We take care of public employees.
136
We take care of public employees. Comprehensive Annual Financial Report Public employees take care of Colorado. For the Fiscal Year Ended December 31, 2007
-
Upload
khangminh22 -
Category
Documents
-
view
3 -
download
0
Transcript of We take care of public employees.

We take care of public employees.
Comprehensive Annual Financial Report
Public employees take care of Colorado.
For the Fiscal Year Ended December 31, 2007
We take care of public employees.
Comprehensive Annual Financial Report
Public employees take care of Colorado.
For the Fiscal Year Ended December 31, 2007
Colorado Public Employees’ Retirement Association 1300 Logan Street
Denver, Colorado 80203303-832-9550www.copera.org
Prepared by the Colorado PERA Staff
TABLE OF CONTENTS
INTRODUCTORY SECTIONLetter of Transmittal 3–7
Certificate of Achievement 8
Board Chair’s Report 9
Board of Trustees 10–11
Administrative Organizational Chart 12
Colorado PERA Executives and Management 13
Consultants 14
FINANCIAL SECTIONReport of the Independent Auditors 16–17
Management’s Discussion and Analysis 18–29
Basic Financial StatementsFund Financial Statements
Statement of Fiduciary Net Assets 30–31
Statement of Changes in Fiduciary Net Assets 32–33
Notes to the Financial Statements 34–54
Required Supplementary InformationSchedule of Funding Progress 55–56
Schedule of Employer Contributions 56-57
Schedule of Contributions from Employers and Other
Contributing Entities 57
Notes to the Required Supplementary Information 58–60
Supplementary SchedulesSchedule of Administrative Expenses 61
Schedule of Investment Expenses 62
Schedule of Payments to Consultants 62
Schedule of Other Additions 63
Schedule of Other Deductions/(Transfers) 63
Voluntary Investment Program Statement of Fiduciary
Net Assets by Component Plan 64
Voluntary Investment Program Statement of Changes
in Fiduciary Net Assets by Component Plan 65
INVESTMENT SECTIONColorado PERA Report on Investment Activity 68–69
Investment Brokers/Advisers 70
Investment Summary 71
Asset Allocation at Market Value 71
Fund Performance Evaluation 72–74
Schedule of Investment Results 75
Profile of Investments in Colorado 76
Largest Stock Holdings by Market Value 76
Largest Bond Holdings by Market Value 76
INVESTMENT SECTION (continued)Voluntary Investment Program
Report on Investment Activity 77–78
Voluntary Investment Program
Schedule of Investment Results 79
Voluntary Investment Program Summary 80
Asset Allocation by Voluntary Investment Program
Component Plans 80
ACTUARIAL SECTIONReport of the Independent Actuary 82–84
The Plan Summary for Calendar Year 2007 85–87
Summary of Actuarial Methods and Assumptions 88–93
Schedule of Retirees and Beneficiaries Added to and
Removed from Benefit Payroll 94
Member-Retiree Comparison 94
Schedule of Members in Valuation 95–96
Summary of Solvency Test 97
Total Actuarial Liabilities 97
Summary of Unfunded/(Overfunded) Actuarial
Accrued Liabilities 98
Unfunded/(Overfunded) Actuarial Accrued Liabilities
(UAAL/OAAL) 99
Schedule of Gains and Losses in Accrued Liabilities 100
Schedule of Computed Employer Contribution Rates
for Fiscal Years Beginning in 2009 101
Schedule of Active Member Valuation Data 101
STATISTICAL SECTIONStatistical Section Overview 105
Changes in Fiduciary Net Assets 106–111
Benefits and Refund Deductions
from Net Assets by Type 112–115
Member and Benefit Recipient Statistics 116
Schedule of Average Retirement Benefits Payable 116
Schedule of Retirees and Survivors by Type of Benefit 117–120
Current Average Monthly Benefit by Year of Retirement 121
Schedule of Average Benefit Payments by Division 122
Schedule of Average Benefit Payments—
Combined State, School, Local Government, and
Judicial Divisions Trust Funds 123
Schedule of Contribution Rate History 124–128
Principal Participating Employers 129–130
Schedule of Affiliated Employers 131–136

Serving our members
INTRODUCTORY SECTION
3
LETTER OF TRANSMITTAL
Colorado Public Employees’ Retirement AssociationMailing Address: PO Box 5800, Denver, CO 80217-5800Office Locations: 1300 Logan Street, Denver, Colorado
1120 West 122nd Avenue, Westminster, Colorado303-832-9550 1-800-759-7372 www.copera.org
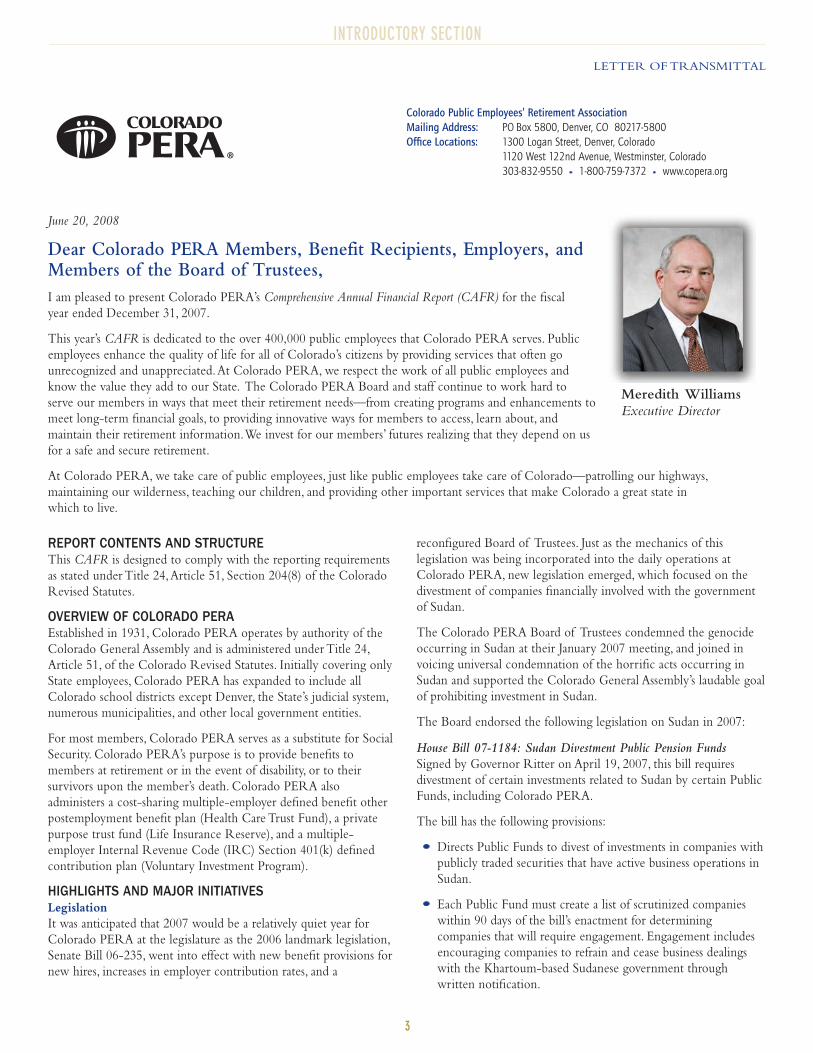
June 20, 2008
Dear Colorado PERA Members, Benefit Recipients, Employers, andMembers of the Board of Trustees,
I am pleased to present Colorado PERA’s Comprehensive Annual Financial Report (CAFR) for the fiscal
year ended December 31, 2007.
This year’s CAFR is dedicated to the over 400,000 public employees that Colorado PERA serves. Public
employees enhance the quality of life for all of Colorado’s citizens by providing services that often go
unrecognized and unappreciated.At Colorado PERA, we respect the work of all public employees and
know the value they add to our State. The Colorado PERA Board and staff continue to work hard to
serve our members in ways that meet their retirement needs—from creating programs and enhancements to
meet long-term financial goals, to providing innovative ways for members to access, learn about, and
maintain their retirement information.We invest for our members’ futures realizing that they depend on us
for a safe and secure retirement.
At Colorado PERA, we take care of public employees, just like public employees take care of Colorado—patrolling our highways,
maintaining our wilderness, teaching our children, and providing other important services that make Colorado a great state in
which to live.
Meredith Williams
Executive Director
REPORT CONTENTS AND STRUCTUREThis CAFR is designed to comply with the reporting requirements
as stated under Title 24,Article 51, Section 204(8) of the Colorado
Revised Statutes.
OVERVIEW OF COLORADO PERAEstablished in 1931, Colorado PERA operates by authority of the
Colorado General Assembly and is administered under Title 24,
Article 51, of the Colorado Revised Statutes. Initially covering only
State employees, Colorado PERA has expanded to include all
Colorado school districts except Denver, the State’s judicial system,
numerous municipalities, and other local government entities.
For most members, Colorado PERA serves as a substitute for Social
Security. Colorado PERA’s purpose is to provide benefits to
members at retirement or in the event of disability, or to their
survivors upon the member’s death. Colorado PERA also
administers a cost-sharing multiple-employer defined benefit other
postemployment benefit plan (Health Care Trust Fund), a private
purpose trust fund (Life Insurance Reserve), and a multiple-
employer Internal Revenue Code (IRC) Section 401(k) defined
contribution plan (Voluntary Investment Program).
HIGHLIGHTS AND MAJOR INITIATIVES Legislation
It was anticipated that 2007 would be a relatively quiet year for
Colorado PERA at the legislature as the 2006 landmark legislation,
Senate Bill 06-235, went into effect with new benefit provisions for
new hires, increases in employer contribution rates, and a
reconfigured Board of Trustees. Just as the mechanics of this
legislation was being incorporated into the daily operations at
Colorado PERA, new legislation emerged, which focused on the
divestment of companies financially involved with the government
of Sudan.
The Colorado PERA Board of Trustees condemned the genocide
occurring in Sudan at their January 2007 meeting, and joined in
voicing universal condemnation of the horrific acts occurring in
Sudan and supported the Colorado General Assembly’s laudable goal
of prohibiting investment in Sudan.
The Board endorsed the following legislation on Sudan in 2007:
House Bill 07-1184: Sudan Divestment Public Pension Funds
Signed by Governor Ritter on April 19, 2007, this bill requires
divestment of certain investments related to Sudan by certain Public
Funds, including Colorado PERA.
The bill has the following provisions:
Directs Public Funds to divest of investments in companies with
publicly traded securities that have active business operations in
Sudan.
Each Public Fund must create a list of scrutinized companies
within 90 days of the bill’s enactment for determining
companies that will require engagement. Engagement includes
encouraging companies to refrain and cease business dealings
with the Khartoum-based Sudanese government through
written notification.
INTRODUCTORY SECTION
4
LETTER OF TRANSMITTAL
If a company does not stop active business operations after 90
days, then the Public Fund has nine months from creating the
list of scrutinized companies to divest 50 percent of the assets
and 15 months to divest from 100 percent of the assets.
Assets subject to divestiture include all publicly traded securities
in direct accounts.
■ Passively managed indirect holdings may also be subject to
divestiture by October 1, 2008, unless a similar Sudan-Free
Fund is created by the outside manager before that date.
■ Officially sanctioned U.S. businesses by the U.S. government
are excluded from divestiture.
The Public Fund cannot acquire new direct holdings of any
active scrutinized company and cannot undertake new
investments in indirect passively managed funds containing
active scrutinized companies after the passage of the bill.
Each Public Fund is responsible for the costs incurred due to
divestiture.
Divestment is not required and re-investment in scrutinized
companies is allowed, if it is shown that the value of the Public
Fund’s portfolio is reduced by 50 basis points due to divestment.
The bill requires legislative staff to perform a post-enactment
review of the implementation of the bill.
In July 2007, to comply with this legislation, the Board adopted a
Scrutinized Company List comprised of companies that have been
identified as having active business operations in Sudan.
In addition to the Sudan divestment legislation, there were a few
other legislative items that were passed and signed into law during
2007, which affected Colorado PERA:
House Bill 07-1377: Higher Ed and State Retirement Plans
This bill was signed by Governor Ritter on June 1, 2007, and it
repealed a portion of Senate Bill 06-235. Under Senate Bill 06-235,
new employees of higher education institutions who were hired on
or after January 1, 2008, were eligible to choose their retirement
plan.They may have selected the Colorado PERA Defined Benefit
(DB) Plan, Colorado PERA Defined Contribution (DC) Plan, or
the State DC Plan, in addition to an existing Optional Retirement
Plan (ORP) at institutions that had ORPs.
House Bill 07-1377 removes that choice for higher education and
gives employees hired after January 1, 2008, the same retirement
options as current employees. The bill makes an exception for new
hires at community colleges. House Bill 07-1377 would give certain
new employees hired on or after January 1, 2008, at a community
college the ability to choose between participation in the Colorado
PERA DB and PERA DC plans.
House Bill 07-1365: Challenger Learning Center as a Colorado
PERA Employer
Signed by Governor Ritter on June 1, 2007, this bill adds the
Colorado Consortium for Earth and Space Science Education
(CCESSE) as a separate Colorado PERA-affiliated employer. The
CCESSE is a group composed of former teachers who had
previously been covered under Colorado PERA with the Pikes Peak
Board of Cooperative Educational Services (BOCES).
Investments
Investment portfolio income is a significant source of revenue
to Colorado PERA. The Investment Committee is responsible
for assisting the Board in overseeing Colorado PERA’s
investment program.
In 2007, there was net investment income of $3,983,543,000
compared with total contributions by members and employers of
$699,071,000 and $754,274,000, respectively.
For the year ended December 31, 2007, the total fund had a rate of
return of 10.0 percent on a market value basis. Colorado PERA’s
annualized rate of return over the last three years was 11.7 percent, over
the last five years it was 14.4 percent, and over the last 10 years it was
8.1 percent.
Proper funding and healthy investment returns are important to the
financial soundness of Colorado PERA. Changes in the composition of
the portfolio are reflected in the “Investment Summary” on page 71.
An integral part of the overall investment policy is the strategic asset
allocation policy. The targeted strategic asset allocation is designed to
provide appropriate diversification and balance expected total rate of
return with the volatility of expected returns. Specifically, the fund is
to be broadly diversified across and within asset classes to limit the
volatility of the total fund investment returns and to limit the impact
of large losses on individual investments. Both traditional and
nontraditional assets are incorporated into the asset allocation mix.
In addition to asset class targets, the Board of Trustees sets ranges
within which asset classes are maintained. The permissible ranges in
effect during 2007 were adopted by the Board of Trustees in
December 2005. The targeted asset allocation mix and the specified
ranges for each asset class are presented on page 68.All of the asset
classes were within their specified ranges at year end. In November
2007, the Board approved the creation of an Opportunity Fund and
approved new asset allocation targets and permissible ranges that will
be effective January 1, 2008. The new asset allocation targets and
specified ranges are presented on page 68.
Also in November 2007, the Board approved a long duration
portfolio mandate for fixed income, which went into effect
January 1, 2008.
Voluntary Investment Program Activities
In 2007,Voluntary Investment Program net assets grew from
$1,522,839,000 at the end of 2006 to $1,733,477,000 at the end of
2007, with 73,321 participant accounts by the close of the 2007 year.
Assets continued to increase and the number of participant accounts
increased by 389 in 2007, compared with the previous year.
401(k) Plan—Component of the Voluntary Investment Program
During 2007, 401(k) Plan participants transferred a total of
$92,607,000 from their accounts. Of that total, 1,471 participants
LETTER OF TRANSMITTAL
INTRODUCTORY SECTION
5
used $13,728,000 to purchase Colorado PERA service credit. The
number of members purchasing service credit using their 401(k)
accounts represents a 47 percent decline from 2006.
Colorado PERA DC Plan—Component of the Voluntary Investment
Program
On January 1, 2006, eligible new State employees were offered a new
defined contribution choice option. Eligible new State employees
may now select the Colorado PERA Defined Benefit Plan, the
Colorado PERA Defined Contribution Plan, or the defined
contribution plan offered by the State.At the end of 2007, the
Colorado PERA DC Plan had 489 participant accounts and assets of
$2,547,000.Withdrawals from the Colorado PERA DC Plan totaled
$148,000 in 2007, with $97,000 representing participant
terminations and $51,000 of plan forfeitures.
Corporate Governance
Colorado PERA continued to be active in the securities litigation
arena, fulfilling the Board’s commitment to support corporate
governance reforms such as transparency, accountability, and
enforcement of shareholder’s rights. Colorado PERA also has been
active in corporate governance reform through its participation in
the Council of Institutional Investors. During 2007, Colorado
PERA continued to demonstrate its commitment in the securities
litigation arena by monitoring all securities litigation activities and
pursuing all available claims. In addition, Colorado PERA continues
to pursue recovery from the audit firms involved in the Royal Ahold
securities class action. (Settlement was reached with the principal
defendants in 2005 for $1.1 billion.)
Total Compensation Philosophy
To support the application of Colorado PERA’s Total Compensation
Philosophy, the Hay Group was again retained in 2007 to conduct
the annual market analysis to support the setting of the 2008 Base
Pay Ranges. Colorado PERA also participated in several annual
compensation and benefits surveys, most notable being the
Mountain States Employers’ Council Front Range Survey and the
McLagan Partners Pension Fund Data Exchange Compensation
Survey. These surveys, in combination with the market analysis,
provide solid comparable compensation data to assist in keeping
Colorado PERA’s compensation programs competitive, and to
support Colorado PERA’s ability to attract and retain critical talent.
In addition, a Web-based performance management system was used
for the second consecutive year to support the establishment of
performance objectives, to conduct performance reviews, and to
award merit increases.
ACCOUNTING SYSTEMS AND REPORTS This CAFR was prepared to conform with the principles of
governmental accounting and reporting set forth by the
Governmental Accounting Standards Board (GASB) in Statement No.
25,“Financial Reporting for Defined Benefit Pension Plans and Note
Disclosures for Defined Contribution Plans;” Statement No. 43,
“Financial Reporting for Postemployment Benefit Plans Other Than
Pension Plans;” and Statement No. 34,“Basic Financial Statements—
and Management’s Discussion and Analysis—for State and Local
Governments” as well as other GASB statements as appropriate.
GASB Statement No. 25 establishes financial reporting standards for
defined benefit plans and standards for the notes to the financial
statements of defined contribution plans. GASB Statement No. 43
provides financial reporting standards for other postemployment
benefit plans.
GASB Statement No. 34 requires that management provide a
narrative introduction, overview, and analysis to accompany the basic
financial statements in the form of the Management’s Discussion
and Analysis (MD&A). This Letter of Transmittal is designed to
complement the MD&A and should be read in conjunction with it.
In May 2007, the GASB issued Statement No. 50,“Pension
Disclosures (an amendment of GASB Statements No. 26 and No.
27).” Colorado PERA adopted the provisions of this standard for the
year ended December 31, 2007.
In June 2007, the GASB issued Statement No. 51,“Accounting and
Financial Reporting for Intangible Assets.”The Statement will be
effective for periods beginning after June 15, 2009. Colorado PERA
has chosen not to adopt this Statement early.Accordingly, the effect
of implementing the Statement has not been determined for these
financial statements and disclosures.
The accompanying financial statements are prepared using the
accrual basis of accounting. Member and employer contributions are
recognized as revenues in the period in which the compensation
becomes payable to the member and the employer is statutorily
committed to pay these contributions to the appropriate pension
trust fund and the Health Care Trust Fund. Expenses are recorded
when the corresponding liabilities are incurred, regardless of when
payment is made.
State law requires that the State Auditor cause to be conducted an
annual financial and performance audit of Colorado PERA. Pursuant
to this requirement, the Broomfield, Colorado, office of Clifton
Gunderson LLP audited Colorado PERA’s 2007 financial statements
under the control and oversight of the State Auditor. Colorado PERA
continues to maintain appropriate controls in all operational areas.
RECOGNITION OF ACHIEVEMENTSThe Government Finance Officers Association (GFOA) of the
United States and Canada awarded a Certificate of Achievement for
Excellence in Financial Reporting to Colorado PERA for its
Comprehensive Annual Financial Report (CAFR) for the fiscal year
ended December 31, 2006. The GFOA’s Certificate of Achievement
is the highest form of recognition in the area of public employee
retirement system accounting and financial reporting. To receive
this award, a government unit must publish an easily readable and
efficiently organized CAFR that meets or exceeds program
standards, and satisfies both generally accepted accounting principles
and applicable legal requirements.
A Certificate of Achievement is valid for one year. Colorado
PERA has been awarded this distinction for the past 22 years.We
believe this CAFR continues to meet GFOA requirements and we
are submitting it to the GFOA to determine its eligibility for
another Certificate.
INTRODUCTORY SECTION
6
LETTER OF TRANSMITTAL
The GFOA also awarded Colorado PERA an Award for
Outstanding Achievement in Popular Annual Financial Reporting
for its Popular Annual Financial Report for the fiscal year ended
December 31, 2006. This is the fifth year that Colorado PERA has
received this prestigious national award recognizing conformance
with the highest standards for preparation of state and local
government reports. In order to receive this award, a government
unit must publish a Popular Annual Financial Report whose contents
conform to program standards of creativity, presentation,
understandability, and reader appeal.
ECONOMIC CONDITION AND OUTLOOKThe U.S. economy grew at a modest pace in 2007. However, fourth
quarter growth showed a significant slowdown. The slowdown was
a result of the ripple effect that the decline in the residential housing
market is having on much of the U.S. economy. The subprime
mortgage meltdown has had a serious negative impact on the
financial sector resulting in tens of billions of dollars of write-downs
and the restriction of liquidity across financial markets.As the year
ended, the unemployment rate was rising, energy prices were near
record highs, and consumer confidence was falling. Consumer
demand has continued to fuel economic growth, but there are
several factors that indicate this may not continue. Inflation
indicators spent much of 2007 near the upper end of the Federal
Reserve’s target range. Beginning in September, the Fed began
lowering the Fed Funds rate in response to the distress in the
financial markets. The Fed Funds rate ended the year at 4.25
percent, 100 basis points lower than at the beginning of the year.
The fundamental factors that have supported the domestic
economy’s performance are also showing signs of stress. Corporate
earnings are beginning to reflect deteriorating economic conditions.
On the positive side, interest rates are low on a historical basis,
which may provide liquidity and stimulate growth.
The Colorado economy continues to grow; natural resources and
mining are two of the strongest sectors of the State’s economy. The
Colorado labor market has continued to expand with the increasing
demand for professional and business services sector jobs. The
residential market experienced a slowdown in 2007 and foreclosures
are currently at record levels.
FUNDING The funding objective for Colorado PERA is to be able to pay long-
term benefit promises through contributions that remain approximately
level from year to year as a percent of salaries earned by members. Each
year members and employers pay their share for retirement service
earned in that year by Colorado PERA members. If the retirement
system follows level contribution rate financing principles, the system
will be able to pay all promised benefits when due.
On December 31, 2007, Colorado PERA’s funded ratio equaled 75.1
percent with an unfunded liability of $13.0 billion. (Please see the
Management’s Discussion and Anaylsis on pages 18-29 for additional
information on Colorado PERA’s funding ratio.)
A significant source of revenue to Colorado PERA is income from
the investment portfolio. It is the most powerful component of the
ultimate funding of all promised benefits. Currently the investment
rate of return assumption is 8.5 percent. To understand the
importance of the investment rate of return, which is used to
discount the actuarial liabilities of Colorado PERA, a one-half
percent increase in this investment rate of return and discount rate
would result in a decrease of $2.8 billion in our unfunded liabilities,
and a one-half percent decrease in this investment rate of return and
discount rate would result in an increase of $3.1 billion.
Given the importance of securing benefits for members, Colorado
PERA has worked extensively to implement strategies designed to
put Colorado PERA on solid financial footing in the decades to
come. The Board of Trustees worked extensively in 2004 and 2006
with elected officials to pass Senate Bill 04-257 and Senate Bill 06-
235, which were designed to move Colorado PERA toward full
funding over the coming decades. Key features of these bills include
increased funding through the Amortization Equalization
Disbursement (AED) and Supplemental AED (SAED), as well as a
new benefit structure for new hires that includes a Rule of 85 and a
separate cost-of-living-adjustment (COLA) reserve fund.
With this legislation and its phased 3 percent increases in both the
AED and SAED and the projected reductions in normal cost due to
benefit adjustments for new hires, Colorado PERA expects to achieve
a 30-year amortization period on unfunded liabilities in all trust funds
by the end of a 30-year period and eventually achieve a minimum of
100 percent funding. Current actuarial projections have confirmed
the validity of this plan.
Even with the implementation of the legislative provisions listed
above, Colorado PERA’s funding position remains a top concern
and priority for the Colorado PERA Board and management.
BOARD COMPOSITIONColorado PERA is governed by a Board of Trustees. In 2007, a
phased restructuring of the then 16-member Board of Trustees
began as a result of Senate Bill 06-235. The bill provided that the
Board downsize to 15 members by statutory elimination of the ex-
officio position held by the State Auditor effective January 1, 2007.
In addition, on July 1, 2007, the number of member-elected Trustees
was lowered to 11, by replacing three previously elected Trustees
with three Governor-appointed Trustees approved by the Senate.
The Trustee seats held by F. Elizabeth Friot from the State Division
(Higher Education), Patricia Kelly from the Local Government
Division, and Marcus Pennell from the School Division expired on
June 30, 2007, and they were replaced with the following Trustees
appointed by the Governor and approved by the Senate: Howard M.
Crane, Susan G. Murphy, and Lynn E. Turner.
In addition to the three Governor-appointed Trustees, the Board
includes the State Treasurer as an ex-officio voting member; four
members from the School Division and three members from the
State Division; one member from the Local Government Division;
one Judicial Division member; and two Colorado PERA retirees.
INTRODUCTORY SECTION
LETTER OF TRANSMITTAL
7
EMPLOYER AFFILIATIONSIn 2007, the following public employers affiliated with Colorado
PERA: Central Colorado Water Conservancy District and the Wray
Housing Authority. In addition, as a result of House Bill 07-1365,
The Colorado Consortium for Earth and Space Science Education
spun off from the Pikes Peak BOCES and became its own reporting
employer to Colorado PERA.
MANAGEMENT CHANGESColorado PERA experienced several management changes
during 2007.
In January 2007, Diane Ahonen was promoted to Director of Legal
Services. The Legal Services Division provides the Colorado PERA
Board and staff with legal support services, as well as coordinating
the administration of the administrative review process, domestic
relations orders and subpoena processing, proxy voting, docketing,
and attorney fee review. Diane joined Colorado PERA in February
1990 as an Administrative Assistant and in March 2003 was named
Legal Support Services Manager.
In February 2007,Tim Moore was promoted to the position of
Director of Alternative Investments; Christopher Reilly left the
position in late 2006. Tim joined Colorado PERA in 1996 as an
Analyst in the Investment Operations Division and became a Senior
Portfolio Manager in the Alternative Investments Division in 1999.
The Alternative Investments Division manages the private equity
portfolio, which includes venture capital, leveraged buyout, and
special situation funds.
On March 1, 2007, Mike Miller retired as Colorado PERA Director
of Information Systems after 32 years. Mike started his career at
Colorado PERA as a Computer Operator and became the Director
of Information Systems in November 1993.As Director, Mike
supervised the daily operations of the Information Systems Division,
which included software applications for the Benefits and Investments
Departments, information technology operations, telecommunications
activities for Colorado PERA, and the Webmaster functions.
The retirement of Mike Miller presented an opportunity to re-
evaluate Colorado PERA’s future needs in the area of Information
Systems and it was determined that two separate divisions would
better serve Colorado PERA in this capacity. Therefore, on April 1,
2007, Ron Baker was named Director of Application Development
and Kevin Carpenter was named Director of Information Technology.
Ron was initially hired as a Programmer Analyst in 1994 and in
1999 he became the Application Development Manager. The
Application Development Division develops and maintains
internally written software applications at Colorado PERA as
well as secure Web applications used by the Colorado PERA
membership, employers, and vendors.
Kevin joined Colorado PERA in 1988 as a Programmer Analyst and
was made the Manager of Systems and Information Technology
Services in 1996. The Information Technology Division is
responsible for information systems operations, business continuity,
telecommunications, and Webmaster functions.
In May 2007, Bill Koski transferred to the Investment Administration
Division as the new Senior Opportunities Manager. Bill joined
Colorado PERA in 2002 as Director of Fixed Income. Previously, Bill
was the Head of Fixed Income Research at Charles Schwab
Investment Management. In this newly created position, Bill will
research and manage new investment opportunities as well as
Colorado PERA’s timber investments.
The vacant Director of Fixed Income position was filled in July
2007, when Maruti Moré was named Director of Fixed Income.
Prior to joining Colorado PERA, Maruti was with Smith Graham
and Company as Senior Vice President and Director of Fixed
Income. The Fixed Income Division oversees all bond investing as
well as manages multiple fixed income portfolios.
Finally, Karl Greve was promoted to the position of Colorado
PERA’s Chief Financial Officer in recognition of his wide-ranging
responsibilities and many contributions to Colorado PERA’s
financial well-being. Prior to this promotion, Karl had been the
Director of Accounting/Controller and has worked at Colorado
PERA for 22 years. In addition to his work at Colorado PERA, Karl
is a professional member of the American Institute of Certified
Public Accountants, the Colorado Society of Certified Public
Accountants, and the Government Finance Officers Association, and
currently is the President of the Public Pension Financial Forum.
ACKNOWLEDGEMENTSThe compilation of this CAFR reflects the combined efforts of
Colorado PERA staff. It is intended to provide complete and
reliable information as a basis for making management decisions,
determining compliance with legal provisions, and determining
responsible stewardship of assets contributed by the members and
their employers.
This CAFR is being mailed to all affiliated employers and other
interested parties; a summary will be sent to members and benefit
recipients.An electronic version is available on the Colorado PERA
Web site at www.copera.org.
Colorado PERA thanks the staff and management of our affiliated
employers for their continuing support. The cooperation of our
affiliated employers is significant to the success of Colorado PERA.
Also, I would like to express my thanks for the dedication and
tireless efforts of the Colorado PERA staff, Board of Trustees, and
consultants who diligently ensured the successful operation of
Colorado PERA during 2007.
Respectfully submitted,
Meredith Williams
Colorado PERA Executive Director

CERTIFICATE OF ACHIEVEMENT
INTRODUCTORY SECTION
8
INTRODUCTORY SECTION
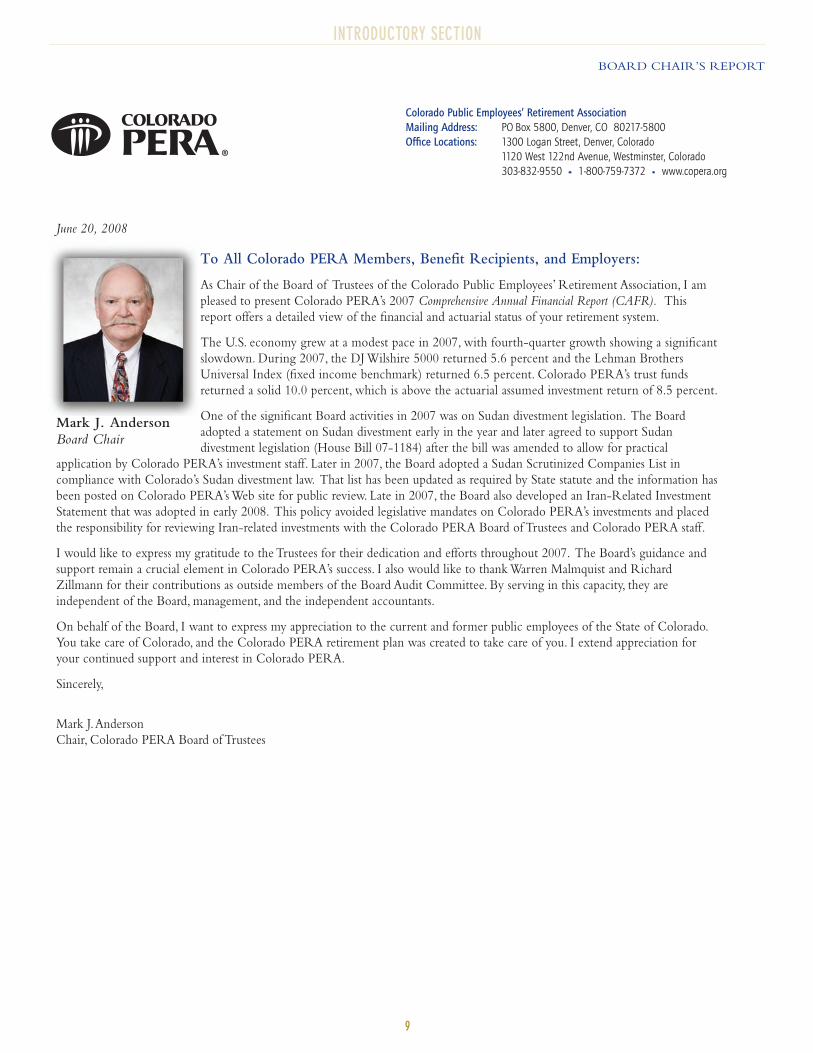
June 20, 2008
To All Colorado PERA Members, Benefit Recipients, and Employers:
As Chair of the Board of Trustees of the Colorado Public Employees’ Retirement Association, I am
pleased to present Colorado PERA’s 2007 Comprehensive Annual Financial Report (CAFR). This
report offers a detailed view of the financial and actuarial status of your retirement system.
The U.S. economy grew at a modest pace in 2007, with fourth-quarter growth showing a significant
slowdown. During 2007, the DJ Wilshire 5000 returned 5.6 percent and the Lehman Brothers
Universal Index (fixed income benchmark) returned 6.5 percent. Colorado PERA’s trust funds
returned a solid 10.0 percent, which is above the actuarial assumed investment return of 8.5 percent.
One of the significant Board activities in 2007 was on Sudan divestment legislation. The Board
adopted a statement on Sudan divestment early in the year and later agreed to support Sudan
divestment legislation (House Bill 07-1184) after the bill was amended to allow for practical
application by Colorado PERA’s investment staff. Later in 2007, the Board adopted a Sudan Scrutinized Companies List in
compliance with Colorado’s Sudan divestment law. That list has been updated as required by State statute and the information has
been posted on Colorado PERA’s Web site for public review. Late in 2007, the Board also developed an Iran-Related Investment
Statement that was adopted in early 2008. This policy avoided legislative mandates on Colorado PERA’s investments and placed
the responsibility for reviewing Iran-related investments with the Colorado PERA Board of Trustees and Colorado PERA staff.
I would like to express my gratitude to the Trustees for their dedication and efforts throughout 2007. The Board’s guidance and
support remain a crucial element in Colorado PERA’s success. I also would like to thank Warren Malmquist and Richard
Zillmann for their contributions as outside members of the Board Audit Committee. By serving in this capacity, they are
independent of the Board, management, and the independent accountants.
On behalf of the Board, I want to express my appreciation to the current and former public employees of the State of Colorado.
You take care of Colorado, and the Colorado PERA retirement plan was created to take care of you. I extend appreciation for
your continued support and interest in Colorado PERA.
Sincerely,
Mark J.Anderson
Chair, Colorado PERA Board of Trustees
Colorado Public Employees’ Retirement AssociationMailing Address: PO Box 5800, Denver, CO 80217-5800Office Locations: 1300 Logan Street, Denver, Colorado
1120 West 122nd Avenue, Westminster, Colorado303-832-9550 1-800-759-7372 www.copera.org
Mark J. Anderson
Board Chair
BOARD CHAIR’S REPORT
9

INTRODUCTORY SECTION
BOARD OF TRUSTEES
10
James Casebolt
Elected by JudicialMembersJudge,Colorado Court ofAppealsCurrent term expires June 30, 2011
Mark J.AndersonChair
Elected by LocalGovernmentMembersRisk Manager,City ofColorado SpringsCurrent term expires June30, 2010
Sara R. AltVice Chair
Elected by RetireesRetired LegislativeLiaisonCurrent term expiresJune 30, 2011
Susan Beeman
Elected by SchoolMembersTeacher on specialassignment forExceptionalStudent Services,Pueblo School District 60Current term expiresJune 30, 2009
F. ElizabethFriot
Elected by StateMembersProfessor ofSecondaryEducation,Metropolitan StateCollege of DenverTerm expired June 30, 2007
Howard M.Crane
Appointed by the GovernorCurrent term expires July 10, 2008
By State law, the management of the public employees’ retirement fund is vested in the Board of Trustees of the Colorado Public Employees’
Retirement Association. The Board is composed of 15 members, which includes the following:
Eleven members elected by mail ballot by their respective Division members to serve on the Board for four–year terms; four members
from the School Division, three from the State Division, one from the Local Government Division, one from the Judicial Division, and
two retiree members elected by benefit recipients.
Three members appointed by the Governor and approved by the State Senate.
The State Treasurer serves as an ex-officio member.
If a Board member resigns, a new member is appointed from the respective Division for the remainder of the year until the next election.
Patricia K.Kelly
Elected by LocalGovernmentMembersCity Attorney,City of ColoradoSpringsTerm expired June 30, 2007
Carol Hoglund
Elected by StateMembersChief BusinessOfficer,Aims CommunityCollegeCurrent term expires June 30, 2010

INTRODUCTORY SECTION
BOARD OF TRUSTEES
11
Cary Kennedy
Ex-officio memberState TreasurerContinuous term
Eric Rothaus
Deputy StateTreasurer
Susan G. Murphy
Appointed by the GovernorCurrent term expires July 10, 2009
Lynn E. Turner
Appointed by the GovernorCurrent term expires July 10, 2010
Tamela Long
Elected by StateMembersBusiness Officer,Colorado StatePatrolCurrent term expiresJune 30, 2008
Amy L. Nichols
Elected by SchoolMembersMath Teacher,Aurora PublicSchoolsCurrent term expires June 30, 2008
Scott Murphy
Elected by SchoolMembersSuperintendent,Littleton PublicSchoolsCurrent term expires June 30, 2010
Scott L. Noller
Elected by SchoolMembersAssistant Principal,Colorado SpringsSchool District #11Current term expires June 30, 2009
Marcus Pennell
Elected by SchoolMembersScience Teacher,Jefferson CountySchool District R-1Term expired June 30, 2007
Maryann Motza
Elected by StateMembersSocial SecurityAdministrator for the StateCurrent term expires June 30, 2009
Carole Wright
Elected by RetireesRetired Teacher,Aurora PublicSchoolsCurrent term expires June 30, 2009
INTRODUCTORY SECTION
12
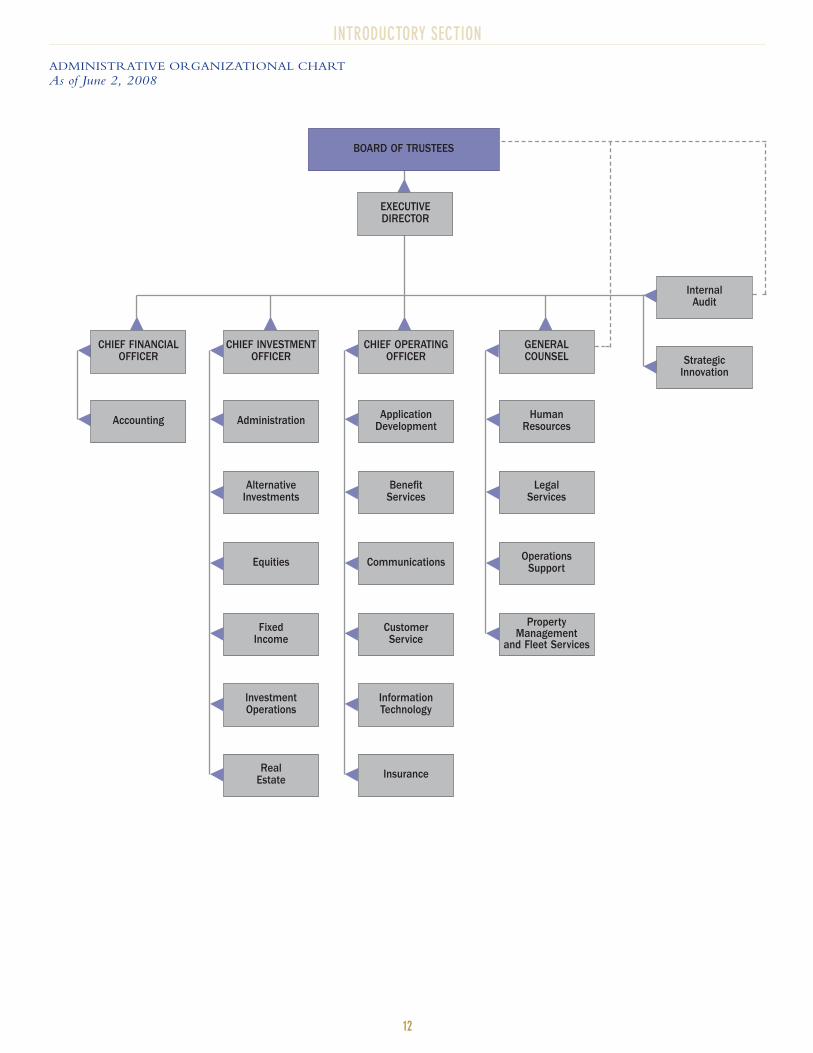
CHIEF OPERATING OFFICER
CHIEF INVESTMENT OFFICER
GENERALCOUNSEL
Accounting Human Resources
Legal Services
Operations Support
PropertyManagement
and Fleet Services
Administration
AlternativeInvestments
Equities
Fixed Income
InvestmentOperations
RealEstate
Benefit Services
Communications
Customer Service
InformationTechnology
Insurance
ApplicationDevelopment
ADMINISTRATIVE ORGANIZATIONAL CHART
As of June 2, 2008
Internal Audit
StrategicInnovation
BOARD OF TRUSTEES
EXECUTIVEDIRECTOR
CHIEF FINANCIAL OFFICER

INTRODUCTORY SECTION
COLORADO PERA EXECUTIVES AND MANAGEMENT
13
(Left to right): David Maurek, Chief Operating Officer;
Jennifer Paquette, Chief Investment Officer; Greg Smith,
General Counsel; Karl Greve, Chief Financial Officer;
Meredith Williams, Executive Director
(Left to right): Karl Paulson, Manager of Strategic
Innovation; John Spielman, Director of Internal Audit
(Left to right):Tim Moore, Director of Alternative
Investments; Martha Argo, Investment Director;
Bill Koski, Senior Opportunities Manager;
Maruti Moré, Director of Fixed Income;Tom Liddy,
Director of Investment Operations; Jim Lavan, Director
of Real Estate; Jim Liptak, Director of Equities
(Left to right): Diane Ahonen, Director of Legal Services;
Sharyl Harston, Director of Human Resources; Donna
Trujillo, Director of Operations Support; Dennis Fischer,
Director of Property Management and Fleet Services
(Left to right):Anne Bandy, Director of Customer
Service; Ron Baker, Director of Application
Development; Katie Kaufmanis, Director of
Communications; Kevin Carpenter, Director of
Information Technology;Wendy Tenzyk, Director of
Insurance; Rick Larson, Director of Benefit Services
INTRODUCTORY SECTION
14
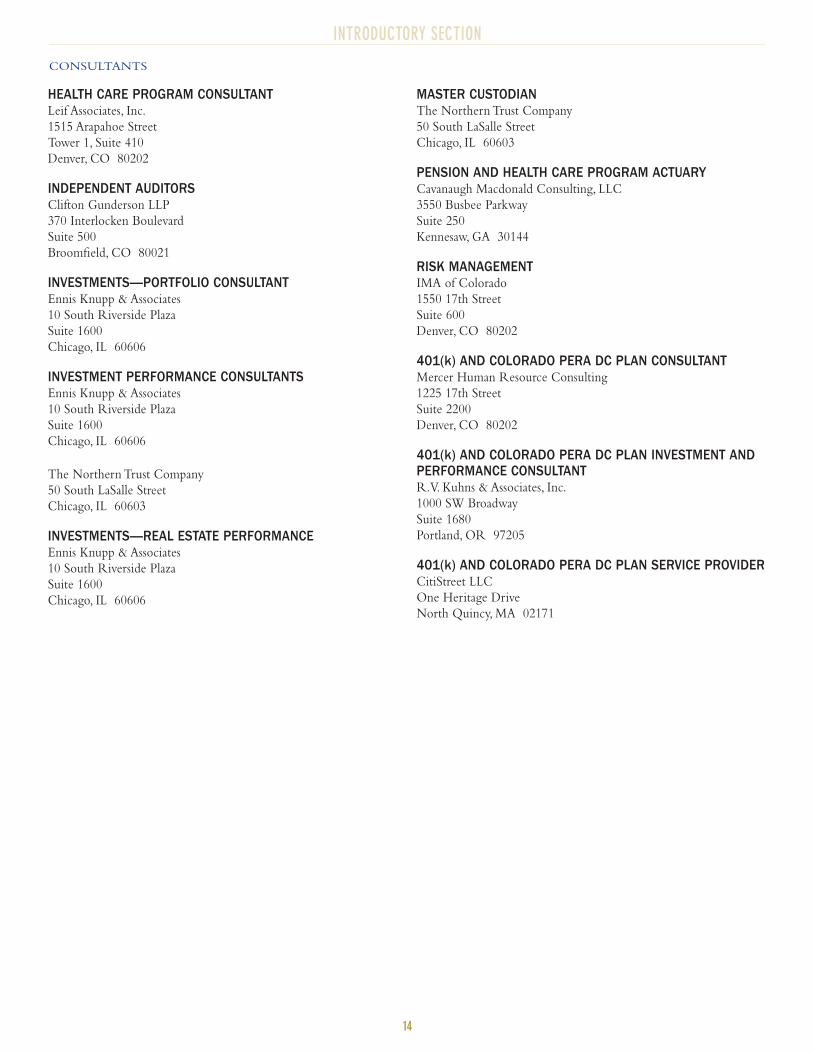
CONSULTANTS
HEALTH CARE PROGRAM CONSULTANTLeif Associates, Inc.
1515 Arapahoe Street
Tower 1, Suite 410
Denver, CO 80202
INDEPENDENT AUDITORSClifton Gunderson LLP
370 Interlocken Boulevard
Suite 500
Broomfield, CO 80021
INVESTMENTS—PORTFOLIO CONSULTANTEnnis Knupp & Associates
10 South Riverside Plaza
Suite 1600
Chicago, IL 60606
INVESTMENT PERFORMANCE CONSULTANTSEnnis Knupp & Associates
10 South Riverside Plaza
Suite 1600
Chicago, IL 60606
The Northern Trust Company
50 South LaSalle Street
Chicago, IL 60603
INVESTMENTS—REAL ESTATE PERFORMANCEEnnis Knupp & Associates
10 South Riverside Plaza
Suite 1600
Chicago, IL 60606
MASTER CUSTODIANThe Northern Trust Company
50 South LaSalle Street
Chicago, IL 60603
PENSION AND HEALTH CARE PROGRAM ACTUARYCavanaugh Macdonald Consulting, LLC
3550 Busbee Parkway
Suite 250
Kennesaw, GA 30144
RISK MANAGEMENTIMA of Colorado
1550 17th Street
Suite 600
Denver, CO 80202
401(k) AND COLORADO PERA DC PLAN CONSULTANTMercer Human Resource Consulting
1225 17th Street
Suite 2200
Denver, CO 80202
401(k) AND COLORADO PERA DC PLAN INVESTMENT ANDPERFORMANCE CONSULTANTR.V. Kuhns & Associates, Inc.
1000 SW Broadway
Suite 1680
Portland, OR 97205
401(k) AND COLORADO PERA DC PLAN SERVICE PROVIDERCitiStreet LLC
One Heritage Drive
North Quincy, MA 02171

Protecting our members
16
FINANCIAL SECTION
REPORT OF THE INDEPENDENT AUDITORS
17
FINANCIAL SECTION
REPORT OF THE INDEPENDENT AUDITORS
18
FINANCIAL SECTION
MANAGEMENT’S DISCUSSION AND ANALYSIS
(In Thousands of Dollars)
Management is pleased to provide this overview and analysis of the financial activities of the Colorado Public Employees’ Retirement
Association (Colorado PERA) for the year ended December 31, 2007.We encourage readers to consider the information presented here in
conjunction with additional information in the Letter of Transmittal beginning on page 3 of this CAFR.
Colorado PERA administers seven fiduciary funds, including four defined benefit pension trust funds: the State Division Trust Fund, the
School Division Trust Fund, the Local Government Division Trust Fund, and the Judicial Division Trust Fund (the Division Trust Funds).
Colorado PERA also administers one defined contribution pension trust fund, the Voluntary Investment Program, a cost-sharing multiple-
employer defined benefit other postemployment benefit plan, the Health Care Trust Fund (HCTF), and one private purpose trust fund, the
Life Insurance Reserve (LIR).
FINANCIAL HIGHLIGHTSNet Assets—Net assets for all funds administered by Colorado PERA increased $2,755,864 during calendar year 2007.
2007 CHANGE 2007 ENDINGIN NET ASSETS NET ASSETS
State Division Trust Fund $810,769 $14,852,029
School Division Trust Fund 1,407,229 23,043,186
Local Government Division Trust Fund 263,203 3,014,274
Judicial Division Trust Fund 19,210 240,873
Voluntary Investment Program 210,638 1,733,477
Health Care Trust Fund 42,582 269,432
Life Insurance Reserve 2,233 18,755
Total increase in net assets and total net assets $2,755,864 $43,172,026
In the Voluntary Investment Program, the increase in net assets was primarily due to strong investment returns in domestic and international
stocks. In all other funds, the increase in net assets was primarily due to strong investment returns in international stocks, alternative
investments, and real estate.
INVESTMENT HIGHLIGHTSThe investment highlights in this section do not include the Voluntary Investment Program unless otherwise noted.This plan is a participant-
directed defined contribution plan. Investments for all of the other plans are pooled (the four Division Trust Funds, the HCTF and the LIR).
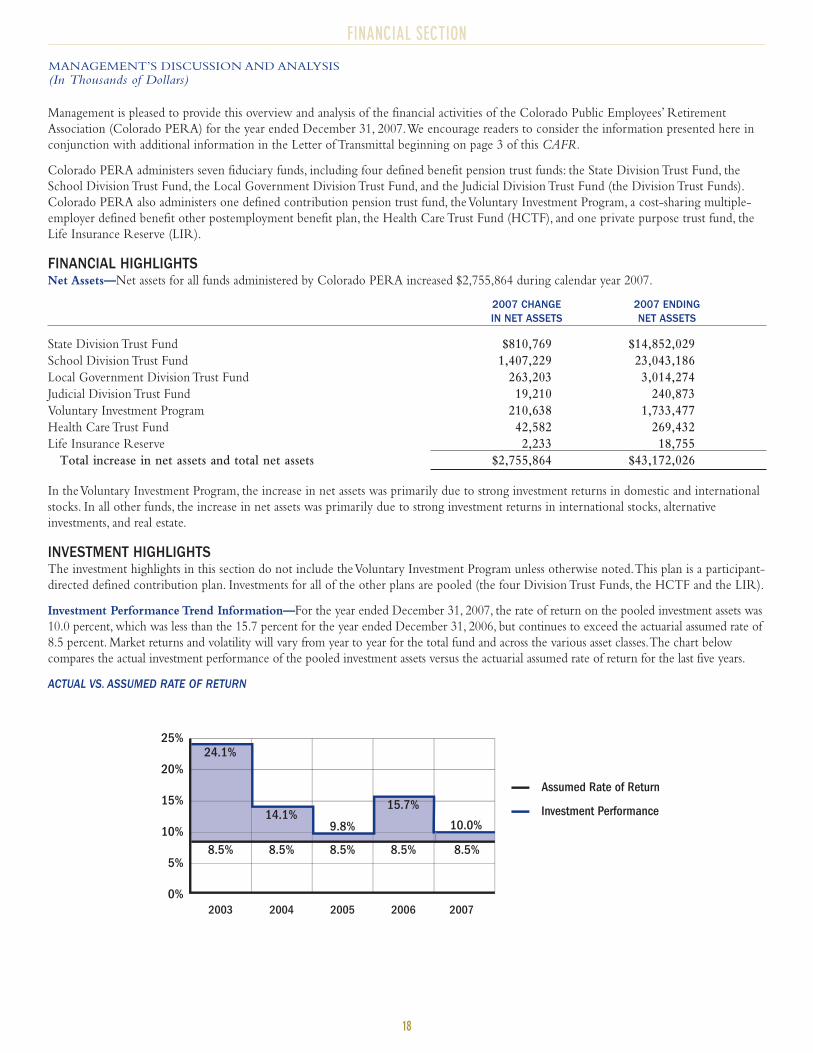
Investment Performance Trend Information—For the year ended December 31, 2007, the rate of return on the pooled investment assets was
10.0 percent, which was less than the 15.7 percent for the year ended December 31, 2006, but continues to exceed the actuarial assumed rate of
8.5 percent. Market returns and volatility will vary from year to year for the total fund and across the various asset classes.The chart below
compares the actual investment performance of the pooled investment assets versus the actuarial assumed rate of return for the last five years.
ACTUAL VS. ASSUMED RATE OF RETURN
8.5% 8.5% 8.5% 8.5% 8.5%
24.1%
14.1%9.8% 10.0%
15.7%
2003 2004 2005 2006 20070%
5%
10%
15%
20%
25%
Assumed Rate of Return
Investment Performance
19
FINANCIAL SECTION
MANAGEMENT’S DISCUSSION AND ANALYSIS
(In Thousands of Dollars)
Asset Allocation—The Board of Trustees of Colorado PERA (the Board) has the responsibility for the investment of Colorado PERA’s
funds with the following statutory limitations: the aggregate amount of monies invested in corporate stocks and fixed income securities
convertible into stock cannot exceed 65 percent of the book value of the fund, no investment in common and/or preferred stock of any
single corporation can exceed 5 percent of the then book value of the fund, and the fund cannot acquire more than 12 percent of the
outstanding stocks or bonds of any single corporation.As fiduciaries of the funds, the Board is responsible to carry out their investment
functions solely in the interest of the Colorado PERA members and benefit recipients and for the exclusive purpose of providing benefits.
The Board commissioned an Asset/Liability Study in 2005, which was prepared by Ennis Knupp & Associates.The objective of the study was
to determine the optimal strategic asset allocation policy that would ultimately allow Colorado PERA to meet its benefit obligations while
also ensuring that Colorado PERA incurs appropriate levels of risk.The Board’s policy specifies the desired target allocation for each asset
class as well as the ranges within which each asset class may operate.As a result of the study, the Board approved the current asset allocation
targets and ranges at its December 2005 Board meeting.
12-31-2006 2006 12-31-2007 2007 2007ACTUAL % TARGET % ACTUAL % TARGET % RANGES
Domestic Stocks 43.3% 45% 43.3% 45% 42%-48%
Fixed Income 23.5% 25% 23.9% 25% 22%-28%
International Stocks 16.2% 15% 15.7% 15% 12%-18%
Alternative Investments 8.3% 7% 7.7% 7% 4%-10%
Real Estate 6.9% 7% 7.6% 7% 4%-10%
Timber 1.1% 1% 1.1% 1% 0%-2%
Cash and Short-Term Investments 0.7% 0% 0.7% 0%
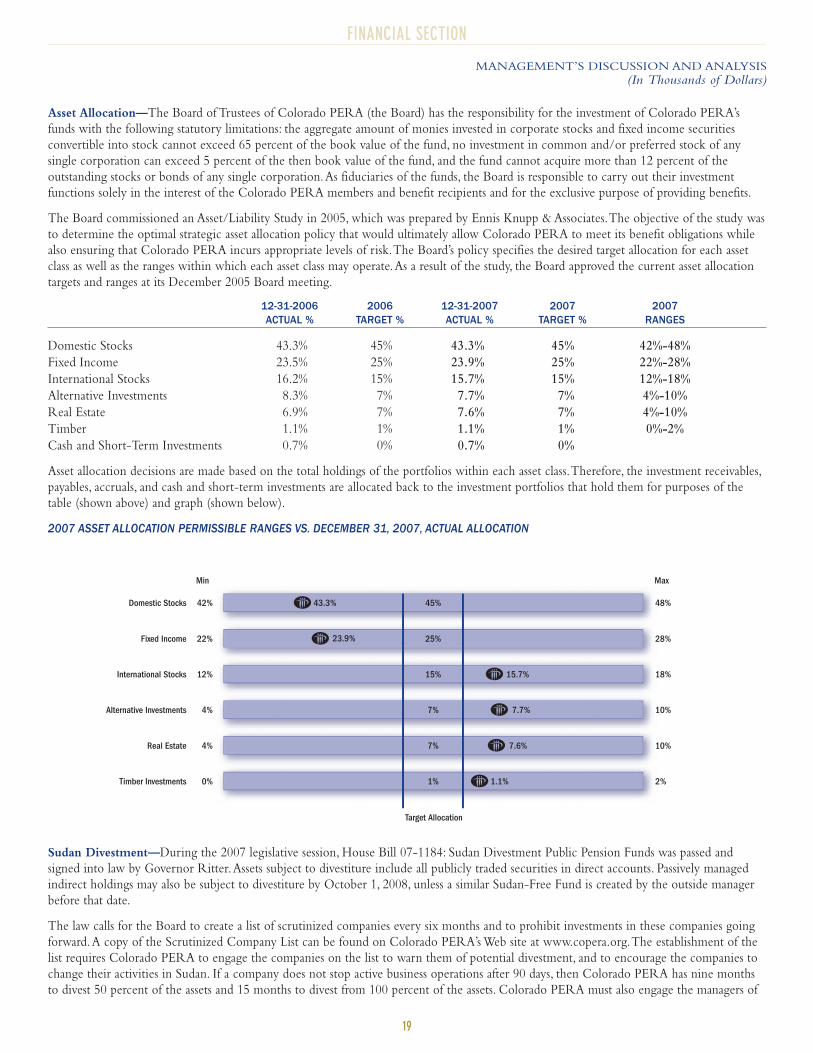
Asset allocation decisions are made based on the total holdings of the portfolios within each asset class.Therefore, the investment receivables,
payables, accruals, and cash and short-term investments are allocated back to the investment portfolios that hold them for purposes of the
table (shown above) and graph (shown below).
2007 ASSET ALLOCATION PERMISSIBLE RANGES VS. DECEMBER 31, 2007, ACTUAL ALLOCATION
Sudan Divestment—During the 2007 legislative session, House Bill 07-1184: Sudan Divestment Public Pension Funds was passed and
signed into law by Governor Ritter.Assets subject to divestiture include all publicly traded securities in direct accounts. Passively managed
indirect holdings may also be subject to divestiture by October 1, 2008, unless a similar Sudan-Free Fund is created by the outside manager
before that date.
The law calls for the Board to create a list of scrutinized companies every six months and to prohibit investments in these companies going
forward.A copy of the Scrutinized Company List can be found on Colorado PERA’s Web site at www.copera.org.The establishment of the
list requires Colorado PERA to engage the companies on the list to warn them of potential divestment, and to encourage the companies to
change their activities in Sudan. If a company does not stop active business operations after 90 days, then Colorado PERA has nine months
to divest 50 percent of the assets and 15 months to divest from 100 percent of the assets. Colorado PERA must also engage the managers of
Target Allocation
42%
22%
12%
4%
4%
0%
48%
28%
18%
10%
10%
2%
Alternative Investments
Domestic Stocks
Fixed Income
International Stocks
Real Estate
Timber Investments
Min Max
43.3%
23.9%
15.7%
7.7%
7.6%
1.1%
45%
25%
15%
7%
7%
1%
20
FINANCIAL SECTION
MANAGEMENT’S DISCUSSION AND ANALYSIS
(In Thousands of Dollars)
indirect investments in companies on the list and request removal of scrutinized companies or ask the managers to create a similar fund that
does not contain the identified companies. Colorado PERA contacts managers in its defined benefit plan as well as managers of funds within
the Voluntary Investment Program regarding the Scrutinized Companies List.
Cash and Short-Term Investments—As of December 31, 2007, Colorado PERA had cash and short-term investments of $564,752, a
decrease of $426,163 from 2006.The decrease included a reduction of $226,627 in the short-term fixed income securities held in various
portfolios.Also in 2006, an investment decision was made concerning the internally managed fixed income portfolio to increase the funds in
the short-term investment fund because of favorable rates compared to shorter-term U.S.Treasury securities.This strategy was no longer
appropriate for the year ended December 31, 2007.
Investment Settlements and Other Receivables and Payables—As of December 31, 2007, Colorado PERA had investment settlements
and income receivables of $199,138, an increase of $73,621.This increase was primarily due to a large amount of pending investment sales at
the end of the year.As of December 31, 2007, Colorado PERA had investment settlements and other liabilities of $167,419, an increase of
$47,348.This increase was primarily due to a $36,305 increase in pending investment purchases and a $10,520 increase in other payables for
the payment of insurance premiums in the Health Care Trust Fund at the end of the year.
Securities Lending Collateral and Obligations—As of December 31, 2007, Colorado PERA had securities lending collateral of
$7,377,247, an increase of $1,323,899 from 2006.The main reasons for the increase in cash collateral were an overall increase in lendable
assets as the portfolio grew and an increase in the percentage of assets on loan at the end of the year.
Securities Lending Net Income/(Loss)—Due to the turmoil and liquidity issues in the short-term credit markets in 2007, especially in August
and November, the earnings on Colorado PERA’s cash collateral pool were less than borrower rebates and created a loss in 2007. For the year
ended December 31, 2007, Colorado PERA had a net loss from securities lending of $26,708 (including a loss of $114 in the Voluntary
Investment Program) which compares to a net gain of $23,148 in 2006 (including a gain of $45 in the Voluntary Investment Program).
Commitments—As of December 31, 2007, Colorado PERA had commitments for the future purchase of investments in alternative
investments of $1,203,924, and real estate of $1,018,223.
ACTUARIAL SUMMARYThe December 31, 2007, actuarial valuation was prepared by Cavanaugh Macdonald Consulting, LLC.
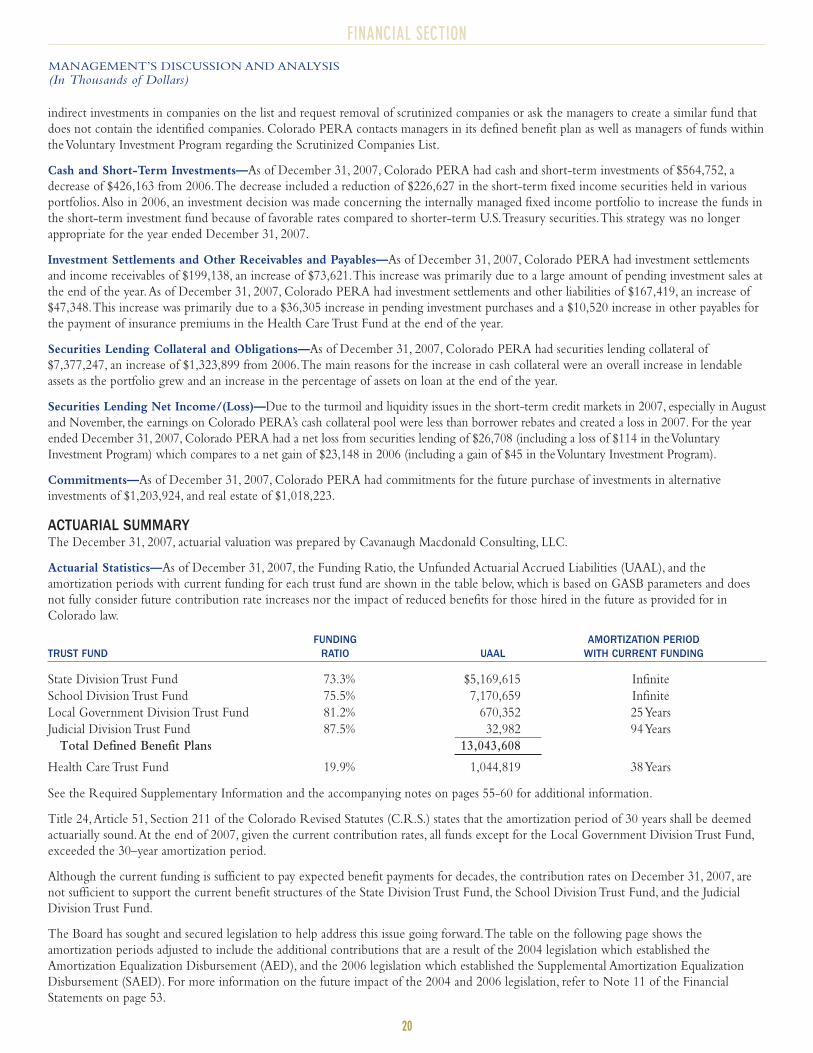
Actuarial Statistics—As of December 31, 2007, the Funding Ratio, the Unfunded Actuarial Accrued Liabilities (UAAL), and the
amortization periods with current funding for each trust fund are shown in the table below, which is based on GASB parameters and does
not fully consider future contribution rate increases nor the impact of reduced benefits for those hired in the future as provided for in
Colorado law.
FUNDING AMORTIZATION PERIODTRUST FUND RATIO UAAL WITH CURRENT FUNDING
State Division Trust Fund 73.3% $5,169,615 Infinite
School Division Trust Fund 75.5% 7,170,659 Infinite
Local Government Division Trust Fund 81.2% 670,352 25 Years
Judicial Division Trust Fund 87.5% 32,982 94 Years
Total Defined Benefit Plans 13,043,608
Health Care Trust Fund 19.9% 1,044,819 38 Years
See the Required Supplementary Information and the accompanying notes on pages 55-60 for additional information.
Title 24,Article 51, Section 211 of the Colorado Revised Statutes (C.R.S.) states that the amortization period of 30 years shall be deemed
actuarially sound.At the end of 2007, given the current contribution rates, all funds except for the Local Government Division Trust Fund,
exceeded the 30–year amortization period.
Although the current funding is sufficient to pay expected benefit payments for decades, the contribution rates on December 31, 2007, are
not sufficient to support the current benefit structures of the State Division Trust Fund, the School Division Trust Fund, and the Judicial
Division Trust Fund.
The Board has sought and secured legislation to help address this issue going forward.The table on the following page shows the
amortization periods adjusted to include the additional contributions that are a result of the 2004 legislation which established the
Amortization Equalization Disbursement (AED), and the 2006 legislation which established the Supplemental Amortization Equalization
Disbursement (SAED). For more information on the future impact of the 2004 and 2006 legislation, refer to Note 11 of the Financial
Statements on page 53.
21
FINANCIAL SECTION
MANAGEMENT’S DISCUSSION AND ANALYSIS
(In Thousands of Dollars)
Based on the December 31, 2007, valuation, the amortization periods for each fund are shown below and include all future estimated AED
and SAED contributions:
AMORTIZATION PERIOD AMORTIZATION PERIODWITH FUTURE AED INCREASES WITH FUTURE AED AND SAED INCREASES
State Division Trust Fund Infinite 69 Years
School Division Trust Fund Infinite 42 Years
Local Government Division Trust Fund 24 Years 14 Years
Judicial Division Trust Fund 78 Years 22 Years
Health Care Trust Fund 38 Years 38 Years
The amortization periods with AED and SAED do not include the full effect of the 2006 legislation.The legislation includes plan changes
that will lower the normal cost for future new hires and will allow more of the employer’s contribution to be used to amortize past service
costs earned.The future AED and SAED have not been taken into consideration in the calculation of the Annual Required Contribution as
defined in GASB Statement 25 or in the amortization period based on the current year funding.
As stated in the Report of the Independent Actuary on pages 82-84 by Cavanaugh Macdonald Consulting, LLC,“Colorado PERA has a
funded ratio of 75% based on the Actuarial Value of Assets.The funded ratio on Market Value of Assets is higher, at 78%. It is our opinion that
the current funding is sufficient to pay benefit payments through the projected actuarial period of 30 years. Current contribution levels are
sufficient to finance the promised benefits for the Local Government Division under GASB Nos. 25 and 27. Recent contribution changes
under SB 06-235 are expected to stabilize the funding levels of the Judicial Division by attaining a 30-year amortization period within the
projected actuarial period of 30 years. In addition, the recent contribution changes combined with the benefit changes of SB 06-235 are
expected to stabilize the State and School Division Trust Funds by attaining a 30-year amortization within the projected actuarial period
based on previous actuarial projections.”
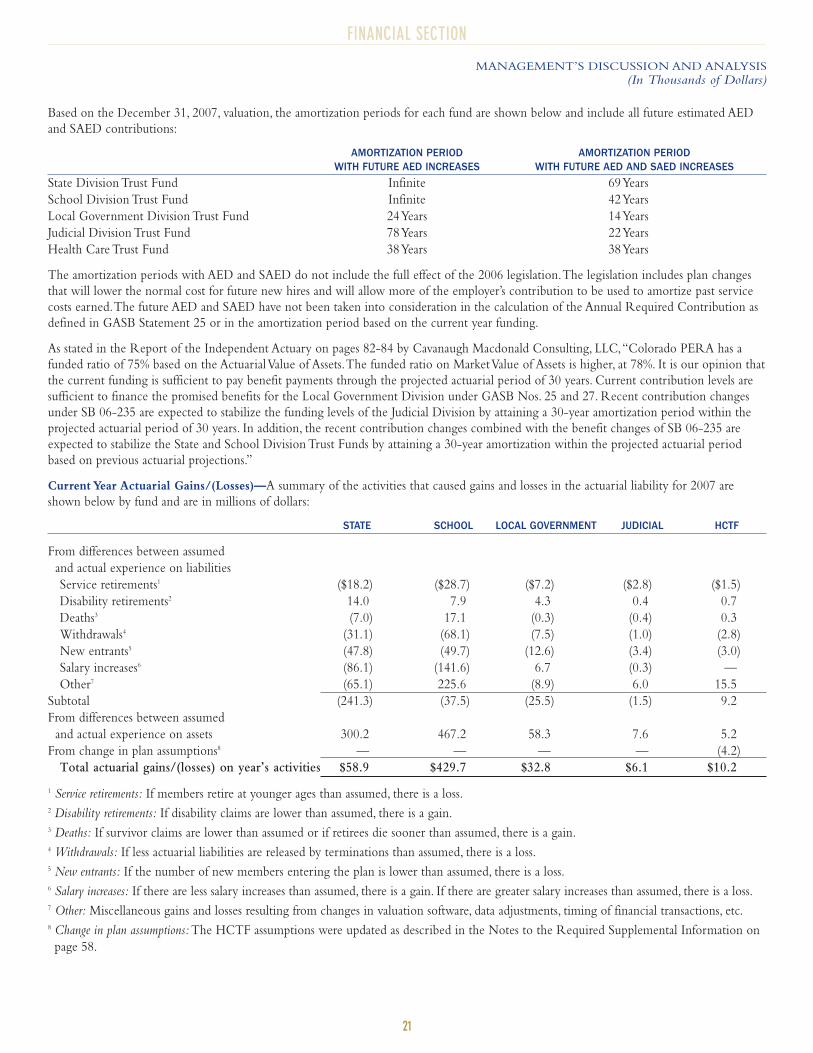
Current Year Actuarial Gains/(Losses)—A summary of the activities that caused gains and losses in the actuarial liability for 2007 are
shown below by fund and are in millions of dollars:
STATE SCHOOL LOCAL GOVERNMENT JUDICIAL HCTF
From differences between assumed
and actual experience on liabilities
Service retirements1 ($18.2) ($28.7) ($7.2) ($2.8) ($1.5)
Disability retirements2 14.0 7.9 4.3 0.4 0.7
Deaths3 (7.0) 17.1 (0.3) (0.4) 0.3
Withdrawals4 (31.1) (68.1) (7.5) (1.0) (2.8)
New entrants5 (47.8) (49.7) (12.6) (3.4) (3.0)
Salary increases6 (86.1) (141.6) 6.7 (0.3) —
Other7 (65.1) 225.6 (8.9) 6.0 15.5
Subtotal (241.3) (37.5) (25.5) (1.5) 9.2
From differences between assumed
and actual experience on assets 300.2 467.2 58.3 7.6 5.2
From change in plan assumptions8 — — — — (4.2)
Total actuarial gains/(losses) on year’s activities $58.9 $429.7 $32.8 $6.1 $10.2
1 Service retirements: If members retire at younger ages than assumed, there is a loss.2 Disability retirements: If disability claims are lower than assumed, there is a gain.3 Deaths: If survivor claims are lower than assumed or if retirees die sooner than assumed, there is a gain.4 Withdrawals: If less actuarial liabilities are released by terminations than assumed, there is a loss.5 New entrants: If the number of new members entering the plan is lower than assumed, there is a loss.6 Salary increases: If there are less salary increases than assumed, there is a gain. If there are greater salary increases than assumed, there is a loss.7 Other: Miscellaneous gains and losses resulting from changes in valuation software, data adjustments, timing of financial transactions, etc.8 Change in plan assumptions: The HCTF assumptions were updated as described in the Notes to the Required Supplemental Information on
page 58.
22
FINANCIAL SECTION
MANAGEMENT’S DISCUSSION AND ANALYSIS
(In Thousands of Dollars)
ACTUARIAL TREND INFORMATIONFunding Ratio—The funding ratio for the plan is determined by dividing the actuarial value of assets by the actuarial accrued liability.The
actuarial value of assets is not the current market value but a market-related value which smoothes changes in the market value over four
years.The funding ratio for each of the funds at December 31 for each of the last five years is shown below:
TRUST FUND 2003 2004 2005 2006 2007
State Division — — 71.5% 73.0% 73.3%School Division — — 73.9% 74.1% 75.5%State and School Division 75.2% 70.1% — — —Local Government Division 80.2% 77.2% 78.0% 79.5% 81.2%Judicial Division 84.0% 81.0% 86.3% 85.1% 87.5%Health Care 17.9% 15.1% 17.1% 17.2% 19.9%
Colorado PERA’s funding objective is to meet long-term benefit promises through contributions and investment income.The funding ratios
listed above give an indication of how well this objective has been met to date.A larger funding ratio indicates that a plan is better funded.As
an example, for every dollar of the actuarially determined benefits earned for the State Division Trust Fund, approximately $0.73 of assets are
available for payment.These benefits earned will be payable over the life span of members after their retirement.
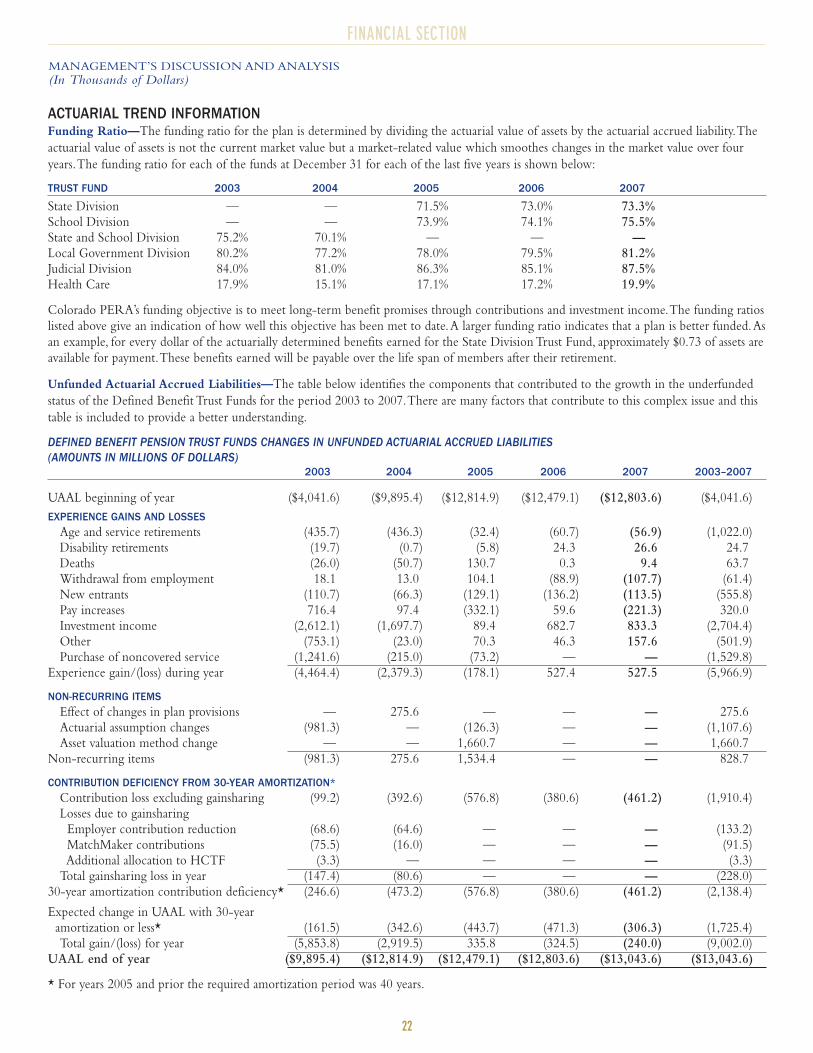
Unfunded Actuarial Accrued Liabilities—The table below identifies the components that contributed to the growth in the underfunded
status of the Defined Benefit Trust Funds for the period 2003 to 2007.There are many factors that contribute to this complex issue and this
table is included to provide a better understanding.
DEFINED BENEFIT PENSION TRUST FUNDS CHANGES IN UNFUNDED ACTUARIAL ACCRUED LIABILITIES(AMOUNTS IN MILLIONS OF DOLLARS)
2003 2004 2005 2006 2007 2003–2007
UAAL beginning of year ($4,041.6) ($9,895.4) ($12,814.9) ($12,479.1) ($12,803.6) ($4,041.6)
EXPERIENCE GAINS AND LOSSESAge and service retirements (435.7) (436.3) (32.4) (60.7) (56.9) (1,022.0)Disability retirements (19.7) (0.7) (5.8) 24.3 26.6 24.7Deaths (26.0) (50.7) 130.7 0.3 9.4 63.7Withdrawal from employment 18.1 13.0 104.1 (88.9) (107.7) (61.4)New entrants (110.7) (66.3) (129.1) (136.2) (113.5) (555.8)Pay increases 716.4 97.4 (332.1) 59.6 (221.3) 320.0Investment income (2,612.1) (1,697.7) 89.4 682.7 833.3 (2,704.4)Other (753.1) (23.0) 70.3 46.3 157.6 (501.9)Purchase of noncovered service (1,241.6) (215.0) (73.2) — — (1,529.8)
Experience gain/(loss) during year (4,464.4) (2,379.3) (178.1) 527.4 527.5 (5,966.9)
NON-RECURRING ITEMSEffect of changes in plan provisions — 275.6 — — — 275.6Actuarial assumption changes (981.3) — (126.3) — — (1,107.6)Asset valuation method change — — 1,660.7 — — 1,660.7
Non-recurring items (981.3) 275.6 1,534.4 — — 828.7
CONTRIBUTION DEFICIENCY FROM 30-YEAR AMORTIZATION*Contribution loss excluding gainsharing (99.2) (392.6) (576.8) (380.6) (461.2) (1,910.4)Losses due to gainsharing
Employer contribution reduction (68.6) (64.6) — — — (133.2)MatchMaker contributions (75.5) (16.0) — — — (91.5)Additional allocation to HCTF (3.3) — — — — (3.3)
Total gainsharing loss in year (147.4) (80.6) — — — (228.0)30-year amortization contribution deficiency* (246.6) (473.2) (576.8) (380.6) (461.2) (2,138.4)
Expected change in UAAL with 30-yearamortization or less* (161.5) (342.6) (443.7) (471.3) (306.3) (1,725.4)Total gain/(loss) for year (5,853.8) (2,919.5) 335.8 (324.5) (240.0) (9,002.0)
UAAL end of year ($9,895.4) ($12,814.9) ($12,479.1) ($12,803.6) ($13,043.6) ($13,043.6)
* For years 2005 and prior the required amortization period was 40 years.
23
FINANCIAL SECTION
MANAGEMENT’S DISCUSSION AND ANALYSIS
(In Thousands of Dollars)
The previous schedule shows where losses and gains occurred over the five-year period compared to what was expected or assumed.The
largest loss of $2.1 billion came from contribution deficiencies from the required amortization period of 30 years (40 years for years 2005
and prior). Other large losses include $1.0 billion due to increased early retirements beyond those assumed, $1.1 billion due to moving to
more conservative actuarial assumptions (2005—changes in mortality, withdrawal, retirement, disability and pay assumptions, 2003—decrease
in the actuarial investment assumption from 8.75 percent to 8.5 percent), $1.5 billion due to purchase of noncovered service at a rate lower
than the full actuarial cost prior to November 1, 2005, investment income losses of $1.0 billion ($2.7 billion investment loss net of the $1.7
billion asset valuation method gain in 2005) which is a result of the market downturn from 2000 to 2002 and the four-year smoothing
methodology which extended losses beyond 2002, and $1.7 billion which is the difference between last year’s UAAL and the expected
UAAL using the normal cost earned, less the required employer contributions all of which is adjusted for interest.
Contribution Rate Sufficiency—With the passage of Senate Bill 04-257 an “Amortization Equalization Disbursement” (AED) was
established and required each Colorado PERA employer to pay 0.5 percent of covered salary beginning January 1, 2006, and increasing to
1.0 percent of covered salary beginning January 1, 2007, to help improve funding.The AED is slated to gradually increase over several years,
reaching a total of 3 percent. Employer contributions for the Division Trust Funds increased from $609,929 in 2006 to $681,410 in 2007 due
to the AED increase and due to increases in members’ covered salaries.
In 2007, the amount received from employers as contributions and the Amortization Equalization Disbursement, defined in statute, was not
sufficient to meet the Annual Required Contribution (ARC) rate calculation as specified by Governmental Accounting Standards Board
(GASB) Statements No. 25 and No. 43, which assumes a 30-year amortization period for all of the funds.
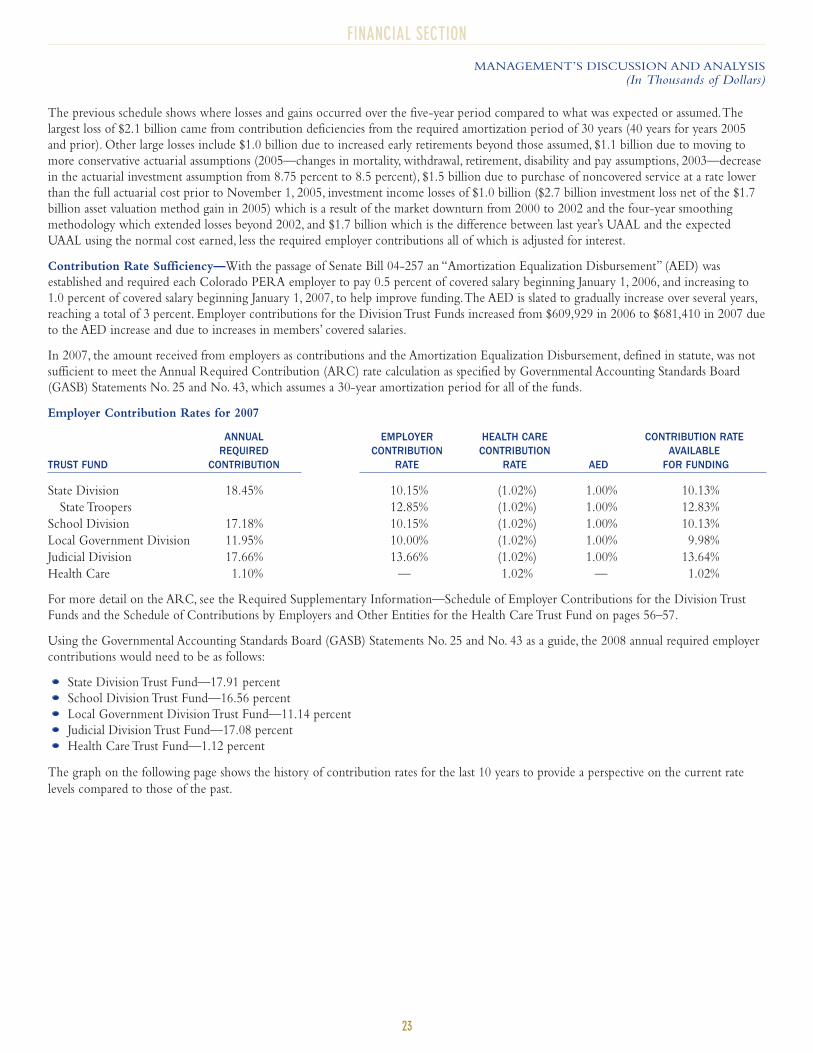
Employer Contribution Rates for 2007
ANNUAL EMPLOYER HEALTH CARE CONTRIBUTION RATEREQUIRED CONTRIBUTION CONTRIBUTION AVAILABLE
TRUST FUND CONTRIBUTION RATE RATE AED FOR FUNDING
State Division 18.45% 10.15% (1.02%) 1.00% 10.13%
State Troopers 12.85% (1.02%) 1.00% 12.83%
School Division 17.18% 10.15% (1.02%) 1.00% 10.13%
Local Government Division 11.95% 10.00% (1.02%) 1.00% 9.98%
Judicial Division 17.66% 13.66% (1.02%) 1.00% 13.64%
Health Care 1.10% — 1.02% — 1.02%
For more detail on the ARC, see the Required Supplementary Information—Schedule of Employer Contributions for the Division Trust
Funds and the Schedule of Contributions by Employers and Other Entities for the Health Care Trust Fund on pages 56–57.
Using the Governmental Accounting Standards Board (GASB) Statements No. 25 and No. 43 as a guide, the 2008 annual required employer
contributions would need to be as follows:
State Division Trust Fund—17.91 percent
School Division Trust Fund—16.56 percent
Local Government Division Trust Fund—11.14 percent
Judicial Division Trust Fund—17.08 percent
Health Care Trust Fund—1.12 percent
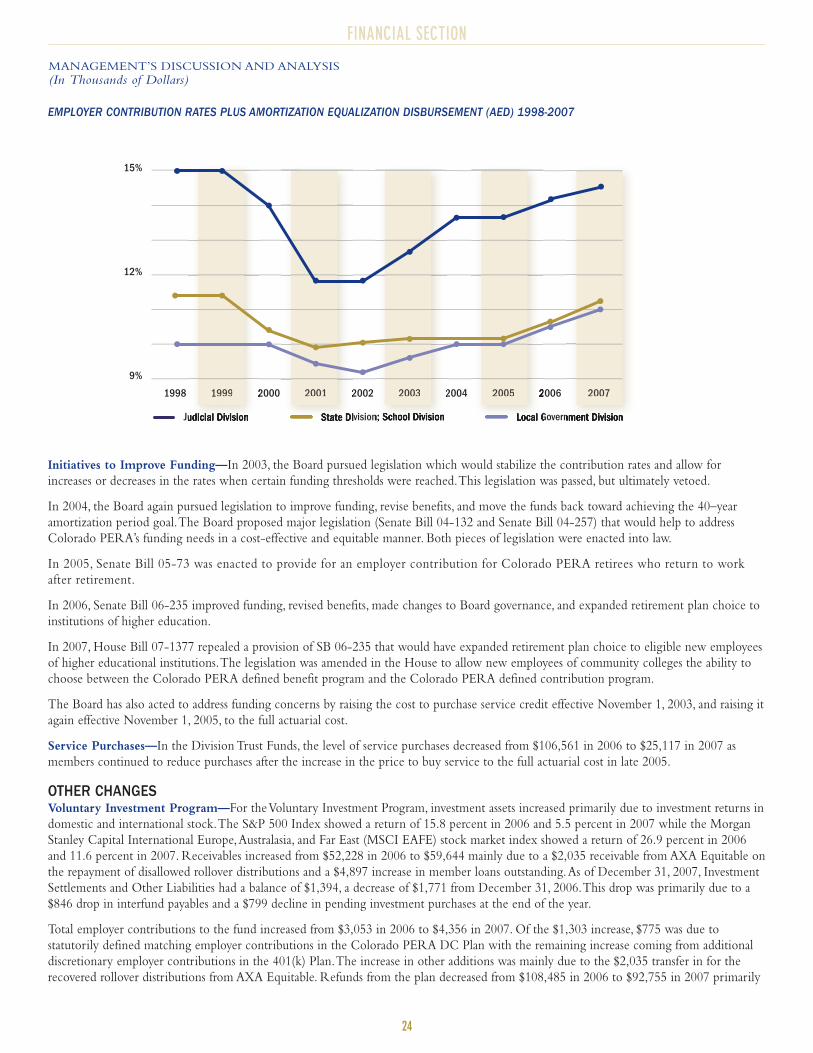
The graph on the following page shows the history of contribution rates for the last 10 years to provide a perspective on the current rate
levels compared to those of the past.
24
FINANCIAL SECTION
MANAGEMENT’S DISCUSSION AND ANALYSIS
(In Thousands of Dollars)
EMPLOYER CONTRIBUTION RATES PLUS AMORTIZATION EQUALIZATION DISBURSEMENT (AED) 1998-2007
Initiatives to Improve Funding—In 2003, the Board pursued legislation which would stabilize the contribution rates and allow for
increases or decreases in the rates when certain funding thresholds were reached.This legislation was passed, but ultimately vetoed.
In 2004, the Board again pursued legislation to improve funding, revise benefits, and move the funds back toward achieving the 40–year
amortization period goal.The Board proposed major legislation (Senate Bill 04-132 and Senate Bill 04-257) that would help to address
Colorado PERA’s funding needs in a cost-effective and equitable manner. Both pieces of legislation were enacted into law.
In 2005, Senate Bill 05-73 was enacted to provide for an employer contribution for Colorado PERA retirees who return to work
after retirement.
In 2006, Senate Bill 06-235 improved funding, revised benefits, made changes to Board governance, and expanded retirement plan choice to
institutions of higher education.
In 2007, House Bill 07-1377 repealed a provision of SB 06-235 that would have expanded retirement plan choice to eligible new employees
of higher educational institutions.The legislation was amended in the House to allow new employees of community colleges the ability to
choose between the Colorado PERA defined benefit program and the Colorado PERA defined contribution program.
The Board has also acted to address funding concerns by raising the cost to purchase service credit effective November 1, 2003, and raising it
again effective November 1, 2005, to the full actuarial cost.
Service Purchases—In the Division Trust Funds, the level of service purchases decreased from $106,561 in 2006 to $25,117 in 2007 as
members continued to reduce purchases after the increase in the price to buy service to the full actuarial cost in late 2005.
OTHER CHANGESVoluntary Investment Program—For the Voluntary Investment Program, investment assets increased primarily due to investment returns in
domestic and international stock.The S&P 500 Index showed a return of 15.8 percent in 2006 and 5.5 percent in 2007 while the Morgan
Stanley Capital International Europe,Australasia, and Far East (MSCI EAFE) stock market index showed a return of 26.9 percent in 2006
and 11.6 percent in 2007. Receivables increased from $52,228 in 2006 to $59,644 mainly due to a $2,035 receivable from AXA Equitable on
the repayment of disallowed rollover distributions and a $4,897 increase in member loans outstanding.As of December 31, 2007, Investment
Settlements and Other Liabilities had a balance of $1,394, a decrease of $1,771 from December 31, 2006.This drop was primarily due to a
$846 drop in interfund payables and a $799 decline in pending investment purchases at the end of the year.
Total employer contributions to the fund increased from $3,053 in 2006 to $4,356 in 2007. Of the $1,303 increase, $775 was due to
statutorily defined matching employer contributions in the Colorado PERA DC Plan with the remaining increase coming from additional
discretionary employer contributions in the 401(k) Plan.The increase in other additions was mainly due to the $2,035 transfer in for the
recovered rollover distributions from AXA Equitable. Refunds from the plan decreased from $108,485 in 2006 to $92,755 in 2007 primarily
9%
12%
15%
2006 200720052004200320022001200019991998
Judicial Division State Division; School Division Local Government Division
2005 20071999 20032001
25
FINANCIAL SECTION
MANAGEMENT’S DISCUSSION AND ANALYSIS
(In Thousands of Dollars)
attributable to less money being transferred out of the plan to pay for purchased service credit in the Division Trust Funds.Administrative
expenses increased from $4,706 in 2006 to $5,484 in 2007 mainly due to an increase of recordkeeping fees by $572.
Health Care Trust Fund—Retiree health care premium payment contributions increased $10,672 to $96,345 in 2007.These increases were
a result of health care cost inflation, combined with plan changes that resulted in more people selecting Anthem Blue Cross Blue Shield
(Anthem), an insurance option where the Fund bears some risk. If the Fund bears risk, all premiums collected are recorded as contributions
and all claims or premiums paid are accounted for as benefit payments and direct administrative expenses are broken out separately.When
there is no health coverage risk, premiums paid by the retiree are not shown as contributions and the only benefit payment or direct expense
recorded is the subsidy benefit which is equal to the difference between the premiums collected from the enrollees and the full premium
due to the insurance company.Administrative expenses increased $2,906 to $11,051 as plan changes were made that resulted in more people
selecting Anthem rather than HMO options.Anthem charges a direct administration fee to the Fund.
Life Insurance Reserve Program—The increase in receivables in 2007 was primarily due to an $861 claims experience refund from
Anthem, the program’s previous carrier and administrator, which was received in 2008.
Unum Life Insurance Company of America (Unum) is the current carrier and administrator for Colorado PERA’s life insurance program.
Colorado PERA’s payment to Unum is based on a flexible funding premium agreement which limits the payments to the lesser of (1) the
actual cumulative premiums collected or (2) an administrative fee plus actual claims paid. Due to the limits built into the contract, in years
when claims are lower, administrative expenses can increase. In 2007, as claims decreased for this plan, there was a rise in administrative
expenses from $1,100 in 2006 to $1,732 in 2007.
26
FINANCIAL SECTION
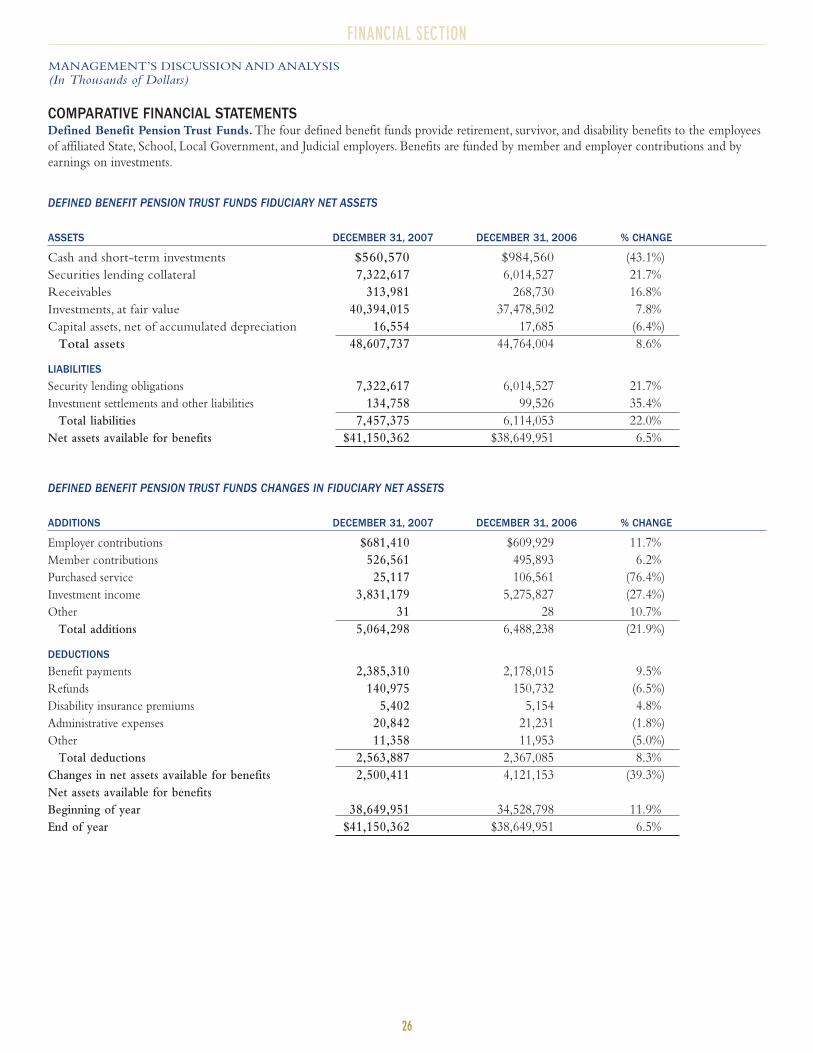
COMPARATIVE FINANCIAL STATEMENTSDefined Benefit Pension Trust Funds. The four defined benefit funds provide retirement, survivor, and disability benefits to the employees
of affiliated State, School, Local Government, and Judicial employers. Benefits are funded by member and employer contributions and by
earnings on investments.
DEFINED BENEFIT PENSION TRUST FUNDS FIDUCIARY NET ASSETS
ASSETS DECEMBER 31, 2007 DECEMBER 31, 2006 % CHANGE
Cash and short-term investments $560,570 $984,560 (43.1%)
Securities lending collateral 7,322,617 6,014,527 21.7%
Receivables 313,981 268,730 16.8%
Investments, at fair value 40,394,015 37,478,502 7.8%
Capital assets, net of accumulated depreciation 16,554 17,685 (6.4%)
Total assets 48,607,737 44,764,004 8.6%
LIABILITIES
Security lending obligations 7,322,617 6,014,527 21.7%
Investment settlements and other liabilities 134,758 99,526 35.4%
Total liabilities 7,457,375 6,114,053 22.0%
Net assets available for benefits $41,150,362 $38,649,951 6.5%
DEFINED BENEFIT PENSION TRUST FUNDS CHANGES IN FIDUCIARY NET ASSETS
ADDITIONS DECEMBER 31, 2007 DECEMBER 31, 2006 % CHANGE
Employer contributions $681,410 $609,929 11.7%
Member contributions 526,561 495,893 6.2%
Purchased service 25,117 106,561 (76.4%)
Investment income 3,831,179 5,275,827 (27.4%)
Other 31 28 10.7%
Total additions 5,064,298 6,488,238 (21.9%)
DEDUCTIONS
Benefit payments 2,385,310 2,178,015 9.5%
Refunds 140,975 150,732 (6.5%)
Disability insurance premiums 5,402 5,154 4.8%
Administrative expenses 20,842 21,231 (1.8%)
Other 11,358 11,953 (5.0%)
Total deductions 2,563,887 2,367,085 8.3%
Changes in net assets available for benefits 2,500,411 4,121,153 (39.3%)
Net assets available for benefits
Beginning of year 38,649,951 34,528,798 11.9%
End of year $41,150,362 $38,649,951 6.5%
MANAGEMENT’S DISCUSSION AND ANALYSIS
(In Thousands of Dollars)
27
FINANCIAL SECTION
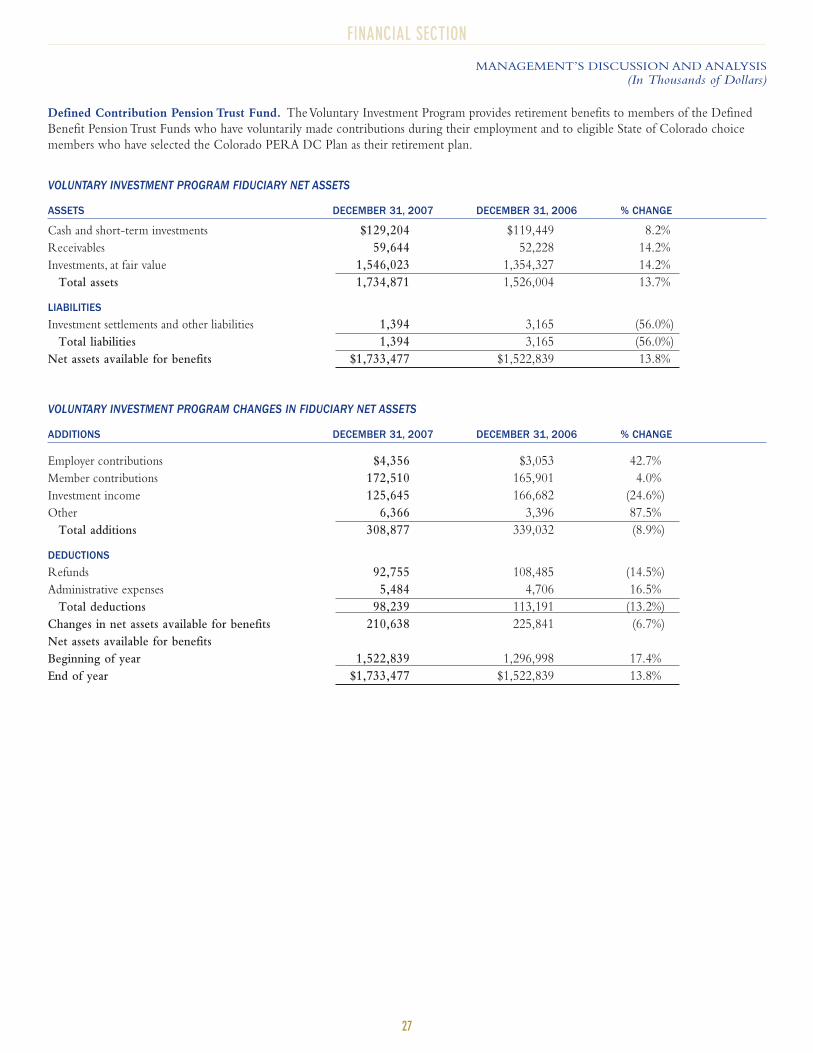
Defined Contribution Pension Trust Fund. The Voluntary Investment Program provides retirement benefits to members of the Defined
Benefit Pension Trust Funds who have voluntarily made contributions during their employment and to eligible State of Colorado choice
members who have selected the Colorado PERA DC Plan as their retirement plan.
VOLUNTARY INVESTMENT PROGRAM FIDUCIARY NET ASSETS
ASSETS DECEMBER 31, 2007 DECEMBER 31, 2006 % CHANGE
Cash and short-term investments $129,204 $119,449 8.2%
Receivables 59,644 52,228 14.2%
Investments, at fair value 1,546,023 1,354,327 14.2%
Total assets 1,734,871 1,526,004 13.7%
LIABILITIES
Investment settlements and other liabilities 1,394 3,165 (56.0%)
Total liabilities 1,394 3,165 (56.0%)
Net assets available for benefits $1,733,477 $1,522,839 13.8%
VOLUNTARY INVESTMENT PROGRAM CHANGES IN FIDUCIARY NET ASSETS
ADDITIONS DECEMBER 31, 2007 DECEMBER 31, 2006 % CHANGE
Employer contributions $4,356 $3,053 42.7%
Member contributions 172,510 165,901 4.0%
Investment income 125,645 166,682 (24.6%)
Other 6,366 3,396 87.5%
Total additions 308,877 339,032 (8.9%)
DEDUCTIONS
Refunds 92,755 108,485 (14.5%)
Administrative expenses 5,484 4,706 16.5%
Total deductions 98,239 113,191 (13.2%)
Changes in net assets available for benefits 210,638 225,841 (6.7%)
Net assets available for benefits
Beginning of year 1,522,839 1,296,998 17.4%
End of year $1,733,477 $1,522,839 13.8%
MANAGEMENT’S DISCUSSION AND ANALYSIS
(In Thousands of Dollars)
28
FINANCIAL SECTION
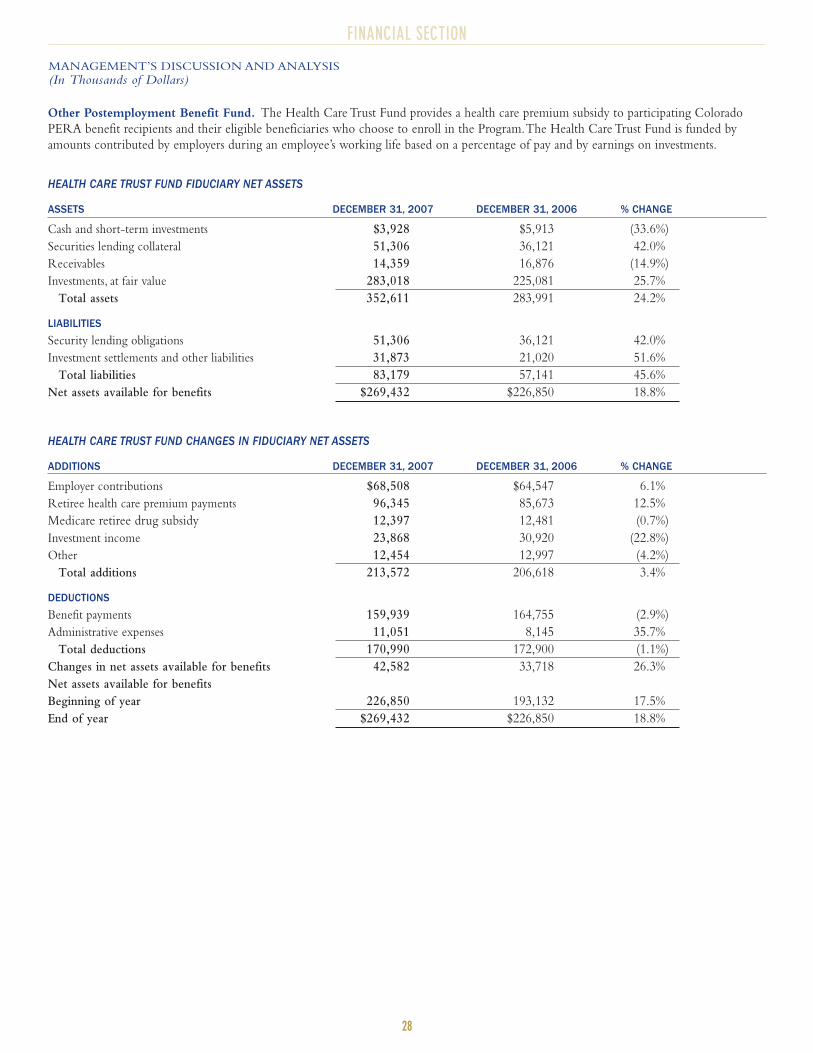
Other Postemployment Benefit Fund. The Health Care Trust Fund provides a health care premium subsidy to participating Colorado
PERA benefit recipients and their eligible beneficiaries who choose to enroll in the Program.The Health Care Trust Fund is funded by
amounts contributed by employers during an employee’s working life based on a percentage of pay and by earnings on investments.
HEALTH CARE TRUST FUND FIDUCIARY NET ASSETS
ASSETS DECEMBER 31, 2007 DECEMBER 31, 2006 % CHANGE
Cash and short-term investments $3,928 $5,913 (33.6%)
Securities lending collateral 51,306 36,121 42.0%
Receivables 14,359 16,876 (14.9%)
Investments, at fair value 283,018 225,081 25.7%
Total assets 352,611 283,991 24.2%
LIABILITIES
Security lending obligations 51,306 36,121 42.0%
Investment settlements and other liabilities 31,873 21,020 51.6%
Total liabilities 83,179 57,141 45.6%
Net assets available for benefits $269,432 $226,850 18.8%
HEALTH CARE TRUST FUND CHANGES IN FIDUCIARY NET ASSETS
ADDITIONS DECEMBER 31, 2007 DECEMBER 31, 2006 % CHANGE
Employer contributions $68,508 $64,547 6.1%
Retiree health care premium payments 96,345 85,673 12.5%
Medicare retiree drug subsidy 12,397 12,481 (0.7%)
Investment income 23,868 30,920 (22.8%)
Other 12,454 12,997 (4.2%)
Total additions 213,572 206,618 3.4%
DEDUCTIONS
Benefit payments 159,939 164,755 (2.9%)
Administrative expenses 11,051 8,145 35.7%
Total deductions 170,990 172,900 (1.1%)
Changes in net assets available for benefits 42,582 33,718 26.3%
Net assets available for benefits
Beginning of year 226,850 193,132 17.5%
End of year $269,432 $226,850 18.8%
MANAGEMENT’S DISCUSSION AND ANALYSIS
(In Thousands of Dollars)
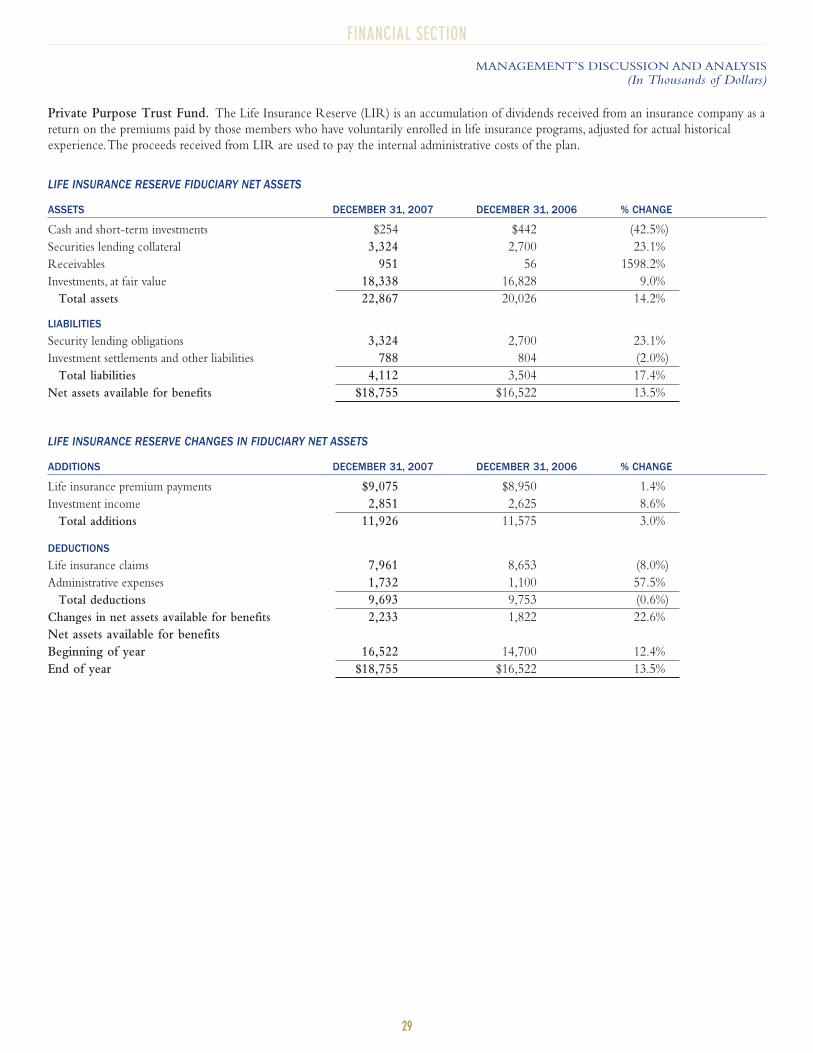
29
FINANCIAL SECTION
Private Purpose Trust Fund. The Life Insurance Reserve (LIR) is an accumulation of dividends received from an insurance company as a
return on the premiums paid by those members who have voluntarily enrolled in life insurance programs, adjusted for actual historical
experience.The proceeds received from LIR are used to pay the internal administrative costs of the plan.
LIFE INSURANCE RESERVE FIDUCIARY NET ASSETS
ASSETS DECEMBER 31, 2007 DECEMBER 31, 2006 % CHANGE
Cash and short-term investments $254 $442 (42.5%)
Securities lending collateral 3,324 2,700 23.1%
Receivables 951 56 1598.2%
Investments, at fair value 18,338 16,828 9.0%
Total assets 22,867 20,026 14.2%
LIABILITIES
Security lending obligations 3,324 2,700 23.1%
Investment settlements and other liabilities 788 804 (2.0%)
Total liabilities 4,112 3,504 17.4%
Net assets available for benefits $18,755 $16,522 13.5%
LIFE INSURANCE RESERVE CHANGES IN FIDUCIARY NET ASSETS
ADDITIONS DECEMBER 31, 2007 DECEMBER 31, 2006 % CHANGE
Life insurance premium payments $9,075 $8,950 1.4%
Investment income 2,851 2,625 8.6%
Total additions 11,926 11,575 3.0%
DEDUCTIONS
Life insurance claims 7,961 8,653 (8.0%)
Administrative expenses 1,732 1,100 57.5%
Total deductions 9,693 9,753 (0.6%)
Changes in net assets available for benefits 2,233 1,822 22.6%
Net assets available for benefits
Beginning of year 16,522 14,700 12.4%
End of year $18,755 $16,522 13.5%
MANAGEMENT’S DISCUSSION AND ANALYSIS
(In Thousands of Dollars)
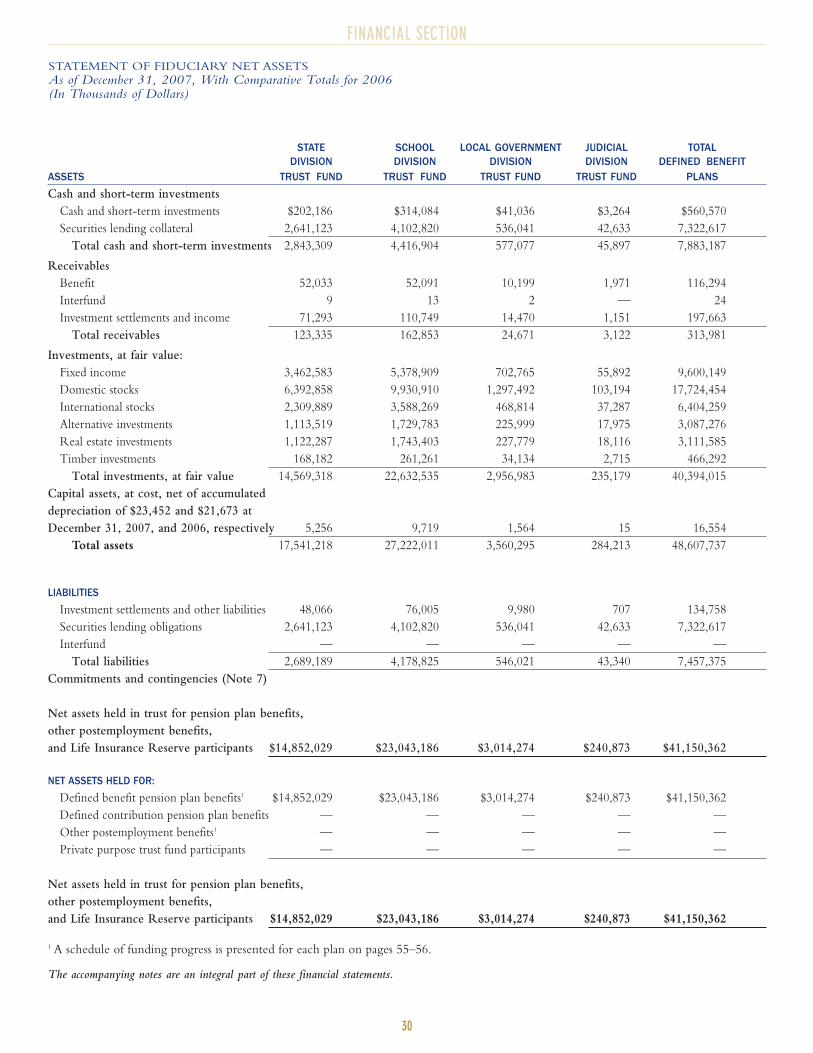
30
FINANCIAL SECTION
STATEMENT OF FIDUCIARY NET ASSETS
As of December 31, 2007, With Comparative Totals for 2006(In Thousands of Dollars)
STATE SCHOOL LOCAL GOVERNMENT JUDICIAL TOTALDIVISION DIVISION DIVISION DIVISION DEFINED BENEFIT
ASSETS TRUST FUND TRUST FUND TRUST FUND TRUST FUND PLANS
Cash and short-term investments
Cash and short-term investments $202,186 $314,084 $41,036 $3,264 $560,570
Securities lending collateral 2,641,123 4,102,820 536,041 42,633 7,322,617
Total cash and short-term investments 2,843,309 4,416,904 577,077 45,897 7,883,187
Receivables
Benefit 52,033 52,091 10,199 1,971 116,294
Interfund 9 13 2 — 24
Investment settlements and income 71,293 110,749 14,470 1,151 197,663
Total receivables 123,335 162,853 24,671 3,122 313,981
Investments, at fair value:
Fixed income 3,462,583 5,378,909 702,765 55,892 9,600,149
Domestic stocks 6,392,858 9,930,910 1,297,492 103,194 17,724,454
International stocks 2,309,889 3,588,269 468,814 37,287 6,404,259
Alternative investments 1,113,519 1,729,783 225,999 17,975 3,087,276
Real estate investments 1,122,287 1,743,403 227,779 18,116 3,111,585
Timber investments 168,182 261,261 34,134 2,715 466,292
Total investments, at fair value 14,569,318 22,632,535 2,956,983 235,179 40,394,015
Capital assets, at cost, net of accumulated
depreciation of $23,452 and $21,673 at
December 31, 2007, and 2006, respectively 5,256 9,719 1,564 15 16,554
Total assets 17,541,218 27,222,011 3,560,295 284,213 48,607,737
LIABILITIES
Investment settlements and other liabilities 48,066 76,005 9,980 707 134,758
Securities lending obligations 2,641,123 4,102,820 536,041 42,633 7,322,617
Interfund — — — — —
Total liabilities 2,689,189 4,178,825 546,021 43,340 7,457,375
Commitments and contingencies (Note 7)
Net assets held in trust for pension plan benefits,
other postemployment benefits,
and Life Insurance Reserve participants $14,852,029 $23,043,186 $3,014,274 $240,873 $41,150,362
NET ASSETS HELD FOR:
Defined benefit pension plan benefits1 $14,852,029 $23,043,186 $3,014,274 $240,873 $41,150,362
Defined contribution pension plan benefits — — — — —
Other postemployment benefits1 — — — — —
Private purpose trust fund participants — — — — —
Net assets held in trust for pension plan benefits,
other postemployment benefits,
and Life Insurance Reserve participants $14,852,029 $23,043,186 $3,014,274 $240,873 $41,150,362
1 A schedule of funding progress is presented for each plan on pages 55–56.
The accompanying notes are an integral part of these financial statements.
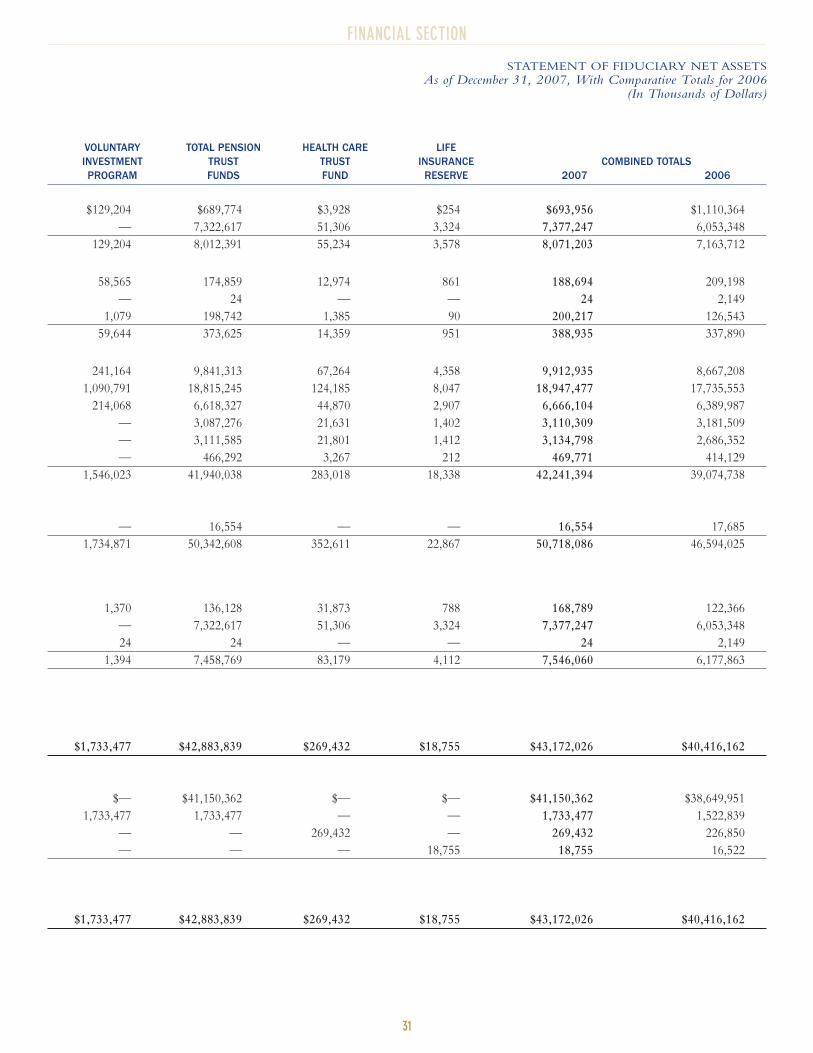
31
FINANCIAL SECTION
VOLUNTARY TOTAL PENSION HEALTH CARE LIFEINVESTMENT TRUST TRUST INSURANCE COMBINED TOTALSPROGRAM FUNDS FUND RESERVE 2007 2006
$129,204 $689,774 $3,928 $254 $693,956 $1,110,364
— 7,322,617 51,306 3,324 7,377,247 6,053,348
129,204 8,012,391 55,234 3,578 8,071,203 7,163,712
58,565 174,859 12,974 861 188,694 209,198
— 24 — — 24 2,149
1,079 198,742 1,385 90 200,217 126,543
59,644 373,625 14,359 951 388,935 337,890
241,164 9,841,313 67,264 4,358 9,912,935 8,667,208
1,090,791 18,815,245 124,185 8,047 18,947,477 17,735,553
214,068 6,618,327 44,870 2,907 6,666,104 6,389,987
— 3,087,276 21,631 1,402 3,110,309 3,181,509
— 3,111,585 21,801 1,412 3,134,798 2,686,352
— 466,292 3,267 212 469,771 414,129
1,546,023 41,940,038 283,018 18,338 42,241,394 39,074,738
— 16,554 — — 16,554 17,685
1,734,871 50,342,608 352,611 22,867 50,718,086 46,594,025
1,370 136,128 31,873 788 168,789 122,366
— 7,322,617 51,306 3,324 7,377,247 6,053,348
24 24 — — 24 2,149
1,394 7,458,769 83,179 4,112 7,546,060 6,177,863
$1,733,477 $42,883,839 $269,432 $18,755 $43,172,026 $40,416,162
$— $41,150,362 $— $— $41,150,362 $38,649,951
1,733,477 1,733,477 — — 1,733,477 1,522,839
— — 269,432 — 269,432 226,850
— — — 18,755 18,755 16,522
$1,733,477 $42,883,839 $269,432 $18,755 $43,172,026 $40,416,162
STATEMENT OF FIDUCIARY NET ASSETS
As of December 31, 2007, With Comparative Totals for 2006(In Thousands of Dollars)
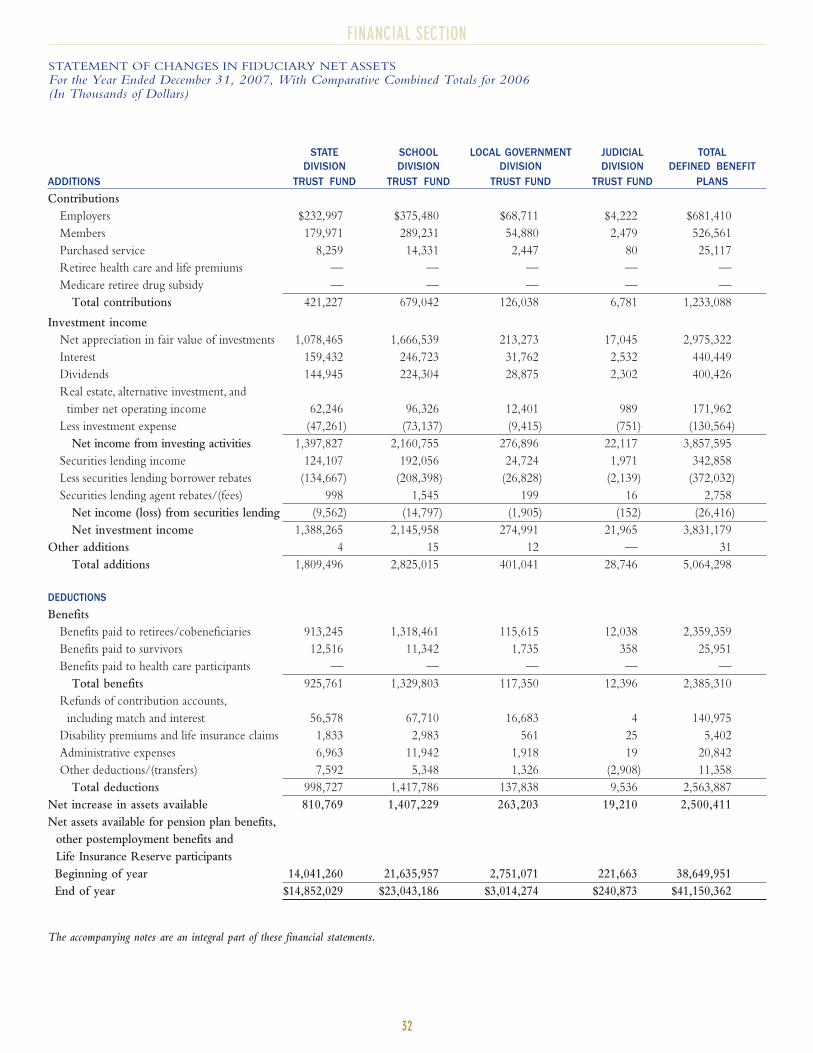
32
FINANCIAL SECTION
STATEMENT OF CHANGES IN FIDUCIARY NET ASSETS
For the Year Ended December 31, 2007, With Comparative Combined Totals for 2006(In Thousands of Dollars)
STATE SCHOOL LOCAL GOVERNMENT JUDICIAL TOTALDIVISION DIVISION DIVISION DIVISION DEFINED BENEFIT
ADDITIONS TRUST FUND TRUST FUND TRUST FUND TRUST FUND PLANS
Contributions
Employers $232,997 $375,480 $68,711 $4,222 $681,410
Members 179,971 289,231 54,880 2,479 526,561
Purchased service 8,259 14,331 2,447 80 25,117
Retiree health care and life premiums — — — — —
Medicare retiree drug subsidy — — — — —
Total contributions 421,227 679,042 126,038 6,781 1,233,088
Investment income
Net appreciation in fair value of investments 1,078,465 1,666,539 213,273 17,045 2,975,322
Interest 159,432 246,723 31,762 2,532 440,449
Dividends 144,945 224,304 28,875 2,302 400,426
Real estate, alternative investment, and
timber net operating income 62,246 96,326 12,401 989 171,962
Less investment expense (47,261) (73,137) (9,415) (751) (130,564)
Net income from investing activities 1,397,827 2,160,755 276,896 22,117 3,857,595
Securities lending income 124,107 192,056 24,724 1,971 342,858
Less securities lending borrower rebates (134,667) (208,398) (26,828) (2,139) (372,032)
Securities lending agent rebates/(fees) 998 1,545 199 16 2,758
Net income (loss) from securities lending (9,562) (14,797) (1,905) (152) (26,416)
Net investment income 1,388,265 2,145,958 274,991 21,965 3,831,179
Other additions 4 15 12 — 31
Total additions 1,809,496 2,825,015 401,041 28,746 5,064,298
DEDUCTIONS
Benefits
Benefits paid to retirees/cobeneficiaries 913,245 1,318,461 115,615 12,038 2,359,359
Benefits paid to survivors 12,516 11,342 1,735 358 25,951
Benefits paid to health care participants — — — — —
Total benefits 925,761 1,329,803 117,350 12,396 2,385,310
Refunds of contribution accounts,
including match and interest 56,578 67,710 16,683 4 140,975
Disability premiums and life insurance claims 1,833 2,983 561 25 5,402
Administrative expenses 6,963 11,942 1,918 19 20,842
Other deductions/(transfers) 7,592 5,348 1,326 (2,908) 11,358
Total deductions 998,727 1,417,786 137,838 9,536 2,563,887
Net increase in assets available 810,769 1,407,229 263,203 19,210 2,500,411
Net assets available for pension plan benefits,
other postemployment benefits and
Life Insurance Reserve participants
Beginning of year 14,041,260 21,635,957 2,751,071 221,663 38,649,951
End of year $14,852,029 $23,043,186 $3,014,274 $240,873 $41,150,362
The accompanying notes are an integral part of these financial statements.
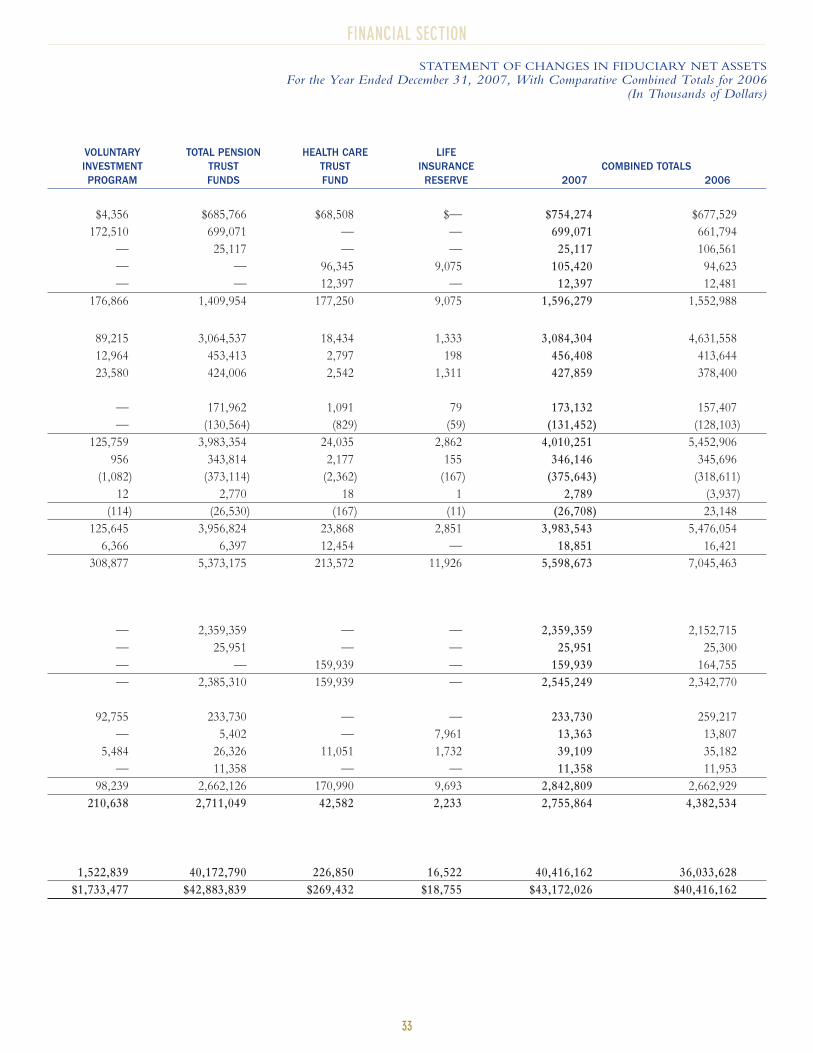
33
FINANCIAL SECTION
STATEMENT OF CHANGES IN FIDUCIARY NET ASSETS
For the Year Ended December 31, 2007, With Comparative Combined Totals for 2006(In Thousands of Dollars)
VOLUNTARY TOTAL PENSION HEALTH CARE LIFEINVESTMENT TRUST TRUST INSURANCE COMBINED TOTALSPROGRAM FUNDS FUND RESERVE 2007 2006
$4,356 $685,766 $68,508 $— $754,274 $677,529
172,510 699,071 — — 699,071 661,794
— 25,117 — — 25,117 106,561
— — 96,345 9,075 105,420 94,623
— — 12,397 — 12,397 12,481
176,866 1,409,954 177,250 9,075 1,596,279 1,552,988
89,215 3,064,537 18,434 1,333 3,084,304 4,631,558
12,964 453,413 2,797 198 456,408 413,644
23,580 424,006 2,542 1,311 427,859 378,400
— 171,962 1,091 79 173,132 157,407
— (130,564) (829) (59) (131,452) (128,103)
125,759 3,983,354 24,035 2,862 4,010,251 5,452,906
956 343,814 2,177 155 346,146 345,696
(1,082) (373,114) (2,362) (167) (375,643) (318,611)
12 2,770 18 1 2,789 (3,937)
(114) (26,530) (167) (11) (26,708) 23,148
125,645 3,956,824 23,868 2,851 3,983,543 5,476,054
6,366 6,397 12,454 — 18,851 16,421
308,877 5,373,175 213,572 11,926 5,598,673 7,045,463
— 2,359,359 — — 2,359,359 2,152,715
— 25,951 — — 25,951 25,300
— — 159,939 — 159,939 164,755
— 2,385,310 159,939 — 2,545,249 2,342,770
92,755 233,730 — — 233,730 259,217
— 5,402 — 7,961 13,363 13,807
5,484 26,326 11,051 1,732 39,109 35,182
— 11,358 — — 11,358 11,953
98,239 2,662,126 170,990 9,693 2,842,809 2,662,929
210,638 2,711,049 42,582 2,233 2,755,864 4,382,534
1,522,839 40,172,790 226,850 16,522 40,416,162 36,033,628
$1,733,477 $42,883,839 $269,432 $18,755 $43,172,026 $40,416,162
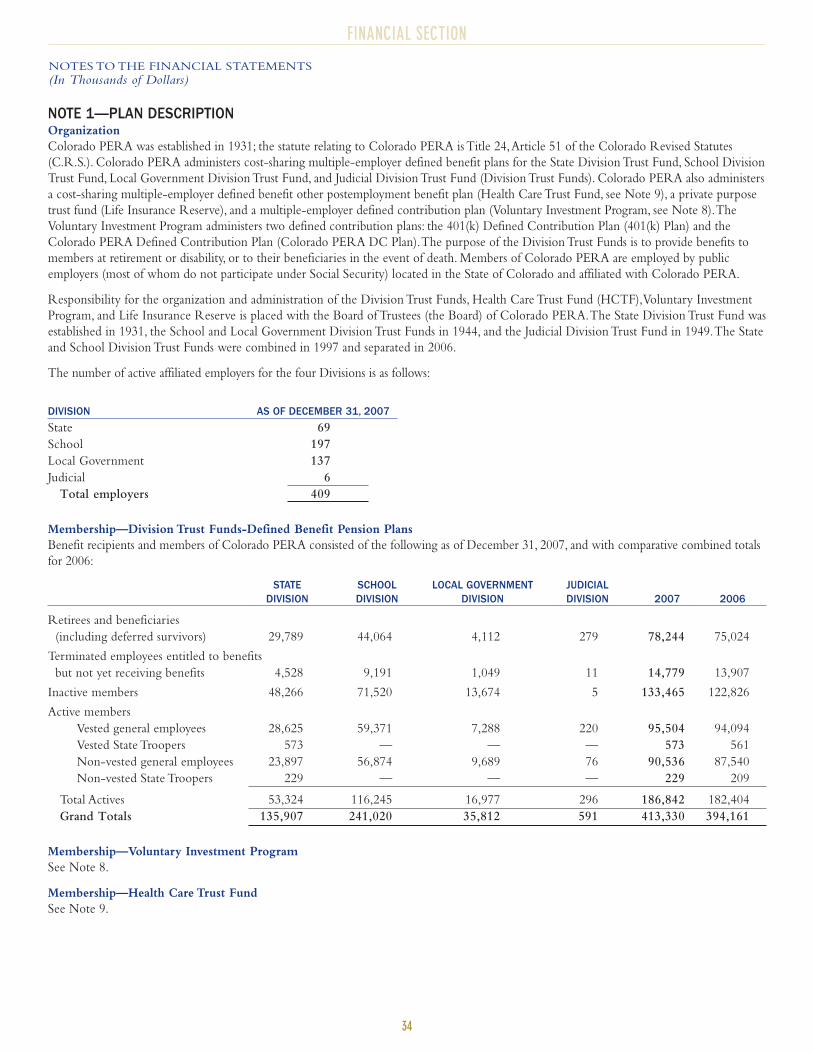
34
FINANCIAL SECTION
NOTES TO THE FINANCIAL STATEMENTS
(In Thousands of Dollars)
NOTE 1—PLAN DESCRIPTIONOrganization
Colorado PERA was established in 1931; the statute relating to Colorado PERA is Title 24,Article 51 of the Colorado Revised Statutes
(C.R.S.). Colorado PERA administers cost-sharing multiple-employer defined benefit plans for the State Division Trust Fund, School Division
Trust Fund, Local Government Division Trust Fund, and Judicial Division Trust Fund (Division Trust Funds). Colorado PERA also administers
a cost-sharing multiple-employer defined benefit other postemployment benefit plan (Health Care Trust Fund, see Note 9), a private purpose
trust fund (Life Insurance Reserve), and a multiple-employer defined contribution plan (Voluntary Investment Program, see Note 8).The
Voluntary Investment Program administers two defined contribution plans: the 401(k) Defined Contribution Plan (401(k) Plan) and the
Colorado PERA Defined Contribution Plan (Colorado PERA DC Plan).The purpose of the Division Trust Funds is to provide benefits to
members at retirement or disability, or to their beneficiaries in the event of death. Members of Colorado PERA are employed by public
employers (most of whom do not participate under Social Security) located in the State of Colorado and affiliated with Colorado PERA.
Responsibility for the organization and administration of the Division Trust Funds, Health Care Trust Fund (HCTF),Voluntary Investment
Program, and Life Insurance Reserve is placed with the Board of Trustees (the Board) of Colorado PERA.The State Division Trust Fund was
established in 1931, the School and Local Government Division Trust Funds in 1944, and the Judicial Division Trust Fund in 1949.The State
and School Division Trust Funds were combined in 1997 and separated in 2006.
The number of active affiliated employers for the four Divisions is as follows:
DIVISION AS OF DECEMBER 31, 2007
State 69
School 197
Local Government 137
Judicial 6
Total employers 409
Membership—Division Trust Funds-Defined Benefit Pension Plans
Benefit recipients and members of Colorado PERA consisted of the following as of December 31, 2007, and with comparative combined totals
for 2006:
STATE SCHOOL LOCAL GOVERNMENT JUDICIAL DIVISION DIVISION DIVISION DIVISION 2007 2006
Retirees and beneficiaries
(including deferred survivors) 29,789 44,064 4,112 279 78,244 75,024
Terminated employees entitled to benefits
but not yet receiving benefits 4,528 9,191 1,049 11 14,779 13,907
Inactive members 48,266 71,520 13,674 5 133,465 122,826
Active members
Vested general employees 28,625 59,371 7,288 220 95,504 94,094
Vested State Troopers 573 — — — 573 561
Non-vested general employees 23,897 56,874 9,689 76 90,536 87,540
Non-vested State Troopers 229 — — — 229 209
Total Actives 53,324 116,245 16,977 296 186,842 182,404
Grand Totals 135,907 241,020 35,812 591 413,330 394,161
Membership—Voluntary Investment Program
See Note 8.
Membership—Health Care Trust Fund
See Note 9.
35
FINANCIAL SECTION
NOTES TO THE FINANCIAL STATEMENTS
(In Thousands of Dollars)
Benefit Provisions—Division Trust Funds
Plan benefits are specified in Title 24,Article 51 of the Colorado Revised Statutes and applicable provisions of the federal Internal Revenue
Code. Colorado State law provisions may be amended from time to time by the Colorado General Assembly.
Plan Eligibility
All employees of Colorado PERA-affiliated employers who work in a position eligible for Colorado PERA membership must be covered by
Colorado PERA, except for those positions eligible for retirement plan choice as described below:
Effective January 1, 2006, certain new employees of State Agencies and Departments are eligible to select a retirement plan in which
to participate. Eligible state employees may choose between the State Division Trust Fund, the Colorado PERA DC Plan and the
State of Colorado Defined Contribution Plan. If an eligible employee does not elect a plan within 60 days of the starting date of
employment, the employee is automatically enrolled in the plan to which he last contributed or the State Division Trust Fund if there
was no prior participation.
Effective January 1, 2008, certain new employees of State Higher Education are also eligible for retirement plan choice. Eligible
community college employees may choose between the State Division Trust Fund and the Colorado PERA DC Plan. If an eligible
employee does not elect a plan within 60 days of the starting date of employment, the employee is automatically enrolled in the plan
to which he last contributed or the State Division Trust Fund if there was no prior participation.
After one year of participation in their plan of choice, employees who elected to participate in the Colorado PERA DC Plan or the State
Division Trust fund may make a one-time election to switch from their plan of choice to the other Colorado PERA Plan. However, the
switch must be made before completing the fifth year of participation in the plan of choice. State Defined Contribution Plan participants do
not have this option.
Some positions of Colorado PERA-affiliated employers are not eligible for Colorado PERA membership but may be covered by another
separate retirement program.
Benefit Provisions
The Division Trust Funds have various benefit provisions depending upon the member’s date of hire or upon the member’s date of
retirement.Where there are differences in plan benefit provisions, they are noted below.
Member Accounts
Members contribute 8 percent of their Colorado PERA-includable salary to their individual accounts; State Troopers and Colorado Bureau
of Investigation agents contribute 10 percent. State law authorizes the Colorado PERA Board to annually determine the interest to be
credited to member accounts. Beginning July 1, 2004, the Board set the interest rate at 5 percent compounded annually.The rate currently
remains at 5 percent. In no event shall the Board specify a rate that exceeds 5 percent.
Service Credit
Members earn service credit for each month of work performed and salary earned for a Colorado PERA-affiliated employer.A full month
of service credit is earned for each month of work and salary equal to 80 multiplied by the federal minimum hourly wage in effect for that
month. Earned salary which is less than this amount results in a partial month of service credit.
Eligible members may purchase additional service credit based upon (1) other employment that is not covered by another retirement
program or (2) the service credit forfeited as the result of a withdrawn account. Such service credit purchases are subject to limits in State
and federal law.The amounts used to purchase service credit are credited to the member’s account and are eligible for interest, but no match.
Highest Average Salary
The plan benefits described below are generally calculated as a percentage of the member’s highest average salary (HAS).
For all members, except judges, who were hired before January 1, 2007, and who retire before January 1, 2009:
HAS is one-twelfth of the average of the highest annual salaries on which Colorado PERA contributions were paid that are
associated with three periods of 12 consecutive months of service credit.The three 12–month periods do not have to be consecutive
nor do they have to be the last three years of employment.
A 15 percent annual limit in actual salary increases applies if any salary used in the HAS calculation is from the three years prior to
retirement.
For all members, except judges, who were hired before January 1, 2007, and who retire on or after January 1, 2009:
HAS is one-twelfth of the average of the highest annual salaries on which Colorado PERA contributions were paid that are
associated with three periods of 12 consecutive months of service credit.
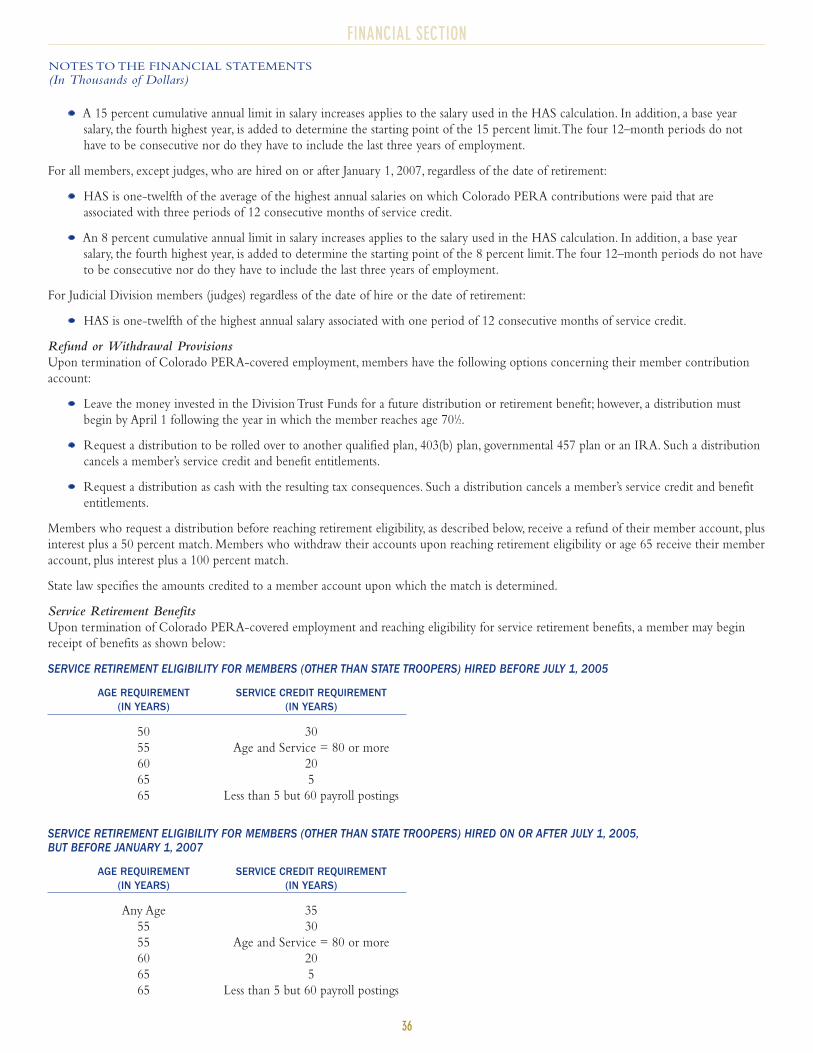
36
FINANCIAL SECTION
NOTES TO THE FINANCIAL STATEMENTS
(In Thousands of Dollars)
A 15 percent cumulative annual limit in salary increases applies to the salary used in the HAS calculation. In addition, a base year
salary, the fourth highest year, is added to determine the starting point of the 15 percent limit.The four 12–month periods do not
have to be consecutive nor do they have to include the last three years of employment.
For all members, except judges, who are hired on or after January 1, 2007, regardless of the date of retirement:
HAS is one-twelfth of the average of the highest annual salaries on which Colorado PERA contributions were paid that are
associated with three periods of 12 consecutive months of service credit.
An 8 percent cumulative annual limit in salary increases applies to the salary used in the HAS calculation. In addition, a base year
salary, the fourth highest year, is added to determine the starting point of the 8 percent limit.The four 12–month periods do not have
to be consecutive nor do they have to include the last three years of employment.
For Judicial Division members (judges) regardless of the date of hire or the date of retirement:
HAS is one-twelfth of the highest annual salary associated with one period of 12 consecutive months of service credit.
Refund or Withdrawal Provisions
Upon termination of Colorado PERA-covered employment, members have the following options concerning their member contribution
account:
Leave the money invested in the Division Trust Funds for a future distribution or retirement benefit; however, a distribution must
begin by April 1 following the year in which the member reaches age 701/2.
Request a distribution to be rolled over to another qualified plan, 403(b) plan, governmental 457 plan or an IRA. Such a distribution
cancels a member’s service credit and benefit entitlements.
Request a distribution as cash with the resulting tax consequences. Such a distribution cancels a member’s service credit and benefit
entitlements.
Members who request a distribution before reaching retirement eligibility, as described below, receive a refund of their member account, plus
interest plus a 50 percent match. Members who withdraw their accounts upon reaching retirement eligibility or age 65 receive their member
account, plus interest plus a 100 percent match.
State law specifies the amounts credited to a member account upon which the match is determined.
Service Retirement Benefits
Upon termination of Colorado PERA-covered employment and reaching eligibility for service retirement benefits, a member may begin
receipt of benefits as shown below:
SERVICE RETIREMENT ELIGIBILITY FOR MEMBERS (OTHER THAN STATE TROOPERS) HIRED BEFORE JULY 1, 2005
AGE REQUIREMENT SERVICE CREDIT REQUIREMENT(IN YEARS) (IN YEARS)
50 30
55 Age and Service = 80 or more
60 20
65 5
65 Less than 5 but 60 payroll postings
SERVICE RETIREMENT ELIGIBILITY FOR MEMBERS (OTHER THAN STATE TROOPERS) HIRED ON OR AFTER JULY 1, 2005,BUT BEFORE JANUARY 1, 2007
AGE REQUIREMENT SERVICE CREDIT REQUIREMENT(IN YEARS) (IN YEARS)
Any Age 35
55 30
55 Age and Service = 80 or more
60 20
65 5
65 Less than 5 but 60 payroll postings
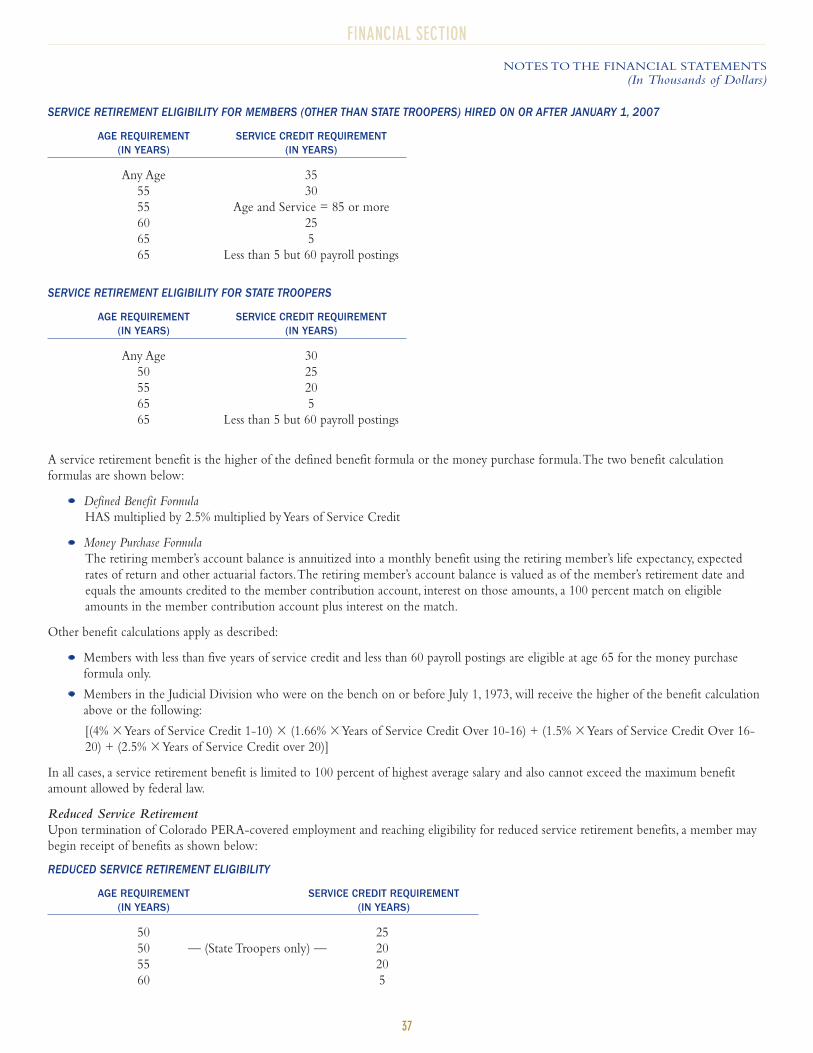
37
FINANCIAL SECTION
NOTES TO THE FINANCIAL STATEMENTS
(In Thousands of Dollars)
SERVICE RETIREMENT ELIGIBILITY FOR MEMBERS (OTHER THAN STATE TROOPERS) HIRED ON OR AFTER JANUARY 1, 2007
AGE REQUIREMENT SERVICE CREDIT REQUIREMENT(IN YEARS) (IN YEARS)
Any Age 35
55 30
55 Age and Service = 85 or more
60 25
65 5
65 Less than 5 but 60 payroll postings
SERVICE RETIREMENT ELIGIBILITY FOR STATE TROOPERS
AGE REQUIREMENT SERVICE CREDIT REQUIREMENT(IN YEARS) (IN YEARS)
Any Age 30
50 25
55 20
65 5
65 Less than 5 but 60 payroll postings
A service retirement benefit is the higher of the defined benefit formula or the money purchase formula.The two benefit calculation
formulas are shown below:
Defined Benefit Formula
HAS multiplied by 2.5% multiplied by Years of Service Credit
Money Purchase Formula
The retiring member’s account balance is annuitized into a monthly benefit using the retiring member’s life expectancy, expected
rates of return and other actuarial factors.The retiring member’s account balance is valued as of the member’s retirement date and
equals the amounts credited to the member contribution account, interest on those amounts, a 100 percent match on eligible
amounts in the member contribution account plus interest on the match.
Other benefit calculations apply as described:
Members with less than five years of service credit and less than 60 payroll postings are eligible at age 65 for the money purchase
formula only.
Members in the Judicial Division who were on the bench on or before July 1, 1973, will receive the higher of the benefit calculation
above or the following:
[(4% �Years of Service Credit 1-10) � (1.66% �Years of Service Credit Over 10-16) + (1.5% �Years of Service Credit Over 16-
20) + (2.5% �Years of Service Credit over 20)]
In all cases, a service retirement benefit is limited to 100 percent of highest average salary and also cannot exceed the maximum benefit
amount allowed by federal law.
Reduced Service Retirement
Upon termination of Colorado PERA-covered employment and reaching eligibility for reduced service retirement benefits, a member may
begin receipt of benefits as shown below:
REDUCED SERVICE RETIREMENT ELIGIBILITY
AGE REQUIREMENT SERVICE CREDIT REQUIREMENT(IN YEARS) (IN YEARS)
50 25
50 — (State Troopers only) — 20
55 20
60 5
38
FINANCIAL SECTION
NOTES TO THE FINANCIAL STATEMENTS
(In Thousands of Dollars)
Reduced service retirement benefits are calculated in the same manner as a service retirement benefit with a reduction for each month prior
to the member’s first eligible date for a service retirement.The benefit calculation reduction factors are specified in C.R.S. §24-51-605.
Disability Program
Members with five or more years of earned service credit, with at least six months of this credit earned in the most recent period of
membership, are covered by the Colorado PERA Disability Program. Medical determinations are made by a separate Disability Program
Administrator, Standard Insurance Company.
Short-Term Disability (STD): Disability applicants who are found to be mentally or physically incapacitated from performance of
essential job duties after reasonable accommodation, but who are not totally and permanently incapacitated from regular and
substantial gainful employment are eligible for STD payments.These payments are an insurance product paid by Standard Insurance
Company.The maximum income replacement is 60 percent of the member’s pre-disability Colorado PERA salary for up to 22
months.
Disability Retirement Benefits: Disability applicants who are found to be totally and permanently mentally or physically incapacitated
from regular and substantial gainful employment are eligible for disability retirement benefits.These benefits are paid by Colorado
PERA for as long as the disability retiree remains disabled.The benefit is calculated as a percentage of the disabled member’s HAS
using accrued, and in some cases projected, service credit.
Benefit Options
Service retirees and disability retirees may elect to receive their retirement or disability benefits in the form of a single-life benefit payable for
the retiree’s lifetime only or one of two joint-life benefits payable for the lifetime of the retiree with a continuing benefit paid upon the
retiree’s death to the retiree’s cobeneficiary. Such option designations may only be changed under limited conditions specified in State law.
Survivor Benefits Program
Members who have at least one year of earned service credit are covered by the Colorado PERA Survivor Benefits Program.The one-year
requirement is waived if the death is job related.
In the event of the covered member’s death, monthly survivor benefits may be paid to the qualified survivors of the deceased. Qualified
survivors generally include minor children, a surviving spouse, dependent parents, or a cobeneficiary (for deceased members who were
eligible for retirement at the time of death).
Benefits are specified in statute and vary based upon the deceased’s HAS, years of service credit, the qualified survivor to whom benefits are
to be paid, and the number of qualified survivors receiving benefits.
If a member dies with less than one year of earned service credit or with no qualified survivors, the deceased’s named beneficiary or the
estate receives a lump-sum payment of the member’s contribution account plus a matching amount equal to 100 percent of the member’s
contributions and interest.
Annual Benefit Increases
On an annual basis, retirement benefits, disability retirement benefits, and survivor benefits are increased.The amount and timing of the
annual increase is determined by the date the retiree or deceased member was hired as a Colorado PERA member.
For service and disability retirees who were hired before June 30, 2005, and for survivor benefit recipients of deceased members who were
hired before June 30, 2005, the annual increase is 3.5 percent, compounded annually.The first annual increase occurs in the March that
immediately follows the calendar year in which the benefit recipient began receiving benefits. If benefits have been payable for less than a full
year, but at least three months, a prorated annual increase is made.
For service and disability retirees who were hired on or after July 1, 2005, but before January 1, 2007, and for survivor benefit recipients of
deceased members who were hired on or after July 1, 2005, but before January 1, 2007, the annual increase is the lower of 3 percent or the
actual change in the Consumer Price Index, compounded annually. If benefits have been payable for less than a full year, but at least three
months, a prorated annual increase is made.
For service and disability retirees who were hired on or after January 1, 2007, and for survivor benefit recipients of deceased members who
were hired on or after January 1, 2007, the annual increase is the lower of 3 percent or the actual change in the Consumer Price Index,
compounded annually. For service retirees, the annual increase does not begin until the retiree has been receiving benefits for one year and in
addition has either reached age 60 or years of service plus age equal to 85 or more. For disability retirees or survivor benefit recipients, the
annual increase does not begin until the benefit recipient has been receiving benefits for one year.Annual increases to all benefit recipients in
this group are limited to 10 percent of the total funds available in the Annual Increase Reserve in the Division from which they retired or
were a member before death.

39
FINANCIAL SECTION
NOTES TO THE FINANCIAL STATEMENTS
(In Thousands of Dollars)
Benefit Provisions—Voluntary Investment Program
See Note 8.
Benefit Provisions—Health Care Trust Fund
See Note 9.
Pension Plan Disclosure Statements for Colorado PERA Employees
All employees of Colorado PERA, an affiliated employer, are members of the State Division Trust Fund and earn and accrue benefits as
would any other member as described above. Colorado PERA, as an affiliated employer, contributes to the State Division Trust Fund (see
Note 4), Colorado PERA also contributes to the Health Care Trust Fund (see Note 9) and employees are able to voluntarily participate in
the 401(k) component of the Voluntary Investment Program (see Note 8).
Colorado PERA’s employer contributions to the State Division Trust Fund for the years ending December 31, 2007, 2006, and 2005, were
$1,688, $1,518, and $1,474, respectively, equal to its required contributions for each year. Colorado PERA’s member contributions to the
State Division Trust Fund for the years ended December 31, 2007, 2006, and 2005, were $1,323, $1,254, and $1,283, respectively. Colorado
PERA’s contributions to the Health Care Trust Fund for the years ending December 31, 2007, 2006, and 2005, were $170, $161, and $164,
respectively, equal to its required contributions for each year.The 401(k) Plan member contributions from Colorado PERA for the years
ended December 31, 2007, 2006, and 2005, were $1,721, $1,513, and $1,526, respectively. Colorado PERA also provides its employees with
an employer partial match to their contributions to the 401(k) Plan, and the totals for the years ended December 31, 2007, 2006, and 2005
were $280, $277, and $274, respectively.
Life Insurance Reserve
The Life Insurance Reserve (LIR) is an accumulation of dividends received from an insurance company as a return on the premiums paid by
those members who have voluntarily enrolled in life insurance programs, adjusted for actual historical experience.The proceeds received
from LIR are used to pay the internal administrative costs of the plan.
Termination of Colorado PERA
If Colorado PERA is partially or fully terminated for any reason, State law (C.R.S. § 24-51-217) provides that the rights of all members and
benefit recipients to all benefits on the date of termination, to the extent then funded, will become nonforfeitable.
NOTE 2—SUMMARY OF SIGNIFICANT ACCOUNTING POLICIESReporting Entity
The Board oversees all funds included in the financial statements of Colorado PERA and has the ability to influence operations.The Board’s
responsibilities include designation of management, membership eligibility, investment of funds, and accountability for fiscal matters.
Colorado PERA is an Instrumentality of the State; it is not an Agency of State government.Also, it is not subject to administrative direction
by any department, commission, board, bureau, or agency of the State.Accordingly, Colorado PERA’s financial statements are not included in
the financial statements of any other organization.
Basis of Presentation
The accompanying financial statements are prepared in accordance with Governmental Accounting Standards Board (GASB) Statements
numbers 25, 28, 34, 37, and 43 as well as generally accepted accounting principles that apply to governmental accounting for fiduciary funds.
In May 2007, the GASB issued Statement No. 50,“Pension Disclosures (an amendment of GASB Statements No. 26 and No. 27).” Colorado
PERA adopted the provisions of this standard for the year ended December 31, 2007.
In June 2007, the GASB issued Statement No. 51,“Accounting and Financial Reporting for Intangible Assets.” The Statement will be
effective for periods beginning after June 15, 2009. Colorado PERA has chosen not to adopt this Statement early.Accordingly, the effect of
implementing the Statement has not been determined for these financial statements and disclosures.
Basis of Accounting
The accompanying financial statements for the pension trust funds, the private purpose trust fund, and the other postemployment benefit
plan are prepared using the economic resources measurement focus and the accrual basis of accounting.The preparation of financial
statements in conformity with accounting principles generally accepted in the United States of America requires Colorado PERA to use
estimates and assumptions that affect the accompanying financial statements and disclosures.Actual results could differ from those estimates.
Member and employer contributions are recognized as revenues in the period in which the compensation becomes payable to the member
and the employer is statutorily committed to pay these contributions to the pension trust funds and the HCTF. Benefits and refunds are
recognized when due and payable.
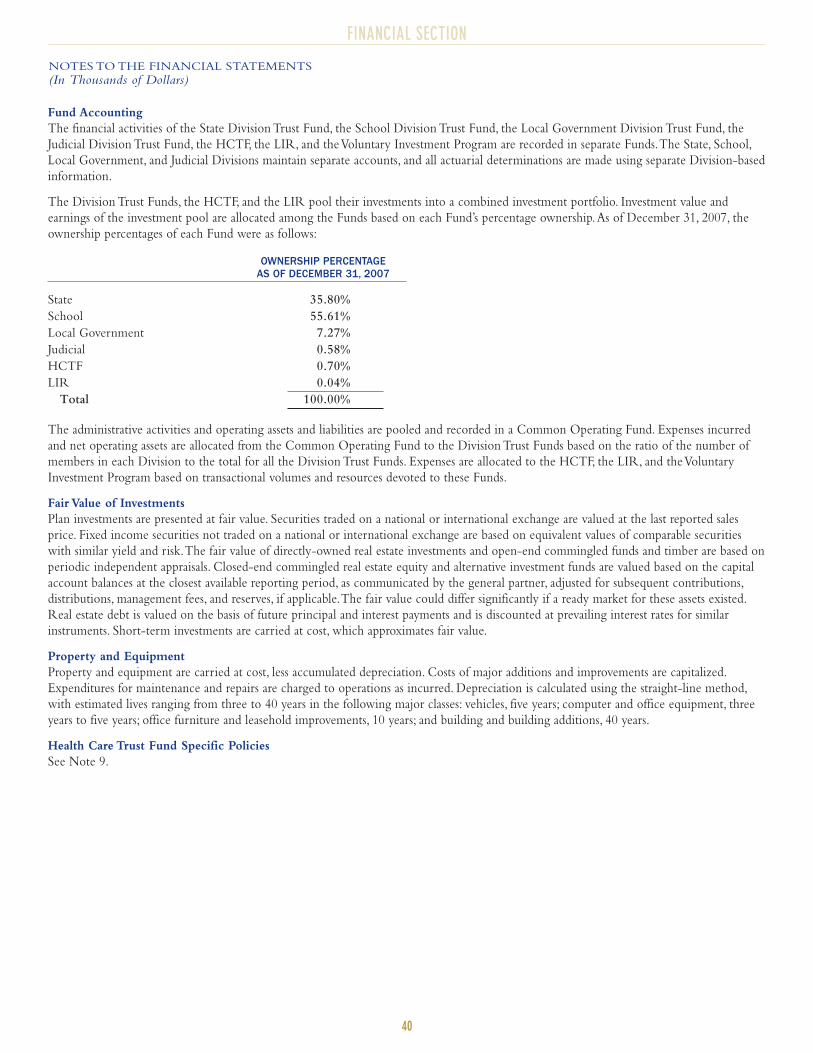
40
FINANCIAL SECTION
NOTES TO THE FINANCIAL STATEMENTS
(In Thousands of Dollars)
Fund Accounting
The financial activities of the State Division Trust Fund, the School Division Trust Fund, the Local Government Division Trust Fund, the
Judicial Division Trust Fund, the HCTF, the LIR, and the Voluntary Investment Program are recorded in separate Funds.The State, School,
Local Government, and Judicial Divisions maintain separate accounts, and all actuarial determinations are made using separate Division-based
information.
The Division Trust Funds, the HCTF, and the LIR pool their investments into a combined investment portfolio. Investment value and
earnings of the investment pool are allocated among the Funds based on each Fund’s percentage ownership.As of December 31, 2007, the
ownership percentages of each Fund were as follows:
OWNERSHIP PERCENTAGEAS OF DECEMBER 31, 2007
State 35.80%
School 55.61%
Local Government 7.27%
Judicial 0.58%
HCTF 0.70%
LIR 0.04%
Total 100.00%
The administrative activities and operating assets and liabilities are pooled and recorded in a Common Operating Fund. Expenses incurred
and net operating assets are allocated from the Common Operating Fund to the Division Trust Funds based on the ratio of the number of
members in each Division to the total for all the Division Trust Funds. Expenses are allocated to the HCTF, the LIR, and the Voluntary
Investment Program based on transactional volumes and resources devoted to these Funds.
Fair Value of Investments
Plan investments are presented at fair value. Securities traded on a national or international exchange are valued at the last reported sales
price. Fixed income securities not traded on a national or international exchange are based on equivalent values of comparable securities
with similar yield and risk.The fair value of directly-owned real estate investments and open-end commingled funds and timber are based on
periodic independent appraisals. Closed-end commingled real estate equity and alternative investment funds are valued based on the capital
account balances at the closest available reporting period, as communicated by the general partner, adjusted for subsequent contributions,
distributions, management fees, and reserves, if applicable.The fair value could differ significantly if a ready market for these assets existed.
Real estate debt is valued on the basis of future principal and interest payments and is discounted at prevailing interest rates for similar
instruments. Short-term investments are carried at cost, which approximates fair value.
Property and Equipment
Property and equipment are carried at cost, less accumulated depreciation. Costs of major additions and improvements are capitalized.
Expenditures for maintenance and repairs are charged to operations as incurred. Depreciation is calculated using the straight-line method,
with estimated lives ranging from three to 40 years in the following major classes: vehicles, five years; computer and office equipment, three
years to five years; office furniture and leasehold improvements, 10 years; and building and building additions, 40 years.
Health Care Trust Fund Specific Policies
See Note 9.
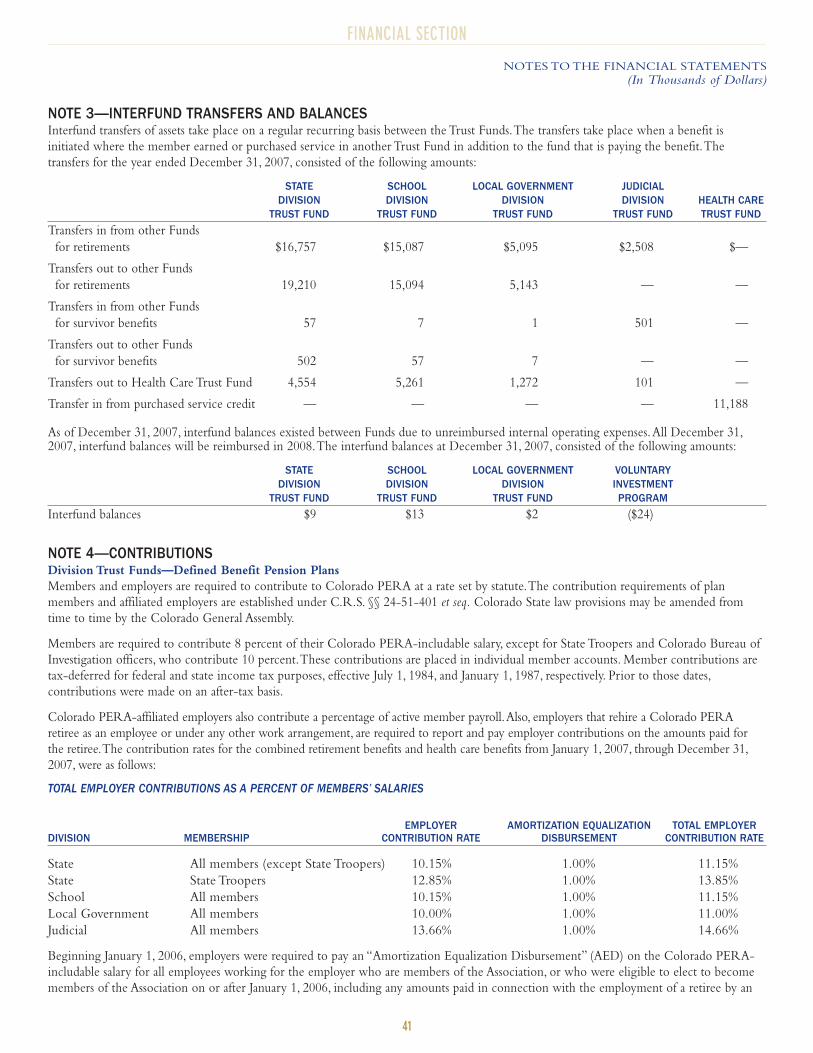
41
FINANCIAL SECTION
NOTES TO THE FINANCIAL STATEMENTS
(In Thousands of Dollars)
NOTE 3—INTERFUND TRANSFERS AND BALANCESInterfund transfers of assets take place on a regular recurring basis between the Trust Funds.The transfers take place when a benefit is
initiated where the member earned or purchased service in another Trust Fund in addition to the fund that is paying the benefit.The
transfers for the year ended December 31, 2007, consisted of the following amounts:
STATE SCHOOL LOCAL GOVERNMENT JUDICIAL DIVISION DIVISION DIVISION DIVISION HEALTH CARE
TRUST FUND TRUST FUND TRUST FUND TRUST FUND TRUST FUND
Transfers in from other Funds
for retirements $16,757 $15,087 $5,095 $2,508 $—
Transfers out to other Funds
for retirements 19,210 15,094 5,143 — —
Transfers in from other Funds
for survivor benefits 57 7 1 501 —
Transfers out to other Funds
for survivor benefits 502 57 7 — —
Transfers out to Health Care Trust Fund 4,554 5,261 1,272 101 —
Transfer in from purchased service credit — — — — 11,188
As of December 31, 2007, interfund balances existed between Funds due to unreimbursed internal operating expenses.All December 31,2007, interfund balances will be reimbursed in 2008.The interfund balances at December 31, 2007, consisted of the following amounts:
STATE SCHOOL LOCAL GOVERNMENT VOLUNTARYDIVISION DIVISION DIVISION INVESTMENT
TRUST FUND TRUST FUND TRUST FUND PROGRAM
Interfund balances $9 $13 $2 ($24)
NOTE 4—CONTRIBUTIONSDivision Trust Funds—Defined Benefit Pension Plans
Members and employers are required to contribute to Colorado PERA at a rate set by statute.The contribution requirements of plan
members and affiliated employers are established under C.R.S. §§ 24-51-401 et seq. Colorado State law provisions may be amended from
time to time by the Colorado General Assembly.
Members are required to contribute 8 percent of their Colorado PERA-includable salary, except for State Troopers and Colorado Bureau of
Investigation officers, who contribute 10 percent.These contributions are placed in individual member accounts. Member contributions are
tax-deferred for federal and state income tax purposes, effective July 1, 1984, and January 1, 1987, respectively. Prior to those dates,
contributions were made on an after-tax basis.
Colorado PERA-affiliated employers also contribute a percentage of active member payroll.Also, employers that rehire a Colorado PERA
retiree as an employee or under any other work arrangement, are required to report and pay employer contributions on the amounts paid for
the retiree.The contribution rates for the combined retirement benefits and health care benefits from January 1, 2007, through December 31,
2007, were as follows:
TOTAL EMPLOYER CONTRIBUTIONS AS A PERCENT OF MEMBERS’ SALARIES
EMPLOYER AMORTIZATION EQUALIZATION TOTAL EMPLOYER DIVISION MEMBERSHIP CONTRIBUTION RATE DISBURSEMENT CONTRIBUTION RATE
State All members (except State Troopers) 10.15% 1.00% 11.15%
State State Troopers 12.85% 1.00% 13.85%
School All members 10.15% 1.00% 11.15%
Local Government All members 10.00% 1.00% 11.00%
Judicial All members 13.66% 1.00% 14.66%
Beginning January 1, 2006, employers were required to pay an “Amortization Equalization Disbursement” (AED) on the Colorado PERA-
includable salary for all employees working for the employer who are members of the Association, or who were eligible to elect to become
members of the Association on or after January 1, 2006, including any amounts paid in connection with the employment of a retiree by an
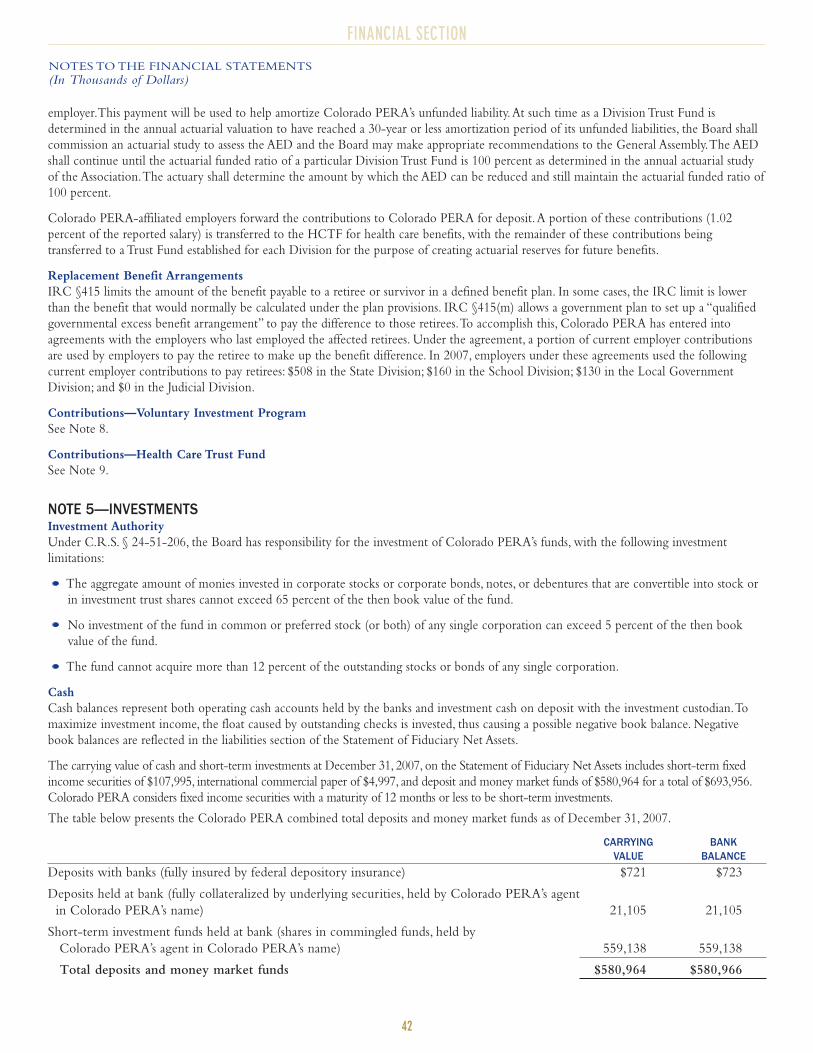
42
FINANCIAL SECTION
NOTES TO THE FINANCIAL STATEMENTS
(In Thousands of Dollars)
employer.This payment will be used to help amortize Colorado PERA’s unfunded liability.At such time as a Division Trust Fund is
determined in the annual actuarial valuation to have reached a 30-year or less amortization period of its unfunded liabilities, the Board shall
commission an actuarial study to assess the AED and the Board may make appropriate recommendations to the General Assembly.The AED
shall continue until the actuarial funded ratio of a particular Division Trust Fund is 100 percent as determined in the annual actuarial study
of the Association.The actuary shall determine the amount by which the AED can be reduced and still maintain the actuarial funded ratio of
100 percent.
Colorado PERA-affiliated employers forward the contributions to Colorado PERA for deposit.A portion of these contributions (1.02
percent of the reported salary) is transferred to the HCTF for health care benefits, with the remainder of these contributions being
transferred to a Trust Fund established for each Division for the purpose of creating actuarial reserves for future benefits.
Replacement Benefit Arrangements
IRC §415 limits the amount of the benefit payable to a retiree or survivor in a defined benefit plan. In some cases, the IRC limit is lower
than the benefit that would normally be calculated under the plan provisions. IRC §415(m) allows a government plan to set up a “qualified
governmental excess benefit arrangement” to pay the difference to those retirees.To accomplish this, Colorado PERA has entered into
agreements with the employers who last employed the affected retirees. Under the agreement, a portion of current employer contributions
are used by employers to pay the retiree to make up the benefit difference. In 2007, employers under these agreements used the following
current employer contributions to pay retirees: $508 in the State Division; $160 in the School Division; $130 in the Local Government
Division; and $0 in the Judicial Division.
Contributions—Voluntary Investment Program
See Note 8.
Contributions—Health Care Trust Fund
See Note 9.
NOTE 5—INVESTMENTSInvestment Authority
Under C.R.S. § 24-51-206, the Board has responsibility for the investment of Colorado PERA’s funds, with the following investment
limitations:
The aggregate amount of monies invested in corporate stocks or corporate bonds, notes, or debentures that are convertible into stock or
in investment trust shares cannot exceed 65 percent of the then book value of the fund.
No investment of the fund in common or preferred stock (or both) of any single corporation can exceed 5 percent of the then book
value of the fund.
The fund cannot acquire more than 12 percent of the outstanding stocks or bonds of any single corporation.
Cash
Cash balances represent both operating cash accounts held by the banks and investment cash on deposit with the investment custodian.To
maximize investment income, the float caused by outstanding checks is invested, thus causing a possible negative book balance. Negative
book balances are reflected in the liabilities section of the Statement of Fiduciary Net Assets.
The carrying value of cash and short-term investments at December 31, 2007, on the Statement of Fiduciary Net Assets includes short-term fixed
income securities of $107,995, international commercial paper of $4,997, and deposit and money market funds of $580,964 for a total of $693,956.
Colorado PERA considers fixed income securities with a maturity of 12 months or less to be short-term investments.
The table below presents the Colorado PERA combined total deposits and money market funds as of December 31, 2007.
CARRYING BANKVALUE BALANCE
Deposits with banks (fully insured by federal depository insurance) $721 $723
Deposits held at bank (fully collateralized by underlying securities, held by Colorado PERA’s agent
in Colorado PERA’s name) 21,105 21,105
Short-term investment funds held at bank (shares in commingled funds, held by
Colorado PERA’s agent in Colorado PERA’s name) 559,138 559,138
Total deposits and money market funds $580,964 $580,966
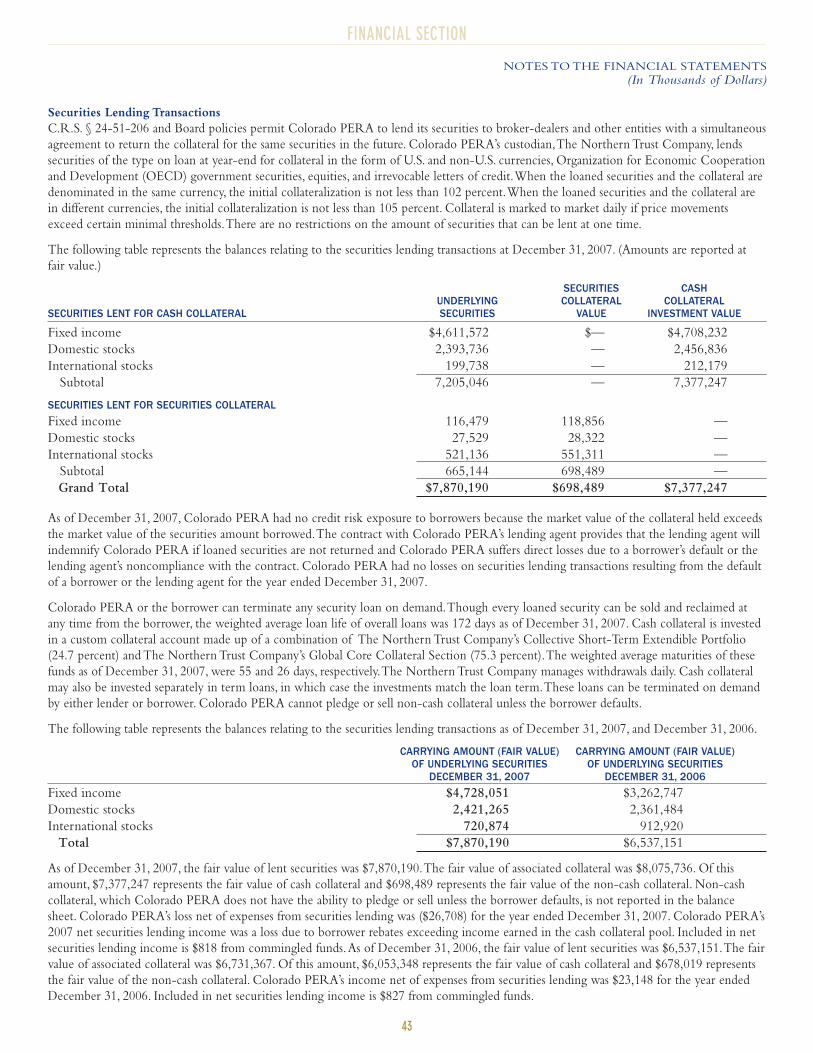
43
FINANCIAL SECTION
NOTES TO THE FINANCIAL STATEMENTS
(In Thousands of Dollars)
Securities Lending Transactions
C.R.S. § 24-51-206 and Board policies permit Colorado PERA to lend its securities to broker-dealers and other entities with a simultaneous
agreement to return the collateral for the same securities in the future. Colorado PERA’s custodian,The Northern Trust Company, lends
securities of the type on loan at year-end for collateral in the form of U.S. and non-U.S. currencies, Organization for Economic Cooperation
and Development (OECD) government securities, equities, and irrevocable letters of credit.When the loaned securities and the collateral are
denominated in the same currency, the initial collateralization is not less than 102 percent.When the loaned securities and the collateral are
in different currencies, the initial collateralization is not less than 105 percent. Collateral is marked to market daily if price movements
exceed certain minimal thresholds.There are no restrictions on the amount of securities that can be lent at one time.
The following table represents the balances relating to the securities lending transactions at December 31, 2007. (Amounts are reported at
fair value.)
SECURITIES CASHUNDERLYING COLLATERAL COLLATERAL
SECURITIES LENT FOR CASH COLLATERAL SECURITIES VALUE INVESTMENT VALUE
Fixed income $4,611,572 $— $4,708,232
Domestic stocks 2,393,736 — 2,456,836
International stocks 199,738 — 212,179
Subtotal 7,205,046 — 7,377,247
SECURITIES LENT FOR SECURITIES COLLATERAL
Fixed income 116,479 118,856 —
Domestic stocks 27,529 28,322 —
International stocks 521,136 551,311 —
Subtotal 665,144 698,489 —
Grand Total $7,870,190 $698,489 $7,377,247
As of December 31, 2007, Colorado PERA had no credit risk exposure to borrowers because the market value of the collateral held exceeds
the market value of the securities amount borrowed.The contract with Colorado PERA’s lending agent provides that the lending agent will
indemnify Colorado PERA if loaned securities are not returned and Colorado PERA suffers direct losses due to a borrower’s default or the
lending agent’s noncompliance with the contract. Colorado PERA had no losses on securities lending transactions resulting from the default
of a borrower or the lending agent for the year ended December 31, 2007.
Colorado PERA or the borrower can terminate any security loan on demand.Though every loaned security can be sold and reclaimed at
any time from the borrower, the weighted average loan life of overall loans was 172 days as of December 31, 2007. Cash collateral is invested
in a custom collateral account made up of a combination of The Northern Trust Company’s Collective Short-Term Extendible Portfolio
(24.7 percent) and The Northern Trust Company’s Global Core Collateral Section (75.3 percent).The weighted average maturities of these
funds as of December 31, 2007, were 55 and 26 days, respectively.The Northern Trust Company manages withdrawals daily. Cash collateral
may also be invested separately in term loans, in which case the investments match the loan term.These loans can be terminated on demand
by either lender or borrower. Colorado PERA cannot pledge or sell non-cash collateral unless the borrower defaults.
The following table represents the balances relating to the securities lending transactions as of December 31, 2007, and December 31, 2006.
CARRYING AMOUNT (FAIR VALUE) CARRYING AMOUNT (FAIR VALUE)OF UNDERLYING SECURITIES OF UNDERLYING SECURITIES
DECEMBER 31, 2007 DECEMBER 31, 2006
Fixed income $4,728,051 $3,262,747
Domestic stocks 2,421,265 2,361,484
International stocks 720,874 912,920
Total $7,870,190 $6,537,151
As of December 31, 2007, the fair value of lent securities was $7,870,190.The fair value of associated collateral was $8,075,736. Of this
amount, $7,377,247 represents the fair value of cash collateral and $698,489 represents the fair value of the non-cash collateral. Non-cash
collateral, which Colorado PERA does not have the ability to pledge or sell unless the borrower defaults, is not reported in the balance
sheet. Colorado PERA’s loss net of expenses from securities lending was ($26,708) for the year ended December 31, 2007. Colorado PERA’s
2007 net securities lending income was a loss due to borrower rebates exceeding income earned in the cash collateral pool. Included in net
securities lending income is $818 from commingled funds.As of December 31, 2006, the fair value of lent securities was $6,537,151.The fair
value of associated collateral was $6,731,367. Of this amount, $6,053,348 represents the fair value of cash collateral and $678,019 represents
the fair value of the non-cash collateral. Colorado PERA’s income net of expenses from securities lending was $23,148 for the year ended
December 31, 2006. Included in net securities lending income is $827 from commingled funds.
44
FINANCIAL SECTION
NOTES TO THE FINANCIAL STATEMENTS
(In Thousands of Dollars)
In accordance with GASB 40, Colorado PERA discloses investments that are subject to custodial credit risk, concentration of credit risk,
credit risk, interest rate risk and foreign currency risk.
Custodial Credit Risk
Colorado PERA has no formal policy for custodial credit risk for investments. Custodial credit risk for investments is the risk that, in the
event of the failure of the counterparty to a transaction, Colorado PERA would not be able to recover the value of investment or collateral
securities that are in possession of an outside party. Investment securities are exposed to custodial credit risk if the securities are uninsured,
are not registered in Colorado PERA’s name and are held by either a counter party or the counter party’s trust department or agent but not
in Colorado PERA’s name. The Northern Trust Company is the master custodian for the majority of Colorado PERA’s securities.At
December 31, 2007, there were no investments or collateral securities subject to custodial credit risk.
Concentration of Credit Risk
Concentration of credit risk is the risk of loss that may be attributed to the magnitude of Colorado PERA’s investment in a single issuer.
C.R.S. § 24-51-206 (3) requires that no investment of the fund in common or preferred stock, or both, of any single corporation shall be of
an amount which exceeds 5 percent of the then book value of the fund, nor shall the fund acquire more than 12 percent of the outstanding
stock or bonds of any single corporation.The 12 percent requirement does not apply to governmental securities (U.S.Treasuries, sovereigns,
etc.), GSE securities (agencies including FNMA, FHLMC, etc.), mortgage-backed securities (agency or non-agency), commercial mortgage-
backed securities (CMBS), asset-backed securities, or municipal securities.There is no single issuer exposure that comprises 5 percent of the
then book value of the fund and no holdings greater than 12 percent of the outstanding stock or bonds of any single corporation at
December 31, 2007.
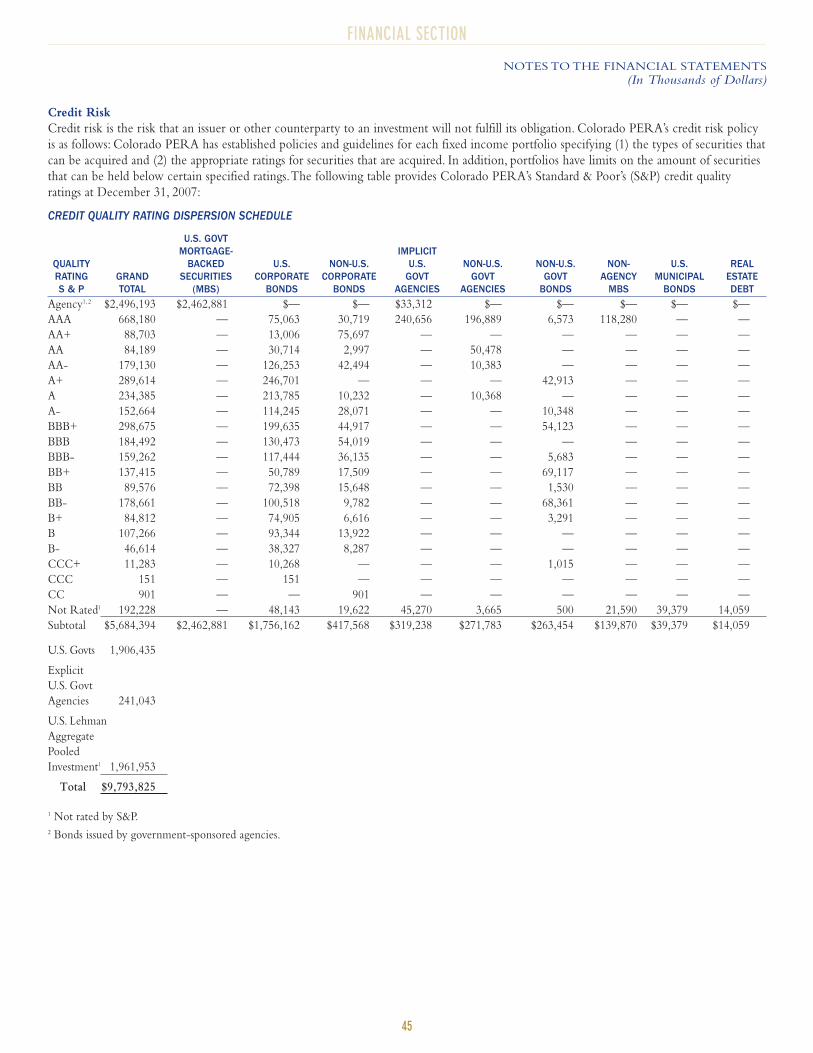
45
FINANCIAL SECTION
NOTES TO THE FINANCIAL STATEMENTS
(In Thousands of Dollars)
Credit Risk
Credit risk is the risk that an issuer or other counterparty to an investment will not fulfill its obligation. Colorado PERA’s credit risk policy
is as follows: Colorado PERA has established policies and guidelines for each fixed income portfolio specifying (1) the types of securities that
can be acquired and (2) the appropriate ratings for securities that are acquired. In addition, portfolios have limits on the amount of securities
that can be held below certain specified ratings.The following table provides Colorado PERA’s Standard & Poor’s (S&P) credit quality
ratings at December 31, 2007:
CREDIT QUALITY RATING DISPERSION SCHEDULE
U.S. GOVTMORTGAGE- IMPLICIT
QUALITY BACKED U.S. NON-U.S. U.S. NON-U.S. NON-U.S. NON- U.S. REALRATING GRAND SECURITIES CORPORATE CORPORATE GOVT GOVT GOVT AGENCY MUNICIPAL ESTATES & P TOTAL (MBS) BONDS BONDS AGENCIES AGENCIES BONDS MBS BONDS DEBT
Agency1, 2 $2,496,193 $2,462,881 $— $— $33,312 $— $— $— $— $—
AAA 668,180 — 75,063 30,719 240,656 196,889 6,573 118,280 — —
AA+ 88,703 — 13,006 75,697 — — — — — —
AA 84,189 — 30,714 2,997 — 50,478 — — — —
AA- 179,130 — 126,253 42,494 — 10,383 — — — —
A+ 289,614 — 246,701 — — — 42,913 — — —
A 234,385 — 213,785 10,232 — 10,368 — — — —
A- 152,664 — 114,245 28,071 — — 10,348 — — —
BBB+ 298,675 — 199,635 44,917 — — 54,123 — — —
BBB 184,492 — 130,473 54,019 — — — — — —
BBB- 159,262 — 117,444 36,135 — — 5,683 — — —
BB+ 137,415 — 50,789 17,509 — — 69,117 — — —
BB 89,576 — 72,398 15,648 — — 1,530 — — —
BB- 178,661 — 100,518 9,782 — — 68,361 — — —
B+ 84,812 — 74,905 6,616 — — 3,291 — — —
B 107,266 — 93,344 13,922 — — — — — —
B- 46,614 — 38,327 8,287 — — — — — —
CCC+ 11,283 — 10,268 — — — 1,015 — — —
CCC 151 — 151 — — — — — — —
CC 901 — — 901 — — — — — —
Not Rated1 192,228 — 48,143 19,622 45,270 3,665 500 21,590 39,379 14,059
Subtotal $5,684,394 $2,462,881 $1,756,162 $417,568 $319,238 $271,783 $263,454 $139,870 $39,379 $14,059
U.S. Govts 1,906,435
Explicit
U.S. Govt
Agencies 241,043
U.S. Lehman
Aggregate
Pooled
Investment1 1,961,953
Total $9,793,825
1 Not rated by S&P.2 Bonds issued by government-sponsored agencies.
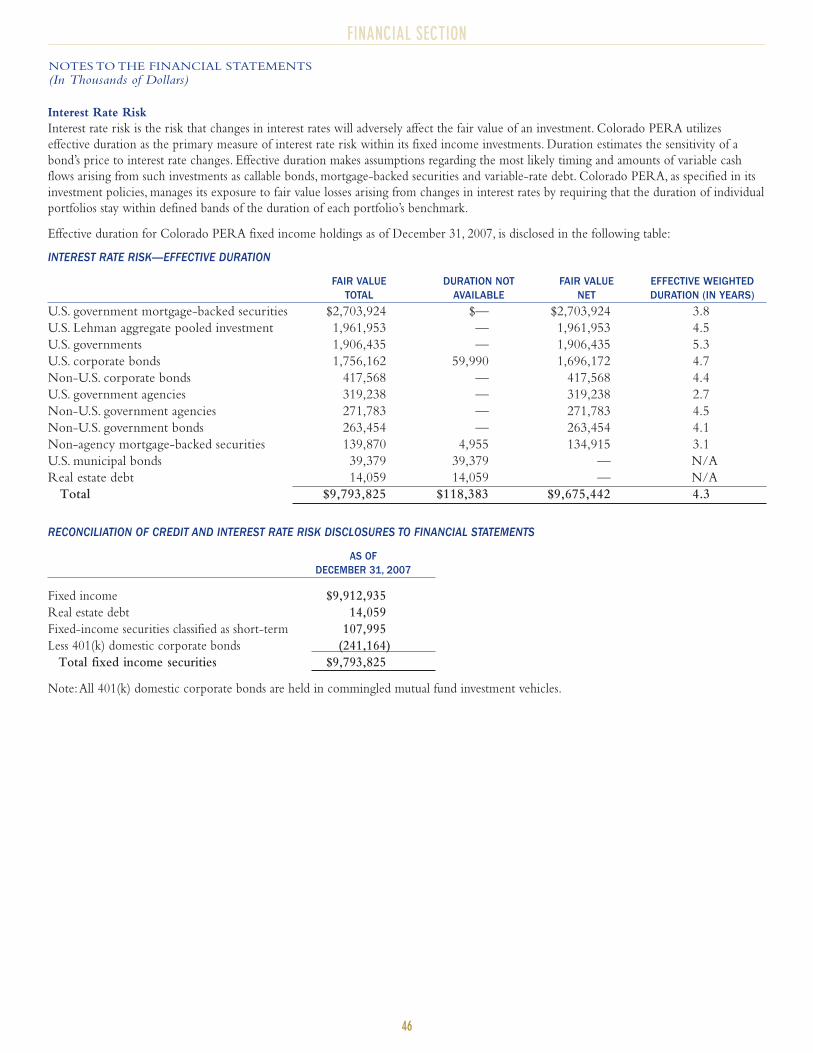
46
FINANCIAL SECTION
NOTES TO THE FINANCIAL STATEMENTS
(In Thousands of Dollars)
Interest Rate Risk
Interest rate risk is the risk that changes in interest rates will adversely affect the fair value of an investment. Colorado PERA utilizes
effective duration as the primary measure of interest rate risk within its fixed income investments. Duration estimates the sensitivity of a
bond’s price to interest rate changes. Effective duration makes assumptions regarding the most likely timing and amounts of variable cash
flows arising from such investments as callable bonds, mortgage-backed securities and variable-rate debt. Colorado PERA, as specified in its
investment policies, manages its exposure to fair value losses arising from changes in interest rates by requiring that the duration of individual
portfolios stay within defined bands of the duration of each portfolio’s benchmark.
Effective duration for Colorado PERA fixed income holdings as of December 31, 2007, is disclosed in the following table:
INTEREST RATE RISK—EFFECTIVE DURATION
FAIR VALUE DURATION NOT FAIR VALUE EFFECTIVE WEIGHTEDTOTAL AVAILABLE NET DURATION (IN YEARS)
U.S. government mortgage-backed securities $2,703,924 $— $2,703,924 3.8
U.S. Lehman aggregate pooled investment 1,961,953 — 1,961,953 4.5
U.S. governments 1,906,435 — 1,906,435 5.3
U.S. corporate bonds 1,756,162 59,990 1,696,172 4.7
Non-U.S. corporate bonds 417,568 — 417,568 4.4
U.S. government agencies 319,238 — 319,238 2.7
Non-U.S. government agencies 271,783 — 271,783 4.5
Non-U.S. government bonds 263,454 — 263,454 4.1
Non-agency mortgage-backed securities 139,870 4,955 134,915 3.1
U.S. municipal bonds 39,379 39,379 — N/A
Real estate debt 14,059 14,059 — N/A
Total $9,793,825 $118,383 $9,675,442 4.3
RECONCILIATION OF CREDIT AND INTEREST RATE RISK DISCLOSURES TO FINANCIAL STATEMENTS
AS OFDECEMBER 31, 2007
Fixed income $9,912,935
Real estate debt 14,059
Fixed-income securities classified as short-term 107,995
Less 401(k) domestic corporate bonds (241,164)
Total fixed income securities $9,793,825
Note:All 401(k) domestic corporate bonds are held in commingled mutual fund investment vehicles.
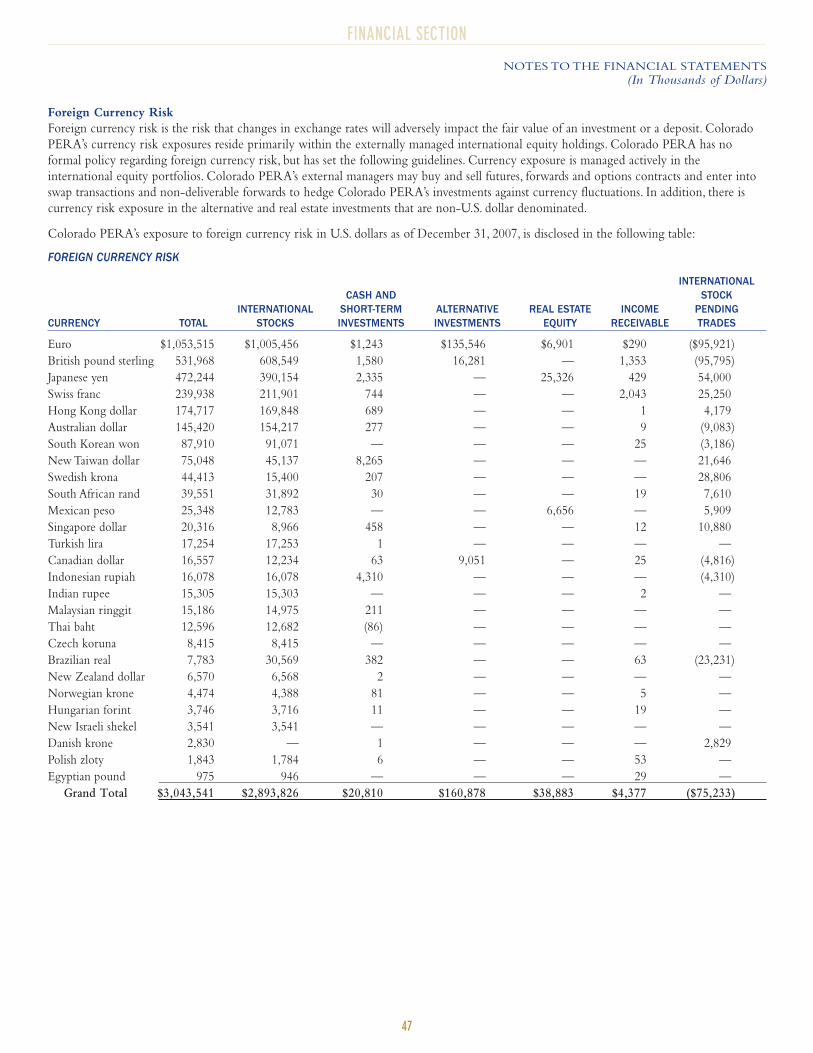
47
FINANCIAL SECTION
NOTES TO THE FINANCIAL STATEMENTS
(In Thousands of Dollars)
Foreign Currency Risk
Foreign currency risk is the risk that changes in exchange rates will adversely impact the fair value of an investment or a deposit. Colorado
PERA’s currency risk exposures reside primarily within the externally managed international equity holdings. Colorado PERA has no
formal policy regarding foreign currency risk, but has set the following guidelines. Currency exposure is managed actively in the
international equity portfolios. Colorado PERA’s external managers may buy and sell futures, forwards and options contracts and enter into
swap transactions and non-deliverable forwards to hedge Colorado PERA’s investments against currency fluctuations. In addition, there is
currency risk exposure in the alternative and real estate investments that are non-U.S. dollar denominated.
Colorado PERA’s exposure to foreign currency risk in U.S. dollars as of December 31, 2007, is disclosed in the following table:
FOREIGN CURRENCY RISK
INTERNATIONAL CASH AND STOCK
INTERNATIONAL SHORT-TERM ALTERNATIVE REAL ESTATE INCOME PENDINGCURRENCY TOTAL STOCKS INVESTMENTS INVESTMENTS EQUITY RECEIVABLE TRADES
Euro $1,053,515 $1,005,456 $1,243 $135,546 $6,901 $290 ($95,921)
British pound sterling 531,968 608,549 1,580 16,281 — 1,353 (95,795)
Japanese yen 472,244 390,154 2,335 — 25,326 429 54,000
Swiss franc 239,938 211,901 744 — — 2,043 25,250
Hong Kong dollar 174,717 169,848 689 — — 1 4,179
Australian dollar 145,420 154,217 277 — — 9 (9,083)
South Korean won 87,910 91,071 — — — 25 (3,186)
New Taiwan dollar 75,048 45,137 8,265 — — — 21,646
Swedish krona 44,413 15,400 207 — — — 28,806
South African rand 39,551 31,892 30 — — 19 7,610
Mexican peso 25,348 12,783 — — 6,656 — 5,909
Singapore dollar 20,316 8,966 458 — — 12 10,880
Turkish lira 17,254 17,253 1 — — — —
Canadian dollar 16,557 12,234 63 9,051 — 25 (4,816)
Indonesian rupiah 16,078 16,078 4,310 — — — (4,310)
Indian rupee 15,305 15,303 — — — 2 —
Malaysian ringgit 15,186 14,975 211 — — — —
Thai baht 12,596 12,682 (86) — — — —
Czech koruna 8,415 8,415 — — — — —
Brazilian real 7,783 30,569 382 — — 63 (23,231)
New Zealand dollar 6,570 6,568 2 — — — —
Norwegian krone 4,474 4,388 81 — — 5 —
Hungarian forint 3,746 3,716 11 — — 19 —
New Israeli shekel 3,541 3,541 — — — — —
Danish krone 2,830 — 1 — — — 2,829
Polish zloty 1,843 1,784 6 — — 53 —
Egyptian pound 975 946 — — — 29 —
Grand Total $3,043,541 $2,893,826 $20,810 $160,878 $38,883 $4,377 ($75,233)
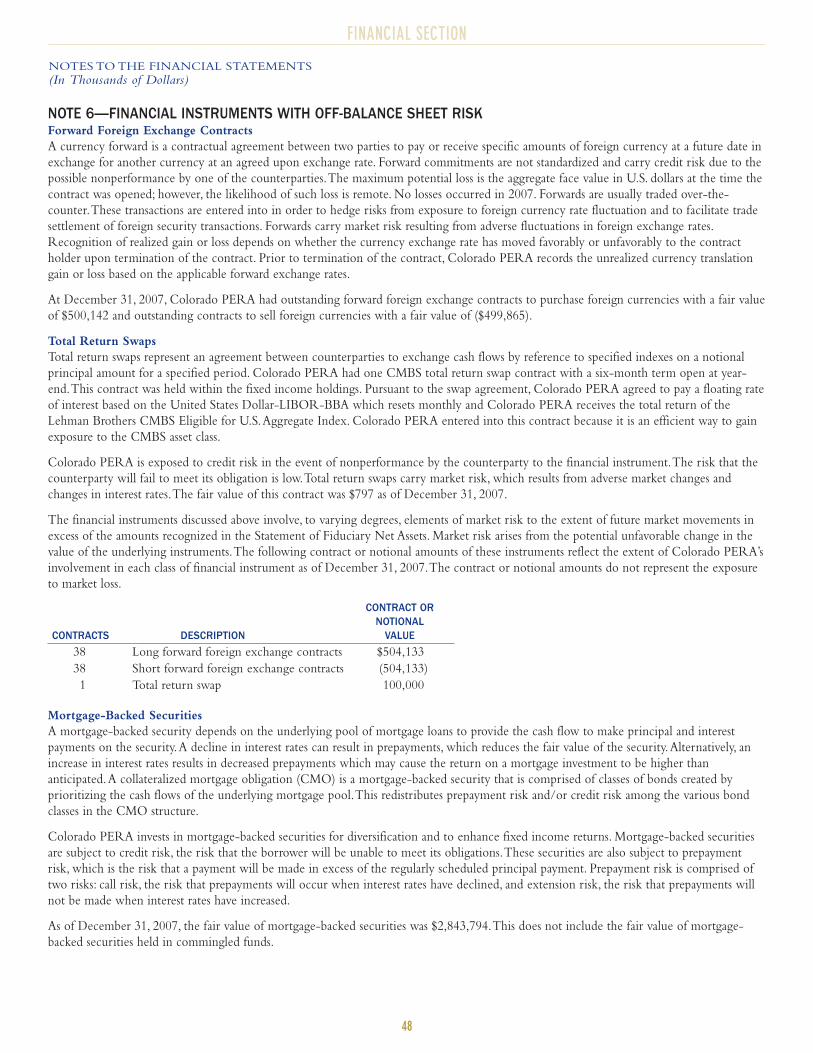
48
FINANCIAL SECTION
NOTES TO THE FINANCIAL STATEMENTS
(In Thousands of Dollars)
NOTE 6—FINANCIAL INSTRUMENTS WITH OFF-BALANCE SHEET RISKForward Foreign Exchange Contracts
A currency forward is a contractual agreement between two parties to pay or receive specific amounts of foreign currency at a future date in
exchange for another currency at an agreed upon exchange rate. Forward commitments are not standardized and carry credit risk due to the
possible nonperformance by one of the counterparties.The maximum potential loss is the aggregate face value in U.S. dollars at the time the
contract was opened; however, the likelihood of such loss is remote. No losses occurred in 2007. Forwards are usually traded over-the-
counter.These transactions are entered into in order to hedge risks from exposure to foreign currency rate fluctuation and to facilitate trade
settlement of foreign security transactions. Forwards carry market risk resulting from adverse fluctuations in foreign exchange rates.
Recognition of realized gain or loss depends on whether the currency exchange rate has moved favorably or unfavorably to the contract
holder upon termination of the contract. Prior to termination of the contract, Colorado PERA records the unrealized currency translation
gain or loss based on the applicable forward exchange rates.
At December 31, 2007, Colorado PERA had outstanding forward foreign exchange contracts to purchase foreign currencies with a fair value
of $500,142 and outstanding contracts to sell foreign currencies with a fair value of ($499,865).
Total Return Swaps
Total return swaps represent an agreement between counterparties to exchange cash flows by reference to specified indexes on a notional
principal amount for a specified period. Colorado PERA had one CMBS total return swap contract with a six-month term open at year-
end.This contract was held within the fixed income holdings. Pursuant to the swap agreement, Colorado PERA agreed to pay a floating rate
of interest based on the United States Dollar-LIBOR-BBA which resets monthly and Colorado PERA receives the total return of the
Lehman Brothers CMBS Eligible for U.S.Aggregate Index. Colorado PERA entered into this contract because it is an efficient way to gain
exposure to the CMBS asset class.
Colorado PERA is exposed to credit risk in the event of nonperformance by the counterparty to the financial instrument.The risk that the
counterparty will fail to meet its obligation is low.Total return swaps carry market risk, which results from adverse market changes and
changes in interest rates.The fair value of this contract was $797 as of December 31, 2007.
The financial instruments discussed above involve, to varying degrees, elements of market risk to the extent of future market movements in
excess of the amounts recognized in the Statement of Fiduciary Net Assets. Market risk arises from the potential unfavorable change in the
value of the underlying instruments.The following contract or notional amounts of these instruments reflect the extent of Colorado PERA’s
involvement in each class of financial instrument as of December 31, 2007.The contract or notional amounts do not represent the exposure
to market loss.
CONTRACT ORNOTIONAL
CONTRACTS DESCRIPTION VALUE
38 Long forward foreign exchange contracts $504,133
38 Short forward foreign exchange contracts (504,133)
1 Total return swap 100,000
Mortgage-Backed Securities
A mortgage-backed security depends on the underlying pool of mortgage loans to provide the cash flow to make principal and interest
payments on the security.A decline in interest rates can result in prepayments, which reduces the fair value of the security.Alternatively, an
increase in interest rates results in decreased prepayments which may cause the return on a mortgage investment to be higher than
anticipated.A collateralized mortgage obligation (CMO) is a mortgage-backed security that is comprised of classes of bonds created by
prioritizing the cash flows of the underlying mortgage pool.This redistributes prepayment risk and/or credit risk among the various bond
classes in the CMO structure.
Colorado PERA invests in mortgage-backed securities for diversification and to enhance fixed income returns. Mortgage-backed securities
are subject to credit risk, the risk that the borrower will be unable to meet its obligations.These securities are also subject to prepayment
risk, which is the risk that a payment will be made in excess of the regularly scheduled principal payment. Prepayment risk is comprised of
two risks: call risk, the risk that prepayments will occur when interest rates have declined, and extension risk, the risk that prepayments will
not be made when interest rates have increased.
As of December 31, 2007, the fair value of mortgage-backed securities was $2,843,794.This does not include the fair value of mortgage-
backed securities held in commingled funds.
49
FINANCIAL SECTION
NOTES TO THE FINANCIAL STATEMENTS
(In Thousands of Dollars)
NOTE 7—COMMITMENTS AND CONTINGENCIESAs of December 31, 2007, Colorado PERA had commitments for the future purchase of investments in alternative investments of
$1,203,924, and real estate of $1,018,223.
NOTE 8—VOLUNTARY INVESTMENT PROGRAM—COLORADO PERA’S DEFINED CONTRIBUTION PENSION TRUSTFUND Colorado PERA, through the Voluntary Investment Program, administers two defined contribution plans: the 401(k) Defined Contribution
Plan and the Colorado PERA Defined Contribution Plan (collectively,“the Plans”).The Board has the authority to establish and amend the
Plans pursuant to C.R.S. §24-51-1401 and C.R.S. §24-51-1501.The complete provisions of both Plans are incorporated into Colorado
PERA’s 401(k) Plan Document. The two Plans vary significantly in their purpose, contribution provisions, and participation.
401(k) Plan
The 401(k) Defined Contribution Pension Plan was established January 1, 1985, and is an Internal Revenue Code §401(k) plan that allows
for voluntary participation to provide additional benefits at retirement for Colorado PERA members.All Colorado PERA members and
retirees working for a Colorado PERA-affiliated employer may contribute to the Colorado PERA 401(k) Plan. In 2007, participants could
contribute the lesser of $15,500 (actual dollars) or 100 percent of compensation less Colorado PERA contributions and employer
contributions. Catch-up contributions up to $5,000 (actual dollars) in 2007 were allowed for participants who had attained age 50 before the
close of the plan year, subject to the limitations of IRC §414(v). Employer matching and discretionary contributions are allowable with total
participant and employer contributions limited to $45,000 (actual dollars) per participant in 2007.
In-service withdrawals are allowed by 401(k) Plan participants while employed with a Colorado PERA affiliated employer through loans,
hardship withdrawals or by a trustee-to-trustee transfer to Colorado PERA’s defined benefit plan to purchase service.As of December 31,
2007, the 401(k) Plan had 72,832 participants with balances. Of those with balances, 39,242 were active participants with contributions in
the last three months of the year; 11,765 were active participants with no contributions in the last three months of the year; 68 were active
participants suspended from making contributions due to a hardship withdrawal; 95 were accounts for deceased participants; 10,271 were
terminated participants with balances; and there were 11,391 retirees with balances. During 2007, the 401(k) Plan had a total of 3,108
terminated participants take full distributions.
Colorado PERA DC Plan
The Colorado PERA Defined Contribution (DC) Plan was established January 1, 2006, and is an Internal Revenue Code §401(a)
governmental profit-sharing plan. Its purpose is to offer a defined contribution alternative to Colorado PERA’s defined benefit plan.
Participation is available to eligible new State employees hired on or after January 1, 2006 (except for certain employees of state colleges and
universities).The eligible employees have the option to choose Colorado PERA’s defined benefit plan, Colorado PERA’s DC Plan, or a
defined contribution plan administered by the State of Colorado.
During the second to fifth year of participation in Colorado PERA’s DC Plan, a participant may elect to terminate membership in the plan
and become a member of Colorado PERA’s defined benefit plan. Similarly, an eligible employee of the Colorado PERA defined benefit plan
may elect, during the second to fifth year of membership, to terminate membership in Colorado PERA’s defined benefit plan and become a
participant of Colorado PERA’s DC Plan. Either election is irrevocable.
Participants in the Colorado PERA DC Plan are required to contribute 8 percent and employers are required to contribute 10.15 percent of
includable salary. (For State Troopers, the rates are 10 percent and 12.85 percent.) Employers also contribute the 1.0 percent Amortization
Equalization Disbursement (see Note 4) to the Division Trust Fund where the employer is affiliated. DC Plan participants are immediately
vested in 50 percent of their employer contributions, together with accumulated investment earnings on the vested portion. For each full
year of participation vesting increases by 10 percent. Contribution requirements are established under C.R.S. § 24-51-1505.
In-service withdrawals are prohibited from Colorado PERA’s DC Plan, although the election to purchase service is available to those who
have made the one-time irrevocable election to transfer to Colorado PERA’s defined benefit plan.As of December 31, 2007, the Colorado
PERA DC Plan had 489 participants with balances. Of those with balances, 308 were active participants with contributions in the last three
months of the year; 22 were active participants with no contributions in the last three months of the year; 158 were terminated participants
with balances; and there was one retiree with a balance. During 2007, the Colorado PERA DC Plan had a total of 44 terminated participants
take full distributions.
Both Plans
The following investment, distribution, and fee provisions are the same under both Plans.
The Board has authorized an Investment Advisory Committee comprised of Colorado PERA staff to review, monitor, and recommend the
investments available to the Plans. Participants have the choice of contributing to 17 different investment funds. Participants may also make
transfers among the investment funds at any time.The investment funds are: Northern Trust Short Term Fund, PIMCO Low Duration Fund,
50
FINANCIAL SECTION
NOTES TO THE FINANCIAL STATEMENTS
(In Thousands of Dollars)
PIMCO Total Return Fund, Dodge & Cox Balanced Fund,Vanguard Institutional Index Fund, Dodge & Cox Stock Fund, Colorado PERA
Growth & Income Stock Fund, GMO US Growth Fund, Fidelity Contrafund,American Funds EuroPacific Growth Fund,Vanguard Small
Cap Index Fund, Fidelity Freedom Income Fund, Fidelity Freedom 2000 Fund, Fidelity Freedom 2010 Fund, Fidelity Freedom 2020 Fund,
Fidelity Freedom 2030 Fund, and Fidelity Freedom 2040 Fund.
The participant’s entire account balance in either Plan becomes available for distribution upon termination from a Colorado PERA-affiliated
employer.All distribution requirements are made in accordance with Colorado PERA’s 401(k) Plan Document and Internal Revenue Code
requirements.
The recordkeeping for all participant transactions is administered by CitiStreet.The custodian is Northern Trust.The custodial agent of the
investments carries no custodial credit risk as all deposits are insured and/or collateralized by the securities held by Northern Trust in
Colorado PERA’s name.All investments are presented at fair value. Cash balances represent both operating cash accounts and investment
cash on deposit held by the custodian. Plan administration expenses are paid through monthly administrative fees charged to participant
accounts. In addition, each investment fund charges an investment management fee, which is paid directly from each investment’s earnings.
NOTE 9—HEALTH CARE TRUST FUND—COLORADO PERA’S COST-SHARING MULTIPLE-EMPLOYER DEFINEDBENEFIT HEALTHCARE PLANPlan Description and Benefit Provisions
The Health Care Trust Fund (HCTF) is a cost-sharing multiple-employer defined benefit other postemployment benefit plan that provides a
health care premium subsidy to participating Colorado PERA benefit recipients who choose to enroll in one of Colorado PERA’s health care
plans.As of December 31, 2007, there were 186,842 Colorado PERA members in active service who were earning a potential future subsidy
benefit if they retire from Colorado PERA and enroll in the plan.There were 14,108 inactive members who had accumulated a potential
subsidy benefit, but were not yet receiving benefits.There were 35,125 retired members who had accumulated a potential subsidy benefit, but
had not elected to enroll in the plan, and there were 44,214 retirees and beneficiaries enrolled in the plan of whom 15,580 were under age 65
and 28,634 were age 65 or older.
C.R.S. §§ 24-51-1201 et seq. specifies the eligibility for enrollment and the amount of the premium subsidy.The maximum monthly subsidy
is $230 (actual dollars) per month for benefit recipients who are under 65 years of age and who are not entitled to Medicare; the subsidy is
$115 (actual dollars) per month for benefit recipients who are 65 years of age or older or who are under 65 years of age and entitled to
Medicare.The maximum subsidy is for benefit recipients whose retirement benefits are based on 20 years or more of service credit. For those
with less service credit, the subsidy is reduced by 5 percent for each year less than 20 years.The benefit recipient pays the remaining portion
of the premium if the subsidy does not cover the entire amount.An additional subsidy exists for retirees who have not participated in Social
Security and are not otherwise eligible for Medicare Part A for hospital-related services. C.R.S. § 24-51-1206(4) states that the HCTF
cannot charge premiums to retirees without Part A that are greater than premiums charged to retirees with Part A for the same plan option,
coverage level, and service credit. Currently for each individual retiree, the total premium for Medicare coverage is determined assuming plan
participants have both Medicare Parts A and B. Implicit in this process, an additional subsidy is paid by the HCTF on behalf of retirees who
are not covered by Medicare Part A.
The HCTF offers two general types of health plans—fully insured plans offered through healthcare organizations and self-insured plans
administered by third party vendors.The plan designs offered include HMO, PPO, Medicare Supplement, Medicare Advantage, and Medicare
Cost plans.
The Medicare Prescription Drug, Improvement, and Modernization Act of 2003 established prescription drug coverage for Medicare
beneficiaries under Medicare Part D. One of the provisions of Medicare Part D provides sponsors of postemployment healthcare plans the
opportunity to receive a payment—referred to as a retiree drug subsidy (RDS)—if the sponsor’s plan provides a prescription drug benefit
that is actuarially equivalent to the Medicare Part D benefit.The RDS is equal to 28 percent of the amount of eligible prescription drug
benefit costs of retirees who are eligible for, but not enrolled in, Medicare Part D, by virtue of continuing to be covered by the sponsor’s
plan.The provisions of Medicare Part D became effective on January 1, 2006.The HCTF receives the Medicare RDS payment for the self-
insured plans administered by Anthem Blue Cross Blue Shield (Anthem) and the insured plan offered by Rocky Mountain Health Plans.The
HCTF uses the anticipated RDS payments to reduce the required premiums collected from the enrollees. The HCTF then pays for the full
premiums or claims during the year, and recoups the additional cost when the RDS payment is received from the federal government. For
the year ended December 31, 2007, the HCTF received $12,397 in Medicare RDS payments.
In addition, all of the fully insured pre-Medicare health plans are available to any Colorado PERA-affiliated employer who voluntarily elects
to provide health care coverage through the Health Care Program for its employees who are Colorado PERA members.The program acts as
a purchaser of private insurance to obtain economies of scale for the employers that elect to join in the joint purchasing arrangement.The
insurance companies who provide coverage through the program set custom rates for each employer group.There is no transfer of risk to the
51
FINANCIAL SECTION
NOTES TO THE FINANCIAL STATEMENTS
(In Thousands of Dollars)
HCTF, to Colorado PERA, or between the participating employers.The insurance companies providing the benefits bear the risk for the
plan.The employers and/or participants pay the full premiums for the coverage and no subsidy is provided by the HCTF. Colorado PERA
collects the premiums and deposits them into the HCTF and then pays these premiums to the insurance companies who provide the
coverage.As of December 31, 2007, there were 22 employers in the program with 383 active members enrolled.
Dental and vision plans are also available to participants.These plans are all fully insured and no subsidy is provided by the HCTF; the risk is
borne by the insurance companies that are contracted to provide the coverage.The participants and/or employers pay the premiums for the
coverage. Colorado PERA collects the premiums and deposits them into the HCTF and then pays these premiums to the insurance
companies who provide the coverage.As of December 31, 2007, there were 26,250 participants enrolled in the dental plans and 21,361
participants enrolled in the vision plans.
The Board has the authority to contract, self-insure, and make disbursements necessary to carry out the purposes of the Program. Colorado
PERA contracts with a major national insurance carrier to administer claims for the self-insured plans, with a national prescription benefit
manager to administer a pharmacy benefit for the self-insured plans, and with health insurance companies to provide fully insured health
plans providing services within Colorado.
Membership
Enrollment in the Health Care Program is voluntary and available to the following eligible individuals. Only those enrollees who are also
PERA Division Trust Fund retiree or survivor benefit recipients receive the subsidy.
Benefit recipients and their dependents.
Guardians of children receiving Colorado PERA survivor benefits if the children are enrolled in the Program.
Surviving spouses of deceased retirees who are not receiving Colorado PERA benefits, but were enrolled in the Program when
death occurred.
Divorced spouses of retirees who are not receiving Colorado PERA benefits, but were enrolled in the Program when the divorce
occurred.
Members while receiving short-term disability program payments.
Members whose employers have elected to provide coverage through the Health Care Program and such members’ dependents.
Summary of HCTF Specific Significant Accounting Policies
Following the applicable recognition requirements of GASB Statement 33, the HCTF recognizes an asset and contribution for the RDS payment.
The HCTF applies the measurement requirements of GASB Statement 43 to determine the actuarial accrued liabilities, the annual required
contribution of the employer (ARC), and the annual other postemployment benefits (OPEB) cost without reduction for RDS payments.
Premiums collected and payments made are handled in two ways, depending on whether or not the plan bears any level of risk with regard
to the health coverage.Where the plan bears risk, all premiums collected are recorded as contributions and all claims or premiums paid are
accounted for as benefit payments.Where there is no risk transfer to the plan, the premiums collected are held by the plan as a liability and
the liability is relieved when the premiums are transferred to the health insurance company that provides the fully insured health plan.When
there is no health coverage risk, the only benefit payment recorded is the subsidy benefit which is equal to the difference between the
premiums collected from the enrollees and the full premium due to the insurance company.
The first health plan that involves risk to the HCTF is the self-insured plan which is administered by Anthem. Colorado PERA uses an outside
consultant to determine the premiums required to cover anticipated health claims less the anticipated Medicare Part D retiree drug subsidy.The
cost to the enrollee is further reduced by the amount of the enrollee’s calculated subsidy, if applicable. Implicit in this process is the risk that
actual claims experience and the Medicare RDS could be different from the estimates resulting in either a gain or a loss to the HCTF.
The second health plan that involves risk to the HCTF is Rocky Mountain Health Plans’ (RMHP) Medicare plan where the HCTF directly
receives the Medicare RDS payment from the federal government. Using an outside consultant, Colorado PERA estimates in advance the
amount of the Medicare RDS payment that the HCTF will receive based on an estimate of the amount of claims that will be paid by
RMHP.The anticipated savings is passed on to the enrollees through a premium reduction.The HCTF pays RMHP the full premium
payment, which includes the amounts collected from enrollees, the HCTF subsidy, as well as an additional amount for the anticipated
Medicare RDS payment which reduced the enrollees’ premiums.The inherent risk is that the actual Medicare RDS could be different from
the estimate resulting in either a gain or a loss to the HCTF.
Contributions
Contribution requirements are established by statute under C.R.S. § 24-51-208. Colorado State law provisions may be amended from time
to time by the Colorado General Assembly.Affiliated employers must submit contributions for all Colorado PERA members equal to 1.02
percent of covered salaries.
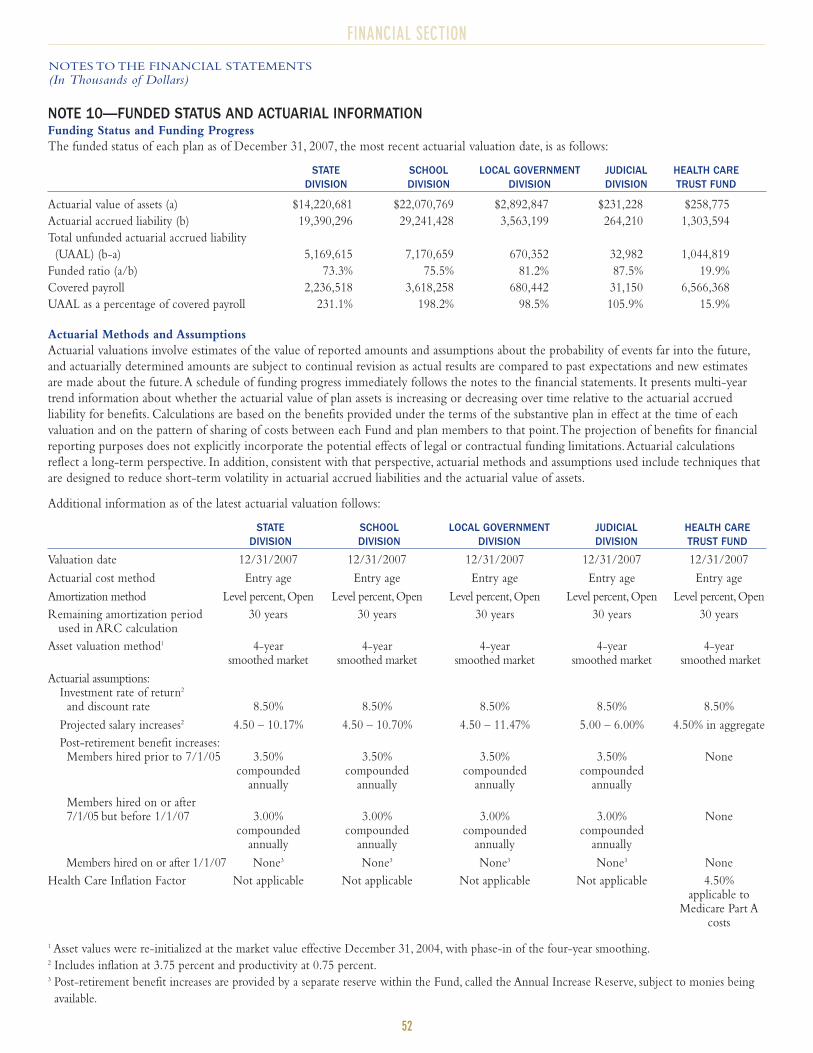
52
FINANCIAL SECTION
NOTES TO THE FINANCIAL STATEMENTS
(In Thousands of Dollars)
NOTE 10—FUNDED STATUS AND ACTUARIAL INFORMATIONFunding Status and Funding Progress
The funded status of each plan as of December 31, 2007, the most recent actuarial valuation date, is as follows:
STATE SCHOOL LOCAL GOVERNMENT JUDICIAL HEALTH CAREDIVISION DIVISION DIVISION DIVISION TRUST FUND
Actuarial value of assets (a) $14,220,681 $22,070,769 $2,892,847 $231,228 $258,775
Actuarial accrued liability (b) 19,390,296 29,241,428 3,563,199 264,210 1,303,594
Total unfunded actuarial accrued liability
(UAAL) (b-a) 5,169,615 7,170,659 670,352 32,982 1,044,819
Funded ratio (a/b) 73.3% 75.5% 81.2% 87.5% 19.9%
Covered payroll 2,236,518 3,618,258 680,442 31,150 6,566,368
UAAL as a percentage of covered payroll 231.1% 198.2% 98.5% 105.9% 15.9%
Actuarial Methods and Assumptions
Actuarial valuations involve estimates of the value of reported amounts and assumptions about the probability of events far into the future,
and actuarially determined amounts are subject to continual revision as actual results are compared to past expectations and new estimates
are made about the future.A schedule of funding progress immediately follows the notes to the financial statements. It presents multi-year
trend information about whether the actuarial value of plan assets is increasing or decreasing over time relative to the actuarial accrued
liability for benefits. Calculations are based on the benefits provided under the terms of the substantive plan in effect at the time of each
valuation and on the pattern of sharing of costs between each Fund and plan members to that point.The projection of benefits for financial
reporting purposes does not explicitly incorporate the potential effects of legal or contractual funding limitations.Actuarial calculations
reflect a long-term perspective. In addition, consistent with that perspective, actuarial methods and assumptions used include techniques that
are designed to reduce short-term volatility in actuarial accrued liabilities and the actuarial value of assets.
Additional information as of the latest actuarial valuation follows:
STATE SCHOOL LOCAL GOVERNMENT JUDICIAL HEALTH CAREDIVISION DIVISION DIVISION DIVISION TRUST FUND
Valuation date 12/31/2007 12/31/2007 12/31/2007 12/31/2007 12/31/2007
Actuarial cost method Entry age Entry age Entry age Entry age Entry age
Amortization method Level percent,Open Level percent,Open Level percent,Open Level percent,Open Level percent,Open
Remaining amortization period 30 years 30 years 30 years 30 years 30 yearsused in ARC calculation
Asset valuation method1 4-year 4-year 4-year 4-year 4-yearsmoothed market smoothed market smoothed market smoothed market smoothed market
Actuarial assumptions:Investment rate of return2
and discount rate 8.50% 8.50% 8.50% 8.50% 8.50%
Projected salary increases2 4.50 – 10.17% 4.50 – 10.70% 4.50 – 11.47% 5.00 – 6.00% 4.50% in aggregate
Post-retirement benefit increases:Members hired prior to 7/1/05 3.50% 3.50% 3.50% 3.50% None
compounded compounded compounded compounded annually annually annually annually
Members hired on or after7/1/05 but before 1/1/07 3.00% 3.00% 3.00% 3.00% None
compounded compounded compounded compounded annually annually annually annually
Members hired on or after 1/1/07 None3 None3 None3 None3 None
Health Care Inflation Factor Not applicable Not applicable Not applicable Not applicable 4.50% applicable to
Medicare Part A costs
1 Asset values were re-initialized at the market value effective December 31, 2004, with phase-in of the four-year smoothing.2 Includes inflation at 3.75 percent and productivity at 0.75 percent.3 Post-retirement benefit increases are provided by a separate reserve within the Fund, called the Annual Increase Reserve, subject to monies being
available.
53
FINANCIAL SECTION
NOTES TO THE FINANCIAL STATEMENTS
(In Thousands of Dollars)
Beginning in 2007, a new reserve was created within each Divisional Trust Fund (“Annual Increase Reserve”) for the purpose of funding
future benefit increases for members hired on or after January 1, 2007. Funding for this reserve comes from the employer contributions and
is calculated at 1 percent of the salary reported for members hired after January 1, 2007. Post-retirement benefit increases for these members
are limited to a maximum of 3 percent compounded annually subject to the availability of assets in the Annual Increase Reserve for each
Division.As of December 31, 2007, the value of the Annual Increase Reserve was $1,110 in the State Division $1,108 in the School
Division, $467 in the Local Government Division, and $11 in the Judicial Division. Since these assets are earmarked for the specific purpose
of providing future benefit increases for members hired after January 1, 2007, they are not included in the Actuarial Value of Assets used in
the calculation of the ARC or the funded status and funding progress of the plans shown above.
NOTE 11—SUBSEQUENT EVENTSLegislation Impacting Future Years
During the 2008 legislative session, House Bill 08-1403: Concerning the Merger of a School District Retirement System, was passed by the
Legislature and signed into law by Governor Ritter on May 28, 2008.This bill modifies the existing law that authorizes the Denver Public
Schools Retirement System (DPSRS) and Denver Public Schools (DPS) to enter into an agreement to merge into Colorado PERA. Major
provisions in the bill include the following:
The effective date of the merger is January 1, 2009, or a later date as agreed to by the parties.
Any of the three parties (Colorado PERA, Denver Public Schools, and the Denver Public Schools Retirement System) are allowed to
end negotiations if a mutually acceptable agreement is not negotiated.
DPS and its related employers will become affiliated employers with Colorado PERA subject to Colorado PERA laws and rules and
all on-going contributions will be governed by Colorado PERA laws and rules.
As of the effective date of the merger, current DPSRS retirees, beneficiaries, survivors, and disability retirees will not have a reduction
in their benefits because of the merger.
The parties will negotiate a separate agreement to address health care coverage for retirees, beneficiaries, and members of DPSRS.
The parties will negotiate portability rules.
The merger will not result in the involuntary reduction of anyone’s benefits.
Two valuations, completed by Colorado PERA’s actuary, will occur:
■ The initial valuation completed within 60 days of the signing of the agreement will be based on December 31, 2007, audited
financial reports, with consideration of the proceeds to DPSRS for the pension certificates of participation.
■ The final valuation based on December 31, 2008, audited financial reports or such later reports as are agreed upon by the parties.
The valuations will establish a single up-front payment that must be transferred from DPSRS to Colorado PERA in order to avoid
any subsidy between the parties and equalize the funding status of the systems.
An Asset Surplus Account (ASA) will be calculated and will consist of the total value of the assets transferred on the date of the
merger minus the single up-front payment.
The ASA monies may be used by DPS as a credit toward their employer contributions, the Amortization Equalization Disbursement
(AED), and the Supplemental AED (SAED).
Colorado PERA will hire the DPSRS staff as of the effective date of the merger as at-will employees, but they will continue to
accrue DPSRS benefits.
During the 2007 legislative session, a bill that impacted Colorado PERA was passed by the Legislature and signed into law by Governor
Ritter on June 1, 2007.The features of the bill that will be implemented in future years that could potentially impact the financial statements
to the greatest extent are listed below:
House Bill 07-1377: Higher Ed and State Retirement Plans
This bill would repeal a portion of Senate Bill 06-235. Under SB 06-235, new employees of higher education institutions who are hired
as of January 1, 2008, are eligible to choose their retirement plan.
HB 07-1377 removes that choice for higher education and gives employees hired after January 1, 2008, the same retirement options as
current employees.The bill makes an exception for new hires at community colleges. HB 07-1377 would give certain new employees
54
FINANCIAL SECTION
hired at a community college on or after January 1, 2008, the ability to choose between participation in the State Division Trust Fund and
the Colorado PERA DC Plan within the Voluntary Investment Program.
During the 2006 legislative session, a bill that impacted Colorado PERA was passed by the Legislature and signed into law by Governor
Owens on May 25, 2006.The features of the bill that will be implemented in future years that could potentially impact the financial
statements to the greatest extent are listed below:
Senate Bill 06-235: Concerning Public Employees’ Retirement Benefit Plans
The addition of a Supplemental Amortization Equalization Disbursement (SAED) that will begin January 1, 2008, at 0.5 percent of
covered salary and will increase by 0.5 percent per year until an additional 3 percent is implemented.The SAED will be discontinued
when each Division Trust Fund reaches 100 percent funding.The SAED is noted in the statute as foregone compensation increases
from employees.
The General Assembly must contract for an independent actuarial study before any future benefit enhancements can occur.
The expansion of Defined Contribution Choice to institutions of higher education effective January 1, 2008. New employees in
higher education would be eligible to select the Colorado PERA DB Plan, the Colorado PERA DC Plan, or the State DC Plan, in
addition to existing Optional Retirement Plans (ORPs) at institutions that have ORPs.This includes faculty and administrators who
have not previously had access to the Colorado PERA DB, Colorado PERA DC, or the State DC Plan. It also includes classified staff
who have not been eligible for DC Choice. Current members of ORPs could not elect to participate in Colorado PERA DB,
Colorado PERA DC, or the State DC Plan. (This provision was repealed as provided in HB 07-1377.)
During the 2004 legislative session, a bill that impacted Colorado PERA was passed by the Legislature and signed into law by Governor
Owens on June 4, 2004.The features of the bill that will be implemented in future years that could potentially impact the financial
statements to the greatest extent are listed below:
Senate Bill 04-257: Public Employee Retirement Plans
This bill will provide additional employer funding for Colorado PERA and will expand the defined contribution plan option beyond
elected officials to new hire State government employees. Major provisions of this bill that will be implemented after the year ended
December 31, 2005, include the following:
An “Amortization Equalization Disbursement” (AED) will be established and will require each Colorado PERA employer to pay 0.5
percent of salary to Colorado PERA, beginning January 1, 2006, increasing by 0.5 percent of salary in 2007 and by 0.4 percent of
salary each subsequent year, reaching a maximum of 3 percent of salary in 2012 and thereafter.This payment will be used to help
amortize Colorado PERA’s unfunded liability. If Colorado PERA reaches 100 percent funded status, the AED will be repealed.
The School employer contribution rate to Colorado PERA will increase by 0.4 percent of salary, beginning January 1, 2013.
Iran-Related Investment Policy
In January 2008, the Board adopted an Iran Related Investment Policy.The policy requires Colorado PERA to initiate a phased strategy to
address Colorado PERA’s direct public investments in foreign companies doing business in the Islamic Republic of Iran.The policy includes
phases for identifying a list of public companies doing business in Iran, criteria that will be used, periods of time for engagement with
companies identified, investment moratorium requirements, and other possible actions including potential divestment.A copy of the Policy
on Iran-Related Investments is available online at www.copera.org/pdf/Policy/IranPolicy.pdf.
Life Insurance Reserve
Effective April 1, 2008, the contract with Unum Life Insurance Company of America, the carrier and administrator for Colorado PERA’s life
insurance program, changed from a flex-funding premium agreement to a fully pooled premium contract.The new contract will increase the
expenses to the Life Insurance Reserve by 31 cents per unit per month and the program currently has approximately 112,000 units of
insurance. This contract is for a two-year period, and the rates are in effect until April 1, 2010.
NOTES TO THE FINANCIAL STATEMENTS
(In Thousands of Dollars)
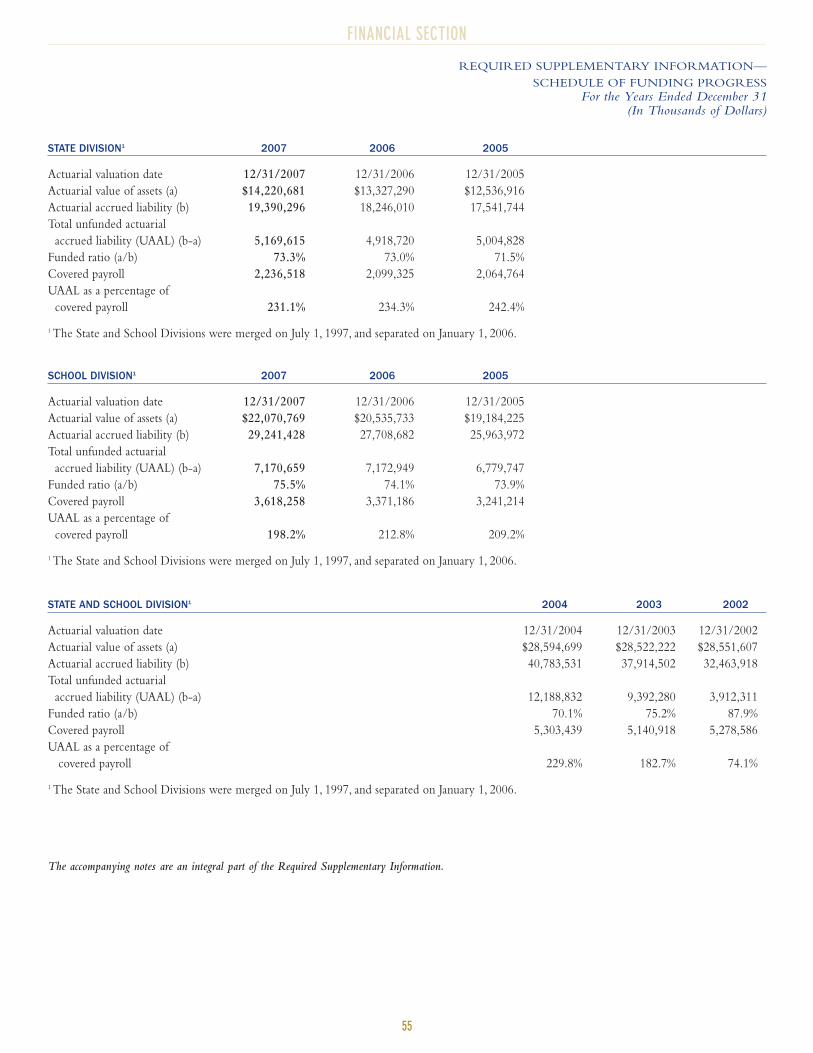
55
FINANCIAL SECTION
REQUIRED SUPPLEMENTARY INFORMATION—
SCHEDULE OF FUNDING PROGRESS
For the Years Ended December 31(In Thousands of Dollars)
STATE DIVISION1 2007 2006 2005
Actuarial valuation date 12/31/2007 12/31/2006 12/31/2005
Actuarial value of assets (a) $14,220,681 $13,327,290 $12,536,916
Actuarial accrued liability (b) 19,390,296 18,246,010 17,541,744
Total unfunded actuarial
accrued liability (UAAL) (b-a) 5,169,615 4,918,720 5,004,828
Funded ratio (a/b) 73.3% 73.0% 71.5%
Covered payroll 2,236,518 2,099,325 2,064,764
UAAL as a percentage of
covered payroll 231.1% 234.3% 242.4%
1 The State and School Divisions were merged on July 1, 1997, and separated on January 1, 2006.
SCHOOL DIVISION1 2007 2006 2005
Actuarial valuation date 12/31/2007 12/31/2006 12/31/2005
Actuarial value of assets (a) $22,070,769 $20,535,733 $19,184,225
Actuarial accrued liability (b) 29,241,428 27,708,682 25,963,972
Total unfunded actuarial
accrued liability (UAAL) (b-a) 7,170,659 7,172,949 6,779,747
Funded ratio (a/b) 75.5% 74.1% 73.9%
Covered payroll 3,618,258 3,371,186 3,241,214
UAAL as a percentage of
covered payroll 198.2% 212.8% 209.2%
1 The State and School Divisions were merged on July 1, 1997, and separated on January 1, 2006.
STATE AND SCHOOL DIVISION1 2004 2003 2002
Actuarial valuation date 12/31/2004 12/31/2003 12/31/2002
Actuarial value of assets (a) $28,594,699 $28,522,222 $28,551,607
Actuarial accrued liability (b) 40,783,531 37,914,502 32,463,918
Total unfunded actuarial
accrued liability (UAAL) (b-a) 12,188,832 9,392,280 3,912,311
Funded ratio (a/b) 70.1% 75.2% 87.9%
Covered payroll 5,303,439 5,140,918 5,278,586
UAAL as a percentage of
covered payroll 229.8% 182.7% 74.1%
1 The State and School Divisions were merged on July 1, 1997, and separated on January 1, 2006.
The accompanying notes are an integral part of the Required Supplementary Information.
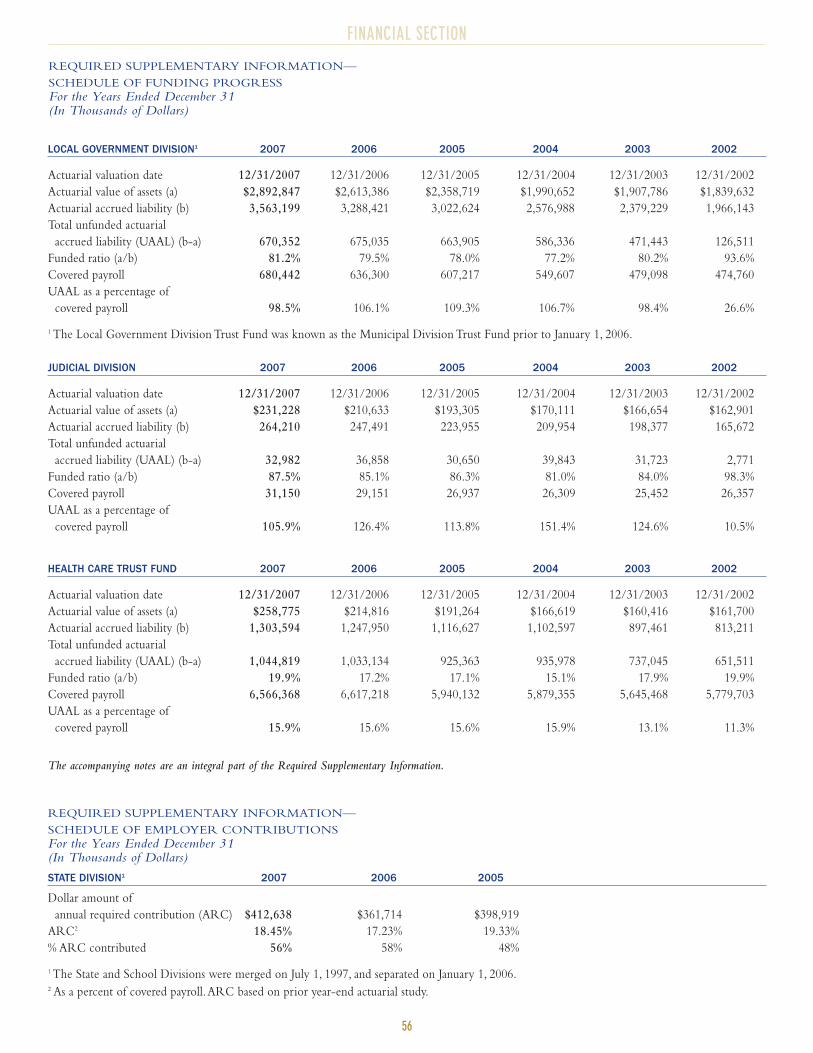
56
FINANCIAL SECTION
REQUIRED SUPPLEMENTARY INFORMATION—
SCHEDULE OF EMPLOYER CONTRIBUTIONS
For the Years Ended December 31(In Thousands of Dollars)
STATE DIVISION1 2007 2006 2005
Dollar amount of
annual required contribution (ARC) $412,638 $361,714 $398,919
ARC2 18.45% 17.23% 19.33%
% ARC contributed 56% 58% 48%
1 The State and School Divisions were merged on July 1, 1997, and separated on January 1, 2006.2 As a percent of covered payroll.ARC based on prior year-end actuarial study.
REQUIRED SUPPLEMENTARY INFORMATION—
SCHEDULE OF FUNDING PROGRESS
For the Years Ended December 31(In Thousands of Dollars)
LOCAL GOVERNMENT DIVISION1 2007 2006 2005 2004 2003 2002
Actuarial valuation date 12/31/2007 12/31/2006 12/31/2005 12/31/2004 12/31/2003 12/31/2002
Actuarial value of assets (a) $2,892,847 $2,613,386 $2,358,719 $1,990,652 $1,907,786 $1,839,632
Actuarial accrued liability (b) 3,563,199 3,288,421 3,022,624 2,576,988 2,379,229 1,966,143
Total unfunded actuarial
accrued liability (UAAL) (b-a) 670,352 675,035 663,905 586,336 471,443 126,511
Funded ratio (a/b) 81.2% 79.5% 78.0% 77.2% 80.2% 93.6%
Covered payroll 680,442 636,300 607,217 549,607 479,098 474,760
UAAL as a percentage of
covered payroll 98.5% 106.1% 109.3% 106.7% 98.4% 26.6%
1 The Local Government Division Trust Fund was known as the Municipal Division Trust Fund prior to January 1, 2006.
HEALTH CARE TRUST FUND 2007 2006 2005 2004 2003 2002
Actuarial valuation date 12/31/2007 12/31/2006 12/31/2005 12/31/2004 12/31/2003 12/31/2002
Actuarial value of assets (a) $258,775 $214,816 $191,264 $166,619 $160,416 $161,700
Actuarial accrued liability (b) 1,303,594 1,247,950 1,116,627 1,102,597 897,461 813,211
Total unfunded actuarial
accrued liability (UAAL) (b-a) 1,044,819 1,033,134 925,363 935,978 737,045 651,511
Funded ratio (a/b) 19.9% 17.2% 17.1% 15.1% 17.9% 19.9%
Covered payroll 6,566,368 6,617,218 5,940,132 5,879,355 5,645,468 5,779,703
UAAL as a percentage of
covered payroll 15.9% 15.6% 15.6% 15.9% 13.1% 11.3%
The accompanying notes are an integral part of the Required Supplementary Information.
JUDICIAL DIVISION 2007 2006 2005 2004 2003 2002
Actuarial valuation date 12/31/2007 12/31/2006 12/31/2005 12/31/2004 12/31/2003 12/31/2002
Actuarial value of assets (a) $231,228 $210,633 $193,305 $170,111 $166,654 $162,901
Actuarial accrued liability (b) 264,210 247,491 223,955 209,954 198,377 165,672
Total unfunded actuarial
accrued liability (UAAL) (b-a) 32,982 36,858 30,650 39,843 31,723 2,771
Funded ratio (a/b) 87.5% 85.1% 86.3% 81.0% 84.0% 98.3%
Covered payroll 31,150 29,151 26,937 26,309 25,452 26,357
UAAL as a percentage of
covered payroll 105.9% 126.4% 113.8% 151.4% 124.6% 10.5%
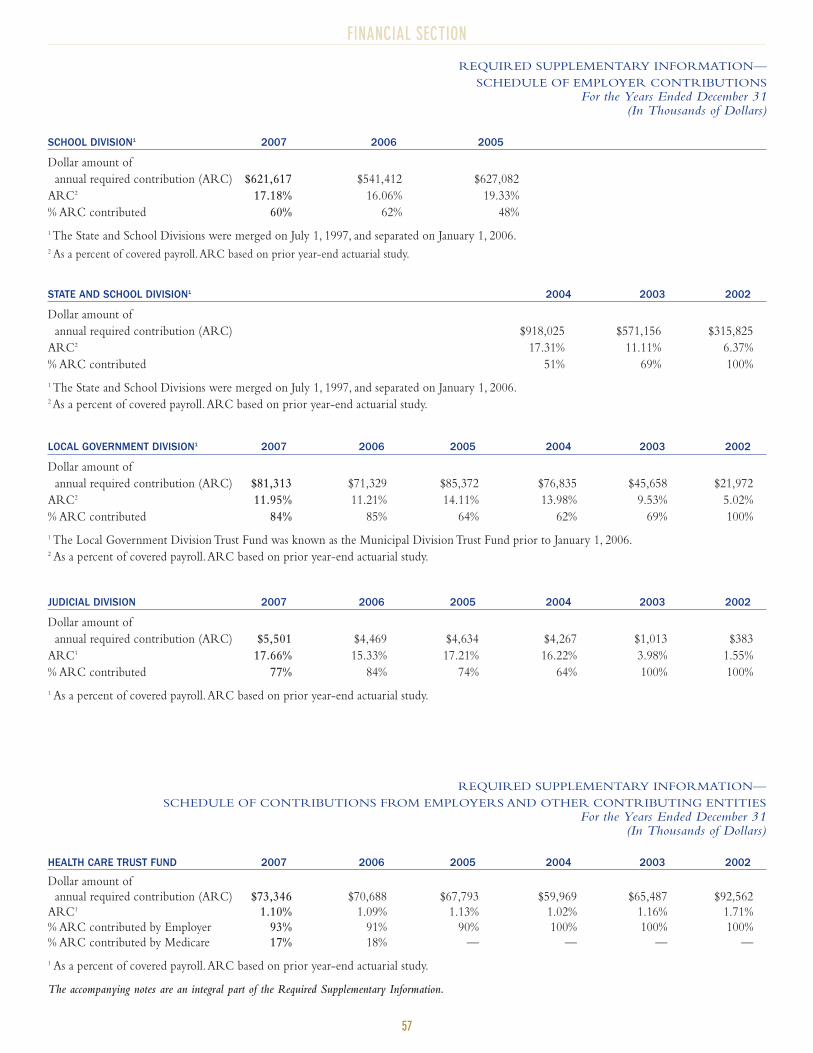
57
FINANCIAL SECTION
REQUIRED SUPPLEMENTARY INFORMATION—
SCHEDULE OF EMPLOYER CONTRIBUTIONS
For the Years Ended December 31(In Thousands of Dollars)
REQUIRED SUPPLEMENTARY INFORMATION—
SCHEDULE OF CONTRIBUTIONS FROM EMPLOYERS AND OTHER CONTRIBUTING ENTITIES
For the Years Ended December 31(In Thousands of Dollars)
SCHOOL DIVISION1 2007 2006 2005
Dollar amount of
annual required contribution (ARC) $621,617 $541,412 $627,082
ARC2 17.18% 16.06% 19.33%
% ARC contributed 60% 62% 48%
1 The State and School Divisions were merged on July 1, 1997, and separated on January 1, 2006.2 As a percent of covered payroll.ARC based on prior year-end actuarial study.
STATE AND SCHOOL DIVISION1 2004 2003 2002
Dollar amount of
annual required contribution (ARC) $918,025 $571,156 $315,825
ARC2 17.31% 11.11% 6.37%
% ARC contributed 51% 69% 100%
1 The State and School Divisions were merged on July 1, 1997, and separated on January 1, 2006.2 As a percent of covered payroll.ARC based on prior year-end actuarial study.
LOCAL GOVERNMENT DIVISION1 2007 2006 2005 2004 2003 2002
Dollar amount of
annual required contribution (ARC) $81,313 $71,329 $85,372 $76,835 $45,658 $21,972
ARC2 11.95% 11.21% 14.11% 13.98% 9.53% 5.02%
% ARC contributed 84% 85% 64% 62% 69% 100%
1 The Local Government Division Trust Fund was known as the Municipal Division Trust Fund prior to January 1, 2006.2 As a percent of covered payroll.ARC based on prior year-end actuarial study.
JUDICIAL DIVISION 2007 2006 2005 2004 2003 2002
Dollar amount of
annual required contribution (ARC) $5,501 $4,469 $4,634 $4,267 $1,013 $383
ARC1 17.66% 15.33% 17.21% 16.22% 3.98% 1.55%
% ARC contributed 77% 84% 74% 64% 100% 100%
1 As a percent of covered payroll.ARC based on prior year-end actuarial study.
HEALTH CARE TRUST FUND 2007 2006 2005 2004 2003 2002
Dollar amount of
annual required contribution (ARC) $73,346 $70,688 $67,793 $59,969 $65,487 $92,562
ARC1 1.10% 1.09% 1.13% 1.02% 1.16% 1.71%
% ARC contributed by Employer 93% 91% 90% 100% 100% 100%
% ARC contributed by Medicare 17% 18% — — — —
1 As a percent of covered payroll.ARC based on prior year-end actuarial study.
The accompanying notes are an integral part of the Required Supplementary Information.
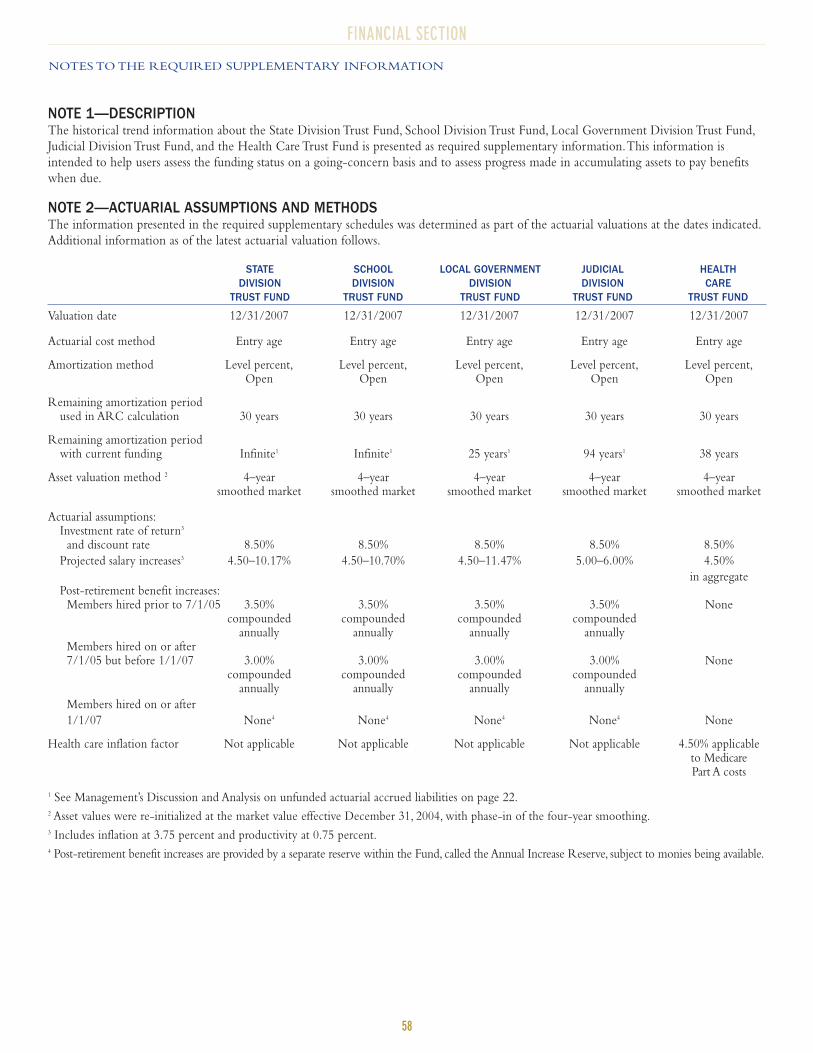
58
FINANCIAL SECTION
NOTES TO THE REQUIRED SUPPLEMENTARY INFORMATION
NOTE 1—DESCRIPTIONThe historical trend information about the State Division Trust Fund, School Division Trust Fund, Local Government Division Trust Fund,
Judicial Division Trust Fund, and the Health Care Trust Fund is presented as required supplementary information.This information is
intended to help users assess the funding status on a going-concern basis and to assess progress made in accumulating assets to pay benefits
when due.
NOTE 2—ACTUARIAL ASSUMPTIONS AND METHODSThe information presented in the required supplementary schedules was determined as part of the actuarial valuations at the dates indicated.
Additional information as of the latest actuarial valuation follows.
STATE SCHOOL LOCAL GOVERNMENT JUDICIAL HEALTH DIVISION DIVISION DIVISION DIVISION CARE
TRUST FUND TRUST FUND TRUST FUND TRUST FUND TRUST FUND
Valuation date 12/31/2007 12/31/2007 12/31/2007 12/31/2007 12/31/2007
Actuarial cost method Entry age Entry age Entry age Entry age Entry age
Amortization method Level percent, Level percent, Level percent, Level percent, Level percent,Open Open Open Open Open
Remaining amortization period used in ARC calculation 30 years 30 years 30 years 30 years 30 years
Remaining amortization periodwith current funding Infinite1 Infinite1 25 years1 94 years1 38 years
Asset valuation method 2 4–year 4–year 4–year 4–year 4–yearsmoothed market smoothed market smoothed market smoothed market smoothed market
Actuarial assumptions:Investment rate of return3
and discount rate 8.50% 8.50% 8.50% 8.50% 8.50%
Projected salary increases3 4.50–10.17% 4.50–10.70% 4.50–11.47% 5.00–6.00% 4.50%
in aggregatePost-retirement benefit increases:
Members hired prior to 7/1/05 3.50% 3.50% 3.50% 3.50% Nonecompounded compounded compounded compounded
annually annually annually annuallyMembers hired on or after7/1/05 but before 1/1/07 3.00% 3.00% 3.00% 3.00% None
compounded compounded compounded compoundedannually annually annually annually
Members hired on or after
1/1/07 None4 None4 None4 None4 None
Health care inflation factor Not applicable Not applicable Not applicable Not applicable 4.50% applicable to Medicare Part A costs
1 See Management’s Discussion and Analysis on unfunded actuarial accrued liabilities on page 22.2 Asset values were re-initialized at the market value effective December 31, 2004, with phase-in of the four-year smoothing.3 Includes inflation at 3.75 percent and productivity at 0.75 percent.4 Post-retirement benefit increases are provided by a separate reserve within the Fund, called the Annual Increase Reserve, subject to monies being available.
59
FINANCIAL SECTION
NOTES TO THE REQUIRED SUPPLEMENTARY INFORMATION
NOTE 3—SIGNIFICANT FACTORS AFFECTING TRENDS IN ACTUARIAL INFORMATIONPension Plans—State, School, Local Government1, and Judicial Division Trust Funds
2007 Changes in Plan Provisions Since Prior Year:
No material changes.
2006 Changes in Plan Provisions Since Prior Year:
No material changes.
2005 Changes in Plan Provisions Since Prior Year:
Senate Bill 04-257 provides that the State and School Divisions will be split beginning January 1, 2006, and the 2005 actuarial
information has been shown separately.
Fully recognized the transitional amount of unrealized gains from the 1992 actuarial change from cost value to smoothed market value.
Changed the method of calculating the actuarial value of assets such that the expected rate of investment return going forward will be
based on the beginning of year market value, with annual differences between the actual and expected market value of assets
smoothed over a four-year period.
Reset the actuarial value of assets to be equal to the market value of assets as of December 31, 2004.
Mortality, withdrawal, retirement, disability, and salary increase assumptions were changed based on the actuarial experience study
performed in 2005.
2004 Changes in Plan Provisions Since Prior Year:
Suspension of MatchMaker contributions on June 1, 2004.
Reduction in the interest rate credited to member contribution accounts from 80 percent of the actuarial valuation interest rate to a
rate determined by the Colorado PERA Board, such rate not to exceed 5 percent per annum beginning July 1, 2004.
A reduction in the allocation of the employer contribution rate to the Health Care Trust Fund from 1.10 percent to 1.02 percent of
salary on or after July 1, 2004, with the difference increasing pension funding.
Gradual increases in payments toward Colorado PERA’s unfunded liability starting January 1, 2006, at 0.5 percent of salary, increasing
0.5 percent in 2007 and by 0.4 percent of salary each subsequent year, reaching a maximum of 3 percent of salary by 2012 and
thereafter known as the Amortization Equalization Disbursement (AED). If Colorado PERA reaches 100 percent of funded status, the
AED will be repealed.
School Division employer contribution rate is increased from 10.15 percent to 10.55 percent in 2013.
2003 Changes in Plan Provisions Since Prior Year:
The actuarial investment assumption rate was changed from 8.75 percent to 8.50 percent, the rate of inflation assumption was
changed from 4.50 percent to 3.75 percent, the real rate of return assumption was changed from 4.25 percent to 4.75 percent, and the
payroll growth rate assumption was changed from 5.50 percent to 4.50 percent.
2002 Changes in Plan Provisions Since Prior Year:
No material changes.
Health Care Trust Fund
2007 Changes in Plan Provisions Since Prior Actuarial Valuation:
The following changes have been made to certain health care assumptions since the previous valuation:
■ Future plan election rates for retirees age 65 and older have been adjusted to reflect recent election patterns, incorporating the
addition of the Secure Horizons (HMO) option.
■ Expected inpatient hospital claims cost for retirees age 65 and older who do not have Part A have been updated to better reflect
anticipated changes in the various coverage categories, based on the most recent “no Part A” report presented to the Board of
Trustees in March 2008.
1 The Local Government Division Trust Fund was known as the Municipal Division Trust Fund prior to January 1, 2006.
60
FINANCIAL SECTION
NOTES TO THE REQUIRED SUPPLEMENTARY INFORMATION
2006 Changes in Plan Provisions Since Prior Actuarial Valuation:
The following changes have been made to certain health care assumptions since the previous valuation:
■ Based on the results of surveys conducted by Colorado PERA staff, the percentage of actives hired before April 1, 1986, and pre-
Medicare retirees assumed to not have Part A Medicare coverage was changed to 20 percent.
■ Future plan election rates for retirees age 65 and older have been adjusted to reflect recent election patterns.
■ Expected inpatient hospital claims costs for retirees age 65 and older who do not have Part A have been updated and associated
trend assumptions for future increases in medical costs were amended to better reflect anticipated changes in the various coverage
categories.
The following methodology change has been implemented since the previous valuation:
■ Members electing coverage in a qualified plan option produce a Retiree Drug Subsidy (RDS) which is payable to the HCTF
under Part D of the Medicare Modernization Act of 2003.The HCTF has reduced the full cost of coverage by the estimated
RDS. GASB Statement 43, GASB Technical Bulletin 2006-1, and GASB Statement 45 do not allow for future assumed RDS
payments to be used as a direct offset for future liabilities.Therefore, the total HCTF actuarially accrued liability has been
increased for future RDS premium offsets to members.
2005 Changes in Plan Provisions Since Prior Actuarial Valuation:
Changed the method of calculating the actuarial value of assets such that the expected rate of investment return going forward will be
based on the beginning of year market value, with annual differences between the actual and expected market value of assets
smoothed over a four-year period.
Reset the actuarial value of assets to be equal to the market value of assets as of December 31, 2004.
Mortality, withdrawal, retirement, disability, and expected rates of participation in the Health Care Trust Fund programs were changed
based on the actuarial experience study performed in 2005.
2004 Changes in Plan Provisions Since Prior Actuarial Valuation:
A reduction in the allocation of the employer contribution rate to the Health Care Trust Fund from 1.10 percent to 1.02 percent of
salary on or after July 1, 2004, with the difference increasing pension funding.
The valuation considers the implicit subsidy provided to retired members over age 65 who are not fully covered by Medicare Part A.
2003 Changes in Plan Provisions Since Prior Actuarial Valuation:
The actuarial investment assumption rate was changed from 8.75 percent to 8.50 percent, the rate of inflation assumption was
changed from 4.50 percent to 3.75 percent, the real rate of return assumption was changed from 4.25 percent to 4.75 percent, and the
payroll growth rate assumption was changed from 5.50 percent to 4.50 percent.
2002 Changes in Plan Provisions Since Prior Actuarial Valuation:
No material changes.
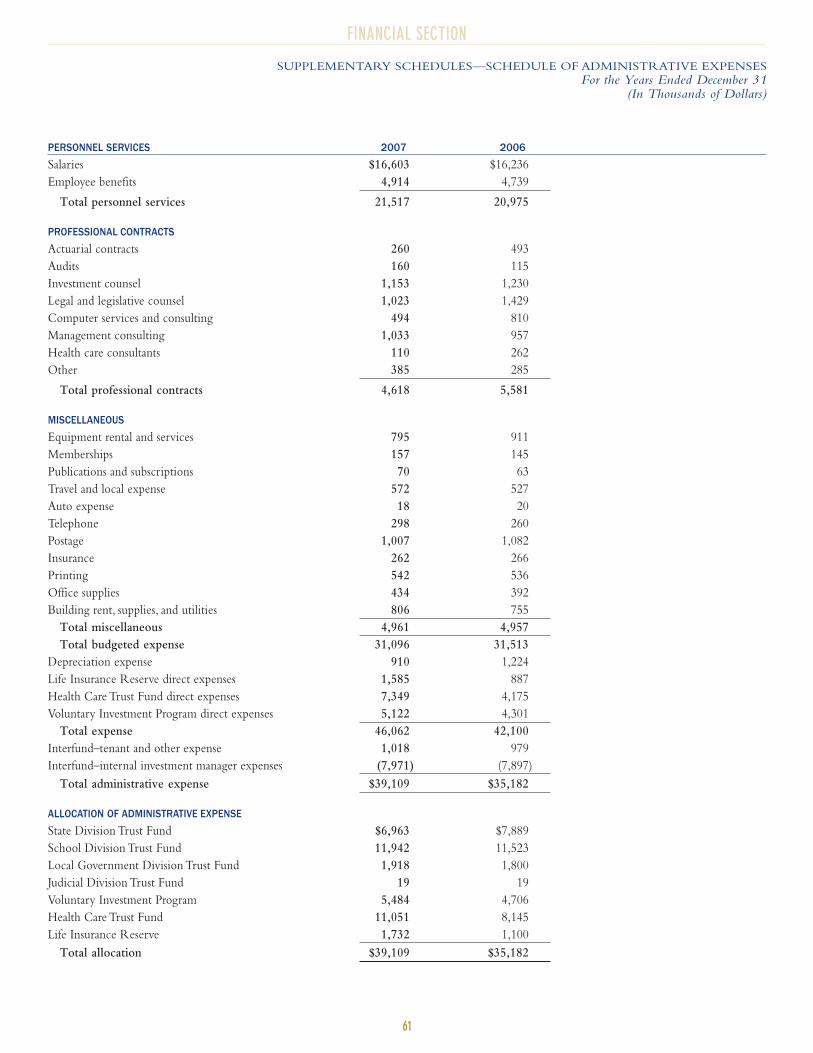
61
FINANCIAL SECTION
SUPPLEMENTARY SCHEDULES—SCHEDULE OF ADMINISTRATIVE EXPENSES
For the Years Ended December 31(In Thousands of Dollars)
PERSONNEL SERVICES 2007 2006
Salaries $16,603 $16,236
Employee benefits 4,914 4,739
Total personnel services 21,517 20,975
PROFESSIONAL CONTRACTS
Actuarial contracts 260 493
Audits 160 115
Investment counsel 1,153 1,230
Legal and legislative counsel 1,023 1,429
Computer services and consulting 494 810
Management consulting 1,033 957
Health care consultants 110 262
Other 385 285
Total professional contracts 4,618 5,581
MISCELLANEOUS
Equipment rental and services 795 911
Memberships 157 145
Publications and subscriptions 70 63
Travel and local expense 572 527
Auto expense 18 20
Telephone 298 260
Postage 1,007 1,082
Insurance 262 266
Printing 542 536
Office supplies 434 392
Building rent, supplies, and utilities 806 755
Total miscellaneous 4,961 4,957
Total budgeted expense 31,096 31,513
Depreciation expense 910 1,224
Life Insurance Reserve direct expenses 1,585 887
Health Care Trust Fund direct expenses 7,349 4,175
Voluntary Investment Program direct expenses 5,122 4,301
Total expense 46,062 42,100
Interfund–tenant and other expense 1,018 979
Interfund–internal investment manager expenses (7,971) (7,897)
Total administrative expense $39,109 $35,182
ALLOCATION OF ADMINISTRATIVE EXPENSE
State Division Trust Fund $6,963 $7,889
School Division Trust Fund 11,942 11,523
Local Government Division Trust Fund 1,918 1,800
Judicial Division Trust Fund 19 19
Voluntary Investment Program 5,484 4,706
Health Care Trust Fund 11,051 8,145
Life Insurance Reserve 1,732 1,100
Total allocation $39,109 $35,182
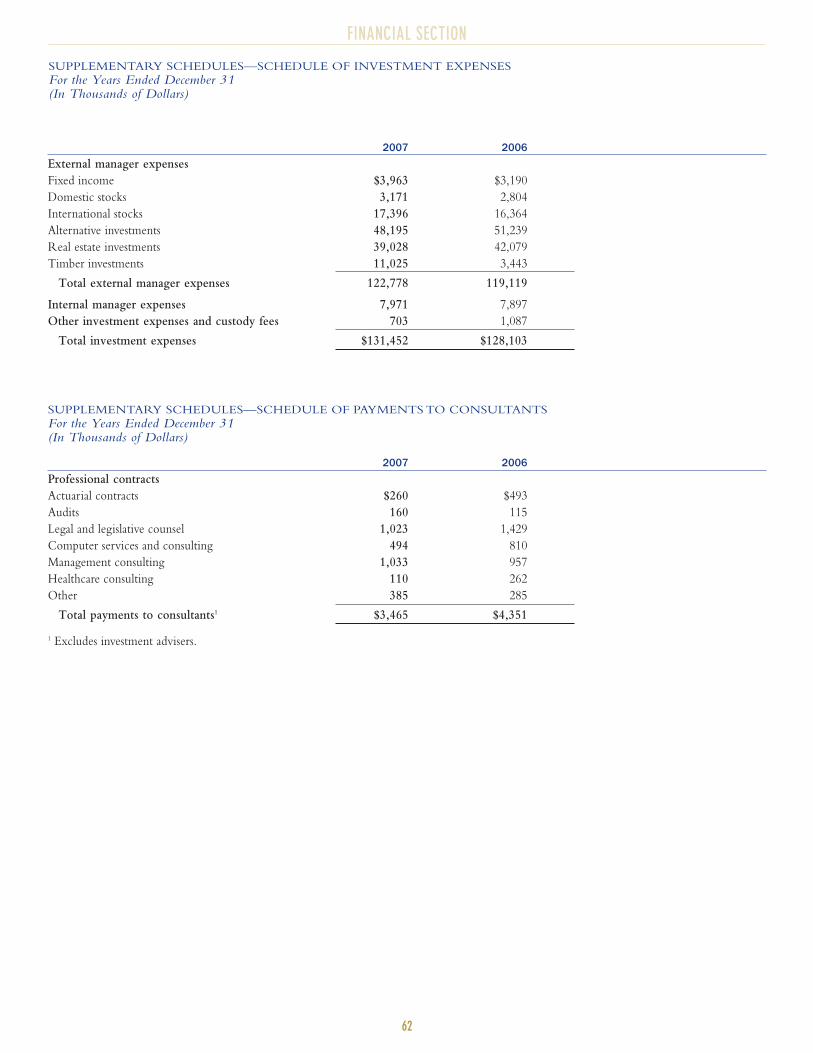
62
FINANCIAL SECTION
SUPPLEMENTARY SCHEDULES—SCHEDULE OF INVESTMENT EXPENSES
For the Years Ended December 31(In Thousands of Dollars)
SUPPLEMENTARY SCHEDULES—SCHEDULE OF PAYMENTS TO CONSULTANTS
For the Years Ended December 31(In Thousands of Dollars)
2007 2006
External manager expenses
Fixed income $3,963 $3,190
Domestic stocks 3,171 2,804
International stocks 17,396 16,364
Alternative investments 48,195 51,239
Real estate investments 39,028 42,079
Timber investments 11,025 3,443
Total external manager expenses 122,778 119,119
Internal manager expenses 7,971 7,897
Other investment expenses and custody fees 703 1,087
Total investment expenses $131,452 $128,103
2007 2006
Professional contracts
Actuarial contracts $260 $493
Audits 160 115
Legal and legislative counsel 1,023 1,429
Computer services and consulting 494 810
Management consulting 1,033 957
Healthcare consulting 110 262
Other 385 285
Total payments to consultants1 $3,465 $4,351
1 Excludes investment advisers.
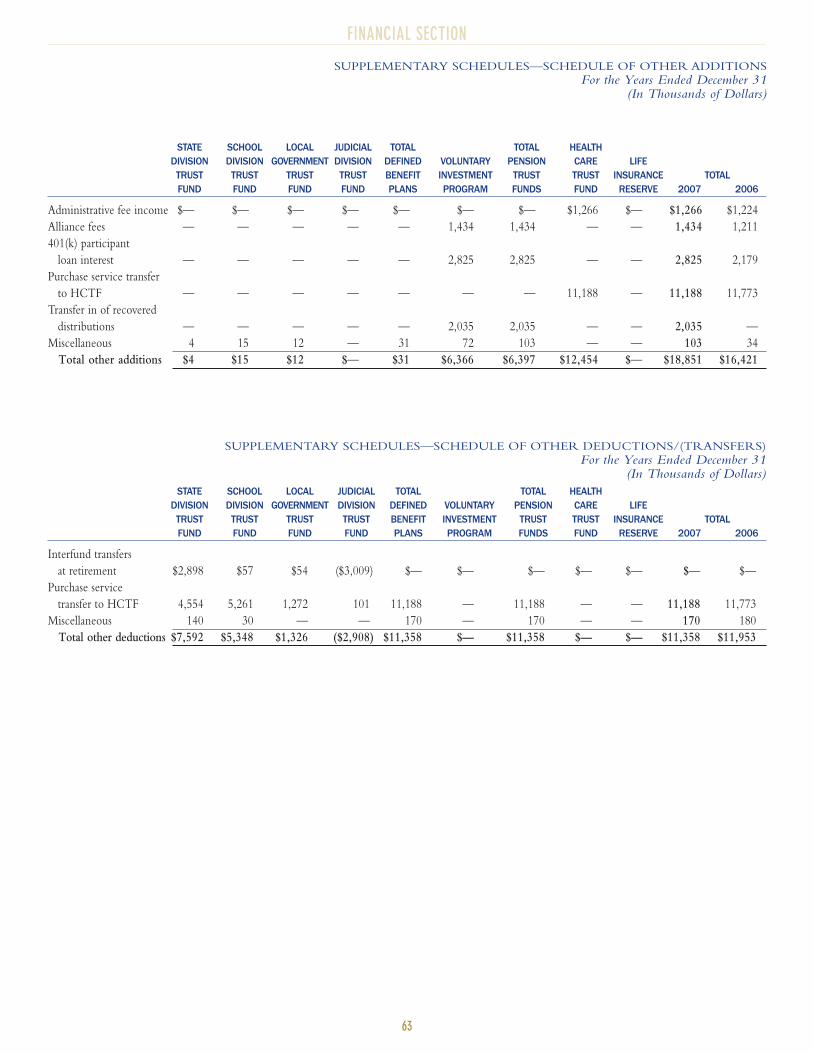
63
FINANCIAL SECTION
SUPPLEMENTARY SCHEDULES—SCHEDULE OF OTHER DEDUCTIONS/(TRANSFERS)
For the Years Ended December 31(In Thousands of Dollars)
STATE SCHOOL LOCAL JUDICIAL TOTAL TOTAL HEALTHDIVISION DIVISION GOVERNMENT DIVISION DEFINED VOLUNTARY PENSION CARE LIFETRUST TRUST TRUST TRUST BENEFIT INVESTMENT TRUST TRUST INSURANCE TOTALFUND FUND FUND FUND PLANS PROGRAM FUNDS FUND RESERVE 2007 2006
Interfund transfers
at retirement $2,898 $57 $54 ($3,009) $— $— $— $— $— $— $—
Purchase service
transfer to HCTF 4,554 5,261 1,272 101 11,188 — 11,188 — — 11,188 11,773
Miscellaneous 140 30 — — 170 — 170 — — 170 180
Total other deductions $7,592 $5,348 $1,326 ($2,908) $11,358 $— $11,358 $— $— $11,358 $11,953
SUPPLEMENTARY SCHEDULES—SCHEDULE OF OTHER ADDITIONS
For the Years Ended December 31(In Thousands of Dollars)
STATE SCHOOL LOCAL JUDICIAL TOTAL TOTAL HEALTHDIVISION DIVISION GOVERNMENT DIVISION DEFINED VOLUNTARY PENSION CARE LIFETRUST TRUST TRUST TRUST BENEFIT INVESTMENT TRUST TRUST INSURANCE TOTALFUND FUND FUND FUND PLANS PROGRAM FUNDS FUND RESERVE 2007 2006
Administrative fee income $— $— $— $— $— $— $— $1,266 $— $1,266 $1,224
Alliance fees — — — — — 1,434 1,434 — — 1,434 1,211
401(k) participant
loan interest — — — — — 2,825 2,825 — — 2,825 2,179
Purchase service transfer
to HCTF — — — — — — — 11,188 — 11,188 11,773
Transfer in of recovered
distributions — — — — — 2,035 2,035 — — 2,035 —
Miscellaneous 4 15 12 — 31 72 103 — — 103 34
Total other additions $4 $15 $12 $— $31 $6,366 $6,397 $12,454 $— $18,851 $16,421
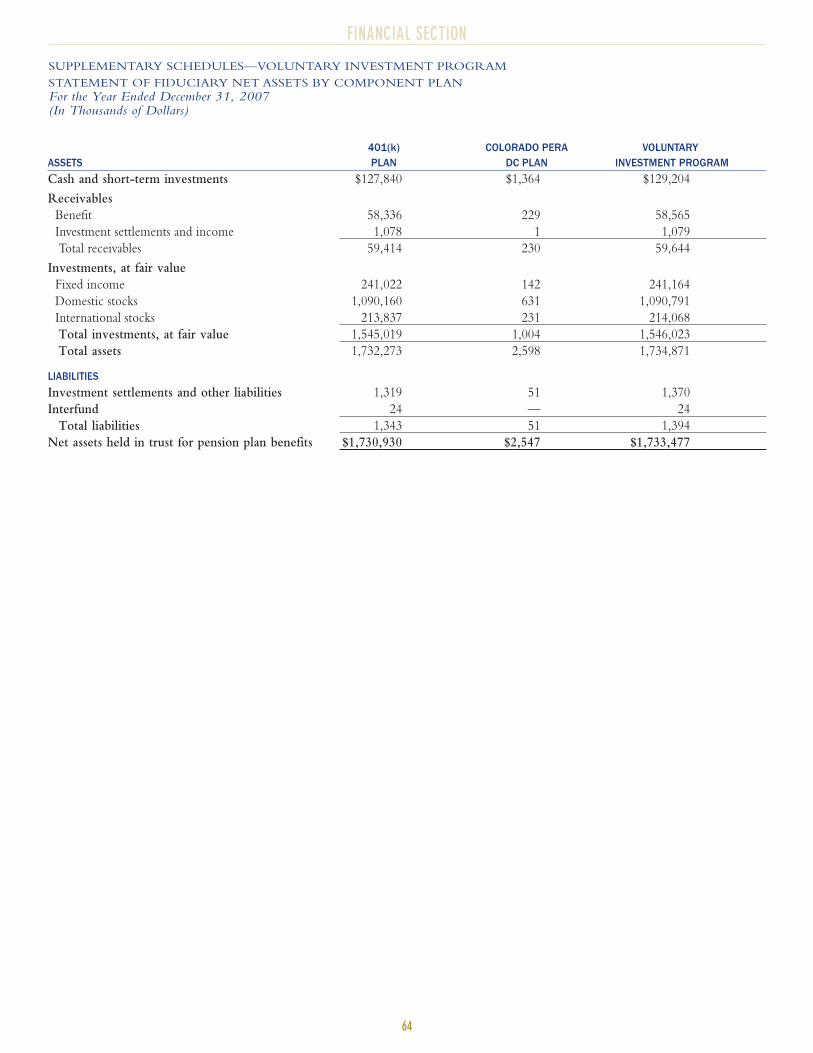
64
FINANCIAL SECTION
401(k) COLORADO PERA VOLUNTARYASSETS PLAN DC PLAN INVESTMENT PROGRAM
Cash and short-term investments $127,840 $1,364 $129,204
Receivables
Benefit 58,336 229 58,565
Investment settlements and income 1,078 1 1,079
Total receivables 59,414 230 59,644
Investments, at fair value
Fixed income 241,022 142 241,164
Domestic stocks 1,090,160 631 1,090,791
International stocks 213,837 231 214,068
Total investments, at fair value 1,545,019 1,004 1,546,023
Total assets 1,732,273 2,598 1,734,871
LIABILITIES
Investment settlements and other liabilities 1,319 51 1,370
Interfund 24 — 24
Total liabilities 1,343 51 1,394
Net assets held in trust for pension plan benefits $1,730,930 $2,547 $1,733,477
SUPPLEMENTARY SCHEDULES—VOLUNTARY INVESTMENT PROGRAM
STATEMENT OF FIDUCIARY NET ASSETS BY COMPONENT PLAN
For the Year Ended December 31, 2007(In Thousands of Dollars)
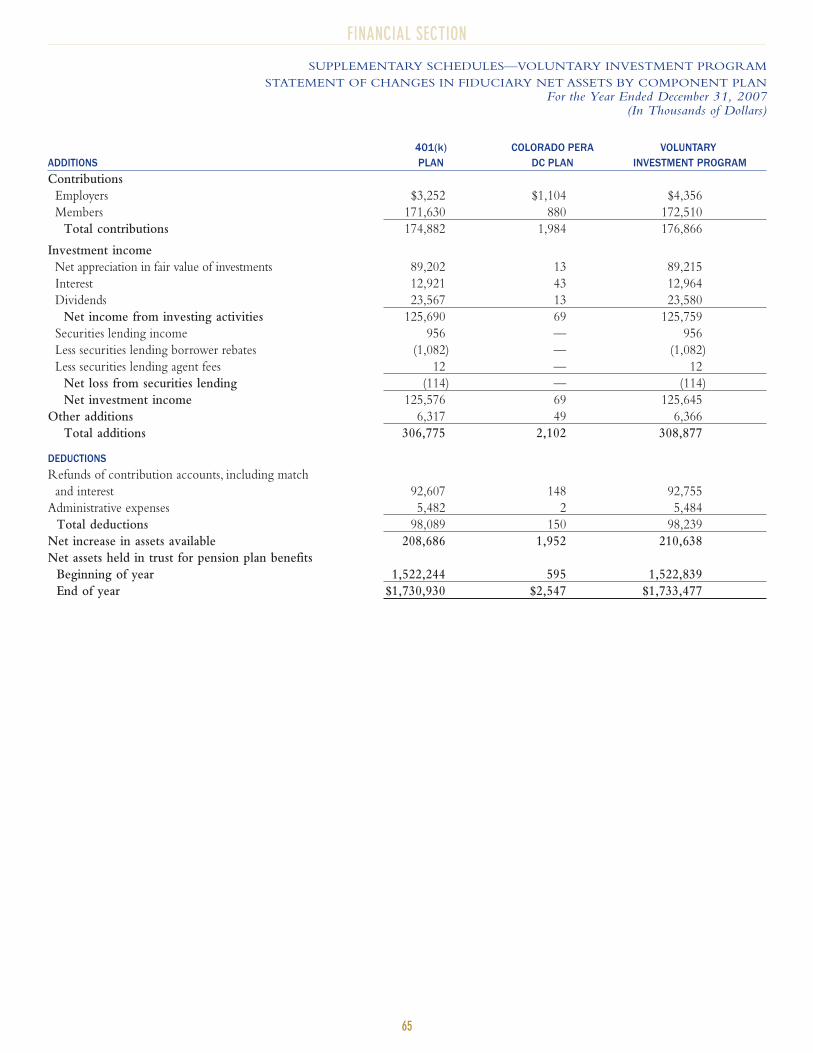
65
FINANCIAL SECTION
SUPPLEMENTARY SCHEDULES—VOLUNTARY INVESTMENT PROGRAM
STATEMENT OF CHANGES IN FIDUCIARY NET ASSETS BY COMPONENT PLAN
For the Year Ended December 31, 2007(In Thousands of Dollars)
401(k) COLORADO PERA VOLUNTARYADDITIONS PLAN DC PLAN INVESTMENT PROGRAM
Contributions
Employers $3,252 $1,104 $4,356
Members 171,630 880 172,510
Total contributions 174,882 1,984 176,866
Investment income
Net appreciation in fair value of investments 89,202 13 89,215
Interest 12,921 43 12,964
Dividends 23,567 13 23,580
Net income from investing activities 125,690 69 125,759
Securities lending income 956 — 956
Less securities lending borrower rebates (1,082) — (1,082)
Less securities lending agent fees 12 — 12
Net loss from securities lending (114) — (114)
Net investment income 125,576 69 125,645
Other additions 6,317 49 6,366
Total additions 306,775 2,102 308,877
DEDUCTIONS
Refunds of contribution accounts, including match
and interest 92,607 148 92,755
Administrative expenses 5,482 2 5,484
Total deductions 98,089 150 98,239
Net increase in assets available 208,686 1,952 210,638
Net assets held in trust for pension plan benefits
Beginning of year 1,522,244 595 1,522,839
End of year $1,730,930 $2,547 $1,733,477

Investing for our members
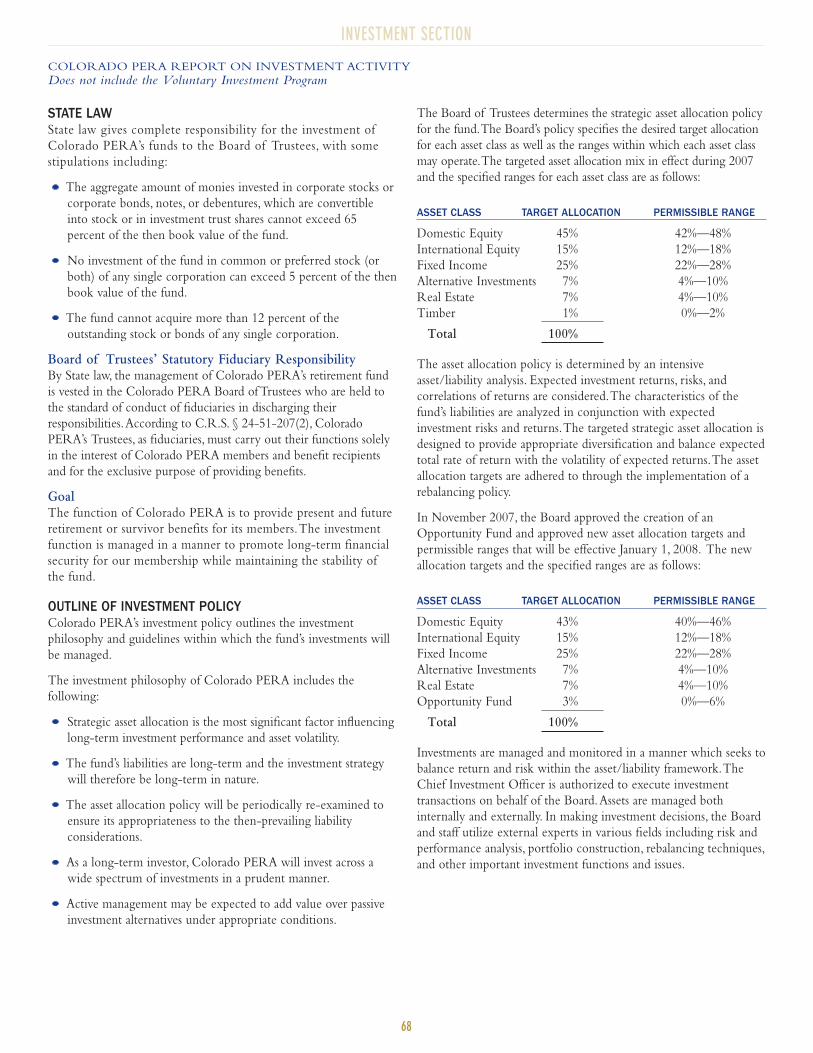
68
INVESTMENT SECTION
STATE LAWState law gives complete responsibility for the investment of
Colorado PERA’s funds to the Board of Trustees, with some
stipulations including:
The aggregate amount of monies invested in corporate stocks or
corporate bonds, notes, or debentures, which are convertible
into stock or in investment trust shares cannot exceed 65
percent of the then book value of the fund.
No investment of the fund in common or preferred stock (or
both) of any single corporation can exceed 5 percent of the then
book value of the fund.
The fund cannot acquire more than 12 percent of the
outstanding stock or bonds of any single corporation.
Board of Trustees’ Statutory Fiduciary ResponsibilityBy State law, the management of Colorado PERA’s retirement fund
is vested in the Colorado PERA Board of Trustees who are held to
the standard of conduct of fiduciaries in discharging their
responsibilities.According to C.R.S. § 24-51-207(2), Colorado
PERA’s Trustees, as fiduciaries, must carry out their functions solely
in the interest of Colorado PERA members and benefit recipients
and for the exclusive purpose of providing benefits.
GoalThe function of Colorado PERA is to provide present and future
retirement or survivor benefits for its members.The investment
function is managed in a manner to promote long-term financial
security for our membership while maintaining the stability of
the fund.
OUTLINE OF INVESTMENT POLICYColorado PERA’s investment policy outlines the investment
philosophy and guidelines within which the fund’s investments will
be managed.
The investment philosophy of Colorado PERA includes the
following:
Strategic asset allocation is the most significant factor influencing
long-term investment performance and asset volatility.
The fund’s liabilities are long-term and the investment strategy
will therefore be long-term in nature.
The asset allocation policy will be periodically re-examined to
ensure its appropriateness to the then-prevailing liability
considerations.
As a long-term investor, Colorado PERA will invest across a
wide spectrum of investments in a prudent manner.
Active management may be expected to add value over passive
investment alternatives under appropriate conditions.
COLORADO PERA REPORT ON INVESTMENT ACTIVITY
Does not include the Voluntary Investment Program
The Board of Trustees determines the strategic asset allocation policy
for the fund.The Board’s policy specifies the desired target allocation
for each asset class as well as the ranges within which each asset class
may operate.The targeted asset allocation mix in effect during 2007
and the specified ranges for each asset class are as follows:
ASSET CLASS TARGET ALLOCATION PERMISSIBLE RANGE
Domestic Equity 45% 42%—48%
International Equity 15% 12%—18%
Fixed Income 25% 22%—28%
Alternative Investments 7% 4%—10%
Real Estate 7% 4%—10%
Timber 1% 0%—2%
Total 100%
The asset allocation policy is determined by an intensive
asset/liability analysis. Expected investment returns, risks, and
correlations of returns are considered.The characteristics of the
fund’s liabilities are analyzed in conjunction with expected
investment risks and returns.The targeted strategic asset allocation is
designed to provide appropriate diversification and balance expected
total rate of return with the volatility of expected returns.The asset
allocation targets are adhered to through the implementation of a
rebalancing policy.
In November 2007, the Board approved the creation of an
Opportunity Fund and approved new asset allocation targets and
permissible ranges that will be effective January 1, 2008. The new
allocation targets and the specified ranges are as follows:
ASSET CLASS TARGET ALLOCATION PERMISSIBLE RANGE
Domestic Equity 43% 40%—46%
International Equity 15% 12%—18%
Fixed Income 25% 22%—28%
Alternative Investments 7% 4%—10%
Real Estate 7% 4%—10%
Opportunity Fund 3% 0%—6%
Total 100%
Investments are managed and monitored in a manner which seeks to
balance return and risk within the asset/liability framework.The
Chief Investment Officer is authorized to execute investment
transactions on behalf of the Board.Assets are managed both
internally and externally. In making investment decisions, the Board
and staff utilize external experts in various fields including risk and
performance analysis, portfolio construction, rebalancing techniques,
and other important investment functions and issues.
COLORADO PERA REPORT ON INVESTMENT ACTIVITY
Does not include the Voluntary Investment Program
CORPORATE GOVERNANCEGeneral PolicyAlthough Colorado PERA is not subject to the Employee
Retirement Income Security Act of 1974 (ERISA), the Colorado
PERA Board complies with the position taken by the U.S.
Department of Labor (DOL) in February 1988.The DOL has stated
that the right to vote shares of stock owned by a pension plan is, in
itself, an asset of the plan, and therefore the fiduciary’s responsibility
to manage the assets includes proxy voting.
Board of Trustees Shareholder Responsibility CommitteeTo assist the Board of Trustees in carrying out its fiduciary
responsibilities in voting proxies, the Board established a Shareholder
Responsibility Committee.The Colorado PERA General Counsel
serves as an adviser to the Committee.The Board and the
Shareholder Responsibility Committee have delegated to the Legal
Department the authority to execute and vote all domestic proxies
according to the Board Proxy Voting Policy.All proxy issues are
reviewed by staff on a case-by-case basis and then voted according to
guidelines established by the Policy. Colorado PERA retains proxy
voting analysts to assist in the proxy voting process.
Proxy Voting PolicyThe Board’s Proxy Voting Policy sets forth directives on the following
nine issues: Board of Directors, Proxy Contests and Corporate
Defenses,Tender Offers and Corporate Defenses, Corporate
Restructurings, State of Incorporation, Proxy System, Executive
Compensation, Corporate Governance, and Social Issues.The Proxy
Voting Policy on Social Issues states that “Colorado PERA will
abstain on all social issues, and will only vote on financial issues.”
The voting of proxy ballots for international stocks is delegated to
Colorado PERA’s external international equity managers consistent
with certain requirements established by the Board.
(Colorado PERA’s Report on Investment Activity was prepared by
internal staff.)
69
INVESTMENT SECTION
70
INVESTMENT SECTION
Certain broker agreements include provisions for commission recapture.
INVESTMENT BROKERS/ADVISERS
A.G. Edwards
Alignment Capital Group, LLC
Banc of America Securities LLC
Bank of New York
Barclays Capital Inc.
BB&T Capital Services
Bear Stearns & Co. Inc.
BNP Paribas Securities Services
B-Trade Services LLC
Cantor, Fitzgerald & Co.
Capital Institutional Services, Inc.
CIBC Capital Markets
Citigroup Global
Credit Suisse First Boston Corporation
D.A. Davidson & Co.
Descap Securities Inc.
Deutsche Bank Alex Brown Inc.
Ennis Knupp & Associates
Friedman Billings & Ramsey
Goldman, Sachs & Co.
Heitman Capital Management Corp.
HSBC Securities
INVESCO Realty Advisors
Investment Technology Group
J.P. Morgan Chase
Jefferies & Co.
Jones Lang LaSalle
La Branche & Co. Inc.
Lehman Brothers Inc.
Liquidnet, Inc.
Merrill Lynch, Pierce, Fenner & Smith Inc.
Morgan Stanley & Co. Incorporated
Piper Jaffray Companies, Inc.
Prudential Securities
Putnam Lovell NBF Securities
RBC Capital Markets
RBS Greenwich Capital Markets
Robert W. Baird & Co. Inc.
RREEF Real Estate Investment Managers
Sanford Bernstein & Co. LLC
SG Cowen Securities Corporation
Stifel Nicolaus & Company, Inc.
Suntrust Capital Markets
UBS Warburg LLC
Wachovia Securities
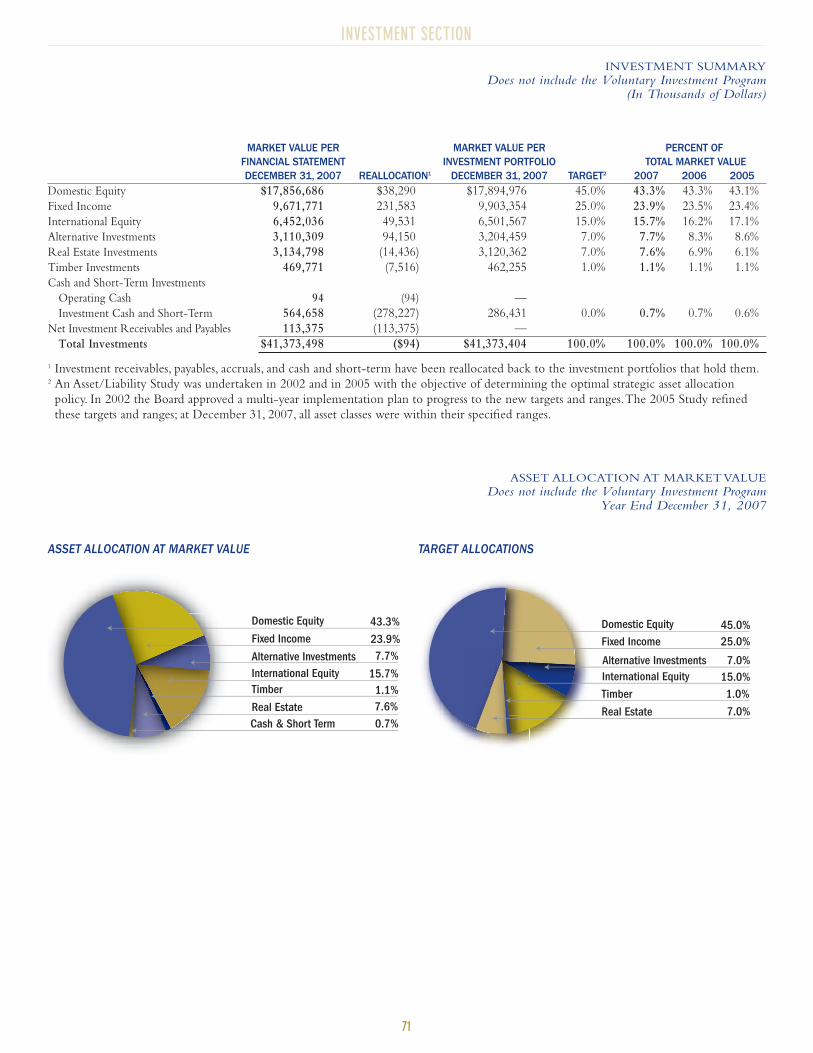
71
INVESTMENT SECTION
MARKET VALUE PER MARKET VALUE PER PERCENT OFFINANCIAL STATEMENT INVESTMENT PORTFOLIO TOTAL MARKET VALUEDECEMBER 31, 2007 REALLOCATION1 DECEMBER 31, 2007 TARGET2 2007 2006 2005
Domestic Equity $17,856,686 $38,290 $17,894,976 45.0% 43.3% 43.3% 43.1%
Fixed Income 9,671,771 231,583 9,903,354 25.0% 23.9% 23.5% 23.4%
International Equity 6,452,036 49,531 6,501,567 15.0% 15.7% 16.2% 17.1%
Alternative Investments 3,110,309 94,150 3,204,459 7.0% 7.7% 8.3% 8.6%
Real Estate Investments 3,134,798 (14,436) 3,120,362 7.0% 7.6% 6.9% 6.1%
Timber Investments 469,771 (7,516) 462,255 1.0% 1.1% 1.1% 1.1%
Cash and Short-Term Investments
Operating Cash 94 (94) —
Investment Cash and Short-Term 564,658 (278,227) 286,431 0.0% 0.7% 0.7% 0.6%
Net Investment Receivables and Payables 113,375 (113,375) —
Total Investments $41,373,498 ($94) $41,373,404 100.0% 100.0% 100.0% 100.0%
1 Investment receivables, payables, accruals, and cash and short-term have been reallocated back to the investment portfolios that hold them.2 An Asset/Liability Study was undertaken in 2002 and in 2005 with the objective of determining the optimal strategic asset allocation
policy. In 2002 the Board approved a multi-year implementation plan to progress to the new targets and ranges.The 2005 Study refined
these targets and ranges; at December 31, 2007, all asset classes were within their specified ranges.
ASSET ALLOCATION AT MARKET VALUE
Does not include the Voluntary Investment ProgramYear End December 31, 2007
INVESTMENT SUMMARY
Does not include the Voluntary Investment Program(In Thousands of Dollars)
1.1%7.6%
23.9%
Cash & Short Term 0.7%Real Estate
Fixed Income
International Equity 15.7%Alternative Investments 7.7%
Domestic Equity 43.3%
Timber
Real Estate 7.0%
Fixed Income 25.0%
15.0%Alternative Investments 7.0%
45.0%
Timber 1.0%
Domestic Equity
International Equity
TARGET ALLOCATIONSASSET ALLOCATION AT MARKET VALUE
72
INVESTMENT SECTION
FUND PERFORMANCE EVALUATION
Does not include the Voluntary Investment Program
EVALUATIONEnnis Knupp & Associates and The Northern Trust Company are
retained by Colorado PERA to evaluate fund performance. Ennis
Knupp & Associates is also used for the real estate portfolio
performance evaluation and industry comparisons. In their analysis,
Ennis Knupp and The Northern Trust include all investments within
the portfolio, including cash and accrued income.They also
compute the annual rates of return. In order to provide fund returns
inclusive of all asset classes, performance calculations were prepared
using time-weighted rates of return.
ASSET ALLOCATIONColorado PERA’s long-term strategic asset allocation policy sets forth
specific portfolio targets.Asset allocation targets effective during 2007,
approved by the Colorado PERA Board of Trustees in 2005, are as
follows: domestic equity 45 percent, international equity 15 percent,
fixed income 25 percent, alternative investments 7 percent, real estate
investments 7 percent, and timber investments 1 percent.The
Colorado PERA Board has approved new asset allocation targets
effective January 1, 2008, as follows: domestic equity 43 percent,
international equity 15 percent, fixed income 25 percent, alternative
investments 7 percent, real estate investments 7 percent, and
opportunity fund 3 percent.
TOTAL PORTFOLIO RESULTSFor the year ended December 31, 2007, Colorado PERA’s total
fund returned 10.0 percent, compared to the Russell/Mellon
Median Public Fund return of 8.0 percent.The Russell/Mellon
Median Public Fund measure is comprised of 67 public pension
funds with assets of approximately $1 trillion. Colorado PERA’s
total fund returned 11.7 percent and 14.4 percent on a three- and
five-year annualized basis, respectively. In comparison, the
Russell/Mellon Median Public Fund returned 9.6 percent and 13.0
percent, respectively, for these periods. Colorado PERA’s 10-year
annualized rate of return was 8.1 percent compared to the
Russell/Mellon Median Public Fund return of 7.7 percent.
Colorado PERA adopted a policy benchmark, which is a passive
representation of the asset allocation policy, as of April 1, 2004. For
the year ended December 31, 2007, the total fund returned 10.0
percent compared to the policy benchmark return of 8.7 percent.
DOMESTIC EQUITYThe U.S. stock market ended 2007 in positive territory as most
major U.S. indexes posted low single digit investment returns.This
was the fifth straight year that the U.S. equity markets provided
positive investment returns.The equity markets took investors on a
roller coaster ride during 2007.They rallied significantly during the
end of the first quarter and most of the second quarter despite
increased levels of price volatility and a sharp rise in interest rates in
June.At that time, equities continued to be supported by factors
such as record setting merger and acquisition and leveraged buyout
activity, as well as strong corporate earnings and significant share
buybacks. However, equity markets experienced a difficult second
half of the year in the face of economic growth concerns,
weakening corporate earnings growth, high oil prices, credit related
concerns, and some emerging inflationary pressures.While credit
fears over the summer were sparked by uncertainty surrounding
which investments might have exposure to subprime mortgages, the
fourth quarter was dominated by a realization that many of these
fears may have been justified.
Eight of the 10 U.S. stock index sectors recorded positive returns in
2007, while the consumer discretionary and financials sectors had
double digit negative returns.The consumer discretionary sector
struggled as slowing economic growth and higher energy prices
weighed negatively on consumer spending. Financials performed
poorly as a number of banks reported large write-offs following the
severe stress in structured product markets. Given the fact that the
financials sector is the U.S. equity market’s largest in terms of market
capitalization, this sector’s poor performance significantly dragged
down equity market returns as a whole.The energy sector was the
top performing sector as it was driven by higher oil prices and
positive earnings revisions. On a style basis, growth stocks finally
outperformed value stocks, breaking a seven year run of value style
dominance. U.S. large cap stocks noticeably outperformed smaller
cap stocks in 2007, primarily on the belief that larger cap stocks are
better positioned to weather the anticipated environment of slower
economic growth.
In 2007, Colorado PERA’s total domestic equity portfolio returned 6.6
percent, compared to its benchmark’s total return of 5.6 percent.
Colorado PERA’s three-year annualized domestic equity portfolio total
return was 9.4 percent, beating the benchmark’s return of 9.1 percent.
The five-year annualized total return for Colorado PERA’s domestic
portfolio was 13.6 percent, compared to the benchmark’s total return of
13.6 percent.
INTERNATIONAL EQUITYForeign stock markets rose sharply in 2007 as non-U.S. stock
markets outperformed their U.S. counterparts.The continued
weakness of the U.S. dollar was a key feature of the strong
performance in international equities.The value of the U.S. dollar
fell throughout 2007, a trend that accelerated sharply in the fourth
quarter as the U.S. economy slowed relative to the rest of the world
and as the U.S. Federal Reserve cut interest rates more quickly than
other central banks. By November, the dollar reached a new record
low against the Euro and had posted multi-year lows against many
other currencies. Many global markets reached record or multi-year
highs in October before trending downward amid a renewed flight-
to-quality in November. Despite a modest year-end rally, the fourth
quarter was still a negative for most international markets.
In 2007, emerging market stocks continued to outperform developed
market stocks due to stronger earnings growth coupled with a
relatively more optimistic economic growth outlook.The growth in
emerging economies has persisted, particularly in China and India. In
addition, most emerging markets were less affected by the problems
in the global credit markets.Among the major developed markets, a
noticeable laggard was Japan as earnings growth in Japan was close to
0 percent in 2007 and valuations remained high relative to other
developed markets. On a style basis, growth stocks outperformed
value stocks for the first time in seven years.
73
INVESTMENT SECTION
FUND PERFORMANCE EVALUATION
Does not include the Voluntary Investment Program
Colorado PERA’s international equity return in 2007 was 17.1
percent, outperforming the 16.7 percent return for its benchmark.
Colorado PERA’s three-year annualized international equity
portfolio total return figure was 20.0 percent, ahead of the
benchmark’s return of 19.9 percent.The five-year annualized total
return for Colorado PERA’s international portfolio was 23.9
percent, compared to the benchmark’s total return of 23.6 percent.
FIXED INCOMEThe year 2007 will be remembered for two critical events in fixed
income: the subprime mortgage crisis that impaired U.S. economic
growth and for the poor risk-adjusted return performance from
fixed income sectors other than U.S.Treasuries.
The credit crunch started in the summer of 2007 when default rates
on subprime mortgages began to surge and rating agencies took
unprecedented actions to downgrade thousands of subprime linked
securities.As investors fled from investing in riskier securities and
liquidity quickly dried up, commercial banks, finance companies,
and brokerage firms were left with subprime mortgages and
leveraged loan commitments on ballooning balance sheets supported
by eroding capital ratios. In order to shore up capital, banks began to
tighten lending standards.These actions had an adverse impact on
many financial markets.
Recognizing the downward risks to financial markets and economic
growth, the Federal Reserve, along with other major central banks
around the world, began to aggressively inject liquidity into the
banking system in the fall of 2007. During the last four months of
the year, the Federal Reserve lowered the Fed Funds rate 1.0
percent to 4.25 percent. Consumer and investor confidence fell at
the end of 2007, increasing the odds of economic recession in the
face of falling home prices, record high oil prices, a falling U.S.
dollar, and rising default rates in high yield, home mortgage, credit,
and auto markets.
The year was marked by a bifurcation of generally rising yields
during the first half of the year before a dramatic risk aversion led to
sharply lower interest rates in the second half of the year. Despite
the turmoil in the second half of the year, total returns were positive
across all fixed income sectors due to falling yields. Due to the
flight-to-quality in the second half of the year, the U.S.Treasury
sector was the strongest performing fixed income sector.The worst
performing sectors during the year were asset-backed securities and
corporate high-yield bonds.
Colorado PERA’s fixed income portfolio returned 6.5 percent
during 2007, which equaled the benchmark’s return of 6.5 percent.
Colorado PERA’s three-year and five-year returns for the fixed
income portfolio were 4.7 percent and 5.2 percent compared to the
benchmark’s returns of 4.7 percent and 4.6 percent, respectively.
ALTERNATIVESThe private equity market continued its strong multi-year
performance during the first half of 2007. Capital needed to finance
acquisitions proved to be relatively easy to acquire and the result was
what many in the industry termed the “Golden Age of Buyouts.”
Many public companies looked to private equity sponsors to
provide capital for growth and, in several instances, as financing
sources for going private transactions.The largest deal ever
announced, the acquisition of Bell Canada, occurred in June 2007.
Other large private equity transactions that were announced in 2007
included the acquisitions of TXU, First Data, Clear Channel,
Chrysler, EMI, Bausch & Lomb and others.As many sponsors were
focused on taking their portfolio companies private, a select few
private equity firms took advantage of the favorable market
conditions and took their management companies public. Other
sponsors looked to the large pools of sovereign wealth to create
liquidity by selling ownership interests in their respective private
equity firms.
The second half of 2007 showed a marked change from the robust
investment environment during the first six months of the year.
Subprime-related issues created uncertainty in the credit markets
and the result was a dramatic slowdown in the size and number of
deals announced in the private equity arena. Many sponsors and
lenders opted to halt new activity until the more than $300 billion
of transaction value looking for permanent financing worked its way
through the deal pipeline. Given the turn in market conditions,
private equity sponsors focusing on distressed investing took the
opportunity to raise additional capital.
As a result of the recovering initial public offering market, a lively
mergers and acquisition environment and healthy fundraising, the
venture capital market had a promising 2007.Venture capitalists
continued to show interest in cleantech, digital media, and startup
companies in India and China.
Overall, valuations remain quite strong and cash flow was again
positive for the year. The portfolio funded $765 million in capital
calls and received cash distributions of $1.1 billion during the year.
In 2007, Colorado PERA approved 12 commitments in alternative
investments—five in venture capital, four in leveraged buyouts, and
three in special situations—totaling $700 million. In addition,
Colorado PERA was able to complete dispositions of 20 funds
during the year, slightly reducing the number of private equity
managers in the portfolio.
Colorado PERA’s alternative investment portfolio returned 19.3
percent in 2007 compared with the custom alternatives benchmark
return of 8.6 percent. Colorado PERA’s alternative investment
portfolio returned 20.8 percent and 22.5 percent, respectively, for
the three- and five-year annualized periods compared with the
annualized custom benchmark returns of 12.1 percent and 17.0
percent, respectively, for the same periods.The alternative
investment program’s net, since inception internal rate of return as
of December 31, 2007, is 11.9 percent compared to the custom
benchmark’s since inception internal rate of return of 10.7 percent.
74
INVESTMENT SECTION
REAL ESTATEThe U.S. commercial real estate market and related property
fundamentals hit their peak in mid-2007. Deceleration of U.S.
economic growth coupled with a tightening of the debt market
dampened real estate performance in the latter half of 2007.The
property market fundamentals across the primary property types are
in relatively good position, and have provided stability in the
portfolio’s overall annual performance.
The commercial capital markets have been seriously impacted by
the subprime residential mortgage losses, and this has slowed the
acquisition and sales activity in the commercial property markets in
the second half of the year.The second tiered property markets have
seen valuations decrease, but the demand in prime property markets
has solidified their property values.
The European markets have performed in a similar fashion to the U.S.
The U.K. markets actually experienced a decline in market value
during 2007. In Asia, the credit market dislocation has had less of an
impact, hence, transaction volumes and real estate values are steady.
In 2007, the real estate portfolio had a total return of 18.1 percent,
compared to its custom benchmark return of 15.8 percent.The real
estate portfolio returned 22.6 percent and 20.7 percent for the
three- and five-year annualized periods, which compared favorably
to the custom benchmark returns of 15.2 percent and 16.3 percent,
respectively.At December 31, 2007, real estate was principally
comprised of U.S. private equity and international private equity
investments.
TIMBERIn 2007, no acquisitions were made by the timberland manager on
behalf of Colorado PERA and sales totaled $7.1 million. Colorado
PERA’s timber portfolio produced one-, three-, and five-year
annualized returns of 16.4 percent, 14.5 percent, and 16.1 percent,
respectively, compared with the NCREIF Timberland Index
returns of 18.4 percent, 17.1 percent and 14.0 percent,
respectively, for these periods.
FUND PERFORMANCE EVALUATION
Does not include the Voluntary Investment Program

75
INVESTMENT SECTION
SCHEDULE OF INVESTMENT RESULTS
Does not include the Voluntary Investment ProgramAs of December 31, 2007
Ennis Knupp & Associates, the Board’s Investment Performance consultant, provides the investment returns for the fund based on data made
available by the fund’s custodian,The Northern Trust Company. Listed below are the one–, three–, five–, and ten–year net-of-fee time-
weighted rates of return for each asset class and their respective benchmarks.
2007 3–YEAR 5–YEAR 10–YEAR
Colorado PERA Total Portfolio 10.0% 11.7% 14.4% 8.1%
Total Fund Policy Benchmark 8.7% 10.4% — —
Median Plan (Russell/Mellon’s Median Public Fund Universe) 8.0% 9.6% 13.0% 7.7%
Domestic Stocks 6.6% 9.4% 13.6% 6.6%
DJ Wilshire 50001 5.6% 9.1% 13.6% 6.5%
International Stocks 17.1% 20.0% 23.9% 10.7%
MSCI ACWI Ex-U.S.1 16.7% 19.9% 23.6% 9.8%
Fixed Income 6.5% 4.7% 5.2% 5.4%
Lehman Brothers Universal1 6.5% 4.7% 4.6% 6.1%
Lehman Brothers Aggregate 7.0% 4.6% 4.4% 6.0%
Alternative Investments 19.3% 20.8% 22.5% 13.2%
Custom Alternative Benchmark2 8.6% 12.1% 17.0% 9.3%
Real Estate 18.1% 22.6% 20.7% 14.7%
Custom Real Estate Benchmark3 15.8% 15.2% 16.3% 11.7%
Colorado PERA Timber Investments 16.4% 14.5% 16.1% 10.4%
NCREIF Timberland Property Index 18.4% 17.1% 14.0% 8.6%
Note: Performance calculations were prepared using net-of-fee time-weighted rates of return.
1 The Colorado PERA Board of Trustees adopted new benchmarks for domestic stock, international stock, and fixed income as of
April 1, 2004.Accordingly, the benchmark returns presented represent a blend, as follows:
The Total Fund benchmark is a combination of 45 percent of the DJ Wilshire 5000 Stock Index; 15 percent of the Morgan
Stanley Capital International All Country World Ex-U.S. Index; 25 percent of the Lehman Brothers Universal Bond Index; 7
percent of the Colorado PERA Real Estate Index; 7 percent of the Colorado PERA Alternatives Index; and 1 percent of the
NCREIF Timber Index. Prior to January 1, 2006, the weight for the MSCI ACWI Ex-U.S. Index was 14 percent and the
Custom Alternative Benchmark was 8 percent.
Domestic Stocks—S&P 1500 prior to April 1, 2004; DJ Wilshire 5000 beginning April 1, 2004.
International Stocks—EAFE Custom Index (75 percent MSCI EAFE Index and 25 percent MSCI EAFE excluding Japan)
prior to April 1, 2004; MSCI ACWI excluding U.S. beginning April 1, 2004.
Fixed Income—Lehman Aggregate prior to April 1, 2004; Lehman Universal beginning April 1, 2004.
2 DJ Wilshire 5000 plus 300 basis points.
3 Beginning January 1, 2006: NFI (NCREIF Open-end Core Fund Index) plus 100 basis points; prior to January 1, 2006: 15 percent
NAREIT, 45 percent NCREIF Property, 20 percent CITI Mortgage, and 20 percent Global Property Research.
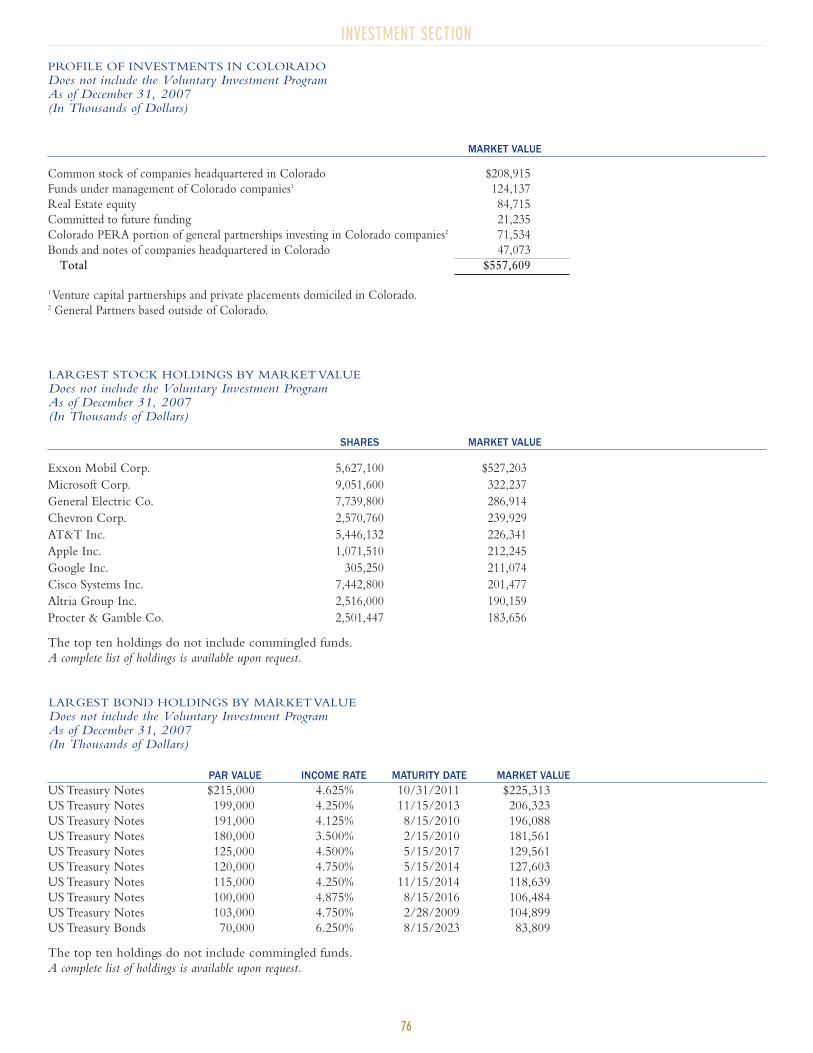
76
INVESTMENT SECTION
PROFILE OF INVESTMENTS IN COLORADO
Does not include the Voluntary Investment ProgramAs of December 31, 2007(In Thousands of Dollars)
MARKET VALUE
Common stock of companies headquartered in Colorado $208,915
Funds under management of Colorado companies1 124,137
Real Estate equity 84,715
Committed to future funding 21,235
Colorado PERA portion of general partnerships investing in Colorado companies2 71,534
Bonds and notes of companies headquartered in Colorado 47,073
Total $557,609
1 Venture capital partnerships and private placements domiciled in Colorado.2 General Partners based outside of Colorado.
LARGEST STOCK HOLDINGS BY MARKET VALUE
Does not include the Voluntary Investment ProgramAs of December 31, 2007(In Thousands of Dollars)
LARGEST BOND HOLDINGS BY MARKET VALUE
Does not include the Voluntary Investment ProgramAs of December 31, 2007(In Thousands of Dollars)
PAR VALUE INCOME RATE MATURITY DATE MARKET VALUEUS Treasury Notes $215,000 4.625% 10/31/2011 $225,313
US Treasury Notes 199,000 4.250% 11/15/2013 206,323
US Treasury Notes 191,000 4.125% 8/15/2010 196,088
US Treasury Notes 180,000 3.500% 2/15/2010 181,561
US Treasury Notes 125,000 4.500% 5/15/2017 129,561
US Treasury Notes 120,000 4.750% 5/15/2014 127,603
US Treasury Notes 115,000 4.250% 11/15/2014 118,639
US Treasury Notes 100,000 4.875% 8/15/2016 106,484
US Treasury Notes 103,000 4.750% 2/28/2009 104,899
US Treasury Bonds 70,000 6.250% 8/15/2023 83,809
The top ten holdings do not include commingled funds.
A complete list of holdings is available upon request.
SHARES MARKET VALUE
Exxon Mobil Corp. 5,627,100 $527,203
Microsoft Corp. 9,051,600 322,237
General Electric Co. 7,739,800 286,914
Chevron Corp. 2,570,760 239,929
AT&T Inc. 5,446,132 226,341
Apple Inc. 1,071,510 212,245
Google Inc. 305,250 211,074
Cisco Systems Inc. 7,442,800 201,477
Altria Group Inc. 2,516,000 190,159
Procter & Gamble Co. 2,501,447 183,656
The top ten holdings do not include commingled funds.
A complete list of holdings is available upon request.
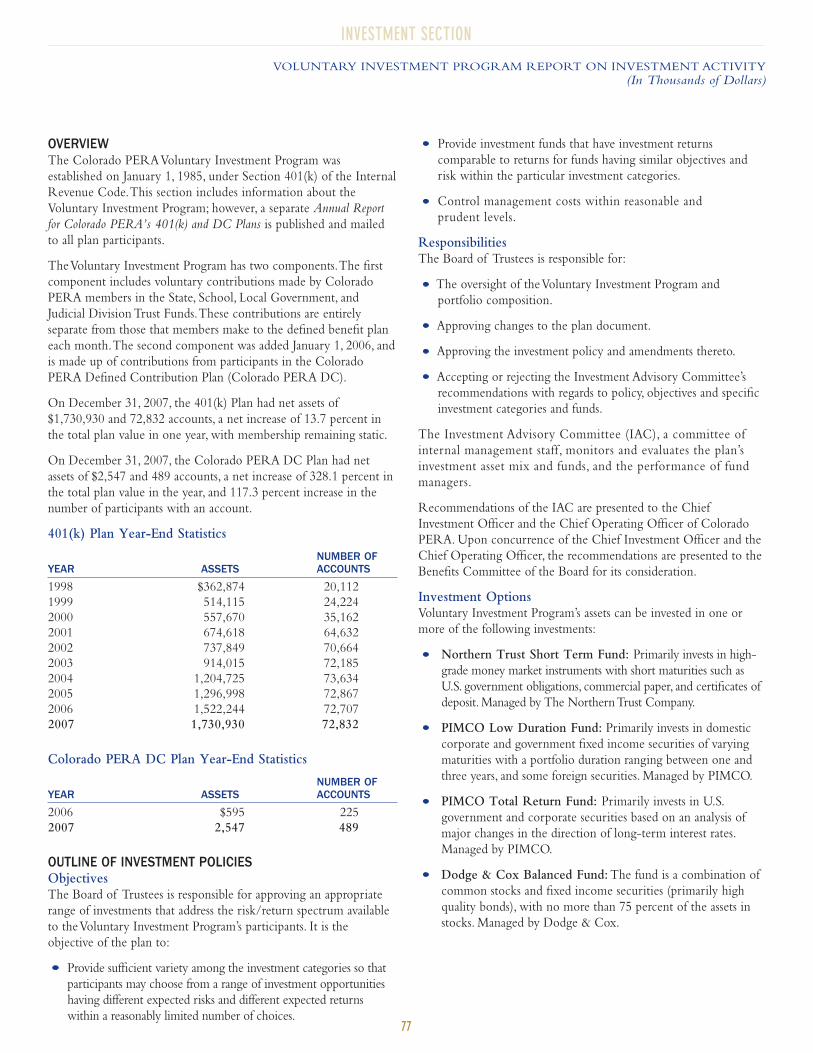
77
INVESTMENT SECTION
VOLUNTARY INVESTMENT PROGRAM REPORT ON INVESTMENT ACTIVITY
(In Thousands of Dollars)
OVERVIEWThe Colorado PERA Voluntary Investment Program was
established on January 1, 1985, under Section 401(k) of the Internal
Revenue Code.This section includes information about the
Voluntary Investment Program; however, a separate Annual Report
for Colorado PERA’s 401(k) and DC Plans is published and mailed
to all plan participants.
The Voluntary Investment Program has two components.The first
component includes voluntary contributions made by Colorado
PERA members in the State, School, Local Government, and
Judicial Division Trust Funds.These contributions are entirely
separate from those that members make to the defined benefit plan
each month.The second component was added January 1, 2006, and
is made up of contributions from participants in the Colorado
PERA Defined Contribution Plan (Colorado PERA DC).
On December 31, 2007, the 401(k) Plan had net assets of
$1,730,930 and 72,832 accounts, a net increase of 13.7 percent in
the total plan value in one year, with membership remaining static.
On December 31, 2007, the Colorado PERA DC Plan had net
assets of $2,547 and 489 accounts, a net increase of 328.1 percent in
the total plan value in the year, and 117.3 percent increase in the
number of participants with an account.
401(k) Plan Year-End Statistics
NUMBER OF YEAR ASSETS ACCOUNTS
1998 $362,874 20,112
1999 514,115 24,224
2000 557,670 35,162
2001 674,618 64,632
2002 737,849 70,664
2003 914,015 72,185
2004 1,204,725 73,634
2005 1,296,998 72,867
2006 1,522,244 72,707
2007 1,730,930 72,832
Colorado PERA DC Plan Year-End Statistics
NUMBER OF YEAR ASSETS ACCOUNTS
2006 $595 225
2007 2,547 489
OUTLINE OF INVESTMENT POLICIESObjectivesThe Board of Trustees is responsible for approving an appropriate
range of investments that address the risk/return spectrum available
to the Voluntary Investment Program’s participants. It is the
objective of the plan to:
Provide sufficient variety among the investment categories so that
participants may choose from a range of investment opportunities
having different expected risks and different expected returns
within a reasonably limited number of choices.
Provide investment funds that have investment returns
comparable to returns for funds having similar objectives and
risk within the particular investment categories.
Control management costs within reasonable and
prudent levels.
ResponsibilitiesThe Board of Trustees is responsible for:
The oversight of the Voluntary Investment Program and
portfolio composition.
Approving changes to the plan document.
Approving the investment policy and amendments thereto.
Accepting or rejecting the Investment Advisory Committee’s
recommendations with regards to policy, objectives and specific
investment categories and funds.
The Investment Advisory Committee (IAC), a committee of
internal management staff, monitors and evaluates the plan’s
investment asset mix and funds, and the performance of fund
managers.
Recommendations of the IAC are presented to the Chief
Investment Officer and the Chief Operating Officer of Colorado
PERA. Upon concurrence of the Chief Investment Officer and the
Chief Operating Officer, the recommendations are presented to the
Benefits Committee of the Board for its consideration.
Investment OptionsVoluntary Investment Program’s assets can be invested in one or
more of the following investments:
Northern Trust Short Term Fund: Primarily invests in high-
grade money market instruments with short maturities such as
U.S. government obligations, commercial paper, and certificates of
deposit. Managed by The Northern Trust Company.
PIMCO Low Duration Fund: Primarily invests in domestic
corporate and government fixed income securities of varying
maturities with a portfolio duration ranging between one and
three years, and some foreign securities. Managed by PIMCO.
PIMCO Total Return Fund: Primarily invests in U.S.
government and corporate securities based on an analysis of
major changes in the direction of long-term interest rates.
Managed by PIMCO.
Dodge & Cox Balanced Fund: The fund is a combination of
common stocks and fixed income securities (primarily high
quality bonds), with no more than 75 percent of the assets in
stocks. Managed by Dodge & Cox.
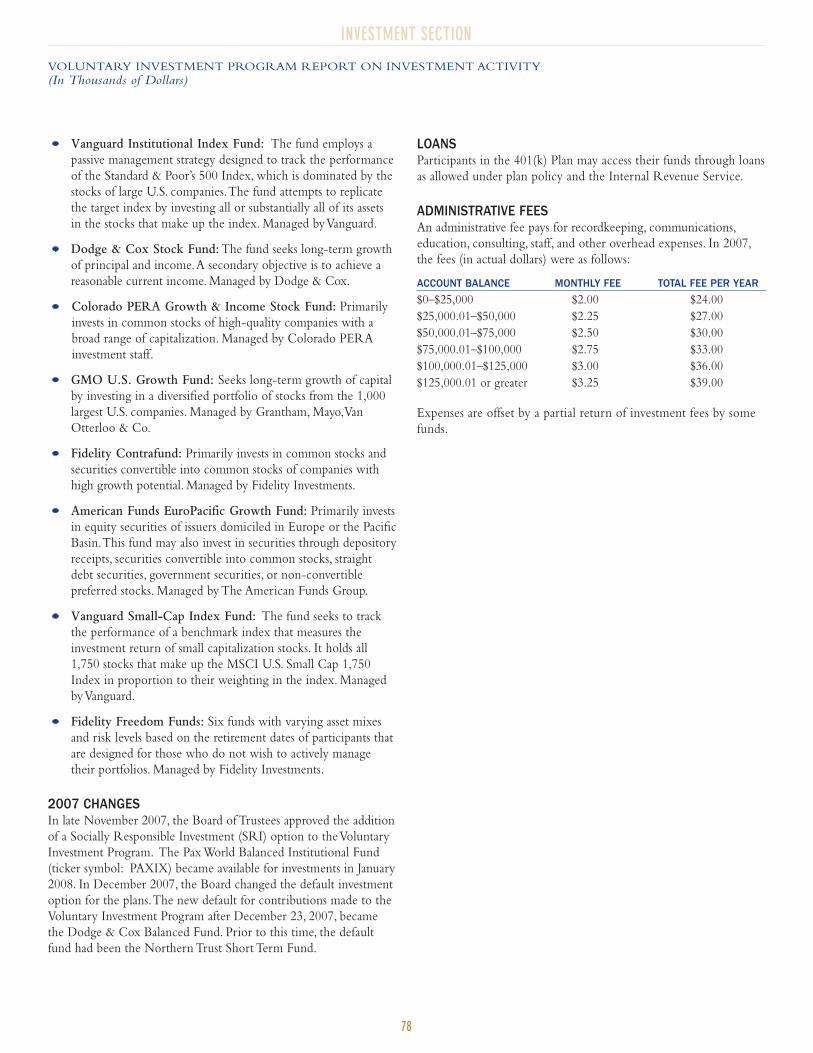
78
INVESTMENT SECTION
VOLUNTARY INVESTMENT PROGRAM REPORT ON INVESTMENT ACTIVITY
(In Thousands of Dollars)
Vanguard Institutional Index Fund: The fund employs a
passive management strategy designed to track the performance
of the Standard & Poor’s 500 Index, which is dominated by the
stocks of large U.S. companies.The fund attempts to replicate
the target index by investing all or substantially all of its assets
in the stocks that make up the index. Managed by Vanguard.
Dodge & Cox Stock Fund: The fund seeks long-term growth
of principal and income.A secondary objective is to achieve a
reasonable current income. Managed by Dodge & Cox.
Colorado PERA Growth & Income Stock Fund: Primarily
invests in common stocks of high-quality companies with a
broad range of capitalization. Managed by Colorado PERA
investment staff.
GMO U.S. Growth Fund: Seeks long-term growth of capital
by investing in a diversified portfolio of stocks from the 1,000
largest U.S. companies. Managed by Grantham, Mayo,Van
Otterloo & Co.
Fidelity Contrafund: Primarily invests in common stocks and
securities convertible into common stocks of companies with
high growth potential. Managed by Fidelity Investments.
American Funds EuroPacific Growth Fund: Primarily invests
in equity securities of issuers domiciled in Europe or the Pacific
Basin.This fund may also invest in securities through depository
receipts, securities convertible into common stocks, straight
debt securities, government securities, or non-convertible
preferred stocks. Managed by The American Funds Group.
Vanguard Small-Cap Index Fund: The fund seeks to track
the performance of a benchmark index that measures the
investment return of small capitalization stocks. It holds all
1,750 stocks that make up the MSCI U.S. Small Cap 1,750
Index in proportion to their weighting in the index. Managed
by Vanguard.
Fidelity Freedom Funds: Six funds with varying asset mixes
and risk levels based on the retirement dates of participants that
are designed for those who do not wish to actively manage
their portfolios. Managed by Fidelity Investments.
2007 CHANGESIn late November 2007, the Board of Trustees approved the addition
of a Socially Responsible Investment (SRI) option to the Voluntary
Investment Program. The Pax World Balanced Institutional Fund
(ticker symbol: PAXIX) became available for investments in January
2008. In December 2007, the Board changed the default investment
option for the plans.The new default for contributions made to the
Voluntary Investment Program after December 23, 2007, became
the Dodge & Cox Balanced Fund. Prior to this time, the default
fund had been the Northern Trust Short Term Fund.
LOANSParticipants in the 401(k) Plan may access their funds through loans
as allowed under plan policy and the Internal Revenue Service.
ADMINISTRATIVE FEESAn administrative fee pays for recordkeeping, communications,
education, consulting, staff, and other overhead expenses. In 2007,
the fees (in actual dollars) were as follows:
ACCOUNT BALANCE MONTHLY FEE TOTAL FEE PER YEAR
$0–$25,000 $2.00 $24.00
$25,000.01–$50,000 $2.25 $27.00
$50,000.01–$75,000 $2.50 $30.00
$75,000.01–$100,000 $2.75 $33.00
$100,000.01–$125,000 $3.00 $36.00
$125,000.01 or greater $3.25 $39.00
Expenses are offset by a partial return of investment fees by some
funds.
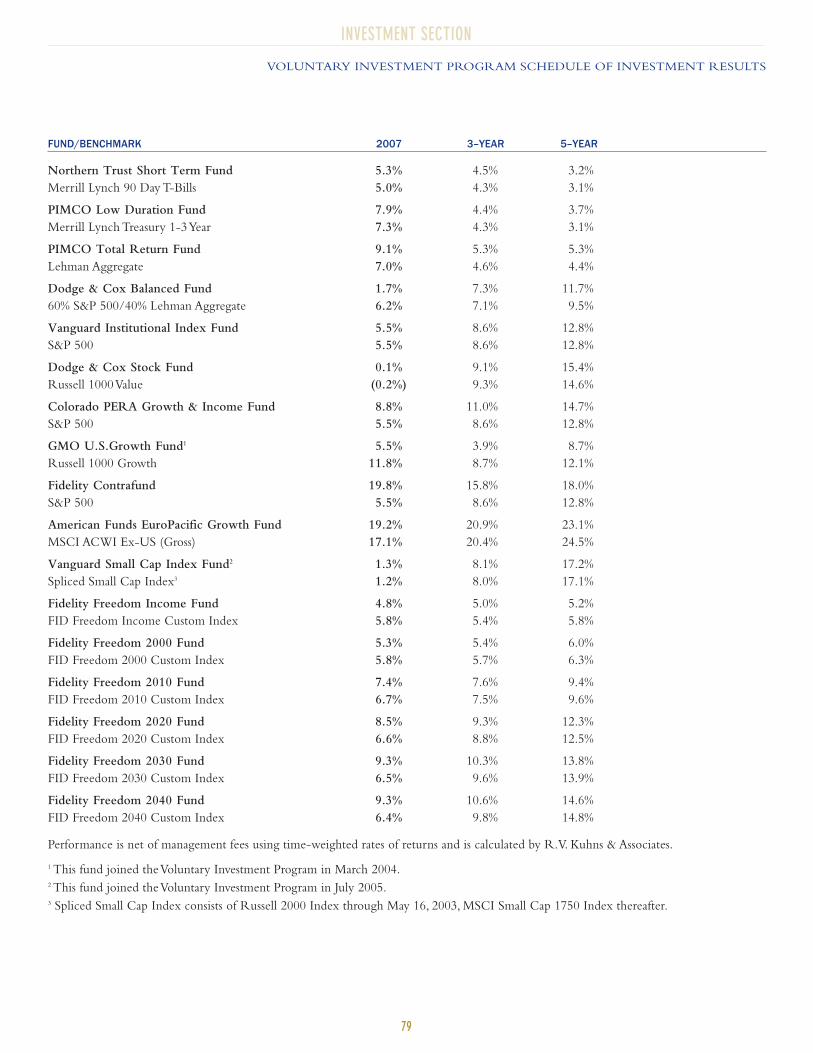
79
INVESTMENT SECTION
VOLUNTARY INVESTMENT PROGRAM SCHEDULE OF INVESTMENT RESULTS
FUND/BENCHMARK 2007 3–YEAR 5–YEAR
Northern Trust Short Term Fund 5.3% 4.5% 3.2%
Merrill Lynch 90 Day T-Bills 5.0% 4.3% 3.1%
PIMCO Low Duration Fund 7.9% 4.4% 3.7%
Merrill Lynch Treasury 1-3 Year 7.3% 4.3% 3.1%
PIMCO Total Return Fund 9.1% 5.3% 5.3%
Lehman Aggregate 7.0% 4.6% 4.4%
Dodge & Cox Balanced Fund 1.7% 7.3% 11.7%
60% S&P 500/40% Lehman Aggregate 6.2% 7.1% 9.5%
Vanguard Institutional Index Fund 5.5% 8.6% 12.8%
S&P 500 5.5% 8.6% 12.8%
Dodge & Cox Stock Fund 0.1% 9.1% 15.4%
Russell 1000 Value (0.2%) 9.3% 14.6%
Colorado PERA Growth & Income Fund 8.8% 11.0% 14.7%
S&P 500 5.5% 8.6% 12.8%
GMO U.S.Growth Fund1 5.5% 3.9% 8.7%
Russell 1000 Growth 11.8% 8.7% 12.1%
Fidelity Contrafund 19.8% 15.8% 18.0%
S&P 500 5.5% 8.6% 12.8%
American Funds EuroPacific Growth Fund 19.2% 20.9% 23.1%
MSCI ACWI Ex-US (Gross) 17.1% 20.4% 24.5%
Vanguard Small Cap Index Fund2 1.3% 8.1% 17.2%
Spliced Small Cap Index3 1.2% 8.0% 17.1%
Fidelity Freedom Income Fund 4.8% 5.0% 5.2%
FID Freedom Income Custom Index 5.8% 5.4% 5.8%
Fidelity Freedom 2000 Fund 5.3% 5.4% 6.0%
FID Freedom 2000 Custom Index 5.8% 5.7% 6.3%
Fidelity Freedom 2010 Fund 7.4% 7.6% 9.4%
FID Freedom 2010 Custom Index 6.7% 7.5% 9.6%
Fidelity Freedom 2020 Fund 8.5% 9.3% 12.3%
FID Freedom 2020 Custom Index 6.6% 8.8% 12.5%
Fidelity Freedom 2030 Fund 9.3% 10.3% 13.8%
FID Freedom 2030 Custom Index 6.5% 9.6% 13.9%
Fidelity Freedom 2040 Fund 9.3% 10.6% 14.6%
FID Freedom 2040 Custom Index 6.4% 9.8% 14.8%
Performance is net of management fees using time-weighted rates of returns and is calculated by R.V. Kuhns & Associates.
1 This fund joined the Voluntary Investment Program in March 2004.2 This fund joined theVoluntary Investment Program in July 2005.3 Spliced Small Cap Index consists of Russell 2000 Index through May 16, 2003, MSCI Small Cap 1750 Index thereafter.
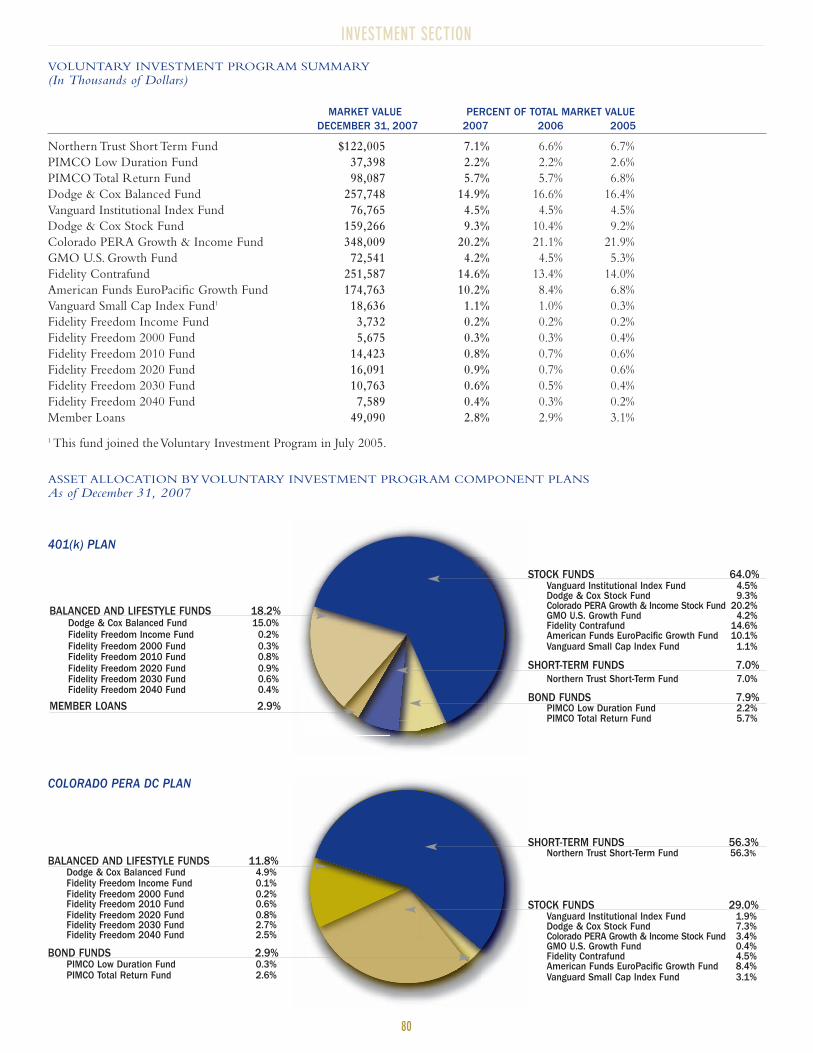
80
INVESTMENT SECTION
VOLUNTARY INVESTMENT PROGRAM SUMMARY
(In Thousands of Dollars)
MARKET VALUE PERCENT OF TOTAL MARKET VALUEDECEMBER 31, 2007 2007 2006 2005
Northern Trust Short Term Fund $122,005 7.1% 6.6% 6.7%
PIMCO Low Duration Fund 37,398 2.2% 2.2% 2.6%
PIMCO Total Return Fund 98,087 5.7% 5.7% 6.8%
Dodge & Cox Balanced Fund 257,748 14.9% 16.6% 16.4%
Vanguard Institutional Index Fund 76,765 4.5% 4.5% 4.5%
Dodge & Cox Stock Fund 159,266 9.3% 10.4% 9.2%
Colorado PERA Growth & Income Fund 348,009 20.2% 21.1% 21.9%
GMO U.S. Growth Fund 72,541 4.2% 4.5% 5.3%
Fidelity Contrafund 251,587 14.6% 13.4% 14.0%
American Funds EuroPacific Growth Fund 174,763 10.2% 8.4% 6.8%
Vanguard Small Cap Index Fund1 18,636 1.1% 1.0% 0.3%
Fidelity Freedom Income Fund 3,732 0.2% 0.2% 0.2%
Fidelity Freedom 2000 Fund 5,675 0.3% 0.3% 0.4%
Fidelity Freedom 2010 Fund 14,423 0.8% 0.7% 0.6%
Fidelity Freedom 2020 Fund 16,091 0.9% 0.7% 0.6%
Fidelity Freedom 2030 Fund 10,763 0.6% 0.5% 0.4%
Fidelity Freedom 2040 Fund 7,589 0.4% 0.3% 0.2%
Member Loans 49,090 2.8% 2.9% 3.1%
1 This fund joined the Voluntary Investment Program in July 2005.
ASSET ALLOCATION BY VOLUNTARY INVESTMENT PROGRAM COMPONENT PLANS
As of December 31, 2007
COLORADO PERA DC PLAN
STOCK FUNDS 64.0%Vanguard Institutional Index Fund 4.5%Dodge & Cox Stock Fund 9.3%Colorado PERA Growth & Income Stock Fund 20.2%GMO U.S. Growth Fund 4.2%Fidelity Contrafund 14.6%American Funds EuroPacific Growth Fund 10.1%Vanguard Small Cap Index Fund 1.1%
SHORT-TERM FUNDS 7.0%Northern Trust Short-Term Fund 7.0%
BOND FUNDS 7.9%PIMCO Low Duration Fund 2.2%PIMCO Total Return Fund 5.7%
SHORT-TERM FUNDS 56.3%Northern Trust Short-Term Fund 56.3%
STOCK FUNDS 29.0%Vanguard Institutional Index Fund 1.9%Dodge & Cox Stock Fund 7.3%Colorado PERA Growth & Income Stock Fund 3.4%GMO U.S. Growth Fund 0.4%Fidelity Contrafund 4.5%American Funds EuroPacific Growth Fund 8.4%Vanguard Small Cap Index Fund 3.1%
BALANCED AND LIFESTYLE FUNDS 18.2%Dodge & Cox Balanced Fund 15.0%Fidelity Freedom Income Fund 0.2%Fidelity Freedom 2000 Fund 0.3%Fidelity Freedom 2010 Fund 0.8%Fidelity Freedom 2020 Fund 0.9%Fidelity Freedom 2030 Fund 0.6%Fidelity Freedom 2040 Fund 0.4%
MEMBER LOANS 2.9%
401(k) PLAN
BALANCED AND LIFESTYLE FUNDS 11.8%Dodge & Cox Balanced Fund 4.9%Fidelity Freedom Income Fund 0.1%Fidelity Freedom 2000 Fund 0.2%Fidelity Freedom 2010 Fund 0.6%Fidelity Freedom 2020 Fund 0.8%Fidelity Freedom 2030 Fund 2.7%Fidelity Freedom 2040 Fund 2.5%
BOND FUNDS 2.9%PIMCO Low Duration Fund 0.3%PIMCO Total Return Fund 2.6%

Providing technology for our members
ACTUARIAL SECTION
82
REPORT OF THE INDEPENDENT ACTUARY
ACTUARIAL SECTION
83
REPORT OF THE INDEPENDENT ACTUARY
ACTUARIAL SECTION
84
REPORT OF THE INDEPENDENT ACTUARY

ACTUARIAL SECTION
85
THE PLAN SUMMARY FOR CALENDAR YEAR 2007
The Colorado Public Employees’ Retirement Association was
established in 1931 by the Colorado General Assembly as an
Instrumentality of the State. It initially covered only State
employees, but membership has expanded to include all school
districts except Denver, numerous municipalities, special districts,
public health departments and other local government entities, as
well as the State’s judicial system.
The plan’s purpose is to provide benefits to members and their
dependents at retirement or in the event of death or disability.The
plan is funded on an actuarial reserve basis, with money being set
aside for benefits while the benefits are being earned and before
they are paid.
ADMINISTRATION OF THE PLANThe plan operates by the authority of the Colorado General
Assembly, with benefits and administration defined under Title 24,
Article 51, of the Colorado Revised Statutes. Colorado PERA is
governed by a Board of Trustees.
The Board appoints an Executive Director who is responsible for
the daily administration of Colorado PERA.The Board retains an
actuary to make annual valuations of the funding adequacy of the
liabilities accrued under the plan.The Board also retains other
consultants as necessary.
MEMBER CONTRIBUTIONSAll members except State Troopers and Colorado Bureau of
Investigation agents contribute 8 percent of their gross salary to a
member contribution account. State Troopers and Colorado Bureau
of Investigation agents contribute 10 percent of salary. Generally,
salary is compensation for services rendered and is specifically
defined in State law.
Member contributions have been tax-deferred for federal income
tax purposes since July 1, 1984, and for state income tax purposes
since January 1, 1987.Therefore, contributions are not considered as
income for federal or state income tax purposes until they are
withdrawn through a refund or a benefit.
EMPLOYER CONTRIBUTIONSColorado PERA-affiliated employers contribute a percentage of
their total payroll to the fund. Respective employer contribution
rates are shown on the Schedule of Contribution Rate History on
pages 124-128.
The Schedule of Computed Employer Contribution Rates on page
101 shows a detailed explanation of how the employer contributions
are determined.These contributions are credited to the respective
Division for the purpose of creating actuarial reserves, so each
member’s benefits are fully provided for at retirement. Colorado
PERA is exempt from federal income taxes under the Internal
Revenue Code.
TERMINATIONA member who terminates Colorado PERA-covered employment
may request a member contribution account refund or leave the
account with Colorado PERA; a refund cancels a former Colorado
PERA member’s rights to future Colorado PERA benefits.
A member who has not attained age 65 or is not eligible to retire
and who wishes to refund his or her account will receive his or her
Colorado PERA contributions, a matching amount equal to 50
percent of the member contributions and interest, and any payments
made to purchase service.A member who withdraws his or her
account upon or after reaching age 65 or retirement eligibility
receives a 100 percent matching amount.
State law authorizes the Colorado PERA Board to determine the
interest to be credited to member accounts.The current interest rate
is 5 percent compounded annually. In no event shall the Board
specify a rate that exceeds 5 percent.
Any member who leaves a member account with Colorado PERA
until reaching age 65 or meeting Colorado PERA’s age and
service requirements may apply for lifetime monthly benefits
instead of withdrawing their account.
RETIREMENT BENEFITSService Retirement Benefits
Members are eligible to receive monthly retirement benefits when
they reach age and service retirement requirements as noted below:
SERVICE RETIREMENT ELIGIBILITY FOR MEMBERS (OTHER THAN STATE TROOPERS) HIRED BEFORE JULY 1, 2005Age Requirement Service Credit Requirement
(in years) (in years)
50 30
55 Age and Service = 80 or more
60 20
65 5
65 Less than 5 but 60 payroll postings
SERVICE RETIREMENT ELIGIBILITY FOR MEMBERS (OTHER THAN STATE TROOPERS) HIRED ON OR AFTER JULY 1, 2005,
BUT BEFORE JANUARY 1, 2007Age Requirement Service Credit Requirement
(in years) (in years)
Any Age 35
55 30
60 20
65 5
65 Less than 5 but 60 payroll postings
SERVICE RETIREMENT ELIGIBILITY FOR MEMBERS (OTHER THAN STATE TROOPERS) HIRED ON OR AFTER JANUARY 1, 2007
Age Requirement Service Credit Requirement
(in years) (in years)
Any Age 35
55 30
55 Age and Service = 85 or more
60 25
65 5
65 Less than 5 but 60 payroll postings
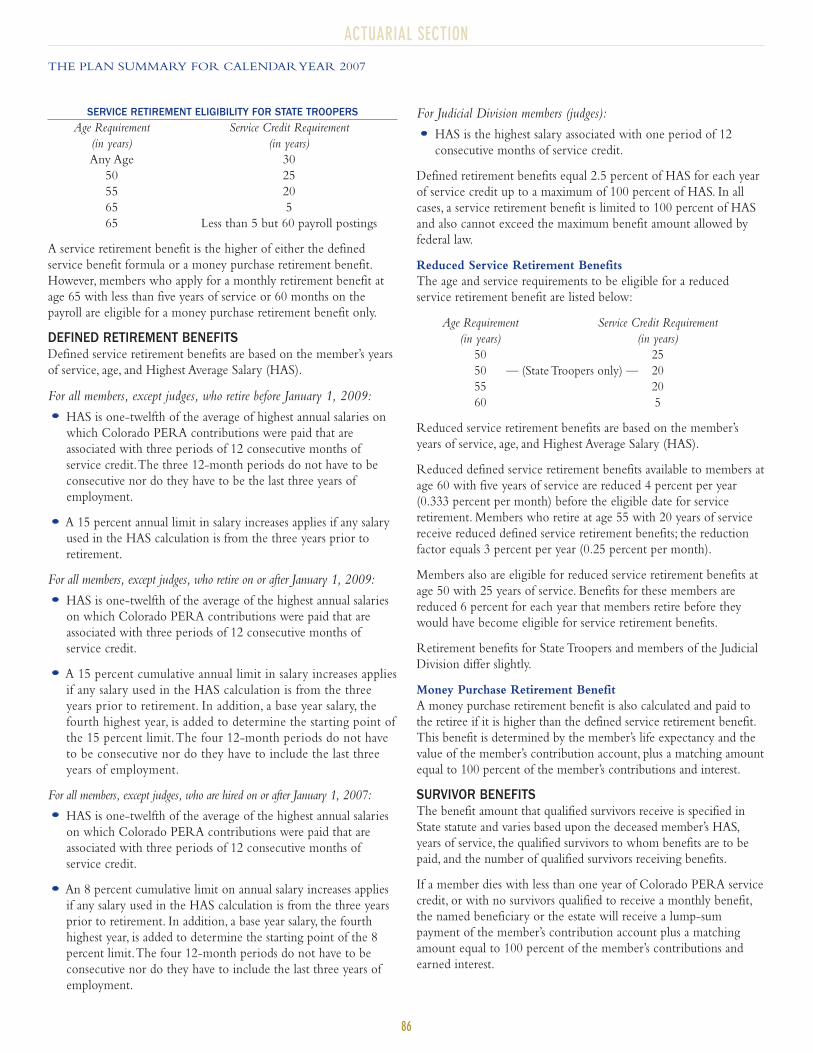
ACTUARIAL SECTION
86
THE PLAN SUMMARY FOR CALENDAR YEAR 2007
SERVICE RETIREMENT ELIGIBILITY FOR STATE TROOPERSAge Requirement Service Credit Requirement
(in years) (in years)
Any Age 30
50 25
55 20
65 5
65 Less than 5 but 60 payroll postings
A service retirement benefit is the higher of either the defined
service benefit formula or a money purchase retirement benefit.
However, members who apply for a monthly retirement benefit at
age 65 with less than five years of service or 60 months on the
payroll are eligible for a money purchase retirement benefit only.
DEFINED RETIREMENT BENEFITSDefined service retirement benefits are based on the member’s years
of service, age, and Highest Average Salary (HAS).
For all members, except judges, who retire before January 1, 2009:
HAS is one-twelfth of the average of highest annual salaries on
which Colorado PERA contributions were paid that are
associated with three periods of 12 consecutive months of
service credit.The three 12-month periods do not have to be
consecutive nor do they have to be the last three years of
employment.
A 15 percent annual limit in salary increases applies if any salary
used in the HAS calculation is from the three years prior to
retirement.
For all members, except judges, who retire on or after January 1, 2009:
HAS is one-twelfth of the average of the highest annual salaries
on which Colorado PERA contributions were paid that are
associated with three periods of 12 consecutive months of
service credit.
A 15 percent cumulative annual limit in salary increases applies
if any salary used in the HAS calculation is from the three
years prior to retirement. In addition, a base year salary, the
fourth highest year, is added to determine the starting point of
the 15 percent limit.The four 12-month periods do not have
to be consecutive nor do they have to include the last three
years of employment.
For all members, except judges, who are hired on or after January 1, 2007:
HAS is one-twelfth of the average of the highest annual salaries
on which Colorado PERA contributions were paid that are
associated with three periods of 12 consecutive months of
service credit.
An 8 percent cumulative limit on annual salary increases applies
if any salary used in the HAS calculation is from the three years
prior to retirement. In addition, a base year salary, the fourth
highest year, is added to determine the starting point of the 8
percent limit.The four 12-month periods do not have to be
consecutive nor do they have to include the last three years of
employment.
For Judicial Division members (judges):
HAS is the highest salary associated with one period of 12
consecutive months of service credit.
Defined retirement benefits equal 2.5 percent of HAS for each year
of service credit up to a maximum of 100 percent of HAS. In all
cases, a service retirement benefit is limited to 100 percent of HAS
and also cannot exceed the maximum benefit amount allowed by
federal law.
Reduced Service Retirement Benefits
The age and service requirements to be eligible for a reduced
service retirement benefit are listed below:
Age Requirement Service Credit Requirement
(in years) (in years)
50 25
50 — (State Troopers only) — 20
55 20
60 5
Reduced service retirement benefits are based on the member’s
years of service, age, and Highest Average Salary (HAS).
Reduced defined service retirement benefits available to members at
age 60 with five years of service are reduced 4 percent per year
(0.333 percent per month) before the eligible date for service
retirement. Members who retire at age 55 with 20 years of service
receive reduced defined service retirement benefits; the reduction
factor equals 3 percent per year (0.25 percent per month).
Members also are eligible for reduced service retirement benefits at
age 50 with 25 years of service. Benefits for these members are
reduced 6 percent for each year that members retire before they
would have become eligible for service retirement benefits.
Retirement benefits for State Troopers and members of the Judicial
Division differ slightly.
Money Purchase Retirement Benefit
A money purchase retirement benefit is also calculated and paid to
the retiree if it is higher than the defined service retirement benefit.
This benefit is determined by the member’s life expectancy and the
value of the member’s contribution account, plus a matching amount
equal to 100 percent of the member’s contributions and interest.
SURVIVOR BENEFITSThe benefit amount that qualified survivors receive is specified in
State statute and varies based upon the deceased member’s HAS,
years of service, the qualified survivors to whom benefits are to be
paid, and the number of qualified survivors receiving benefits.
If a member dies with less than one year of Colorado PERA service
credit, or with no survivors qualified to receive a monthly benefit,
the named beneficiary or the estate will receive a lump-sum
payment of the member’s contribution account plus a matching
amount equal to 100 percent of the member’s contributions and
earned interest.
ACTUARIAL SECTION
87
THE PLAN SUMMARY FOR CALENDAR YEAR 2007
If a member had more than one year of service and qualified
survivors at the time of death, a monthly benefit may be payable to
qualified survivors. If the member is not eligible for retirement,
children receive a benefit first, but if the member is eligible for
retirement, the cobeneficiary receives the benefit first.
Children are eligible to receive survivor benefits if under age 18, or
if enrolled full-time in an accredited school within six months of
the member’s death, until they reach age 23. If there are no eligible
children, or after benefits to children have ceased, the member’s
surviving spouse receives a monthly benefit at age 60 if the member
had less than 10 years of service credit or immediately if the
member had more than 10 years of service at the time of death. If
there is no eligible spouse, financially dependent parents will receive
a survivor benefit.
DISABILITY BENEFITSColorado PERA provides a two-tiered disability program. Short-
term disability payments are provided to members who are mentally
or physically incapacitated from performance of essential job duties
with reasonable accommodation, but who are not totally and
permanently incapacitated from regular and substantial gainful
employment. Colorado PERA provides reasonable income
replacement, or rehabilitation or retraining services. Disability
retirement benefits are provided to members who are totally and
permanently mentally or physically incapacitated from regular and
substantial gainful employment.
ANNUAL BENEFIT INCREASESColorado PERA benefits are increased annually each March.The
amount and timing of the annual increase is determined by the
Colorado PERA membership date of the retiree or deceased
Colorado PERA member.
For service and disability retirees who were hired before June 30,
2005, and for survivor benefit recipients of deceased members who
were hired before June 30, 2005, the annual increase is 3.5 percent,
compounded annually.The first annual increase occurs in the March
that immediately follows the calendar year in which the benefit
recipient began receiving benefits. If benefits have been payable for
less than a full year, but at least three months, a prorated annual
increase is made.
For service and disability retirees who were hired on or after July 1,
2005, but before January 1, 2007, and for survivor benefit recipients
of deceased members who were hired on or after July 1, 2005, but
before January 1, 2007, the annual increase is the lower of 3 percent
or the actual change in the Consumer Price Index, compounded
annually. If benefits have been payable for less than a full year, but at
least three months, a prorated annual increase is made.
For service and disability retirees who were hired on or after January
1, 2007, and for survivor benefit recipients of deceased members who
were hired on or after January 1, 2007, the annual increase is the
lower of 3 percent or the actual change in the Consumer Price
Index, compounded annually. For service retirees, the annual increase
does not begin until the retiree has been receiving benefits for one
year and in addition has either reached age 60 or years of service plus
age equal to 85 or more. For disability retirees or survivor benefit
recipients, the annual increase does not begin until the benefit
recipient has been receiving benefits for one year.Annual increases to
all benefit recipients in this group are limited to 10 percent of the
total funds available in the annual increase reserve in the Division
from which they retired or were a member before death.
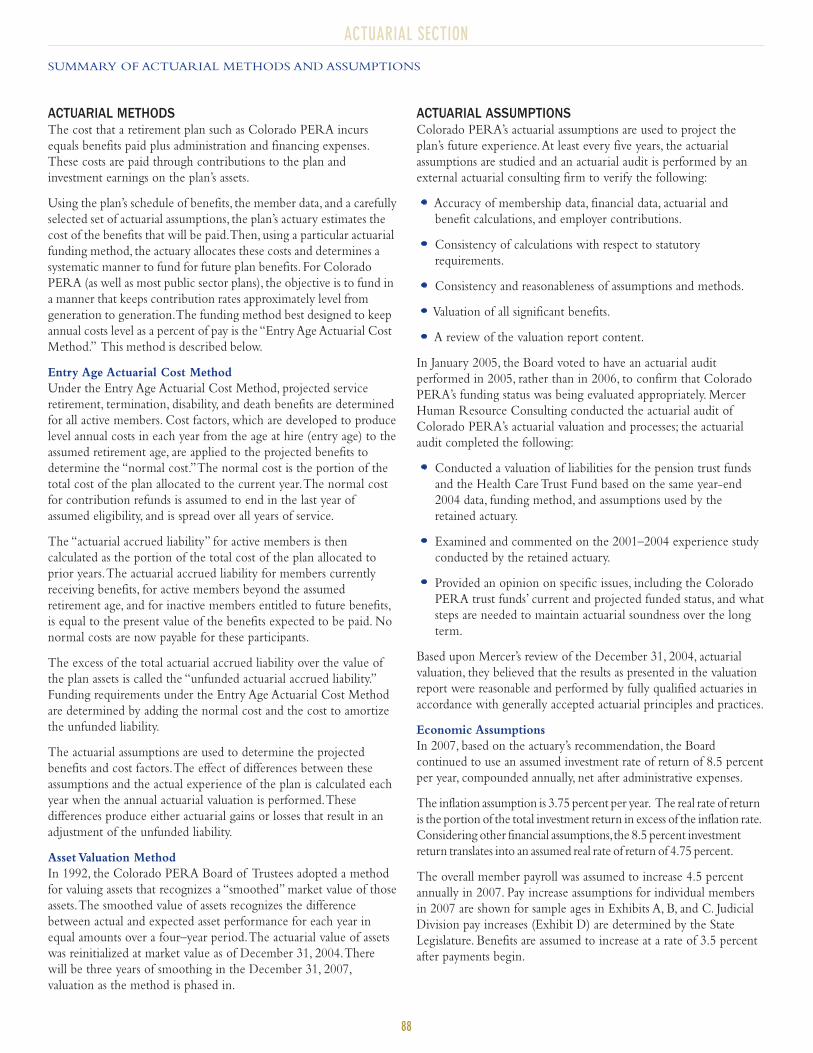
ACTUARIAL SECTION
88
SUMMARY OF ACTUARIAL METHODS AND ASSUMPTIONS
ACTUARIAL METHODSThe cost that a retirement plan such as Colorado PERA incurs
equals benefits paid plus administration and financing expenses.
These costs are paid through contributions to the plan and
investment earnings on the plan’s assets.
Using the plan’s schedule of benefits, the member data, and a carefully
selected set of actuarial assumptions, the plan’s actuary estimates the
cost of the benefits that will be paid.Then, using a particular actuarial
funding method, the actuary allocates these costs and determines a
systematic manner to fund for future plan benefits. For Colorado
PERA (as well as most public sector plans), the objective is to fund in
a manner that keeps contribution rates approximately level from
generation to generation.The funding method best designed to keep
annual costs level as a percent of pay is the “Entry Age Actuarial Cost
Method.” This method is described below.
Entry Age Actuarial Cost Method
Under the Entry Age Actuarial Cost Method, projected service
retirement, termination, disability, and death benefits are determined
for all active members. Cost factors, which are developed to produce
level annual costs in each year from the age at hire (entry age) to the
assumed retirement age, are applied to the projected benefits to
determine the “normal cost.”The normal cost is the portion of the
total cost of the plan allocated to the current year.The normal cost
for contribution refunds is assumed to end in the last year of
assumed eligibility, and is spread over all years of service.
The “actuarial accrued liability” for active members is then
calculated as the portion of the total cost of the plan allocated to
prior years.The actuarial accrued liability for members currently
receiving benefits, for active members beyond the assumed
retirement age, and for inactive members entitled to future benefits,
is equal to the present value of the benefits expected to be paid. No
normal costs are now payable for these participants.
The excess of the total actuarial accrued liability over the value of
the plan assets is called the “unfunded actuarial accrued liability.”
Funding requirements under the Entry Age Actuarial Cost Method
are determined by adding the normal cost and the cost to amortize
the unfunded liability.
The actuarial assumptions are used to determine the projected
benefits and cost factors.The effect of differences between these
assumptions and the actual experience of the plan is calculated each
year when the annual actuarial valuation is performed.These
differences produce either actuarial gains or losses that result in an
adjustment of the unfunded liability.
Asset Valuation Method
In 1992, the Colorado PERA Board of Trustees adopted a method
for valuing assets that recognizes a “smoothed” market value of those
assets.The smoothed value of assets recognizes the difference
between actual and expected asset performance for each year in
equal amounts over a four–year period.The actuarial value of assets
was reinitialized at market value as of December 31, 2004.There
will be three years of smoothing in the December 31, 2007,
valuation as the method is phased in.
ACTUARIAL ASSUMPTIONSColorado PERA’s actuarial assumptions are used to project the
plan’s future experience.At least every five years, the actuarial
assumptions are studied and an actuarial audit is performed by an
external actuarial consulting firm to verify the following:
Accuracy of membership data, financial data, actuarial and
benefit calculations, and employer contributions.
Consistency of calculations with respect to statutory
requirements.
Consistency and reasonableness of assumptions and methods.
Valuation of all significant benefits.
A review of the valuation report content.
In January 2005, the Board voted to have an actuarial audit
performed in 2005, rather than in 2006, to confirm that Colorado
PERA’s funding status was being evaluated appropriately. Mercer
Human Resource Consulting conducted the actuarial audit of
Colorado PERA’s actuarial valuation and processes; the actuarial
audit completed the following:
Conducted a valuation of liabilities for the pension trust funds
and the Health Care Trust Fund based on the same year-end
2004 data, funding method, and assumptions used by the
retained actuary.
Examined and commented on the 2001–2004 experience study
conducted by the retained actuary.
Provided an opinion on specific issues, including the Colorado
PERA trust funds’ current and projected funded status, and what
steps are needed to maintain actuarial soundness over the long
term.
Based upon Mercer’s review of the December 31, 2004, actuarial
valuation, they believed that the results as presented in the valuation
report were reasonable and performed by fully qualified actuaries in
accordance with generally accepted actuarial principles and practices.
Economic Assumptions
In 2007, based on the actuary’s recommendation, the Board
continued to use an assumed investment rate of return of 8.5 percent
per year, compounded annually, net after administrative expenses.
The inflation assumption is 3.75 percent per year. The real rate of return
is the portion of the total investment return in excess of the inflation rate.
Considering other financial assumptions,the 8.5 percent investment
return translates into an assumed real rate of return of 4.75 percent.
The overall member payroll was assumed to increase 4.5 percent
annually in 2007. Pay increase assumptions for individual members
in 2007 are shown for sample ages in Exhibits A, B, and C. Judicial
Division pay increases (Exhibit D) are determined by the State
Legislature. Benefits are assumed to increase at a rate of 3.5 percent
after payments begin.
ACTUARIAL SECTION
89
SUMMARY OF ACTUARIAL METHODS AND ASSUMPTIONS
Non-Economic Assumptions
The mortality table, last updated in 2005, is based on Colorado PERA
experience and is used to estimate the value of benefits expected to be
paid.Related values are shown in Exhibit F. For disability retirement,
impaired longevity is recognized by basing benefit values on an
adjusted age midway between attained age and normal retirement age.
The probabilities of age and service retirement are shown in Exhibits
G and H.The probabilities of withdrawal from service,disability,and
death-in-service are shown for sample ages in ExhibitsA,B,C,and D.
It is assumed that 35 percent of the vested members who terminate
will elect to withdraw their accounts while the remaining 65 percent
will elect to leave their accounts in the plan to be eligible for a benefit
at their retirement date.
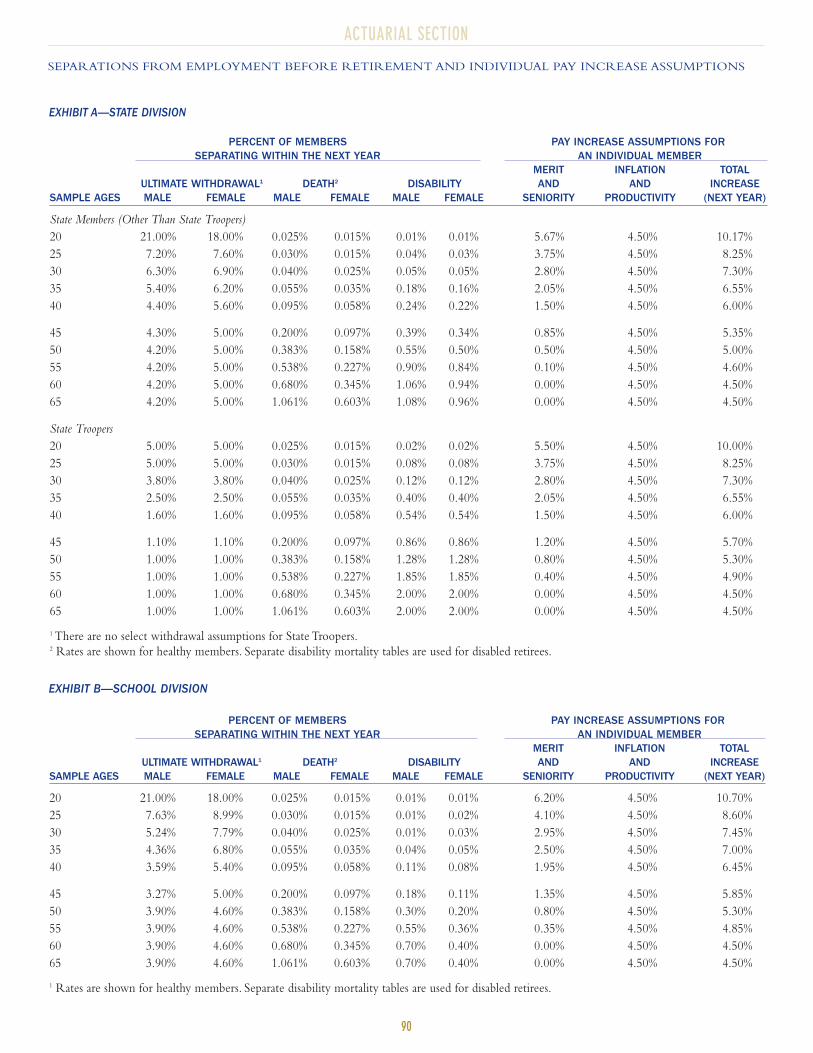
ACTUARIAL SECTION
90
PERCENT OF MEMBERS PAY INCREASE ASSUMPTIONS FORSEPARATING WITHIN THE NEXT YEAR AN INDIVIDUAL MEMBER
MERIT INFLATION TOTALULTIMATE WITHDRAWAL1 DEATH2 DISABILITY AND AND INCREASE
SAMPLE AGES MALE FEMALE MALE FEMALE MALE FEMALE SENIORITY PRODUCTIVITY (NEXT YEAR)
State Members (Other Than State Troopers)
20 21.00% 18.00% 0.025% 0.015% 0.01% 0.01% 5.67% 4.50% 10.17%
25 7.20% 7.60% 0.030% 0.015% 0.04% 0.03% 3.75% 4.50% 8.25%
30 6.30% 6.90% 0.040% 0.025% 0.05% 0.05% 2.80% 4.50% 7.30%
35 5.40% 6.20% 0.055% 0.035% 0.18% 0.16% 2.05% 4.50% 6.55%
40 4.40% 5.60% 0.095% 0.058% 0.24% 0.22% 1.50% 4.50% 6.00%
45 4.30% 5.00% 0.200% 0.097% 0.39% 0.34% 0.85% 4.50% 5.35%
50 4.20% 5.00% 0.383% 0.158% 0.55% 0.50% 0.50% 4.50% 5.00%
55 4.20% 5.00% 0.538% 0.227% 0.90% 0.84% 0.10% 4.50% 4.60%
60 4.20% 5.00% 0.680% 0.345% 1.06% 0.94% 0.00% 4.50% 4.50%
65 4.20% 5.00% 1.061% 0.603% 1.08% 0.96% 0.00% 4.50% 4.50%
State Troopers
20 5.00% 5.00% 0.025% 0.015% 0.02% 0.02% 5.50% 4.50% 10.00%
25 5.00% 5.00% 0.030% 0.015% 0.08% 0.08% 3.75% 4.50% 8.25%
30 3.80% 3.80% 0.040% 0.025% 0.12% 0.12% 2.80% 4.50% 7.30%
35 2.50% 2.50% 0.055% 0.035% 0.40% 0.40% 2.05% 4.50% 6.55%
40 1.60% 1.60% 0.095% 0.058% 0.54% 0.54% 1.50% 4.50% 6.00%
45 1.10% 1.10% 0.200% 0.097% 0.86% 0.86% 1.20% 4.50% 5.70%
50 1.00% 1.00% 0.383% 0.158% 1.28% 1.28% 0.80% 4.50% 5.30%
55 1.00% 1.00% 0.538% 0.227% 1.85% 1.85% 0.40% 4.50% 4.90%
60 1.00% 1.00% 0.680% 0.345% 2.00% 2.00% 0.00% 4.50% 4.50%
65 1.00% 1.00% 1.061% 0.603% 2.00% 2.00% 0.00% 4.50% 4.50%
1 There are no select withdrawal assumptions for State Troopers.2 Rates are shown for healthy members. Separate disability mortality tables are used for disabled retirees.
SEPARATIONS FROM EMPLOYMENT BEFORE RETIREMENT AND INDIVIDUAL PAY INCREASE ASSUMPTIONS
EXHIBIT A—STATE DIVISION
PERCENT OF MEMBERS PAY INCREASE ASSUMPTIONS FORSEPARATING WITHIN THE NEXT YEAR AN INDIVIDUAL MEMBER
MERIT INFLATION TOTALULTIMATE WITHDRAWAL1 DEATH2 DISABILITY AND AND INCREASE
SAMPLE AGES MALE FEMALE MALE FEMALE MALE FEMALE SENIORITY PRODUCTIVITY (NEXT YEAR)
20 21.00% 18.00% 0.025% 0.015% 0.01% 0.01% 6.20% 4.50% 10.70%
25 7.63% 8.99% 0.030% 0.015% 0.01% 0.02% 4.10% 4.50% 8.60%
30 5.24% 7.79% 0.040% 0.025% 0.01% 0.03% 2.95% 4.50% 7.45%
35 4.36% 6.80% 0.055% 0.035% 0.04% 0.05% 2.50% 4.50% 7.00%
40 3.59% 5.40% 0.095% 0.058% 0.11% 0.08% 1.95% 4.50% 6.45%
45 3.27% 5.00% 0.200% 0.097% 0.18% 0.11% 1.35% 4.50% 5.85%
50 3.90% 4.60% 0.383% 0.158% 0.30% 0.20% 0.80% 4.50% 5.30%
55 3.90% 4.60% 0.538% 0.227% 0.55% 0.36% 0.35% 4.50% 4.85%
60 3.90% 4.60% 0.680% 0.345% 0.70% 0.40% 0.00% 4.50% 4.50%
65 3.90% 4.60% 1.061% 0.603% 0.70% 0.40% 0.00% 4.50% 4.50%
1 Rates are shown for healthy members. Separate disability mortality tables are used for disabled retirees.
EXHIBIT B—SCHOOL DIVISION
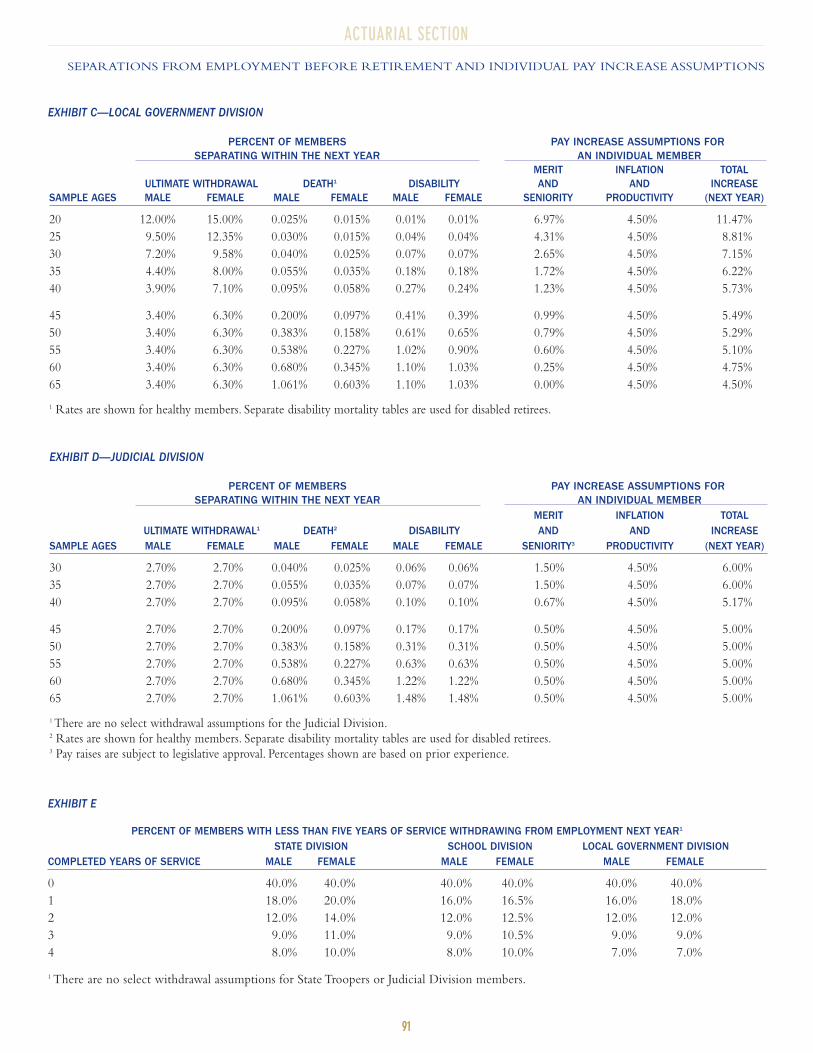
ACTUARIAL SECTION
91
SEPARATIONS FROM EMPLOYMENT BEFORE RETIREMENT AND INDIVIDUAL PAY INCREASE ASSUMPTIONS
PERCENT OF MEMBERS PAY INCREASE ASSUMPTIONS FORSEPARATING WITHIN THE NEXT YEAR AN INDIVIDUAL MEMBER
MERIT INFLATION TOTALULTIMATE WITHDRAWAL DEATH1 DISABILITY AND AND INCREASE
SAMPLE AGES MALE FEMALE MALE FEMALE MALE FEMALE SENIORITY PRODUCTIVITY (NEXT YEAR)
20 12.00% 15.00% 0.025% 0.015% 0.01% 0.01% 6.97% 4.50% 11.47%
25 9.50% 12.35% 0.030% 0.015% 0.04% 0.04% 4.31% 4.50% 8.81%
30 7.20% 9.58% 0.040% 0.025% 0.07% 0.07% 2.65% 4.50% 7.15%
35 4.40% 8.00% 0.055% 0.035% 0.18% 0.18% 1.72% 4.50% 6.22%
40 3.90% 7.10% 0.095% 0.058% 0.27% 0.24% 1.23% 4.50% 5.73%
45 3.40% 6.30% 0.200% 0.097% 0.41% 0.39% 0.99% 4.50% 5.49%
50 3.40% 6.30% 0.383% 0.158% 0.61% 0.65% 0.79% 4.50% 5.29%
55 3.40% 6.30% 0.538% 0.227% 1.02% 0.90% 0.60% 4.50% 5.10%
60 3.40% 6.30% 0.680% 0.345% 1.10% 1.03% 0.25% 4.50% 4.75%
65 3.40% 6.30% 1.061% 0.603% 1.10% 1.03% 0.00% 4.50% 4.50%
1 Rates are shown for healthy members. Separate disability mortality tables are used for disabled retirees.
EXHIBIT C—LOCAL GOVERNMENT DIVISION
EXHIBIT D—JUDICIAL DIVISION
PERCENT OF MEMBERS PAY INCREASE ASSUMPTIONS FORSEPARATING WITHIN THE NEXT YEAR AN INDIVIDUAL MEMBER
MERIT INFLATION TOTALULTIMATE WITHDRAWAL1 DEATH2 DISABILITY AND AND INCREASE
SAMPLE AGES MALE FEMALE MALE FEMALE MALE FEMALE SENIORITY3 PRODUCTIVITY (NEXT YEAR)
30 2.70% 2.70% 0.040% 0.025% 0.06% 0.06% 1.50% 4.50% 6.00%
35 2.70% 2.70% 0.055% 0.035% 0.07% 0.07% 1.50% 4.50% 6.00%
40 2.70% 2.70% 0.095% 0.058% 0.10% 0.10% 0.67% 4.50% 5.17%
45 2.70% 2.70% 0.200% 0.097% 0.17% 0.17% 0.50% 4.50% 5.00%
50 2.70% 2.70% 0.383% 0.158% 0.31% 0.31% 0.50% 4.50% 5.00%
55 2.70% 2.70% 0.538% 0.227% 0.63% 0.63% 0.50% 4.50% 5.00%
60 2.70% 2.70% 0.680% 0.345% 1.22% 1.22% 0.50% 4.50% 5.00%
65 2.70% 2.70% 1.061% 0.603% 1.48% 1.48% 0.50% 4.50% 5.00%
1 There are no select withdrawal assumptions for the Judicial Division.2 Rates are shown for healthy members. Separate disability mortality tables are used for disabled retirees.3 Pay raises are subject to legislative approval. Percentages shown are based on prior experience.
PERCENT OF MEMBERS WITH LESS THAN FIVE YEARS OF SERVICE WITHDRAWING FROM EMPLOYMENT NEXT YEAR1
STATE DIVISION SCHOOL DIVISION LOCAL GOVERNMENT DIVISIONCOMPLETED YEARS OF SERVICE MALE FEMALE MALE FEMALE MALE FEMALE
0 40.0% 40.0% 40.0% 40.0% 40.0% 40.0%
1 18.0% 20.0% 16.0% 16.5% 16.0% 18.0%
2 12.0% 14.0% 12.0% 12.5% 12.0% 12.0%
3 9.0% 11.0% 9.0% 10.5% 9.0% 9.0%
4 8.0% 10.0% 8.0% 10.0% 7.0% 7.0%
1 There are no select withdrawal assumptions for State Troopers or Judicial Division members.
EXHIBIT E
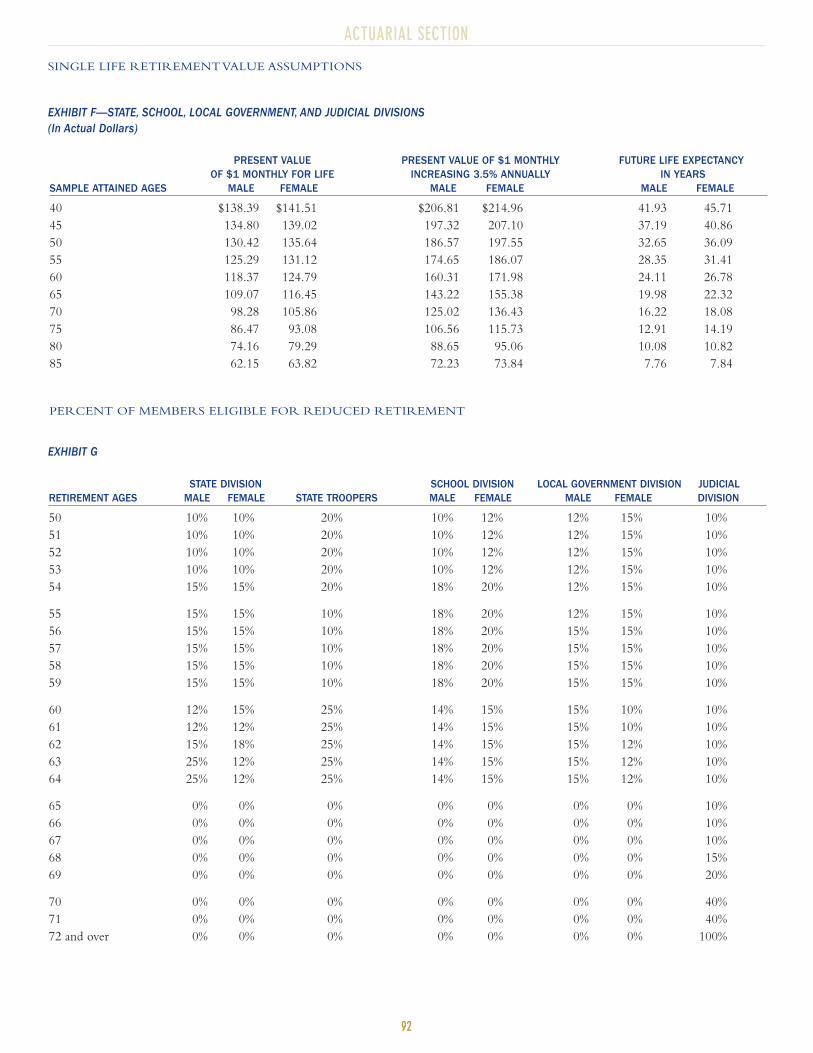
ACTUARIAL SECTION
92
SINGLE LIFE RETIREMENT VALUE ASSUMPTIONS
PRESENT VALUE PRESENT VALUE OF $1 MONTHLY FUTURE LIFE EXPECTANCYOF $1 MONTHLY FOR LIFE INCREASING 3.5% ANNUALLY IN YEARS
SAMPLE ATTAINED AGES MALE FEMALE MALE FEMALE MALE FEMALE
40 $138.39 $141.51 $206.81 $214.96 41.93 45.71
45 134.80 139.02 197.32 207.10 37.19 40.86
50 130.42 135.64 186.57 197.55 32.65 36.09
55 125.29 131.12 174.65 186.07 28.35 31.41
60 118.37 124.79 160.31 171.98 24.11 26.78
65 109.07 116.45 143.22 155.38 19.98 22.32
70 98.28 105.86 125.02 136.43 16.22 18.08
75 86.47 93.08 106.56 115.73 12.91 14.19
80 74.16 79.29 88.65 95.06 10.08 10.82
85 62.15 63.82 72.23 73.84 7.76 7.84
PERCENT OF MEMBERS ELIGIBLE FOR REDUCED RETIREMENT
STATE DIVISION SCHOOL DIVISION LOCAL GOVERNMENT DIVISION JUDICIALRETIREMENT AGES MALE FEMALE STATE TROOPERS MALE FEMALE MALE FEMALE DIVISION
50 10% 10% 20% 10% 12% 12% 15% 10%
51 10% 10% 20% 10% 12% 12% 15% 10%
52 10% 10% 20% 10% 12% 12% 15% 10%
53 10% 10% 20% 10% 12% 12% 15% 10%
54 15% 15% 20% 18% 20% 12% 15% 10%
55 15% 15% 10% 18% 20% 12% 15% 10%
56 15% 15% 10% 18% 20% 15% 15% 10%
57 15% 15% 10% 18% 20% 15% 15% 10%
58 15% 15% 10% 18% 20% 15% 15% 10%
59 15% 15% 10% 18% 20% 15% 15% 10%
60 12% 15% 25% 14% 15% 15% 10% 10%
61 12% 12% 25% 14% 15% 15% 10% 10%
62 15% 18% 25% 14% 15% 15% 12% 10%
63 25% 12% 25% 14% 15% 15% 12% 10%
64 25% 12% 25% 14% 15% 15% 12% 10%
65 0% 0% 0% 0% 0% 0% 0% 10%
66 0% 0% 0% 0% 0% 0% 0% 10%
67 0% 0% 0% 0% 0% 0% 0% 10%
68 0% 0% 0% 0% 0% 0% 0% 15%
69 0% 0% 0% 0% 0% 0% 0% 20%
70 0% 0% 0% 0% 0% 0% 0% 40%
71 0% 0% 0% 0% 0% 0% 0% 40%
72 and over 0% 0% 0% 0% 0% 0% 0% 100%
EXHIBIT F—STATE, SCHOOL, LOCAL GOVERNMENT, AND JUDICIAL DIVISIONS(In Actual Dollars)
EXHIBIT G
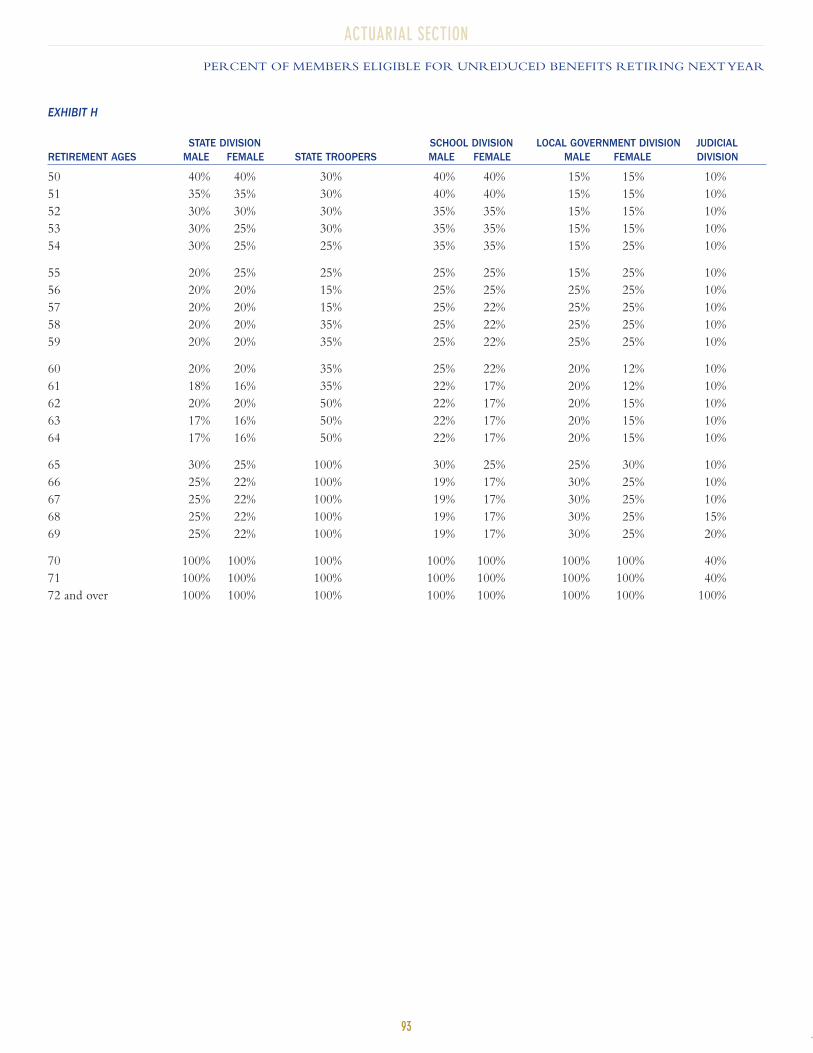
ACTUARIAL SECTION
93
PERCENT OF MEMBERS ELIGIBLE FOR UNREDUCED BENEFITS RETIRING NEXT YEAR
STATE DIVISION SCHOOL DIVISION LOCAL GOVERNMENT DIVISION JUDICIALRETIREMENT AGES MALE FEMALE STATE TROOPERS MALE FEMALE MALE FEMALE DIVISION
50 40% 40% 30% 40% 40% 15% 15% 10%
51 35% 35% 30% 40% 40% 15% 15% 10%
52 30% 30% 30% 35% 35% 15% 15% 10%
53 30% 25% 30% 35% 35% 15% 15% 10%
54 30% 25% 25% 35% 35% 15% 25% 10%
55 20% 25% 25% 25% 25% 15% 25% 10%
56 20% 20% 15% 25% 25% 25% 25% 10%
57 20% 20% 15% 25% 22% 25% 25% 10%
58 20% 20% 35% 25% 22% 25% 25% 10%
59 20% 20% 35% 25% 22% 25% 25% 10%
60 20% 20% 35% 25% 22% 20% 12% 10%
61 18% 16% 35% 22% 17% 20% 12% 10%
62 20% 20% 50% 22% 17% 20% 15% 10%
63 17% 16% 50% 22% 17% 20% 15% 10%
64 17% 16% 50% 22% 17% 20% 15% 10%
65 30% 25% 100% 30% 25% 25% 30% 10%
66 25% 22% 100% 19% 17% 30% 25% 10%
67 25% 22% 100% 19% 17% 30% 25% 10%
68 25% 22% 100% 19% 17% 30% 25% 15%
69 25% 22% 100% 19% 17% 30% 25% 20%
70 100% 100% 100% 100% 100% 100% 100% 40%
71 100% 100% 100% 100% 100% 100% 100% 40%
72 and over 100% 100% 100% 100% 100% 100% 100% 100%
EXHIBIT H
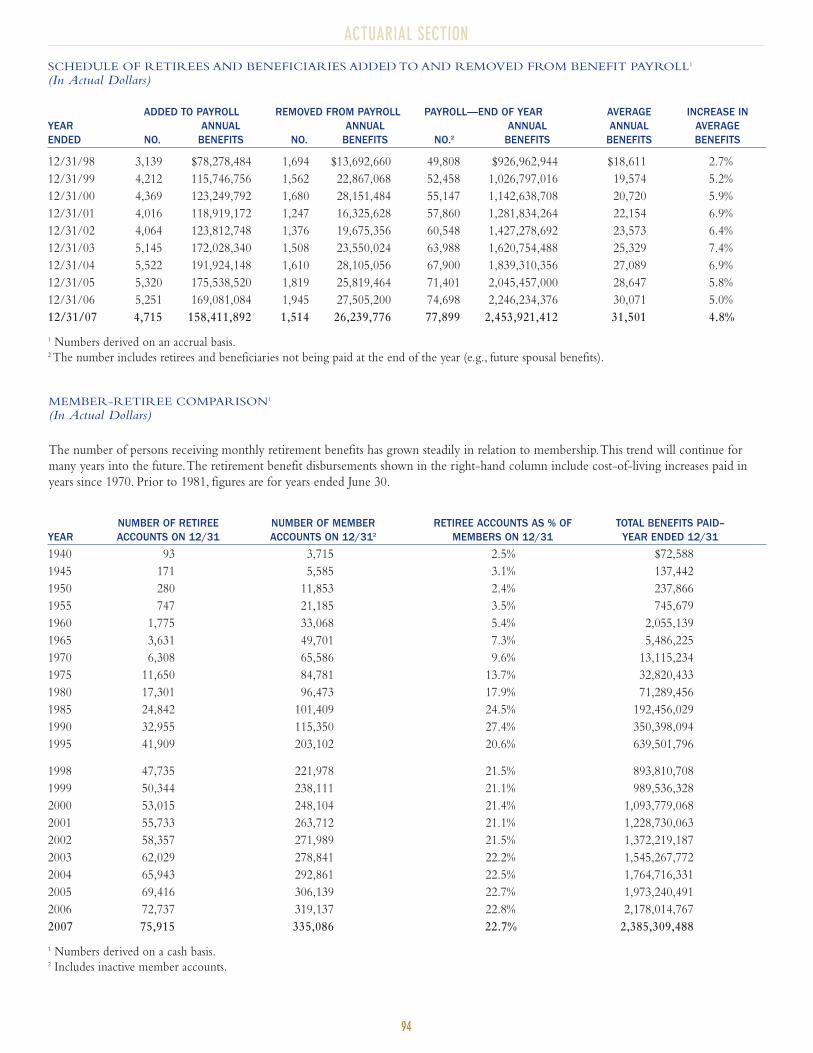
ACTUARIAL SECTION
94
SCHEDULE OF RETIREES AND BENEFICIARIES ADDED TO AND REMOVED FROM BENEFIT PAYROLL1
(In Actual Dollars)
ADDED TO PAYROLL REMOVED FROM PAYROLL PAYROLL—END OF YEAR AVERAGE INCREASE INYEAR ANNUAL ANNUAL ANNUAL ANNUAL AVERAGEENDED NO. BENEFITS NO. BENEFITS NO.2 BENEFITS BENEFITS BENEFITS
12/31/98 3,139 $78,278,484 1,694 $13,692,660 49,808 $926,962,944 $18,611 2.7%
12/31/99 4,212 115,746,756 1,562 22,867,068 52,458 1,026,797,016 19,574 5.2%
12/31/00 4,369 123,249,792 1,680 28,151,484 55,147 1,142,638,708 20,720 5.9%
12/31/01 4,016 118,919,172 1,247 16,325,628 57,860 1,281,834,264 22,154 6.9%
12/31/02 4,064 123,812,748 1,376 19,675,356 60,548 1,427,278,692 23,573 6.4%
12/31/03 5,145 172,028,340 1,508 23,550,024 63,988 1,620,754,488 25,329 7.4%
12/31/04 5,522 191,924,148 1,610 28,105,056 67,900 1,839,310,356 27,089 6.9%
12/31/05 5,320 175,538,520 1,819 25,819,464 71,401 2,045,457,000 28,647 5.8%
12/31/06 5,251 169,081,084 1,945 27,505,200 74,698 2,246,234,376 30,071 5.0%
12/31/07 4,715 158,411,892 1,514 26,239,776 77,899 2,453,921,412 31,501 4.8%
1 Numbers derived on an accrual basis.2 The number includes retirees and beneficiaries not being paid at the end of the year (e.g., future spousal benefits).
The number of persons receiving monthly retirement benefits has grown steadily in relation to membership.This trend will continue for
many years into the future.The retirement benefit disbursements shown in the right-hand column include cost-of-living increases paid in
years since 1970. Prior to 1981, figures are for years ended June 30.
MEMBER-RETIREE COMPARISON1
(In Actual Dollars)
NUMBER OF RETIREE NUMBER OF MEMBER RETIREE ACCOUNTS AS % OF TOTAL BENEFITS PAID–YEAR ACCOUNTS ON 12/31 ACCOUNTS ON 12/312 MEMBERS ON 12/31 YEAR ENDED 12/31
1940 93 3,715 2.5% $72,588
1945 171 5,585 3.1% 137,442
1950 280 11,853 2.4% 237,866
1955 747 21,185 3.5% 745,679
1960 1,775 33,068 5.4% 2,055,139
1965 3,631 49,701 7.3% 5,486,225
1970 6,308 65,586 9.6% 13,115,234
1975 11,650 84,781 13.7% 32,820,433
1980 17,301 96,473 17.9% 71,289,456
1985 24,842 101,409 24.5% 192,456,029
1990 32,955 115,350 27.4% 350,398,094
1995 41,909 203,102 20.6% 639,501,796
1998 47,735 221,978 21.5% 893,810,708
1999 50,344 238,111 21.1% 989,536,328
2000 53,015 248,104 21.4% 1,093,779,068
2001 55,733 263,712 21.1% 1,228,730,063
2002 58,357 271,989 21.5% 1,372,219,187
2003 62,029 278,841 22.2% 1,545,267,772
2004 65,943 292,861 22.5% 1,764,716,331
2005 69,416 306,139 22.7% 1,973,240,491
2006 72,737 319,137 22.8% 2,178,014,767
2007 75,915 335,086 22.7% 2,385,309,488
1 Numbers derived on a cash basis.2 Includes inactive member accounts.
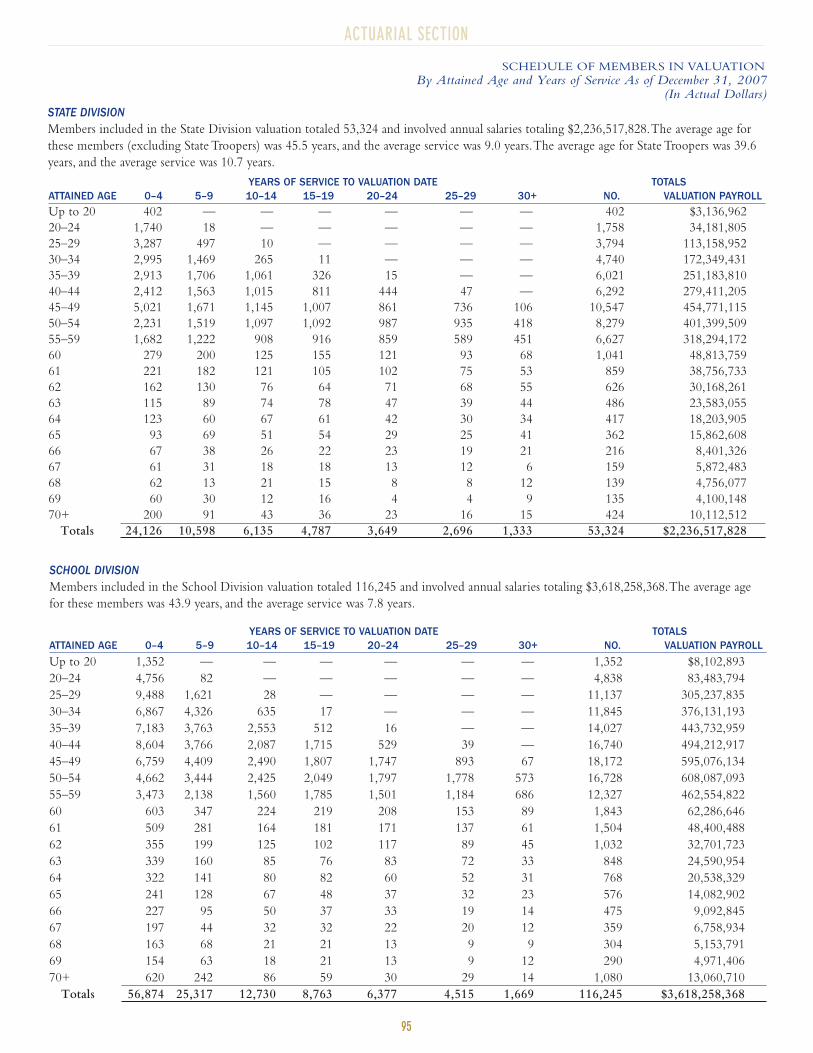
ACTUARIAL SECTION
95
SCHEDULE OF MEMBERS IN VALUATION
By Attained Age and Years of Service As of December 31, 2007(In Actual Dollars)
STATE DIVISIONMembers included in the State Division valuation totaled 53,324 and involved annual salaries totaling $2,236,517,828.The average age for
these members (excluding State Troopers) was 45.5 years, and the average service was 9.0 years.The average age for State Troopers was 39.6
years, and the average service was 10.7 years.
SCHOOL DIVISIONMembers included in the School Division valuation totaled 116,245 and involved annual salaries totaling $3,618,258,368.The average age
for these members was 43.9 years, and the average service was 7.8 years.
YEARS OF SERVICE TO VALUATION DATE TOTALSATTAINED AGE 0–4 5–9 10–14 15–19 20–24 25–29 30+ NO. VALUATION PAYROLLUp to 20 402 — — — — — — 402 $3,136,962
20–24 1,740 18 — — — — — 1,758 34,181,805
25–29 3,287 497 10 — — — — 3,794 113,158,952
30–34 2,995 1,469 265 11 — — — 4,740 172,349,431
35–39 2,913 1,706 1,061 326 15 — — 6,021 251,183,810
40–44 2,412 1,563 1,015 811 444 47 — 6,292 279,411,205
45–49 5,021 1,671 1,145 1,007 861 736 106 10,547 454,771,115
50–54 2,231 1,519 1,097 1,092 987 935 418 8,279 401,399,509
55–59 1,682 1,222 908 916 859 589 451 6,627 318,294,172
60 279 200 125 155 121 93 68 1,041 48,813,759
61 221 182 121 105 102 75 53 859 38,756,733
62 162 130 76 64 71 68 55 626 30,168,261
63 115 89 74 78 47 39 44 486 23,583,055
64 123 60 67 61 42 30 34 417 18,203,905
65 93 69 51 54 29 25 41 362 15,862,608
66 67 38 26 22 23 19 21 216 8,401,326
67 61 31 18 18 13 12 6 159 5,872,483
68 62 13 21 15 8 8 12 139 4,756,077
69 60 30 12 16 4 4 9 135 4,100,148
70+ 200 91 43 36 23 16 15 424 10,112,512
Totals 24,126 10,598 6,135 4,787 3,649 2,696 1,333 53,324 $2,236,517,828
YEARS OF SERVICE TO VALUATION DATE TOTALSATTAINED AGE 0–4 5–9 10–14 15–19 20–24 25–29 30+ NO. VALUATION PAYROLL
Up to 20 1,352 — — — — — — 1,352 $8,102,893
20–24 4,756 82 — — — — — 4,838 83,483,794
25–29 9,488 1,621 28 — — — — 11,137 305,237,835
30–34 6,867 4,326 635 17 — — — 11,845 376,131,193
35–39 7,183 3,763 2,553 512 16 — — 14,027 443,732,959
40–44 8,604 3,766 2,087 1,715 529 39 — 16,740 494,212,917
45–49 6,759 4,409 2,490 1,807 1,747 893 67 18,172 595,076,134
50–54 4,662 3,444 2,425 2,049 1,797 1,778 573 16,728 608,087,093
55–59 3,473 2,138 1,560 1,785 1,501 1,184 686 12,327 462,554,822
60 603 347 224 219 208 153 89 1,843 62,286,646
61 509 281 164 181 171 137 61 1,504 48,400,488
62 355 199 125 102 117 89 45 1,032 32,701,723
63 339 160 85 76 83 72 33 848 24,590,954
64 322 141 80 82 60 52 31 768 20,538,329
65 241 128 67 48 37 32 23 576 14,082,902
66 227 95 50 37 33 19 14 475 9,092,845
67 197 44 32 32 22 20 12 359 6,758,934
68 163 68 21 21 13 9 9 304 5,153,791
69 154 63 18 21 13 9 12 290 4,971,406
70+ 620 242 86 59 30 29 14 1,080 13,060,710
Totals 56,874 25,317 12,730 8,763 6,377 4,515 1,669 116,245 $3,618,258,368
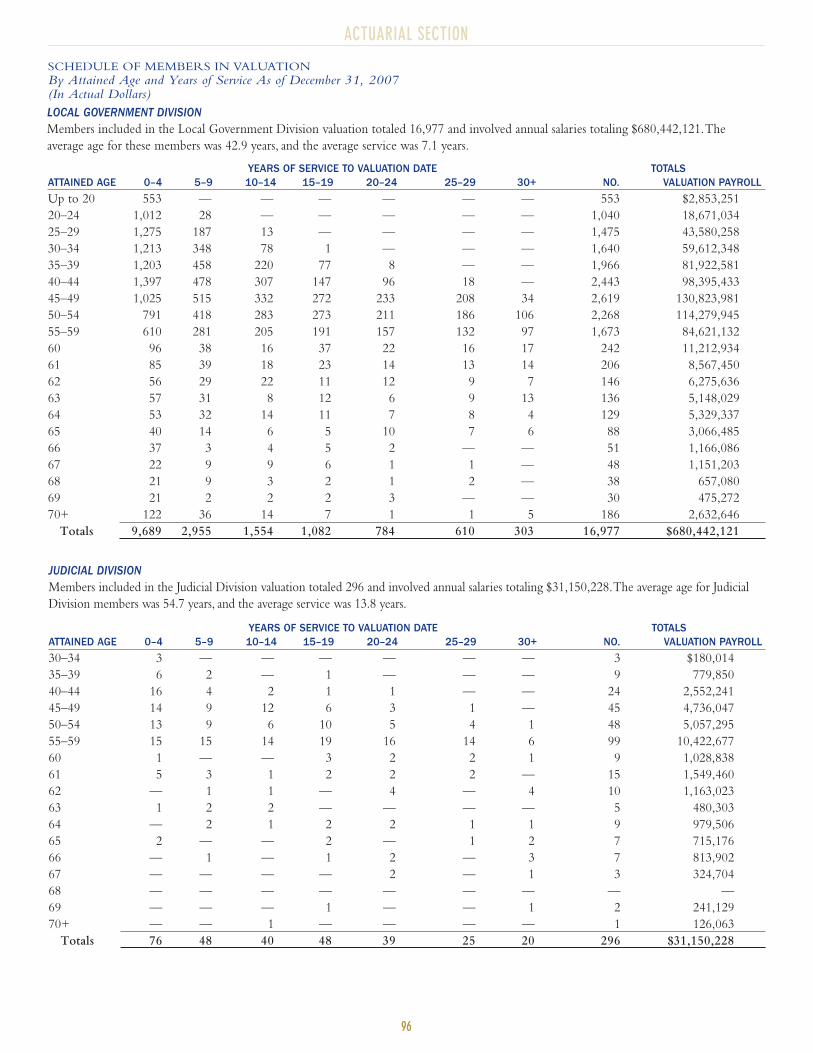
ACTUARIAL SECTION
96
SCHEDULE OF MEMBERS IN VALUATION
By Attained Age and Years of Service As of December 31, 2007(In Actual Dollars)
LOCAL GOVERNMENT DIVISIONMembers included in the Local Government Division valuation totaled 16,977 and involved annual salaries totaling $680,442,121.The
average age for these members was 42.9 years, and the average service was 7.1 years.
JUDICIAL DIVISIONMembers included in the Judicial Division valuation totaled 296 and involved annual salaries totaling $31,150,228.The average age for Judicial
Division members was 54.7 years, and the average service was 13.8 years.
YEARS OF SERVICE TO VALUATION DATE TOTALSATTAINED AGE 0–4 5–9 10–14 15–19 20–24 25–29 30+ NO. VALUATION PAYROLL
Up to 20 553 — — — — — — 553 $2,853,251
20–24 1,012 28 — — — — — 1,040 18,671,034
25–29 1,275 187 13 — — — — 1,475 43,580,258
30–34 1,213 348 78 1 — — — 1,640 59,612,348
35–39 1,203 458 220 77 8 — — 1,966 81,922,581
40–44 1,397 478 307 147 96 18 — 2,443 98,395,433
45–49 1,025 515 332 272 233 208 34 2,619 130,823,981
50–54 791 418 283 273 211 186 106 2,268 114,279,945
55–59 610 281 205 191 157 132 97 1,673 84,621,132
60 96 38 16 37 22 16 17 242 11,212,934
61 85 39 18 23 14 13 14 206 8,567,450
62 56 29 22 11 12 9 7 146 6,275,636
63 57 31 8 12 6 9 13 136 5,148,029
64 53 32 14 11 7 8 4 129 5,329,337
65 40 14 6 5 10 7 6 88 3,066,485
66 37 3 4 5 2 — — 51 1,166,086
67 22 9 9 6 1 1 — 48 1,151,203
68 21 9 3 2 1 2 — 38 657,080
69 21 2 2 2 3 — — 30 475,272
70+ 122 36 14 7 1 1 5 186 2,632,646
Totals 9,689 2,955 1,554 1,082 784 610 303 16,977 $680,442,121
YEARS OF SERVICE TO VALUATION DATE TOTALSATTAINED AGE 0–4 5–9 10–14 15–19 20–24 25–29 30+ NO. VALUATION PAYROLL
30–34 3 — — — — — — 3 $180,014
35–39 6 2 — 1 — — — 9 779,850
40–44 16 4 2 1 1 — — 24 2,552,241
45–49 14 9 12 6 3 1 — 45 4,736,047
50–54 13 9 6 10 5 4 1 48 5,057,295
55–59 15 15 14 19 16 14 6 99 10,422,677
60 1 — — 3 2 2 1 9 1,028,838
61 5 3 1 2 2 2 — 15 1,549,460
62 — 1 1 — 4 — 4 10 1,163,023
63 1 2 2 — — — — 5 480,303
64 — 2 1 2 2 1 1 9 979,506
65 2 — — 2 — 1 2 7 715,176
66 — 1 — 1 2 — 3 7 813,902
67 — — — — 2 — 1 3 324,704
68 — — — — — — — — —
69 — — — 1 — — 1 2 241,129
70+ — — 1 — — — — 1 126,063
Totals 76 48 40 48 39 25 20 296 $31,150,228
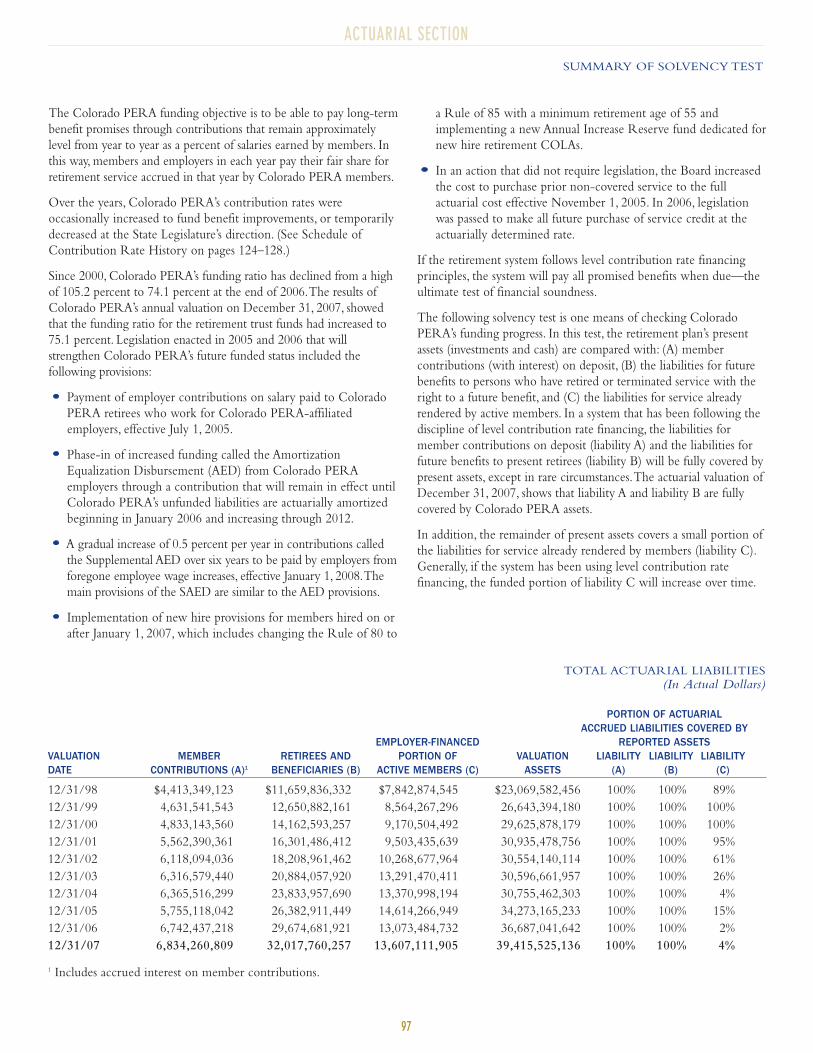
ACTUARIAL SECTION
97
SUMMARY OF SOLVENCY TEST
The Colorado PERA funding objective is to be able to pay long-term
benefit promises through contributions that remain approximately
level from year to year as a percent of salaries earned by members. In
this way, members and employers in each year pay their fair share for
retirement service accrued in that year by Colorado PERA members.
Over the years, Colorado PERA’s contribution rates were
occasionally increased to fund benefit improvements, or temporarily
decreased at the State Legislature’s direction. (See Schedule of
Contribution Rate History on pages 124–128.)
Since 2000, Colorado PERA’s funding ratio has declined from a high
of 105.2 percent to 74.1 percent at the end of 2006.The results of
Colorado PERA’s annual valuation on December 31, 2007, showed
that the funding ratio for the retirement trust funds had increased to
75.1 percent. Legislation enacted in 2005 and 2006 that will
strengthen Colorado PERA’s future funded status included the
following provisions:
Payment of employer contributions on salary paid to Colorado
PERA retirees who work for Colorado PERA-affiliated
employers, effective July 1, 2005.
Phase-in of increased funding called the Amortization
Equalization Disbursement (AED) from Colorado PERA
employers through a contribution that will remain in effect until
Colorado PERA’s unfunded liabilities are actuarially amortized
beginning in January 2006 and increasing through 2012.
A gradual increase of 0.5 percent per year in contributions called
the Supplemental AED over six years to be paid by employers from
foregone employee wage increases, effective January 1, 2008.The
main provisions of the SAED are similar to the AED provisions.
Implementation of new hire provisions for members hired on or
after January 1, 2007, which includes changing the Rule of 80 to
a Rule of 85 with a minimum retirement age of 55 and
implementing a new Annual Increase Reserve fund dedicated for
new hire retirement COLAs.
In an action that did not require legislation, the Board increased
the cost to purchase prior non-covered service to the full
actuarial cost effective November 1, 2005. In 2006, legislation
was passed to make all future purchase of service credit at the
actuarially determined rate.
If the retirement system follows level contribution rate financing
principles, the system will pay all promised benefits when due—the
ultimate test of financial soundness.
The following solvency test is one means of checking Colorado
PERA’s funding progress. In this test, the retirement plan’s present
assets (investments and cash) are compared with: (A) member
contributions (with interest) on deposit, (B) the liabilities for future
benefits to persons who have retired or terminated service with the
right to a future benefit, and (C) the liabilities for service already
rendered by active members. In a system that has been following the
discipline of level contribution rate financing, the liabilities for
member contributions on deposit (liability A) and the liabilities for
future benefits to present retirees (liability B) will be fully covered by
present assets, except in rare circumstances.The actuarial valuation of
December 31, 2007, shows that liability A and liability B are fully
covered by Colorado PERA assets.
In addition, the remainder of present assets covers a small portion of
the liabilities for service already rendered by members (liability C).
Generally, if the system has been using level contribution rate
financing, the funded portion of liability C will increase over time.
TOTAL ACTUARIAL LIABILITIES
(In Actual Dollars)
PORTION OF ACTUARIALACCRUED LIABILITIES COVERED BY
EMPLOYER-FINANCED REPORTED ASSETSVALUATION MEMBER RETIREES AND PORTION OF VALUATION LIABILITY LIABILITY LIABILITYDATE CONTRIBUTIONS (A)1 BENEFICIARIES (B) ACTIVE MEMBERS (C) ASSETS (A) (B) (C)
12/31/98 $4,413,349,123 $11,659,836,332 $7,842,874,545 $23,069,582,456 100% 100% 89%
12/31/99 4,631,541,543 12,650,882,161 8,564,267,296 26,643,394,180 100% 100% 100%
12/31/00 4,833,143,560 14,162,593,257 9,170,504,492 29,625,878,179 100% 100% 100%
12/31/01 5,562,390,361 16,301,486,412 9,503,435,639 30,935,478,756 100% 100% 95%
12/31/02 6,118,094,036 18,208,961,462 10,268,677,964 30,554,140,114 100% 100% 61%
12/31/03 6,316,579,440 20,884,057,920 13,291,470,411 30,596,661,957 100% 100% 26%
12/31/04 6,365,516,299 23,833,957,690 13,370,998,194 30,755,462,303 100% 100% 4%
12/31/05 5,755,118,042 26,382,911,449 14,614,266,949 34,273,165,233 100% 100% 15%
12/31/06 6,742,437,218 29,674,681,921 13,073,484,732 36,687,041,642 100% 100% 2%
12/31/07 6,834,260,809 32,017,760,257 13,607,111,905 39,415,525,136 100% 100% 4%
1 Includes accrued interest on member contributions.
ACTUARIAL SECTION
98
SUMMARY OF UNFUNDED/(OVERFUNDED) ACTUARIAL ACCRUED LIABILITIES
Unfunded/(overfunded) actuarial accrued liabilities are the
difference between actuarially calculated liabilities for service already
rendered and the assets of the retirement fund. It is natural for
unfunded liabilities to exist for Colorado PERA and other defined
benefit retirement plans.
The ratio of Colorado PERA’s assets to accrued liabilities exceeded 100
percent for the first time on December 31, 1999, and again exceeded
100 percent in 2000. However, the ratio fell to a recent low of 71
percent in 2004. In 2007, the funded ratio increased to 75 percent.
The increase (or gains) in the 2007 funded status over 2006 can be
attributed mainly to the following factors:
Recognition of investment gains experienced from 2005–2007.
Fewer members retired with a disability retirement than assumed.
Current retirees are not living as long as expected.
Health care claims were less than expected.
The following factors resulted in higher liabilities (or losses) to
Colorado PERA during 2007:
Fewer members terminated Colorado PERA-covered
employment and withdrew their accounts than had been
assumed during 2007, increasing future liabilities.
New Colorado PERA members had some service resulting in
accrued liabilities.
Members retired at earlier ages during 2007 than had been assumed.
Member pay increases were higher than expected.
Effective November 1, 2005, the cost to purchase non-covered service
was increased to the actuarial cost, further limiting the plan’s liabilities
going forward. Legislation passed and signed into law in 2003 limited
the number of years for non-covered service to a total of 10 years.
Legislation supported by the Board in 2004, 2005, and 2006 contained
moderate and balanced provisions that improve Colorado PERA’s
financial soundness.A brief description of this legislation follows:
Senate Bill 04-132 (“Modification of Existing Benefit Plans for
Colorado PERA Members”) as amended was signed by Governor
Owens.The bill contained the following provisions that went into
effect during 2005:
Reduced the annual post-retirement increase to the lower of 3
percent or the actual increase in the Consumer Price Index for
new employees hired on or after July 1, 2005.
Eliminated the unreduced service retirement eligibility
requirement at age 50 with 30 or more years of service, for new
employees hired on or after July 1, 2005.
Senate Bill 04-257 (“Modifications to Retirement Plans for Public
Employees”) as amended was signed by Governor Owens and
included provisions that will phase-in increased funding from
Colorado PERA employers with an amortization equalization
disbursement beginning in January 2006 through 2012.The bill also
required employer contributions on salary paid to Colorado PERA
retirees who return to work for Colorado PERA-affiliated employers.
Senate Bill 05-73 (“Employment After Retirement for Colorado
PERA Retirees”) was signed by Governor Owens and ensured that the
amortization equalization disbursement will be paid by employers on
the salary they pay to Colorado PERA retirees. SB 05-73 also provides
for employer contributions to be paid on compensation paid to
Colorado PERA retirees who are working as independent contractors
or in certain other arrangements, and who are performing services for
Colorado PERA employers.
Senate Bill 06-235 (“Concerning Public Employees’ Retirement
Benefit Plans”) was signed by Governor Owens on May 25, 2006.
This legislation provided the following:
Added a supplemental amortization equalization disbursement
payment that is slated to come from salary increases that would
have otherwise been awarded to employees over a six–year
period.The collection of 0.5 percent of salaries is scheduled to
begin on January 1, 2008.
Modified retirement provisions for new employees hired on or
after January 1, 2007.
Specified a 30–year amortization period in statute.
Required that an actuarial study be commissioned by the General
Assembly before any benefit enhancements can be made.
Modified the structure of the Colorado PERA Board of Trustees.
Expanded defined contribution and defined benefit choice to
new employees of institutions of higher education who did not
previously have access to both types of plans.
Benefits to retirees are fully funded, that is, assets reserved for
benefits currently being paid equal liabilities for those benefits.
Liabilities for members are based on service rendered toward their
retirement benefits payable in the future. Unfunded actuarial
accrued liabilities exist because liabilities for such service by
members exceed assets currently on hand for such future benefits.
Since inflation decreases the dollar’s value, it is important to examine
more than only the dollar amounts of assets, benefits paid, member
salaries, and unfunded/(overfunded) actuarial accrued liabilities when
assessing the plan’s financial status.The ratio of unfunded/(overfunded)
actuarial accrued liability dollars divided by member salary dollars can
provide a meaningful index.The smaller the ratio, the stronger the
system. Observation of this relative index over a period of years will
give an indication of the financial strength of the system.This ratio has
decreased at times over the last decade, but increased sharply in years
2002 through 2004.This increase reflects the poor investment
environment of 2001 and 2002, as well as increased liabilities.The
UAAL/OAAL as a percent of member salaries was reduced in 2007,
which is evidence of a moderation in Colorado PERA’s liabilities and
recognition of investment gains in the past few years.
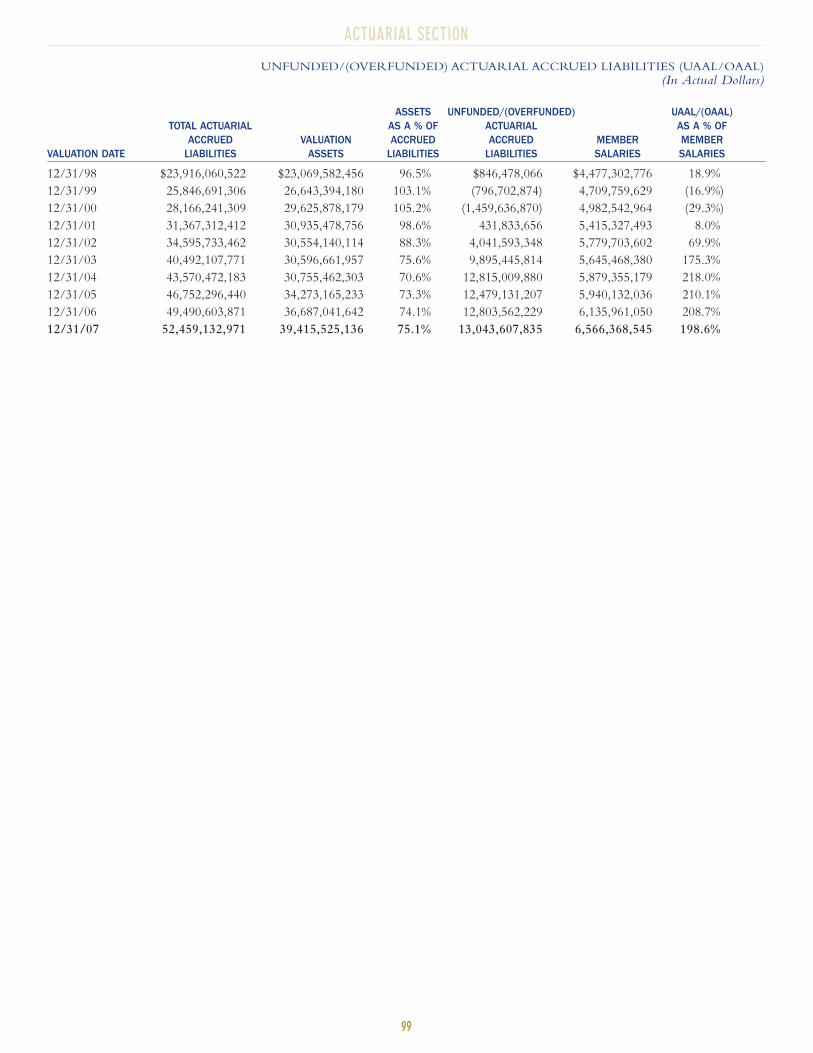
ACTUARIAL SECTION
99
UNFUNDED/(OVERFUNDED) ACTUARIAL ACCRUED LIABILITIES (UAAL/OAAL)
(In Actual Dollars)
ASSETS UNFUNDED/(OVERFUNDED) UAAL/(OAAL)TOTAL ACTUARIAL AS A % OF ACTUARIAL AS A % OF
ACCRUED VALUATION ACCRUED ACCRUED MEMBER MEMBERVALUATION DATE LIABILITIES ASSETS LIABILITIES LIABILITIES SALARIES SALARIES
12/31/98 $23,916,060,522 $23,069,582,456 96.5% $846,478,066 $4,477,302,776 18.9%
12/31/99 25,846,691,306 26,643,394,180 103.1% (796,702,874) 4,709,759,629 (16.9%)
12/31/00 28,166,241,309 29,625,878,179 105.2% (1,459,636,870) 4,982,542,964 (29.3%)
12/31/01 31,367,312,412 30,935,478,756 98.6% 431,833,656 5,415,327,493 8.0%
12/31/02 34,595,733,462 30,554,140,114 88.3% 4,041,593,348 5,779,703,602 69.9%
12/31/03 40,492,107,771 30,596,661,957 75.6% 9,895,445,814 5,645,468,380 175.3%
12/31/04 43,570,472,183 30,755,462,303 70.6% 12,815,009,880 5,879,355,179 218.0%
12/31/05 46,752,296,440 34,273,165,233 73.3% 12,479,131,207 5,940,132,036 210.1%
12/31/06 49,490,603,871 36,687,041,642 74.1% 12,803,562,229 6,135,961,050 208.7%
12/31/07 52,459,132,971 39,415,525,136 75.1% 13,043,607,835 6,566,368,545 198.6%
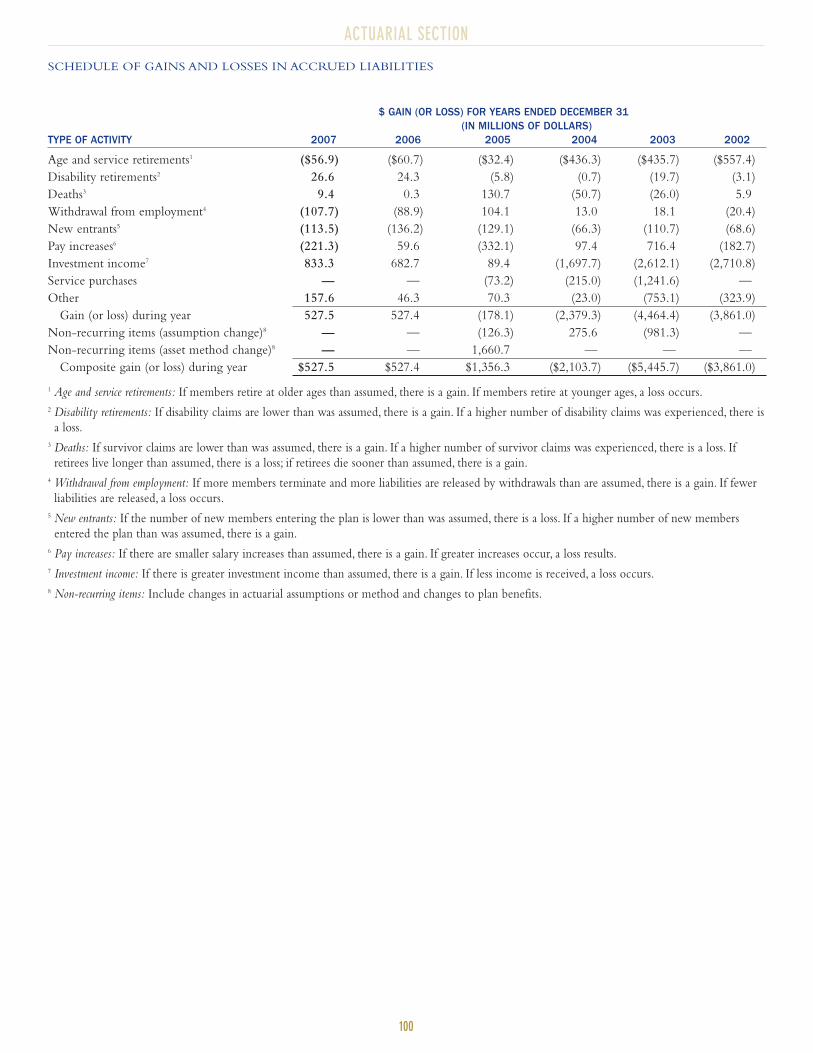
ACTUARIAL SECTION
100
SCHEDULE OF GAINS AND LOSSES IN ACCRUED LIABILITIES
$ GAIN (OR LOSS) FOR YEARS ENDED DECEMBER 31(IN MILLIONS OF DOLLARS)
TYPE OF ACTIVITY 2007 2006 2005 2004 2003 2002
Age and service retirements1 ($56.9) ($60.7) ($32.4) ($436.3) ($435.7) ($557.4)
Disability retirements2 26.6 24.3 (5.8) (0.7) (19.7) (3.1)
Deaths3 9.4 0.3 130.7 (50.7) (26.0) 5.9
Withdrawal from employment4 (107.7) (88.9) 104.1 13.0 18.1 (20.4)
New entrants5 (113.5) (136.2) (129.1) (66.3) (110.7) (68.6)
Pay increases6 (221.3) 59.6 (332.1) 97.4 716.4 (182.7)
Investment income7 833.3 682.7 89.4 (1,697.7) (2,612.1) (2,710.8)
Service purchases — — (73.2) (215.0) (1,241.6) —
Other 157.6 46.3 70.3 (23.0) (753.1) (323.9)
Gain (or loss) during year 527.5 527.4 (178.1) (2,379.3) (4,464.4) (3,861.0)
Non-recurring items (assumption change)8 — — (126.3) 275.6 (981.3) —
Non-recurring items (asset method change)8 — — 1,660.7 — — —
Composite gain (or loss) during year $527.5 $527.4 $1,356.3 ($2,103.7) ($5,445.7) ($3,861.0)
1 Age and service retirements: If members retire at older ages than assumed, there is a gain. If members retire at younger ages, a loss occurs.
2 Disability retirements: If disability claims are lower than was assumed, there is a gain. If a higher number of disability claims was experienced, there is
a loss.
3 Deaths: If survivor claims are lower than was assumed, there is a gain. If a higher number of survivor claims was experienced, there is a loss. If
retirees live longer than assumed, there is a loss; if retirees die sooner than assumed, there is a gain.
4 Withdrawal from employment: If more members terminate and more liabilities are released by withdrawals than are assumed, there is a gain. If fewer
liabilities are released, a loss occurs.
5 New entrants: If the number of new members entering the plan is lower than was assumed, there is a loss. If a higher number of new members
entered the plan than was assumed, there is a gain.
6 Pay increases: If there are smaller salary increases than assumed, there is a gain. If greater increases occur, a loss results.
7 Investment income: If there is greater investment income than assumed, there is a gain. If less income is received, a loss occurs.
8 Non-recurring items: Include changes in actuarial assumptions or method and changes to plan benefits.
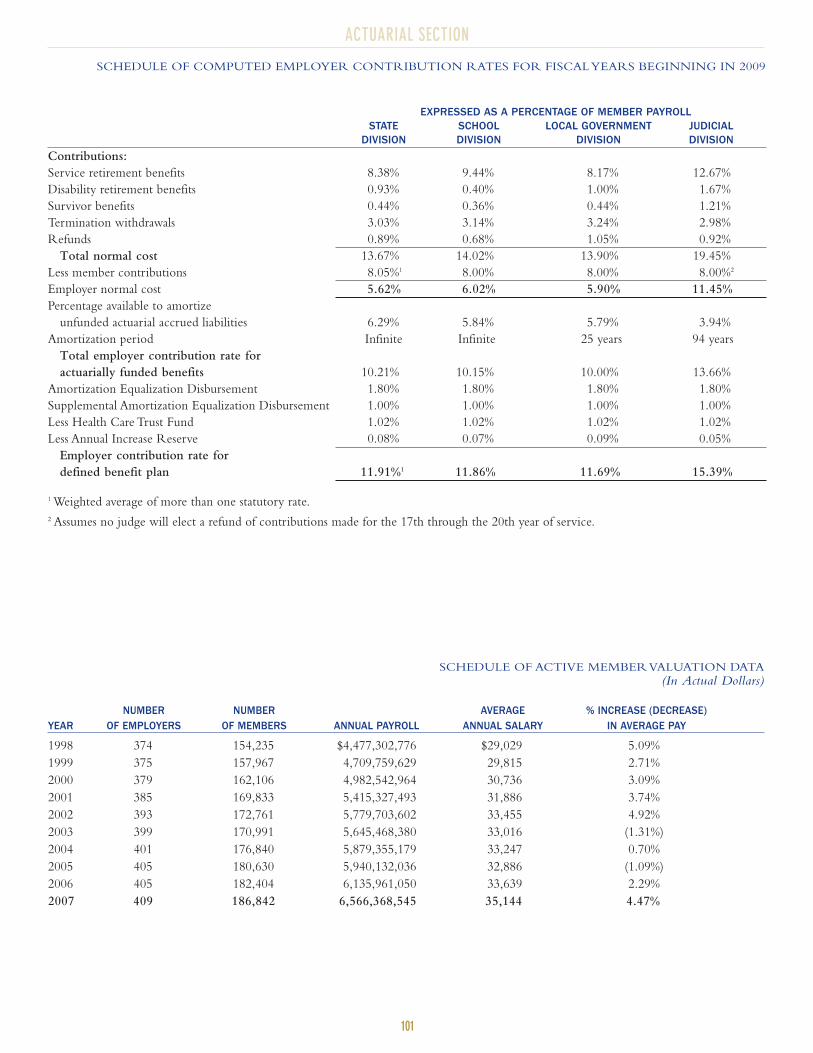
101
ACTUARIAL SECTION
SCHEDULE OF ACTIVE MEMBER VALUATION DATA
(In Actual Dollars)
NUMBER NUMBER AVERAGE % INCREASE (DECREASE)YEAR OF EMPLOYERS OF MEMBERS ANNUAL PAYROLL ANNUAL SALARY IN AVERAGE PAY
1998 374 154,235 $4,477,302,776 $29,029 5.09%
1999 375 157,967 4,709,759,629 29,815 2.71%
2000 379 162,106 4,982,542,964 30,736 3.09%
2001 385 169,833 5,415,327,493 31,886 3.74%
2002 393 172,761 5,779,703,602 33,455 4.92%
2003 399 170,991 5,645,468,380 33,016 (1.31%)
2004 401 176,840 5,879,355,179 33,247 0.70%
2005 405 180,630 5,940,132,036 32,886 (1.09%)
2006 405 182,404 6,135,961,050 33,639 2.29%
2007 409 186,842 6,566,368,545 35,144 4.47%
EXPRESSED AS A PERCENTAGE OF MEMBER PAYROLLSTATE SCHOOL LOCAL GOVERNMENT JUDICIAL
DIVISION DIVISION DIVISION DIVISION
Contributions:
Service retirement benefits 8.38% 9.44% 8.17% 12.67%
Disability retirement benefits 0.93% 0.40% 1.00% 1.67%
Survivor benefits 0.44% 0.36% 0.44% 1.21%
Termination withdrawals 3.03% 3.14% 3.24% 2.98%
Refunds 0.89% 0.68% 1.05% 0.92%
Total normal cost 13.67% 14.02% 13.90% 19.45%
Less member contributions 8.05%1 8.00% 8.00% 8.00%2
Employer normal cost 5.62% 6.02% 5.90% 11.45%
Percentage available to amortize
unfunded actuarial accrued liabilities 6.29% 5.84% 5.79% 3.94%
Amortization period Infinite Infinite 25 years 94 years
Total employer contribution rate for
actuarially funded benefits 10.21% 10.15% 10.00% 13.66%
Amortization Equalization Disbursement 1.80% 1.80% 1.80% 1.80%
Supplemental Amortization Equalization Disbursement 1.00% 1.00% 1.00% 1.00%
Less Health Care Trust Fund 1.02% 1.02% 1.02% 1.02%
Less Annual Increase Reserve 0.08% 0.07% 0.09% 0.05%
Employer contribution rate for
defined benefit plan 11.91%1 11.86% 11.69% 15.39%
1 Weighted average of more than one statutory rate.
2 Assumes no judge will elect a refund of contributions made for the 17th through the 20th year of service.
SCHEDULE OF COMPUTED EMPLOYER CONTRIBUTION RATES FOR FISCAL YEARS BEGINNING IN 2009

Taking care of our members
STATISTICAL SECTION
105
STATISTICAL SECTION OVERVIEW
The Statistical Section presents detailed information that assists users in utilizing the basic financial statements, notes to basic financial
statements, and required supplementary information to assess the economic condition of Colorado PERA.
CONTENTSFinancial Trends—These schedules show trend information about the changes and growth in Colorado PERA’s net assets over the past 10 years.
Changes in Fiduciary Net Assets
Benefits and Refund Deductions from Net Assets by Type
Operating Information—These schedules contain information related to the services that Colorado PERA provides and the activities
it performs.
Member and Benefit Recipient Statistics1
Schedule of Average Retirement Benefits Payable1
Schedule of Retirees and Survivors by Type of Benefit
Current Average Monthly Benefit by Year of Retirement1
Schedule of Average Benefit Payments by Division
Schedule of Average Benefit Payments1—Combined State, School, Local Government, and Judicial Divisions Trust Funds
Schedule of Contribution Rate History
Principal Participating Employers
Schedule of Affiliated Employers
Schedules and information are derived from Colorado PERA internal sources unless otherwise noted.
1Schedules and data are provided by the consulting actuary, Cavanaugh Macdonald Consulting, LLC.
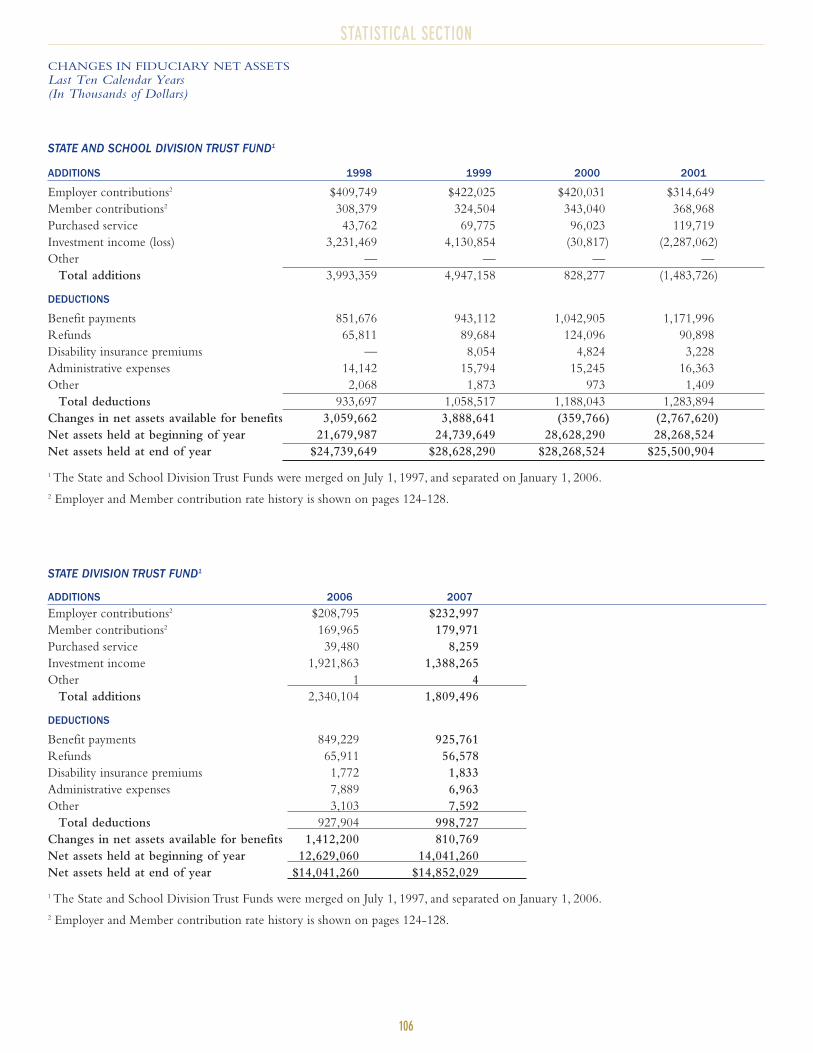
STATISTICAL SECTION
106
CHANGES IN FIDUCIARY NET ASSETS
Last Ten Calendar Years(In Thousands of Dollars)
ADDITIONS 1998 1999 2000 2001
Employer contributions2 $409,749 $422,025 $420,031 $314,649
Member contributions2 308,379 324,504 343,040 368,968
Purchased service 43,762 69,775 96,023 119,719
Investment income (loss) 3,231,469 4,130,854 (30,817) (2,287,062)
Other — — — —
Total additions 3,993,359 4,947,158 828,277 (1,483,726)
DEDUCTIONS
Benefit payments 851,676 943,112 1,042,905 1,171,996
Refunds 65,811 89,684 124,096 90,898
Disability insurance premiums — 8,054 4,824 3,228
Administrative expenses 14,142 15,794 15,245 16,363
Other 2,068 1,873 973 1,409
Total deductions 933,697 1,058,517 1,188,043 1,283,894
Changes in net assets available for benefits 3,059,662 3,888,641 (359,766) (2,767,620)
Net assets held at beginning of year 21,679,987 24,739,649 28,628,290 28,268,524
Net assets held at end of year $24,739,649 $28,628,290 $28,268,524 $25,500,904
1 The State and School Division Trust Funds were merged on July 1, 1997, and separated on January 1, 2006.
2 Employer and Member contribution rate history is shown on pages 124-128.
ADDITIONS 2006 2007
Employer contributions2 $208,795 $232,997
Member contributions2 169,965 179,971
Purchased service 39,480 8,259
Investment income 1,921,863 1,388,265
Other 1 4
Total additions 2,340,104 1,809,496
DEDUCTIONS
Benefit payments 849,229 925,761
Refunds 65,911 56,578
Disability insurance premiums 1,772 1,833
Administrative expenses 7,889 6,963
Other 3,103 7,592
Total deductions 927,904 998,727
Changes in net assets available for benefits 1,412,200 810,769
Net assets held at beginning of year 12,629,060 14,041,260
Net assets held at end of year $14,041,260 $14,852,029
1 The State and School Division Trust Funds were merged on July 1, 1997, and separated on January 1, 2006.
2 Employer and Member contribution rate history is shown on pages 124-128.
STATE AND SCHOOL DIVISION TRUST FUND1
STATE DIVISION TRUST FUND1
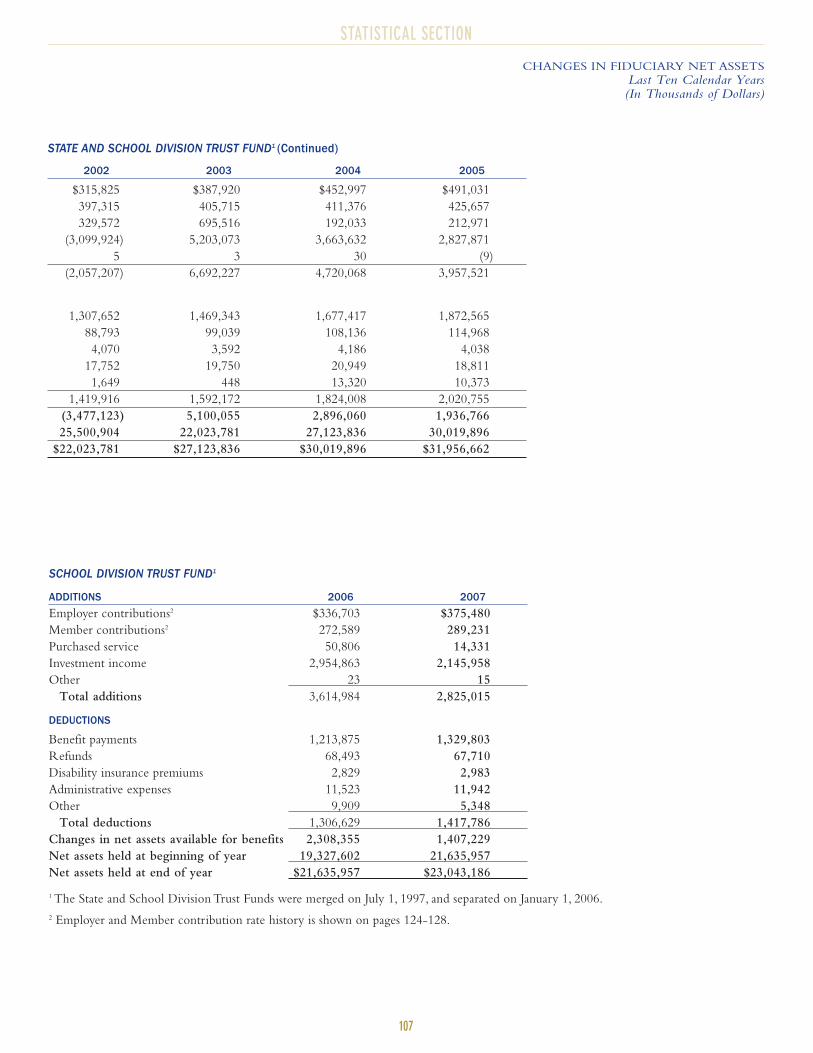
STATISTICAL SECTION
107
CHANGES IN FIDUCIARY NET ASSETS
Last Ten Calendar Years(In Thousands of Dollars)
2002 2003 2004 2005
$315,825 $387,920 $452,997 $491,031
397,315 405,715 411,376 425,657
329,572 695,516 192,033 212,971
(3,099,924) 5,203,073 3,663,632 2,827,871
5 3 30 (9)
(2,057,207) 6,692,227 4,720,068 3,957,521
1,307,652 1,469,343 1,677,417 1,872,565
88,793 99,039 108,136 114,968
4,070 3,592 4,186 4,038
17,752 19,750 20,949 18,811
1,649 448 13,320 10,373
1,419,916 1,592,172 1,824,008 2,020,755
(3,477,123) 5,100,055 2,896,060 1,936,766
25,500,904 22,023,781 27,123,836 30,019,896
$22,023,781 $27,123,836 $30,019,896 $31,956,662
ADDITIONS 2006 2007
Employer contributions2 $336,703 $375,480
Member contributions2 272,589 289,231
Purchased service 50,806 14,331
Investment income 2,954,863 2,145,958
Other 23 15
Total additions 3,614,984 2,825,015
DEDUCTIONS
Benefit payments 1,213,875 1,329,803
Refunds 68,493 67,710
Disability insurance premiums 2,829 2,983
Administrative expenses 11,523 11,942
Other 9,909 5,348
Total deductions 1,306,629 1,417,786
Changes in net assets available for benefits 2,308,355 1,407,229
Net assets held at beginning of year 19,327,602 21,635,957
Net assets held at end of year $21,635,957 $23,043,186
1 The State and School Division Trust Funds were merged on July 1, 1997, and separated on January 1, 2006.
2 Employer and Member contribution rate history is shown on pages 124-128.
SCHOOL DIVISION TRUST FUND1
STATE AND SCHOOL DIVISION TRUST FUND1 (Continued)
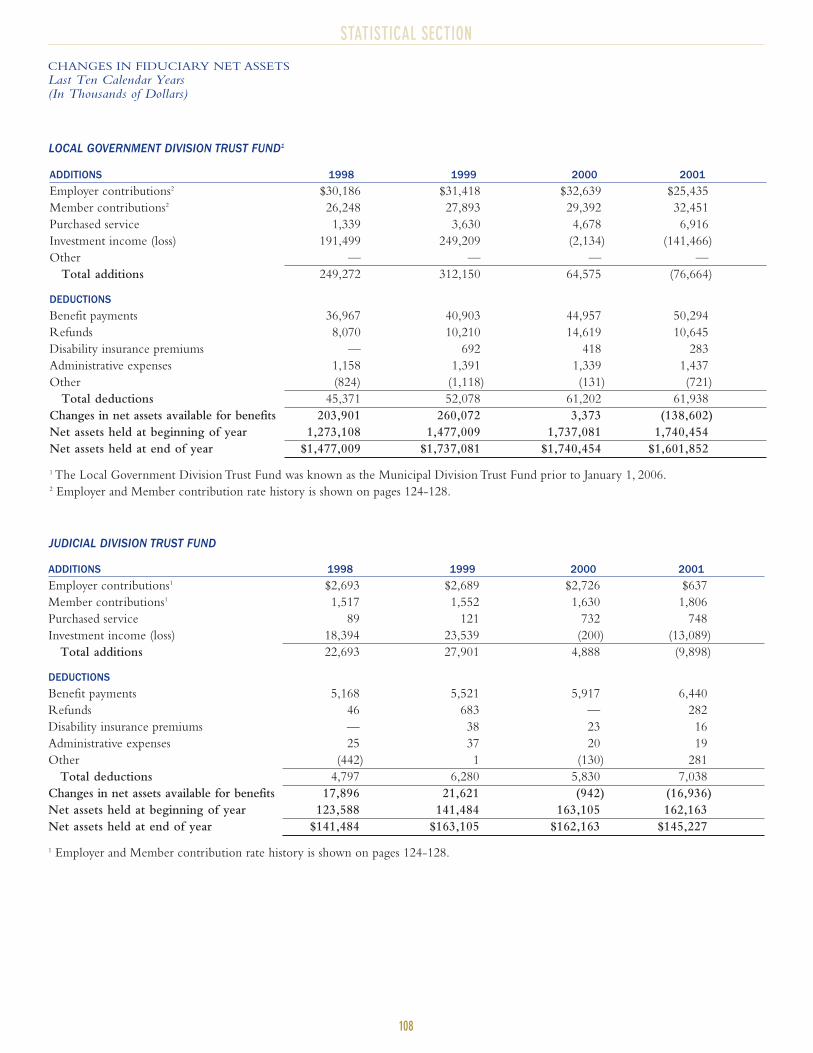
STATISTICAL SECTION
108
CHANGES IN FIDUCIARY NET ASSETS
Last Ten Calendar Years(In Thousands of Dollars)
ADDITIONS 1998 1999 2000 2001
Employer contributions2 $30,186 $31,418 $32,639 $25,435
Member contributions2 26,248 27,893 29,392 32,451
Purchased service 1,339 3,630 4,678 6,916
Investment income (loss) 191,499 249,209 (2,134) (141,466)
Other — — — —
Total additions 249,272 312,150 64,575 (76,664)
DEDUCTIONS
Benefit payments 36,967 40,903 44,957 50,294
Refunds 8,070 10,210 14,619 10,645
Disability insurance premiums — 692 418 283
Administrative expenses 1,158 1,391 1,339 1,437
Other (824) (1,118) (131) (721)
Total deductions 45,371 52,078 61,202 61,938
Changes in net assets available for benefits 203,901 260,072 3,373 (138,602)
Net assets held at beginning of year 1,273,108 1,477,009 1,737,081 1,740,454
Net assets held at end of year $1,477,009 $1,737,081 $1,740,454 $1,601,852
1 The Local Government Division Trust Fund was known as the Municipal Division Trust Fund prior to January 1, 2006.2 Employer and Member contribution rate history is shown on pages 124-128.
ADDITIONS 1998 1999 2000 2001
Employer contributions1 $2,693 $2,689 $2,726 $637
Member contributions1 1,517 1,552 1,630 1,806
Purchased service 89 121 732 748
Investment income (loss) 18,394 23,539 (200) (13,089)
Total additions 22,693 27,901 4,888 (9,898)
DEDUCTIONS
Benefit payments 5,168 5,521 5,917 6,440
Refunds 46 683 — 282
Disability insurance premiums — 38 23 16
Administrative expenses 25 37 20 19
Other (442) 1 (130) 281
Total deductions 4,797 6,280 5,830 7,038
Changes in net assets available for benefits 17,896 21,621 (942) (16,936)
Net assets held at beginning of year 123,588 141,484 163,105 162,163
Net assets held at end of year $141,484 $163,105 $162,163 $145,227
1 Employer and Member contribution rate history is shown on pages 124-128.
LOCAL GOVERNMENT DIVISION TRUST FUND1
JUDICIAL DIVISION TRUST FUND
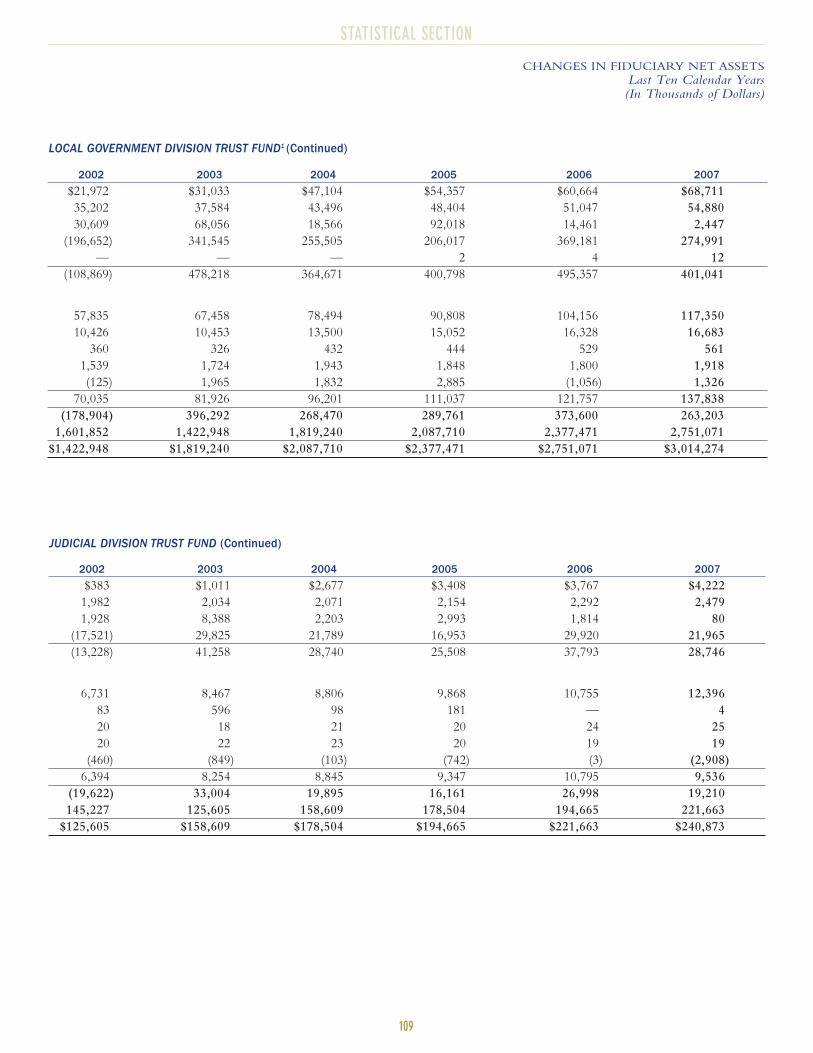
STATISTICAL SECTION
109
CHANGES IN FIDUCIARY NET ASSETS
Last Ten Calendar Years(In Thousands of Dollars)
2002 2003 2004 2005 2006 2007
$21,972 $31,033 $47,104 $54,357 $60,664 $68,711
35,202 37,584 43,496 48,404 51,047 54,880
30,609 68,056 18,566 92,018 14,461 2,447
(196,652) 341,545 255,505 206,017 369,181 274,991
— — — 2 4 12
(108,869) 478,218 364,671 400,798 495,357 401,041
57,835 67,458 78,494 90,808 104,156 117,350
10,426 10,453 13,500 15,052 16,328 16,683
360 326 432 444 529 561
1,539 1,724 1,943 1,848 1,800 1,918
(125) 1,965 1,832 2,885 (1,056) 1,326
70,035 81,926 96,201 111,037 121,757 137,838
(178,904) 396,292 268,470 289,761 373,600 263,203
1,601,852 1,422,948 1,819,240 2,087,710 2,377,471 2,751,071
$1,422,948 $1,819,240 $2,087,710 $2,377,471 $2,751,071 $3,014,274
2002 2003 2004 2005 2006 2007
$383 $1,011 $2,677 $3,408 $3,767 $4,222
1,982 2,034 2,071 2,154 2,292 2,479
1,928 8,388 2,203 2,993 1,814 80
(17,521) 29,825 21,789 16,953 29,920 21,965
(13,228) 41,258 28,740 25,508 37,793 28,746
6,731 8,467 8,806 9,868 10,755 12,396
83 596 98 181 — 4
20 18 21 20 24 25
20 22 23 20 19 19
(460) (849) (103) (742) (3) (2,908)
6,394 8,254 8,845 9,347 10,795 9,536
(19,622) 33,004 19,895 16,161 26,998 19,210
145,227 125,605 158,609 178,504 194,665 221,663
$125,605 $158,609 $178,504 $194,665 $221,663 $240,873
LOCAL GOVERNMENT DIVISION TRUST FUND1 (Continued)
JUDICIAL DIVISION TRUST FUND (Continued)

STATISTICAL SECTION
110
CHANGES IN FIDUCIARY NET ASSETS
Last Ten Calendar Years(In Thousands of Dollars)
ADDITIONS 1998 1999 2000 2001
Employer contributions $386 $495 $719 $58,037
Member contributions 61,805 76,469 102,130 165,001
New affiliate transfer — — — —
Investment income (loss) 45,459 102,823 (13,139) (52,070)
Other — — — —
Total additions 107,650 179,787 89,710 170,968
DEDUCTIONS
Refunds 16,529 28,574 45,678 52,909
Administrative expenses 1,056 984 1,835 2,946
Other (756) (1,012) (1,358) (1,835)
Total deductions 16,829 28,546 46,155 54,020
Changes in net assets available for benefits 90,821 151,241 43,555 116,948
Net assets held at beginning of year 272,053 362,874 514,115 557,670
Net assets held at end of year $362,874 $514,115 $557,670 $674,618
ADDITIONS 1998 1999 2000 2001
Employer contributions1 $33,522 $43,136 $51,351 $74,324
Retiree health care premium 21,798 25,611 28,751 43,960
Medicare retiree drug subsidy — — — —
Investment income (loss) 14,089 17,891 (94) (10,818)
Other — — — —
Total additions 69,409 86,638 80,008 107,466
DEDUCTIONS
Benefit payments 62,395 64,979 77,332 103,472
Administrative expenses 846 483 1,134 679
Other (2,122) — — (368)
Total deductions 61,119 65,462 78,466 103,783
Changes in net assets available for benefits 8,290 21,176 1,542 3,683
Net assets held at beginning of year 91,172 99,462 120,638 122,180
Net assets held at end of year $99,462 $120,638 $122,180 $125,863
1 Employer contribution rate history is shown on pages 124-128.
ADDITIONS 1998 1999 2000 2001
Life insurance premiums $— $— $— $—
Investment income (loss) 2,802 3,717 (6) (1,659)
Total additions 2,802 3,717 (6) (1,659)
DEDUCTIONS
Life insurance premiums and claims 656 1,196 1,366 793
Administrative expenses 265 424 491 726
Total deductions 921 1,620 1,857 1,519
Changes in net assets available for benefits 1,881 2,097 (1,863) (3,178)
Net assets held at beginning of year 18,210 20,091 22,188 20,325
Net assets held at end of year $20,091 $22,188 $20,325 $17,147
VOLUNTARY INVESTMENT PROGRAM
HEALTH CARE TRUST FUND
LIFE INSURANCE RESERVE
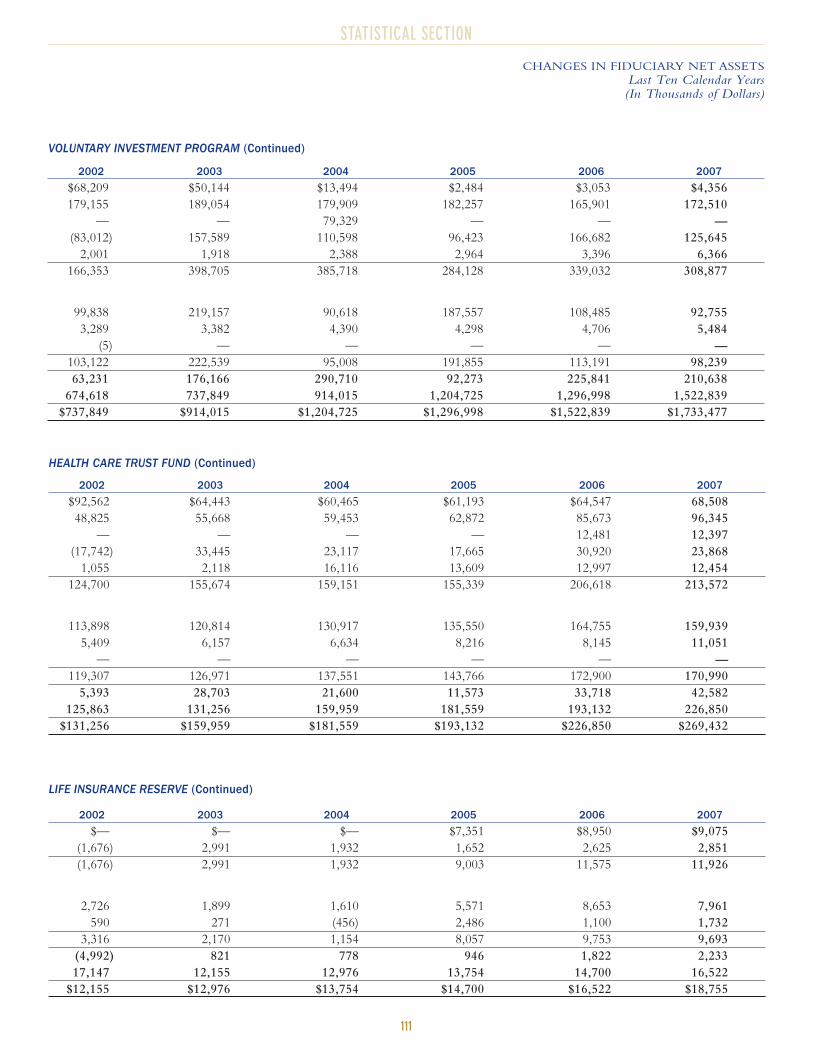
STATISTICAL SECTION
111
CHANGES IN FIDUCIARY NET ASSETS
Last Ten Calendar Years(In Thousands of Dollars)
2002 2003 2004 2005 2006 2007
$68,209 $50,144 $13,494 $2,484 $3,053 $4,356
179,155 189,054 179,909 182,257 165,901 172,510
— — 79,329 — — —
(83,012) 157,589 110,598 96,423 166,682 125,645
2,001 1,918 2,388 2,964 3,396 6,366
166,353 398,705 385,718 284,128 339,032 308,877
99,838 219,157 90,618 187,557 108,485 92,755
3,289 3,382 4,390 4,298 4,706 5,484
(5) — — — — —
103,122 222,539 95,008 191,855 113,191 98,239
63,231 176,166 290,710 92,273 225,841 210,638
674,618 737,849 914,015 1,204,725 1,296,998 1,522,839
$737,849 $914,015 $1,204,725 $1,296,998 $1,522,839 $1,733,477
2002 2003 2004 2005 2006 2007
$92,562 $64,443 $60,465 $61,193 $64,547 68,508
48,825 55,668 59,453 62,872 85,673 96,345
— — — — 12,481 12,397
(17,742) 33,445 23,117 17,665 30,920 23,868
1,055 2,118 16,116 13,609 12,997 12,454
124,700 155,674 159,151 155,339 206,618 213,572
113,898 120,814 130,917 135,550 164,755 159,939
5,409 6,157 6,634 8,216 8,145 11,051
— — — — — —
119,307 126,971 137,551 143,766 172,900 170,990
5,393 28,703 21,600 11,573 33,718 42,582
125,863 131,256 159,959 181,559 193,132 226,850
$131,256 $159,959 $181,559 $193,132 $226,850 $269,432
2002 2003 2004 2005 2006 2007
$— $— $— $7,351 $8,950 $9,075
(1,676) 2,991 1,932 1,652 2,625 2,851
(1,676) 2,991 1,932 9,003 11,575 11,926
2,726 1,899 1,610 5,571 8,653 7,961
590 271 (456) 2,486 1,100 1,732
3,316 2,170 1,154 8,057 9,753 9,693
(4,992) 821 778 946 1,822 2,233
17,147 12,155 12,976 13,754 14,700 16,522
$12,155 $12,976 $13,754 $14,700 $16,522 $18,755
VOLUNTARY INVESTMENT PROGRAM (Continued)
HEALTH CARE TRUST FUND (Continued)
LIFE INSURANCE RESERVE (Continued)
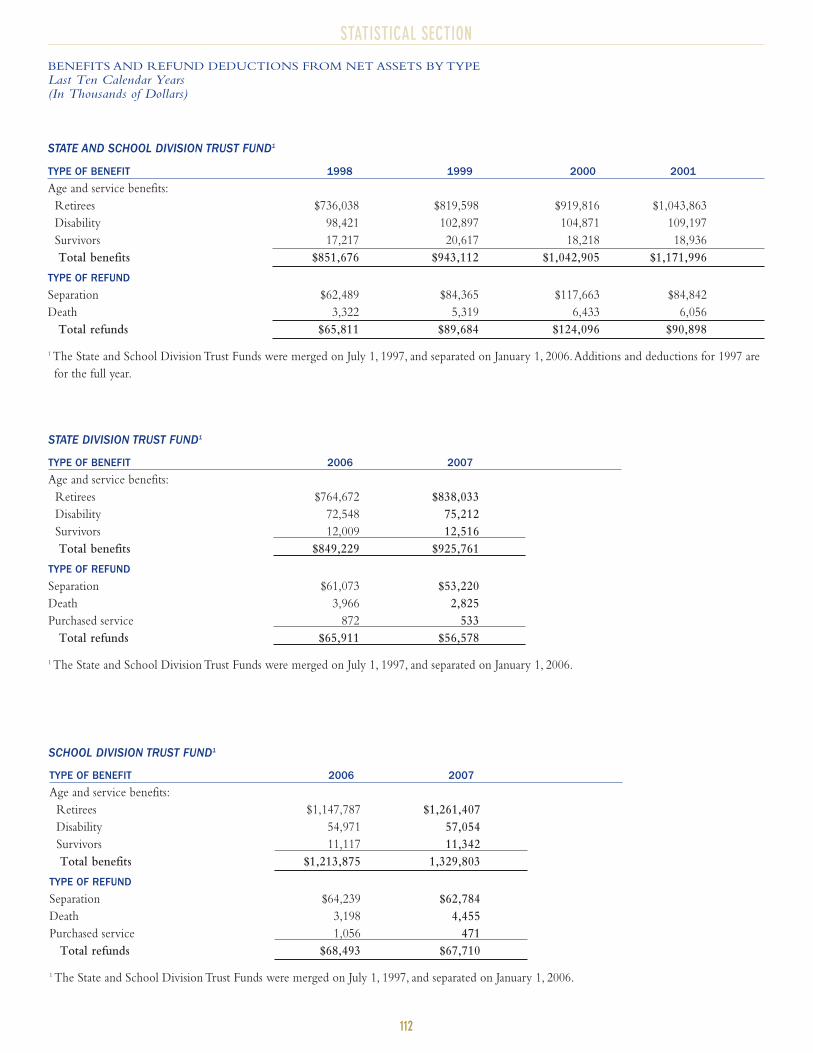
STATISTICAL SECTION
112
BENEFITS AND REFUND DEDUCTIONS FROM NET ASSETS BY TYPE
Last Ten Calendar Years(In Thousands of Dollars)
TYPE OF BENEFIT 1998 1999 2000 2001
Age and service benefits:
Retirees $736,038 $819,598 $919,816 $1,043,863
Disability 98,421 102,897 104,871 109,197
Survivors 17,217 20,617 18,218 18,936
Total benefits $851,676 $943,112 $1,042,905 $1,171,996
TYPE OF REFUND
Separation $62,489 $84,365 $117,663 $84,842
Death 3,322 5,319 6,433 6,056
Total refunds $65,811 $89,684 $124,096 $90,898
1 The State and School Division Trust Funds were merged on July 1, 1997, and separated on January 1, 2006.Additions and deductions for 1997 are
for the full year.
TYPE OF BENEFIT 2006 2007
Age and service benefits:
Retirees $764,672 $838,033
Disability 72,548 75,212
Survivors 12,009 12,516
Total benefits $849,229 $925,761
TYPE OF REFUND
Separation $61,073 $53,220
Death 3,966 2,825
Purchased service 872 533
Total refunds $65,911 $56,578
1 The State and School Division Trust Funds were merged on July 1, 1997, and separated on January 1, 2006.
TYPE OF BENEFIT 2006 2007
Age and service benefits:
Retirees $1,147,787 $1,261,407
Disability 54,971 57,054
Survivors 11,117 11,342
Total benefits $1,213,875 1,329,803
TYPE OF REFUND
Separation $64,239 $62,784
Death 3,198 4,455
Purchased service 1,056 471
Total refunds $68,493 $67,710
1 The State and School Division Trust Funds were merged on July 1, 1997, and separated on January 1, 2006.
STATE AND SCHOOL DIVISION TRUST FUND1
STATE DIVISION TRUST FUND1
SCHOOL DIVISION TRUST FUND1

STATISTICAL SECTION
113
BENEFITS AND REFUND DEDUCTIONS FROM NET ASSETS BY TYPE
Last Ten Calendar Years(In Thousands of Dollars)
2002 2003 2004 2005
$1,175,082 $1,331,960 $1,535,496 $1,726,569
112,701 116,770 120,252 123,808
19,869 20,613 21,669 22,188
$1,307,652 $1,469,343 $1,677,417 $1,872,565
$83,457 $91,232 $100,608 $109,588
5,336 7,807 7,528 5,380
$88,793 $99,039 $108,136 $114,968
STATE AND SCHOOL DIVISION TRUST FUND1 (Continued)
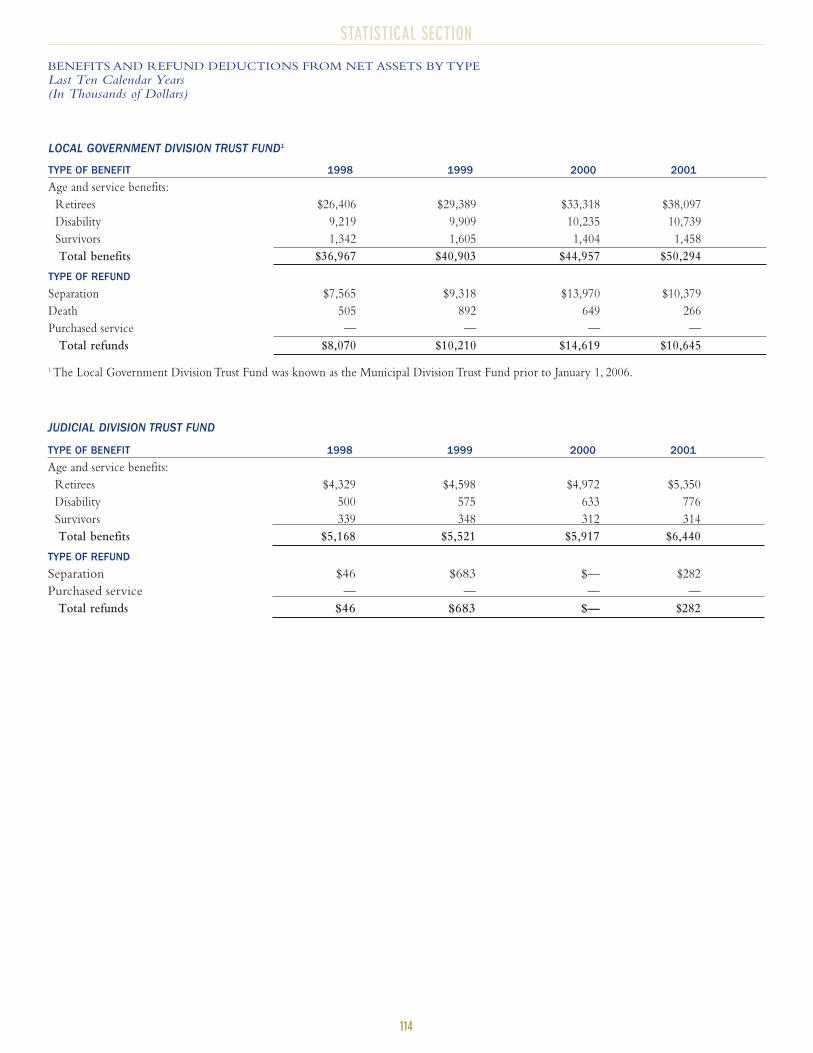
STATISTICAL SECTION
114
BENEFITS AND REFUND DEDUCTIONS FROM NET ASSETS BY TYPE
Last Ten Calendar Years(In Thousands of Dollars)
TYPE OF BENEFIT 1998 1999 2000 2001
Age and service benefits:
Retirees $26,406 $29,389 $33,318 $38,097
Disability 9,219 9,909 10,235 10,739
Survivors 1,342 1,605 1,404 1,458
Total benefits $36,967 $40,903 $44,957 $50,294
TYPE OF REFUND
Separation $7,565 $9,318 $13,970 $10,379
Death 505 892 649 266
Purchased service — — — —
Total refunds $8,070 $10,210 $14,619 $10,645
1 The Local Government Division Trust Fund was known as the Municipal Division Trust Fund prior to January 1, 2006.
TYPE OF BENEFIT 1998 1999 2000 2001
Age and service benefits:
Retirees $4,329 $4,598 $4,972 $5,350
Disability 500 575 633 776
Survivors 339 348 312 314
Total benefits $5,168 $5,521 $5,917 $6,440
TYPE OF REFUND
Separation $46 $683 $— $282
Purchased service — — — —
Total refunds $46 $683 $— $282
LOCAL GOVERNMENT DIVISION TRUST FUND1
JUDICIAL DIVISION TRUST FUND
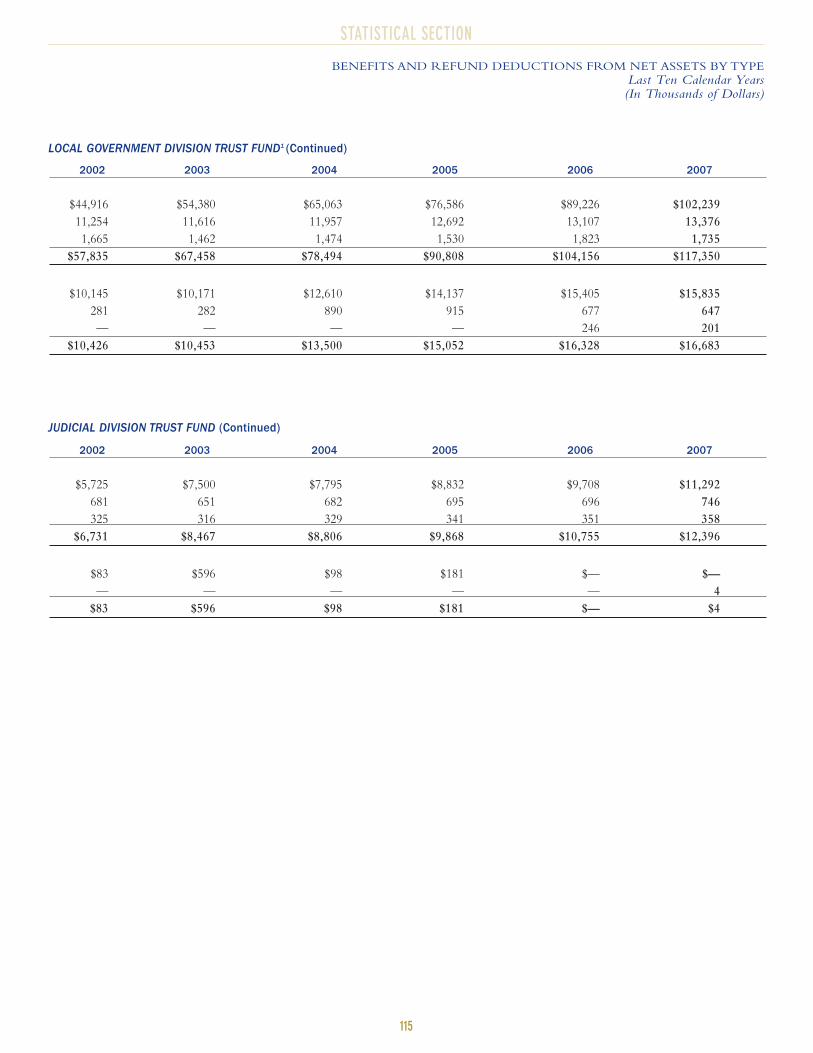
STATISTICAL SECTION
115
BENEFITS AND REFUND DEDUCTIONS FROM NET ASSETS BY TYPE
Last Ten Calendar Years(In Thousands of Dollars)
2002 2003 2004 2005 2006 2007
$44,916 $54,380 $65,063 $76,586 $89,226 $102,239
11,254 11,616 11,957 12,692 13,107 13,376
1,665 1,462 1,474 1,530 1,823 1,735
$57,835 $67,458 $78,494 $90,808 $104,156 $117,350
$10,145 $10,171 $12,610 $14,137 $15,405 $15,835
281 282 890 915 677 647
— — — — 246 201
$10,426 $10,453 $13,500 $15,052 $16,328 $16,683
2002 2003 2004 2005 2006 2007
$5,725 $7,500 $7,795 $8,832 $9,708 $11,292
681 651 682 695 696 746
325 316 329 341 351 358
$6,731 $8,467 $8,806 $9,868 $10,755 $12,396
$83 $596 $98 $181 $— $—
— — — — — 4
$83 $596 $98 $181 $— $4
LOCAL GOVERNMENT DIVISION TRUST FUND1 (Continued)
JUDICIAL DIVISION TRUST FUND (Continued)
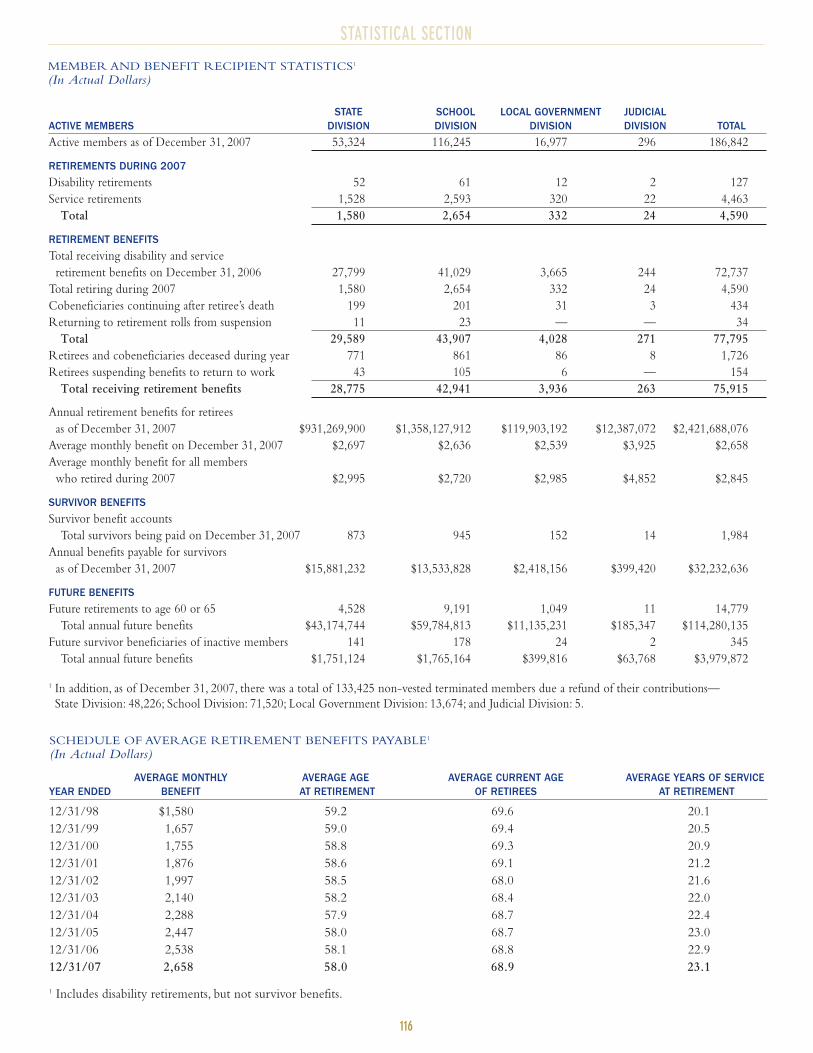
STATISTICAL SECTION
116
MEMBER AND BENEFIT RECIPIENT STATISTICS1
(In Actual Dollars)
STATE SCHOOL LOCAL GOVERNMENT JUDICIALACTIVE MEMBERS DIVISION DIVISION DIVISION DIVISION TOTAL
Active members as of December 31, 2007 53,324 116,245 16,977 296 186,842
RETIREMENTS DURING 2007
Disability retirements 52 61 12 2 127
Service retirements 1,528 2,593 320 22 4,463
Total 1,580 2,654 332 24 4,590
RETIREMENT BENEFITS
Total receiving disability and service
retirement benefits on December 31, 2006 27,799 41,029 3,665 244 72,737
Total retiring during 2007 1,580 2,654 332 24 4,590
Cobeneficiaries continuing after retiree’s death 199 201 31 3 434
Returning to retirement rolls from suspension 11 23 — — 34
Total 29,589 43,907 4,028 271 77,795
Retirees and cobeneficiaries deceased during year 771 861 86 8 1,726
Retirees suspending benefits to return to work 43 105 6 — 154
Total receiving retirement benefits 28,775 42,941 3,936 263 75,915
Annual retirement benefits for retirees
as of December 31, 2007 $931,269,900 $1,358,127,912 $119,903,192 $12,387,072 $2,421,688,076
Average monthly benefit on December 31, 2007 $2,697 $2,636 $2,539 $3,925 $2,658
Average monthly benefit for all members
who retired during 2007 $2,995 $2,720 $2,985 $4,852 $2,845
SURVIVOR BENEFITS
Survivor benefit accounts
Total survivors being paid on December 31, 2007 873 945 152 14 1,984
Annual benefits payable for survivors
as of December 31, 2007 $15,881,232 $13,533,828 $2,418,156 $399,420 $32,232,636
FUTURE BENEFITS
Future retirements to age 60 or 65 4,528 9,191 1,049 11 14,779
Total annual future benefits $43,174,744 $59,784,813 $11,135,231 $185,347 $114,280,135
Future survivor beneficiaries of inactive members 141 178 24 2 345
Total annual future benefits $1,751,124 $1,765,164 $399,816 $63,768 $3,979,872
1 In addition, as of December 31, 2007, there was a total of 133,425 non-vested terminated members due a refund of their contributions—
State Division: 48,226; School Division: 71,520; Local Government Division: 13,674; and Judicial Division: 5.
AVERAGE MONTHLY AVERAGE AGE AVERAGE CURRENT AGE AVERAGE YEARS OF SERVICEYEAR ENDED BENEFIT AT RETIREMENT OF RETIREES AT RETIREMENT
12/31/98 $1,580 59.2 69.6 20.1
12/31/99 1,657 59.0 69.4 20.5
12/31/00 1,755 58.8 69.3 20.9
12/31/01 1,876 58.6 69.1 21.2
12/31/02 1,997 58.5 68.0 21.6
12/31/03 2,140 58.2 68.4 22.0
12/31/04 2,288 57.9 68.7 22.4
12/31/05 2,447 58.0 68.7 23.0
12/31/06 2,538 58.1 68.8 22.9
12/31/07 2,658 58.0 68.9 23.1
1 Includes disability retirements, but not survivor benefits.
SCHEDULE OF AVERAGE RETIREMENT BENEFITS PAYABLE1
(In Actual Dollars)
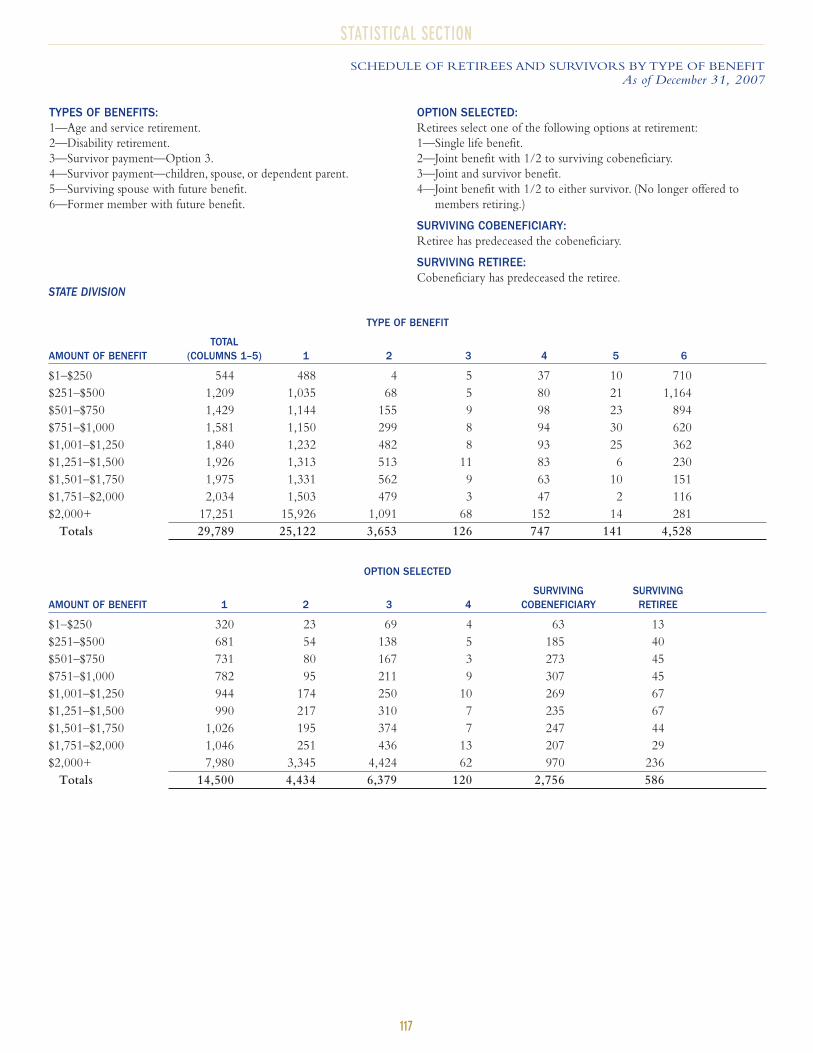
STATISTICAL SECTION
117
SCHEDULE OF RETIREES AND SURVIVORS BY TYPE OF BENEFIT
As of December 31, 2007
TYPES OF BENEFITS:1—Age and service retirement.
2—Disability retirement.
3—Survivor payment—Option 3.
4—Survivor payment—children, spouse, or dependent parent.
5—Surviving spouse with future benefit.
6—Former member with future benefit.
OPTION SELECTED:Retirees select one of the following options at retirement:
1—Single life benefit.
2—Joint benefit with 1/2 to surviving cobeneficiary.
3—Joint and survivor benefit.
4—Joint benefit with 1/2 to either survivor. (No longer offered to
members retiring.)
SURVIVING COBENEFICIARY:Retiree has predeceased the cobeneficiary.
SURVIVING RETIREE:Cobeneficiary has predeceased the retiree.
OPTION SELECTED
SURVIVING SURVIVINGAMOUNT OF BENEFIT 1 2 3 4 COBENEFICIARY RETIREE
$1–$250 320 23 69 4 63 13
$251–$500 681 54 138 5 185 40
$501–$750 731 80 167 3 273 45
$751–$1,000 782 95 211 9 307 45
$1,001–$1,250 944 174 250 10 269 67
$1,251–$1,500 990 217 310 7 235 67
$1,501–$1,750 1,026 195 374 7 247 44
$1,751–$2,000 1,046 251 436 13 207 29
$2,000+ 7,980 3,345 4,424 62 970 236
Totals 14,500 4,434 6,379 120 2,756 586
STATE DIVISION
TYPE OF BENEFIT
TOTALAMOUNT OF BENEFIT (COLUMNS 1–5) 1 2 3 4 5 6
$1–$250 544 488 4 5 37 10 710
$251–$500 1,209 1,035 68 5 80 21 1,164
$501–$750 1,429 1,144 155 9 98 23 894
$751–$1,000 1,581 1,150 299 8 94 30 620
$1,001–$1,250 1,840 1,232 482 8 93 25 362
$1,251–$1,500 1,926 1,313 513 11 83 6 230
$1,501–$1,750 1,975 1,331 562 9 63 10 151
$1,751–$2,000 2,034 1,503 479 3 47 2 116
$2,000+ 17,251 15,926 1,091 68 152 14 281
Totals 29,789 25,122 3,653 126 747 141 4,528
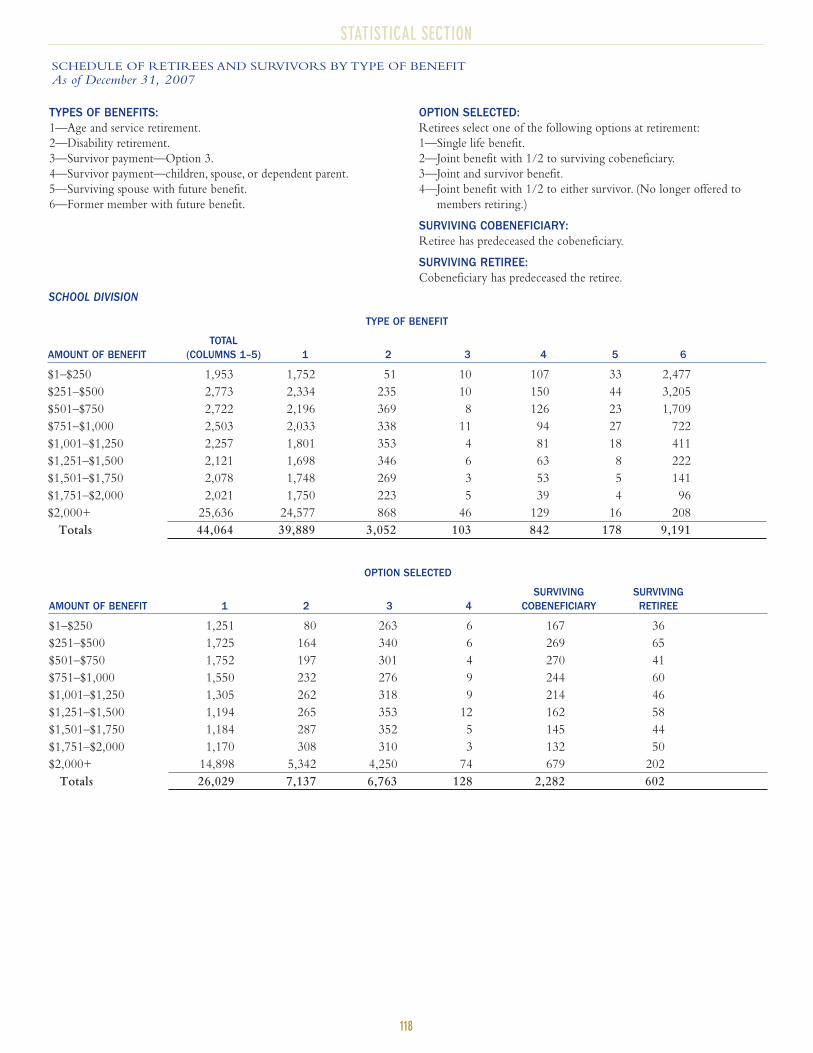
STATISTICAL SECTION
118
SCHEDULE OF RETIREES AND SURVIVORS BY TYPE OF BENEFIT
As of December 31, 2007
TYPES OF BENEFITS:1—Age and service retirement.
2—Disability retirement.
3—Survivor payment—Option 3.
4—Survivor payment—children, spouse, or dependent parent.
5—Surviving spouse with future benefit.
6—Former member with future benefit.
OPTION SELECTED:Retirees select one of the following options at retirement:
1—Single life benefit.
2—Joint benefit with 1/2 to surviving cobeneficiary.
3—Joint and survivor benefit.
4—Joint benefit with 1/2 to either survivor. (No longer offered to
members retiring.)
SURVIVING COBENEFICIARY:Retiree has predeceased the cobeneficiary.
SURVIVING RETIREE:Cobeneficiary has predeceased the retiree.
SCHOOL DIVISION
TYPE OF BENEFIT
TOTALAMOUNT OF BENEFIT (COLUMNS 1–5) 1 2 3 4 5 6
$1–$250 1,953 1,752 51 10 107 33 2,477
$251–$500 2,773 2,334 235 10 150 44 3,205
$501–$750 2,722 2,196 369 8 126 23 1,709
$751–$1,000 2,503 2,033 338 11 94 27 722
$1,001–$1,250 2,257 1,801 353 4 81 18 411
$1,251–$1,500 2,121 1,698 346 6 63 8 222
$1,501–$1,750 2,078 1,748 269 3 53 5 141
$1,751–$2,000 2,021 1,750 223 5 39 4 96
$2,000+ 25,636 24,577 868 46 129 16 208
Totals 44,064 39,889 3,052 103 842 178 9,191
OPTION SELECTED
SURVIVING SURVIVINGAMOUNT OF BENEFIT 1 2 3 4 COBENEFICIARY RETIREE
$1–$250 1,251 80 263 6 167 36
$251–$500 1,725 164 340 6 269 65
$501–$750 1,752 197 301 4 270 41
$751–$1,000 1,550 232 276 9 244 60
$1,001–$1,250 1,305 262 318 9 214 46
$1,251–$1,500 1,194 265 353 12 162 58
$1,501–$1,750 1,184 287 352 5 145 44
$1,751–$2,000 1,170 308 310 3 132 50
$2,000+ 14,898 5,342 4,250 74 679 202
Totals 26,029 7,137 6,763 128 2,282 602
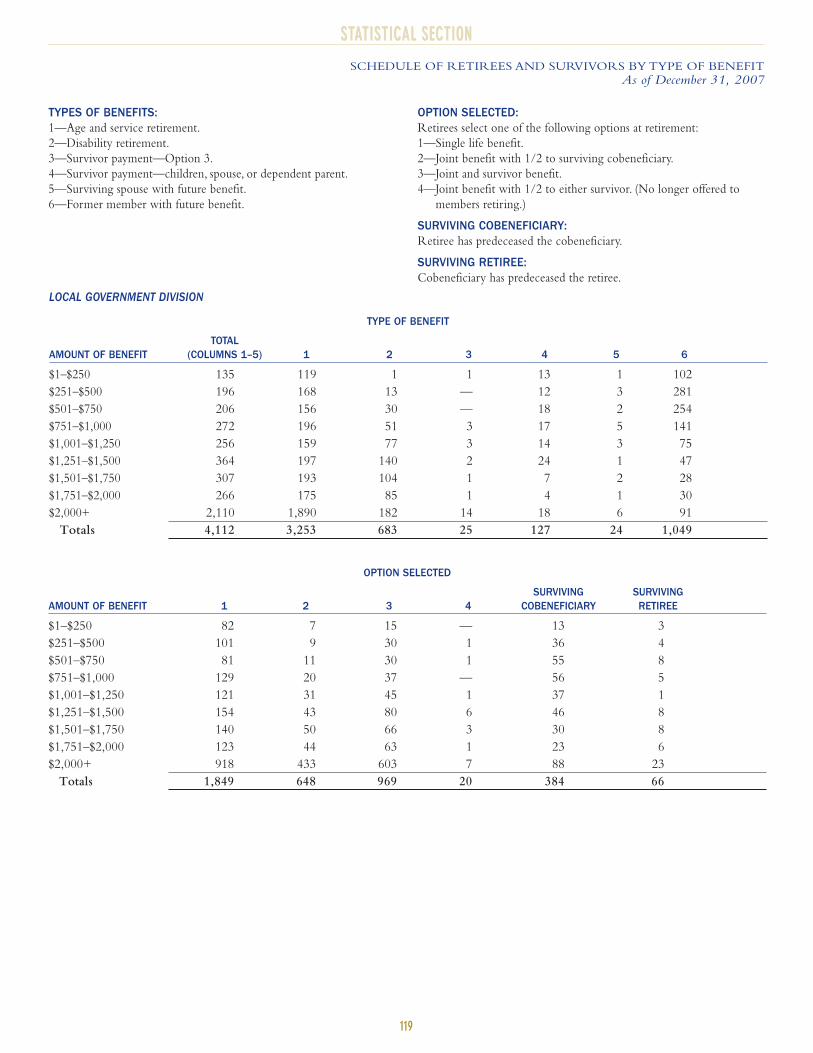
STATISTICAL SECTION
119
STATISTICAL SECTION
SCHEDULE OF RETIREES AND SURVIVORS BY TYPE OF BENEFIT
As of December 31, 2007
TYPES OF BENEFITS:1—Age and service retirement.
2—Disability retirement.
3—Survivor payment—Option 3.
4—Survivor payment—children, spouse, or dependent parent.
5—Surviving spouse with future benefit.
6—Former member with future benefit.
OPTION SELECTED:Retirees select one of the following options at retirement:
1—Single life benefit.
2—Joint benefit with 1/2 to surviving cobeneficiary.
3—Joint and survivor benefit.
4—Joint benefit with 1/2 to either survivor. (No longer offered to
members retiring.)
SURVIVING COBENEFICIARY:Retiree has predeceased the cobeneficiary.
SURVIVING RETIREE:Cobeneficiary has predeceased the retiree.
LOCAL GOVERNMENT DIVISION
TYPE OF BENEFIT
TOTALAMOUNT OF BENEFIT (COLUMNS 1–5) 1 2 3 4 5 6
$1–$250 135 119 1 1 13 1 102
$251–$500 196 168 13 — 12 3 281
$501–$750 206 156 30 — 18 2 254
$751–$1,000 272 196 51 3 17 5 141
$1,001–$1,250 256 159 77 3 14 3 75
$1,251–$1,500 364 197 140 2 24 1 47
$1,501–$1,750 307 193 104 1 7 2 28
$1,751–$2,000 266 175 85 1 4 1 30
$2,000+ 2,110 1,890 182 14 18 6 91
Totals 4,112 3,253 683 25 127 24 1,049
OPTION SELECTED
SURVIVING SURVIVINGAMOUNT OF BENEFIT 1 2 3 4 COBENEFICIARY RETIREE
$1–$250 82 7 15 — 13 3
$251–$500 101 9 30 1 36 4
$501–$750 81 11 30 1 55 8
$751–$1,000 129 20 37 — 56 5
$1,001–$1,250 121 31 45 1 37 1
$1,251–$1,500 154 43 80 6 46 8
$1,501–$1,750 140 50 66 3 30 8
$1,751–$2,000 123 44 63 1 23 6
$2,000+ 918 433 603 7 88 23
Totals 1,849 648 969 20 384 66
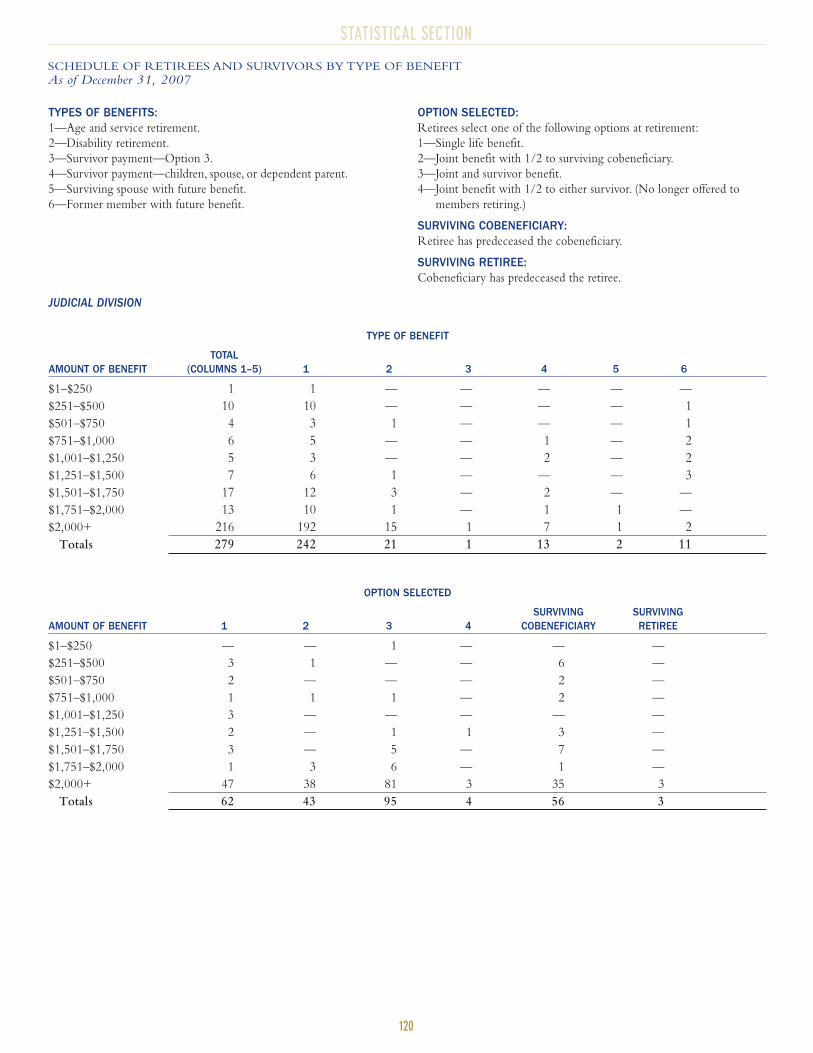
STATISTICAL SECTION
120
SCHEDULE OF RETIREES AND SURVIVORS BY TYPE OF BENEFIT
As of December 31, 2007
TYPES OF BENEFITS:1—Age and service retirement.
2—Disability retirement.
3—Survivor payment—Option 3.
4—Survivor payment—children, spouse, or dependent parent.
5—Surviving spouse with future benefit.
6—Former member with future benefit.
OPTION SELECTED:Retirees select one of the following options at retirement:
1—Single life benefit.
2—Joint benefit with 1/2 to surviving cobeneficiary.
3—Joint and survivor benefit.
4—Joint benefit with 1/2 to either survivor. (No longer offered to
members retiring.)
SURVIVING COBENEFICIARY:Retiree has predeceased the cobeneficiary.
SURVIVING RETIREE:Cobeneficiary has predeceased the retiree.
JUDICIAL DIVISION
TYPE OF BENEFIT
TOTALAMOUNT OF BENEFIT (COLUMNS 1–5) 1 2 3 4 5 6
$1–$250 1 1 — — — — —
$251–$500 10 10 — — — — 1
$501–$750 4 3 1 — — — 1
$751–$1,000 6 5 — — 1 — 2
$1,001–$1,250 5 3 — — 2 — 2
$1,251–$1,500 7 6 1 — — — 3
$1,501–$1,750 17 12 3 — 2 — —
$1,751–$2,000 13 10 1 — 1 1 —
$2,000+ 216 192 15 1 7 1 2
Totals 279 242 21 1 13 2 11
OPTION SELECTED
SURVIVING SURVIVINGAMOUNT OF BENEFIT 1 2 3 4 COBENEFICIARY RETIREE
$1–$250 — — 1 — — —
$251–$500 3 1 — — 6 —
$501–$750 2 — — — 2 —
$751–$1,000 1 1 1 — 2 —
$1,001–$1,250 3 — — — — —
$1,251–$1,500 2 — 1 1 3 —
$1,501–$1,750 3 — 5 — 7 —
$1,751–$2,000 1 3 6 — 1 —
$2,000+ 47 38 81 3 35 3
Totals 62 43 95 4 56 3

STATISTICAL SECTION
121
CURRENT AVERAGE MONTHLY BENEFIT BY YEAR OF RETIREMENT
Service Retiree Accounts as of December 31, 2007(In Actual Dollars)
$1,4091970
1975
1980
1985
1990
1995
2000
2005
2007
$1,234
$1,484
$1,922
$2,360
$2,523
$3,094
$3,165
$2,996
1970 1975 1980 1985 1990 1995 2000 2005 2007
$272 $325 $598 $984 $1,413 $1,769 $2,456 $2,983 $2,996
$1,137 $909 $886 $938 $947 $754 $638 $182 $—
ORIGINAL BENEFIT AT RETIREMENTBENEFIT INCREASES
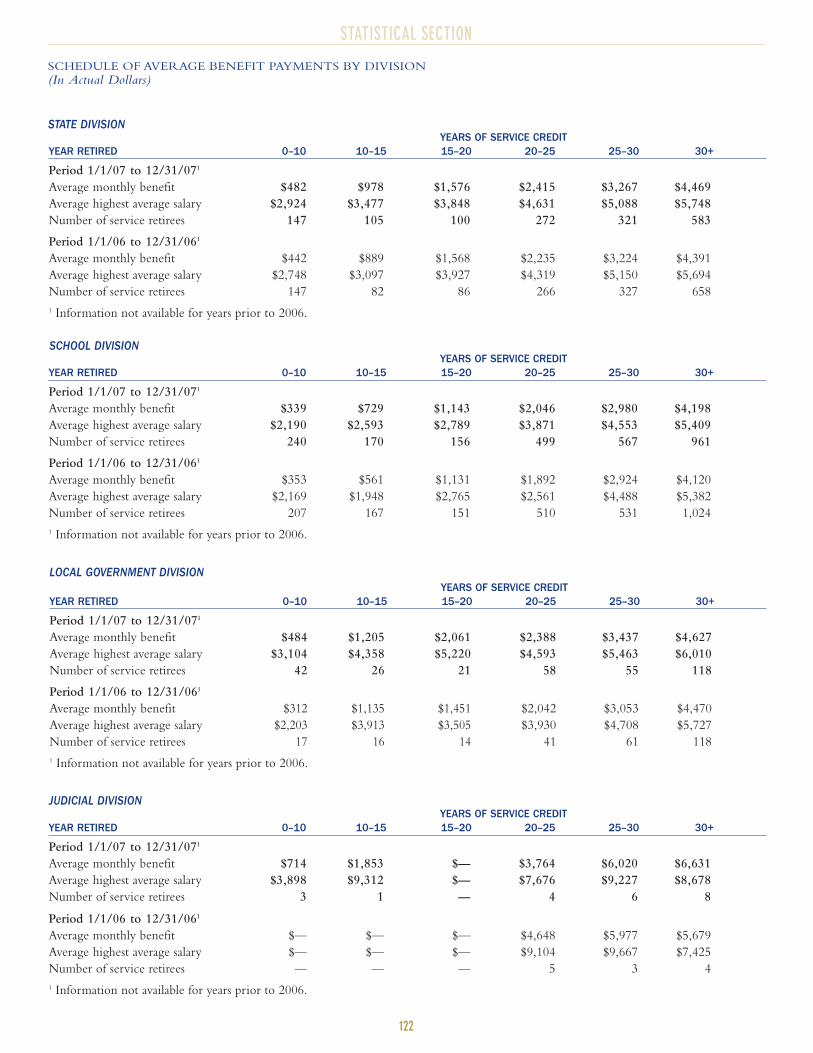
STATISTICAL SECTION
122
SCHEDULE OF AVERAGE BENEFIT PAYMENTS BY DIVISION
(In Actual Dollars)
LOCAL GOVERNMENT DIVISION
JUDICIAL DIVISION
YEARS OF SERVICE CREDITYEAR RETIRED 0–10 10–15 15–20 20–25 25–30 30+
Period 1/1/07 to 12/31/071
Average monthly benefit $482 $978 $1,576 $2,415 $3,267 $4,469
Average highest average salary $2,924 $3,477 $3,848 $4,631 $5,088 $5,748
Number of service retirees 147 105 100 272 321 583
Period 1/1/06 to 12/31/061
Average monthly benefit $442 $889 $1,568 $2,235 $3,224 $4,391
Average highest average salary $2,748 $3,097 $3,927 $4,319 $5,150 $5,694
Number of service retirees 147 82 86 266 327 658
1 Information not available for years prior to 2006.
YEARS OF SERVICE CREDITYEAR RETIRED 0–10 10–15 15–20 20–25 25–30 30+
Period 1/1/07 to 12/31/071
Average monthly benefit $339 $729 $1,143 $2,046 $2,980 $4,198
Average highest average salary $2,190 $2,593 $2,789 $3,871 $4,553 $5,409
Number of service retirees 240 170 156 499 567 961
Period 1/1/06 to 12/31/061
Average monthly benefit $353 $561 $1,131 $1,892 $2,924 $4,120
Average highest average salary $2,169 $1,948 $2,765 $2,561 $4,488 $5,382
Number of service retirees 207 167 151 510 531 1,024
1 Information not available for years prior to 2006.
YEARS OF SERVICE CREDITYEAR RETIRED 0–10 10–15 15–20 20–25 25–30 30+
Period 1/1/07 to 12/31/071
Average monthly benefit $484 $1,205 $2,061 $2,388 $3,437 $4,627
Average highest average salary $3,104 $4,358 $5,220 $4,593 $5,463 $6,010
Number of service retirees 42 26 21 58 55 118
Period 1/1/06 to 12/31/061
Average monthly benefit $312 $1,135 $1,451 $2,042 $3,053 $4,470
Average highest average salary $2,203 $3,913 $3,505 $3,930 $4,708 $5,727
Number of service retirees 17 16 14 41 61 118
1 Information not available for years prior to 2006.
YEARS OF SERVICE CREDITYEAR RETIRED 0–10 10–15 15–20 20–25 25–30 30+
Period 1/1/07 to 12/31/071
Average monthly benefit $714 $1,853 $— $3,764 $6,020 $6,631
Average highest average salary $3,898 $9,312 $— $7,676 $9,227 $8,678
Number of service retirees 3 1 — 4 6 8
Period 1/1/06 to 12/31/061
Average monthly benefit $— $— $— $4,648 $5,977 $5,679
Average highest average salary $— $— $— $9,104 $9,667 $7,425
Number of service retirees — — — 5 3 4
1 Information not available for years prior to 2006.
STATE DIVISION
SCHOOL DIVISION
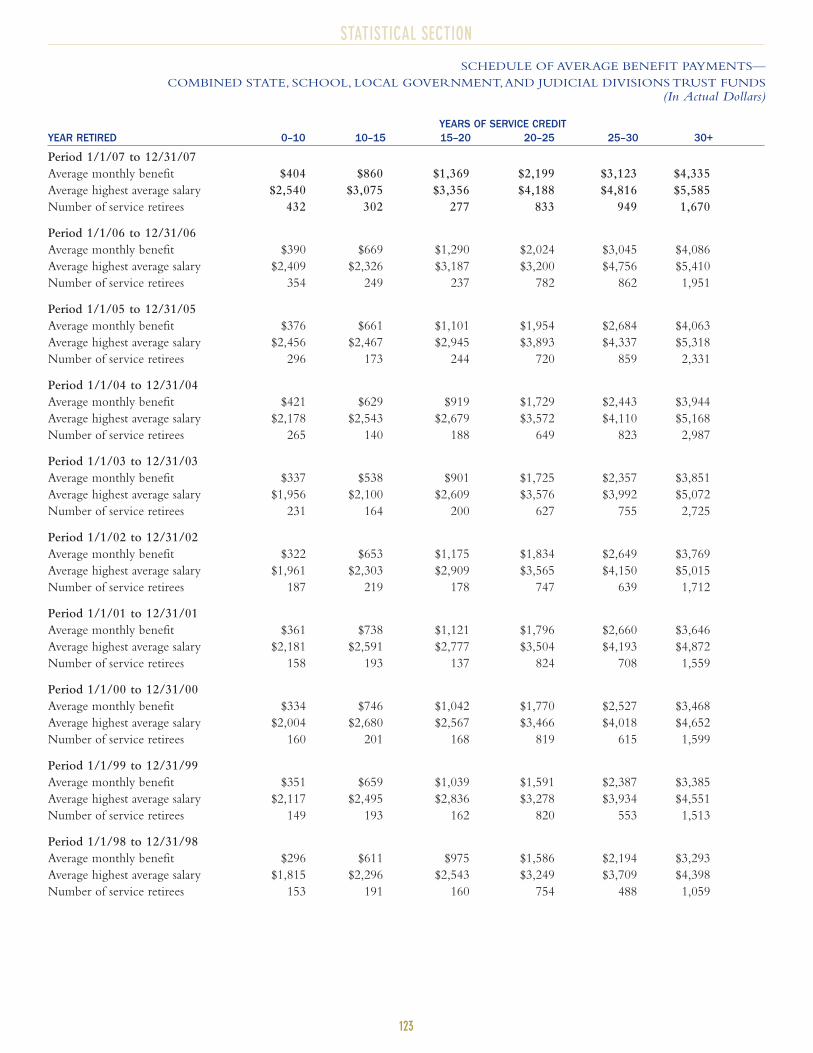
STATISTICAL SECTION
123
SCHEDULE OF AVERAGE BENEFIT PAYMENTS—
COMBINED STATE, SCHOOL, LOCAL GOVERNMENT,AND JUDICIAL DIVISIONS TRUST FUNDS
(In Actual Dollars)
YEARS OF SERVICE CREDITYEAR RETIRED 0–10 10–15 15–20 20–25 25–30 30+
Period 1/1/07 to 12/31/07
Average monthly benefit $404 $860 $1,369 $2,199 $3,123 $4,335
Average highest average salary $2,540 $3,075 $3,356 $4,188 $4,816 $5,585
Number of service retirees 432 302 277 833 949 1,670
Period 1/1/06 to 12/31/06
Average monthly benefit $390 $669 $1,290 $2,024 $3,045 $4,086
Average highest average salary $2,409 $2,326 $3,187 $3,200 $4,756 $5,410
Number of service retirees 354 249 237 782 862 1,951
Period 1/1/05 to 12/31/05
Average monthly benefit $376 $661 $1,101 $1,954 $2,684 $4,063
Average highest average salary $2,456 $2,467 $2,945 $3,893 $4,337 $5,318
Number of service retirees 296 173 244 720 859 2,331
Period 1/1/04 to 12/31/04
Average monthly benefit $421 $629 $919 $1,729 $2,443 $3,944
Average highest average salary $2,178 $2,543 $2,679 $3,572 $4,110 $5,168
Number of service retirees 265 140 188 649 823 2,987
Period 1/1/03 to 12/31/03
Average monthly benefit $337 $538 $901 $1,725 $2,357 $3,851
Average highest average salary $1,956 $2,100 $2,609 $3,576 $3,992 $5,072
Number of service retirees 231 164 200 627 755 2,725
Period 1/1/02 to 12/31/02
Average monthly benefit $322 $653 $1,175 $1,834 $2,649 $3,769
Average highest average salary $1,961 $2,303 $2,909 $3,565 $4,150 $5,015
Number of service retirees 187 219 178 747 639 1,712
Period 1/1/01 to 12/31/01
Average monthly benefit $361 $738 $1,121 $1,796 $2,660 $3,646
Average highest average salary $2,181 $2,591 $2,777 $3,504 $4,193 $4,872
Number of service retirees 158 193 137 824 708 1,559
Period 1/1/00 to 12/31/00
Average monthly benefit $334 $746 $1,042 $1,770 $2,527 $3,468
Average highest average salary $2,004 $2,680 $2,567 $3,466 $4,018 $4,652
Number of service retirees 160 201 168 819 615 1,599
Period 1/1/99 to 12/31/99
Average monthly benefit $351 $659 $1,039 $1,591 $2,387 $3,385
Average highest average salary $2,117 $2,495 $2,836 $3,278 $3,934 $4,551
Number of service retirees 149 193 162 820 553 1,513
Period 1/1/98 to 12/31/98
Average monthly benefit $296 $611 $975 $1,586 $2,194 $3,293
Average highest average salary $1,815 $2,296 $2,543 $3,249 $3,709 $4,398
Number of service retirees 153 191 160 754 488 1,059
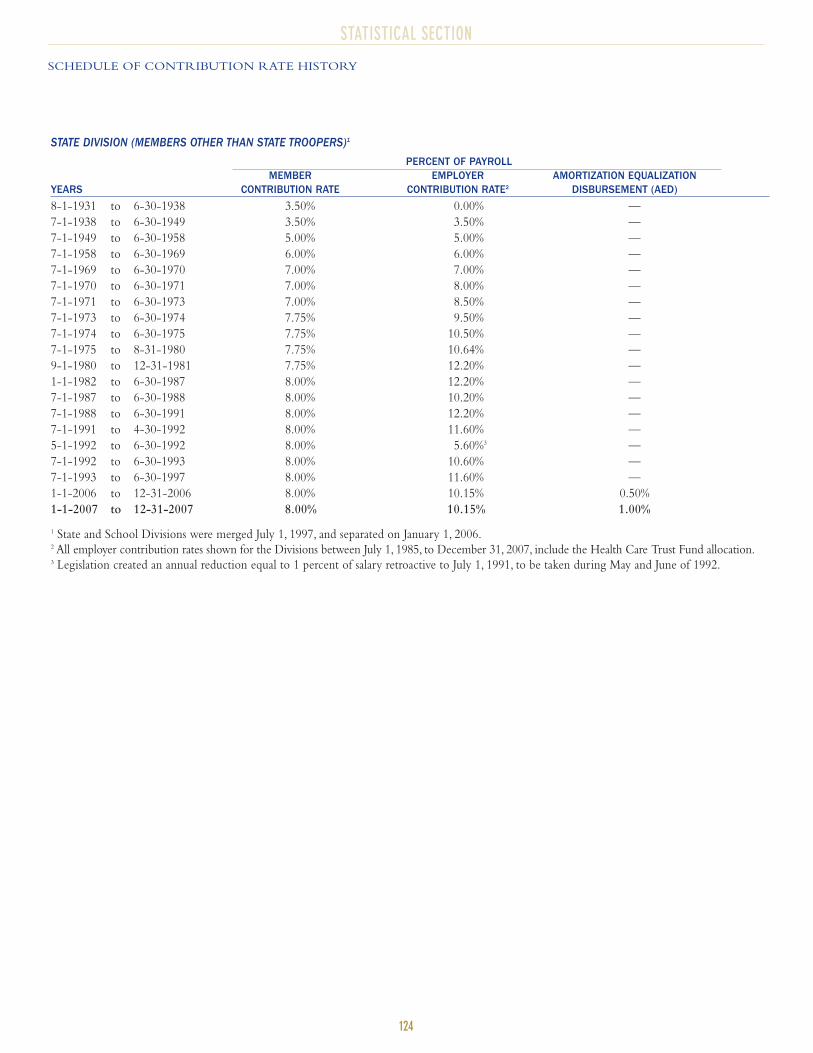
STATISTICAL SECTION
124
PERCENT OF PAYROLLMEMBER EMPLOYER AMORTIZATION EQUALIZATION
YEARS CONTRIBUTION RATE CONTRIBUTION RATE2 DISBURSEMENT (AED)
8-1-1931 to 6-30-1938 3.50% 0.00% —
7-1-1938 to 6-30-1949 3.50% 3.50% —
7-1-1949 to 6-30-1958 5.00% 5.00% —
7-1-1958 to 6-30-1969 6.00% 6.00% —
7-1-1969 to 6-30-1970 7.00% 7.00% —
7-1-1970 to 6-30-1971 7.00% 8.00% —
7-1-1971 to 6-30-1973 7.00% 8.50% —
7-1-1973 to 6-30-1974 7.75% 9.50% —
7-1-1974 to 6-30-1975 7.75% 10.50% —
7-1-1975 to 8-31-1980 7.75% 10.64% —
9-1-1980 to 12-31-1981 7.75% 12.20% —
1-1-1982 to 6-30-1987 8.00% 12.20% —
7-1-1987 to 6-30-1988 8.00% 10.20% —
7-1-1988 to 6-30-1991 8.00% 12.20% —
7-1-1991 to 4-30-1992 8.00% 11.60% —
5-1-1992 to 6-30-1992 8.00% 5.60%3 —
7-1-1992 to 6-30-1993 8.00% 10.60% —
7-1-1993 to 6-30-1997 8.00% 11.60% —
1-1-2006 to 12-31-2006 8.00% 10.15% 0.50%
1-1-2007 to 12-31-2007 8.00% 10.15% 1.00%
1 State and School Divisions were merged July 1, 1997, and separated on January 1, 2006.2 All employer contribution rates shown for the Divisions between July 1, 1985, to December 31, 2007, include the Health Care Trust Fund allocation.3 Legislation created an annual reduction equal to 1 percent of salary retroactive to July 1, 1991, to be taken during May and June of 1992.
SCHEDULE OF CONTRIBUTION RATE HISTORY
STATE DIVISION (MEMBERS OTHER THAN STATE TROOPERS)1
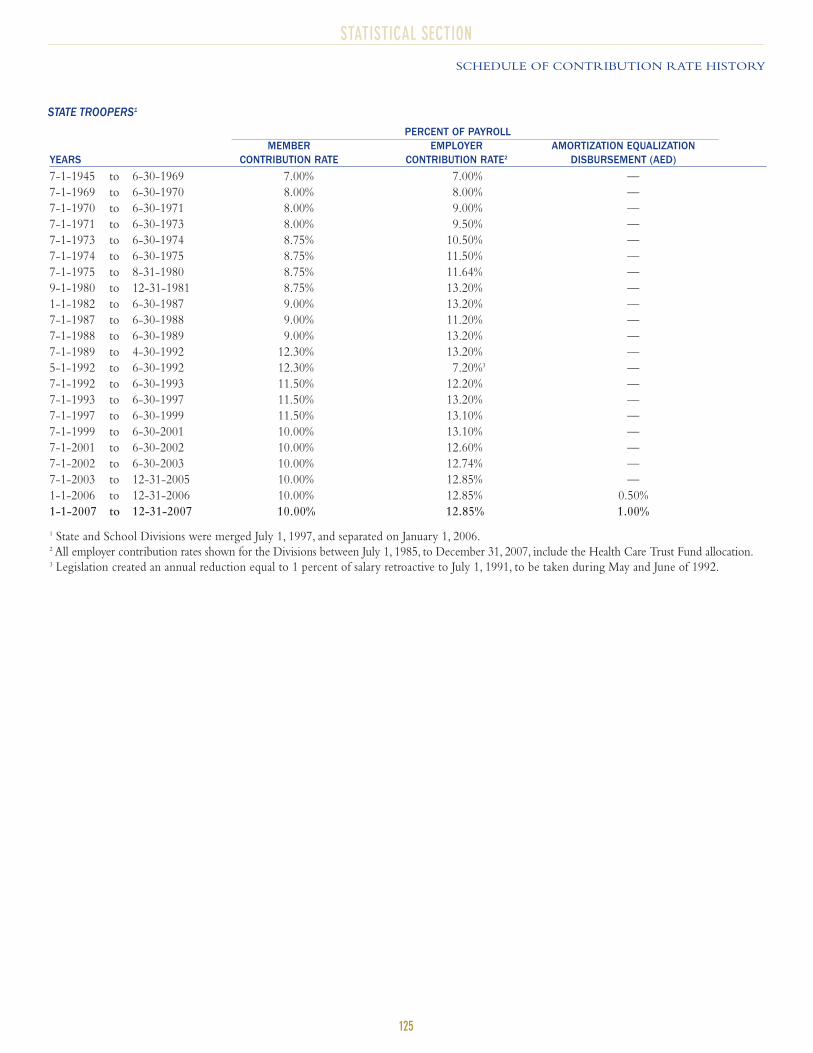
STATISTICAL SECTION
125
STATE TROOPERS1
PERCENT OF PAYROLLMEMBER EMPLOYER AMORTIZATION EQUALIZATION
YEARS CONTRIBUTION RATE CONTRIBUTION RATE2 DISBURSEMENT (AED)
7-1-1945 to 6-30-1969 7.00% 7.00% —
7-1-1969 to 6-30-1970 8.00% 8.00% —
7-1-1970 to 6-30-1971 8.00% 9.00% —
7-1-1971 to 6-30-1973 8.00% 9.50% —
7-1-1973 to 6-30-1974 8.75% 10.50% —
7-1-1974 to 6-30-1975 8.75% 11.50% —
7-1-1975 to 8-31-1980 8.75% 11.64% —
9-1-1980 to 12-31-1981 8.75% 13.20% —
1-1-1982 to 6-30-1987 9.00% 13.20% —
7-1-1987 to 6-30-1988 9.00% 11.20% —
7-1-1988 to 6-30-1989 9.00% 13.20% —
7-1-1989 to 4-30-1992 12.30% 13.20% —
5-1-1992 to 6-30-1992 12.30% 7.20%3 —
7-1-1992 to 6-30-1993 11.50% 12.20% —
7-1-1993 to 6-30-1997 11.50% 13.20% —
7-1-1997 to 6-30-1999 11.50% 13.10% —
7-1-1999 to 6-30-2001 10.00% 13.10% —
7-1-2001 to 6-30-2002 10.00% 12.60% —
7-1-2002 to 6-30-2003 10.00% 12.74% —
7-1-2003 to 12-31-2005 10.00% 12.85% —
1-1-2006 to 12-31-2006 10.00% 12.85% 0.50%
1-1-2007 to 12-31-2007 10.00% 12.85% 1.00%
1 State and School Divisions were merged July 1, 1997, and separated on January 1, 2006.2 All employer contribution rates shown for the Divisions between July 1, 1985, to December 31, 2007, include the Health Care Trust Fund allocation.3 Legislation created an annual reduction equal to 1 percent of salary retroactive to July 1, 1991, to be taken during May and June of 1992.
SCHEDULE OF CONTRIBUTION RATE HISTORY
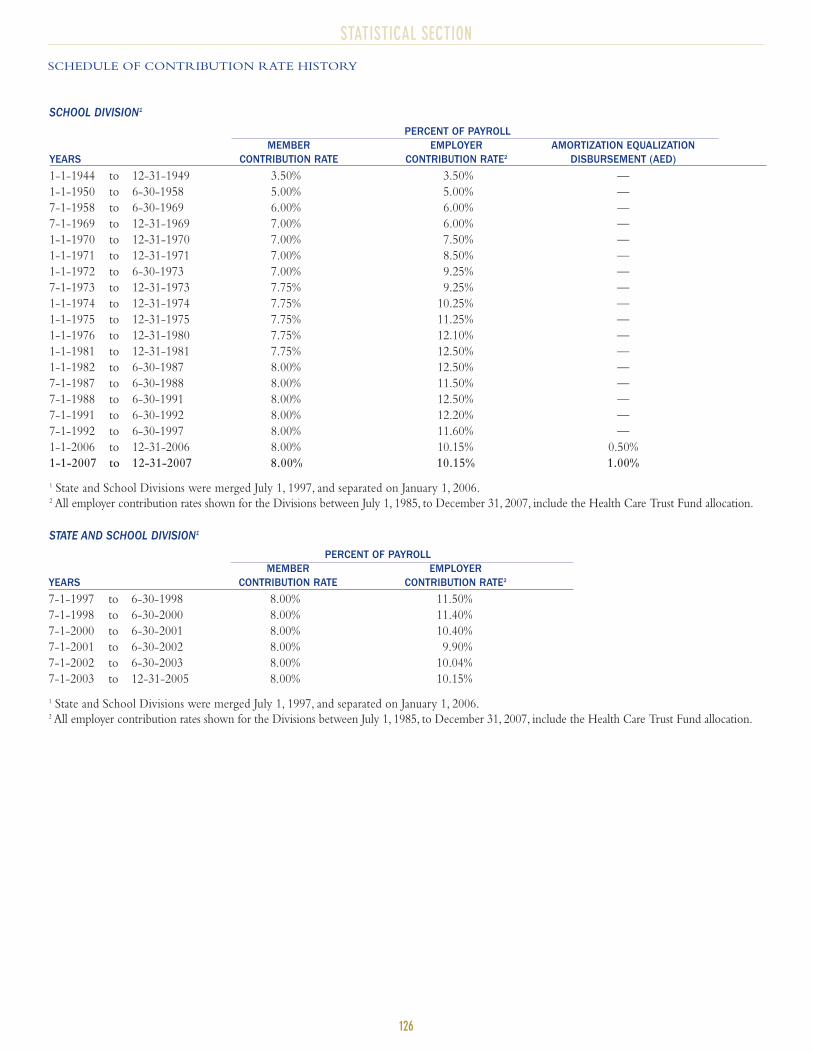
STATISTICAL SECTION
126
SCHEDULE OF CONTRIBUTION RATE HISTORY
SCHOOL DIVISION1
STATE AND SCHOOL DIVISION1
PERCENT OF PAYROLLMEMBER EMPLOYER AMORTIZATION EQUALIZATION
YEARS CONTRIBUTION RATE CONTRIBUTION RATE2 DISBURSEMENT (AED)
1-1-1944 to 12-31-1949 3.50% 3.50% —
1-1-1950 to 6-30-1958 5.00% 5.00% —
7-1-1958 to 6-30-1969 6.00% 6.00% —
7-1-1969 to 12-31-1969 7.00% 6.00% —
1-1-1970 to 12-31-1970 7.00% 7.50% —
1-1-1971 to 12-31-1971 7.00% 8.50% —
1-1-1972 to 6-30-1973 7.00% 9.25% —
7-1-1973 to 12-31-1973 7.75% 9.25% —
1-1-1974 to 12-31-1974 7.75% 10.25% —
1-1-1975 to 12-31-1975 7.75% 11.25% —
1-1-1976 to 12-31-1980 7.75% 12.10% —
1-1-1981 to 12-31-1981 7.75% 12.50% —
1-1-1982 to 6-30-1987 8.00% 12.50% —
7-1-1987 to 6-30-1988 8.00% 11.50% —
7-1-1988 to 6-30-1991 8.00% 12.50% —
7-1-1991 to 6-30-1992 8.00% 12.20% —
7-1-1992 to 6-30-1997 8.00% 11.60% —
1-1-2006 to 12-31-2006 8.00% 10.15% 0.50%
1-1-2007 to 12-31-2007 8.00% 10.15% 1.00%
1 State and School Divisions were merged July 1, 1997, and separated on January 1, 2006.2 All employer contribution rates shown for the Divisions between July 1, 1985, to December 31, 2007, include the Health Care Trust Fund allocation.
PERCENT OF PAYROLLMEMBER EMPLOYER
YEARS CONTRIBUTION RATE CONTRIBUTION RATE2
7-1-1997 to 6-30-1998 8.00% 11.50%
7-1-1998 to 6-30-2000 8.00% 11.40%
7-1-2000 to 6-30-2001 8.00% 10.40%
7-1-2001 to 6-30-2002 8.00% 9.90%
7-1-2002 to 6-30-2003 8.00% 10.04%
7-1-2003 to 12-31-2005 8.00% 10.15%
1 State and School Divisions were merged July 1, 1997, and separated on January 1, 2006.2 All employer contribution rates shown for the Divisions between July 1, 1985, to December 31, 2007, include the Health Care Trust Fund allocation.
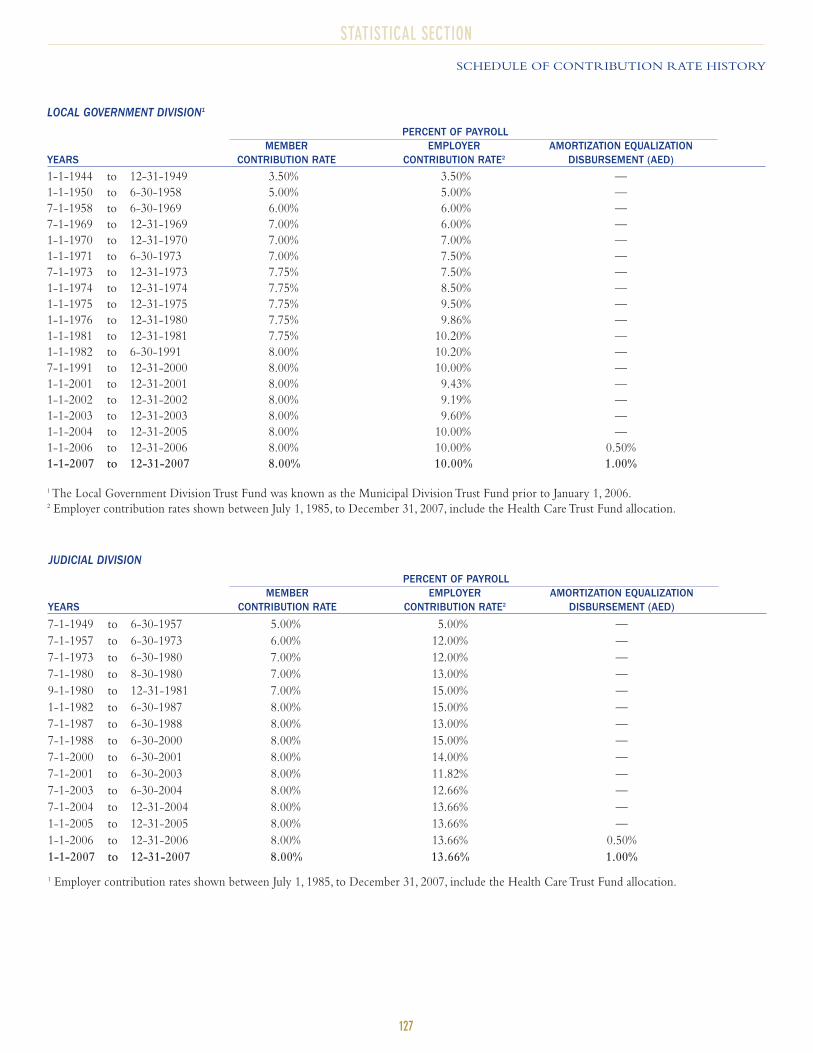
STATISTICAL SECTION
127
SCHEDULE OF CONTRIBUTION RATE HISTORY
JUDICIAL DIVISION
PERCENT OF PAYROLLMEMBER EMPLOYER AMORTIZATION EQUALIZATION
YEARS CONTRIBUTION RATE CONTRIBUTION RATE2 DISBURSEMENT (AED)
7-1-1949 to 6-30-1957 5.00% 5.00% —
7-1-1957 to 6-30-1973 6.00% 12.00% —
7-1-1973 to 6-30-1980 7.00% 12.00% —
7-1-1980 to 8-30-1980 7.00% 13.00% —
9-1-1980 to 12-31-1981 7.00% 15.00% —
1-1-1982 to 6-30-1987 8.00% 15.00% —
7-1-1987 to 6-30-1988 8.00% 13.00% —
7-1-1988 to 6-30-2000 8.00% 15.00% —
7-1-2000 to 6-30-2001 8.00% 14.00% —
7-1-2001 to 6-30-2003 8.00% 11.82% —
7-1-2003 to 6-30-2004 8.00% 12.66% —
7-1-2004 to 12-31-2004 8.00% 13.66% —
1-1-2005 to 12-31-2005 8.00% 13.66% —
1-1-2006 to 12-31-2006 8.00% 13.66% 0.50%
1-1-2007 to 12-31-2007 8.00% 13.66% 1.00%
1 Employer contribution rates shown between July 1, 1985, to December 31, 2007, include the Health Care Trust Fund allocation.
LOCAL GOVERNMENT DIVISION1
PERCENT OF PAYROLLMEMBER EMPLOYER AMORTIZATION EQUALIZATION
YEARS CONTRIBUTION RATE CONTRIBUTION RATE2 DISBURSEMENT (AED)
1-1-1944 to 12-31-1949 3.50% 3.50% —
1-1-1950 to 6-30-1958 5.00% 5.00% —
7-1-1958 to 6-30-1969 6.00% 6.00% —
7-1-1969 to 12-31-1969 7.00% 6.00% —
1-1-1970 to 12-31-1970 7.00% 7.00% —
1-1-1971 to 6-30-1973 7.00% 7.50% —
7-1-1973 to 12-31-1973 7.75% 7.50% —
1-1-1974 to 12-31-1974 7.75% 8.50% —
1-1-1975 to 12-31-1975 7.75% 9.50% —
1-1-1976 to 12-31-1980 7.75% 9.86% —
1-1-1981 to 12-31-1981 7.75% 10.20% —
1-1-1982 to 6-30-1991 8.00% 10.20% —
7-1-1991 to 12-31-2000 8.00% 10.00% —
1-1-2001 to 12-31-2001 8.00% 9.43% —
1-1-2002 to 12-31-2002 8.00% 9.19% —
1-1-2003 to 12-31-2003 8.00% 9.60% —
1-1-2004 to 12-31-2005 8.00% 10.00% —
1-1-2006 to 12-31-2006 8.00% 10.00% 0.50%
1-1-2007 to 12-31-2007 8.00% 10.00% 1.00%
1 The Local Government Division Trust Fund was known as the Municipal Division Trust Fund prior to January 1, 2006.2 Employer contribution rates shown between July 1, 1985, to December 31, 2007, include the Health Care Trust Fund allocation.
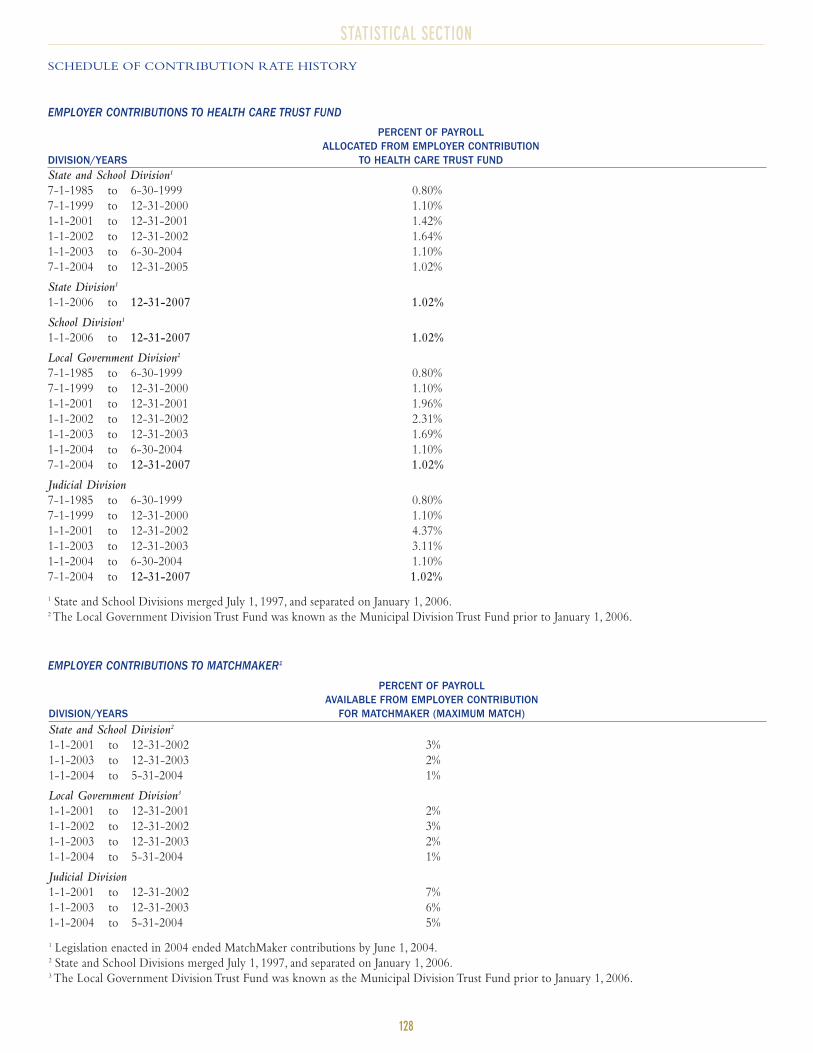
STATISTICAL SECTION
128
EMPLOYER CONTRIBUTIONS TO HEALTH CARE TRUST FUND
EMPLOYER CONTRIBUTIONS TO MATCHMAKER1
PERCENT OF PAYROLLALLOCATED FROM EMPLOYER CONTRIBUTION
DIVISION/YEARS TO HEALTH CARE TRUST FUNDState and School Division1
7-1-1985 to 6-30-1999 0.80%
7-1-1999 to 12-31-2000 1.10%
1-1-2001 to 12-31-2001 1.42%
1-1-2002 to 12-31-2002 1.64%
1-1-2003 to 6-30-2004 1.10%
7-1-2004 to 12-31-2005 1.02%
State Division1
1-1-2006 to 12-31-2007 1.02%
School Division1
1-1-2006 to 12-31-2007 1.02%
Local Government Division2
7-1-1985 to 6-30-1999 0.80%
7-1-1999 to 12-31-2000 1.10%
1-1-2001 to 12-31-2001 1.96%
1-1-2002 to 12-31-2002 2.31%
1-1-2003 to 12-31-2003 1.69%
1-1-2004 to 6-30-2004 1.10%
7-1-2004 to 12-31-2007 1.02%
Judicial Division
7-1-1985 to 6-30-1999 0.80%
7-1-1999 to 12-31-2000 1.10%
1-1-2001 to 12-31-2002 4.37%
1-1-2003 to 12-31-2003 3.11%
1-1-2004 to 6-30-2004 1.10%
7-1-2004 to 12-31-2007 1.02%
1 State and School Divisions merged July 1, 1997, and separated on January 1, 2006.2 The Local Government Division Trust Fund was known as the Municipal Division Trust Fund prior to January 1, 2006.
PERCENT OF PAYROLLAVAILABLE FROM EMPLOYER CONTRIBUTION
DIVISION/YEARS FOR MATCHMAKER (MAXIMUM MATCH)
State and School Division2
1-1-2001 to 12-31-2002 3%
1-1-2003 to 12-31-2003 2%
1-1-2004 to 5-31-2004 1%
Local Government Division3
1-1-2001 to 12-31-2001 2%
1-1-2002 to 12-31-2002 3%
1-1-2003 to 12-31-2003 2%
1-1-2004 to 5-31-2004 1%
Judicial Division
1-1-2001 to 12-31-2002 7%
1-1-2003 to 12-31-2003 6%
1-1-2004 to 5-31-2004 5%
1 Legislation enacted in 2004 ended MatchMaker contributions by June 1, 2004.2 State and School Divisions merged July 1, 1997, and separated on January 1, 2006.3 The Local Government Division Trust Fund was known as the Municipal Division Trust Fund prior to January 1, 2006.
SCHEDULE OF CONTRIBUTION RATE HISTORY
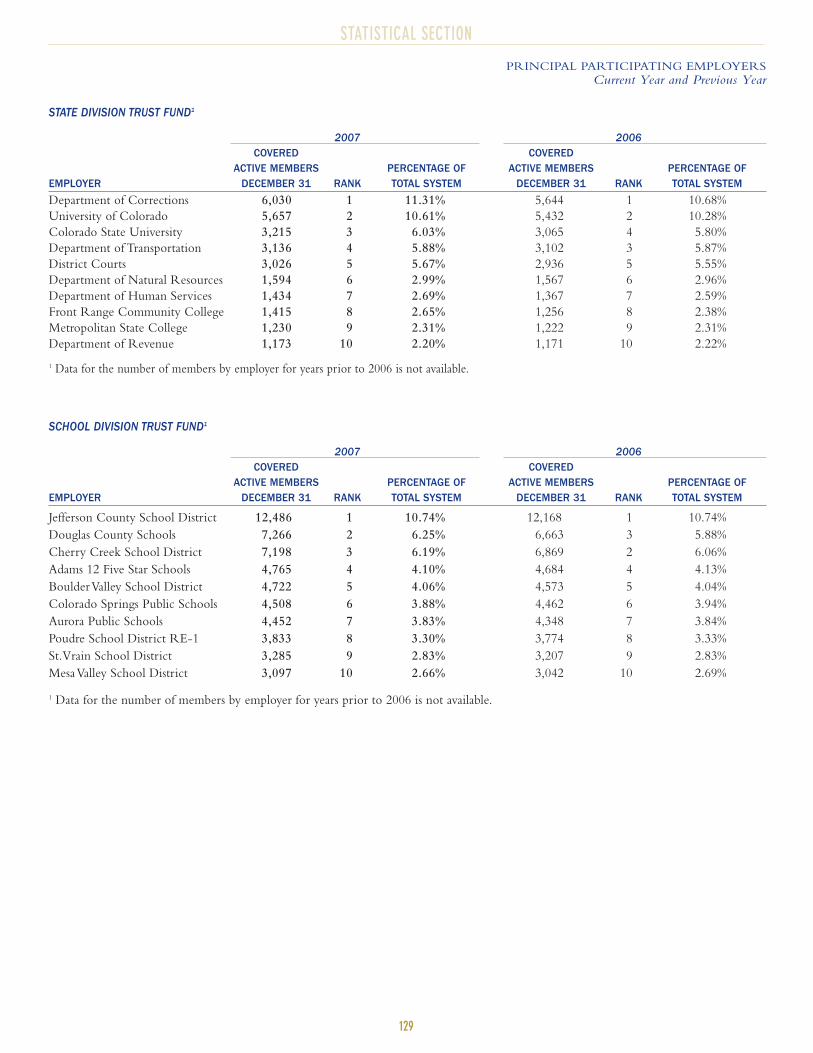
STATISTICAL SECTION
129
PRINCIPAL PARTICIPATING EMPLOYERS
Current Year and Previous Year
SCHOOL DIVISION TRUST FUND1
2007 2006COVERED COVERED
ACTIVE MEMBERS PERCENTAGE OF ACTIVE MEMBERS PERCENTAGE OFEMPLOYER DECEMBER 31 RANK TOTAL SYSTEM DECEMBER 31 RANK TOTAL SYSTEM
Jefferson County School District 12,486 1 10.74% 12,168 1 10.74%
Douglas County Schools 7,266 2 6.25% 6,663 3 5.88%
Cherry Creek School District 7,198 3 6.19% 6,869 2 6.06%
Adams 12 Five Star Schools 4,765 4 4.10% 4,684 4 4.13%
Boulder Valley School District 4,722 5 4.06% 4,573 5 4.04%
Colorado Springs Public Schools 4,508 6 3.88% 4,462 6 3.94%
Aurora Public Schools 4,452 7 3.83% 4,348 7 3.84%
Poudre School District RE-1 3,833 8 3.30% 3,774 8 3.33%
St.Vrain School District 3,285 9 2.83% 3,207 9 2.83%
Mesa Valley School District 3,097 10 2.66% 3,042 10 2.69%
1 Data for the number of members by employer for years prior to 2006 is not available.
STATE DIVISION TRUST FUND1
2007 2006COVERED COVERED
ACTIVE MEMBERS PERCENTAGE OF ACTIVE MEMBERS PERCENTAGE OFEMPLOYER DECEMBER 31 RANK TOTAL SYSTEM DECEMBER 31 RANK TOTAL SYSTEM
Department of Corrections 6,030 1 11.31% 5,644 1 10.68%
University of Colorado 5,657 2 10.61% 5,432 2 10.28%
Colorado State University 3,215 3 6.03% 3,065 4 5.80%
Department of Transportation 3,136 4 5.88% 3,102 3 5.87%
District Courts 3,026 5 5.67% 2,936 5 5.55%
Department of Natural Resources 1,594 6 2.99% 1,567 6 2.96%
Department of Human Services 1,434 7 2.69% 1,367 7 2.59%
Front Range Community College 1,415 8 2.65% 1,256 8 2.38%
Metropolitan State College 1,230 9 2.31% 1,222 9 2.31%
Department of Revenue 1,173 10 2.20% 1,171 10 2.22%
1 Data for the number of members by employer for years prior to 2006 is not available.
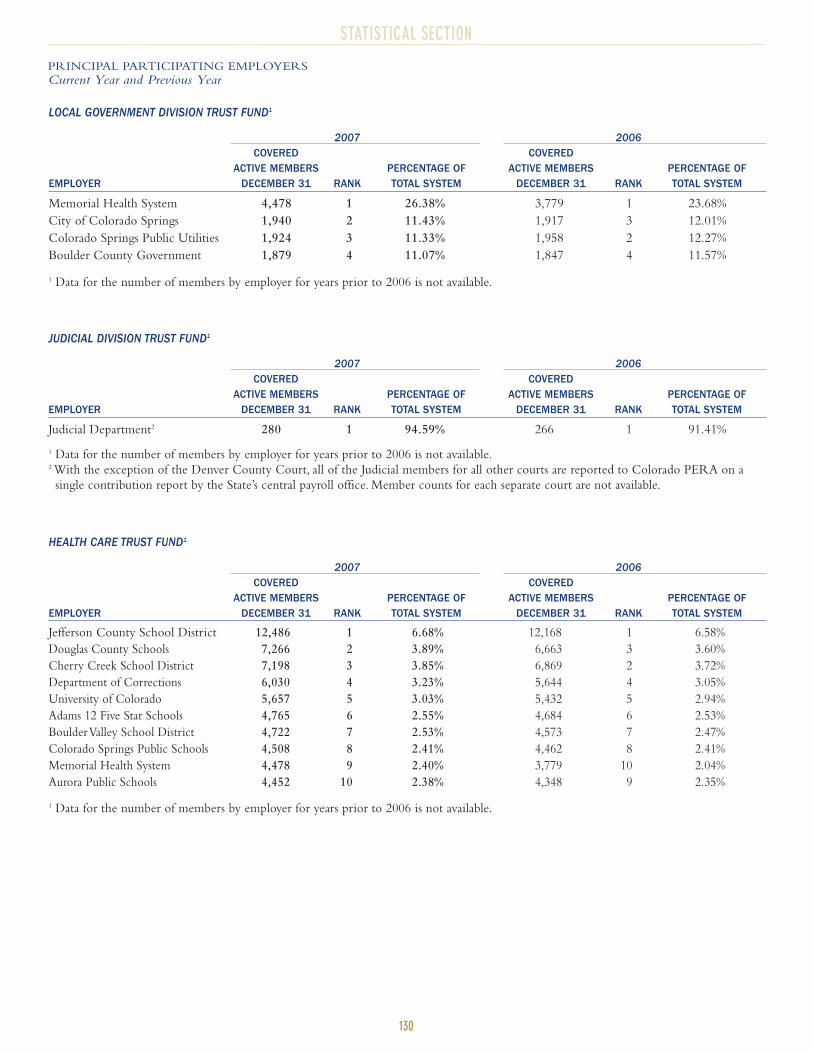
STATISTICAL SECTION
130
JUDICIAL DIVISION TRUST FUND1
2007 2006COVERED COVERED
ACTIVE MEMBERS PERCENTAGE OF ACTIVE MEMBERS PERCENTAGE OFEMPLOYER DECEMBER 31 RANK TOTAL SYSTEM DECEMBER 31 RANK TOTAL SYSTEM
Judicial Department2 280 1 94.59% 266 1 91.41%
1 Data for the number of members by employer for years prior to 2006 is not available.2 With the exception of the Denver County Court, all of the Judicial members for all other courts are reported to Colorado PERA on a
single contribution report by the State’s central payroll office. Member counts for each separate court are not available.
HEALTH CARE TRUST FUND1
2007 2006COVERED COVERED
ACTIVE MEMBERS PERCENTAGE OF ACTIVE MEMBERS PERCENTAGE OFEMPLOYER DECEMBER 31 RANK TOTAL SYSTEM DECEMBER 31 RANK TOTAL SYSTEM
Jefferson County School District 12,486 1 6.68% 12,168 1 6.58%
Douglas County Schools 7,266 2 3.89% 6,663 3 3.60%
Cherry Creek School District 7,198 3 3.85% 6,869 2 3.72%
Department of Corrections 6,030 4 3.23% 5,644 4 3.05%
University of Colorado 5,657 5 3.03% 5,432 5 2.94%
Adams 12 Five Star Schools 4,765 6 2.55% 4,684 6 2.53%
Boulder Valley School District 4,722 7 2.53% 4,573 7 2.47%
Colorado Springs Public Schools 4,508 8 2.41% 4,462 8 2.41%
Memorial Health System 4,478 9 2.40% 3,779 10 2.04%
Aurora Public Schools 4,452 10 2.38% 4,348 9 2.35%
1 Data for the number of members by employer for years prior to 2006 is not available.
LOCAL GOVERNMENT DIVISION TRUST FUND1
2007 2006COVERED COVERED
ACTIVE MEMBERS PERCENTAGE OF ACTIVE MEMBERS PERCENTAGE OFEMPLOYER DECEMBER 31 RANK TOTAL SYSTEM DECEMBER 31 RANK TOTAL SYSTEM
Memorial Health System 4,478 1 26.38% 3,779 1 23.68%
City of Colorado Springs 1,940 2 11.43% 1,917 3 12.01%
Colorado Springs Public Utilities 1,924 3 11.33% 1,958 2 12.27%
Boulder County Government 1,879 4 11.07% 1,847 4 11.57%
1 Data for the number of members by employer for years prior to 2006 is not available.
PRINCIPAL PARTICIPATING EMPLOYERS
Current Year and Previous Year
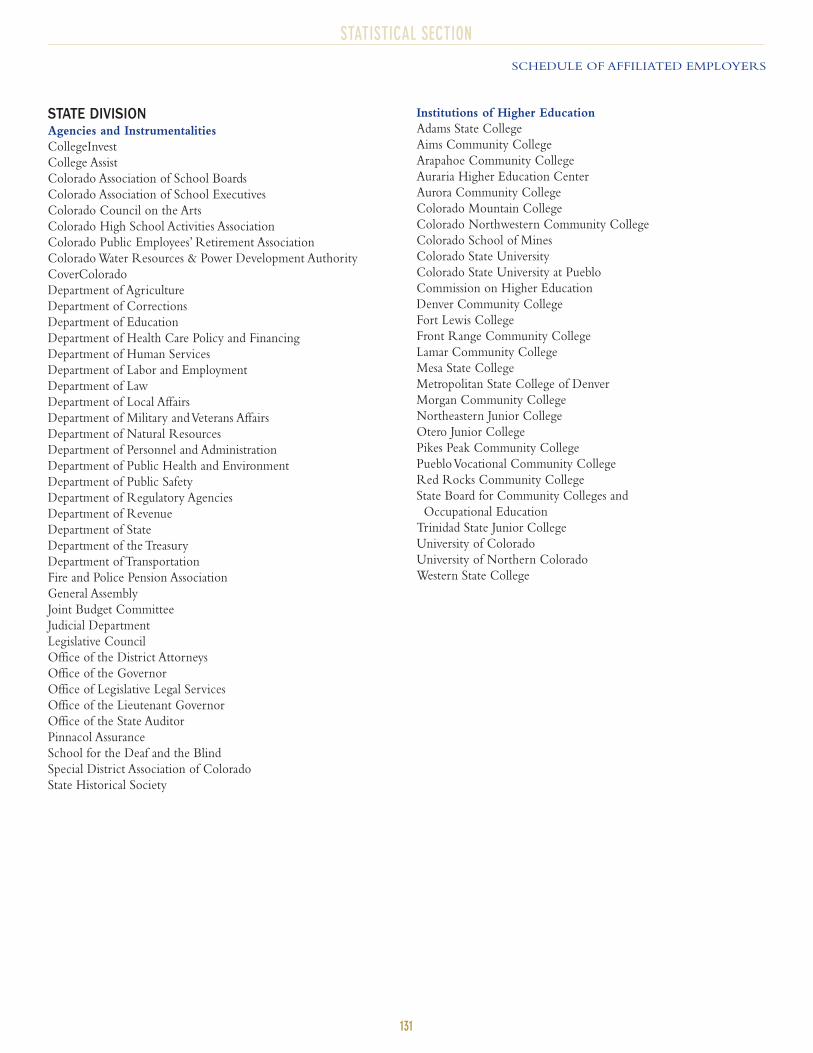
STATISTICAL SECTION
131
SCHEDULE OF AFFILIATED EMPLOYERS
STATE DIVISIONAgencies and Instrumentalities
CollegeInvest
College Assist
Colorado Association of School Boards
Colorado Association of School Executives
Colorado Council on the Arts
Colorado High School Activities Association
Colorado Public Employees’ Retirement Association
Colorado Water Resources & Power Development Authority
CoverColorado
Department of Agriculture
Department of Corrections
Department of Education
Department of Health Care Policy and Financing
Department of Human Services
Department of Labor and Employment
Department of Law
Department of Local Affairs
Department of Military and Veterans Affairs
Department of Natural Resources
Department of Personnel and Administration
Department of Public Health and Environment
Department of Public Safety
Department of Regulatory Agencies
Department of Revenue
Department of State
Department of the Treasury
Department of Transportation
Fire and Police Pension Association
General Assembly
Joint Budget Committee
Judicial Department
Legislative Council
Office of the District Attorneys
Office of the Governor
Office of Legislative Legal Services
Office of the Lieutenant Governor
Office of the State Auditor
Pinnacol Assurance
School for the Deaf and the Blind
Special District Association of Colorado
State Historical Society
Institutions of Higher Education
Adams State College
Aims Community College
Arapahoe Community College
Auraria Higher Education Center
Aurora Community College
Colorado Mountain College
Colorado Northwestern Community College
Colorado School of Mines
Colorado State University
Colorado State University at Pueblo
Commission on Higher Education
Denver Community College
Fort Lewis College
Front Range Community College
Lamar Community College
Mesa State College
Metropolitan State College of Denver
Morgan Community College
Northeastern Junior College
Otero Junior College
Pikes Peak Community College
Pueblo Vocational Community College
Red Rocks Community College
State Board for Community Colleges and
Occupational Education
Trinidad State Junior College
University of Colorado
University of Northern Colorado
Western State College

STATISTICAL SECTION
132
SCHOOL DIVISIONAdams County
Adams 12 Five Star Schools
Adams County School District 14
Bennett School District 29J
Brighton School District 27J
Mapleton School District 1
Strasburg School District 31J
Westminster School District 50
Alamosa County
Alamosa County School District Re-11J
Sangre de Cristo School District Re-22J
Arapahoe County
Adams-Arapahoe School District 28J
Byers School District 32J
Cherry Creek School District 5
Deer Trail School District 26J
Englewood School District 1
Littleton School District 6
Sheridan School District 2
Archuleta County
Archuleta County School District 50 Jt
Baca County
Campo School District RE-6
Pritchett School District RE-3
Springfield School District RE-4
Vilas School District RE-5
Walsh School District RE-1
Bent County
Las Animas School District RE-1
McClave School District RE-2
Boulder County
Boulder Valley School District RE2
St.Vrain Valley School District RE1J
Chaffee County
Buena Vista School District R-31
Salida School District R-32(J)
Cheyenne County
Cheyenne County School District Re-5
Kit Carson School District R-1
Clear Creek County
Clear Creek School District RE-1
Conejos County
North Conejos School District RE1J
Sanford School District 6J
South Conejos School District RE 10
Costilla County
Centennial School District R-1
Sierra Grande School District R-30
Crowley County
Crowley County School District RE-1
Custer County
Custer County Consolidated School District C-1
Delta County
Delta County School District 50(J)
Dolores County
Dolores County School District Re No. 2
Douglas County
Douglas County School District Re 1
Eagle County
Eagle County School District Re 50
Elbert County
Agate School District 300
Big Sandy School District 100J
Elbert School District 200
Elizabeth School District C-1
Kiowa School District C-2
El Paso County
Academy School District #20
Calhan School District RJ1
Cheyenne Mountain School District 12
Colorado Springs School District 11
Edison School District 54 Jt
Ellicott School District 22
Falcon School District 49
Fountain School District 8
Hanover School District 28
Harrison School District 2
Lewis-Palmer School District 38
Manitou Springs School District 14
Miami/Yoder School District 60 Jt
Peyton School District 23 Jt
Widefield School District 3
Fremont County
Canon City School District Re-1
Cotopaxi School District Re-3
Florence School District Re-2
Garfield County
Garfield School District 16
Garfield School District Re-2
Roaring Fork School District Re-1
Gilpin County
Gilpin County School District Re-1
SCHEDULE OF AFFILIATED EMPLOYERS
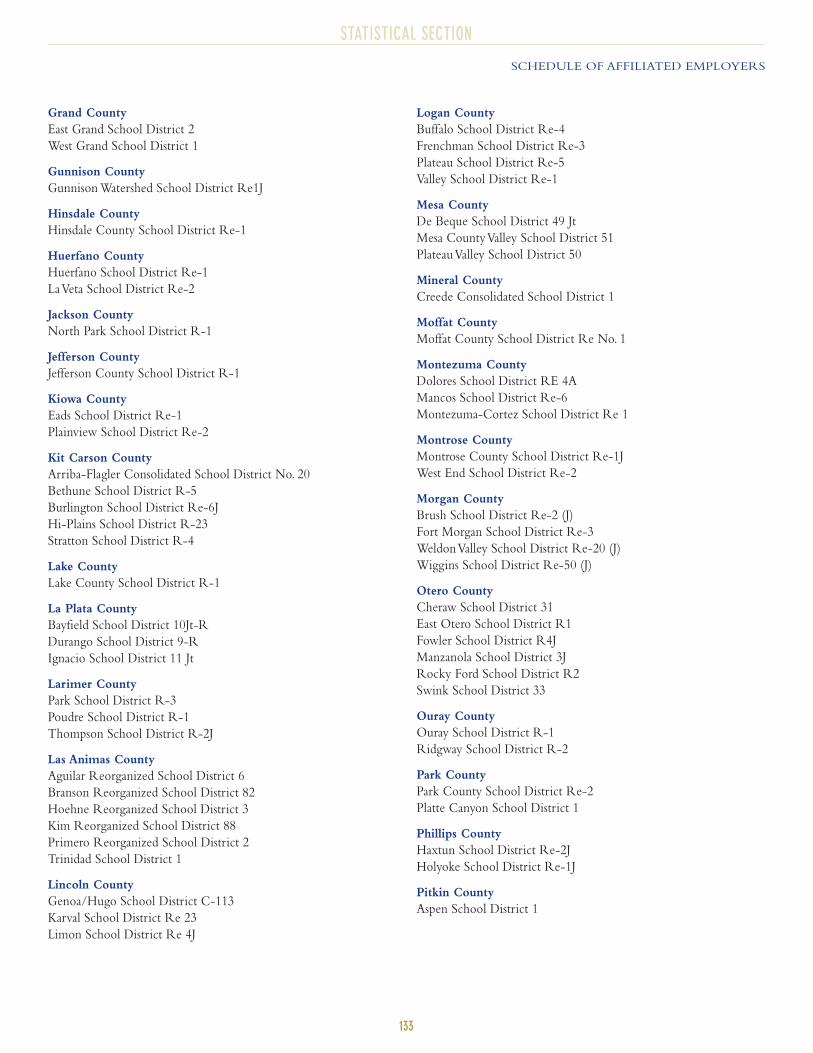
STATISTICAL SECTION
133
SCHEDULE OF AFFILIATED EMPLOYERS
Grand County
East Grand School District 2
West Grand School District 1
Gunnison County
Gunnison Watershed School District Re1J
Hinsdale County
Hinsdale County School District Re-1
Huerfano County
Huerfano School District Re-1
La Veta School District Re-2
Jackson County
North Park School District R-1
Jefferson County
Jefferson County School District R-1
Kiowa County
Eads School District Re-1
Plainview School District Re-2
Kit Carson County
Arriba-Flagler Consolidated School District No. 20
Bethune School District R-5
Burlington School District Re-6J
Hi-Plains School District R-23
Stratton School District R-4
Lake County
Lake County School District R-1
La Plata County
Bayfield School District 10Jt-R
Durango School District 9-R
Ignacio School District 11 Jt
Larimer County
Park School District R-3
Poudre School District R-1
Thompson School District R-2J
Las Animas County
Aguilar Reorganized School District 6
Branson Reorganized School District 82
Hoehne Reorganized School District 3
Kim Reorganized School District 88
Primero Reorganized School District 2
Trinidad School District 1
Lincoln County
Genoa/Hugo School District C-113
Karval School District Re 23
Limon School District Re 4J
Logan County
Buffalo School District Re-4
Frenchman School District Re-3
Plateau School District Re-5
Valley School District Re-1
Mesa County
De Beque School District 49 Jt
Mesa County Valley School District 51
Plateau Valley School District 50
Mineral County
Creede Consolidated School District 1
Moffat County
Moffat County School District Re No. 1
Montezuma County
Dolores School District RE 4A
Mancos School District Re-6
Montezuma-Cortez School District Re 1
Montrose County
Montrose County School District Re-1J
West End School District Re-2
Morgan County
Brush School District Re-2 (J)
Fort Morgan School District Re-3
Weldon Valley School District Re-20 (J)
Wiggins School District Re-50 (J)
Otero County
Cheraw School District 31
East Otero School District R1
Fowler School District R4J
Manzanola School District 3J
Rocky Ford School District R2
Swink School District 33
Ouray County
Ouray School District R-1
Ridgway School District R-2
Park County
Park County School District Re-2
Platte Canyon School District 1
Phillips County
Haxtun School District Re-2J
Holyoke School District Re-1J
Pitkin County
Aspen School District 1
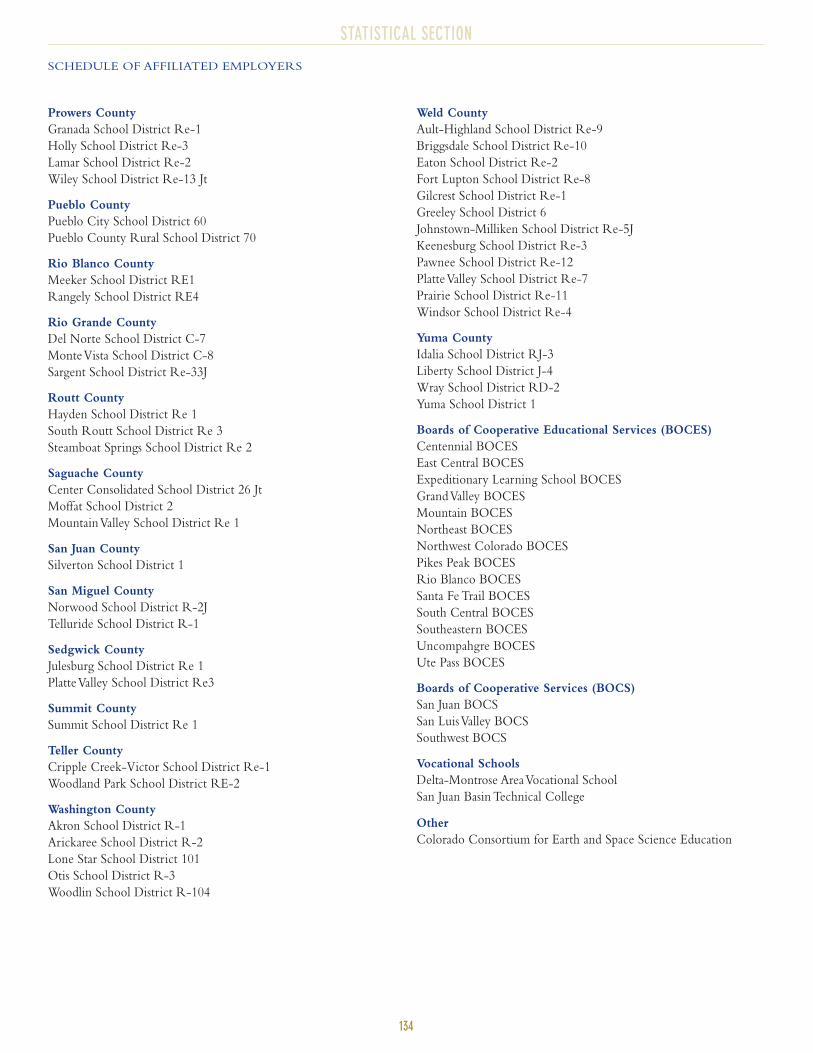
STATISTICAL SECTION
134
Prowers County
Granada School District Re-1
Holly School District Re-3
Lamar School District Re-2
Wiley School District Re-13 Jt
Pueblo County
Pueblo City School District 60
Pueblo County Rural School District 70
Rio Blanco County
Meeker School District RE1
Rangely School District RE4
Rio Grande County
Del Norte School District C-7
Monte Vista School District C-8
Sargent School District Re-33J
Routt County
Hayden School District Re 1
South Routt School District Re 3
Steamboat Springs School District Re 2
Saguache County
Center Consolidated School District 26 Jt
Moffat School District 2
Mountain Valley School District Re 1
San Juan County
Silverton School District 1
San Miguel County
Norwood School District R-2J
Telluride School District R-1
Sedgwick County
Julesburg School District Re 1
Platte Valley School District Re3
Summit County
Summit School District Re 1
Teller County
Cripple Creek-Victor School District Re-1
Woodland Park School District RE-2
Washington County
Akron School District R-1
Arickaree School District R-2
Lone Star School District 101
Otis School District R-3
Woodlin School District R-104
Weld County
Ault-Highland School District Re-9
Briggsdale School District Re-10
Eaton School District Re-2
Fort Lupton School District Re-8
Gilcrest School District Re-1
Greeley School District 6
Johnstown-Milliken School District Re-5J
Keenesburg School District Re-3
Pawnee School District Re-12
Platte Valley School District Re-7
Prairie School District Re-11
Windsor School District Re-4
Yuma County
Idalia School District RJ-3
Liberty School District J-4
Wray School District RD-2
Yuma School District 1
Boards of Cooperative Educational Services (BOCES)
Centennial BOCES
East Central BOCES
Expeditionary Learning School BOCES
Grand Valley BOCES
Mountain BOCES
Northeast BOCES
Northwest Colorado BOCES
Pikes Peak BOCES
Rio Blanco BOCES
Santa Fe Trail BOCES
South Central BOCES
Southeastern BOCES
Uncompahgre BOCES
Ute Pass BOCES
Boards of Cooperative Services (BOCS)
San Juan BOCS
San Luis Valley BOCS
Southwest BOCS
Vocational Schools
Delta-Montrose Area Vocational School
San Juan Basin Technical College
Other
Colorado Consortium for Earth and Space Science Education
SCHEDULE OF AFFILIATED EMPLOYERS
STATISTICAL SECTION
135
SCHEDULE OF AFFILIATED EMPLOYERS
LOCAL GOVERNMENT DIVISIONAdams and Jefferson County Hazardous Response Authority
Alamosa Housing Authority
Arapahoe Park and Recreation District
Aurora Housing Authority
Baca Grande Water & Sanitation District
Beulah Water Works District
Black Hawk-Central City Sanitation District
Blanca-Fort Garland Metropolitan District
Boulder County
Boulder County Public Trustee’s Office
Boxelder Sanitation District
Brush Housing Authority
Carbon Valley Park & Recreation District
Castle Pines Metropolitan District
Castle Pines North Metropolitan District
Center Housing Authority
Central Colorado Water Conservancy District
City of Alamosa
City of Boulder
City of Colorado Springs
City of Fort Morgan
City of Las Animas
City of Lone Tree
City of Manitou Springs
City of Pueblo
City of Wray
City of Yuma
Collbran Conservancy District
Colorado District Attorneys’ Council
Colorado First Conservation District
Colorado Health Facilities Authority
Colorado Housing and Finance Authority
Colorado Library Consortium
Colorado School District Self Insurance Pool
Colorado Springs Utilities
Columbine Knolls-Grove Metropolitan Recreation District
Costilla Housing Authority
County Technical Services
Crown Mountain Park & Recreation District
Cunningham Fire Protection District
Douglas County Housing Partnership
Douglas Public Library District
Durango Fire and Rescue Authority
East Cheyenne Groundwater Management District
East Larimer County Water District
Eastern Rio Blanco Metropolitan Recreation & Park District
Eaton Housing Authority
Elbert County Library District
Elizabeth Park and Recreation District
Estes Valley Public Library District
Forest Lakes Metropolitan District
Fremont Conservation District
Fremont Sanitation District
Garfield County Housing Authority
Grand Junction Regional Airport Authority
Grand Valley Fire Protection District
Green Mountain Water and Sanitation District
GVR Metropolitan District
Housing Authority of the City of Boulder
Housing Authority of the County of Adams
Housing Authority of the Town of Limon
Lamar Housing Authority
Lamar Utilities Board
Left Hand Water District
Longmont Housing Authority
Longs Peak Water District
Louisville Fire Protection District
Meeker Cemetery District
Meeker Regional Library District
Meeker Sanitation District
Memorial Health System
Montrose Fire Protection District
Montrose Recreation District
Monument Sanitation District
Morgan Conservation District
Morgan County Quality Water District
Mountain View Fire Protection District
Mountain Village Metropolitan District
Mountain Water and Sanitation District
Niwot Sanitation District
North Carter Lake Water District
North Chaffee County Regional Library
Northeast Colorado Health Department
Northeastern Colorado Association of Local Governments
Park Center Water District
Pine Drive Water District
Prowers Conservation District
Pueblo City-County Health Department
Pueblo Library District
Pueblo Transit Authority
Rampart Regional Library District
Rangely Regional Library District
Red Feather Mountain Library District
Red,White & Blue Fire Protection District
Republican River Water Conservation District
Rifle Fire Protection District
Rio Blanco Fire Protection District
Rio Blanco Water Conservancy District
Routt County Conservation District
Sable-Altura Fire Protection District
San Luis Valley Development Resources Group
San Luis Valley Water Conservancy District
San Miguel County Public Library
San Miguel Regional and Telluride Housing Authority
Scientific and Cultural Facilities District
STATISTICAL SECTION
136
Sheridan Sanitation District #1
Soldier Canyon Filter Plant
Steamboat II Water and Sanitation District
St.Vrain Sanitation District
Tabernash Meadows Water and Sanitation District
Town of Alma
Town of Bayfield
Town of Crawford
Town of Dinosaur
Town of Eckley
Town of Estes Park
Town of Firestone
Town of Lake City
Town of Lochbuie
Town of Mountain Village
Town of Platteville
Town of Rico
Town of Rye
Town of Seibert
Town of Silver Plume
Town of Timnath
Tri-County Health Department
Upper Colorado Environmental Plant Center
Washington-Yuma Counties Combined Communications Center
Weld County Department of Public Health and Environment
West Greeley Conservation District
Western Rio Blanco Metropolitan Recreation and Park District
White River Conservation District
Windsor-Severance Library District
Wray Housing Authority
Yuma Housing Authority
Y-W Well Testing Association
JUDICIAL DIVISION1st-23rd District Court
24th District-Denver Probate Court
25th District-Denver Juvenile Court
Adams County Court
Alamosa County Court
Arapahoe County Court
Archuleta County Court
Baca County Court
Bent County Court
Boulder County Court
Broomfield County Court
Chaffee County Court
Cheyenne County Court
Clear Creek County Court
Conejos County Court
Costilla County Court
Court of Appeals
Crowley County Court
Custer County Court
Delta County Court
Denver County Court
Dolores County Court
Douglas County Court
Eagle County Court
Elbert County Court
El Paso County Court
Fremont County Court
Garfield County Court
Gilpin County Court
Grand County Court
Gunnison County Court
Hinsdale County Court
Huerfano County Court
Jackson County Court
Jefferson County Court
Kiowa County Court
Kit Carson County Court
Lake County Court
La Plata County Court
Larimer County Court
Las Animas County Court
Lincoln County Court
Logan County Court
Mesa County Court
Mineral County Court
Moffat County Court
Montezuma County Court
Montrose County Court
Morgan County Court
Otero County Court
Ouray County Court
Park County Court
Phillips County Court
Pitkin County Court
Prowers County Court
Pueblo County Court
Rio Blanco County Court
Rio Grande County Court
Routt County Court
Saguache County Court
San Juan County Court
San Miguel County Court
Sedgwick County Court
Summit County Court
Supreme Court
Teller County Court
Washington County Court
Weld County Court
Yuma County Court
SCHEDULE OF AFFILIATED EMPLOYERS

Personal. Innovative. Secure.5/20 (REV 6-08) 2M
Colorado Public Employees’ Retirement Association1300 Logan Street, Denver, Colorado 80203-2386303-832-9550 1-800-759-7372www.copera.org