IMPROVING EMPLOYEES AND ORGANIZATION ...
15
IMPROVING EMPLOYEES AND ORGANIZATION PERFORMANCE USING BUSINESS SIMULATION AND MODELING Lecturer PhD Nicoleta Valentina FLOREA Valahia University of Targoviste Email: [email protected] Abstract: Changes in the internal and external environment, such as globalization, internationalization and liberalization of markets, using new technology in almost all organizations processes, continuous changing of customer behavior, but also of employees and managers, make modeling and simulation processes become increasingly used and necessary when direct experience real system is not possible or advisable. In this article we intend to analyze the important role and the advantages and disadvantages of simulation and modeling processes in organizations. In our research we apply one of the business simulation models, using a mathematical model (multi-factorial regression function) and a computer program (Data Analysis from Excel), only to demonstrate that a simulation process may increase process performance by streamlining resources, reducing the time and costs involved in growth teamwork efficiency, the rationalization, knowledge and experiences to the development of human capital involved, but also reduce the cost of sales, which are fundamental aspects in the current global economic situation. Keywords: employees, organization, simulation, modeling, performance. Introduction Today we are living in a rapidly, changing world, change which is not always desired (Palmer B., 2004). To cope with these changes, organizations must make this change to seem normal and be accepted in any organization’ and its employees’ life (Griffin R., Moorehead G., 2014, p.546). The changes are brought by globalization of markets, the internationalization and liberalization, continuous change of customers’ needs and desires, competition, legislation, culture, structure and size of the companies. Most experts say that the best place for analyzing and understanding a process is at the end of the chain where the consumer is (Laguna M., Marklund J., 2011, p.83). All these lead to increased pressure on decision makers from business, and new requirements on how to develop and adopt decisions (Luban F., 2005). To make decisions and get performance, organizations can turn to build a future desired, simulated using modeling tools and information technology (Ratiu-Suciu C., 2003). Thus, organizations may use different models and software with which organizations will be able to simulate the desired future development of its business. Thus, modeling and simulation become necessary when direct experience of real system is not possible or advisable. A simulation process may enhance the performance of a process by streamlining resources, reducing the time and costs involved
-
Upload
khangminh22 -
Category
Documents
-
view
0 -
download
0
Transcript of IMPROVING EMPLOYEES AND ORGANIZATION ...

IMPROVING EMPLOYEES AND ORGANIZATION PERFORMANCE USING BUSINESS SIMULATION AND
MODELING
Lecturer PhD Nicoleta Valentina FLOREA Valahia University of Targoviste Email: [email protected]
Abstract: Changes in the internal and external environment, such as globalization, internationalization and liberalization of markets, using new technology in almost all organizations processes, continuous changing of customer behavior, but also of employees and managers, make modeling and simulation processes become increasingly used and necessary when direct experience real system is not possible or advisable. In this article we intend to analyze the important role and the advantages and disadvantages of simulation and modeling processes in organizations. In our research we apply one of the business simulation models, using a mathematical model (multi-factorial regression function) and a computer program (Data Analysis from Excel), only to demonstrate that a simulation process may increase process performance by streamlining resources, reducing the time and costs involved in growth teamwork efficiency, the rationalization, knowledge and experiences to the development of human capital involved, but also reduce the cost of sales, which are fundamental aspects in the current global economic situation.
Keywords: employees, organization, simulation, modeling, performance. Introduction Today we are living in a rapidly,
changing world, change which is not always desired (Palmer B., 2004). To cope with these changes, organizations must make this change to seem normal and be accepted in any organization’ and its employees’ life (Griffin R., Moorehead G., 2014, p.546). The changes are brought by globalization of markets, the internationalization and liberalization, continuous change of customers’ needs and desires, competition, legislation, culture, structure and size of the companies. Most experts say that the best place for analyzing and understanding a process is at the end of the chain where the consumer is (Laguna M., Marklund J., 2011, p.83). All these lead to increased
pressure on decision makers from business, and new requirements on how to develop and adopt decisions (Luban F., 2005). To make decisions and get performance, organizations can turn to build a future desired, simulated using modeling tools and information technology (Ratiu-Suciu C., 2003). Thus, organizations may use different models and software with which organizations will be able to simulate the desired future development of its business.
Thus, modeling and simulation become necessary when direct experience of real system is not possible or advisable. A simulation process may enhance the performance of a process by streamlining resources, reducing the time and costs involved

368
and reduce cost of sales, which are fundamental aspects in the current global economy.
1. The role of human resources in obtaining performance in organization
In any field it stands the idea that people constitute "the most valuable asset of the organization" (Florea N.V., 2013, p.49). Global competition and rising customer’ expectations, make the survival of the organization and development to be increasingly more difficult (Bach S., 2005 p.3). One of the most important factors that help organization to increase its performance and requires a special attention is the people working in the organization (Sims R.R., 2002, p.1). Today, the human factor is recognized as a central factor as being the most important resource of doing business (Reed A., 2001, p.1). Organizations without investing in human resources, will probably not be able to develop and retain those key resources-people- in the coming years (Holbeche L. Mayo A., 2012, p.30). Human resources are considered the cornerstone of the success of the organization (Lakhdar S. et al., 2001,
p.51). People are the key resource that influences every element of the strategic management of an organization (Millmore M. et al., 2007, p.15).
An organization, to operate, must know the amount and type of resources that each will use: people, equipment and materials. Regarding human resources, the organization must determine what knowledge and experiences will need to implement its projects (Schwalbe K., 2006, p.116). If the organization has motivated human resources, will have happy and satisfied customers and will make also the shareholders happy (Ahlstrom D., Bruton G.D, 2011, p.197).
2. Simulation- importance and advantages for organizations
Simulation is used in two circumstances: when experimentation is not possible and when analytical solution is unknown or uncertain (Davis G., Pecar B., 2013, p.551), but is used in different contexts (Figure 1), thus demonstrating the flexibility of this instrument problem solving and organizational success (EOMAS 2011, Sa Silva P. et al., p.63).
Figure 1. Reasons of using the simulation process Model developed by the author
Teamwork promotion
Rational use of resources
Updating objectives and standards
Maximizing organization’
results
Forecasting future activities
Updating knowledge and experience
Improving individual
performance
Reasons to use the motivation process
369
Currently, there is an increased
use of simulation in various fields (Moore, JH, 2001). Due to the relatively low cost of collecting information necessary for decision making, simulation and modeling processes are used in various fields, such as:
- Production systems design (Robinson S, 2014, 15)
- Public and social sectors: health system (to minimize waiting lists in hospitals or response times for ambulances), military, natural resources,
- Transport systems, construction, telecommunications, food processing (Fishman G.S., 2013, p.3) - Reengineering, computer games, science, engineering, art, music, mathematics, - Management (estimating the probability of completing a project under fixed deadlines) and marketing (sales simulation) (Baker M.J., 2001, p.21),
- Finance (financial risk analysis, management) (Davis G., Pecar B. 2013, p.551),
- Training (e.g. pilot skills development to meet complex situations that could be dangerous and expensive in real situations (Anton J. et al., 1999, p.7).
Simulation is used: - To compare different
alternatives and to optimize its design and involves imitating the real processes existing in the real world (Wehrle, K, 2010, p.1),
- To analyze the behavior of the system, into an analysis of type: "What if ...?" (Leeflang P.S.H. et al., 2000, p.18), or designing real systems (Banks J., Carson J., Nelson B. Nicol D., 2000).
- When the real system (Sokolowsky J.A., Banks C.M., 2011,
p.4) is not accessible, or is dangerous, or it cannot be accepted, or the system does not yet exist.
Advantages of using simulation processes by organizations:
- Develop projects for new equipment, laying machines, various transport systems can be tested without engaging resources for their purchase,
- Can test hypotheses about how and why certain events may occur,
- Time can be compressed or expanded to enable acceleration or slowing an investigated phenomenon,
- Can identify "narrow places" in which the manufacturing process, information and materials are excessively delayed,
- Sensitivity analysis can be made of "What if ...?" (Leeflang P.S.H. et al., 2000, p.18)
- Can quantify the risk inherent in a system or an investment decision.
Among the disadvantages simulation can include:
- Development processes, verification and validation of the simulation model can be time consuming and money (Anderson D.R. et al., 2010, p.729)
- Provides only part of the analysis of a real system
- Provides only estimates and approximations of the real system,
- Does not guarantee optimal solutions due to subjective judgment of analysts or lack of experience in analyzing and interpreting the results,
- May have high costs of software, of obtaining information (data not always readily available) and may require large financial resources for training (building simulation model requires special training) (Robinson S., 2014, p.11)
- Require highly experienced in the use of computers in modeling,

370
statistical, and teamwork skills, and experience in project management,
- Quality Simulation results depend on the quality of data used. Data collection needed simulation can be difficult and time consuming.
- Building simulation model requires special training. It is an art that is learned over time and through experience (Luban F., 2005, p.16).
3. Modeling- role and
importance for business forcasting Using simulation, various
models can be developed that further actions marketers can estimate future competition or marketing plans, which can lead to profitability (GR Powell, 2008). The process involves modeling abstraction of a situation through a model that represents the essence of that situation (Diaconescu T., Ene C., 2011, p.21).
Modeling involves developing simple representation of a complex system of setting targets that provide estimates of system performance (Altiok T., Melamed B., 2010, p.1). Modeling is a constructive activity, often placing the question of whether the model is "good enough to solve the" (Birta LG, Arbez G., 2007, p.7). Moore J.H. and Weatherford L.R. (2001) believe that the manager involvement in modeling is very important for the successful implementation of a model and in decision making. A model is designed and developed to answer specific questions, so it has broad applicability. The probability is very low in the use and in other cases, because the problems are different and every situation is unique (Robinson S., 2014, p.276-277).
The model is a simplified representation of reality that are subordinated to the research purpose. It is constructed artificially, similar to a certain extent with the real, but not
identical to it. The transition from the original system model involves an abstraction and idealization (simplicity) system, used instead of the system itself (Hîncu D., 2013). To show the importance of models used in business and to increase performance, we present some definitions, as follows:
- Is a simplified representation of reality that are subordinated to the research purpose. It is constructed artificially, similar to a certain extent with the real, but not identical with it. The transition from the original system model involves an abstraction and idealization (simplicity) system, used instead of the system itself (Hîncu D., 2013).
- It is not reality, but a simplified picture of reality which man is able to understand (Anghelache C. Diaconu A., 2009, p.9).
- Provide a solution that will be interpreted by reference to the real system, taking into account the elements removed by abstraction (Luban F., 2005).
- Certain aspects of the system is modeled, in order to obtain new knowledge (Altiok T., B. Melamed, 2010, p.1).
4. Case study- using
computer modeling (Excel) and simulation (regression function) to improve processes and obtain performance
Data collection for simulation can be difficult and time consuming (Luban F., 2005). Managers, to make decisions, must have data and information necessary for the implementation of models in order to simulate economic processes and to implement the necessary actions at the microeconomic level. The implementation of such patterns is consistent with the resources owned by the organization.

371
In this paper we proposed to start from the actual data of an industrial company, and data used to simulate future, so that managers be able to make decisions, develop strategies that lead to increased performance, reduce costs and improve business human resources management in our case. Simulation experiments can be developed using test hypothesis and those designed to make predictions (Dixon K.R., 2011, p.147). For predictions a very used method is linear regression, which is the most widely used statistical method of regression (Dixon K.R., 2011, p. 125). It is a simple and a more used method in order to predict human performance and decison-making in organizations (Rouse W.B., Boff K.R., 2005, p.206). Linear regression is a parametric method, and is defined in terms of a finite number of unknown parameters estimated from a set of data; it is using the method of Ordinary Least Squares to predict the value of a dependent variable Y, based on an independent variable X (Darbyshire P., Hampton D., 2014). These models are among the most popular data-driven modles for their easy application and very well-known techniques (Araghinejad S., 2013, p.48). The regression function involves a set of unknown parameters, which we seek to find in a modeling process.
Regression modeling is particularly valuable when:
- the dependent variable is costly or difficult (or impossible) to measure,
- helps understand how the typical value of the dependent variable changes when any of the independent variables is varied, while the other independent variables are held fixed,
- aim to identify what variables are associated with y, to postulate what causes y, to predict future observations of y, or to assess control over a process or system,
- is based on data obtained from well-controlled experiments, quality control models, and observations.
It has been developed in the late eighteen century by Karl Friedrich Gauss and has the next form:
where (Dixon K.R., 2011, p.
125; Darbyshire P., Hampton D., 2014; Walish P. et al., 2014, p.97):
Y= dependent variable, Xi= independent variables, b= the slope (or gradient) of the straight line, a= the intercept This equation is a black box-
type model of an input-output system, where x1, ..., xn are the given input quantities and y is the output quantity computed from the inputs. Grapfically, this can be interpreted as shown in Figure 2, which shows a network of nodes where each of the nodes corresponds to one of the quantities x1,..., xn and y (Velten K., 2009, p.87).
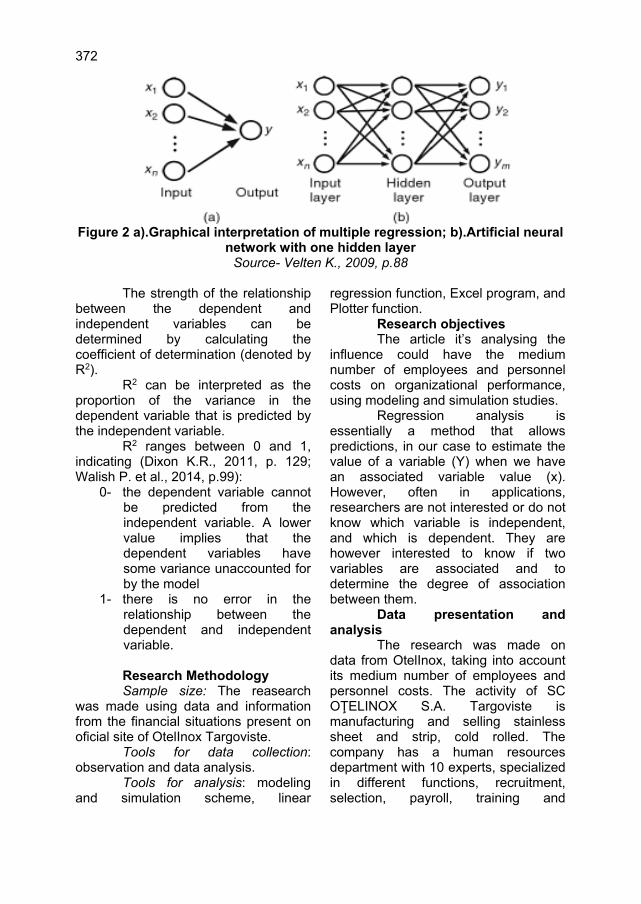
372
Figure 2 a).Graphical interpretation of multiple regression; b).Artificial neural
network with one hidden layer Source- Velten K., 2009, p.88
The strength of the relationship
between the dependent and independent variables can be determined by calculating the coefficient of determination (denoted by R2).
R2 can be interpreted as the proportion of the variance in the dependent variable that is predicted by the independent variable.
R2 ranges between 0 and 1, indicating (Dixon K.R., 2011, p. 129; Walish P. et al., 2014, p.99):
0- the dependent variable cannot be predicted from the independent variable. A lower value implies that the dependent variables have some variance unaccounted for by the model
1- there is no error in the relationship between the dependent and independent variable. Research Methodology Sample size: The reasearch
was made using data and information from the financial situations present on oficial site of OtelInox Targoviste.
Tools for data collection: observation and data analysis.
Tools for analysis: modeling and simulation scheme, linear
regression function, Excel program, and Plotter function.
Research objectives The article it’s analysing the
influence could have the medium number of employees and personnel costs on organizational performance, using modeling and simulation studies.
Regression analysis is essentially a method that allows predictions, in our case to estimate the value of a variable (Y) when we have an associated variable value (x). However, often in applications, researchers are not interested or do not know which variable is independent, and which is dependent. They are however interested to know if two variables are associated and to determine the degree of association between them. Data presentation and analysis
The research was made on data from OtelInox, taking into account its medium number of employees and personnel costs. The activity of SC OŢELINOX S.A. Targoviste is manufacturing and selling stainless sheet and strip, cold rolled. The company has a human resources department with 10 experts, specialized in different functions, recruitment, selection, payroll, training and
373 development, appraisal and other HR activities.
Case study- Using regression function and Excel to predict organization performance
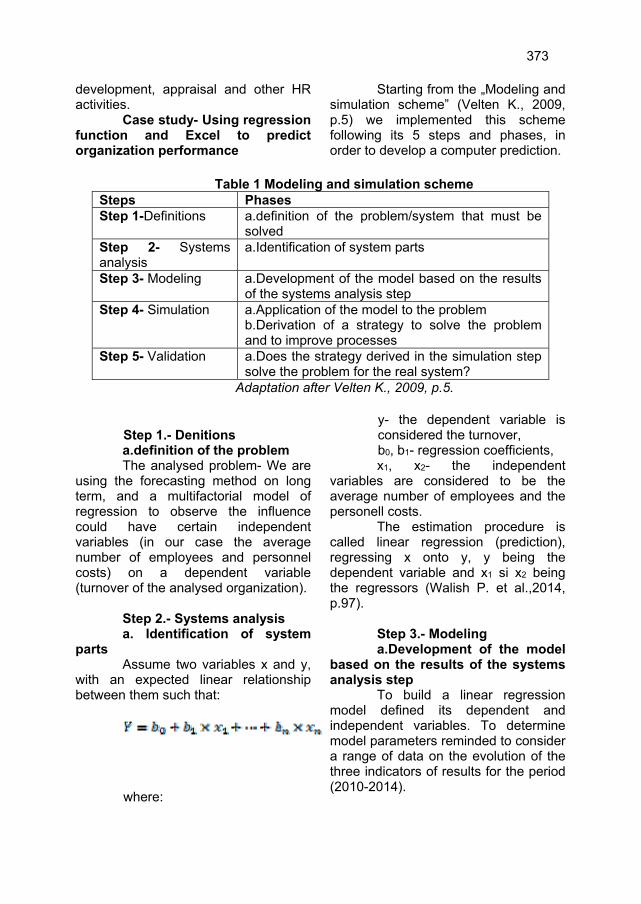
Starting from the „Modeling and simulation scheme” (Velten K., 2009, p.5) we implemented this scheme following its 5 steps and phases, in order to develop a computer prediction.
Table 1 Modeling and simulation scheme
Steps Phases Step 1-Definitions a.definition of the problem/system that must be
solved Step 2- Systems analysis
a.Identification of system parts
Step 3- Modeling
a.Development of the model based on the results of the systems analysis step
Step 4- Simulation
a.Application of the model to the problem b.Derivation of a strategy to solve the problem and to improve processes
Step 5- Validation a.Does the strategy derived in the simulation step solve the problem for the real system?
Adaptation after Velten K., 2009, p.5.
Step 1.- Denitions a.definition of the problem
The analysed problem- We are using the forecasting method on long term, and a multifactorial model of regression to observe the influence could have certain independent variables (in our case the average number of employees and personnel costs) on a dependent variable (turnover of the analysed organization).
Step 2.- Systems analysis a. Identification of system parts
Assume two variables x and y, with an expected linear relationship between them such that:
where:
y- the dependent variable is considered the turnover, b0, b1- regression coefficients, x1, x2- the independent
variables are considered to be the average number of employees and the personell costs.
The estimation procedure is called linear regression (prediction), regressing x onto y, y being the dependent variable and x1 si x2 being the regressors (Walish P. et al.,2014, p.97).
Step 3.- Modeling a.Development of the model
based on the results of the systems analysis step
To build a linear regression model defined its dependent and independent variables. To determine model parameters reminded to consider a range of data on the evolution of the three indicators of results for the period (2010-2014).

374
Table 2 Data recorded by the analysed organization between 2010-
2014 Year Turnover (CA)
(mil. lei) (y)
Average nb. of employees (NMA) (X1)
Personell costs (CP) (mil. lei) (X2)
2010 177,25 857 44,429 2011 144,15 845 47,816 2012 161,12 843 53,121 2013 163,20 840 52,952 2014 150,52 836 59,491
Source- www.otelinox.ro/situatii financiare.
Step 4.- Simulation a.Application of the model to
the problem To identify the typology of
regression function it has been realized the graphical representation of pairs of points that comprise the turnover
values and the two independent variables values (the average number of employees and personnel costs).
The scatter diagram shows the location of the points (x,y) as demonstrated in Figure 3.
Figure 3 The connection between turnover (CA) and average nb. of
employees NMA) and personnel costs (CP)
It can be estimated that between CA and NMA and CP, there is a direct and linear connection. Based
on the data presented, and using Excel- Data Analysis, were obtained the following results:

375
Figure 4 Determination of linear parameters using the regression model and
Excel Measuring the parameters of
the linear model is usually done by using least squares or maximum likelihood.
From calculations, using the linear regression we obtain the following parameters:
Multiple R is the multiple
coefficient of correlation between X1, X2 and Y. Between the value X1, X2 and y recorded in the analyzed organization in 2010-2014 there is a direct and strong enough connection due to the amount obtained by Multiple R (0.7886).
R2 means that 62,2% of the variance in the dependent variable Y is predicted or explained by the independent variables X1 and X2.
The strength of the linear relationship between variables is measured by the simple correlation coefficient (Araghinejad S., 2013, p.51), so the R2 show a value of 0,622, which is closer to 1 indicating that the most of the variance in the dependent variables
originate in the variation of the regressors, as propagated through the model.
Adjusted R Square is a coefficient of determination corrected with the freedom degree having the same signification as R2.
Standard Error is the standard error which shows the average of the values observed deviate from the theoretical values yi of the regression line, Yi (in this case with ±11,06).
Observations are n, the number of observations, n=5.
ANOVA reprezents the analysis table of tha variance. For the variance due to factor x, Regression, Residual due to the others unregistred factors, and Total due to the all factors:
- df- degrees freedom: k – number of explivative variables x (simple regression k=1), n-k-1 for residuals (5-1-1=3 degree freedom) and n-1 for total variance (5-1=4); The sum df for Regression and

376
Residual is equal with df / Total: k + (n – k – 1) = n – 1.
- Intercept is for the free term (constant) of the model and has the value (-2158,74).
- Coefficients- contain the estimated values of coefficients a and b.
From the presented values results the model estimated in our example:
- - Lower 95%, Upper 95% –
upper and lower limits of
the confidence interval for the parameter. The limits for 0.05 are calculated automatically, regardless of the initialization procedure Regression. It could be said that the linear model parameters are within the following ranges:
-9032,1291< b0 < 4717,6418; -4,9487839< b1 < 10,160616; -8,1177507< b2 < 12,697783.
Analysis of model quality is presented in Figure 5.
Figure 5 NMA Residual Plot
After the form of the points
position, results that there is no correlation between the independent variables and residuals, the model being well choosed.
From the formula founded by the computer simulation model results that CP and NMA are quite important factors in the evolution of CA. To increase with a monetary unit the NMA will get an increase of 2.60 monetary units of CA and an increase with a monetary unit of CP will get an increase of 2.29 monetary units of CA.
We note that the value of -2158.74 of free term is not very high, which allows us to conclude that the
factors were not taken into account in the model construction having a material impact on the evolution of the term CA (being negative). The negative value of the free term reveals that the variables were not included in the econometric model and have a negative effect on the evolution of CA.
b.Derivation of a strategy to solve the problem and to improve processes If we suppose that the organization wants that in the year 2016, to obtain a better turnover, increasing NMA (we suppose it will increase annualy with 0,5%) and maintaining CP as it was in 2014. The
377 main reason is not to increase so much the number of employees, in order to have not so high personnel costs. This can be obtained through a good policy of HR, such as: attracting new candidates using as recruitment source branding or the university candidatures, and to retire the employees with age conditions. Thus, the average number of employees may increase with 0,5% and personnel costs may be maintained. The analysed organization, using its brand, may attract new candidates, because is a known company for its quality products, procedures, its social behavior, its
motivation methods (financial and non-financial), its implications in work environment and external environment. Big companies do not sell products and services: they sell and require a lifestyle (Nistorescu T. et al., p.7). Moreover, a study, made in 2011 on six large organizations (Florea N.V., 2011, p.294), showed that our analysed organization is using good practices of recruitment, selection, employment and integration, using corporate branding to attract, recruit and maintain good and talented staff.
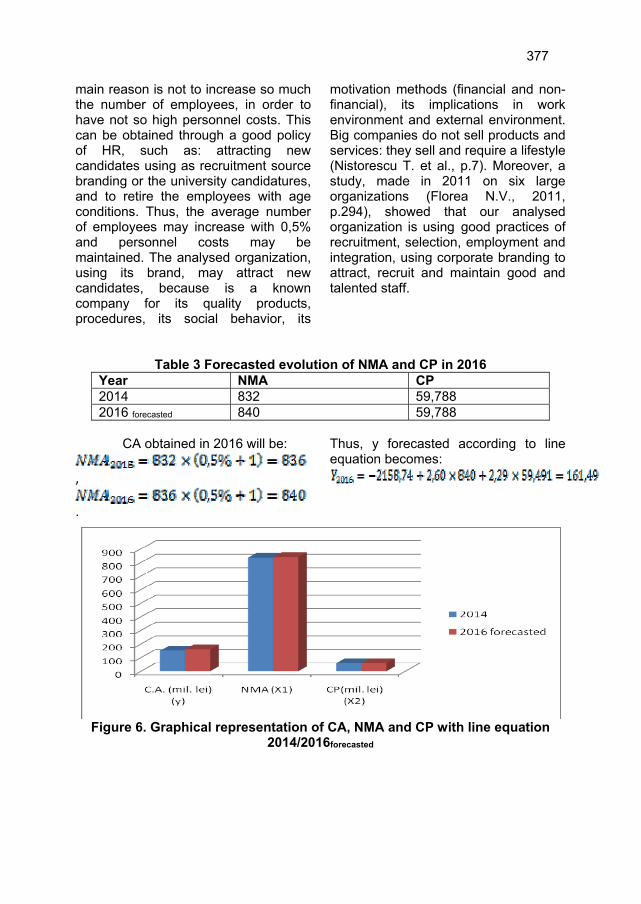
Table 3 Forecasted evolution of NMA and CP in 2016 Year NMA CP 2014 832 59,788 2016 forecasted 840 59,788
CA obtained in 2016 will be:
,
.
Thus, y forecasted according to line equation becomes:
Figure 6. Graphical representation of CA, NMA and CP with line equation
2014/2016forecasted
378
Step 5.1.- Validation a.Does the strategy derived
in the simulation step solve the problem for the real system? The implemented model is fitting for the proposed problem solving, being possible a prediction for the next period, too.
The process involves developing a simulation model more clearly reflecting the behavior and evolution, data and prospective resources of its implementation (ter Hofstede A., 2008, p.67). Since experiments can be really costly, dangerous, time consuming unacceptable ethically or irreversible is implementing a model turns out to be even desired, playing a role of substitute for real purposes (Birta L.G., Arbez G. , 2007, p.6).
Proposals Human capital is important for
any organization in obtaining performance. It is a strategic partner who bring competitive advantage, a positive image, sustain a strong brand, and satisfy the financial and the soacial needs of the employees, of the stakeholders, and of the general public (Florea N.V., 2015).
As we can see, if such organizations apply process simulation by using a simple and reliable mathematical model (in our case the regression function and Excel) will get the following benefits:
- Can be observed interactions between different variables and lead to different independent variables influence on system performance (dependent variable),
- can be discovered relationships between variables, in our case the relationship between employees and turnover,
- Offer the possibility of virtual experimentation of a real system,
- Delivers results that help to forecast changes that will influence the real system,
- Identify constraints by reviewing the default period for obtaining information processes and materials,
- Observe system operation, - Develop plans observation
system - Associated with computer
simulation, the organization can view a software system can help increase response capabilities makers by charging broader opportunities and by clarifying and assessing the effects of any action,
- Could be a way of solving problems for which analytical and algorithmic solutions are not possible.
Conclusions Applying a model of linear
regression function, one of the most complex procedures of processing and statistical analysis package from Excel enables statistical analysis and economic, but also building the necessary graphics fit to the linear model. We find that implementing a computer-based simulation model, the average number of employees and personnel costs are quite important factors in the evolution of turnover of the analyzed organization. Many specialists have aroused the importance of human capital in obtaining competitive advantage, and implicitly in obtaining a better turnover. The personnel expenses consisted of wages and salaries, social security taxes and old age provision and support, are important financial motivation factors. It was demonstrated that, a motivated employee will stay longer with organization, will be more loyal, will work harder in obtaining

379 performance and an improved turnover, and will be more committed to the organization. Therefore, implementing such a model, by any company that wants performance, will help for future predictions, offering analysts and organizations advantageous alternative in terms of time and cost, improving teamwork, winning new knowledge, experiences and skills that will benefit the organization and will be able to win, in a not too distant future, competitive advantage in the market. Simulation and computer modeling are used to
reduce the risk associated with creating new systems or the implementation of change.
More than ever, organizations want to ensure that its investments will lead to the expected results. Organizations which are not reluctant to change and who adopt in their leadership, organization and management style, innovation and creativity, will get individual performance and implicitly organizational performance.
REFERENCES Ahlstrom, David, Bruton, Gary D.(2011), International management strategy and
culture in the emerging world, South-Western Cengage Learning, p.197,
Altiok, Tayfur, Melamed, Benjamin (2010), Simulation modeling and analysis with ARENA, MA, USA: Elsevier, p.1,
Anderson, Philip H., et al.(2000), Threshold Entrepreneur. A New Business Simulation. Solo Version. New Jersey, Upper Saddle River: Prentice-Hall Inc., p.279,
Anghelache, Constantin, Diaconu, Aurelian (2009), Modele utilizate în analizele manageriale, Editura Artifex, București, p.9,
Anton, Jon et al.(1999), Call center performance enhancement. Using simulation and modeling, Purdue University Press, p.7,
Araghinejad, Shahab (2013), Data-driven modeling: using MATLAB in water resources and environmental, Springer Science&Business Media, p.48,51,
Bach, Stephen (2005), Managing human resources:personnel management in transition, Ma, USA : Blackwell Pub., p.3,
Baker, Michael J.(2001), Marketing. Critical perspectives on business and management, USA: Routledge, p.21,
Banks, Jerry et al.(1996), Discrete-Event System Simulation, Englewood Cliffs: Prentice-Hall,
Birta, Louis G., Arbez, Gilbert (2007), Modeling and simulation. Exploring dynamic system behaviour, Springer-Verlag, p.6-7,
Brad, Stelian și col.(2010), Simularea dezvoltării afacerilor. Suport de curs, www.mim.utcluj.ro,
Darbyshire, Paul, Hampton, David (2014), Hedge fund modeling and analysis using MATLAB, John Wiley&Sons,

380
Davis, Glyn, Pecar Branko (2013), Quantitative methods for decision making using Excel, UK: Oxford University Press, p.551,
Diaconescu, Tiberiu, Ene Corina (2011), Simulări și proiecte de management. Suport de curs ID. Modul I, Universitatea Hyperion București, Facultatea de Științe Economice,
Dixon, Kenneth R.(2011), Modeling and simulation in Ecotoxicology with applications in MATLAB and Simulink, CRC Press, p.125,129,147,
Florea, Nicoleta V. (2011), Using branding to attract, recruit, and retain talented staff, Revista Management&Marketing, vol.IX, nr.2/2011, Editura Universitaria Craiova, p.285-297,
Florea, Nicoleta V.(2013), Auditul resurselor umane, Bucuresti : Editura C.H.Beck, p.49,
Florea, Nicoleta V.(2014-2015), Simulari de marketing. Suport de curs, Curs Licenta Marketing, UVT,
Florea, Nicoleta V. (2015), Developing careers of employees in the new Knowledge Economy, Revista Management&Marketing, vol.XIII, nr.1/2015, Editura Universitaria Craiova,
Fishman, George S.(2013), Discret-event simulation: modeling, programming, and analysis, Springer Science&Business Media, p.3,
Griffin, Ricky, Moorehead, Gregory (2014), Organizational behavior, USA: South-Western, p.546,
Hîncu, Daniela (2013-2014), Simularea proceselor economice, Curs Master Management, ASE Bucuresti,
Holbeche, Linda, Mayo (2012), Andrew Motivating people in Lean organizations, USA: Butterworth-Heineman,
Laguna, Manuel, Marklund, Johan (2011), Business process modeling, simulation and design, India: Pearson Edu, p.83,
Lakhdar, Seykou et al(2001), Gestion de ressources humaines, Canada : Universite de Boeck, p.51,
Leeflang, Peter S.H. et al.(2000), Building models for marketing decisions, ISQM, Netherlands : Kluwer Academic Publisher, p.18,
Luban, Florica (2005), Simulări în afaceri, Bucureşti : Editura ASE, p.16,
McHaney, Roger (2009), Understanding computer simulation, Ventus Pub., ApS.,
Millmore, Mike et al (2007)., Strategic HRM: contemporary issues, England: Pearson Edu. Ltd., p.15,
Moore, Jeffrey.H., Weatherford, Larry R.(2001), Decision Modeling with Microsoft Excel. USA: Prentice-Hall,

381 Nistorescu, Tudor et al.(2014), Brand - product interdependence, Revista
Management&Marketing, vol.XII, nr.1/2014, Editura Universitaria Craiova, p.7-13,
Palmer, Brien (2004), Making change work. Practical tools for oercoming human resistance to change, ASQ Quality Press,
Powell, Guy R.(2008), Marketing calculator. Measuring and managing return on marketing investment, Singapore : John Wiley & Sons,
Raţiu-Suciu, Camelia (2003), Modelarea & Simularea proceselor economice. Teorie şi practică. Ediţia a-III-a. Bucureşti : Editura Economică,
Reed, Alec (2001), Innovation in HRM: tooling up for the talent wars, London: CIPD House,
Robinson Stewart (2014), Simulation. The practice of model development and use, NY : Palvrage Macmillan, p.11, 15, 276-277,
Rouse, William B., Boff, Kenneth R.(2005), Organizational simulation, Chapter 7, Salas E. et al., Modeling team performance: the basic ingredients and research needs, John Wiley&Sons, p.185-228,
EOMAS (2011), Enterprise and organizational modeling and simulation, 7th International Workshop, Sa Silva P. et al., Simulation, Games and challenges from schools to enterprises, pp.63-74, London, UK : Springer, p.63,
Sims, Ronald R.(2002), Organizational success through effective human resources management, USA: Greenwood Pub. Inc.Group, p.1,
Scwalbe, Kathy (2006), Introduction to project management, Thomson Learning, USA, p.116,
Sokolowski, John A., Banks, Catherine M.(2011), Principles of modeling and simulation. A multidisciplinary approach, USA : John Wiley & Sons, N.J., p.4,
ter Hofstede, Arthur (2008), Business process management workshops, PPM 2007 International Workshops, Brisbane, Australia: Springer Science & Business Media,
Velten, Kai (2009), Mathematical modeling and simulation: introduction for scientists and engineers, John Wiley and Sons, p.87-88,
Walish, Pascal et al.(2014), MATLAB for neuroscientists: an introduction to scientific computing in MATLAB, Academic Press, p.97, 99,
Wehrle, Klaus et al.(2010), Modeling and tools for network simulation, Germany: Springer, p.1.