Watering Trough Gulch Mining Project: A Feasibility Study Routt County, Colorado Acknowledgements
93
Watering Trough Gulch Mining Project: A Feasibility Study Routt County, Colorado Prepared By Jonathan D. Lindquist Fort Collins, CO May 2, 2014 Watering Trough Gulch Feasibility Study (2014)
Transcript of Watering Trough Gulch Mining Project: A Feasibility Study Routt County, Colorado Acknowledgements
Watering Trough Gulch Mining Project:
A Feasibility Study
Routt County, Colorado
Prepared By
Jonathan D. Lindquist
Fort Collins, CO
May 2, 2014
Watering Trough Gulch Feasibility Study (2014)
Acknowledgements
There are a number of people I would like to extend my gratitude
and thanks to for helping me with this thesis. First, I would
like to address the instructors; Dr. John Stednick has helped
immensely improve my thinking as a natural scientist, and pushed
me to develop new time management strategies. His hard work
giving feedback could not be mentioned fully if the help of Dr.
Sunil Kumar and Ph.D. candidate Ryan Webb were left out. Dr.
Kumar and candidate Webb both offered flexibility with questions
and helping me understand my mistakes on the writing assignments.
I would also like to thank my peers in the class for being a
resource when I felt overwhelmed with the other classes being
taken concurrently and believing in me when I did not. Of course
I would also like to express my gratitude towards my brother and
family at home for their support and constant questions about my
work on this thesis. Without all of these people this report
would not exist.
Watering Trough Gulch Feasibility Study (2014)

Conversion Factors
This report is reporting units in metric but for future utility
and a different perspective, a conversion table is provided. The
purpose of the conversion table is to provide a convenient way
for readers and users of this report to be able to convert units
to their liking.
U.S. Customary - Metric unitsMultiply By To Obtain
Lengthinch (in.) 25.4 millimeter (mm)inch (in.) 2.54 centimeter (cm)foot (ft) 0.3048 meter (m)mile (mi) 1.609 kilometer (km)Area
Watering Trough Gulch Feasibility Study (2014)

acre (ac) 40.47 square meter (m2)acre (ac) 0.0041 Square kilometer (km2)square foot (ft2) 0.0929 square meter (m2)square mile (mi2) 2.59 square kilometer (km2)Massounce (oz) 28.34 grams (g)pounds (lb) .454 kilograms (kg)short ton (ton) .91 metric ton (ton)Volumegallon (gal) 3.785 liter (L)cubic foot (ft3) 0.02832 cubic meter (m3)acre-feet (ac-ft) 0.1234 hectare-meters (ha-m)Flowinch per year (in/yr) 25.4 millimeter per year (mm/yr)foot per year (ft/yr) 0.3048 meter per year (m/yr)cubic foot per second (ft3/s)
0.0283 cubic meter per second (m3/s)
gallon per minute (gal/min) 0.0631 liter per second (L/s)million gallons per day (Mgal/d)
0.0438 cubic meter per second (m3/s)
billion gallons per day (Bgal/d)
43.81 cubic meter per second (m3/s)
Densitypounds per cubic foot (lb/ft3)
16.018 kilograms per cubic meter (kg/m3)
TemperatureCelsius °C (°C*1.8)
+32Fahrenheit °F
Yieldtons per acre per year (ton/ac/year)
224170 kilograms per square kilometerper year (kg/km/year)
Short forms and Acronyms
Watering Trough Gulch Feasibility Study (2014)

These acronyms, short forms and abbreviations appear throughout
the text. The purpose of this page is to supply the reader with
the meaning of any acronym or short form used in the report
- WTG (Watering Trough Gulch)- SB1 (Subbasin 1)
- BLM (Bureau of Land Management)- CCC (Colorado Climate Center) - COAgMet (Colorado Agricultural Meteorological Network)- DOI (Department of Interior)- EIA (Energy Information Administration)- OSMRE (Office of Surface Mining Reclamation and
Enforcement)- NCDC (National Climatic Data Center) - NLDC (National Land Cover Database)- NOAA (National Oceanic Atmospheric Association)- NRCS (Natural Resource Conservation Service)- SMCRA (Surface Mining Control and Reclamation Act of
1977)- USDA (United States Department of Agriculture)- USGS (United States Geologic Survey)- WSS (Web Soil Survey)
- HEC-HMS (Hydrologic Engineering Center-Hydrologic Modeling System)
- GIS (Geographical Information Systems)- NAD (North American datum)- UTM (Universal Transverse Mercator)- AOI (Area of Interest)- SDB (Sediment detention basin)- SDR (Sediment detention ratio)- AWC (Average water content)
Watering Trough Gulch Feasibility Study (2014)

TABLE OF CONTENTS
Acknowledgements...............................................2Conversion Factors............................................3Short forms and Acronyms......................................4
Executive Summary..............................................1Chapter 1 – Introduction.......................................4Chapter 2 – Watershed Description..............................62.1 Introduction..............................................62.2 Methods...................................................6
Data Collection.................................................6Map Making - ArcGIS.............................................7
2.3 Results...................................................82.4 Discussion...............................................10
Chapter 3 – The Water Balance.................................113.1 Introduction.............................................113.3 Methods..................................................113.4 Results..................................................133.5 Discussion...............................................14
Chapter 4 Pre-Mining Condition................................154.1 Purpose..................................................154.2 introduction.............................................15
Watering Trough Gulch Feasibility Study (2014)

4.3 Methods..................................................154.4 Results..................................................174.5 Discussion...............................................174.6 Conclusion.....................Error! Bookmark not defined.
Chapter 5 During-Mining Hydrologic Condition..................185.1 Introduction.............................................195.2 Methods..................................................195.3 Results..................................................215.4 Discussion...............................................225.5 Conclusions..............................................225.6 Recommendations..........................................22
chapter 6 – Soil Erosion......................................226.1 Purpose..................................................236.2 Introduction.............................................236.3 Methods..................................................23
Chapter 7 – Sediment Detention / Channel Hydraulics...........247.1 Introduction.............................................247.2 Methods..................................................247.4 Results..................................................27
Chapter 8 – Reclamation/Revegetation..........................288.1 Introduction.............................................288.3 Methods..................................................29Pre-Mining.................................................30Post mining................................................30
8.4 Results..................................................318.5 Discussion...............................................328.6 Conclusion.....................Error! Bookmark not defined.8.7 Recommendations..........................................33
Chapter 9 – Monitoring........................................34
Watering Trough Gulch Feasibility Study (2014)

9.1 Introduction.............................................349.2 Methods..................................................34
Conclusion....................................................35Recommendations...............................................35Appendix......................................................37A1. Chapter 1................................................37A2. Chapter 2.................................................1A3. Chapter 3.................................................1A4. Chapter 4.................................................1A5. Chapter 5.................................................1A6. Chapter 6.................................................3A7. Chapter 7.................................................4A8. Chapter 8.................................................5A9. Chapter 9.................................................5A4. Figures........................Error! Bookmark not defined.
Literature Cited...............................................8
Watering Trough Gulch Feasibility Study (2014)

Executive Summary
This report, prepared for the Watershed Problem Analysis Capstone
class was completed over the course of the semester under the guidance
of Dr. Stednick. The purpose of this report is to analyze an area –
assigned to us at the start of the semester – for the feasibility of a
potential surface coal mining operation. The feasibility of the mining
operation in Watering Trough Gulch will be determined on the amount of
physical disturbance produced as described in the Surface Mining
Control and Reclamation Act of 1977 (SMCRA). A surface mine operation
in Colorado mines 0.4 km2 annually and the average mine life is 20
years amounting to 2000 total acres mined – this is considered a
baseline for mining to begin.
Watering Trough Gulch has a total area of 6.8 km2 is located in Routt
County, and the area proposed for mining is Subbasin 1. Subbasin 1 has
an area of 0.81 km2 and is dominated by shrub and scrub vegetation at
lower elevations and deciduous forest near the higher elevations. The
subbasin has an average elevation of 2334.7 meters and has an average
slope of 18%. The dominant soil type in both the Watering Trough Gulch
and the subbasin is Foidel Loam – 24% of total area.
Watering Trough Gulch Feasibility Study (2014)

Using climate data at a nearby airport, the watershed and its
surrounding area was characterized by a water balance model. An annual
average temperature of 6°C and an annual average precipitation of 35
mm. Cumulative precipitation was found to be 425 mm or 40 cm. This
climate was characterized as semi-arid with scrub and shrub with mixed
forest at higher elevations. Soil types were dominantly loams – 412
acres in Watering Trough Gulch or about 24% of the total area.
An in-depth hydrologic analysis was conducted for the entire watershed
as well as the subbasin considered for mining: both 10-year 24-hour
and 100-year 24-hour storm events were used for modeling purposes. The
goal of the hydrologic analysis for the different land conditions
(pre- and during- mining) in both Watering Trough Gulch and Subbasin 1
was to notice the change in annual soil loss. SMCRA requires the
control of sediment lost to downstream users, to mitigate the effects
of soil loss on the disturbed land it is often that a sediment
detention basin will be designed. The design of the detention basin is
planned to accommodate the capacity of a 10-year 24-hour event as well
as a 24-hour settling rate. Additionally, an emergency spillway will
be designed to accommodate the larger 100-year 24-hour storm event –
this will be designed by a registered engineering company for the
reclamation and monitoring period. Watering Trough Gulch Feasibility Study (2014)

The reclamation of the land would begin, if time and money allow, when
the mine has been operating for at least 6 years. As mining occurs,
the top soil would be saved and seeded with nitrogen-fixing vegetation
to be re-applied at the end of mining each plot. Before the re-
vegetation can being, the area must be returned to its approximate
original contour using backfill of waste rock and overburden- the
stored top soil would be put down once the original contours and
hydrology have been restored. Efficiency and diligence during the
reclamation period must be considered, as re-establishing vegetation
in the Western U.S. takes much longer than the Eastern U.S. Native
grasses and shrubs would be planted using drill seeding on high slopes
while broadcast seeding and mulching on less steep slopes.
An analysis on the pre- and during-mining hydrology is important for
characterizing the “worst case scenario” so that a potential mining
operation may use better judgment in the operation. This plan laid out
in the chapters following, is a desktop-based assessment of the
current and potential conditions given only certain records of data.
With this condition in mind, it may be hard to judge certain variables
in the overall assessment of Watering Trough Gulch and the basin to be
mined, but using historical and spatial references can aid in decision
making. Watering Trough Gulch Feasibility Study (2014)

In conclusion, the mining operation in Watering Trough Gulch is not
feasible at this time. Longer records of data need to exist as well as
a reference site – Watering Trough Gulch is very small in area and has
a number of slopes greater than 30%. I purpose that instead of mining
in this watershed, that it be used as a reference site for adjacent
watersheds permitted to mine. Implementing a meteorological station
within the catchment and activating the stream gauge may be a good
starting point.
Watering Trough Gulch Feasibility Study (2014)

Chapter 1 – Introduction
Long ago, about 55 million years ago, Colorado was not so dry and
dinosaurs roamed the plains, there was a shallow sea that extended
from Canada to Mexico. As time passed, the ocean levels slowly receded
and swamps had formed along the coast and peat – an organic-rich soil
material – came as a result of the wetland condition. Over millions of
years, the compaction of the peat over a long period of time produces
the precious coal sought under the ground. Figure 1.2 shows the
different stages of compaction and burial related to the energy
content - the more compaction and heating the peat experience the
higher quality coal is produced (Carroll & Berry, 2005). Anthracite is
this highest quality coal while the lignite coal is of the lowest
quality - the coal found in Colorado is typically bituminous to sub-
Watering Trough Gulch Feasibility Study (2014)

bituminous and is low in sulfur content but high in energy content
making it highly desirable (Sanford, 2014). Over 80% of coal in
Colorado is bituminous (Carroll & Berry, 2005).
The state of Colorado is growing in population and a need for more
energy has arisen in response – coal seems to do a good job of
providing cheap clean energy. In Colorado, as well as the entire
United States, coal is a leading source of energy – 50% of electricity
in the United States comes from coal-fired power plants (Carroll &
Berry, 2005). Last year an estimated 30,000 short tons of coal were
produced form Colorado – only 2.8% of the country’s annual coal
production (US Energy Information Administration , 2014). The U.S.
Energy Information Administration (EIA) also reported that each short
ton sold was valued at nearly $40.00 per short ton. With this demand
for coal, mining companies are interested in Colorado coal for its
desired characteristics. Mining cannot occur unless; the miners get a
permit from the Office of Surface Mining Reclamation and Enforcement –
part of a lengthy legal process (Colorado Division of Minerals and
Geology, 1980).
Watering Trough Gulch Feasibility Study (2014)

An average surface mine would remove 100 acres/ year – upon being
granted permission to mine. With this permit the mining company agrees
to a list of requirements defined in SMCRA (SMCRA, 2014). Some of the
more important requirements include:
- The entire area is returned to its approximate original
contour (AOC) and that the land is restored to an equal or
better condition once mining has been completed – more
specifics are listed in SMCRA
- Damage and alterations to the hydrologic processes are
prohibited - the normal flows should not be altered, mining
alluvial valley floors is avoided, and minimizes the
disturbances to the water quality and quantity for
downstream users
- Water quality is maintained at state and federal levels –
preventing acid mine drainage and reducing the sediment
yields from the area. Sediment yields from roads and bare
surfaces are considered in the control of erosion.`
The overall analysis on Watering Trough Gulch and the subbasin will be
used in the permitting process and once the permit is accepted a
baseline condition must be established for the following:
Watering Trough Gulch Feasibility Study (2014)

- Hydrology and Climatic Data
- Soil losses and annual sediment yields compared to
tolerances
- Reclamation and any implementation of structures (roads,
diversions, settling areas)
- Water quality monitoring
This baseline condition is necessary in returning the area to its
original or better condition as well as determining if the miners will
be awarded their bond for successful reclamation. This report will
explore the process in the obtaining values and basic characteristics
needed to get a mining permit.
Chapter 2 – Watershed Description
2.1 Introduction
To better understand the potential effects a surface mining operation,
it is important to characterize the watershed for baseline parameters.
Since a mining operation has been proposed for the area within
Watering Trough Gulch an analysis of the watershed will be conducted
using several sources of data; from a selection of nearby climate
monitoring stations and a USGS stream gauging station at the mouth of Watering Trough Gulch Feasibility Study (2014)

the watershed, the post-mining period may reference these conditions
in monitoring and reclamation. The mining company, upon completing the
operation, must restore the land to equal or better standing without
disturbing or altering any hydrology (SMCRA, 2014). Using Desktop-
based applications and electronic data acquired from several agencies
websites and databases – characterizing the watershed can be done
remotely and accurately.
2.2 Methods
To get a better understanding of the seasonal and temporal variations
in and around Watering Trough Gulch several websites and agencies were
accessed for spatial and temporal data. This data was imported into
different computer applications for analysis and testing – the ESRI
ArcMap and Microsoft Excel were of major importance in manipulating
and organizing data. Another program that was vital in many of the
calculations was HEC-HMS, free hydrologic modeling software developed
by the Army Corps of Engineers. The major steps in the watershed
characterization will be outlined in the following pages of this
chapter.
Data Collection
Watering Trough Gulch Feasibility Study (2014)

From the web – there are a number of ways to access historical and
current climatic and hydrologic datasets. The following points detail
the source and the type of data acquired from the source:
- For this watershed analysis, the USGS historical streamflow
database was accessed to provide a historic record of flows
from the stream gauge (USGS 09244460) located in Watering
Trough Gulch.
- Meteorological data was collected from NOAA’s National
Climatic Data Center database. Data was collected on a
monthly average basis for a period of 105 years from the
Hayden Airport.
- The soils data: Available Water Content (AWC), K & T-
Factors, hydrologic soil group and was collected from the
Web Soil Survey (WSS) and imported into Excel and ArcMap and
area-weighted with land cover.
- Land cover and hydrography were acquired from two different
sources – the USGS Map Viewer Tool (an interactive map) and
the Colorado View database.
- Water quality data was obtained from the COAgMet
Map Making - ArcGIS
Watering Trough Gulch Feasibility Study (2014)

The ArcGIS desktop application was used to make a number of maps for
Watering Trough Gulch – maps of slope, aspect, elevation, hydrologic
soil group, stream network, and land cover. The stream gauge in
Watering Trough Gulch was used to delineate the basin as well as
provide a record of streamflow.
2.3 Results
Watering Trough Gulch a smaller catchment located in Routt County and
12 miles south of Hayden, CO is characterized as an arid west
environment. The surrounding climate stations were located at a
similar elevation (Table 2.1).
The mean basin elevation for Watering Trough Gulch was determined to
be 2255 m – the gauging station is located at an elevation of 2117 m
while the highest elevation point is located at 2456 m. The hydraulic
length of the watershed – from the farthest point to the outlet – was Watering Trough Gulch Feasibility Study (2014)

found to be 5.6 km. The area for Watering Trough Gulch was calculated
in both Stream Stats and ArcGIS – 6.35 km2. The average slope for
Watering Trough Gulch was calculated at 21% - greater slopes (Figure
2.1).
The land cover for the basin is dominantly deciduous forest – 69%
followed by scrub and shrub species at 29% of the entire watershed -
the remaining land cover classifications make up the remaining 2% of
land cover (A2-Figure 2.2). The deciduous forest is characterized by
trees generally greater than 5 meters tall, and greater than 20% of
total vegetation cover – more than 75% of vegetation sheds seasonally.
The shrub and scrub are characterized as less than 5 m tall and (Table
2.3).
The dominant soil types were found to be loamy – both Foidel and
Lintim loam make up almost 45% of the soils in Watering Trough Gulch –
just above 42%. 18% of the total area in Watering Trough Gulch
consists of Lintim loam – found on slopes ranging from 3% to 25%.
Foidel loam is found on slopes ranging from 15% to 65% (Figure 2.3).
The streamflow from the USGS gauging station reported a peak on April
30, 1980 with a discharge of 0.1 m3/sec. The streams in watering
trough gulch vary in length and slope, a number of first-order streams
Watering Trough Gulch Feasibility Study (2014)

exist in all three basins ranging from; a total 136 channels ranging
from 3 m to 115 m.
The watershed is then split up by the two natural junctions – yielding
three subbasins of similar areas.
Subbasin 1 (SUB1) with an area of 3.1 km2 is furthest to the south and
higher in elevation, the highest point at 2368 m and the lowest at
2169 m – the change in elevation is roughly 200m.The length a drop of
water would have to travel from one end of the subbasin is 3421 m.
Subbasin 2 is located downstream of Subbasin 1 and upstream of the
mouth of Watering trough Gulch making it the middle basin. The area of
Subbasin 2 was determined to be 2.2 km2 and has a similar elevation
change; the highest point being at 2276 m and the lowest at 2123 m is
only a 178 m difference. The hydraulic length of the middle subbasin
was determined to be 1816 m – making this the shortest basin.
The third subbasin or Subbasin 3 is in junction with the middle
subbasin, getting closer to Dry creek and the Yampa it has an area of
1.4 km2. Although the area of the basin is smaller than Subbasin 2 the
hydraulic length is greater being 3026 m long it is 395 km2 less than
the first subbasin and greater than the middle basin by 1200 m. The
Watering Trough Gulch Feasibility Study (2014)

highest point in subbasin 3 was 2295 m and the lowest at 2117 m – this
low point is the elevation of the USGS gauging site.
The two reaches in the watershed were also evaluated for physical
traits. The first reach –Reach 1 had a hydraulic length of 1520 m
while Reach 2 closer to the mouth of the watershed had only a 196 m
length. The change in elevation along the first reach was found to be
50 m while the second reach only had a change in 4 m.
2.4 Discussion
Understanding the physical characteristics and naturally occurring
processes that make up the watershed is a vital step in making the
baseline condition. The baseline condition is in a sense is then set
as the goal for the mining operation to meet upon completing their
digs. It is important to understand these physical relationships so
that the best judgment may be used when prescribing different Watering Trough Gulch Feasibility Study (2014)

reclamation and monitoring techniques. For the remainder of this study
the use of Subbasin 1 will be the main scope of analysis.
The stream gauge used to monitor Watering Trough Gulch was active for
only 3 years – September 1979 to July 1981. For hydrologic modeling
standpoint this is not a substantial amount of data or time and
comparing the recorded flows of the watershed to the modeled storms
discussed further in the hydrology chapter.
Chapter 3 – The Water Balance
Watering Trough Gulch Feasibility Study (2014)

3.1 Introduction
The purpose of the water balance chapter is to analyze, interpret and
discuss the water balance for the Watering Trough Gulch study site
south of Hayden Colorado. A water balance, in a basic sense, is a
utility for hydrologists to show relationships between the inputs and
outputs of a determined area or system on a time basis (Dunne &
Leopold, Water in Environmental Planning, 1978). Essentially the
water balance equation can be re-arranged until the inputs balance the
outputs.
3.3 Methods
The water balance model can begin with using just temperature and
precipitation values - monthly average temperature and precipitation
values were obtained from an NCDC station located at the Hayden
Airport (Table 2.1). Precipitation of snow and rain are both
considered in the model and a temperature threshold for snow Tsnow <=
3.3°C <= Train was used to determine when snow is accumulating and when
it is raining (EQ 3.1). The precipitation falling on the catchment is
then subject to interception and infiltration losses.
Interception rates may follow a seasonal trend and range from 0 to
1.To determine the interception rates a function of Leaf Area (LAI)
Watering Trough Gulch Feasibility Study (2014)

for each land cover classification (Table 2.3) and that land covers
area for the watershed as well as each subbasin.
Snow was calculated as the accumulated snowpack or SWE in millimeters
with interception accounted for. The fraction of snow storage that
melts away is known as the snow melt factor (SMF) and is a function of
mean temperature thresholds and the meltmax (often set to 0.5) (McCabe
& Markstrom, 2007).
With the precipitation defined as snow or rain and temperature
thresholds established, the net inputs have been determined. The
direct runoff (DRO) from the net inputs can be determined next using a
function of the fraction of monthly precipitation as direct runoff
(drofrac) and the monthly precipitation as rain (EQ 3.3). Often the
drofrac is set to 5% (McCabe & Markstrom, 2007) .
PET (potential evapotranspiration) and AET were calculated next: PET
was calculated usign the Thornthwaite method form Dunnne & Leopold
(1978). PET uses the mean monthly air temperature in °C and diveds it
by the annual heat index I found in (EQ 3.5) and raises that ratio
to a power, a - based on the annual heat index .
AET (actual evapotranspiration) is equal to the PET when the net
inputs are greater than PET. Conversely, if PET is greater than net
Watering Trough Gulch Feasibility Study (2014)

inputs of the system then AET equals the absoulte value of the change
in soil moisture and the sum of net inputs (Dunne & Leopold, Water in
Environmental Planning, 1978).
To characterize the monthly changes in soil moisture of the system,
rooting depths for each land cover were area weighted in the watershed
with the AWC for each land cover classification. First and accumulated
potential water loss (APWL) must be calculte for eachmonth by
subtracting PET from the net inputs – looking for negative numbers.
Any positive values obtained will be counted as zero (Walter, 2013).
See Water Balance Table (Table 3.1) in Appendix A2.
3.4 Results
The annual average precipitation as snow was determined to be 14 mm
while the average annual precipitation as rain was just 21 mm. The max
Watering Trough Gulch Feasibility Study (2014)

annual precipitation as rain was calculated to be 42 mm in April while
the maximum annual precipitation as snow was calculated as 38 mm in
December.
PET exceeded AET levels from May to September indicating a deficit
while the months from October to May indicate a soil moisture surplus
– AET has exceeded PET.
In response changes in soil moisture were observed on an annual scale.
The soil moisture decreased by 26 mm from the months of October to
January and remained at zero until the snow began melting around the
end of March – the change in coil moisture becomes more negative and
between March and April the system loses 28 mm but begins a gradual
incline till July increasing by 5.33 mm per month. In July the soil
moisture levels rise more rapidly at 14.5 mm per month.
Annual temperatures for the region were typical for the area. The
annual maximum temperature ranged from 5.9°C to 28.6°C with a spike in
February – which is typically colder was recorded at 23.4°C. The
average temperature was used for water balance calculations and had a
range of -7.9°C to 19.2°C between January and July. The minimum
temperature had a greater range and increased from -35°C the absolute
minimum of annual temperatures. Minimum temperatures increased to 0°C
Watering Trough Gulch Feasibility Study (2014)

for the summer months before dropping back down in September (Figure
3.3)
3.5 Discussion
Temperature thresholds are chosen based on literature but in Colorado
especially the climate regime is always varying. By choosing a 3.3°C
temperature threshold for snow or rain it seems there is a large
window for error when calculating monthly average precipitation
amounts. Snow is and continues to be the more challenging hydrologic
variable to monitor and make seasonal relationships.
Assuming this threshold for temperature will old true for most areas
seems unreasonable for the typical annual climate variability in
Northwestern Colorado. Another assumption regarding snow as
precipitation is the interception rates accounted for by LAI as a
function of land cover and area. The LAI of one plant species is not Watering Trough Gulch Feasibility Study (2014)

going to be the same over an area and as area increases, the accuracy
of the LAI’s ability to predict interception rates decreases. A more
in-depth look at area weighting the land covers in smaller parcels may
help increase the reliability of using the interception rates in the
water balance model. The LAI may also play a role in sublimation rates
and ripening of snow in areas – spatial variability in melting snow
during the spring and fall months. The snowmelt may also be pooling
under the snow surface – either flowing under the snowpack or pooling
and slowly infiltrating down.
Chapter 4 Pre-Mining Condition
4.1 PURPOSE
Watering Trough Gulch Feasibility Study (2014)

This chapter will examine the hydrology and land effects in the
Watering Trough Gulch basin for pre-mining condition. The goal of this
chapter is to establish a baseline condition or initial condition of
the land and top soil using two design storms. The chapter should also
illustrate the choice of what area (sub-basin) will be used for the
mining operation and why that choice was appropriate.
4.2 INTRODUCTION
The United States Army Corp of Engineers over several decades have
developed a modeling program for the general public and have been able
to digitize it into a computer model with a graphical user interface.
The HEC-HMS 3.5 program is a modeling program that uses many equations
and functions – these functions need inputs from physical and climatic
data to run the model more accurately (Army Corps of Engineers, 2000).
For this model there are two climatic events of interest: 10-year, 24-
hour and the 100-year, 24-hour storm events. The remainder of the
chapter will look at the methodology, results and issues with running
the model.
4.3 METHODS
This section discusses the methodology for using HEC-HMS and how to go
about operating the program. The following components will outline the
Watering Trough Gulch Feasibility Study (2014)

general process of obtaining the desired runoff calculations as well
as the initial steps to get inputs and model parameters. In the header
bar of the program there are different components under the Component
tab, and each component will be detailed below:
1. Basin Model Manager
The first component that should be selected is the Basin Model;
this component will represent either the entire catchment or each
sub-basin depending on the goal of the model. For this model,
there were three sub-basins (delineated in ArcGIS) with two
junctions and four reaches routing the flow from the top to the
bottom of the watershed. For each basin, rout or reach, and
junction different parameters need to define per the desired
function or outcome. Under the basin model manager tab,
adjustments to each reach, junction, and sub-basin area made.
Finding the areas of each basin was done in the ArcGIS as well as
the soil hydrologic groups and their land covers for each basin –
this produces the curve numbers needed to obtain a more
Watering Trough Gulch Feasibility Study (2014)

approximate runoff in Watering Trough Gulch. Areas for each soil
type with regard to the land cover can be found in (Table 4.3).
2. Meteorological Model Manager
This is the next component that would be selected for a design
storm and is the basis for the precipitation rates in the
watershed. To analyze the runoff potential in the watershed, two
design storms were established. The 10-year, 24-hour storm and
the 100-year, 24-hour the target for this study and is defined by
certain inputs. These inputs include the precipitation type, for
this model a look at different precipitation types was used to
analyze the comparative magnitude of runoff. Other inputs
involved in the meteorological model can represent the
evapotranspiration, and the snowmelt if desired.
3. Control Specifications
Control specifications define the timeframe of the storm event –
the 10-year event was given a 3 day time period to run. The three
day increment at 1-minute intervals was chosen for the 10-year
event while a ten day increment at 1-minute intervals was
selected for the 100-year event. Preference on the number of days
was chosen to scale the intensity of a typical storm of that typeWatering Trough Gulch Feasibility Study (2014)
for the region Colorado is in (Type II). The 1-minute interval
was chosen to produce the best resolution for the storm event.
Beyond the basic modeling with HEC-HMS, much work in GIS and Excel was
done to determine the parameters and will be presented below in the
results and discussion sections.
4.4 RESULTS
After running the model for both the 10-year and 100-year storm
events, results are still being generated. The storm event that
occurred in October of 1981 over watering trough gulch produced almost
6 cfs for several hours. When running the HEC-HMS model for the pre-
mining condition, the observed flows from the basin were much higher
nearly 18 cfs for the 10-year event and 75 cfs for the 100-year event.
4.5 DISCUSSION
For this model and others there is always a certain level of error
associated with calculating inputs but also the judgment of which
methods to use can influence abstract numbers. The first error
encountered when beginning to calibrate the pre-mining runoff
condition arose in the ArcGIS program. While delineating the sub-
basins, some area was lost in the process – still unsure as to why.
The area given by USGS was approximately 2.65 mi2 while the total areaWatering Trough Gulch Feasibility Study (2014)

after dividing up the sub-basins amounted to 2.57 mi2. This loss
decreases attributing land cover and soil types which can then change
the curve numbers for each basin, but also the areas of each sub-
basin. The next influence on the model was the amount of stream gauge
data to compare to the resulting storm events in the HEC model. With
only three years of record provided from the USGS Surface Water
website, one storm event was observed with a peak of 3 in/hr during
the October 1981 storm.
In conclusion, the look at HEC-HMS and the pre-mining condition show
results that make mining in watering trough gulch feasible. The basin
to be mined would be basin 1 at the southern-most end of the
watershed. This area is the largest and also has the highest frequency
of slopes less than 30%. The dominant vegetative cover in the sub-
basin is scrub and shrub making the initial mining clearing easy.
Watering Trough Gulch Feasibility Study (2014)

CHAPTER 5 DURING-MINING HYDROLOGIC CONDITION
5.1 INTRODUCTION
This chapter will examine the during-mining condition of the Watering
Trough Gulch in Basin 1 (B1) (Figure 5.1) for the hydrologic soil
properties and potential runoff for two different design storms; 10-
Watering Trough Gulch Feasibility Study (2014)
year 24-hour and the 100-year 24-hour storms for the entire watershed
and the basin selected to be mined. Typically a surface coal mine has
the ability to mine 100 acres per year (Stednick, 2014)
5.2 METHODS
The during-mining condition, similar to the pre-mining or undisturbed
condition a combination of the programs HEC-HMS and ArcMap were
implemented.
To examine the during mining condition and its potential effects on
downstream users and surrounding areas, a baseline condition
(undisturbed) was established in the previous chapter and now will be
compared to the condition of the mine during the mining process. To
accomplish a successful and accurate estimation of the feasibility of
a surface mine under the “worst case scenario” the following steps
were taken using ArcMap:
1. Starting with the Digital Elevation Model (DEM) the slope for the
entire watershed as well as each of the subbasins, the slope (as
a percent rise) was calculated.
2. To determine the area of mineable terrain a conditional statement
using the slopes was created by saying the following: If the
slope is greater than or equal to 35% it shall be assigned a 0
Watering Trough Gulch Feasibility Study (2014)

and if the slope is less than 35% give it a 1. Using the
attribute table from the new feature, the data was exported and
added to the map to show the land able for mining.
3. The stream layer was added next and buffered 30 meters. Each
subbasin was clipped to the overall watershed with the new slope
condition to better define the boundaries of each basin. The
visual model in HEC-HMS would later be drawn from the current
map.
4. Finally, the hydrologic soil groups were added to the basin
chosen to be mined (Basin 1) to show where mining would be
accomplished easier as well as provide a baseline for how the
dragline will progress through the mine.
Once the GIS had been wrapped up, the modeling in HEC could begin. The
HEC program was used to determine the peak outflows from the overall
watershed as well as the Basin 1 (B1) selected for the mining
operation. To determine the flows for the now disturbed mined area, as
well as the undisturbed parts the following steps were taken:
1. First under the Components tab the Basin Model Manager option was
chosen and named Watering Trough Gulch, under the Basin Model
Watering Trough Gulch Feasibility Study (2014)

Manager the three subbasins were added to the desktop window. The
units were set to metric for this model.
2. Next the Loss Method was set to SCS Curve Number, and similarly
the Transform Method to SCS Unit Hydrograph. The options for the
Baseflow, Canopy, and Surface Methods were not assigned anything
– none. Under the Loss Method, the initial abstraction was not
used but the lag time was calculated using the SCS method (Dunne
& Leopold, 1978). Under the same option, the Curve Number and
the percent impervious area was set to describe the surface mine
after more than 4 years of operation and will be detailed in
the . The Transform Method requires the lag time which was
calculated in the SCS method aforementioned. Repeated this step
for the remaining two subbasins.
3. Once all subbasins characteristics have been filled out, the
reaches were then assigned their parameters – under the Reach tab
for Basin 1 the Junction-1 was selected downstream, the routing
method was selected as Muskingum-Cunge and finally the Loss/Gain
method was selected as none. Next under the Routing tab, the
channel length, channel slope, channel bed width, and side slope
were assigned their respective values. The shape of the channel
Watering Trough Gulch Feasibility Study (2014)

was chosen to be trapezoidal. The Options tab was ignored for this
model. Repeated Step 3 for the other reaches.
4. After the Basin Model had been completely filled out, the
Meteorological Model tab was created and two storms could be
defined. The 10-Year 24-Hour and 100-Year 24-hour design storms
parameters could be defined. Under each design storm, the
precipitation type was defined as the SCS storm, leaving the
remaining parameters as none. Moving to the next tab - the basins
were selected to be included. Under each design storm in the
model, the type (Type II) and the depth (mm) were inputted.
5. Finally, select from the Components tab, the Control Specifications
Manager. The number of days and hours for each storm were
inputted – for this model a summer storm setting was chosen and
the month of July was chosen. The number of days was irrelevant
but a 3-day period was selected for the 10-Year 24-Hour storm
while a 5-day period was selected for the 100-Year 24-Hour storm.
Both components were selected to have a 1-minute resolution.
6. Once all the parameters in the Watershed Explorer and Component Editor
had been inputted, running of the model could begin. The results
and discrepancies with the model will be outlined in the
remaining sections of this chapter.
Watering Trough Gulch Feasibility Study (2014)
5.3 RESULTS
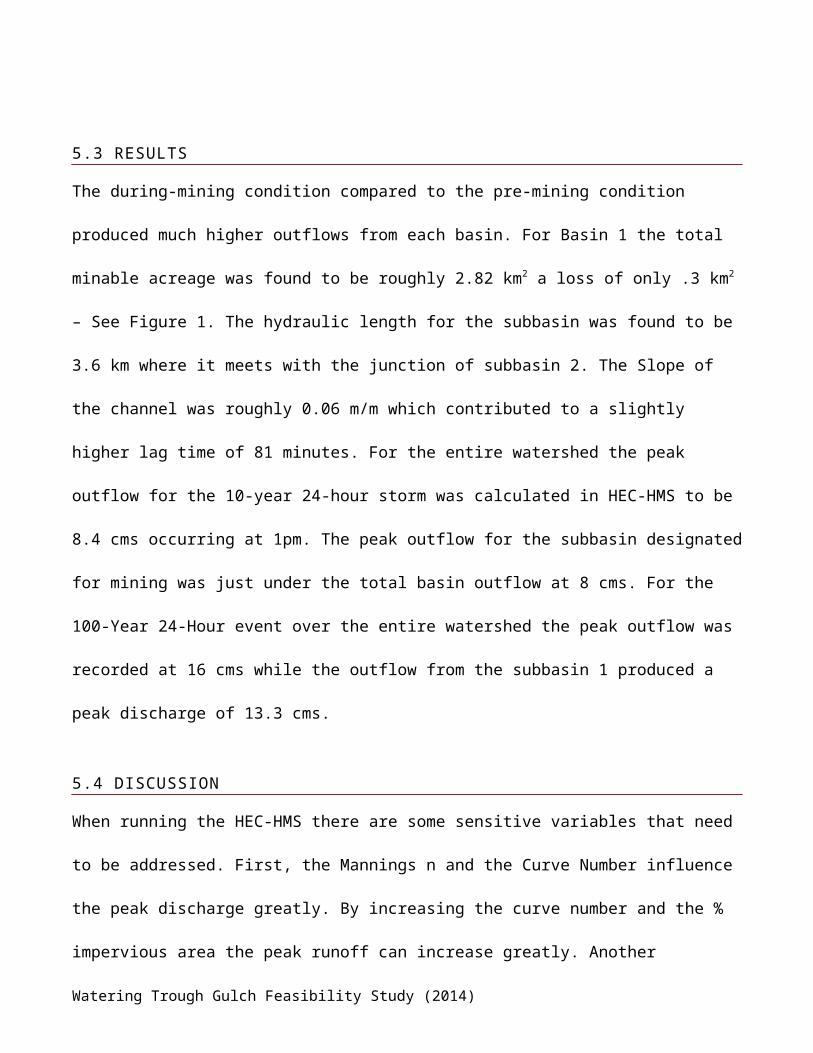
The during-mining condition compared to the pre-mining condition
produced much higher outflows from each basin. For Basin 1 the total
minable acreage was found to be roughly 2.82 km2 a loss of only .3 km2
– See Figure 1. The hydraulic length for the subbasin was found to be
3.6 km where it meets with the junction of subbasin 2. The Slope of
the channel was roughly 0.06 m/m which contributed to a slightly
higher lag time of 81 minutes. For the entire watershed the peak
outflow for the 10-year 24-hour storm was calculated in HEC-HMS to be
8.4 cms occurring at 1pm. The peak outflow for the subbasin designated
for mining was just under the total basin outflow at 8 cms. For the
100-Year 24-Hour event over the entire watershed the peak outflow was
recorded at 16 cms while the outflow from the subbasin 1 produced a
peak discharge of 13.3 cms.
5.4 DISCUSSION
When running the HEC-HMS there are some sensitive variables that need
to be addressed. First, the Mannings n and the Curve Number influence
the peak discharge greatly. By increasing the curve number and the %
impervious area the peak runoff can increase greatly. Another
Watering Trough Gulch Feasibility Study (2014)

influence on differing results can come from the numbers calculated in
ArcMap.
5.5 CONCLUSIONS
The discharge and peak outflow from each basin were considered under
the worst case scenario for the “during-mining” phase – as the mine is
excavated each year (100 acres) the soil is removed as well as the
overburden and replaced every 6 years – this is the process of surface
mining detailed in the SMCRA section. The numbers obtained from both
design storms seem reasonable considering the size and slope of the
watershed as well as the prospective subbasin.
5.6 RECOMMENDATIONS
In the future work with the mining condition – more consideration to
land cover and the actual mining process should be developed. The
numbers obtained in HEC-HMS and ArcMap are reasonable but further
studies within the subbasin should be conducted..
Chapter 6 – Soil Erosion
Watering Trough Gulch Feasibility Study (2014)

6.1 Purpose
The purpose of this chapter is to explore the sediment erosion rates in watering trough gulch by means of solving the universal soil loss equation (usle). The goal is to understand the rate and total amount of sediment that runs off the catchment in a pre- during- and post-mining setting.
6.2 Introduction
The amount of soil that leaves a catchment is almost directly related to different
6.3 Methods
To calculate the loss of soil from subbasin 1 in the watering trough
gulch catchment a series of factors from the usle were used and
calculated to determine the annual soil loss.
The soil loss equation is represented by the following parameters: a =
r k l s c p
R-factor
The initial parameter that was calculated was the r-value or rainfall
and runoff factor. To understand the runoff better there were a number
of options available, but for this estimation an isoerodent map was
used as a simple, “cut-and-dry” approach. The r-factor was 10 hundreds
ft-tonf-in(ac'h).
K-factor
Watering Trough Gulch Feasibility Study (2014)
The k-factor was found from the natural resource conservation services
(nrcs) webpage under the web soil survey (wss) link. The values for
the k-factor were taken for the pre-mining condition (all the
horizons/layers) as well as the during-mining condition indicating the
top layer was 16 inches below the surface.
The k-factor values for each land condition were imported as .txt
files into the gis program and joined with the soil data from ssurgo.
To determine the average k-factors for the subbasin and overall
watershed the average was taken from each area and land condition and
an average of those was used to determine the during mining runoff
from the watering trough gulch catchment.
Ls-factor
The length-slope factor is determined by the various lengths within
the subbasins of the hydrology as well as the slope for the
corresponding lengths. The accumulation of these values equates to the
length slope factor for a certain area.
Chapter 7 – sediment detention / channel hydraulics
7.1 introduction
Watering Trough Gulch Feasibility Study (2014)

The purpose of this chapter is to design a sediment detention basin in
the watering trough gulch catchment as a model to be used during the
mining and reclamation phases of mining.
The sediment runoff of a watershed is important to monitor and control
for most any land-use activity. The amount of sediment that comes off
an area is a function of the precipitation and the existing land
cover. The precipitation intensity, duration and spatial variability
influence the runoff response at a given monitoring gauge. In a mining
setting, there must be a series of sediment detention basins installed
to attenuate the flows from storms due to the lack of friction the
once-covered ground provided. In this chapter a detention basin model
is designed to accommodate the peak flows from a 10-year 24-hour
storm.
7.2 methods
Making the catchment
The subbasin being considered for a feasible mining operation is basin
1. In this basin a smaller catchment was established to help
understand the runoff potential in a during-mining condition. The
catchment area was found using stream stats – state applications to
get an idea of the physical basin characteristics in a timely manner.
Watering Trough Gulch Feasibility Study (2014)

Arcmap was used to measure the channel length, basin area, mean slope
by clipping the dem to the catchment raster.
Soil data was found on the web soil survey (wss) on the nrcs webpage.
Under the “physical properties” tab the percent (%) clay, silt, and
sand were found and imported into excel and area weighted for the area
of interest (aoi). In arcmap the soil data was clipped to the land
cover hydrologic soil group raster to determine a new curve number for
the catchment - using the nrcs curve number sheet (nrcs, 2014). From
there the s-value (in.) And initial abstraction (in.) Could be
determined; it would later be used for modeling a design storm in hec-
hms.
In hec-hms the curve number was used as an input in runoff
calculations and to determine the initial abstraction used in the
“basin model manager” tab. Other variables needed include the lag time tl
in minutes, the following equation shows how to calculate the lag time
in hours:
(equation 7.1) lag time is reported in hours and multiplied by 60
minutes to obtain the input for hec-hms. L=channel length in feet,
s=value calculated from the curve number in inches, and s=slope in
percent (%).
Watering Trough Gulch Feasibility Study (2014)

There are two important outputs to obtain from hec-hms after a
successful test has been run for the catchment. Looking at the “results”
tab, an executive summary is produced indicating a volume a peak
runoff volume (∀) in inches and the peak discharge (qp) from the
design storm in cubic feet per second (ft3/sec). These values are
important because they determine the sensitivity of the calculated
time of base tbi and peak runoff qpi.
Calculating the sediment detention basin
Using the area-weighted percentages for each soil in the catchment and
each soil type’s unit weight, a weight per cubic foot of soil, was
determined for the aoi. This unit weight would be used for the
remaining calculations of sediment storage
with the new area delineated from arcmap or stream stats, a
sediment detention ratio (sdr) can be calculated using the usda scs
method (1979) where a = square miles (mi2).
The total amount of sediment in pounds per cubic foot (lbs/ft3) for
the mine life can be determined using the following equation where
a=annual soil loss (tons/acres/year), sdr=sediment detention ratio,
w=unit weight found in equation7.1, a=area (acres). The volume of soil
is reported in acre-feet (af).
Watering Trough Gulch Feasibility Study (2014)

the peak runoff was calculated using one of the two hec-hms
outputs qp in inches per hour (in/hr). The area of catchment in acres
was used as well to calculate a rate of flow.
using the qpi found in equation 7.4 and the ∀ from hec-hms the
time of base in hours was calculated.
time of recession tri in hours was calculated using time of base -
the value from equation 7.4 and the estimated time to peak tpi from
the hec-hms outputs graph.
Center of mass for the inflow hydrograph was calculated next using the
values obtained in equation 7.5 and the estimated time to peak tpi. The
time to the center of mass for the inflow hydrograph tmi is also in
hours.
Equation (7.8) the detention time tmo, required for a center of
mass outflow hydrograph on the 24-hour scale must be greater than or
equal to 24 hours. Tmo was calculated by adding the center of mass time
(eq 7.8) to the detention time = 24 hours.
the peak outflow qpo was calculated by breaking up and rearranging
equation 7.9 into two parts to obtain values for a quadratic equation
Watering Trough Gulch Feasibility Study (2014)

that qpo is defined for. The resulting rate of qpo was produced in
inches per hour and converted to cubic feet per second.
Estimated the storage s volume for the basin is calculated in inches
but converted to acre-feet (af) by multiplying by the area in acres
and converting inches to feet.
The diameter of the outflow pipe in the sediment detention basin can
be calculated by reworking the equation for head on an outflow pipe
(eq 7.11a). Rearranging to solve for dr the inputs needed are the
calculated head in feet (see note below), and the calculated peak
outflow qpo.
The h-value or head is obtained by looking at a stage (ft) vs volume
(af) relationship graph and using the equation produced by the linear
interpolation of the two closest points to the calculated total
storage volume ∀total.
The values for each equation will be reported in the results section.
7.4 Results
The total area of the catchment for this model was determined to be
198 acres or 0.31 mi2. The calculated stream length was 3,394 feet
while the overall basin length was 5,642 feet and an average basin
Watering Trough Gulch Feasibility Study (2014)

slope of 18.4%. The curve number used was 88 to represent the worst
case scenario of basin 1 and the catchment together. From there the s-
value and initial abstraction (ia) were calculated. The s-value was
1.4 inches while the initial abstraction was calculated at 0.3 inches.
The estimated weight of storage was determined to be 63 (tons/acre)
per year and for the life of the mine the total storage came to be 967
tons/year or 1 acre-foot annually. (table 7.1)
Time of base tbi was the first component calculated for the sizing of
the detention basin and pipe outflow capacity. Time of base was
estimated to be 1.6 hours. The time to the peak of the inflow
hydrograph tpi occurred at 1.37 hours. The recession tri was 0.25 while
the center of mass of inflow tmi was 1 hour. Next, approximating the
center of mass of outflow hydrograph for a 24-hour detention, tmo
resulted in being 25 hours. (table 7.2)
CHAPTER 8 – RECLAMATION/REVEGETATION
8.1 INTRODUCTION
Watering Trough Gulch Feasibility Study (2014)
The purpose and overall goal of this chapter is to address the
concerns with mining reclamation in Watering Trough Gulch and the goal
of the reclamation process for post-mined land in Northern Colorado.
Upon the completion of the mine operation, a process to restore the
land to a better or similar condition than it was prior to the mining
must occur – this process is called reclamation. The reclamation
process can vary in the time and money spent on the project and is a
function of several physical variables.
Revegetation techniques differ by region because they are a function
of the annual and seasonal climate variation for the area. The
revegetation can take place naturally, but with the right funding, it
is typically increased with modern practices and updated machinery.
Compared to the Eastern parts of the United States, where revegetation
may take place naturally or aided in 10 years or less, the Western
states have a much longer revegetation period 10 to 100 years
(Congress, 1986).
Revegetation is a key step and aids other aspects of the reclamation
process – one of the most d important is the sediment yield and the
runoff water quality. With a successful establishment of local
Watering Trough Gulch Feasibility Study (2014)
vegetation, and new topsoil placed on top of the filled in land, the
roots should hold the soil in place and reduce the annual sediment
yield from the basin as time goes on.
The reclamation process can be complex and should be taken on by a
series of experts; the general process described is bulleted below
(Paschke, 2014):
1. Determine the restoration goal: The restoration goal can be one
overarching goal or a series of small goals collectively working
together. To build an accurate comparison, the use of a nearby
area with similar physical characteristics can be used to help
compare results.
2. Identify the constraints: There are a number of constraints that
limit restorative efforts from physical and chemical conditions,
a species index and animal patterns, as well as money and time.
3. Prioritize constraints: Some factors in the restoration process
may be accomplished simultaneously to save time and money while
enhancing the condition of the area at
4. Address the constraints in order: Starting with the physical
characteristics, the initial goal is to reduce the runoff by
establishing a vegetation cover over a well-mixed topsoil layer.
Watering Trough Gulch Feasibility Study (2014)

Topsoil is the beginning to a successful long-term restoration
followed by vegetative growth and then the introduction of
species. The methods of addressing these different constraints
are discussed further in the Methods section of this chapter.
5. Monitoring: The monitoring of the site will be conducted on the
basis of the physical constraints found in the pre-mining
evaluations and the post-mining reclamation.
6. Maintain the new system: With monitoring efforts in place, the
system may undergo unforeseen changes and flexibility in
management practices may need to be enacted.
With a goal and the important criteria mapped out, the reclamation
process can being during or after the mining operation – typically
the latter is chosen.
8.3 METHODS
There are several main goals of the restoration process that are
considered for a post-mining project, mainly the physical and chemical
characteristics of the soil and runoff water quality. To satisfy a
successful reestablishment of an equal or better ecology in the area,
a pre-mining baseline condition must be fashioned to understand the
goal of the post-mining reclamation process. Watering Trough Gulch Feasibility Study (2014)

PRE-MINING
An account of all the plant species in the area to be designated for
mining must be made prior to mining so that upon completing the mining
operation, a successful growth of vegetation can occur.
A similar account of the animal and other biota living on the premise
may be accounted for using the help of rangeland scientists and
ecologists. The goal is to obtain populations, general habitat
classification and area needed – if larger animals (cattle, bison,
ect.) are present on the land cooperation with the rancher may be
required.
Soil samples will be taken prior to mining to get an idea of the
topsoil and lower layers to determine the soil hydrologic groups –
classifications can be found in Chapter 2. Understanding the
hydrologic soil groups prior to mining will help determine the post
mining soil replacement and revegetation
POST MINING
Once the mining is complete and the heavy machinery has finished the
major operations, new machinery and materials can begin to be moved
into the abandoned mine area, and the restoration plan can be put into
action.
Watering Trough Gulch Feasibility Study (2014)

Starting with the stored piles of soil, overburden, interburden and
the tailings from the mining operation – the goal is to make sure
there is no issue with water quality for downstream users. First, the
remaining pits are filled in and the remaining soil can be used
towards putting down new topsoil. To make healthy topsoil it is
important to include a variety of different soil amendments (Paschke,
2014) and many organic elements can be used by mulching any unwanted
vegetation and dead material.
The next step after topsoil has been applied to the area and the
topography has been smoothed back to a similar baseline condition. The
seeding of native plants can begin – to reduce compaction of the new
soil and increase the chance of a successful plant community.
Once basic characteristics of the land have been restored, focus on
managing the chemicals and metals in runoff water quality.
8.4 RESULTS
The findings for the restoration process are categorized into the
highest need to be taken care of first followed by less important or
less time-intensive projects. To understand the importance and order
of these processes or goals in reclaiming a mine site, a sensitivity
analysis may be used to compare the different physical criteria in the
Watering Trough Gulch Feasibility Study (2014)

watershed that have the highest potential to affect the environment as
well as the downstream users. The order of restoration will occur in
this order: separate the unusable soil and materials, return area to
original AOC by grading or other method, apply even and well mixed
topsoil over disturbed areas, and begin the revegetation process by
planting and seeding.
When establishing the topsoil there are two options to consider
depending on the mine operations: The storage and upkeep of the local
soil on site, this can be cost effective in the short term, but the
soil may degrade over time affecting long-term success of
revegetation. The other option; Import fresh topsoil from off-site -
this option has been shown to help the long term succession of plants
in the disturbed area (Congress, 1986). For other land cover that once
existed on the site – trees, large shrubs, and crops should be given
special planting instructions and a visual description of the planting
guidelines can be found in Appendix 8.
The succession of a new vegetative cover is a difficult task
especially for the Western US where generally the climate is more
variable and there is a lack of moisture for plants to take in. For
the seeding technique, a spray seeding will not be used due to lower
Watering Trough Gulch Feasibility Study (2014)

rates of succession in germination (Congress, 1986). The soil type in
the basin under scope is mostly loam ~ 60-80% of the land cover area.
The loamy soil and potential for metal leeching will be counteracted
using a variety of native grasses and shrubs – some with alkali-
reducing properties. These grasses include: Blue Grama and
Buffalograss (Chapter 12 - Revegetation , 2001).
Considering the hydrology of the disturbed area – and the stream
buffer that was established prior to the mining, post-mining hydrology
can hinder the success of revegetation.
8.5 DISCUSSION
In the reclamation process, the criteria under scope of most
importance and will be taken care of with higher priority than other
processes within the mine site. To have a successful reclamation for
the long-term, it is important to consider the discrepancies with the
methods described above and how they quality can be improved or
reduced in each situation.
When replacing soil it is imperative to have strong Nitrogen-fixers in
the soil, regardless if soil is freshly brought in or stored over the
life of the mine. Nitrogen is a vital chemical for plant growth in
both early and late stages of life (Congress, 1986).
Watering Trough Gulch Feasibility Study (2014)

Seeding and planting of the vegetation has the issue of possible weed
growth or an unwanted intrusion of noxious weeds. Weeds grow well in
Colorado, and prevention is a good practice when seeding and
monitoring of the vegetation (Brown & Macklow, 2012). Weeds like
myrtle spurge and houndstongue can be found in many areas near
Watering trough Gulch – monitoring efforts should be placed on the
succession of desirable native plants.
Mine tailings will be placed in an isolated area lined with a liner
and capped with extra overburden. This site shall be monitored for any
runoff of metals after the reclamation process has been underway for
any amount of time. The mine tailings containment can be a difficult
step in the reclamation process but should not be overlooked if the
amount of tailings is not significant (Congress, 1986). If dealt with
improperly, an increase in alkalinity or a change in pH can be
observed downstream of the sub-subbasin.
8.7 RECOMMENDATIONS
When the reclamation process begins it is dependent on the available
money and time as well as temporal and physical variables. These
variables and constraints can influence the choice in reclamation
method for each different project or aspect of the overall reclamation
Watering Trough Gulch Feasibility Study (2014)

period. As recommendations, a look at different techniques new and old
could be referenced to the different physical aspects of the disturbed
land to choose the most efficient one.
In the restorative and monitoring phase, an emerging technology in
many industries – Unmanned Aerial Vehicle (UAV) may be implemented to
reduce the amount of man-hours spent driving too and from the site.
These UAV’s are capable of long flight times, mounting hi-resolution
cameras, sensors, and can even carry supplies into the disturbed area.
Drones could be used to aid in the distribution of seed, or be used to
check the progress of the reclamation (Wanless & Katsuris, 2013).
Another recommendation for the reclamation process is to work
diligently and concurrently with the mining process (during mining)
and restore as time goes on.
Watering Trough Gulch Feasibility Study (2014)

CHAPTER 9 – MONITORING
9.1 INTRODUCTION
Monitoring is the process of making observations over a time period to
track the progress or levels of a certain variable of interest within
the system. For Watering Trough Gulch, it will be imperative to
monitor prior to the mining operation and long after the mine shuts
down. Monitoring before mining will determine the baseline water
quality levels – referenced in the during- and post-mining stages to
prevent levels exceeding the standard. Water quality is of greatest
concern in the post and pre mining stages
9.2 METHODS
For the monitoring process in Watering Trough Gulch, there will have
been a monitoring and reclamation plan established to monitor prior to
the operation so that any unexpected or unwanted circumstance is
prevented more readily – as designated in SMCRA (SMCRA, 2014).
Monitoring in the pre-mining phase is a key step to establishing
ambient or natural water quality conditions. These conditions can then
be used in the during- and post-mining monitoring efforts. I would
Watering Trough Gulch Feasibility Study (2014)
recommend a seasonal or semi-annual monitoring schedule for all
periods of the mining process.
Conclusion
Watering Trough gulch is a smaller watershed that is being considered
for mining use and an initial assessment of the land, water, flora and
fauna must be made to set a standard during the post-mining
reclamation. After interpreting the basic characteristics of the
watershed, the mining process can begin. This watershed is small and
so the remediation of the area can be more easily directed and
controlled compared to other nearby watersheds that are much larger.
In a conclusive look at Watering Trough Gulch, the subbasin chosen to
Watering Trough Gulch Feasibility Study (2014)

undergo the mining process will be a highly disturbed area with much
need repair. To make sure the bond is released for the mining company
and their liability for the land freed, the monitoring and initial
restoration efforts must be not only successful but also efficient and
ecologically sustainable for the future. These monitoring efforts will
be discussed in greater detail in the next chapter (CH 9).
Recommendations
CH 2 For this chapter, I plan on going back to my data and checking
for inconsistencies and manipulating any missing data from the cells.
A description of Watering Trough Gulch would be better if the
following occur: An accurate or reasonable water balance calculated
using the Thronwaite model would match temporally with the discharge
and precipitation as rain (Dunne, 1978). There could’ve been adjacent
watersheds to contrast general characteristics of each to understand
how Watering Trough Gulch behaves. Furthermore, it is imperative that
a map of soils and land cover be incorporated in the initial
description of Watering Trough Gulch to show the physical
characteristics of the land better.
Watering Trough Gulch Feasibility Study (2014)

Watering Trough Gulch Feasibility Study (2014)

APPENDIX
A1. Chapter 1
(Figure 1.1) Diagram shows the relationship between the carbon content (or the time and depth of burial) compared to the heating value.
Watering Trough Gulch Feasibility Study (2014)

(Figure1.2) Annual coal mine production in Colorado from 1864-2004 in millions of short tons
Watering Trough Gulch Feasibility Study (2014)
A2. Chapter 2
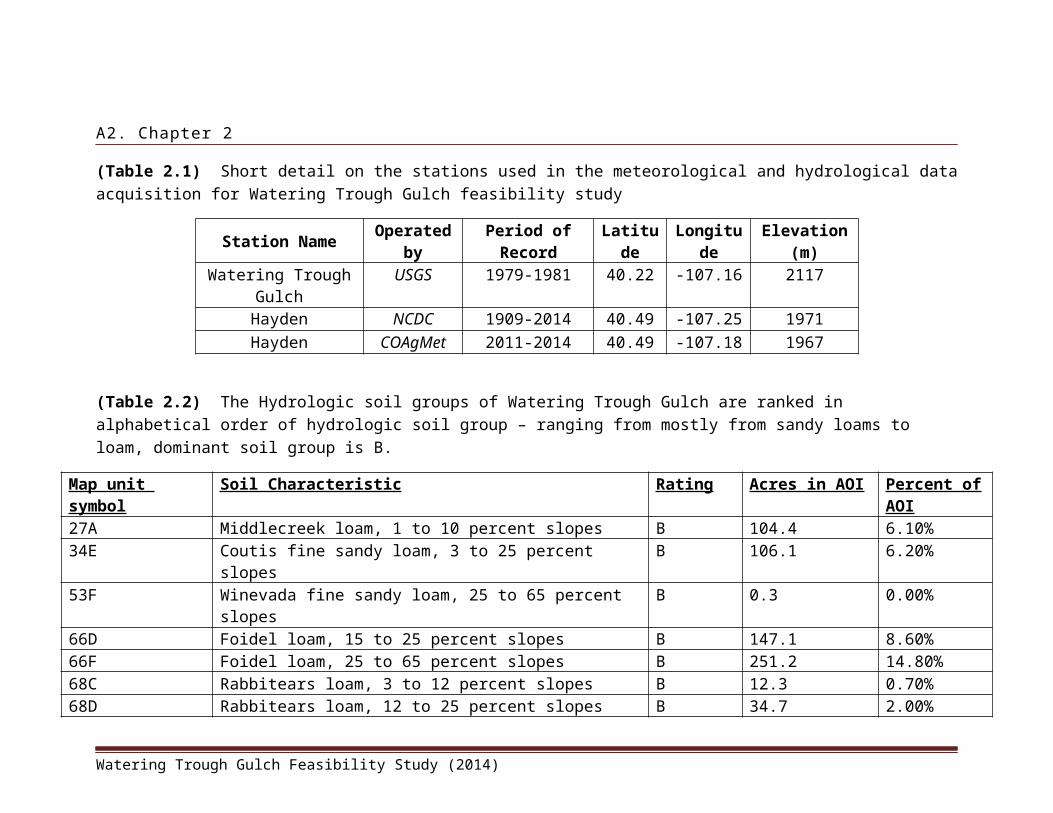
(Table 2.1) Short detail on the stations used in the meteorological and hydrological dataacquisition for Watering Trough Gulch feasibility study
Station Name Operatedby
Period ofRecord
Latitude
Longitude
Elevation(m)
Watering TroughGulch
USGS 1979-1981 40.22 -107.16 2117
Hayden NCDC 1909-2014 40.49 -107.25 1971Hayden COAgMet 2011-2014 40.49 -107.18 1967
(Table 2.2) The Hydrologic soil groups of Watering Trough Gulch are ranked in alphabetical order of hydrologic soil group – ranging from mostly from sandy loams to loam, dominant soil group is B.
Map unit symbol
Soil Characteristic Rating Acres in AOI Percent ofAOI
27A Middlecreek loam, 1 to 10 percent slopes B 104.4 6.10%34E Coutis fine sandy loam, 3 to 25 percent
slopesB 106.1 6.20%
53F Winevada fine sandy loam, 25 to 65 percent slopes
B 0.3 0.00%
66D Foidel loam, 15 to 25 percent slopes B 147.1 8.60%66F Foidel loam, 25 to 65 percent slopes B 251.2 14.80%68C Rabbitears loam, 3 to 12 percent slopes B 12.3 0.70%68D Rabbitears loam, 12 to 25 percent slopes B 34.7 2.00%
Watering Trough Gulch Feasibility Study (2014)

80D Foidel loam, 3 to 25 percent slopes B 13.2 0.80%X8D Winevada-Splitro complex, 3 to 25 percent
slopesB 55.3 3.30%
X8F Dunckley-Skyway complex, 25 to 65 percent slopes
B 133.2 7.80%
2E Routtskin loam, 12 to 25 percent slopes C 42.3 2.50%50F Routt loam, warm, 25 to 65 percent slopes C 98.4 5.80%133 Lintim loam, cool, 3 to 25 percent slopes C 310.3 18.20%35D Phippsberg silty clay loam, 12 to 25 percent
slopesD 91.9 5.40%
103 Cryoborolls, cryorthents soils, rock outcrop, 25 to 99 percent slopes
D 177.1 10.40%
120 Phippsberg clay loam, 25 to 65 percent slopes
D 27.8 1.60%
D10 Impass silty clay loam, 12 to 25 percent slopes
D 94.5 5.60%
W Water 1.3 0.10%
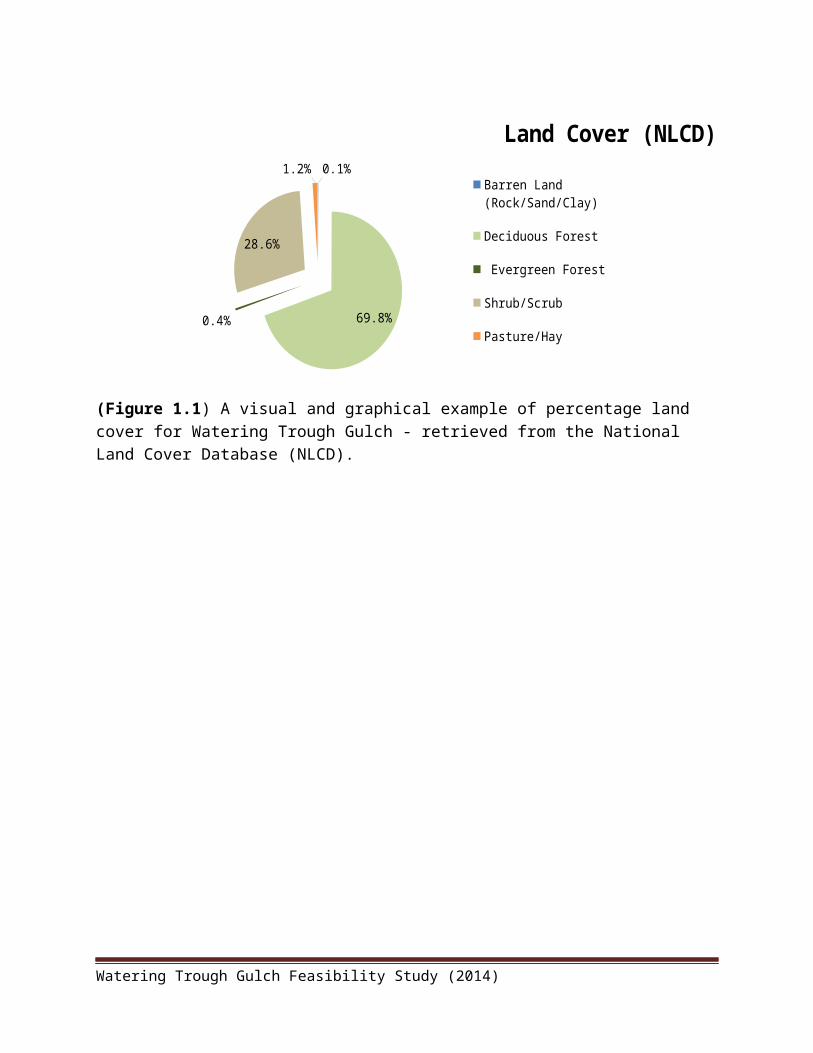
(Table 2.3) There are only 5 land cover types found in the watershed found on the NRCS WebSoil Survey webpage. Listed below are the different land cover types and their area of cover as well as the calculated leaf area indexes (LAI), Max Stand Mass and Rooting Depth(Fassnacht S. R., 2013).
VALUE Land Cover Classification Count % of Area Min LAI Max LAI Max StandMass (kg/m2)
Rooting Depth(m) Description
31 Barren Land(Rock/Sand/Clay)
5 0.0007 0 0 0 0 Barren areas of bedrock, desert pavement, scarps, talus, slides, sand dunes, strip mines, gravel pits and other accumulations of earthen material. Generally,
Watering Trough Gulch Feasibility Study (2014)

vegetation accounts for less than 15% of total cover.
41 Deciduous Forest 5332 0.6976 0.5 6 20 2
Areas dominated by trees generally greater than 5 meters tall, and greater than 20% of total vegetation cover. >75% of vegetation sheds seasonally
42 Evergreen Forest 33 0.0043 1.6 2 25 1
Areas dominated by trees generallygreater than 5 meters tall, and greater than 20% of total vegetation cover. More than 75 percent of the tree species maintain their leaves all year. Canopy is never without green foliage.
52 Shrub/Scrub 2184 0.2858 0.5 4 8 1
Areas dominated by shrubs; less than 5 meters tall with shrub canopy typically greater than 20% of total vegetation. This class includes true shrubs, and young trees in an early successional stage
81 Pasture/Hay 89 0.0116 3 4 1.5 0.2
Areas of grasses, legumes planted for livestock grazing or the production of seed or hay crops, typically on a perennial cycle. Pasture/hay vegetation accounts forgreater than 20 percent of total vegetation.
Watering Trough Gulch Feasibility Study (2014)
0.1%
69.8%0.4%
28.6%
1.2%
Land Cover (NLCD)Barren Land (Rock/Sand/Clay)
Deciduous Forest
Evergreen Forest
Shrub/Scrub
Pasture/Hay
(Figure 1.1) A visual and graphical example of percentage land cover for Watering Trough Gulch - retrieved from the National Land Cover Database (NLCD).
Watering Trough Gulch Feasibility Study (2014)

(Figure 2.2) Slopes of Watering Trough Gulch with the stream network – slopes were calculated in ArcMap using the Slope tool from the DEM. DEM data was acquired from Colorado View
Watering Trough Gulch Feasibility Study (2014)

Watering Trough Gulch Feasibility Study (2014)

(Figure 2.3) Land Cover Data retrieved from the NCLD. Watering trough gulch is dominated by deciduous forest and scrub/shrub.
Watering Trough Gulch Feasibility Study (2014)

(Figure 2.4) Soils data acquired from SSURGO database. Dominant soils are Foidel Loams and Lintim Loam
Watering Trough Gulch Feasibility Study (2014)
A3. Chapter 3
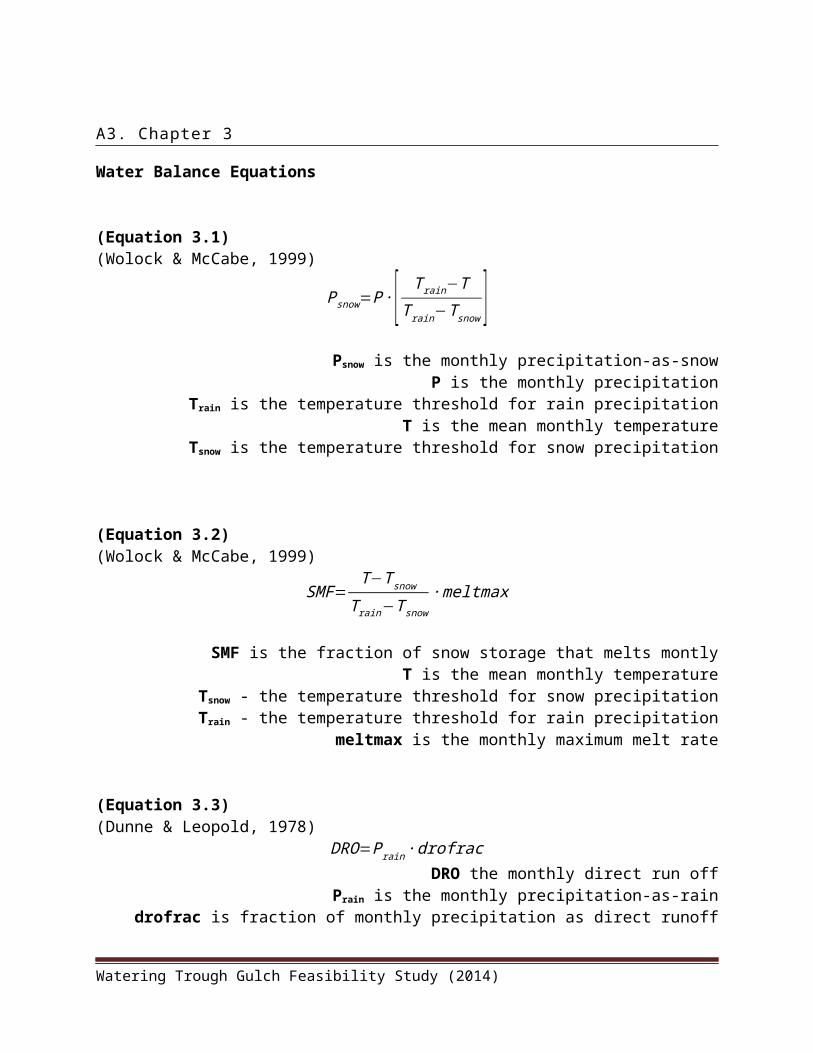
Water Balance Equations
(Equation 3.1)(Wolock & McCabe, 1999)
Psnow=P∙ [ Train−TTrain−Tsnow ]
Psnow is the monthly precipitation-as-snowP is the monthly precipitation
Train is the temperature threshold for rain precipitationT is the mean monthly temperature
Tsnow is the temperature threshold for snow precipitation
(Equation 3.2)(Wolock & McCabe, 1999)
SMF=T−Tsnow
Train−Tsnow∙meltmax
SMF is the fraction of snow storage that melts montlyT is the mean monthly temperature
Tsnow - the temperature threshold for snow precipitationTrain - the temperature threshold for rain precipitation
meltmax is the monthly maximum melt rate
(Equation 3.3)(Dunne & Leopold, 1978)
DRO=Prain∙drofracDRO the monthly direct run off
Prain is the monthly precipitation-as-raindrofrac is fraction of monthly precipitation as direct runoff
Watering Trough Gulch Feasibility Study (2014)

(Equation 3.4)(Dunne & Leopold, 1978)
Et=1.6[10∙TaI ]a
Et is the monthly potential evapotraspiration (PET)Ta is the monthly average temperature
a is calculated in Equation 3.6I is the monthly heat index
(Equation 3.5)(Dunne & Leopold, 1978)
I=∑i=1
12 [ Tai5 ]1.5
I is the monthly heat indexTa is the monthly average temperature
(Equation 3.6)(Dunne & Leopold, 1978)
a=0.49+0.0179I−0.0000771I2+0.000000675I3
a is used to calculate Equation 3.4I is the monthly heat index
(Equation 3.7)(Walter, 2013)
AW=AWC×e(APWLAWC
)
AW is the monthly available soil waterAWC is the total available water capacity
APWL is the monthly accumulated potential water loss
Watering Trough Gulch Feasibility Study (2014)

(Table 3.1) The annual water balance of Watering Trough Gulch was determined using the series of Equations 3.1-3.7 displayed above using climatic data retrieved from the Hayden Airport in Hayden, Colorado. The water balance was used to characterize the hydrology and climate for the baseline condition.
Annual
Month October November Decembe
rJanuar
yFebruar
y March April May June Jul
y August September Sum Avg
Temperature [C] 7.5 -0.1 -6.3 -8.0 -5.6 -1 5.8 11 16 19 18 14 6Precipitation [mm] 39 33 38 37 31 33 42 38 30 32 35 38 425 35Precipitation as Rain [mm] 39 0 0 0 0 0 42 38 30 32 35 38 254 21
Precipitation as Snow [mm] 0 33 38 37 31 33 0 0 0 0 0 0 172 14
Interception [mm/month] 5 5 6 7 7 6 5 5 5 5 6 6 68
Accumulated snow asSWE [mm] 0 28 60 90 114 141 136 0 0 0 0 0 567
Snowmelt Factor [mm] 0.0 0.0 0 0 0 0 0 0 0 0 0 0
Snowmelt [mm] 0 0 60 90 114 141 68 0 0 0 0 0 471Net Input [mm] 39 32 98 126 145 174 110 38 30 32 35 38 897Direct Runoff 1.9 0 0 0 0 0 2.1 1.9 1.5 1.6 1.8 1.9 13PET [mm/month] 38 0 0 0 0 0 30 56 80 98 93 69 464P-PET [mm] 0 33 38 37 31 33 12 -18 -50 -66 -58 -32Net Input - PET [mm] 0 32 98 126 145 174 80 -18 -50 -66 -58 -32 433
Accumulated potential WL [mm] -18 -50 -66 -58 -32
Actual soil moisture [mm] 214 243 250 250 250 250 222 199 181 169 171 188
Change in SM [mm] 26 29 7 0 0 0 -28 -23 -18 -12 2 17AET [mm/month] 14 11 0 0 0 0 30 56 48 43 37 70 309Deficit [mm] 24 0 0 0 0 0 0 0 32 55 56 -1 167Surplus 14 43 50 50 50 50 22 0 0 0 0 0 279
Watering Trough Gulch Feasibility Study (2014)

Total available forrunoff [mm] 25 22 38 37 31 33 12 0 0 0 0 0 197
Detention [mm] 7 22 25 25 25 25 11 0 0 0 0 0 140Total runoff [mm] 12 11 19 18 16 16 6 0 0 0 0 0 99Observed discharge [mm] 0.51 0.53 1.6 25 18 3.7 1 0.26 0.28 0.3
3 0.39 0.41 52.0 4.3
Watering Trough Gulch Feasibility Study (2014)

Sep Oct Nov Dec Jan Feb Mar Apr May Jun Jul Aug Sep Oct0
20
40
60
80
100
120
-10.0
-5.0
0.0
5.0
10.0
15.0
20.0
25.0Precipitation [mm] PET [mm] AET [mm]Temperature [C]
Month
Depth (mm)
Temperature (C)
Deficit
Soil Moisture Recharge
(Figure 3.1) A water balance was calculated in Chapter 3 to characterize baseline conditions. The monthly water balance indicates relationships between the inputs and outputs and predicts the annual runoff depth from the area.
Watering Trough Gulch Feasibility Study (2014)

10/1/1989
11/1/1989
12/1/1989
1/1/1990
2/1/1990
3/1/1990
4/1/1990
5/1/1990
6/1/1990
7/1/1990
8/1/1990
9/1/1990
-40.00
-20.00
0.00
20.00
40.00
60.00
80.00
0.00
10.00
20.00
30.00
40.00
50.00
60.00Soil Moisture
Change in SM [mm] Deficit [mm] Surplus [mm]
Figure (3.2) A monthly water balance was used to determine soil moisture exchanges within the system and to help determine times of deficit and surplus. Soil moisture is both a losing and gaining system through a porous media – soil
Watering Trough Gulch Feasibility Study (2014)

Watering Trough Gulch Feasibility Study (2014)

0 1 2 3 4 5 6 7 8 9 10 11 12-40.0
-30.0
-20.0
-10.0
0.0
10.0
20.0
30.0
40.0
Avg Temp Max Temp Min Temp
Month
Temperature (C)
(Figure 3.3) Maximum, minimum and average temperatures recorded over a 105 year period recorded at the Hayden Airport – part of the NCDC Climate Observations.
Watering Trough Gulch Feasibility Study (2014)

A4. Chapter 4
(Equation 4.1)S=
1000CN
−10
CN is the Curve NumberS is associated with the conditions of the soil and plant-litter-
cover
(Equation 4.2)Ia=0.2×S
Ia represents all losses to the hydrologic systemS is associated with the conditions of the soil and plant-litter-
cover
(Equation 4.3)tL=¿¿¿
tL denotes lag time in hoursY is indicative of channel percent slope
L represents the hydraulic length in feetS is calculated with the CN
Watering Trough Gulch Feasibility Study (2014)

Watershed
Areakm2
Highest
Elevation m
Lowest
Elevation m
Hydraulic
Length m
%impervious
CN Slope%
Slopem/m S Ia
Tl (LagTime)hours
Tl (LagTime)min
SubBasin
13.07 2368 2169 3421 1 65.3 6 0.06 5.3 1.06 1.357 81
SubBasin
22.22 2276 2123 1816 1 67.9 5 0.08 4.7 0.95 0.836 50
SubBasin
31.38 2295 2118 3026 1 63.7 6 0.06 5.7 1.14 1.282 77
Reach1 2170 2121 1521 66 3 0.03 5.2 1.05 0.995 60
Reach2 2121 2117 196 66 2 0.02 5.2 1.04 0.236 14
Watering
TroughGulch(complete)
6.67 2456 2117 5,665 66 21 0.06 5.2 1.03 1.056 63
(Table 4.1) A hydrologic modeling program (HEC-HMS) requires several inputs to run accurately and produce valuable results for further analysis. Basic inputs are given in the table below for the pre mining hydrology.
Watering Trough Gulch Feasibility Study (2014)

(Table 4.2) The hydrologic soil groups and their associated land cover area weighted for each subbasin in Watering Trough Gulch. Subbasin 1 will be considered for mining in the study.
Basin 1 Basin 2 Basin 3Area = 3.03 km2 Area = 2.23 km2 Area = 1.38 km2
Land Cover Code
B C D B C D B C D
41 0.38 0.11 0.38 0.09 0.04 0.08 0.14 - 0.0342 0.12 0.05 - 0.25 0.27 0.28 0.05 0.04 0.0152 1.02 0.85 0.15 0.60 0.23 0.26 0.72 0.04 0.3081 - - 0.00 - 0.13 0.00 - - 0.05
Watering Trough Gulch Feasibility Study (2014)

A5. Chapter 5
(Figure 5.1) Outflow in cubic meters per second (cms) from Subbasin 1 entering Reach 1 for the 100-year 24-hour storm event.Peak at 13 cms.
Watering Trough Gulch Feasibility Study (2014)
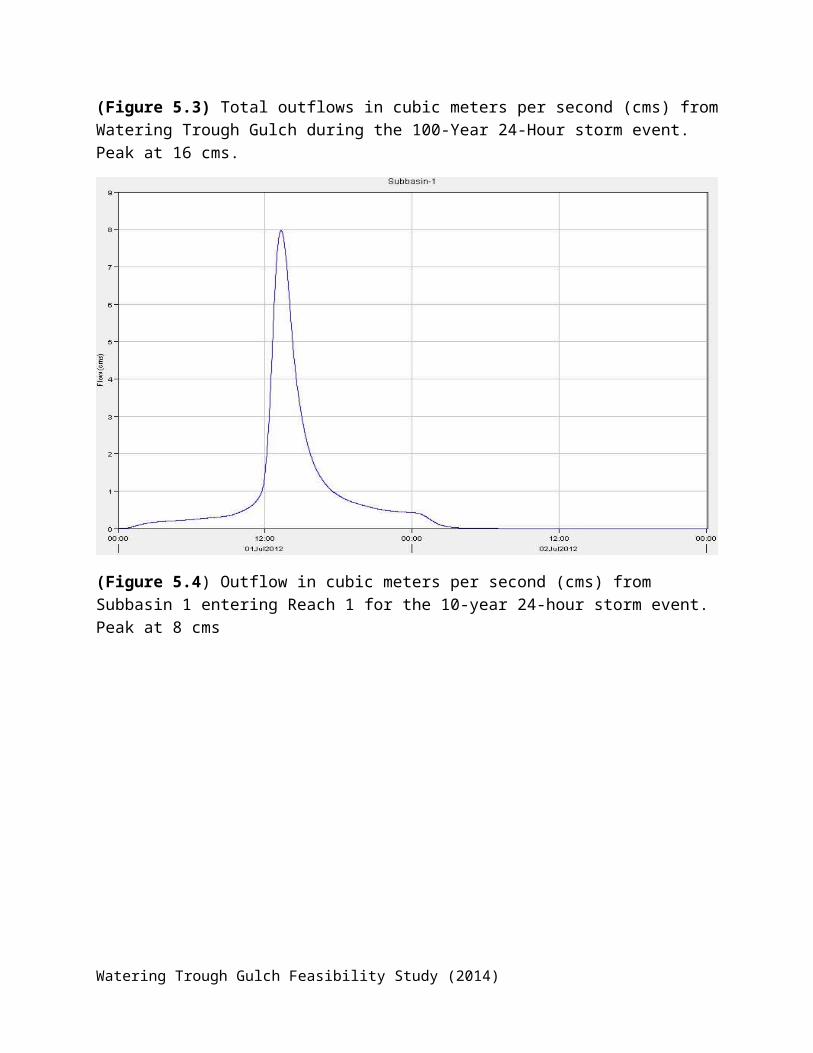
(Figure 5.3) Total outflows in cubic meters per second (cms) fromWatering Trough Gulch during the 100-Year 24-Hour storm event. Peak at 16 cms.
(Figure 5.4) Outflow in cubic meters per second (cms) from Subbasin 1 entering Reach 1 for the 10-year 24-hour storm event. Peak at 8 cms
Watering Trough Gulch Feasibility Study (2014)

(Figure 5.5) Total outflows in cubic meters per second (cms) fromWatering Trough Gulch during the 10-Year 24-Hour storm event. Peak at 8.5 cm
A6. Chapter 6
(Equation 6.1)A=R∙K∙L∙S∙C∙P
A is the estimated average soil loss [tons/acre/year]R is the rainfall-runoff erosivity factor
K is the soil erodibility factorL is the slope length factor
S is the slope steepness factorC is the cover and management factor
P is the erosion control practice factor
(Equation 6.2)(Moore & Burch, 1986)
LS=( [FA ]∙3022.13 )
0.4
∙( sin(S)0.0896)
1.3
LS is the length slope factorFA is the GIS flow accumulation layer
S is the GIS slope layer in degrees
Watering Trough Gulch Feasibility Study (2014)

A7. Chapter 7
Clay Sand Silt
Weight when submerged(lbs/ft3) 26 97 70
Percent (%) of Catchment 31.95 31.56667 35.26667
Percent (%) of Catchment 0.32 0.31 0.35 Tons/Mine Life
W (ton/ac/yr) 63 968.6492Table 7.1 The properties of sand silt and clay submerged in waterarea used in the determination of settling times and sediment detention basin size.Watering Trough Gulch Feasibility Study (2014)
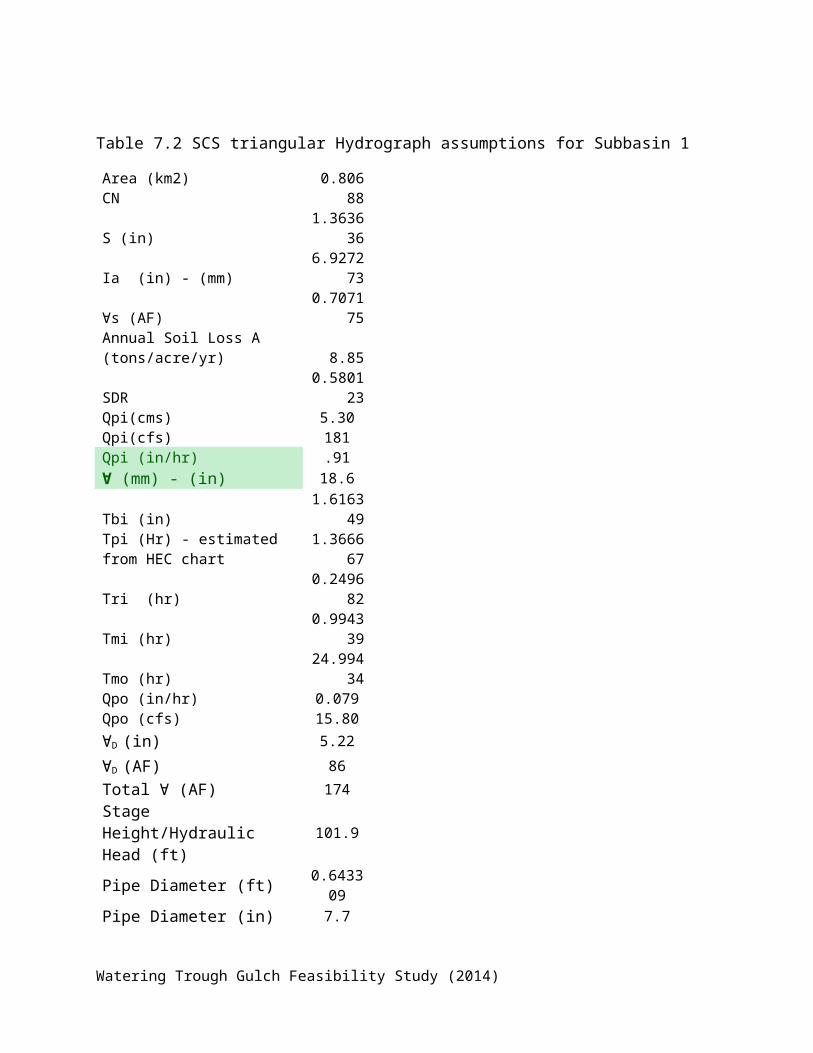
Table 7.2 SCS triangular Hydrograph assumptions for Subbasin 1
Area (km2) 0.806CN 88
S (in)1.3636
36
Ia (in) - (mm)6.9272
73
∀s (AF)0.7071
75Annual Soil Loss A (tons/acre/yr) 8.85
SDR0.5801
23Qpi(cms) 5.30Qpi(cfs) 181Qpi (in/hr) .91∀ (mm) - (in) 18.6
Tbi (in)1.6163
49Tpi (Hr) - estimated from HEC chart
1.366667
Tri (hr)0.2496
82
Tmi (hr)0.9943
39
Tmo (hr)24.994
34Qpo (in/hr) 0.079Qpo (cfs) 15.80∀D (in) 5.22∀D (AF) 86Total ∀ (AF) 174Stage Height/Hydraulic Head (ft)
101.9
Pipe Diameter (ft) 0.643309
Pipe Diameter (in) 7.7
Watering Trough Gulch Feasibility Study (2014)

A8. Chapter 8
Figure 8.1 Reclaimed lands often have forests and reestablished forestis a victory in surface mine reclamation. Above are basics to replanting young trees – deemed more successful than seeding.
Watering Trough Gulch Feasibility Study (2014)

Table 8.1 The mining reclamation process as noted by Dr. Stednick (2014)
Year 1 Year 2 Year 3 Year 4 Year 5 Year 6 Year 7
Top Soil Rem oved
Second Year of Reclam ationReclam ation
BeginsTop Soil ReplacedOverburden Replaced
M ining of the Coal
Overburden Rem oved
Reclam ation BeginsTop Soil Replaced
Overburden ReplacedM ining of the Coal
Overburden Rem ovedTop Soil Rem oved
Top Soil Replaced
Overburden ReplacedM ining of the Coal
Overburden Rem ovedTop Soil Rem oved
Overburden ReplacedM ining of the Coal
Overburden Rem ovedTop Soil Rem oved
Parcel 5
Parcel 6
Parcel 7
Overburden Rem ovedTop Soil Rem oved
Concurrent Reclam tion
Top Soil Rem ovedParcel 1
Parcel 2
Parcel 3
Parcel 4
M ining of the Coal
Overburden Rem ovedTop Soil Rem oved
Watering Trough Gulch Feasibility Study (2014)

A9. Chapter 9
Table 1: Water Quality in watering trough gulch The red indicatesexceeding the state standard for the water use as posted by the CDPHE 2014
DO pH NO2 NO3 Se As CdJan 9.8 8.0Mar 7.8Apr 10.8 8.2 1.0 1.0May 10.4 7.8 0.0 5.0Jun 12.0 7.8 1.0Jul 8.2 8.2Aug 8.2 8.0 1.0 1.0 0.0Sep 8.2 7.9Oct 8.6 7.6 1.0 2.0Nov 9.6 8.0
Zn Cr Cu Pb Ni Mn TSSJan 400.0 0.0 470.0 48Mar 50.0 35Apr 300.0 4.0 0.0 0.0 0.0 150.0 93May 40.0 49Jun 330.0 107Jul 0.0 0.0 140.0 75Aug 200.0 0.0 0.0 0.0 60.0 34Sep 20.0 48Oct 0.0 30.0 0.0 0.0 100.0 51Nov 60.0 48
Watering Trough Gulch Feasibility Study (2014)
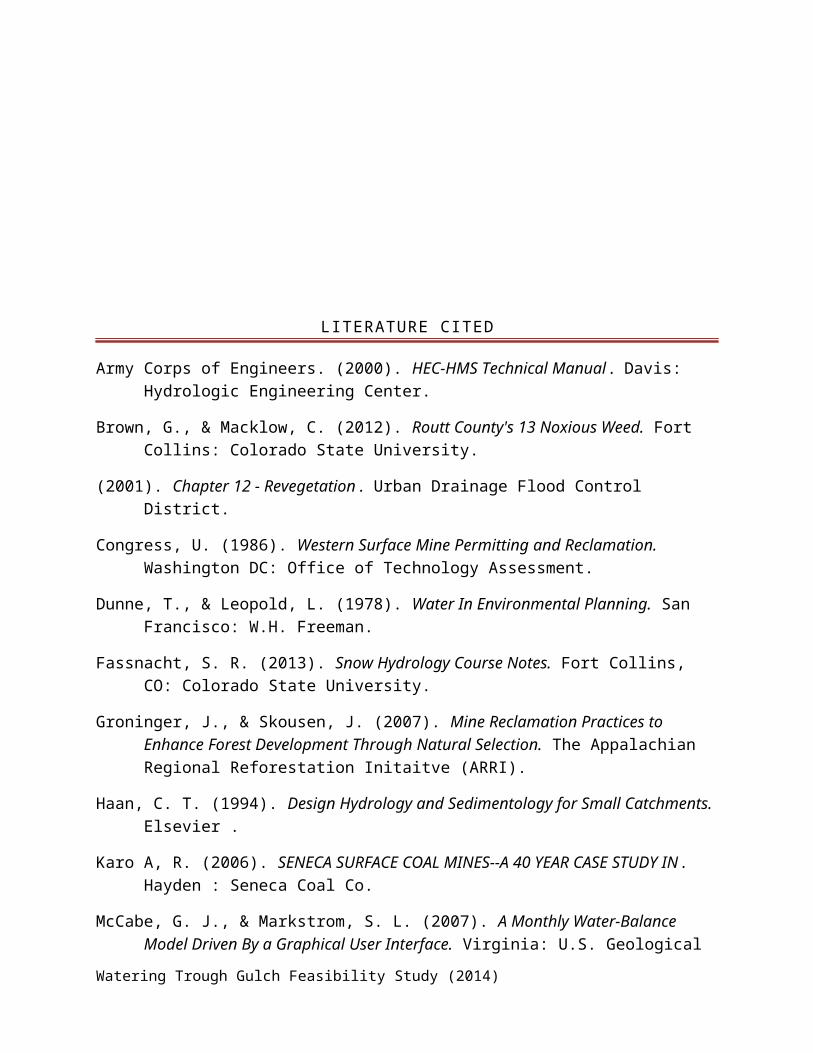
LITERATURE CITED
Army Corps of Engineers. (2000). HEC-HMS Technical Manual . Davis: Hydrologic Engineering Center.
Brown, G., & Macklow, C. (2012). Routt County's 13 Noxious Weed. Fort Collins: Colorado State University.
(2001). Chapter 12 - Revegetation . Urban Drainage Flood Control District.
Congress, U. (1986). Western Surface Mine Permitting and Reclamation. Washington DC: Office of Technology Assessment.
Dunne, T., & Leopold, L. (1978). Water In Environmental Planning. San Francisco: W.H. Freeman.
Fassnacht, S. R. (2013). Snow Hydrology Course Notes. Fort Collins, CO: Colorado State University.
Groninger, J., & Skousen, J. (2007). Mine Reclamation Practices to Enhance Forest Development Through Natural Selection. The Appalachian Regional Reforestation Initaitve (ARRI).
Haan, C. T. (1994). Design Hydrology and Sedimentology for Small Catchments.Elsevier .
Karo A, R. (2006). SENECA SURFACE COAL MINES--A 40 YEAR CASE STUDY IN . Hayden : Seneca Coal Co.
McCabe, G. J., & Markstrom, S. L. (2007). A Monthly Water-Balance Model Driven By a Graphical User Interface. Virginia: U.S. Geological
Watering Trough Gulch Feasibility Study (2014)

Survey.
Parker, S. R., & Norris, J. M. (1989). SIMULATION OF STREAMFLOW IN SMALL DRAINAGE BASINSIN THE SOUTHERN YAMPA RIVER BASIN, COLORADO. Denver, Colorado: U.S. GEOLOGICAL SURVEY.
Paschke, M. (2014). Ecological Restoration Outline. Fort Collins: Colorado State University.
Renard, K. G., Foster, G. R., Weesles, G. A., McCool, D. K., & Yoder, D. C. (1997). Predicting Soil Erosion By Water: A Guide to Conservation Planning with the Revised Universal Soil Loss Equation.
Shumate, S. (2013, Aug 22). Office of Surface Mining. (W. F. Practicum, Interviewer)
SMCRA . (1977, August 3). Retrieved September 3, 2013, from OSMRE:http://www.osmre.gov/topic/SMCRA/SMCRA.pdf
Stednick, J. D. (2014). Personal Communication .
Wanless, B., & Katsuris, D. (2013). Application of UAV Technologyfor Environmental Lifecylce Monitoring.
Williams, R. S., & Hammond , S. E. (1988). SOIL-WATER HYDROLOGY AND GEOCHEMISTRY OF A COAL SPOIL AT A RECLAIMED SURFACE MINE IN ROUTT COUNTY, COLORADO. Denver, Colorado: U.S. GEOLOGICAL SURVEY.
Xu, Y. C., & Singh, P. V. (1998). A Review on Monthly Water Balance Models for Water Resources Investigations. Netherlands: Kluwer Academic Publishers.
Watering Trough Gulch Feasibility Study (2014)