Water Use of Crops and Nutritional Water Productivity for Food ...
326
Water Use of Crops and Nutritional Water Productivity for Food Production, Nutrition and Health in Rural Communities in KwaZulu-Natal Report to the WATER RESEARCH COMMISSION edited by AT Modi and T Mabhaudhi Centre for Transformative Agricultural and Food Systems School of Agricultural, Earth & Environmental Sciences University of KwaZulu-Natal WRC Report No. 2493/1/20 ISBN 978-0-6392-0158-0 June 2020
-
Upload
khangminh22 -
Category
Documents
-
view
4 -
download
0
Transcript of Water Use of Crops and Nutritional Water Productivity for Food ...
Water Use of Crops and Nutritional Water Productivity for Food Production, Nutrition and Health in Rural Communities in KwaZulu-Natal
Report to the WATER RESEARCH COMMISSION
edited by
AT Modi and T Mabhaudhi
Centre for Transformative Agricultural and Food Systems School of Agricultural, Earth & Environmental Sciences
University of KwaZulu-Natal
WRC Report No. 2493/1/20 ISBN 978-0-6392-0158-0
June 2020
ii
Obtainable from Water Research Commission Private Bag X03 Gezina, 0031 [email protected] or download from www.wrc.org.za Supplementary information related to this report has been included in a separate document.
DISCLAIMER This report has been reviewed by the Water Research Commission (WRC) and approved for
publication. Approval does not signify that the contents necessarily reflect the views and policies of the WRC nor does mention of trade names or commercial products constitute
endorsement or recommendation for use. © Water Research Commission
iii
EXECUTIVE SUMMARY
The role of water in achieving food and nutrition security for improved nutrition and human
health cannot be understated. Water is essential for food and nutrition security through its
linkages with all aspects related to economic access to food. Any discussion on food and
nutrition security is incomplete without first establishing the linkages with water. Thus, there
is a need to link the concept of ‘more crop per drop’ with aspects of nutritional value. This
could provide a holistic approach to linking water, agriculture and nutrition with improving
human health. This report builds on previous research aimed at highlighting and strengthening
the linkages between water, agriculture, nutrition and human health, with a particular focus on
poor rural households. This is done by placing emphasis on the use of nutritional water
productivity as a suitable index for assessing the contribution of water use and agriculture to
food and nutrition security. The focus on underutilised crops, as an alternative to major,
mainstream crops, is meant to address the need for dietary diversity in poor rural communities.
At inception, a global review of the literature was undertaken to establish the linkages
between agriculture (a proxy for food), water, nutrition and human health, with focus on poor
rural households. The review took a global approach as it sought to establish the global
relevance of the study and establish opportunities for the project outcomes to also inform a
wider audience. The review noted that, while there had been some progress in addressing food
security driven by increased crop productivity, these gains were not linked to nutrition security.
There was a disjoint between improving crop productivity, the choice of crops and addressing
gaps in nutrition. As a result, most of the poor rural households still suffered high levels of
nutrition insecurity and malnutrition. This was associated with, in part, a chronic lack of dietary
diversity and access to nutrient dense foods. Such increasing malnutrition, if left unchecked,
could reinforce a vicious cycle of poverty among poor rural communities. Importantly, the
review confirmed the project hypothesis that there was a need for a paradigm shift in how
agriculture interventions were designed and implemented, such that the interventions were
more closely linked to water, nutrition and human health outcomes. However, achieving this
calls for more transdisciplinary type approaches which focus on the broader food system rather
than just specific food value chains, which tend to be linear.
Following from the global review, we undertook a qualitative systematic approach to
conduct an environmental scan and review of the literature of studies conducted in South Africa,
specifically within the study population of KwaZulu-Natal. This complemented the initial
review, but with greater focus on the study population. The systematic analysis confirmed that
the major constraints to achieving food and nutrition security as well as human health and well-

iv
being within poor rural households of KwaZulu-Natal was a very limited availability and access
to nutritious, diverse and balanced diets. Consequently, both under- and over-nutrition, in
particular, stunting, continued to affect children under 5 years of age. In addition, there was a
high prevalence of over-nutrition, both overweight and obesity, among black African females.
Low incomes limit poor rural households’ access to a healthy diet. However, given that most
of these households have access to farming land, agriculture could be used to improve both
availability and access to diverse and nutritious foods, leading to improved human health and
well-being of the poor rural households. Such interventions should pay attention to the fact that
water remains scarce in these rural areas. As such, the adoption and wider use of traditional
vegetable crops and pulses could improve availability and access to healthy and locally
available alternative food sources. The promotion of household and community food gardens,
and the use of nutrient dense crops with low levels of water use, i.e. high nutritional water
productivity, were then identified as options for addressing food and nutrition insecurity in poor
rural areas.
From the review of the relevant literature, it emerged that detailed studies of dietary intake
of defined population groups living in specific areas of KZN had not been conducted. To
address this shortcoming, a follow-up study aimed at assessing the nutritional status of four
selected rural communities in KZN, using selected anthropometric indices and dietary
assessment methods was conducted. The results of the study confirmed that under- and over-
nutrition co-existed in the studied black African rural communities of KZN. Stunting was
prevalent among children under 5 years, whilst obesity also affected children under 5 years and
adults, especially females aged 16-35 years. There was frequent consumption of food items
high in carbohydrates (mainly the cereal grain foods), and low in micronutrients and fibre. The
findings indicated that a nutrition transition had influenced the nutritional status of the rural
KZN population groups investigated. Similar to the findings of the literature review described
above, the trends of gaps and weak designs of past agriculture interventions observed during
the investigation were observed. Based on the literature reviews, the project team undertook to
focus on grain legumes as alternative crops. The choice of these crops was informed by review
of previous studies documented in the literature as well as awareness of ongoing research,
which focussed on cereal and leafy vegetable crops. Thus, in order to not duplicate what was
being done elsewhere, the project focussed on legumes and selected provitamin A (PVA)-
biofortified crops, such as orange-fleshed sweet potato and PVA-biofortified maize.
With regard to the measurement of water use and water productivity (WP) of the selected
crops, it was hypothesised that nutrient content and nutritional water productivity (NWP) of
crops would vary with varying water availability and across environments. The use of multiple
v
environments was meant to assess the suitability of various bioclimatic regions of KZN for
growing the different study crops. The aim of the study was, therefore, to determine water use,
WP and NWP of selected alternative indigenous grain legumes [bambara groundnut (Vigna
subterranea) and cowpea (Vigna unguiculata)] and conventional grain legumes [groundnut
(Arachis hypogaea) and dry bean (Phaseolus vulgaris)], in response to production environment.
The specific objectives were to determine water use, WP and NWP of selected African
indigenous (bambara groundnut and cowpea) and major grain legumes (groundnut and dry
bean) in response to (i) water regimes and (ii) environments. Results highlighted the role of
legumes in increasing dietary diversity as they can complement cereals and vegetables in diets
to meet the nutrient requirements for a healthy life. Water regimes did not have a significant
effect on NWP, implying that there is scope for legumes to contribute to food and nutrition
security under rainfed conditions.
Following from the field studies, a major part of the project was to model the water use and
WP of the selected crops. The AquaCrop model, which has been widely used for such studies,
as well as for alternative crops, was selected for this study. The modelling stage of the study
focused on the groundnut and dry beans as bambara groundnut has been previously modelled
in another project, while cowpea was the subject of a separate ongoing study. Therefore, the
aim of the study was to calibrate and test the performance of the AquaCrop model for groundnut
and dry bean under varying water regimes and sub-environments within the larger semi- and
arid environments, respectively. The specific objectives were to (i) calibrate AquaCrop for
groundnut and dry bean, (ii) evaluate its ability to simulate canopy cover (CC), biomass, yield
and evapotranspiration (ET) of groundnut and dry bean for varying soils and climates. Overall,
the model showed potential for simulating yield and ET of groundnut and dry bean under semi-
arid conditions.
A major value advantage of developing models is their importance in addressing
hypothetical “what if, when, where and how” type of questions. This can save both time and
costs associated with conducting lengthy multilocational field studies. The AquaCrop model
was therefore applied to evaluate the effect of management practices on yield (Y) and water
productivity (WPET) for groundnut and bambara groundnut. This would aid in developing best
management practices for increased Y and WP of groundnut and bambara groundnut under
different environments. Management scenarios focused on practices such as (i) planting dates,
(ii) irrigation, and (iii) soil water conservation as being key for improving productivity of
smallholder farmers. Based on this, a total of 6 scenarios were evaluated using AquaCrop to
develop best management practices. Notably, this exercise confirmed that crop diversification
vi
remains a viable option as the study showed that bambara groundnut had a lower risk of crop
failure, compared to groundnut, under the various scenarios considered.
The second phase of the project focused mainly on linking the crops to the plate, i.e.
addressing food intake. Previous studies and the review of the literature confirmed that
vitamin A deficiency (VAD) remained problematic in KZN, and South Africa as a whole. The
orange-fleshed sweet potato (OFSP) and PVA-biofortified maize were, therefore, identified as
suitable crop-based alternatives for addressing VAD. Pursuant to that, a study was then
conducted to determine the effect of replacing non-biofortified white maize and cream-fleshed
sweet potato (CFSP) with PVA-biofortified maize and OFSP on the nutritional composition of
popular traditional foods consumed locally in KZN. The food products studied were phutu1
prepared with white maize meal and PVA-biofortified maize meal, served with curried2
chicken, cabbage or bambara groundnut and boiled sweet potato3 (CFSP and OFSP). The phutu
combinations were selected based on a survey conducted in four selected rural study sites in
KZN to determine popular dishes in which maize was combined with other food items. The
results of the study showed that PVA-biofortified phutu, when combined with other foods, such
as curried cabbage, chicken or bambara groundnut as well as OFSP, have the potential to
improve nutrient intake and dietary diversity of rural population groups in KZN and other rural
areas of South Africa. This confirmed the recommendations from the initial reviews conducted.
Subsequent to that, and having established the positive benefits of PVA-biofortified maize
and OFSP, a separate study then investigated the effect of replacing white maize and CFSP with
PVA-biofortified maize and OFSP, respectively, on consumer acceptability and perceptions of
traditional dishes among selected rural communities in KZN. The results of the study were
encouraging as the foods investigated were acceptable to and positively perceived by the
majority of the study participants.
Malnutrition, in all its forms, in the communities used in this study, was mainly associated
with a lack of dietary diversity and limited access to and non-availability of nutrient dense
foods. Under these circumstances, agriculture offers an opportunity to address the availability
and accessibility of diverse nutrient-dense foods in poor rural communities. Alternative crops
have the potential to provide nutrient dense options; however, they still lack improvement and
often produce yields that are lower than those of conventional crops, making them unattractive.
This study was a first to benchmark NP and NWP of conventional grain legumes to alternative
1 Maize meal cooked into a crumbly porridge. 2 A curry was selected as the preparation method as it was reported by study participants as the most common way in which the food items were prepared. 3 Prepared using the boiling method.

vii
grain legumes under similar conditions. Crop improvement should target improving the yield
and sensory attributes of these crops.
Despite several interventions targeted at alleviating household food and nutritional
insecurity, poor rural households still suffer unacceptable levels of malnutrition. This is mostly
associated with a lack of dietary diversity and limited access to and non-availability of nutrient-
dense foods. Also, the lack of clear linkages between food, nutrition and health outcomes limits
the impact of interventions. Therefore, future research should focus on: (i) adopting a food
systems approach, which links agriculture, the environment and health, (ii) investigating the
potential of promoting underutilised crops as nutrient dense alternatives, (iii) the role of
indigenous fruit trees in agroecology and income generation initiatives should be considered,
(iv) developing metrics such as the NWP that help the assessment of the water-food-nutrition-
health nexus, and (v) building education and awareness among consumers on healthy dietary
habits. Finally, transdisciplinary approaches that straddle the science-policy interface should be
promoted in such research in order to inform policy and decision makers.
viii
ACKNOWLEDGEMENTS
The Project Team would like to extend their heartfelt gratitude to the following individuals,
institutions and communities who assisted in the conduct of this project:
• The Water Research Commission for initiating, managing and funding this project.
• The University of KwaZulu-Natal for hosting and supporting the project.
• The farmers in Tugela Ferry, Umbumbulu and Swayimane for making land available
for the study.
• The management at Fountainhill Estate, in particular Mr Ed Gevers, for graciously
allowing us to conduct some of our studies at their farm and with their staff.
• Dr Gerhard Backeberg and Prof Sylvester Mpandeli of the WRC for their leadership
and guidance during the conduct of this project.
• The Reference Group Members:
Prof NS Mpandeli Dr GR Backeberg Dr SN Hlophe-Ginindza Dr L Nhamo Prof AT Modi Prof M Faber Prof N Monde Prof A Oelofse Mr TC Ramashala Prof W van Averbeke Prof FAM Wenhold
Water Research Commission – Chairperson Water Research Commission – Retired Water Research Commission Water Research Commission University of KwaZulu-Natal – Project Leader Medical Research Council University of Fort Hare University of the Western Cape Department of Agriculture, Land Reform and Rural Development Tshwane University of Technology University of Pretoria
• The Project Team:
o Dr Tafadzwa Mabhaudhi UKZN (Principal Researcher)
o Prof Muthulisi Siwela UKZN (Researcher)
o Dr Kirthee Pillay UKZN (Researcher)
• The students at MSc and PhD levels registered at the University of KwaZulu-Natal who
worked on various aspects of the project (cf. Appendix 1).
• The administration, technical and field support staff at the University of KwaZulu-Natal
who supported the project.
ix
TABLE OF CONTENTS
EXECUTIVE SUMMARY ....................................................................................................... iii
ACKNOWLEDGEMENTS .................................................................................................... viii
TABLE OF CONTENTS .......................................................................................................... ix
LIST OF FIGURES ................................................................................................................. xiv
LIST OF TABLES ................................................................................................................. xvii
LIST OF ACRONYMS AND ABBREVIATIONS ................................................................. xx
LIST OF SYMBOLS .............................................................................................................. xxii
REPOSITORY OF DATA .................................................................................................... xxiii
CHAPTER 1: WATER USE OF CROPS AND NUTRITIONAL WATER PRODUCTIVITY FOR FOOD PRODUCTION, NUTRITION AND HEALTH IN RURAL COMMUNITIES IN KWAZULU-NATAL: AN OVERVIEW ................................................................................... 1
1.1 Background and Conceptualisation .................................................................................. 1
1.2 Objectives ......................................................................................................................... 3
1.2.1 General objective........................................................................................................ 3
1.2.2 Specific objectives...................................................................................................... 3
1.3 Scope of the Report ........................................................................................................... 3
References ............................................................................................................................... 7
CHAPTER 2: WATER-FOOD-NUTRITION-HEALTH NEXUS: LINKING WATER TO IMPROVING FOOD, NUTRITION AND HEALTH IN SUB-SAHARAN AFRICA ............. 9
2.1 Introduction ....................................................................................................................... 9
2.2 Water ............................................................................................................................... 11
2.3 Agriculture ...................................................................................................................... 12
2.3.1 Crop Water Use ........................................................................................................ 12
2.3.2 Improving Crop Water Productivity ........................................................................ 13
2.3.3 Relating Water Use to Dry Matter Production in Crops .......................................... 14
2.3.4 Water Use Efficiency and Water Productivity ......................................................... 15
2.3.5 Linking Water Productivity to Nutrition – Nutritional Water Productivity ............. 17
2.4 Water-Food-Nutrition-Health Nexus .............................................................................. 21
2.5 Food for Nutrition ........................................................................................................... 24
2.5.1 Food Intake, Sources of Food in Poor Rural Households ........................................ 25
2.5.2 Reasons for Food Choices in Poor Rural Households ............................................. 26
2.5.3 Alternative crops: Potential to Contribute to Food and Nutrition Security.............. 27
2.5.4 Competing Needs in Poor Rural Household ............................................................ 29
2.6 Human Health and Well-Being ....................................................................................... 29
x
2.7 Conclusions ..................................................................................................................... 31
References ............................................................................................................................. 31
CHAPTER 3: FOOD AND NUTRITION INSECURITY IN SELECTED RURAL COMMUNITIES OF KWAZULU-NATAL, SOUTH AFRICA – LINKING HUMAN NUTRITION AND AGRICULTURE...................................................................................... 42
3.1 Introduction ..................................................................................................................... 42
3.2 Nutritional status of South African children and adults with a focus on KwaZulu-Natal .............................................................................................................................................. 44
3.2.1 Undernutrition .......................................................................................................... 44
3.2.2 Over-nutrition ........................................................................................................... 51
3.3 Interventions to combat nutritional problems in KwaZulu-Natal ................................... 58
3.3.1 Food fortification...................................................................................................... 59
3.3.2 Vitamin A supplementation ..................................................................................... 59
3.3.3 Prevention and management of malnutrition in KwaZulu-Natal ............................. 60
3.3.4 Dietary diversity ....................................................................................................... 61
3.4 Biofortification ................................................................................................................ 62
3.5 Linking agriculture to address malnutrition .................................................................... 62
3.6 Traditional, indigenous and innovative crops with a potential to alleviate malnutrition in rural areas of South Africa, with a focus on KwaZulu-Natal ............................................... 63
3.6.1 Alternative crops ...................................................................................................... 63
3.7 The way forward ............................................................................................................. 66
3.8 Conclusions ..................................................................................................................... 66
References ............................................................................................................................. 68
CHAPTER 4: ASSESSMENT OF THE NUTRITIONAL STATUS OF FOUR SELECTED RURAL COMMUNITIES IN KWAZULU-NATAL .............................................................. 79
4.1 Introduction ..................................................................................................................... 79
4.2 Methodology ................................................................................................................... 83
4.2.1 Anthropometry ......................................................................................................... 84
4.2.2 Dietary intake ........................................................................................................... 89
4.2.3 Pilot study ................................................................................................................. 90
4.2.4 Data analysis ............................................................................................................ 91
4.2.5 Ethical considerations .............................................................................................. 92
4.3 Results ............................................................................................................................. 93
4.3.1 Demographic characteristics .................................................................................... 93
4.3.2 Anthropometry ......................................................................................................... 94
4.3.3 Dietary assessment ................................................................................................. 100
4.4 Discussion ..................................................................................................................... 104
xi
4.5 Conclusions ................................................................................................................... 111
References ........................................................................................................................... 112
CHAPTER 5: WATER USE, NUTRIENT CONTENT AND NUTRITIONAL WATER PRODUCTIVITY OF SELECTED GRAIN LEGUMES ...................................................... 121
5.1 Introduction ................................................................................................................... 121
5.2 Material and Methods ................................................................................................... 123
5.2.1 Plant material.......................................................................................................... 123
5.2.2 Site description ....................................................................................................... 123
5.2.3 Experimental design and trial management ........................................................... 124
5.2.4 Measurements......................................................................................................... 125
5.2.5 Data analysis .......................................................................................................... 128
5.3 Results ........................................................................................................................... 128
5.3.1 Rainfall ................................................................................................................... 128
5.3.2 Nutritional content in response to water regimes ................................................... 130
5.3.3 Nutritional content in response to environments.................................................... 132
5.3.4 Nutritional water productivity in response to water regimes ................................. 134
5.3.5 Nutritional water productivity in response to environments .................................. 137
5.4 Discussion ..................................................................................................................... 140
5.5 Conclusions ................................................................................................................... 143
References ........................................................................................................................... 143
CHAPTER 6: CALIBRATION AND TESTING OF AQUACROP FOR GROUNDNUT AND DRY BEAN .................................................................................................................. 147
6.1 Introduction ................................................................................................................... 147
6.2 Material and Methods ................................................................................................... 149
6.2.1 AquaCrop Model .................................................................................................... 149
6.2.2 Study areas ............................................................................................................. 150
6.2.3 Experimental design ............................................................................................... 150
6.2.4 Model Inputs .......................................................................................................... 152
6.2.5 Simulation procedure ............................................................................................. 157
6.2.6 Model evaluation statistics ..................................................................................... 158
6.3 Results and Discussion ................................................................................................. 159
6.3.1 Groundnut............................................................................................................... 159
6.3.2 Dry Bean ................................................................................................................ 169
6.4 Conclusions ................................................................................................................... 178
References ........................................................................................................................... 178
xii
CHAPTER 7: MODELLING BEST MANAGEMENT PRACTICES OF GROUNDNUT AND BAMBARA GROUNDNUT IN DIFFERENT BIO-CLIMATIC REGIONS OF KWAZULU-NATAL ............................................................................................................. 183
7.1 Introduction ................................................................................................................... 183
7.2 Materials and Methods .................................................................................................. 184
7.2.1 AquaCrop model .................................................................................................... 184
7.2.2 Study Sites .............................................................................................................. 185
7.2.3 Climate data............................................................................................................ 186
7.2.4 Scenarios ................................................................................................................ 187
7.2.5 Simulation procedure ............................................................................................. 189
7.2.6 Data Analyses ......................................................................................................... 190
7.3 Results and Discussion ................................................................................................. 190
7.3.1 Groundnut............................................................................................................... 190
7.4 Conclusions ................................................................................................................... 202
References ........................................................................................................................... 202
CHAPTER 8: REPLACING NON-BIOFORTIFIED WHITE MAIZE AND SWEET POTATO WITH PROVITAMIN A-BIOFORTIFIED MAIZE AND ORANGE-FLESHED SWEET POTATO IN POPULAR TRADITIONAL FOODS OF KWAZULU-NATAL ..... 206
8.1 Introduction ................................................................................................................... 206
8.2 Methodology ................................................................................................................. 208
8.2.1 Plant materials ........................................................................................................ 208
8.2.2 Preparation of food products .................................................................................. 208
8.2.3 Nutritional composition of maize composite dishes and sweet potato .................. 209
8.2.4 Determining usual portion sizes for children aged 1-5 years ................................. 212
8.2.5 Data quality control ................................................................................................ 214
8.2.6 Reduction of experimental errors ........................................................................... 214
8.2.7 Statistical analysis .................................................................................................. 214
8.3 Results ........................................................................................................................... 215
8.3.1 Proximate composition of uncooked and cooked food samples ............................ 215
8.3.2 Amino acid content of uncooked and cooked food samples .................................. 218
8.3.3 Mineral composition of uncooked and cooked food samples ................................ 222
8.3.4 Provitamin A (PVA) carotenoid composition of uncooked and cooked food samples ......................................................................................................................................... 225
8.3.5 Determining the percentage of EAR met for vitamin A from cooked phutu composite dishes and sweet potato ................................................................................. 229
8.4 Discussion ..................................................................................................................... 229
8.5 Conclusions ................................................................................................................... 234
References ........................................................................................................................... 235
xiii
CHAPTER 9: ACCEPTANCE OF TRADITIONAL DISHES MADE WITH PROVITAMIN A-BIOFORTIFIED MAIZE AND ORANGE-FLESHED SWEET POTATO IN KWAZULU-NATAL ................................................................................................................................... 241
9.1 Introduction ................................................................................................................... 241
9.2 Methodology ................................................................................................................. 244
9.2.1 Study population and sample selection .................................................................. 244
9.2.2 Survey on the consumption of white maize ........................................................... 245
9.2.3 Plant materials ........................................................................................................ 248
9.2.4 Sensory evaluation ................................................................................................. 248
9.2.5 Focus group discussions ......................................................................................... 254
9.2.6 Pilot study ............................................................................................................... 255
9.3 Results ........................................................................................................................... 259
9.3.1 Survey..................................................................................................................... 259
9.3.2 Consumer acceptance and perceptions of PVA-biofortified maize and OFSP ...... 262
9.3.3 Sensory Evaluation.................................................................................................263 9.3.4 Focus Group Discussions.......................................................................................271
9.4 Discussion.....................................................................................................................274 9.5 Conclusions ................................................................................................................... 279
References ........................................................................................................................... 280
CHAPTER 10: GENERAL CONCLUSIONS AND RECOMMENDATIONS .................... 290
10.1 General Discussion ..................................................................................................... 290
10.2 Conclusions ................................................................................................................. 294
10.3 Recommendations ....................................................................................................... 295
10.4 Proposed Future Research........................................................................................... 296
APPENDIX I: CAPACITY DEVELOPMENT REPORT ..................................................... 297
APPENDIX II: REPORT ON RESEARCH DISSEMINATION .......................................... 298
xiv
LIST OF FIGURES Figure 1.1: Maps of the study Area in relation to were it is located within the Province, District
Municipality and Local Municipality ................................................................................... 5 Figure 4.1: The UNICEF conceptual framework illustrating the causes of malnutrition
(UNICEF, 1998). ................................................................................................................ 81 Figure 4.2: Weight-for-age classification for children under five years (n=39) ...................... 95 Figure 4.3: Height-for-age classification for children under five years (n=39) ....................... 95 Figure 4.4: Weight-for-height classification in children under five years (n=39) ................... 96 Figure 4.5: Classification of degree of malnutrition using mid-upper arm circumference in
children under five years (n=39) ........................................................................................ 96 Figure 4.6: Distribution of body mass index for adults from four rural areas of KwaZulu-Natal
(n=322) ............................................................................................................................... 97 Figure 4.7: Waist circumference classification by gender (n=318) ......................................... 98 Figure 4.8: Distribution of body mass index for females aged 16-35 years (n=94) ................. 99 Figure 4.9: Waist circumference classification for females aged 16-35 years (n=93) ........... 100 Figure 5.1: Seed of selected varieties of indigenous grain legumes (A = cowpea – mixed brown;
B = bambara groundnut – landrace) and major grain legumes (C = dry bean – Ukulinga; D = groundnuts – Kwarts). ................................................................................................... 124
Figure 5.2: Rainfall (mm) observed at three sites (Ukulinga Research Farm, Umbumbulu Rural District and Fountainhill Estate) during 2015/16 and 2016/17 season. ............................ 129
Figure 6.1: Simulated and observed CC for groundnut under A) optimum irrigation B) deficit irrigation C) rainfed conditions during the calibration season 2015/16.......................... 163
Figure 6.2: Simulated and observed cumulative biomass for groundnut under A) optimum irrigation B) deficit irrigation C) rainfed conditions during the calibration season 2015/16. .......................................................................................................................................... 164
Figure 6.3: Simulated and observed CC for groundnut under A) optimum irrigation B) deficit irrigation C) rainfed conditions during model testing at Ukulinga (2016/17 season). ..... 165
Figure 6.4: Simulated and observed cumulative biomass for groundnut under A) optimum irrigation B) deficit irrigation C) rainfed conditions during model testing at Ukulinga (2016/17 season). .............................................................................................................. 166
Figure 6.5: Simulated and observed CC (A) and cumulative biomass (B) for groundnut at Fountainhill during model testing (2016/17 season). ....................................................... 167
Figure 6.6: Simulated and observed CC (A) and cumulative biomass (B) for groundnut at Umbumbulu during model testing (2016/17 season). ...................................................... 167
Figure 6.7: Simulated and observed CC for dry bean under A) optimum irrigation B) deficit irrigation C) rainfed conditions during the calibration season 2015/16. .......................... 172
Figure 6.8: Simulated and observed cumulative biomass for dry bean under A) optimum irrigation B) deficit irrigation C) rainfed conditions during the calibration season 2015/16. .......................................................................................................................................... 173
Figure 6.9: Simulated and observed CC for dry bean under A) optimum irrigation B) deficit irrigation C) rainfed conditions during model testing at Ukulinga (2016/17 season). ..... 174
Figure 6.10: Simulated and observed cumulative biomass for dry bean under A) optimum irrigation B) deficit irrigation C) rainfed conditions during model testing at Ukulinga (2016/17 season). .............................................................................................................. 175
xv
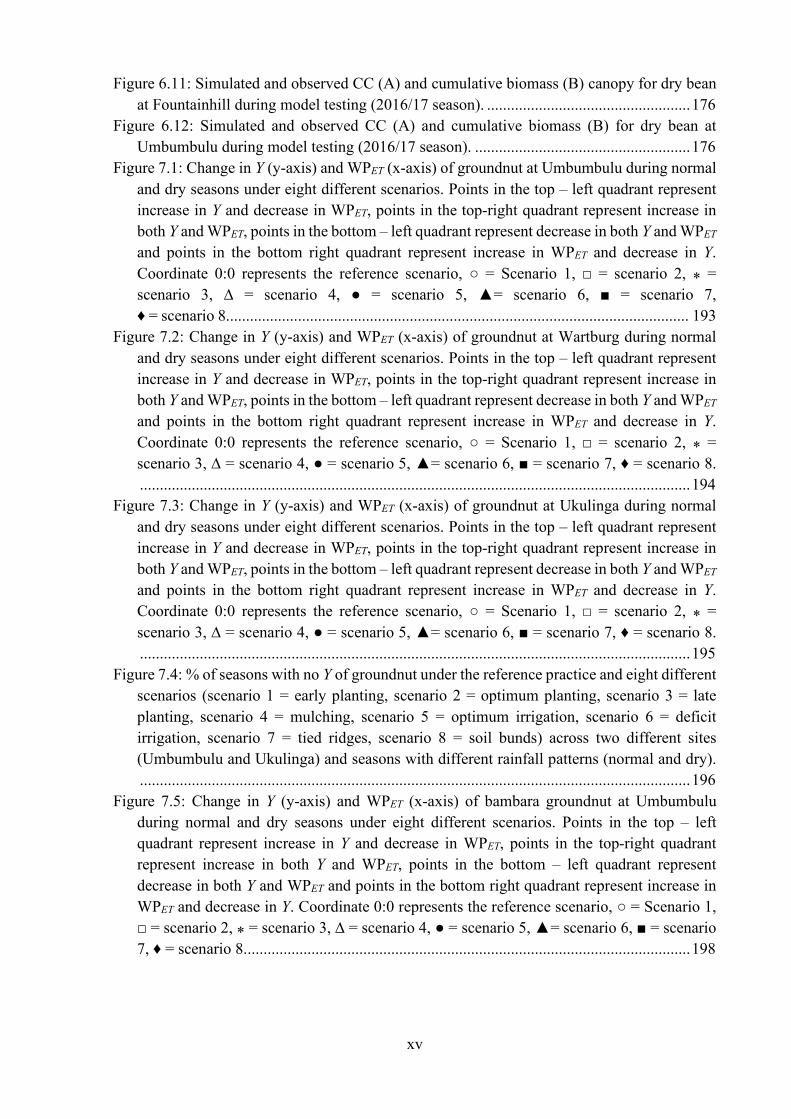
Figure 6.11: Simulated and observed CC (A) and cumulative biomass (B) canopy for dry bean at Fountainhill during model testing (2016/17 season). ................................................... 176
Figure 6.12: Simulated and observed CC (A) and cumulative biomass (B) for dry bean at Umbumbulu during model testing (2016/17 season). ...................................................... 176
Figure 7.1: Change in Y (y-axis) and WPET (x-axis) of groundnut at Umbumbulu during normal and dry seasons under eight different scenarios. Points in the top – left quadrant represent increase in Y and decrease in WPET, points in the top-right quadrant represent increase in both Y and WPET, points in the bottom – left quadrant represent decrease in both Y and WPET and points in the bottom right quadrant represent increase in WPET and decrease in Y. Coordinate 0:0 represents the reference scenario, ○ = Scenario 1, □ = scenario 2, ⁎ = scenario 3, ∆ = scenario 4, ● = scenario 5, ▲= scenario 6, ■ = scenario 7, ♦ = scenario 8.................................................................................................................... 193
Figure 7.2: Change in Y (y-axis) and WPET (x-axis) of groundnut at Wartburg during normal and dry seasons under eight different scenarios. Points in the top – left quadrant represent increase in Y and decrease in WPET, points in the top-right quadrant represent increase in both Y and WPET, points in the bottom – left quadrant represent decrease in both Y and WPET and points in the bottom right quadrant represent increase in WPET and decrease in Y. Coordinate 0:0 represents the reference scenario, ○ = Scenario 1, □ = scenario 2, ⁎ = scenario 3, ∆ = scenario 4, ● = scenario 5, ▲= scenario 6, ■ = scenario 7, ♦ = scenario 8. .......................................................................................................................................... 194
Figure 7.3: Change in Y (y-axis) and WPET (x-axis) of groundnut at Ukulinga during normal and dry seasons under eight different scenarios. Points in the top – left quadrant represent increase in Y and decrease in WPET, points in the top-right quadrant represent increase in both Y and WPET, points in the bottom – left quadrant represent decrease in both Y and WPET and points in the bottom right quadrant represent increase in WPET and decrease in Y. Coordinate 0:0 represents the reference scenario, ○ = Scenario 1, □ = scenario 2, ⁎ = scenario 3, ∆ = scenario 4, ● = scenario 5, ▲= scenario 6, ■ = scenario 7, ♦ = scenario 8. .......................................................................................................................................... 195
Figure 7.4: % of seasons with no Y of groundnut under the reference practice and eight different scenarios (scenario 1 = early planting, scenario 2 = optimum planting, scenario 3 = late planting, scenario 4 = mulching, scenario 5 = optimum irrigation, scenario 6 = deficit irrigation, scenario 7 = tied ridges, scenario 8 = soil bunds) across two different sites (Umbumbulu and Ukulinga) and seasons with different rainfall patterns (normal and dry). .......................................................................................................................................... 196
Figure 7.5: Change in Y (y-axis) and WPET (x-axis) of bambara groundnut at Umbumbulu during normal and dry seasons under eight different scenarios. Points in the top – left quadrant represent increase in Y and decrease in WPET, points in the top-right quadrant represent increase in both Y and WPET, points in the bottom – left quadrant represent decrease in both Y and WPET and points in the bottom right quadrant represent increase in WPET and decrease in Y. Coordinate 0:0 represents the reference scenario, ○ = Scenario 1, □ = scenario 2, ⁎ = scenario 3, ∆ = scenario 4, ● = scenario 5, ▲= scenario 6, ■ = scenario 7, ♦ = scenario 8................................................................................................................ 198
xvi
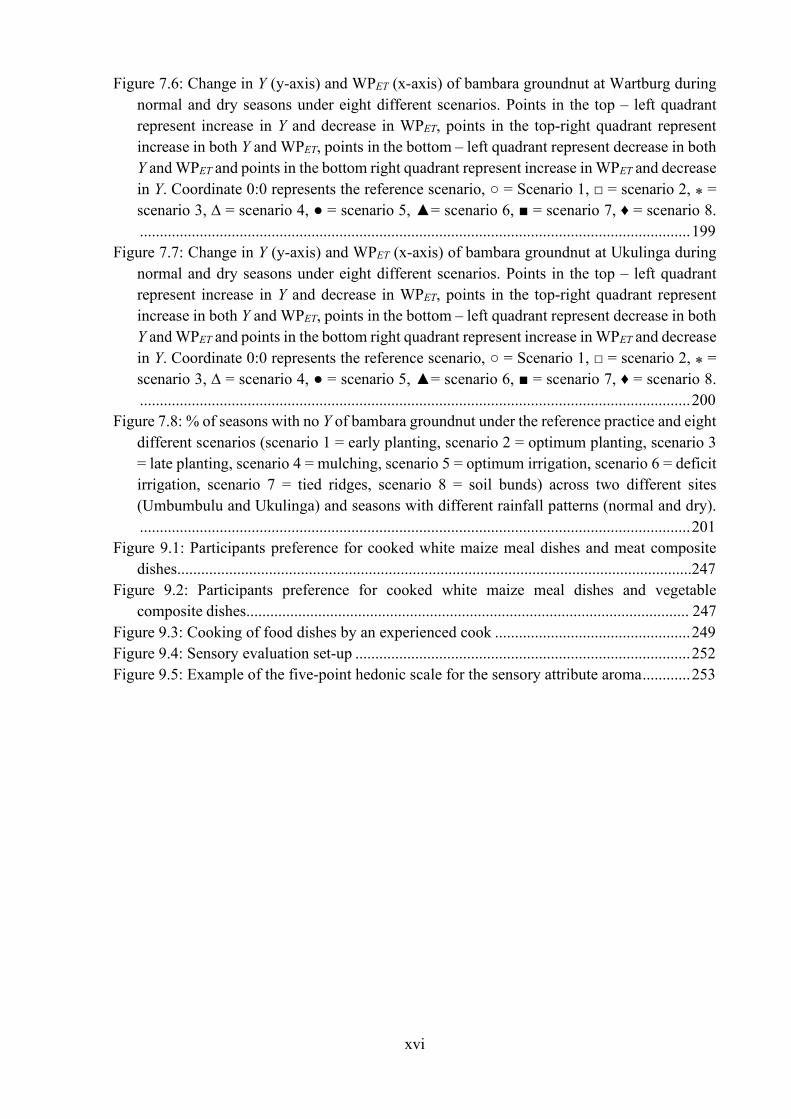
Figure 7.6: Change in Y (y-axis) and WPET (x-axis) of bambara groundnut at Wartburg during normal and dry seasons under eight different scenarios. Points in the top – left quadrant represent increase in Y and decrease in WPET, points in the top-right quadrant represent increase in both Y and WPET, points in the bottom – left quadrant represent decrease in both Y and WPET and points in the bottom right quadrant represent increase in WPET and decrease in Y. Coordinate 0:0 represents the reference scenario, ○ = Scenario 1, □ = scenario 2, ⁎ = scenario 3, ∆ = scenario 4, ● = scenario 5, ▲= scenario 6, ■ = scenario 7, ♦ = scenario 8. .......................................................................................................................................... 199
Figure 7.7: Change in Y (y-axis) and WPET (x-axis) of bambara groundnut at Ukulinga during normal and dry seasons under eight different scenarios. Points in the top – left quadrant represent increase in Y and decrease in WPET, points in the top-right quadrant represent increase in both Y and WPET, points in the bottom – left quadrant represent decrease in both Y and WPET and points in the bottom right quadrant represent increase in WPET and decrease in Y. Coordinate 0:0 represents the reference scenario, ○ = Scenario 1, □ = scenario 2, ⁎ = scenario 3, ∆ = scenario 4, ● = scenario 5, ▲= scenario 6, ■ = scenario 7, ♦ = scenario 8. .......................................................................................................................................... 200
Figure 7.8: % of seasons with no Y of bambara groundnut under the reference practice and eight different scenarios (scenario 1 = early planting, scenario 2 = optimum planting, scenario 3 = late planting, scenario 4 = mulching, scenario 5 = optimum irrigation, scenario 6 = deficit irrigation, scenario 7 = tied ridges, scenario 8 = soil bunds) across two different sites (Umbumbulu and Ukulinga) and seasons with different rainfall patterns (normal and dry). .......................................................................................................................................... 201
Figure 9.1: Participants preference for cooked white maize meal dishes and meat composite dishes.................................................................................................................................247
Figure 9.2: Participants preference for cooked white maize meal dishes and vegetable composite dishes............................................................................................................... 247
Figure 9.3: Cooking of food dishes by an experienced cook ................................................. 249 Figure 9.4: Sensory evaluation set-up .................................................................................... 252 Figure 9.5: Example of the five-point hedonic scale for the sensory attribute aroma ............ 253
xvii
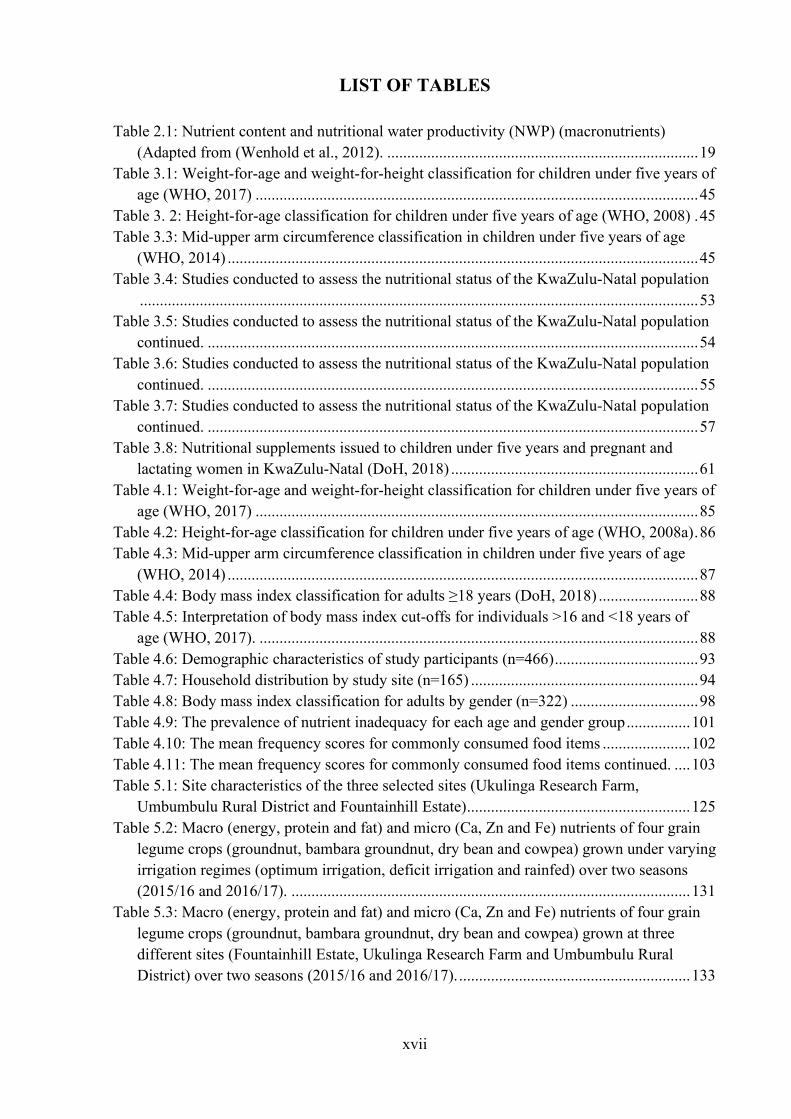
LIST OF TABLES Table 2.1: Nutrient content and nutritional water productivity (NWP) (macronutrients)
(Adapted from (Wenhold et al., 2012). .............................................................................. 19 Table 3.1: Weight-for-age and weight-for-height classification for children under five years of
age (WHO, 2017) ............................................................................................................... 45 Table 3. 2: Height-for-age classification for children under five years of age (WHO, 2008) . 45 Table 3.3: Mid-upper arm circumference classification in children under five years of age
(WHO, 2014) ...................................................................................................................... 45 Table 3.4: Studies conducted to assess the nutritional status of the KwaZulu-Natal population
............................................................................................................................................ 53 Table 3.5: Studies conducted to assess the nutritional status of the KwaZulu-Natal population
continued. ........................................................................................................................... 54 Table 3.6: Studies conducted to assess the nutritional status of the KwaZulu-Natal population
continued. ........................................................................................................................... 55 Table 3.7: Studies conducted to assess the nutritional status of the KwaZulu-Natal population
continued. ........................................................................................................................... 57 Table 3.8: Nutritional supplements issued to children under five years and pregnant and
lactating women in KwaZulu-Natal (DoH, 2018) .............................................................. 61 Table 4.1: Weight-for-age and weight-for-height classification for children under five years of
age (WHO, 2017) ............................................................................................................... 85 Table 4.2: Height-for-age classification for children under five years of age (WHO, 2008a) . 86 Table 4.3: Mid-upper arm circumference classification in children under five years of age
(WHO, 2014) ...................................................................................................................... 87 Table 4.4: Body mass index classification for adults ≥18 years (DoH, 2018) ......................... 88 Table 4.5: Interpretation of body mass index cut-offs for individuals >16 and <18 years of
age (WHO, 2017). .............................................................................................................. 88 Table 4.6: Demographic characteristics of study participants (n=466) .................................... 93 Table 4.7: Household distribution by study site (n=165) ......................................................... 94 Table 4.8: Body mass index classification for adults by gender (n=322) ................................ 98 Table 4.9: The prevalence of nutrient inadequacy for each age and gender group ................ 101 Table 4.10: The mean frequency scores for commonly consumed food items ...................... 102 Table 4.11: The mean frequency scores for commonly consumed food items continued. .... 103 Table 5.1: Site characteristics of the three selected sites (Ukulinga Research Farm,
Umbumbulu Rural District and Fountainhill Estate) ........................................................ 125 Table 5.2: Macro (energy, protein and fat) and micro (Ca, Zn and Fe) nutrients of four grain
legume crops (groundnut, bambara groundnut, dry bean and cowpea) grown under varying irrigation regimes (optimum irrigation, deficit irrigation and rainfed) over two seasons (2015/16 and 2016/17). .................................................................................................... 131
Table 5.3: Macro (energy, protein and fat) and micro (Ca, Zn and Fe) nutrients of four grain legume crops (groundnut, bambara groundnut, dry bean and cowpea) grown at three different sites (Fountainhill Estate, Ukulinga Research Farm and Umbumbulu Rural District) over two seasons (2015/16 and 2016/17). .......................................................... 133
xviii
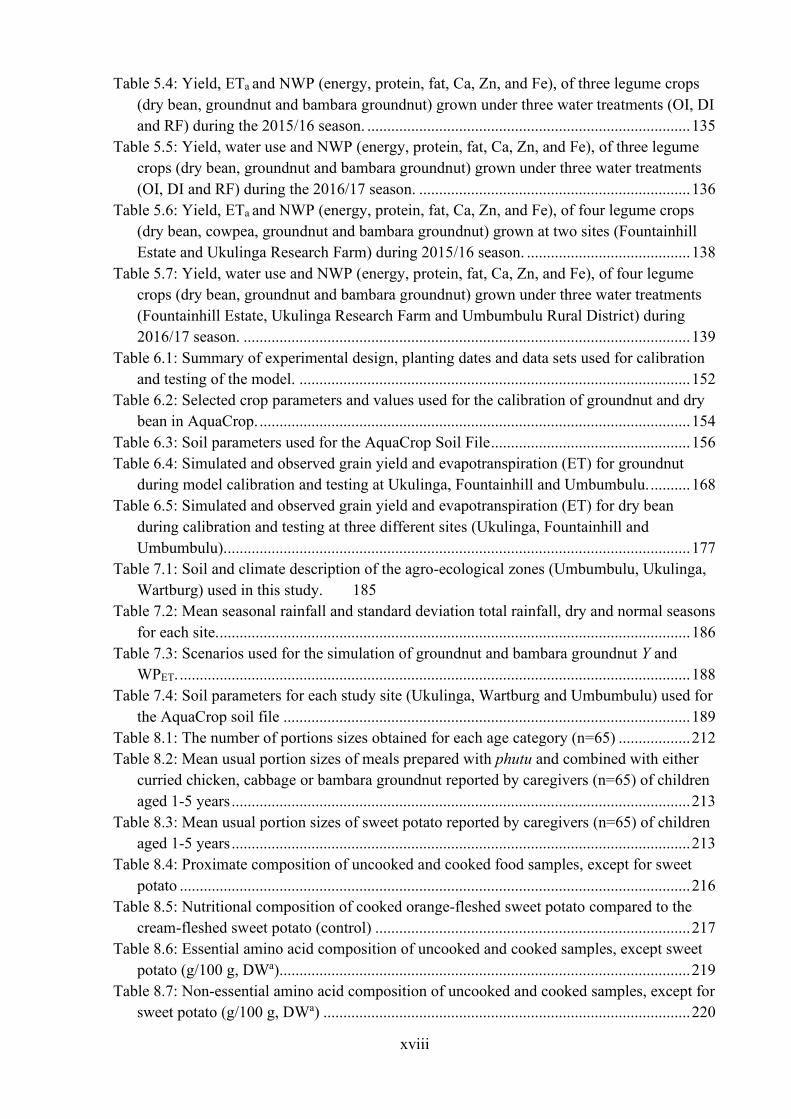
Table 5.4: Yield, ETa and NWP (energy, protein, fat, Ca, Zn, and Fe), of three legume crops (dry bean, groundnut and bambara groundnut) grown under three water treatments (OI, DI and RF) during the 2015/16 season. ................................................................................. 135
Table 5.5: Yield, water use and NWP (energy, protein, fat, Ca, Zn, and Fe), of three legume crops (dry bean, groundnut and bambara groundnut) grown under three water treatments (OI, DI and RF) during the 2016/17 season. .................................................................... 136
Table 5.6: Yield, ETa and NWP (energy, protein, fat, Ca, Zn, and Fe), of four legume crops (dry bean, cowpea, groundnut and bambara groundnut) grown at two sites (Fountainhill Estate and Ukulinga Research Farm) during 2015/16 season. ......................................... 138
Table 5.7: Yield, water use and NWP (energy, protein, fat, Ca, Zn, and Fe), of four legume crops (dry bean, groundnut and bambara groundnut) grown under three water treatments (Fountainhill Estate, Ukulinga Research Farm and Umbumbulu Rural District) during 2016/17 season. ................................................................................................................ 139
Table 6.1: Summary of experimental design, planting dates and data sets used for calibration and testing of the model. .................................................................................................. 152
Table 6.2: Selected crop parameters and values used for the calibration of groundnut and dry bean in AquaCrop. ............................................................................................................ 154
Table 6.3: Soil parameters used for the AquaCrop Soil File .................................................. 156 Table 6.4: Simulated and observed grain yield and evapotranspiration (ET) for groundnut
during model calibration and testing at Ukulinga, Fountainhill and Umbumbulu. .......... 168 Table 6.5: Simulated and observed grain yield and evapotranspiration (ET) for dry bean
during calibration and testing at three different sites (Ukulinga, Fountainhill and Umbumbulu). .................................................................................................................... 177
Table 7.1: Soil and climate description of the agro-ecological zones (Umbumbulu, Ukulinga, Wartburg) used in this study. 185
Table 7.2: Mean seasonal rainfall and standard deviation total rainfall, dry and normal seasons for each site. ...................................................................................................................... 186
Table 7.3: Scenarios used for the simulation of groundnut and bambara groundnut Y and WPET. ................................................................................................................................ 188
Table 7.4: Soil parameters for each study site (Ukulinga, Wartburg and Umbumbulu) used for the AquaCrop soil file ...................................................................................................... 189
Table 8.1: The number of portions sizes obtained for each age category (n=65) .................. 212 Table 8.2: Mean usual portion sizes of meals prepared with phutu and combined with either
curried chicken, cabbage or bambara groundnut reported by caregivers (n=65) of children aged 1-5 years ................................................................................................................... 213
Table 8.3: Mean usual portion sizes of sweet potato reported by caregivers (n=65) of children aged 1-5 years ................................................................................................................... 213
Table 8.4: Proximate composition of uncooked and cooked food samples, except for sweet potato ................................................................................................................................ 216
Table 8.5: Nutritional composition of cooked orange-fleshed sweet potato compared to the cream-fleshed sweet potato (control) ............................................................................... 217
Table 8.6: Essential amino acid composition of uncooked and cooked samples, except sweet potato (g/100 g, DWa)....................................................................................................... 219
Table 8.7: Non-essential amino acid composition of uncooked and cooked samples, except for sweet potato (g/100 g, DWa) ............................................................................................ 220
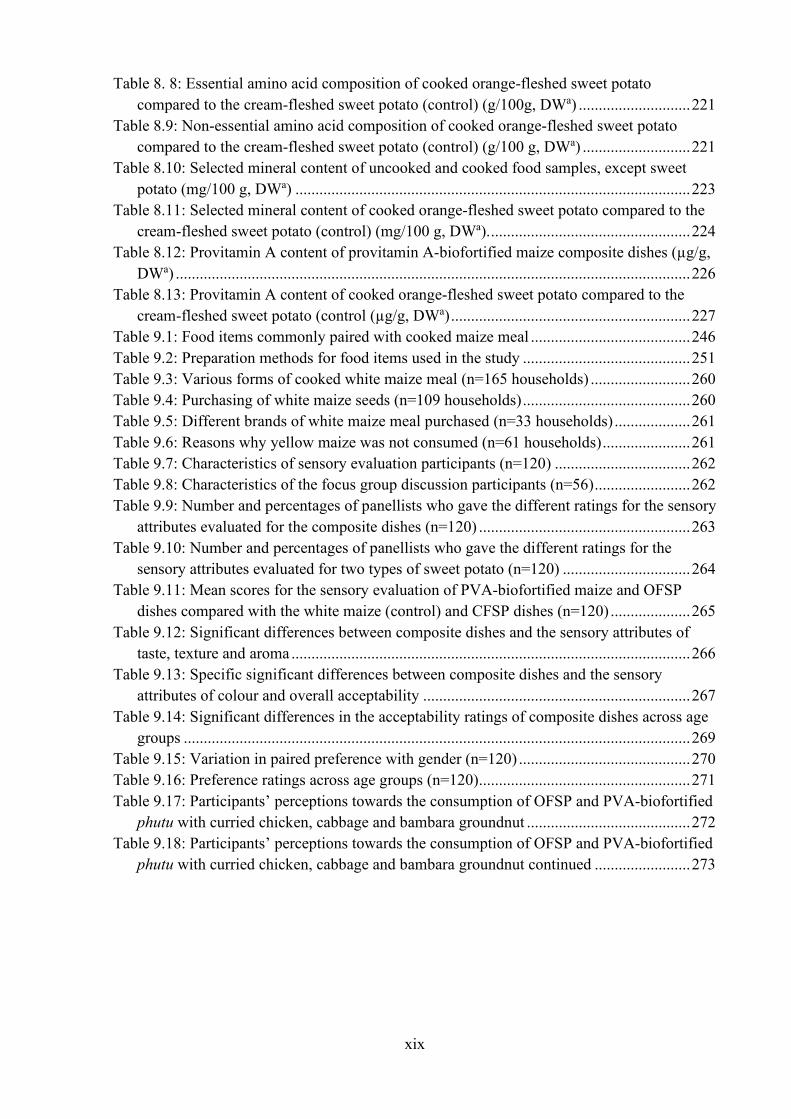
xix
Table 8. 8: Essential amino acid composition of cooked orange-fleshed sweet potato compared to the cream-fleshed sweet potato (control) (g/100g, DWa) ............................ 221
Table 8.9: Non-essential amino acid composition of cooked orange-fleshed sweet potato compared to the cream-fleshed sweet potato (control) (g/100 g, DWa) ........................... 221
Table 8.10: Selected mineral content of uncooked and cooked food samples, except sweet potato (mg/100 g, DWa) ................................................................................................... 223
Table 8.11: Selected mineral content of cooked orange-fleshed sweet potato compared to the cream-fleshed sweet potato (control) (mg/100 g, DWa). .................................................. 224
Table 8.12: Provitamin A content of provitamin A-biofortified maize composite dishes (µg/g, DWa) ................................................................................................................................. 226
Table 8.13: Provitamin A content of cooked orange-fleshed sweet potato compared to the cream-fleshed sweet potato (control (µg/g, DWa) ............................................................ 227
Table 9.1: Food items commonly paired with cooked maize meal ........................................ 246 Table 9.2: Preparation methods for food items used in the study .......................................... 251 Table 9.3: Various forms of cooked white maize meal (n=165 households) ......................... 260 Table 9.4: Purchasing of white maize seeds (n=109 households) .......................................... 260 Table 9.5: Different brands of white maize meal purchased (n=33 households) ................... 261 Table 9.6: Reasons why yellow maize was not consumed (n=61 households) ...................... 261 Table 9.7: Characteristics of sensory evaluation participants (n=120) .................................. 262 Table 9.8: Characteristics of the focus group discussion participants (n=56) ........................ 262 Table 9.9: Number and percentages of panellists who gave the different ratings for the sensory
attributes evaluated for the composite dishes (n=120) ..................................................... 263 Table 9.10: Number and percentages of panellists who gave the different ratings for the
sensory attributes evaluated for two types of sweet potato (n=120) ................................ 264 Table 9.11: Mean scores for the sensory evaluation of PVA-biofortified maize and OFSP
dishes compared with the white maize (control) and CFSP dishes (n=120) .................... 265 Table 9.12: Significant differences between composite dishes and the sensory attributes of
taste, texture and aroma .................................................................................................... 266 Table 9.13: Specific significant differences between composite dishes and the sensory
attributes of colour and overall acceptability ................................................................... 267 Table 9.14: Significant differences in the acceptability ratings of composite dishes across age
groups ............................................................................................................................... 269 Table 9.15: Variation in paired preference with gender (n=120) ........................................... 270 Table 9.16: Preference ratings across age groups (n=120) ..................................................... 271 Table 9.17: Participants’ perceptions towards the consumption of OFSP and PVA-biofortified
phutu with curried chicken, cabbage and bambara groundnut ......................................... 272 Table 9.18: Participants’ perceptions towards the consumption of OFSP and PVA-biofortified
phutu with curried chicken, cabbage and bambara groundnut continued ........................ 273
xx
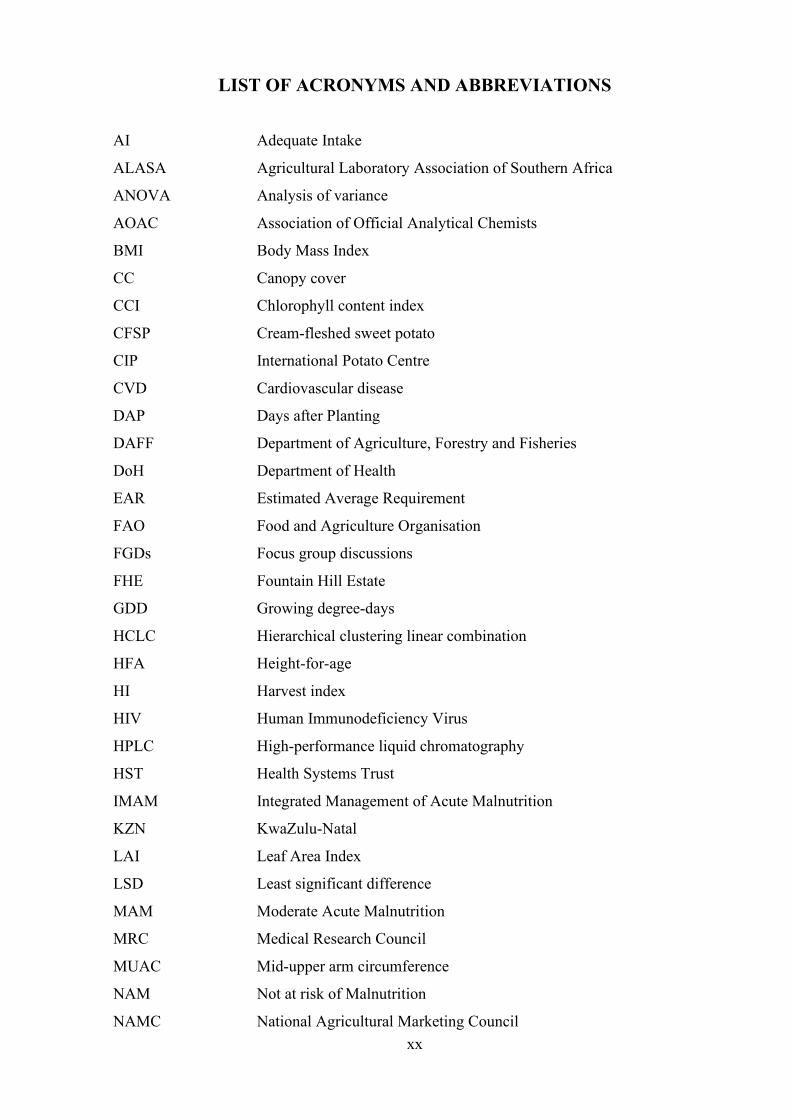
LIST OF ACRONYMS AND ABBREVIATIONS
AI Adequate Intake
ALASA Agricultural Laboratory Association of Southern Africa
ANOVA Analysis of variance
AOAC Association of Official Analytical Chemists
BMI Body Mass Index
CC Canopy cover
CCI Chlorophyll content index
CFSP Cream-fleshed sweet potato
CIP International Potato Centre
CVD Cardiovascular disease
DAP Days after Planting
DAFF Department of Agriculture, Forestry and Fisheries
DoH Department of Health
EAR Estimated Average Requirement
FAO Food and Agriculture Organisation
FGDs Focus group discussions
FHE Fountain Hill Estate
GDD Growing degree-days
HCLC Hierarchical clustering linear combination
HFA Height-for-age
HI Harvest index
HIV Human Immunodeficiency Virus
HPLC High-performance liquid chromatography
HST Health Systems Trust
IMAM Integrated Management of Acute Malnutrition
KZN KwaZulu-Natal
LAI Leaf Area Index
LSD Least significant difference
MAM Moderate Acute Malnutrition
MRC Medical Research Council
MUAC Mid-upper arm circumference
NAM Not at risk of Malnutrition
NAMC National Agricultural Marketing Council
xxi
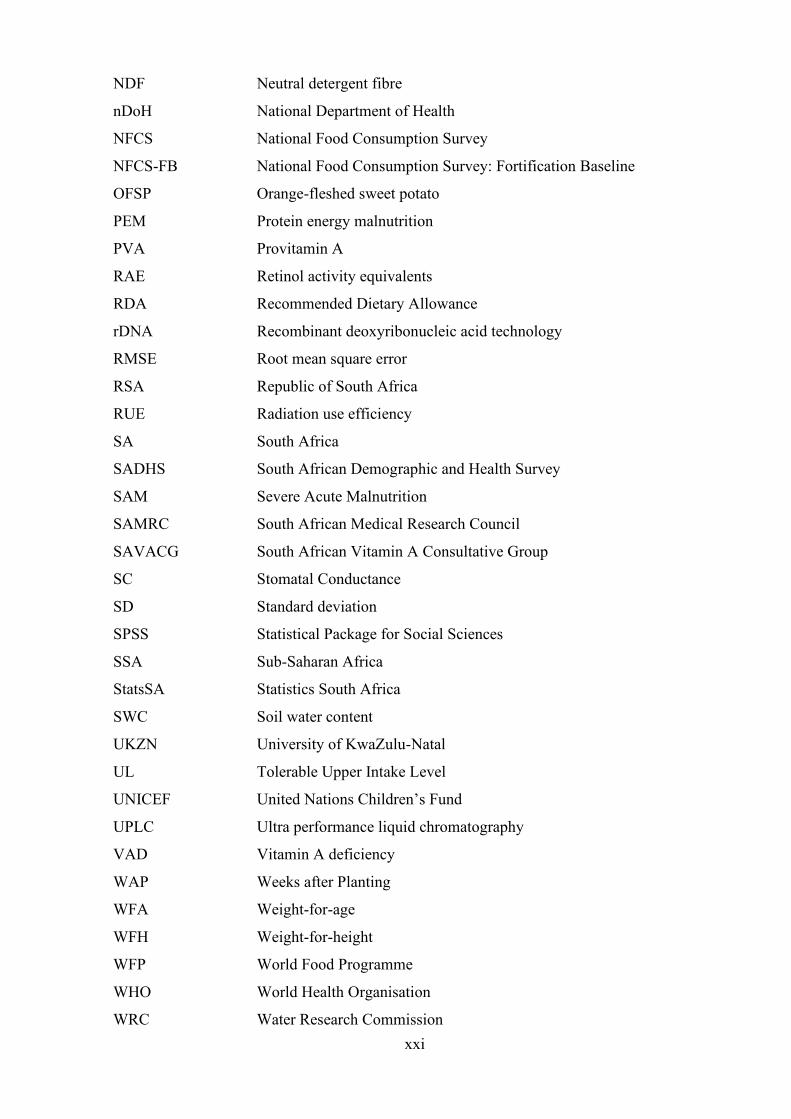
NDF Neutral detergent fibre
nDoH National Department of Health
NFCS National Food Consumption Survey
NFCS-FB National Food Consumption Survey: Fortification Baseline
OFSP Orange-fleshed sweet potato
PEM Protein energy malnutrition
PVA Provitamin A
RAE Retinol activity equivalents
RDA Recommended Dietary Allowance
rDNA Recombinant deoxyribonucleic acid technology
RMSE Root mean square error
RSA Republic of South Africa
RUE Radiation use efficiency
SA South Africa
SADHS South African Demographic and Health Survey
SAM Severe Acute Malnutrition
SAMRC South African Medical Research Council
SAVACG South African Vitamin A Consultative Group
SC Stomatal Conductance
SD Standard deviation
SPSS Statistical Package for Social Sciences
SSA Sub-Saharan Africa
StatsSA Statistics South Africa
SWC Soil water content
UKZN University of KwaZulu-Natal
UL Tolerable Upper Intake Level
UNICEF United Nations Children’s Fund
UPLC Ultra performance liquid chromatography
VAD Vitamin A deficiency
WAP Weeks after Planting
WFA Weight-for-age
WFH Weight-for-height
WFP World Food Programme
WHO World Health Organisation
WRC Water Research Commission
xxii
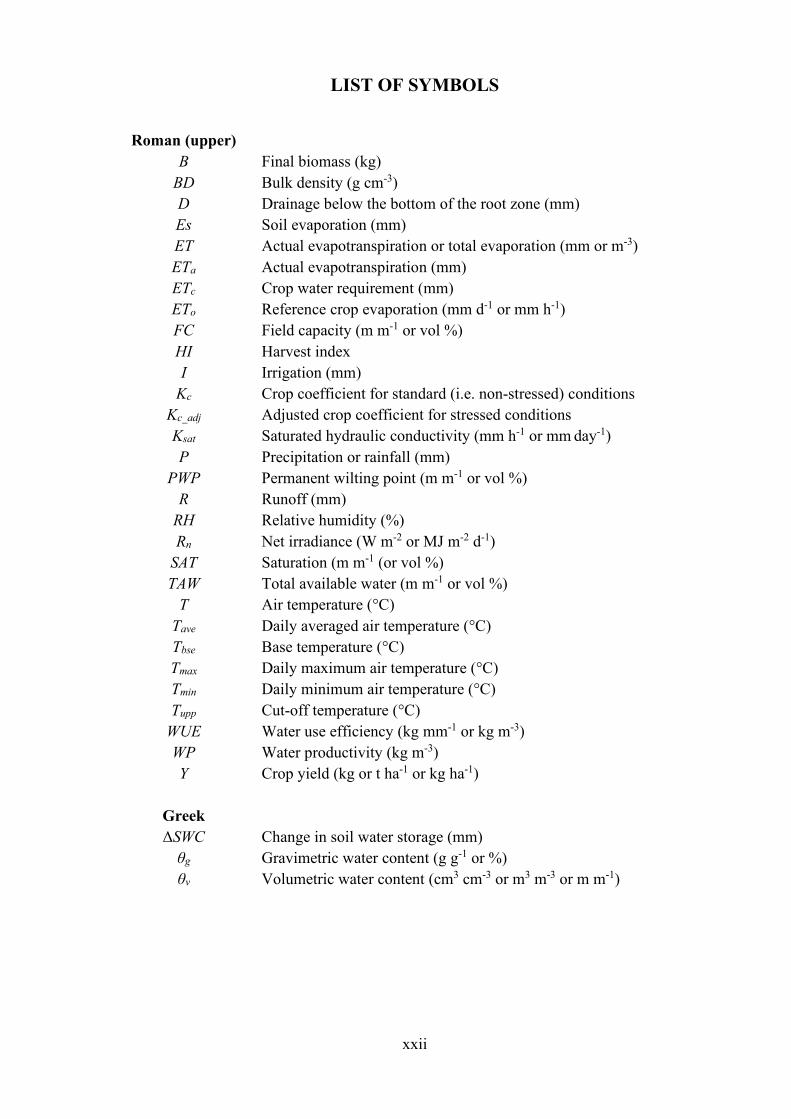
LIST OF SYMBOLS
Roman (upper) B Final biomass (kg)
BD Bulk density (g cm-3) D Drainage below the bottom of the root zone (mm) Es Soil evaporation (mm) ET Actual evapotranspiration or total evaporation (mm or m-3) ETa Actual evapotranspiration (mm) ETc Crop water requirement (mm) ETo Reference crop evaporation (mm d-1 or mm h-1) FC Field capacity (m m-1 or vol %) HI Harvest index I Irrigation (mm)
Kc Crop coefficient for standard (i.e. non-stressed) conditions Kc_adj Adjusted crop coefficient for stressed conditions Ksat Saturated hydraulic conductivity (mm h-1 or mm day-1) P Precipitation or rainfall (mm)
PWP Permanent wilting point (m m-1 or vol %) R Runoff (mm)
RH Relative humidity (%) Rn Net irradiance (W m-2 or MJ m-2 d-1)
SAT Saturation (m m-1 (or vol %) TAW Total available water (m m-1 or vol %)
T Air temperature (°C) Tave Daily averaged air temperature (°C) Tbse Base temperature (°C) Tmax Daily maximum air temperature (°C) Tmin Daily minimum air temperature (°C) Tupp Cut-off temperature (°C)
WUE Water use efficiency (kg mm-1 or kg m-3) WP Water productivity (kg m-3) Y Crop yield (kg or t ha-1 or kg ha-1)
Greek ΔSWC Change in soil water storage (mm)
θg Gravimetric water content (g g-1 or %) θv Volumetric water content (cm3 cm-3 or m3 m-3 or m m-1)

xxiii
REPOSITORY OF DATA
For details related to the project data, please contact:
Tafadzwa Mabhaudhi (Principal Researcher)
Centre for Transformative Agricultural and Food Systems
School of Agricultural, Earth and Environmental Sciences
University of KwaZulu-Natal
Private Bag X01, Scottsville 3209
Pietermaritzburg, South Africa

xxiv
This page was intentionally left blank
1
CHAPTER 1
WATER USE OF CROPS AND NUTRITIONAL WATER PRODUCTIVITY FOR FOOD PRODUCTION, NUTRITION AND HEALTH IN RURAL
COMMUNITIES IN KWAZULU-NATAL: AN OVERVIEW T Mabhaudhi and AT Modi
1.1 Background and Conceptualisation
“Food and nutrition security exists when all people, at all times, have physical and economic
access to sufficient, safe and nutritious food that meets their dietary needs and food preferences for
an active and healthy life” (FAO, 1996). Over the past decades, issues of food and nutrition security
have taken centre stage in defining the development agenda in sub-Saharan Africa (SSA) and other
developing regions. Significant funding has been channelled towards fighting food and nutrition
insecurity. Although considerable progress has been made towards combating food and nutrition
insecurity on a global scale (FAO-IFAD-WFP, 2013), the same cannot be said for much of SSA.
The region still has the highest prevalence of undernutrition (FAO-IFAD-WFP, 2013). Recent
reports have pegged the prevalence of undernutrition in SSA at 23.8% (FAO-IFAD-WFP, 2014).
In addition, most SSA countries are still characterised as food and nutrition insecure (FAO-IFAD-
WFP, 2014). Therefore, despite achievements realised over the period under review, food and
nutrition security remain elusive (Chivenge et al., 2015).
The roles that water and agriculture have to play in delivering food and nutrition security goals
cannot be overstated. This realisation has stimulated discussions around the water-food nexus.
Within the context of SSA it is important to note that 70% of the population relies on agriculture
(Livingston et al., 2011), either directly or indirectly, and that 95% of this agriculture is primarily
rainfed (Singh et al., 2011). Poor rural households rely on rainfed agriculture as the primary source
of their food and nutrition. This highlights the linkage between water use in agriculture and food
and nutrition security and explains why agriculture remains the main vehicle for addressing food
and nutrition security in poor rural households. Approaches used in the past have mainly focused
on increasing food production and water productivity. This has resulted in nutrition security playing
second fiddle to food production. Given that nutrition security is the basis upon which human health

2
and well-being are built (IFPRI, 2014), it would be grossly unwise and not prudent to continue
paying lip service to nutrition, especially as we move into the post-2015 era of Sustainable
Development Goals (SDGs) replacing the Millennium Development Goals (MDGs) (Sachs, 2012).
Although South Africa is food secure at the national level, it experiences household food
insecurity (De Klerk et al., 2004). Earlier reports suggested that rural and peri-urban South African
households faced food and nutrition insecurity, with about 14 million people residing in these areas
facing malnutrition (De Klerk et al., 2004). A decade later, recent reports (Oxfam, 2014) have also
confirmed these observations. This highlights that while several government programmes have
been implemented over the past decade, food and nutrition security still remain a poignant
challenge. There is a need to improve agriculture in rural areas so that people are empowered to
produce enough food, broaden their existing food basket and improve supply and access to
nutritious foods; a concept that has been linked to food sovereignty.
There is a need for a paradigm shift in order to effectively deliver on the twin challenges of
food and nutrition security. Part of this means re-thinking the indices that have been used by
researchers and development agencies in assessing food and nutrition goals and assessing their
impacts on human health. Previous studies have focussed separately on either crop production
(food availability) or food access or nutrition (Sachs, 2012). Thus, food production, nutrition and
human health have been addressed separately using different indices, with the balance tilting in
favour of food production. In order to meaningfully address food and nutrition security, there is a
need for indices that combine aspects of production, access and nutrition. This could also encourage
multidisciplinary research between agricultural scientists, nutritionists and dieticians, considering
available agribusiness data. In doing so, recommendations can be generated that empower rural
farmers so that they get the most (biomass and nutrition) per unit drop of water used – nutritional
water productivity (NWP) (Renault and Wallender, 2000). The potential for such approaches was
highlighted by Wenhold et al. (2012) in their report on water use and nutrient content. The scoping
study by Wenhold et al. (2012) made significant progress in establishing a baseline for future
studies on NWP of crops.
This review builds on previous work (Wenhold et al., 2012) and aims to highlight the linkages
between water, agriculture, nutrition and human health. This is done by placing emphasis on the
use of NWP as a suitable index for assessing the contribution of water use and agriculture to food
and nutrition security. The focus on crops alternative to major crops, is meant to address the need
3
for dietary diversity in poor rural communities. The review introduces the water-food-nutrition-
health nexus as a way of planning agriculture-based strategies for improving human nutrition and
health in poor rural households.
1.2 Objectives
The contractually specified objectives of the project were:
1.2.1 General objective To determine water use and nutritional water productivity for improved production, nutrition and
health in poor rural communities.
1.2.2 Specific objectives i. To review and update available knowledge on water use and nutritional water productivity,
food intake, food sources and nutrition of food consumed in poor rural communities;
ii. To identify food intake and sources of food in poor rural households;
iii. To identify the reasons behind choices of food intake in poor rural households and
nutritional evaluation of food intake;
iv. To determine nutrient content (nutritional value) of currently used crops and alternative
crops;
v. To measure water use and nutritional water productivity of currently used crops as well as
new crops to be introduced;
vi. To perform crop yield modelling and nutritional water productivity of the range of crops;
and
vii. To formulate best management practices for maximising water use and nutritional value for
current crop choices and new crops.
1.3 Scope of the Report
For the purposes of the current project, we have defined conventional and alternative crops as
follows:
• Conventional crops: these are commonly referred to as major or staple crops and generally
include those crops that have been the subject of significant research, development and

4
innovation and now occupy larger production areas. Examples include maize, wheat, rice,
dry beans, groundnuts, spinach, etc.
• Alternative crops: these are commonly referred to as underutilised crops and are crops that
have not been previously classified as major crops, have previously been under-researched,
currently occupy low levels of utilisation and are mainly confined to smallholder farming
areas. Such crops may have the potential to contribute to food and nutrition security of poor
rural households and may be suited to the marginal production environments that typify
most rural areas. Examples of such crops include, but are not limited to, cereals (sorghum,
teff and millets), legumes (bambara groundnut, cowpea, lablab), root and tuber crops (taro,
orange-fleshed sweet potatoes) and traditional leafy vegetables (amaranth, wild mustard,
cleome).
For the current study, the focus has been on conventional (dry beans and groundnuts) and
alternative legumes (bambara groundnut and cowpeas), with some limited focus on sorghum,
which derives from WRC K5/2274//4, and orange-fleshed sweet potatoes for VAD. The focus on
traditional leafy vegetables has been covered in a separate and recently completed WRC project
WRC K5/2171/1/16. The studies were conducted in KwaZulu-Natal Province, uMgungundlovu
District Municipality in Swayimane which is located in Ward 8 of uMshwati Local Municipality
(Figure 1.1)
5
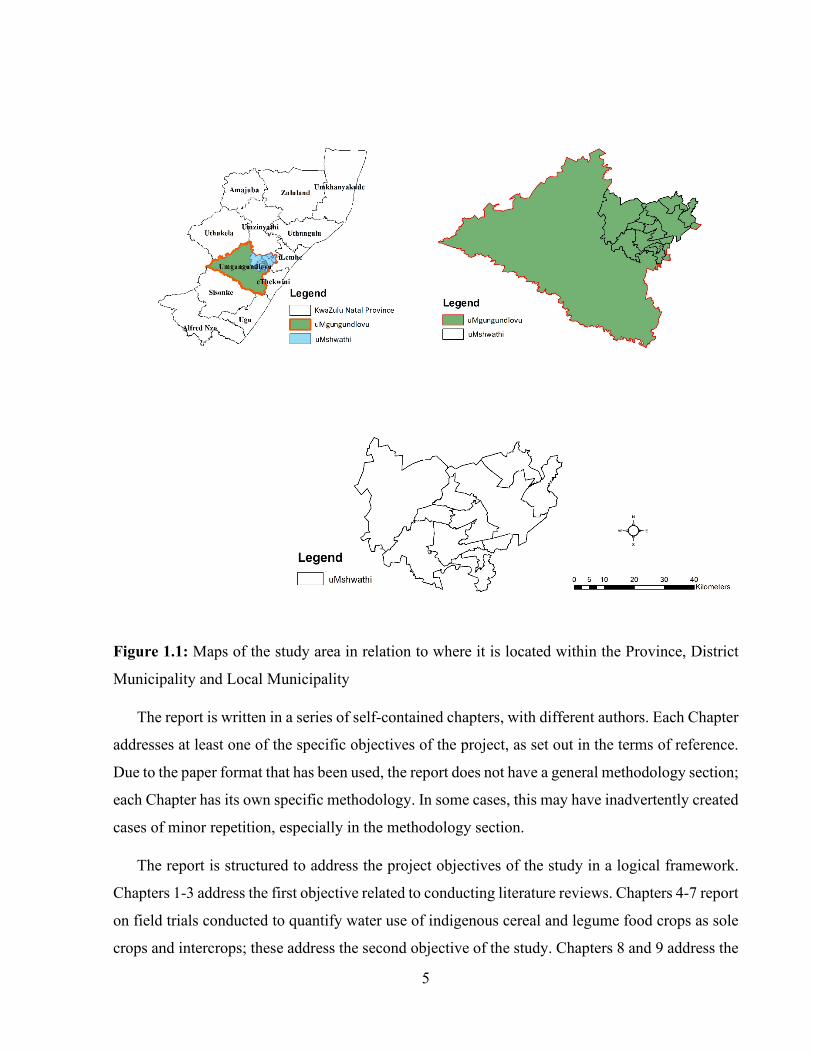
Figure 1.1: Maps of the study area in relation to where it is located within the Province, District
Municipality and Local Municipality
The report is written in a series of self-contained chapters, with different authors. Each Chapter
addresses at least one of the specific objectives of the project, as set out in the terms of reference.
Due to the paper format that has been used, the report does not have a general methodology section;
each Chapter has its own specific methodology. In some cases, this may have inadvertently created
cases of minor repetition, especially in the methodology section.
The report is structured to address the project objectives of the study in a logical framework.
Chapters 1-3 address the first objective related to conducting literature reviews. Chapters 4-7 report
on field trials conducted to quantify water use of indigenous cereal and legume food crops as sole
crops and intercrops; these address the second objective of the study. Chapters 8 and 9 address the

6
third objective related to modelling water use of indigenous cereal and legume food crops. Lastly,
Chapters 10 and 11 address both objective three and four on agronomic management and
developing best practice recommendations. A general overview of the report is provided below:
Chapter 1: provides a general introduction, background and conceptualisation of the entire study.
It provides a motivation for the broad study as set out in the terms of reference. It also sets out the
project’s aims and specific objects as defined in the contract.
Chapter 2: provides a literature review on food sources, reasons for food choices and linking water
to nutrition and human health. The chapter takes a broader and more holistic view to give a global
perspective to the problem, highlighting commonalities with South Africa. The chapter addresses
specific objective 1 of the project. It also addresses specific objectives 2 and 3 related to food intake
and sources of food in poor rural households, and reasons behind choices of food intake in poor
rural households and nutritional evaluation of food intake
Chapter 3: provides a more in-depth analysis of food and nutrition security within the study
population, which is KwaZulu-Natal, again, showing similarities to the national, regional and
global perspectives. It also addresses specific objectives 2 and 3 related to food intake and sources
of food in poor rural households, and reasons behind choices of food intake in poor rural households
and nutritional evaluation of food intake.
Chapter 4: reports on results of an analyses of food intake and nutritional status of the identified
population groups within the selected study populations of KwaZulu-Natal. It also addresses
specific objective 2 on food intake and sources of food in poor rural households.
Chapter 5: this follows from the gaps identified in Chapters 2, 3 and 4, and the proposals contained
therein. The preceding chapters highlighted the need for a crop-based approach or intervention,
where the choice of crop is linked to addressing identified gaps in nutrition. This chapter reports
on results of water use and nutritional water productivity of the range of identified crops and
addresses specific objectives 4 and 5 of the project.
Chapter 6: reports on results of modelling yield and water use for the range of crops identified and
addresses specific objective 6 of the study related to modelling yield and water use of the range of
identified crops.
Chapter 7: based on crop model application, report on the development of best management
practices for the range of identified crops. This chapter addresses specific objective 7 of the study.
7
Chapter 8: reports on the use of composite dishes featuring PVA-biofortified maize and orange-
fleshed sweet potato as well as bambara groundnut as alternative food sources for addressing
identified gaps in nutrition.
Chapter 9: explores further the consumer perceptions and acceptability of food products prepared
using the identified alternative crops.
Chapter 10: provides a holistic discussion of the entire project and links all the separate studies to
achieving the project objectives. The chapter also provides the conclusion and recommendations
for future studies.
References
CHIVENGE P, MABHAUDHI T, MODI AT and MAFONGOYA P (2015) The potential role of neglected
and underutilised crop species as future crops under water scarce conditions in sub-Saharan Africa. Int. J.
Environ. Res. Public Health 12 5685-5711.
DE KLERK M, DRIMIE S, ALIBER M, MINI S, MOKEONA R, RANDELA R, MODISELLE SC, DE
SWART, C and KIRSTEN J (2004) Food security in South Africa: key policy issues for the medium term
Human Sciences Research Council, Pretoria pp82.
FAO (FOOD AND AGRICULTURE ORGANISATION) (1996) Rome Declaration on World Food
Security and World Food Summit Plan of Action. World Food Summit 13-17 November 1996. Rome
FAO, IFAD, WFP (2014) The State of Food Insecurity in the World 2014: Strengthening the Enabling
Environment for Food Security and Nutrition. FAO, Rome, Italy.
FAO, WFP, IFAD (2013) The State of Food Insecurity in the World 2013: The Multiple Dimensions of Food
Security. FAO, Rome, Italy.
IFPRI (INTERNATIONAL FOOD POLICY RESEARCH INSTITUTE) (2014) Global Nutrition Report
2014: Actions and Accountability to Accelerate the World’s Progress on Nutrition. Washington, DC.
LIVINGSTON G, SCHONBERGER S and DELANEY S (2011) Sub-Saharan Africa: The state of
smallholders in agriculture. In: Proceedings of the (International Fund for Agricultural Development) IFAD
Conference on New Directions for Smallholder Agriculture 24-25 January 2011, Rome Italy.
OXFAM (2014a) Hidden hunger in South Africa: The faces of hunger and malnutrition in a food-secure
nation. Oxfam, UK.
OXFAM (2014b) Even it up: Time to end extreme inequality. Oxfam, UK.
SACHS JD (2012) From Millennium Development Goals to Sustainable Development Goals. Lancet 379
2206-2211.
8
SINGH P, WANI SP, PATHAK P, SAHRAWAT KL and SINGH AK (2011) Increasing crop productivity
and water use efficiency in rainfed agriculture. In: SP Wani, J Rockstrom, LS Hrawat (Eds), Integrated
Watershed Management; CRC Press: London, UK, 2011; chapter 10, pp. 315-348.
RENAULT D and WALLENDER WW (2000) Nutritional water productivity and diets. Agric. Water
Manage. 45 275-296.
WENHOLD F, ANNANDALE J, FABER M and HART T (2012) Water Use and Nutrient Content of Crop
and Animal Products for Improved Household Security: A Scoping Study. Water Research Commission
Report No. TT 537/12.ISBN 978-1-4312-0332-1.

9
CHAPTER 2
WATER-FOOD-NUTRITION-HEALTH NEXUS: LINKING WATER TO
IMPROVING FOOD, NUTRITION AND HEALTH IN SUB-SAHARAN
AFRICA
T Mabhaudhi, TP Chibarabada and AT Modi
2.1 Introduction
“Food and nutrition security exists when all people, at all times, have physical and economic access
to sufficient, safe and nutritious food that meets their dietary needs and food preferences for an
active and healthy life” (FAO, 1996). Over the past decades, issues of food and nutrition security
have taken centre stage in defining the development agenda in sub-Saharan Africa (SSA) and other
developing regions. Significant funding has been channelled towards fighting food and nutrition
insecurity. Although considerable progress has been made towards combating food and nutrition
insecurity on a global scale (FAO et al., 2013), the same cannot be said for SSA. At 23.8% (FAO
et al., 2018), the region still has the highest prevalence of undernutrition in its population (FAO et
al., 2018). Most countries in SSA are still characterised as food and nutrition insecure (FAO et al.,
2013). Therefore, despite achievements realised over the period under review, food and nutrition
security remain a major challenge (Chivenge et al., 2015).
Water for agriculture and crop productivity play a significant role in delivering food and
nutrition security goals (Chivenge et al., 2015) This realisation has stimulated discussions around
the water-food nexus. Within the context of SSA, it is important to note that 70% of the population
relies on agriculture (Livingston et al., 2011a), either directly or indirectly, and that 95% of this
agriculture is primarily rainfed (Singh et al., 2011). This highlights the linkage between water use
in agriculture and food and nutrition security and explains why agriculture remains the main vehicle
for addressing food and nutrition security in poor rural households. Approaches to dealing with
poverty and hunger in SSA have hitherto mainly focused on food production under water scarce
conditions (Singh et al., 2011). While this approach indirectly allowed for nutrition security to be
addressed, it was not adequate, because agriculture and nutrition research was conducted in
10
isolation. Given that nutrition security is the basis upon which human health and well-being are
built (Rosegrant et al., 2014), it is important to design a transdisciplinary approach with scientific
and social credibility, especially as we move into the post-2015 era of Sustainable Development
Goals (SDGs) (Sachs, 2012). Such multifunctional agricultural systems have been reported to have
had more success in delivering on nutrition, health and income goals (Leakey, 2012).
There is a need for a paradigm shift in order to effectively deliver on the twin challenges of
food and nutrition security. Part of this means re-thinking the indices that have been used by
researchers and development agencies in assessing food and nutrition goals and assessing their
impacts on human health. Previous studies have focussed separately on either crop production
(food availability) or food access or nutrition (Sachs, 2012). Thus, food production, nutrition and
human health have been addressed separately using different indices, with the balance tilting in
favour of food production. In order to meaningfully address food and nutrition security, there is a
need for indices that combine aspects of production, access and nutrition. This could also encourage
transdisciplinary research between agricultural scientists, nutritionists and dieticians. In doing so,
recommendations can be generated that empower rural farmers so that they get the most (biomass
and nutrition) per unit drop of water used – nutritional water productivity (NWP) (Renault and
Wallender, 2000). According to Renault and Wallender (2000), NWP, defined as nutritional value
per unit of water, offers more meaning in linking crop water productivity, and food production to
malnutrition and poverty. The potential for application for NWP was highlighted by Wenhold et
al. (2012) and Nyathi et al. (2016) in their report on water use and nutrient content. These WRC
studies (Project No. 2171/1/16 and report No. TT 537/12, respectively) made significant progress
in establishing a baseline for future studies on NWP of crops (Wenhold et al., 2012).
The review introduces the water-food-nutrition-health nexus as a way of planning agriculture
based strategies for improving human nutrition and health in poor rural households. It hypothesizes
that water, agriculture, nutrition and human health are intricately linked to each other – a nexus. In
addition, it suggests that such linkages should be made explicit in planning agricultural
interventions aimed at improving food and nutrition security and human health among the poor.
Furthermore, recognition of these linkages entails transdisciplinary research. Such
transdisciplinary research needs to be supported by the development of appropriate metrics that
can articulate components of the linkage. In this regard, the review suggests the use of NWP as a
suitable index for assessing the contribution of water use and agriculture to food and nutrition
security as a starting point. The focus on neglected and underutilised crop species (NUCS), as an
11
alternative to major crops, is meant to address the need for dietary diversity in poor rural
communities. Within the scope of this review, NUCS are defined as those crops that have not been
previously categorized as major crops, are currently under-researched or have not been the subject
of major research projects, have low levels of utilisation and are mainly confined to niche
agroecological areas (Chivenge et al., 2015).
2.2 Water
The role of water in achieving food and nutrition security for improved nutrition and human health
cannot be understated. Water is essential to food and nutrition security through its linkages with all
aspects related to economic access to food (HLPE, 2015). While the role of water in the provision
of food and nutrition transcends many sectors, this review focusses primarily on the linkages
between water and agriculture. Sufficient and quality water is critical for agricultural production
(HLPE, 2015) and achieving food and nutrition security. Options for increasing agricultural
production to meet the growing food demand include increasing (i) land area under production; (ii)
yield, through crop improvement, plant biotechnology or other alternative methods; and (iii) output
per unit input (productivity) on existing land area (Edgerton, 2009). Agricultural productivity in
SSA is currently low and remains far below yield potentials (Chauvin et al., 2012), suggesting that
there is need to improve current levels of productivity on existing land area.
Reports also suggest that poor rural farmers in SSA cannot afford inputs such as fertilizers,
chemicals and herbicides to improve their productivity (Druilhe and Barreiro-Hurlé, 2012). This
may, in part, explain current low levels of productivity. In such instances, it may be more effective
to develop agroecological approaches to crop husbandry and income generation opportunities so
that farmers can afford inputs to achieving more sustainable systems (Wezel and Soldat, 2009;
Wezel et al., 2011; Druilhe and Barreiro-Hurlé, 2012). This review focuses on the third option with
a particular emphasis on water as an integral input in agriculture. Global reports indicate that
agriculture is the biggest water user, accounting for 60-90% of fresh water withdrawals (Water,
2006). Water will be a major constraint for agriculture especially in SSA, where rainfall is generally
low and the population is increasing rapidly (Rijsberman, 2006). Recent reports on climate change
have confirmed this with indications that climate change impacts in SSA will mainly be felt through
changes in rainfall and water availability (IPCC, 2014). This has placed agriculture in a situation
where any increases in agricultural production cannot be met with corresponding increases in water
use. This has brought about the slogan “more crop per drop” (FAO, 2003; Molden et al., 2003;

12
SIWI-IWMI, 2004). Increasing agricultural production without increasing water use will contribute
to sustainability by ensuring food and nutrition security now and in the future without further
threatening scarce and limited water resources.
2.3 Agriculture
In crop production, water use is often equated to evapotranspiration (ET) which is the combined
loss of water from the soil surface by evaporation (E) and from the plant by transpiration (T) (Allen,
1998). Evaporation and transpiration are the two processes where water is actually depleted from
the soil; other outflows such as runoff and drainage are not considered as depletion as water is
captured in other sinks such as ground water, saline water bodies and oceans (Molden et al., 2010).
Globally, rainfall contributes about 80% of water that is lost through evapotranspiration while 20%
is drawn from water bodies for irrigation purposes [Comprehensive Assessment of Water
Management in Agriculture (CA), 2007]. Climate change and variability are expected to
significantly alter this situation through changes in rainfall patterns with significant impacts on
agriculture. This threatens the role of agriculture in providing food and nutrition security, especially
in water scarce areas. Ali and Talukder (2008) suggested that improving productivity under rainfed
conditions would decrease irrigation withdrawals and ultimately decrease pressure on fresh water
resources. This would include adopting crops that thrive under rainfed conditions reducing the need
for irrigation and adopting strategies that reduce the amount of water used by crops during
production. It is important to note that these strategies are at the crop interphase and do not consider
nutritional value, which is key to nutrition security.
2.3.1 Crop Water Use Crop water use refers to the amount of water lost by the crop through evaporation and transpiration
(evapotranspiration) in exchange for biomass accumulation. Due to the combination of the
processes of evaporation and transpiration, some authors refer to crop water use as crop ET (Soppe
and Ayars, 2003; Candogan et al., 2013). Both processes are driven by point weather conditions,
with some meteorological variables having a direct influence (wind, radiation, temperature and
humidity) (Allen et al., 1998). There are various methods of determining ET, which can be grouped
into hydrological (e.g. soil water balance and lysimetric measurements) and micrometeorological
techniques (e.g. eddy covariance, the Bowen ratio-energy balance and the temperature difference
method). Hydrological approaches are often the most practical approach to determine ET under
field conditions and consider incoming and outgoing water fluxes (Allen et al., 1998):
13
𝐸𝐸𝐸𝐸 = 𝐼𝐼𝐼𝐼𝐼𝐼𝐼𝐼𝐼𝐼𝐼𝐼𝐼𝐼𝐼𝐼𝐼𝐼𝐼𝐼 + 𝑅𝑅𝐼𝐼𝐼𝐼𝐼𝐼𝑅𝑅𝐼𝐼𝑅𝑅𝑅𝑅 − 𝑅𝑅𝑅𝑅𝐼𝐼𝐼𝐼𝑅𝑅𝑅𝑅 − 𝐷𝐷𝐷𝐷𝐷𝐷𝐷𝐷 𝐷𝐷𝐷𝐷𝐼𝐼𝑝𝑝𝐼𝐼𝑅𝑅𝐼𝐼𝐼𝐼𝐼𝐼𝐼𝐼𝐼𝐼 + 𝐶𝐶𝐼𝐼𝐷𝐷𝐼𝐼𝑅𝑅𝑅𝑅𝐼𝐼𝐼𝐼𝐶𝐶 𝐼𝐼𝐼𝐼𝑟𝑟𝐷𝐷
± 𝑝𝑝ℎ𝐼𝐼𝐼𝐼𝐼𝐼𝐷𝐷𝑟𝑟 𝐼𝐼𝐼𝐼 𝑟𝑟𝑅𝑅𝑠𝑠𝑟𝑟𝑅𝑅𝐼𝐼𝑅𝑅𝐼𝐼𝑝𝑝𝐷𝐷 𝑅𝑅𝑅𝑅𝐼𝐼𝑓𝑓 ± 𝑝𝑝ℎ𝐼𝐼𝐼𝐼𝐼𝐼𝐷𝐷𝑟𝑟 𝐼𝐼𝐼𝐼 𝑟𝑟𝐼𝐼𝐼𝐼𝑅𝑅 𝑓𝑓𝐼𝐼𝐼𝐼𝐷𝐷𝐼𝐼 𝑝𝑝𝐼𝐼𝐼𝐼𝐼𝐼𝐷𝐷𝐼𝐼𝐼𝐼
Equation 2.1
Fluxes such as runoff, deep percolation, capillary rise and changes in subsurface flow are
challenging to determine accurately under field conditions (Allen et al., 1998). The published water
use values of some crops suggest that vegetables such as carrots (Daucus carota) and garden beans
(Phaseolus vulgaris) use the least amount of water (200 and 320 mm, respectively) while
groundnut (Arachis hypogaea), soybean (Glycine max) and maize (Zea mays) are among the crops
with high water use (700-1000 mm) (Wenhold et al., 2012). It is important to note that these values
were obtained at a specific location and may not be applicable across various locations due to
differences in weather conditions.
Water use values also differ with crop management and genotype. Efforts to determine water
use of crops have been linked to relating it to biomass production and ultimately crop yield.
Notably, these efforts have not focussed much on relating crop biomass and yield to the provision
of nutrition for improved human health. They have assumed that more biomass and yield translate
to more nutrition.
2.3.2 Improving Crop Water Productivity There is a need to improve WP under rainfed production (Ali and Talukder, 2008). This will benefit
the majority of the sub-Saharan African population (>70%) that relies on rainfed agriculture as the
primary source of livelihood (Livingston et al., 2011). Despite the limitations in resources suffered
by farmers across SSA, there is high confidence that productivity levels can be improved (Nin-
Pratt et al., 2011). Currently, yields in the USA and Europe are approximately 200-300% higher
than yields achieved in SSA (AGRA, 2013). The huge yield gap is partly due to poor agronomic
practices and limited use of improved crop varieties in SSA. The USA and Europe also have higher
water productivity (~2 kg·m-3) compared to SSA (~0.2 kg·m-3). The disparity between these yield
and water productivity values creates an opportunity for interventions to narrow the gap. The
approaches taken so far have included adopting better agronomic practices, promoting use of
improved varieties and improved water productivity. These strategies are not linked to increasing
production of nutrient dense crops. Strategies to improve yield and water productivity should also
consider increasing production of several nutrient dense crops in order to address malnutrition.

14
There are possible crops that could be recommended in SSA where food and nutritional
insecurity are currently high (Wenhold et al., 2012). Among the vegetable crops, black nightshade
(Solanum nigrum) and cleome (Cleome gynandra) have low water use and high water use
efficiency (37-300 mm and 60 kg·ha-1.mm-1) (Wenhold et al., 2012). Among the legumes,
groundnuts (Arachis hypogea) yield the most (2-4.8 t·ha-1) but require more water (800 mm)
compared to cowpea (Vigna unguiculata), which yields 2.6-3.9 t·ha-1 and uses about 600 mm of
water during the growing season. The same difference was observed for maize (Zea maize) and
grain sorghum (Sorghum bicolor). Water use of grain sorghum was shown to be lower than that of
maize, but they shared the same range of WUE (6-10 kg·ha-1.mm-1) due to sorghum’s lower grain
yields (Wenhold et al., 2012). Most of the crops reported to 0have lower water requirements in the
different categories are alternative crops of African origin or African traditional varieties. They
thrive well under SSA conditions and with improved agronomic practices and improved varieties
there is potential that these crops could contribute to future food security, especially under rainfed
conditions (Mabhaudhi and Modi, 2013). While it is acknowledged that increasing yields and
reducing crop water use is of great importance, there is a need to link crop water productivity with
nutrition.
2.3.3 Relating Water Use to Dry Matter Production in Crops
While the focus has been on increasing dry matter production in crops, it is the amount of water
required that agricultural scientists are concerned about. This is because water is a finite resource
and its efficient use in crop production is of primary concern (Heydari, 2014). It also addresses the
“more crop per drop” slogan that is being promoted by agricultural and water practitioners. The
history of efficient use of water dates back to the 1950s (Sinclair et al., 2009). Then, since irrigation
was considered responsible for the highest water withdrawals, irrigation scientists attempted to
control and manage irrigation water by introducing an irrigation efficiency (IE) ratio defined as
water consumed by crops of an irrigated farm to the water diverted from the source (Nin-Pratt et
al., 2011):
𝐈𝐈𝐈𝐈 = water consumedwater diverted
Equation 2.2
where, IE is irrigation efficiency, water consumed is the volume of water consumed by crops
on an irrigated farm and water diverted is the volume of water diverted from the source for that
purpose (Sinclair et al., 1984; Perry, 2007; Heydari and Heydari, 2014). The IE ratio was from an
engineering perspective and facilitated better water allocation from water sources to farms. It did

15
not account for crop yield and water used to produce the crop, failing to describe the relationship
between yield output per unit of water.
The relationship between yield output per unit of water started being investigated before the
19th century as a measure of drought tolerance (Heydari, 2014). It was termed efficiency of
transpiration,
defined as dry matter produced per unit water transpired:
𝐸𝐸𝐸𝐸 = BT Equation 2.3
where, TE is efficiency of transpiration (g·kg-1 water), B is the total dry matter produced (g) and T
is mass of water transpired (kg) (Maximov, 1929). From a strictly engineering perspective, this
was more of an efficiency index as it produced a unitless ratio. In the late 1950s, the term employed
to describe the relationship between yield output per unit of water was water use efficiency (WUE)
(Viets, 1962). It was defined as mass of dry matter produced per unit volume of water
evapotranspired:
WUE = BET
Equation 2.4
where, WUE (g·mm-1) is water use efficiency, B is total dry matter produced (g) and ET is amount
of water evapotranspired (mm). Viets (1962) justified the term WUE as being more appropriate
since it emphasises water, whose efficient use was the subject of interest. Water use efficiency was
then widely used under field conditions to describe the ratio between yield/biomass per unit water
used. However, depending on scope and scale of studies, WUE was understood, interpreted and
calculated differently (Anyia and Herzog, 2004; Siahpoosh and Dehghanian, 2012; Candogan et
al., 2013; Li et al., 2013). Molden et al. (2010) introduced the term water productivity (WP) to
describe the ratio between yield output per unit of water. Productivity of water emerged during a
System-Wide Initiative on Water Management (SWIM), to develop standardised water accounting
procedures (Molden, 1997). Since then the terms WUE and WP have been used interchangeably,
creating much confusion for researchers, practitioners and policy makers.
2.3.4 Water Use Efficiency and Water Productivity While the terms WUE and WP seek to address the notion of “more crop per drop”, they are now
being used interchangeably and seemingly lack common definition. The efforts in distinguishing
16
WP and WUE sparked debate, with several papers being written on the subject, where irrigation
engineers, crop physiologists and water managers hold different perspectives. Molden et al. (2010)
proposed a common conceptual framework for communicating water productivity. They
highlighted the importance of water accounting at various scales of interest. WUE calculated as:
B/Ywater applied
Equation 2. 5
where B/Y is biomass (B) or yield (Y) (g) and water applied is water into the system as precipitation
and/or irrigation (mm) or:
B/YET
Equation 2.6
where B/Y is biomass or yield (g) and ET in mm (calculated as the residual of precipitation +
rainfall ± changes in soil water content) are efficiency ratios to describe the ability of crops to
utilize water made available to them (Van Halsema and Vincent, 2012).
The denominator in Equations (5) and (6) (water applied and ET) assume that water entering
the field through irrigation and precipitation is all taken up via crop evapotranspiration. These do
not account for other water movements in and out of the system such as runoff, deep percolation,
capillary rise and changes in subsurface flow. This may be attributed to the fact raised by Allen et
al. (1998) that water fluxes were challenging to quantify; hence, in many cases, authors assume
the effect of other water fluxes to be negligible. While this approach may be justified, it posed
difficulties in its application as a comparative measure of efficacy (Van Halsema and Vincent,
2012). This was reflected in the scoping study where WUE values derived from various studies
showed a wide range. A classic example was for carrots where an experiment conducted in South
Africa reported WUE values of 131-148 kg·ha-1.mm-1 and experiments conducted in Chile reported
WUE of 19.4-28.3 kg·ha-1.mm-1 for the same crop (Wenhold et al., 2012).
On the other hand, WP4 calculated as
WP = Ya ETa
Equation 2.7
where WP is water productivity (kg·m-3), Ya is the actual yield (kg) and ETa is the actual
evapotranspiration (mm·ha-1 or m3) or water consumed [48,49] (Zwart and Bastiaanssen, 2004;
4 In this project we adopted the use of Water Productivity (WP). See chapters 5, 6 and 7

17
Perry et al., 2009) is a true efficacy parameter of the crop production process. In this case, the
denominator only considers water consumed by the crop for biomass production (Van Halsema
and Vincent, 2012). When calculating WP only, the water consumed by the crop through
evaporation and transpiration is considered. Complex water flows in and out of the system are
accounted for in order to determine the actual volume of water consumed by the crop. One
advantage of WP is that unlike WUE, its values are more conservative, hence, comparable across
temporal and spatial scales (Zwart and Bastiaanssen, 2004; Steduto et al., 2007). However, these
arguments, while valid, tend to narrow the scope of WP.
Molden et al. (2010) simplified WP by defining it as the benefits derived from a unit of water,
thus, from a holistic point of view, WP can be used to analyse water management. More recently,
the High Level Panel of Experts (HLPE) on Food and Nutrition also weighed in on the subject in
their report on linking water to food and nutrition (HLPE, 2015). While concurring with Molden
et al. (2010), they reasoned that owing to its origins in agronomic and economic sciences, water
productivity was more an output-centred concept. In this way, the output could vary from crop
yield, monetary value, or nutritional value per unit of water (HLPE, 2015), making WP a more
useful parameter for water management. For the purposes of this review, the reasoning of the HLPE
is followed, because it provides a basis for linking water use in agriculture to nutrition.
2.3.5 Linking Water Productivity to Nutrition – Nutritional Water Productivity The progress made over the last few decades by agricultural scientists towards water saving
strategies is laudable (Edgerton, 2009; Wezel and Soldat, 2009; Wezel et al., 2011; Altieri et al.,
2012; Chauvin et al., 2012; Druilhe and Barreiro-Hurlé, 2012; Wenhold et al., 2012; HLPE, 2015).
Irrigation scientists have designed more efficient irrigation systems, breeders have identified and
bred high water use efficient crops and crop scientists have identified more water productive
cropping and field management systems. While these efforts towards improving water productivity
remain commendable, the question remains – “is this enough?”
Water scarcity is not the only global challenge that needs to be addressed. Between 30% and
40% of the world population is malnourished; they experience some form of undernutrition, are
overweight or obese, or have some type of micronutrient deficiency (Rosegrant et al., 2014). As
such, malnutrition is a problem that is currently affecting nearly every country in the world,
although it is more prevalent in SSA. Addressing malnutrition should focus on nutritional value
and quality of agricultural produce and diets, as most nutrients come from crops (Gupta and Gupta,
18
2014). Looking at the United Nations’ (United Nations et al., 2014) proposed SDG 2 (End hunger,
achieve food security and improved nutrition and ensure sustainable food production by 2030), it
is clear that while the “more crop per drop” approach addresses ending hunger and achieving food
security, it is silent on issues of nutrition. It is directly linked with increasing food availability and
access, while silent on utilisation, hence, ultimately failing to achieve sustainable food production.
Sustainable food production describes the capability of agriculture over time to provide sufficient
and nutritious food at all times in ways that are economically efficient, socially responsible, and
environmentally sound (UNCSD, 2011). The water productivity approach focusses on dry matter
production but does not account for nutritional content of the biomass produced. As such, efforts
towards increasing food and nutrition security will possibly improve physical and economic access
to sufficient food, from the production perspective. This will be in addition to efficient utilisation
of water resources by agriculture. However, the WP approach falls short of addressing aspects
related to provision of “nutritious food capable of meeting their dietary requirements and food
preferences for an active and healthy life”. Therefore, there is a need to link the concept of “more
crop per drop” with aspects of nutritional value. This could provide a holistic approach to linking
water, agriculture and nutrition with improving human health.
In this regard, achieving sustainable food production should also focus on dietary requirements
and their relation to scarce water resources (Renault and Wallender, 2000). This is especially true
for the rural poor, where the link between water and food is a crucial link for nutrition and
livelihood security (SIWI-IWMI, 2004). Within these communities, improved nutrition will lead
to improved health, development and productivity (Fanzo, 2014). This was proposed by the SIWI-
IWMI (2004) under the notion of “more nutrition per drop”. Renault and Wallender (2000) had
earlier identified this relationship and termed it nutritional water productivity (NWP).
By definition, NWP is nutritional content per volume of water consumed (Renault and Wallender,
2000). Hence,
𝑁𝑁𝑁𝑁𝑁𝑁 = � 𝑌𝑌𝑎𝑎𝐸𝐸𝐸𝐸𝑎𝑎� × 𝑁𝑁𝑁𝑁 Equation 2.8
where NWP is the nutritional water productivity (nutrition m-3 of water evapotranspired), Ya the
actual harvested yield (kg·ha-1), ETa the actual evapotranspiration (m3·ha-1), and NP is the
nutritional content per kg of product (nutrition unit·kg-1). A closer look at Equation (8) shows
Ya/ETa = WP as described in Equation (7).
19
When determining nutritional value, there is need to consider many other nutritional
components of food (Renault and Wallender, 2000). There is a dearth of empirical information
describing NWP for a range of crops. Where available, values of NWP are calculated using WP
and NP values obtained from separate studies. For example, in the scoping study by Wenhold et
al. (2012), published international benchmarks for energy, protein and fat values of selected crops
from Canada, Ghana and the USA together with WUE values obtained separately, were used to
calculate NWP (Table 2.1). Another concern is the values that Wenhold et al. (2012) refer to as
WP. Were they actually WP values or were they a combination of WP and WUE values, but for
the sake of consistency were all referred to as WP? As mentioned earlier WUE values are less
conservative and when used to determine NWP, can increase inaccuracy. In addition, nutritional
composition values were obtained from crops grown under different conditions and at different
water contents. This casts doubt on the conservativeness of NWP values. However, the importance
of the study was not in calculating NWP, but rather in highlighting the linkages between water,
agriculture and nutrition (Table 2.1; Wenhold et al., 2012; Nyathi et al., 2016).
Based on South African benchmarked values of macronutrient water productivities, among the
vegetable crops, sweet potatoes (Ipomoea batatas), carrots, pumpkin leaves (Cucurbita pepo) and
amaranth (Amaranthus sp.) showed high efficiency in terms of water consumed per energy and
carbohydrates produced (>20 MJ·m-3 and >300 g·m-3). Amaranth and pumpkin leaves were
efficient in terms of water consumed per protein produced (>500 g·m-3). Legumes generally did
not show a wide range in energy and protein water productivities, but soybeans, lentils (Lens
culinaris), groundnuts and dry beans (Phaseolus vulgaris) were the most efficient (>100 g·m-3)
with respect to protein water productivity. Among cereal crops, only maize NWP values were
estimated. Maize was not as efficient as sweet potatoes, carrots, pumpkin leaves and amaranth with
respect to energy and protein water productivity (17 MJ·m-3 and 132 g·m-3, respectively). Maize
was, however, an efficient synthesiser of carbohydrates (672 g·m-3). Wenhold et al. (2012) also
calculated NWP for minerals and vitamins for selected crops. It was apparent that vegetable crops
were the most efficient. Their results highlighted the potential of amaranth and pumpkin leaves
with respect to their high NWP. Coincidentally, these crops are currently underutilised.
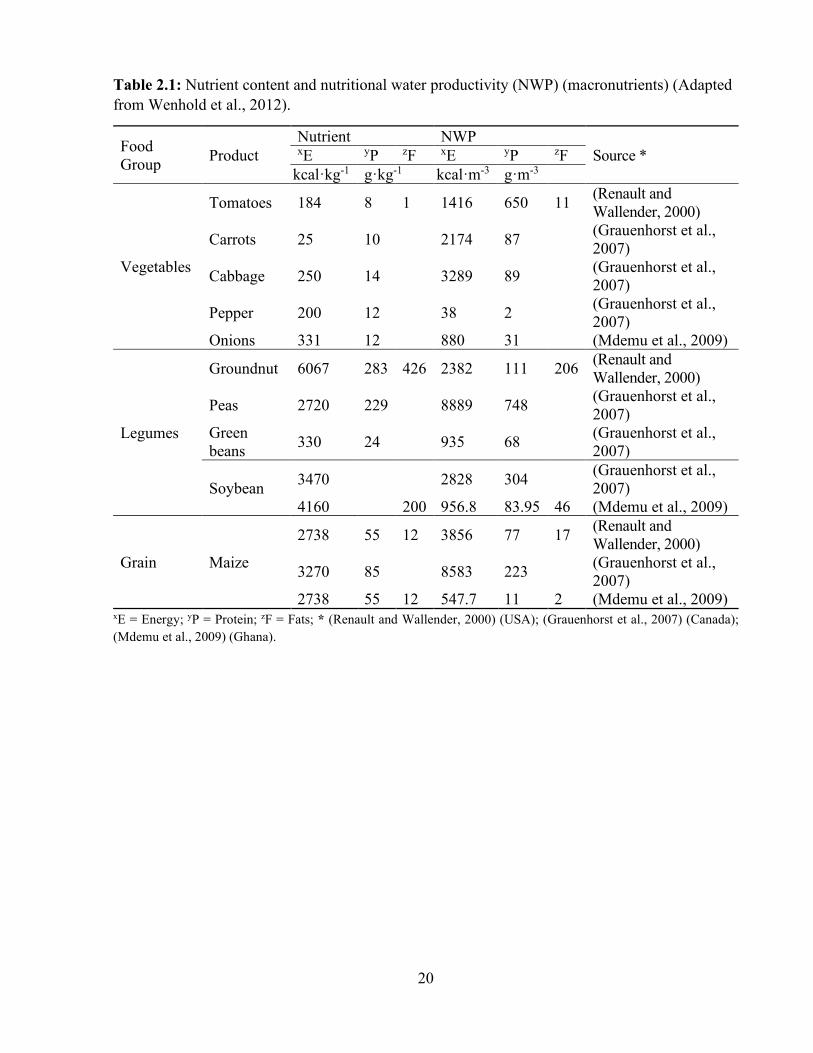
20
Table 2.1: Nutrient content and nutritional water productivity (NWP) (macronutrients) (Adapted from Wenhold et al., 2012).
Food Group Product
Nutrient NWP Source * xE yP zF xE yP zF
kcal·kg-1 g·kg-1 kcal·m-3 g·m-3
Vegetables
Tomatoes 184 8 1 1416 650 11 (Renault and Wallender, 2000)
Carrots 25 10 2174 87 (Grauenhorst et al., 2007)
Cabbage 250 14 3289 89 (Grauenhorst et al., 2007)
Pepper 200 12 38 2 (Grauenhorst et al., 2007)
Onions 331 12 880 31 (Mdemu et al., 2009)
Legumes
Groundnut 6067 283 426 2382 111 206 (Renault and Wallender, 2000)
Peas 2720 229 8889 748 (Grauenhorst et al., 2007)
Green beans 330 24 935 68 (Grauenhorst et al.,
2007)
Soybean 3470 2828 304 (Grauenhorst et al., 2007)
4160 200 956.8 83.95 46 (Mdemu et al., 2009)
Grain Maize
2738 55 12 3856 77 17 (Renault and Wallender, 2000)
3270 85 8583 223 (Grauenhorst et al., 2007)
2738 55 12 547.7 11 2 (Mdemu et al., 2009) xE = Energy; yP = Protein; zF = Fats; * (Renault and Wallender, 2000) (USA); (Grauenhorst et al., 2007) (Canada); (Mdemu et al., 2009) (Ghana).
21
Unlike WP, which only focuses on increasing food availability and access, NWP addresses
availability, access and utilisation components of food security. It also provides a linkage for water,
agriculture and nutrition, making NWP a more useful index for evaluating impacts of agriculture
on food and nutrition security. There is a need to promote the use of NWP in studies using
agriculture to address nutrition and health aspects (Nyathi et al., 2016). Concurrently, there is also
a need for transdisciplinary dialogue and studies to develop more such appropriate metrics that can
be useful to operationalise transdisciplinary efforts to link water, agriculture and nutrition.
2.4 Water-Food-Nutrition-Health Nexus
In developing countries, the goal of the water, agriculture, nutrition and health sectors is to improve
the standard of living of people, especially historically disadvantaged poor rural communities.
Despite this shared goal, agriculture has seldom been openly set out to address nutrition and health
challenges (IFPRI, 2011). This is because the linkages between agriculture and nutrition have not
always been explicit in planning. There is a need for a paradigm shift in terms of how we continue
to deal with food and nutrition insecurity. In the past decades, the “green revolution” made huge
strides in boosting food production in much of SSA (Welch, 2001); however, an unforeseen
problem emerged in the form of inadequate nutrition. While investments in agriculture increased
crop production, mainly for cereal crops, this was accompanied by declining crop diversification,
production and utilisation of traditional food crops (e.g. legumes and leafy vegetables) with high
nutrient density (Welch, 2001). Although unintended, this reduced dietary diversity and nutrition,
especially for poor rural households. The goals that drove the “green revolution” did not explicitly
include adequate nutrition as an output from agriculture. If the endpoint to agriculture is improved
human health anchored on good nutrition, it follows that the role of agriculture in providing
adequate nutrition must be explicit in planning. Shifting agriculture to focus on “food for nutrition”
would establish the crucial linkages between food and its role as the primary source of nutrition in
human diets. In addition, given the water-food nexus, such agriculture should also be water-smart
(Nicol et al., 2015).
The lack of explicit linkages between water, agriculture, nutrition and health is not isolated to
agricultural planning alone. A paradigm shift is also required with regards to how we deal with
nutritional challenges. In the past, the response from human nutritionists was rather medical in that
it viewed malnutrition as a “disease” that needed to be “treated” (Welch, 2001). Consequently,
intervention programs spearheaded the use of supplements or food fortification programs to “treat”
22
malnutrition (Welch, 2001). In cases where crops were short-listed to combat malnutrition, only a
few were singled out for their ability to deal with specific nutrient deficiencies (e.g. orange-fleshed
sweet potato to tackle VAD). Although these nutritional interventions have registered successes in
the short-term, they have failed in the long-term due to various social, policy and technical
problems which affected their sustainability (Beaton et al., 1994; Welch et al., 1997; Yip, 1997).
Most importantly, these approaches did not fully embrace the opportunities that exist along the
agricultural value chain to improve human nutrition and health. Including nutrition in the
agricultural value chain would ensure that nutritious foods are more available and affordable for
poor rural households; this would also improve utilisation wherein nutrition lies. The need to
consider the interlinked value of agriculture and nutrition has been recognised for many years. For
example, a 1992 global conference on nutrition concluded that “most nutrition programs directed
at eliminating malnutrition do not consider using agriculture as a primary weapon in their arsenal
against this public health crisis” (FAO and WHO, 1992). In many agrarian countries and rural
communities in particular, agriculture remains best placed to effectively deliver nutritional
outcomes and improve the health status of the rural poor. In order to achieve this, the linkages
between water, agriculture, nutrition and health must be made explicit in planning agriculture-
based interventions for improving nutrition and health of the rural poor.
While the linkages between water, agriculture, nutrition and health have always existed, it is
only recently that they have become more recognised. The agriculture-nutrition-health nexus which
highlights these linkages only came to prominence in 2011 (IFPRI, 2011). It called for coordinated
action in agriculture, nutrition and health planning and implementation. Proponents suggested that,
if fully adopted and implemented, it could have significant positive impacts for food and nutrition
security and development, as well as improving the health status of the rural poor and women
(Fanzo, 2014). Some progress has been made in this regard. Since 2011, several multilateral
agencies have started to realign their programs in line with the agriculture-nutrition-health nexus
(IFPRI, 2011). In Africa, the New Partnership for Africa’s Development (NEPAD) is currently
exploring opportunities to fully integrate the agriculture-nutrition-health nexus into Africa’s
agriculture roadmap – the Comprehensive Africa Agriculture Development Program (CAADP)
framework (IFPRI, 2011). While this process is on-going, some individual member states have also
started to apply the agriculture-nutrition-health nexus to national planning. Uganda launched a
Nutrition Action Plan (2011-2016), while Malawi has brought together policymakers and planners
in the agriculture, nutrition, and health sectors to coordinate and integrate their activities on the
23
basis of the agriculture-nutrition-health nexus (IFPRI, 2011). Although the agriculture-nutrition-
health nexus is now being recognised, there is currently scant empirical evidence on how these
linkages work (IFPRI, 2011; Ruel and Alderman, 2013; Webb and Kennedy, 2014)
There are, however, limitations to the agriculture-nutrition-health nexus in that the role of water
is not made explicit. Some might contend that water already features in all three, hence, there is no
need to explicitly mention it. However, it is also for that very reason that water should be included
in the nexus. This review has so far established the water-food nexus, highlighting that food
production is inextricably linked to water. In addition to the linkages between water and food
production, water also plays significant roles in nutrition and hygiene from a water and sanitation
perspective. The HLPE (2015) affirmed the crucial linkages between water and food and nutrition
security and highlighted the challenges of securing food and nutrition security under increasingly
water scarce conditions. Recognising this important linkage is more essential to securing food and
nutrition security in SSA, where water scarcity (physical and economic) is the major limitation to
crop production. This is especially true under rainfed agriculture which is practiced by more than
70% of SSA’s population. The need to include water alongside agriculture, nutrition and health has
previously been suggested by several authors (Field, 1987; Hawkes and Ruel, 2006). Furthermore,
across SSA, the impacts of climate change and variability on food production will mainly be felt
through water. As such, including water in the nexus would ensure that agriculture becomes
resilient through water-smart agricultural practices. This review therefore proposes that the
agriculture-nutrition-health nexus be renamed the water-food-nutrition-health nexus. Compared to
the former, the latter includes the water sector and focuses more on food for nutrition, thus making
the roles of water and food for nutrition explicit.
In order to operationalise the water-food-nutrition-health nexus, there is a need for research on
the nutritional and health impacts of water use for food production. To achieve this, more nutrition-
relevant data need to be generated and collected from agricultural experiments, while nutritional
and health indicators should be included in evaluations of agricultural programs (IFPRI, 2011).
There is also need to develop common indices that can be used to measure the health outcomes of
agricultural interventions. In this regard, the use of NWP, if linked to health indicators, could prove
instrumental in operationalising the water-food-nutrition-health nexus. The objective of improving
the well-being of poor communities requires a transdisciplinary approach that addresses all aspects
of improving the quality of life (Schultz, 1979; Backeberg et al., 2010). Focus on agriculture alone
tends to overate the value of land (Schultz, 1979) at the expense of water, nutrition and health.

24
They all require equal attention in order to transform the quality of life among poor communities.
In this regard, adopting the water-food-nutrition-health nexus for planning rural development and
food and nutrition security programmes, could prove beneficial to SSA.
2.5 Food for Nutrition
While there has been much effort towards combating food and nutrition insecurity, the balance has
been tilted more in favour of food production than nutrition. The concept of “food and nutrition
security” in itself may have unintentionally led to the two being treated as separate, with more
focus on food production. The fact that agriculture underpins rural livelihoods and is inextricably
linked to rural development explains why, over the past decades, large investments have been made
in agriculture. In addition, such agricultural production is assessed mostly by metrics of crop yield,
economic output (IAASTD, 2009) and resource use efficiency/productivity, which do not address
the nutritional value associated with the crop yield (Remans et al., 2011). The evolution of the
concept of NWP and the limited literature on its application speaks volumes about the limitations
of current agricultural interventions to deliver nutrition outcomes. The IAASTD (2009) highlighted
the need for a holistic and multi-functional approach as well as a need for an agro-ecological
approach to farming. This, they argued, could assist in transforming agriculture to deliver on issues
of food, nutrition and sustainability.
Although there are now growing calls for agriculture to deliver nutritional goals (Haddad,
2013), there has been a lag in integrating issues of nutrition into planning and evaluation of
agricultural and food systems and policies (Remans et al., 2011). In order to achieve such
integration, there is a need for a paradigm shift with regards to food and nutrition security. Part of
this requires revising the notion of “food and nutrition” and focussing rather on “food for nutrition”.
The latter recognises the crucial link that food, in the context of this review derived from crop
production, is the primary source of nutrition in human diets. A draft definition of nutrition security
states that “nutrition security exists when all people at all times consume food of sufficient quantity
and quality in terms of variety, diversity, nutrient content and safety to meet their dietary needs and
food preferences for an active and healthy life style, coupled with a sanitary environment, adequate
health, education and care” (FAO/AGN, 2013). This involves obtaining, utilising and absorbing
nutrients that are required for normal growth, health and social well-being (Fanzo, 2014). Although
there is now emerging interest in addressing nutrition, malnutrition still remains a significant

25
development challenge and a multidimensional problem in infants, young children, and women
(Fanzo, 2014).
Malnutrition continues to cause poor health, morbidity and mortality from childhood through
to adulthood, affecting social and economic development among the rural poor. About 38% of
children in less developed countries suffer stunting due to undernutrition; this could negatively
impact on cognitive development during early childhood development (Save the Children et al.,
2013). Burchi et al. (2011) emphasised the vital role of nutrition for growth, cognitive development
and health, suggesting that there could be significant consequences for children who experienced
undernutrition in the first 1000 days of their lives. They were likely to perform poorly in math and
science subjects in the future (Save the Children et al., 2013); this in itself would help to perpetuate
poverty in poor rural communities. In this regard, it can be hypothesised that breaking the cycle of
malnutrition during early childhood development could go some way towards breaking the cycle
of intergenerational poverty among the rural poor. This is especially true for SSA, where social
inequality is still rife and continues to perpetuate poverty among the rural poor (Tsegay et al.,
2014). Poor rural farmers lack the privilege of having access to diverse food sources and choices
(Fanzo, 2014). Where food sources are available and accessible, it is their utilisation that limits
poor rural communities from deriving the nutritional benefits therein.
Nutrition is inextricably linked to utilisation. Nordhagen (2013) suggested that in order to
achieve food and nutrition security, policy makers must look at agriculture as not merely the
provider of food, but rather as the provider of nutrition in human diets – food for nutrition. This is
because nutrition is seldom about adequate food supply/availability, but rather impeded utilisation,
which is often associated with poverty and lack of education (Nordhagen, 2013). As such, efforts
aimed at addressing nutrition insecurity should not be merely technological interventions aimed at
boosting productivity, but should also consider social anthropogenic issues that influence food
utilisation such as sources of food and reasons for the food choices made by poor rural households.
2.5.1 Food Intake, Sources of Food in Poor Rural Households As previously highlighted, much of the effort directed towards achieving food and nutrition
security has been crop-centric and biased towards increasing food availability and accessibility,
with less attention paid to nutrition. Food availability and access are some of the factors linked to
food and nutrition security of rural households (Wenhold et al., 2012) However, knowledge of food
sources consumed by poor rural households is essential for developing appropriate food-based
26
interventions for addressing malnutrition (under- and over-nutrition) in rural households. While it
may be difficult to clearly define a food basket of food consumed by rural households, it is clear
that diets among this group are mainly starch (cereals and root and tuber crops) based (Wenhold et
al., 2012). Other food groups such as legumes, fruit and vegetables do not feature prominently in
diets of poor rural households. This apparent lack of dietary diversity could explain some of the
underlying reasons for undernutrition amongst the rural poor. Agriculture, because of its potential
to produce nutrient-dense foods, can play an important role in addressing dietary diversity (Fanzo,
2014). Diverse cropping systems and inclusion of alternative crops in food for nutrition
interventions could address dietary diversity and contribute to nutritional goals. Multicrop systems
and alternative crops have historically played a crucial role in the diets of rural people (Modi and
Mabhaudhi, 2013a; Mabhaudhi and Modi, 2014). Bezner et al. (2011) reported that intercropping
of maize and legumes in Malawi for improved dietary diversity resulted in improved levels of
nutrition in children under five years.
In this instance, agricultural interventions were also coupled with nutrition education at the
community level. Alternative crops which are mostly affordable and often free, if sourced from the
wild, are often nutrient-dense. However, a lack of education on their nutritional value and stigma
remain an obstacle to improving their utilisation amongst poor rural households. Therefore, in
addition to addressing scientific knowledge gaps on food for nutrition, there are social barriers that
need to be addressed to ensure uptake and utilisation by poor rural communities. This emphasises
the need to understand reasons for food choices in poor rural households.
2.5.2 Reasons for Food Choices in Poor Rural Households Reasons for food choices reflect the various causes that, either separately or synergistically,
influence why people consume certain foods and not others. Reasons for food choices are more
than a simple matter of nutritional value (Sun, 2008). Each time people choose food, they bring
their past food choices, events, experiences, thoughts and feelings as well as historical context to
the fore (Devine, 2005). This salient observation is important in highlighting why people eat what
they eat as a complexity. In addition, reasons for food choices exist at various levels and are
influenced by a range of factors such as demographics, health awareness (Sun, 2008), availability,
affordability, taste and cultural preferences, among others. Whilst availability and affordability can
be dealt with from a technical viewpoint, it is the other variables and often dynamic reasons that
present challenges. While noting the shortfalls of previous research in interrelating the variables
27
influencing food choices (Sun, 2008) suggested that research needed to be dynamic and to
transcend the boundaries of nutritional value. This would allow researchers to grasp the dynamic
nature of the reasons behind food choices. Wenhold et al. (2012) emphasised that understanding
the reasons for food choices was important as they were directly linked to the food and nutrition
security of rural households. This also included gaining knowledge of why rural households used
certain foods more frequently than others (Wenhold et al., 2012); this would be essential for
coordinating an effective food for nutrition programme. (Renault and Wallender, 2000) suggested
that while macro-, meso- and micro-level factors influenced reasons for food choices, it was the
latter that required more in-depth research and case studies in order to make meaningful
breakthroughs.
The different issues regarding food for nutrition, food sources and reasons for food choices
present a case for a multidisciplinary approach to address nutrition security in poor rural
households. Agriculture has a role to play through providing food for nutrition. It also has a role to
play through increasing dietary diversity and giving people more choices. In addition, agriculture
can improve household income and allow people to afford other nutritious foods. Nutrition
education is still needed to allow people to exercise their choices and to utilise the food from
agriculture in order to derive the nutrition required for a healthy lifestyle.
2.5.3 Alternative crops: Potential to Contribute to Food and Nutrition Security As we continue to re-think strategy, focus should also be on diversifying the food basket in order
to create dietary diversity in poor rural households. Diets of poor rural households are essentially
starch-based and lack protein, vitamins and minerals. The reasons for this include limited food
sources and choices (Wenhold et al., 2012; Stein et al., 2014) mainly associated with poverty.
Fanzo (2014) stated that dietary diversity was an integral component of a quality diet; both diversity
and quality are key to achieving food and nutritional goals. In addition, consumption of a
diversified diet ensures adequate provision of essential nutrients and health enhancers (Wenhold et
al., 2012; Stein et al., 2014). However, access to a diversified diet is often hampered by a lack of
understanding on its effects on human health and affordability.
While the latter is partly true, this thinking fails to recognise the rich tapestry of agro-
biodiversity that exists within rural landscapes, which could be a source of sustainable dietary
diversity for poor rural households at little to no cost. In addition, a lack of skills and understanding
also hampers the effective utilization of such agro-biodiversity (Leakey et al., 2003; Tchoundjeu
28
et al., 2006). This concurs with suggestions by Schultz (1979) and Backeberg et al. (2010) that
there was a need for human capacity development to support and sustain agricultural interventions.
Such capacity development could be in the form of participatory approaches as exemplified by the
work reported by Tchoundjeu et al. (2006) on domestication of indigenous fruit trees. The findings
of Wenhold et al. (2012) (Table 1) also justify the need to conduct more research on alternative
crops for the purposes of contributing to food and nutrition security. Neglected and alternative
crops species (NUCS) have the potential to improve access to and availability of nutritious food
for poor rural households. There currently exists no common definition of NUCS with variations
in classification due to geography (underutilized/neglected where?), social (underutilized by
whom?) and economic (to what extent) concerns. While acknowledging these shortcomings,
Chivenge et al. (2015) defined NUCS as “crops that have not been previously classified as major
crops, have previously been under-researched, currently occupy low levels of utilisation and are
mainly confined to smallholder farming areas”. Such crops may have the potential to contribute to
food and nutrition security of poor rural households and may be suited to the marginal production
environments that typify most rural areas in SSA (Chivenge et al., 2015). However, NUCS
currently occupy low levels of utilization. Limitations in utilisation have been linked to limited
research addressing basic aspects of their production, water use, nutritional value and seed systems
(Modi and Mabhaudhi, 2013b). There is a gap in agronomic information on the range of crops that
could be utilised as food security crops (Wenhold et al., 2012). This highlights the need for more
research targeted at NUCS with a view to tapping into their potential to contribute to food and
nutrition security in rural areas.
Indigenous fruit trees also form an important aspect of agro-biodiversity that is currently
underutilised within SSA. A recent review by Chivenge et al. (2015) noted that indigenous fruit
which were often consumed by poor rural communities, were highly nutritious. Indigenous fruit
were reported to be rich sources of sugars, essential vitamins, minerals and essential oils (Saka and
Msonthi, 1994; Kwesiga et al., 2000). However, their potential to contribute to food for nutrition
and health has not been fully explored. Unlocking the value of NUCS requires multidisciplinary
initiatives which can recognize the diverse roles that NUCS often play within the communities that
have preserved them. Reports of work done in Cameroon to promote utilization of indigenous fruit
provides some evidence of the transformation that can be achieved through multifunctional
approaches (Leakey et al., 2009; Leakey, 2012). Inclusion of NUCS will broaden the food basket,
hence influencing food choices, especially in rural communities where access to nutritious food is

29
a major limitation. Within these communities, inclusion of NUCS would not only increase dietary
diversity, but would also increase dietary quality, hence contributing to improved human nutrition
and health.
2.5.4 Competing Needs in Poor Rural Household When considering food for nutrition, reasons for food choices and crop diversification in poor rural
households and competing economic interests within poor rural households, also require
consideration. For example, farmers may grow a nutrient-dense crop and opt to sell the crop as
opposed to consuming it within the household. Other related competing interests in poor rural
households include the need for energy production on the farm (manure for cooking, fuel wood
needs, or commercial biofuel crops), which have an impact on competing water uses and on soil
quality, all of which are interlinked This adds to the general complexity of understanding reasons
for food choices in poor rural households and partly explains why technical interventions, alone,
may not be successful. The occurrence of such competing needs also emphasises the need for
multidisciplinary approaches that not only address biophysical constraints, but also socio-economic
constraints.
2.6 Human Health and Well-Being
According to the World Health Organisation (1946), “health is a state of complete physical, mental
and social well-being and not merely the absence of disease or infirmity”; this definition has not
been amended since 1948. The Global Food Report emphasised good nutrition as being the basis
of human health. This underscored the importance of nutrition to human health and well-being. In
addition to nutrition, several other factors are known to influence human health and these include
background, culture/lifestyle, and economic and social conditions. Interestingly, these factors can
be linked to factors that influence reasons for food choices and nutrition, thus reaffirming the
critical role of nutrition to human health. It is for this reason that we are interested in nutrition
(Stein, 2014), hence, human health and well-being are the primary end goal for food for nutrition.
Nutrition has always been a key development indicator. The consequences of inadequate
nutrition include poor human health, well-being, productivity, livelihood and consequently a
stagnation in national development (Welch, 2001). For developing regions such as SSA, this can
have huge negative impacts on economic development and poverty alleviation efforts. This justifies
the need for governments within SSA to invest in food for nutrition as a strategy for improving
human health and well-being among the rural poor. The economic justifications for investments in
30
nutrition have long been established. Behrman (1993) reviewed the economic justification for
developing countries to invest in nutrition and found that improved nutrition resulted in improved
health, labour productivity and general upliftment of the poor. Investments in food for nutrition
which targeted the rural poor were a cost effective use of national resources and led to reduced
social and financial losses associated with poor health resulting from malnutrition (Behrman,
1993).
The consequences of malnutrition are even more severe on the health and well-being of
vulnerable groups, which include children under five years and breastfeeding women. For children
under five years, inadequate nutrition is a major contributing factor to child mortality;
undernutrition accounts for more than 33% of child mortality in low-income countries (Horton and
Hoddinot, 2014). Adequate nutrition is essential for cognitive development during early childhood
development, and hence educational success, both of which are important determinants of labour
productivity and economic growth (Save the Children et al., 2013; Horton and Hoddinot, 2014)
Globally, an estimated 162 million children remain moderately or severely stunted, an indication
of chronic undernutrition (Black et al., 2013; Unicef, 2013), with most of these children from the
developing world.
In pregnant women, malnutrition has been associated with low birth weight and varying levels
of mental retardation in offspring. Intelligent quotients (IQs) of infants with low birth weight have
been reported to be about five points lower than for normal weight infants (Welch, 2001); thus,
setting in motion an unfortunate cycle which can perpetuate poverty (Seery and Caistor Arendar,
2014). The effects of malnutrition on pregnant and breastfeeding women as well as on infants and
children, further justify the need for robust food for nutrition programmes targeted at poor rural
communities. Lack of adequate nutrition and the consequences thereof on human health can
perpetuate poverty, making it difficult for generations of poor rural people to ever escape poverty.
In order to achieve food for nutrition programmes that can effectively improve human health and
well-being among the rural poor, there is a need to fully recognise the various linkages that
contribute to this end goal. In this regard, realising the crucial linkages between water, agriculture,
nutrition and human health is essential for achieving the endpoint of a healthy nation. Hawkes and
Ruel (2006) described these linkages as mutual in that while water and agriculture affected nutrition
and health, the latter two also affected agriculture. However, the linkages between water,
agriculture, nutrition and health are still not well-understood. This may be because these sectors
have traditionally used, and still continue to use, distinct indices to assess their impacts on human
31
well-being. The use of an index such as NWP offers the possibility of linking water to agriculture
and nutrition via the food for nutrition paradigm.
2.7 Conclusions
While progress has been made towards improving food security through improvements in crop
production, the same cannot be said of nutrition security. Little attention has been paid to nutrition
goals and linking them to agriculture programmes as well as the endpoint of improved human
health and well-being in poor rural households. Consequently, poor rural households still suffer
unacceptable levels of malnutrition despite the various interventions that have been made to
improve their status. Inadequate nutrition in poor rural communities is partly associated with a lack
of dietary diversity and limited access to and non-availability of nutrient-dense foods. Improving
the utilisation of several NUCS could increase dietary diversity and increase access to nutrient-
dense foods in poor rural communities. The role of indigenous fruit trees, which also qualify as
NUCS, in agroecology and income generation initiatives should be considered. Malnutrition, if left
unchecked, could perpetuate poverty in poor rural communities. Programmes aimed at addressing
food and nutrition security for improved human health have had limited success. This is because
of failure to clearly recognise the crucial linkages between water, agriculture, nutrition and health
outcomes. There is a need for a paradigm shift which includes adopting the water-food-nutrition-
health nexus approach. This would ensure that nutrition is made an explicit output in agricultural
interventions. Developing appropriate metrics, such as NWP, which can be used to evaluate water,
crop productivity, and nutrition and health impacts would also go some way in achieving this. In
order to operationalise the water-food-nutrition-health nexus, there is a need for interdisciplinary
studies that can address the knowledge gap which is critical for formulating policy.
References
ALLIANCE FOR A GREEN REVOLUTION IN AFIRCA (AGRA) (2013) Agra Africa Agriculture Status
Report AGRA: Westlands Kenya.
Ali MHH and Talukder MSU (2008) Increasing water productivity in crop production – A synthesis Agric
Water Manag 95 1201-1213.

32
ALLEN R, PEREIRA LS, RAES D and SMITH M (1998) Crop evapotranspiration: Guidelines for
computing crop requirements Irrigation and Drainage Paper No 56 FAO Rome Italy D05109.
ALLEN RG (1998) FAO Irrigation and Drainage Paper Crop by (FW Resources, Ed.) Irrig Drain 300(56):
300 Available at http://www.kimberly.uidaho.edu/water/fao56/fao56.pdf.
ALTIERI MA, FUNES-MONZOTE FR and PETERSEN P (2012) Agroecologically efficient agricultural
systems for smallholder farmers: contributions to food sovereignty Agron Sustain Dev 32 1-13.
ANYIA A and HERZOG H (2004) Water-use efficiency leaf area and leaf gas exchange of cowpeas under
mid-season drought Eur J Agron 20(4) 327-339.
http://www.sciencedirect.com/science/article/pii/S1161030103000388. (verified 24 May 2015).
ARIMOND M and RUEL M (2004) Dietary diversity is associated with child nutritional status: Evidence
from 11 demographic and health surveys. J Nutr 134 2579-2585.
BACKEBERG GR, BEHL RK, MERBACH W, MELICZEK H and KAETSCH C (2010) Improving rural
livelihoods with rainwater harvesting and conservation on communal croplands in South Africa:
Opportunities and obstacles In Crop Science and Landuse for Food and Bioenergy Agrobios: Jodhpur India
pp 299-317.
BALA RAVI S, HOESCHLE-ZELEDON I, SWAMINATHAN MS and FRISON E (2006) Hunger and
poverty: the role of biodiversity. Report of an International Consultation on the Role of Biodiversity in
Achieving the UN Millennium Development Goal of Freedom from Hunger and Poverty, Chennai, India,
April 18-19, 2005 Available online: http://wwwbioversityinternationalorg/e-
library/publications/detail/hunger-and-poverty-the-role-of-biodiversity/ (accessed on 31 December 2015).
BEATON GH, MARTORELL R, ARONSON KA, EDMONSTON B, MCCABE G, ROSS AC and
HARVEY B (1994) Vitamin A supplementation and child morbidity and mortality in developing countries
Food Nutr Bull Nations Univ 15 282-289.
BEHRMAN JR (1993) The economic rationale for investing in nutrition in developing countries World Dev
21 1749-1771.
BEZNER KERR R, BERTI PR and SHUMBA L (2011) Effects of a participatory agriculture and nutrition
education project on child growth in northern Malawi Public Health Nutr 14 1466-1472.
BLACK RE, VICTORA CG, WALKER SP, BHUTTA ZA, CHRISTIAN P, DE ONIS M, EZZATI M,
GRANTHAM-MCGREGOR S, KATZ J and MARTORELL R (2013) Maternal and child undernutrition
and overweight in low-income and middle-income countries Lancet 382 427-451.
33
BLUM A (2009) Effective use of water (EUW) and not water-use efficiency (WUE) is the target of crop
yield improvement under drought stress F Crop Res 112 119-123.
BURCHI F, FANZO J and FRISON E (2011) The role of food and nutrition system approaches in tackling
hidden hunger Int J Environ Res Public Health 8 358-373.
CANDOGAN BN SINCIK M BUYUKCANGAZ H DEMIRTAS C GOKSOY AT and YAZGAN S (2013)
Yield quality and crop water stress index relationships for deficit-irrigated soybean [Glycine max (L) Merr]
in sub-humid climatic conditions Agric Water Manag 118 113-121.
CHAUVIN ND, MULANGU F and PORTO G (2012) Food production and consumption trends in sub-
Saharan Africa: Prospects for the transformation of the agricultural sector UNDP Regional Bureau for
Africa New York NY USA
CHIVENGE P, MABHAUDHI T, MODI AT and MAFONGOYA P (2015) The Potential Role of Neglected
and Underutilised Crop Species as Future Crops under Water Scarce Conditions in Sub-Saharan Africa Int
J Environ Res Public Health 12 5685-5711.
COMPREHENSIVE ASSESSMENT OF WATER MANAGEMENT IN AGRICULTURE (CA). 2007.
Water for food Water for life. Earthscan, London and International Water Management Institute, Colombo.
DAVIES WJ, ZHANG J, YANG J and DODD IC (2011) Novel crop science to improve yield and resource
use efficiency in water-limited agriculture J Agric Sci 149 123-131
DEVINE CMA (2005) life course perspective: Understanding food choices in time social location and
history J Nutr Educ Behav 37 121-128.
DRUILHE Z and BARREIRO-HURLÉ J (2012) Fertilizer subsidies in sub-Saharan Africa ESA Working
paper No 12-04: Rome FAO
EDGERTON MD (2009) Increasing crop productivity to meet global needs for feed food and fuel Plant
Physiol 149 7-13
FANZO J (2014) Strengthening the engagement of food and health systems to improve nutrition security:
Synthesis and overview of approaches to address malnutrition Glob Food Sec 3 183-192.
FAO and WHO. 1992. International Conference on Nutrition: World Declaration and Plant of Action. p.
142. In FAO and WHO (ed.), International Conference on Nutrition. Food and Agricultural Organisation
and World Health Organisation, Rome.
34
FAO IFAD WFP and WFP (2013) The State of Food Insecurity in the World 2013 The multiple dimensions
of food security FAO Rome.
FAO IFAD WFP and WFP (2014) The State of Food Insecurity in the World 2014 strengthening the
enabling environment for food security and nutrition FAO Rome Italy
FAO, IFAD, UNICEF, WFP, and WHO (2018) The State of Food Security and Nutrition in the World 2018:
Building climate resilience for food security and nutrition. Rome, Italy.
FAO/AGN (2013) Coming to Terms with Terminology. Rome, Italy.
FIELD JO (1987) Multi-sectoral nutrition planning: a post-mortem Food Policy 12 15-28
FOOD AND AGRICULTURE ORGANISATION (FAO) (1996) The Rome declaration on world food
security Popul Dev Rev 22 14-17.
FOOD AND AGRICULTURE ORGANISATION OF THE UNITED NATIONS (FAO) (2003) More Crop
per Drop Available online: https://wwwfaoorg/english/newsroom/focus/2003/waterhtm (accessed on 30
October 2015)
GRAUENHORST A and BROOKS DB (2007) Friends of the Earth (Canada) Saving Water by Changing
Our Diets Friends of the Earth: Ottawa ON Canada
GUPTA UC and GUPTA SC (2014) Sources and deficiency diseases of mineral nutrients in human health
and nutrition: A review Pedosphere 24 13-38
HADDAD L (2013) From Nutrition Plus to Nutrition Driven: How to realize the elusive potential of
agriculture for nutrition? Food Nutr Bull 34 39-44
HAWKES C and RUEL MT (2006) Overview: Understanding the Links between Agriculture and Health
International Food Policy Research Institute: Washington DC USA
HEYDARI M and HEYDARI M (2014) Evaluation of pan coefficient equations for estimating reference
crop evapotranspiration in the arid region Arch Agron Soil Sci 60(5), 715-731.
HEYDARI N (2014) Water productivity in agriculture: challenges in concepts, terms and values. Irrig.
Drain 63 22-28 Available at http://onlinelibrary.wiley.com/doi/10.1002/ird.1816/full (verified 27 March
2015).
35
HLPE (HIGH LEVEL PANEL of EXPERTS) (2015) HLPE Report #9 – Water for food security and
nutrition. A Report by the High Level Panel of Experts on Food Security and Nutrition of the Committee
on World Food Security.
HORTON S and HODDINOT J (2014) Food Security and Nutrition Perspective Paper: Benefits and Costs
of the Food and Nutrition Targets for the Post – 2015 Development Agenda Copenhagen Consensus Center:
Copenhagen Denmark
IFPRI (INTERNATIONAL FOOD POLICY RESEARCH INSTITUTE) (2011) Global food policy report.
Washington, D. C.
INTERGOVERNMENTAL PANEL ON CLIMATE CHANGE (IPCC) (2014) Climate change 2014:
Impacts, adaptation, and vulnerability. Part A: global and sectoral aspects. Contribution of Working Group
II to the Fifth Assessment Report of the IPCC. Cambridge and New York: Cambridge University Press.
INTERNATIONAL ASSESSMENT OF AGRICULTURAL KNOWLEDGE SCIENCE AND
TECHNOLOCY FOR DEVELOPMENT (IAASTD) (2009) Agriculture at a Crossroads Island Press:
(McIntyre BD, Herren H, Wakhungu J, and RT Watson, Eds.). Internation. Island press, Washington, D. C.
JENSEN ME (2007) Beyond irrigation efficiency Irrig Sci 25 233-245
KENNEDY GL, PEDRO MR, SEGHIERI C, NANTEL G and BROUWER I (2007) Dietary diversity score
is a useful indicator of micronutrient intake in non-breast-feeding Filipino children J Nutr 137 472-477
KWESIGA F, AKINNIFESHIL F, RAMADHANI T, KADZERE I, SAKAF J, SHUMBA EM, LUSEPANI
E and HANGULA R (2000) Domestication of Indigenous Fruit Trees of the Miombo in Southern Africa
Available online: http://agrisfaoorg/agris-search/searchdo?recordID=ZW2005100356 (accessed on 31
December 2015)
LEAKEY RRB (2012) Living with the trees of life: towards the transformation of tropical agriculture CABI.
LEAKEY RRB, NEVENIMO T, MOXON J, PAUKU R, TATE H, PAGE T and CORNELIUS J (2009)
Domestication and improvement of tropical crops for multi-functional farming systems In Proceeding of
the 14th Australasian Plant Breeding Conference and 11th SABRAO Congress Cairns Australia 10-13
August 2009 pp 1-23
LEAKEY RRB, SCHRECKENBERG K and TCHOUNDJEU Z (2003) The participatory domestication of
West African indigenous fruits Int For Rev 5 338-347.
36
LI D, LIU H, QIAO Y, WANG Y, CAI Z, DONG B, SHI C, LIU Y, LI X and LIU M (2013) Effects of
elevated CO2 on the growth seed yield and water use efficiency of soybean (Glycine max (L) Merr) under
drought stress Agric Water Manag 129 105-112
LIVINGSTON G, SCHONBERGER S and SARA D (2011) Sub-Saharan Africa: The state of smallholders
in agriculture In New Directions for Smallholder Agriculture Via Paolo Di Dono Rome Italy.
MABHAUDHI T and MODI AT (2013) Growth phenological and yield responses of a bambara groundnut
(Vigna subterranea (L) Verdc) landrace to imposed water stress under field conditions South African J Plant
Soil 30 69-79.
MABHAUDHI T and MODI AT (2014) Intercropping Taro and Bambara Groundnut. p. 275-290. In
Lichtfouse, E. (ed.), Sustainable Agriculture Reviews. Springer International Publishing, Cham.
MAXIMOV N (1929) The plant in relation to water: A Study of the Physiological Basis of Drought
Resistance George Allen and Unwin Ltd: London UK
MDEMU MV, RODGERS C, VLEK PLG and BORGADI JJ (2009) Water productivity (WP) in reservoir
irrigated schemes in the upper east region (UER) of Ghana Phys Chem Earth Parts A/B/C 34 324-328
MODI AT and MABHAUDHI T (2013) Water use and drought tolerance of selected traditional and
indigenous crops Final Report of Water Research Commission Project K5/1771//4 WRC Report No
1771/1/13 ISBN 978-1-4312-0434-2 Water Research Commission Pretoria South Africa
MODI AT and MABHAUDHI T (2014) Intercropping Taro and Bambara Groundnut In Lichtfouse E Ed
Sustainable Agriculture Reviews Springer International Publishing: Cham Vietnam 13 275-290
MOLDEN D (1997) Accounting for Water Use and Productivity International Water Management Institute
(IWMI): Battaramulla Sri Lanka
MOLDEN D, MOLDEN D, MURRAY-RUST H, MURRAY-RUST H, SAKTHIVADIVEL R,
SAKTHIVADIVEL R, MAKIN I and MAKIN I (2003) A Water-productivity Framework for
Understanding and Action Water 1-18
MOLDEN D, OWEIS T, STEDUTO P, BINDRABAN P, HANJRA MA and KIJNE J (2010) Improving
agricultural water productivity: Between optimism and caution Agric Water Manag 97 528-535
MOURSI MM, ARIMOND M, DEWEY KG, TRÈCHE S, RUEL MT and DELPEUCH F (2008) Dietary
diversity is a good predictor of the micronutrient density of the diet of 6-to 23-month-old children in
Madagascar J Nutr 138 2448-2453.
37
NYATHI MK, ANNANDALE JG, BELETSEC YG, BEUKESD DJ, DU PLOOYA CP, PRETORIUSE
B, VAN HALSEMAF GE (2016) Nutritional water productivity of traditional vegetable crops. Water
Research Commission (WRC) Report No. 2171/1/16, Pretoria, South Africa
NICOL A, LANGAN S, VICTOR M and GONSALVES J (2015) Water-Smart Agriculture in East Africa
International Water Management Institute (IWMI): Colombo Sri Lanka CGIAR Research Program on
Water Land and Ecosystems (WLE): Kampala Uganda Global Water Initiative East Africa (GWI EA):
Kampala Uganda
NIN-PRATT A, JOHNSON M, MAGALHAES E, YOU L, DIAO X and CHAMBERLIN J (2011) Yield
gaps and potential agricultural growth in West and Central Africa Intl Food Policy Res Inst Vol 170
NORDHAGEN S (2013) The Complex Challenge of Malnutrition Available online:
https://wwwhuffingtonpostcouk/gates-cambridge-scholars/malnutrition-complex-
challenge_b_3441024html (accessed on 11 September 2013)
NYAKUDYA IW and STROOSNIJDER L (2014) Effect of rooting depth plant density and planting date
on maize (Zea mays L) yield and water use efficiency in semi-arid Zimbabwe: Modelling with AquaCrop
Agric Water Manag 146 280-296
PERRY C (2007) Efficient irrigation inefficient communication flawed recommendations Irrig Drain 56
367-378
PERRY C, STEDUTO P, ALLEN RG and BURT CM (2009) Increasing productivity in irrigated
agriculture: agronomic constraints and hydrological realities Agric Water Manag 96 1517-1524
RAH JH, AKHTER N, SEMBA RD, DE PEE S, BLOEM MW, CAMPBELL AA, MOENCH-PFANNER
R, SUN K, BADHAM J and KRAEMER K (2010) Low dietary diversity is a predictor of child stunting in
rural Bangladesh Eur J Clin Nutr 64 1393-1398.
REMANS R FLYNN DFB DECLERCK F DIRU W FANZO J GAYNOR K LAMBRECHT I MUDIOPE
J MUTUO PK and NKHOMA P (2011) Assessing nutritional diversity of cropping systems in African
villages (N Mock, Ed.). PLoS ONE 6 doi:101371/journalpone0021235
RENAULT D and WALLENDER WW (2000) Nutritional water productivity and diets Agric water Manag
45 275-296
RIJSBERMAN FR (2006) Water scarcity: Fact or fiction? Agric water Manag 80 5-22

38
ROSEGRANT MW, KOO J, CENACCHI N, RINGLER C, ROBERTSON R, FISHER M, COX C,
GARRETT K, PEREZ ND and SABBAGH P (2014) Food Security in a World of Natural Resource Scarcity
RUEL MT, ALDERMAN H and MATERNAL AND CHILD NUTRITION STUDY GROUP (2013)
Nutrition-sensitive interventions and programmes: how can they help to accelerate progress in improving
maternal and child nutrition? Lancet 382 536-551
SACHS J D (2012) From millennium development goals to sustainable development goals. Lancet 379
2206-2211
SAKA JDK and MSONTHI JD (1994) Nutritional value of edible fruits of indigenous wild trees in Malawi
For Ecol Manage 64 245-248
SAVE THE CHILDREN (2013) Food for Thought – Tackling Child Malnutrition to Unlock Potential and
Boost Prosperity Save the Children: London pp 1-34
SAVE THE CHILDREN, CROSBY L, JAYASINGHE D and MCNAIR D (2013) Food for Thought:
Tackling child malnutrition to unlock potential and boost prosperity. London Save Child: 1-34.
SAWADOGO PS, MARTIN-PRÉVEL Y, SAVY M, KAMELI Y, TRAISSAC P, TRAORÉ AS and
DELPEUCH F (2006) An infant and child feeding index is associated with the nutritional status of 6-to 23-
month-old children in rural Burkina Faso J Nutr 136 656-663
SCHULTZ T (1979) The Economics of Being Poor – Lecture to the Memory of Alfred Nobel University
of Chicago Press: Chicago IL USA
SEERY E and CAISTOR ARENDAR A (2014) Even it up: Time to end extreme inequality Oxfam
International: Oxford UK 2014
SIAHPOOSH MR and DEHGHANIAN E (2012) Water use efficiency transpiration efficiency and uptake
efficiency of wheat during drought Agron J 104 1238-1243
SINCLAIR TR, TANNER CB and BENNETT JM (1984) Water-Use Efficiency in Crop Production
Bioscience 34 36-40
SINGH P, WANI SP, PATHAK P, SAHRAWAT KL and SINGH AK (2011) Increasing crop productivity
and water use efficiency in rainfed agriculture. Integr Watershed Manag 315-348
SOPPE RWO and AYARS JE (2003) Characterizing ground water use by safflower using weighing
lysimeters Agric water Manag 60 59-71
39
STEDUTO P, HSIAO TC and FERERES E (2007) On the conservative behavior of biomass water
productivity Irrig Sci 25 189-207
STEIN AJ (2014) Rethinking the measurement of undernutrition in a broader health context: Should we
look at possible causes or actual effects? Glob Food Sec 3 193-199
STEIN C, BARRON J, NIGUSSIE L, GEDIF B and AMSALU T (2014) Advancing the water-energy-food
nexus: social networks and institutional interplay in the Blue Nile. Available at
https://cgspace.cgiar.org/handle/10568/42208 (verified 27 September 2019).
STOCKHOLM INTERNATIONAL WATER INSTITUTE (SIWI) – INTERNATIONAL WATER
MANAGEMENT INSTITUTE (IWMI) (2004) Water-More Nutrition per Drop SIWI–IWMI: Stockholm
Sweden
SUN YHC (2008) Health concern food choice motives and attitudes toward healthy eating: the mediating
role of food choice motives Appetite 51 42-49
TCHOUNDJEU Z, ASAAH EK, ANEGBEH P, DEGRANDE A, MBILE P, FACHEUX C, TSOBENG A,
ATANGANA AR, NGO-MPECK ML and SIMONS AJ (2006) Putting participatory domestication into
practice in West and Central Africa For Trees Livelihoods 16 53-69
TEKA-TSEGAY Y, RUSARE M and MISTRY R (2014) Hidden Hunger in South Africa: The Faces of
Hunger and Malnutrition in a Food-Secure Nation Oxfam GB: Oxford UK
UNCF (2013) The United Nations Children’s Fund Improving Child Nutrition: The Achievable Imperative
for Global Progress United Nations Children’s Fund: Washington DC USA
UNCSD (United Nations Conference on Sustainable Development) (2011) Food Security and Sustainable
Agriculture. Available at https://sustainabledevelopment.un.org/content/documents/316brief9.pdf.
UNITED NATIONS (2017) Open Working Group Proposal for Sustainable Development Goals Available
online: https://sustainabledevelopmentunorg/sdgsproposal (accessed on 31 December 2015)
UNITED NATIONS CONFERENCE ON SUSTAINABLE DEVELOPMENT (UNCSD) (2011) Food
Security and Sustainable Agriculture UNCSD: New York NY USA
UNITED NATIONS (2014) Open Working Group Proposal for Sustainable Development Goals. Prog. UN
Syst. Available at https://sustainabledevelopment.un.org/sdgsproposal.
UN-WATER (2006) Coping with Water Scarcity-A Strategic Issue and Priority for System-wide Action
UN-Water: Geneva Switzerland

40
VAN HALSEMA and GE VINCENT L (2012) Efficiency and productivity terms for water management:
A matter of contextual relativism versus general absolutism Agric Water Manag 108 9-15
VIETS FG (1962) Fertilizers and the efficient use of water Adv Agron 14 223-264
WATER UN (2006) Coping with Water Scarcity-A Strategic Issue and Priority for System-wide Action.
UN-Water Themat. Initiat.
WEBB P and KENNEDY E (2014) Impacts of agriculture on nutrition: nature of the evidence and research
gaps Food Nutr Bull 35 126-132
WELCH R M, COMBS Jr GF and DUXBURY JM (1997) Toward a“ Greener” revolution Issues Sci
Technol 14-50
WELCH RM (2001) Micronutrients agriculture and nutrition linkages for improved health and well-being
Perspect Micronutr Nutr Crop Jodhpur India Sci Publ 247-289
WELCH RM and GRAHAM RD (1999) A new paradigm for world agriculture: meeting human needs:
productive sustainable nutritious F Crop Res 60 1-10
WENHOLD F, ANNANDALE J, FABER M, and HART T (2012) Water Use and Nutrient Content of Crop
and Animal Food Products for Improved Household Food Security: A Scoping Study. Report TT 537/12.
Water Research Commission, Pretoria, South Africa.
http://wwwwrcorgza/Knowledge%20Hub%20Documents/Research%20Reports/TT%20537-12pdf.
(accessed on 3 June 2014)
WEZEL A and SOLDAT VA (2009) quantitative and qualitative historical analysis of the scientific
discipline of agroecology Int J Agric Sustain 7 3-18
WEZEL A BELLON S DORÉ T FRANCIS C VALLOD D and DAVID C (2011) Agroecology as a science
a movement and a practice In Sustainable Agriculture Volume 2 Springer pp 27-43
WORLD HEALTH ORGANISATION (WHO) (1992) International Conference on Nutrition World
Declaration and Plant of Action Food and Agricultural Organisation and World Health Organisation: Rome
Italy p 142
WORLD HEALTH ORGANISATION (WHO) (1948) Preamble to the Constitution of the World Health
Organisation as Adopted by the International Health Conference New York 19-22 June 1946 Signed on 22
July 1946 by the Representatives of 61 States WHO: New York NY USA 1948
41
YIP R (1997) The challenge of improving iron nutrition: limitations and potentials of major intervention
approaches Eur J Clin Nutr 51 S16
ZWART SJ and BASTIAANSSEN WGM (2004) Review of measured crop water productivity values for
irrigated wheat rice cotton and maize Agric Water Manag 69 115-133

42
CHAPTER 3
FOOD AND NUTRITION INSECURITY IN SELECTED RURAL
COMMUNITIES OF KWAZULU-NATAL, SOUTH AFRICA – LINKING
HUMAN NUTRITION AND AGRICULTURE
L Govender, K Pillay, M Siwela, AT Modi and T Mabhaudhi
3.1 Introduction
Worldwide, many forms of malnutrition co-exist. Malnutrition presents as either undernutrition
(underweight, wasting, stunting and micronutrient deficiencies) or over-nutrition (overweight,
obesity and chronic diseases of lifestyle) [Food and Agriculture Organisation of the United Nations
(FAO)], International Fund for Agricultural Development (IFAD), United Nations Children’s Fund
(UNICEF), World Food Programme (WFP) and World Health Organisation (WHO), 2017].
Globally, in 2016, 815 million people had chronic undernutrition. Stunting affected 155 million
children under five years and wasting affected 52 million children between the ages of one and 12
years. Over-nutrition is as much of a problem as undernutrition. The 2016 statistics indicated that
41 million children under the age of five years were overweight (FAO et al., 2017). Both under-
and over-nutrition are not only on the rise globally, but is also a major concern in sub-Saharan
African countries, including South Africa (SA) (Faber and Wenhold, 2007).
In SA, all forms of malnutrition could be attributed to, in part, the shift from traditional diets,
which were high in carbohydrates and fibre, to western diets which are high in fat. The shift in
dietary habits seems to be contributing significantly to the increased risk of chronic diseases of
lifestyle such as obesity, hypertension, coronary heart disease and hyperlipidaemia (Van Zyl et al.,
2012; Lutter et al., 2011; Schӧnfeldt et al., 2010; Faber and Wenhold, 2007; Bourne et al., 2002).
The dietary shift has had varying impacts on the nutritional and health status of different
demographic groups in SA. A high prevalence of over-nutrition has been reported among South
African women, whereas children and infants are mostly affected by undernutrition (Shisana et al.,
2013). Similar to other countries in sub-Saharan Africa (SSA), there are several underlying causes
of malnutrition in SA, including poverty, food insecurity, inadequate infrastructure and access to
health care facilities, lack of education and inadequate food intake (Bain et al., 2010; Chopra
43
et al.,2009; Manary and Sandige, 2008; Smuts et al.,2008). These causes are largely inter-linked
(UNICEF 1998), with poverty being the leading cause, including in SA (Bain et al., 2013).
Poverty can be defined as the lack of or limited access to necessities, such as safe clean water,
health care, shelter, sanitation, nutritious food and basic education due to economic constraints
(WHO, 2016; Woolard, 2012). The 2015 statistics indicated that one in every two South Africans
is poor, which equates to approximately 30.4 million South Africans [Statistics South Africa
(StatsSA), 2017]. In SA, black Africans are particularly affected by poverty (47-53%) (Argent et
al., 2009). The KwaZulu-Natal (KZN) province has the largest proportion of poor households in
SA and has been one of the poorest provinces in SA since 2011 (StatsSA, 2017; Argent et al.,
2009). Poor households are at a high risk of malnutrition, as they cannot afford a diverse diet
(Mabhaudhi et al., 2016a; Wenhold et al., 2012). Within KZN, 37.2% of poor households receive
a child support grant (StatsSA, 2017), which is currently R430/month [Republic of South Africa
(RSA) 2019]. In some instances, households depend solely on grants for purchasing food in SA. A
basic food basket costs approximately R883.16/month in SA, which may be unaffordable to many
impoverished people [National Agricultural Marketing Council (NAMC), 2019]. Several strategies
have been proposed to address dietary diversity in poor rural households. These include
biofortification and the promotion of alternative crops that are nutrient-dense (Mabhaudhi et al.,
2016a).
Food and nutrition insecurity can be defined as the inability to access adequate quantities of
nutritious foods required for optimal growth and development (Napoli et al., 2011). There is a
direct relationship between food and nutrition insecurity and poverty (Kimani-Murage et al., 2010).
In SA, at the national level, food insecurity affects one in five households (Labadarios, Moodie and
Van Rensburg, 2007). Most rural communities consume diets that have very limited variety and
are typically inadequate in fruits and vegetables (WHO, 2013). Micronutrient deficiencies are
common in developing countries such as SA. These micronutrient deficiencies include iron, iodine,
zinc and vitamin A (Bailey et al., 2015).
Various national studies have been conducted to assess the nutritional status of South Africans.
The South African Vitamin A Consultative Group (SAVACG) conducted a survey in 1994 on
children aged 0-71 months (Labadarios and Van Middelkoop, 1995), while the National Food
Consumption Survey (NFCS 1999) surveyed children aged 1-9 years of age (Labadarios et al.,
2000). The 2005 National Food Consumption Survey-Fortification Baseline (NFCS-FB) was
conducted on children aged 1-9 years and women of childbearing age (Labadarios et al., 2007).

44
The most recent national study, the South African National Health and Nutrition Examination
Survey (SANHANES-1), was conducted in 2012 (Shisana et al., 2013). These studies have given
an overall view of the nutritional status of the South African population and have drawn
conclusions on the nutritional status of South Africans living in different provinces. The sampling
method used when conducting the national studies was disproportionate stratification by province.
This means that only a certain fraction of the province was sampled. Therefore, the data obtained
from these studies are arguably not a true reflection of the nutritional status of different population
groups found in specific localities within the province, including district and sub-district levels
(Shisana et al., 2013; Labadarios and Van Middelkoop, 1995).
The aim of this literature review is to determine the nutritional status of people living in KZN,
especially those living in poor rural areas, by evaluating available data and information on the
nutritional status of population groups residing in KZN. This study focussed on poor rural
communities because most of the national studies indicated that poor rural populations are the worst
affected and are most vulnerable to both under- and over-nutrition (Shisana et al., 2013; Labadarios
et al., 2007; Labadarios et al., 2000).
3.2 Nutritional status of South African children and adults with a focus on KwaZulu-Natal
3.2.1 Undernutrition Undernutrition is a serious nutritional problem as it leads to poor quality of life due to the loss of
body cell mass. It is associated with various health issues such as anaemia, hepatic mass losses,
infection, emphysema, gastrointestinal tract (GIT) atrophy and intestinal bacterial overgrowth
(Escott-Stump, 2015). Undernutrition, more specifically stunting, is common in South African
children, affecting approximately 27% of children under the age of five years [National Department
of Health (nDoH), StatsSA, South African Medical Research Council (SAMRC) and ICF, 2017].
There are a number of measurements used to classify undernutrition in children using the WHO
classification. These include a weight-for-age (WFA), height-for-age (HFA) and weight-for-height
(WFH). This classification indicates if a child is underweight, stunted or wasted. The WFH can
further classify a child as having severe acute malnutrition (SAM) or moderate acute malnutrition
(MAM), being not acutely malnourished (NAM) or overweight (WHO, 2017). For persons under
18 years of age, the mid-upper arm circumference (MUAC) is another common anthropometric
measurement used in addition to weight and height, to identify malnutrition. Tables 3.1, 3.2 and
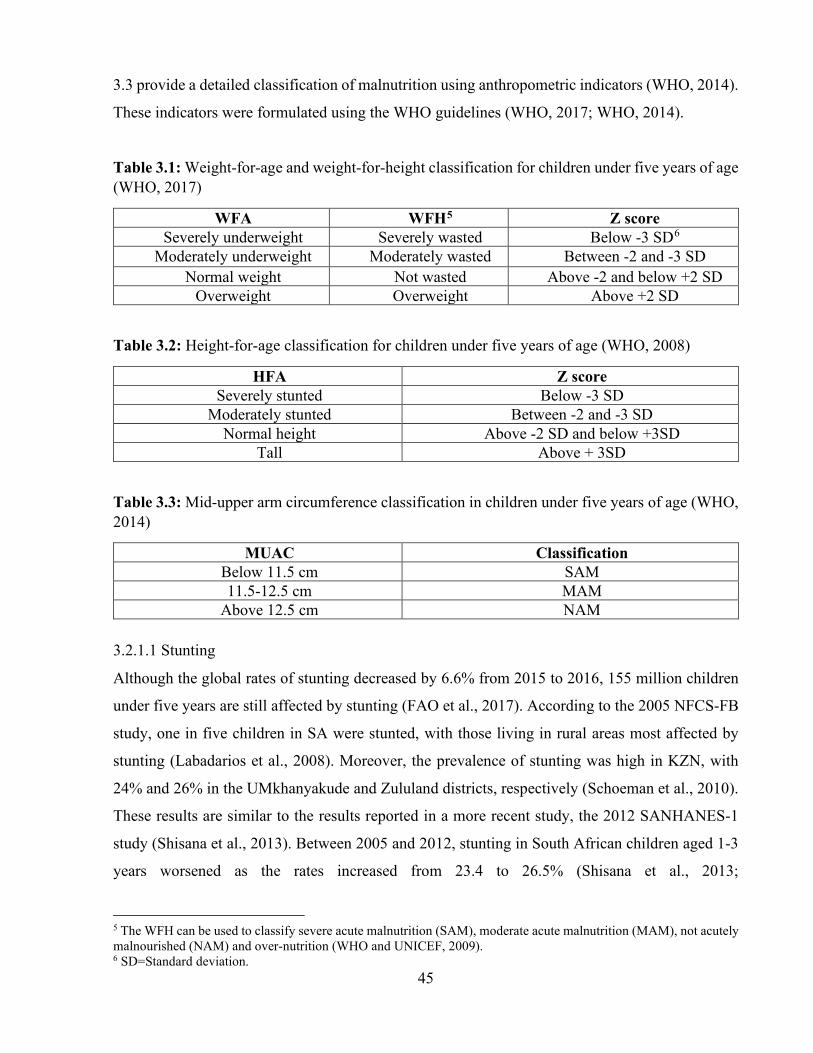
45
3.3 provide a detailed classification of malnutrition using anthropometric indicators (WHO, 2014).
These indicators were formulated using the WHO guidelines (WHO, 2017; WHO, 2014).
Table 3.1: Weight-for-age and weight-for-height classification for children under five years of age (WHO, 2017)
WFA WFH5 Z score Severely underweight Severely wasted Below -3 SD6
Moderately underweight Moderately wasted Between -2 and -3 SD Normal weight Not wasted Above -2 and below +2 SD
Overweight Overweight Above +2 SD
Table 3.2: Height-for-age classification for children under five years of age (WHO, 2008)
HFA Z score Severely stunted Below -3 SD
Moderately stunted Between -2 and -3 SD Normal height Above -2 SD and below +3SD
Tall Above + 3SD
Table 3.3: Mid-upper arm circumference classification in children under five years of age (WHO, 2014)
MUAC Classification Below 11.5 cm SAM 11.5-12.5 cm MAM
Above 12.5 cm NAM
3.2.1.1 Stunting
Although the global rates of stunting decreased by 6.6% from 2015 to 2016, 155 million children
under five years are still affected by stunting (FAO et al., 2017). According to the 2005 NFCS-FB
study, one in five children in SA were stunted, with those living in rural areas most affected by
stunting (Labadarios et al., 2008). Moreover, the prevalence of stunting was high in KZN, with
24% and 26% in the UMkhanyakude and Zululand districts, respectively (Schoeman et al., 2010).
These results are similar to the results reported in a more recent study, the 2012 SANHANES-1
study (Shisana et al., 2013). Between 2005 and 2012, stunting in South African children aged 1-3
years worsened as the rates increased from 23.4 to 26.5% (Shisana et al., 2013;
5 The WFH can be used to classify severe acute malnutrition (SAM), moderate acute malnutrition (MAM), not acutely malnourished (NAM) and over-nutrition (WHO and UNICEF, 2009). 6 SD=Standard deviation.

46
Labadarios et al., 2007). According to the 2016 South African Demographic and Health Survey
(SADHS), stunting affected 27% of children under the age of five years, indicating an increase in
stunting in comparison to other studies (nDoH et al., 2017). There are many implications of
stunting, especially in children under five years of age [Health Systems Trust (HST), 2016;
UNICEF, 2016; Escott-Stump, 2015].
Stunting is a chronic form of malnutrition (UNICEF, 2016) and is diagnosed when HFA is
below minus two standard deviations (SD) of the WHO child growth standards median (UNICEF,
2012). Stunting is caused either by inadequate food intake or by the consumption of foods that lack
adequate nutrients for an extended period of time (WHO, 2019). It is a serious health problem as it
can lead to reduced mental development, poor performance in school, poor social-emotional
development and increased risk for chronic diseases of lifestyle, later on in life. It is important to
determine the WFA in children under five years of age, as they are most vulnerable to all forms of
malnutrition, including stunting (HST, 2016; UNICEF, 2016; Escott-Stump, 2015). From the point
of in-utero fetal development up to two years of age, children are at risk of poor development due
to inadequate nutrition. After two years, some of these effects become irreversible (HST, 2016).
These children perform poorly in school, suffer from food and nutrition insecurity and lack
financial stability later on in life. This contributes to an economic loss as these children grow up to
become unemployed adults reliant on social grants, thus perpetuating a vicious cycle of poverty
and food insecurity (HST, 2016; Escott-Stump, 2015).
3.2.1.2 Underweight
Underweight is diagnosed when WFA is less than the minus two SD of the WHO child growth
standards median. It is a serious nutritional problem that may be caused by either weight loss or
poor nutritional intake (WHO, 2017). Globally, 16% of children under five years are underweight.
This figure is higher in SSA, with 21% of children under five years underweight (UNICEF, 2012).
Although these percentages are high, the prevalence of underweight and wasting has reduced in
SA. National studies conducted for the period 2005-2012 indicated that the prevalence of
underweight and wasting in children aged 1-3 years in SA declined from 11% to 6.1% and 5.1%
to 2.2%, respectively (Shisana et al., 2013; Labadarios et al., 2007). In KZN, the highest prevalence
(6%) of underweight in children between the ages of 12-23 months was found in the
UMkhanyakude district (Schoeman et al., 2010).
As alluded to earlier, poor dietary intake may contribute to malnutrition. The improvement in
undernutrition in KZN could be attributed to the Integrated Management of Acute Malnutrition
47
(IMAM) programme that was implemented by the national Department of Health in 2014 (DoH,
2014) and the new 2018 standard operating procedures on the prevention and management of
malnutrition in KZN (DoH, 2018). Although the prevalence of underweight and wasting in children
has improved, it remains important to determine the nutritional status of vulnerable children and
adults in rural KZN. This is especially because many of those living in poor rural areas with
malnutrition may remain undiagnosed, as they live far away from health care facilities (Strasser,
2003).
3.2.1.3 Wasting
Wasting is diagnosed when WFL/WFH is less than minus two SD of the WHO child growth
standards median. Wasting is a serious nutritional problem that may be caused by either weight
loss or poor nutritional intake (WHO, 2017). It can present as protein-energy malnutrition (PEM),
which is the most common form of malnutrition observed in developing countries. It is caused by
a lack of one or more macronutrients that are required by body tissue in order to sustain the optimal
functioning of the human body (Manary and Sandige, 2008). This form of malnutrition is caused
by a protein and glycaemic carbohydrate deficiency (Mahan and Raymond, 2017). Malnutrition
can manifest in different ways depending on the symptoms presented, with PEM often manifesting
itself as SAM with or without oedema or MAM. Severe acute malnutrition is characterised by the
presence of severe wasting or pitting oedema and MAM presents clinically as moderate wasting
with no oedema (DoH, 2018). Malnutrition can be classified using anthropometric measurements
(Tables 3.1, 3.2 and 3.3).
When an individual is malnourished, the body goes into a state of starvation (Mahan and
Raymond, 2017). Glucose is the main energy source for the body, obtained from the consumption
of carbohydrate-containing foods. Although free fatty acids are utilised to provide energy when
glucose is unavailable in the body, certain organs, such as the kidneys, brain, eyes and red blood
cells, are unable to use free fatty acids as a source of fuel and require glucose as an energy source.
When the body is in a state of starvation, the brain still requires a constant supply of energy. The
liver produces ketone bodies, which are partly used as an energy source by the brain during
starvation (Mahan, Escott-Stump and Raymond, 2012). Starvation affects the GIT, cardiac muscle,
liver, kidneys and the immune system (Manary and Sandige, 2008). During starvation, appropriate
nutrition is required to correct electrolyte imbalance, prevent further organ damage and provide the
48
correct amounts of macronutrients for sustainability. The human body is significantly affected
during episodes of starvation (Mahan et al., 2012,).
3.2.1.4 Micronutrient deficiencies, particularly vitamin A deficiency
Although micronutrient deficiencies are also a problem in developing countries, they are not
routinely treated. Globally, about two billion people have micronutrient deficiency due to the
consumption of poor quality foods that lack diversity. The most common micronutrient
deficiencies observed in developing countries are iron, iodine, zinc and vitamin A (Bailey et al.,
2015). Micronutrient deficiencies result in several health conditions, including growth retardation
and delayed development (Bain et al., 2013). The 1999 NFCS showed that South African children
had a low intake of the following micronutrients: vitamin A, calcium, iron, zinc, folate, vitamin B6,
niacin, riboflavin, vitamin C and vitamin E. The study further indicated that, in SA, the highest
prevalence of micronutrient deficiencies was noted in rural communities (Labadarios et al., 2000).
Similarly, the 2005 NFCS-FB study also found that many micronutrients were consumed at less
than 67% of the recommended dietary allowances (RDA). These included calcium, iron, zinc,
selenium, vitamin D, vitamin C, vitamin E, riboflavin, niacin, folic acid and vitamin D (Labadarios
et al., 2008). On a national level, poor iron status was noted in one in five and one in 10 women
and children, respectively. Iron deficiency anaemia affected 5.9% of children aged 1-9 years in
KZN (Labadarios et al., 2008). The prevalence of iron deficiency in South African children reduced
from 5% in 1994 to 1.9% in 2012 (Shisana et al., 2013; Labadarios et al., 2000; Labadarios and
Van Middelkoop, 1995).
Nationally, 43.3% of children in SA have a poor zinc status (Labadarios et al., 2008). A recent
longitudinal study conducted on children aged 4-6 years and 6-8 years in rural KZN, found that out
of the 103 children in the study, 37.9% of the children were mildly anaemic, 60.2% were
moderately anaemic and 1.9% were severely anaemic (Gwetu et al., 2015). These study results
were in contrast to the results obtained from the 2012 SANHANES-1 study. A possible reason for
the difference in results could be due to the classification used to analyse data. The study conducted
by Gwetu et al. (2015), classified anaemia using two target groups, i.e. 0-59 months (mild: 10-10.9
g/dl; moderate: 7-9.9 g/dl; and severe: <7 g/dl) and 5-11 years (mild: 11-11.4 g/dl; moderate: 8-
10.9 g/dl; and severe: <8 g/dl) (Gwetu et al., 2015). On the other hand, the 2012 SANHANES-1
study classified anaemia in children under five years as follows: mild (10-10.9 g/dl); moderate (7-
9.9 g/dl) and severe (<7 g/dl) (Shisana et al., 2013). The results from Gwetu et al. (2015) are similar
to previous national studies (Labadarios et al., 2008; Labadarios and Van Middelkoop, 1994), and

49
local studies (Faber et al., 2001; Oelofse et al., 1999). These studies all indicated that the prevalence
of anaemia ranged from 16.5 to 33% between 1994 and 2005 (Labadarios et al., 2008; Faber et al.,
2001; Oelofse et al., 1999; Labadarios and Van Middelkoop, 1995). As previously highlighted, the
2012 SANHANES-1 study used disproportionate stratification that did not cover every area of a
specific province (Shisana et al., 2013). This may explain, in part, the differences noted.
A separate study conducted on the urban population of Durban, KZN also found high rates of
anaemia. The cross-sectional prospective study conducted in a regional hospital found that out of
2000 pregnant patients enrolled in the study, 854 patients (42.7%) were anaemic. From the
pregnant women that were anaemic, 81.4% were mildly anaemic, 18% were moderately anaemic
and 0.6% were severely anaemic (Tunkyi and Moodley, 2016). Anaemia in pregnancy is a
significant problem as it affects the health of both the mother and fetus. Iron is required during
pregnancy to assist with fetal growth and improves the Apgar7 score, which provides an indication
of how well the infant is doing outside the womb. A mother suffering from anaemia is at risk of
maternal and perinatal mortality due to poor nutritional status (Pasricha et al., 2013; Allen, 2000).
Anaemia during pregnancy can result in a low birth weight or premature delivery (Allen, 2000).
This is a serious problem, as the vicious cycle of malnutrition continues. These infants may suffer
from developmental delays that may affect their academic performance in school, with possible
unemployment later in life, hence exposing them to poverty and food insecurity (HST, 2016;
Escott-Stump, 2015; Kimani-Murage et al., 2010).
Although there has been an improvement in the iron status of South Africans, it is important to
highlight that national studies only sampled a portion of the province and were not district specific.
It also indicates that iron deficiency anaemia affects two vulnerable groups in KZN, women of
childbearing age and children. It is important to prioritise the nutritional status of these two
vulnerable groups as they are at high risk of micronutrient malnutrition (Shisana et al., 2013;
Labadarios et al., 2000; Labadarios and Van Middelkoop, 1995). A possible long-term strategy that
could be explored to help address micronutrient malnutrition is dietary diversification through the
promotion of household and community food gardens, utilisation of indigenous crops and
consumption of biofortified foods.
Vitamin A deficiency is a common micronutrient deficiency, observed globally and throughout
SSA (Shisana et al., 2013; Bain et al., 2013; Labadarios et al., 2008; Smuts et al., 2005; Labadarios
7 Apgar (A: appearance, P: pulse, G:grimace, A: activity, R: respiration)

50
et al., 2000; Labadarios and Van Middelkoop, 1995. A few national studies have documented VAD
in SA. In 1994, the SAVACG study (Labadarios and Van Middelkoop, 1995) reported that 33.3%
of South African children had VAD, while the 2005 NFCS-FB study (Labadarios et al., 2008)
reported that 63.6% had VAD. This showed that the VAD situation had worsened between 1994
and 2005. Furthermore, the 2005 NFCS-FB study reported that two in three women had VAD. In
KZN alone, six out of ten women had VAD, which was the highest prevalence in SA. Forty-four
percent of children between the ages of 1-9 years living in KZN had VAD. Overall, KZN had the
second highest prevalence of VAD (Labadarios et al., 2008; Labadarios et al., 2000; Labadarios
and Van Middelkoop, 1995). A more recent study, the 2012 SANHANES-1 study, reported an
improvement in the VAD situation in SA (Shisana et al., 2013). Although still significantly high,
the SANHANES-1 study reported a decline in the number of children with VAD (43.6%). The
SANHANES-1 study also reported that there was an improvement in the vitamin A status of
females residing in KZN. Those with the lowest education levels were the most affected by VAD
(Shisana et al., 2013).
Although the prevalence of VAD in SA has decreased, it still remains a challenge, especially
in KZN (Shisana et al., 2013; Labadarios et al., 2008). It is vital to find ways to reduce VAD as
vitamin A is an important micronutrient required by the human body. Vitamin A deficiency affects
protein synthesis, vision, growth and development and could result in a child not being able to
reach their full potential, both physically and mentally (Mahan and Raymond, 2017). The main
reasons for VAD, especially in SA, are poor economic status and limited access to nutritious foods.
A possible solution to this problem could be diversifying household food baskets with biofortified
crops and underutilised indigenous crops. However, the acceptability of such crops by poor rural
communities remains a challenge. It is therefore important to identify the foods consumed by
people at risk of VAD in KZN, and analyse these foods to determine their nutritional value.
Improvements in the prevalence of micronutrient deficiencies could be attributed to the success
of the nutritional interventions implemented to help alleviate micronutrient deficiencies (DoH,
2018; Swart et al., 2008; DoH and UNICEF, 2007). Although these interventions have shown an
improvement in the prevalence of micronutrient deficiencies, progress has been slow. Despite the
improvement in the iron status of women and children observed from national studies, it is evident
that it remains a problem in some areas of KZN (Shisana et al., 2013). With the high poverty rates
and the worsening economy, many poor rural communities remain unable to access basic food
items (NAMC, 2019; RSA, 2019). This leads to poor nutritional status as the foods consumed lack
51
variety and many essential nutrients. Assessing the dietary intake of the rural population in KZN
could assist in improving dietary intake by modifying current eating patterns or advising on
cheaper, more nutritious food options. Current recipes could be documented and assessed for
nutritional composition. Items from these recipes could be substituted with options that are more
nutritious. For example, substituting unfortified white maize with biofortified maize or sweet
potato with OFSP could improve vitamin A intake and address VAD. Adding fruits and vegetables
to diets that lack variety by promoting vegetable gardens, utilising wild vegetables and fruit or
biofortified foods, could assist in diversifying household food baskets.
3.2.2 Over-nutrition For many years, undernutrition has been under the spotlight, while over-nutrition has received less
attention. However, this has now changed (DoH, 2018; Haslam and James, 2005). Over-nutrition
was previously mostly associated with affluence. However, due to the nutritional transition, it is
now also prevalent in middle and low-income groups. Over-nutrition is a major risk factor for
chronic diseases of lifestyle, especially in women (Devanathan et al., 2013).
3.2.2.1 Overweight and obesity in children
There are several possible causes of childhood obesity. These include increased consumption of
poor quality, high-energy foods, children born to mothers who were overweight or obese during
pregnancy, overweight or obese parents, low physical activity and metabolic disorders (Escott-
Stump, 2015). Overweight and obesity are serious health concerns, especially in children, as it
increases the risk of other chronic diseases of lifestyle later, such as cardiovascular disease,
hypertension and diabetes mellitus (Escott-Stump, 2015). Stunting in children increases the risk of
obesity in adulthood (FAO et al., 2017).
Globally, in 2016, 41 million children under the age of five were overweight. Southern Africa
accounts for 12% of the overweight children (FAO et al., 2017). The 2005 NFCS-FB found that 1
in 10 South African children were overweight (Labadarios et al., 2008). A separate study conducted
by Armstrong et al. (2006), using random sampling in South African children aged 6-13 years in
five selected provinces during the National Health Survey (2001-2004), found that the prevalence
of overweight and obesity increased with age among black African girls. However, the opposite
trend was observed with white girls. The combined percentage of overweight and obesity increased
from 11.9% in black African girls aged 6 years to 21.8% in black girls aged 13 years (Armstrong
et al., 2006). Similarly, a national study conducted in 2012 in SA, reported that the prevalence of
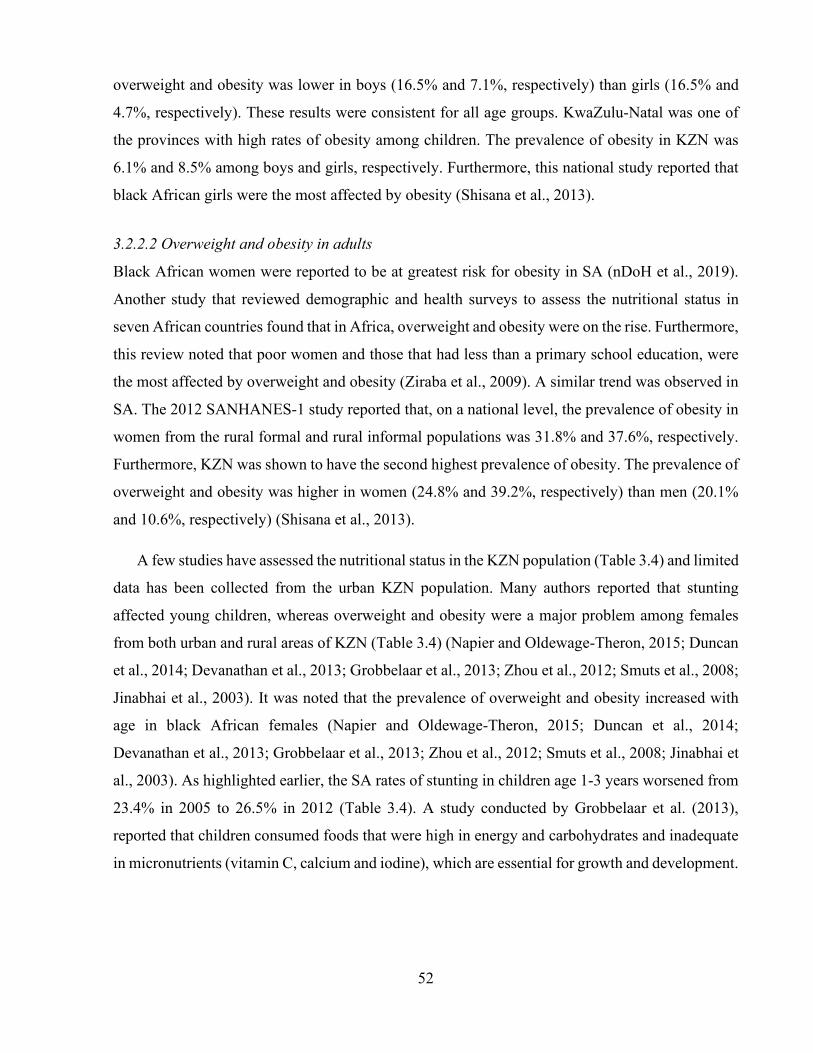
52
overweight and obesity was lower in boys (16.5% and 7.1%, respectively) than girls (16.5% and
4.7%, respectively). These results were consistent for all age groups. KwaZulu-Natal was one of
the provinces with high rates of obesity among children. The prevalence of obesity in KZN was
6.1% and 8.5% among boys and girls, respectively. Furthermore, this national study reported that
black African girls were the most affected by obesity (Shisana et al., 2013).
3.2.2.2 Overweight and obesity in adults
Black African women were reported to be at greatest risk for obesity in SA (nDoH et al., 2019).
Another study that reviewed demographic and health surveys to assess the nutritional status in
seven African countries found that in Africa, overweight and obesity were on the rise. Furthermore,
this review noted that poor women and those that had less than a primary school education, were
the most affected by overweight and obesity (Ziraba et al., 2009). A similar trend was observed in
SA. The 2012 SANHANES-1 study reported that, on a national level, the prevalence of obesity in
women from the rural formal and rural informal populations was 31.8% and 37.6%, respectively.
Furthermore, KZN was shown to have the second highest prevalence of obesity. The prevalence of
overweight and obesity was higher in women (24.8% and 39.2%, respectively) than men (20.1%
and 10.6%, respectively) (Shisana et al., 2013).
A few studies have assessed the nutritional status in the KZN population (Table 3.4) and limited
data has been collected from the urban KZN population. Many authors reported that stunting
affected young children, whereas overweight and obesity were a major problem among females
from both urban and rural areas of KZN (Table 3.4) (Napier and Oldewage-Theron, 2015; Duncan
et al., 2014; Devanathan et al., 2013; Grobbelaar et al., 2013; Zhou et al., 2012; Smuts et al., 2008;
Jinabhai et al., 2003). It was noted that the prevalence of overweight and obesity increased with
age in black African females (Napier and Oldewage-Theron, 2015; Duncan et al., 2014;
Devanathan et al., 2013; Grobbelaar et al., 2013; Zhou et al., 2012; Smuts et al., 2008; Jinabhai et
al., 2003). As highlighted earlier, the SA rates of stunting in children age 1-3 years worsened from
23.4% in 2005 to 26.5% in 2012 (Table 3.4). A study conducted by Grobbelaar et al. (2013),
reported that children consumed foods that were high in energy and carbohydrates and inadequate
in micronutrients (vitamin C, calcium and iodine), which are essential for growth and development.

53
Table 3.4: Studies conducted to assess the nutritional status of the KwaZulu-Natal population
Authors Study design and methods Area conducted Participants Findings Napier and Oldewage-Theron (2015)
Three informal settlements, randomly selected. Anthropometric data was collected (weight and height) and a structured 24-hour recall was conducted.
EThekwini Municipal District (Urban area).
Girls in secondary school and women aged 19-28 years of age (n=523).
- Stunting was evident in young girls (7.7%). - Forty-three percent of the girls were at risk of
being overweight and 12.8% were overweight. - BMI for age indicated that 5.2% of the women
were underweight and that 30.5% and 15% were overweight and obese, respectively.
- Half the women had a normal BMI. - The intake of micronutrients was adequate
among both the girls and women, however, the energy intakes were inadequate.
Duncan et al. (2014)
Nested cross-sectional study. Anthropometric measurements and blood pressure were measured for all participants. A questionnaire was formulated and participants interviewed.
Manguzi, KwaZulu-Natal (Mahlungulu, Maputa, Mshundu, Thengane and Zama Zama).
Males (n=109) and females (n=391). Patients from 11 primary health care clinics.
- The results of the study indicated that 28% of the participants were overweight, 34% were obese and 4% were underweight.
- This study concluded that most of the participants were overweight and obese; however, not many participants perceived that they were overweight.
Devanathan et al. (2013)
A cross-sectional exploratory study. Systematic sampling was used. Anthropometric measurements were taken and interviews were conducted.
Wentworth Hospital, Durban, KZN.
Urban black women (n=328) aged 19-70 years.
- The prevalence of overweight and obesity was 16% and 76%, respectively.
- All participants had one or more chronic diseases of lifestyle.
- The overweight and obese women who had one or more chronic diseases of lifestyle perceived themselves as thinner than they were.
Grobbelaar et al. (2013)
Anthropometric measurements were taken. A seven-day cycle menu was obtained and analysed.
Three residential care facilities in Durban.
Girls (n=33) and boys (n=110) aged 5-18 years
- Severe stunting was noted in 4.7% and 3.3% of the boys aged 4-8 years and 14-18 years, respectively.
- Stunting affected 13.3% and 20% of girls aged 9-13 years and 14-18 years, respectively.
- Wasting was noted in 6.7% of girls aged 9-13 years and 3.3% of boys aged 14-18 years.
- Approximately 27% of girls aged 14-18 years were overweight and 33.5% of girls aged 9-13 years were at risk of becoming overweight.
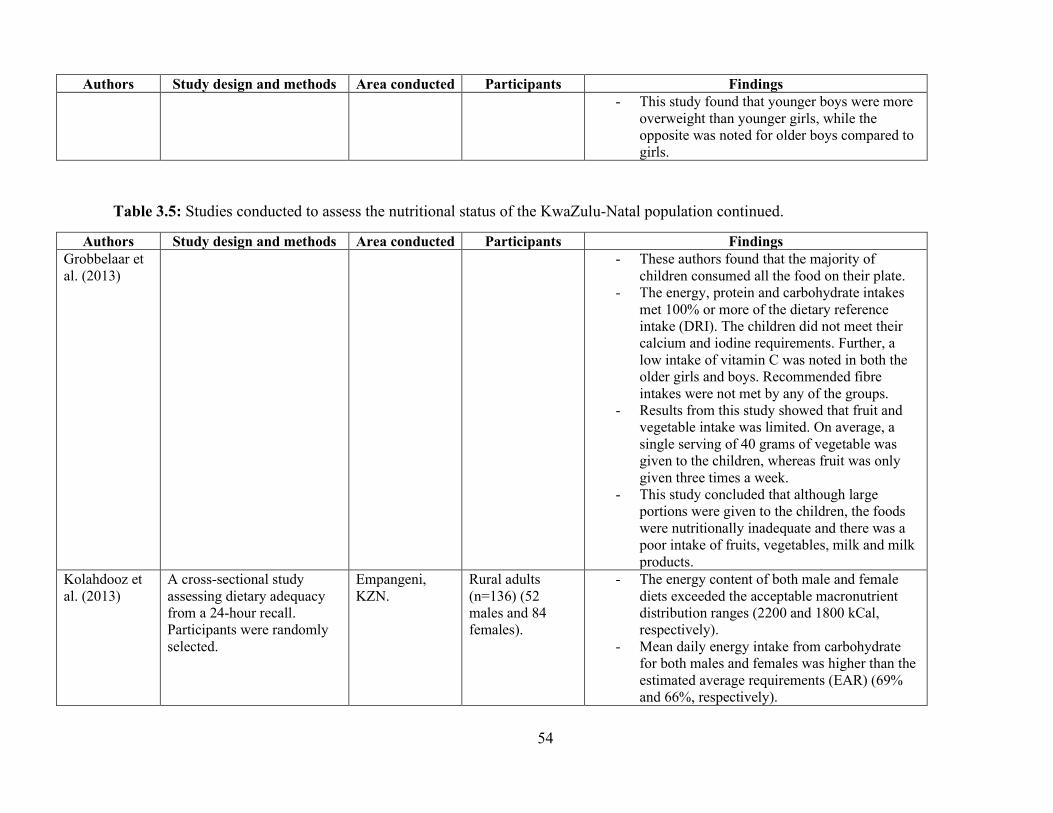
54
Authors Study design and methods Area conducted Participants Findings - This study found that younger boys were more
overweight than younger girls, while the opposite was noted for older boys compared to girls.
Table 3.5: Studies conducted to assess the nutritional status of the KwaZulu-Natal population continued.
Authors Study design and methods Area conducted Participants Findings Grobbelaar et al. (2013)
- These authors found that the majority of children consumed all the food on their plate.
- The energy, protein and carbohydrate intakes met 100% or more of the dietary reference intake (DRI). The children did not meet their calcium and iodine requirements. Further, a low intake of vitamin C was noted in both the older girls and boys. Recommended fibre intakes were not met by any of the groups.
- Results from this study showed that fruit and vegetable intake was limited. On average, a single serving of 40 grams of vegetable was given to the children, whereas fruit was only given three times a week.
- This study concluded that although large portions were given to the children, the foods were nutritionally inadequate and there was a poor intake of fruits, vegetables, milk and milk products.
Kolahdooz et al. (2013)
A cross-sectional study assessing dietary adequacy from a 24-hour recall. Participants were randomly selected.
Empangeni, KZN.
Rural adults (n=136) (52 males and 84 females).
- The energy content of both male and female diets exceeded the acceptable macronutrient distribution ranges (2200 and 1800 kCal, respectively).
- Mean daily energy intake from carbohydrate for both males and females was higher than the estimated average requirements (EAR) (69% and 66%, respectively).
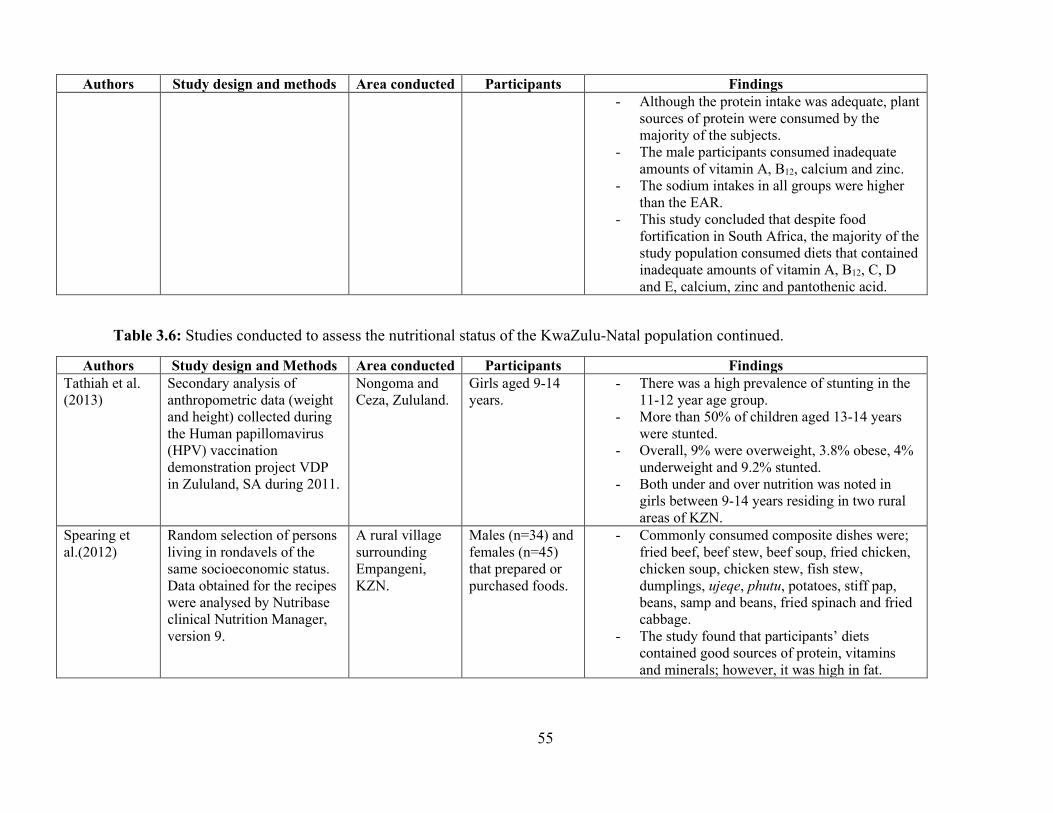
55
Authors Study design and methods Area conducted Participants Findings - Although the protein intake was adequate, plant
sources of protein were consumed by the majority of the subjects.
- The male participants consumed inadequate amounts of vitamin A, B12, calcium and zinc.
- The sodium intakes in all groups were higher than the EAR.
- This study concluded that despite food fortification in South Africa, the majority of the study population consumed diets that contained inadequate amounts of vitamin A, B12, C, D and E, calcium, zinc and pantothenic acid.
Table 3.6: Studies conducted to assess the nutritional status of the KwaZulu-Natal population continued.
Authors Study design and Methods Area conducted Participants Findings Tathiah et al. (2013)
Secondary analysis of anthropometric data (weight and height) collected during the Human papillomavirus (HPV) vaccination demonstration project VDP in Zululand, SA during 2011.
Nongoma and Ceza, Zululand.
Girls aged 9-14 years.
- There was a high prevalence of stunting in the 11-12 year age group.
- More than 50% of children aged 13-14 years were stunted.
- Overall, 9% were overweight, 3.8% obese, 4% underweight and 9.2% stunted.
- Both under and over nutrition was noted in girls between 9-14 years residing in two rural areas of KZN.
Spearing et al.(2012)
Random selection of persons living in rondavels of the same socioeconomic status. Data obtained for the recipes were analysed by Nutribase clinical Nutrition Manager, version 9.
A rural village surrounding Empangeni, KZN.
Males (n=34) and females (n=45) that prepared or purchased foods.
- Commonly consumed composite dishes were; fried beef, beef stew, beef soup, fried chicken, chicken soup, chicken stew, fish stew, dumplings, ujeqe, phutu, potatoes, stiff pap, beans, samp and beans, fried spinach and fried cabbage.
- The study found that participants’ diets contained good sources of protein, vitamins and minerals; however, it was high in fat.
56
Authors Study design and Methods Area conducted Participants Findings Zhou et al. (2012)
A large population-based survey measuring BMI and blood pressure.
Hlabisa sub-district in rural Umkhanyakude.
BMI (n=2298) and blood pressure (n=2307). Females aged 15-49 years and males aged 15-54 years.
- More than half of the participants were overweight (58.4%).
- Females were more likely to be overweight in comparison to their male counterparts.
Schoeman et al. (2010)
A cross-sectional study was conducted. Structured interview questionnaires were used and anthropometric measurements were taken (height and weight).
Umkhanyakude (n=398) (sub-district Jozini), Zululand (n=303) (sub-district Pongola) and OR Tambo (n=364) (sub-district Nyandeni)
Children between 0-59 months from UMkhanyakude, Zululand and OR Tambo.
- Thirty percent of participants in the two KZN districts had food gardens.
- Half of the participants from the two KZN districts had experienced a food shortage in the previous 12 months.
- Zululand had the lowest coverage of vitamin A supplementation.
- Wasting was not a concern in this study. - The highest rates of stunting were seen in
UMkhanyakude (6%), in the 12-23-month old group.
- Stunting was higher in the second year of life. - The rates of overweight in the 0-23-month
group were higher than underweight. - There was a high rate of obesity noted among
the caregivers living in Zululand (60%).

57
Table 3.7: Studies conducted to assess the nutritional status of the KwaZulu-Natal population continued.
Authors Study design and methods Area conducted Participants Findings Smuts et al. (2008)
A cross-sectional study was conducted. A questionnaire was used and anthropometric measurements were taken.
OR Tambo and Alfred Nzo district (Eastern Cape, n=1794) and UMkhanyakude and Zululand (n=1988).
Children 0-71 months old and caregivers.
- Between 16-18% of the children in both provinces were overweight.
- Childhood malnutrition doubled from the first year of life to the second. Further, the prevalence of stunting was significantly high in the Nongoma district of KZN.
- The mean BMI for the caregivers was above 25 kg/m2 for all areas, except the UMkhanyakude district.
- Obesity was higher among females; 45% of female caregivers in KZN were obese.
- Only 9% of the caregivers in the UMkhanyakude district were underweight.
- This study indicates that maternal over-nutrition and childhood malnutrition co-exist in both the Eastern Cape and KZN.
Jinabhai et al. (2003)
A cross-sectional survey conducted in 1995 on primary school children in KZN. Anthropometric data was collected. WHO and International obesity task force (IOTF) sets were used to measure nutritional status.
Eleven schools from the Vulamehlo district (rural) (n=802).
Grade 3 pupils, aged 8-11 years.
- Females had a higher prevalence of overweight and obesity in comparison to their male counterparts.
- Levels of stunting ranged between 31.4-75% in this study. There was no clear link between stunting and obesity in this particular study.
58
The studies reviewed indicated that overweight and obesity affected females more than
males. There are many possible reasons for the increasing prevalence of obesity in older girls
of black ethnicity. Some studies have noted that overweight is perceived as being associated
with wealth and a negative Human Immunodeficiency Virus (HIV) status (Duncan et al., 2014;
Devanathan et al., 2013). Thinness is usually associated with illness and being HIV positive
(Devanathan et al., 2013). From the studies reviewed, it was noted that some overweight and
obese participants did not perceive themselves as overweight or obese. Furthermore, the
participants did not recognise that they had a weight problem (Duncan et al., 2014; Devanathan
et al., 2013). These social misconceptions further emphasise the need for education and
awareness programmes, especially in poor rural communities (Duncan et al., 2014; Devanathan
et al., 2013).
Over-nutrition increases the risk for chronic diseases of lifestyle (Devanathan et al., 2013).
Various studies conducted in KZN have noted that although participants consumed large
portions of foods, these foods were nutritionally inadequate. These foods were often high in
energy, carbohydrates and sodium, but low in micronutrients such as vitamin A, vitamin B12,
vitamin C, vitamin D, vitamin E, zinc, pantothenic acid, calcium and iodine. A poor intake of
fruits, vegetables, dairy products and fibre was noted (Kolahdooz et al., 2013; Grobbelaar et
al., 2013; Spearing et al., 2012). These results indicate that there is a need to improve dietary
diversity.
Based on the literature reviewed, it is evident that there is limited data on the nutritional
intake of people living in KZN. It is also important to highlight that these studies were
conducted in specific districts and sub-districts within KZN, and therefore do not necessarily
reflect the nutritional status of the KZN population as a whole. Furthermore, the nutritional
status of most of the localised areas within KZN has not been investigated. Each area has a
population with a different income, socio-economic status and education level. These factors
could possibly affect the nutritional status of the populations living within these districts.
Therefore, it would be beneficial to investigate the nutritional status of people living in the
districts and sub-districts of KZN, which have not been previously investigated.
3.3 Interventions to combat nutritional problems in KwaZulu-Natal
In response to the nutritional problems discussed thus far in this chapter, there have been a
number of interventions employed by the South African DoH in order to combat these
problems. These include food fortification, vitamin A supplementation, the prevention and

59
management of malnutrition and dietary diversity (DoH, 2018; DoH, 2013; Swart et al., 2008;
DoH and UNICEF, 2007). These are discussed further in this section.
3.3.1 Food fortification The results of the 1999 NFCS study led to the fortification of foods to improve the nutritional
status of South Africans (Labadarios et al., 2000). Food fortification is a cost-effective process
that involves the addition of micronutrients to foods that are commonly consumed by vulnerable
populations (Pretorius and Schönfeldt, 2012; Gillespie and Mason, 1994). As of October 2003,
the South African Department of Health made it mandatory for all maize meal and wheat flour
to be fortified with vitamin A, iron, zinc, folic acid, thiamin, niacin, vitamin B6 and riboflavin
(DoH and UNICEF, 2007). The decision to use maize meal and wheat flour were taken because
the commonly consumed foods in SA were bread and maize (Labadarios et al., 2000). However,
access to fortified foods remains problematic for poor people who rely on social grants to
purchase food (NAMC, 2019; StatsSA, 2019; Labadarios et al., 2008). This implies that
alternative solutions are needed to reach this vulnerable group.
3.3.2 Vitamin A supplementation Vitamin A supplementation was another strategy employed by the South African DoH to assist
in the alleviation of VAD. The KZN DoH guidelines state that all children over six months of
age and under five months should receive a routine dose of vitamin A supplementation (DoH,
2013). A therapeutic dose is issued to all children that present to the hospital or clinic with
severe malnutrition or signs of VAD (DoH, 2018; DoH, 2013). Although this programme is
currently in place in KZN, not all children benefit from it. Health care facilities are usually far
from where people reside and many people do not have money to transport children to health
care facilities for supplements. Many children only receive a therapeutic dose of vitamin A on
admission to hospital with malnutrition (DoH, 2018; DoH, 2013). Results of a study conducted
in KZN indicated that there was poor utilisation of health care facilities. A high percentage of
mothers (25%) living in KZN had no access to basic healthcare and many home deliveries were
noted (Smuts et al., 2008). Another study conducted in UMkhanyakude and Zululand indicated
that not all the children residing in these areas received vitamin A supplementation (Schoeman
et al., 2010).
As alluded to earlier, other than financial constraints, poor maternal education is also a
contributing factor to poor nutritional intake. Poor utilisation of health care facilities to obtain
vitamin A supplementation may be attributed to low levels of education. Caregivers from these
communities may be unaware of the importance of vitamin A supplementation (Faber and
Benadé, 2007), thus resulting in a poor vitamin A status in children from these areas. Maternal
60
education could play a significant role in reducing malnutrition, as mothers could be educated
on the effective utilisation of basic resources as well as family planning. This could result in
smaller families and improved nutritional status in children (Bain et al., 2013).
3.3.3 Prevention and management of malnutrition in KwaZulu-Natal As mentioned earlier, both under- and over-nutrition co-exist (nDoH et al., 2017; Shisana et al.,
2013). A possible reason why malnutrition is not detected early is that there is a poor utilisation
of health care facilities due to location as well as financial constraints (Bain et al., 2013; Chopra
et al., 2009; Smuts et al., 2008). Many caregivers only bring their children to health care
facilities when they are ill and, in most cases, the children are severely malnourished. This is
because there are a number of family members involved in the decision making on when to
bring the child to the hospital (Haskins et al., 2017).
The old policy for treating malnutrition could be a contributing factor in improving the
prevalence of wasting and underweight observed in KZN (nDoH et al., 2017; DoH, 2014;
Shisana et al., 2013). The problem with the old policy was that the primary focus was on
undernutrition in children. In KZN, since March 2018, the DoH has implemented standard
operating procedures on the prevention and management of malnutrition in KZN. The new
policy now incorporates children and adults, both under- and over-nutrition, as well as food
security. Nutritional treatment is based on the diagnosis and either nutritional advice only or
nutritional advice and nutritional supplements are issued (DoH, 2018). Table 2.5 indicates the
nutritional supplements that are issued to children under five years and pregnant and lactating
women. Different supplements are issued depending on the severity of the undernutrition and
the age of the individual (DoH, 2018).
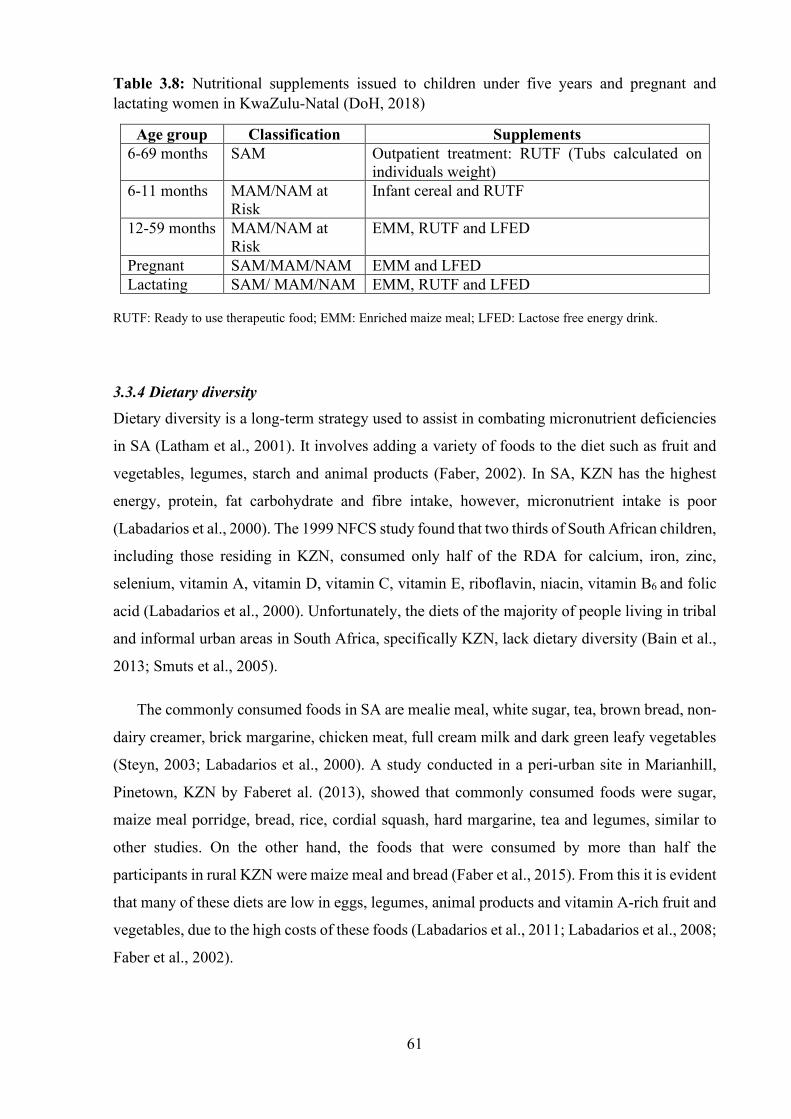
61
Table 3.8: Nutritional supplements issued to children under five years and pregnant and lactating women in KwaZulu-Natal (DoH, 2018)
Age group Classification Supplements 6-69 months SAM Outpatient treatment: RUTF (Tubs calculated on
individuals weight) 6-11 months MAM/NAM at
Risk Infant cereal and RUTF
12-59 months MAM/NAM at Risk
EMM, RUTF and LFED
Pregnant SAM/MAM/NAM EMM and LFED Lactating SAM/ MAM/NAM EMM, RUTF and LFED
RUTF: Ready to use therapeutic food; EMM: Enriched maize meal; LFED: Lactose free energy drink.
3.3.4 Dietary diversity Dietary diversity is a long-term strategy used to assist in combating micronutrient deficiencies
in SA (Latham et al., 2001). It involves adding a variety of foods to the diet such as fruit and
vegetables, legumes, starch and animal products (Faber, 2002). In SA, KZN has the highest
energy, protein, fat carbohydrate and fibre intake, however, micronutrient intake is poor
(Labadarios et al., 2000). The 1999 NFCS study found that two thirds of South African children,
including those residing in KZN, consumed only half of the RDA for calcium, iron, zinc,
selenium, vitamin A, vitamin D, vitamin C, vitamin E, riboflavin, niacin, vitamin B6 and folic
acid (Labadarios et al., 2000). Unfortunately, the diets of the majority of people living in tribal
and informal urban areas in South Africa, specifically KZN, lack dietary diversity (Bain et al.,
2013; Smuts et al., 2005).
The commonly consumed foods in SA are mealie meal, white sugar, tea, brown bread, non-
dairy creamer, brick margarine, chicken meat, full cream milk and dark green leafy vegetables
(Steyn, 2003; Labadarios et al., 2000). A study conducted in a peri-urban site in Marianhill,
Pinetown, KZN by Faberet al. (2013), showed that commonly consumed foods were sugar,
maize meal porridge, bread, rice, cordial squash, hard margarine, tea and legumes, similar to
other studies. On the other hand, the foods that were consumed by more than half the
participants in rural KZN were maize meal and bread (Faber et al., 2015). From this it is evident
that many of these diets are low in eggs, legumes, animal products and vitamin A-rich fruit and
vegetables, due to the high costs of these foods (Labadarios et al., 2011; Labadarios et al., 2008;
Faber et al., 2002).
62
3.4 Biofortification
The South African government has put various strategies in place to assist in the alleviation of
malnutrition, including VAD (DoH, 2018; DoH, 2012; Swart et al., 2008; DoH and UNICEF,
2007). However, there is still a need for a complementary or alternate strategy to assist in the
reduction of VAD. An effective and sustainable approach to address VAD could be through
biofortification (Singh et al., 2016). Biofortification is a complementary strategy that involves
the production of micronutrient-rich crops (Singh et al., 2016). The two methods used for
biofortification are genetic modification and conventional breeding (Saltzman et al., 2013;
Stevens and Winter-Nelson, 2008).
HarvestPlus has a biofortification programme that uses conventional breeding and has
identified seven crops suitable for biofortification namely; beans (Phaseolus vulgaris), maize
(Zea mays), pearl millet (Pennisetum glaucum), wheat (Triticum aestivum), cassava (Manihot
esculenta), sweet potato (Ipomoea batatas), and rice (Oryza sativa). Of the seven crops, three
crops (cassava, maize and sweet potato) have been identified for PVA-biofortification
(HarvestPlus, 2018; WHO, 2018). White maize and cream-fleshed sweet potato (CFSP) are two
commonly grown and consumed crops in SA [Department of Agriculture, Forestry and
Fisheries (DAFF), 2017; Low et al., 2017] and are therefore ideal for PVA-biofortification
(DAFF, 2017; Low et al., 2017; Mitra, 2012).
Some studies have indicated that there is a low acceptance of biofortified crops (Muzhingi et
al., 2008; Stevens and Nelson-Winter, 2008; Pillay et al., 2011). However, there have also been
reports of acceptance. Govender et al. (2014), found that caregivers were willing to give their
infants porridge made with PVA-biofortified maize if it had a health benefit and was affordable
and readily available. Additionally, Amod et al. (2016) reported that biofortified maize was
acceptable to caregivers if it was consumed with another food item such as chicken stew. Thus,
this strategy could be introduced to assist in improving the nutritional intake of poor rural
people. However, before this is implemented, there is a need to determine the acceptability of
biofortified foods in KZN.
3.5 Linking agriculture to address malnutrition
The traditional crops grown in KZN are maize, beans, potatoes, pumpkin, amadumbe and
groundnuts (Modi et al., 2006). This traditional food basket highlights a lack of dietary diversity
due to the lack of nutrient-dense foods. Due to the high cost of food, household and community
food gardens are now being promoted as an alternative means of improving availability and

63
access to nutritious foods, in poor rural households. A study conducted by Modi et al. (2006)
found that wild vegetables contributed to the nutritional intake of the study participants from
Ezigeni, a rural location in KZN. Wild vegetables are found in abundance when other
vegetables are scarce (Modi et al., 2006). KwaZulu-Natal province has the second highest
consumption of wild vegetables in SA with as many as 24 species of wild vegetables identified
in KZN. The authors noted that although these vegetables were available, there has been a
decline in their consumption. This could be attributed to the nutrition transition from traditional
diets to more westernised diets. Increased consumption of wild vegetables could improve food
insecurity by providing variety to a diet that is already nutrient deficient (Bvenura and
Afolayan, 2015; Modi et al., 2006).
Although wild vegetables are not routinely consumed and communal gardens are not
popular, many people grow foods for their own consumption. A study conducted by Faber et
al. (2013), found that cabbage and pumpkin were popular items consumed in KZN. Fifty
percent of the participants consumed cabbage and 63% grew their own pumpkin (Faber et al.,
2013). Yellow vegetables, which are high in vitamin A were only consumed by a small
percentage of children in KZN, which could be the reason for the poor vitamin A status (Faber
et al., 2015). A possible intervention to assist in improving the nutritional status of vulnerable
groups is to improve the consumption of wild vegetables. There has been a decline in the
consumption of these often-free crops due to a lack of education. These crops are most often
nutrient-dense and readily available. There are, however, challenges with the acceptability of
some of these indigenous leafy vegetables. The acceptability of indigenous crops could be
improved if people residing in rural communities were made aware of the health benefits
associated with consumption of these crops, and incorporating them into already existing
traditional dishes.
3.6 Traditional, indigenous and innovative crops with a potential to alleviate malnutrition in rural areas of South Africa, with a focus on KwaZulu-Natal
3.6.1 Alternative crops Modi et al. (2006) reported that several indigenous crops in KZN could be utilised as food
sources to diversify diets. The utilisation of these crops could provide nutrients that are
currently lacking in the diets of poor rural people. For example, amaranth, blackjack and gallant
soldier are popular indigenous crops in the Ezigeni area of KZN (Modi et al., 2006). Of these,
amaranth contains vitamin C and iron, while blackjack contains vitamin A and vitamin E (Modi
et al., 2006). A study conducted by Olumakaiye (2011) found that the vitamin C content of
64
amaranth ranged from 0.79-1.7 mg/100 g and iron content ranged from 35.42-53.58 mg/100g
(Olumakaiye, 2011). Amaranth contains non-haem iron, which is less well absorbed. However,
amaranth also contains vitamin C, which when consumed together with a non-haem iron
containing food, enhances the absorption of iron (Mahan and Raymond, 2017). It is important
to note that the amount of nutrients obtained from these nutrient-rich foods depends on the
amount eaten as well as preparation methods used. If prepared correctly and eaten in appropriate
amounts, they could be used to diversify diets, especially where other vegetables are lacking
(Modi et al., 2006). Mabhaudhi et al. (2016a) further emphasised that improved utilisation of
alternative crops could contribute to improving dietary diversity and providing nutrient-dense
foods to poor rural communities.
3.6.1.1. Sweet potato
There are four main root and tuber crops grown in Africa, namely cassava, yam, potato and
sweet potato (Sanginga, 2015). From these crops, sweet potato is a staple food crop with a short
cycle of between 3-4 months, thus suitable for double cropping (two or more crops grown on
the same land). This is advantageous especially in months where other crops are not harvested
(Sanoussi et al., 2015).
Creamed-fleshed sweet potato is the most commonly consumed sweet potato in Africa and
contains a number of vitamins and minerals such as potassium, phosphorus, vitamins C, K, E,
several B vitamins and dietary fibre. However, it lacks beta-carotene (Low et al., 2017; Mitra,
2012). It is high in carbohydrates, but low in protein and fat (Sanoussi et al., 2016). Orange-
fleshed sweet potato is a new crop that could improve nutritional status; it not only contains the
vitamins and minerals found in CFSP, but also contains beta-carotene, a good source of vitamin
A (Mitra, 2012; Burr, i 2011).
Unlike PVA-biofortified maize, several studies have shown positive responses from
participants toward OFSP, despite the orange colour (Pillay et al., 2018; Laurie et al., 2013;
Tomlins et al., 2012; Chowdhury et al., 2011; Tomlins et al., 2007). A study conducted by Pillay
et al. (2018) on infant caregivers, found that a complementary food made with OFSP was well
accepted by the caregivers (Pillay et al., 2018). Additionally, another study that investigated the
acceptance of OFSP by caregivers, reported that the OFSP was preferred to the pale-fleshed
sweet potato for all sensory attributes investigated (Low and Van Jaarsveld, 2008).
Moreover, a study conducted in Uganda found that the deep orange coloured sweet potato was
preferred over yellow or white sweet potato (Chowdhury et al., 2011). Biofortified crops have
the potential to improve the nutritional status of individuals. These crops are better accepted if
their non-biofortified counterparts are commonly consumed and known to individuals of a
65
particular area. Orange-fleshed sweet potato is a good example of this crop and further research
should be conducted on its nutritional composition and consumer acceptability.
3.6.1.2 Bambara groundnut
As mentioned earlier, a basic food basket in SA costs R883.16/month, which is a 3% increase
from 2018 (NAMC, 2019). This price rise makes animal food products unaffordable to
vulnerable households (NAMC, 2019). Plant-based proteins have also risen in price, however,
they are still cheaper than animal sources (NAMC, 2019). Legumes, a widely consumed plant
food is considered cheaper than animal sources and is a source of protein as well as
carbohydrates, minerals and vitamins (Maphosa and Jideani, 2017).
Bambara groundnut (Vigna subterranean) is an indigenous crop in Africa and is well
adapted to and thrives in the agronomical marginal regions (Chibarabada et al., 2017), where a
significant proportion of vulnerable individuals live in SSA countries, including SA. Although
bambara groundnut is grown in various parts of SA, it is an underutilised legume (Chivenge et
al., 2015). It is a traditional crop grown by subsistence farmers in Mpumalanga, Limpopo,
North-West province, Gauteng and KZN. Within KZN, this crop is grown in Greytown,
Msinga, Nkamdla, Nguthuthu, Makhati and Kosibaai (Agriculture, Forestry and Fisheries,
2016).
Unlike other legumes, bambara groundnut contains the essential amino acid methionine
(Lichtfouse, 2016; Stone et al., 2011; Mwale et al., 2007). Moreover, bambara groundnut has
been found to have high levels of essential fatty acids, minerals and vitamins (Adeleke et al.,
2018). The combination of a starch-based food such as maize and a legume such as bambara
groundnut, would result in a good quality complementary protein (Lichtfouse, 2016; Mwale et
al., 2007; Linnemann and Azam-Ali, 1993).
Unfortunately, despite the fact that bambara groundnut has the potential to form a
complementary protein when consumed with a starch-based food item and is nutrient-dense, it
is underutilised as a food source in SSA for a number of reasons (Bogart et al., 2012). Bambara
groundnut exhibits antinutritional properties and hard-to-mill and hard-to-cook properties
(Ndidi et al., 2014; Boye et al., 2010; Uvere et al., 1999). Additionally, the acceptability of
bambara groundnut is a challenge, as many South Africans are unaccustomed to this crop
(Oyeyinka et al., 2017). Although bambara groundnut is underutilised, a few studies conducted
in SA have found that when bambara groundnut was prepared in some food types, it was
positively accepted by consumers (Oyeyinka et al., 2018; Oyeyinka et al., 2017; Okafor et al.,
66
2015). Furthermore, roasting, a heat processing method, has been found to improve the protein
quality and taste of bambara groundnut (Okafor et al., 2015). Bambara groundnut is grown in
various areas of KZN, thus it could possibly be accepted by impoverished communities to
improve their nutritional status and dietary diversity. However, consumer acceptability needs
to be further investigated in rural communities of KZN.
3.7 The way forward
Despite the implemented nutrition interventions, more work is required in order to improve the
nutritional status of poor rural communities in KZN. The sustainable development goals
(SDGs) one, two and three speak explicitly to the need to (i) end poverty, (ii) achieve zero
hunger, and (iii) ensure good health and well-being (Sachs, 2012). Achieving these goals is
important and discussions on how to do that currently dominate the post-2015 debate
(Mabhaudhi et al., 2016a; Mabhaudhi et al., 2016b). It is evident that food and nutrition security
remains a major problem in developing countries, including SSA (Temple and Steyn, 2016). A
multi-disciplinary approach needs to be adopted to help address poor nutrition. Agriculture on
its own is insufficient to provide nutritious produce. Poor utilisation of nutritious foods will not
change the nutritional status of vulnerable people (Temple and Steyn, 2016).
Malnutrition is a serious public health concern, especially in children. A major contributor
to poor nutritional status is poverty. Financial insecurity directly affects the utilisation of foods,
which affects the nutritional status of vulnerable groups (Mabhaudhi et al., 2016a). According
to Mabhaudhi et al. (2016a), agriculture should be recognised as a provider of nutrition and not
as a provider of food. This emphasises the crucial role that agriculture and optimal utilisation
of nutritious food play in improving the nutritional status of vulnerable populations. Before one
can determine what optimal utilisation is for a specific population, one needs to determine
which foods are consumed within that population group. Thus, it is important to assess food
intake and identify sources of food among poor rural communities in KZN, in order to
strengthen and diversify their food systems.
3.8 Conclusions
The trends in the nutritional status of population groups in the province of KZN are similar to
national trends. There is a burden of both under- and over-nutrition. Undernutrition, specifically
stunting, remains a problem in children. Over-nutrition, including both overweight and obesity
are a problem among black African females. Data on the micronutrient status of both the rural
and urban population as well as the nutritional status of the different population groups in KZN
are limited. There is a gap in knowledge with regards to the nutritional status of rural population
67
groups in the local municipalities of uMshwathi, Msinga and eThekwini, in uMgungundlovu
and uMzinyathi Districts and the eThekwini metropolitan of KZN, which were the focus of the
current study. This is attributed to the fact that national studies aimed to determine the
nutritional status of the South African population and not specific sub-groups, within the
population. Consequently, while such studies are plausible, they have limitations of over-
generalising the nutritional status of specific sub-groups. Availability and access to nutritious
foods is a major obstacle to improving the diets of poor rural people. The majority of them rely
on social grants, which restricts them to a narrow food basket that lacks diversity. Under these
circumstances, agriculture offers an opportunity to address the availability and accessibility of
diverse nutrient-dense foods in poor rural communities. The promotion of household and
community food gardens should be encouraged. Dietary intake, habits and patterns and
nutritional status vary across the provinces in SA, as well as across defined population groups
within a province. In order to implement targeted nutritional interventions, the nutritional status
of specific provinces and defined local areas within a province should be determined. In that
regard, this study aimed to assess the nutritional status (using selected anthropometric indices
and dietary intake methods), of population groups in four defined rural areas in the local
municipalities of uMshwathi, Msinga and eThekwini, in uMgungundlovu and uMzinyathi
Districts and the eThekwini metropolitan of the KZN province.

68
References
ADELEKE OR, ADIAMO OQ, and FAWALE OS (2018) Nutritional, physiochemical, and functional
properties of protein concentrate and isolate of newly-developed bambara groundnut (Vigna subterranea
L.) cultivars. Food Sci Nutri 6 229-242.
AGRICULTURE, FORESTRY AND FISHERIES (2016) Bambara groundnuts (Vigna subterranea).
Department of Agriculture, Forestry and Fisheries, Pretoria.
ALLEN LH (2000) Anemia and iron deficiency: effects on pregnancy outcomes. Am J Clin Nutri 71(sup
1) 1280S-1284S.
AMOD R, PILLAY K, SIWELA M, and KOLANISI U (2016) Acceptance of a complementary food
based on provitamin A-biofortified maize and chicken stew. J Hum Eco 55(3) 152-159.
ARGENT J, FINN A, LEIBBRANDT M, and WOOLARD I (2009) NIDS National Income Dynamics
Study. Poverty: Analysis of the NIDS wave 1 dataset discussion paper no.13.
ARMSTRONG M, LAMBERT MI, SHARWOOD KA, and LAMBERT EV (2006) Obesity and
overweight in South African primary schoolchildren – the Health of the Nation Study. J Endocri, Meta
Diabetes S Afr 11(2) 52-62.
BAILEY RL, WEST JR KP, and BLACK RE (2015) The epidemiology of global micronutrient
deficiencies. Ann Nutri Meta 66 (sup 2) 22-33. doi:10.1159/000371618.
BAIN LE AWAH PK, GERALDINE N, KINDONG NP, SIGAL Y, BERNARD N and TANJEKO AT
(2013) Malnutrition in Sub-Saharan Africa: burden causes and prospects Pan-Afri Med J 15
120doi1011604/pamj2013151202535. http://wwwpanafrican-med-
journalcom/content/article/15/120/full/? (Accessed on 28/09/18).
BOGART KR, TICKLE-DEGNEN L, and JOFFE MS (2012) Social interaction experiences of adults
with Moebius Syndrome: a focus group. J Health Psych 17(8) 1212-1222.
BOURNE LT, LAMBERT EV, and STEYN K (2002) Where does the black population of South Africa
stand on the nutrition transition? Public Health Nutr 5(1A) 157-162.
BOYE J, ZARE F, and PLETCH A (2010) Pulse proteins: processing, characterization, functional
properties and applications in food and feed. Food Res Int 43 414-431.
BURRI BJ (2011) Evaluating sweet potato as an intervention food to prevent vitamin A deficiency.
Compr Rev Food Sci Food Saf 10 118-130.
BVENURA C and AFOLAYAN AJ (2015) The role of wild vegetables in household food security in
South Africa: A review. Food Res Int 76 1001-1011.
69
CHIBARABADA TP, MODI AT and MABHAUDHI T (2017) Expounding the value of grain legumes
in the semi-and arid tropics Sustain 9, 60; https://doi.org/10.3390/su9010060
CHIVENGE P, MABHAUDHI T, MODI AT, and MAFONGOYA P (2015) The potential of neglected
and underutilised crop species as future crops under water scarce conditions in sub-Saharan Africa. Int
J Environ Res Public Health 12 5685-5711.
CHOPRA M, DAVIAUD E, PATTINSON R, FONN S, and LAWN JE (2009) Saving the lives of South
Africa’s mothers, babies and children. Can the health system deliver? Lancet 374 (9692) 835-846.
CHOWDHURY S, MEENAKSHI JV, TOMLINS KI, OWORI C (2011) Are consumers in developing
countries willing to pay more for micronutrient-dense biofortified foods? Evidence from a field
experiment in Uganda. Am J Agri Eco 93 (1) 83-97.
DEPARTMENT OF AGRICULTURE, FORESTRY AND FISHERIES (DAFF) (2017). Trends in the
Agricultural Sector 2017. 1-77.
http://www.daff.gov.za/Daffweb3/Portals/0/Statistics%20and%20Economic%20Analysis/Statistical%
20Information/Trends%20in%20the%20Agricultural%20Sector%20217.pdf. (Accessed on
09/09/2018).
DEPARTMENT OF HEALTH (DoH) (2013) Roadmap for nutrition in South Africa 2013-2017.
http://www.adsa.org.za/Portals/14/Documents/DOH/Nutrition%20Road%20Map%20 2013-2017.pdf
(Accessed on 30/07/2017).
DEPARTMENT OF HEALTH (DoH) (2014) Guidelines on the Integrated Management of Acute
Malnutrition (IMAM) in KwaZulu-Natal. www.kznhealth.gov.za/family/MCWH/KZN-IMAM-
Guidelines.pdf (Accessed on 28/02/2016).
DEPARTMENT OF HEALTH (DoH) (2018) Standard operating procedures on the prevention and
management of malnutrition in KZN. DoH, Pietermaritzburg
DEPARTMENT OF HEALTH (DOH), UNITED NATIONS CHILDREN’S FUND (UNICEF) (2007)
A Reflection of the South African Maize Meal and Wheat Flour Fortification Programme (2004 to
2007). https://www.unicef.org/southafrica/SAF_resources_wheatfortificationn.pdf (Accessed on
17/8/2017).
DEVANATHAN R, ESTERHUIZEN TM, and GOVENDER RD (2013) Overweight and obesity
amongst Black women in Durban, KwaZulu-Natal: A ‘disease’ of perception in an area of high HIV
prevalence. Afr J Prim Health Care Fam Med 5 1-7.
DUNCAN PR, HOWE LD, MANUKUSA Z, and PURDY S (2014) Determinants of obesity and
perception of weight in hypertensive patients in rural South Africa. S Afri J Clin Nutr 27 56-62.
70
ESCOTT-STUMP S (2015) Nutrition and Diagnosis-Related Care, 8th ed. Wolters Kluwer,
Philadelphia.
FABER M, and BENADÉ AJS (2007) Breastfeeding, complementary feeding and nutritional status of
6-12-month-old infants in rural KwaZulu-Natal. S Afri J Clin Nutr 20 16-24.
FABER M, and WENHOLD F (2007) Nutrition in contemporary South Africa. Water SA 33(3) 393-
400.
FABER M, JOGESSAR VB, and BENADÉ AJS (2001) Nutritional status and dietary intakes of
children aged 2-5 years and their caregivers in a rural South African community. Intl J Food Sci Nutri
52 401-411.
FABER M, LAUBSCHER R, and LAURIE S (2013) Availability of, access to and consumption of fruits
and vegetables in a peri-urban in KwaZulu-Natal, South Africa. Maternal and Child Nutrition 9 409-
424.
FABER M, PHUNGULA MAS, VENTER SL, DHANSAY MA, and BENADÉ AJS (2002) Home
gardens focusing on the production of yellow and dark-green leafy vegetables increase the serum retinol
concentrations of 2-5-y-old children in South Africa. Am J Clin Nutri 76 1048-1054.
FABER M, VAN JAARSVELD PJ, KUNNEKE G, KRUGER HS, SCHOEMAN SE, and VAN
STUIJVENBERG ME (2015) Vitamin A and anthropometric status of South African preschool children
from four areas with known distinct eating patterns Nutrition 31 64-71.
FOOD AND AGRICULTURE ORGANISATION OF THE UNITED NATIONS (FAO),
INTERNATIONAL FUND FOR AGRICULTURAL DEVELOPMENT (IFAD), UNITED NATIONS
CHILDREN’S FUND (UNICEF), WORLD FOOD PROGRAMME (WFP), and WORLD HEALTH
ORGANISATION (WHO) (2017) The state of food security and nutrition in the world 2017. Building
resilience for peace and food security. FAO, Rome.
GILLESPIE S, and MASON J (1994) Controlling Vitamin A Deficiency – Nutrition Policy Discussion
Paper No. 14. ACC/SCN, Geneva
GOVENDER L, PILLAY K, DERERA J, and SIWELA M (2014) Acceptance of a complementary food
prepared with yellow, provitamin A-biofortified maize by black caregivers in rural KwaZulu-Natal. S
Afri J Clin Nutr 27(4) 217-221.
GOVENDER L, PILLAY K, SIWELA M, MODI A and MABHAUDHI T (2017) Food and Nutrition
Insecurity in Selected Rural Communities of KwaZulu-Natal South Africa – Linking Human Nutrition
and Agriculture Int J Environ Res Public Health 14 17 doi: 103390/ijerph14010017
71
GROBBELAAR HH, NAPIER CE, and OLDEWAGE-THERON W (2013) Nutritional status and food
intake data on children and adolescents in residential care facilities in Durban. S Afri J Clin Nutr 26 29-
36.
GWETU TP, CHHAGAN M, CRAIB M, TAYLOR M, and KAUCHALI S (2015) Persistent and new-
onset anaemia in children aged 6-8 years from KwaZulu-Natal province, South Africa. S Afri J Child
Health 9 127-129.
HARVESTPLUS (2018) Crops: It all starts will a seed http://wwwharvestplusorg/what-we-do/crops
(accessed on 09/09/18)
HASKINS L, GRANT M, PHAKATHI S, WILFORD A, JAMA N, and HORWOOD C (2017) Insights
into health care seeking behaviour for children in communities in KwaZulu-Natal, South Africa. Afri J
Prim Health Care and Fam Med 9 a1378. https://doi.org/10.4102/phcfm.v9i1.1378.
HASLAM DW, and JAMES WPT (2005) Obesity. Lancet 366 1197-1209.
HEALTH SYSTEMS TRUST (HST) (2016) Malnutrition causes, economic loss, half of all child
deaths. http://www.hst.org.za/news/malnutrition-causes-economic-loss-half-all-child-deaths (Accessed
on 04 September 2016).
INSTITUTE OF MEDICINE (2006) Dietary reference intakes: The essential guide to nutrient
requirements. Washington DC: National Academy Press.
INTERNATIONAL ANALYTICAL GROUP (2016) Section Feed Analysis International Analytical
Group: Hollywood FL USA https://wwwagesat/en/service/services-feed/feed/round-robin-tests/iag/
(accessed on 10/05/19)
JINABHAI CC, TAYLOR M, SULLIVAN KR (2003) Implications of the prevalence of stunting,
overweight and obesity amongst South African primary school children: a possible nutritional
transition? Euro J Clin Nutr 57 358-365.
KIMANI-MURAGE EW, KAHN K, PETTIFOR JM, TOLLMAN SM, DUNGER DB, GÓMEZ-
OLIVÉ XF, and NORRIS S (2010) The prevalence of stunting, overweight and obesity, and metabolic
disease risk in rural South African children. Biomed Central Public Health 10(158) 1-13.
KOLAHDOOZ F, SPEARING K, and SANGITA S (2013) Dietary adequacies among South African
adults in rural KwaZulu-Natal. PLos ONE 8(6) e67184
doi:10.1371/journal.pone.0067184.
LA FRANO MR, DE MOURA FF, BOY E, LÖNNERDAL B and BURRI BJ (2014) Bioavailability of
iron zinc and provitamin A carotenoids in biofortified staple crops Nutr Rev 72 289-307

72
LABADARIOS D, and VAN MIDDELKOOP AM (1995) The South African Vitamin A Consultative
Group. Children Aged 6-71 Months in South Africa, 1994; Their Anthropometric, Vitamin A, Iron and
Immunization Coverage Status. Isando, South Africa.
LABADARIOS D, MOODIE IM, and VAN RENSBURG A (2007) Vitamin A status: In: Labadarios
D. National Food Consumption Survey: Fortification Baseline, Chapter 9B: South Africa 2005.
Department of Health, Stellenbosch.
LABADARIOS D, STEYN N, MAUNDER E, MACINTYRE U, SWART R, GERICKE G,
HUSKISSON J, DANNHAUSER A, VORSTER HH, and NESAMVUNI EA (2000) The National Food
Consumption Survey (NFCS): children aged 1-9 years, South Africa 1999. Department of Health:
Directorate of Nutrition, Pretoria.
LABADARIOS D, STEYN NP, NEL J (2011) How diverse is the diet of adult South Africans? Nutr J
10(33) 1-11.
LABADARIOS D, SWART R,MAUNDER EMW, KRUGER HS, GERICKE GJ, KUZWAYO PMN,
NTSIE PR, STEYN NP, SCHLOSS I, DHANSAY MA, JOOSTE PL, DANNHAUSER A, NEL JH,
MOLEFE D and KOTZE TJVW (2008) The national food consumption survey Fortification baseline
(NFCS:FB-1) S Afr J Clin Nutri 21(3) (supp 2) 246-271
LATHAM MC, ASH D, NDOSSI G, MEHANSHO H, and TATALA S (2001) Micronutrient dietary
supplements: a new fourth approach. Arch Latino Am Nutr 51(1) 37-41.
LAURIE SM and VAN HEERDEN SM (2012) Consumer acceptability of four products made from
beta-carotene-rich sweet potato Afr J Food Sci 6 96-103
LAURIE SM, FABER M, CALITZ FJ, MOELICH EI, MULLER N, and LABUSCHAGNE T (2013).
The use of sensory attributes, sugar content, instrumental data and consumer acceptability in selection
of sweet potato varieties. J Sci Food Agri 93 1610-1619.
LICHTFOUSE E (2016) Sustainable agriculture reviews, 19th ed. Springer international publishing,
Switzerland.
LINNEMANN A, and AZAM-ALI S (1993) Bambara groundnut (Vigna subterranean L. verde).
Underutilised crops series II vegetables and pulses. London.
LOW JW and VAN JAARSVELD PJ (2008) The potential contribution of bread buns fortified with
beta-carotene-rich sweet potato in central Mozambique Food Nutr Bull 29 98-107
LOW JW, MWANGA ROM, ANDRADE M, CAREY E, and BALL A (2017) Tackling vitamin A
deficiency with biofortified sweet potato in sub-Saharan Africa. Glob Food Secur 14 23-30
http://dx.doi.org/10.1016/j.gfs.2017.01.004.
73
LUTTER CK, DAELMANS BMEG, DE ONIS M, KOTHARI MT, RUEL MT, ARIMOND M,
DEITCHLER M, DEWEY KG, BLӦSSNER M, and BORGHI S (2011) Undernutrition, poor feeding
practices, and low coverage of key nutrition interventions. J Am Acad Paedatr 128 e1418-e1427.
MABHAUDHI T, CHIBARABADA T and MODI A (2016) Water-food-nutrition-health nexus:
Linking water to improving food nutrition and health in Sub-Saharan Africa Int J Environ Res Public
Health 13 1-19
MABHAUDHI T, O’REILLY P, WALKER S, and MWALE S (2016b) Opportunities for Underutilised
Crops in Southern Africa’s Post-2015 Development Agenda. Sustain 8 302. doi:10.3390/su8040302.
MAHAN LK, and RAYMOND JL (2017) Food and Nutrition Care Process, 14th ed. Elsevier, St. Louis.
MAHAN LK, ESCOTT-STUMP S, and RAYMOND JL (2012) Krause’s Food and the Nutrition Care
Process, 13th ed. St Louis: Elsevier.
MANARY MJ, and SANDIGE HL (2008) Management of acute moderate and severe childhood
malnutrition. Br Med J 337 1227-1230.
MAPHOSA Y and JIDEANI VA (2017) The role of legumes in Human Nutrition Chapter 6 In: Hueda
MC ed Functional food Intech open doi:105772/intechopen69127
MITRA S (2012) Nutritional status of orange-fleshed sweet potatoes in alleviating vitamin A
malnutrition through a food-based approach J Nutri Food Sci 2 1-3
MODI M, MODI AT, HENDRIKS S (2006) Potential role for wild vegetables in household food
security: A preliminary case study in KwaZulu-Natal, South Africa. Afr J Food Agr Nutr Dev 6 1-13.
MUZHINGI T, LANGYINTUO AS, MALABA LC, and BANZIGER M (2008) Consumer
acceptability of yellow maize products in Zimbabwe. Food Policy 33 352-361.
MWALE S, AZAM-ALI S, and MASSAWE FJ (2007) Growth and development of Bambara groundnut
(Vigna subterranea) in response to soil moisture: 1. Dry matter and yield. Eur J Agron 26 345-353.
NAPIER C, and OLDEWAGE-THERON W (2015) Dietary intake and nutritional status of adolescent
girls and young women in Durban, South Africa. J Family Eco Cons Sci 43 1-15.
NAPOLI M, DE MURO P, and MAZZIOTTA M (2011) Towards a food insecurity multidimensional
index (FIMI). Master in human development and food security (2010/2011). Roma Tre University,
Rome. http://www.fao.org/fileadmin/templates/ERP/un/FIMI.pdf (Accessed on 29/06/2016).
NATIONAL AGRICULTURAL MARKETING COUNCIL (NAMC) (2019) Markets and economic
research centre: food basket price monthly https://wwwnamccoza/wp-content/uploads/2019/04/NAMC-
Food-Basket-Price-Monthly-Apr-2019pdf (accessed on 20/05/19)

74
NATIONAL DEPARTMENT OF HEALTH (nDoH), STATISTICS SOUTH AFRICA (StatsSA),
SOUTH AFRICAN MEDICAL RESEARCH COUNCIL (SAMRC), AND ICF (2019) South Africa
Demographic and Health Survey 2016. NDoH, StatsSA, SAMRC and ICF, Pretoria.
NATIONAL DEPARTMENT OF HEALTH (nDoH), STATISTICS SOUTH AFRICA (StatsSA),
SOUTH AFRICAN MEDICAL RESEARCH COUNCIL (SAMRC), ICF (2017) South Africa
Demographic and Health Survey 2016: Key indicators. Health and vital statistics division, Pretoria.
NDIDI US, NDIDI CU, AIMOLA IA, BASSA OY, MANKILIK M, and ADAMU ZC (2014) Effects
of processing (boiling and roasting) on the nutritional and antinutritional properties of bambara
groundnuts (vigna subterranean [L.] verdc.) from Southern Kaduna, Nigeria. J Food Proces.
doi.org/10.1155/2014/472129.
OELOFSE A, FABER M, BENADÉ AJ, and KENOYER DG (1999) The nutritional status of the rural
community in KwaZulu-Natal, South Africa: The Ndunakazi project. Central Afr J Med 45 14-19.
OKAFOR JNC, OKAFOR G, LEELAVATHI K, BHAGYA S, and ELEMO GN (2015) Effect of
roasted bambara groundnut (voandzeia subterranean) fortification on quality and acceptability of
biscuits. Pak J Nutr 14 653-657.
OLUMAKAIYE MF (2011) Evaluation of nutrient contents of amaranth leaves prepared using different
cooking methods. Food Nutr Sci 2 249-252.
OYEYINKA AT, PILLAY K and SIWELA M (2017) Consumer awareness and acceptability of
bambara groundnut as a protein source for use in complementary foods in rural KwaZulu-Natal South
Africa J Clin Nutr 30 87-92.
OYEYINKA SA, TIJANI TS, OYEYINKA AT, ANSE AK, BALOGUN MA, KOLAWOLE FL,
OBALOWU MA and JOSEPH KJ (2018) Value added snacks produced from bambara groundnut (vigna
subterranean) paste or flour LWT – Food Sci Techn 58 120-131.
PASRICHA S, DRAKESMITH H, BLACK J, DAVID H, and BIGGS B (2013) Control of iron
deficiency anaemia in low-and middle-income countries. Blood J 121 2607-2617.
PILLAY K, DERERA J, SIWELA M, and VELDMAN FJ (2011) Consumer acceptance of yellow,
provitamin A-biofortified maize in KwaZulu-Natal. S Afr J Clin Nutr 24 186-191.
PILLAY K, KHANYILE N, and SIWELA M (2018) Acceptance of an orange-fleshed sweet potato
complementary food by infant caregivers in KwaZulu-Natal province-a preliminary study. S Afr J Child
Health 12 100-104.
PRETORIUS B, and SCHÖNFELDT HC (2012) Vitamin A content of fortified maize meal and porridge
as purchased and consumed in South Africa. Food Res Int 47 128-133.
75
REPUBLIC OF SOUTH AFRICA (RSA) (2019) Tito Titus Mboweni Minister of Finance: 2019 budget
speech. http://www.treasury.gov.za/documents/national%20budget/2019/speech/speech.pdf (Accessed
on 03/03/2019).
SACHS JD (2012) From millennium development goals to sustainable development goals. Lancet 379
2206-2211.
SALTZMAN A, BIROL E, BOUIS HE, BOY E, DE MOURA FF, ISLAM Y, and PFEIFFER WH
(2013) Biofortification: progress toward a more nourishing future. Global Food Secur 2 9-17.
SANGINGA N (2015) Background paper: root and tuber crops (cassava, yam, potato and sweet potato).
United Nations Economic Commission for Africa. Feed Afr 21-23 October 2015.
https://www.afdb.org/fileadmin/uploads/afdb/Documents/Events/DakAgri2015/Root
and_Tuber_Crops__Cassava__Yam__Potato_and_Sweet_Potato_.pdf (Accessed on 5/10/2017).
SANOUSSI AF, ADJATIN A, DANSI A, ADEBOWALE A, SANNI LO, and SANNI A (2016)
Mineral composition of ten elite sweet potato (ipomoea batatas [L.] Lam.) Landraces of Benin. Int J
Curr Microbio Appl Sci 5 103-115.
SCHOEMAN S, FABER M, ADAMS V, SMUTS C, FORD-NGOMANE N, LAUBSCHER J, and
DHANSAY M (2010) Adverse social, nutrition and health conditions in rural districts of the KwaZulu-
Natal and Eastern Cape Provinces, South Africa. S Afri J Clin Nutr 23(3) 140-147.
SCHÖNFELDT HC, GIBSON N, and VERMEULEN H (2010) The possible impact of inflation on
nutritionally vulnerable households in a developing country using South Africa as a case study. Nutr
Bull 35 254-267.
SHISANA O, LABADARIOS D, REHLE T, SIMBAYI L, ZUMA K, DHANSAY A, REDDY P,
PARKER W, HOOSAIN E, NAIDOO P, HONGORO C, MCHIZA Z, STEYN NP, DWANE N,
MAKOAE M, MALULEKE T, RAMLAGAN S, ZUNGU N, EVANS MG, JACOBS L, FABER M and
SANHANES-1 Team (2013) South African National Health and Nutrition Examination Survey
(SANHANES-1) Cape Town: HSRC Press
SINGH U, PRAHARAJ CS, SINGH SS, and SINGH NP (2016) Biofortification of food crops. Springer.
New Delhi.
SMUTS CM, DHANSAY MA, FABER M, VAN STUIJVENBERG ME, SWANEVELDER S, GROSS
R and BENADÉ AJS (2005) Efficacy of multiple micronutrient supplementation for improving anaemia
micronutrient status and growth in South Africa infants J Nutr 135 653S-659
SMUTS CM, FABER M, SCHOEMAN SE, LAUBSCHER JA, OELOFSE A, BENADÉ AJS, and
DHANSAY MA (2008) Socio-demographic profiles and anthropometric status of 0-to 71-month-old
76
children and their caregivers in rural districts of the Eastern Cape and KwaZulu-Natal provinces of South
Africa. S Afri J Clin Nutr 21(3) 117-124.
SPEARING K, KOLAHDOOZ F, LUKASEWICH M, MATHE N, KHAMIS T, and SHARMA S
(2012) Nutritional composition of commonly consumed composite dishes in rural villages in
Empangeni, KwaZulu-Natal, South Africa. J Human Nutr Diet 1-8. doi:10.1111/jhn.12001.
STATISTICS SOUTH AFRICA (StatsSA) (2017) Poverty trends in South Africa. An examination of
absolute poverty between 2016 and 2015. Statistics South Africa: Pretoria.
STATISTICS SOUTH AFRICA (StatsSA) (2019) General household survey 2018. Statistics South
Africa: Pretoria. http://www.statssa.gov.za/publications/P0318/P03182018.pdf (Accessed on
20/09/2019).
STEVENS R, and WINTER-NELSON A (2008) Consumer acceptance of provitamin A-biofortified
maize in Maputo, Mozambique. Food Policy 33 341-351.
STEYN NP, NEL JH, and CASEY A (2003) Secondary data analyses of dietary surveys undertaken in
South Africa to determine usual food consumption of the population. Public Health Nutr 6 631-644.
STONE A, MASSEY A, THEOBALD M, STYSLINGER M, KANE D, KANDY D, TUNG A,
ADEKOYA A, MADAN J, DAVERT E (2011) African’s indigenous crops.
http://www.NourishingthePlanet.org. (Assessed on 01/08/2017).
STRASSER R (2003) Rural health around the world: challenges and solutions. Family Pract 20 457-
463.
SWART R, SANDERS D, and MCLACHLAN M (2008) Nutrition: A Primary Health Care Perspective
http://healthlink.org.za/uploads/files/chap9_08.pdf (Accessed on 28/01/2016).
TATHIAH N, MOODLEY I, MUBAIWA V, DENNY L, and TAYLOR M (2013) South African’s
nutritional transition: overweight, obesity, underweight and stunting inn female primary school learners
in rural KwaZulu-Natal, South Africa. S Afr Med J 10 718-723.
TEMPLE NJ, and STEYN N (2016) Community Nutrition for Developing Countries. UNISA Press,
Pretoria.
TOMLINS K, NDUNGURU C, STAMBUL K, JOSHUA N, NGENDELLO T, RWIZA E, AMOUR R,
RAMADHANI B, KAPANDE A, and WESTBY A (2007) Sensory evaluation and consumer
acceptability of pale-fleshed and orange-fleshed sweet potato by school children and mothers with
preschool children J Sci Food Agri 98 2320-2331.
TOMLINS K, OWORI C, BECHOFF A, MENYA G, and WESTBY A (2012) Relationship among the
carotenoid content, dry matter content and sensory attributes of sweet potato. Food Chem 131(1) 14-21.
77
TUNKYI K, and MOODLEY J (2016) Prevalence of anaemia in pregnancy in a regional health facility
in South Africa S Afr Med J 106 101-104.
UNITED NATIONS CHILDREN’S FUND (UNICEF) (1998) The State of the World’s Children 1998.
http://www.unicef.org/sowc98/silent4.htm (Accessed on 26/06/2016).
UNITED NATIONS CHILDREN’S FUND (UNICEF) (2012) Child info: Monitoring the situation of
children and woman. http://www.childinfo.org/malnutrition_status.html (Accessed on 18/07/2016).
UNITED NATIONS CHILDREN’S FUND (UNICEF) (2016) Stunting reflects chronic undernutrition
during the most critical periods of growth and development in early life.
http://unicef.in/Whatwedo/10/stunting (Accessed on 15/06/2016).
UVERE P, UWAEGBUTE A, and ADEDEJI E (1999) Effects of malting on the milling performance
and acceptability of bambara groundnut (voandzela subterranea thouars) seeds and products. Plant Food
Human Nutr 54 49-57.
VAN ZYL S, VAN DER MERWE LJ, WALSH CM, GROENEWALD AJ, and VAN ROOYEN FC
(2012) Risk factor profiles for chronic diseases of lifestyle and metabolic syndrome in an urban and
rural setting in South Africa. Afr J Prim Health Care Fam Med 4 1-10.
WENHOLD F, ANNANDALE J, FABER M, and HART T (2012) Water use and nutrient content of
crop and animal food products for improved household food security: A scoping study: report to the
water research commission TT
537/12http://wwwwrcorgza/Knowledge%20Hub%20Documents/Research%Reports/TT%20537-
12pdf (accessed on 03/09/16)
WOOLARD I (2012) An overview of poverty and inequality in South Africa. Working paper for DFID
(SA) 1-15.
WORLD HEALTH ORGANISATION (WHO) (2008) Training course on child growth assessment.
WHO, Geneva.
WORLD HEALTH ORGANISATION (WHO) (2013) Malnutrition: Maternal, New Born, Child and
Adolescent Health. (Accessed on 27/08/2015).
WORLD HEALTH ORGANISATION (WHO) (2014) Integrated management of childhood illness
(IMAM): distance learning course module 6; Malnutrition and anaemia.
Http://apps.who.int/iris/bitstream/10665/104772/8/9789241506823_Module-6_eng.pdf?ua=1
(Accessed on 15/08/2017).
WORLD HEALTH ORGANISATION (WHO) (2015) Micronutrients. WHO, Geneva.
78
WORLD HEALTH ORGANISATION (WHO) (2016) Poverty http://www.who.int/topics/poverty/en/
(Accessed on 30/06/2016).
WORLD HEALTH ORGANISATION (WHO) (2017) Global database on child growth and
malnutrition. https://www.int/nutgrowthdb/about/introduction/en/ (Accessed on 07/08/2017).
WORLD HEALTH ORGANISATION (WHO) (2019) Malnutrition. https://www.who.int/news-
room/fact-sheets/detail/malnutrition (Accessed on 01/10/2019).
WORLD HEALTH ORGANISATION (WHO), and UNITED NATIONS CHILDREN’S FUND
(UNICEF) (2009) WHO Child Growth Standards and the Identification of Severe Acute Malnutrition
in Infants and Children. WHO, Geneva.
ZHOU J, LURIE MN, BÄRNIGHAUSEN T, MCGARVEY ST, NEWELL M, and TANSER F (2012)
Determinants and spatial patterns of adult overweight and hypertension in a high HIV prevalence rural
South African population. Health Place 18 1300-1306.
ZIRABA AK, FOTSO JC, and OCHAKO R (2009) Overweight and obesity in urban Africa: a problem
of the rich or poor? Biomed Cent Public Health 9 465-475.
79
CHAPTER 4
ASSESSMENT OF THE NUTRITIONAL STATUS OF FOUR SELECTED RURAL COMMUNITIES IN KWAZULU-NATAL
L Govender, K Pillay, M Siwela, AT Modi and T Mabhaudhi
4.1 Introduction
Malnutrition, including both under- and over-nutrition, remains an ongoing challenge
worldwide (Development Initiatives, 2017), especially in children (FAO et al., 2017). The 2018
Global Nutrition Report indicated that stunting and wasting affected 150.8 and 50.5 million
children under five years, respectively, while 38.3 million children under the age of five years
were overweight (Development Initiatives, 2018). In Africa, the percentage of stunted children
under five years of age had increased from 50.6 million in 2000 to 58.7 million in 2017
(Development Initiatives, 2018). Child malnutrition is most prevalent in the sub-Saharan
African region and there are inter-and-intra-country variations in malnutrition trends
(Development Initiatives, 2017; FAO et al., 2017).
A number of national studies investigated the nutritional status of the South African
population. The 2012 SANHANES-1 study, which investigated the nutritional status of all
South Africans, found that underweight (5.5%) and wasting (2.5%) rates had improved in
children (Shisana et al., 2013). While these results showed an improvement compared to
previous national studies, the nutritional status of children and other vulnerable population
groups such as women of childbearing age is still a cause for concern. The National Food
Consumption Survey-Fortification Baseline (NFCS-FB) of 2005 showed that nationally, one
out of five and one out of ten South African children were stunted and underweight, respectively
(Labadarios et al., 2007). The prevalence of stunting among children from the 2012
SANHANES-1 and the 2016 South African Demographic and Health Survey (SADHS), which
was 21.6% and 27%, respectively, has worsened since the 2005 NFCS-FB study (Shisana et al.,
2013; nDoH et al., 2017). Stunting is a form of undernutrition and can result in fever,
dehydration due to diarrhoea, compromised immunity and acute respiratory infections, which
could lead to morbidity and mortality (Manary and Sandige, 2008; Escott-Stump, 2015; HST,
2016; UNICEF, 2016). This emphasises that stunting is a public health concern (Labadarios et
al., 2007; Shisana et al., 2013; nDoH et al., 2017).
80
National studies conducted in SA between 1994 and 2005 revealed that the prevalence of
VAD had doubled amongst children. The 2012 SANHANES-1 study reported that the
prevalence of VAD in children was still high, despite a 20% drop since the 2005 NFCS-FB
study (Labadarios and Van Middelkoop, 1995; Labadarios et al., 2000; Labadarios et al., 2007;
Shisana et al., 2013). The 2005 NFCS-FB study showed that in children, the intakes of energy
and several essential micronutrients including, calcium, iron, selenium, vitamins, D, C and E,
riboflavin, niacin, vitamin B6 and folic acid, was less than two-thirds of the recommended
dietary allowance (RDA) (Labadarios et al., 2007).
Both under- and over-nutrition remain a concern among South African children (Shisana et
al., 2013). Undernutrition leads to several health conditions, including those linked to protein-
energy malnutrition (PEM) and micronutrient deficiencies (Faber and Wenhold, 2007;
UNICEF, 2016; UNICEF et al., 2017). There are a number of factors responsible for the vicious
cycle of child malnutrition as described by the UNICEF conceptual framework (UNICEF,
1998) (Figure 4.1). The main factors include poverty, food and nutrition insecurity, inadequate
infrastructure and poor access to healthcare facilities and limited education (Smuts et al., 2008;
Manary and Sandige, 2008; Chopra et al., 2009; Kimani-Murage et al., 2010; Bain et al., 2013).
There are several possible causes of childhood obesity. These include increased
consumption of poor-quality high-energy foods, children born to mothers who were overweight
or obese during pregnancy, overweight or obese parents, poor physical activity and metabolic
disorders (Escott-Stump, 2015, p626). Overweight and obesity are serious health concerns,
especially in children, as it increases the risk of other chronic diseases of lifestyle later, such as
cardiovascular disease, hypertension and diabetes mellitus (Joubert et al., 2007; Escott-Stump,
2015). Stunting in children increases the risk of obesity in adulthood (FAO et al., 2017).
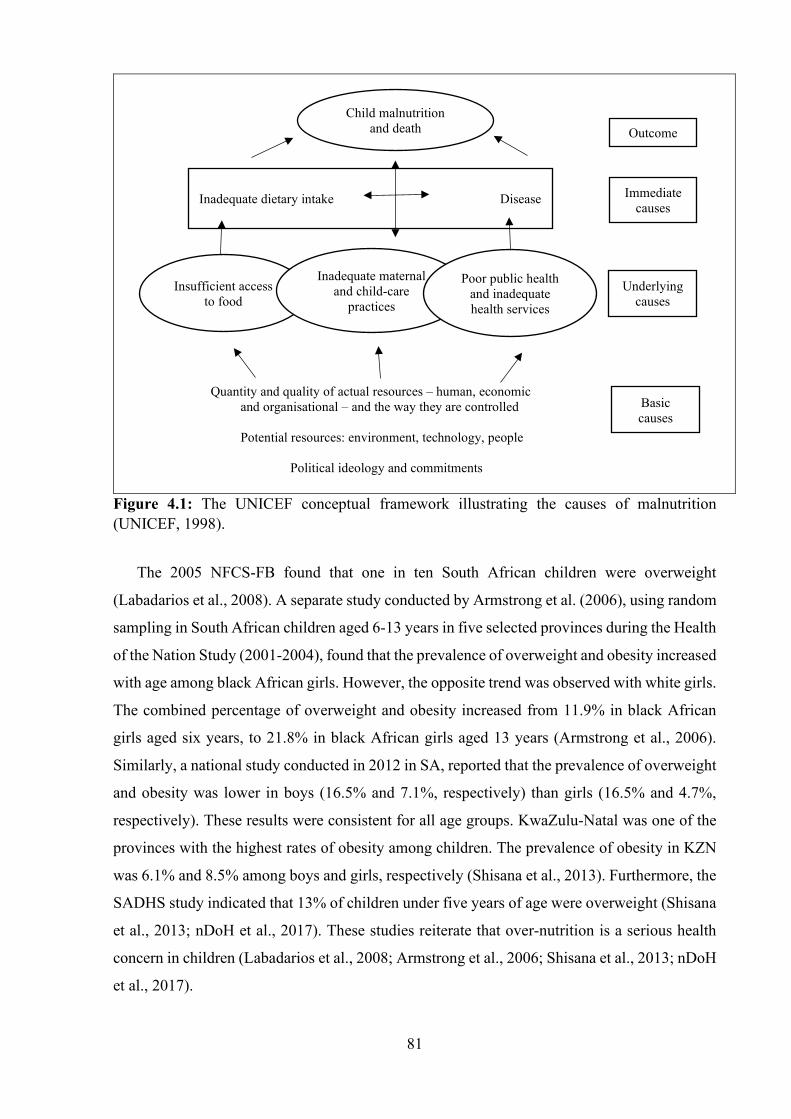
81
Quantity and quality of actual resources – human, economic and organisational – and the way they are controlled
Potential resources: environment, technology, people
Political ideology and commitments
Figure 4.1: The UNICEF conceptual framework illustrating the causes of malnutrition (UNICEF, 1998).
The 2005 NFCS-FB found that one in ten South African children were overweight
(Labadarios et al., 2008). A separate study conducted by Armstrong et al. (2006), using random
sampling in South African children aged 6-13 years in five selected provinces during the Health
of the Nation Study (2001-2004), found that the prevalence of overweight and obesity increased
with age among black African girls. However, the opposite trend was observed with white girls.
The combined percentage of overweight and obesity increased from 11.9% in black African
girls aged six years, to 21.8% in black African girls aged 13 years (Armstrong et al., 2006).
Similarly, a national study conducted in 2012 in SA, reported that the prevalence of overweight
and obesity was lower in boys (16.5% and 7.1%, respectively) than girls (16.5% and 4.7%,
respectively). These results were consistent for all age groups. KwaZulu-Natal was one of the
provinces with the highest rates of obesity among children. The prevalence of obesity in KZN
was 6.1% and 8.5% among boys and girls, respectively (Shisana et al., 2013). Furthermore, the
SADHS study indicated that 13% of children under five years of age were overweight (Shisana
et al., 2013; nDoH et al., 2017). These studies reiterate that over-nutrition is a serious health
concern in children (Labadarios et al., 2008; Armstrong et al., 2006; Shisana et al., 2013; nDoH
et al., 2017).
Child malnutrition and death Outcome
Inadequate dietary intake Disease Immediate causes
Insufficient access to food
Inadequate maternal and child-care
practices
Poor public health and inadequate health services
Underlying causes
Basic causes

82
Over-nutrition is also prevalent among South African adults, especially women. On a
national level, the 2016 SADHS indicated that one in five women were severely obese with a
BMI > 35kg/m2 (nDoH et al., 2017). The 2012 SANHANES-1 study revealed that the
prevalence of overweight and obesity was higher among women (24.8% and 39.2%,
respectively), compared to men (20.1% and 10.6%, respectively). The highest prevalence of
overweight in men was found in the Western Cape (26.9%), KZN (23.7%) and Gauteng
(21.0%). Furthermore, Gauteng (28.1%), Mpumalanga (26.2%) and KZN (25.2%) provinces
had the highest prevalence of overweight, while KZN (44.0%), the Free State (43.0%) and the
Eastern Cape (41.8%) provinces had the highest prevalence of obesity in SA (Shisana et al.,
2013). There is a high prevalence of overweight and obesity among South African women,
which negatively affects their health and nutritional status. Obesity can lead to a number of
health-related issues such as arthritis, sleep apnoea, hypertension, diabetes, heart disease, breast
cancer, stroke, gall bladder disease, and non-alcoholic fatty liver disease. Additionally, severely
obese individuals are at higher risk of mortality due to the health conditions associated with
obesity (Sizer and Whitney, 2017). A possible reason for the high rates of obesity seen among
the South African population could be as a result of the nutrition transition, whereby refined
diets high in sugar, fat and salt have replaced traditional diets, high in fibre (Faber and Wenhold,
2007; Schönfeldt et al., 2010; Lutter et al., 2011).
In most sub-Saharan African countries, including SA, the majority of rural communities
consume diets that are limited in variety and inadequate in fruit and vegetables (WHO, 2013).
As mentioned earlier, poverty is a major contributing factor to inadequate food intake, which
leads to malnutrition. The 2015 statistics indicated that one in every two South Africans is living
in poverty, which equates to approximately 30.4 million South Africans (StatsSA, 2017).
Furthermore, South Africans from the black African ethnic group are particularly affected by
poverty (47-53%) (Argent et al., 2009). The largest proportion of poor households are found in
the KZN province in SA (StatsSA, 2019). Moreover, the KZN province has been one of the
poorest provinces in SA since 2011 (Argent et al., 2009; StatsSA, 2017). Poor households are
at a high risk of malnutrition, as they cannot afford a diverse diet (Wenhold et al., 2012;
Mabhaudhi et al., 2016). Within KZN, 37.2% of poor households receive a child support grant
(StatsSA, 2017), which is currently R430/month (RSA, 2019). In some instances, households
depend solely on grants for purchasing food. A basic food basket in SA costs approximately
R883.16/month and may be unaffordable to many impoverished people (NAMC, 2019).
Several strategies have been proposed to address dietary diversity in poor rural households.

83
These include biofortification and the promotion of alternative crops that are nutrient-dense
(Mabhaudhi et al., 2016).
It is evident that under- and over-nutrition co-exist in SA. Children are affected by stunting
and over-nutrition, whereas adults, especially females, are affected by obesity. The diets
consumed, especially by the black African rural communities lack dietary diversity. The studies
described earlier aimed to determine the nutritional status of the South African population.
However, dietary intake and nutritional status vary across the South African provinces, as well
as across defined population groups within a province. Nutrition data from specific provinces
and defined areas (or population groups) within a province are required, in order to implement
targeted nutritional interventions. From the available literature, it seems that detailed studies of
the dietary intake of defined population groups living in specific areas of KZN have not been
conducted. To address this shortcoming, the current study aimed to assess the nutritional status
of four selected rural communities in KZN, using selected anthropometric indices and dietary
assessment methods.
4.2 Methodology
This study aimed to determine the nutritional status of black African individuals residing in
four rural locations in KZN, using selected anthropometric8 indices and dietary assessment9
methods. These rural locations included Ward 8 of Swayimane, Umbumbulu (Ezigeni and
Ogagwini villages), Tugela Ferry (irrigation scheme and dryland farmers), and Fountain Hill
Estate (farm workers). Systematic randomised sampling was used to generate a sample of 50
households at Swayimane, Umbumbulu and Tugela Ferry and 21 households at Fountain Hill
Estate. Purposive sampling was used to select households from Swayimane, Umbumbulu and
Tugela Ferry in order to avoid collecting data from extended families and neighbouring
households.
All members of the household were invited to participate in the study. However, the
following inclusion criteria were used to recruit study participants for different parts of the
study. For the food frequency questionnaire and the survey questions, a head of the household
or the person responsible for purchasing food items was selected to provide information
pertaining to food frequency and consumption. Anthropometric measurements and diet
histories were taken from all participants. However, the anthropometric results were separated
8 Weight, height and MUAC measurements were collected from children, while weight, height and waist circumference measurements were collected from adults. 9 24-hour repeated recall and a food frequency questionnaire.

84
into three categories; children (≥ 1 and ≤ 5 years), adults and women of childbearing age (16-
35 years).
Pilot study participants and individuals who were not at home on the first day of data
collection were excluded from the study. Specific households were targeted for the pilot study.
These households were known to all research assistants and were not visited during data
collection for the main study. Participants, who were not home on both non-consecutive days
of data collection, were excluded as a diet history for two non-consecutive days could not be
collected. Children who were at day-care, crèche or on a school feeding programme were
excluded from the study because caregivers would not know the quantities and types of foods
consumed by their children while away from home. As a result, the mothers or caregivers would
not have been able to give an accurate 24-hour recall and accurately answer the food frequency
questionnaire. Children who were not at a day-care or crèche on the day of data collection or
had not attended a school feeding programme the day before, were included in the study.
Written consent was obtained from all adult participants and caregivers of the children before
data collection commenced.
4.2.1 Anthropometry Anthropometric measurements, which involves measuring the physical attributes of an
individual, are one of the easiest, most non-invasive and cost-effective methods to obtain data
for assessing the nutritional status of both children and adults. Anthropometric measurements
can indicate both under- and over-nutrition in both adults and children. Weight, height, MUAC
waist circumference and BMI are common measurements used to assess the nutritional status
of both adults and children (Shisana et al., 2013; DoH, 2018).
The fieldworkers were responsible for taking the anthropometric measurements. The
fieldworkers were extensively trained on how to take anthropometric measurements and how
to record it on the data collection sheets. A training manual (Supplementary Information 1) was
developed and given to each fieldworker to use as a reference during data collection. This was
done to ensure that the data was collected correctly. Furthermore, to ensure that data was
collected accurately, trained postgraduate students from the University of KwaZulu-Natal
(UKZN) supervised the community-recruited field workers. The UKZN postgraduate students
were trained on how to correctly take anthropometric measurements and how to correctly record
it on the data collection sheet. Furthermore, they were also trained to check data collection
sheets for accuracy and missing data.
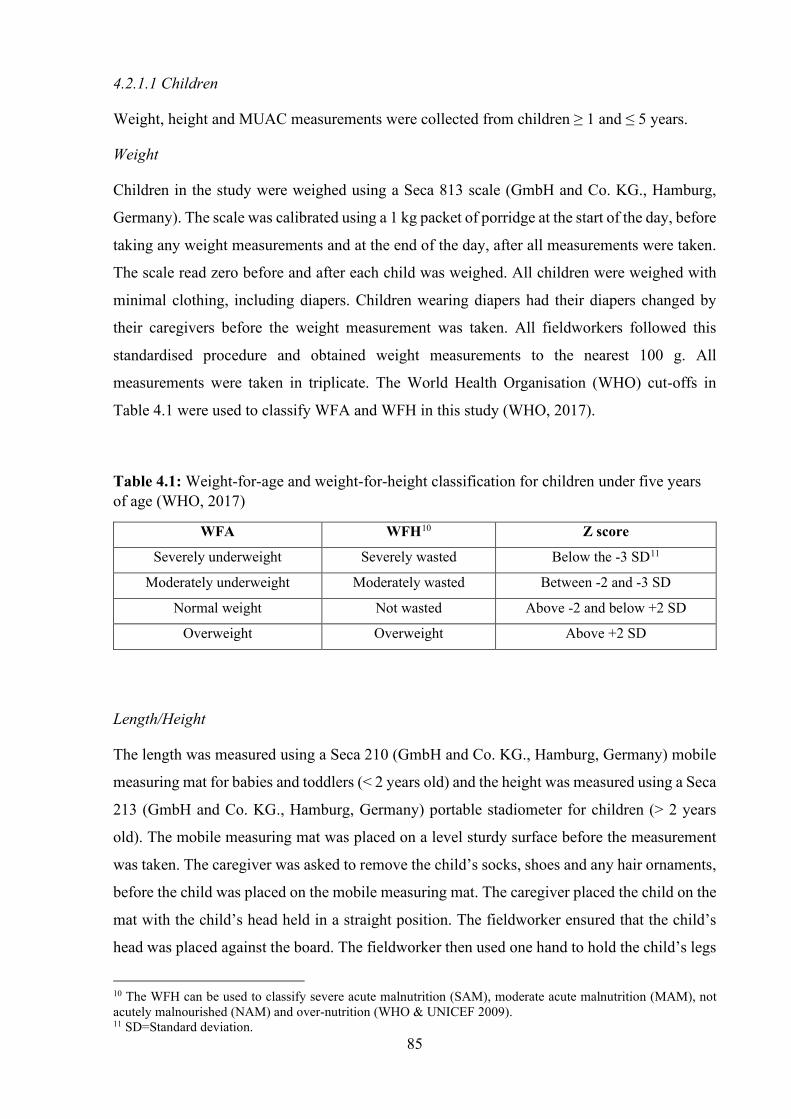
85
4.2.1.1 Children
Weight, height and MUAC measurements were collected from children ≥ 1 and ≤ 5 years.
Weight
Children in the study were weighed using a Seca 813 scale (GmbH and Co. KG., Hamburg,
Germany). The scale was calibrated using a 1 kg packet of porridge at the start of the day, before
taking any weight measurements and at the end of the day, after all measurements were taken.
The scale read zero before and after each child was weighed. All children were weighed with
minimal clothing, including diapers. Children wearing diapers had their diapers changed by
their caregivers before the weight measurement was taken. All fieldworkers followed this
standardised procedure and obtained weight measurements to the nearest 100 g. All
measurements were taken in triplicate. The World Health Organisation (WHO) cut-offs in
Table 4.1 were used to classify WFA and WFH in this study (WHO, 2017).
Table 4.1: Weight-for-age and weight-for-height classification for children under five years of age (WHO, 2017)
WFA WFH10 Z score
Severely underweight Severely wasted Below the -3 SD11
Moderately underweight Moderately wasted Between -2 and -3 SD
Normal weight Not wasted Above -2 and below +2 SD
Overweight Overweight Above +2 SD
Length/Height
The length was measured using a Seca 210 (GmbH and Co. KG., Hamburg, Germany) mobile
measuring mat for babies and toddlers (< 2 years old) and the height was measured using a Seca
213 (GmbH and Co. KG., Hamburg, Germany) portable stadiometer for children (> 2 years
old). The mobile measuring mat was placed on a level sturdy surface before the measurement
was taken. The caregiver was asked to remove the child’s socks, shoes and any hair ornaments,
before the child was placed on the mobile measuring mat. The caregiver placed the child on the
mat with the child’s head held in a straight position. The fieldworker ensured that the child’s
head was placed against the board. The fieldworker then used one hand to hold the child’s legs
10 The WFH can be used to classify severe acute malnutrition (SAM), moderate acute malnutrition (MAM), not acutely malnourished (NAM) and over-nutrition (WHO & UNICEF 2009). 11 SD=Standard deviation.
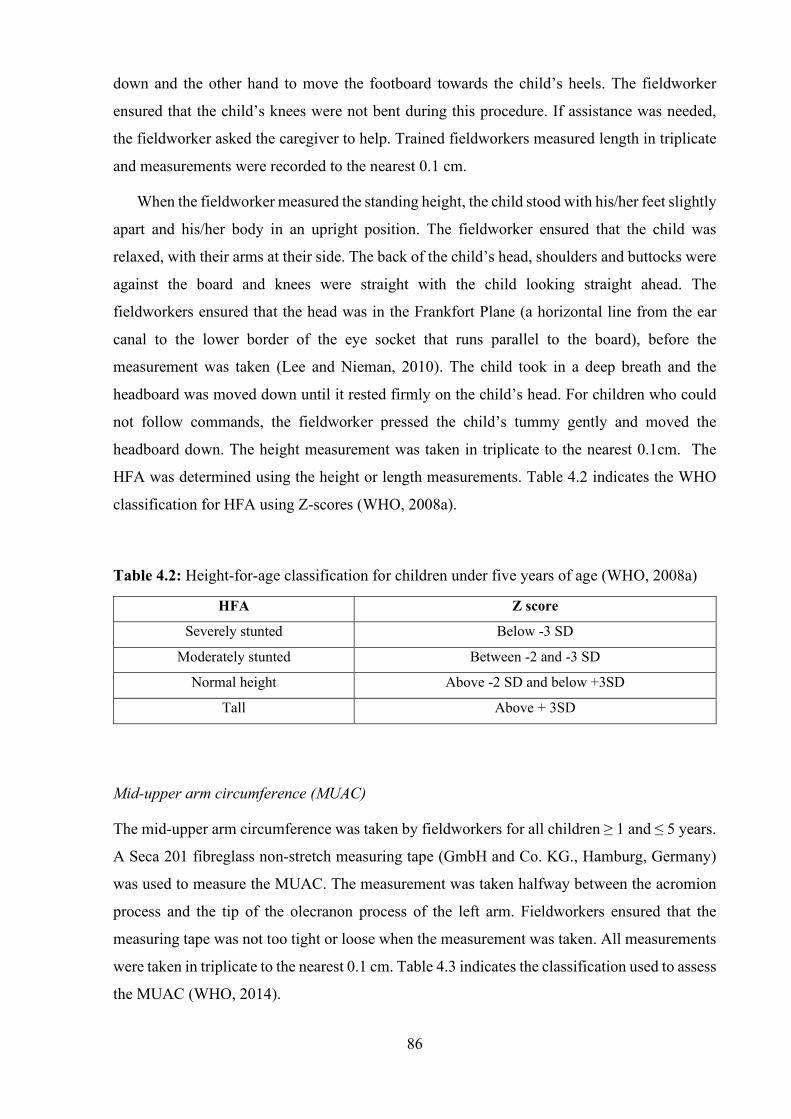
86
down and the other hand to move the footboard towards the child’s heels. The fieldworker
ensured that the child’s knees were not bent during this procedure. If assistance was needed,
the fieldworker asked the caregiver to help. Trained fieldworkers measured length in triplicate
and measurements were recorded to the nearest 0.1 cm.
When the fieldworker measured the standing height, the child stood with his/her feet slightly
apart and his/her body in an upright position. The fieldworker ensured that the child was
relaxed, with their arms at their side. The back of the child’s head, shoulders and buttocks were
against the board and knees were straight with the child looking straight ahead. The
fieldworkers ensured that the head was in the Frankfort Plane (a horizontal line from the ear
canal to the lower border of the eye socket that runs parallel to the board), before the
measurement was taken (Lee and Nieman, 2010). The child took in a deep breath and the
headboard was moved down until it rested firmly on the child’s head. For children who could
not follow commands, the fieldworker pressed the child’s tummy gently and moved the
headboard down. The height measurement was taken in triplicate to the nearest 0.1cm. The
HFA was determined using the height or length measurements. Table 4.2 indicates the WHO
classification for HFA using Z-scores (WHO, 2008a).
Table 4.2: Height-for-age classification for children under five years of age (WHO, 2008a)
HFA Z score
Severely stunted Below -3 SD
Moderately stunted Between -2 and -3 SD
Normal height Above -2 SD and below +3SD
Tall Above + 3SD
Mid-upper arm circumference (MUAC)
The mid-upper arm circumference was taken by fieldworkers for all children ≥ 1 and ≤ 5 years.
A Seca 201 fibreglass non-stretch measuring tape (GmbH and Co. KG., Hamburg, Germany)
was used to measure the MUAC. The measurement was taken halfway between the acromion
process and the tip of the olecranon process of the left arm. Fieldworkers ensured that the
measuring tape was not too tight or loose when the measurement was taken. All measurements
were taken in triplicate to the nearest 0.1 cm. Table 4.3 indicates the classification used to assess
the MUAC (WHO, 2014).

87
Table 4.3: Mid-upper arm circumference classification in children under five years of age (WHO, 2014)
MUAC Classification
Below 11.5 cm SAM
11.5-12.5 cm MAM
Above 12.5 cm NAM
4.2.1.2 Adults
Weight
Weight in adults was measured using a Seca 813 scale (GmbH and Co. KG., Hamburg,
Germany). The scale was calibrated using a 1 kg packet of porridge at the start of the day before
taking any weight measurements and at the end of the day, after all, measurements were taken.
The scale read zero before the participant was weighed. The participant was required to stand
in the middle of the scale with his/her feet slightly apart and as still as possible. Similarly, to
children, all heavy objects in pockets, excess clothing and shoes were removed before the
participant was weighed.
Height
Height was measured in metres (m) using the Seca 213 portable stadiometer (GmbH and Co.
KG., Hamburg, Germany). The participant was required to remove hats, hair ornaments and
shoes before height was measured. The participant stood in an upright position with his/her feet
slightly apart. The participant kept their arms at their side and looked straight ahead. The
fieldworkers ensured that the head was in the Frankfort Plane (a horizontal line from the ear
canal to the lower border of the eye socket that runs parallel to the board) before the
measurement was taken (Lee and Nieman, 2010). The fieldworker ensured that the head,
shoulders and buttocks were against the board and knees were straight, before the measurement
was taken. The participant took in a deep breath and the fieldworker moved the headboard down
until it rested firmly on the participant’s head. All measurements were taken in triplicate to the
nearest 0.1 cm.
Body mass index (BMI)
Weight and height measurements were used to determine body mass index (BMI) for
individuals above the age of 18 years. The BMI was calculated by dividing the weight by the
height in metres squared. The BMI helps to determine the nutritional status of an individual and
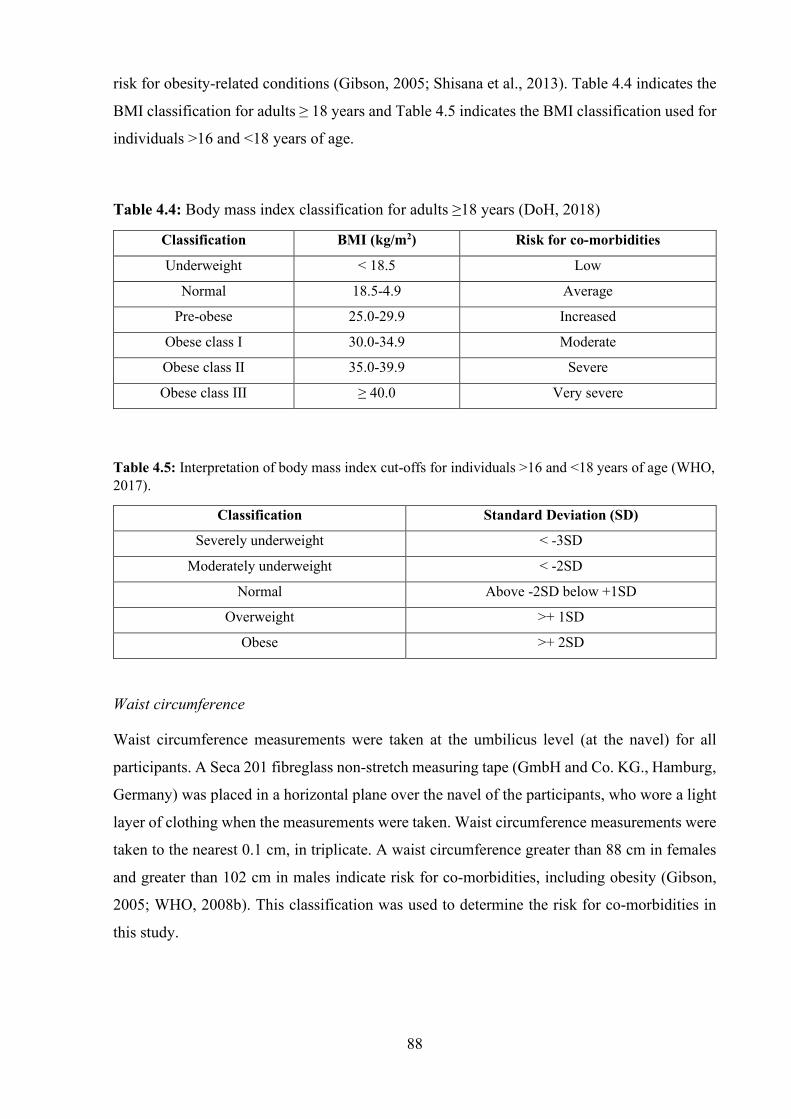
88
risk for obesity-related conditions (Gibson, 2005; Shisana et al., 2013). Table 4.4 indicates the
BMI classification for adults ≥ 18 years and Table 4.5 indicates the BMI classification used for
individuals >16 and <18 years of age.
Table 4.4: Body mass index classification for adults ≥18 years (DoH, 2018)
Classification BMI (kg/m2) Risk for co-morbidities
Underweight < 18.5 Low
Normal 18.5-4.9 Average
Pre-obese 25.0-29.9 Increased
Obese class I 30.0-34.9 Moderate
Obese class II 35.0-39.9 Severe
Obese class III ≥ 40.0 Very severe
Table 4.5: Interpretation of body mass index cut-offs for individuals >16 and <18 years of age (WHO, 2017).
Classification Standard Deviation (SD)
Severely underweight < -3SD
Moderately underweight < -2SD
Normal Above -2SD below +1SD
Overweight >+ 1SD
Obese >+ 2SD
Waist circumference
Waist circumference measurements were taken at the umbilicus level (at the navel) for all
participants. A Seca 201 fibreglass non-stretch measuring tape (GmbH and Co. KG., Hamburg,
Germany) was placed in a horizontal plane over the navel of the participants, who wore a light
layer of clothing when the measurements were taken. Waist circumference measurements were
taken to the nearest 0.1 cm, in triplicate. A waist circumference greater than 88 cm in females
and greater than 102 cm in males indicate risk for co-morbidities, including obesity (Gibson,
2005; WHO, 2008b). This classification was used to determine the risk for co-morbidities in
this study.
89
4.2.2 Dietary intake 4.2.2.1 24-hour repeated recall method
In this study, a 24-hour repeated recall method was used to assess the dietary intake of the target
group at a nutrient level. Trained fieldworkers interviewed the selected household members to
obtain information about the types of foods consumed by individuals over the age of one year,
over a 24-hour period for two non-consecutive days. This data set was collected randomly12 on
all days of the week, including weekends. The primary caregiver was interviewed in the case
of children under four years of age. Children between 4-8 years of age were interviewed
together with their primary caregiver. The information obtained from the 24-hour recall
included portion sizes, preparation methods and ingredients used. Portion sizes were
determined using measuring cups, plates of different sizes, cups, mugs, glasses, measuring
spoons, dishing spoons and rulers. The first step of the 24-hour recall was to determine the time
of day and place that the food was consumed. The participants were then asked to list the foods
that they consumed at the times documented. Thereafter, participations were asked to give a
description of the preparation methods used to prepare the meals. Participants then provided
the research assistants with household measures used to serve the meals, so that portion sizes
could be determined. Participants indicated to the research assistant whether this was the usual
diet followed. Lastly, participants were asked if they took any vitamins or mineral supplements.
This was done because the vitamins or mineral supplements would need to be included in the
analysis of dietary intake. The 24-hour recall was conducted using standardised methods,
similar to previous studies (Faber and Kruger, 2005; Spearing et al., 2012; Faber et al., 2013;
Sheehy et al., 2013; Fagúndez et al., 2015).
4.2.2.2 Qualitative food frequency questionnaire13
A food frequency questionnaire is used to assess the frequency with which foods are consumed
(Rodrigo et al., 2015). In the current study, a qualitative food frequency questionnaire was used
to collect data to validate the 24-hour recall data (Faber and Kruger, 2005; Faber et al., 2013;
Fagúndez et al., 2015). The food frequency questionnaire comprised of a list of 94 food items,
subdivided into the following groups; cereals and grains, bread, biscuits and snacks, starchy
vegetables, starchy foods prepared with fats, fruit, milk and milk products, vegetables, meat
and meat substitutes, fats and other carbohydrates. The frequency was indicated next to each
12 There was no specific day allocated for each fieldworker to collect data. Data was collected on any day of the week as long as it was two non-consecutive days. 13 Dietary intake was assessed on a food level (no nutritional analysis was conducted on the food items obtained from the food frequency).
90
food item listed. The frequency options were; never or less than once a month, 1-3 times a
month, 2-4 times a week, 5-6 times a week, once a day, 2-3 times a day, 4-5 times a day or
more than 6 times a day. The food frequency questionnaire that was developed was similar to
those used in other studies (Coulston et al., 2013; Rodrigo et al., 2015). The trained fieldworkers
recorded the responses of the study participants in the food frequency questionnaire.
4.2.3 Pilot study A sample of 18 households was used for the pilot study. The pilot study was conducted to test
the feasibility of the study design and the appropriateness of the questionnaires. This allowed
for appropriate changes to be made before the main study was conducted. Anthropometric
measurements (weight, height and MUAC for children and weight, height and waist
circumference for adults) and dietary intake data (24-hour recall and food frequency) were
collected at two selected sites (Swayimane and Tugela Ferry). The researcher supervised the
fieldworkers on a one-on-one basis during the pilot study to ensure that the correct techniques
for collecting anthropometric measurements and dietary intake were being followed. A post-
pilot training session was conducted to revise the correct procedures to be followed during data
collection. Each fieldworker received a training manual at the start of the training session
(Supplementary Information 1).
4.2.3.1 Findings of the pilot study and consequent changes made to the methods
Several problems were encountered during the pilot study. Areas and households from
Swayimane and Tugela Ferry were a far distance away from each other. More time was spent
travelling to research sites and less time on data collection. For the main study, local members
of the community were employed to assist with data collection. These members were
extensively trained to collect data accurately. This saved on travelling time and more
households were reached in a shorter space of time. The recruited fieldworkers resided in
different areas within the study sites, which allowed for more households to be reached. Another
problem encountered was that there were only one or two people available in some households,
as the members of the households were working or had gone out. To overcome this, more field
workers were recruited to assist with data collection, which resulted in more members of the
household being interviewed at a given time. To ensure that data was collected accurately the
trained fieldworkers from UKZN supervised the community-recruited field workers. The last
problem encountered was that the large volume of paperwork involved was confusing to the
fieldworkers. The loose pieces of paper could easily be misplaced. For the main study, data
collection sheets were printed in a booklet for each household. This minimised confusion with
regard to the information that needed to be collected. A training manual (Supplementary
91
Information 1) was developed and given to each field worker to use as a reference during data
collection.
4.2.4 Data analysis 4.2.4.1 Anthropometry
Trained fieldworkers14 captured the data onto Microsoft Excel spreadsheets. The data were
cross-checked for accuracy by the researcher. The means and standard deviations for weight,
height, MUAC and waist circumference were calculated using Microsoft Excel. The BMI was
calculated using the equation, BMI = weight (kg)/height (m)2. The BMI value obtained was
coded and interpreted using the BMI classification (Table 4.4 and Table 4.5) (WHO, 2017;
DoH, 2018).
4.2.4.2 Dietary intake data
The repeated 24-hour recall data was captured onto the Food Finder version 3 software
programme of the Medical Research Council (MRC), SA, to determine the nutrients consumed
over the two non-consecutive days. Nutrient values for fortified maize and bread were obtained
from Food Finder. Data from Food Finder was exported to Microsoft Excel and mean daily
nutrient intakes and standard deviations were calculated. Of the four Dietary Reference Intakes
(DRIs), the Estimated Average Requirement (EAR) and Adequate Intake (AI) were used to
assess the nutrient intake. The EAR was selected as it is the recommended DRI for assessing
the nutritional status of population groups, defined by demographic profiles, including age,
gender and lifecycle stage (Institute of Medicine, 2006). The EAR is the amount of a nutrient
that is estimated to meet the needs of 50% of people in a defined population group and can be
used to estimate the prevalence of inadequate nutrient intakes (EAR cut-point method). The
EAR cut-point method can be used for most nutrients, except energy, as energy intake and
expenditure are highly related (Institute of Medicine, 2001a; Murphy et al., 2006). The AI
values were used for nutrients without an EAR. The AI is based on observed or experimentally
determined estimates of the average nutrient intake of an apparently healthy population group.
It is assumed that if the nutrient intake is above the AI, there is a low risk for inadequate intake
(Institute of Medicine, 2001a; Murphy et al., 2006; Institute of Medicine, 2006).
4.2.4.3 Statistical analysis
Data were analysed using the Statistical Package for the Social Sciences (SPSS) version 25
(SPSS Inc., Chicago, IL, USA). Descriptive statistics, including means, standard deviations and
14 The researcher trained fieldworkers on how to enter data onto Excel spreadsheets and how to interpret the coded data.

92
frequencies, were computed where applicable. The Chi-square test was used to analyse for
relationships among anthropometric data: BMI, WFH, BMI-for-age and MUAC. The Chi-
square test was used to determine whether there were significant associations among the
categorical variable responses selected. The binomial test was used to test whether a significant
proportion of respondents selected one of two possible responses. When conditions were not
met, the Fisher’s exact test was used. The Chi-square test was also used to analyse for
associations between anthropometric data and gender and age. The Fisher’s exact test was used
for MUAC and gender, MUAC and WFH and BMI and waist circumference. A p-value of
<0.05 was considered statistically significant.
4.2.5 Ethical considerations Ethical approval was obtained from the UKZN, Humanities and Social Science Ethics
Committee (HSS/0256/016D) (Supplementary Information 2). Gatekeeper’s permission was
obtained from Swayimane, Tugela Ferry, Umbumbulu and Fountain Hill Estate (FHE). Each
participant was required to sign a consent form before participating in the study (English
version: Supplementary Information 3; isiZulu version: Supplementary Information 4). In the
case of minors, the caregiver gave consent for the minor15 to participate in the study. The
consent form was read to the participants in isiZulu so that illiterate participants could
understand the contents of the consent form. Thereafter, they were shown where to sign or
initial on the consent form if they had understood what had been explained. If the study
participants did not understand what had been explained, the explanation was repeated. The
participants signed the form only after they had understood its contents.
15 For the purpose of this study, a minor is any person under the age of 18 years.

93
4.3 Results
4.3.1 Demographic characteristics The demographic characteristics of the study participants are presented in Table 4.6. Of the 466
participants (both adults and children) who participated, 63.7% (n=297) were female and 42.9%
(n=200) were from Umbumbulu. Most of the participants were between 19-30 years (23.6%;
n=110) and 31-50 years (20.2%; n=94), and the least number of participants were over 70 years
old (3.2%; n=15). One hundred and sixty-five households participated in the study (Table 4.7).
Table 4.6: Demographic characteristics of study participants (n=466)
Characteristics n %*
Gender
Male
Female
169
297
36.3
63.7
Participant distribution by study site
Swayimane
Umbumbulu
Tugela Ferry
Fountain Hill Estate
139
200
114
13
29.8
42.9
24.5
2.8
Age (years)
1-3 16 3.4
4-8 59 12.7
9-13 51 10.9
14-18 50 10.7
19-30 110 23.6
31-50 94 20.2
51-70 71 15.2
70+ 15 3.2
* Percentage of sample (n=466)
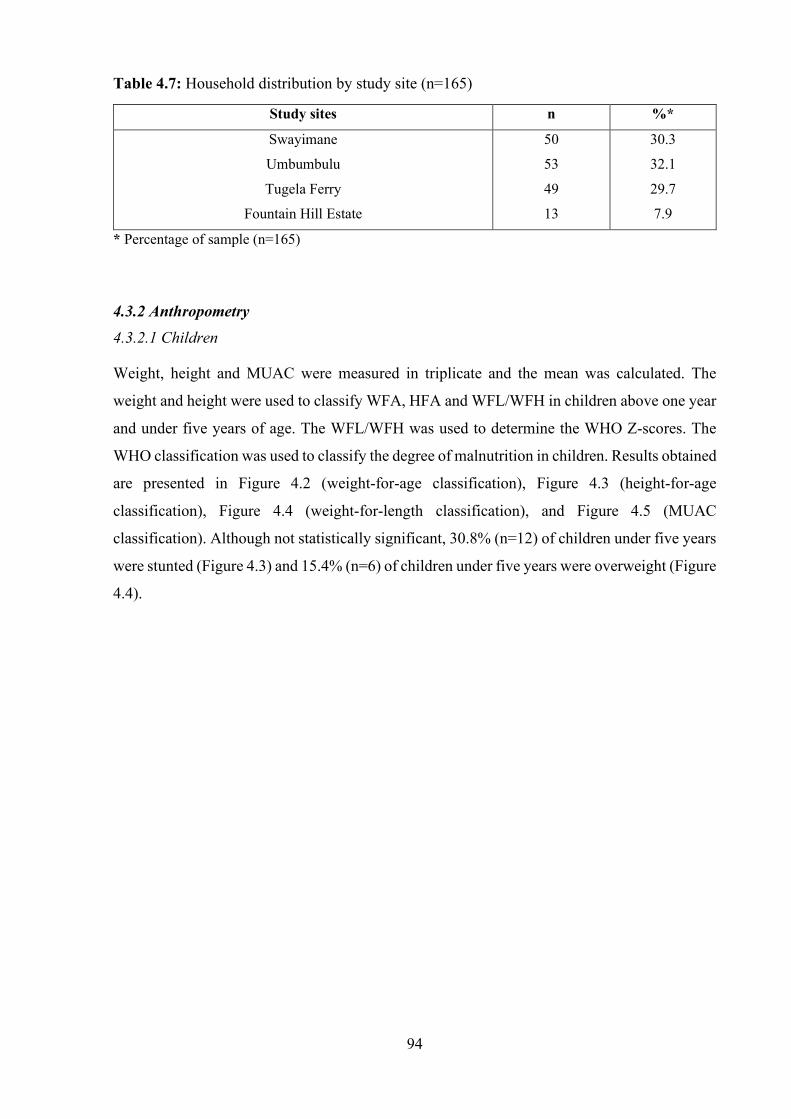
94
Table 4.7: Household distribution by study site (n=165)
Study sites n %*
Swayimane
Umbumbulu
Tugela Ferry
Fountain Hill Estate
50
53
49
13
30.3
32.1
29.7
7.9
* Percentage of sample (n=165)
4.3.2 Anthropometry 4.3.2.1 Children
Weight, height and MUAC were measured in triplicate and the mean was calculated. The
weight and height were used to classify WFA, HFA and WFL/WFH in children above one year
and under five years of age. The WFL/WFH was used to determine the WHO Z-scores. The
WHO classification was used to classify the degree of malnutrition in children. Results obtained
are presented in Figure 4.2 (weight-for-age classification), Figure 4.3 (height-for-age
classification), Figure 4.4 (weight-for-length classification), and Figure 4.5 (MUAC
classification). Although not statistically significant, 30.8% (n=12) of children under five years
were stunted (Figure 4.3) and 15.4% (n=6) of children under five years were overweight (Figure
4.4).

95
Figure 4.2: Weight-for-age classification for children under five years (n=39)
Figure 4.3: Height-for-age classification for children under five years16 (n=39)
16 Children under five years with a HFA greater than the +3SD were classified as tall.
5.1%; n=212.8%; n=5
64.1%; n=25
17.9%; n=7
0
10
20
30
40
50
60
70
Severelyunderweight
moderatelyunderweight
normal weight overweight
Perc
enta
ge (%
)
Weight-for-age classification
20.5%; n=8
10.3%; n=4
66.7%; n=26
2.6%; n=10
10
20
30
40
50
60
70
80
Severely stunted Moderatelystunted
Normal height Tall
Perc
enta
ge (%
)
Height-for-age classification
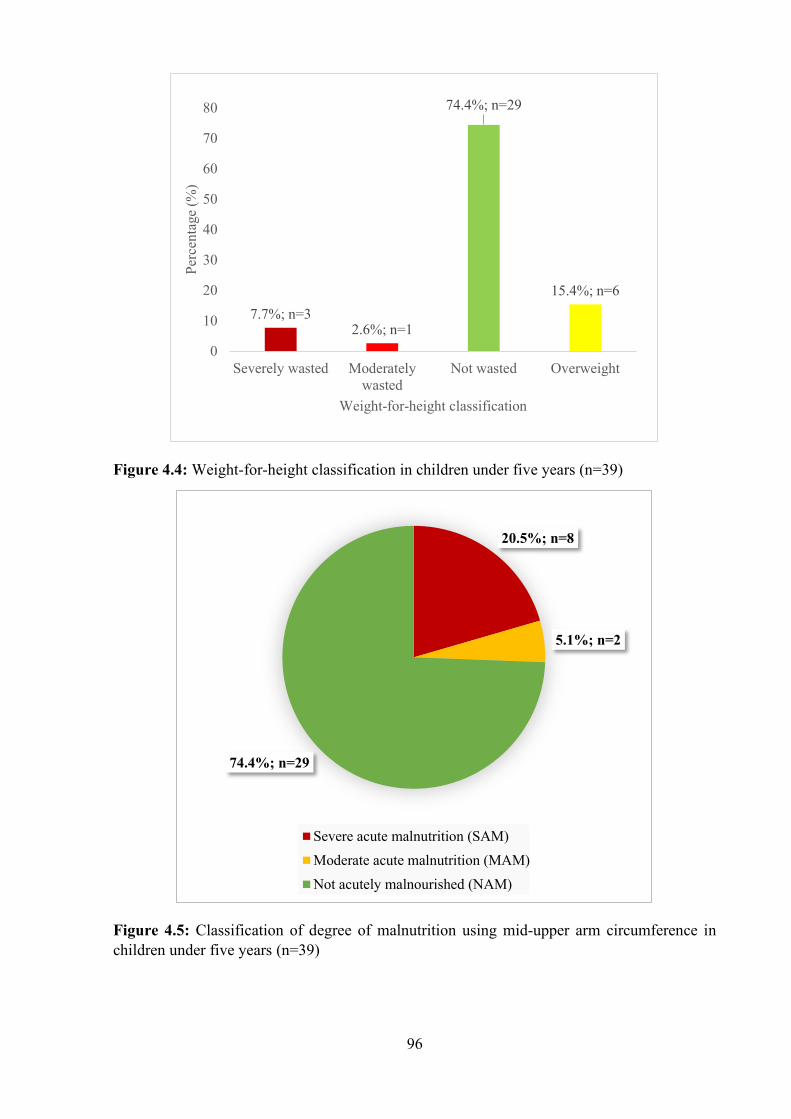
96
Figure 4.4: Weight-for-height classification in children under five years (n=39)
Figure 4.5: Classification of degree of malnutrition using mid-upper arm circumference in children under five years (n=39)
7.7%; n=32.6%; n=1
74.4%; n=29
15.4%; n=6
0
10
20
30
40
50
60
70
80
Severely wasted Moderatelywasted
Not wasted Overweight
Perc
enta
ge (%
)
Weight-for-height classification
20.5%; n=8
5.1%; n=2
74.4%; n=29
Severe acute malnutrition (SAM)Moderate acute malnutrition (MAM)Not acutely malnourished (NAM)
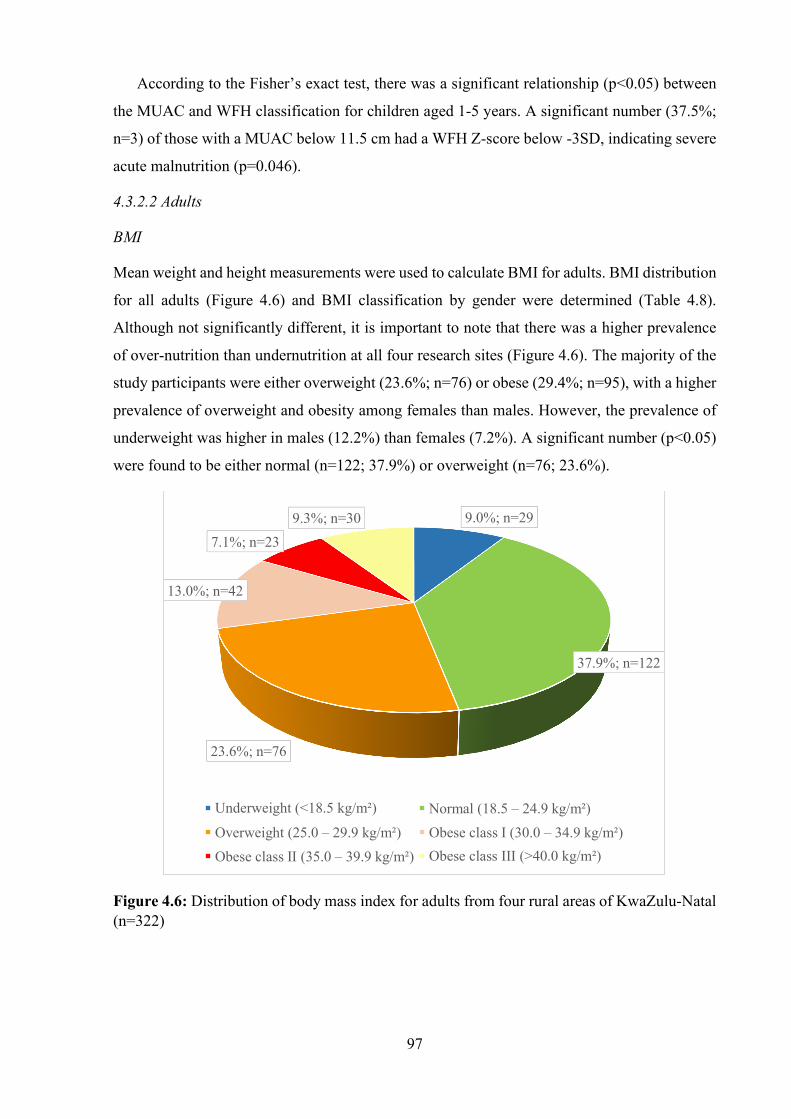
97
According to the Fisher’s exact test, there was a significant relationship (p<0.05) between
the MUAC and WFH classification for children aged 1-5 years. A significant number (37.5%;
n=3) of those with a MUAC below 11.5 cm had a WFH Z-score below -3SD, indicating severe
acute malnutrition (p=0.046).
4.3.2.2 Adults
BMI
Mean weight and height measurements were used to calculate BMI for adults. BMI distribution
for all adults (Figure 4.6) and BMI classification by gender were determined (Table 4.8).
Although not significantly different, it is important to note that there was a higher prevalence
of over-nutrition than undernutrition at all four research sites (Figure 4.6). The majority of the
study participants were either overweight (23.6%; n=76) or obese (29.4%; n=95), with a higher
prevalence of overweight and obesity among females than males. However, the prevalence of
underweight was higher in males (12.2%) than females (7.2%). A significant number (p<0.05)
were found to be either normal (n=122; 37.9%) or overweight (n=76; 23.6%).
Figure 4.6: Distribution of body mass index for adults from four rural areas of KwaZulu-Natal (n=322)
9.0%; n=29
37.9%; n=122
23.6%; n=76
13.0%; n=42
7.1%; n=239.3%; n=30
Underweight (<18.5 kg/m²) Normal (18.5 – 24.9 kg/m²)Overweight (25.0 – 29.9 kg/m²) Obese class I (30.0 – 34.9 kg/m²)Obese class II (35.0 – 39.9 kg/m²) Obese class III (>40.0 kg/m²)

98
Table 4.8: Body mass index classification for adults by gender (n=322)
BMI classification (n=322)
Gender Underweight (<18.5 kg/m2)
Normal (18.5-24.9
kg/m2)
Overweight (25.0-29.9
kg/m2)
Obese class I
(30.0-34.9 kg/m2)
Obese class II
(35.0-39.9 kg/m2)
Obese class III (≥40.0 kg/m2)
Male (n=115) 14a (12.2%)b 65 (56.5%) 22 (19.1%) 9 (7.8%) 3 (2.6%) 2 (1.7%)
Female (n=207)
15c (7.2%)d 57 (27.5%) 54 (26.1%) 33 (15.9%) 20 (9.7%) 28 (13.5%)
BMI=Body mass index; a Number of males; b Percentage of males; cNumber of females; d Percentage of females
Waist circumference
Figure 4.7 indicates waist circumference classification for adults by gender. The total number
of weight circumference measurements obtained was lower than the total number of BMI
measurements obtained, as the waist circumference measurements were either missing or not
taken correctly. The measurements that were not taken correctly were discarded. According to
the binomial test, a significant number (67.0%; n=213) had waist circumference measurements
below 88 cm and 102 cm for females and males, respectively (p<0.05). The chi-square test of
independence indicated that there was a significant relationship between gender and waist
circumference (p<0.05). A significant proportion of males (92.9%; n=105) had a normal waist
circumference and were not at risk for obesity-related diseases, while 47.3% of females (n=97)
were (p<0.05).
Figure 4.7: Waist circumference classification by gender (n=318)
92.9%; n=105
7.1%; n=8
52.7%; n=10847.3%; n=97
0
10
20
30
40
50
60
70
80
90
100
Normal waist circumference (males < 102cm; females < 88 cm)
Large waist circumference (males > 102cm; females > 88 cm)
Perc
enta
ge (%
)
waist circumerence classification
Male (113) Female (205)

99
Overweight and obesity
There was a significant relationship between BMI and risk for co-morbidities associated with
waist circumference (p<0.05). Underweight and normal BMI was not associated with risk for
co-morbidities and obesity, while individuals that were classified as obese class I, II and III had
high risk for co-morbidities.
4.3.2.3 Women of child-bearing age (16-35 years)
Body mass index (Figure 4.8) and waist circumference (Figure 4.9) were determined for women
aged 16-35 years to classify their nutritional status. Although not statistically significant, there
was a higher prevalence of over-nutrition compared to undernutrition at all four research sites
for females aged 16-35 years old (Figure 4.8).
Overweight and obesity
There was a significant relationship between BMI and risk associated with waist circumference
(p<0.05). Individuals that were classified as obese class I, II and III were at high risk for co-
morbidities according to waist circumference measurements.
Figure 4.8: Distribution of body mass index for females aged 16-35 years (n=94)
8.5%; n=8
32.9%; n=31
26.6%; n=25
12.8%; n=12
6.4%; n=6
12.8%; n=12
0
5
10
15
20
25
30
35
Perc
enta
ge (%
)
BMI Catergories
underweight normal preobese obese class I obese class II obese class III
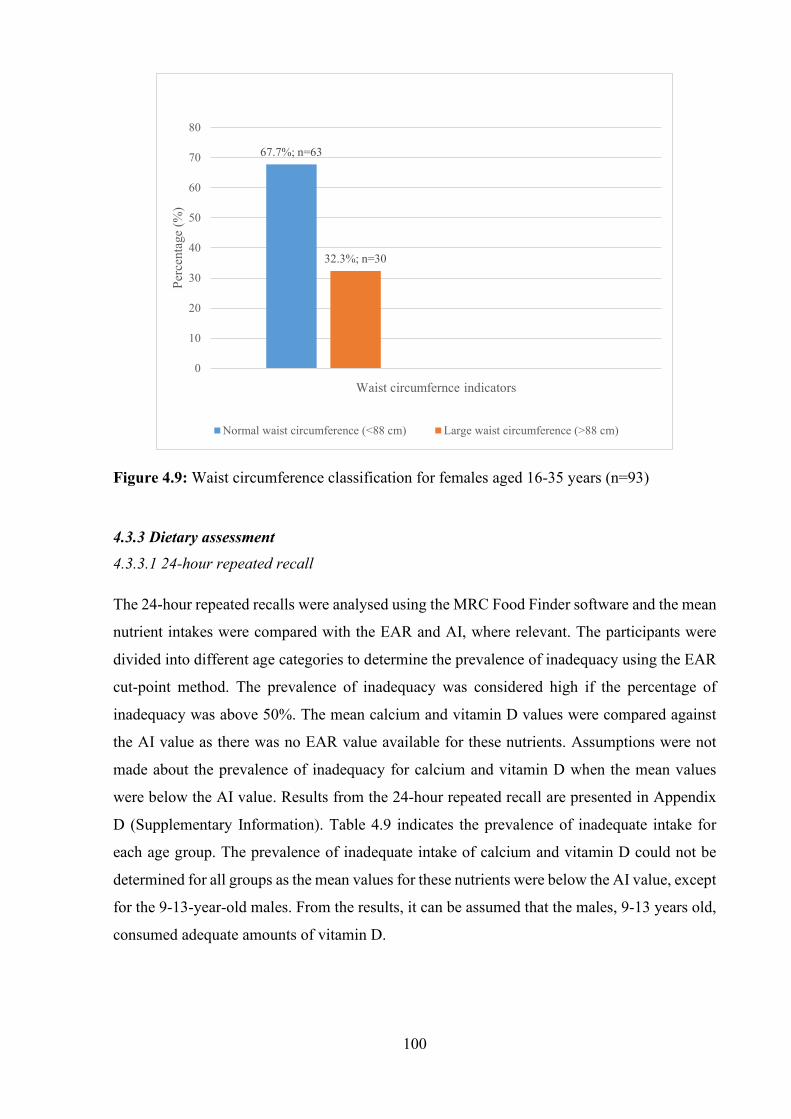
100
Figure 4.9: Waist circumference classification for females aged 16-35 years (n=93)
4.3.3 Dietary assessment 4.3.3.1 24-hour repeated recall
The 24-hour repeated recalls were analysed using the MRC Food Finder software and the mean
nutrient intakes were compared with the EAR and AI, where relevant. The participants were
divided into different age categories to determine the prevalence of inadequacy using the EAR
cut-point method. The prevalence of inadequacy was considered high if the percentage of
inadequacy was above 50%. The mean calcium and vitamin D values were compared against
the AI value as there was no EAR value available for these nutrients. Assumptions were not
made about the prevalence of inadequacy for calcium and vitamin D when the mean values
were below the AI value. Results from the 24-hour repeated recall are presented in Appendix
D (Supplementary Information). Table 4.9 indicates the prevalence of inadequate intake for
each age group. The prevalence of inadequate intake of calcium and vitamin D could not be
determined for all groups as the mean values for these nutrients were below the AI value, except
for the 9-13-year-old males. From the results, it can be assumed that the males, 9-13 years old,
consumed adequate amounts of vitamin D.
67.7%; n=63
32.3%; n=30
0
10
20
30
40
50
60
70
80
Perc
enta
ge (%
)
Waist circumfernce indicators
Normal waist circumference (<88 cm) Large waist circumference (>88 cm)
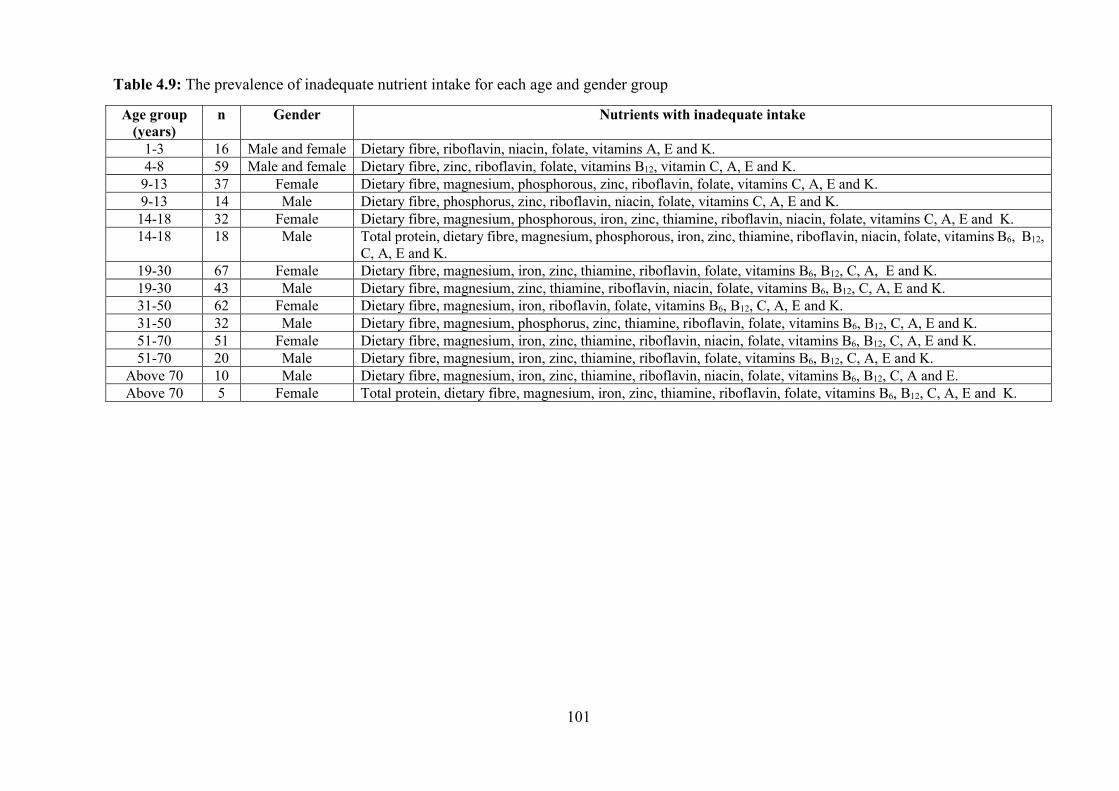
101
Table 4.9: The prevalence of inadequate nutrient intake for each age and gender group
Age group (years)
n Gender Nutrients with inadequate intake
1-3 16 Male and female Dietary fibre, riboflavin, niacin, folate, vitamins A, E and K. 4-8 59 Male and female Dietary fibre, zinc, riboflavin, folate, vitamins B12, vitamin C, A, E and K.
9-13 37 Female Dietary fibre, magnesium, phosphorous, zinc, riboflavin, folate, vitamins C, A, E and K. 9-13 14 Male Dietary fibre, phosphorus, zinc, riboflavin, niacin, folate, vitamins C, A, E and K.
14-18 32 Female Dietary fibre, magnesium, phosphorous, iron, zinc, thiamine, riboflavin, niacin, folate, vitamins C, A, E and K. 14-18 18 Male Total protein, dietary fibre, magnesium, phosphorous, iron, zinc, thiamine, riboflavin, niacin, folate, vitamins B6, B12,
C, A, E and K. 19-30 67 Female Dietary fibre, magnesium, iron, zinc, thiamine, riboflavin, folate, vitamins B6, B12, C, A, E and K. 19-30 43 Male Dietary fibre, magnesium, zinc, thiamine, riboflavin, niacin, folate, vitamins B6, B12, C, A, E and K. 31-50 62 Female Dietary fibre, magnesium, iron, riboflavin, folate, vitamins B6, B12, C, A, E and K. 31-50 32 Male Dietary fibre, magnesium, phosphorus, zinc, thiamine, riboflavin, folate, vitamins B6, B12, C, A, E and K. 51-70 51 Female Dietary fibre, magnesium, iron, zinc, thiamine, riboflavin, niacin, folate, vitamins B6, B12, C, A, E and K. 51-70 20 Male Dietary fibre, magnesium, iron, zinc, thiamine, riboflavin, folate, vitamins B6, B12, C, A, E and K.
Above 70 10 Male Dietary fibre, magnesium, iron, zinc, thiamine, riboflavin, niacin, folate, vitamins B6, B12, C, A and E. Above 70 5 Female Total protein, dietary fibre, magnesium, iron, zinc, thiamine, riboflavin, folate, vitamins B6, B12, C, A, E and K.

102
Table 4.10: The mean frequency scores for commonly consumed food items
Food items n17 Mean18 Food items n Mean Food items n Mean Oil 156 3.37 Mageu19 159 1.82 Beef, sausage 160 1.39 Onions 159 3.31 Orange 156 1.79 Samp and beans 160 1.37 Phutu20 158 2.63 Maas21 156 1.74 Steamed bread (Ujeqe) 99 1.34 Sweets 151 2.35 Fruit juice 159 1.73 Peanut butter 161 1.30 Brown bread/roll 145 2.33 Chicken, feet 159 1.70 Avocado, medium 157 1.30 Tomato 157 2.29 Cabbage 161 1.68 Grapes, small 157 1.27 Mayonnaise 159 2.28 Potato crisps 156 1.65 Organ meat (liver, kidney, heart) 161 1.23 Rice, white 156 2.15 Mealie/corn (on cob) 156 1.63 Isijingi22 24 1.21 Apple, unpeeled medium 159 2.13 Baked beans 160 1.61 Margarine, tub 159 1.21 Eggs 158 2.12 Sweet potato 157 1.62 Instant noodles 158 1.19 Chicken, stewed 159 2.11 Squash, butternut, pumpkin, winter squash 159 1.59 Scone 159 1.18 Chicken, cooked 161 2.06 Amadumbe23 159 1.58 Green leafy vegetable 23 1.17 Pepper 159 2.01 Beef, cuts 161 1.58 Cake, plain 160 1.16 White bread/roll 157 1.99 Margarine, brick 160 1.57 Biscuit 160 1.14 Maize meal porridge 158 1.93 Cornflakes 160 1.56 Ice cream 158 1.09 Full cream milk 160 1.91 Weetbix 155 1.54 Custard Ultra Mel 159 1.09 Potato, pumpkin 159 1.90 Fried chips 158 1.50 Pear 156 1.09 Mixed vegetable 160 1.88 Vetkoek (amagwinya)24 144 1.47 Low fat milk 160 1.07 Polony 159 1.87 Pilchards, canned 161 1.43 Beetroot 156 1.06 Banana, small 158 1.84 Cheese, cheddar 160 1.42 Canned fruit 159 1.03 Spinach 155 1.82 Maize meal porridge 157 1.41 Biscuit, filling 150 1.01
17 n: Indicates the number of households that consumed that particular food item. 18 The mean is expressed as an average score. 19 Mageu: fermented maize meal. 20 Phutu: maize meal cooked into a crumbly porridge. 21 Maas: Fermented milk product. 22 Isijingi: Soft porridge made with pumpkin. 23 Amadumbe: A tuber that grows underground. 24 Amagwinya: Traditional fried bread made with flour, yeast, sugar and salt.
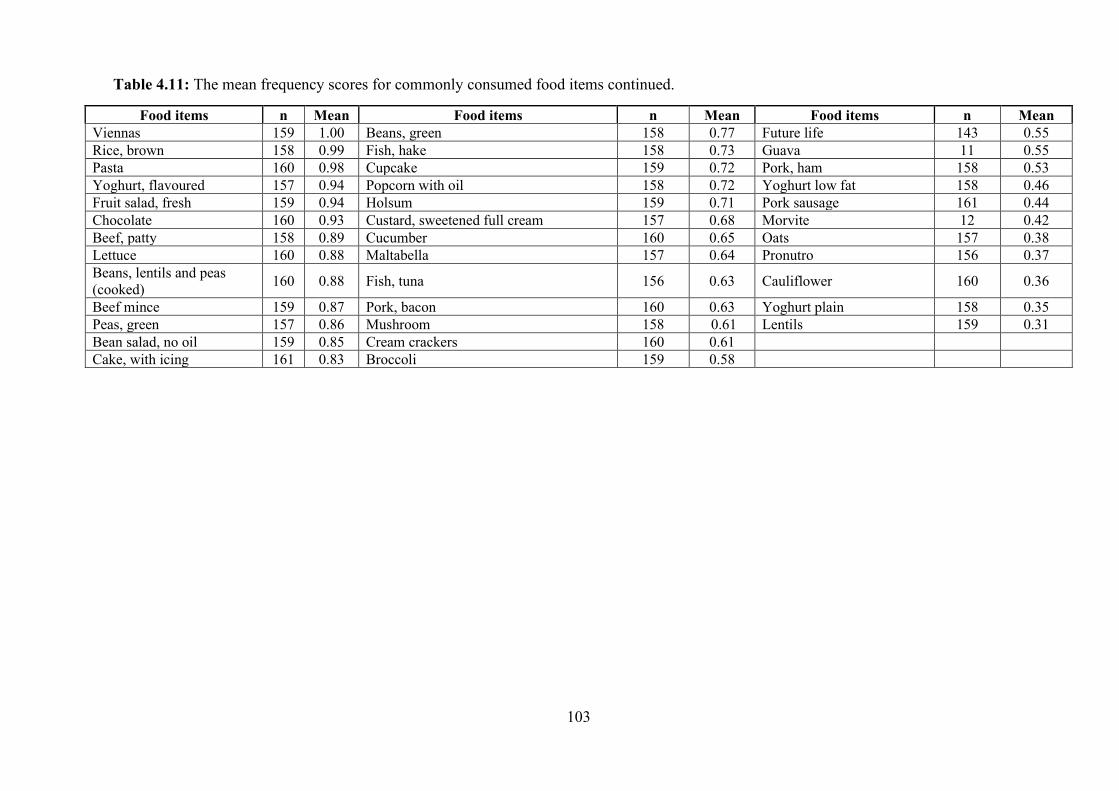
103
Table 4.11: The mean frequency scores for commonly consumed food items continued.
Food items n Mean Food items n Mean Food items n Mean Viennas 159 1.00 Beans, green 158 0.77 Future life 143 0.55 Rice, brown 158 0.99 Fish, hake 158 0.73 Guava 11 0.55 Pasta 160 0.98 Cupcake 159 0.72 Pork, ham 158 0.53 Yoghurt, flavoured 157 0.94 Popcorn with oil 158 0.72 Yoghurt low fat 158 0.46 Fruit salad, fresh 159 0.94 Holsum 159 0.71 Pork sausage 161 0.44 Chocolate 160 0.93 Custard, sweetened full cream 157 0.68 Morvite 12 0.42 Beef, patty 158 0.89 Cucumber 160 0.65 Oats 157 0.38 Lettuce 160 0.88 Maltabella 157 0.64 Pronutro 156 0.37 Beans, lentils and peas (cooked) 160 0.88 Fish, tuna 156 0.63 Cauliflower 160 0.36
Beef mince 159 0.87 Pork, bacon 160 0.63 Yoghurt plain 158 0.35 Peas, green 157 0.86 Mushroom 158 0.61 Lentils 159 0.31 Bean salad, no oil 159 0.85 Cream crackers 160 0.61 Cake, with icing 161 0.83 Broccoli 159 0.58
104
4.3.3.2 Food frequency questionnaire results
The food frequency questionnaire data was collected from either the head of the household or
the person responsible for purchasing the groceries for the household. Appendix K
(Supplementary Information) indicates the food items consumed by households and the
frequency of consumption. Table 4.10 indicates the average frequency score using an ordinal
scale. The mean value was determined using the average frequency scores. These scores were
used to identify which food items were consumed the most and the least.
4.4 Discussion
The purpose of this study was to assess the nutritional status of communities residing in four
rural areas of KZN using selected anthropometric indices and dietary assessment methods.
4.4.1 Anthropometry
4.4.1.1 Children
The results indicate that under- and over-nutrition co-existed in children. In comparison to other
South African studies, the prevalence of stunting in children (30.8%) in the current study was
higher than the 2016 SADHS, which found that 27% of children under five years were stunted
(nDoH et al., 2017). The prevalence of stunting in children in the current study was also higher
than that reported by earlier national studies. The 2005 NFCS-FB study indicated that one in
five children in SA was stunted, and the SANHANES-1 study indicated that 26.5% of South
African children aged 1-3 years were stunted (Labadarios et al., 2008; Shisana et al., 2013).
This study also found a higher prevalence of stunting in children compared to a study conducted
in the uMkhanyakude and Zululand districts of KZN, which found that 24% and 26% of
children were stunted, respectively (Schoeman et al., 2010). However, the results of the current
study should be interpreted with caution because a small sample was taken from the population
of children under five years of age. Another limitation was that anthropometric data were
collected only from children who were present at the time of the study. It is recommended that
these limitations be addressed in future studies.
Stunting is a chronic form of undernutrition which is classified by a HFA < -2SD and results
from a lack of adequate energy or nutrient intake for a prolonged period (WHO, 2008a). There
are many negative consequences to stunting and it can be detrimental. It can lead to poor
performance in school and poor social and mental development, resulting in a poor quality of
life (Escott-Stump, 2015; HST, 2016; UNICEF, 2016). Furthermore, stunting could lead to
obesity in adulthood, which increases the risk for health-related conditions (Escott-Stump,
105
2015; HST, 2016; UNICEF, 2016). The effects of stunting become irreversible after two years
of age (HST, 2016).
Although undernutrition is a serious problem in SA, over-nutrition is also of concern. This
study found that 15.5% (n=6) of children under five years were overweight. This result was
expected as Southern Africa accounts for 12% of overweight children in Africa (FAO et al.,
2017). The current study results for overweight in children under five years was higher than
other national studies (Labadarios et al., 2008; Shisana et al., 2013; nDoH et al., 2017). The
2005 NFCS-FB found that one in ten South African children were overweight (Labadarios et
al., 2008), whereas the 2016 SADHS found that 13% of children under five years old were
overweight (nDoH et al., 2017). The percentage of overweight children increased between 2005
and 2016 (Labadarios et al., 2008; Shisana et al., 2013). Furthermore, the 2012 SANHANES-
1 study indicated that KZN was one of the provinces with the highest rates of obesity among
children (Shisana et al., 2013). As mentioned earlier, in the current study, measurements were
obtained from a small sample and results should be interpreted with caution. However, obesity
in childhood is still an issue and is on the rise in SA, especially in KZN. Childhood obesity has
been linked to a number of chronic diseases in adulthood such as cardiovascular disease,
hypertension and diabetes mellitus (Escott-Stump, 2015).
It is important to remember that caregivers are responsible for the types of food and portion
sizes given to children (Omidire et al., 2015). Food choice is influenced by many factors such
as affordability, seasonality, cultural practices and personal preferences (Kearney, 2010;
Wenhold et al., 2012; Kamphuis et al., 2015; Emily et al., 2017). Caregivers are more likely to
give their child a food item that is affordable and positively affects their child’s health
(Govender et al., 2014). Thus, if caregivers are educated on nutritious foods, they would be able
to make more informed choices, leading to an improved nutritional status for their children. A
good nutritional status can be achieved not only by having access to nutritious foods but also
by correct utilisation of these foods. Many rural communities cannot afford a variety of foods.
However, if healthier cheaper food types were provided such as underutilised and biofortified
crops and caregivers were educated on the correct processing and preparation methods of these
crops, the nutritional status of vulnerable children could be improved.
4.4.1.2 Adults
The prevalence of obesity among females (39.1%) in the current study is similar to the 2016
SADHS, which found that one in five women were severely obese and the SANHANES-1
study, which found that 31.8% of females living in rural areas were obese (Shisana et al., 2013;

106
nDoH et al., 2017). Black African women have been previously reported to be most at risk of
obesity (Puoane et al., 2002; Senekal et al., 2003), similar to the current study. The prevalence
of overweight and obesity was higher in females than males in the current study, which was
similar to the 2016 SADHS and 2012 SANHANES-1 study (Shisana et al., 2013; nDoH et al.,
2017). The prevalence of overweight and obesity is on the rise in all provinces of SA, with the
KZN province having the second highest prevalence (Ziraba et al., 2009; Shisana et al., 2013).
This is a major concern as overweight and obesity increases the risk of non-communicable
diseases such as cardiovascular disease (CVD), certain cancers, type 2 diabetes and
musculoskeletal disorders (WHO, 2011a; Nyberg et al., 2018).
Waist circumference measurements and BMI confirmed that females were more at risk for
chronic diseases of lifestyle than males. This is a problem as obesity affects women at every
stage of the life cycle (Hawkins et al., 2018). It can have economic, biological and psychosocial
implications. A child born to a pregnant, obese mother is at increased risk of chronic diseases,
thus negatively affecting the health of future generations (Hawkins et al., 2018). This study
indicated that individuals with a higher BMI also had a higher waist circumference, indicating
an increased risk for obesity-related diseases. A study by Zhu et al. (2004), conducted on 8712
white men and women indicated that a combination of both a high BMI and waist circumference
could increase the risk for CVD (Zhu et al., 2004). Another study by Gierach et al. (2014),
found a direct relationship between waist circumference and BMI. High amounts of abdominal
fat were noted in overweight males and normal females (Gierach et al., 2014). The risk for
comorbidities due to a large waist circumference can be independent of BMI (Jansen et al.,
2002; Wildman et al., 2005).
The study findings indicate that there is an urgent need for interventions to address the high
prevalence of overweight and obesity. A possible strategy to address this problem could be to
increase the nutrient density of foods consumed by vulnerable individuals through the
introduction of food types that are more accessible and affordable, such as biofortified foods
and alternative crops. However, the acceptance of alternative food types would need to be
investigated. The prevalence of obesity could be reduced by educating the affected population
groups on optimum methods of food preparation and processing, and emphasising healthier
cheaper food types and control of portion sizes.
4.4.1.3 Women of childbearing age (16-35 years)
As mentioned earlier, black African women were reported to be at greatest risk for obesity in
SA (Puoane et al., 2002; Senekal et al., 2003). This study found that among the females aged
107
16-35 years, there was a higher prevalence of overweight and obesity (n=55; 58.5%) than
underweight (n=8; 8.5%). This was an expected result for rural areas of KZN as the 2012
SANHANES-1 study reported that, on a national level, the prevalence of obesity in women
from the rural formal and rural informal populations was 31.8% and 37.6%, respectively
(Shisana et al., 2013). Furthermore, the SANHANES-1 study found that the prevalence of
overweight and obesity was high among women (24.8% and 39.2%, respectively), which was
similar to findings of the current study (26.6% and 31.9%, respectively). Additionally, the
prevalence of overweight and obesity has been found to increase with age in black African
females (Smuts et al., 2008; Zhu et al., 2012; Devanathan et al., 2013; Duncan et al., 2014).
A possible reason for the increase in obesity could be due to incorrect perceptions. Many
women residing in rural areas often do not perceive themselves as being overweight or obese
and do not consider their weight to be a problem (Devanathan et al., 2013; Duncan et al., 2014;
Okop et al., 2016). Another reason could be due to the negative stigma associated with thinness.
In some cultures, thinness is associated with illness and HIV, whereas obesity is associated with
wealth, happiness and good health (Devanathan et al., 2013; Duncan et al., 2014).
The results of this study indicate that there is a need to address obesity, especially in KZN.
It is a challenge to address the problem of incorrect perceptions of body weight as rural black
African women have strong cultural beliefs (Duncan et al., 2014). In most cases, individuals
that are most affected by overweight and obesity are women that have less than a primary school
education (Ziraba et al., 2009). Thus, nutrition education has the potential to contribute to
improving the nutritional status of these communities. Women are usually responsible for
preparing meals and for feeding children. If nutrition education is targeted at women and they
are taught how to modify their diets or prepare nutritious alternative crops, they are more likely
to prepare this for themselves and their families, which may result in an improved nutritional
status (Omidire et al., 2015). Although the impact of education on food choice was not assessed
in the current study, the low level of education of a substantial proportion of the study
participants could have contributed to the over-nutrition and undernutrition observed. This
hypothesis should be tested in future studies.
4.4.2 Dietary assessment
4.4.2.1 24-hour repeated recall
The results from the 24-hour repeated recall suggest that not all age groups met their nutritional
requirements. Protein and carbohydrates were consumed in large quantities, whilst the diet
lacked adequate amounts of dietary fibre in most age groups. Although protein was consumed
108
in larger amounts, it was obtained mainly from plant sources, rather than animal sources. These
results were similar to results from a study conducted by Kolahdooz et al. (2013), where most
of the study participants consumed protein from plant sources. Animal sources of protein are
known to contain essential micronutrients, fatty acids and high-quality protein (Schönfeldt et
al., 2013). The poor dietary intake of animal proteins could be due to poor availability and
accessibility, especially in rural areas (Schönfeldt and Hall, 2012). Many rural communities do
not have access to a variety of foods and rely solely on Spaza shops (informal convenience
shops found in rural areas that sell a small range of food items). These shops do not sell a variety
of food items and the food that they stock is usually sold at increased prices and are most often
unaffordable. Many rural households purchase foods that are starch-based such as maize meal,
as these are cheaper when bought in bulk (Temple and Steyn, 2009; Battersby and Peyton,
2014). A review conducted by Schönfeldt and Hall (2012), points out that plant-based shelf-
stable staples are a predominant part of the diet in disadvantaged communities (Schönfeldt et
al., 2013). In this study, the food frequency confirmed that phutu (n=158) which is made from
maize meal, was one of the most frequently consumed food items.
Starch-based foods consumed alone are not nutritionally adequate. However, animal-based
proteins are unaffordable to most people. Legumes could be considered as a good alternative to
animal protein (Huma et al., 2008). It contains protein as well as fibre which contributes to
satiety, resulting in the consumption of smaller portions of food (Slavin and Green, 2007), thus
preventing overeating and weight gain. When a starch-based food is consumed together with
legumes, it provides complementary proteins. Starch-based foods lack lysine and tryptophan
that is found in legumes, and the sulfur-containing amino acids that are limiting in legumes are
found in starch-based foods (Serna-Saldivar, 2010). The combination of legumes and starch-
based foods together could be considered a more nutritious alternative to starch-based foods
consumed alone.
The provision of nutrition education on dietary modification of foods currently consumed
and portion control are other strategies to improve nutritional status. Portion control can help
to maintain weight. If more calories are consumed than expended, it would result in weight gain
(Hawkins et al., 2018). Educating individuals on the correct portion sizes and affordable healthy
food choices could result in a change in lifestyle, resulting in a reduction in obesity. However,
education alone is not enough as compliance is not always guaranteed. Thus, follow-up sessions
and monitoring dietary intake for a certain period of time could help improve eating habits and
reduce obesity. Sixty minutes a day of physical activity should be promoted in order to assist
with weight loss (Hawkins et al., 2018).

109
More than 50% of the sample of children and adults had inadequate intake of the following
nutrients: magnesium, phosphorus, zinc, riboflavin, niacin, folate, vitamin B12, vitamin A,
vitamin C, vitamin E and vitamin K, for most of the age groups. These results were similar to
results from the 1999 NFCS, which indicated that South African children, especially rural
children, had a low intake of the following micronutrients: vitamin A, calcium, iron, zinc, folate,
vitamin B6, niacin, riboflavin, vitamin C and vitamin E (Labadarios et al., 2000). Possible
reasons for the inadequate nutrient intake could be due to seasonal availability of foods or foods
not consumed at the time of data collection. The current study results should be interpreted with
caution as 24-hour recalls were only collected for two days. Dietary data is very subjective and
there is room for inaccurate reporting and analysis (Shim et al., 2014).
Micronutrient deficiency is defined as an inadequate status of one or more micronutrients
and is just as serious as under- and over-nutrition. Although micronutrient deficiency is a
problem, it is not routinely treated in developing countries. It can result in several health
conditions, including growth retardation and delayed development (Bain et al., 2013). Thus, it
is important for individuals to consume good quality, nutrient-dense foods in order to avoid
micronutrient deficiencies, however, this is not always possible due to the high cost of these
foods. The most common micronutrient deficiencies observed in developing countries are iron,
iodine, zinc and vitamin A (Bailey et al., 2015). Amongst the micronutrient deficiencies, iron
and vitamin A are of concern in South Africa. Many South African national studies have shown
this to be true, especially in vulnerable groups such as women and children (Labadarios and
Van Middelkoop, 1995; Labadarios et al., 2000; Smuts et al., 2005; Bain et al., 2013; Shisana
et al., 2013).
The current study results indicated that 50% of the females aged 14 to > 70 years had an
inadequate intake of iron. The low intake could be due to the high cost of iron-rich foods. As
mentioned, many rural communities rely predominantly on starch-based diets, which contain
limited amounts of fruits, vegetables and animal protein (Shisana et al., 2013). A study
conducted in 2016 on 651 healthy South African adults indicated that the prevalence of anaemia
was 12.6%, which was lower than the findings of the 2012 SANHANES-1 study (Phatlhane et
al., 2016). Further, both studies found the prevalence of anaemia to be higher among females
than males (Shisana et al., 2013; Phatlhane et al., 2016). This study showed that dietary intake
of iron was low and females were at higher risk of becoming iron deficient or further worsening
their already poor iron status. This is a major concern especially for pregnant women as iron
requirements are increased during pregnancy. If a mother has a poor nutritional status, she is at
increased risk of giving birth to a malnourished child (King, 2016). Furthermore, if a mother
110
has iron-deficiency anaemia during pregnancy, it can result in fetal and maternal mortality,
morbidity, pre-eclampsia, bleeding and infection (Abu-Ouf and Jan, 2015). A possible long-
term strategy that could be explored to help address iron deficiency is dietary diversification,
through the promotion of household and community food gardens, utilisation of indigenous
crops and consumption of biofortified foods.
Vitamin A deficiency (VAD) is a major health concern in SA. In this study, vitamin A
intake was inadequate in all of the age groups due to poor intake of animal-based foods, fruits
and vegetables. Furthermore, no participants had reported that they were taking any vitamin or
mineral supplements at the time of data collection. Thus, the analysis of vitamin A did not
include any vitamin A supplements. This low intake is in line with national data, which
indicated that the vitamin A status of South African children had worsened between 1994 and
2005 (Labadarios and Van Middelkoop, 1995; Labadarios et al., 2000; Labadarios et al., 2008).
Further, the 2005 NFCS-FB study indicated that one in 10 women were vitamin A deficient in
KZN (Labadarios et al., 2008). The 2012 SANHANES-1 study reported high rates of VAD
throughout SA, however, it noted an improvement in the status of women residing in KZN
(Shisana et al., 2013). As alluded to earlier, the South African government has employed a
number of interventions to combat VAD, including food fortification, vitamin A
supplementation and dietary diversity (DoH and UNICEF, 2007; Swart et al., 2008; WHO,
2011b). The current study indicates that although these interventions are in place, vitamin A
intake remains inadequate. Possible complementary strategies such as biofortification of
already consumed staple foods such as maize with vitamin A, or increased usage of alternative
crops, could be used together with already existing strategies in KZN, to improve vitamin A
intake.
4.4.2.2 Food frequency
The food frequency results indicated that onion, phutu, brown bread, tomato, rice, apple, eggs
and chicken were the most commonly consumed food items. This was similar to studies
conducted in SA which documented that mealie meal, white sugar, tea, brown bread, non-dairy
creamer, brick margarine, chicken meat, full cream milk and dark green leafy vegetables were
frequently consumed (Labadarios et al., 2000; Steyn et al., 2003). Similarly, another study
conducted in KZN, by Faber et al. (2013), found that sugar, maize meal porridge, bread, rice,
cordial squash, hard margarine, tea and legumes were the most commonly consumed food
items. Additionally, a study conducted by Faber et al. (2015), found that 50.5% of participants
from rural KZN consumed both bread and maize meal (Faber et al., 2015). From this, it is

111
evident that in SA, more specifically in rural areas of KZN, most diets comprise of starch-based
foods, either a maize-based dish, bread or rice. This could lead to an excessive intake of
carbohydrates and energy, thus contributing to a high prevalence of obesity (Hawkins et al.,
2018).
Consumption of high amounts of refined carbohydrates have been associated with an
increased risk of coronary heart disease, insulin resistance, obesity, diabetes, hypertension and
stroke (López-Alarcón et al., 2014; Li et al., 2015; Okop et al., 2016). Study participants who
were overweight and obese were at increased risk of conditions such as cardiovascular disease
(CVD), certain cancers, type 2 diabetes and hypertension. A possible reason for this high
prevalence could be due to poor food choices, sedentary lifestyle or lack of physical activity
(Fabbri and Crosby, 2016; Wiklund, 2016; Hawkins et al., 2018). Increasing physical activity
and energy expenditure could be another way of reducing the rates of obesity (Wiklund, 2016).
However, this study did not investigate physical activity. Most study participants consumed
processed foods or purchased foods prepared with large amounts of fat and sugar, resulting in
high energy intake. Sweets were one of the most commonly consumed unhealthy food items in
this study. If more fruit was consumed in place of high-energy snacks and if preparation
methods such as steaming, baking and boiling, rather than frying were incorporated into daily
cooking, this could aid in reducing the prevalence of obesity in the long-term (He et al., 2004;
Fabbri and Crosby, 2016). Rural communities could achieve this if they saved the money that
is usually spent on unhealthy snacks to buy fruits that are in season and cheaper. If produce is
grown, individuals could sell leftover produce and use the money to purchase healthier,
affordable snacks.
4.5 Conclusions
The results of the current study indicate that under- and over-nutrition co-exist in the black
African rural communities of KZN studied. Stunting was prevalent among children under five
years of age, whilst obesity affected children under five years of age and adults, especially
females aged 16-35 years. There was frequent consumption of food items high in carbohydrates
(mainly the cereal grain foods) and high in protein (chicken and eggs) and low in micronutrients
and fibre. The findings suggest that the nutrition transition has influenced the nutritional status
of the rural KZN population groups investigated. The use of agriculture to improve the
availability of and access to diverse, affordable and nutrient-dense foods should be explored.
In this regard, the inclusion of several nutritious alternative crops in such agricultural
interventions should be encouraged. Future studies should explore improving current diets with
112
biofortified and alternative crops such as maize, sweet potato and protein-rich crops such as
bambara groundnut. Furthermore, there is a need to investigate the nutritional composition of
these crops so that these crops can be incorporated into the diets of vulnerable population groups
to improve their nutritional status.
References
ABU-OUF N and JAN MM (2015) The impact of maternal iron deficiency and iron deficiency anemia
on child’s health Saudi Med J 36 146-149
ARGENT J, FINN A, LEIBBRANDT M, and WOOLARD I (2009) NIDS National Income Dynamics
Study Poverty: Analysis of the NIDS wave 1 dataset discussion paper no13
ARMSTRONG M, LAMBERT MI, SHARWOOD KA, and LAMBERT EV (2006) Obesity and
overweight in South African primary schoolchildren – the Health of the Nation Study J Endocri, Meta
Diabetes S Afr 11(2) 52-62
BAILEY RL, WEST JR KP, and BLACK RE (2015) The epidemiology of global micronutrient
deficiencies Ann Nutri Meta 66 (sup 2) 22-33 doi:101159/000371618
BAIN LE, AWAH PK, GERALDINE N, KINDONG NP, SIGAL Y, BERNARD N, and TANJEKO
AT (2013) Malnutrition in Sub-Saharan Africa: burden, causes and prospects Pan-Afri Med J 15 120
doi1011604/pamj2013151202535
BATTERSBY J and PEYTON S (2014) The geography of supermarkets in Cape Town: supermarket
expansion and food access Urban Forum 25, 153-164
CHIBARABADA TP, MODI AT, and MABHAUDHI T (2017) Expounding the value of grain legumes
in the semi-and arid tropics Sustain 9, 60; https://doiorg/103390/su9010060
CHOPRA M, DAVIAUD E, PATTINSON R, FONN S, and LAWN JE (2009) Saving the lives of South
Africa’s mothers, babies and children Can the health system deliver? Lancet 374 (9692) 835-846
CHOWDHURY S, MEENAKSHI JV, TOMLINS KI, and OWORI C (2011) Are consumers in
developing countries willing to pay more for micronutrient-dense biofortified foods? Evidence from a
field experiment in Uganda Am J Agric Econ 93 83-97
COULSTON AM, BOUSHEY CJ, and FERRUZZI MG, 2013 Nutrition in the Prevention and
Treatment of Disease, 3rd ed California: Academic Press
DEPARTMENT OF AGRICULTURE FORESTRY AND FISHERIES (DAFF) (2017) Trends in the
Agricultural Sector 2017 1-77
113
http://wwwdaffgovza/Daffweb3/Portals/0/Statistics%20and%20Economic%20Analysis/Statistical%20
Information/Trends%20in%20the%20Agricultural%20Sector%202017pdf (accessed on 09/09/18)
DEPARTMENT OF HEALTH (DoH) (2018) Standard operating procedures on the prevention and
management of malnutrition in KZN DoH, Pietermaritzburg
DEPARTMENT OF HEALTH (DOH), UNITED NATIONS CHILDREN’S FUND (UNICEF) (2007)
A Reflection of the South African Maize Meal and Wheat Flour Fortification Programme (2004 to 2007)
https://wwwuniceforg/southafrica/SAF_resources_wheatfortificationnpdf (Accessed on 17/8/2017)
DEVANATHAN R, ESTERHUIZEN TM, and GOVENDER RD (2013) Overweight and obesity
amongst Black women in Durban, KwaZulu-Natal: A ‘disease’ of perception in an area of high HIV
prevalence Afr J Prim Health Care Fam Med 5(1) 1-7
DEVELOPMENT INITIATIVES (2017) Global Nutrition Report 2017: Nourishing the SDGs Bristol:
Development Initiatives
DEVELOPMENT INITIATIVES (2018) Global Nutrition Report 2018: Shining a light to spur action
on nutrition Bristol: Development Initiatives
DUNCAN PR, HOWE LD, MANUKUSA Z, and PURDY S (2014) Determinants of obesity and
perception of weight in hypertensive patients in rural South Africa S Afri J Clin Nutr 27(2) 56-62
EMILY KB, HUGGINS CE, HUGGINS CT, MCCAFFREY TA, PALERMO C, and BONHAM M
(2017) Influences on dietary choices during day versus night shift in shift workers: A mixed methods
study Nutrients 9(193), doi:103390/nu9030193
ESCOTT-STUMP S (2015) Nutrition and Diagnosis-Related Care, 8th ed Wolters Kluwer, Philadelphia
FABER M, and WENHOLD F (2007) Nutrition in contemporary South Africa Water SA 33(3) 393-400
FABER M, LAUBSCHER R, and LAURIE S (2013) Availability of, access to and consumption of fruits
and vegetables in a peri-urban in KwaZulu-Natal, South Africa Maternal and Child Nutrition 9(3) 409-
424
FABER M, VAN JAARSVELD PJ, KUNNEKE G, KRUGER HS, SCHOEMAN SE, and VAN
STUIJVENBERG ME (2015) Vitamin A and anthropometric status of South African preschool children
from four areas with known distinct eating patterns Nutrition 31 64-71
FABER M and KRUGER HS (2005) Dietary intake, perceptions regarding body weight, and attitudes
toward weight control of normal weight, overweight, and obese black females in a rural village in South
Africa Ethnicity Dis 15, 238-244
114
FOOD AND AGRICULTURE ORGANISATION OF THE UNITED NATIONS (FAO),
INTERNATIONAL FUND FOR AGRICULTURAL DEVELOPMENT (IFAD), UNITED NATIONS
CHILDREN’S FUND (UNICEF), WORLD FOOD PROGRAMME (WFP), and WORLD HEALTH
ORGANISATION (WHO) (2017) The state of food security and nutrition in the world 2017 Building
resilience for peace and food security FAO, Rome
GIBSON RS (2005) Principles of Nutritional Assessment, 2nd ed New York: Oxford University Press,
Inc
GIERACH M, GIERACH J, EWERTOWSKA M, ARNDT A and JUNIK R (2014) Correlation between
Body Mass Index and Waist Circumference in Patients with Metabolic Syndrome Endocrinology 1-6,
doi:101155/2014/514589
GILLESPIE S, and MASON J (1994) Controlling Vitamin A Deficiency – Nutrition Policy Discussion
Paper No 14 ACC/SCN, Geneva
GOVENDER L, PILLAY K, DERERA J, and SIWELA M (2014) Acceptance of a complementary food
prepared with yellow, provitamin A-biofortified maize by black caregivers in rural KwaZulu-Natal S
Afri J Clin Nutr 27(4) 217-221
GOVENDER L, PILLAY K, SIWELA M, MODI A, and MABHAUDHI T (2017) Food and Nutrition
Insecurity in Selected Rural Communities of KwaZulu-Natal South Africa – Linking Human Nutrition
and Agriculture Int J Environ Res Public Health 14 17 doi: 103390/ijerph14010017
HAWKINS SS, OKEN E, and GILLMAN MW (2018) Early in the life course: time for obesity
prevention In: Handbook if life course health development Halfon N, Forrest CB, Lerner RM and
Faustma EM eds Cham: Springer International Publishing
HE K, HU FB, COLDITZ GA, MANSON JE, WILLETT WC, and LIU S (2004) Changes in intake of
fruits and vegetables in relation to risk of obesity and weight gain among middle-aged women Int J Obes
28, 1569-1574
HEALTH SYSTEMS TRUST (HST) (2016) Malnutrition causes, economic loss, half of all child
deaths http://wwwhstorgza/news/malnutrition-causes-economic-loss-half-all-child-deaths (Accessed
on 04 September 2016)
HUMA N, ANJUM FM, SEHAR S, KHAN MI, and HUSSAIN S (2008) Effect of soaking and cooking
on nutritional quality and safety of legumes Nutr Food Sci 38, 570-577
INSTITUTE OF MEDICINE (2006) Dietary DRI reference intakes: The essential guide to nutrient
requirements Washington DC: National Academy Press
INSTITUTE OF MEDICINE (1997) Dietary Reference Intakes for calcium, phosphorous, magnesium,
vitamin D and fluoride Food and Nutrition Board Washington DC: National Academy Press
115
INSTITUTE OF MEDICINE (1998) Dietary Reference Intakes for thiamine, riboflavin, niacin, vitamin
B6, folate, vitamin B12, pantothenic acid, biotin and choline Food and Nutrition Board Washington DC:
National Academy Press
INSTITUTE OF MEDICINE (2000) Dietary Reference Intakes for vitamin C, vitamin E, selenium and
carotenoids Food and Nutrition Board Washington DC: National Academy Press
INSTITUTE OF MEDICINE (2001a) Dietary reference intakes: application in dietary assessment Food
and Nutrition Board Washington DC: National Academy Press
INSTITUTE OF MEDICINE (2001b) Dietary Reference Intakes for vitamin A, vitamin K, arsenic,
boron, chromium, copper, iodine, iron, manganese, molybdenum, nickel, silicon, vanadium and zinc
Food and Nutrition Board Washington DC: National Academy Press
INSTITUTE OF MEDICINE (2003) Dietary Reference Intakes: Application in Dietary Assessment
Food and Nutrition Board Washington DC: National Academy Press
JANSEN I, HEYMSFIELD SB, ALLISON DB, KOTLER D, and ROSS R (2002) Body mass index and
waist circumference independently contribute to the prediction of nonabdominal, abdominal
subcutaneous and visceral fat Am J Clin Nutr 75, 683-688
Joubert J, Norman R, Bradshaw D, Goedecke JH, Steyn NP and Puoane T (2007) The South African
Comparative Group, Estimating the burden of disease attributable to excess body weight in South Africa
in 2000 S Afr Med J 97, 683-690
KAMPHUIS CB, DE BEKKER-GROB EW and VAN LENTHE FJ (2015) Factors affecting food
choices of older adults from high and low socioeconomic groups: a discrete choice experiment Am J
Clin Nutr 104(4), 768-774
Kearney J (2010) Food consumption trends and drivers Philos Trans Royal Soc 365, 2793-2807
KIMANI-MURAGE EW, KAHN K, PETTIFOR JM, TOLLMAN SM, DUNGER DB, GÓMEZ-
OLIVÉ XF, and NORRIS S (2010) The prevalence of stunting, overweight and obesity, and metabolic
disease risk in rural South African children Biomed Central Public Health 10(158) 1-13
KING JC (2016) A summary of pathways or mechanisms linking preconception maternal nutrition with
birth outcomes. J Nutr 146 1437S-1444S
KOLAHDOOZ F, SPEARING K, and SANGITA S (2013) Dietary adequacies among South African
adults in rural KwaZulu-Natal PLos ONE 8(6) e67184 doi:101371/journalpone0067184
LABADARIOS D VAN and MIDDELKOOP AM (1995) The South African Vitamin A Consultative
Group Children Aged 6-71 Months in South Africa 1994; Their Anthropometric Vitamin A Iron and
Immunization Coverage Status Isando South Africa

116
LABADARIOS D, MOODIE IM, and VAN RENSBURG A (2007) Vitamin A status: In: Labadarios
D National Food Consumption Survey: Fortification Baseline, Chapter 9B: South Africa 2005
Department of Health, Stellenbosch
LABADARIOS D, STEYN N, MAUNDER E, MACINTYRE U, SWART R, GERICKE G,
HUSKISSON J, DANNHAUSER A, VORSTER HH, and NESAMVUNI EA (2000) The National Food
Consumption Survey (NFCS): children aged 1-9 years, South Africa 1999 Department of Health:
Directorate of Nutrition, Pretoria
LABADARIOS D, STEYN NP, NEL J (2011) How diverse is the diet of adult South Africans? Nutr J
10(33) 1-11
LABADARIOS D, SWART R,MAUNDER EMW, KRUGER HS, GERICKE GJ, KUZWAYO PMN,
NTSIE PR, STEYN NP, SCHLOSS I, DHANSAY MA, JOOSTE PL, DANNHAUSER A, NEL JH,
MOLEFE D and KOTZE TJVW (2008) The national food consumption survey Fortification baseline
(NFCS:FB-1) SA J Clin Nutri 21(3) (supp 2) 246-271
LEE RD and NIEMAN, DC (2010) Nutritional Assessment, 5th Ed New York: McGraw-Hill
LI Y, HRUBY A, BERNSTEIN AM, LEV SH, WANG DD, CHIUVE SE, SAMPSON L, REXRODE
KM, RIMM EB, WILLETT WC, and HU FB (2015) Saturated fats compared with unsaturated fats and
sources of carbohydrates in relation to risk of coronary heart disease: A prospective cohort study J Am
College Cardio 66(14), 1538-1548
LÓPEZ-ALARCÓN M, PERICHART-PERERA O, FLORES-HUERTA S, INDA-ICAZA P,
RODRÍGUEZ-CRUZ M, ARMENTA-ÁLVAREZ A, BRAM-FALCÓN MT, MAYORGA-OCHOA M
(2014) Excessive refined carbohydrates and scarce micronutrients intakes increase inflammatory
mediators and insulin resistance in pre-pubertal and pubertal obese children independently of obesity
Mediators of Inflammation 1-8, http://dxdoiorg/101155/2014/849031
LUTTER CK, DAELMANS BMEG, DE ONIS M, KOTHARI MT, RUEL MT, ARIMOND M,
DEITCHLER M, DEWEY KG, BLӦSSNER M, and BORGHI S (2011) Undernutrition, poor
feeding practices, and low coverage of key nutrition interventions J Am Acad Paedatr 128 e1418-e1427
MABHAUDHI T CHIBARABADA T and MODI A (2016) Water-food-nutrition-health nexus: Linking
water to improving food nutrition and health in Sub-Saharan Africa Int J Environ Res Public Health 13
1-19
MANARY MJ, and SANDIGE HL (2008) Management of acute moderate and severe childhood
malnutrition Br Med J 337 1227-1230
MURPHY SP, GUENTHER PM, and KRETSCH MJ, 2006 Using the dietary reference intakes to assess
intakes of groups: pitfalls to avoid J Am Diet Asso 106 1550-1552

117
NATIONAL AGRICULTURAL MARKETING COUNCIL (NAMC) (2019) Markets and economic
research centre: food basket price monthly https://wwwnamccoza/wp-content/uploads/2019/04/NAMC-
Food-Basket-Price-Monthly-Apr-2019pdf (accessed on 20/05/19)
NYBERG ST, BATTY GD, PENTTI J, VIRTANEN M, ALFREDSSON L, FRANSSON EI,
GOLDBERG M, HEIKKILÄ K, JOKELA M, KNUTSSON A, KOSKENVUO M, LALLUKKA T,
LEINEWEBER L, LINDBOHM JV, MADSEN IEH, HANSON LLM, NORDIN M, OKSANEN T,
PIETILÄINEN O, RAHKONEN O, RUGULIES R, SHIPLEY MJ, STENHOLM S, SUOMINEN S,
THEORELL T, VAHTERA J, WESTERHOLM PJM, WESTERLUND H, ZINS M, HAMER M,
SINGH-MANOUX A, BELL JA, FERRIE JE KIVIMÄKI M (2018) Obesity and loss of disease-free
years owing to major non-communicable diseases: a multicohort study Lancet Public Health 3 490-497
OKOP KJ, MUKUMBANG FC, MATHOLE T, LEVITT N and PUOANE T (2016) Perception of body
size, obesity threat and the willingness to lose weight among black South African adults: a qualitative
study Biomed Cent Public Health 16 (365), 1-13
OMIDIRE MF, ANNAMOSIA D and MAMPANE MR (2015) Perception of the roles and
responsibilities of caregivers in children’s homes in South Africa Revista de Asistenţ Social 2 113-126
PHATLHANE DV, ZEMLIN AE, MATSHA TE, HOFFMANN M, NAIDOO N, ICHIHARA K, SMIT
F and ERASMUS RJ (2016) The iron status of a healthy South African population Clinica Chimica Acta
460 240-245
PUOANE T, STEYN K, BRADSHAW D, LAUBSCHER, R, FOURIE, J, LAMBERT V and
MBANANGA N (2002) Obesity in South Africa: The South African demographic and health survey
Obes Res 10 1038-1048
REPUBIC OF SOUTH AFRICA (RSA) (2019) Tito Titus Mboweni Minister of Finance: 2019 budget
speech http://wwwtreasurygovza/documents/national%20budget/2019/speech/speechpdf (accessed on
03/03/19)
RODRIGO CP, ARANCETA J, SALVADOR G and VARELA-MOREIRAS G (2015) Food frequency
questionnaires Nutrición Hospitalaria 31(sup 3), 49-56
SCHOEMAN S, FABER M, ADAMS V, SMUTS C, FORD-NGOMANE N, LAUBSCHER J, and
DHANSAY M (2010) Adverse social, nutrition and health conditions in rural districts of the KwaZulu-
Natal and Eastern Cape Provinces, South Africa S Afri J Clin Nutr 23(3) 140-147
SCHÖNFELDT HC, GIBSON N, and VERMEULEN H (2010) The possible impact of inflation on
nutritionally vulnerable households in a developing country using South Africa as a case study Nutr Bull
35 254-267
SCHÖNFELDT HC and HALL NG (2012) Dietary protein quality and malnutrition in South Africa Br
J Nutr 108 S69-S76
118
SCHÖNFELDT HC, PRETORIUS B and HALL N (2013) The impact of animal source food products
on human nutrition and health S Afr J Ani Sci 41 394-412
SENEKAL M, STEYN NP and NEL JH (2003) Factors associated with overweight/obesity in
economically active South African populations Ethnicity Dis 13 109-116
SERNA-SALDIVAR SO (2010) Cereal grains: properties, processing and nutritional attributes Boca
Raton: CRC Press
SHEEHY T, KOLAHDOOZ F, MTSHALI L, KHAMIS T and SHARMA S (2013) Development of a
quantitative food frequency questionnaire for use among rural South Africans in KwaZulu-Natal J
Human Nutr Diet 1-7
SHIM J, OH K and KIM HC (2014) Dietary assessment methods in epidemiologic studies Epidem
Health 36 1-8
SHISANA O, LABADARIOS D, REHLE T, SIMBAYI L, ZUMA K, DHANSAY A, REDDY P,
PARKER W, HOOSAIN E, NAIDOO P, HONGORO C, MCHIZA Z, STEYN NP, DWANE N,
MAKOAE M, MALULEKE T, RAMLAGAN S, ZUNGU N, EVANS MG, JACOBS L, FABER M and
SANHANES-1 Team (2013) South African National Health and Nutrition Examination Survey
(SANHANES-1) Cape Town: HSRC Press
SIZER FS and WHITNEY EN (2017) Nutrition Concepts and Controversies 4th ed Boston: Cengage
Learning
SLAVIN J and GREEN H (2007) Dietary fibre Nutr Bull 32(supp 1), 32-42
SMUTS CM, DHANSAY MA, FABER M, VAN STUIJVENBERG ME, SWANEVELDER S, GROSS
R and BENADÉ AJS (2005) Efficacy of multiple micronutrient supplementation for improving anaemia
micronutrient status and growth in South Africa infants J Nutr 135 653S-659
SMUTS CM, FABER M, SCHOEMAN SE, LAUBSCHER JA, OELOFSE A, BENADÉ AJS, and
DHANSAY MA (2008) Socio-demographic profiles and anthropometric status of 0-to 71-month-old
children and their caregivers in rural districts of the Eastern Cape and KwaZulu-Natal provinces of South
Africa S Afri J Clin Nutr 21(3) 117-124
SPEARING K, KOLAHDOOZ F, LUKASEWICH M, MATHE N, KHAMIS T, and SHARMA S
(2012) Nutritional composition of commonly consumed composite dishes in rural villages in
Empangeni, KwaZulu-Natal, South Africa J Human Nutr Diet 1-8 doi:101111/jhn12001
STATISTICS SOUTH AFRICA (StatsSA) (2018) General Household Survey (2017)
http://wwwstatssagovza/publications/P0318/P03182017pdf (accessed on 26/07/18)
STEYN NP, NEL JH, and CASEY A (2003) Secondary data analyses of dietary surveys undertaken in
South Africa to determine usual food consumption of the population Public Health Nutr 6 631-644

119
TEMPLE NJ, and STEYN N (2016) Community Nutrition for Developing Countries UNISA Press,
Pretoria
UNITED NATIONS CHILDREN’S FUND (UNICEF) (1998) The State of the World’s Children 1998
http://wwwuniceforg/sowc98/silent4htm (Accessed on 26/06/2016)
UNITED NATIONS CHILDREN’S FUND (UNICEF) (2012) Child info: Monitoring the situation of
children and woman http://wwwchildinfoorg/malnutrition_statushtml (Accessed on
18/07/2016)
UNITED NATIONS CHILDREN’S FUND (UNICEF) (2016) Stunting reflects chronic undernutrition
during the most critical periods of growth and development in early life
http://unicefin/Whatwedo/10/stunting (Accessed on 15/06/2016)
UNITED NATIONS CHILDREN’S FUND (UNICEF), WORLD HEALTH ORGANISATION
(WHO), WORLD BANK GROUP 2017 Levels and trends in child malnutrition
http://datauniceforg/topic/nutrition/malnutrition/ (accessed on 23/07/2017)
WENHOLD F ANNANDALE J FABER M, and HART T (2012) Water use and nutrient content of
crop and animal food products for improved household food security: A scoping study: report to the
water research commission TT
537/12http://wwwwrcorgza/Knowledge%20Hub%20Documents/Research%Reports/TT%20537-
12pdf (accessed on 03/09/16)
WIKLUND P (2016) The role of physical activity and exercise in obesity and weight management: time
for critical appraisal Journal of Sport and Health Science 5, 151-154
WILDMAN RP, GU D, REYNOLDS K, DUAN X, WU X and HE J (2005) Are waist circumference
and body mass index independently associated with cardiovascular disease in Chinese adults? Am J Clin
Nutr 82, 1195-1202
WOOLARD I (2012) An overview of poverty and inequality in South Africa Working paper for DFID
(SA) 1-15
WORLD HEALTH ORGANISATION (WHO) (2008) Training course on child growth assessment
WHO, Geneva
WORLD HEALTH ORGANISATION (WHO) (2013) Malnutrition: Maternal, New Born, Child and
Adolescent Health
http://wwwwhoint/maternal_child_adolescent/topics/child/malnutrition/en/indexhtml (Accessed on
27/08/2015)
WORLD HEALTH ORGANISATION (WHO) (2014) Integrated management of childhood illness
(IMAM): distance learning course module 6; Malnutrition and anaemia
120
http://appswhoint/iris/bitstream/10665/104772/8/9789241506823_Module – 6_engpdf?ua=1
(Accessed on 15/08/2017)
WORLD HEALTH ORGANISATION (WHO) (2015) Micronutrients WHO: Geneva, Switzerland
WORLD HEALTH ORGANISATION (WHO) (2016) Poverty http://wwwwhoint/topics/poverty/en/
(Accessed on 30/06/2016)
WORLD HEALTH ORGANISATION (WHO) (2017) Global database on child growth and
malnutrition https://wwwint/nutgrowthdb/about/introduction/en/ (Accessed on 07/08/2017)
WORLD HEALTH ORGANISATION (WHO) (2018) Bio-fortification of staple crops
http://wwwwhoint/elena/titles/biofortification/en/ (accessed on 09/09/18)
ZHU S, HESHKA S, WANG Z, SHEN W, ALLISON DB, ROSS, R, and HEYMSFIELD, SB (2004)
Combination of BMI and waist circumference for identifying cardiovascular risk factors in whites Obes
Res 12 (4), 633-645
ZIRABA AK, FOTSO JC, and OCHAKO R (2009) Overweight and obesity in urban Africa: a problem
of the rich or poor? Biomed Cent Public Health 9 465-475
121
CHAPTER 5
WATER USE, NUTRIENT CONTENT AND NUTRITIONAL WATER PRODUCTIVITY OF SELECTED GRAIN LEGUMES
TP Chibarabada, AT Modi and T Mabhaudhi
5.1 Introduction
Two billion people suffer from micronutrient deficiency, with nearly one billion being calorie
deficient (IFPRI, 2016). There is a gap between food supply and nutritional requirements, which
has been attributed to lack of nutritional considerations in crop production (Schönfeldt, 2017).
There is a need for a paradigm shift in current food production to consider nutrition outcomes
(Mabhaudhi et al., 2016). Increasing food production and productivity should be tied to
increasing nutrient density. In this regard, agriculture could simultaneously address the
challenge of increasing food production and improving nutrition under limited resource
availability. However, there are often challenges to linking disciplines as there are often no
appropriate metrics for evaluating such linkages. In the case of quantifying the water-food-
nutrition nexus, nutritional water productivity (NWP) (Renault and Wallender, 2000) has been
proposed as a useful metric.
Nutritional water productivity is a measure of yield and nutrition outcome per unit of water
consumed and would be applicable for sustainable food production given the limited water
resources and modified diets [Renault and Wallender, 2000; Stockholm International Water
Institute (SIWI) and International Water Management Institute (IWMI), 2004]. To date,
increasing food production under water scarcity has been evaluated using different metrics such
as ‘water use efficiency’ and ‘water productivity’ (Stanhill, 1986; Steduto, 1996; Molden et al.,
2003; Molden et al., 2010; Descheemaeker et al., 2013). On the other hand, nutritionists have
quantified nutritional content of different foodstuffs and suggested diets for improving
nutritional status of people. These efforts have been parallel and needed to be merged to address
the challenge of producing more nutritious food under water scarcity. Nutritional water
productivity would be a useful metric in the semi- and arid tropics, where water scarcity and
food and nutrition insecurity are prevalent (Mabhaudhi et al., 2016).
The high prevalence of food and nutrition insecurity has been attributed to the dominance
of starch in diets leading to poor dietary diversity. Diets lack protein, micronutrients and
minerals (Baker et al., 1996; Bourne et al., 2002; Diskin, 2004; Abrahams et al., 2011). This
leads to various forms of malnutrition, including but not limited to, stunting, wasting and

122
underweight in children under five, anaemia in women of the reproductive age, obesity and
type 2 diabetes (IFPRI, 2016). Dietary diversity has been recommended to alleviate
malnutrition. Dietary diversity is defined as the number of different foods or food groups
consumed over a given reference period (Ruel, 2003). Increasing the variety of foods across
and within food groups ensures adequate intake of essential nutrients to promote good health.
Legumes are being promoted in the semi- and arid tropics, as part of dietary diversity efforts.
They are rich in proteins and some micronutrients (Duranti and Guis, 1997; Iqbal et al., 2006;
Seena et al., 2006), hence have the potential to alleviate malnutrition. Crop diversification
through inclusion of indigenous grain legumes in food and nutrition agendas has been proposed
by several authors (Chivenge et al., 2015; Foyer et al., 2016; Mabhaudhi et al., 2016;
Chibarabada et al., 2017). A study on nutrient content and NWP of indigenous and exotic
vegetables observed that crops differed in their nutrient content and NWP (Nyathi et al., 2016).
For some micronutrients, indigenous vegetables were more nutrient dense compared to the
reference exotic vegetable swiss chard (Beta vulgaris).
In the semi- and arid tropics, water is one of the main limiting factors in agriculture. Yield
of grain legumes has been observed to decrease with decreasing water availability (Pandey et
al., 2004; Daryanto et al., 2015; Farooq et al., 2017). Grain legumes have also been associated
with yield instability across environments. There is not much information on how water
availability and different environments affect nutritional content of grain legumes. Moreso,
there is need to link yield, water use and nutritional content of grain legumes to establish the
best yielding crops that use less water and are nutritionally dense. This should include
indigenous grain legumes as they form part of crop diversification efforts. This information will
be useful for promotion of grain legumes across different environments. It is hypothesised that
nutrient content and NWP of crops will vary with varying water availability and across
environments. The aim of the study was therefore to determine NWP of selected alternative
indigenous grain legumes [bambara groundnut (Vigna subterranea) and cowpea (Vigna
unguiculata)] and conventional grain legumes [groundnut (Arachis hypogaea) and dry bean
(Phaseolus vulgaris)], in response to production environment. The specific objectives were to
determine nutrient content and NWP of selected African indigenous (bambara groundnut and
cowpea) and major grain legumes (groundnut and dry bean) in response to (i) water regimes
and (ii) environments.
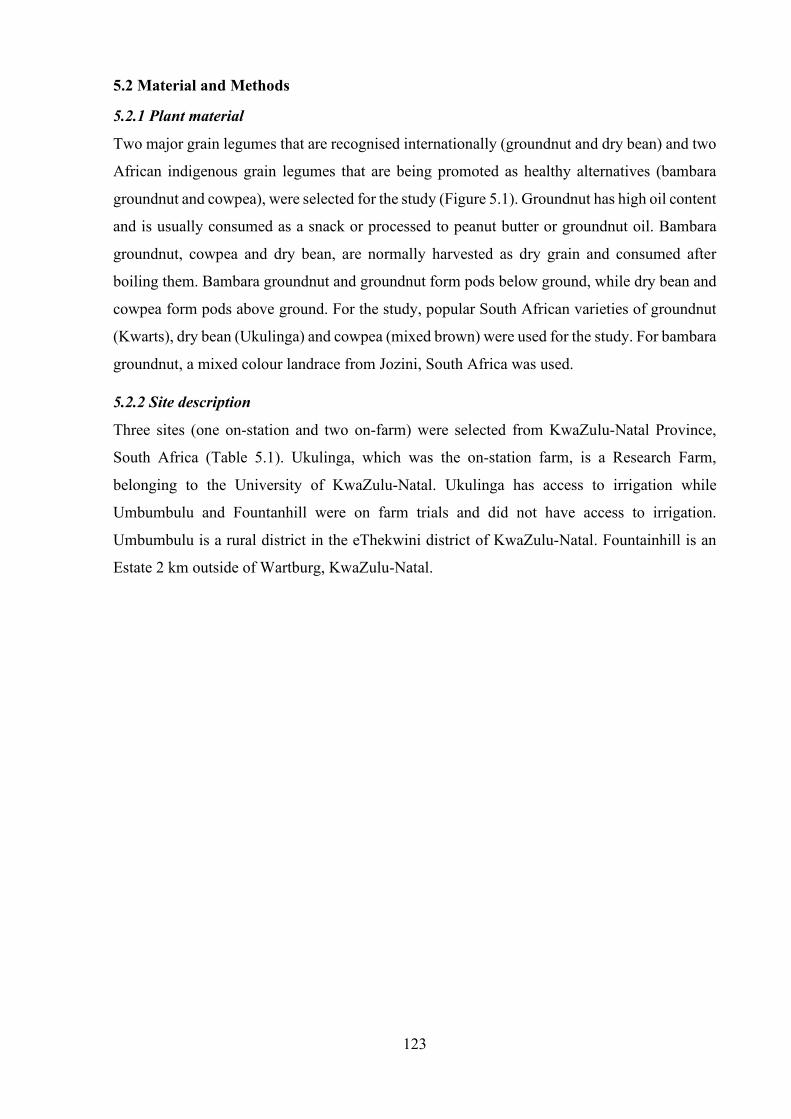
123
5.2 Material and Methods
5.2.1 Plant material
Two major grain legumes that are recognised internationally (groundnut and dry bean) and two
African indigenous grain legumes that are being promoted as healthy alternatives (bambara
groundnut and cowpea), were selected for the study (Figure 5.1). Groundnut has high oil content
and is usually consumed as a snack or processed to peanut butter or groundnut oil. Bambara
groundnut, cowpea and dry bean, are normally harvested as dry grain and consumed after
boiling them. Bambara groundnut and groundnut form pods below ground, while dry bean and
cowpea form pods above ground. For the study, popular South African varieties of groundnut
(Kwarts), dry bean (Ukulinga) and cowpea (mixed brown) were used for the study. For bambara
groundnut, a mixed colour landrace from Jozini, South Africa was used.
5.2.2 Site description
Three sites (one on-station and two on-farm) were selected from KwaZulu-Natal Province,
South Africa (Table 5.1). Ukulinga, which was the on-station farm, is a Research Farm,
belonging to the University of KwaZulu-Natal. Ukulinga has access to irrigation while
Umbumbulu and Fountanhill were on farm trials and did not have access to irrigation.
Umbumbulu is a rural district in the eThekwini district of KwaZulu-Natal. Fountainhill is an
Estate 2 km outside of Wartburg, KwaZulu-Natal.
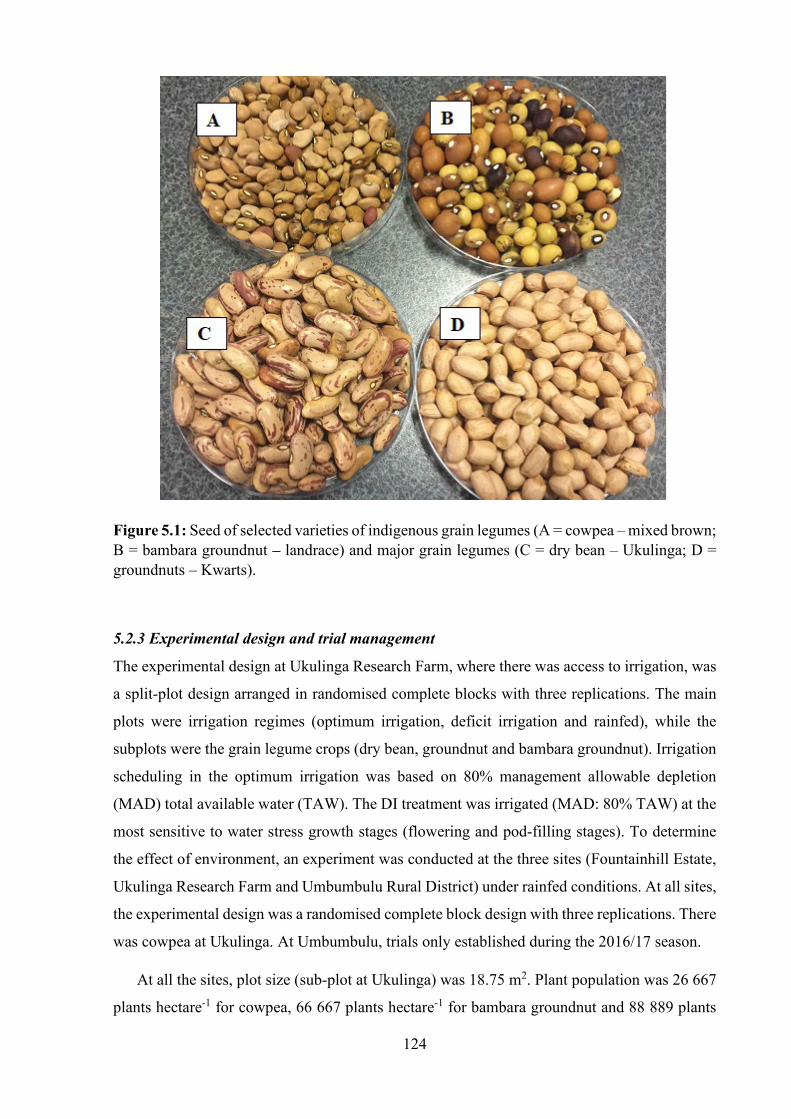
124
Figure 5.1: Seed of selected varieties of indigenous grain legumes (A = cowpea – mixed brown; B = bambara groundnut – landrace) and major grain legumes (C = dry bean – Ukulinga; D = groundnuts – Kwarts).
5.2.3 Experimental design and trial management
The experimental design at Ukulinga Research Farm, where there was access to irrigation, was
a split-plot design arranged in randomised complete blocks with three replications. The main
plots were irrigation regimes (optimum irrigation, deficit irrigation and rainfed), while the
subplots were the grain legume crops (dry bean, groundnut and bambara groundnut). Irrigation
scheduling in the optimum irrigation was based on 80% management allowable depletion
(MAD) total available water (TAW). The DI treatment was irrigated (MAD: 80% TAW) at the
most sensitive to water stress growth stages (flowering and pod-filling stages). To determine
the effect of environment, an experiment was conducted at the three sites (Fountainhill Estate,
Ukulinga Research Farm and Umbumbulu Rural District) under rainfed conditions. At all sites,
the experimental design was a randomised complete block design with three replications. There
was cowpea at Ukulinga. At Umbumbulu, trials only established during the 2016/17 season.
At all the sites, plot size (sub-plot at Ukulinga) was 18.75 m2. Plant population was 26 667
plants hectare-1 for cowpea, 66 667 plants hectare-1 for bambara groundnut and 88 889 plants
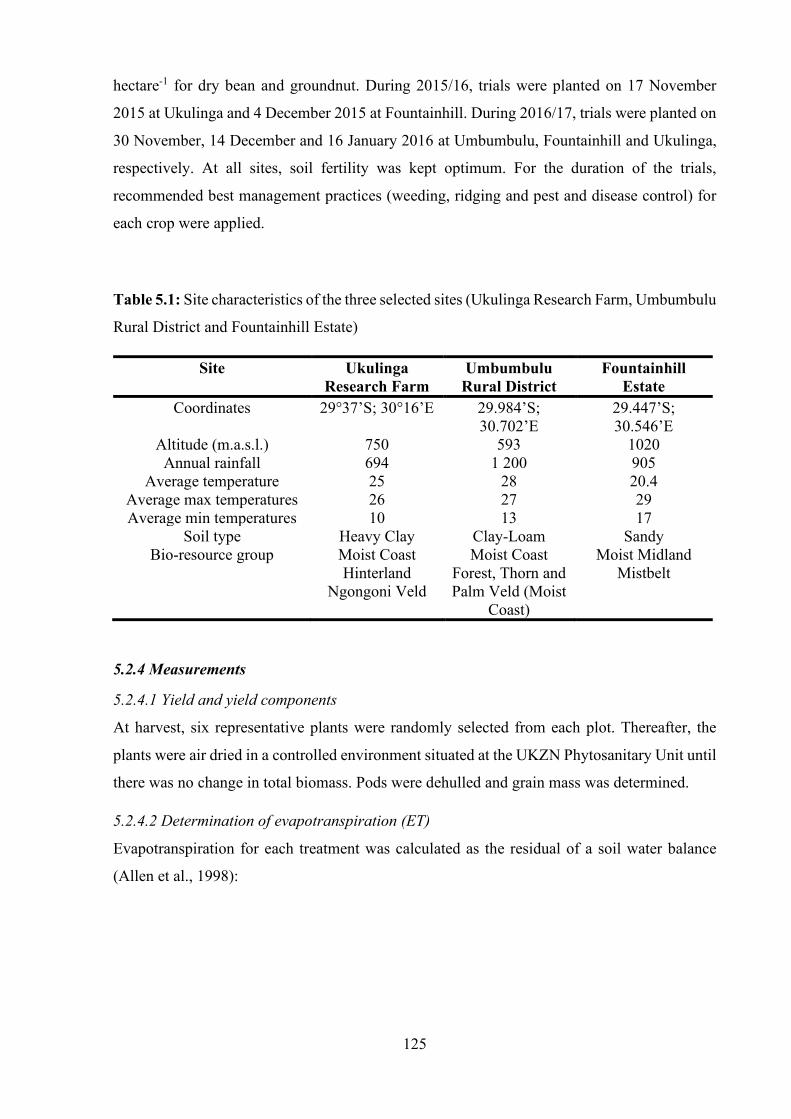
125
hectare-1 for dry bean and groundnut. During 2015/16, trials were planted on 17 November
2015 at Ukulinga and 4 December 2015 at Fountainhill. During 2016/17, trials were planted on
30 November, 14 December and 16 January 2016 at Umbumbulu, Fountainhill and Ukulinga,
respectively. At all sites, soil fertility was kept optimum. For the duration of the trials,
recommended best management practices (weeding, ridging and pest and disease control) for
each crop were applied.
Table 5.1: Site characteristics of the three selected sites (Ukulinga Research Farm, Umbumbulu
Rural District and Fountainhill Estate)
Site Ukulinga Research Farm
Umbumbulu Rural District
Fountainhill Estate
Coordinates 29°37’S; 30°16’E 29.984’S; 30.702’E
29.447’S; 30.546’E
Altitude (m.a.s.l.) 750 593 1020 Annual rainfall 694 1 200 905
Average temperature 25 28 20.4 Average max temperatures 26 27 29 Average min temperatures 10 13 17
Soil type Heavy Clay Clay-Loam Sandy Bio-resource group Moist Coast
Hinterland Ngongoni Veld
Moist Coast Forest, Thorn and Palm Veld (Moist
Coast)
Moist Midland Mistbelt
5.2.4 Measurements
5.2.4.1 Yield and yield components
At harvest, six representative plants were randomly selected from each plot. Thereafter, the
plants were air dried in a controlled environment situated at the UKZN Phytosanitary Unit until
there was no change in total biomass. Pods were dehulled and grain mass was determined.
5.2.4.2 Determination of evapotranspiration (ET)
Evapotranspiration for each treatment was calculated as the residual of a soil water balance
(Allen et al., 1998):
126
𝐸𝐸𝐸𝐸 = 𝑁𝑁 + 𝐼𝐼 − 𝐷𝐷 − 𝑅𝑅 − ∆𝑆𝑆𝑁𝑁𝐶𝐶 Equation 5.1
where: ET = evapotranspiration (mm),
P = precipitation (mm),
I = irrigation (mm),
D = drainage (mm),
R = runoff (mm), and
ΔSWC = changes in soil water content (mm).
Daily rainfall (mm) was obtained from weather stations within a 10 km radius from the sites.
At Fountainhill and Umbumbulu, daily rainfall data was obtained from the South African Sugar
Association (SASA) weather web portal (http://portal.sasa.org.za/weatherweb). At Ukulinga,
daily rainfall data was obtained from an automatic weather station (AWS), which is part of the
Agricultural Research Council-Institute for Soil, Climate and Water (ARC-ISCW) network of
automatic weather stations. Changes in soil water content (SWC) were measured using a PR2/6
profile probe connected to an HH2 handheld moisture meter (Delta-T, UK). The sensors of the
PR2/6 profile probe were positioned to measure volumetric water content at six depths (0.10,
0.20, 0.30, 0.40, 0.60 and 1.00 m along the probe). The effective depth at Ukulinga was 0.40
m, hence the sensors positioned at 0.60 and 1.00 m were considered during analyses.
Drainage was considered as negligible. At Ukulinga there was an impeding layer at 0.4 m,
which restricted downward movement of water beyond the root zone. At Fountainhill and
Umbumbulu, drainage was considered negligible based on Dancette and Hall (1979), where in
semi- and arid environments drainage is negligible if the profile is not periodically saturated to
drain excess water. Runoff (R) was not quantified during the trials. However, to account for its
effect, the United States Department of Agriculture – Soil Conservation Service (USDA-SCS)
procedure (USDA-SCS, 1967) was used to estimate the monthly effective rainfall that is stored
in the root zone after subtracting the amount of rainfall lost to runoff. The soil water balance
was therefore simplified to;
𝑁𝑁𝑊𝑊 = 𝐸𝐸𝑅𝑅 + 𝐼𝐼 − ∆𝑆𝑆𝑁𝑁𝐶𝐶 Equation 5.2
where: WU = water use = evapotranspiration (mm),
ER = effective rainfall (mm),
I = irrigation (mm), and
ΔSWC = changes in soil water content (mm).
127
Values of ETa in mm (depth) were then converted to m3 (volume) using the formula;
𝑉𝑉𝐼𝐼𝑅𝑅𝑅𝑅𝑉𝑉𝐷𝐷 (𝑉𝑉3) = 𝐴𝐴𝐼𝐼𝐷𝐷𝐼𝐼 (𝑉𝑉2) × 𝐷𝐷𝐷𝐷𝐷𝐷𝐼𝐼ℎ (𝑉𝑉) Equation 5.3
5.2.4.3 Determination of nutritional content (NC)
To preserve nutrients and avoid further metabolic reactions, grain was freeze dried using a
model RV3 vacuum freeze drier (Edwards, United States of America) after yield determination.
Thereafter, samples were ground using a coffee grinder (Mellerware, South Africa) and sent to
the KZN Department of Agriculture and Rural Development Plant Nutrition Lab. The nutrients
analysed per dry matter basis included macro-nutrients (energy, fat and protein) and micro-
nutrients [calcium (Ca), zinc (Zn), iron (Fe)].
Determination of macro nutrients (energy, fat and protein) followed the Association of
Official Analytical Chemists (AOAC) standard procedures for nutrient analysis (AOAC, 1980).
Dry matter was determined by drying samples in a fanned oven a 100°C for 24 hours. Nitrogen
(N) was determined by the micro-Kjeldahl method. Thereafter, crude protein was calculated as;
𝑁𝑁 × 6.25 Equation 5.4
Crude fat was determined according to the soxhlett procedure. Ash was determined by igniting
fibre samples in a furnace at 550°C overnight. The carbohydrate content was then determined
as the difference between 100% and addition of the percentages of moisture, fat, crude protein,
and crude fibre. Gross energy of the diets was measured with a bomb calorimeter (Lab-X,
Kolkata, India).
The mineral composition (Ca, Zn, Fe) were determined using the dry ashing (DA) technique
(AOAC, 1980). An aliquot of 25 ml was placed in crucibles. Thereafter, samples were placed
in an oven set at 50°C to heat overnight. Following this, crucibles with residues obtained after
vaporisation of water and most organic compounds were introduced in a high temperature
muffle furnace and ashed at 450°C for 24 hours. Thereafter, samples were cooled and residues
treated with nitric acid while on a warm hot plate. Samples were then transferred back to the
muffle furnace for 24 hours. White ashes obtained were dissolved in a beaker with 20ml 5%
(v/v) nitric acid. The solution was then transferred to a 25 ml volumetric flask by rinsing with
5% v/v nitric acid. The solution was then used to determine Ca, Zn, Fe using an atomic
absorption spectrophotometer (AAS) (Analytikjena AG, Germany).
128
2.2.4.4 Determination of nutritional water productivity (NWP)
Nutritional water productivity was calculated based on the formula by Renault and Wallender
(2000) where;
𝑁𝑁𝑁𝑁𝑁𝑁 = � 𝑌𝑌𝑎𝑎𝐸𝐸𝐸𝐸𝑎𝑎� × 𝑁𝑁𝑁𝑁 Equation 5.5
where: NWP is the nutritional water productivity (nutrition m-3 of water evapotranspired), Ya
is the actual harvested grain yield (kg·ha-1), ETa is the actual evapotranspiration (m3·ha-1), and
NC is the nutritional content per kg of product (nutrition unit·kg-1).
5.2.5 Data analysis
Data from Ukulinga (the irrigation treatments) and from the three sites (rainfed trials) were
analysed separately. For both data sets, data of the two seasons (2015/16 and 2016/17) were
subjected to Bartlett’s test for homogeneity of variance in GenStat® 18th Edition (VSN
International, UK). Results of both data sets showed evidence of non-homogeneity between the
two seasons hence a separate analysis of the seasons was conducted. The data sets (the irrigation
treatments) and (the three sites) were subjected to analysis of variances (ANOVA) using
GenStat® version 18 (VSN International, UK). Least significance difference (LSD) was used
to separate means at the 5% level of significance.
5.3 Results
5.3.1 Rainfall
Total rainfall at Ukulinga and Fountainhill during 2015/16 was 445 and 583 mm, respectively.
During 2016/17, total rainfall observed at Ukulinga, Fountainhill and Umbumbulu was 235,
395 and 595 mm, respectively. At Ukulinga during 2015/16, ≈ 25% of the total rainfall (120
mm) was received in two rainfall events [68 and 120 days after planting (DAP)] (Figure 5.2).
During 2015/16, daily rainfall at Fountainhill did not exceed 45 mm and it was observed that ≈
20% of the total rainfall was received during the first 14 days while ≈ 25% was received
between 95 and 106 DAP. At Ukulinga, during 2016/17, rainfall did not exceed 30 mm for all
the rain days. In addition to being low (235 mm), rainfall was also sparsely distributed (Figure
5.2). At Umbumbulu, where the highest rainfall was observed during 2016/17 (595 mm), it was
observed that 120 mm of this rainfall was received in two days (72 and 97 DAP). .
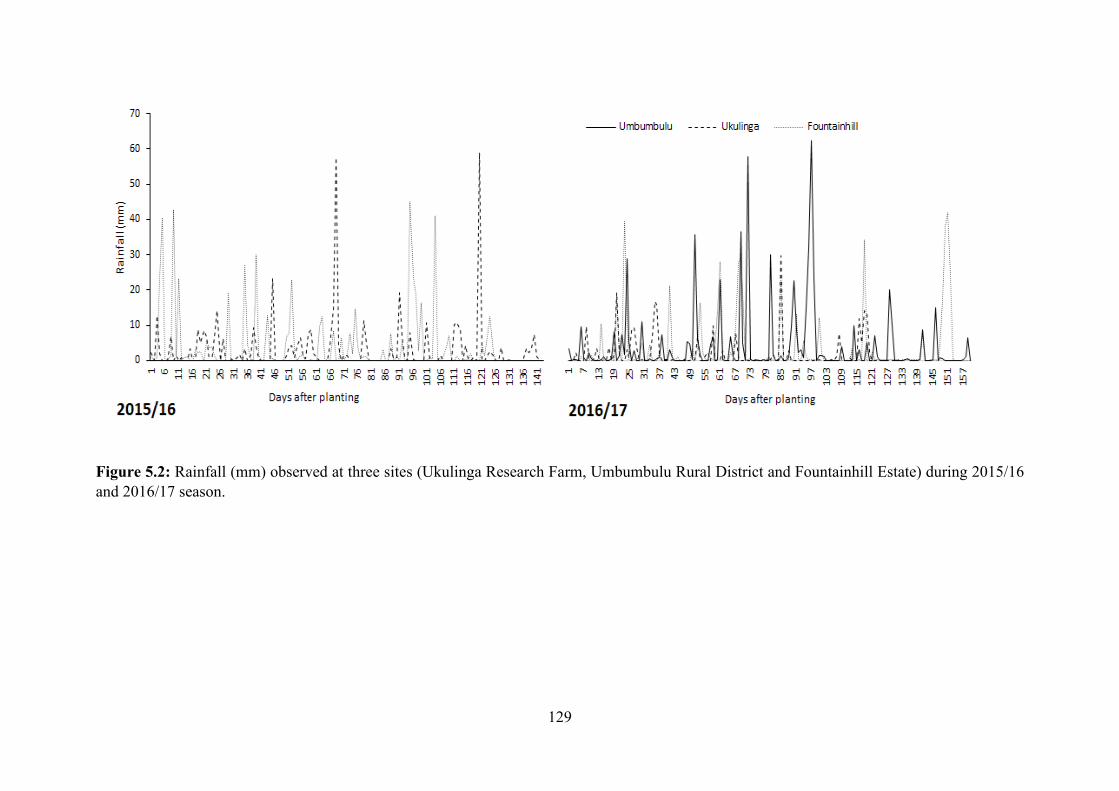
129
Figure 5.2: Rainfall (mm) observed at three sites (Ukulinga Research Farm, Umbumbulu Rural District and Fountainhill Estate) during 2015/16 and 2016/17 season.
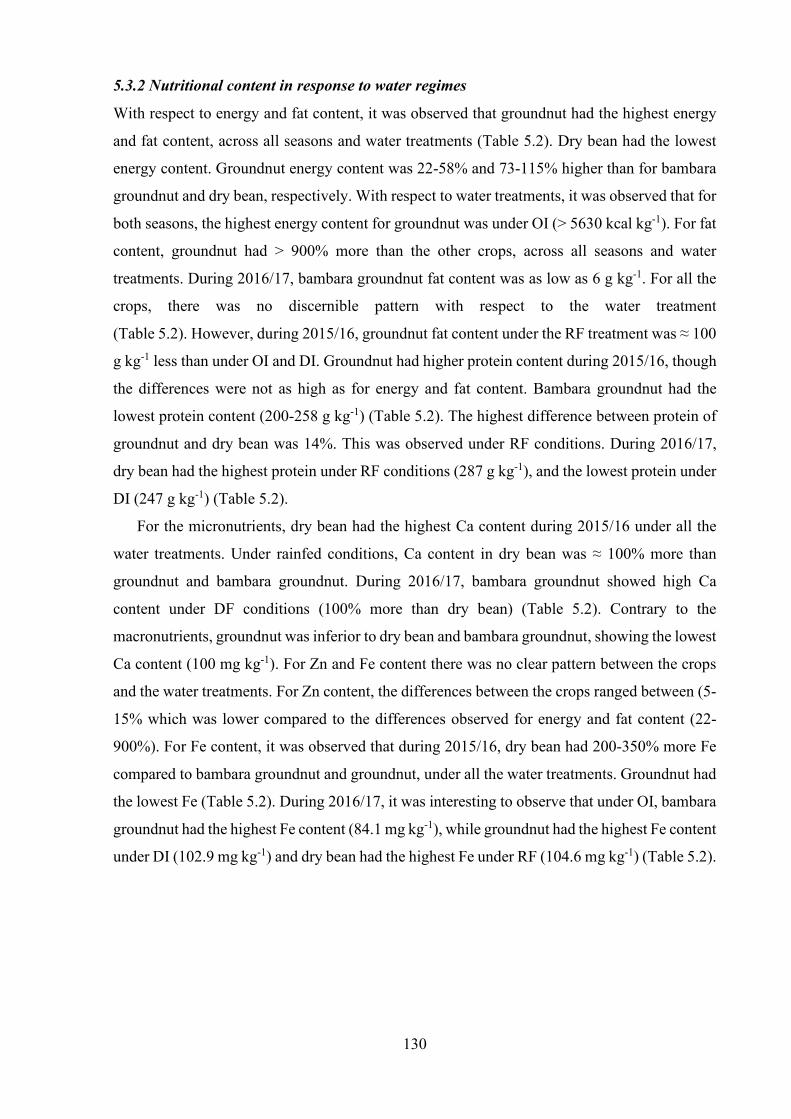
130
5.3.2 Nutritional content in response to water regimes
With respect to energy and fat content, it was observed that groundnut had the highest energy
and fat content, across all seasons and water treatments (Table 5.2). Dry bean had the lowest
energy content. Groundnut energy content was 22-58% and 73-115% higher than for bambara
groundnut and dry bean, respectively. With respect to water treatments, it was observed that for
both seasons, the highest energy content for groundnut was under OI (> 5630 kcal kg-1). For fat
content, groundnut had > 900% more than the other crops, across all seasons and water
treatments. During 2016/17, bambara groundnut fat content was as low as 6 g kg-1. For all the
crops, there was no discernible pattern with respect to the water treatment
(Table 5.2). However, during 2015/16, groundnut fat content under the RF treatment was ≈ 100
g kg-1 less than under OI and DI. Groundnut had higher protein content during 2015/16, though
the differences were not as high as for energy and fat content. Bambara groundnut had the
lowest protein content (200-258 g kg-1) (Table 5.2). The highest difference between protein of
groundnut and dry bean was 14%. This was observed under RF conditions. During 2016/17,
dry bean had the highest protein under RF conditions (287 g kg-1), and the lowest protein under
DI (247 g kg-1) (Table 5.2).
For the micronutrients, dry bean had the highest Ca content during 2015/16 under all the
water treatments. Under rainfed conditions, Ca content in dry bean was ≈ 100% more than
groundnut and bambara groundnut. During 2016/17, bambara groundnut showed high Ca
content under DF conditions (100% more than dry bean) (Table 5.2). Contrary to the
macronutrients, groundnut was inferior to dry bean and bambara groundnut, showing the lowest
Ca content (100 mg kg-1). For Zn and Fe content there was no clear pattern between the crops
and the water treatments. For Zn content, the differences between the crops ranged between (5-
15% which was lower compared to the differences observed for energy and fat content (22-
900%). For Fe content, it was observed that during 2015/16, dry bean had 200-350% more Fe
compared to bambara groundnut and groundnut, under all the water treatments. Groundnut had
the lowest Fe (Table 5.2). During 2016/17, it was interesting to observe that under OI, bambara
groundnut had the highest Fe content (84.1 mg kg-1), while groundnut had the highest Fe content
under DI (102.9 mg kg-1) and dry bean had the highest Fe under RF (104.6 mg kg-1) (Table 5.2).
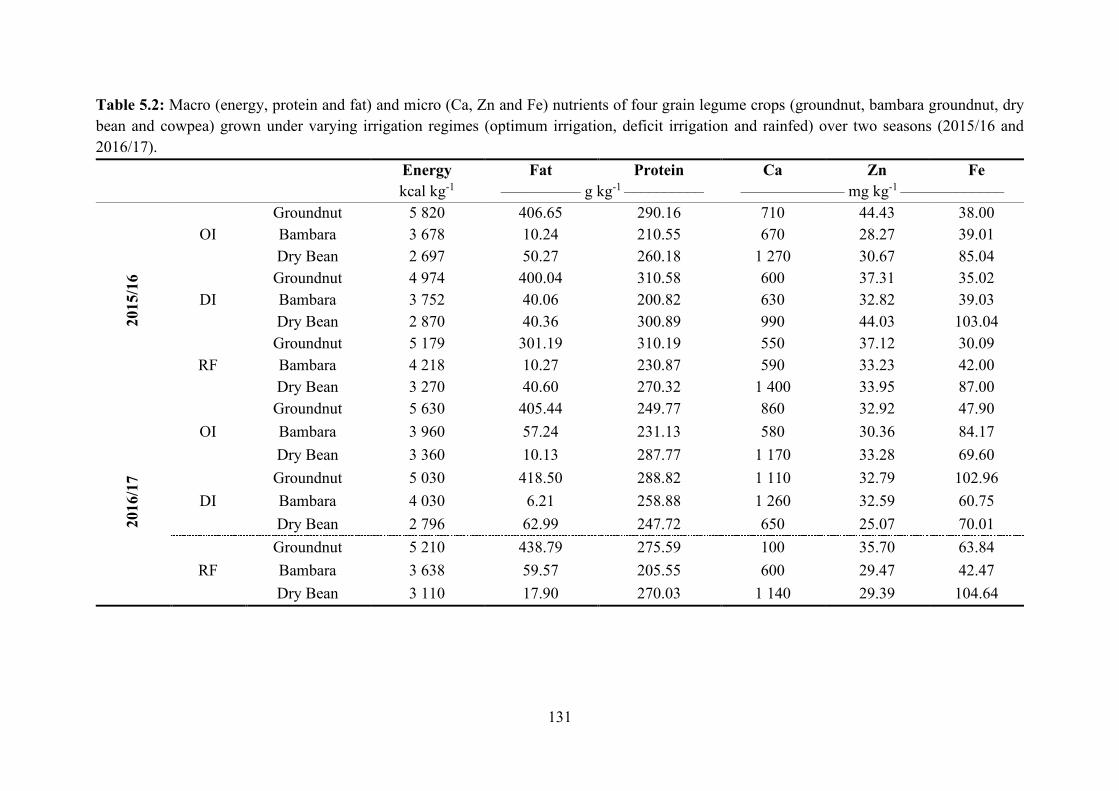
131
Table 5.2: Macro (energy, protein and fat) and micro (Ca, Zn and Fe) nutrients of four grain legume crops (groundnut, bambara groundnut, dry bean and cowpea) grown under varying irrigation regimes (optimum irrigation, deficit irrigation and rainfed) over two seasons (2015/16 and 2016/17).
Energy Fat Protein Ca Zn Fe kcal kg-1 –––––––––– g kg-1 –––––––––– ––––––––––––– mg kg-1 –––––––––––––
2015
/16
OI Groundnut 5 820 406.65 290.16 710 44.43 38.00 Bambara 3 678 10.24 210.55 670 28.27 39.01 Dry Bean 2 697 50.27 260.18 1 270 30.67 85.04
DI Groundnut 4 974 400.04 310.58 600 37.31 35.02 Bambara 3 752 40.06 200.82 630 32.82 39.03 Dry Bean 2 870 40.36 300.89 990 44.03 103.04
RF Groundnut 5 179 301.19 310.19 550 37.12 30.09 Bambara 4 218 10.27 230.87 590 33.23 42.00 Dry Bean 3 270 40.60 270.32 1 400 33.95 87.00
2016
/17
OI Groundnut 5 630 405.44 249.77 860 32.92 47.90 Bambara 3 960 57.24 231.13 580 30.36 84.17 Dry Bean 3 360 10.13 287.77 1 170 33.28 69.60
DI Groundnut 5 030 418.50 288.82 1 110 32.79 102.96 Bambara 4 030 6.21 258.88 1 260 32.59 60.75 Dry Bean 2 796 62.99 247.72 650 25.07 70.01
RF Groundnut 5 210 438.79 275.59 100 35.70 63.84 Bambara 3 638 59.57 205.55 600 29.47 42.47 Dry Bean 3 110 17.90 270.03 1 140 29.39 104.64
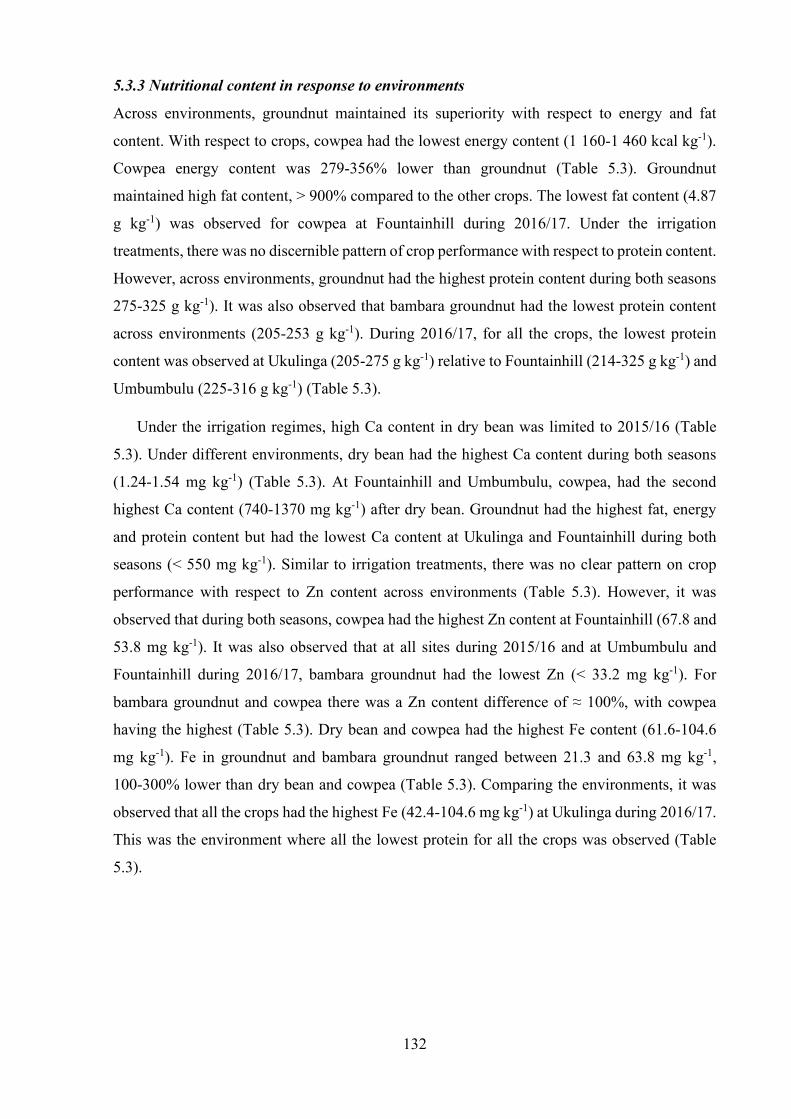
132
5.3.3 Nutritional content in response to environments
Across environments, groundnut maintained its superiority with respect to energy and fat
content. With respect to crops, cowpea had the lowest energy content (1 160-1 460 kcal kg-1).
Cowpea energy content was 279-356% lower than groundnut (Table 5.3). Groundnut
maintained high fat content, > 900% compared to the other crops. The lowest fat content (4.87
g kg-1) was observed for cowpea at Fountainhill during 2016/17. Under the irrigation
treatments, there was no discernible pattern of crop performance with respect to protein content.
However, across environments, groundnut had the highest protein content during both seasons
275-325 g kg-1). It was also observed that bambara groundnut had the lowest protein content
across environments (205-253 g kg-1). During 2016/17, for all the crops, the lowest protein
content was observed at Ukulinga (205-275 g kg-1) relative to Fountainhill (214-325 g kg-1) and
Umbumbulu (225-316 g kg-1) (Table 5.3).
Under the irrigation regimes, high Ca content in dry bean was limited to 2015/16 (Table
5.3). Under different environments, dry bean had the highest Ca content during both seasons
(1.24-1.54 mg kg-1) (Table 5.3). At Fountainhill and Umbumbulu, cowpea, had the second
highest Ca content (740-1370 mg kg-1) after dry bean. Groundnut had the highest fat, energy
and protein content but had the lowest Ca content at Ukulinga and Fountainhill during both
seasons (< 550 mg kg-1). Similar to irrigation treatments, there was no clear pattern on crop
performance with respect to Zn content across environments (Table 5.3). However, it was
observed that during both seasons, cowpea had the highest Zn content at Fountainhill (67.8 and
53.8 mg kg-1). It was also observed that at all sites during 2015/16 and at Umbumbulu and
Fountainhill during 2016/17, bambara groundnut had the lowest Zn (< 33.2 mg kg-1). For
bambara groundnut and cowpea there was a Zn content difference of ≈ 100%, with cowpea
having the highest (Table 5.3). Dry bean and cowpea had the highest Fe content (61.6-104.6
mg kg-1). Fe in groundnut and bambara groundnut ranged between 21.3 and 63.8 mg kg-1,
100-300% lower than dry bean and cowpea (Table 5.3). Comparing the environments, it was
observed that all the crops had the highest Fe (42.4-104.6 mg kg-1) at Ukulinga during 2016/17.
This was the environment where all the lowest protein for all the crops was observed (Table
5.3).
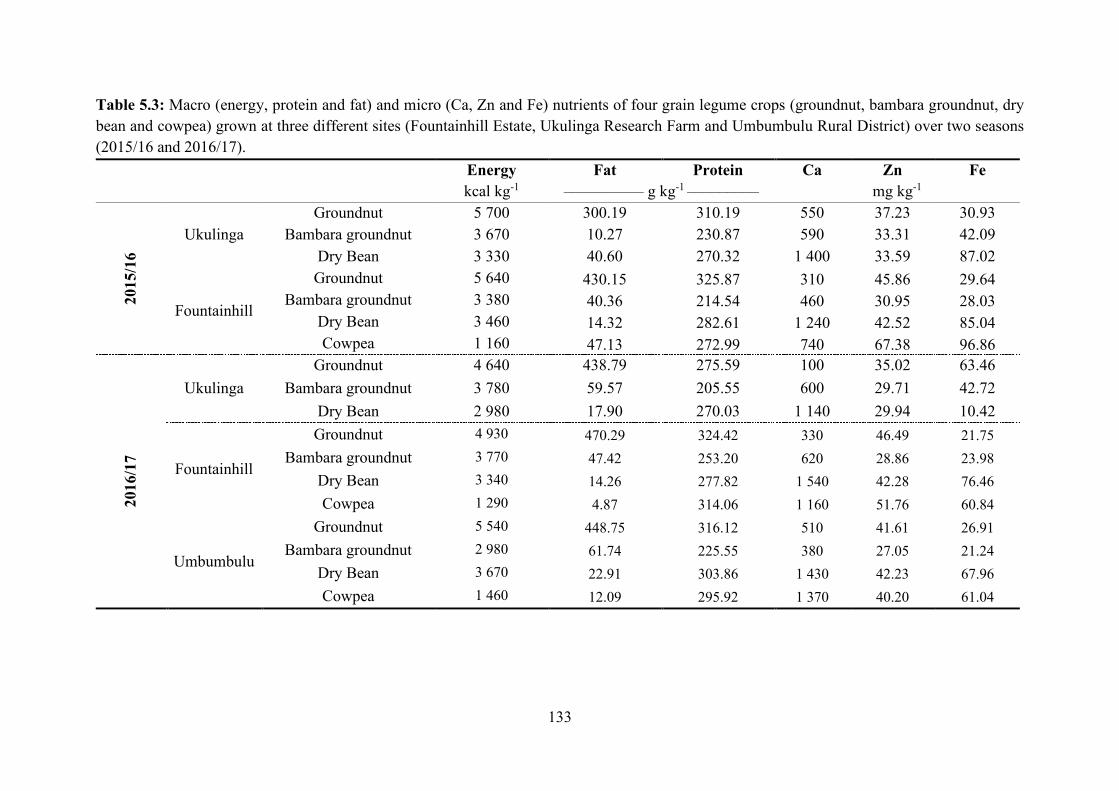
133
Table 5.3: Macro (energy, protein and fat) and micro (Ca, Zn and Fe) nutrients of four grain legume crops (groundnut, bambara groundnut, dry bean and cowpea) grown at three different sites (Fountainhill Estate, Ukulinga Research Farm and Umbumbulu Rural District) over two seasons (2015/16 and 2016/17).
Energy Fat Protein Ca Zn Fe kcal kg-1 –––––––––– g kg-1 ––––––––– mg kg-1
2015
/16
Ukulinga Groundnut 5 700 300.19 310.19 550 37.23 30.93
Bambara groundnut 3 670 10.27 230.87 590 33.31 42.09 Dry Bean 3 330 40.60 270.32 1 400 33.59 87.02
Fountainhill
Groundnut 5 640 430.15 325.87 310 45.86 29.64 Bambara groundnut 3 380 40.36 214.54 460 30.95 28.03
Dry Bean 3 460 14.32 282.61 1 240 42.52 85.04 Cowpea 1 160 47.13 272.99 740 67.38 96.86
2016
/17
Ukulinga Groundnut 4 640 438.79 275.59 100 35.02 63.46
Bambara groundnut 3 780 59.57 205.55 600 29.71 42.72 Dry Bean 2 980 17.90 270.03 1 140 29.94 10.42
Fountainhill
Groundnut 4 930 470.29 324.42 330 46.49 21.75 Bambara groundnut 3 770 47.42 253.20 620 28.86 23.98
Dry Bean 3 340 14.26 277.82 1 540 42.28 76.46 Cowpea 1 290 4.87 314.06 1 160 51.76 60.84
Umbumbulu
Groundnut 5 540 448.75 316.12 510 41.61 26.91 Bambara groundnut 2 980 61.74 225.55 380 27.05 21.24
Dry Bean 3 670 22.91 303.86 1 430 42.23 67.96 Cowpea 1 460 12.09 295.92 1 370 40.20 61.04

134
5.3.4 Nutritional water productivity in response to water regimes
During 2015/16, results of yield and NWP for all the nutrients (energy, protein, fat, Ca, Zn and
Fe) showed significant differences (P < 0.05) among the crops. Water treatments were not
significantly different (P > 0.05) (Table 5.4). The interaction between water treatments and
crops was significantly different (P < 0.05) for grain yield, NWPfat and NWPprotein. Under OI,
the highest yield was observed for dry bean (2 260 kg ha-1). Dry bean also had the lowest ETa
(2 680 m-3) translating to high productivity (Table 5.4). This resulted in the highest NWPprotein
(220 g m-3), despite the crop not having the highest protein content under OI. The high Ca (1
270 mg kg-1) and Fe content (85 mg kg-1) observed for dry bean under OI translated to high
NWPCa (1 060 mg m-3) and NWPFe (71.9 mg m-3). Groundnut had high energy and fat content
resulting in the highest NWPenergy (3 568 kcal m-3) and NWPfat (249 g m-3). For bambara
groundnut, low NWP for all the nutrients was as a result of combined effect of low yield, high
ETa and low nutritional content (Table 5.4).
In addition to the high energy, fat and protein content observed for groundnut under DI, it
also had the highest yield (200% more than the other crops) (Table 5.5). This resulted in higher
NWPenergy, fat and protein (4 956 kcal m-3, 406 g m-3, 314 g m-3) under DI. It was interesting to
observe that despite groundnut having the lowest Ca and Fe, it had the second highest NWPCa
and Fe, (590 and 35.1 mg m-3, respectively) because of the high grain yield (2 900 kg ha-1) (Table
2.5). For bambara groundnut, results were consistent to the OI treatment – it had the lowest
NWP for all the nutrients. Dry bean had the highest NWPCa and Fe (> 300% more than groundnut
and bambara groundnut) (Table 5.4).
During 2016/17, results of grain yield and NWP were similar to 2015/16 – significantly
different among crops (P < 0.05) and not significantly different among irrigation treatments (P
> 0.05) (Table 5.5). The interaction between crops and water regime was only significant for
NWPfat, Ca and Fe. During 2016/17, dry bean had the highest grain yield (1 081-1 296 kg ha-1) and
lowest ETa (1 430-1 950 m-3) across all water treatments. As a result, the highest NWPenergy,
protein, Ca, Zn and Fe was highest for dry bean across water treatments. Although groundnut had 800%
more fat under DI, dry bean had a higher NWPfat (42 g m-3) due to the high grain yield and low
ETa. During 2015/16, groundnut performed better than bambara groundnut. In 2016/17 due to
low grain yield for bambara groundnut and groundnut, the crops had similar NWPenergy, protein,
Ca, Zn and Fe despite groundnut having higher nutrient content than bambara groundnut (Table 5.2
and 5.5).

135
Table 5.4: Yield, ETa and NWP (energy, protein, fat, Ca, Zn, and Fe), of three legume crops (dry bean, groundnut and bambara groundnut) grown under three water treatments (OI, DI and RF) during the 2015/16 season.
Water
treatments Crop species Grain yield ETa NWPenergy NWPfat NWPprotein NWPCa NWPZn NWPFe
kg ha-1 m-3 kcal m-3 –––––– g m-3 –––––– ––––––––– mg m-3 ––––––––––
OI
Dry bean 2 260a 2 680 2 270b 44.00c 220.30b 1 060a 25.80 71.90a
Groundnut 1 950ab 3 160 3 568b 249.20b 178.80c 440b 27.20 23.30b
Bambara groundnut 1 480b 3 170 1 718c 5.80c 100.70d 310c 13.20 18.30b
Mean 1 800 3 020 2 518 99.80 166.60 600 22.10 37.80
DI
Dry bean 1 400b 2 390 1 795c 27.30 193.30b 620b 27.50 64.70a
Groundnut 2 900a 2 920 4 956a 406.00a 314.70a 590b 37.20 35.10b
Bambara groundnut 1 410b 2 630 2 011c 21.80c 111.60d 340c 17.60 21.10b
Mean 1 930 2 650 2 921 151.70 206.50 520 27.40 40.30
RF
Dry bean 1 960a 2 380 2 565b 38.00c 225.40b 1 150a 28.00 71.80a
Groundnut 2 770a 2 830 5 074a 308.20b 305.60a 450b 36.40 30.30b
Bambara groundnut 1 090b 2 770 1 439c 5.00c 94.40d 230c 13.10 16.70b
Mean 1 940 2 660 3 026 117.10 208.50 640 13.02 39.60
Significance
(P=0.05)
Crops < 0.001 < 0.001 < 0.001 < 0.001 < 0.001 < 0.001 < 0.001
Water regime *ns *ns *ns *ns *ns *ns *ns
Crops*Water regime 0.031 *ns 0.028 0.040 *ns *ns *ns
LSD (P=0.05) 1 069 1455 78.00 32.20 410 26.63
*ns: Not significant at P = 0.05.
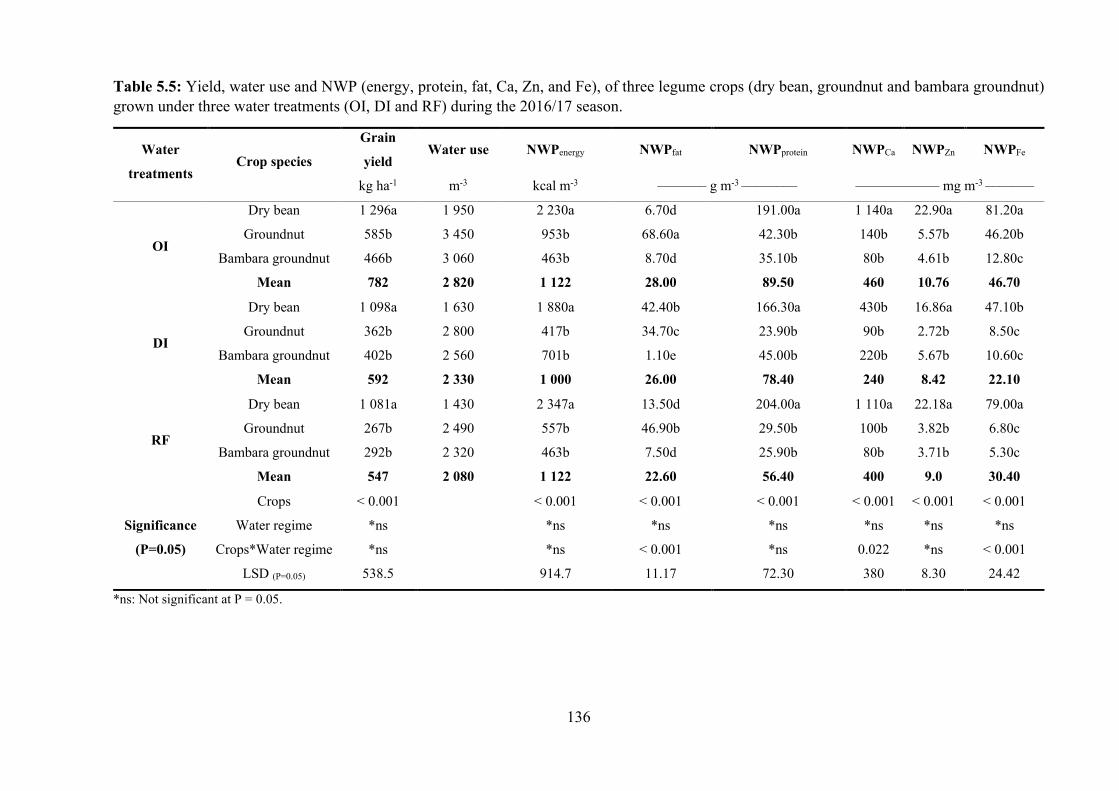
136
Table 5.5: Yield, water use and NWP (energy, protein, fat, Ca, Zn, and Fe), of three legume crops (dry bean, groundnut and bambara groundnut) grown under three water treatments (OI, DI and RF) during the 2016/17 season.
Water
treatments Crop species
Grain
yield Water use NWPenergy NWPfat NWPprotein NWPCa NWPZn NWPFe
kg ha-1 m-3 kcal m-3 ––––––– g m-3 –––––––– –––––––––––– mg m-3 –––––––
OI
Dry bean 1 296a 1 950 2 230a 6.70d 191.00a 1 140a 22.90a 81.20a
Groundnut 585b 3 450 953b 68.60a 42.30b 140b 5.57b 46.20b
Bambara groundnut 466b 3 060 463b 8.70d 35.10b 80b 4.61b 12.80c
Mean 782 2 820 1 122 28.00 89.50 460 10.76 46.70
DI
Dry bean 1 098a 1 630 1 880a 42.40b 166.30a 430b 16.86a 47.10b
Groundnut 362b 2 800 417b 34.70c 23.90b 90b 2.72b 8.50c
Bambara groundnut 402b 2 560 701b 1.10e 45.00b 220b 5.67b 10.60c
Mean 592 2 330 1 000 26.00 78.40 240 8.42 22.10
RF
Dry bean 1 081a 1 430 2 347a 13.50d 204.00a 1 110a 22.18a 79.00a
Groundnut 267b 2 490 557b 46.90b 29.50b 100b 3.82b 6.80c
Bambara groundnut 292b 2 320 463b 7.50d 25.90b 80b 3.71b 5.30c
Mean 547 2 080 1 122 22.60 56.40 400 9.0 30.40
Significance
(P=0.05)
Crops < 0.001 < 0.001 < 0.001 < 0.001 < 0.001 < 0.001 < 0.001
Water regime *ns *ns *ns *ns *ns *ns *ns
Crops*Water regime *ns *ns < 0.001 *ns 0.022 *ns < 0.001
LSD (P=0.05) 538.5 914.7 11.17 72.30 380 8.30 24.42
*ns: Not significant at P = 0.05.
137
5.3.5 Nutritional water productivity in response to environments
During 2015/16, sites were not significantly different for grain yield (P > 0.05) while NWP for
all the nutrients (energy, protein, fat, Ca, Zn and Fe) was significantly different (P < 0.05).
Grain yield and NWP for all the nutrients (energy, protein, fat, Ca, Zn and Fe) were significantly
different (P < 0.05) among the crops (Table 5.6). The interaction between crop and site was
significant (P < 0.05) for grain yield and NWP for all the nutrients (energy, protein, fat, Ca, Zn
and Fe). At Fountainhill, despite bambara groundnut having the highest yield (1 978 kg ha-1),
it did not have the highest NWP for all the nutrients because of high ETa (4 370 m3) and low
nutritional content (Table 5.3 and 6). Groundnut had the highest macro nutrient content (Table
2.3) which was translated to the highest NWPenergy, fat and protein (2 575 kcal m-3, 197 g m-3, 148 g
m-3, respectively). Cowpea had the lowest NWPenergy (450 kcal m-3), consistent to the low
energy content (1 160 kcal kg-1) and grain yield (1 214 kg ha-1) observed. Dry bean had the
highest NWPFe and Ca (> 39.7 mg m-3 and > 570 mg m-3). Despite low grain yield of cowpea, it
had the highest NWPZn (26.3 mg m-3) due to the high Zn content (67.8 mg kg-1). Comparing the
two sites, it was observed that Ukulinga yielded better (1 950 kg ha-1) and had lower ETa (2 660
m3) than Fountainhill (1 560 kg ha-1 and 3 547 m3, respectively). This led to 60-110% higher
NWP for all the nutrients (energy, protein, fat, Ca, Zn and Fe) at Ukulinga compared to
Fountainhill.
During 2016/17, results of crops were significantly different (P < 0.05) for NWPenergy, fat, Ca,
Zn and Fe. For sites, NWPenergy, protein, Ca, Zn and Fe were significantly different (P < 0.05). The
interaction between crop and site was significantly different (P < 0.05) for NWPenergy, fat, protein
and Zn (Table 5.7). During 2015/16, it was observed that Ukulinga was better performing than
Fountainhill. In 2016/17, Fountainhill was the best performing site. At Fountainhill, grain yield,
NWPenergy, fat, protein, Ca and Zn was ≈ 100% more than at Umbumbulu and Ukulinga. Groundnut had
the highest NWPfat, protein and energy at Fountainhill and Umbumbulu (Table 5.7). At Ukulinga, dry
bean grain yield was high, and ETa was low, contributing to the highest NWPenergy and protein (2
347 kcal m-3 and 204 g m-3, respectively). Similar to results of 2015/16, dry bean had the highest
NWPFe at Ukulinga and Fountainhill (79 and 46.6 mg m-3), however due to the low grain yield
at Umbumbulu (282 kg ha-1), the crop did not have the highest NWPFe (9.1 mg m-3). Consistent
to results of 2015/16, cowpea had the lowest NWPenergy (< 478 kcal m-3) compared to the other
crops, due to the low energy content (< 1 460 kcal kg-1).

138
Table 5.6: Yield, ETa and NWP (energy, protein, fat, Ca, Zn, and Fe), of four legume crops (dry bean, cowpea, groundnut and bambara groundnut) grown at two sites (Fountainhill Estate and Ukulinga Research Farm) during 2015/16 season.
Water
treatments Crop species
Grain
yield ETa NWPenergy NWPfat NWPprotein NWPCa NWPZn NWPFe
kg ha-1 m-3 kcal m-3 –––––– g m-3 –––––– ––––––––– mg m-3 ––––––––––
Fountainhill
Dry bean 1 456ab 3 130 1 604b 6.64c 131c 570b 19.87b 39.73b
Groundnut 1 594ab 3 490 2 575b 197.05b 148.8c 140c 21.00b 13.36c
Bambara groundnut 1 978a 4 370 1 529c 18.26c 97.1c 200c 13.89c 12.90c
Cowpea 1 214b 3 200 450d 18.28c 105.8c 280c 26.30b 37.33b
Mean 1 560.5 3 547 1 695 66.03 122.8 290 19.4 24.19
Ukulinga
Dry bean 1 960a 2 380 2 565b 38.00c 225.40b 1 150a 28.00a 71.80a
Groundnut 2 770a 2 830 5 074a 308.20a 305.60a 450b 36.40a 30.30b
Bambara groundnut 1 090b 2 770 1 439c 5.00c 94.40c 230c 13.10c 16.70c
Mean 1 940 2 660 3 026 117.10 208.50 640 13.02 39.60
Significance
(P=0.05)
Crops 0.032 < 0.001 < 0.001 < 0.001 < 0.001 0.001 < 0.001
Site *ns < 0.001 0.003 < 0.001 < 0.001 0.007 < 0.001
Crops*Site 0.003 0.001 0.002 0.007 0.002 0.046 0.015
LSD (P=0.05) 745.9 987.3 44.38 63.27 180 8.76 12.48
*ns: Not significant at P = 0.05.
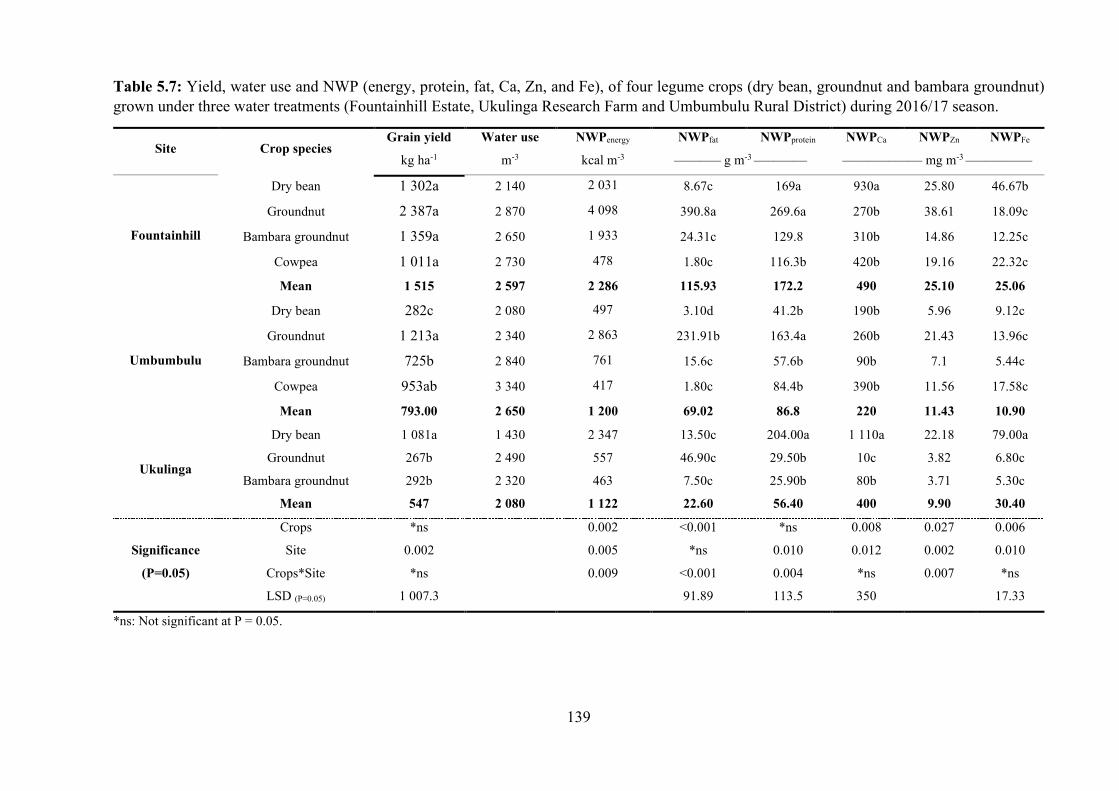
139
Table 5.7: Yield, water use and NWP (energy, protein, fat, Ca, Zn, and Fe), of four legume crops (dry bean, groundnut and bambara groundnut) grown under three water treatments (Fountainhill Estate, Ukulinga Research Farm and Umbumbulu Rural District) during 2016/17 season.
Site Crop species Grain yield Water use NWPenergy NWPfat NWPprotein NWPCa NWPZn NWPFe
kg ha-1 m-3 kcal m-3 ––––––– g m-3 –––––––– –––––––––––– mg m-3 ––––––––––
Fountainhill
Dry bean 1 302a 2 140 2 031 8.67c 169a 930a 25.80 46.67b
Groundnut 2 387a 2 870 4 098 390.8a 269.6a 270b 38.61 18.09c
Bambara groundnut 1 359a 2 650 1 933 24.31c 129.8 310b 14.86 12.25c
Cowpea 1 011a 2 730 478 1.80c 116.3b 420b 19.16 22.32c
Mean 1 515 2 597 2 286 115.93 172.2 490 25.10 25.06
Umbumbulu
Dry bean 282c 2 080 497 3.10d 41.2b 190b 5.96 9.12c
Groundnut 1 213a 2 340 2 863 231.91b 163.4a 260b 21.43 13.96c
Bambara groundnut 725b 2 840 761 15.6c 57.6b 90b 7.1 5.44c
Cowpea 953ab 3 340 417 1.80c 84.4b 390b 11.56 17.58c
Mean 793.00 2 650 1 200 69.02 86.8 220 11.43 10.90
Ukulinga
Dry bean 1 081a 1 430 2 347 13.50c 204.00a 1 110a 22.18 79.00a
Groundnut 267b 2 490 557 46.90c 29.50b 10c 3.82 6.80c
Bambara groundnut 292b 2 320 463 7.50c 25.90b 80b 3.71 5.30c
Mean 547 2 080 1 122 22.60 56.40 400 9.90 30.40
Significance
(P=0.05)
Crops *ns 0.002 <0.001 *ns 0.008 0.027 0.006
Site 0.002 0.005 *ns 0.010 0.012 0.002 0.010
Crops*Site *ns 0.009 <0.001 0.004 *ns 0.007 *ns
LSD (P=0.05) 1 007.3 91.89 113.5 350 17.33
*ns: Not significant at P = 0.05.
140
5.4 Discussion
The objectives of the study were to determine nutrient content and NWP of selected indigenous
and major grain legumes in response to water regimes and production environments. Crops
differed in their nutritional content. Groundnut had higher fat content relative to the other crops;
a 100 g serving of groundnut can supply the Recommended Dietary Allowance (RDA) for fat
(40-78 g). A gram of fat contains ≈ 37.6 kJ of energy, hence fat-rich foods are good sources of
energy. This explains the high energy content observed for groundnut. High fat content of
groundnut has been explored through processing into peanut butter and extraction of oil for
household use. This makes groundnut a multi-purpose grain legume, and partly explains the
reason why groundnut is an important and major grain legume. However, over consumption of
groundnut has risk associated with excess fat consumption, which is one of the major causes of
obesity (Ros, 2010; UNDP, 2012). In semi- and arid regions, 30% of the population is
overweight and obese (IFPRI, 2016), hence the promotion of groundnut needs to be
accompanied with proper consumption recommendations. This also supports the need to
diversify grain legumes to avoid over reliance on major legumes such as soybean and groundnut
that have high fat content.
For all the grain legumes, protein content was between 205 and 325 g kg-1, implying that a
100 g portion of legume supplies 40-60% of protein RDA (50 g). This confirms arguments by
Foyer et al. (2016) and Chibarabada et al. (2017), that legumes can be promoted as alternatives
to meat, to avoid protein energy malnutrition. Legumes have also been associated with
containing appreciable amounts of micronutrients (Seena and Sridhar, 2005; Boschi and
Arnoldi, 2011; Akinyele and Shokunbi, 2015). In the semi- and arid regions, Fe, Ca and Zn are
among the problematic micronutrients as their deficiency has devastating consequences such
as anaemia in women of reproductive age and birth defects in children (UNDP, 2012). For Fe,
Ca, Zn, the RDA for an adult is 18 mg, 1 000 mg and 11 mg, respectively (National Research
Council, 1989). Fruits and vegetables are the major sources of micronutrients, but they are not
always available due to price and seasonality. Dry bean and cowpea have the potential to supply
40 to 60% of the RDA for Fe and Zn. In the case of Zn, this study showed that cowpea and dry
bean contained ≈ 500% more Zn than leafy vegetables, which have been observed to contain
2.9 to 15.1 mg kg-1 (Nyathi et al., 2016). While vegetables such as spider flower contain more
Fe than grain legumes (200 mg kg-1), Fe content of grain legumes is comparable to those
observed for vegetables such as swiss chard and cabbage (38.80-98.40 mg kg-1) (Nyathi et al.,
2016). These nutritional values show that legumes’ micronutrient value is comparable to that
of leafy vegetables and support the role of legumes in increasing dietary diversity, as they can

141
complement cereals and vegetables in diets to meet the required nutrients for a healthy life
(Chibarabada et al., 2017).
Among the grain legumes under study, bambara groundnut had the lowest macro- and
micronutrient content. Nutrient content of bambara groundnut observed in this study were in
the same range of those observed in other studies (Brough and Azam-Ali, 1992; Amarteifio et
al., 2006; Kudre and Benjakul, 2013). Amarteifio et al. (2006) assessed micronutrient content
of various landraces of bambara groundnut from Botswana, Namibia and Swaziland. They
observed large variability within landraces and interestingly landraces from Swaziland had
higher micronutrient content than landraces from Namibia and Botswana. This demonstrates
that some bambara groundnut landraces are more nutrient dense than others. This non-
uniformity in nutrient content within bambara groundnut landraces may hamper its promotion
in the semi- and arid tropics. This calls for breeding efforts to select for nutrient dense landraces
that can be used in breeding for high and uniform nutrient content.
Nutrient content of crops differed across water treatments and environments. When rainfall
was low (Ukulinga during 2016/17), protein content for all the crops was also low. The low
protein content under water limited conditions is attributed to low nitrogen (N) uptake by the
plant. Nitrogen is correlated to protein content because it is important for synthesis of amino
acids, which are building blocks of protein. Under water limited conditions, the activity of the
enzyme that converts nitrogen to a form that is readily available to plants (nitrate reductase) is
reduced (Da Silva et al., 2011). This ultimately reduced N availability to the plant (Da Silva et
al., 2011), and consequently protein synthesis was reduced. Moreso, under water limited
conditions, chlorophyll in plants is downregulated (Sanchez et al., 1983; Zhang et al., 2011).
Nitrogen (N) is also a structural element of chlorophyll, hence down regulation of chlorophyll
reduces N in the plant (Ercoli et al., 1993; Bojovic and Marcovic, 2009). This will have negative
consequences on protein synthesis. This implies that water stress does not only affect yield, but
can also affect protein content of crops. Fe content was higher at Ukulinga compared to the
other sites. Fe is not readily mobile to different plant organs and its delivery to seeds depends
on a continuous Fe transport system (Briat, 2005; Da Silva et al., 2011). The moisture of soil
affects Fe availability. Wet soils have greater Fe availability for plants due to higher Fe2+/Fe3+
ratio (Briat, 2005; 2009; Da Silva et al., 2011). Ukulinga was characterised by shallow soil
profile and clay soil, hence good water holding capacity. This could have enhanced Fe mobility
from roots to seeds. Inherent environmental conditions influenced grain nutrient content but
there is still a dearth of information on how inherent environmental conditions and plant nutrient
availability affects grain nutrient content in different crops.
142
Nutritional water productivity varied significantly among the crops. With respect to fat and
energy productivity, groundnut was the most productive producing up to 400 and 5000 kcal
m-3, respectively. This was because of high fat and energy content. Values of energy water
productivity of groundnut were similar to those estimated by Renault and Wallender (2000) and
Annandale et al. (2012) for cereals. For NWP Fe, Zn and Ca, dry bean was the most productive
followed by cowpea. For groundnut, despite the high grain yield, NWP Fe, Zn and Ca was low due
to poor nutrient content. This highlights the need for crop diversification to maximise nutritional
productivity as crops showed different qualities. Fe, Zn and Ca contents of dry bean and cowpea
observed in this study were comparable to those observed for leafy vegetables. However,
NWPFe, Zn and Ca observed for leafy vegetables by Nyathi et al. (2016) were higher (≈ 200%) than
those observed by this study for grain legumes. This could be because leafy vegetables
relatively used less water (1 210-3 260 m-3) and had higher yield (600-9 500 kg ha-1) than the
grain legumes under study. For maximum benefit of Fe, Zn and Ca under water limited
conditions, vegetables would be the recommended option as they are more productive. This
highlights the importance of merging aspects of water use, yield and nutritional content for
effective recommendations on tackling food and nutritional security.
The major legumes (groundnut and dry bean), had the highest protein water productivity,
relative to the indigenous grain legumes. In the case of groundnut, it was mostly as a result of
high protein content and high yield observed for the crop. For dry bean, high protein water
productivity was contributed but with low water use and high protein content. For the
indigenous grain legumes (cowpea and bambara groundnut), protein water productivity was
low due to low protein content, high water use and low grain yield for bambara groundnut and
low yield for cowpea. If indigenous grain legumes are to be promoted for crop diversification,
there is need for yield and nutritional content improvements, to improve protein water
productivity. When comparing protein water productivity values of grain legumes (100-300 g
m-3) to that estimated for meat products (12-60 g m-3) (Annandale et al., 2012), it is interesting
to note that despite meat being the highest protein source, legumes are more productive. This
is because water consumption in legume production is less than water consumption for
production of meat. This further supports the promotion of legumes as protein alternatives in
water scarce areas as they relatively use less water compared to production of meat.
Environments had a significant effect on NWP. This was mostly as a result of yield
instability across environments. Fluctuations in NWP followed fluctuations in grain yield. Low
grain yield caused low NWP. There has been emphasis on improving yield stability in the
context of food security. This study highlights that yield stability also affects NWP. Improving
yield stability not only ensures continuous availability of grain but also ensures continuous
143
nutritional gain. Water regimes did not have a significant effect on NW, while grain yield was
also not significantly affected by water regimes. This implies that there is scope to tackle the
challenge of food and nutritional security in the semi- and arid tropics under rainfed conditions.
5.5 Conclusions
Groundnut had higher fat and energy content relative to the other crops. Dry bean and cowpea
had the highest micronutrient and have the potential to supply 40 to 60% of the RDA for Fe and
Zn. The protein content of the grain legumes has potential to supply 40-60% of the RDA for
protein. This supports the role of legumes in increasing dietary diversity as they can
complement cereals and vegetables in diets to meet the required nutrients for a healthy life.
Bambara groundnut had the lowest macro- and micronutrient content. This calls for breeding
efforts to breed for nutrient density in bambara groundnut. Protein content reduced when
rainfall was low. Fe content was higher under clay soil. The major legumes (groundnut and dry
bean), had the highest protein water productivity, relative to the indigenous grain legumes. For
NWP Fe, Zn and Ca, dry bean and cowpea were more productive. Environments had a significant
effect on NWP, due to yield instability across environments. Yield stability of grain legumes is
key for tackling food and nutritional insecurity. Water regimes did not have a significant effect
on NWP, implying that there is scope to tackle the challenge of food and nutritional security in
the semi- and arid tropics under rainfed conditions. Future research is needed on understanding
the effect of agronomic practices and inherent environmental conditions on nutrient content and
NWP of crops.
References
ABRAHAMS Z, MCHIZA Z, and STEYN NP (2011) Diet and mortality rates in Sub-Saharan Africa:
stages in the nutrition transition. BMC Public Health 11 801.
AKINYELE IO and SHOKUNBI OS (2015) Concentrations of Mn, Fe, Cu, Zn, Cr, Cd, Pb, Ni in
selected Nigerian tubers, legumes and cereals and estimates of the adult daily intakes. Food Chem 173
702-708.
ALLEN RG, PEREIRA LS, RAES D, and SMITH M (1998) Crop evapotranspiration – Guidelines for
computing crop water requirements. FAO Irrigation and drainage paper 56.
AMARTEIFIO JO, TIBE O, and NJOGU RM (2006) The mineral composition of bambara groundnut
(Vigna subterranea (L) Verdc) grown in Southern Africa. Afri J Biotechnol 5.
ANNANDALE J, STEYN M, and NYATHI M (2012) Water use and nutritional water productivity of
selected food products, in Wenhold F, Annandale J, Faber M, Hart T, (Eds), Water Use and Nutrient
144
Content of Crop and Animal Food Products for Improved Household Food Security: A Scoping Study.
Water Research Commission, South Africa, pp. 123-157. ISBN 978-1-4312-0332-1.
AOAC (1980) Official Methods of Analysis. Howitz (ed), pp 734-740.
BAKER J, MARTIN L, and PIWOZ E (1996) The time to act Women’s nutrition and its consequences
for child survival and reproductive health in Africa.
BOJOVIĆ B and MARKOVIĆ A (2009) Correlation between nitrogen and chlorophyll content in wheat
(Triticum aestivum L.). Kragujev J Sci 31 69-74.
BOSCHIN G and ARNOLDI A (2011) Legumes are valuable sources of tocopherols. Food Chem 127
1199-1203.
BOURNE LT, LAMBERT EV, and STEYN K (2002) Where does the black population of South Africa
stand on the nutrition transition? Public Health Nutr 5 157-162.
BRIAT JF (2005) Iron from soil to plant products. Bull Acad Natl Med 189 1609-1619.
Brough SH and Azam‐Ali SN (1992) The effect of soil moisture on the proximate composition of
Bambara groundnut (Vigna subterranea (L) Verdc). J. Sci Food Agric 60 197-203.
CHIBARABADA T, MODI A, and MABHAUDHI T (2017) Expounding the Value of Grain Legumes
in the Semi- and Arid Tropics. Sustain 9 60. doi:10.3390/su9010060.
CHIVENGE P, MABHAUDHI T, MODI AT, and MAFONGOYA P (2015) The potential role of
neglected and underutilised crop species as future crops under water scarce conditions in Sub-Saharan
Africa. Int J Environ Res Public Health 12 5685-5711.
DA SILVA EC, NOGUEIRA R, DA SILVA MA, and DE ALBUQUERQUE MB (2011) Drought stress
and plant nutrition. Plant Stress 5 32-41.
DANCETTE C and HALL AE (1979) Agroclimatology applied to water management in the Sudanian
and Sahelian zones of Africa, in: Agriculture in Semi-Arid Environments. Springer, pp. 98-118.
DARYANTO S, WANG L, and JACINTHE PA (2015) Global synthesis of drought effects on food
legume production. PLoS One 10 0127401.
DESCHEEMAEKER K, BUNTING SW, BINDRABAN P, MUTHURI C, MOLDEN D, BEVERIDGE
M, VAN BRAKEL M, HERRERO M, CLEMENT F, and BOELEE E (2013) 8 Increasing Water
Productivity in Agriculture. Manag Water Agroecosystems Food Secur 10 104.
DISKIN P (1994) Understanding linkages among food availability, access, consumption, and nutrition
in Africa: Empirical findings and issues from the literature. Department of Agricultural Economics,
Michigan State University.

145
DURANTI M and GIUS C (1997) Legume seeds: protein content and nutritional value. F. Crop. Res.
53 31-45.
ERCOLI L, MARIOTTI M, MASONI A, and MASSANTINI F (1993) Relationship between nitrogen
and chlorophyll content and spectral properties in maize leaves. Eur. J. Agron. 2 113-117.
FAROOQ M, GOGOI N, BARTHAKUR S, BAROOWA B, BHARADWAJ N, ALGHAMDI SS, and
SIDDIQUE KHM (2017) Drought stress in grain legumes during reproduction and grain filling. J.
Agron. Crop Sci. 203 81-102.
FOYER CH, LAM HM, NGUYEN HT, SIDDIQUE KHM, VARSHNEY RK, COLMER TD,
COWLING W, BRAMLEY H, MORI TA, and HODGSON JM (2016) Neglecting legumes has
compromised human health and sustainable food production. Nat. Plants 2 16112.
INTERNATIONAL FOOD POLICY RESEARCH INSTITUTE (2016) Global Nutrition Report 2016:
From Promise to Impact: Ending Malnutrition by 2030. Washington, DC.
IQBAL A, KHALIL IA, ATEEQ N and KHAN MS (2006) Nutritional quality of important food
legumes. Food Chem. 97 331-335.
KUDRE TG and BENJAKUL S (2013) Combining effect of microbial transglutaminase and bambara
groundnut protein isolate on gel properties of surimi from sardine (Sardinella albella). Food Biophys. 8
240-249.
MABHAUDHI T, CHIBARABADA T, and MODI A (2016) Water-Food-Nutrition-Health Nexus:
Linking Water to Improving Food, Nutrition and Health in Sub-Saharan Africa. Int. J. Environ. Res.
Public Health 13 107.
MK NYATHI, JG ANNANDALE, YG BELETSE, DJ BEUKES, CP DU PLOOY, B PRETORIUS,
and GE VAN HALSEMA (2016) Nutritional Water Productivity of Traditional Vegetable Crops. WRC
Report No. 2171/1/16. Water Research Commission, South Africa.
MOLDEN D, MURRAY-RUST H, SAKTHIVADIVEL R, and MAKIN I (2003) A water-productivity
framework for understanding and action. Water Product. Agric. Limits Oppor. Improv.
MOLDEN D, OWEIS T, STEDUTO P, BINDRABAN P, HANJRA MA, and KIJNE J (2010)
Improving agricultural water productivity: between optimism and caution. Agric. Water Manag. 97 528-
535.
NATIONAL RESEARCH COUNCIL, UNITED STATES (1989) Recommended dietary allowances.
National Academies Press. Washington, D.C.
PANDEY RK, HERRERA WAT and PENDLETON JW (1984) Drought response of grain legumes
under irrigation gradient: I. Yield and yield components. Agron J 76 549-553.

146
RENAULT D and WALLENDER WW (2000) Nutritional water productivity and diets. Agric water
Manag 45 275-296.
ROS E (2010) Health benefits of nut consumption. Nutrients 2 652-682.
RUEL MT (2003) Operationalizing dietary diversity: a review of measurement issues and research
priorities. J Nutr 133 3911-3926S.
SANCHEZ RA, HALL AJ, TRAPANI NDE and HUNAU RC (1983) Effects of water stress on the
chlorophyll content, nitrogen level and photosynthesis of leaves of two maize genotypes. Photosynth
Res 4 35-47.
SCHÖNFELDT HC; HALL N and PRETORIUS B (2017) Nutrition-Sensitive Agricultural
Development for Food Security in Africa: A Case Study of South Africa. In International Development.
InTech, 2017.
SEENA S and SRIDHAR KR (2005) Physicochemical, functional and cooking properties of under
explored legumes, Canavalia of the southwest coast of India. Food Res Int 38 803-814.
SEENA S, SRIDHAR KR, ARUN AB, YOUNG CC (2006) Effect of roasting and pressure-cooking on
nutritional and protein quality of seeds of mangrove legume Canavalia cathartica from southwest coast
of India. J Food Compos Anal 19 284-293. doi:10.1016/j.jfca.2005.05.004.
SIWI-IWMI (2004) Water – More Nutrition per drop. Stockholm International Water Institute.
Stockholm.
STANHILL G (1986) Water use efficiency. Adv Agron 39 53-85.
STEDUTO P (1996) Water use efficiency, in: Sustainability of Irrigated Agriculture. Springer, pp. 193-
209.
UNDP (2012) The Nutrition Challenge in Sub-Saharan Africa. WP 2012-012. Rome, Italy.
USDA-SCS (1967) Irrigation water requirements, Technical Release 21.
ZHANG YJ, XIE ZK, WANG YJ, SU PX, AN LP and GAO H (2011) Effect of water stress on leaf
photosynthesis, chlorophyll content, and growth of oriental lily. Russ J plant Physiol 58 844-850.
147
CHAPTER 6
CALIBRATION AND TESTING OF AQUACROP FOR GROUNDNUT AND DRY BEAN
TP Chibarabada, AT Modi and T Mabhaudhi
6.1 Introduction
An increase in production of grain legumes is expected in semi- and arid regions following the
promotion of sustainable intensification and alleviation of food and nutrition security.
Currently, grain legumes have shown suitability to these environments, but they have also
shown instability across environments and seasons. In these regions water remains one of the
limiting factors to agriculture. There are gaps on how grain legumes adapt to different
environments and to varying water availability. For successful promotion of legumes in semi-
and arid regions there is need for information on their adaptability to these regions. This requires
investments in time and resources on research, which are often limiting. Crop growth models
have been developed partly to answer research questions, thus, limiting time and resources
spent on carrying out field experiments under various environments and management
(Dourago-Neto et al., 1998; Rauff and Bello, 2015).
Crop growth models mimic growth and development of crops under different conditions
using empirical and mathematical relationships (Dourago-Neto et al., 1998; Rauff and Bello,
2015). They are useful decision support tools (Boote et al., 1996), making them valuable tools
in agriculture. Grain legumes have been modelled successfully with groundnuts, soybeans and
dry beans having their own models [PNUTGRO (Boote et al.,., 1989), SOYGRO (Jones et al.,
1989) and BEANGRO (Hoogenboom et al., 1994), respectively], which are housed in the
Decision Support System for Agrotechnology Transfer (DSSAT) model (Jones et al., 2003).
Legumes such as groundnut, soybean, cowpea and dry bean have also been calibrated for major
models such as the Agricultural Production Systems sIMulator (APSIM) (Keating et al., 2003).
While these models were successful in simulating yield under different management conditions
(Bhatia et al., 2008; Yadav et al., 2012), their wider use has been limited by their complexity,
as they require a relatively large number of input parameters, some of which are challenging to
obtain under field conditions (Corbeels et al., 2006; Mourice et al., 2014; Jones et al., 2017).
This confines their application to research applications where resources, instrumentation and

148
expertise are available. The FAO overcame the issue of complexity, by developing a simpler
model that can still maintain accuracy and robustness – AquaCrop (Raes et al., 2009; Steduto
et al., 2009).
The FAO – AquaCrop model was designed to model yield responses to water making it an
appropriate model in semi- and arid regions (Raes et al., 2009; Steduto et al., 2009). AquaCrop
has been successfully parameterized for several herbaceous crops including, but not limited to,
wheat (Triticum aestivum) (Andarzian et al., 2011), maize (Zea mays) (Heng et al., 2009)
sorghum (sorghum bicolor) (Araya et al., 2016) and cotton (Gossypium spp.) (Farahani et al.,
2009). Thus far, a few grain legume crops such as soybean (Glycine max) (Steduto et al., 2012;
Adeboye et al., 2017), bambara groundnut (Vigna subterranea) (Karunaratne et al., 2011;
Mabhaudhi et al., 2014a) and pea (Pisum sativum) (Paredes and Torres, 2016), have been
calibrated and tested for AquaCrop. For these crops, AquaCrop was able to predict yield under
different production scenarios (Karunaratne et al., 2011; Mabhaudhi et al., 2014a, Paredes and
Torres, 2016; Adeboye et al., 2017). For pea, AquaCrop was successfully applied to assess the
impact of sowing dates and irrigation strategies on yield and water use (Paredes and Torres,
2016). AquaCrop could be a useful decision support tool on production of grain legumes in
semi- and arid regions. This is currently limited as only a few grain legumes (soybean, bambara
groundnut, pea) have been modelled in AquaCrop.
There is need to calibrate and test AquaCrop for more grain legume crops. Groundnut
(Arachis hypogaea) and dry bean (Phaseolus vulgaris) are among the major grain legumes
produced by subsistence and commercial farmers in the semi- and arid regions (Chibarabada et
al., 2017). Currently, AquaCrop has not been calibrated and validated for both crops.
Availability of well-calibrated models, is an initial step to increased application of AquaCrop
to answer research questions on adaptability of grain legumes to varying water availability and
environmental conditions. The aim of the study was to calibrate and test the performance of
AquaCrop model for groundnut and dry bean under varying water regimes and environments
in a semi- and arid environment. The specific objectives were to (i) calibrate AquaCrop for
groundnut and dry bean, (ii) evaluate its ability to simulate CC, biomass, yield and
evapotranspiration (ET) of groundnut and dry bean for varying soils and climates.
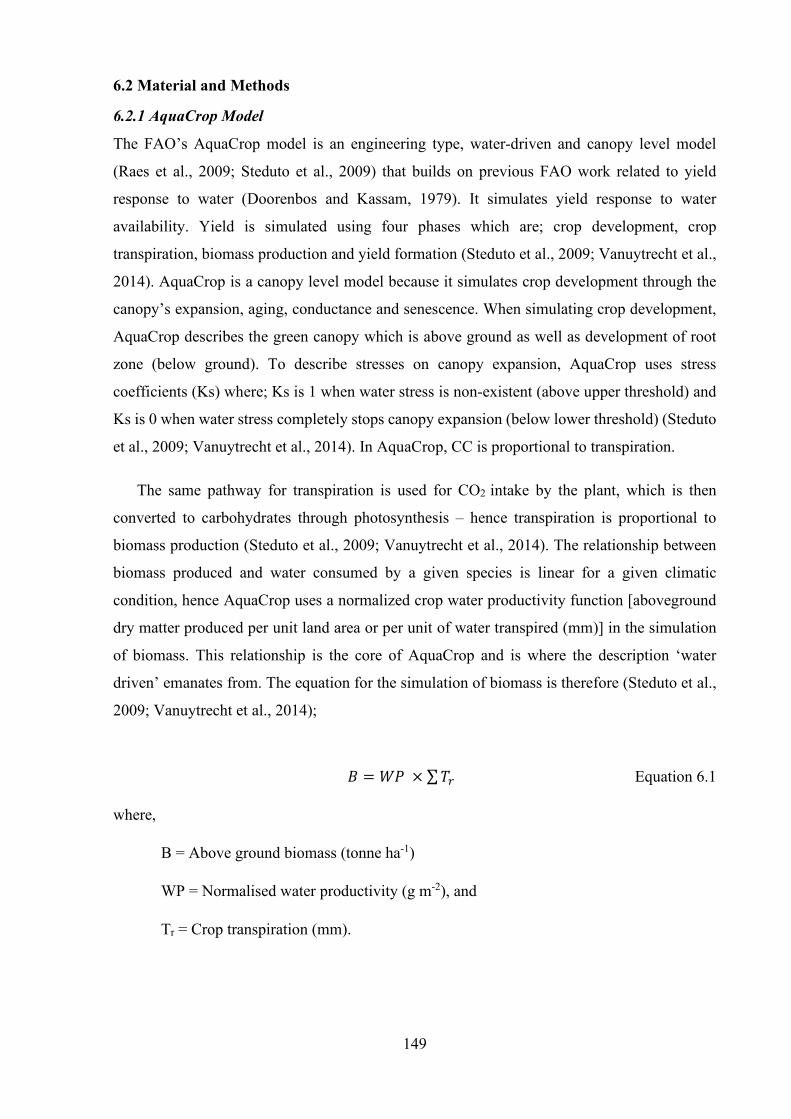
149
6.2 Material and Methods
6.2.1 AquaCrop Model
The FAO’s AquaCrop model is an engineering type, water-driven and canopy level model
(Raes et al., 2009; Steduto et al., 2009) that builds on previous FAO work related to yield
response to water (Doorenbos and Kassam, 1979). It simulates yield response to water
availability. Yield is simulated using four phases which are; crop development, crop
transpiration, biomass production and yield formation (Steduto et al., 2009; Vanuytrecht et al.,
2014). AquaCrop is a canopy level model because it simulates crop development through the
canopy’s expansion, aging, conductance and senescence. When simulating crop development,
AquaCrop describes the green canopy which is above ground as well as development of root
zone (below ground). To describe stresses on canopy expansion, AquaCrop uses stress
coefficients (Ks) where; Ks is 1 when water stress is non-existent (above upper threshold) and
Ks is 0 when water stress completely stops canopy expansion (below lower threshold) (Steduto
et al., 2009; Vanuytrecht et al., 2014). In AquaCrop, CC is proportional to transpiration.
The same pathway for transpiration is used for CO2 intake by the plant, which is then
converted to carbohydrates through photosynthesis – hence transpiration is proportional to
biomass production (Steduto et al., 2009; Vanuytrecht et al., 2014). The relationship between
biomass produced and water consumed by a given species is linear for a given climatic
condition, hence AquaCrop uses a normalized crop water productivity function [aboveground
dry matter produced per unit land area or per unit of water transpired (mm)] in the simulation
of biomass. This relationship is the core of AquaCrop and is where the description ‘water
driven’ emanates from. The equation for the simulation of biomass is therefore (Steduto et al.,
2009; Vanuytrecht et al., 2014);
𝐵𝐵 = 𝑁𝑁𝑁𝑁 × ∑𝐸𝐸𝑟𝑟 Equation 6.1
where,
B = Above ground biomass (tonne ha-1)
WP = Normalised water productivity (g m-2), and
Tr = Crop transpiration (mm).
150
To calculate the yield, AquaCrop uses the harvest index (HI), taking into consideration the
adjustments in HI due to stress at the start of the yield formation, during flowering and during
yield formation (Steduto et al., 2009; Vanuytrecht et al., 2014). Therefore;
𝑌𝑌 = 𝑅𝑅𝐻𝐻𝐻𝐻 × 𝐻𝐻𝐼𝐼𝐼𝐼 × 𝐵𝐵 Equation 6.2
where:
Y = yield (tonne ha-1)
fHI = multiplier which considers the stresses that adjust the HI from its reference value
HIo = Reference HI (%)
B = Total above ground biomass (tonne ha-1).
To run simulations, AquaCrop requires inputs of climate data, crop characteristics, soil
characteristics and description of management practices.
6.2.2 Study areas
Field trials were conducted at three sites (Fountainhill Estate, Ukulinga Research Farm and
Umbumbulu Rural District), in KwaZulu-Natal, South Africa. Ukulinga Research Farm
[29°37’S; 30°16’E; 750 meters above sea level (m.a.s.l.)] was the on-station research trial,
while Umbumbulu (29.984’S; 30.702’E; 593 m.a.s.l.) and Fountainhill Estate (29.447’S;
30.546’E; 1020 m.a.s.l.) were on-farm research trials. A pot trial was conducted in a growth
tunnel at the University of KwaZulu-Natal’s Controlled Environment Facility,
Pietermaritzburg, South Africa (29°37'12"S; 30°23'49"E; 750 m.a.s.l.). The environment in the
growth tunnel is semi-controlled with temperatures ranging from ~18/33°C (day/night) and
relative humidity (60-80%), which is a warm subtropical climate (Modi, 2007).
6.2.3 Experimental design
6.2.3.1 Field Trials
Experiments were conducted during the 2015/16 and 2016/17 summer seasons. At Ukulinga
Research Farm, the experimental design was a split-plot design arranged in randomised
complete blocks. The main plots were the water treatments, while subplots were the crops
(groundnut and dry bean). The water treatments were optimum irrigation, deficit irrigation and
rainfed conditions. Irrigation scheduling was based on management allowable depletion (MAD)
of 60% Plant Available Water (PAW). The approach to deficit irrigation was to apply irrigation
(MAD: 60% PAW) at the growth stages that were most sensitive to water stress (Geerts and
Raes, 2009). All the water treatments were optimally irrigated up to 90% emergence to ensure

151
establishment of all trials. For the rainfed trial, irrigation was withdrawn thereafter. At
Umbumbulu and Fountainhill, the trials were entirely rainfed and the experimental design was
a randomised complete block design with three replications. Plant population for both crops
was 88 889 plants ha-1. Trials from Ukulinga during the 2015/16 were used to calibrate the
model, while trials at all the sites during 2016/17 were used for model evaluation (Table 6.1).
Planting dates for all the trials are given in Table 6.1.
6.2.3.2 Controlled environment
A pot trial was conducted for 2015/16 summer season for the purposes of determining some
parameters needed to calibrate the model (Table 6.1). Planting date is given in Table 6.1. The
experimental design included three water treatments (80, 60 and 30% of field capacity) and two
grain legume crops (groundnut and dry bean), arranged in a completely randomised design with
three replications (3×2×3 = 18 pots). The three water treatments [80, 60 and 30% of field
capacity (FC)] represented no water stress, mild water stress and severe water stress,
respectively. This was based on previous studies that used the same treatments to impose water
stress in pot trials. In addition to the 18 pots, nine pots (three replications × three water
treatments) were added to monitor soil evaporation from the pots. Soil evaporation was
deducted from the total evapotranspiration of the pots to determine crop transpiration. Fifty-
four pots representing (two legume crops × three water treatments × nine intervals), were also
added to allow for destructive sampling to determine plant mass fortnightly. This allowed for
correction of plant mass when determining irrigation through gravimetric measurements. In
total, there were 81 pots.
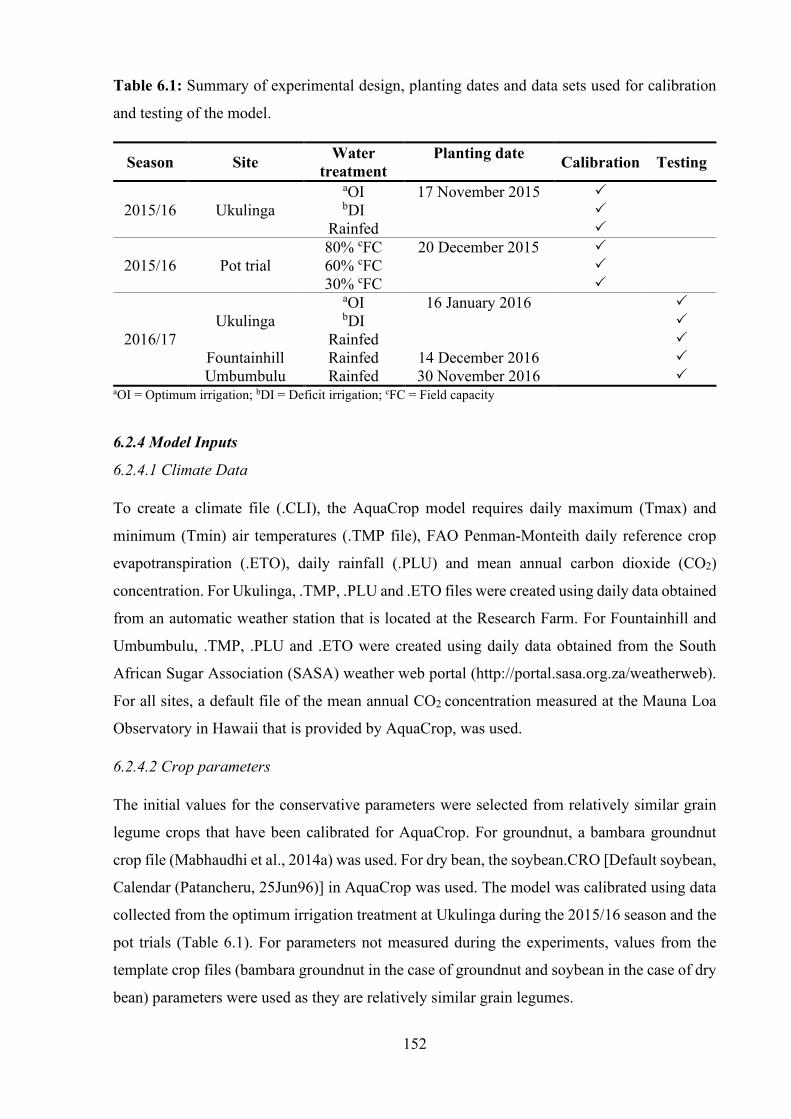
152
Table 6.1: Summary of experimental design, planting dates and data sets used for calibration
and testing of the model.
Season Site Water treatment
Planting date Calibration Testing
2015/16 Ukulinga aOI 17 November 2015 bDI
Rainfed
2015/16 Pot trial 80% cFC 20 December 2015 60% cFC 30% cFC
2016/17 Ukulinga
aOI 16 January 2016 bDI
Rainfed Fountainhill Rainfed 14 December 2016 Umbumbulu Rainfed 30 November 2016
aOI = Optimum irrigation; bDI = Deficit irrigation; cFC = Field capacity
6.2.4 Model Inputs
6.2.4.1 Climate Data
To create a climate file (.CLI), the AquaCrop model requires daily maximum (Tmax) and
minimum (Tmin) air temperatures (.TMP file), FAO Penman-Monteith daily reference crop
evapotranspiration (.ETO), daily rainfall (.PLU) and mean annual carbon dioxide (CO2)
concentration. For Ukulinga, .TMP, .PLU and .ETO files were created using daily data obtained
from an automatic weather station that is located at the Research Farm. For Fountainhill and
Umbumbulu, .TMP, .PLU and .ETO were created using daily data obtained from the South
African Sugar Association (SASA) weather web portal (http://portal.sasa.org.za/weatherweb).
For all sites, a default file of the mean annual CO2 concentration measured at the Mauna Loa
Observatory in Hawaii that is provided by AquaCrop, was used.
6.2.4.2 Crop parameters
The initial values for the conservative parameters were selected from relatively similar grain
legume crops that have been calibrated for AquaCrop. For groundnut, a bambara groundnut
crop file (Mabhaudhi et al., 2014a) was used. For dry bean, the soybean.CRO [Default soybean,
Calendar (Patancheru, 25Jun96)] in AquaCrop was used. The model was calibrated using data
collected from the optimum irrigation treatment at Ukulinga during the 2015/16 season and the
pot trials (Table 6.1). For parameters not measured during the experiments, values from the
template crop files (bambara groundnut in the case of groundnut and soybean in the case of dry
bean) parameters were used as they are relatively similar grain legumes.
153
Groundnut and dry bean crop files (.CRO) were created using data collected from Ukulinga
during 2015/16 and pot trials. Crop parameters from the OI treatment were used to calibrate the
model as they represent the crops’ potential under no stress (Table 6.2). Data from the DI and
rainfed irrigation treatments was used to determine crop response to water stress. In cases where
data from field trials was inconclusive, data from pot trials were used to determine crop
responses to water stress. Transpiration could not be determined under field conditions; hence
WP was determined from the pot trial (Table 6.2). Parameters not considered were biomass
production affected by soil salinity and fertility stress. Crop phenology was observed in
calendar days and thereafter converted to thermal time (GDD) in AquaCrop.

154
Table 6.2: Selected crop parameters and values used for the calibration of groundnut and dry bean in AquaCrop.
Parameter Determination Unit Groundnut value
Dry Bean value
Planting method - Direct sowing Direct sowing Plant population Plant population based on intra-row spacing of 0.75 m and inter-row spacing of 0.15 m Plants hectare-1 88 889 88 889
Seedling size Obtained under controlled environment where the mean initial seedling leaf area per plant was
measured at 90% emergence on five randomly selected plants using the LI-3100C Leaf Area Meter (LICOR, USA).
cm2 3 17
Initial canopy cover (CCo) Model derived % 0.27 1.51
Time to emergence Time to emergence was determined as the number of days from planting to when 90% of the plants had > 20 mm hypocotyle protrusion.
Growing Degree days 127 89
Time to maximum canopy cover (CCx)
Leaf area index, which is the one-sided green leaf area per unit ground surface area occupied by the plant was measured with the LAI‑2200C Plant Canopy Analyzer (LICOR, USA). LAI values were
converted to CC using the formula by Hsiao et al. (2012) where; CC = 1.005 × [1 – exp (-0.6 LAI)]
Graphs of weekly CC were plotted and the time to which the canopy reached its constant peak was determined as the maximum canopy cover.
Growing Degree days 1 040 949
Time to canopy senescence
Time taken when at least 10% of leaves had senesced (chlorophyll degradation) without new leaves being formed to replace them.
Growing Degree days 110 1 133
Time to physiological maturity A plant matured when at least 50% of leaves had senesced (chlorophyll degradation). Growing Degree
days 132 1 559
CCx Consistent maximum canopy observed. % 68 70 Canopy decline Time from maximum CC to when 50% of plants had reached senescence days 23 20 Canopy growth
coefficient (CGC) Model derived %/day 12.2 11.0
Canopy decline coefficient (CDC) Model derived %/GDD 0.683 0.745
Length building up HI Time from flowering (50% of the plants had at least one open flower) to maturity (50% of plants reached physiological maturity).
Growing Degree days 943 846
Duration of flowering This was defined as the period (number of days) that 50% of the experimental plants had at least one flower that was open.
Growing Degree days 798 641
Time to flowering This was the time taken for 50% of the experimental plants to have at least one fully opened flower. Growing Degree days 595 640
Determinacy linked with flowering
Determinancy was defined as cessation of vegetative growth when the terminal flower of the main stem started to develop. – No Yes
Minimum effective rooting depth
Plants used for determination of seedling CC were used for determination of minimum effective rooting depth. Seedlings were sampled at 90% emergence and root length was measured using a 30-cm
ruler. m 0.3 0.3
Upper temperature Upper temperatures were obtained from Vara Prasad et al. (2002) and Vara Prasad et al. (2001), respectively. °C 28 29
Maximum air temperature affecting pollination Obtained from Vara Prasad et al. (2002) and Vara Prasad et al. (2001), respectively. °C 34 34
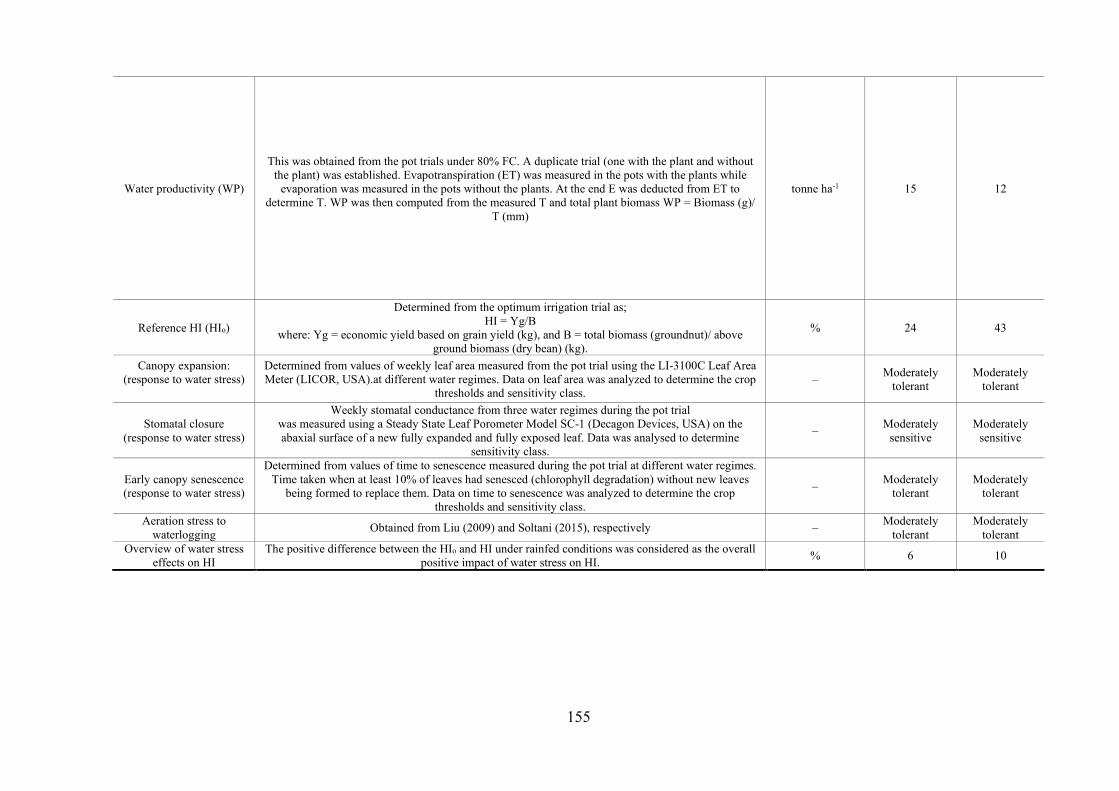
155
Water productivity (WP)
This was obtained from the pot trials under 80% FC. A duplicate trial (one with the plant and without the plant) was established. Evapotranspiration (ET) was measured in the pots with the plants while
evaporation was measured in the pots without the plants. At the end E was deducted from ET to determine T. WP was then computed from the measured T and total plant biomass WP = Biomass (g)/
T (mm)
tonne ha-1 15 12
Reference HI (HIo)
Determined from the optimum irrigation trial as; HI = Yg/B
where: Yg = economic yield based on grain yield (kg), and B = total biomass (groundnut)/ above ground biomass (dry bean) (kg).
% 24 43
Canopy expansion: (response to water stress)
Determined from values of weekly leaf area measured from the pot trial using the LI-3100C Leaf Area Meter (LICOR, USA).at different water regimes. Data on leaf area was analyzed to determine the crop
thresholds and sensitivity class. – Moderately
tolerant Moderately
tolerant
Stomatal closure (response to water stress)
Weekly stomatal conductance from three water regimes during the pot trial was measured using a Steady State Leaf Porometer Model SC-1 (Decagon Devices, USA) on the abaxial surface of a new fully expanded and fully exposed leaf. Data was analysed to determine
sensitivity class.
– Moderately sensitive
Moderately sensitive
Early canopy senescence (response to water stress)
Determined from values of time to senescence measured during the pot trial at different water regimes. Time taken when at least 10% of leaves had senesced (chlorophyll degradation) without new leaves
being formed to replace them. Data on time to senescence was analyzed to determine the crop thresholds and sensitivity class.
– Moderately tolerant
Moderately tolerant
Aeration stress to waterlogging Obtained from Liu (2009) and Soltani (2015), respectively – Moderately
tolerant Moderately
tolerant Overview of water stress
effects on HI The positive difference between the HIo and HI under rainfed conditions was considered as the overall
positive impact of water stress on HI. % 6 10
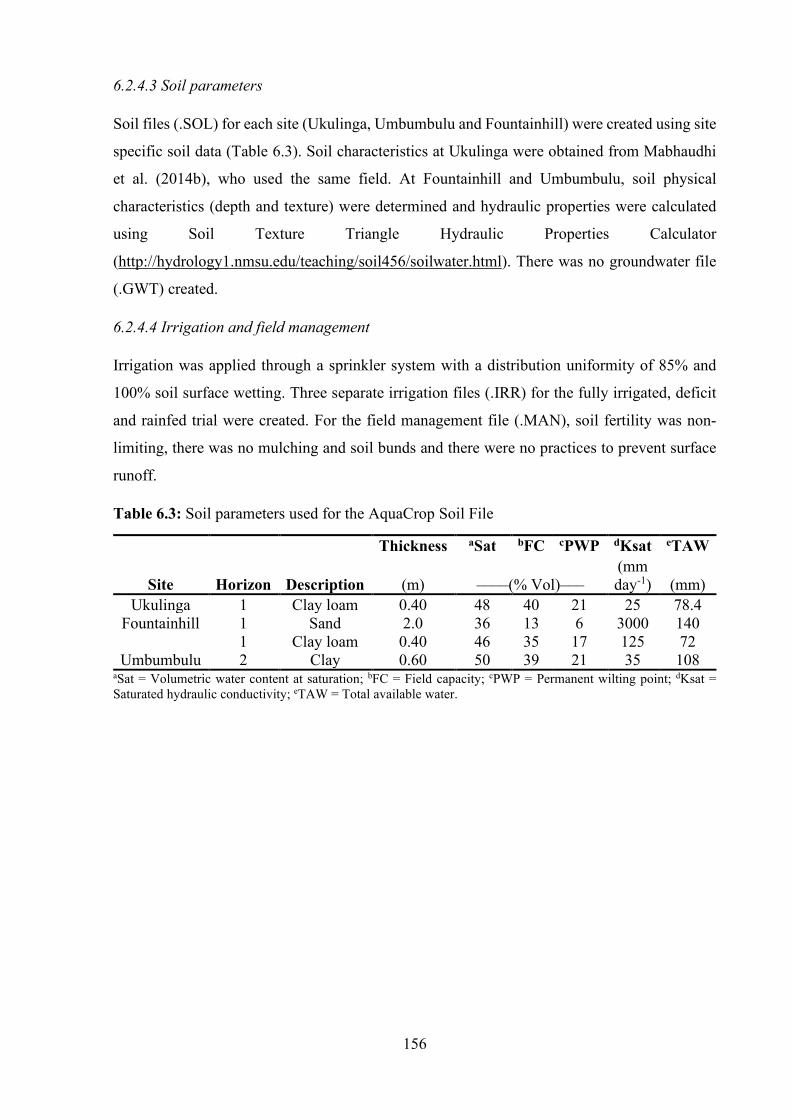
156
6.2.4.3 Soil parameters
Soil files (.SOL) for each site (Ukulinga, Umbumbulu and Fountainhill) were created using site
specific soil data (Table 6.3). Soil characteristics at Ukulinga were obtained from Mabhaudhi
et al. (2014b), who used the same field. At Fountainhill and Umbumbulu, soil physical
characteristics (depth and texture) were determined and hydraulic properties were calculated
using Soil Texture Triangle Hydraulic Properties Calculator
(http://hydrology1.nmsu.edu/teaching/soil456/soilwater.html). There was no groundwater file
(.GWT) created.
6.2.4.4 Irrigation and field management
Irrigation was applied through a sprinkler system with a distribution uniformity of 85% and
100% soil surface wetting. Three separate irrigation files (.IRR) for the fully irrigated, deficit
and rainfed trial were created. For the field management file (.MAN), soil fertility was non-
limiting, there was no mulching and soil bunds and there were no practices to prevent surface
runoff.
Table 6.3: Soil parameters used for the AquaCrop Soil File
Site Horizon Description
Thickness aSat bFC cPWP dKsat eTAW
(m) ––––(% Vol)––– (mm day-1) (mm)
Ukulinga 1 Clay loam 0.40 48 40 21 25 78.4 Fountainhill 1 Sand 2.0 36 13 6 3000 140
Umbumbulu 1 Clay loam 0.40 46 35 17 125 72 2 Clay 0.60 50 39 21 35 108
aSat = Volumetric water content at saturation; bFC = Field capacity; cPWP = Permanent wilting point; dKsat = Saturated hydraulic conductivity; eTAW = Total available water.

157
6.2.4.5 Observations
Above ground destructive sampling was conducted every fortnight and then plants were oven
dried at 80°C until there were no changes in total above aground biomass observed to determine
accumulation of above ground biomass. Leaf area index (LAI), which is the one-sided green
leaf area per unit ground surface area occupied by the plant, was routinely measured using the
LAI-2200C Plant Canopy Analyzer (LICOR, USA). Leaf area index values were then converted
to CC using the formula by Hsiao et al. (2012);
𝐶𝐶𝐶𝐶 = 1.005 × [1 − exp(−0.6𝐿𝐿𝐴𝐴𝐼𝐼)]1.2 Equation 6.3
Observed CC data and above ground biomass were used to create field observation files (.OBS)
for each water treatment and experimental site.
Crop ET was calculated under field conditions as the residual of a modified soil water balance
(Allen et al., 1998);
𝐸𝐸𝐸𝐸 = 𝐸𝐸𝑅𝑅 + 1 ± ∆𝑆𝑆𝑁𝑁𝐶𝐶 Equation 6.4
where;
ET = evapotranspiration,
ER = Effective rainfall (mm) is monthly effective rainfall that is stored in the root zone
after subtracting the amount of rainfall lost to runoff and deep percolation (USDA-SCS,
1967),
I = irrigation (mm), and
ΔSWC = changes in soil water content (mm) measured using a PR2/6 soil moisture
probe (Delta T, UK).
At harvest, six representative plants were harvested from each plot and air dried for
determination of total biomass and yield.
6.2.5 Simulation procedure
AquaCrop version 5.0 (FAO, 2015) was used. The created files (.CLI, .CRO, .SOL, .IRR,
.MAN and .OBS) were put into AquaCrop and the model was run in thermal time (growing
degree days). Simulation periods were linked to the growing cycle (day one after sowing to
maturity; planting dates are given in Table 6.1). At Ukulinga, during 2015/16, initial soil water
content was assumed to be at field capacity as planting followed a rainfall event and irrigation
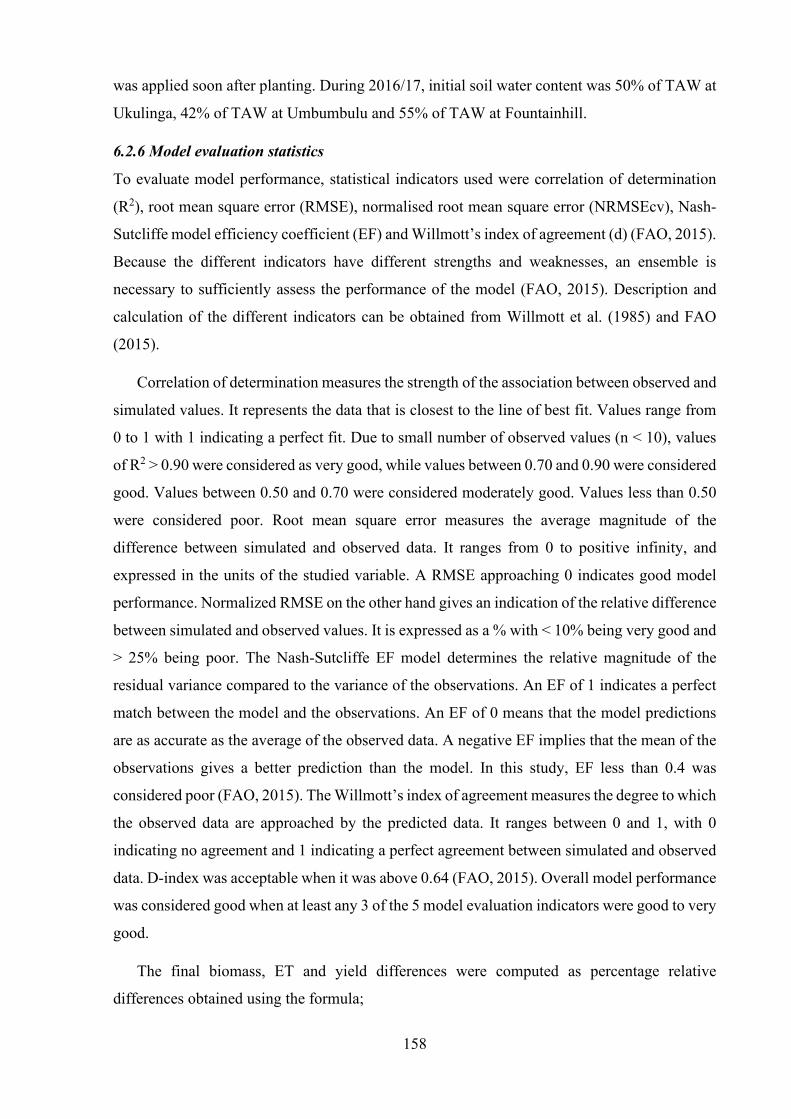
158
was applied soon after planting. During 2016/17, initial soil water content was 50% of TAW at
Ukulinga, 42% of TAW at Umbumbulu and 55% of TAW at Fountainhill.
6.2.6 Model evaluation statistics
To evaluate model performance, statistical indicators used were correlation of determination
(R2), root mean square error (RMSE), normalised root mean square error (NRMSEcv), Nash-
Sutcliffe model efficiency coefficient (EF) and Willmott’s index of agreement (d) (FAO, 2015).
Because the different indicators have different strengths and weaknesses, an ensemble is
necessary to sufficiently assess the performance of the model (FAO, 2015). Description and
calculation of the different indicators can be obtained from Willmott et al. (1985) and FAO
(2015).
Correlation of determination measures the strength of the association between observed and
simulated values. It represents the data that is closest to the line of best fit. Values range from
0 to 1 with 1 indicating a perfect fit. Due to small number of observed values (n < 10), values
of R2 > 0.90 were considered as very good, while values between 0.70 and 0.90 were considered
good. Values between 0.50 and 0.70 were considered moderately good. Values less than 0.50
were considered poor. Root mean square error measures the average magnitude of the
difference between simulated and observed data. It ranges from 0 to positive infinity, and
expressed in the units of the studied variable. A RMSE approaching 0 indicates good model
performance. Normalized RMSE on the other hand gives an indication of the relative difference
between simulated and observed values. It is expressed as a % with < 10% being very good and
> 25% being poor. The Nash-Sutcliffe EF model determines the relative magnitude of the
residual variance compared to the variance of the observations. An EF of 1 indicates a perfect
match between the model and the observations. An EF of 0 means that the model predictions
are as accurate as the average of the observed data. A negative EF implies that the mean of the
observations gives a better prediction than the model. In this study, EF less than 0.4 was
considered poor (FAO, 2015). The Willmott’s index of agreement measures the degree to which
the observed data are approached by the predicted data. It ranges between 0 and 1, with 0
indicating no agreement and 1 indicating a perfect agreement between simulated and observed
data. D-index was acceptable when it was above 0.64 (FAO, 2015). Overall model performance
was considered good when at least any 3 of the 5 model evaluation indicators were good to very
good.
The final biomass, ET and yield differences were computed as percentage relative
differences obtained using the formula;
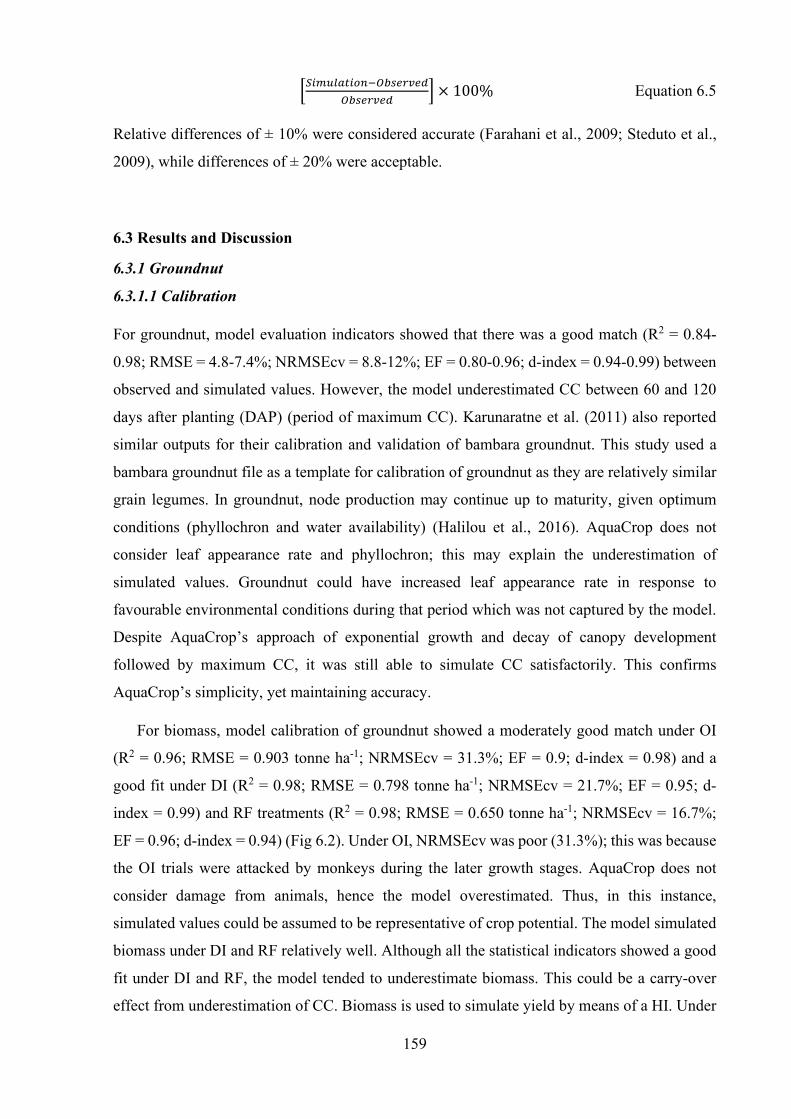
159
�𝑆𝑆𝑆𝑆𝑆𝑆𝑆𝑆𝑆𝑆𝑆𝑆𝑆𝑆𝑆𝑆𝑆𝑆𝑆𝑆−𝑂𝑂𝑂𝑂𝑂𝑂𝑂𝑂𝑟𝑟𝑂𝑂𝑂𝑂𝑂𝑂𝑂𝑂𝑂𝑂𝑂𝑂𝑂𝑂𝑟𝑟𝑂𝑂𝑂𝑂𝑂𝑂
� × 100% Equation 6.5
Relative differences of ± 10% were considered accurate (Farahani et al., 2009; Steduto et al.,
2009), while differences of ± 20% were acceptable.
6.3 Results and Discussion
6.3.1 Groundnut
6.3.1.1 Calibration
For groundnut, model evaluation indicators showed that there was a good match (R2 = 0.84-
0.98; RMSE = 4.8-7.4%; NRMSEcv = 8.8-12%; EF = 0.80-0.96; d-index = 0.94-0.99) between
observed and simulated values. However, the model underestimated CC between 60 and 120
days after planting (DAP) (period of maximum CC). Karunaratne et al. (2011) also reported
similar outputs for their calibration and validation of bambara groundnut. This study used a
bambara groundnut file as a template for calibration of groundnut as they are relatively similar
grain legumes. In groundnut, node production may continue up to maturity, given optimum
conditions (phyllochron and water availability) (Halilou et al., 2016). AquaCrop does not
consider leaf appearance rate and phyllochron; this may explain the underestimation of
simulated values. Groundnut could have increased leaf appearance rate in response to
favourable environmental conditions during that period which was not captured by the model.
Despite AquaCrop’s approach of exponential growth and decay of canopy development
followed by maximum CC, it was still able to simulate CC satisfactorily. This confirms
AquaCrop’s simplicity, yet maintaining accuracy.
For biomass, model calibration of groundnut showed a moderately good match under OI
(R2 = 0.96; RMSE = 0.903 tonne ha-1; NRMSEcv = 31.3%; EF = 0.9; d-index = 0.98) and a
good fit under DI (R2 = 0.98; RMSE = 0.798 tonne ha-1; NRMSEcv = 21.7%; EF = 0.95; d-
index = 0.99) and RF treatments (R2 = 0.98; RMSE = 0.650 tonne ha-1; NRMSEcv = 16.7%;
EF = 0.96; d-index = 0.94) (Fig 6.2). Under OI, NRMSEcv was poor (31.3%); this was because
the OI trials were attacked by monkeys during the later growth stages. AquaCrop does not
consider damage from animals, hence the model overestimated. Thus, in this instance,
simulated values could be assumed to be representative of crop potential. The model simulated
biomass under DI and RF relatively well. Although all the statistical indicators showed a good
fit under DI and RF, the model tended to underestimate biomass. This could be a carry-over
effect from underestimation of CC. Biomass is used to simulate yield by means of a HI. Under

160
OI, grain yield was overestimated by 48%. This was due to yield loss from monkeys. Under DI
and RF, AquaCrop under- and overestimated grain yield by 0.8% and 2.2%, respectively, thus
the model simulated yield accurately (Farahani et al., 2009) (Table 6.4). Since AquaCrop
accurately simulated CC, biomass and yield under DI and RF, it can be inferred that it is a
suitable model for simulating biomass and yield of groundnut under different water regimes.
The model overestimated final ET by 28% in the OI treatment, 35% in the DI treatment and
34% in the RF treatment (Table 6.4). One of the distinguishing features of AquaCrop is the
separation of ET into evaporation (Es) and transpiration (Tr) based on a simple CC model
(Vanuytrecht et al., 2014). It would be assumed that since the model underestimated CC, which
is proportional to Tr, (cf. section 2.1), then Es would be the parameter overestimated. Based on
RMSE values, there was more underestimation of CC under RF relative to DI and OI. To
support the assumption, it was expected that results of simulated Es relative to Tr under the
different water regimes would show that there was more Es relative to Tr under rainfed
conditions. However, this was not the case as proportion of Es was the same under all the
watering regimes. This shows that the model tended to overestimate both Es and Tr and this was
greater under DI and RF conditions. It is not clear why the model overestimated ET.
6.3.1.2 Testing
At Ukulinga, model performance evaluators showed moderately good to poor model
performance in simulating CC across all the water regimes (Fig 6.3). Under OI, R2 was
moderately good (0.75), while it was very good under DI and RF conditions (0.92 and 0.93,
respectively). D-index was good across all the water regimes (0.70; 0.78 and 0.84, in the OI,
DI and RF treatment respectively). Root mean square error, NRMSEcv and EF were poor across
all the water regimes (> 8.6%, > 43.8% and < -0.38, respectively) (Fig 6.3). The coefficient of
determination and d-index showed moderately good fit as they are not sensitive to the
magnitude of the difference between simulated and observed data. Root mean square error,
NRMSEcv and EF were very poor due to their sensitivity to magnitude of the difference
between simulated and observed data (cf. section 6.2.6).
The model overestimated CC for groundnut across all the watering regimes. This was
mainly as a result of disturbances in our trials by monkeys and wild pigs which could not be
factored into the model. The canopy was often disturbed as the monkeys were seeking the
groundnut pods. As the canopy was damaged, it would take time to recover which was also not
factored into the model. This was evident in the differences between observed and estimated
time to maturity (29 May 2017 and 18 May 2017, respectively). While crop damage by pests
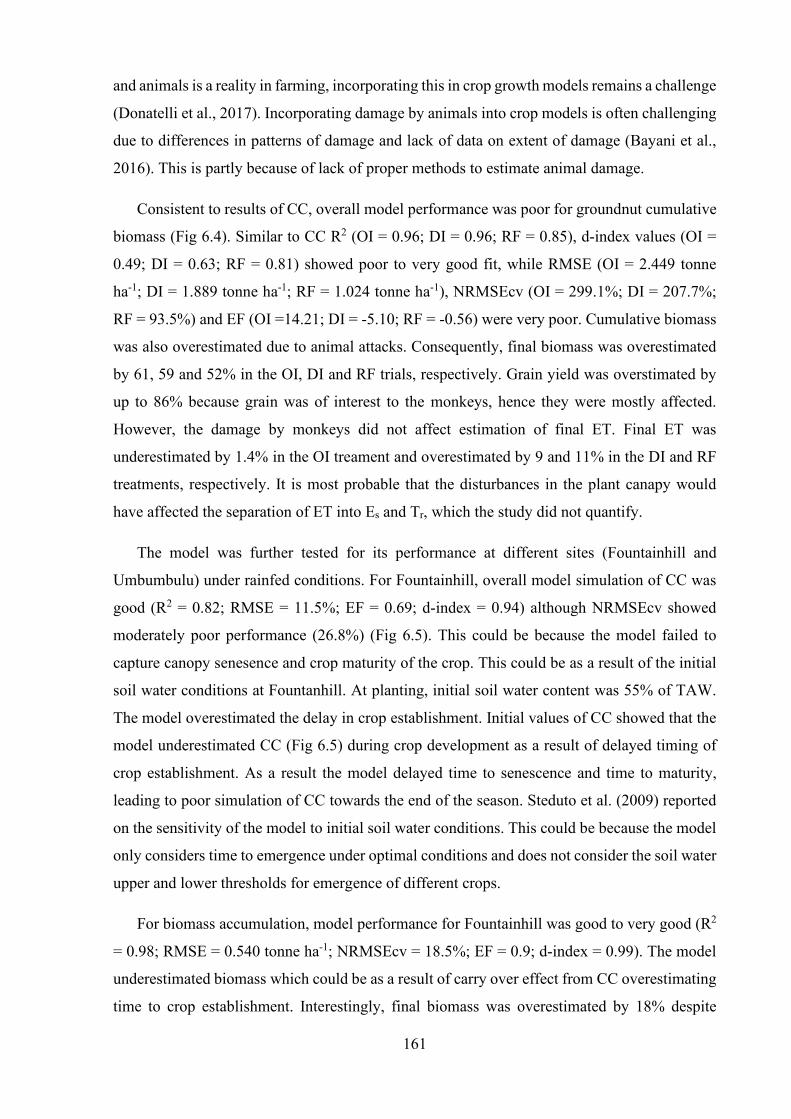
161
and animals is a reality in farming, incorporating this in crop growth models remains a challenge
(Donatelli et al., 2017). Incorporating damage by animals into crop models is often challenging
due to differences in patterns of damage and lack of data on extent of damage (Bayani et al.,
2016). This is partly because of lack of proper methods to estimate animal damage.
Consistent to results of CC, overall model performance was poor for groundnut cumulative
biomass (Fig 6.4). Similar to CC R2 (OI = 0.96; DI = 0.96; RF = 0.85), d-index values (OI =
0.49; DI = 0.63; RF = 0.81) showed poor to very good fit, while RMSE (OI = 2.449 tonne
ha-1; DI = 1.889 tonne ha-1; RF = 1.024 tonne ha-1), NRMSEcv (OI = 299.1%; DI = 207.7%;
RF = 93.5%) and EF (OI =14.21; DI = -5.10; RF = -0.56) were very poor. Cumulative biomass
was also overestimated due to animal attacks. Consequently, final biomass was overestimated
by 61, 59 and 52% in the OI, DI and RF trials, respectively. Grain yield was overstimated by
up to 86% because grain was of interest to the monkeys, hence they were mostly affected.
However, the damage by monkeys did not affect estimation of final ET. Final ET was
underestimated by 1.4% in the OI treament and overestimated by 9 and 11% in the DI and RF
treatments, respectively. It is most probable that the disturbances in the plant canapy would
have affected the separation of ET into Es and Tr, which the study did not quantify.
The model was further tested for its performance at different sites (Fountainhill and
Umbumbulu) under rainfed conditions. For Fountainhill, overall model simulation of CC was
good (R2 = 0.82; RMSE = 11.5%; EF = 0.69; d-index = 0.94) although NRMSEcv showed
moderately poor performance (26.8%) (Fig 6.5). This could be because the model failed to
capture canopy senesence and crop maturity of the crop. This could be as a result of the initial
soil water conditions at Fountanhill. At planting, initial soil water content was 55% of TAW.
The model overestimated the delay in crop establishment. Initial values of CC showed that the
model underestimated CC (Fig 6.5) during crop development as a result of delayed timing of
crop establishment. As a result the model delayed time to senescence and time to maturity,
leading to poor simulation of CC towards the end of the season. Steduto et al. (2009) reported
on the sensitivity of the model to initial soil water conditions. This could be because the model
only considers time to emergence under optimal conditions and does not consider the soil water
upper and lower thresholds for emergence of different crops.
For biomass accumulation, model performance for Fountainhill was good to very good (R2
= 0.98; RMSE = 0.540 tonne ha-1; NRMSEcv = 18.5%; EF = 0.9; d-index = 0.99). The model
underestimated biomass which could be as a result of carry over effect from CC overestimating
time to crop establishment. Interestingly, final biomass was overestimated by 18% despite
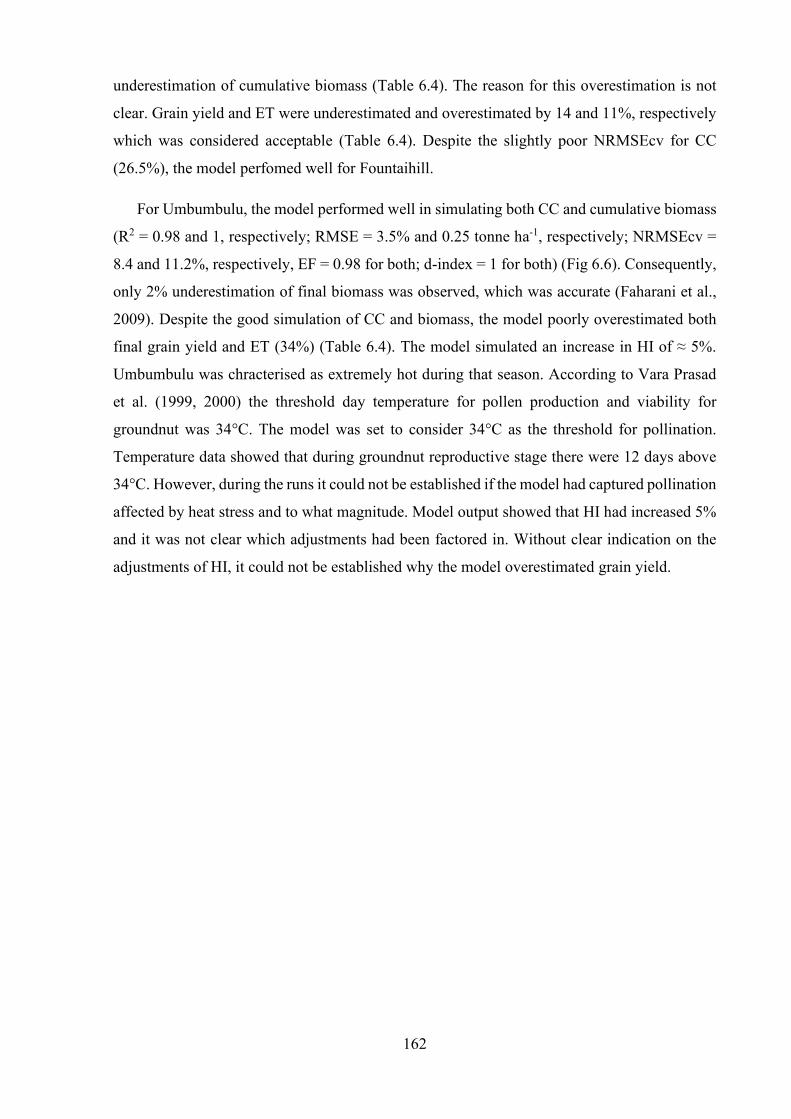
162
underestimation of cumulative biomass (Table 6.4). The reason for this overestimation is not
clear. Grain yield and ET were underestimated and overestimated by 14 and 11%, respectively
which was considered acceptable (Table 6.4). Despite the slightly poor NRMSEcv for CC
(26.5%), the model perfomed well for Fountaihill.
For Umbumbulu, the model performed well in simulating both CC and cumulative biomass
(R2 = 0.98 and 1, respectively; RMSE = 3.5% and 0.25 tonne ha-1, respectively; NRMSEcv =
8.4 and 11.2%, respectively, EF = 0.98 for both; d-index = 1 for both) (Fig 6.6). Consequently,
only 2% underestimation of final biomass was observed, which was accurate (Faharani et al.,
2009). Despite the good simulation of CC and biomass, the model poorly overestimated both
final grain yield and ET (34%) (Table 6.4). The model simulated an increase in HI of ≈ 5%.
Umbumbulu was chracterised as extremely hot during that season. According to Vara Prasad
et al. (1999, 2000) the threshold day temperature for pollen production and viability for
groundnut was 34°C. The model was set to consider 34°C as the threshold for pollination.
Temperature data showed that during groundnut reproductive stage there were 12 days above
34°C. However, during the runs it could not be established if the model had captured pollination
affected by heat stress and to what magnitude. Model output showed that HI had increased 5%
and it was not clear which adjustments had been factored in. Without clear indication on the
adjustments of HI, it could not be established why the model overestimated grain yield.
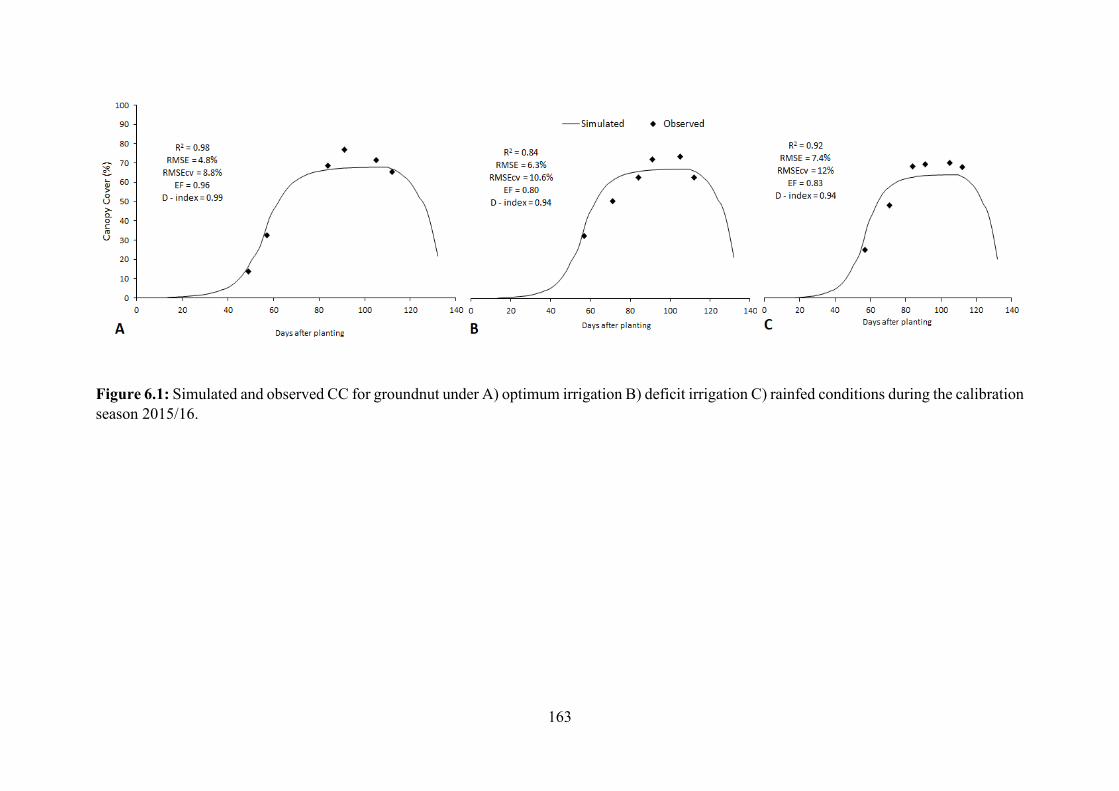
163
Figure 6.1: Simulated and observed CC for groundnut under A) optimum irrigation B) deficit irrigation C) rainfed conditions during the calibration season 2015/16.
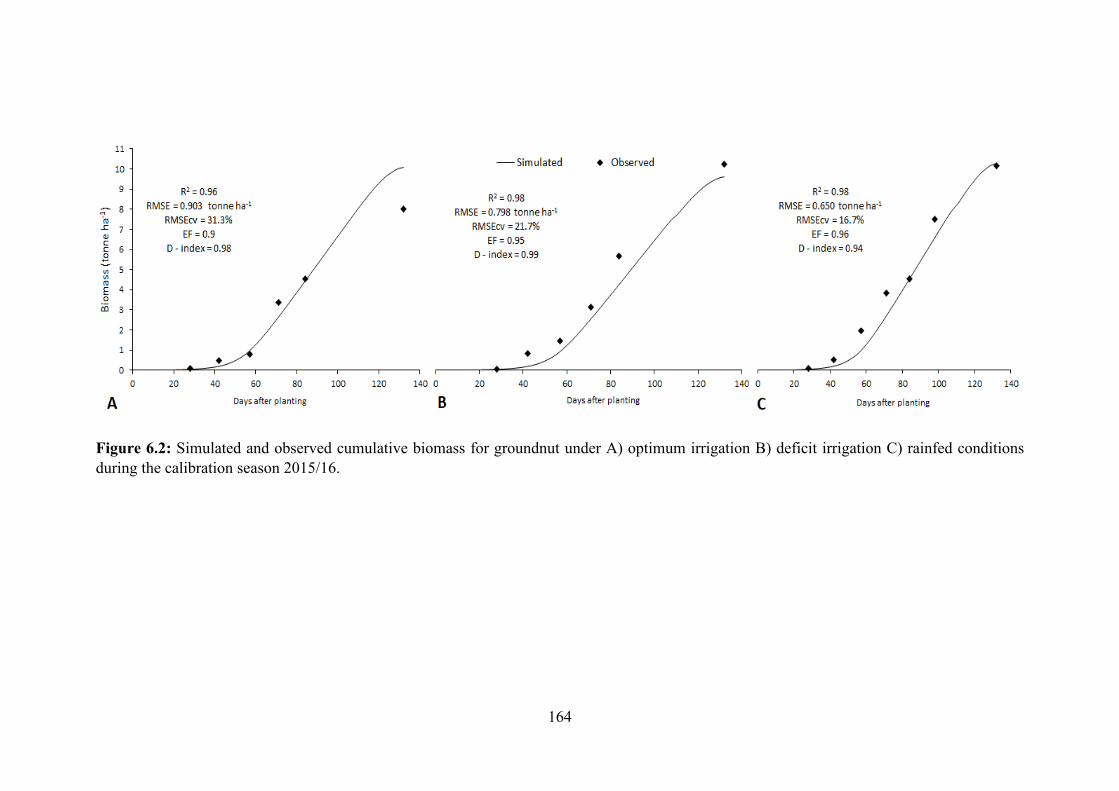
164
Figure 6.2: Simulated and observed cumulative biomass for groundnut under A) optimum irrigation B) deficit irrigation C) rainfed conditions during the calibration season 2015/16.

165
Figure 6.3: Simulated and observed CC for groundnut under A) optimum irrigation B) deficit irrigation C) rainfed conditions during model testing at Ukulinga (2016/17 season).
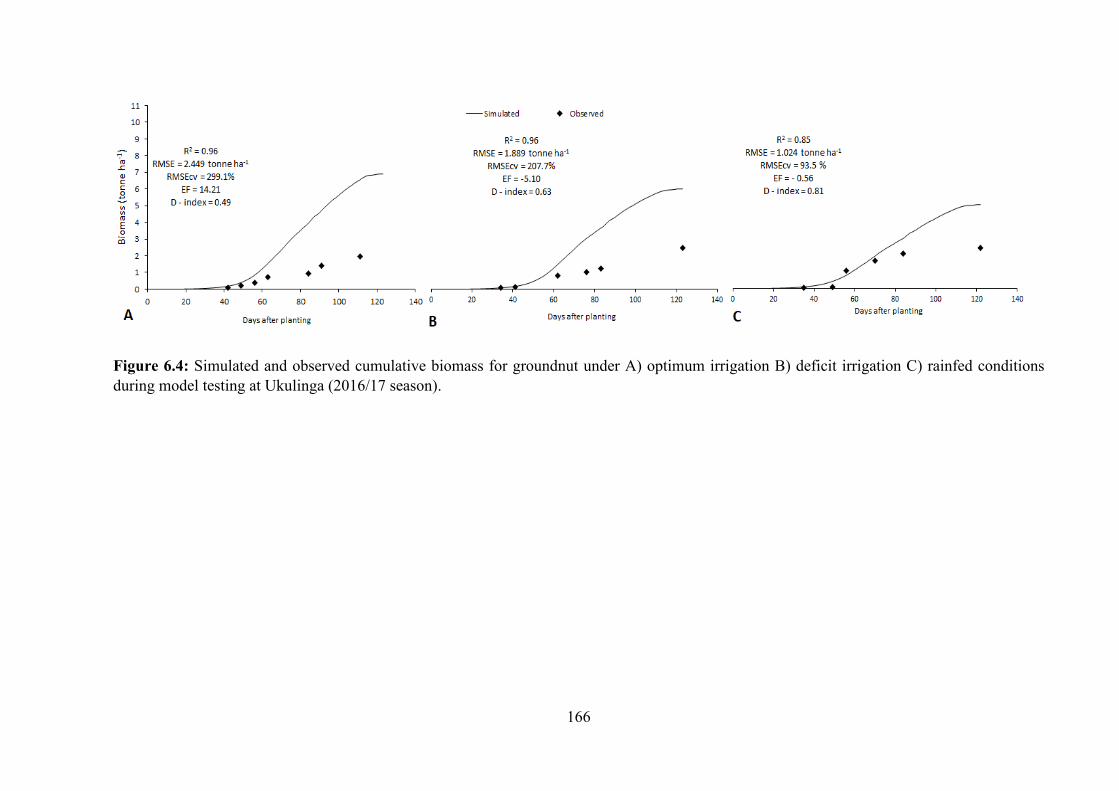
166
Figure 6.4: Simulated and observed cumulative biomass for groundnut under A) optimum irrigation B) deficit irrigation C) rainfed conditions during model testing at Ukulinga (2016/17 season).
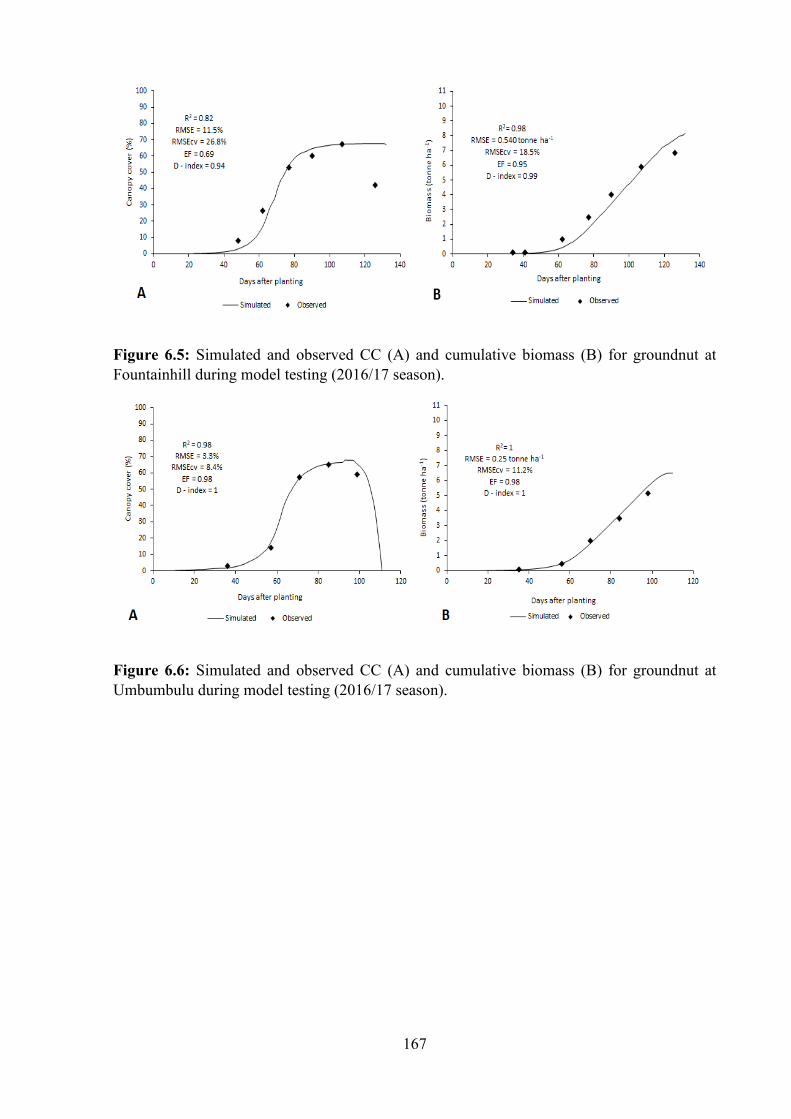
167
Figure 6.5: Simulated and observed CC (A) and cumulative biomass (B) for groundnut at Fountainhill during model testing (2016/17 season).
Figure 6.6: Simulated and observed CC (A) and cumulative biomass (B) for groundnut at Umbumbulu during model testing (2016/17 season).
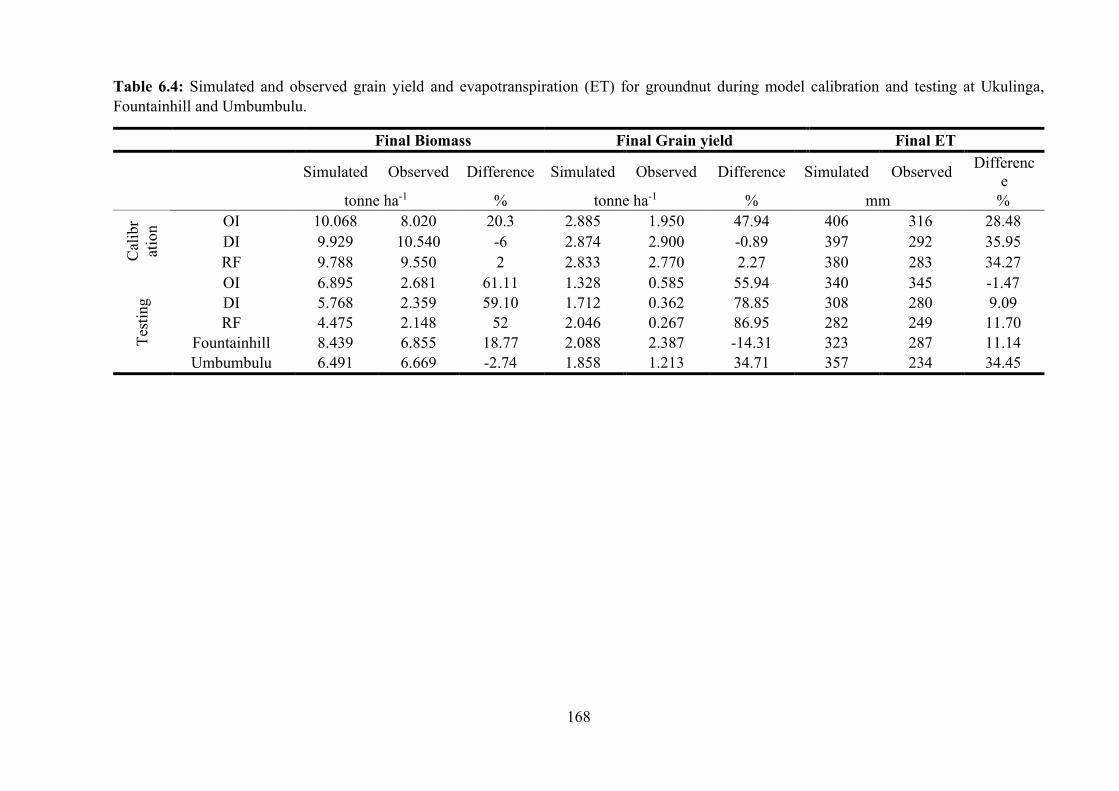
168
Table 6.4: Simulated and observed grain yield and evapotranspiration (ET) for groundnut during model calibration and testing at Ukulinga, Fountainhill and Umbumbulu.
Final Biomass Final Grain yield Final ET
Simulated Observed Difference Simulated Observed Difference Simulated Observed Difference
tonne ha-1 % tonne ha-1 % mm %
Cal
ibr
atio
n OI 10.068 8.020 20.3 2.885 1.950 47.94 406 316 28.48 DI 9.929 10.540 -6 2.874 2.900 -0.89 397 292 35.95 RF 9.788 9.550 2 2.833 2.770 2.27 380 283 34.27
Test
ing
OI 6.895 2.681 61.11 1.328 0.585 55.94 340 345 -1.47 DI 5.768 2.359 59.10 1.712 0.362 78.85 308 280 9.09 RF 4.475 2.148 52 2.046 0.267 86.95 282 249 11.70
Fountainhill 8.439 6.855 18.77 2.088 2.387 -14.31 323 287 11.14 Umbumbulu 6.491 6.669 -2.74 1.858 1.213 34.71 357 234 34.45
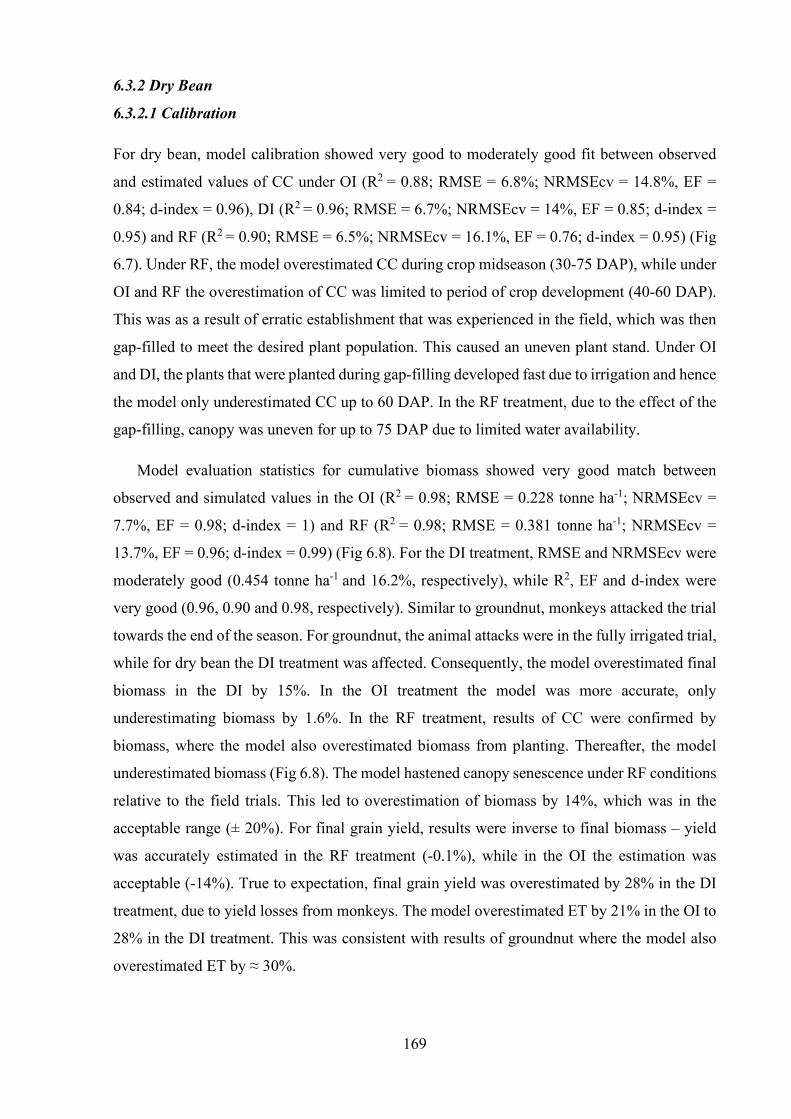
169
6.3.2 Dry Bean
6.3.2.1 Calibration
For dry bean, model calibration showed very good to moderately good fit between observed
and estimated values of CC under OI (R2 = 0.88; RMSE = 6.8%; NRMSEcv = 14.8%, EF =
0.84; d-index = 0.96), DI (R2 = 0.96; RMSE = 6.7%; NRMSEcv = 14%, EF = 0.85; d-index =
0.95) and RF (R2 = 0.90; RMSE = 6.5%; NRMSEcv = 16.1%, EF = 0.76; d-index = 0.95) (Fig
6.7). Under RF, the model overestimated CC during crop midseason (30-75 DAP), while under
OI and RF the overestimation of CC was limited to period of crop development (40-60 DAP).
This was as a result of erratic establishment that was experienced in the field, which was then
gap-filled to meet the desired plant population. This caused an uneven plant stand. Under OI
and DI, the plants that were planted during gap-filling developed fast due to irrigation and hence
the model only underestimated CC up to 60 DAP. In the RF treatment, due to the effect of the
gap-filling, canopy was uneven for up to 75 DAP due to limited water availability.
Model evaluation statistics for cumulative biomass showed very good match between
observed and simulated values in the OI (R2 = 0.98; RMSE = 0.228 tonne ha-1; NRMSEcv =
7.7%, EF = 0.98; d-index = 1) and RF (R2 = 0.98; RMSE = 0.381 tonne ha-1; NRMSEcv =
13.7%, EF = 0.96; d-index = 0.99) (Fig 6.8). For the DI treatment, RMSE and NRMSEcv were
moderately good (0.454 tonne ha-1 and 16.2%, respectively), while R2, EF and d-index were
very good (0.96, 0.90 and 0.98, respectively). Similar to groundnut, monkeys attacked the trial
towards the end of the season. For groundnut, the animal attacks were in the fully irrigated trial,
while for dry bean the DI treatment was affected. Consequently, the model overestimated final
biomass in the DI by 15%. In the OI treatment the model was more accurate, only
underestimating biomass by 1.6%. In the RF treatment, results of CC were confirmed by
biomass, where the model also overestimated biomass from planting. Thereafter, the model
underestimated biomass (Fig 6.8). The model hastened canopy senescence under RF conditions
relative to the field trials. This led to overestimation of biomass by 14%, which was in the
acceptable range (± 20%). For final grain yield, results were inverse to final biomass – yield
was accurately estimated in the RF treatment (-0.1%), while in the OI the estimation was
acceptable (-14%). True to expectation, final grain yield was overestimated by 28% in the DI
treatment, due to yield losses from monkeys. The model overestimated ET by 21% in the OI to
28% in the DI treatment. This was consistent with results of groundnut where the model also
overestimated ET by ≈ 30%.
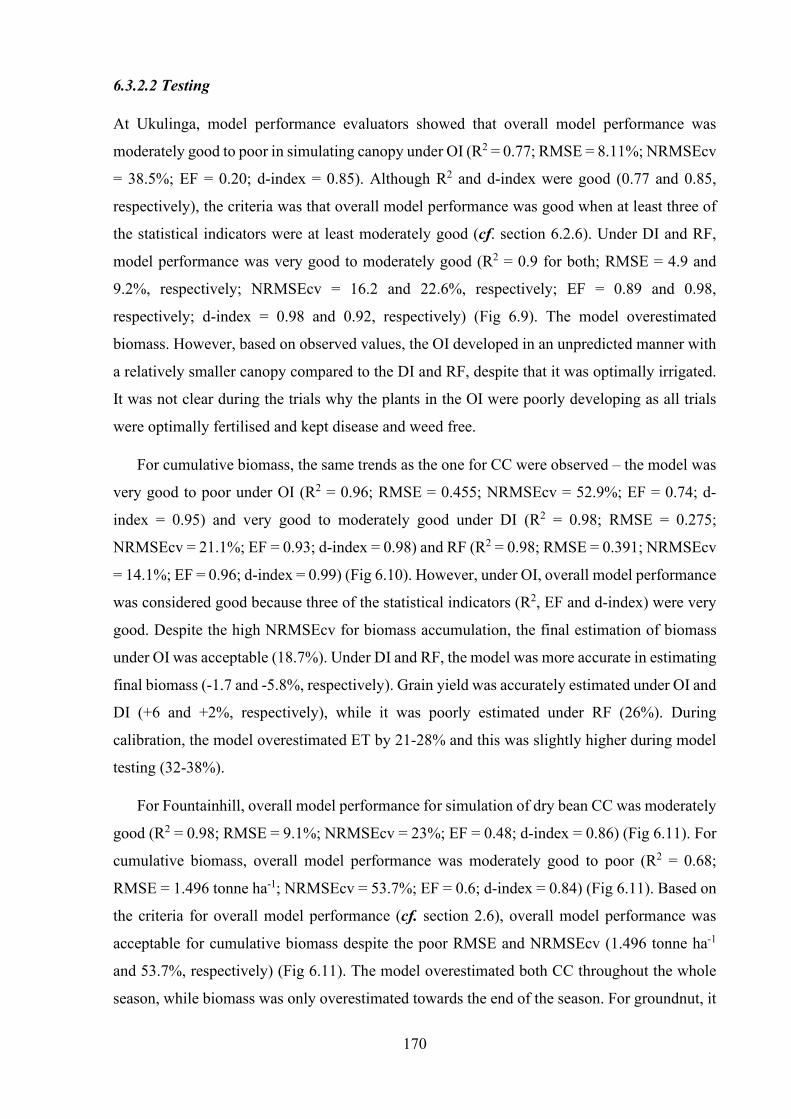
170
6.3.2.2 Testing
At Ukulinga, model performance evaluators showed that overall model performance was
moderately good to poor in simulating canopy under OI (R2 = 0.77; RMSE = 8.11%; NRMSEcv
= 38.5%; EF = 0.20; d-index = 0.85). Although R2 and d-index were good (0.77 and 0.85,
respectively), the criteria was that overall model performance was good when at least three of
the statistical indicators were at least moderately good (cf. section 6.2.6). Under DI and RF,
model performance was very good to moderately good (R2 = 0.9 for both; RMSE = 4.9 and
9.2%, respectively; NRMSEcv = 16.2 and 22.6%, respectively; EF = 0.89 and 0.98,
respectively; d-index = 0.98 and 0.92, respectively) (Fig 6.9). The model overestimated
biomass. However, based on observed values, the OI developed in an unpredicted manner with
a relatively smaller canopy compared to the DI and RF, despite that it was optimally irrigated.
It was not clear during the trials why the plants in the OI were poorly developing as all trials
were optimally fertilised and kept disease and weed free.
For cumulative biomass, the same trends as the one for CC were observed – the model was
very good to poor under OI (R2 = 0.96; RMSE = 0.455; NRMSEcv = 52.9%; EF = 0.74; d-
index = 0.95) and very good to moderately good under DI (R2 = 0.98; RMSE = 0.275;
NRMSEcv = 21.1%; EF = 0.93; d-index = 0.98) and RF (R2 = 0.98; RMSE = 0.391; NRMSEcv
= 14.1%; EF = 0.96; d-index = 0.99) (Fig 6.10). However, under OI, overall model performance
was considered good because three of the statistical indicators (R2, EF and d-index) were very
good. Despite the high NRMSEcv for biomass accumulation, the final estimation of biomass
under OI was acceptable (18.7%). Under DI and RF, the model was more accurate in estimating
final biomass (-1.7 and -5.8%, respectively). Grain yield was accurately estimated under OI and
DI (+6 and +2%, respectively), while it was poorly estimated under RF (26%). During
calibration, the model overestimated ET by 21-28% and this was slightly higher during model
testing (32-38%).
For Fountainhill, overall model performance for simulation of dry bean CC was moderately
good (R2 = 0.98; RMSE = 9.1%; NRMSEcv = 23%; EF = 0.48; d-index = 0.86) (Fig 6.11). For
cumulative biomass, overall model performance was moderately good to poor (R2 = 0.68;
RMSE = 1.496 tonne ha-1; NRMSEcv = 53.7%; EF = 0.6; d-index = 0.84) (Fig 6.11). Based on
the criteria for overall model performance (cf. section 2.6), overall model performance was
acceptable for cumulative biomass despite the poor RMSE and NRMSEcv (1.496 tonne ha-1
and 53.7%, respectively) (Fig 6.11). The model overestimated both CC throughout the whole
season, while biomass was only overestimated towards the end of the season. For groundnut, it

171
was observed that the model overestimated delay in crop establishment (cf. section 6.3.1.2).
For dry bean, the model simulated earlier establishment relative to the observed. This led to
overestimation of CC by the model throughout the season. This further highlights the issue of
sensitivity of different crops to initial soil water content, which is not factored into the model.
Grain yield was accurately estimated (+9%) and estimation of final ET was acceptable (+18%)
(Table 6.5).
For Umbumbulu, model performance for simulating CC and biomass of dry bean was
moderately good to poor (R2 = 0.92 and 0.98, respectively; RMSE = 11.9% and 0.101 tonne
ha-1, respectively; NRMSEcv = 71.2 and 30.1%, respectively; EF = -1.43 and 0.78 respectively;
d-index = 0.60 and 0.98, respectively) (Fig 6.12). For cumulative biomass, overall model
performance was acceptable despite poor NRMSEcv (30.1%). The model underestimated CC
throughout the season. Model output showed this was mostly due to canopy expansion stress
because of water stress. The model estimated an acceptable final biomass (+12.6%). The model
simulated no grain yield although grain yield of 0.285 tonne ha-1 was observed. Final ET was
overestimated by 27% (Table 6.5).
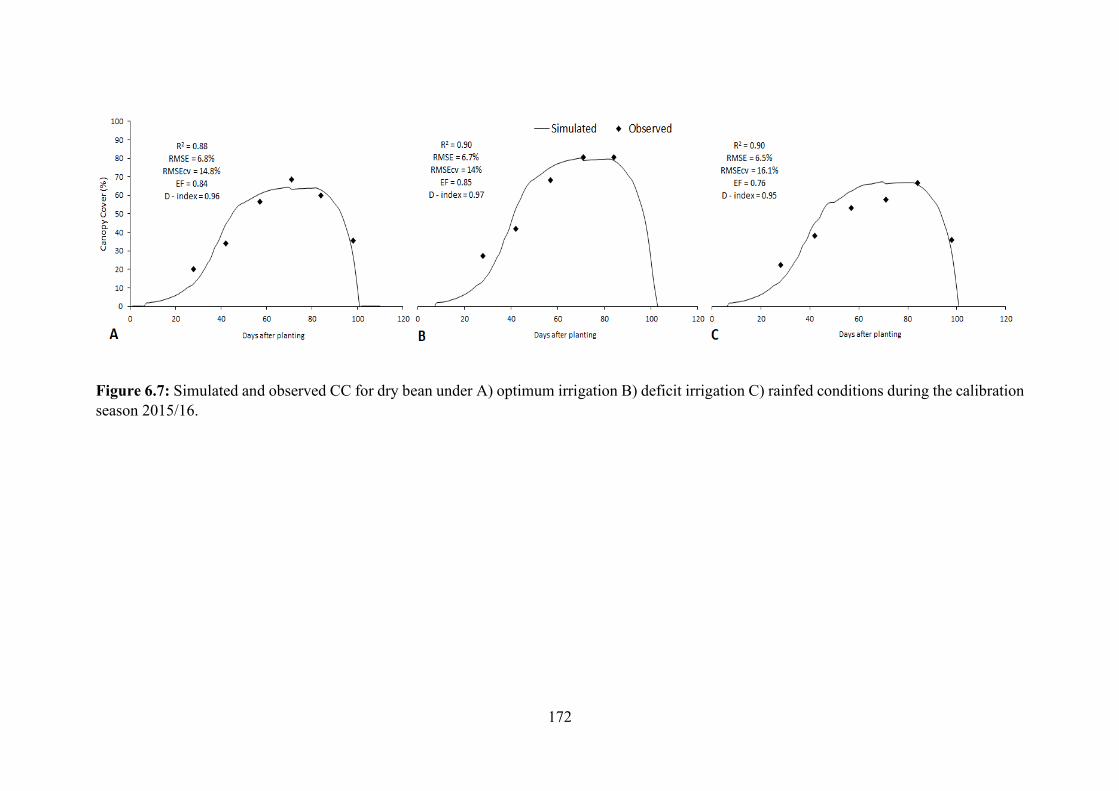
172
Figure 6.7: Simulated and observed CC for dry bean under A) optimum irrigation B) deficit irrigation C) rainfed conditions during the calibration season 2015/16.
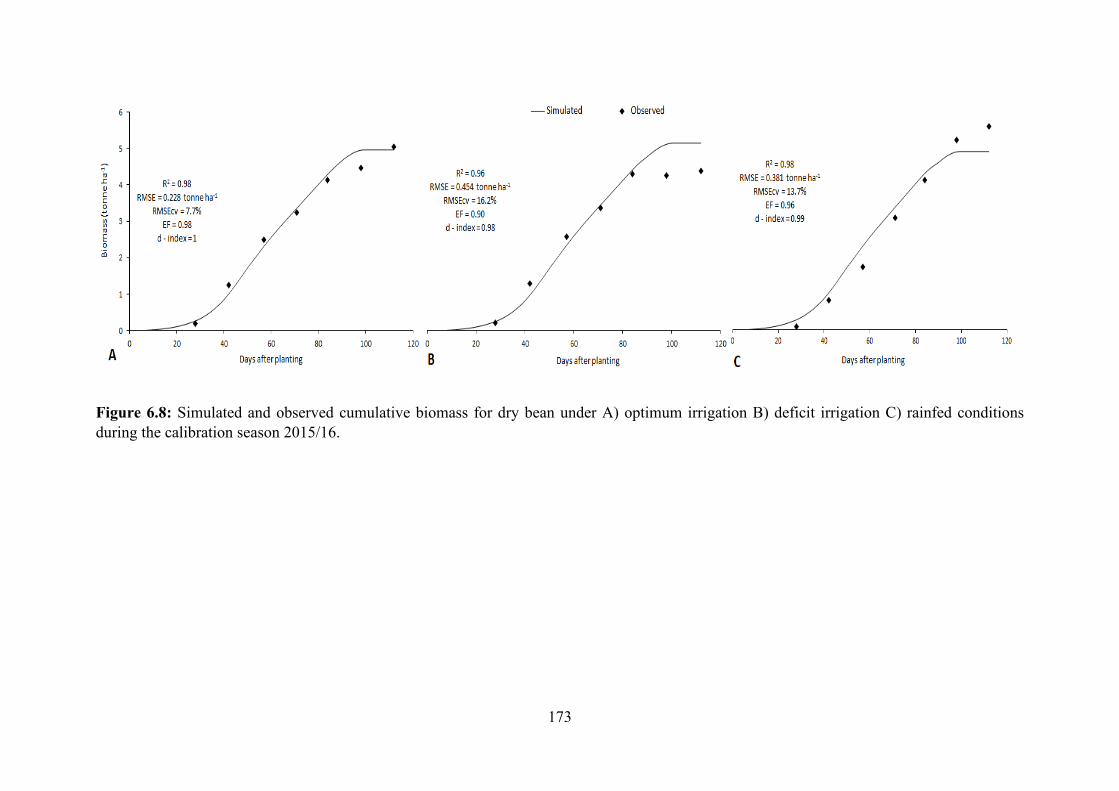
173
Figure 6.8: Simulated and observed cumulative biomass for dry bean under A) optimum irrigation B) deficit irrigation C) rainfed conditions during the calibration season 2015/16.
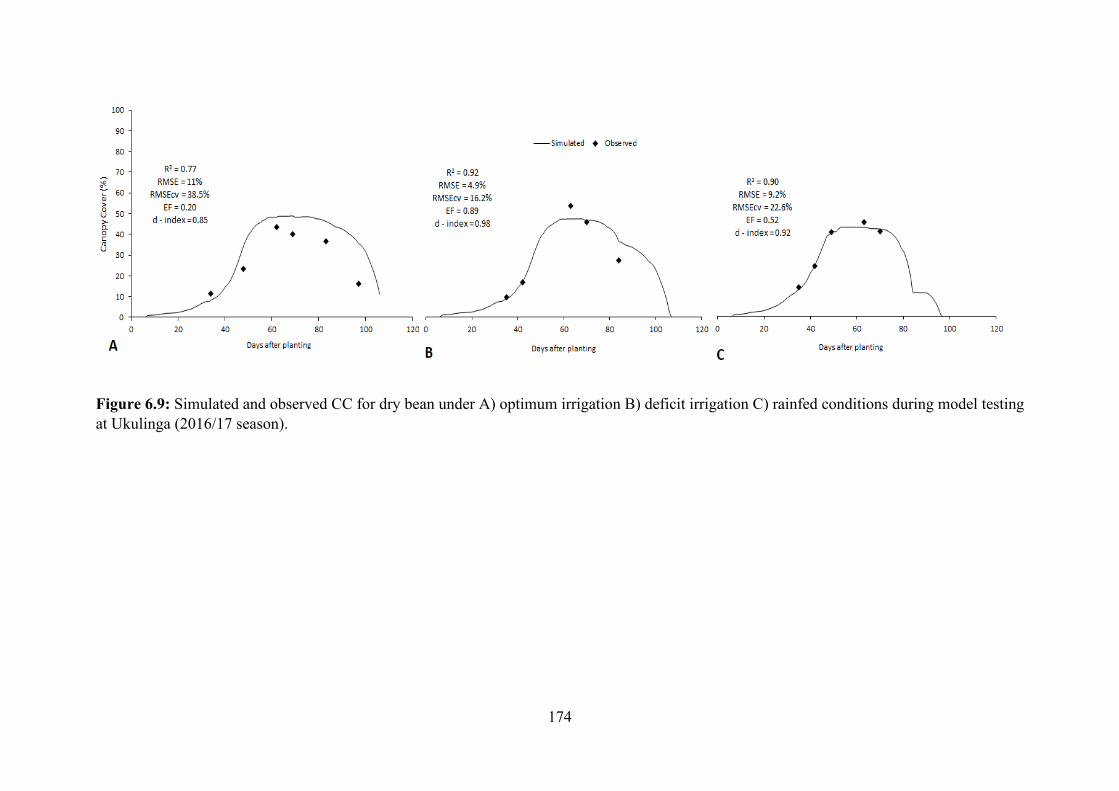
174
Figure 6.9: Simulated and observed CC for dry bean under A) optimum irrigation B) deficit irrigation C) rainfed conditions during model testing at Ukulinga (2016/17 season).
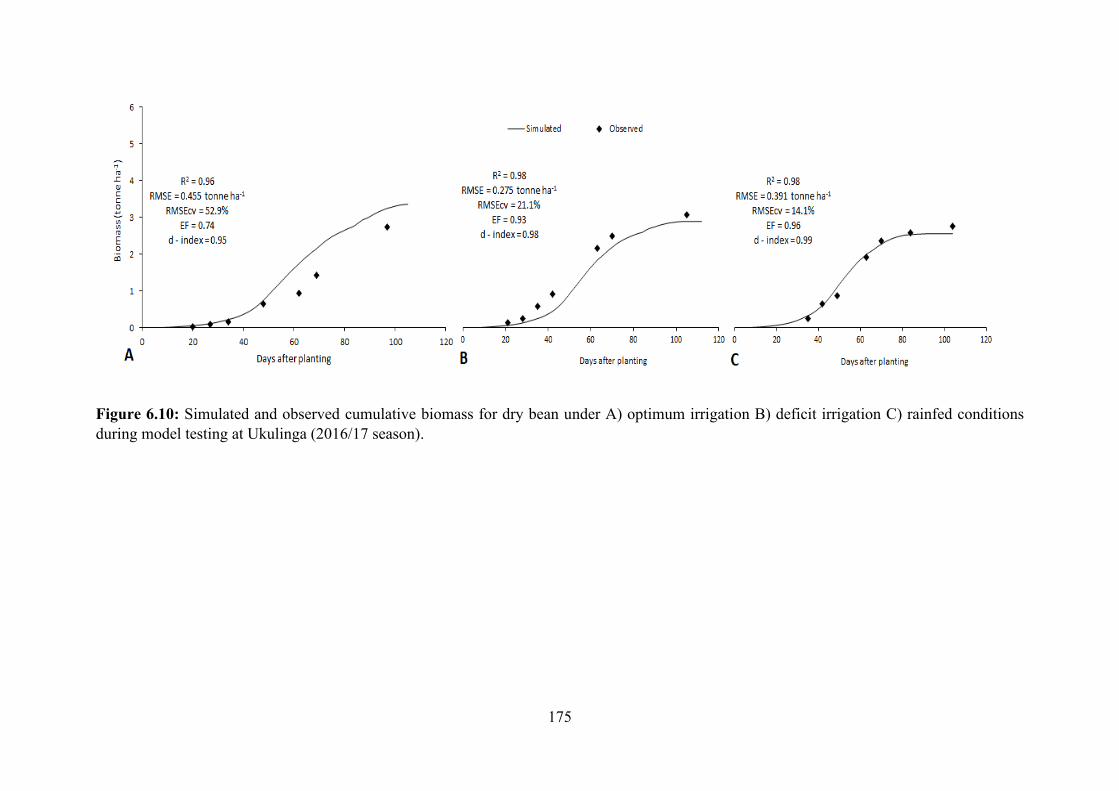
175
Figure 6.10: Simulated and observed cumulative biomass for dry bean under A) optimum irrigation B) deficit irrigation C) rainfed conditions during model testing at Ukulinga (2016/17 season).
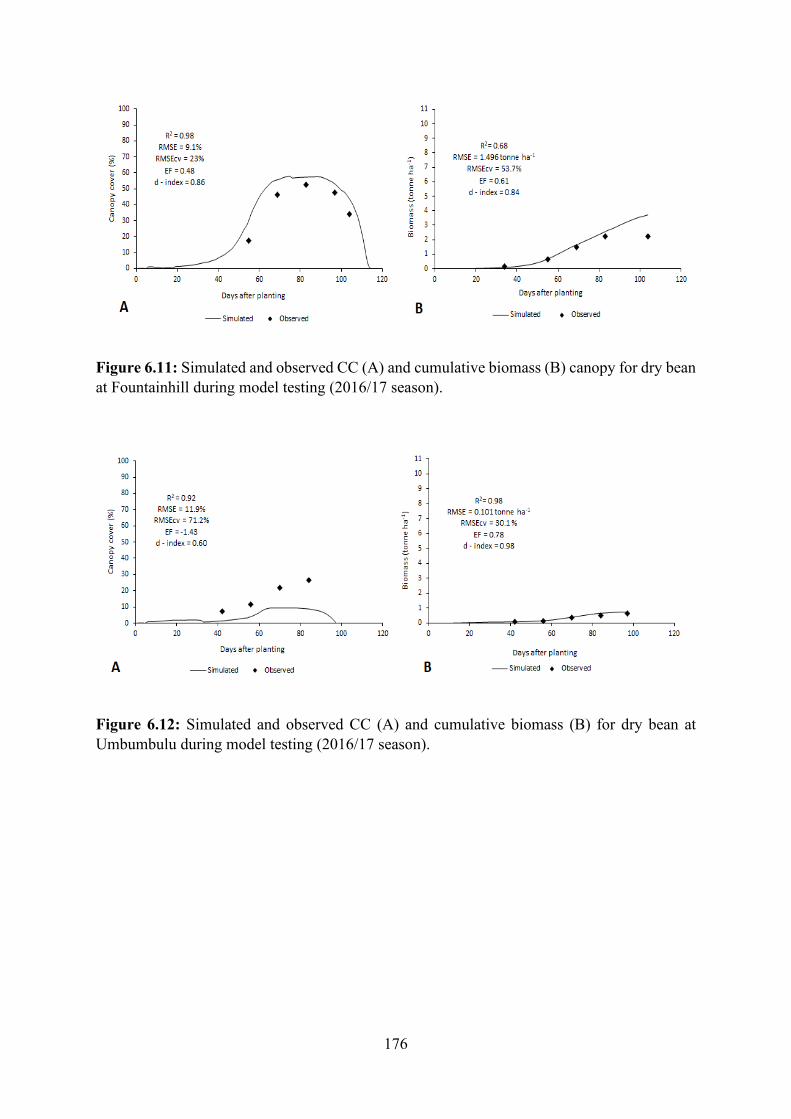
176
Figure 6.11: Simulated and observed CC (A) and cumulative biomass (B) canopy for dry bean at Fountainhill during model testing (2016/17 season).
Figure 6.12: Simulated and observed CC (A) and cumulative biomass (B) for dry bean at Umbumbulu during model testing (2016/17 season).
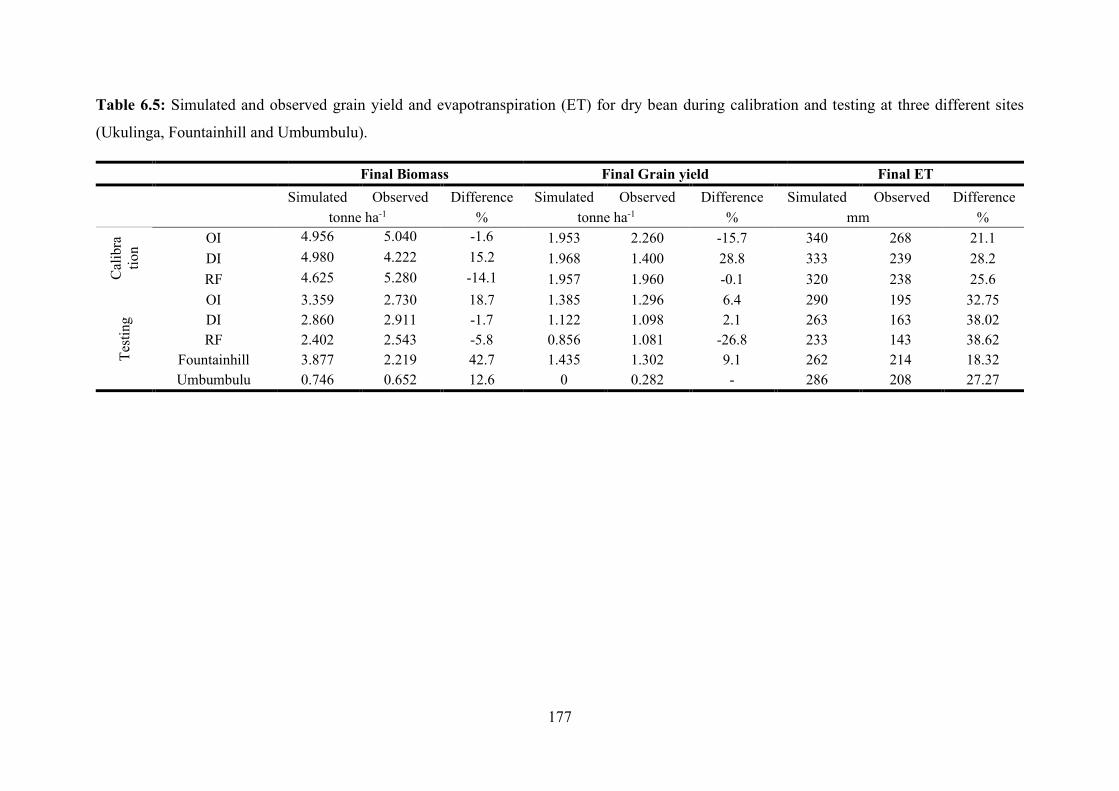
177
Table 6.5: Simulated and observed grain yield and evapotranspiration (ET) for dry bean during calibration and testing at three different sites
(Ukulinga, Fountainhill and Umbumbulu).
Final Biomass Final Grain yield Final ET
Simulated Observed Difference Simulated Observed Difference Simulated Observed Difference tonne ha-1 % tonne ha-1 % mm %
Cal
ibra
tion
OI 4.956 5.040 -1.6 1.953 2.260 -15.7 340 268 21.1 DI 4.980 4.222 15.2 1.968 1.400 28.8 333 239 28.2 RF 4.625 5.280 -14.1 1.957 1.960 -0.1 320 238 25.6
Test
ing
OI 3.359 2.730 18.7 1.385 1.296 6.4 290 195 32.75 DI 2.860 2.911 -1.7 1.122 1.098 2.1 263 163 38.02 RF 2.402 2.543 -5.8 0.856 1.081 -26.8 233 143 38.62
Fountainhill 3.877 2.219 42.7 1.435 1.302 9.1 262 214 18.32 Umbumbulu 0.746 0.652 12.6 0 0.282 - 286 208 27.27
178
6.4 Conclusions
During calibration, the model simulated CC and cumulative biomass well for both crops. The
model tended to underestimate CC of groundnut during maximum canopy cover. This was
attributed to leaf appearance rate and phyllochron. For groundnut, final biomass was
overestimated in the OI, while for dry bean, final biomass was overestimated in the DI. This
was due to monkey attacks towards the end of the season. For both crops, the model
overestimated ET. During model testing for groundnut, model performance was poor for CC
and cumulative biomass. The model overestimated CC and cumulative biomass for groundnut
across all the water regimes. This was mainly because of disturbances in our trials by monkeys
and wild pigs, which could not be factored into the model. Consequently, final biomass and
grain yield were overestimated. The model accurately estimated final ET. The model was
further tested for two environments (Umbumbulu and Fountainhill), where it simulated CC and
biomass well. At Umbumbulu, however, the model overestimated grain yield and ET. For dry
bean testing, the model performed well under DI and RF. For Fountainhill, overall model
performance for simulating CC and biomass was acceptable. Grain yield was accurately
simulated. For Umbumbulu, the model poorly simulated CC. Biomass simulation was
acceptable, while ET was overestimated. Overall, the model showed potential for simulating
yield and ET of groundnut and dry bean under semi-arid conditions. There is need to improve
model parameters for both dry bean and groundnut before the model can be applied for different
soils and climates.
References
ABEBE A, BRICK MA and KIRKBY RA (1998) Comparison of selection indices to identify productive
dry bean lines under diverse environmental conditions. F. Crop. Res. 58 15-23.
ABBERTON M (2010) Enhancing the role of legumes: potential and obstacles. Grassl. carbon
sequestration Manag. Policy Econ. 11 177.
ADEBOYE OB, SCHULTZ B, ADEKALU KO and PRASAD K (2017) Modelling of Response of the
Growth and Yield of Soybean to Full and Deficit Irrigation by Using AquaCrop. Irrig. Drain. 66 192-
205.
ACOSTA-GALLEGOS JA and ADAMS MW (1991) Plant traits and yield stability of dry bean
(Phaseolus vulgaris) cultivars under drought stress. J. Agric. Sci. 117 213-219.
179
ALLEN R, PEREIRA LS, RAES D and SMITH M (1998) Crop evapotranspiration: Guidelines for
computing crop requirements, Irrigation and Drainage Paper No. 56, FAO. Irrigation and Drainage
Paper No. 56, FAO.
ANDARZIAN B, BANNAYAN M, STEDUTO P, MAZRAEH H, BARATI ME, BARATI MA and
RAHNAMA A (2011) Validation and testing of the AquaCrop model under full and deficit irrigated
wheat production in Iran. Agric. Water Manag. 100 1-8.
ARAYA A, KISEKKA I and HOLMAN J (2016) Evaluating deficit irrigation management strategies
for grain sorghum using AquaCrop. Irrig. Sci. 34 465-481.
BAYANI A, TIWADE D, DONGRE A, DONGRE AP, PHATAK R and WATVE M (2016)
Assessment of crop damage by protected wild mammalian herbivores on the western boundary of
Tadoba-Andhari Tiger Reserve (TATR), Central India. PLoS One. 11(4) e0153854.
BHATIA VS, SINGH P, WANI SP, CHAUHAN GS, RAO AVRK, MISHRA AK and SRINIVAS K
(2008) Analysis of potential yields and yield gaps of rainfed soybean in India using CROPGRO-Soybean
model. Agric. For. Meteorol. 148 1252-1265. doi:10.1016/j.agrformet.2008.03.004
BOOTE KJ, JONES JW, HOOGENBOOM G, WILKERSON GG and JAGTAP SS (1989) PNUTGRO
v. 1.02. Peanut crop growth simulation model. Florida Agricultural Experiment Station Journal No.
8420, Agricultural Engineering Department and Agronomy Department, University of Florida,
Gainesville, Florida 32611, USA.
BOOTE KJ, JONES JW and PICKERING NB (1996) Potential uses and limitations of crop models.
Agron. J. 88 704-716.
CHIBARABADA T, MODI A and MABHAUDHI T (2017) Expounding the Value of Grain Legumes
in the Semi- and Arid Tropics. Sustainability 9, 60. doi:10.3390/su9010060.
CHIANU JN, NKONYA EM, MAIRURA FS, CHIANU JN and AKINNIFESI FK (2010) Biological
nitrogen fixation and socioeconomic factors for legume production in sub-Saharan Africa: a review.
Sustainable Agriculture Volume 2. Springer, Dordrecht.
CISSE M and DIALLO S (2007) Evaluating performance and yield stability of some groundnut (Arachis
hypogaea L.) varieties under irrigation in three agroecological zones of the Senegal River Valley. Adv.
Integr. Soil Fertil. Manag. Sub-Saharan Africa Challenges Oppor. 713-722.
180
CORBEELS M, CHIRAT G, MESSAD S and THIERFELDER C (2016) Performance and sensitivity
of the DSSAT crop growth model in simulating maize yield under conservation agriculture. Eur. J.
Agron. 76 41-53.
DONATELLI M, MAGAREY RD, BREGAGLIO S, WILLOCQUET L, WHISH JPM and SAVARY
S (2017) Modelling the impacts of pests and diseases on agricultural systems. Agric. Syst. 155 213-224.
DOORENBOS J and KASSAM AH (1979) FAO irrigation and drainage paper No. 33 “Yield response
to water.” Food Agric. Organ. United Nations (FAO), Rome.
DOURADO-NETO D, TERUEL DA, REICHARDT K, NIELSEN DR, FRIZZONE JA and BACCHI
OOS (1998) Principles of crop modeling and simulation: I. Uses of mathematical models in agricultural
science. Sci. Agric. 55 46-50.
FARAHANI HJ, IZZI G and OWEIS TY (2009) Parameterization and evaluation of the AquaCrop
model for full and deficit irrigated cotton. Agron. J. 101 469-476.
FOOD AND AGRICULTURE ORGANISATION (2015) AquaCrop new features and updates
Version 5.0.
GEERTS S and RAES D (2009) Deficit irrigation as an on-farm strategy to maximize crop water
productivity in dry areas. Agric. water Manag. 96 1275-1284.
HALILOU O, HISSENE HM, MICHELANGELI JAC, HAMIDOU F, SINCLAIR TR, SOLTANI A,
MAHAMANE S and VADEZ V (2016) Determination of coefficient defining leaf area development in
different genotypes, plant types and planting densities in peanut (Arachis hypogeae L.). F. Crop. Res.
199 42-51.
HENG LK, HSIAO T, EVETT S, HOWELL T and STEDUTO P (2009) Validating the FAO AquaCrop
model for irrigated and water deficient field maize. Agron. J. 101 488-498.
HSIAO TC, HENG L, STEDUTO P, ROJAS-LARA B, RAES D and FERERES E (2009) AquaCrop
– the FAO crop model to simulate yield response to water: III. Parameterization and testing for maize.
Agron. J. 101 448-459.
JAME YW and CUTFORTH HW (1996) Crop growth models for decision support systems. Can. J.
Plant Sci. 76 9-19.
JONES JW, ANTLE JM, BASSO B, BOOTE KJ, CONANT RT, FOSTER I, GODFRAY HCJ,
HERRERO M, HOWITT RE and JANSSEN S (2017). Brief history of agricultural systems modeling.
Agric. Syst. 155 240-254.
181
JONES JW, BOOTE KJ, HOOGENBOOM G, JAGTAP SS and WILKERSON GG (1989) SOYGRO
V5. 42, soybean crop growth simulation model. User’s guide. Florida Agric. Exp. Stn. J. 8304, 83.
JONES JW, HOOGENBOOM G, PORTER CH, BOOTE KJ, BATCHELOR WD, HUNT LA,
WILKENS PW, SINGH U, GIJSMAN AJ and RITCHIE JT (2003) The DSSAT cropping system model.
Eur. J. Agron. 18 235-265.
KARUNARATNE AS, AZAM-ALI SN, IZZI G and STEDUTO P (2011) Calibration and validation of
FAO-AquaCrop model for irrigated and water deficient bambara groundnut. Exp. Agric. 47 509-527.
KELLY JD, ADAMS MW and VARNER GV (1987) Yield stability of determinate and indeterminate
dry bean cultivars. TAG Theor. Appl. Genet. 74 516-521.
LIU D, LI L, ZOU D and LIU F (2009) Effect of waterlogging on growth and agronomic trait of different
peanut varieties. Zhongguo Shengtai Nongye Xuebao/Chinese J. Eco-Agriculture 17 968-973.
MABHAUDHI T, MODI AT and BELETSE YG (2014a) Parameterization and testing of AquaCrop for
a South African bambara groundnut landrace. Agron. J. 106 243-251.
MABHAUDHI T, MODI AT and BELETSE YG (2014b) Parameterisation and evaluation of the FAO-
AquaCrop model for a South African taro (Colocasia esculenta L. Schott) landrace. Agric. For.
Meteorol. 192 132-139.
MEKONTCHOU T, NGUEGUIM M and FOBASSO M (2006) Stability Analyse for Yield and Yield
Components of Selected Peanut Breeding Lines Arachis hypogaea L. in the North Province of
Cameroon. Tropicultura 24 90.
MODI AT (2007) Growth temperature and plant age influence on nutritional quality of Amaranthus
leaves and seed germination capacity. Water SA 33 369-376.
MUÑOZ-PEREA CG, ALLEN RG, WESTERMANN DT, WRIGHT JL and SINGH SP (2007) Water
use efficiency among dry bean landraces and cultivars in drought-stressed and non-stressed
environments. Euphytica 155 393-402. doi:10.1007/s10681-006-9340-z
NAWAZ MS, NAWAZ N, YOUSUF M, KHAN MA, MIRZA MY, MOHMAND AS, SHER MA and
ASIF MASOOD M (2009) Stability performance for pod yield in groundnut. Pakistan J. Agric. Res 22
116-119.
NEDUMARAN S, ABINAYA P, JYOSTHNAA P, SHRAAVYA B, RAO P and BANTILAN C (2015)
Grain Legumes Production, Consumption and Trade Trends in Developing Countries; Working Paper
Series No. 60.
182
PAREDES P and TORRES MO (2017) Parameterization of AquaCrop model for vining pea biomass
and yield predictions and assessing impacts of irrigation strategies considering various sowing dates.
Irrig. Sci. 35 27-41.
RAES D, STEDUTO P, HSIAO TC and FERERES E (2009) AquaCrop the FAO-crop model to simulate
yield response to water: Ii. Main algorithms and software description. Agron. J. 101 438-447.
RAUFF KO and BELLO R (2015) A review of crop growth simulation models as tools for agricultural
meteorology. Agric. Sci. 6 1098-1105.
ROBERTSON MJ, CARBERRY PS, HUTH NI, TURPIN JE, PROBERT ME, POULTON PL, BELL
M, WRIGHT GC, YEATES SJ and BRINSMEAD RB (2002) Simulation of growth and development
of diverse legume species in APSIM. Aust. J. Agric. Res. 53 429-446.
ROCKSTRÖM J (2003) Water for food and nature in drought-prone tropics: vapour shift in rain-fed
agriculture. Philos. Trans. R. Soc. London B Biol. Sci. 358 1997-2009.
SAHAY G and SARMA BK (2005) Yield stability of some groundnut (Arachis hypogea) genotypes in
Meghalaya. Indian J. Agric. Res. 39 221-224.
STEDUTO P, HSIAO TC, RAES D and FERERES E (2009) AquaCrop – The FAO crop model to
simulate yield response to water: I. Concepts and underlying principles. Agron. J. 101 426-437.
USDA-SCS (1967) Irrigation water requirements, Technical Release 21.
VANUYTRECHT E, RAES D, STEDUTO P, HSIAO TC, FERERES E, HENG LK, VILA MG and
MORENO PM (2014) AquaCrop: FAO’s crop water productivity and yield response model. Environ.
Model. Softw. 62 351-360.
VARA PRASAD PV, CRAUFURD PQ and SUMMERFIELD RJ (1999) Fruit number in relation to
pollen production and viability in groundnut exposed to short episodes of heat. Annals of Botany 84
381-386.
VARA PRASAD PV, BOOTE KJ, ALLEN LH and THOMAS JMG (2002) Effects of elevated
temperature and carbon dioxide on seed‐set and yield of kidney bean (Phaseolus vulgaris L.). Glob.
Chang. Biol. 8 710-721.
WILLMOTT CJ, ACKLESON SG, DAVIS RE, FEDDEMA JJ, KLINK KM, LEGATES DR,
O’DONNELL J and ROWE CM (1985) Statistics for the evaluation and comparison of models. J.
Geophys. Res. Ocean. 90 8995-9005.
183
CHAPTER 7
MODELLING BEST MANAGEMENT PRACTICES OF GROUNDNUT AND BAMBARA GROUNDNUT IN DIFFERENT BIO-CLIMATIC
REGIONS OF KWAZULU-NATAL TP Chibarabada, AT Modi and T Mabhaudhi
7.1 Introduction
Groundnut (Arachis hypogaea) and bambara groundnut (Vigna subterranea L.) are two
important grain legumes in Africa. They share the same ecological niche. Bambara groundnut
is indigenous to Africa and was widely cultivated during the 1800s and early 1900s. Since the
mid-1990s, bambara groundnut has since been replaced by groundnut (Hepper, 1963;
Mkandawire, 2007). Groundnut now occupies more land area than bambara groundnut in
cropping systems; this has relegated bambara groundnut to the status of neglected and
alternative crops (Azam-Ali, 2001). Climate variability and change as well as increased
frequency and intensity of drought are threatening agriculture in the sub-tropics (Rijsberman,
2006).
Mean precipitation in many subtropical regions is expected to decrease. This will be coupled
by an increase in average temperatures, which will affect crop production. This has given rise
to an interest in indigenous crops based on their resilience to harsh environmental conditions
(Azam-Ali, 2001; Mayes et al., 2011). Bambara groundnut is no exception to this. It has been
identified as a possible future crop because of its greater drought tolerance (Collinson, 1997;
Azam-Ali et al., 2001; Mabhaudhi and Modi, 2013; Vurayai et al., 2012), heat tolerance
(Berchie, 2012) and high-water use efficiency (WUE) (Mabhaudhi et al., 2013; Chibarabada et
al., 2015). This makes it an ideal grain legume for crop diversification.
Chibarabada (2018) evaluated genotype × environment performance of selected grain
legumes. It was observed that the grain legumes behaved differently under different
environments. It is, however, known that yield (Y) is influenced by the interaction between
genotype, environment and management practices (Tittonell and Giller, 2013). While
Chibarabada (2018) evaluated genotype and environment effects, the influence of management
practices remains not well-understood. Management practices such as planting date (Makanda
et al., 2009; Wilson, 2012; Hadebe et al., 2017), soil fertility (Ouédraogo et al., 2007; Zhang et
al., 2017) and irrigation (Mabhaudhi et al., 2013; Thomas et al., 2004) have been shown to have
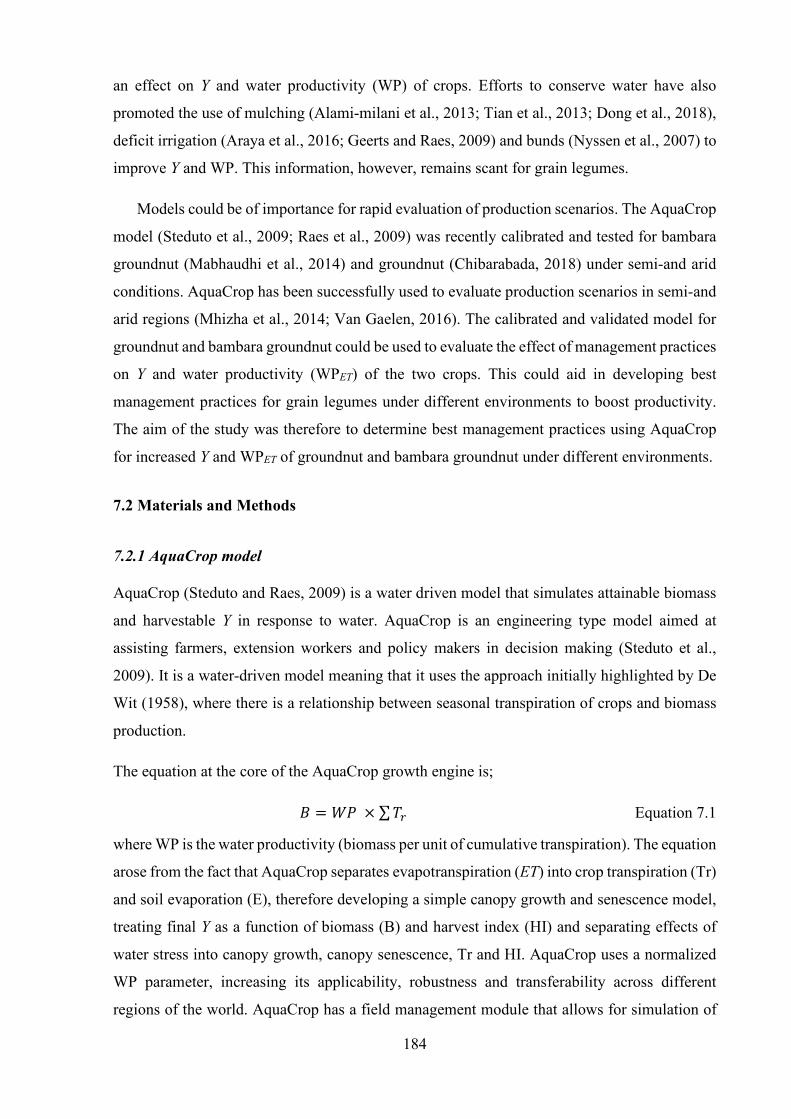
184
an effect on Y and water productivity (WP) of crops. Efforts to conserve water have also
promoted the use of mulching (Alami-milani et al., 2013; Tian et al., 2013; Dong et al., 2018),
deficit irrigation (Araya et al., 2016; Geerts and Raes, 2009) and bunds (Nyssen et al., 2007) to
improve Y and WP. This information, however, remains scant for grain legumes.
Models could be of importance for rapid evaluation of production scenarios. The AquaCrop
model (Steduto et al., 2009; Raes et al., 2009) was recently calibrated and tested for bambara
groundnut (Mabhaudhi et al., 2014) and groundnut (Chibarabada, 2018) under semi-and arid
conditions. AquaCrop has been successfully used to evaluate production scenarios in semi-and
arid regions (Mhizha et al., 2014; Van Gaelen, 2016). The calibrated and validated model for
groundnut and bambara groundnut could be used to evaluate the effect of management practices
on Y and water productivity (WPET) of the two crops. This could aid in developing best
management practices for grain legumes under different environments to boost productivity.
The aim of the study was therefore to determine best management practices using AquaCrop
for increased Y and WPET of groundnut and bambara groundnut under different environments.
7.2 Materials and Methods
7.2.1 AquaCrop model
AquaCrop (Steduto and Raes, 2009) is a water driven model that simulates attainable biomass
and harvestable Y in response to water. AquaCrop is an engineering type model aimed at
assisting farmers, extension workers and policy makers in decision making (Steduto et al.,
2009). It is a water-driven model meaning that it uses the approach initially highlighted by De
Wit (1958), where there is a relationship between seasonal transpiration of crops and biomass
production.
The equation at the core of the AquaCrop growth engine is;
𝐵𝐵 = 𝑁𝑁𝑁𝑁 × ∑𝐸𝐸𝑟𝑟 Equation 7.1
where WP is the water productivity (biomass per unit of cumulative transpiration). The equation
arose from the fact that AquaCrop separates evapotranspiration (ET) into crop transpiration (Tr)
and soil evaporation (E), therefore developing a simple canopy growth and senescence model,
treating final Y as a function of biomass (B) and harvest index (HI) and separating effects of
water stress into canopy growth, canopy senescence, Tr and HI. AquaCrop uses a normalized
WP parameter, increasing its applicability, robustness and transferability across different
regions of the world. AquaCrop has a field management module that allows for simulation of
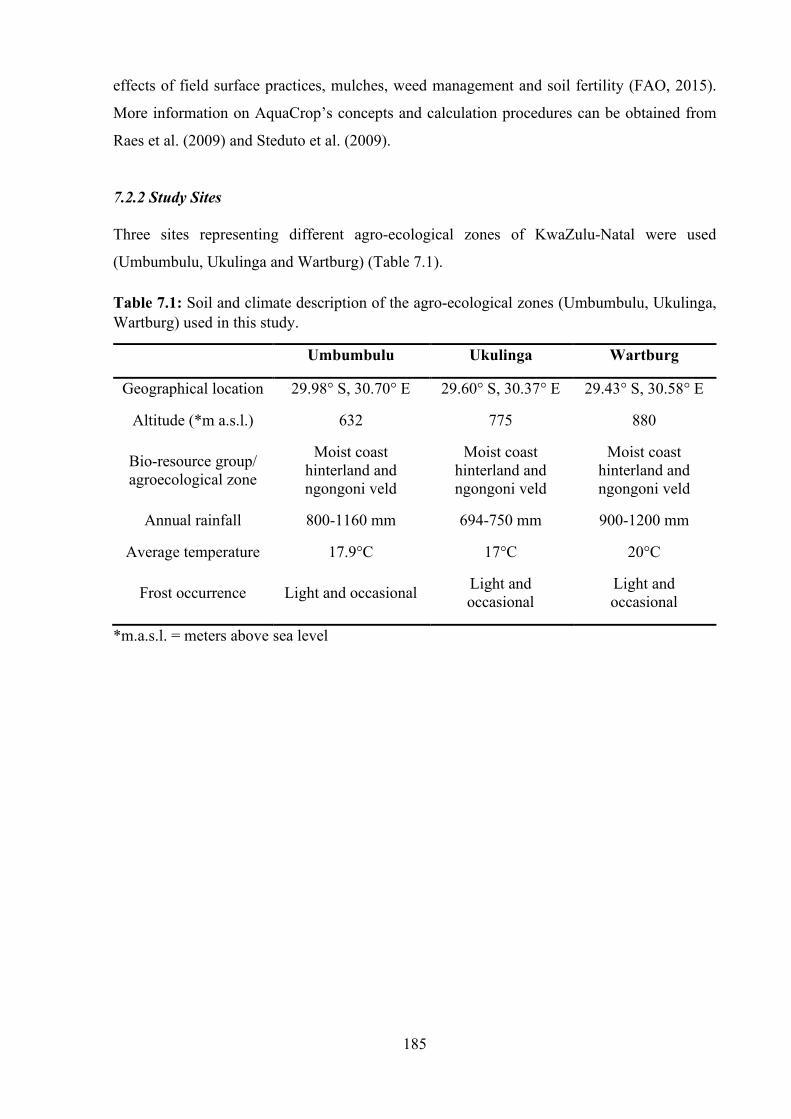
185
effects of field surface practices, mulches, weed management and soil fertility (FAO, 2015).
More information on AquaCrop’s concepts and calculation procedures can be obtained from
Raes et al. (2009) and Steduto et al. (2009).
7.2.2 Study Sites
Three sites representing different agro-ecological zones of KwaZulu-Natal were used
(Umbumbulu, Ukulinga and Wartburg) (Table 7.1).
Table 7.1: Soil and climate description of the agro-ecological zones (Umbumbulu, Ukulinga, Wartburg) used in this study.
Umbumbulu Ukulinga Wartburg
Geographical location 29.98° S, 30.70° E 29.60° S, 30.37° E 29.43° S, 30.58° E
Altitude (*m a.s.l.) 632 775 880
Bio-resource group/ agroecological zone
Moist coast hinterland and ngongoni veld
Moist coast hinterland and ngongoni veld
Moist coast hinterland and ngongoni veld
Annual rainfall 800-1160 mm 694-750 mm 900-1200 mm
Average temperature 17.9°C 17°C 20°C
Frost occurrence Light and occasional Light and occasional
Light and occasional
*m.a.s.l. = meters above sea level
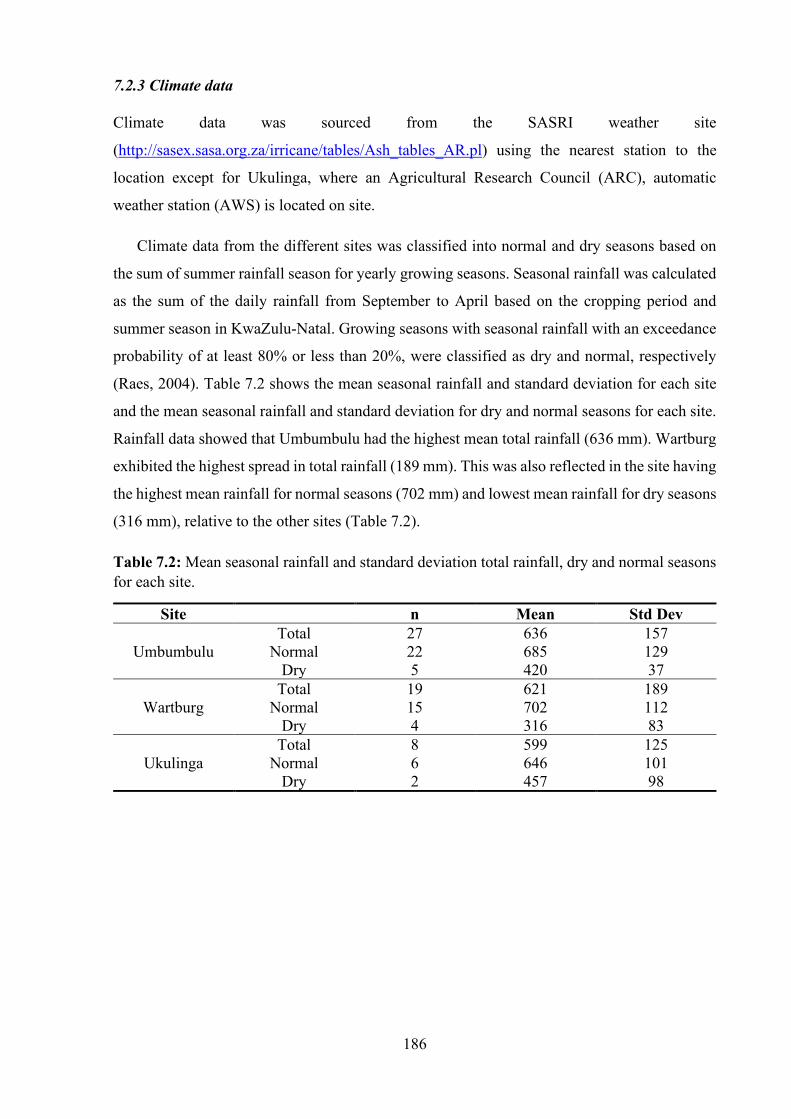
186
7.2.3 Climate data
Climate data was sourced from the SASRI weather site
(http://sasex.sasa.org.za/irricane/tables/Ash_tables_AR.pl) using the nearest station to the
location except for Ukulinga, where an Agricultural Research Council (ARC), automatic
weather station (AWS) is located on site.
Climate data from the different sites was classified into normal and dry seasons based on
the sum of summer rainfall season for yearly growing seasons. Seasonal rainfall was calculated
as the sum of the daily rainfall from September to April based on the cropping period and
summer season in KwaZulu-Natal. Growing seasons with seasonal rainfall with an exceedance
probability of at least 80% or less than 20%, were classified as dry and normal, respectively
(Raes, 2004). Table 7.2 shows the mean seasonal rainfall and standard deviation for each site
and the mean seasonal rainfall and standard deviation for dry and normal seasons for each site.
Rainfall data showed that Umbumbulu had the highest mean total rainfall (636 mm). Wartburg
exhibited the highest spread in total rainfall (189 mm). This was also reflected in the site having
the highest mean rainfall for normal seasons (702 mm) and lowest mean rainfall for dry seasons
(316 mm), relative to the other sites (Table 7.2).
Table 7.2: Mean seasonal rainfall and standard deviation total rainfall, dry and normal seasons for each site.
Site n Mean Std Dev
Umbumbulu Total 27 636 157
Normal 22 685 129 Dry 5 420 37
Wartburg Total 19 621 189
Normal 15 702 112 Dry 4 316 83
Ukulinga Total 8 599 125
Normal 6 646 101 Dry 2 457 98
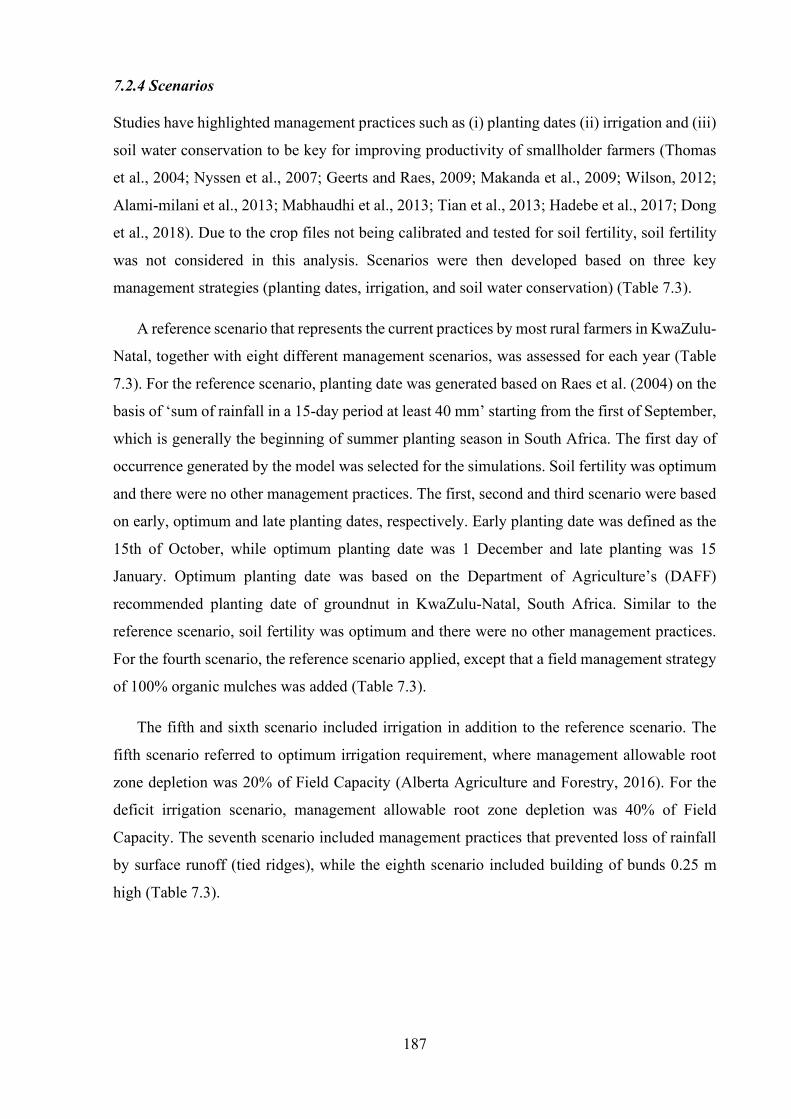
187
7.2.4 Scenarios
Studies have highlighted management practices such as (i) planting dates (ii) irrigation and (iii)
soil water conservation to be key for improving productivity of smallholder farmers (Thomas
et al., 2004; Nyssen et al., 2007; Geerts and Raes, 2009; Makanda et al., 2009; Wilson, 2012;
Alami-milani et al., 2013; Mabhaudhi et al., 2013; Tian et al., 2013; Hadebe et al., 2017; Dong
et al., 2018). Due to the crop files not being calibrated and tested for soil fertility, soil fertility
was not considered in this analysis. Scenarios were then developed based on three key
management strategies (planting dates, irrigation, and soil water conservation) (Table 7.3).
A reference scenario that represents the current practices by most rural farmers in KwaZulu-
Natal, together with eight different management scenarios, was assessed for each year (Table
7.3). For the reference scenario, planting date was generated based on Raes et al. (2004) on the
basis of ‘sum of rainfall in a 15-day period at least 40 mm’ starting from the first of September,
which is generally the beginning of summer planting season in South Africa. The first day of
occurrence generated by the model was selected for the simulations. Soil fertility was optimum
and there were no other management practices. The first, second and third scenario were based
on early, optimum and late planting dates, respectively. Early planting date was defined as the
15th of October, while optimum planting date was 1 December and late planting was 15
January. Optimum planting date was based on the Department of Agriculture’s (DAFF)
recommended planting date of groundnut in KwaZulu-Natal, South Africa. Similar to the
reference scenario, soil fertility was optimum and there were no other management practices.
For the fourth scenario, the reference scenario applied, except that a field management strategy
of 100% organic mulches was added (Table 7.3).
The fifth and sixth scenario included irrigation in addition to the reference scenario. The
fifth scenario referred to optimum irrigation requirement, where management allowable root
zone depletion was 20% of Field Capacity (Alberta Agriculture and Forestry, 2016). For the
deficit irrigation scenario, management allowable root zone depletion was 40% of Field
Capacity. The seventh scenario included management practices that prevented loss of rainfall
by surface runoff (tied ridges), while the eighth scenario included building of bunds 0.25 m
high (Table 7.3).
188
Table 7.3: Scenarios used for the simulation of groundnut and bambara groundnut Y and WPET.
Scenario Management
Practice Reference 1 2 3 4 5 6 7 8
Planting date Generated 15 October 1 December 15 January Generated Generated Generated Generated Generated
Irrigation nc nc nc nc nc Optimum-irrigation
Deficit irrigation nc nc
Soil fertility Non-limiting Non-limiting
Non-limiting
Non- limiting
Non- limiting
Non- limiting
Non- limiting
Non- limiting
Non- limiting
Mulch n/a n/a n/a n/a 100% cover n/a n/a n/a n/a
Bunds n/a n/a n/a n/a n/a n/a n/a n/a 0.25 m high
Tied ridges n/a n/a n/a n/a n/a n/a n/a yes n/a

189
7.2.5 Simulation procedure
AquaCrop Version 5.0 (http://www.fao.org/nr/water/aquacrop.html) was used. Crop files
(.CRO) were obtained from previously calibrated and tested crop files. The Bambara Red
Landrace crop file (RedbambaraGDD.Cro) was used to simulate Y of bambara groundnut
(Mabhaudhi et al., 2014). The groundnut crop file (GroundnutGDD.Cro) was calibrated for a
South African cultivar (Kwarts) during 2015/16 season and tested during 2016/17 season
(Chibarabada, 2018). Simulations were run in thermal time (growing degree days). For both
crops, plant density was 88 889 plants hectare-1 across the different sites.
To create a climate file (.CLI), the AquaCrop model requires daily maximum (Tmax) and
minimum (Tmin) air temperatures (.TMP file), FAO Penman-Monteith daily reference crop
evapotranspiration (.ETO), daily rainfall (.PLU) and mean annual carbon dioxide (CO2)
concentration. Climate files were created based on historical observed climate. Management
files (.IRR and .Man) were created for each scenario (c.f section 7.2.4). Soil files were created
using measured soil characteristics for the specific sites (Table 7.4) Due to absence of
observations of initial soil water content at the time of sowing the initial conditions file (.SW0),
the simulation period was set to start on the 1st of August every year. Soil water content was
assumed to be at permanent wilting point as August follows the winter season that is dry with
no rain. The simulation period was therefore not linked with the growing cycle.
Table 7.4: Soil parameters for each study site (Ukulinga, Wartburg and Umbumbulu) used for the AquaCrop soil file
Site Horizon Description Thickness aSat bFC cPWP dKsat eTAW
(m) ––––(% Vol) ––– (mm day-1) (mm)
Ukulinga 1 Clay loam 0.40 48 40 21 25 78.4 Wartburg 1 Sand 2.0 36 13 6 3000 140
Umbumbulu 1 Clay loam 0.40 46 35 17 125 72 2 Clay 0.60 50 39 21 35 108

190
7.2.6 Data Analyses
Model outputs were used for data analyses. The Y and WPET response to eight different
management practices was analysed making a distinction between dry and normal growing
seasons for each site. The effectiveness of each agricultural management practice was assessed
by means of the Y and WPET response given by:
[Y/WPETof management scenario – Y/WPET of reference scenarioY/WP of reference scenario
] × 100% Equation 7.2
where;
Y/WPET of management scenario is mean Y or water productivity (WPET) under different
management scenarios and Y/WPET of reference scenario is mean Y or water productivity WPET
under the reference scenario.
Response values were expressed in % as the relative increase (positive response values) or
decrease (negative response values) of the average Y and WPET for certain environmental
conditions due to a certain management strategy in comparison to the reference management.
Results that showed zero grain Y, hence failure to harvest were analysed separately. Additional
frequency analysis of failure to harvest seasons for every management practice was conducted.
7.3 Results and Discussion
7.3.1 Groundnut
Results from Umbumbulu showed that early planting decreased both Y and WPET during normal
and wet seasons. This effect was more pronounced during the dry seasons (Figure 7.1). In
contrast to Umbumbulu, early planting was greatly beneficial at Wartburg especially during dry
seasons (Y increased by 35% while WPET increased by 20%) (Figure 7.2). Results from
Ukulinga echoed those from Umbumbulu – early planting decreased Y and WPET and this was
more marked during dry seasons (Y and WPET decreased by ≈ 10%) (Figure 7.2). Interestingly,
recommended planting date showed different effects across the three sites. At Umbumbulu,
recommended planting date of groundnut did not increase Y, but increased WPET (Figure 7.1).
At Wartburg, recommended planting date increased Y by ≈ 30% during dry seasons (Figure
7.2). At Ukulinga, recommended planting date improved Y and WPET relative to the reference
period (Figure 7.3). Several studies observed late planting to decrease Y of plants (Sinefu, 2011;
Hadebe et al., 2017; Chibarabada, 2018). This was true for Ukulinga during dry seasons (Y and

191
WPET decreased by up to 20%). At Umbumbulu and Wartburg, late planting had a positive
effect on both Y and WPET (WPET increased by 60%).
Mulching is an important practice for integrated soil management. It is associated with soil
water conservation, which is beneficial in semi-and tropics where rainfall is low and water is
one of the major limiting factors to high Y (Erenstein, 2003). This study confirmed the benefits
of mulching as Y and WPET improved by up to 50% across the three sites. Mulching was more
effective under dry seasons compared to normal seasons, further confirming its role in soil water
conservation (Fig 7.1, 7.2 and 7.3). There have been several debates around the impact of
irrigation to increase crop Y in the semi-and arid tropics. The study confirms findings by other
studies that irrigation significantly increases Y, but has negative implications on WPET (Oweis,
1997; Kar et al., 2006; Geerts and Raes, 2009; Borivoj et al., 2012). Despite Y increasing by up
to (50%), WPET decreased due to optimum irrigation (Fig 7.1, 7.2 and 7.3). At Ukulinga, WPET
decreased by ≈ 15% at Ukulinga (Fig 7.3). The semi-and arid tropics are also affected by water
scarcity, hence strategies to increase should consider both Y and WPET improvement. Strategies
such as deficit irrigation have been recommended to improve WPET with minimum Y trade-offs.
This was confirmed by results from all sites – deficit irrigation improved Y and WPET by up to
40 and 15%, respectively. An exception, however, was at Ukulinga for the dry seasons, where
deficit irrigation increased Y by 9%, but decreased WPET by ≈ 2% (Fig 7.3).
AquaCrop allows for simulation of tied ridges that prevent runoff. In addition, AquaCrop
simulates the effect of soil bunds that not only prevent surface runoff, but also store excess
water between the bunds (FAO, 2015). This study explored these scenarios across the different
seasons. A positive response across all the sites and seasons was observed for tied ridges and
soil bunds (Fig 7.1, 7.2 and 7.3). These practices were more beneficial during the dry seasons.
At Umbumbulu and Ukulinga, tied-ridges and closed-end furrows showed potential to increase
Y and WPET by up to 30 and 40%, respectively. At Fountainhill, increases in Y and WPET were
less than 3% implying that the soil characteristics may not be suitable for tied ridges. For the
dry seasons, soil bunds were more effective (Y increased by 23% while WPET increased by
13%) (Fig 7.2).
Farmers in rural areas depend on annual grain Y for food and livelihood. Any crop failures
have significant effects on their livelihood. The study went further to analyse the number of
seasons that there was no Y for each scenario. This is to guide farmers in making decisions that
minimize risk of crop failures. While optimum irrigation showed decrease in WPET, it also
showed no risk of harvest failure across all sites – an attribute that may be attractive for

192
continuous grain. For the other scenarios, Umbumbulu and Ukulinga were susceptible to Y
failures despite it being a normal year or dry year (Figure 7.4). There were more seasons of
harvest failure at Ukulinga during the dry seasons for the reference scenario. Early planting
showed much risk at Umbumbulu during the dry seasons and at Ukulinga during normal
seasons. Recommended planting date, mulching and deficit irrigation showed less risk across
all the sites and seasons (Figure 7.4). Despite tied ridges and soil bunds showing potential to
increase Y and WPET, there may be seasons with zero Y (Figure 7.4).

193
Figure 7.1: Change in Y (y-axis) and WPET (x-axis) of groundnut at Umbumbulu during normal and dry seasons under eight different scenarios. Points in the top – left quadrant represent increase in Y and decrease in WPET, points in the top-right quadrant represent increase in both Y and WPET, points in the bottom – left quadrant represent decrease in both Y and WPET and points in the bottom right quadrant represent increase in WPET and decrease in Y. Coordinate 0:0 represents the reference scenario, ○ = Scenario 1, □ = scenario 2, ⁎ = scenario 3, ∆ = scenario 4, ● = scenario 5, ▲= scenario 6, ■ = scenario 7, ♦ = scenario 8.

194
Figure 7.2: Change in Y (y-axis) and WPET (x-axis) of groundnut at Wartburg during normal and dry seasons under eight different scenarios. Points in the top – left quadrant represent increase in Y and decrease in WPET, points in the top-right quadrant represent increase in both Y and WPET, points in the bottom – left quadrant represent decrease in both Y and WPET and points in the bottom right quadrant represent increase in WPET and decrease in Y. Coordinate 0:0 represents the reference scenario, ○ = Scenario 1, □ = scenario 2, ⁎ = scenario 3, ∆ = scenario 4, ● = scenario 5, ▲= scenario 6, ■ = scenario 7, ♦ = scenario 8.
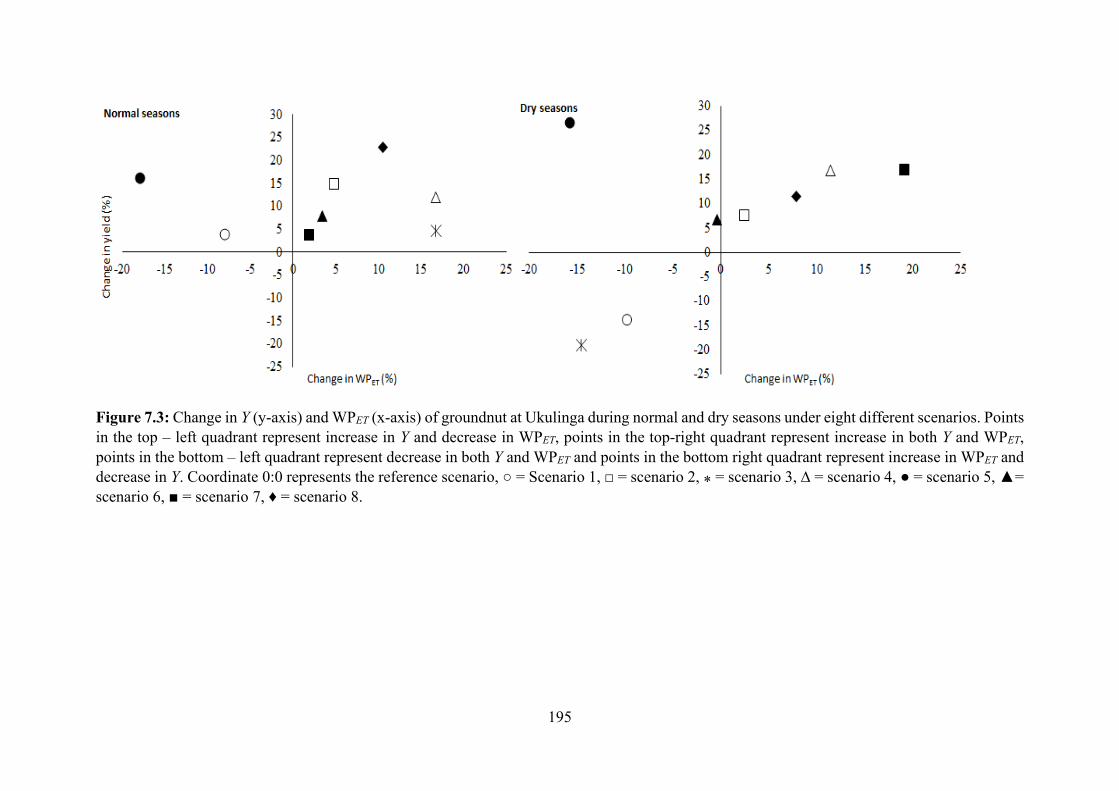
195
Figure 7.3: Change in Y (y-axis) and WPET (x-axis) of groundnut at Ukulinga during normal and dry seasons under eight different scenarios. Points in the top – left quadrant represent increase in Y and decrease in WPET, points in the top-right quadrant represent increase in both Y and WPET, points in the bottom – left quadrant represent decrease in both Y and WPET and points in the bottom right quadrant represent increase in WPET and decrease in Y. Coordinate 0:0 represents the reference scenario, ○ = Scenario 1, □ = scenario 2, ⁎ = scenario 3, ∆ = scenario 4, ● = scenario 5, ▲= scenario 6, ■ = scenario 7, ♦ = scenario 8.
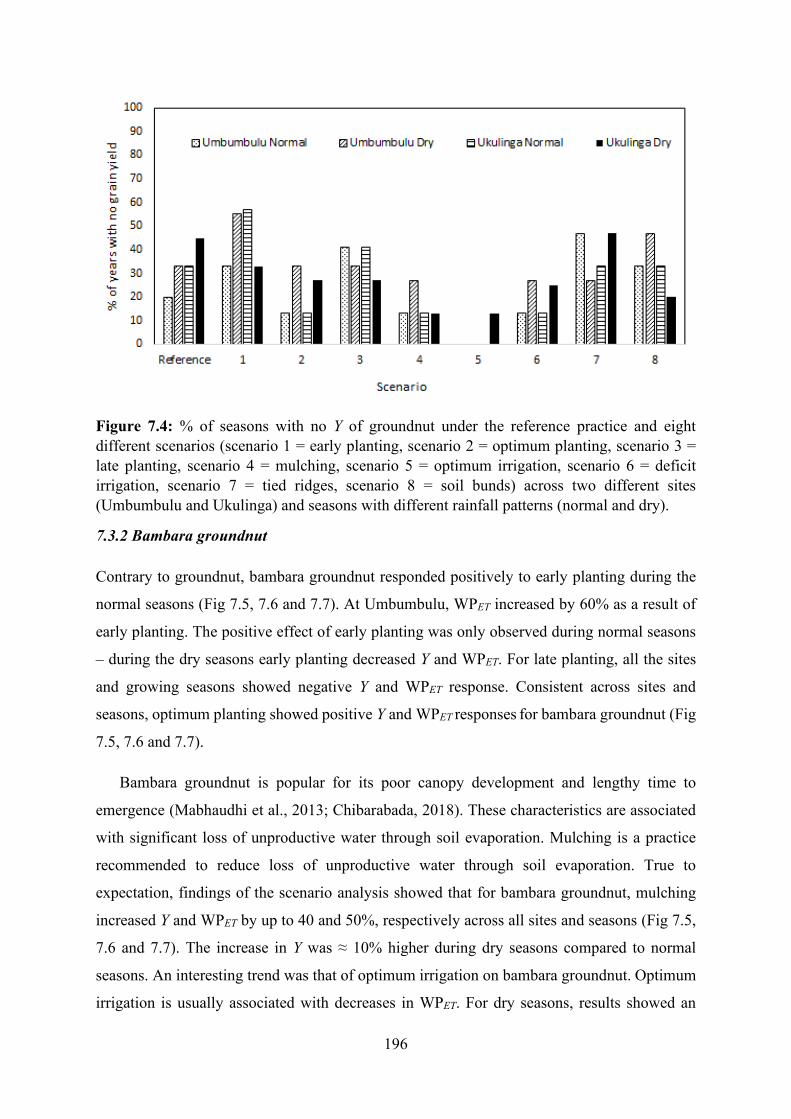
196
Figure 7.4: % of seasons with no Y of groundnut under the reference practice and eight different scenarios (scenario 1 = early planting, scenario 2 = optimum planting, scenario 3 = late planting, scenario 4 = mulching, scenario 5 = optimum irrigation, scenario 6 = deficit irrigation, scenario 7 = tied ridges, scenario 8 = soil bunds) across two different sites (Umbumbulu and Ukulinga) and seasons with different rainfall patterns (normal and dry).
7.3.2 Bambara groundnut
Contrary to groundnut, bambara groundnut responded positively to early planting during the
normal seasons (Fig 7.5, 7.6 and 7.7). At Umbumbulu, WPET increased by 60% as a result of
early planting. The positive effect of early planting was only observed during normal seasons
– during the dry seasons early planting decreased Y and WPET. For late planting, all the sites
and growing seasons showed negative Y and WPET response. Consistent across sites and
seasons, optimum planting showed positive Y and WPET responses for bambara groundnut (Fig
7.5, 7.6 and 7.7).
Bambara groundnut is popular for its poor canopy development and lengthy time to
emergence (Mabhaudhi et al., 2013; Chibarabada, 2018). These characteristics are associated
with significant loss of unproductive water through soil evaporation. Mulching is a practice
recommended to reduce loss of unproductive water through soil evaporation. True to
expectation, findings of the scenario analysis showed that for bambara groundnut, mulching
increased Y and WPET by up to 40 and 50%, respectively across all sites and seasons (Fig 7.5,
7.6 and 7.7). The increase in Y was ≈ 10% higher during dry seasons compared to normal
seasons. An interesting trend was that of optimum irrigation on bambara groundnut. Optimum
irrigation is usually associated with decreases in WPET. For dry seasons, results showed an

197
anomaly – Y was increased by 80% and WPET also increased by 10 and 40%. For normal
seasons optimum irrigation increased Y by ≈ 40% and decreased WPET by ≈ 30%. Similar to
groundnut, deficit irrigation increased Y and WPET across all sites seasons (Fig 7.5, 7.6 and
7.7). The highest benefits of deficit irrigation were observed during dry seasons relative to
normal seasons. With respect to sites, Umbumbulu had ≈ 50% more Y and WPET improvements
compared to the other sites with respect to both deficit and optimum irrigation (Fig 7.5).
For groundnut, tied ridges increased Y and WPET by up to 30 and 40%, respectively. This
was not the case for bambara groundnut. Tied ridges did increase Y, but this was by ≈ 5% across
all sites and seasons (Fig 7.5, 7.6 and 7.7). Soil bunds were more beneficial compared to tied
ridges. At all the sites, soil bunds improved Y and WPET by ≈ 20 and 15%, respectively during
the dry seasons. During normal seasons, Y and WPET by was improved by ≈ 50% of the dry
seasons improvement (Fig 7.5, 7.6 and 7.7).
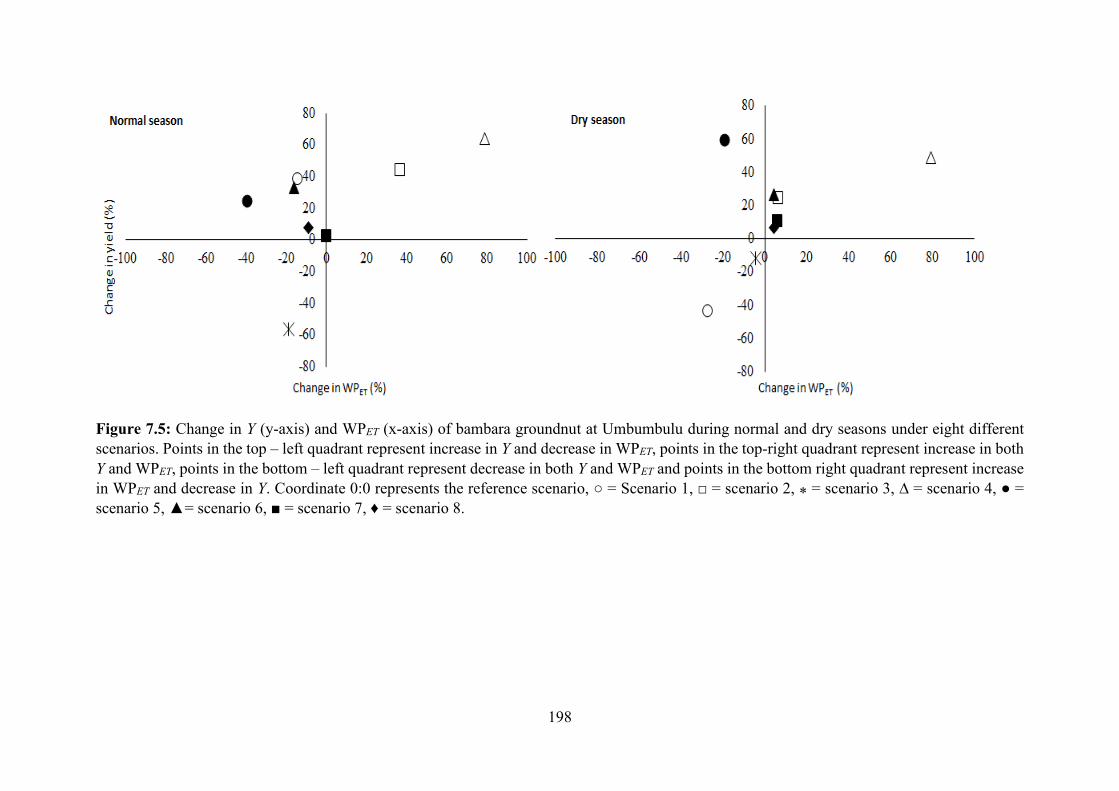
198
Figure 7.5: Change in Y (y-axis) and WPET (x-axis) of bambara groundnut at Umbumbulu during normal and dry seasons under eight different scenarios. Points in the top – left quadrant represent increase in Y and decrease in WPET, points in the top-right quadrant represent increase in both Y and WPET, points in the bottom – left quadrant represent decrease in both Y and WPET and points in the bottom right quadrant represent increase in WPET and decrease in Y. Coordinate 0:0 represents the reference scenario, ○ = Scenario 1, □ = scenario 2, ⁎ = scenario 3, ∆ = scenario 4, ● = scenario 5, ▲= scenario 6, ■ = scenario 7, ♦ = scenario 8.
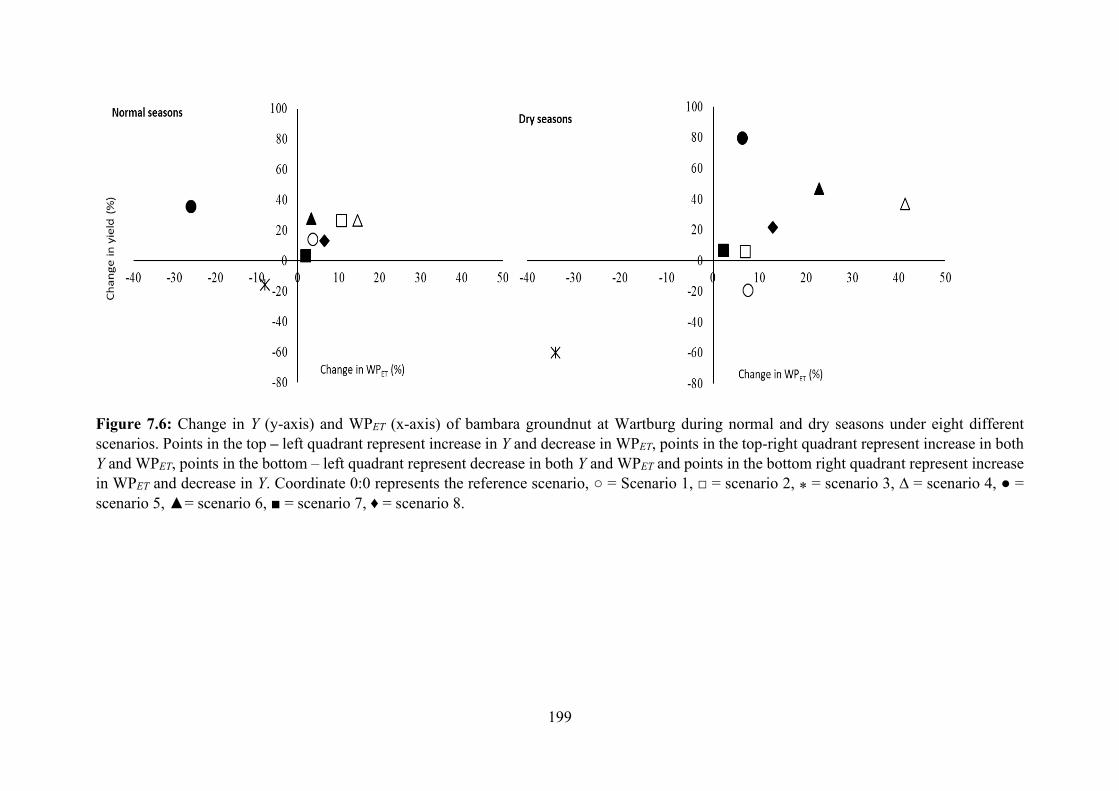
199
Figure 7.6: Change in Y (y-axis) and WPET (x-axis) of bambara groundnut at Wartburg during normal and dry seasons under eight different scenarios. Points in the top – left quadrant represent increase in Y and decrease in WPET, points in the top-right quadrant represent increase in both Y and WPET, points in the bottom – left quadrant represent decrease in both Y and WPET and points in the bottom right quadrant represent increase in WPET and decrease in Y. Coordinate 0:0 represents the reference scenario, ○ = Scenario 1, □ = scenario 2, ⁎ = scenario 3, ∆ = scenario 4, ● = scenario 5, ▲= scenario 6, ■ = scenario 7, ♦ = scenario 8.
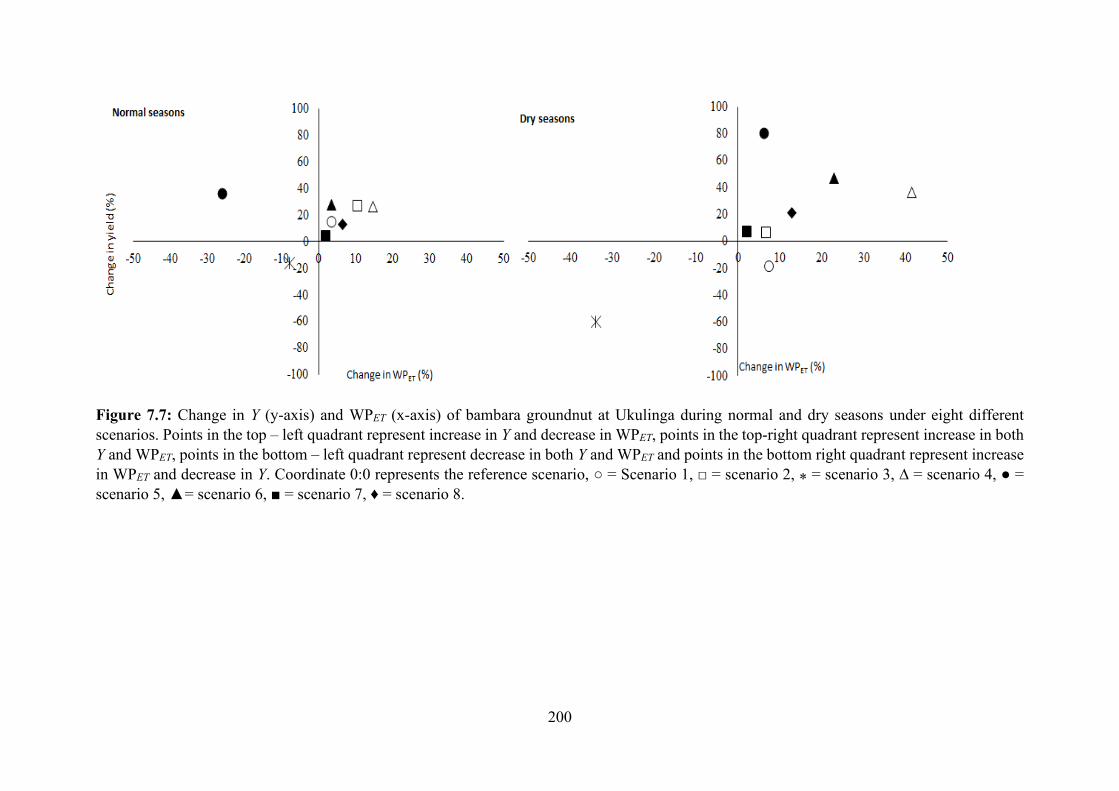
200
Figure 7.7: Change in Y (y-axis) and WPET (x-axis) of bambara groundnut at Ukulinga during normal and dry seasons under eight different scenarios. Points in the top – left quadrant represent increase in Y and decrease in WPET, points in the top-right quadrant represent increase in both Y and WPET, points in the bottom – left quadrant represent decrease in both Y and WPET and points in the bottom right quadrant represent increase in WPET and decrease in Y. Coordinate 0:0 represents the reference scenario, ○ = Scenario 1, □ = scenario 2, ⁎ = scenario 3, ∆ = scenario 4, ● = scenario 5, ▲= scenario 6, ■ = scenario 7, ♦ = scenario 8.
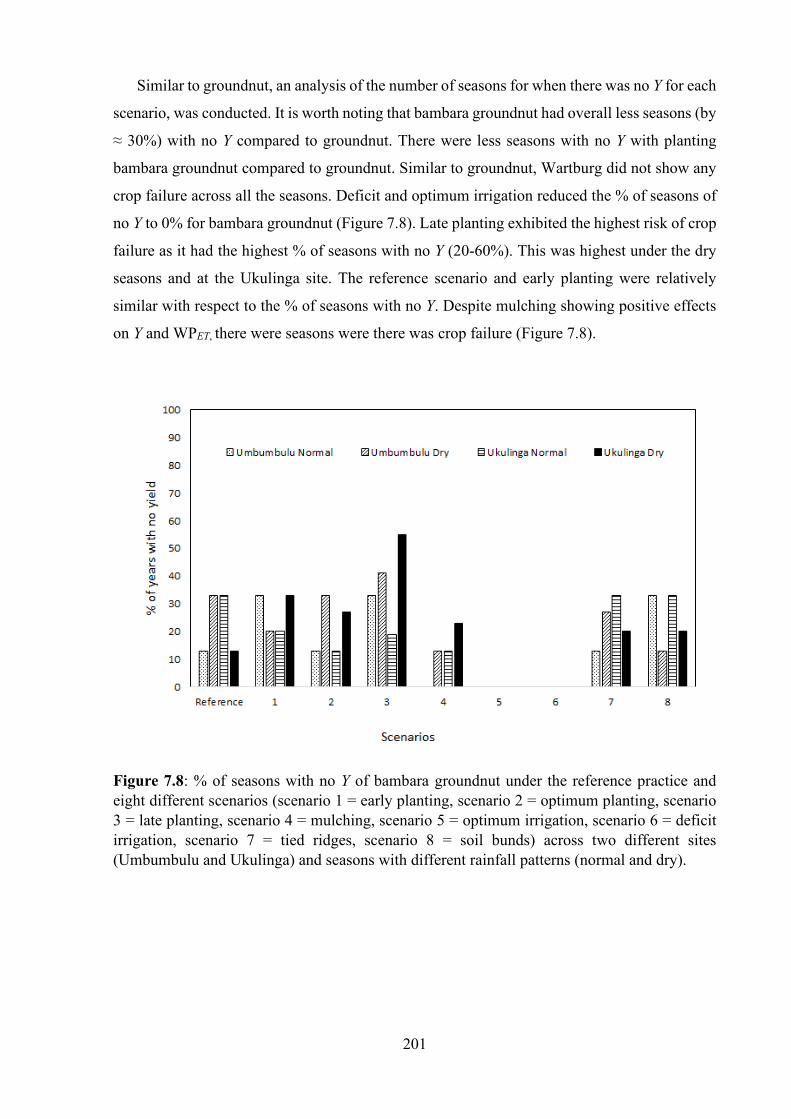
201
Similar to groundnut, an analysis of the number of seasons for when there was no Y for each
scenario, was conducted. It is worth noting that bambara groundnut had overall less seasons (by
≈ 30%) with no Y compared to groundnut. There were less seasons with no Y with planting
bambara groundnut compared to groundnut. Similar to groundnut, Wartburg did not show any
crop failure across all the seasons. Deficit and optimum irrigation reduced the % of seasons of
no Y to 0% for bambara groundnut (Figure 7.8). Late planting exhibited the highest risk of crop
failure as it had the highest % of seasons with no Y (20-60%). This was highest under the dry
seasons and at the Ukulinga site. The reference scenario and early planting were relatively
similar with respect to the % of seasons with no Y. Despite mulching showing positive effects
on Y and WPET, there were seasons were there was crop failure (Figure 7.8).
Figure 7.8: % of seasons with no Y of bambara groundnut under the reference practice and eight different scenarios (scenario 1 = early planting, scenario 2 = optimum planting, scenario 3 = late planting, scenario 4 = mulching, scenario 5 = optimum irrigation, scenario 6 = deficit irrigation, scenario 7 = tied ridges, scenario 8 = soil bunds) across two different sites (Umbumbulu and Ukulinga) and seasons with different rainfall patterns (normal and dry).

202
7.4 Conclusions
The study determined best management practices for increased Y and WPET of groundnut and
bambara groundnut under different environments. Early planting improved Y and WPET of
groundnut at Wartburg, while at Ukulinga and Umbumbulu the current recommended planting
dates should be maintained. However, during dry seasons, the study recommends late planting
for groundnut as it was associated with Y and WPET improvements. Late planting could also be
explored as a climate change adaptation strategy. Bambara groundnut is day length sensitive,
hence performed poorly to late planting (Y and WPET decreased by more than 40%). For
bambara groundnut, early planting is recommended. Mulching improved Y and WPET during
dry seasons at all the sites. For strategies to increase Y, optimum irrigation is recommended but
for WPET improvements deficit irrigation is recommended. For groundnut, tied ridges and soil
bunds should be promoted during dry seasons at Ukulinga and Umbumbulu. For bambara
groundnut, soil bunds should be promoted during both normal and dry seasons across all the
sites. Optimum irrigation is recommended for reduced risk of crop failure. This may, however,
not be feasible due to water scarcity. Crop diversification remains a viable option as the study
observed bambara groundnut to have less risk of crop failure, compared to groundnut.
References
ALAMI-MILANI M, AMINI R, DABBAGH A and JALIL M (2013) Yield and yield components of
lentil (Lens culinaris Medick .) affected by drought stress and mulch. Intl. J. Agri. Crop. Sci. 5 1228-
1231.
ALBERTA AGRICULTURE AND FORESTRY (2016) Alberta Irrigation Management Manual.
Alberta.
ARAYA A, KISEKKA I and HOLMAN J (2016) Evaluating deficit irrigation management strategies
for grain sorghum using AquaCrop. Irrig. Sci. 34 465-481.
AZAM-ALI SN (2001). Assessing the potential of an underutilized crop: A case study using bambara
groundnut.
BORIVOJ P, DJURO B, KSENIJA M, MILORAD R, MARKO J, IRENA J and LIVIJA M (2012) Yield
and water use efficiency of irrigated soybean in Vojvodina, Serbia. Ratar. i Povrt. 49 80-85.
doi:10.5937/ratpov49-1141.
CHIBARABADA TP (2018) Water use and nutritional water productivity of selected major and
underutilized grain legumes. PhD Thesis. University of KwaZulu-Natal.
203
CHIBARABADA TP, MODI AT and MABHAUDHI T (2015) Water use characteristics of a bambara
groundnut (Vigna subterranea L. Verdc) landrace during seedling establishment. Water SA 41 1-8.
doi:10.4314/wsa.v41i4.06.
COLLINSON ST, CLAWSON EJ, AZAM-ALI SN and BLACK CR (1997) Effects of soil moisture
deficits on the water relations of bambara groundnut (Vigna subterranea L. Verdc.). J. Exp. Bot. 48 877-
884.
DE WIT CT (1958) Transpiration and crop yields. Versl. Landbouwk. Onderz. 64-6 1958 pp.88
DONG Q, YANG Y, YU K and FENG H (2018). Effects of straw mulching and plastic film mulching
on improving soil organic carbon and nitrogen fractions, crop yield and water use efficiency in the Loess
Plateau, China. Agric. Water Manag. 201 133-143. doi:https://doi.org/10.1016/j.agwat.2018.01.021.
ERENSTEIN O (2003) Smallholder conservation farming in the tropics and sub-tropics: a guide to the
development and dissemination of mulching with crop residues and cover crops. Agric. Ecosyst.
Environ. 100 17-37.
FOOD AND AGRICULTURE ORGANISATION (2015) AquaCrop new features and updates
Version 5.0.
GEERTS S and RAES D (2009) Deficit irrigation as an on-farm strategy to maximize crop water
productivity in dry areas. Agric. Water Manag. 96 1275-1284.
KAR G, VERMA HN and SINGH R (2006) Effects of winter crop and supplemental irrigation on crop
yield, water use efficiency and profitability in rainfed rice based cropping system of eastern India. Agric.
Water Manag. 79 280-292. doi:https://doi.org/10.1016/j.agwat.2005.03.001
HADEBE ST, MABHAUDHI T and MODI AT (2017) Water use of sorghum (Sorghum bicolor L.
Moench) in response to varying planting dates evaluated under rainfed conditions. Water SA 43 91-103.
HEPPER FN (1963) Plants of the 1957-58 West African Expedition: II. The Bambara Groundnut
(Voandzeia subterranea) and Kersting’s Groundnut (Kerstingiella geocarpa) Wild in West Africa. Kew
Bull. 16 395-407.
MABHAUDHI T, MODI AT and BELETSE YG (2013) Growth, phenological and yield responses of
a bambara groundnut (Vigna subterranea L. Verdc) landrace to imposed water stress: II. Rain shelter
conditions. Water SA 39 191-198.
MABHAUDHI T, MODI AT and BELETSE YG (2014) Parameterization and testing of AquaCrop for
a South African bambara groundnut landrace. Agron. J. 106 243-251.

204
MAKANDA I, TONGOONA P, MADAMBA R, ICISHAHAYO D and DERERA J (2009) Path
coefficient analysis of bambara groundnut pod yield components at four planting dates. Res. J. Agric.
Biol. Sci. 5 287-292.
MAYES S, MASSAWE FJ, ALDERSON PG, ROBERTS JA, AZAM-ALI SN, and HERMANN M
(2011) The potential for underutilized crops to improve security of food production. J. Exp. Bot. 63
1075-1079.
MHIZHA T, GEERTS S, VANUYTRECHT E, RAES D and MAKARAU A (2014) Use of the FAO
AquaCrop model in developing sowing guidelines for rainfed maize in Zimbabwe. Water SA 40 233-
244.
MKANDAWIRE CH (2007) Review of bambara groundnut (Vigna subterranea (L.) Verdc.) production
in Sub-Sahara Africa. Agric. J. 2 464-470.
NYSSEN J, POESEN J, GEBREMICHAEL D, VANCAMPENHOUT K, D’AES M, YIHDEGO G,
GOVERS G, LEIRS H, MOEYERSONS J and NAUDTS J (2007) Interdisciplinary on-site evaluation
of stone bunds to control soil erosion on cropland in Northern Ethiopia. Soil Tillage Res. 94 151-163.
OUÉDRAOGO E, MANDO A, BRUSSAARD L and STROOSNIJDER L (2007) Tillage and fertility
management effects on soil organic matter and sorghum yield in semi-arid West Africa. Soil Tillage
Res. 94 64-74. doi:https://doi.org/10.1016/j.still.2006.07.001.
OWEIS T (1997) Supplemental irrigation: A highly efficient water-use practice. ICARDA.
RAES D (2004) Frequency analysis of rainfall data. International Centre for Theoretical physics.
Katholieke Universiteit Leuven, Belgium.
RAES D, SITHOLE A, MAKARAU A and MILFORD J (2004) Evaluation of first sowing dates
recommended by criteria currently used in Zimbabwe. Agric. For. Meteorol. 125 177-185.
RAES D, STEDUTO P, HSIAO TC and FERERES E (2009) Aquacrop the fao crop model to simulate
yield response to water: Ii. Main algorithms and software description. Agron. J. 101 438-447.
RIJSBERMAN FR (2006) Water scarcity: fact or fiction? Agric. water Manag. 80 5-22.
SINEFU F (2011) Bambara groundnut response to controlled environment and planting date associated
water stress. Masters Dissertation, University of KwaZulu-Natal, Pietermaritzburg, South Africa.
STEDUTO P, HSIAO TC, RAES D and FERERES E (2009) AquaCrop – the FAO crop model to
simulate yield response to water: I. Concepts and underlying principles. Agron. J. 101 426-437.
THOMAS-ROBERTSON MJ, FUKAI S and PEOPLES MB (2004) The effect of timing and severity

205
of water deficit on growth, development, yield accumulation and nitrogen fixation of mungbean. F.
Crop. Res. 86 67-80. doi:10.1016/S0378-4290(03)00120-5
TIAN J, LU S, FAN M, LI X and KUZYAKOV Y (2013) Labile soil organic matter fractions as
influenced by non-flooded mulching cultivation and cropping season in rice-wheat rotation. Eur. J. Soil
Biol. 56 19-25. doi:https://doi.org/10.1016/j.ejsobi.2013.02.001
TITTONELL P and GILLER KE (2013) When yield gaps are poverty traps: The paradigm of ecological
intensification in African smallholder agriculture. F. Crop. Res. 143 76-90.
VAN GAELEN H (2016) Evaluating Agricultural Management from Field to Catchment Scale. PhD
thesis, KU Leuven.
VURAYAI R, EMONGOR V and MOSEKI B (2011) Effect of water stress imposed at different growth
and development stages on morphological traits and yield of Bambara Groundnuts (Vigna subterranea
L. Verdc). Am. J. plant Physiol. 6 17-27.
WILSON C (2012) Effects of planting dates, densities, and varieties on ecophysiology of pigeonpea in
the Southeastern United States. Agric. Sci. 3 147-152. doi:10.4236/as.2012.32017.
ZHANG H, YU X, JIN Z, ZHENG W, ZHAI B and LI Z (2017) Improving grain yield and water use
efficiency of winter wheat through a combination of manure and chemical nitrogen fertilizer on the
Loess plateau, China. J. Soil Sci. Plant Nutr. 17 461-474. doi:10.4067/S0718-95162017005000033.
206
CHAPTER 8
REPLACING NON-BIOFORTIFIED WHITE MAIZE AND SWEET POTATO WITH PROVITAMIN A-BIOFORTIFIED MAIZE AND
ORANGE-FLESHED SWEET POTATO IN POPULAR TRADITIONAL FOODS OF KWAZULU-NATAL
L Govender, K Pillay, M Siwela, AT Modi and T Mabhaudhi
8.1 Introduction
Biofortification is a process that improves the nutrient content of staple crops through plant
breeding or recombinant deoxyribonucleic acid technology (rDNA). Biofortified crops could
play a vital role in improving the nutritional status of vulnerable population groups, where
supplementation, conventional fortification, or dietary diversity is limited or problematic to
implement (WHO, 2018). HarvestPlus, a global Challenge Programme, aims to reduce
micronutrient malnutrition by developing crops that are higher in vitamin A, iron and zinc and
have selected seven crops for biofortification, namely: beans (Phaseolus vulgaris), maize (Zea
mays), pearl millet (Pennisetum glaucum), wheat (Triticum aestivum), cassava (Manihot
esculenta), sweet potato (Ipomoea batatas), and rice (Oryza sativa). Of these crops, cassava,
maize and sweet potato have been selected for PVA-biofortification (HarvestPlus, 2018; WHO,
2018). The current PVA breeding targets for maize and sweet potato are 15 µg/g and 32 µg/g,
respectively (HarvestPlus, 2009a; HarvestPlus, 2009b). White maize and cream-fleshed sweet
potato (CFSP) are two commonly grown and consumed crops in SA (DAFF, 2017; Low et al.,
2017) and are therefore ideal for PVA-biofortification (Mitra, 2012; Low et al., 2017; DAFF,
2017). Although these crops are widely consumed in SA, they are deficient in PVA carotenoids,
the precursors of vitamin A found in plants (Mitra, 2012; Low et al., 2017). This could partly
explain the slow improvement in the vitamin A status of the South African population,
especially children (Shisana et al., 2013).
Vitamin A is an essential micronutrient that has several physiological roles including
immunity, vision and protein synthesis (Sizer and Whitney, 2017). In SA, between 1994 and
2005, the number of children that had VAD increased from 33.3% to 63.6% (Labadarios and
Van Middelkoop, 1995; Labadarios et al., 2008). Although, the results from the 2012
SANHANES-1 study showed a decrease in VAD prevalence from the 2005 NFCS-FB, the
prevalence of VAD is still high (43.6%) (Labadarios et al., 2008; Shisana et al., 2013).
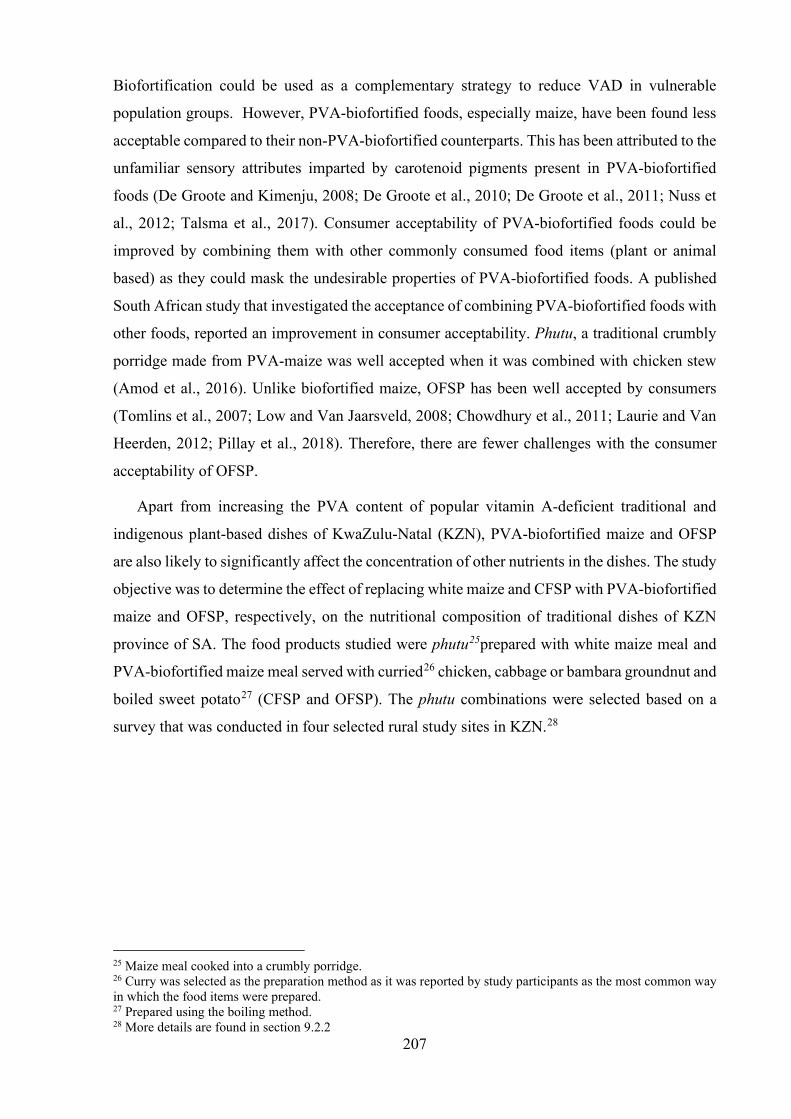
207
Biofortification could be used as a complementary strategy to reduce VAD in vulnerable
population groups. However, PVA-biofortified foods, especially maize, have been found less
acceptable compared to their non-PVA-biofortified counterparts. This has been attributed to the
unfamiliar sensory attributes imparted by carotenoid pigments present in PVA-biofortified
foods (De Groote and Kimenju, 2008; De Groote et al., 2010; De Groote et al., 2011; Nuss et
al., 2012; Talsma et al., 2017). Consumer acceptability of PVA-biofortified foods could be
improved by combining them with other commonly consumed food items (plant or animal
based) as they could mask the undesirable properties of PVA-biofortified foods. A published
South African study that investigated the acceptance of combining PVA-biofortified foods with
other foods, reported an improvement in consumer acceptability. Phutu, a traditional crumbly
porridge made from PVA-maize was well accepted when it was combined with chicken stew
(Amod et al., 2016). Unlike biofortified maize, OFSP has been well accepted by consumers
(Tomlins et al., 2007; Low and Van Jaarsveld, 2008; Chowdhury et al., 2011; Laurie and Van
Heerden, 2012; Pillay et al., 2018). Therefore, there are fewer challenges with the consumer
acceptability of OFSP.
Apart from increasing the PVA content of popular vitamin A-deficient traditional and
indigenous plant-based dishes of KwaZulu-Natal (KZN), PVA-biofortified maize and OFSP
are also likely to significantly affect the concentration of other nutrients in the dishes. The study
objective was to determine the effect of replacing white maize and CFSP with PVA-biofortified
maize and OFSP, respectively, on the nutritional composition of traditional dishes of KZN
province of SA. The food products studied were phutu25prepared with white maize meal and
PVA-biofortified maize meal served with curried26 chicken, cabbage or bambara groundnut and
boiled sweet potato27 (CFSP and OFSP). The phutu combinations were selected based on a
survey that was conducted in four selected rural study sites in KZN.28
25 Maize meal cooked into a crumbly porridge. 26 Curry was selected as the preparation method as it was reported by study participants as the most common way in which the food items were prepared. 27 Prepared using the boiling method. 28 More details are found in section 9.2.2
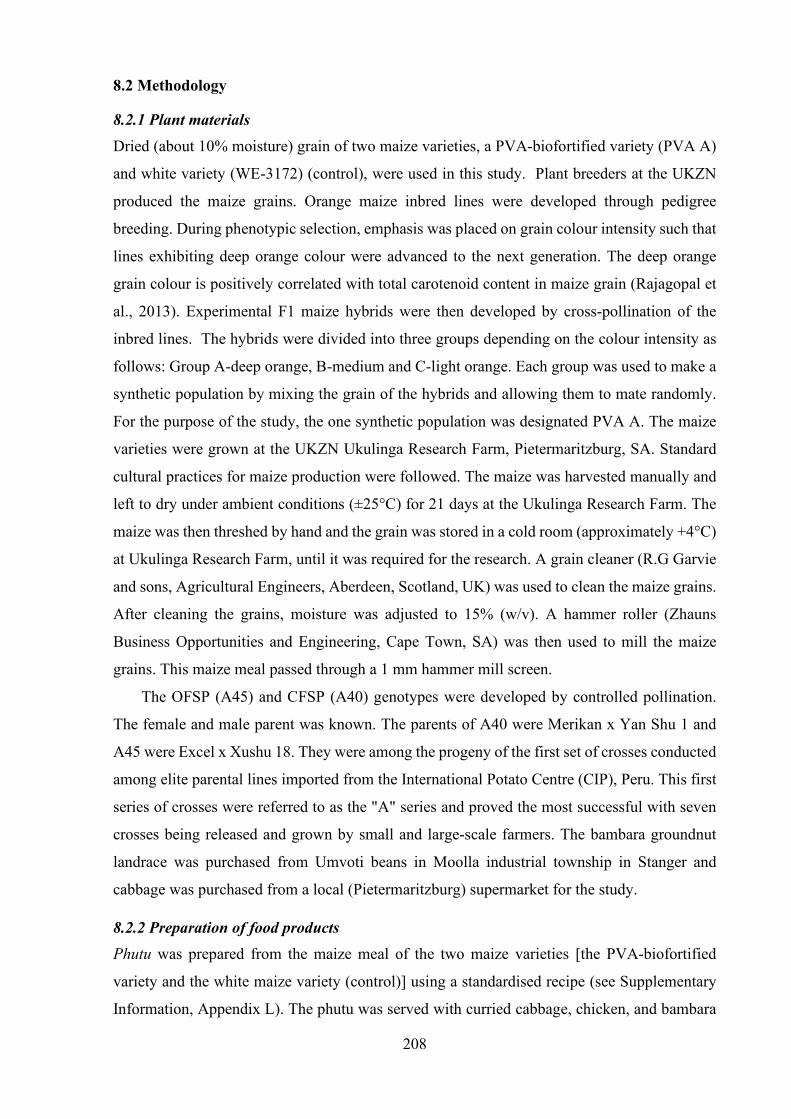
208
8.2 Methodology
8.2.1 Plant materials Dried (about 10% moisture) grain of two maize varieties, a PVA-biofortified variety (PVA A)
and white variety (WE-3172) (control), were used in this study. Plant breeders at the UKZN
produced the maize grains. Orange maize inbred lines were developed through pedigree
breeding. During phenotypic selection, emphasis was placed on grain colour intensity such that
lines exhibiting deep orange colour were advanced to the next generation. The deep orange
grain colour is positively correlated with total carotenoid content in maize grain (Rajagopal et
al., 2013). Experimental F1 maize hybrids were then developed by cross-pollination of the
inbred lines. The hybrids were divided into three groups depending on the colour intensity as
follows: Group A-deep orange, B-medium and C-light orange. Each group was used to make a
synthetic population by mixing the grain of the hybrids and allowing them to mate randomly.
For the purpose of the study, the one synthetic population was designated PVA A. The maize
varieties were grown at the UKZN Ukulinga Research Farm, Pietermaritzburg, SA. Standard
cultural practices for maize production were followed. The maize was harvested manually and
left to dry under ambient conditions (±25°C) for 21 days at the Ukulinga Research Farm. The
maize was then threshed by hand and the grain was stored in a cold room (approximately +4°C)
at Ukulinga Research Farm, until it was required for the research. A grain cleaner (R.G Garvie
and sons, Agricultural Engineers, Aberdeen, Scotland, UK) was used to clean the maize grains.
After cleaning the grains, moisture was adjusted to 15% (w/v). A hammer roller (Zhauns
Business Opportunities and Engineering, Cape Town, SA) was then used to mill the maize
grains. This maize meal passed through a 1 mm hammer mill screen.
The OFSP (A45) and CFSP (A40) genotypes were developed by controlled pollination.
The female and male parent was known. The parents of A40 were Merikan x Yan Shu 1 and
A45 were Excel x Xushu 18. They were among the progeny of the first set of crosses conducted
among elite parental lines imported from the International Potato Centre (CIP), Peru. This first
series of crosses were referred to as the "A" series and proved the most successful with seven
crosses being released and grown by small and large-scale farmers. The bambara groundnut
landrace was purchased from Umvoti beans in Moolla industrial township in Stanger and
cabbage was purchased from a local (Pietermaritzburg) supermarket for the study.
8.2.2 Preparation of food products Phutu was prepared from the maize meal of the two maize varieties [the PVA-biofortified
variety and the white maize variety (control)] using a standardised recipe (see Supplementary
Information, Appendix L). The phutu was served with curried cabbage, chicken, and bambara
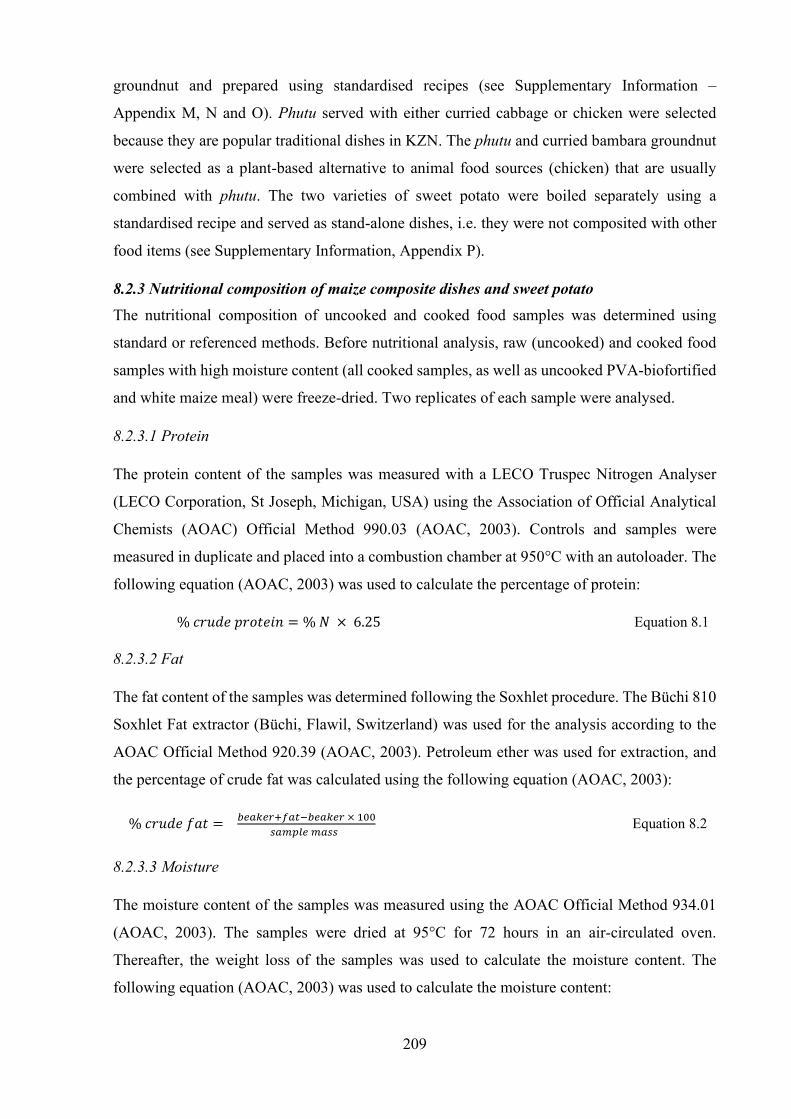
209
groundnut and prepared using standardised recipes (see Supplementary Information –
Appendix M, N and O). Phutu served with either curried cabbage or chicken were selected
because they are popular traditional dishes in KZN. The phutu and curried bambara groundnut
were selected as a plant-based alternative to animal food sources (chicken) that are usually
combined with phutu. The two varieties of sweet potato were boiled separately using a
standardised recipe and served as stand-alone dishes, i.e. they were not composited with other
food items (see Supplementary Information, Appendix P).
8.2.3 Nutritional composition of maize composite dishes and sweet potato The nutritional composition of uncooked and cooked food samples was determined using
standard or referenced methods. Before nutritional analysis, raw (uncooked) and cooked food
samples with high moisture content (all cooked samples, as well as uncooked PVA-biofortified
and white maize meal) were freeze-dried. Two replicates of each sample were analysed.
8.2.3.1 Protein
The protein content of the samples was measured with a LECO Truspec Nitrogen Analyser
(LECO Corporation, St Joseph, Michigan, USA) using the Association of Official Analytical
Chemists (AOAC) Official Method 990.03 (AOAC, 2003). Controls and samples were
measured in duplicate and placed into a combustion chamber at 950°C with an autoloader. The
following equation (AOAC, 2003) was used to calculate the percentage of protein:
% 𝑝𝑝𝐼𝐼𝑅𝑅𝑐𝑐𝐷𝐷 𝐷𝐷𝐼𝐼𝐼𝐼𝐼𝐼𝐷𝐷𝐼𝐼𝐼𝐼 = % 𝑁𝑁 × 6.25 Equation 8.1
8.2.3.2 Fat
The fat content of the samples was determined following the Soxhlet procedure. The Büchi 810
Soxhlet Fat extractor (Büchi, Flawil, Switzerland) was used for the analysis according to the
AOAC Official Method 920.39 (AOAC, 2003). Petroleum ether was used for extraction, and
the percentage of crude fat was calculated using the following equation (AOAC, 2003):
% 𝑝𝑝𝐼𝐼𝑅𝑅𝑐𝑐𝐷𝐷 𝑅𝑅𝐼𝐼𝐼𝐼 =
𝑂𝑂𝑂𝑂𝑆𝑆𝑏𝑏𝑂𝑂𝑟𝑟+𝑓𝑓𝑆𝑆𝑆𝑆−𝑂𝑂𝑂𝑂𝑆𝑆𝑏𝑏𝑂𝑂𝑟𝑟 × 100𝑂𝑂𝑆𝑆𝑆𝑆𝑠𝑠𝑆𝑆𝑂𝑂 𝑆𝑆𝑆𝑆𝑂𝑂𝑂𝑂
Equation 8.2
8.2.3.3 Moisture
The moisture content of the samples was measured using the AOAC Official Method 934.01
(AOAC, 2003). The samples were dried at 95°C for 72 hours in an air-circulated oven.
Thereafter, the weight loss of the samples was used to calculate the moisture content. The
following equation (AOAC, 2003) was used to calculate the moisture content:
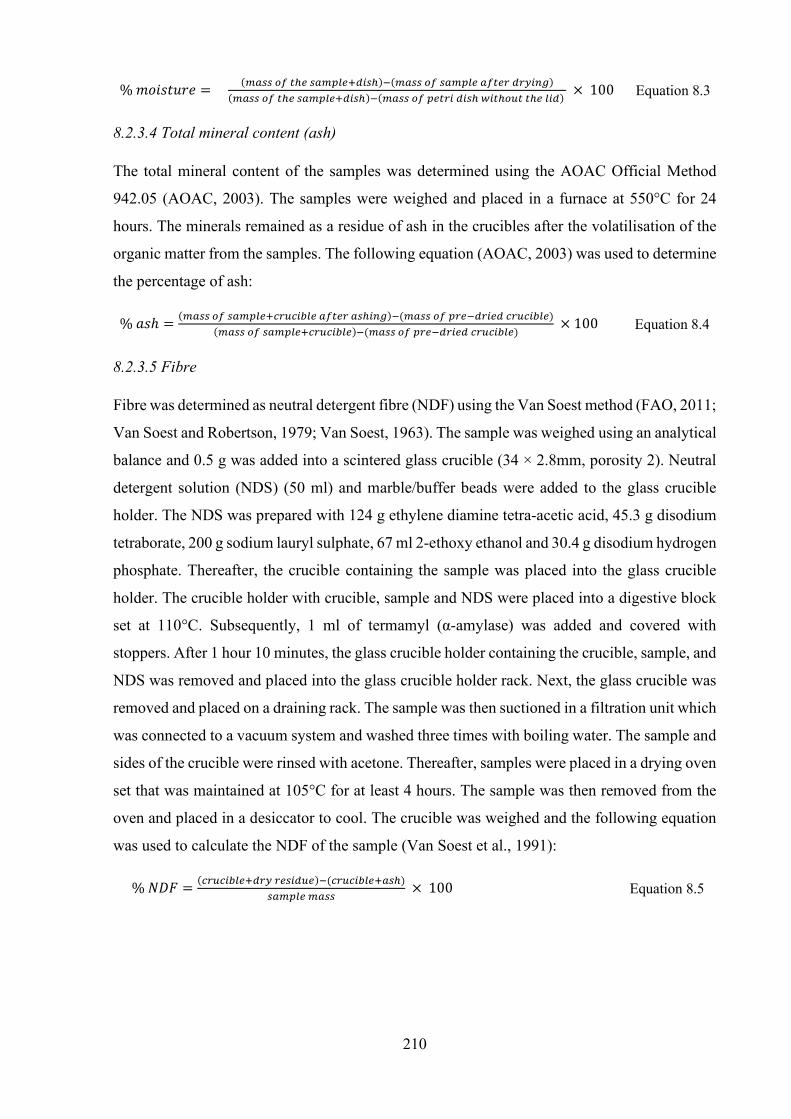
210
% 𝑉𝑉𝐼𝐼𝐼𝐼𝑟𝑟𝐼𝐼𝑅𝑅𝐼𝐼𝐷𝐷 = (𝑆𝑆𝑆𝑆𝑂𝑂𝑂𝑂 𝑆𝑆𝑓𝑓 𝑆𝑆ℎ𝑂𝑂 𝑂𝑂𝑆𝑆𝑆𝑆𝑠𝑠𝑆𝑆𝑂𝑂+𝑂𝑂𝑆𝑆𝑂𝑂ℎ)−(𝑆𝑆𝑆𝑆𝑂𝑂𝑂𝑂 𝑆𝑆𝑓𝑓 𝑂𝑂𝑆𝑆𝑆𝑆𝑠𝑠𝑆𝑆𝑂𝑂 𝑆𝑆𝑓𝑓𝑆𝑆𝑂𝑂𝑟𝑟 𝑂𝑂𝑟𝑟𝑑𝑑𝑆𝑆𝑆𝑆𝑑𝑑)(𝑆𝑆𝑆𝑆𝑂𝑂𝑂𝑂 𝑆𝑆𝑓𝑓 𝑆𝑆ℎ𝑂𝑂 𝑂𝑂𝑆𝑆𝑆𝑆𝑠𝑠𝑆𝑆𝑂𝑂+𝑂𝑂𝑆𝑆𝑂𝑂ℎ)−(𝑆𝑆𝑆𝑆𝑂𝑂𝑂𝑂 𝑆𝑆𝑓𝑓 𝑠𝑠𝑂𝑂𝑆𝑆𝑟𝑟𝑆𝑆 𝑂𝑂𝑆𝑆𝑂𝑂ℎ 𝑤𝑤𝑆𝑆𝑆𝑆ℎ𝑆𝑆𝑆𝑆𝑆𝑆 𝑆𝑆ℎ𝑂𝑂 𝑆𝑆𝑆𝑆𝑂𝑂)
× 100 Equation 8.3
8.2.3.4 Total mineral content (ash)
The total mineral content of the samples was determined using the AOAC Official Method
942.05 (AOAC, 2003). The samples were weighed and placed in a furnace at 550°C for 24
hours. The minerals remained as a residue of ash in the crucibles after the volatilisation of the
organic matter from the samples. The following equation (AOAC, 2003) was used to determine
the percentage of ash:
% 𝐼𝐼𝑟𝑟ℎ = (𝑆𝑆𝑆𝑆𝑂𝑂𝑂𝑂 𝑆𝑆𝑓𝑓 𝑂𝑂𝑆𝑆𝑆𝑆𝑠𝑠𝑆𝑆𝑂𝑂+𝑐𝑐𝑟𝑟𝑆𝑆𝑐𝑐𝑆𝑆𝑂𝑂𝑆𝑆𝑂𝑂 𝑆𝑆𝑓𝑓𝑆𝑆𝑂𝑂𝑟𝑟 𝑆𝑆𝑂𝑂ℎ𝑆𝑆𝑆𝑆𝑑𝑑)−(𝑆𝑆𝑆𝑆𝑂𝑂𝑂𝑂 𝑆𝑆𝑓𝑓 𝑠𝑠𝑟𝑟𝑂𝑂−𝑂𝑂𝑟𝑟𝑆𝑆𝑂𝑂𝑂𝑂 𝑐𝑐𝑟𝑟𝑆𝑆𝑐𝑐𝑆𝑆𝑂𝑂𝑆𝑆𝑂𝑂)(𝑆𝑆𝑆𝑆𝑂𝑂𝑂𝑂 𝑆𝑆𝑓𝑓 𝑂𝑂𝑆𝑆𝑆𝑆𝑠𝑠𝑆𝑆𝑂𝑂+𝑐𝑐𝑟𝑟𝑆𝑆𝑐𝑐𝑆𝑆𝑂𝑂𝑆𝑆𝑂𝑂)−(𝑆𝑆𝑆𝑆𝑂𝑂𝑂𝑂 𝑆𝑆𝑓𝑓 𝑠𝑠𝑟𝑟𝑂𝑂−𝑂𝑂𝑟𝑟𝑆𝑆𝑂𝑂𝑂𝑂 𝑐𝑐𝑟𝑟𝑆𝑆𝑐𝑐𝑆𝑆𝑂𝑂𝑆𝑆𝑂𝑂)
× 100 Equation 8.4
8.2.3.5 Fibre
Fibre was determined as neutral detergent fibre (NDF) using the Van Soest method (FAO, 2011;
Van Soest and Robertson, 1979; Van Soest, 1963). The sample was weighed using an analytical
balance and 0.5 g was added into a scintered glass crucible (34 × 2.8mm, porosity 2). Neutral
detergent solution (NDS) (50 ml) and marble/buffer beads were added to the glass crucible
holder. The NDS was prepared with 124 g ethylene diamine tetra-acetic acid, 45.3 g disodium
tetraborate, 200 g sodium lauryl sulphate, 67 ml 2-ethoxy ethanol and 30.4 g disodium hydrogen
phosphate. Thereafter, the crucible containing the sample was placed into the glass crucible
holder. The crucible holder with crucible, sample and NDS were placed into a digestive block
set at 110°C. Subsequently, 1 ml of termamyl (α-amylase) was added and covered with
stoppers. After 1 hour 10 minutes, the glass crucible holder containing the crucible, sample, and
NDS was removed and placed into the glass crucible holder rack. Next, the glass crucible was
removed and placed on a draining rack. The sample was then suctioned in a filtration unit which
was connected to a vacuum system and washed three times with boiling water. The sample and
sides of the crucible were rinsed with acetone. Thereafter, samples were placed in a drying oven
set that was maintained at 105°C for at least 4 hours. The sample was then removed from the
oven and placed in a desiccator to cool. The crucible was weighed and the following equation
was used to calculate the NDF of the sample (Van Soest et al., 1991):
% 𝑁𝑁𝐷𝐷𝑁𝑁 = (𝑐𝑐𝑟𝑟𝑆𝑆𝑐𝑐𝑆𝑆𝑂𝑂𝑆𝑆𝑂𝑂+𝑂𝑂𝑟𝑟𝑑𝑑 𝑟𝑟𝑂𝑂𝑂𝑂𝑆𝑆𝑂𝑂𝑆𝑆𝑂𝑂)−(𝑐𝑐𝑟𝑟𝑆𝑆𝑐𝑐𝑆𝑆𝑂𝑂𝑆𝑆𝑂𝑂+𝑆𝑆𝑂𝑂ℎ)𝑂𝑂𝑆𝑆𝑆𝑆𝑠𝑠𝑆𝑆𝑂𝑂 𝑆𝑆𝑆𝑆𝑂𝑂𝑂𝑂
× 100 Equation 8.5

211
8.2.3.6 Amino Acids
Amino acids were analysed by the hierarchical clustering linear combination (HCLC) method
after HCl hydrolysis and derivatization. The method was according to the International
Analytical Group (International Analytical Group, 2016) and is briefly described below. The
freeze-dried sample was added to a glass vial and 6 N HCl was added. Thereafter, the vial was
flushed with argon or nitrogen gas to eliminate oxygen, before the lid was closed. The vial was
placed in an oven at 110°C for 18-24 hours. The vial was removed from the oven and allowed
to cool. The hydrolysate was filtered using centrifuge tube filters (Corning® Costar® Spin-X
tubes, Sigma-Aldrich, St. Louis, MO, USA). The filtrate was transferred to Eppendorf tubes
and allowed to dry using a speedvac and thereafter reconstituted in borate buffer for
derivatization. The borate buffer was transferred into a 200 µl glass insert in a 2 ml glass vial,
and 10 µl of either standard solution or diluted sample was added. The 6-aminoquinolyl-N-
hydroxysccinimidyl carbamate (AQC) reagent was added, and then the vial was placed in a
vortex to ensure that the sample was mixed properly. The vial was then placed in an oven at
55°C for 10 minutes, and then loaded into the autosampler tray for analysis. An H-class Waters
Acquity ultra performance liquid chromatography (UPLC) linked to a Waters photodiode array
detector (Waters, Milford, MA, USA), was used for high-resolution UPLC-UV analysis. The
separation was achieved on an Acquity UPLC BEH C18 (2.1 × 150 mm; 1.7 µm particle size)
column at 60°C and a flow rate of 0.4 ml/min. Data were collected at a wavelength of 254 nm.
An injection volume of 1 µl was used, and gradient separation was performed using Solvents
A and B from the Waters Accutag kit.
8.2.3.7 Mineral elements
Calcium, phosphorous, iron, and zinc, were analysed using the Agricultural Laboratory
Association of Southern Africa (ALASA) Method 6.1.1 (ALASA, 1998). The first step of this
process was to freeze-dry the samples in a freeze drier (Edwards, High vacuum international,
Sussex, England). Samples were ashed for 24 hours at 550°C in a furnace. The samples were
dissolved in HCl and then HNO3 was added. The samples were analysed using an atomic
absorption spectrophotometer. Calcium and phosphorus were determined using the Analytik
Jena Spekol 1300 spectrophotometer (Analytik Jena AG, Achtung, Germany). Iron was
determined with the Varian SpectrAA atomic absorption spectrophotometer (Varian Australia
Pty Ltd, Mulgrave, Victoria), and zinc with the GBC 905AA spectrophotometer (GBC
Scientific Equipment Pty Ltd., Dandenong, Victoria, Australia).
212
8.2.3.8 Provitamin A
The provitamin A content of the food samples was determined by high-performance liquid
chromatography (HPLC), according to the procedures described by Lacker et al. (1999).
8.2.4 Determining usual portion sizes for children aged 1-5 years Usual portion sizes of composite dishes (phutu and curried cabbage, phutu and curried chicken
and phutu and curried bambara) and boiled CFSP was obtained from caregivers of children
aged 1-5 years, as part of the consumer acceptability study (Chapter 9). Portion sizes were
obtained from caregivers for 65 children aged 1-5 years. Table 8.1 indicates the number of
portion sizes obtained for each age group.
Table 8.1: The number of portions sizes obtained for each age category (n=65)
Age group n (%)
1-3 years 37 (56.9)
4-5 years 28 (43.1)
Caregivers were provided with a bowl or plate and a dishing spoon and were required to
plate the amount of phutu and curry together, that they would usually serve the child in their
care. Additionally, the caregivers selected the size of CFSP that they felt best resembled the
usual portion they would serve the child. The food portions were then weighed using an
electronic scale (Soehnle, Leifheit AG 56377, Nassau, Germany) and the measurements
recorded. The mean usual intake was calculated for each of the composite dishes. Tables 8.2
and 8.3 presents the mean usual portion sizes for each age category. These values were used to
determine if the usual portion sizes for the different age groups met the EAR for vitamin A for
children in the different age groups.
The caregivers served the children the same portion of phutu with either curried cabbage,
chicken or bambara groundnut. The independent samples t-test indicated that only the chicken
portions were significantly different for the two age groups (p<0.05). The chicken portion
served to 4-5-year olds was significantly greater than the portion served to 1-3 year olds
(p<0.05).

213
Table 8.2: Mean usual portion sizes of meals prepared with phutu and combined with either curried chicken, cabbage or bambara groundnut reported by caregivers (n=65) of children aged 1-5 years
a Mean weight (g); b Standard deviation.
Table 8.3: Mean usual portion sizes of sweet potato reported by caregivers (n=65) of children aged 1-5 years
a Mean weight (g); b Standard deviation.
1-3 YEARS OLD 4-5 YEARS OLD
Composite dish n Usual portion
(g) Weight range of
usual portions (g) Composite dish n Usual portion
(g) Weight range of
usual portions (g) Phutu and curried chicken 37 158.54a (40.80)b 72-236 Phutu and curried chicken 28 188.07 (60.30) 100-386 Phutu and curried cabbage 37 165.24 (52.05) 84-268 Phutu and curried cabbage 28 195.64 (65.96) 110-394 Phutu and curried bambara
groundnut 37 176.51 (59.56) 67-278 Phutu and curried bambara
groundnut 28 200.25 (78.38) 106-452
Age n Usual portion (g) Weight range of usual portion (g) 1-3 years 37 142.73a (97.50)b 40-360 4-5 years 28 179.50 (95.13) 50-448

214
8.2.5 Data quality control A template was designed for data collection and checked by the statistician to ensure that all
relevant variables were included in the template. Data from the nutritional analysis was entered
onto two Microsoft Excel spreadsheets with the same template. These two spreadsheets were
compared to ensure that there were no discrepancies. Thereafter, the two spreadsheets were
consolidated into one and analysed statistically.
8.2.6 Reduction of experimental errors A number of steps were taken to reduce experimental errors. Foods were prepared using the
same brands of ingredients, measuring cups, spoons, pots and model of stove. All dry
ingredients were measured on a calibrated food scale. Samples of the cooked dishes were taken
on the day it was prepared and freeze-dried to stop the cooking process and prevent any
chemical changes. Nutritional analysis was conducted in duplicate, using standardised methods.
8.2.7 Statistical analysis Nutritional composition data were analysed using the Statistical Package for Social Science
(SPSS) (version 25.0 SPSS Inc, Chicago III USA). Mean values and standard deviations were
determined for all duplicate measurements for 13 cooked and uncooked samples. The Kruskal
Wallis non-parametric test was used to determine if there were significant differences in
nutritional composition across uncooked and cooked food products. Where significant
differences were identified, the Mann-Whitney U test was used to determine the specific
differences. The Mann-Whitney U test was also used to determine significant differences in
nutritional composition across the two sweet potato varieties. Significance was measured at the
5% level throughout. Data for the usual portion size was analysed using the statistical package,
SPSS (version 25.0 SPSS Inc, Chicago III USA). Mean values and standard deviations were
determined for all duplicate measurements. The independent samples t-test was used to test for
significant differences in mean values between the portion size of the phutu composite dishes
and sweet potato for the two age groups (1-3 years and 4-5 years).
215
8.3 Results
8.3.1 Proximate composition of uncooked and cooked food samples The concentration of all the nutrients analysed differed significantly according to the Kruskal
Wallis test: p<0.05, across the 13 food samples (Table 8.4). The protein concentration of PVA-
biofortified maize meal/flour (8.68 g/100 g) was not significantly different from that of white
maize meal/flour (10.22 g/100 g) (p=1.000) (Table 8.4). Provitamin A-biofortified phutu (8.74
g/100 g) had a significantly lower protein concentration than that of curried chicken (p<0.05),
but was not significantly different from the protein concentration of curried cabbage (13.04
g/100 g) and bambara groundnut (17.00 g/100 g) (p=0.995 and p=0.682, respectively). The
protein content of curried chicken (71.23 g/100 g) was approximately quintuple that of curried
cabbage (13.04 g/100 g) and approximately quadruple that of curried bambara groundnut (17.00
g/100g) (p<0.05). Provitamin A-biofortified phutu served with either curried cabbage, chicken
or bambara groundnut did not have a significantly different protein concentration in comparison
to white phutu, served with either curried cabbage, chicken or bambara groundnut (p=1.000,
p=0.954 and p=1.000, respectively).
When comparing the three PVA biofortified composite dishes, there were no significant
differences in the protein concentration (p>0.05). The fibre concentration of PVA-biofortified
maize/flour (13.53 g/100 g) was not significantly different from that of white maize meal/flour
(control) (5.44 g/100 g) (Table 8.4) (p=0.998). Replacing white maize phutu (control) with PVA
phutu in the composite dishes had no effect on the fibre concentration of PVA phutu and curried
chicken; PVA phutu and curried cabbage; or phutu and curried bambara groundnut (p=1.000,
p=1.000 and p=0.993, respectively). A similar fibre concentration was observed in all three
composite dishes containing PVA-biofortified phutu (p>0.05).
The total mineral content (ash) of white maize meal/flour (control) (1.21 mg/100 g) was not
significantly different from that of PVA-biofortified maize meal/flour (1.35 mg/100 g) (Table
8.4) (p=1.000). The ash content of PVA-biofortified phutu (2.64 mg/100 g) was significantly
lower than curried cabbage (11.19 mg/100 g), curried chicken (14.15 mg/100 g) and curried
bambara groundnut (8.00 mg/100 g) (p<0.05). Curried chicken (14.15 mg/100 g) had a
significantly higher ash content compared to curried cabbage and bambara groundnut (p<0.05).
However, the ash content did not change significantly when white phutu was replaced with
PVA-biofortified phutu in the three composite dishes (p>0.05). Orange-fleshed sweet potato
had a significantly lower protein concentration relative to the CFSP, but a significantly higher
fibre and total mineral concentration (ash) (Table 8.5) (p<0.05).

216
Table 8.4: Proximate composition of uncooked and cooked food samples, except for sweet potato
Sample Moisture Protein Fat NDFb Total mineral content (ash) (%) (g/100 g, DWa) (g/100 g, DW) (g/100 g, DW) (mg/100 g, DW)
Raw maize meal/flour White maize flour (control) 9.88c (0.59)d 10.22 (0.21) 3.89 (0.61) 5.44 (6.62) 1.21 (0.12) PVAe-biofortified maize flour 9.20 (1.77) 8.68 (0.01) 2.97 (0.15) 13.53 (0.85) 1.35 (0.04) Individual dishes White phutu (control) 4.88 (0.17) 9.71 (0.15) 2.48 (0.21) 9.65 (0.62) 5.10 (0.37) PVA-biofortified phutu 4.91 (0.50) 8.74 (0.03) 2.70 (0.28) 17.45 (0.66) 2.64 (0.15) Curried cabbage 15.48 (1.68) 13.04 (0.56) 20.56 (0.03) 28.64 (1.75) 11.19 (0.28) Curried chicken 9.17 (1.18) 71.23 (9.43) 22.62 (3.03) 40.82 (17.47) 14.15 (0.74) Curried bambara groundnut 8.00 (0.27) 17.00 (0.17) 12.13 (0.97) 29.21 (4.71) 8.00 (0.27) Composite dishes White phutu and curried chicken 4.17 (0.00) 28.60 (2.59) 7.27 (0.13) 10.77 (1.43) 3.42 (0.24) PVA phutu and curried chicken 4.38 (0.54) 22.86 (0.87) 8.87 (1.29) 15.94 (4.55) 3.46 (0.06) White phutu and curried cabbage 6.83 (0.82) 10.10 (0.11) 9.19 (0.35) 18.95 (2.81) 4.18 (0.25) PVA phutu and curried cabbage 6.70 (0.63) 9.00 (0.15) 9.46 (0.10) 18.63 (0.23) 4.63 (0.17) White phutu and curried bambara groundnut 7.14 (1.44) 13.29 (0.15) 8.98 (0.38) 17.45 (0.10) 3.24 (0.09) PVA phutu and curried bambara groundnut 4.51 (2.75) 12.86 (0.93) 8.00 (0.77) 26.63 (2.19) 3.45 (0.11) P-valuef 0.036 0.017 0.019 0.029 0.017
aDW: dry weight basis; bNDF: Neutral detergent fibre; cMean of duplicate values; dStandard deviation; ePVA: Provitamin A; fKruskal Wallis test; Values in bold indicate p<0.05.
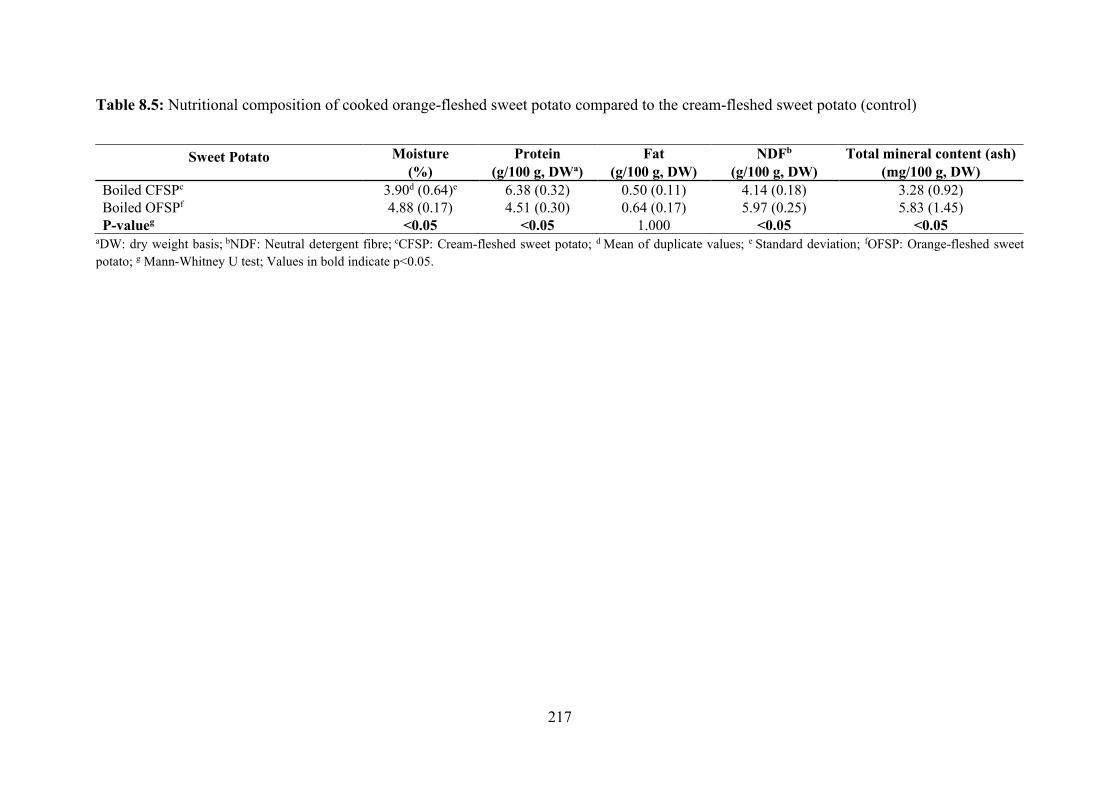
217
Table 8.5: Nutritional composition of cooked orange-fleshed sweet potato compared to the cream-fleshed sweet potato (control)
aDW: dry weight basis; bNDF: Neutral detergent fibre; cCFSP: Cream-fleshed sweet potato; d Mean of duplicate values; e Standard deviation; fOFSP: Orange-fleshed sweet potato; g Mann-Whitney U test; Values in bold indicate p<0.05.
Sweet Potato Moisture Protein Fat NDFb Total mineral content (ash)
(%) (g/100 g, DWa) (g/100 g, DW) (g/100 g, DW) (mg/100 g, DW) Boiled CFSPc 3.90d (0.64)e 6.38 (0.32) 0.50 (0.11) 4.14 (0.18) 3.28 (0.92) Boiled OFSPf 4.88 (0.17) 4.51 (0.30) 0.64 (0.17) 5.97 (0.25) 5.83 (1.45) P-valueg <0.05 <0.05 1.000 <0.05 <0.05
218
8.3.2 Amino acid content of uncooked and cooked food samples Results from the Kruskal Wallis test showed that the concentration of the essential amino acids
histidine, lysine, and phenylalanine (Table 8.6) differed significantly (p<0.05) across the 13
food samples analysed (Table 8.7). Further analysis with the Mann-Whitney U test revealed
specific differences in nutrient concentrations, which are described below.
Lysine concentration in white maize meal/flour (control) (0.40 g/100 g) was not
significantly different from the lysine concentration in PVA-biofortified maize meal/flour (0.36
g/100 g) (p=1.000). There was no significant difference in lysine concentration between PVA-
biofortified phutu and curried cabbage (0.27 g/100 g) and curried bambara groundnut (1.80
g/100 g) (p=1.000 and 0.183, respectively). However, the lysine content was 11.53 g/100 g
higher in curried chicken than in PVA-biofortified flour (p<0.05). The curried chicken had an
11.22 g/100 g and 10.01 g/100 g higher lysine concentration in comparison to curried cabbage
and curried bambara groundnut, respectively (p<0.05). Although not statistically significant,
the mean lysine concentration was higher in curried bambara groundnut (1.80 g/100g) than in
curried cabbage (0.59 g/100g). The lysine concentration did not change when white phutu
(control) was replaced with PVA-biofortified phutu in all three composite dishes. When
comparing the three composite dishes containing PVA-biofortified phutu, it was evident that
there was no significant difference in the lysine concentration (p>0.05). Orange-fleshed sweet
potato had higher lysine, isoleucine, leucine, aspartate, glutamate and alanine concentration,
but a lower phenylalanine concentration than CFSP (Tables 8.8 and 8.9) (p<0.05).
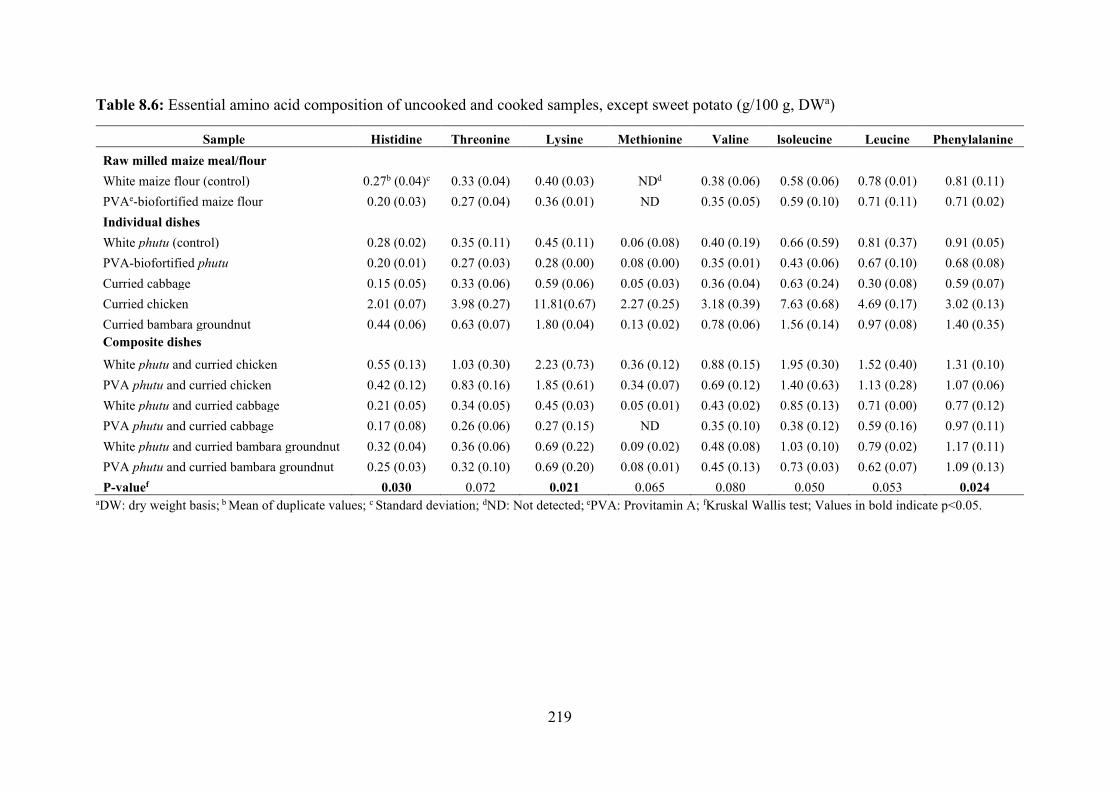
219
Table 8.6: Essential amino acid composition of uncooked and cooked samples, except sweet potato (g/100 g, DWa)
Sample Histidine Threonine Lysine Methionine Valine lsoleucine Leucine Phenylalanine Raw milled maize meal/flour White maize flour (control) 0.27b (0.04)c 0.33 (0.04) 0.40 (0.03) NDd 0.38 (0.06) 0.58 (0.06) 0.78 (0.01) 0.81 (0.11) PVAe-biofortified maize flour 0.20 (0.03) 0.27 (0.04) 0.36 (0.01) ND 0.35 (0.05) 0.59 (0.10) 0.71 (0.11) 0.71 (0.02) Individual dishes White phutu (control) 0.28 (0.02) 0.35 (0.11) 0.45 (0.11) 0.06 (0.08) 0.40 (0.19) 0.66 (0.59) 0.81 (0.37) 0.91 (0.05) PVA-biofortified phutu 0.20 (0.01) 0.27 (0.03) 0.28 (0.00) 0.08 (0.00) 0.35 (0.01) 0.43 (0.06) 0.67 (0.10) 0.68 (0.08) Curried cabbage 0.15 (0.05) 0.33 (0.06) 0.59 (0.06) 0.05 (0.03) 0.36 (0.04) 0.63 (0.24) 0.30 (0.08) 0.59 (0.07) Curried chicken 2.01 (0.07) 3.98 (0.27) 11.81(0.67) 2.27 (0.25) 3.18 (0.39) 7.63 (0.68) 4.69 (0.17) 3.02 (0.13) Curried bambara groundnut 0.44 (0.06) 0.63 (0.07) 1.80 (0.04) 0.13 (0.02) 0.78 (0.06) 1.56 (0.14) 0.97 (0.08) 1.40 (0.35) Composite dishes White phutu and curried chicken 0.55 (0.13) 1.03 (0.30) 2.23 (0.73) 0.36 (0.12) 0.88 (0.15) 1.95 (0.30) 1.52 (0.40) 1.31 (0.10) PVA phutu and curried chicken 0.42 (0.12) 0.83 (0.16) 1.85 (0.61) 0.34 (0.07) 0.69 (0.12) 1.40 (0.63) 1.13 (0.28) 1.07 (0.06) White phutu and curried cabbage 0.21 (0.05) 0.34 (0.05) 0.45 (0.03) 0.05 (0.01) 0.43 (0.02) 0.85 (0.13) 0.71 (0.00) 0.77 (0.12) PVA phutu and curried cabbage 0.17 (0.08) 0.26 (0.06) 0.27 (0.15) ND 0.35 (0.10) 0.38 (0.12) 0.59 (0.16) 0.97 (0.11) White phutu and curried bambara groundnut 0.32 (0.04) 0.36 (0.06) 0.69 (0.22) 0.09 (0.02) 0.48 (0.08) 1.03 (0.10) 0.79 (0.02) 1.17 (0.11) PVA phutu and curried bambara groundnut 0.25 (0.03) 0.32 (0.10) 0.69 (0.20) 0.08 (0.01) 0.45 (0.13) 0.73 (0.03) 0.62 (0.07) 1.09 (0.13) P-valuef 0.030 0.072 0.021 0.065 0.080 0.050 0.053 0.024
aDW: dry weight basis; b Mean of duplicate values; c Standard deviation; dND: Not detected; ePVA: Provitamin A; fKruskal Wallis test; Values in bold indicate p<0.05.
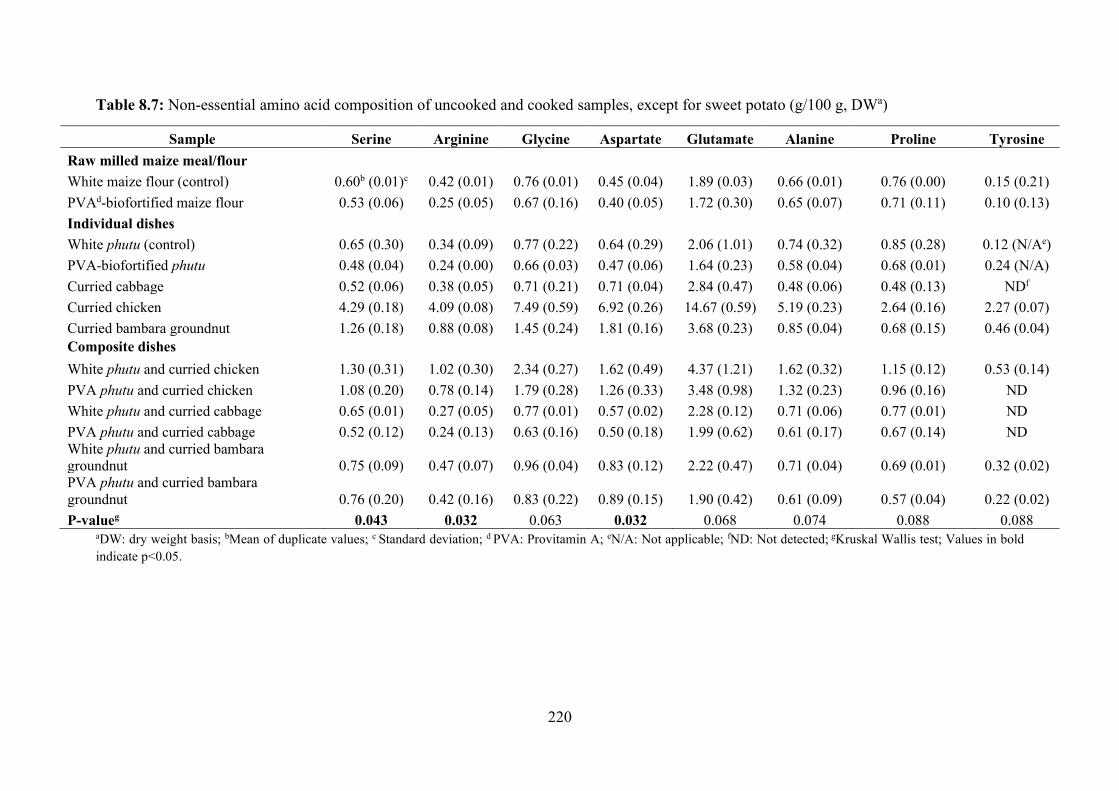
220
Table 8.7: Non-essential amino acid composition of uncooked and cooked samples, except for sweet potato (g/100 g, DWa)
Sample Serine Arginine Glycine Aspartate Glutamate Alanine Proline Tyrosine Raw milled maize meal/flour White maize flour (control) 0.60b (0.01)c 0.42 (0.01) 0.76 (0.01) 0.45 (0.04) 1.89 (0.03) 0.66 (0.01) 0.76 (0.00) 0.15 (0.21) PVAd-biofortified maize flour 0.53 (0.06) 0.25 (0.05) 0.67 (0.16) 0.40 (0.05) 1.72 (0.30) 0.65 (0.07) 0.71 (0.11) 0.10 (0.13) Individual dishes White phutu (control) 0.65 (0.30) 0.34 (0.09) 0.77 (0.22) 0.64 (0.29) 2.06 (1.01) 0.74 (0.32) 0.85 (0.28) 0.12 (N/Ae) PVA-biofortified phutu 0.48 (0.04) 0.24 (0.00) 0.66 (0.03) 0.47 (0.06) 1.64 (0.23) 0.58 (0.04) 0.68 (0.01) 0.24 (N/A) Curried cabbage 0.52 (0.06) 0.38 (0.05) 0.71 (0.21) 0.71 (0.04) 2.84 (0.47) 0.48 (0.06) 0.48 (0.13) NDf Curried chicken 4.29 (0.18) 4.09 (0.08) 7.49 (0.59) 6.92 (0.26) 14.67 (0.59) 5.19 (0.23) 2.64 (0.16) 2.27 (0.07) Curried bambara groundnut 1.26 (0.18) 0.88 (0.08) 1.45 (0.24) 1.81 (0.16) 3.68 (0.23) 0.85 (0.04) 0.68 (0.15) 0.46 (0.04) Composite dishes White phutu and curried chicken 1.30 (0.31) 1.02 (0.30) 2.34 (0.27) 1.62 (0.49) 4.37 (1.21) 1.62 (0.32) 1.15 (0.12) 0.53 (0.14) PVA phutu and curried chicken 1.08 (0.20) 0.78 (0.14) 1.79 (0.28) 1.26 (0.33) 3.48 (0.98) 1.32 (0.23) 0.96 (0.16) ND White phutu and curried cabbage 0.65 (0.01) 0.27 (0.05) 0.77 (0.01) 0.57 (0.02) 2.28 (0.12) 0.71 (0.06) 0.77 (0.01) ND PVA phutu and curried cabbage 0.52 (0.12) 0.24 (0.13) 0.63 (0.16) 0.50 (0.18) 1.99 (0.62) 0.61 (0.17) 0.67 (0.14) ND White phutu and curried bambara groundnut 0.75 (0.09) 0.47 (0.07) 0.96 (0.04) 0.83 (0.12) 2.22 (0.47) 0.71 (0.04) 0.69 (0.01) 0.32 (0.02) PVA phutu and curried bambara groundnut 0.76 (0.20) 0.42 (0.16) 0.83 (0.22) 0.89 (0.15) 1.90 (0.42) 0.61 (0.09) 0.57 (0.04) 0.22 (0.02) P-valueg 0.043 0.032 0.063 0.032 0.068 0.074 0.088 0.088
aDW: dry weight basis; bMean of duplicate values; c Standard deviation; d PVA: Provitamin A; eN/A: Not applicable; fND: Not detected; gKruskal Wallis test; Values in bold indicate p<0.05.
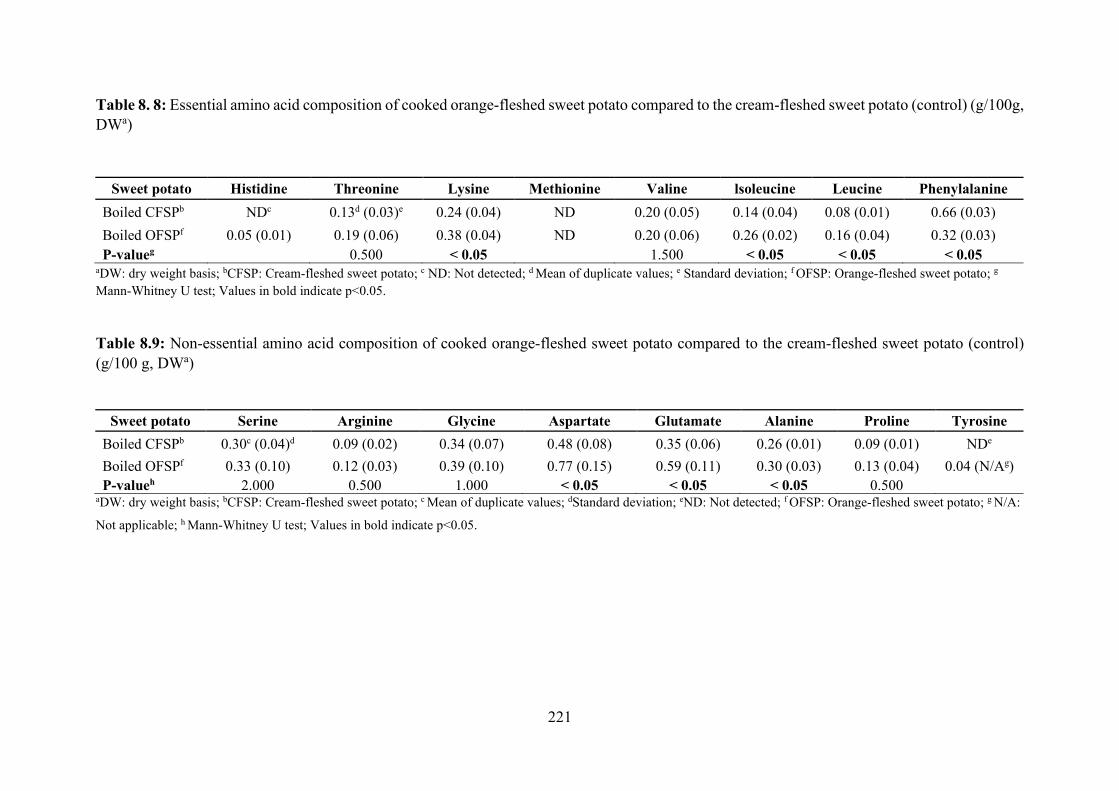
221
Table 8. 8: Essential amino acid composition of cooked orange-fleshed sweet potato compared to the cream-fleshed sweet potato (control) (g/100g, DWa)
aDW: dry weight basis; bCFSP: Cream-fleshed sweet potato; c ND: Not detected; d Mean of duplicate values; e Standard deviation; f OFSP: Orange-fleshed sweet potato; g Mann-Whitney U test; Values in bold indicate p<0.05.
Table 8.9: Non-essential amino acid composition of cooked orange-fleshed sweet potato compared to the cream-fleshed sweet potato (control) (g/100 g, DWa)
aDW: dry weight basis; bCFSP: Cream-fleshed sweet potato; c Mean of duplicate values; dStandard deviation; eND: Not detected; f OFSP: Orange-fleshed sweet potato; g N/A:
Not applicable; h Mann-Whitney U test; Values in bold indicate p<0.05.
Sweet potato Histidine Threonine Lysine Methionine Valine lsoleucine Leucine Phenylalanine Boiled CFSPb NDc 0.13d (0.03)e 0.24 (0.04) ND 0.20 (0.05) 0.14 (0.04) 0.08 (0.01) 0.66 (0.03) Boiled OFSPf 0.05 (0.01) 0.19 (0.06) 0.38 (0.04) ND 0.20 (0.06) 0.26 (0.02) 0.16 (0.04) 0.32 (0.03) P-valueg 0.500 < 0.05 1.500 < 0.05 < 0.05 < 0.05
Sweet potato Serine Arginine Glycine Aspartate Glutamate Alanine Proline Tyrosine Boiled CFSPb 0.30c (0.04)d 0.09 (0.02) 0.34 (0.07) 0.48 (0.08) 0.35 (0.06) 0.26 (0.01) 0.09 (0.01) NDe Boiled OFSPf 0.33 (0.10) 0.12 (0.03) 0.39 (0.10) 0.77 (0.15) 0.59 (0.11) 0.30 (0.03) 0.13 (0.04) 0.04 (N/Ag) P-valueh 2.000 0.500 1.000 < 0.05 < 0.05 < 0.05 0.500

222
8.3.3 Mineral composition of uncooked and cooked food samples Results from the Kruskal Wallis test showed that the concentration of selected mineral elements
analysed differed significantly across all the 13 food samples (p<0.05), except zinc
concentration, for which no significant difference was found (Table 8.10). The Mann-Whitney
U test showed specific differences and these are described below.
Iron concentration in white maize meal/flour (control) was not significantly different from
iron concentration in the PVA-biofortified maize meal/flour (p=1.000). Provitamin A-
biofortified phutu had a 96.8 mg/100 g lower iron concentration compared with curried chicken
(p=0.001). The iron concentration of curried chicken (98.50 mg/100 g) was significantly higher
than that of curried cabbage and curried bambara groundnut (p=0.001). The iron concentration
did not change significantly when white phutu was replaced with PVA phutu in the three
composite dishes. A similar iron concentration was found in all three composite dishes
containing PVA-biofortified phutu. The zinc concentration of CFSP was significantly higher
than that of OFSP, but the OFSP had a significantly higher iron concentration than the CFSP.
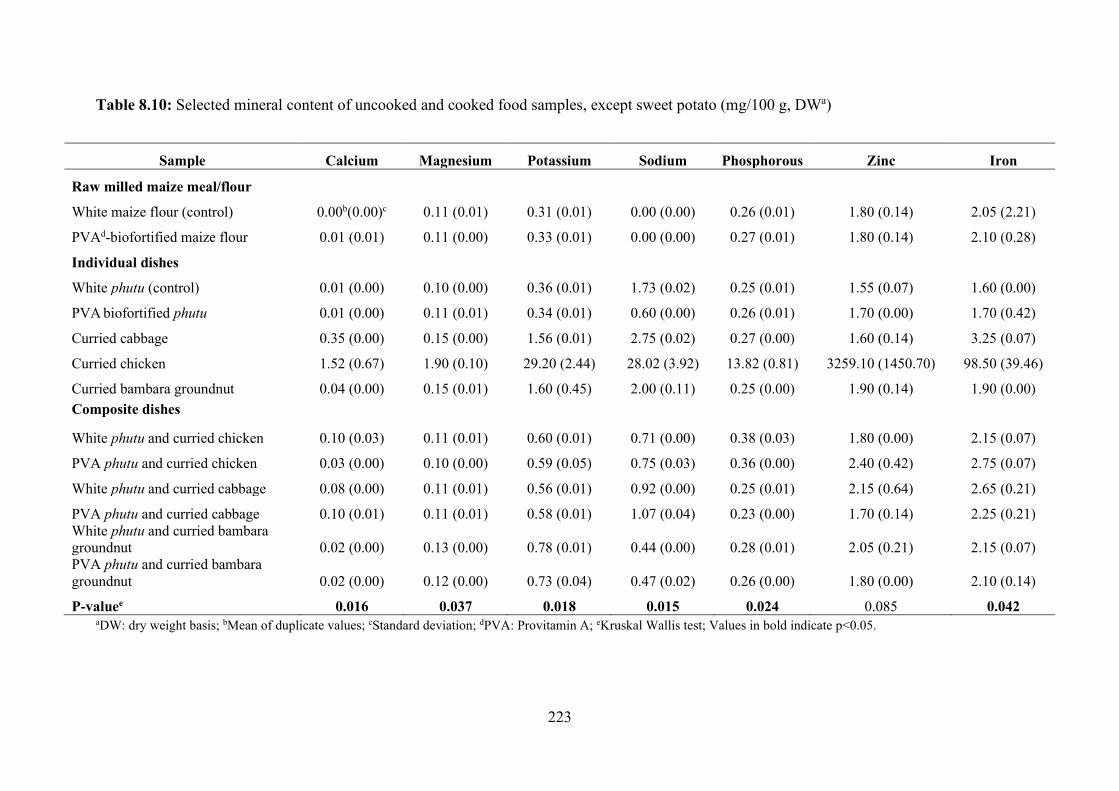
223
Table 8.10: Selected mineral content of uncooked and cooked food samples, except sweet potato (mg/100 g, DWa)
Sample Calcium Magnesium Potassium Sodium Phosphorous Zinc Iron
Raw milled maize meal/flour White maize flour (control) 0.00b(0.00)c 0.11 (0.01) 0.31 (0.01) 0.00 (0.00) 0.26 (0.01) 1.80 (0.14) 2.05 (2.21)
PVAd-biofortified maize flour 0.01 (0.01) 0.11 (0.00) 0.33 (0.01) 0.00 (0.00) 0.27 (0.01) 1.80 (0.14) 2.10 (0.28)
Individual dishes White phutu (control) 0.01 (0.00) 0.10 (0.00) 0.36 (0.01) 1.73 (0.02) 0.25 (0.01) 1.55 (0.07) 1.60 (0.00)
PVA biofortified phutu 0.01 (0.00) 0.11 (0.01) 0.34 (0.01) 0.60 (0.00) 0.26 (0.01) 1.70 (0.00) 1.70 (0.42)
Curried cabbage 0.35 (0.00) 0.15 (0.00) 1.56 (0.01) 2.75 (0.02) 0.27 (0.00) 1.60 (0.14) 3.25 (0.07)
Curried chicken 1.52 (0.67) 1.90 (0.10) 29.20 (2.44) 28.02 (3.92) 13.82 (0.81) 3259.10 (1450.70) 98.50 (39.46)
Curried bambara groundnut 0.04 (0.00) 0.15 (0.01) 1.60 (0.45) 2.00 (0.11) 0.25 (0.00) 1.90 (0.14) 1.90 (0.00) Composite dishes White phutu and curried chicken 0.10 (0.03) 0.11 (0.01) 0.60 (0.01) 0.71 (0.00) 0.38 (0.03) 1.80 (0.00) 2.15 (0.07)
PVA phutu and curried chicken 0.03 (0.00) 0.10 (0.00) 0.59 (0.05) 0.75 (0.03) 0.36 (0.00) 2.40 (0.42) 2.75 (0.07)
White phutu and curried cabbage 0.08 (0.00) 0.11 (0.01) 0.56 (0.01) 0.92 (0.00) 0.25 (0.01) 2.15 (0.64) 2.65 (0.21)
PVA phutu and curried cabbage 0.10 (0.01) 0.11 (0.01) 0.58 (0.01) 1.07 (0.04) 0.23 (0.00) 1.70 (0.14) 2.25 (0.21) White phutu and curried bambara groundnut 0.02 (0.00) 0.13 (0.00) 0.78 (0.01) 0.44 (0.00) 0.28 (0.01) 2.05 (0.21) 2.15 (0.07) PVA phutu and curried bambara groundnut 0.02 (0.00) 0.12 (0.00) 0.73 (0.04) 0.47 (0.02) 0.26 (0.00) 1.80 (0.00) 2.10 (0.14)
P-valuee 0.016 0.037 0.018 0.015 0.024 0.085 0.042 aDW: dry weight basis; bMean of duplicate values; cStandard deviation; dPVA: Provitamin A; eKruskal Wallis test; Values in bold indicate p<0.05.
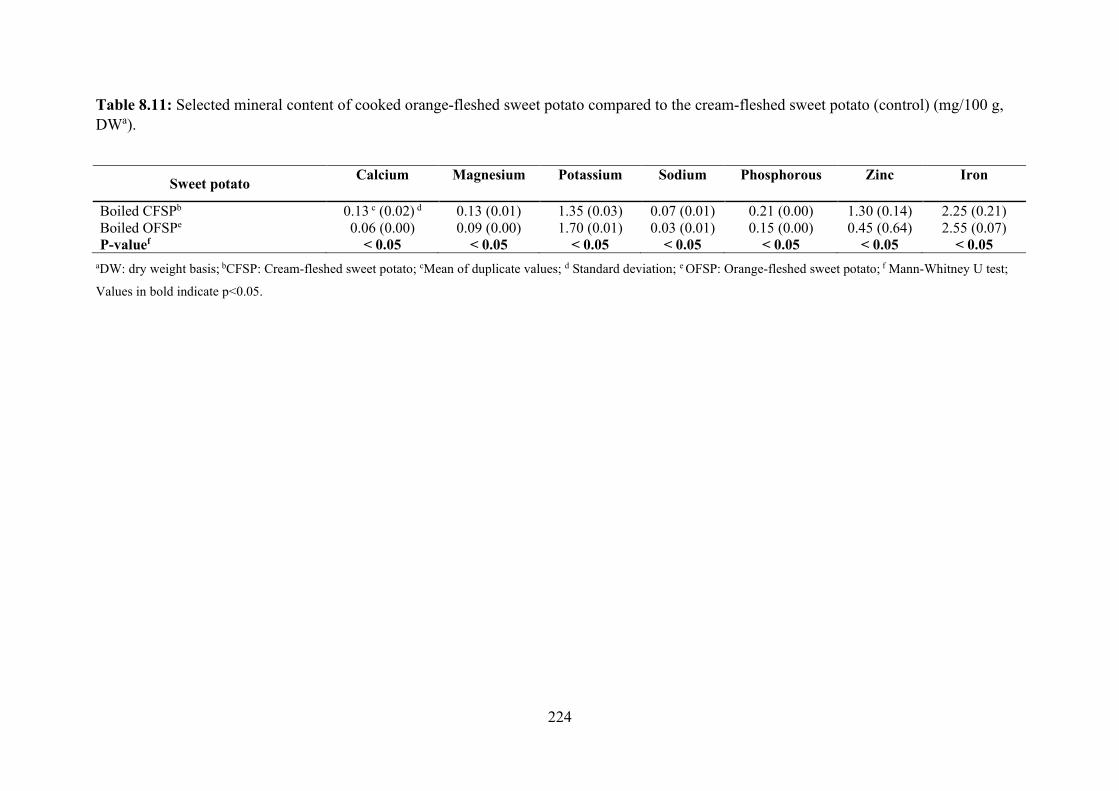
224
Table 8.11: Selected mineral content of cooked orange-fleshed sweet potato compared to the cream-fleshed sweet potato (control) (mg/100 g, DWa).
aDW: dry weight basis; bCFSP: Cream-fleshed sweet potato; cMean of duplicate values; d Standard deviation; e OFSP: Orange-fleshed sweet potato; f Mann-Whitney U test;
Values in bold indicate p<0.05.
Sweet potato Calcium Magnesium Potassium Sodium Phosphorous Zinc Iron
Boiled CFSPb 0.13 c (0.02) d 0.13 (0.01) 1.35 (0.03) 0.07 (0.01) 0.21 (0.00) 1.30 (0.14) 2.25 (0.21) Boiled OFSPe 0.06 (0.00) 0.09 (0.00) 1.70 (0.01) 0.03 (0.01) 0.15 (0.00) 0.45 (0.64) 2.55 (0.07) P-valuef < 0.05 < 0.05 < 0.05 < 0.05 < 0.05 < 0.05 < 0.05

225
8.3.4 Provitamin A (PVA) carotenoid composition of uncooked and cooked food samples Results from the Kruskal Wallis test showed that the concentration of PVA carotenoids
analysed differed significantly across the 13 food samples analysed (Table 8.12) (p<0.05). The
Mann-Whitney U test showed specific differences in nutrient concentration, as described
below.
Provitamin A-biofortified maize meal/flour had a much higher PVA carotenoid
concentration (1.43 µg/g) than white maize meal/flour (control) (0.62 µg/g) (p<0.05). The
PVA-biofortified phutu had a 0.37 µg/g, 1.13 µg/g and 0.71 µg/g higher PVA carotenoid
concentration than curried cabbage, curried chicken, and curried bambara groundnut,
respectively (p=0.039; p<0.05 and p<0.05, respectively). Both curried cabbage and bambara
groundnut had a significantly higher PVA carotenoid concentration than curried chicken
(p<0.05 and p=0.016, respectively). The composite dish that comprised PVA-biofortified phutu
and curried chicken (1.12 µg/g) had a significantly higher PVA carotenoid concentration than
the composite dish of white phutu and curried chicken (control) (0.60 µg/g) (p=0.002). The
PVA carotenoid concentration increased by 0.36 µg/g when white phutu was replaced with
PVA-biofortified phutu in the composite dish containing curried bambara groundnut (p=0.047).
The PVA carotenoid concentration of the OFSP (55.84 µg/g DW) was much higher than that
of the CFSP (0.77 µg/g DW) (control) (Table 8.13) (p<0.05).
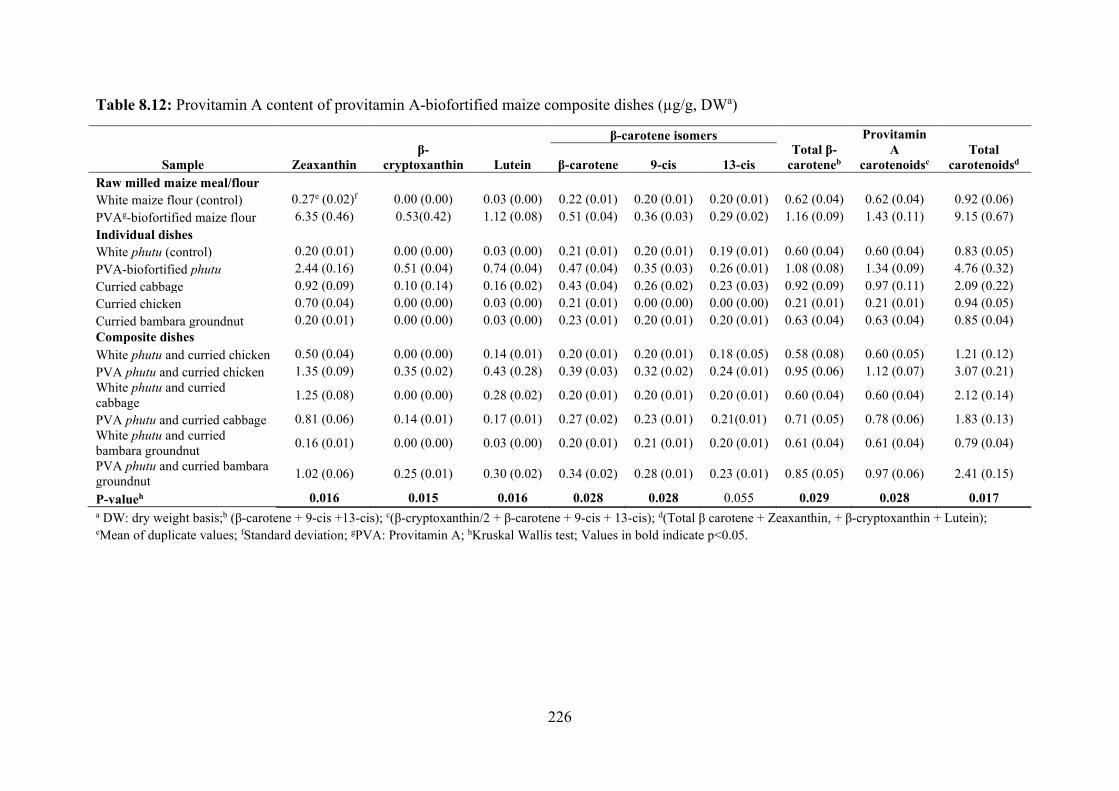
226
Table 8.12: Provitamin A content of provitamin A-biofortified maize composite dishes (µg/g, DWa)
Sample Zeaxanthin β-
cryptoxanthin Lutein
β-carotene isomers Total β-
caroteneb
Provitamin A
carotenoidsc Total
carotenoidsd β-carotene 9-cis 13-cis Raw milled maize meal/flour White maize flour (control) 0.27e (0.02)f 0.00 (0.00) 0.03 (0.00) 0.22 (0.01) 0.20 (0.01) 0.20 (0.01) 0.62 (0.04) 0.62 (0.04) 0.92 (0.06) PVAg-biofortified maize flour 6.35 (0.46) 0.53(0.42) 1.12 (0.08) 0.51 (0.04) 0.36 (0.03) 0.29 (0.02) 1.16 (0.09) 1.43 (0.11) 9.15 (0.67) Individual dishes White phutu (control) 0.20 (0.01) 0.00 (0.00) 0.03 (0.00) 0.21 (0.01) 0.20 (0.01) 0.19 (0.01) 0.60 (0.04) 0.60 (0.04) 0.83 (0.05) PVA-biofortified phutu 2.44 (0.16) 0.51 (0.04) 0.74 (0.04) 0.47 (0.04) 0.35 (0.03) 0.26 (0.01) 1.08 (0.08) 1.34 (0.09) 4.76 (0.32) Curried cabbage 0.92 (0.09) 0.10 (0.14) 0.16 (0.02) 0.43 (0.04) 0.26 (0.02) 0.23 (0.03) 0.92 (0.09) 0.97 (0.11) 2.09 (0.22) Curried chicken 0.70 (0.04) 0.00 (0.00) 0.03 (0.00) 0.21 (0.01) 0.00 (0.00) 0.00 (0.00) 0.21 (0.01) 0.21 (0.01) 0.94 (0.05) Curried bambara groundnut 0.20 (0.01) 0.00 (0.00) 0.03 (0.00) 0.23 (0.01) 0.20 (0.01) 0.20 (0.01) 0.63 (0.04) 0.63 (0.04) 0.85 (0.04) Composite dishes White phutu and curried chicken 0.50 (0.04) 0.00 (0.00) 0.14 (0.01) 0.20 (0.01) 0.20 (0.01) 0.18 (0.05) 0.58 (0.08) 0.60 (0.05) 1.21 (0.12) PVA phutu and curried chicken 1.35 (0.09) 0.35 (0.02) 0.43 (0.28) 0.39 (0.03) 0.32 (0.02) 0.24 (0.01) 0.95 (0.06) 1.12 (0.07) 3.07 (0.21) White phutu and curried cabbage 1.25 (0.08) 0.00 (0.00) 0.28 (0.02) 0.20 (0.01) 0.20 (0.01) 0.20 (0.01) 0.60 (0.04) 0.60 (0.04) 2.12 (0.14)
PVA phutu and curried cabbage 0.81 (0.06) 0.14 (0.01) 0.17 (0.01) 0.27 (0.02) 0.23 (0.01) 0.21(0.01) 0.71 (0.05) 0.78 (0.06) 1.83 (0.13) White phutu and curried bambara groundnut 0.16 (0.01) 0.00 (0.00) 0.03 (0.00) 0.20 (0.01) 0.21 (0.01) 0.20 (0.01) 0.61 (0.04) 0.61 (0.04) 0.79 (0.04)
PVA phutu and curried bambara groundnut 1.02 (0.06) 0.25 (0.01) 0.30 (0.02) 0.34 (0.02) 0.28 (0.01) 0.23 (0.01) 0.85 (0.05) 0.97 (0.06) 2.41 (0.15)
P-valueh 0.016 0.015 0.016 0.028 0.028 0.055 0.029 0.028 0.017 a DW: dry weight basis;b (β-carotene + 9-cis +13-cis); c(β-cryptoxanthin/2 + β-carotene + 9-cis + 13-cis); d(Total β carotene + Zeaxanthin, + β-cryptoxanthin + Lutein); eMean of duplicate values; fStandard deviation; gPVA: Provitamin A; hKruskal Wallis test; Values in bold indicate p<0.05.

227
Table 8.13: Provitamin A content of cooked orange-fleshed sweet potato compared to the cream-fleshed sweet potato (control (µg/g, DWa)
aDW: dry weight basis; b(β-carotene + 9-cis +13-cis); c(β-cryptoxanthin/2 + β-carotene + 9-cis + 13-cis); d(Total β carotene + Zeaxanthin, + β-cryptoxanthin + Lutein); eCFSP: Cream-fleshed sweet potato; f Mean of duplicate values; gStandard deviation; hOFSP: Orange-fleshed sweet potato; iMann-Whitney U test; Values in bold indicate p<0.05.
Sweet potato Zeaxanthin β-
cryptoxanthin Lutein β-carotene isomers Total β-
caroteneb
Provitamin A
carotenoidsc
Total carotenoidsd β-carotene 9-cis 13-cis
Boiled CFSPe 0.20f (0.01)g 0.10 (0.01) 0.03 (0.00) 0.27 (0.01) 0.22 (0.01) 0.23 (0.01) 0.72
(0.04) 0.77 (0.04) 1.05 (0.06)
Boiled OFSPh 0.40 (0.02) 0.35 (0.14) 0.05 (0.01) 43.29 (1.99) 3.18 (0.15) 9.20 (0.42) 55.67
(2.57) 55.84 (2.57) 56.46 (2.61)
P-valuei < 0.05 < 0.05 < 0.05 < 0.05 < 0.05 < 0.05 < 0.05 < 0.05 < 0.05

228
Table 8.14: Percentage of the Estimated Average Requirement met for vitamin A for children aged 1-5 years from the consumption of usual portions of
cooked phutu composite dishes and boiled sweet potato
a RAE (Retinol activity equivalents): 12µg β-carotene = 1 RAE; 24 µg β-cryptoxanthin = 1 RAE. Sum of β-carotene and β-cryptoxanthin using values presented in tables 8.2, 8.3, 8.12 and 8.13. (Institute of Medicine, 2006); b EAR (Estimated average requirement) (Institute of Medicine, 2006); c CFSP: Cream-fleshed sweet potato; d PVA: Provitamin A; e OFSP: Orange-fleshed sweet potato.
29 Tables 8.2 and 8.3 presents the usual portion sizes.
Food combinations29 1-3 years 4-5 years Vitamin A
content (µg/RAE)a
EARb (µg/day)
% of EAR met
Vitamin A content
(µg/RAE)
EAR (µg/day)
% of EAR met
Non-biofortified maize composite dishes White phutu and curried cabbage 8.26 210 3.9 9.78 275 3.6 White phutu and curried chicken 7.66 210 3.6 9.09 275 3.3 White phutu and curried bambara groundnut 8.97 210 4.3 10.18 275 3.7 CFSPc 9.16 210 7.6 11.52 275 4.2 Biofortified maize composite dishes PVAd-biofortified phutu and curried cabbage 10.74 210 5.1 12.72 275 4.6 PVA-biofortified phutu and curried chicken 14.86 210 7.1 17.63 275 6.4 PVA-biofortified phutu and curried bambara groundnut 14.34 210 6.8 16.27 275 5.9
OFSPe 664.23 210 316.3 835.35 275 303.8

229
8.3.5 Determining the percentage of EAR met for vitamin A from cooked phutu composite
dishes and sweet potato
Table 8.14 presents the percentage of EAR met for vitamin A for children aged 1-5 years. The
usual portion size is based on Table 8.2 and 8.3. Table 8.14 indicates that none of the PVA-
biofortified phutu composite dishes met the EAR for vitamin A. However, the OFSP met
approximately three times the EAR for vitamin A for children aged 1-3 years and 4-5 years.
8.4 Discussion
Globally, about two billion people suffer from micronutrient malnutrition, mainly because of
low dietary diversity (Smuts et al., 2005; Bain et al., 2013). Undernutrition, particularly protein-
energy malnutrition and micronutrient deficiencies are more prevalent in developing regions,
especially SSA, where a significant proportion of the population groups are poor and food
insecure (Labadarios and Van Middelkoop, 1995; Smuts et al., 2005; Pinstrup-Andersen, 2009;
Bain et al., 2013). Poor communities cannot afford a nutritious, diversified diet and are heavily
reliant on monotonous diets of starchy staples, which are generally low in essential nutrients,
including micronutrients and protein (Altman et al., 2009; StatsSA, 2017; StatsSA, 2018).
Among the micronutrient deficiencies, VAD as well as iron and zinc deficiencies, are generally
leading (WHO, 2015). This emphasises the need to provide affordable, alternative food sources
of essential nutrients, such as vitamin A, zinc, iron, and protein. Biofortified staple crops, which
are being developed to contain much higher concentrations of target nutrients, like vitamins and
minerals, compared to the corresponding non-biofortified crops, if consumed regularly, would
result in significant improvements in human health and nutrition (WHO, 2018).
As is the case with most of the countries in the SSA region, micronutrient deficiencies,
especially vitamin A deficiency (VAD), are a significant problem in SA (Labadarios and Van
Middelkoop, 1995; Labadarios et al., 2008; Shisana et al., 2013). The KZN province has the
largest proportion of poor households in SA and has been one of the poorest provinces in SA
since 2011 (Argent et al., 2009; StatsSA, 2017). Many of these impoverished communities are
unable to purchase foods that form a diversified diet and end up consuming mainly starch-based
foods (Smuts et al., 2005). A basic food basket in SA, comprising 28 items costs about
R883.16/month, which is unaffordable to most rural population groups (NAMC, 2019). Poor
households are at a high risk of malnutrition, as they cannot afford a diversified diet (Wenhold
et al., 2012; Mabhaudhi et al., 2016). Increasing the concentration of provitamin A carotenoids
in staple crops through biofortification is a promising strategy for contribution to combating
VAD. The results of this study are encouraging, as they indicate that PVA-biofortified maize
230
contained a much higher PVA carotenoid concentration compared to white maize (control),
which is consistent with a previous study (Pillay et al., 2014).
It appears that, currently, there are no published data on the nutritional composition of
composite dishes containing PVA-biofortified maize food products like phutu. However, when
either curried cabbage, chicken, or bambara groundnut were combined with PVA-biofortified
phutu, the PVA carotenoid concentration of the composite dishes was higher than that of the
corresponding composite dishes containing white maize (controls). The results indicate that
composite dishes in which PVA-biofortified phutu is combined with other commonly
consumed food items would be suitable carriers of provitamin A, for delivery to the target
population groups, such as the poor, rural communities of KZN. In the current study, bambara
groundnut was included in the dishes containing maize, because it could be used as an
affordable protein source, with the added advantage of thriving in the predominantly harsh agro-
ecological conditions of most of the marginal rural areas of sub-Saharan African countries,
including the rural areas of KZN (Chibarabada et al., 2017). Previous consumer acceptability
studies conducted on bambara groundnut showed promising results, but the studies investigated
bambara groundnut food types different from that of the current study (Okafor et al., 2015;
Oyeyinka et al., 2017; Oyeyinka et al., 2018). In terms of nutritional composition, the composite
dish consisting of PVA-biofortified phutu and curried bambara groundnut shows a potential for
improving the vitamin A and protein status of vulnerable population groups, but the
acceptability of such dishes to the target population groups should be investigated, because
bambara groundnut is not a familiar food item to the majority of South Africans (Oyeyinka et
al., 2017).
While it is important to note that PVA carotenoids must be converted into vitamin A to be
used by the human body (La Frano et al., 2014), a study conducted by Palmer et al. (2016),
found improved serum β-carotene levels in Zambian pre-school children that routinely
consumed dishes prepared with biofortified maize (Palmer et al., 2016). Other studies have
found that the consumption of biofortified maize resulted in an effective conversion of PVA
into vitamin A (Li et al., 2010; Muzhingi et al., 2011). These results reinforce the hypothesis
that PVA biofortified maize could be used as a sustainable and effective complementary
strategy to address VAD. This study further investigated the percentage of the EAR for vitamin
A that could be met in the 1-3- and 4-5-year age groups with the consumption of usual portions
of PVA-biofortified phutu and curried cabbage, PVA-biofortified phutu and curried chicken
and PVA-biofortified phutu and curried bambara groundnut. It was found that although all three
PVA-biofortified phutu composite dishes contained a higher vitamin A concentration, these
231
combinations did not meet the EAR for vitamin A for the 1-3- and 4-5-year age groups. This
was different from a study conducted by Pillay (2011) who found that the consumption of usual
portions of PVA-biofortified maize products (thin porridge, phutu and samp) would meet a
significant portion of the EAR for vitamin A if consumed three times a day. A study limitation
of the current study was that only one variety of PVA-biofortified maize was used in the study
and if other varieties were used at a higher PVA carotenoid content and served three times a
day, a similar result to Pillay (2011) could have been obtained.
The PVA carotenoid concentration of OFSP was much higher than that of the CFSP, which,
was expected. The PVA values obtained for CFSP in the current study agree with values
reported in the literature (Williams et al., 2013). The high PVA carotenoid concentration in
OFSP could contribute to reducing VAD in vulnerable population groups. Another strategy that
could be investigated is combining OFSP with other commonly consumed food item/s to
enhance the nutrient content of the dishes, including provitamin A as well as other
micronutrients with a high prevalence of deficiency. However, this study did not investigate the
nutritional composition of composite dishes of OFSP combined with other commonly
consumed food items, and, therefore, further investigations are required.
The study further investigated whether the consumption of usual portions of OFSP by the
1-3- and 4-5-year age groups would meet the EAR for vitamin A and found that it met more
than three times the EAR value for vitamin A for both age groups. When comparing the vitamin
A values to the tolerable upper intake level (UL), it was found that the vitamin A intake from
OFSP was higher than the UL for the 1-3-year age group (600 µg/day), but lower than the UL
for the 4-5 year age group (900 µg/day). Although the vitamin A intake was higher than the UL
in the 1-3-year age group, it will not cause any adverse effects. Orange-fleshed sweet potato
contains vitamin A in the form of PVA carotenoids. In the human body PVA carotenoids are
converted to vitamin A as required, thus consuming foods that are high in PVA carotenoids will
not cause toxicity (Mezzomo and Ferreira, 2016). The current study results are encouraging as
it indicates that OFSP could possibly be used to reduce the VAD prevalence in children under
the age of five years, investigated in this study.
As stated earlier, mineral deficiencies, especially iron and zinc deficiencies, are a serious
health problem in SSA countries, including SA, but, unfortunately, they are often unnoticed
and are not routinely treated. In the current study, the total mineral content (ash) of the
individual curries (cabbage, chicken, and bambara groundnut, separately) was higher than that
of PVA-biofortified phutu, which implies that the mineral content would be increased if either
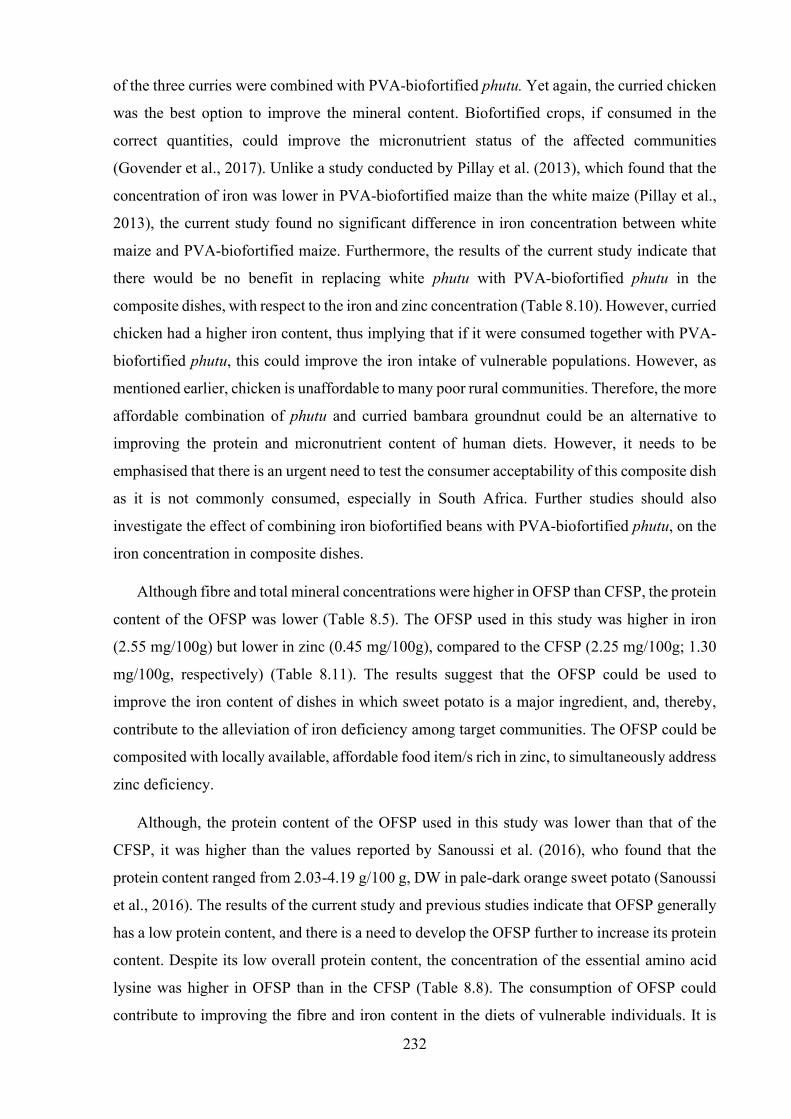
232
of the three curries were combined with PVA-biofortified phutu. Yet again, the curried chicken
was the best option to improve the mineral content. Biofortified crops, if consumed in the
correct quantities, could improve the micronutrient status of the affected communities
(Govender et al., 2017). Unlike a study conducted by Pillay et al. (2013), which found that the
concentration of iron was lower in PVA-biofortified maize than the white maize (Pillay et al.,
2013), the current study found no significant difference in iron concentration between white
maize and PVA-biofortified maize. Furthermore, the results of the current study indicate that
there would be no benefit in replacing white phutu with PVA-biofortified phutu in the
composite dishes, with respect to the iron and zinc concentration (Table 8.10). However, curried
chicken had a higher iron content, thus implying that if it were consumed together with PVA-
biofortified phutu, this could improve the iron intake of vulnerable populations. However, as
mentioned earlier, chicken is unaffordable to many poor rural communities. Therefore, the more
affordable combination of phutu and curried bambara groundnut could be an alternative to
improving the protein and micronutrient content of human diets. However, it needs to be
emphasised that there is an urgent need to test the consumer acceptability of this composite dish
as it is not commonly consumed, especially in South Africa. Further studies should also
investigate the effect of combining iron biofortified beans with PVA-biofortified phutu, on the
iron concentration in composite dishes.
Although fibre and total mineral concentrations were higher in OFSP than CFSP, the protein
content of the OFSP was lower (Table 8.5). The OFSP used in this study was higher in iron
(2.55 mg/100g) but lower in zinc (0.45 mg/100g), compared to the CFSP (2.25 mg/100g; 1.30
mg/100g, respectively) (Table 8.11). The results suggest that the OFSP could be used to
improve the iron content of dishes in which sweet potato is a major ingredient, and, thereby,
contribute to the alleviation of iron deficiency among target communities. The OFSP could be
composited with locally available, affordable food item/s rich in zinc, to simultaneously address
zinc deficiency.
Although, the protein content of the OFSP used in this study was lower than that of the
CFSP, it was higher than the values reported by Sanoussi et al. (2016), who found that the
protein content ranged from 2.03-4.19 g/100 g, DW in pale-dark orange sweet potato (Sanoussi
et al., 2016). The results of the current study and previous studies indicate that OFSP generally
has a low protein content, and there is a need to develop the OFSP further to increase its protein
content. Despite its low overall protein content, the concentration of the essential amino acid
lysine was higher in OFSP than in the CFSP (Table 8.8). The consumption of OFSP could
contribute to improving the fibre and iron content in the diets of vulnerable individuals. It is
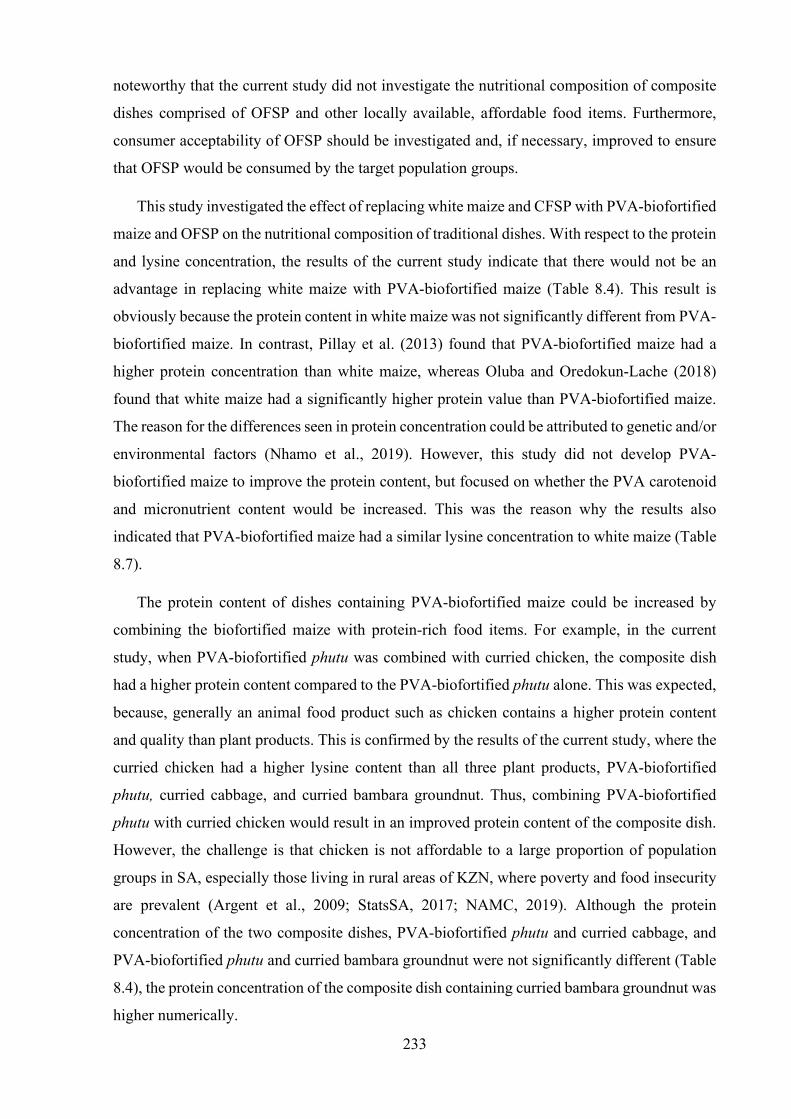
233
noteworthy that the current study did not investigate the nutritional composition of composite
dishes comprised of OFSP and other locally available, affordable food items. Furthermore,
consumer acceptability of OFSP should be investigated and, if necessary, improved to ensure
that OFSP would be consumed by the target population groups.
This study investigated the effect of replacing white maize and CFSP with PVA-biofortified
maize and OFSP on the nutritional composition of traditional dishes. With respect to the protein
and lysine concentration, the results of the current study indicate that there would not be an
advantage in replacing white maize with PVA-biofortified maize (Table 8.4). This result is
obviously because the protein content in white maize was not significantly different from PVA-
biofortified maize. In contrast, Pillay et al. (2013) found that PVA-biofortified maize had a
higher protein concentration than white maize, whereas Oluba and Oredokun-Lache (2018)
found that white maize had a significantly higher protein value than PVA-biofortified maize.
The reason for the differences seen in protein concentration could be attributed to genetic and/or
environmental factors (Nhamo et al., 2019). However, this study did not develop PVA-
biofortified maize to improve the protein content, but focused on whether the PVA carotenoid
and micronutrient content would be increased. This was the reason why the results also
indicated that PVA-biofortified maize had a similar lysine concentration to white maize (Table
8.7).
The protein content of dishes containing PVA-biofortified maize could be increased by
combining the biofortified maize with protein-rich food items. For example, in the current
study, when PVA-biofortified phutu was combined with curried chicken, the composite dish
had a higher protein content compared to the PVA-biofortified phutu alone. This was expected,
because, generally an animal food product such as chicken contains a higher protein content
and quality than plant products. This is confirmed by the results of the current study, where the
curried chicken had a higher lysine content than all three plant products, PVA-biofortified
phutu, curried cabbage, and curried bambara groundnut. Thus, combining PVA-biofortified
phutu with curried chicken would result in an improved protein content of the composite dish.
However, the challenge is that chicken is not affordable to a large proportion of population
groups in SA, especially those living in rural areas of KZN, where poverty and food insecurity
are prevalent (Argent et al., 2009; StatsSA, 2017; NAMC, 2019). Although the protein
concentration of the two composite dishes, PVA-biofortified phutu and curried cabbage, and
PVA-biofortified phutu and curried bambara groundnut were not significantly different (Table
8.4), the protein concentration of the composite dish containing curried bambara groundnut was
higher numerically.
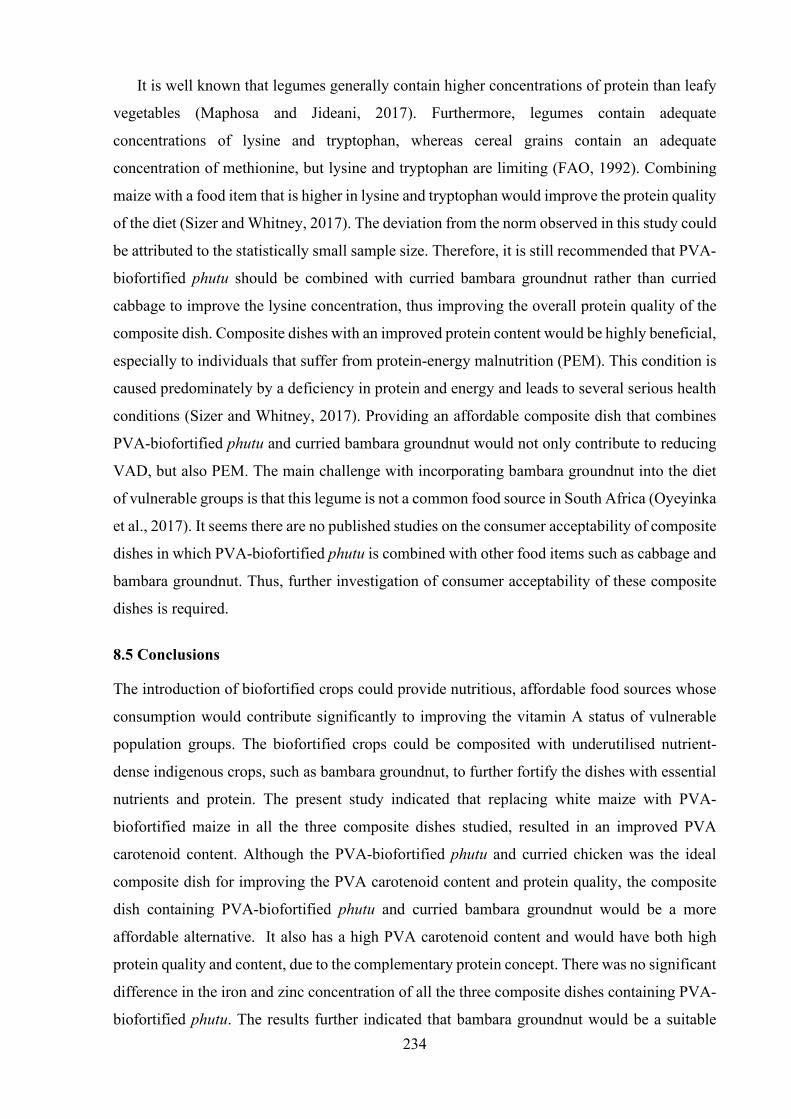
234
It is well known that legumes generally contain higher concentrations of protein than leafy
vegetables (Maphosa and Jideani, 2017). Furthermore, legumes contain adequate
concentrations of lysine and tryptophan, whereas cereal grains contain an adequate
concentration of methionine, but lysine and tryptophan are limiting (FAO, 1992). Combining
maize with a food item that is higher in lysine and tryptophan would improve the protein quality
of the diet (Sizer and Whitney, 2017). The deviation from the norm observed in this study could
be attributed to the statistically small sample size. Therefore, it is still recommended that PVA-
biofortified phutu should be combined with curried bambara groundnut rather than curried
cabbage to improve the lysine concentration, thus improving the overall protein quality of the
composite dish. Composite dishes with an improved protein content would be highly beneficial,
especially to individuals that suffer from protein-energy malnutrition (PEM). This condition is
caused predominately by a deficiency in protein and energy and leads to several serious health
conditions (Sizer and Whitney, 2017). Providing an affordable composite dish that combines
PVA-biofortified phutu and curried bambara groundnut would not only contribute to reducing
VAD, but also PEM. The main challenge with incorporating bambara groundnut into the diet
of vulnerable groups is that this legume is not a common food source in South Africa (Oyeyinka
et al., 2017). It seems there are no published studies on the consumer acceptability of composite
dishes in which PVA-biofortified phutu is combined with other food items such as cabbage and
bambara groundnut. Thus, further investigation of consumer acceptability of these composite
dishes is required.
8.5 Conclusions
The introduction of biofortified crops could provide nutritious, affordable food sources whose
consumption would contribute significantly to improving the vitamin A status of vulnerable
population groups. The biofortified crops could be composited with underutilised nutrient-
dense indigenous crops, such as bambara groundnut, to further fortify the dishes with essential
nutrients and protein. The present study indicated that replacing white maize with PVA-
biofortified maize in all the three composite dishes studied, resulted in an improved PVA
carotenoid content. Although the PVA-biofortified phutu and curried chicken was the ideal
composite dish for improving the PVA carotenoid content and protein quality, the composite
dish containing PVA-biofortified phutu and curried bambara groundnut would be a more
affordable alternative. It also has a high PVA carotenoid content and would have both high
protein quality and content, due to the complementary protein concept. There was no significant
difference in the iron and zinc concentration of all the three composite dishes containing PVA-
biofortified phutu. The results further indicated that bambara groundnut would be a suitable
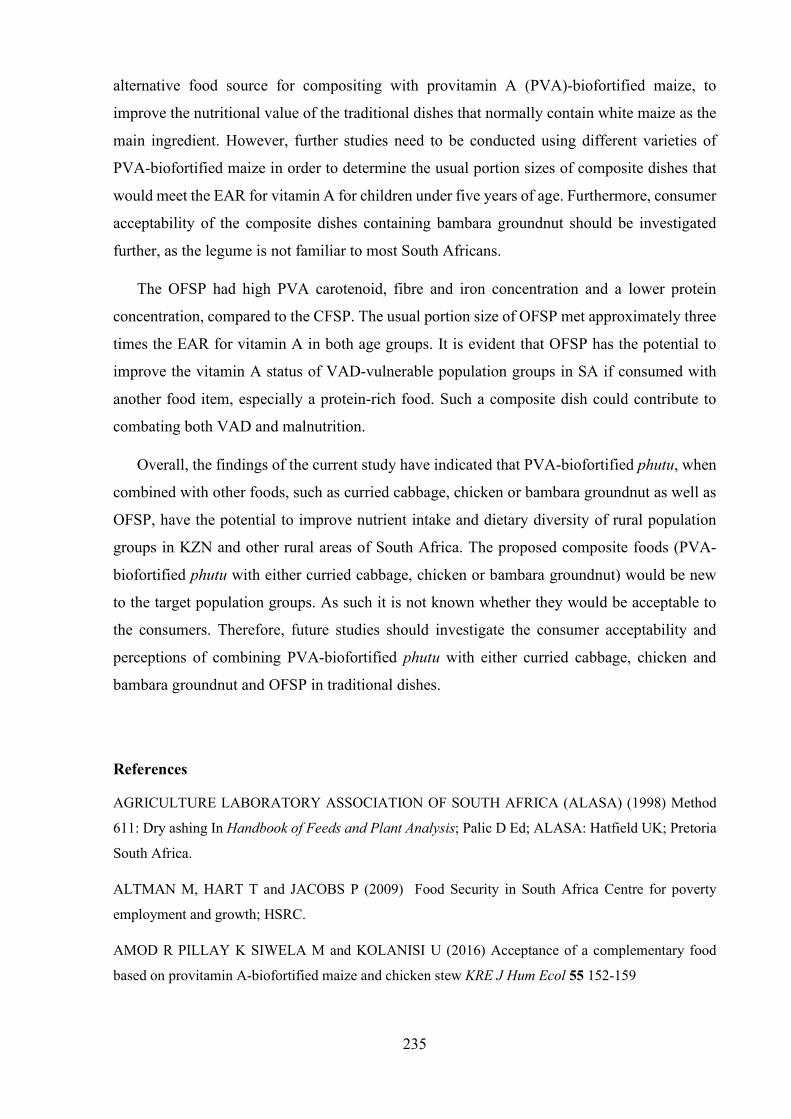
235
alternative food source for compositing with provitamin A (PVA)-biofortified maize, to
improve the nutritional value of the traditional dishes that normally contain white maize as the
main ingredient. However, further studies need to be conducted using different varieties of
PVA-biofortified maize in order to determine the usual portion sizes of composite dishes that
would meet the EAR for vitamin A for children under five years of age. Furthermore, consumer
acceptability of the composite dishes containing bambara groundnut should be investigated
further, as the legume is not familiar to most South Africans.
The OFSP had high PVA carotenoid, fibre and iron concentration and a lower protein
concentration, compared to the CFSP. The usual portion size of OFSP met approximately three
times the EAR for vitamin A in both age groups. It is evident that OFSP has the potential to
improve the vitamin A status of VAD-vulnerable population groups in SA if consumed with
another food item, especially a protein-rich food. Such a composite dish could contribute to
combating both VAD and malnutrition.
Overall, the findings of the current study have indicated that PVA-biofortified phutu, when
combined with other foods, such as curried cabbage, chicken or bambara groundnut as well as
OFSP, have the potential to improve nutrient intake and dietary diversity of rural population
groups in KZN and other rural areas of South Africa. The proposed composite foods (PVA-
biofortified phutu with either curried cabbage, chicken or bambara groundnut) would be new
to the target population groups. As such it is not known whether they would be acceptable to
the consumers. Therefore, future studies should investigate the consumer acceptability and
perceptions of combining PVA-biofortified phutu with either curried cabbage, chicken and
bambara groundnut and OFSP in traditional dishes.
References
AGRICULTURE LABORATORY ASSOCIATION OF SOUTH AFRICA (ALASA) (1998) Method
611: Dry ashing In Handbook of Feeds and Plant Analysis; Palic D Ed; ALASA: Hatfield UK; Pretoria
South Africa.
ALTMAN M, HART T and JACOBS P (2009) Food Security in South Africa Centre for poverty
employment and growth; HSRC.
AMOD R PILLAY K SIWELA M and KOLANISI U (2016) Acceptance of a complementary food
based on provitamin A-biofortified maize and chicken stew KRE J Hum Ecol 55 152-159
236
ARGENT J, FINN A, LEIBBRANDT M and WOOLARD I (2009) NIDS National Income Dynamics
Study Poverty: Analysis of the NIDS wave 1 dataset Discussion paper no13
ASSOCIATION OF OFFICIAL ANALYTICAL CHEMISTS (AOAC) (2003) Official Methods of
Analysis of the Association of Analytical Chemists International Association of Official Chemists 17th
ed Gaithersburg: AOAC International
BAIN LE AWAH PK, GERALDINE N, KINDONG NP, SIGAL Y, BERNARD N and TANJEKO AT
(2013) Malnutrition in Sub-Saharan Africa: burden causes and prospects Pan-Africa Medical J 15
120doi1011604/pamj2013151202535 http://wwwpanafrican-med-
journalcom/content/article/15/120/full/? (accessed on 28/09/18)
CHIBARABADA TP, MODI AT and MABHAUDHI T (2017) Expounding the value of grain legumes
in the semi-and arid tropics Sustain 9, 60; https://doi.org/10.3390/su9010060
CHOWDHURY S, MEENAKSHI JV, TOMLINS KI and OWORI C (2011) Are consumers in
developing countries willing to pay more for micronutrient-dense biofortified foods? Evidence from a
field experiment in Uganda Am J Agric Econ 93 83-97.
DE GROOTE H and KIMENJU SC (2008) Comparing consumer preferences for color and nutritional
quality of maize: Application of a semi-double bound logistic model on urban consumers in Kenya Food
Policy 33 362-370
DE GROOTE H, KIMENJU SC and MORAWETZ UB (2011) Estimating consumer willingness to pay
for food quality with experimental auctions: the case of yellow versus fortified maize meal in Kenya
Agric Econ 42 1-16.
DE GROOTE H, TOMLINS K, HALEEGOAH J, AWOOL M, FRIMPONG B, BANERJI A,
CHOWDURY S and MEENAKSHI JV (2010) Assessing rural consumers’ WTP for orange biofortified
maize in Ghana with experimental auctions and a stimulated radio message Contributed paper presented
at the joint 3rd African association of agricultural economics (AAAE) and 48th agricultural economist
association of South Africa (AEASA) Cape Town South Africa September 19-23 2010
DEPARTMENT OF AGRICULTURE FORESTRY AND FISHERIES (DAFF) (2017) Trends in the
Agricultural Sector 2017 1-77
http://wwwdaffgovza/Daffweb3/Portals/0/Statistics%20and%20Economic%20Analysis/Statistical%20
Information/Trends%20in%20the%20Agricultural%20Sector%202017pdf (accessed on 09/09/18)
FOOD AND AGRICULTURE ORGANISATION OF THE UNITED NATIONS (FAO) 1992 Maize in
Human Nutrition Rome Italy
FOOD AND AGRICULTURE ORGANISATION OF THE UNITED NATIONS (FAO) (2011) Quality
Assurance for Animal Feed Laboratories; FAO Animal and Health Manual; FAO: Rome Italy Volume
4

237
GOVENDER L, PILLAY K, SIWELA M, MODI A and MABHAUDHI T (2017) Food and Nutrition
Insecurity in Selected Rural Communities of KwaZulu-Natal South Africa – Linking Human Nutrition
and Agriculture Int. J. Environ. Res. Public Health 14 17 doi: 103390/ijerph14010017
HARVESTPLUS (2018) Crops: It all starts will a seed http://wwwharvestplusorg/what-we-do/crops
(accessed on 09/09/18)
HARVESTPLUS (2009a) Provitamin A Maize
http://wwwharvestplusorg/sites/default/files/HarvestPlus_Maize_Strategypdf (accessed on 09/09/18)
HARVESTPLUS (2009b) Provitamin A Sweet Potato
http://wwwharvestplusorg/sites/default/files/HarvstPlus_Sweet_Potato_Strategypdf (accessed on
09/09/18)
INSTITUTE OF MEDICINE (2006) Dietary DRI reference intakes: The essential guide to nutrient
requirements Washington DC: National Academy Press
INTERNATIONAL ANALYTICAL GROUP (2016) Section Feed Analysis International Analytical
Group: Hollywood FL USA https://wwwagesat/en/service/services-feed/feed/round-robin-tests/iag/
(accessed on 10/05/19)
LA FRANO MR, DE MOURA FF, BOY E, LÖNNERDAL B and BURRI BJ (2014) Bioavailability of
iron zinc and provitamin A carotenoids in biofortified staple crops Nutr Rev. 72 289-307
LABADARIOS D, SWART R, MAUNDER EMW, KRUGER HS, GERICKE GJ, KUZWAYO PMN,
NTSIE PR, STEYN NP, SCHLOSS I, DHANSAY MA, JOOSTE PL, DANNHAUSER A, NEL JH,
MOLEFE D and KOTZE TJVW (2008) The national food consumption survey Fortification baseline
(NFCS:FB-1) SA J Clin Nutri 21(3) (supp 2) 246-271
LABADARIOS D, and VAN MIDDELKOOP AM (1995) The South African Vitamin A Consultative
Group Children Aged 6-71 Months in South Africa 1994; Their Anthropometric Vitamin A Iron and
Immunization Coverage Status Isando South Africa
LACKER T, STROHSCHEIN S and ALBERT K (1999) Separation and identification of various
carotenoids by c30 reversed-phase high-performance liquid chromatography coupled to UV and
atmospheric pressure chemical ionization mass spectrometric detection J Chromatogr A 854 37-44
LAURIE SM and VAN HEERDEN SM (2012) Consumer acceptability of four products made from
beta-carotene-rich sweet potato Afr J Food Sci 6 96-103
LI S NUGROHO A ROCHEFORD T and WHITE WS (2010) Vitamin A equivalence of the β-carotene
in β-carotene-biofortified maize porridge consumed by women Am J Clin Nutr 92 1105-1112
238
LOW JW MWANGA ROM ANDRADE M CAREY E and BALL A (2017) Tackling vitamin A
deficiency with biofortified sweet potato in sub-Saharan Africa Glob Food Secur 14 23-30
http://dxdoiorg/101016/jgfs201701004
LOW JW and VAN JAARSVELD PJ (2008) The potential contribution of bread buns fortified with
beta-carotene-rich sweet potato in central Mozambique Food Nutrition Bulletin 29(2): 98-107
MABHAUDHI T, CHIBARABADA T and MODI A (2016) Water-food-nutrition-health nexus:
Linking water to improving food nutrition and health in Sub-Saharan Africa Int. J. Environ. Res. Public
Health 13 1-19
MEZZOMO N and FERREIRA SRS (2016) Carotenoids functionality sources and processing by
supercritical technology: a review J of Chemistry 1-16 Article ID 3164312
http://dxdoiorg/101155/2016/3164312
MITRA S (2012) Nutritional status of orange-fleshed sweet potatoes in alleviating vitamin A
malnutrition through a food-based approach J Nutri Food Sci 2 1-3
MAPHOSA Y AND JIDEANI VA (2017) The role of legumes in Human Nutrition Chapter 6 In: Hueda
MC ed Functional food Intech open doi:105772/intechopen69127
MUZHINGI T, GADAGA TH, SIWELA AH, GRUSAK MA, RUSSELL RM and Tang G (2011)
Yellow maize with high β-carotene is an effective source of vitamin A in healthy Zimbabwean men
Am J of Clinical Nutrition 94 510-519
NATIONAL AGRICULTURAL MARKETING COUNCIL (NAMC) (2019) Markets and economic
research centre: food basket price monthly https://wwwnamccoza/wp-content/uploads/2019/04/NAMC-
Food-Basket-Price-Monthly-Apr-2019pdf (accessed on 20/05/19)
NHAMO L, MATCHAYA G, MABHAUDHI T, NHLENGETHWA S, NHEMACHENA C and
MPANDELI S (2019) Cereal production trends under climate change: impacts and adaption strategies
in Southern Africa Agriculture 9 1-16 doi:103390/agriculture9020030
NUSS ET, ARSCOTT SA, BRESNAHAN K, PIXLEY KV, ROCHEFORD T, HOTZ C,
SIAMUSANTU W, CHILESHE J and TANUMIHARDJO SA (2012) Comparative intake of white-
versus orange-colored maize by Zambian children in the context of promotion of biofortified maize
Food Nutr Bull 33 63-71
OKAFOR JNC OKAFOR G LEELAVATHI K BHAGYA S and ELEMO GN (2015) Effect of roasted
bambara groundnut (voandzeia subterranean) fortification on quality and acceptability of biscuits Pak J
Nutr 14 653-657
OLUBA OM and OREDOKUN-LACHE AB (2018) Nutritional composition and glycemic index
analyses of vitamin A-biofortified maize in healthy subjects Int J Food Sci Nutr 6 2285-2292
239
OYEYINKA AT, PILLAY K and SIWELA M (2017) Consumer awareness and acceptability of
bambara groundnut as a protein source for use in complementary foods in rural KwaZulu-Natal South
Africa S Afr J Clin Nutr 30 87-92
OYEYINKA SA, TIJANI TS, OYEYINKA AT, ANSE AK, BALOGUN MA, KOLAWOLE FL,
OBALOWU MA and JOSEPH KJ (2018) Value added snacks produced from bambara groundnut (vigna
subterranean) paste or flour LWT – Food Sci Techn 58 120-131
PALMER AC, SIAMUSANTU W, CHILESHE J, SCHULZE KJ, BARFFOUR M, CRAFT NE,
MOLOBEKA N, KALUNGWANA N, ARGUELLO MA, MITRA M, CASWELL B KLEMM RD and
WEST JR KP (2016) Provitamin A-biofortified maize increases serum β-carotene but not retinol in
marginally nourished children: A cluster-randomized trial in rural Zambia Am J Clin Nutr 104 181-190
PILLAY K (2011) Nutritional quality and consumer acceptability of provitamin A-biofortified maize
Unpublished Thesis Dietetics and Human Nutrition University of KwaZulu-Natal Pietermaritzburg
http://ukzn-dspaceukznacza/handle/10413/8458
PILLAY K KHANYILE N and SIWELA M (2018) Acceptance of an orange-fleshed sweet potato
complementary food by infant caregivers in KwaZulu-Natal province-a preliminary study S Afr J Child
Health 12 100-104
PILLAY K SIWELA S DERERA J and VELDMAN FJ (2013) Influence of biofortification with pro-
vitamin A on protein selected micronutrients composition and grain quality of maize Afr J Biotech
12 5285-5293
PILLAY K SIWELA S DERERA J and VELDMAN FJ (2014) Provitamin A carotenoids in biofortified
maize and their retention during processing and preparation of South African maize foods J Food Sci
Techn 51 634-644
PINSTRUP-ANDERSEN P (2009) Food security: definition and measure J Food Sec 1 5-7
SANOUSSI AA, DANSI A, AHISSOU H, ADEBOWALE A, SANNI LO, OROBIYI A, DANSI M,
AZOKPOTA P and SANNI A (2016) Possibilities of sweet potato [ipomoea batatas (L) Lam] value
chain upgrading as revealed by physico-chemical composition on ten elites landraces of Benin Afr J
Biotechn 15 481-489
SHISANA O, LABADARIOS D, REHLE T, SIMBAYI L, ZUMA K, DHANSAY A, REDDY P,
PARKER W, HOOSAIN E, NAIDOO P, HONGORO C, MCHIZA Z, STEYN NP, DWANE N,
MAKOAE M, MALULEKE T, RAMLAGAN S, ZUNGU N, EVANS MG, JACOBS L, FABER M and
SANHANES-1 Team (2013) South African National Health and Nutrition Examination Survey
(SANHANES-1) Cape Town: HSRC Press
SIZER FS and WHITNEY EN (2017) Nutrition Concepts and Controversies 4th ed Boston: Cengage
Learning
240
SMUTS CM, DHANSAY MA, FABER M, VAN STUIJVENBERG ME, SWANEVELDER S, GROSS
R and BENADÉ AJS (2005) Efficacy of multiple micronutrient supplementation for improving anaemia
micronutrient status and growth in South Africa infants J Nutr 135 653S-659
STATISTICS SOUTH AFRICA (StatsSA) (2018) General Household Survey (2017)
http://wwwstatssagovza/publications/P0318/P03182017pdf (accessed on 26/07/18)
STATISTICS SOUTH AFRICA (StatsSA) (2017) Poverty trends in South Africa An examination of
absolute poverty between 2016 and 2015 Statistics South Africa: Pretoria
TALSMA EF, MELSE-BOONSTRA A and BROUWER ID (2017) Acceptance and adaption of
biofortified crops in low-and middle-income countries: a systematic review Nutr Rev 75 798-829
TOMLINS K, NDUNGURU C, STAMBUL K, JOSHUA N, NGENDELLO T RWIZA E AMOUR R
RAMADHANI B KAPANDE A WESTBY A (2007) Sensory evaluation and consumer acceptability
of pale-fleshed and orange-fleshed sweet potato by school children and mothers with preschool
children J Sci Food Agri 98 2320-2331
VAN SOEST PJ (1963) Use of detergents in the analysis of fibrous feeds A rapid method for the
determination of fibre lignin J Assoc Official Anal Chem 46 829-835
VAN SOEST PJ and ROBERTSON JB (1979) Systems of analysis for evaluating fibrous feeds In:
Standardisation of Analytical Methodology for Feeds; IDRC: Ottawa ON Canada
VAN SOEST PJ ROBERTSON JB and LEWIS BA (1991) Methods for dietary fiber neutral detergent
fibre and nonstarch polysaccharides in relation to animal nutrition J of Dairy Science 74(10) 3583-3597
WENHOLD F ANNANDALE J FABER M and HART T (2012) Water use and nutrient content of crop
and animal food products for improved household food security: A scoping study: report to the water
research commission TT
537/12http://wwwwrcorgza/Knowledge%20Hub%20Documents/Research%Reports/TT%20537-
12pdf (accessed on 03/09/16)
WILLIAMS R, SOARES F, PEREIRA L, BELO B, SOARES A, SETIAWAN A, BROWNE M
NESBITT H and ERSKINE W (2013) Sweet potato can contribute to both nutritional and food security
in Timor-Leste Field Crop Res 146 38-43
WORLD HEALTH ORGANISATION (WHO) (2018) Bio-fortification of staple crops
http://wwwwhoint/elena/titles/biofortification/en/ (accessed on 09/09/18)
WORLD HEALTH ORGANISATION (WHO) (2015) Micronutrients WHO: Geneva, Switzerland.
241
CHAPTER 9
ACCEPTANCE OF TRADITIONAL DISHES MADE WITH PROVITAMIN A-BIOFORTIFIED MAIZE AND ORANGE-FLESHED
SWEET POTATO IN KWAZULU-NATAL L Govender, K Pillay, M Siwela, AT Modi and T Mabhaudhi
9.1 Introduction
Worldwide, VAD is a serious health problem affecting children and pregnant women (WHO,
2019), and is particularly prevalent among countries (including SA) in developing regions,
especially SSA (Ramakrishnan, 2002; Smuts et al., 2005; Bain et al., 2013). In SA, national
studies showed that between 1994 and 2005, the VAD situation among children had worsened.
The prevalence increased from 33.3% in 1994 to 63.6% in 2005 (Labadarios and Van
Middelkoop, 1995; Labadarios et al., 2008). Additionally, the 2005 National Food
Consumption Survey-Fortification baseline (NFCS-FB) study reported that two in three women
had VAD in SA and six in ten women living in KZN had VAD. Overall, KZN had the second
highest prevalence of VAD (Labadarios and Van Middelkoop, 1995; Labadarios et al., 2000;
Labadarios et al., 2008).
The more recent 2012 South African National Health and Nutrition Examination Survey
(SANHANES-1) study found that VAD in children was still significantly high (43.6%)
(Shisana et al., 2013). The 2012 SANHANES-1 study further reported that 45.5% of rural South
Africans had VAD, and individuals with the lowest education levels were the most affected by
VAD (Shisana et al., 2013). It is important to try to improve the vitamin A status of South
Africans, especially children and vulnerable groups such as pregnant women, as vitamin A is
an essential micronutrient that has several physiological roles including immunity, vision and
protein synthesis (Webb and Whitney, 2017). Vitamin A deficiency can result in an increased
risk of mortality due to infections, thus emphasising the need to improve the vitamin A status
of vulnerable groups (UNICEF, 2019).
One of the leading factors contributing to VAD is household food and nutrition insecurity
(Pinstrup-Andersen, 2009). In comparison to other regions in the world, Africa has the highest
level of moderate (30%) and severe food insecurity (20%) (Development Initiatives, 2017).
Poor access to food, an element of food insecurity, is a common problem in SA, where 21.3%
of households have severely inadequate or inadequate food access (StatsSA, 2017a; StatsSA,

242
2018). Although the general household survey (GHS) conducted in SA in 2017 showed a 1%
decrease in the number of individuals with inadequate or severely inadequate access to food in
comparison to the 2016 GHS (StatsSA, 2017a; StatsSA, 2018), micronutrient malnutrition
remains a challenge. Suboptimal utilisation of available and accessible food is another dominant
element of food insecurity in Africa. In SA, access to and utilisation of nutritious foods are a
major problem, especially among impoverished individuals (Altman et al., 2009; StatsSA,
2018). The consumption of nutritious foods promotes human development and enables an
individual to perform the basic tasks needed for survival (Kolahdooz et al., 2013). The South
African government has implemented a number of strategies to reduce micronutrient
deficiencies. These strategies include supplementation, food fortification and dietary diversity.
Despite the implementation of these strategies, there has been no significant improvement in
the vitamin A status of the South African population (Labadarios et al., 2000; DoH and
UNICEF, 2007; Swart et al., 2008; DoH, 2018). This emphasises the need for a complementary
strategy such as biofortification to address VAD (Bouis and Saltzman, 2017).
White maize and CFSP are two commonly grown and consumed staple crops in SA (DAFF,
2017; Low et al., 2017), and are therefore ideal for PVA-biofortification (Mitra, 2012; Low et
al., 2017; DAFF, 2017). Three crops have been identified for PVA-biofortification in Africa by
HarvestPlus, namely cassava (Manihot esculenta), maize (Zea mays) and sweet potato
(Ipomoea batatas) (HarvestPlus, 2018). However, a number of studies conducted in Zambia,
SA, Kenya and Ghana found that there were challenges with consumer acceptability of
biofortified crops (De Groote and Kimenju, 2008; De Groote et al., 2010; De Groote et al.,
2011; Pillay et al., 2011; Nuss et al., 2012). The poor acceptability of PVA-biofortified crops
found in some studies may be attributed to the yellow/orange colour exhibited by carotenoid
pigments found in the crops and the strong aroma and flavour of the biofortified crops, also
attributed to the carotenoid pigments (Nuss and Tanumihardjo, 2010; Chapman, 2012). In
addition, several studies have found that a stigma attached to the consumption of PVA-
biofortified maize has negatively affected consumer acceptance of the biofortified maize crops
(De Groote and Kimenju, 2008; De Groote et al., 2010; De Groote et al., 2011; Nuss et al.,
2012). There are a number of factors that impact on the consumer acceptability of PVA-
biofortified crops, such as gender, income, education, ethnicity, geographical location and
background (Khumalo et al., 2011). Additionally, Pillay et al. (2011), found that the
acceptability of PVA-biofortified maize varied with food type, which suggested that the
acceptability of the biofortified maize could be improved by processing it into suitable food
types (Pillay et al., 2011).
243
Combining PVA-biofortified crops with other commonly consumed plant and animal food
sources, could mask any undesirable sensory properties associated with biofortified crops and
thereby increase their acceptability. For example, a study conducted by Amod et al. (2016),
found that when PVA-biofortified phutu was combined with chicken stew, its acceptability
increased (Amod et al., 2016). Additionally, PVA-biofortified composite dishes could improve
the nutritional intake of vulnerable individuals (Govender et al., 2019). A major problem in SA
is poverty; it is a leading cause of food and nutrition insecurity (Govender et al., 2016).
Currently, in 2019, a basic food basket in SA costs about R883.16/month which is a 3% increase
from 2018 (NAMC, 2019). This rise in food prices makes animal food sources unaffordable to
VAD-vulnerable population groups, who are predominantly of low socioeconomic status. Thus,
suitable food items should be sought from among the more affordable plant products for
combining with PVA-biofortified foods to improve their acceptability.
Plant products have also risen in price, but are generally cheaper than animal products
(NAMC, 2018). The most commonly consumed plant-based foods in SA are maize (milled into
maize meal) and green leafy vegetables (Modi et al., 2006; Lewu and Mavengahama, 2011). In
the KZN province, maize (cooked maize meal) and legumes are leading (Labadarios et al.,
2000; Faber et al., 2013). Legumes could be suitable for combining with PVA-biofortified
maize because they are rich in several nutrients, including protein (Huma et al., 2008). Starch-
based cereal crops such as maize have limited amounts of lysine and tryptophan (Serna-
Saldivar, 2010, p98). Lysine and tryptophan are also essential amino acids. Lysine is required
for the synthesis of peptide-hormones, antibodies, enzymes and muscle mass, whereas
tryptophan is needed as it is a precursor for niacin, nicotinamide and serotonin (Serna-Saldivar,
2010, p94). Legumes generally contain higher amounts of lysine and tryptophan and have a
lower content of sulfur-containing amino acids, especially methionine (Serna-Saldivar, 2010,
p580). Thus, the consumption of a starch-based food such as maize together with a legume such
as bambara groundnut would result in a balanced amino acid profile (Linnemann and Azam-
Ali, 1993; Mwale et al., 2007; Lichtfouse, 2016).
Bambara groundnut is an indigenous crop in Africa. It is well-adapted to and thrives in the
agronomical marginal regions (Chibarabada et al., 2017), where a significant proportion of
vulnerable population groups live in SSA countries, including SA (Labadarios et al., 2000;
Labadarios et al., 2007; Bain et al., 2013; Shisana et al., 2013). Unlike other legumes, bambara
groundnut contains the essential amino acid methionine (Mwale et al., 2008; Stone et al., 2011).
Furthermore, bambara groundnut has been found to have high levels of essential fatty acids,
vitamins and minerals (Adeleke et al., 2018). Unfortunately, despite the fact that bambara

244
groundnut is nutrient-dense, it is generally underutilised as a food source in SSA due to several
factors (Bogart et al., 2012). Bambara groundnut has hard-to-cook and hard-to-mill properties
and exhibits antinutritional properties, a bitter taste and a strong beany flavour, which contribute
to its limited utilisation as a food source (Uvere et al., 1999; Boye et al., 2010; Ndidi et al.,
2014). In SA, another factor limiting the acceptability of bambara groundnut is the fact that
South Africans are generally not accustomed to it (Oyeyinka et al., 2017). Although
underutilised, a few studies have shown that bambara groundnut when prepared in some food
types, was positively accepted by consumers (Okafor et al., 2015; Oyeyinka et al., 2017;
Oyeyinka et al., 2018). Further, heat processing methods such as roasting have been found to
improve the taste and protein quality of bambara groundnut (Okafor et al., 2015).
Unlike biofortified maize, for which mixed responses in consumer acceptability have been
found, OFSP seems acceptable to consumers in SA, although data on its acceptability to
different population groups are limited (Tomlins et al., 2007; Low and Van Jaarsveld, 2008;
Khumalo et al., 2011; Chowdhury et al., 2011; Laurie and Van Heerden, 2012; Pillay et al.,
2018). With regard to specific rural population groups in the KZN province of SA, only one
study has been conducted to assess consumer acceptance of PVA-biofortified maize foods
served with other commonly consumed food items (Amod et al., 2016). Similarly, there are
limited reports of consumer acceptability of OFSP in KZN. Thus, this study aimed to investigate
the effect of replacing white maize and CFSP with PVA-biofortified maize and OFSP,
respectively, on consumer acceptability and perceptions of traditional dishes of selected rural
communities in KZN, SA.
9.2 Methodology
9.2.1 Study population and sample selection For the first phase of the study, systematic randomised sampling was used to obtain a sample
of 50 households at Swayimane, Tugela Ferry and Umbumbulu and 21 households at Fountain
Hill Estate. Purposive sampling was used to select households from Swayimane, Umbumbulu
and Tugela Ferry in order to avoid collecting data from extended families and neighbouring
households. From each of the households, one person was selected to answer the survey
questions. This person was either the head of the household or the person responsible for
purchasing the groceries. Pilot study participants were excluded from the study (this is
discussed further in section 9.2.6).
One hundred and twenty black African participants living in two selected rural areas (60
participants each from Swayimane and Umbumbulu) were recruited for the study. Black
245
African participants were selected for this study, as they are at high risk for malnutrition
(Shisana et al., 2013; nDoH et al., 2017). Furthermore, 120 participants were selected as this
number falls between 75-150 participants, which is the total recommended size to obtain a
significant result for a sensory evaluation (Lawless and Heymann, 2010; Stone, 2018). Focus
group participants were recruited on a voluntary basis from the sensory evaluation panel. Thirty
participants from each of the research sites were randomly selected from the sensory evaluation
participants. Each participant had a participant number which was put into a box when they
volunteered. Thirty numbers were randomly selected from the box and those participants were
selected to participate in the FGDs. This procedure was followed for Swayimane. All
volunteers (n=26) from Umbumbulu participated in the FGDs. The second phase of the study
was conducted at Gcumisa tribal hall in Swayimane and at Ezimiwini community hall in
Umbumbulu.
9.2.2 Survey on the consumption of white maize30 Survey questions were formulated in English (Supplementary Information Appendix Q1) to
determine the consumption patterns of white and PVA-biofortified maize and CFSP. The
questions that were formulated were based on the information that the researcher needed to
collect. The questions were structured and simple. This survey was translated into isiZulu by a
research assistant who was fluent in isiZulu (see Supplementary Information Appendix Q2).
The survey took the form of an interview survey, and only one survey was completed for each
household, by a research assistant. Questions 1-5 in the survey focused on the consumption and
production of white maize, question six focused on yellow maize consumption and question
seven focused on the consumption and production of CFSP.
Participants were asked to provide the research assistants with a list of foods that were
commonly consumed with the cooked white maize meal, as well as the corresponding recipes.
The foods most regularly eaten with cooked white maize meal are presented in Table 9.1. The
participants provided the research assistant with recipes that were used to cook the maize dishes
and the composite food dishes.
30 Survey results were presented under study methods and materials to enlighten the reader about why maize, sweet potato, cabbage, bambara groundnut and chicken were selected for the study.

246
Table 9.1: Food items commonly paired with cooked maize meal
Food item n (%)* Beef 85 (51.5) Chicken 69 (41.8) Green leafy vegetables 58 (35.2) Cabbage 51(30.9) Potatoes 28 (17)
*Percentage of households (n=165 households)
Recipes were collected from all 165 households. Phutu, sweet potato and curried cabbage
were prepared the same in all recipes collected. Curried beef and chicken were prepared the
same in most of the recipes collected. The only variations that were noted were with the flavour
of stock cubes used, the addition of beans to either curry or the addition of mixed vegetables.
The curried bean was cooked similarly by all households, however, a few households added
raw tomato. The recipes that were finally used in the study were those that were prepared by
the majority of the study participants. After the recipes were selected, they were standardised.
Popular food combinations were identified from the answers to the survey questions and the
relevant recipes were obtained. Participants (n=57 households) selected the food combinations
they preferred. Figure 9.2 and Figure 9.3 indicate the food items that study participants
consumed with either phutu or stiff pap (a stiff porridge made from maize meal). The least
preferred meat composite dish was stiff pap and cooked fish in tomato chutney.31 The most
preferred meat composite dishes were phutu with curried beef and stiff pap with curried beef.
However, standardised recipes were not formulated for these combinations as beef is not
regularly consumed, as it is expensive. Therefore, chicken was selected for this study. The
most preferred vegetarian options were phutu with curried cabbage and stiff pap with curried
cabbage.
31 Tomato chutney is cooked following a traditional recipe with oil, onions, tomatoes, water, salt and Raja curry powder spice. It is eaten alone or with another food item such as cooked fish.

247
Figure 9.1: Participants preference for cooked white maize meal dishes and meat composite dishes
Figure 9.2: Participants preference for cooked white maize meal dishes and vegetable composite dishes
3027
0
32
20
5
0
5
10
15
20
25
30
35
Curried beef Curried chicken Cooked fish intomato chutney
Freq
uenc
y
Meat
Cooked maize meal and meat combinations (n=57)
Phutu Stiff pap
2
53
1 1 00
47
51
4
0
10
20
30
40
50
60
Cooked greenleafy
vegetables
Curriedcabbage
Curried bean Cooked potatoCooked tomatochutney
Freq
uenc
y
Vegetables
Cooked maize meal and vegetable combinations (n=57)
Phutu Stiff Pap
248
For the purpose of this study, phutu was selected as the cooked maize meal dish. Curried
cabbage was selected as the vegetarian dish, while curried chicken was the selected meat dish.
Curried chicken was selected for this study as it is a cheaper alternative to beef. Although the
study participants preferred curried beef, they did not consume it frequently, as it is expensive.
Many rural individuals rely solely on government grants (child support grant, old age grant,
disability grant and care dependency grant) to purchase food items and cannot always afford
animal sources of protein (StatsSA, 2017b; South African Social Security Agency, 2018;
NAMC, 2018). Bambara groundnut was also selected for this study as it is an indigenous
legume that can be used as an alternative to animal protein. Not only is it a good source of
protein, but also contains carbohydrates, minerals and vitamins (Huma et al., 2008). Although
bambara groundnut is grown in certain areas of KZN, it is underutilised (Chivenge et al., 2015;
Agriculture, Forestry and Fisheries, 2016). Thus, bambara groundnut could provide a nutritious
alternative to animal protein, if deemed acceptable to impoverished communities in rural KZN.
9.2.3 Plant materials A PVA-biofortified maize type (PVA A) and a white maize variety (control) (WE-3172) were
selected for the study. The provitamin A-biofortified maize coded PVA A is an experimental
type; it has not been commercialised and hence does not have a variety name. The maize grain
was produced by plant breeders from UKZN and milled into maize for this study, using methods
described in chapter 8. Two varieties of sweet potato were selected for this study, OFSP (A45)
and CFSP (A40). The bambara groundnut landrace was purchased from Umvoti beans in
Moollas industrial township Stanger and cabbage was purchased from a local
(Pietermaritzburg) supermarket for the study.
9.2.4 Sensory evaluation 9.2.4.1 Panellists
A total of 120 black African adults comprising of males and females were randomly selected
from Swayimane and Umbumbulu rural areas of KZN to participate in sensory evaluation of
the study food samples. One hundred and twenty participants were recruited as this number falls
between 75-150 participants, which is the total recommended size to obtain a significant result
for a sensory evaluation (Lawless and Heymann, 2010; Stone, 2018). Research assistants went
to different areas within Swayimane and Umbumbulu to recruit participants. Participation was
voluntary and panellists were allowed to leave the study at any point if they so wished. Research
assistants fluent in isiZulu were recruited from UKZN and trained prior to data collection. The
research assistants were postgraduate students and were trained on how to complete the consent
forms, sensory evaluation and paired preference test data collection sheets. They were also
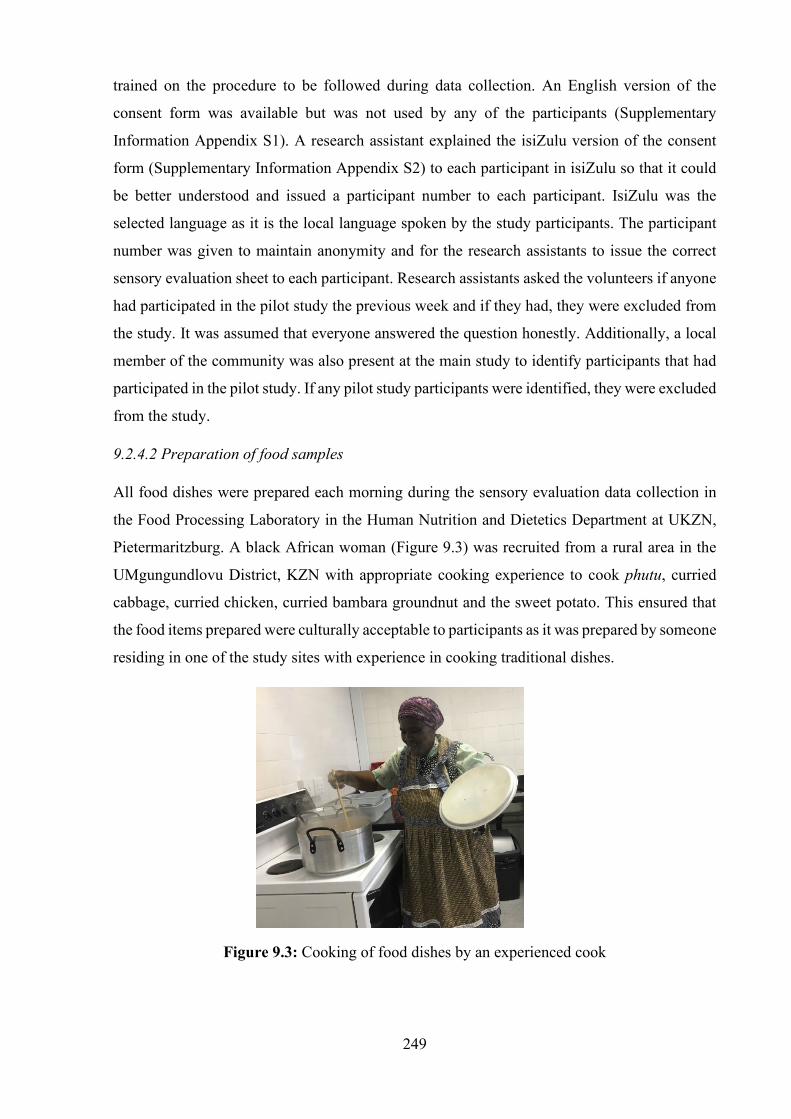
249
trained on the procedure to be followed during data collection. An English version of the
consent form was available but was not used by any of the participants (Supplementary
Information Appendix S1). A research assistant explained the isiZulu version of the consent
form (Supplementary Information Appendix S2) to each participant in isiZulu so that it could
be better understood and issued a participant number to each participant. IsiZulu was the
selected language as it is the local language spoken by the study participants. The participant
number was given to maintain anonymity and for the research assistants to issue the correct
sensory evaluation sheet to each participant. Research assistants asked the volunteers if anyone
had participated in the pilot study the previous week and if they had, they were excluded from
the study. It was assumed that everyone answered the question honestly. Additionally, a local
member of the community was also present at the main study to identify participants that had
participated in the pilot study. If any pilot study participants were identified, they were excluded
from the study.
9.2.4.2 Preparation of food samples
All food dishes were prepared each morning during the sensory evaluation data collection in
the Food Processing Laboratory in the Human Nutrition and Dietetics Department at UKZN,
Pietermaritzburg. A black African woman (Figure 9.3) was recruited from a rural area in the
UMgungundlovu District, KZN with appropriate cooking experience to cook phutu, curried
cabbage, curried chicken, curried bambara groundnut and the sweet potato. This ensured that
the food items prepared were culturally acceptable to participants as it was prepared by someone
residing in one of the study sites with experience in cooking traditional dishes.
Figure 9.3: Cooking of food dishes by an experienced cook

250
The food products were not made at the research sites, as there were no cooking facilities
available. The cooked food samples were transported in insulating plastic containers closed
with tight-fitting lids. Prior to this study, surveys were conducted to determine the commonly
consumed food combinations and recipes were collected. Foods were prepared over two trial
sessions a week prior to the pilot study to ensure that the recipes were accurate and culturally
acceptable. These recipes were standardised for phutu (Supplementary Information Appendix
L), curried cabbage (Supplementary Information Appendix M), curried chicken
(Supplementary Information Appendix N), curried bambara groundnut (Supplementary
Information Appendix O) and sweet potato (Supplementary Information Appendix P). The
curried bambara groundnut was cooked in the same manner as the curried bean (Supplementary
Information Appendix R); however, extra water was added during the cooking process, and
more time was needed to cook the curried bambara groundnut. This was due to the hard-to-
cook properties of bambara groundnut (Mubaiwa et al., 2017). The food dishes were tasted by
four black African males and seven black African females working at UKZN, who had a similar
sociodemographic profile to the study participants to test for cultural acceptability. The UKZN
workers gave their consent to taste the dishes. The tasting was conducted during the trial
cooking. The UKZN workers perceived the dishes as culturally acceptable. The pilot study was
conducted after the trial cooking session and is discussed in section 9.2.6. Although the UKZN
workers were from similar areas as used in the main study, they would be at work during data
collection, thus preventing them from participating in the main study. Table 9.2 gives a
summary of the preparation methods of food items used in the current study.
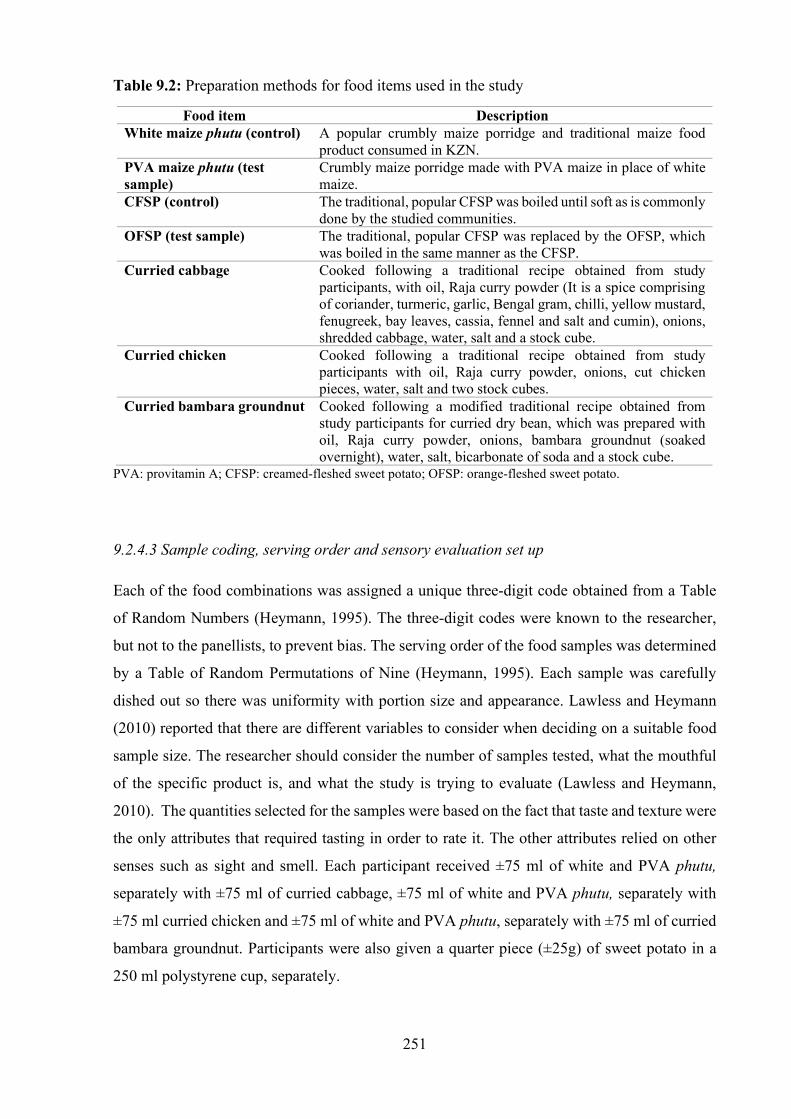
251
Table 9.2: Preparation methods for food items used in the study
Food item Description White maize phutu (control) A popular crumbly maize porridge and traditional maize food
product consumed in KZN. PVA maize phutu (test sample)
Crumbly maize porridge made with PVA maize in place of white maize.
CFSP (control) The traditional, popular CFSP was boiled until soft as is commonly done by the studied communities.
OFSP (test sample) The traditional, popular CFSP was replaced by the OFSP, which was boiled in the same manner as the CFSP.
Curried cabbage Cooked following a traditional recipe obtained from study participants, with oil, Raja curry powder (It is a spice comprising of coriander, turmeric, garlic, Bengal gram, chilli, yellow mustard, fenugreek, bay leaves, cassia, fennel and salt and cumin), onions, shredded cabbage, water, salt and a stock cube.
Curried chicken Cooked following a traditional recipe obtained from study participants with oil, Raja curry powder, onions, cut chicken pieces, water, salt and two stock cubes.
Curried bambara groundnut Cooked following a modified traditional recipe obtained from study participants for curried dry bean, which was prepared with oil, Raja curry powder, onions, bambara groundnut (soaked overnight), water, salt, bicarbonate of soda and a stock cube.
PVA: provitamin A; CFSP: creamed-fleshed sweet potato; OFSP: orange-fleshed sweet potato.
9.2.4.3 Sample coding, serving order and sensory evaluation set up
Each of the food combinations was assigned a unique three-digit code obtained from a Table
of Random Numbers (Heymann, 1995). The three-digit codes were known to the researcher,
but not to the panellists, to prevent bias. The serving order of the food samples was determined
by a Table of Random Permutations of Nine (Heymann, 1995). Each sample was carefully
dished out so there was uniformity with portion size and appearance. Lawless and Heymann
(2010) reported that there are different variables to consider when deciding on a suitable food
sample size. The researcher should consider the number of samples tested, what the mouthful
of the specific product is, and what the study is trying to evaluate (Lawless and Heymann,
2010). The quantities selected for the samples were based on the fact that taste and texture were
the only attributes that required tasting in order to rate it. The other attributes relied on other
senses such as sight and smell. Each participant received ±75 ml of white and PVA phutu,
separately with ±75 ml of curried cabbage, ±75 ml of white and PVA phutu, separately with
±75 ml curried chicken and ±75 ml of white and PVA phutu, separately with ±75 ml of curried
bambara groundnut. Participants were also given a quarter piece (±25g) of sweet potato in a
250 ml polystyrene cup, separately.

252
Additionally, the paired preference test also required participants to taste and compare the
samples. The food sample quantities were tested at the pilot study to determine if the
participants required more of either food item to evaluate the dishes. Thereafter, the quantity
was selected for the main study. At the pilot study, the participants received ±30 ml of white
phutu and each of the curries and ±30 ml of PVA-biofortified phutu and each of the curries.
This was not enough for testing, thus the quantity was increased for the main study. The
samples were warmed for ten seconds in a microwave prior to being served to ensure that it was
warm before being served to each participant. The ideal temperature was determined during the
pilot study. This was done to ensure that the samples were not cold, as cold samples could
negatively affect the outcome of the sensory evaluation (Bajec et al., 2012).
Panellists were randomly selected and given a consent form in isiZulu (Appendix S2
Supplementary Information) to sign after the contents were explained. Thereafter, the panellists
were escorted to their sensory evaluation station by the research assistant. Panellists were told
not to communicate with one another during the sensory evaluation. A separating board divided
the panellists (Figure 9.4) so that they could not communicate with each other during the
sensory evaluation session.
Figure 9.4: Sensory evaluation set-up
Each panellist was provided with a pen, a cup of water to rinse the palate between samples
and sensory evaluation questionnaires [five-point hedonic facial scale (Appendix T1
Supplementary Information) and paired preference test (Appendix T2 Supplementary
Information) developed in isiZulu, the local language in KZN. The English versions of the
sensory evaluation questionnaires [five-point hedonic facial scale (Appendix T3 Supplementary
Information) and paired preference test (Appendix T4 Supplementary Information) were
translated into isiZulu, and then back to English by two separate translators proficient in both
languages, to ensure that the translation was accurate. The English version was not used by

253
participants. The five-point hedonic facial scale (1=very bad; 5=very good) was used so that
the semi-literate/illiterate participants could record their responses.
The five-point hedonic facial scale tested the sensory attributes (taste, texture, aroma, colour
and overall acceptability) of six maize combination food samples (white phutu and curried
cabbage; PVA-biofortified phutu and curried cabbage; white phutu and curried chicken; PVA-
biofortified phutu and curried chicken; white phutu and curried bambara groundnut; PVA-
biofortified phutu and curried bambara groundnut). The same scale was used to test the sensory
attributes of two sweet potato samples (boiled CFSP and boiled OFSP).
The maximum number of samples that should be tasted at one point in time is six for a full
description sensory analysis. However, if a researcher is testing less than 10 sensory attributes,
a maximum of 10 samples may be tasted (Kemp et al., 2018). For the purpose of the study, the
six maize samples were tasted first and thereafter the two sweet potato dishes. One sample was
given to the participant at a time.
Participants were required to put a cross over the face that they felt best described the
attributes of the sample that was tasted. The research assistant explained each sensory attribute
to the participant before the samples were evaluated so that the participant knew what was
meant by each of the five attributes. Figure 9.5 illustrates an example of the five-point hedonic
facial scale for the sensory attribute aroma that was used in this study.
Figure 9.5: Example of the five-point hedonic scale for the sensory attribute aroma
The hedonic scale is a popular sensory evaluation tool that indicates the degree of likes and
dislikes (Lim, 2011). The hedonic scale is best used when there are elderly participants or
participants that have difficulty reading (Lawless and Heymann, 2010, p332). It is simple and
does not involve any mathematical equations, thus it was selected for this study. Each panellist
completed the paired preference test after tasting all eight-food samples. Samples of white phutu
combinations were compared to PVA phutu combinations and CFSP was compared to OFSP.
The paired preference test helps to validate the results from the sensory evaluation using a
five-point hedonic facial scale, which was done in this study (Lawless and Heymann, 2010).
Aroma
Very bad Average Good Very good
254
The paired preference test is used to investigate the preference after tasting two products and
adapted versions are simple to use for semi-literate/illiterate participants (Lawless and
Heymann, 2010). The same three-digit code that was allocated to the two samples during the
initial sensory evaluation using the five-point facial hedonic scale, was used in the paired
preference test. The participant was requested to put a circle around the three-digit number on
the questionnaire that corresponded to the three-digit number on the container of the sample
that they preferred. The paired preference test conducted alone does not give a true reflection
on whether or not a sample is liked, as both samples may be disliked, and one may be more
preferred (Lawless and Heymann, 2010).
9.2.5 Focus group discussions Fifty-six black African adults comprising of males and females from Swayimane and
Umbumbulu were randomly selected from the sensory evaluation panel to participate in the
FDGs. On completion of the sensory evaluation survey, FGD participants were recruited on a
voluntary basis. The participants were then randomly selected in order to reduce bias that could
be created when a participant is personally recruited (Krueger and Casey, 2009). Each
participant had a participant number which was put into a box when they volunteered. Thirty
numbers were randomly selected from the box and those participants were selected to
participate in the FGDs. This procedure was followed for Swayimane. All volunteers (n=26)
from Umbumbulu participated in the FGDs. A total of 56 participants from both areas agreed
to participate in the FGDs. The participants were divided into five groups of between 7 and 10
participants each. This was decided as the ideal size for a focus group discussion is between 6
and 10 participants (Bogart et al., 2012; Tolley et al., 2016; Silverman, 2017). However, FGDs
can have as little as four participants and as many as 12 participants (Krueger and Casey, 2009).
The FGDs were facilitated by two trained research assistants (one male and one female),
who were fluent in isiZulu and had experience with conducting FGDs. The research assistants
alternated facilitating the FGDs. The FGD questions were developed in advance from the
themes that were identified. The FGD questions were first formulated in English by the
researcher (Appendix U1 Supplementary Information) and then translated into isiZulu
(Appendix U2 Supplementary Information) by two isiZulu speaking individuals. The FGD
questions were checked by an individual with experience in working with FGDs. The FGD
questions were tested on the four black African males and seven black African females working
at UKZN that also tasted the samples for appropriateness. The UKZN workers gave consent
before participating. The UKZN workers clearly understood the questions and were able to give
feedback on the composite dishes and OFSP that they tasted. They perceived all food samples
255
as culturally acceptable. The PVA-biofortified phutu and bambara groundnut composite dish
was new to some of the UKZN workers, however, they enjoyed the taste. The most preferred
composite dish was the PVA-biofortified phutu and curried chicken. The UKZN workers
preferred the OFSP over the CFSP. Two research assistants were involved in the translation to
ensure that the FGD questions were translated accurately into isiZulu and the intended questions
were not lost in translation. No changes were made to the FGD questions prior to the pilot study
and after the pilot study, as all participants understood the questions. A digital voice recorder
was used to record the FDGs after all participants consented to the use of the voice recorder.
The recordings were later translated into English by both focus group discussion facilitators.
The translated recordings were cross-checked by an isiZulu speaking person against the English
translation, for accuracy.
9.2.6 Pilot study 6.2.6.1 Survey results
A sample of 18 households was used for the survey pilot study to test the appropriateness of the
questionnaires. This also allowed changes to be made before the main study was conducted.
However, no changes were made to the survey questions as all the questions were understood
by individuals representing each of the households. The survey was collected at two selected
sites (Swayimane and Tugela Ferry). The households were purposively selected, thus the
research assistants did not go back to the same households during the main data collection.
6.2.6.2 Sensory evaluation results
A pilot study of the sensory evaluation and FGDs were conducted at the Gcumisa tribal hall in
Swayimane, KwaZulu-Natal, prior to the main study. This was one of the selected research sites
for the main study. Ten black African participants comprising of four males and six females
were randomly recruited from the Swayimane area, to participate in the pilot study. Ten
participants were selected for the pilot study, as this is the lowest recommended number of
participants that can be used in a sensory evaluation study, to obtain a statistically significant
result (Stone, 2018).
The participants from the pilot study were not allowed to participate in the main study. To
ensure this, the researcher randomly selected one participant from different areas of
Swayimane. An English version of the consent form was available for participants if needed
(Appendix S1 Supplementary Information). All participants signed consent forms in isiZulu
(Appendix S2 Supplementary Information), before commencing with the study. Participants,
256
who could not read due to low literacy levels or did not understand the data collection sheets,
received a detailed explanation from the research assistants. Each participant was allocated a
number from 1-10 to assist with identification and issuing of sensory evaluation sheets. This
was done to protect the participant’s identity.
Focus group discussions were conducted after the sensory evaluation using the sensory
evaluation panellists. Four focus group discussion questions were developed in English
(Appendix U1 Supplementary Information) and translated into isiZulu (Appendix U2
Supplementary Information). All 10 participants were invited to participate in the FGDs and
included both males and females. Only one focus group session was conducted and was
facilitated by a male assistant with experience in conducting focus group discussions.
The aims of the pilot study were as follows:
1. To determine if the standardised recipes that were developed after the first phase of the study were culturally acceptable.
2. To determine if the sensory evaluation questionnaires in isiZulu were user-friendly and understood by participants.
3. To finalise the methodology used for the sensory evaluation and the FGDs.
4. To determine if the research assistants were able to collect data efficiently and if they understood the process to be followed.
The outcomes of the pilot study were as follows:
1. The recipe used to cook the curried bambara groundnut was modified to ensure that it was
acceptable to the study participants. The bambara groundnut took a longer period to cook
and soften. Bambara groundnut was soaked overnight to reduce cooking time and 1 ml of
bicarbonate of soda was added during cooking to reduce the hard-to-cook phenomenon and
allow the bambara groundnut to soften. The addition of one teaspoon of bicarbonate of soda
has been shown to soften legumes that have hard-to-cook properties (Polak et al., 2015). In
this study, 1 ml of bicarbonate of soda was used to cook the bambara groundnut as no studies
have been conducted on the maximum amount of bicarbonate of soda that can be added
during cooking to soften it, without affecting the taste. The addition of 1 ml of bicarbonate
of soda did not affect the taste of the cooked bambara groundnut. This was determined as
the participants did not report any changes in taste.
2. The quantity of the samples issued for sensory evaluation was increased from 30 ml to 75
ml, as it was found that 30 ml each of food sample was insufficient for the sensory
257
evaluation. During the pilot study participants requested more of the sample to taste so that
they could rate the sample. Thus, it was determined that 75 ml of each sample would be
adequate to use for the sensory evaluation.
3. The research assistants needed to be trained after the pilot study to ensure that the correct
procedures were followed and there was no confusion regarding the tasks that needed to be
conducted by each research assistant. During the pilot study, the research assistants tried to
assist each other with tasks and it became confusing. Each research assistant was allocated
one specific task for the duration of the main study.
4. For the pilot study, a FGD was conducted by a male research assistant with experience in
conducting FGDs. The group consisted of both males and females of varying age. Elderly
female participants were not comfortable with expressing their views in the presence of
male participants. The change made for the main study was that two research assistants (one
male and one female) with experience with conducting FGDs, were used. The female
research assistant conducted FGDs with female participants and the male research assistant
conducted FGDs with the male participants.
5. Some female participants did not understand the contents of the consent form when it was
explained to them as a group. For the main study, the consent form was explained in detail
by the same research assistant to all participants individually, so that any queries could be
addressed immediately.
9.2.7 Data quality control
Research assistants were responsible for inspecting all completed sensory evaluation and paired
preference sheets to ensure that all the samples were tasted and rated. Data from the sensory
evaluation and paired preference sheets were captured on a Microsoft Excel spreadsheet by
research assistants. The data entry was cross-checked for accuracy by another research assistant.
9.2.8 Reduction of bias
During the preparation for the sensory evaluation, various steps were taken to reduce bias. All
ingredients to be cooked were weighed using a calibrated scale. The same brands of ingredients
were used to cook the composite dishes and the same measuring cup, measuring jug and
measuring spoons were used to measure the ingredients. Insulated airtight containers were used
for the transportation of food products. All participants were served the same amount of samples
using measuring spoons in a 250 ml polystyrene container. All food products were warmed
258
before testing in a microwave for ten seconds. This was done as cold samples could negatively
affect the rating of the samples during the sensory evaluation (Bajec et al., 2012). All samples
were clearly labelled using a permanent marker on one side of the 250 ml polystyrene container.
The serving order was randomised using a Table of Random Permutations of Nine (Heymann,
1995). For the FGDs, the same questions were asked to the FGD participants in the same order
and participants were randomly selected from those that volunteered to participate in the FGDs.
9.2.9 Statistical analysis
Data from the sensory evaluation questionnaires were analysed using the Statistical Package
for Social Sciences (SPSS) (version 25.0 SPSS Inc, Chicago, IL, USA) at the 5% level of
significance. The Friedman’s test, a nonparametric statistical test was used to test for significant
differences in sensory attributes across the phutu combinations. The specific differences were
then analysed using the Wilcoxon test for the phutu combinations and two varieties of sweet
potato. The independent samples t-test was used to determine significant differences across
gender for the average sensory attributes of the food samples. Analysis of variance (ANOVA)
was used to determine significant differences between different age groups for the sensory
attributes for all food samples. The Welch test was used when conditions for the ANOVA test
were not met. The paired preference results were analysed using a Pearson chi-square test. The
responses from the FGDs were subjected to thematic content analysis. Thematic analysis is a
method used to identify patterns or themes that are related to the research question (Barbour,
2018, p124, 125). This process does not just entail summarising the main points but interpreting
the content into a meaningful output (Barbour, 2018, p125). Verbatim comments from the
FGDs were extracted from the voice recorder and translated from isiZulu into English. Data
from the FGDs and the notes were coded. Similar coded ideas were then arranged into
appropriate themes. Thereafter, a discussion was written for each theme to interpret the results
from the FGDs.
9.2.10 Ethical considerations
Ethical approval was obtained from the UKZN, Humanities and Social Science Ethics
Committee (HSS/0256/016D). Gatekeeper’s permission was obtained to conduct the study at
the Swayimane, Tugela Ferry, Umbumbulu and Fountain Hill Estate. Each panellist was
required to sign a consent form before participating in the sensory evaluation. The consent form
was available in English (Appendix S1 Supplementary Information) and isiZulu (Appendix S2
Supplementary Information). The consent form was read to the participants in isiZulu so that
all participants understood the contents of the consent form. All participants were able to sign
259
the consent form. The participants were shown where to sign on the consent form if they
understood what was explained. If they did not understand something, it was re-explained and
they signed once they understood. The consent form also allowed participants to grant
permission to be photographed and audio and video recorded.
9.3 Results
9.3.1 Survey Results from the survey indicated that all 165 households consumed meals made with cooked
white maize meal. Sixty-one percent of the participants (n=100) reported that they had
consumed cooked maize meal in different forms, several times a week. Table 9.3 indicates the
different forms of food prepared using white maize meal. White maize meal was most
commonly prepared as phutu (84.8%; n=140) by the study participants.
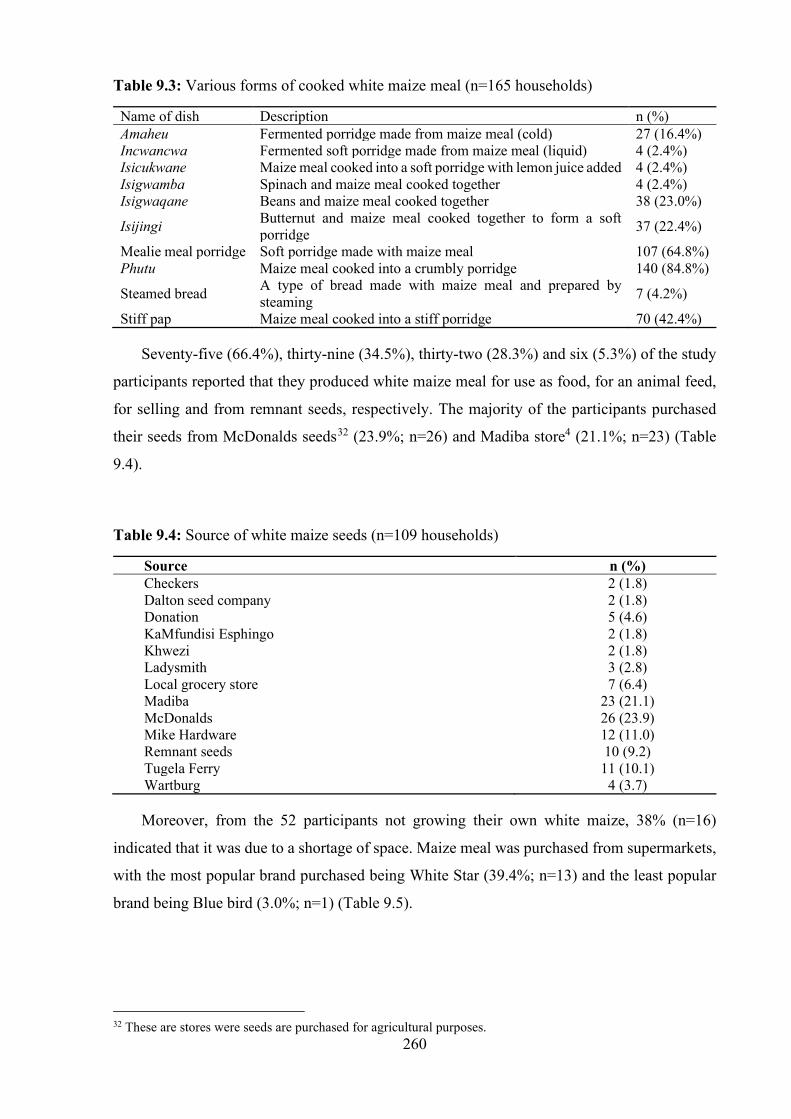
260
Table 9.3: Various forms of cooked white maize meal (n=165 households)
Name of dish Description n (%) Amaheu Fermented porridge made from maize meal (cold) 27 (16.4%) Incwancwa Fermented soft porridge made from maize meal (liquid) 4 (2.4%) Isicukwane Maize meal cooked into a soft porridge with lemon juice added 4 (2.4%) Isigwamba Spinach and maize meal cooked together 4 (2.4%) Isigwaqane Beans and maize meal cooked together 38 (23.0%)
Isijingi Butternut and maize meal cooked together to form a soft porridge 37 (22.4%)
Mealie meal porridge Soft porridge made with maize meal 107 (64.8%) Phutu Maize meal cooked into a crumbly porridge 140 (84.8%)
Steamed bread A type of bread made with maize meal and prepared by steaming 7 (4.2%)
Stiff pap Maize meal cooked into a stiff porridge 70 (42.4%)
Seventy-five (66.4%), thirty-nine (34.5%), thirty-two (28.3%) and six (5.3%) of the study
participants reported that they produced white maize meal for use as food, for an animal feed,
for selling and from remnant seeds, respectively. The majority of the participants purchased
their seeds from McDonalds seeds32 (23.9%; n=26) and Madiba store4 (21.1%; n=23) (Table
9.4).
Table 9.4: Source of white maize seeds (n=109 households)
Source n (%) Checkers 2 (1.8) Dalton seed company 2 (1.8) Donation 5 (4.6) KaMfundisi Esphingo 2 (1.8) Khwezi 2 (1.8) Ladysmith 3 (2.8) Local grocery store 7 (6.4) Madiba 23 (21.1) McDonalds 26 (23.9) Mike Hardware 12 (11.0) Remnant seeds 10 (9.2) Tugela Ferry 11 (10.1) Wartburg 4 (3.7)
Moreover, from the 52 participants not growing their own white maize, 38% (n=16)
indicated that it was due to a shortage of space. Maize meal was purchased from supermarkets,
with the most popular brand purchased being White Star (39.4%; n=13) and the least popular
brand being Blue bird (3.0%; n=1) (Table 9.5).
32 These are stores were seeds are purchased for agricultural purposes.
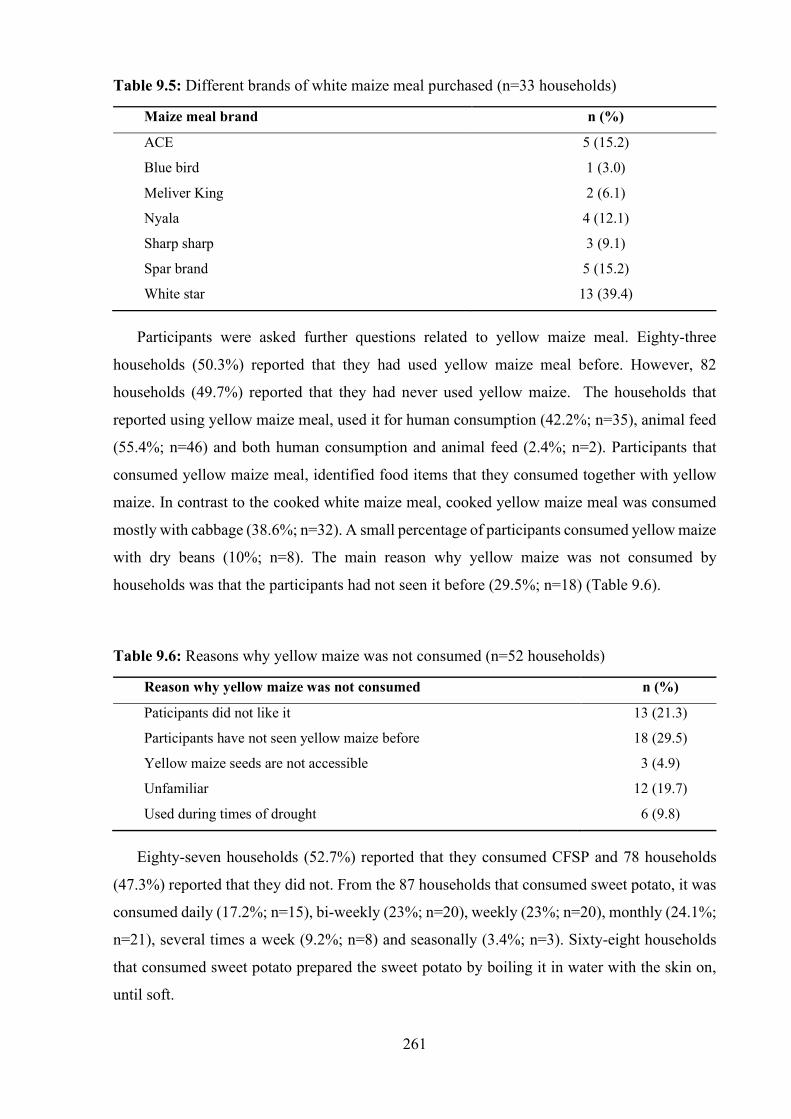
261
Table 9.5: Different brands of white maize meal purchased (n=33 households)
Maize meal brand n (%)
ACE 5 (15.2)
Blue bird 1 (3.0)
Meliver King 2 (6.1)
Nyala 4 (12.1)
Sharp sharp 3 (9.1)
Spar brand 5 (15.2)
White star 13 (39.4)
Participants were asked further questions related to yellow maize meal. Eighty-three
households (50.3%) reported that they had used yellow maize meal before. However, 82
households (49.7%) reported that they had never used yellow maize. The households that
reported using yellow maize meal, used it for human consumption (42.2%; n=35), animal feed
(55.4%; n=46) and both human consumption and animal feed (2.4%; n=2). Participants that
consumed yellow maize meal, identified food items that they consumed together with yellow
maize. In contrast to the cooked white maize meal, cooked yellow maize meal was consumed
mostly with cabbage (38.6%; n=32). A small percentage of participants consumed yellow maize
with dry beans (10%; n=8). The main reason why yellow maize was not consumed by
households was that the participants had not seen it before (29.5%; n=18) (Table 9.6).
Table 9.6: Reasons why yellow maize was not consumed (n=52 households)
Reason why yellow maize was not consumed n (%)
Paticipants did not like it 13 (21.3)
Participants have not seen yellow maize before 18 (29.5)
Yellow maize seeds are not accessible 3 (4.9)
Unfamiliar 12 (19.7)
Used during times of drought 6 (9.8)
Eighty-seven households (52.7%) reported that they consumed CFSP and 78 households
(47.3%) reported that they did not. From the 87 households that consumed sweet potato, it was
consumed daily (17.2%; n=15), bi-weekly (23%; n=20), weekly (23%; n=20), monthly (24.1%;
n=21), several times a week (9.2%; n=8) and seasonally (3.4%; n=3). Sixty-eight households
that consumed sweet potato prepared the sweet potato by boiling it in water with the skin on,
until soft.
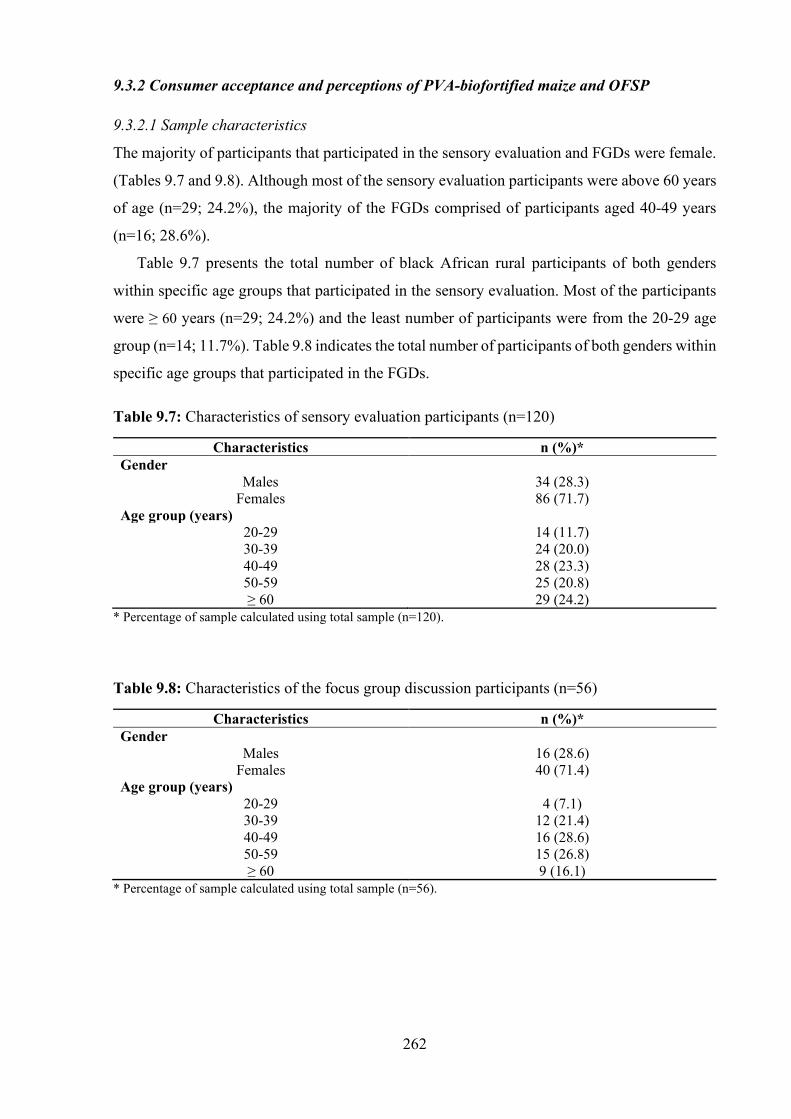
262
9.3.2 Consumer acceptance and perceptions of PVA-biofortified maize and OFSP
9.3.2.1 Sample characteristics
The majority of participants that participated in the sensory evaluation and FGDs were female.
(Tables 9.7 and 9.8). Although most of the sensory evaluation participants were above 60 years
of age (n=29; 24.2%), the majority of the FGDs comprised of participants aged 40-49 years
(n=16; 28.6%).
Table 9.7 presents the total number of black African rural participants of both genders
within specific age groups that participated in the sensory evaluation. Most of the participants
were ≥ 60 years (n=29; 24.2%) and the least number of participants were from the 20-29 age
group (n=14; 11.7%). Table 9.8 indicates the total number of participants of both genders within
specific age groups that participated in the FGDs.
Table 9.7: Characteristics of sensory evaluation participants (n=120)
Characteristics n (%)* Gender
Males 34 (28.3) Females 86 (71.7)
Age group (years) 20-29 14 (11.7) 30-39 24 (20.0) 40-49 28 (23.3) 50-59 25 (20.8) ≥ 60 29 (24.2)
* Percentage of sample calculated using total sample (n=120).
Table 9.8: Characteristics of the focus group discussion participants (n=56)
Characteristics n (%)* Gender
Males 16 (28.6) Females 40 (71.4)
Age group (years) 20-29 4 (7.1) 30-39 12 (21.4) 40-49 16 (28.6) 50-59 15 (26.8) ≥ 60 9 (16.1)
* Percentage of sample calculated using total sample (n=56).
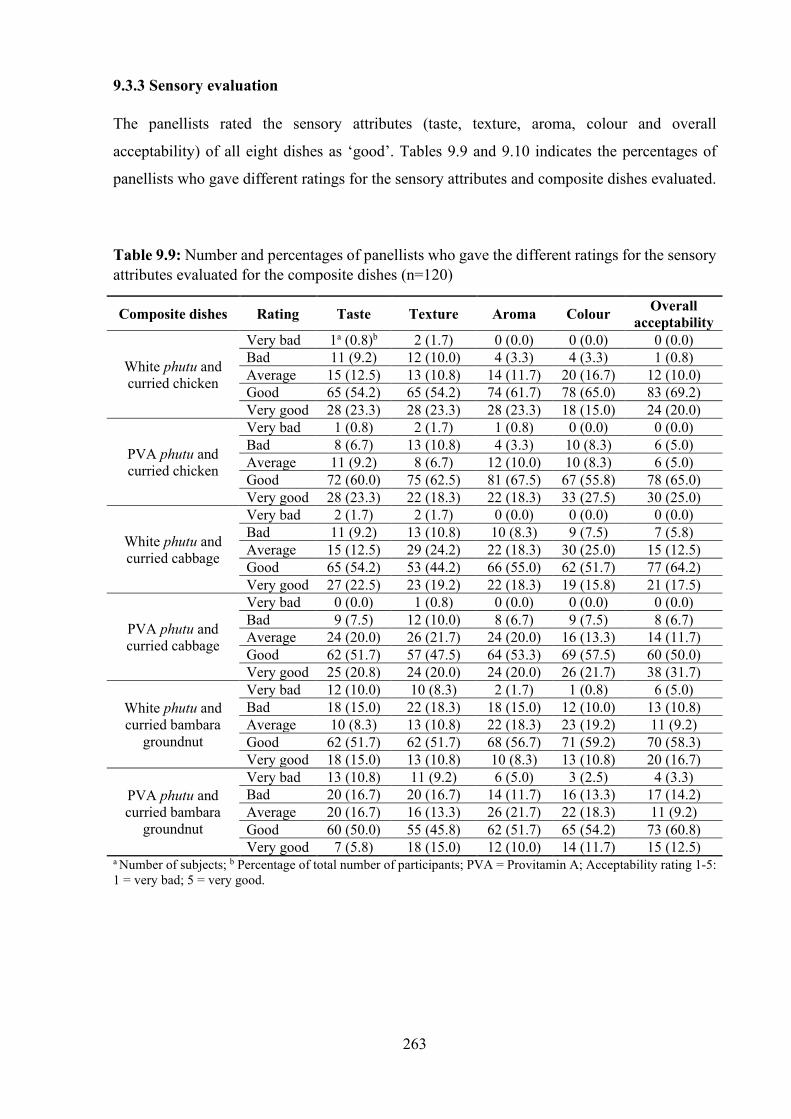
263
9.3.3 Sensory evaluation
The panellists rated the sensory attributes (taste, texture, aroma, colour and overall
acceptability) of all eight dishes as ‘good’. Tables 9.9 and 9.10 indicates the percentages of
panellists who gave different ratings for the sensory attributes and composite dishes evaluated.
Table 9.9: Number and percentages of panellists who gave the different ratings for the sensory attributes evaluated for the composite dishes (n=120)
Composite dishes Rating Taste Texture Aroma Colour Overall acceptability
White phutu and curried chicken
Very bad 1a (0.8)b 2 (1.7) 0 (0.0) 0 (0.0) 0 (0.0) Bad 11 (9.2) 12 (10.0) 4 (3.3) 4 (3.3) 1 (0.8) Average 15 (12.5) 13 (10.8) 14 (11.7) 20 (16.7) 12 (10.0) Good 65 (54.2) 65 (54.2) 74 (61.7) 78 (65.0) 83 (69.2) Very good 28 (23.3) 28 (23.3) 28 (23.3) 18 (15.0) 24 (20.0)
PVA phutu and curried chicken
Very bad 1 (0.8) 2 (1.7) 1 (0.8) 0 (0.0) 0 (0.0) Bad 8 (6.7) 13 (10.8) 4 (3.3) 10 (8.3) 6 (5.0) Average 11 (9.2) 8 (6.7) 12 (10.0) 10 (8.3) 6 (5.0) Good 72 (60.0) 75 (62.5) 81 (67.5) 67 (55.8) 78 (65.0) Very good 28 (23.3) 22 (18.3) 22 (18.3) 33 (27.5) 30 (25.0)
White phutu and curried cabbage
Very bad 2 (1.7) 2 (1.7) 0 (0.0) 0 (0.0) 0 (0.0) Bad 11 (9.2) 13 (10.8) 10 (8.3) 9 (7.5) 7 (5.8) Average 15 (12.5) 29 (24.2) 22 (18.3) 30 (25.0) 15 (12.5) Good 65 (54.2) 53 (44.2) 66 (55.0) 62 (51.7) 77 (64.2) Very good 27 (22.5) 23 (19.2) 22 (18.3) 19 (15.8) 21 (17.5)
PVA phutu and curried cabbage
Very bad 0 (0.0) 1 (0.8) 0 (0.0) 0 (0.0) 0 (0.0) Bad 9 (7.5) 12 (10.0) 8 (6.7) 9 (7.5) 8 (6.7) Average 24 (20.0) 26 (21.7) 24 (20.0) 16 (13.3) 14 (11.7) Good 62 (51.7) 57 (47.5) 64 (53.3) 69 (57.5) 60 (50.0) Very good 25 (20.8) 24 (20.0) 24 (20.0) 26 (21.7) 38 (31.7)
White phutu and curried bambara
groundnut
Very bad 12 (10.0) 10 (8.3) 2 (1.7) 1 (0.8) 6 (5.0) Bad 18 (15.0) 22 (18.3) 18 (15.0) 12 (10.0) 13 (10.8) Average 10 (8.3) 13 (10.8) 22 (18.3) 23 (19.2) 11 (9.2) Good 62 (51.7) 62 (51.7) 68 (56.7) 71 (59.2) 70 (58.3) Very good 18 (15.0) 13 (10.8) 10 (8.3) 13 (10.8) 20 (16.7)
PVA phutu and curried bambara
groundnut
Very bad 13 (10.8) 11 (9.2) 6 (5.0) 3 (2.5) 4 (3.3) Bad 20 (16.7) 20 (16.7) 14 (11.7) 16 (13.3) 17 (14.2) Average 20 (16.7) 16 (13.3) 26 (21.7) 22 (18.3) 11 (9.2) Good 60 (50.0) 55 (45.8) 62 (51.7) 65 (54.2) 73 (60.8) Very good 7 (5.8) 18 (15.0) 12 (10.0) 14 (11.7) 15 (12.5)
a Number of subjects; b Percentage of total number of participants; PVA = Provitamin A; Acceptability rating 1-5: 1 = very bad; 5 = very good.
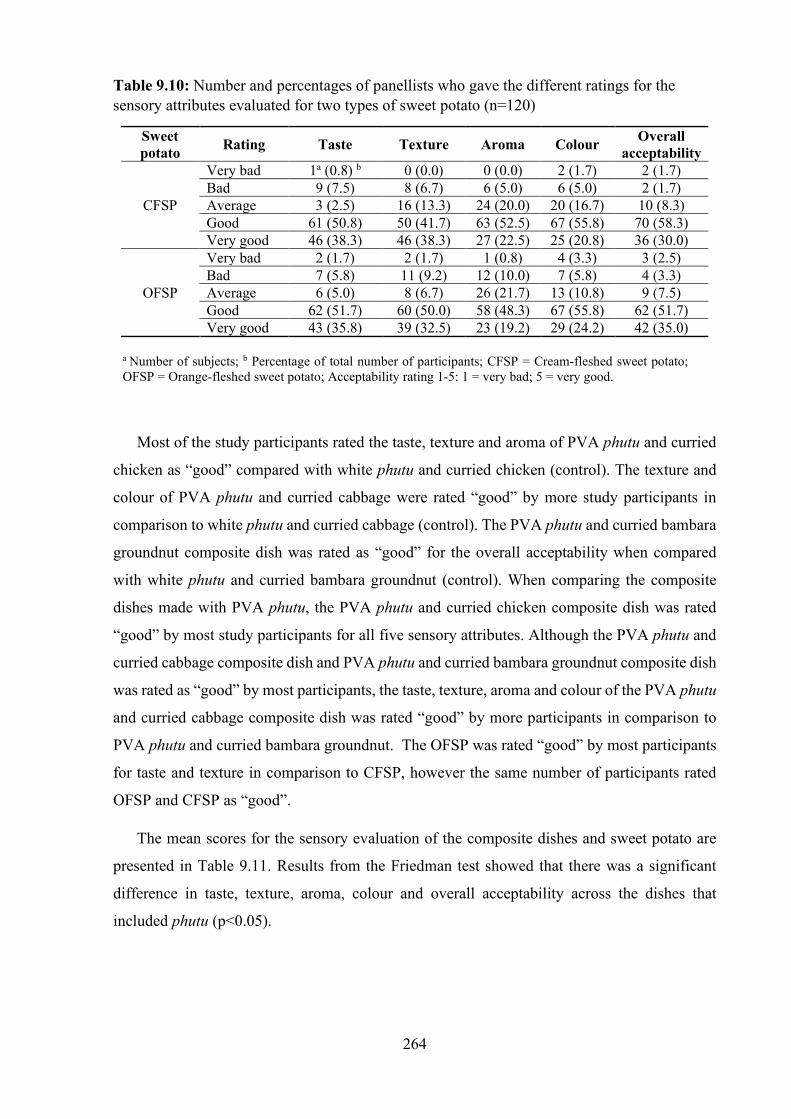
264
Table 9.10: Number and percentages of panellists who gave the different ratings for the sensory attributes evaluated for two types of sweet potato (n=120)
Sweet potato Rating Taste Texture Aroma Colour Overall
acceptability
CFSP
Very bad 1a (0.8) b 0 (0.0) 0 (0.0) 2 (1.7) 2 (1.7) Bad 9 (7.5) 8 (6.7) 6 (5.0) 6 (5.0) 2 (1.7) Average 3 (2.5) 16 (13.3) 24 (20.0) 20 (16.7) 10 (8.3) Good 61 (50.8) 50 (41.7) 63 (52.5) 67 (55.8) 70 (58.3) Very good 46 (38.3) 46 (38.3) 27 (22.5) 25 (20.8) 36 (30.0)
OFSP
Very bad 2 (1.7) 2 (1.7) 1 (0.8) 4 (3.3) 3 (2.5) Bad 7 (5.8) 11 (9.2) 12 (10.0) 7 (5.8) 4 (3.3) Average 6 (5.0) 8 (6.7) 26 (21.7) 13 (10.8) 9 (7.5) Good 62 (51.7) 60 (50.0) 58 (48.3) 67 (55.8) 62 (51.7) Very good 43 (35.8) 39 (32.5) 23 (19.2) 29 (24.2) 42 (35.0)
a Number of subjects; b Percentage of total number of participants; CFSP = Cream-fleshed sweet potato; OFSP = Orange-fleshed sweet potato; Acceptability rating 1-5: 1 = very bad; 5 = very good.
Most of the study participants rated the taste, texture and aroma of PVA phutu and curried
chicken as “good” compared with white phutu and curried chicken (control). The texture and
colour of PVA phutu and curried cabbage were rated “good” by more study participants in
comparison to white phutu and curried cabbage (control). The PVA phutu and curried bambara
groundnut composite dish was rated as “good” for the overall acceptability when compared
with white phutu and curried bambara groundnut (control). When comparing the composite
dishes made with PVA phutu, the PVA phutu and curried chicken composite dish was rated
“good” by most study participants for all five sensory attributes. Although the PVA phutu and
curried cabbage composite dish and PVA phutu and curried bambara groundnut composite dish
was rated as “good” by most participants, the taste, texture, aroma and colour of the PVA phutu
and curried cabbage composite dish was rated “good” by more participants in comparison to
PVA phutu and curried bambara groundnut. The OFSP was rated “good” by most participants
for taste and texture in comparison to CFSP, however the same number of participants rated
OFSP and CFSP as “good”.
The mean scores for the sensory evaluation of the composite dishes and sweet potato are
presented in Table 9.11. Results from the Friedman test showed that there was a significant
difference in taste, texture, aroma, colour and overall acceptability across the dishes that
included phutu (p<0.05).
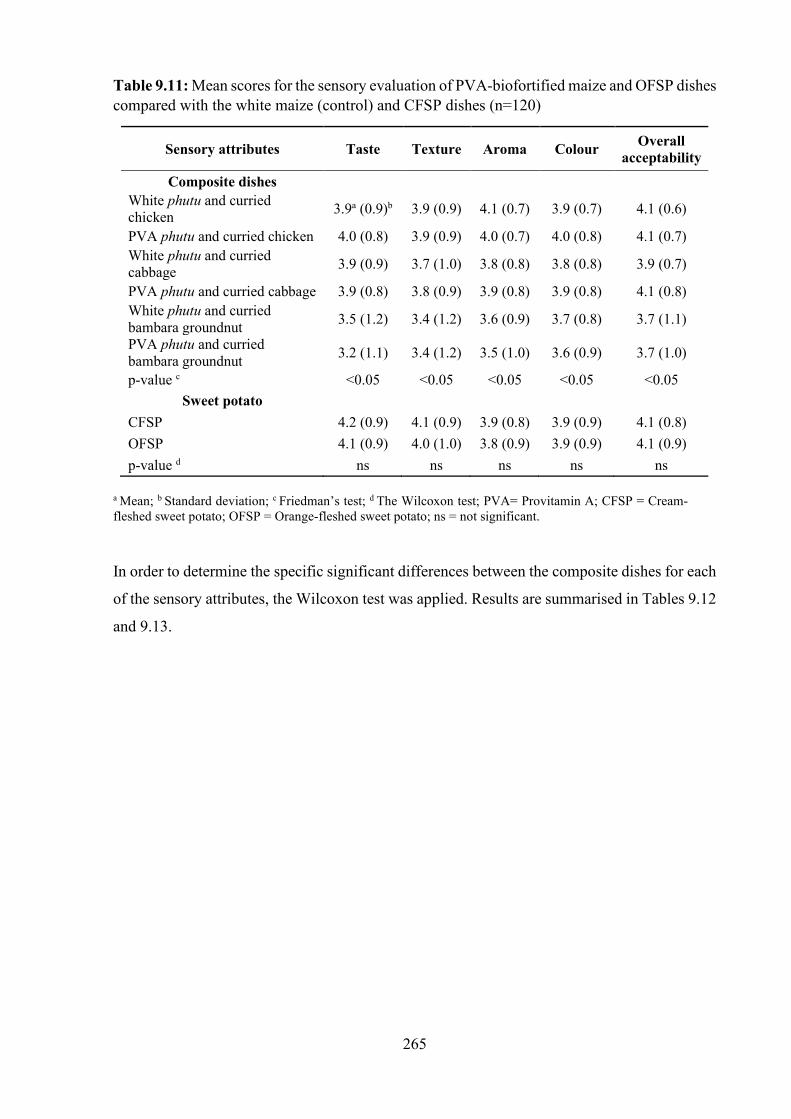
265
Table 9.11: Mean scores for the sensory evaluation of PVA-biofortified maize and OFSP dishes compared with the white maize (control) and CFSP dishes (n=120)
Sensory attributes Taste Texture Aroma Colour Overall acceptability
Composite dishes White phutu and curried chicken 3.9a (0.9)b 3.9 (0.9) 4.1 (0.7) 3.9 (0.7) 4.1 (0.6)
PVA phutu and curried chicken 4.0 (0.8) 3.9 (0.9) 4.0 (0.7) 4.0 (0.8) 4.1 (0.7) White phutu and curried cabbage 3.9 (0.9) 3.7 (1.0) 3.8 (0.8) 3.8 (0.8) 3.9 (0.7)
PVA phutu and curried cabbage 3.9 (0.8) 3.8 (0.9) 3.9 (0.8) 3.9 (0.8) 4.1 (0.8) White phutu and curried bambara groundnut 3.5 (1.2) 3.4 (1.2) 3.6 (0.9) 3.7 (0.8) 3.7 (1.1)
PVA phutu and curried bambara groundnut 3.2 (1.1) 3.4 (1.2) 3.5 (1.0) 3.6 (0.9) 3.7 (1.0)
p-value c <0.05 <0.05 <0.05 <0.05 <0.05 Sweet potato
CFSP 4.2 (0.9) 4.1 (0.9) 3.9 (0.8) 3.9 (0.9) 4.1 (0.8) OFSP 4.1 (0.9) 4.0 (1.0) 3.8 (0.9) 3.9 (0.9) 4.1 (0.9) p-value d ns ns ns ns ns
a Mean; b Standard deviation; c Friedman’s test; d The Wilcoxon test; PVA= Provitamin A; CFSP = Cream-fleshed sweet potato; OFSP = Orange-fleshed sweet potato; ns = not significant.
In order to determine the specific significant differences between the composite dishes for each
of the sensory attributes, the Wilcoxon test was applied. Results are summarised in Tables 9.12
and 9.13.
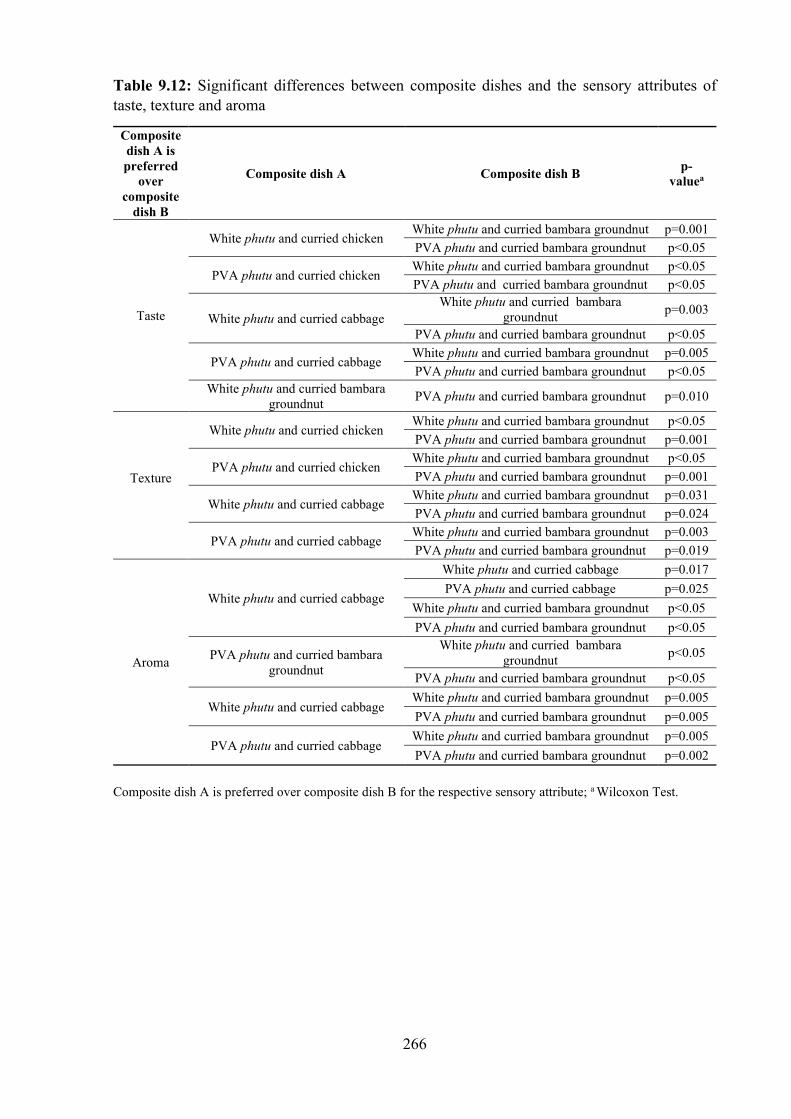
266
Table 9.12: Significant differences between composite dishes and the sensory attributes of taste, texture and aroma
Composite dish A is preferred
over composite
dish B
Composite dish A Composite dish B p-valuea
Taste
White phutu and curried chicken White phutu and curried bambara groundnut p=0.001 PVA phutu and curried bambara groundnut p<0.05
PVA phutu and curried chicken White phutu and curried bambara groundnut p<0.05 PVA phutu and curried bambara groundnut p<0.05
White phutu and curried cabbage White phutu and curried bambara
groundnut p=0.003
PVA phutu and curried bambara groundnut p<0.05
PVA phutu and curried cabbage White phutu and curried bambara groundnut p=0.005 PVA phutu and curried bambara groundnut p<0.05
White phutu and curried bambara groundnut PVA phutu and curried bambara groundnut p=0.010
Texture
White phutu and curried chicken White phutu and curried bambara groundnut p<0.05 PVA phutu and curried bambara groundnut p=0.001
PVA phutu and curried chicken White phutu and curried bambara groundnut p<0.05 PVA phutu and curried bambara groundnut p=0.001
White phutu and curried cabbage White phutu and curried bambara groundnut p=0.031 PVA phutu and curried bambara groundnut p=0.024
PVA phutu and curried cabbage White phutu and curried bambara groundnut p=0.003 PVA phutu and curried bambara groundnut p=0.019
Aroma
White phutu and curried cabbage
White phutu and curried cabbage p=0.017 PVA phutu and curried cabbage p=0.025
White phutu and curried bambara groundnut p<0.05 PVA phutu and curried bambara groundnut p<0.05
PVA phutu and curried bambara groundnut
White phutu and curried bambara groundnut p<0.05
PVA phutu and curried bambara groundnut p<0.05
White phutu and curried cabbage White phutu and curried bambara groundnut p=0.005 PVA phutu and curried bambara groundnut p=0.005
PVA phutu and curried cabbage White phutu and curried bambara groundnut p=0.005 PVA phutu and curried bambara groundnut p=0.002
Composite dish A is preferred over composite dish B for the respective sensory attribute; a Wilcoxon Test.
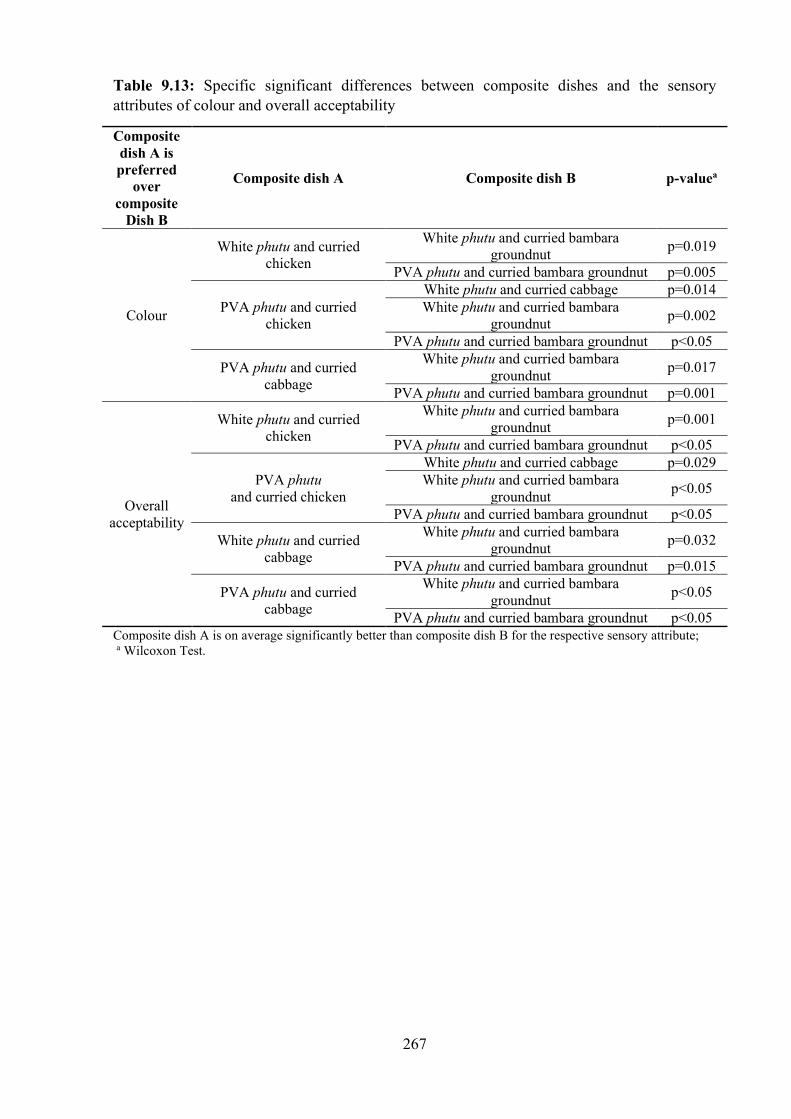
267
Table 9.13: Specific significant differences between composite dishes and the sensory attributes of colour and overall acceptability
Composite dish A is preferred
over composite
Dish B
Composite dish A Composite dish B p-valuea
Colour
White phutu and curried chicken
White phutu and curried bambara groundnut p=0.019
PVA phutu and curried bambara groundnut p=0.005
PVA phutu and curried chicken
White phutu and curried cabbage p=0.014 White phutu and curried bambara
groundnut p=0.002
PVA phutu and curried bambara groundnut p<0.05
PVA phutu and curried cabbage
White phutu and curried bambara groundnut p=0.017
PVA phutu and curried bambara groundnut p=0.001
Overall acceptability
White phutu and curried chicken
White phutu and curried bambara groundnut p=0.001
PVA phutu and curried bambara groundnut p<0.05
PVA phutu and curried chicken
White phutu and curried cabbage p=0.029 White phutu and curried bambara
groundnut p<0.05
PVA phutu and curried bambara groundnut p<0.05
White phutu and curried cabbage
White phutu and curried bambara groundnut p=0.032
PVA phutu and curried bambara groundnut p=0.015
PVA phutu and curried cabbage
White phutu and curried bambara groundnut p<0.05
PVA phutu and curried bambara groundnut p<0.05 Composite dish A is on average significantly better than composite dish B for the respective sensory attribute; a Wilcoxon Test.
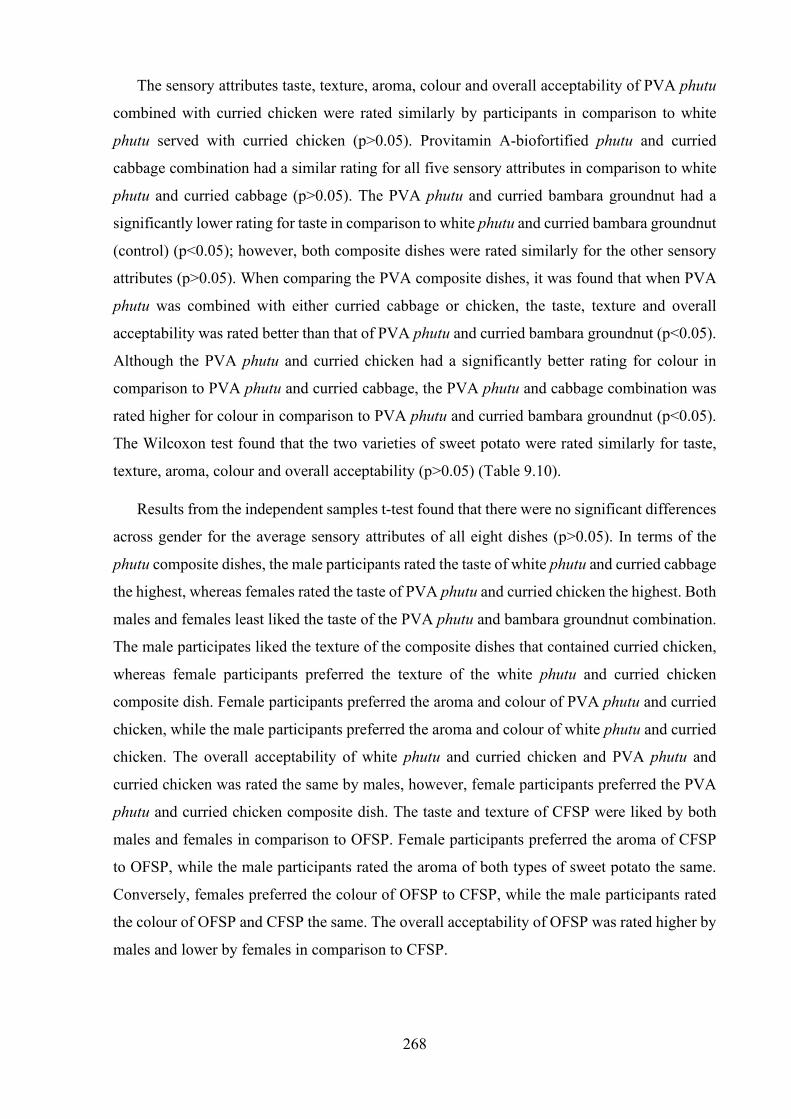
268
The sensory attributes taste, texture, aroma, colour and overall acceptability of PVA phutu
combined with curried chicken were rated similarly by participants in comparison to white
phutu served with curried chicken (p>0.05). Provitamin A-biofortified phutu and curried
cabbage combination had a similar rating for all five sensory attributes in comparison to white
phutu and curried cabbage (p>0.05). The PVA phutu and curried bambara groundnut had a
significantly lower rating for taste in comparison to white phutu and curried bambara groundnut
(control) (p<0.05); however, both composite dishes were rated similarly for the other sensory
attributes (p>0.05). When comparing the PVA composite dishes, it was found that when PVA
phutu was combined with either curried cabbage or chicken, the taste, texture and overall
acceptability was rated better than that of PVA phutu and curried bambara groundnut (p<0.05).
Although the PVA phutu and curried chicken had a significantly better rating for colour in
comparison to PVA phutu and curried cabbage, the PVA phutu and cabbage combination was
rated higher for colour in comparison to PVA phutu and curried bambara groundnut (p<0.05).
The Wilcoxon test found that the two varieties of sweet potato were rated similarly for taste,
texture, aroma, colour and overall acceptability (p>0.05) (Table 9.10).
Results from the independent samples t-test found that there were no significant differences
across gender for the average sensory attributes of all eight dishes (p>0.05). In terms of the
phutu composite dishes, the male participants rated the taste of white phutu and curried cabbage
the highest, whereas females rated the taste of PVA phutu and curried chicken the highest. Both
males and females least liked the taste of the PVA phutu and bambara groundnut combination.
The male participates liked the texture of the composite dishes that contained curried chicken,
whereas female participants preferred the texture of the white phutu and curried chicken
composite dish. Female participants preferred the aroma and colour of PVA phutu and curried
chicken, while the male participants preferred the aroma and colour of white phutu and curried
chicken. The overall acceptability of white phutu and curried chicken and PVA phutu and
curried chicken was rated the same by males, however, female participants preferred the PVA
phutu and curried chicken composite dish. The taste and texture of CFSP were liked by both
males and females in comparison to OFSP. Female participants preferred the aroma of CFSP
to OFSP, while the male participants rated the aroma of both types of sweet potato the same.
Conversely, females preferred the colour of OFSP to CFSP, while the male participants rated
the colour of OFSP and CFSP the same. The overall acceptability of OFSP was rated higher by
males and lower by females in comparison to CFSP.
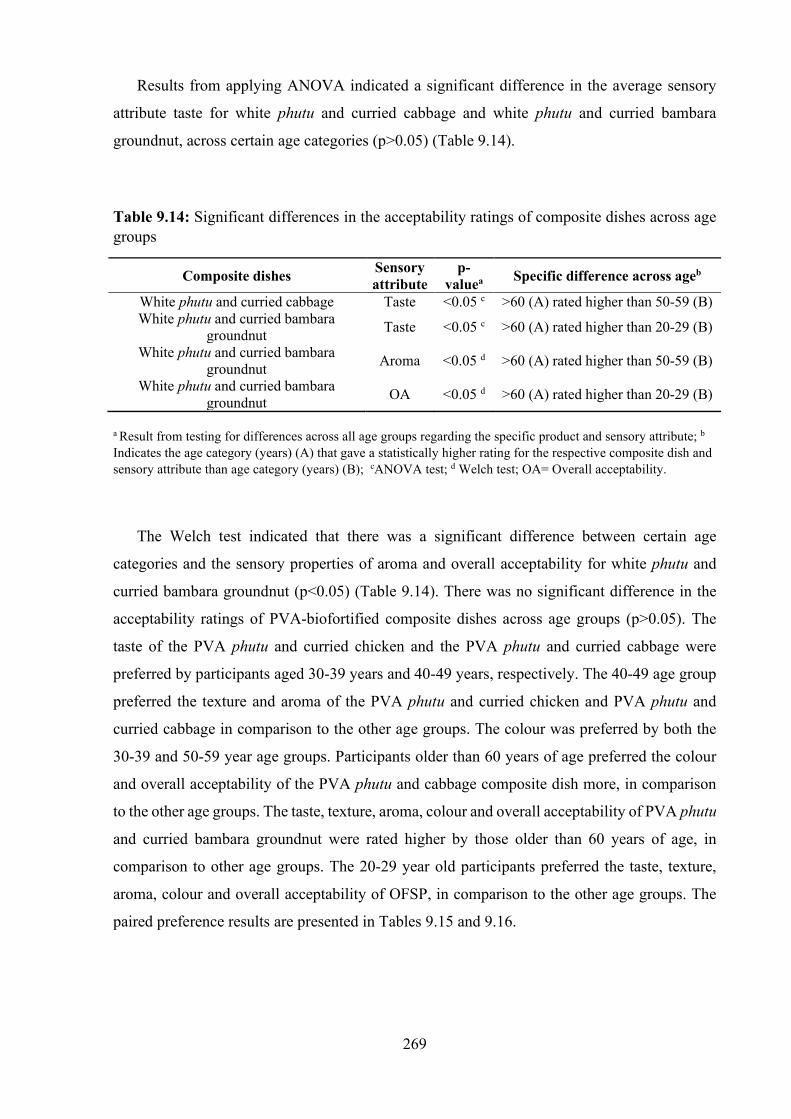
269
Results from applying ANOVA indicated a significant difference in the average sensory
attribute taste for white phutu and curried cabbage and white phutu and curried bambara
groundnut, across certain age categories (p>0.05) (Table 9.14).
Table 9.14: Significant differences in the acceptability ratings of composite dishes across age groups
Composite dishes Sensory attribute
p-valuea Specific difference across ageb
White phutu and curried cabbage Taste <0.05 c >60 (A) rated higher than 50-59 (B) White phutu and curried bambara
groundnut Taste <0.05 c >60 (A) rated higher than 20-29 (B)
White phutu and curried bambara groundnut Aroma <0.05 d >60 (A) rated higher than 50-59 (B)
White phutu and curried bambara groundnut OA <0.05 d >60 (A) rated higher than 20-29 (B)
a Result from testing for differences across all age groups regarding the specific product and sensory attribute; b Indicates the age category (years) (A) that gave a statistically higher rating for the respective composite dish and sensory attribute than age category (years) (B); cANOVA test; d Welch test; OA= Overall acceptability.
The Welch test indicated that there was a significant difference between certain age
categories and the sensory properties of aroma and overall acceptability for white phutu and
curried bambara groundnut (p<0.05) (Table 9.14). There was no significant difference in the
acceptability ratings of PVA-biofortified composite dishes across age groups (p>0.05). The
taste of the PVA phutu and curried chicken and the PVA phutu and curried cabbage were
preferred by participants aged 30-39 years and 40-49 years, respectively. The 40-49 age group
preferred the texture and aroma of the PVA phutu and curried chicken and PVA phutu and
curried cabbage in comparison to the other age groups. The colour was preferred by both the
30-39 and 50-59 year age groups. Participants older than 60 years of age preferred the colour
and overall acceptability of the PVA phutu and cabbage composite dish more, in comparison
to the other age groups. The taste, texture, aroma, colour and overall acceptability of PVA phutu
and curried bambara groundnut were rated higher by those older than 60 years of age, in
comparison to other age groups. The 20-29 year old participants preferred the taste, texture,
aroma, colour and overall acceptability of OFSP, in comparison to the other age groups. The
paired preference results are presented in Tables 9.15 and 9.16.
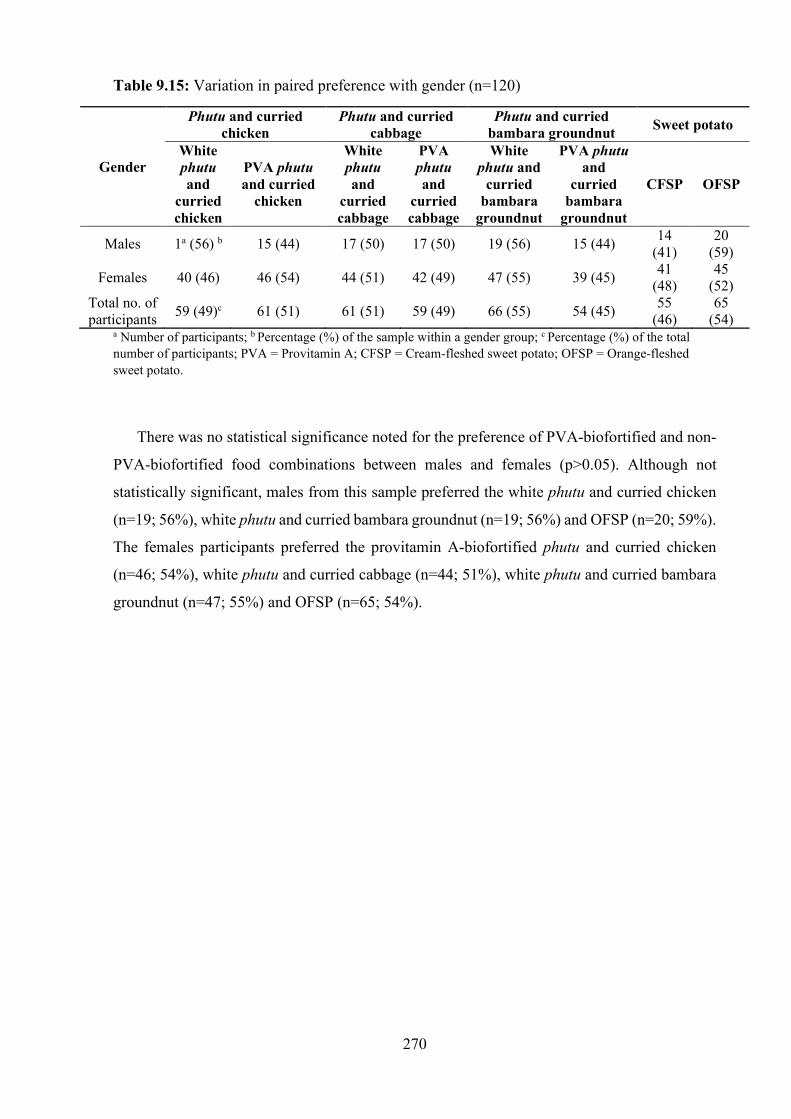
270
Table 9.15: Variation in paired preference with gender (n=120)
Gender
Phutu and curried chicken
Phutu and curried cabbage
Phutu and curried bambara groundnut Sweet potato
White phutu and
curried chicken
PVA phutu and curried
chicken
White phutu and
curried cabbage
PVA phutu and
curried cabbage
White phutu and
curried bambara
groundnut
PVA phutu and
curried bambara
groundnut
CFSP OFSP
Males 1a (56) b 15 (44) 17 (50) 17 (50) 19 (56) 15 (44) 14 (41)
20 (59)
Females 40 (46) 46 (54) 44 (51) 42 (49) 47 (55) 39 (45) 41 (48)
45 (52)
Total no. of participants 59 (49)c 61 (51) 61 (51) 59 (49) 66 (55) 54 (45) 55
(46) 65
(54) a Number of participants; b Percentage (%) of the sample within a gender group; c Percentage (%) of the total number of participants; PVA = Provitamin A; CFSP = Cream-fleshed sweet potato; OFSP = Orange-fleshed sweet potato.
There was no statistical significance noted for the preference of PVA-biofortified and non-
PVA-biofortified food combinations between males and females (p>0.05). Although not
statistically significant, males from this sample preferred the white phutu and curried chicken
(n=19; 56%), white phutu and curried bambara groundnut (n=19; 56%) and OFSP (n=20; 59%).
The females participants preferred the provitamin A-biofortified phutu and curried chicken
(n=46; 54%), white phutu and curried cabbage (n=44; 51%), white phutu and curried bambara
groundnut (n=47; 55%) and OFSP (n=65; 54%).
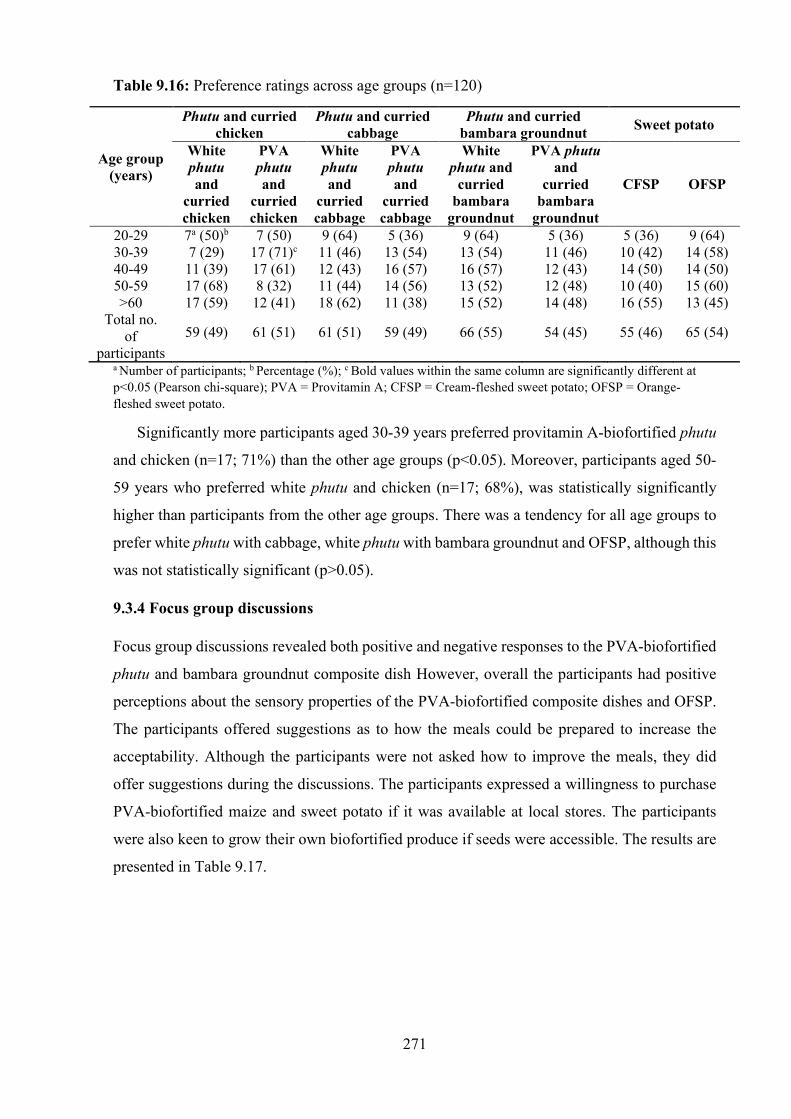
271
Table 9.16: Preference ratings across age groups (n=120)
Age group (years)
Phutu and curried chicken
Phutu and curried cabbage
Phutu and curried bambara groundnut Sweet potato
White phutu and
curried chicken
PVA phutu and
curried chicken
White phutu and
curried cabbage
PVA phutu and
curried cabbage
White phutu and
curried bambara
groundnut
PVA phutu and
curried bambara
groundnut
CFSP OFSP
20-29 7a (50)b 7 (50) 9 (64) 5 (36) 9 (64) 5 (36) 5 (36) 9 (64) 30-39 7 (29) 17 (71)c 11 (46) 13 (54) 13 (54) 11 (46) 10 (42) 14 (58) 40-49 11 (39) 17 (61) 12 (43) 16 (57) 16 (57) 12 (43) 14 (50) 14 (50) 50-59 17 (68) 8 (32) 11 (44) 14 (56) 13 (52) 12 (48) 10 (40) 15 (60) >60 17 (59) 12 (41) 18 (62) 11 (38) 15 (52) 14 (48) 16 (55) 13 (45)
Total no. of
participants 59 (49) 61 (51) 61 (51) 59 (49) 66 (55) 54 (45) 55 (46) 65 (54)
a Number of participants; b Percentage (%); c Bold values within the same column are significantly different at p<0.05 (Pearson chi-square); PVA = Provitamin A; CFSP = Cream-fleshed sweet potato; OFSP = Orange-fleshed sweet potato.
Significantly more participants aged 30-39 years preferred provitamin A-biofortified phutu
and chicken (n=17; 71%) than the other age groups (p<0.05). Moreover, participants aged 50-
59 years who preferred white phutu and chicken (n=17; 68%), was statistically significantly
higher than participants from the other age groups. There was a tendency for all age groups to
prefer white phutu with cabbage, white phutu with bambara groundnut and OFSP, although this
was not statistically significant (p>0.05).
9.3.4 Focus group discussions
Focus group discussions revealed both positive and negative responses to the PVA-biofortified
phutu and bambara groundnut composite dish However, overall the participants had positive
perceptions about the sensory properties of the PVA-biofortified composite dishes and OFSP.
The participants offered suggestions as to how the meals could be prepared to increase the
acceptability. Although the participants were not asked how to improve the meals, they did
offer suggestions during the discussions. The participants expressed a willingness to purchase
PVA-biofortified maize and sweet potato if it was available at local stores. The participants
were also keen to grow their own biofortified produce if seeds were accessible. The results are
presented in Table 9.17.

272
Table 9.17: Participants’ perceptions towards the consumption of OFSP and PVA-biofortified phutu with curried chicken, cabbage and bambara groundnut
Themes Concepts Quotes Discussion
Consumer perceptions about PVA-biofortified composite dishes and OFSP
Preference of combinations: • Phutu and
chicken • Phutu and
cabbage • Phutu and
bambara groundnut
• OFSP
‘Yellow phutu and chicken was nice.’ ‘Cabbage and yellow phutu went good together.’ ‘I did not like these beans.’ ‘This type of beans was different from what I am used to. I love it.’ ‘Orange sweet potato taste nice.’ ‘These beans must be mixed with dry mealies to make iznkobe. It will taste better.’
The FGDs indicated that participants had positive perceptions of the PVA phutu when served with curried chicken or curried cabbage. However, they had mixed perceptions when served with curried bambara groundnut. The older FGDs participants perceived that some of the combinations such as phutu and bambara would not be acceptable to younger consumers, as they were not accustomed to bambara.
Food preparation methods
‘Yellow maize could have been cooked for longer.’ ‘Too much water in the orange sweet potato.’ ‘Beans should be cooked with the maize for more flavour.’ ‘Beans could be cooked for longer.’ ‘Chicken would have tasted better with stiff pap.’ ‘Food cooked like I cook at home.’
Participants suggested names of other dishes made with PVA-biofortified maize that could be better accepted. Stiff pap was one of the suggestions given by FGD participants. Although there were mixed responses concerning bambara, participants offered a few suggestions to improve the acceptability. Participants would have preferred the bambara to be cooked for a longer period or cooked together with the maize meal.
Cultural acceptance of PVA-biofortified composite dishes and OFSP
Expectations of sensory qualities: • Smell • Appearance • Taste • Texture
‘Foods were made like I eat at home.’ ‘Our kids may not accept the preparation of the food as it has less oil and spice.’ ‘Thought the orange sweet potato was butternut.’
The majority of the FGD participants perceived the foods as culturally acceptable, however, they felt that some foods would not be as acceptable to their children and grandchildren. Foods that the younger generation like are prepared with more oil, salt and spices. Most of the FGD participants perceived the OFSP as butternut due to its orange colour, sweet taste and visual appeal and enjoyed the taste.
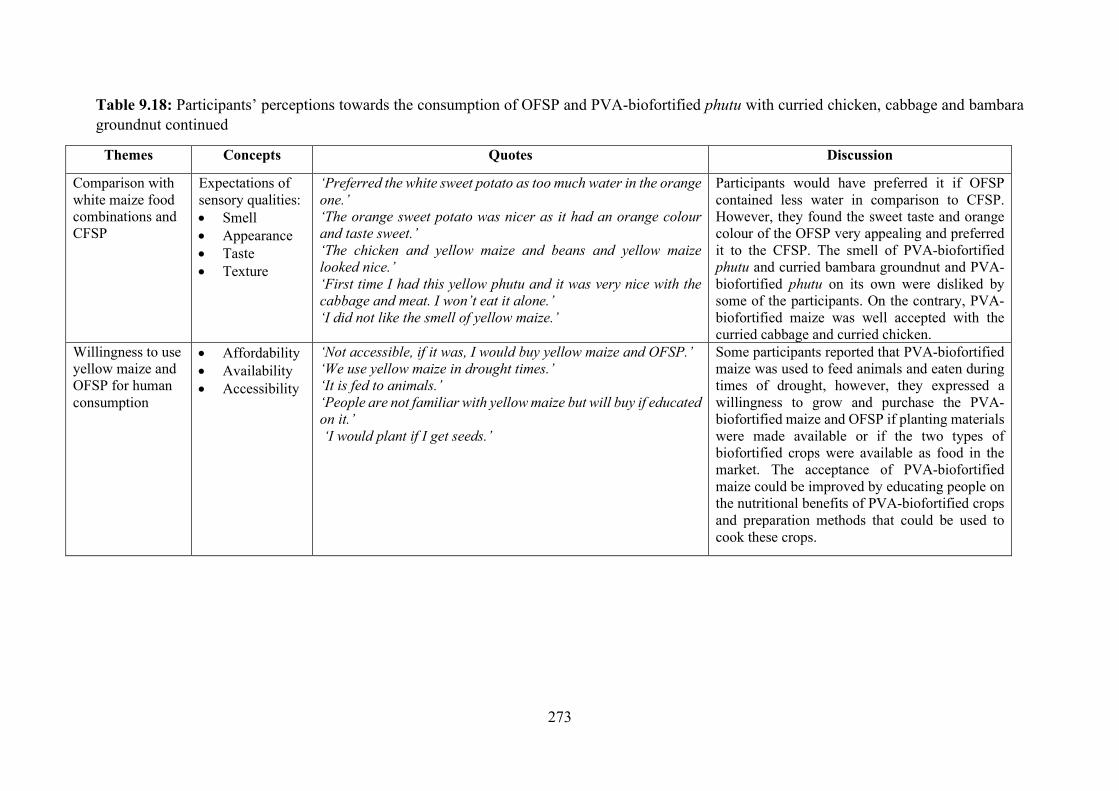
273
Table 9.18: Participants’ perceptions towards the consumption of OFSP and PVA-biofortified phutu with curried chicken, cabbage and bambara groundnut continued
Themes Concepts Quotes Discussion
Comparison with white maize food combinations and CFSP
Expectations of sensory qualities: • Smell • Appearance • Taste • Texture
‘Preferred the white sweet potato as too much water in the orange one.’ ‘The orange sweet potato was nicer as it had an orange colour and taste sweet.’ ‘The chicken and yellow maize and beans and yellow maize looked nice.’ ‘First time I had this yellow phutu and it was very nice with the cabbage and meat. I won’t eat it alone.’ ‘I did not like the smell of yellow maize.’
Participants would have preferred it if OFSP contained less water in comparison to CFSP. However, they found the sweet taste and orange colour of the OFSP very appealing and preferred it to the CFSP. The smell of PVA-biofortified phutu and curried bambara groundnut and PVA-biofortified phutu on its own were disliked by some of the participants. On the contrary, PVA-biofortified maize was well accepted with the curried cabbage and curried chicken.
Willingness to use yellow maize and OFSP for human consumption
• Affordability • Availability • Accessibility
‘Not accessible, if it was, I would buy yellow maize and OFSP.’ ‘We use yellow maize in drought times.’ ‘It is fed to animals.’ ‘People are not familiar with yellow maize but will buy if educated on it.’ ‘I would plant if I get seeds.’
Some participants reported that PVA-biofortified maize was used to feed animals and eaten during times of drought, however, they expressed a willingness to grow and purchase the PVA-biofortified maize and OFSP if planting materials were made available or if the two types of biofortified crops were available as food in the market. The acceptance of PVA-biofortified maize could be improved by educating people on the nutritional benefits of PVA-biofortified crops and preparation methods that could be used to cook these crops.
274
9.4 Discussion
Malnutrition is the leading contributor to the global disease burden (Faber and Wenhold, 2007;
UNICEF, 2016; UNICEF et al., 2019). SA is faced with the double burden of malnutrition (Shisana
et al., 2013). There are many interventions that focus on under and over-nutrition in vulnerable
population groups; however, micronutrient deficiencies are still prevalent. Although the
fortification of maize meal and wheat flour was legislated in SA in October 2003, the accessibility
of these commercially fortified foods to rural households remains questionable (DoH and UNICEF,
2007). Although PVA-biofortified crops improve the nutrient content of foods, their acceptability
to target consumers should be improved through research. Thus, this study aimed to investigate the
effect of replacing white maize and CFSP with PVA-biofortified maize and OFSP, respectively,
on consumer acceptability and perceptions of traditional dishes of selected rural communities in
KZN, SA.
The study results are encouraging as the sensory attributes taste, texture, aroma, colour and
overall acceptability were rated as good by most study participants for all of the PVA phutu
composite dishes. Over a millennia ago, in rural South African communities, indigenous and
traditional crops were the main source of food. However, with urbanisation, there has been a shift
from traditional foods to more western foods with less consumption of indigenous and traditional
foods (Van der Hoeven et al., 2013). The older generation has displayed some knowledge of
bambara groundnut (Oyeyinka et al., 2017), which was also found in the current study during the
FGDs. The older generation (above 60 years) rated the overall acceptability of phutu and curried
bambara groundnut better than the younger generation (20-29 years). Chowdhury et al. (2011),
reported that introducing an unfamiliar product could negatively affect consumer acceptance. This
could have been the case in the current study with the younger generation, specifically with regards
to the phutu and curried bambara groundnut composite dish which was least preferred in
comparison to the other composite dishes.
Although bambara groundnut is an unfamiliar food crop, it was introduced and investigated in
this study as it could be a cheaper alternative to animal protein. Crops like bambara groundnut
could be included in the meals used in school feeding programmes. This would not only improve
the nutritional intake of these children, but would result in earlier exposure to this food item. Early
and frequent exposure to a food item improves the acceptance of the food item (Appleton et al.,
2018). Another suggestion would be to prepare bambara groundnut into different food types using
275
preparation methods that have been shown to improve acceptance, such as roasting. A study
conducted by Oyeyinka et al. (2017) found that bambara groundnut made into a pureed infant
complementary food was acceptable to caregivers. Another study conducted in Nigeria using a
snack made from bambara groundnut flour found that the aroma, colour, crunchiness and overall
acceptability were higher than those of the control made with cowpea (Oyeyinka et al., 2017).
Additionally, Okafor et al. (2015) found that substituting roasted bambara groundnut at different
substitution levels for wheat flour in biscuits, had a higher sensory rating for the attributes
investigated. However, the flavour of the biscuits was similar to that of the control for up to 70%
substitution (Okafor et al., 2015). These studies further confirm that the way in which a food item
is prepared and the geographic location of consumers influence its acceptability (Okafor et al.,
2015; Oyeyinka et al., 2018; Oyeyinka et al., 2018).
As alluded to earlier, poverty is a problem and in some cases, impoverished individuals rely on
social grants as their sole source of income for purchasing food (Jacobs et al., 2010). Hence, there
is a lack of dietary diversity and a high reliance on starch-based foods, such as maize meal as they
are cheaper (Temple and Steyn, 2009; Battersby and Peyton, 2014). Thus, it is important to
introduce impoverished individuals to affordable nutritious food alternatives such as bambara
groundnut that can be consumed together with cooked maize meal. It is important to note that an
individual’s background, traditions, socioeconomic standing and geographical location are
important factors that influence the types of foods consumed and the preparation methods used
(Kearney, 2010; Wenhold et al., 2012; Kamphuis, 2015; Emily et al., 2017).
The participants from the present study were unfamiliar with bambara groundnut and the
younger generation lacked basic knowledge about this crop. This emphasises the need for education
on the nutritional benefits of bambara groundnut and methods for preparation, in order to improve
exposure and acceptance of this underutilised crop. It is noteworthy that this study did not educate
participants about the composite dishes prior to the sensory evaluation and FGDs. Future studies
could investigate the impact of nutritional education on consumer acceptability.
The acceptance of PVA-biofortified maize has been previously investigated by several authors
(Stevens and Winter-Nelson, 2008; De Groote et al., 2010; Pillay et al., 2011; Khumalo et al., 2011;
Govender et al., 2014; Awobusyi et al., 2016). Provitamin A-biofortified maize has been found to
have an undesirable colour. The grain colour changes from white to either yellow or orange due to
the carotenoid pigments (Stevens and Winter-Nelson, 2008; Muzhingi et al., 2008), thus
276
contributing to poor acceptability (De Groote et al., 2010). However, the change did not hinder
colour acceptability of the PVA-biofortified phutu and OFSP in this study. A number of studies
have investigated the preference of PVA-biofortified maize to white maize and found mixed
responses (Stevens and Winter-Nelson, 2008; Muzhingi et al., 2008; Nuss et al., 2012; Govender
et al., 2014; Awobusuyi et al., 2016). However, there is a paucity of information regarding the
preference of PVA-biofortified phutu composite dishes compared to corresponding white maize
composite dishes. The PVA phutu and curried chicken combinations were well accepted in the
current study. This result was similar to the results obtained by Amod et al. (2016), who
investigated the sensory acceptability of PVA-biofortified phutu consumed together with chicken
stew. The authors found that the combination of PVA-biofortified phutu and chicken was well
accepted by caregivers attending the paediatric outpatient department at Edendale Hospital in KZN
(Amod et al., 2016). The participants of the study conducted by Amod et al. (2016) were similar to
the current study participants, as Edendale Hospital mainly services individuals living in
surrounding rural areas (DoH, 2019). In the current study, it was reported that the aroma and colour
of the chicken and yellow phutu were well-accepted. These findings suggest that the combination
of curried chicken and PVA-biofortified phutu was well-accepted by study participants and could
help improve the vitamin A intake in vulnerable groups. However, as mentioned earlier, animal
food sources are not affordable. Thus, bambara groundnut should be considered not only as a
nutritious alternative, but also a viable production option in these areas.
A number of studies conducted on OFSP have shown positive responses from participants,
despite the orange colour (Tomlins et al., 2007; Chowdhury et al., 2011; Tomlins et al., 2012;
Laurie et al., 2013; Pillay et al., 2018). A study conducted by Pillay et al. (2018) on infant
caregivers found that a complementary food made with OFSP was well accepted by the caregivers
(Pillay et al., 2018). Additionally, another study that investigated the acceptance of OFSP by
caregivers, reported that the OFSP was preferred to the pale-fleshed sweet potato for all sensory
attributes investigated (Low and Van Jaarsveld, 2008). Moreover, a study conducted in Uganda
found that the deep orange coloured sweet potato was preferred over yellow or white sweet potato
(Chowdhury et al., 2011). Although not statistically significant, numerically, OFSP was preferred
to CFSP in the current study. This could be due to the sweet taste and colour of OFSP. The results
from this study are encouraging as they suggest that there is a potential to use OFSP in some rural
areas of KZN similar to the study sites, to improve the vitamin A status of vulnerable individuals.
277
Consumption of biofortified crops such as maize and OFSP and the consumption of an
indigenous crop like bambara groundnut could potentially increase the dietary diversity of
impoverished individuals and improve their nutritional status (Mavengahama et al., 2013).
However, bambara groundnut should be introduced in a different cooked form rather than curried
to improve acceptability. For this study, bambara groundnut was cooked in a similar manner to
curried bean to investigate the acceptance. The younger generation was unaccustomed to bambara
groundnut and the older generation that were familiar with it, enjoyed the taste. Acceptance of
bambara groundnut could be improved if it is cooked together with phutu or mealie meal or milled
into a flour and used to prepare other products. There is a need to further investigate the sensory
acceptability of combining other cooked PVA-biofortified maize foods such as stiff pap, mealie
meal porridge, amaheu, isigwaqane or isijingi, with commonly consumed food items in rural KZN,
and the other provinces within SA. Furthermore, future studies could explore the impact of
education on the nutritional benefits of these crops and the acceptance, perception and consumption
of these crops.
The FGD results correlate with the results obtained from the sensory evaluation as the FDG
participants had positive perceptions of the composite dishes made from PVA-biofortified phutu
and chicken and cabbage. However, there were mixed responses with regard to PVA-biofortified
phutu and curried bambara groundnut. This result was not surprising, as bambara groundnut is an
indigenous nutritious crop; however, it is not usually consumed in rural areas of KZN (Chivenge
et al., 2015). The older generation of participants perceived the phutu and bambara groundnut
combination as something the younger generation would not like, as they are not accustomed to it.
A study conducted by Oyeyinka et al. (2017) found that the older generation was familiar with the
preparation of bambara groundnut. This study further identified that a lack of knowledge may be a
reason for the underutilisation of this crop (Oyeyinka et al., 2017). It is important to educate the
younger generation on the nutritional benefits of consuming this crop, as well as good agricultural
practices to produce this crop. Knowing the nutritional value of a particular food item could
improve the acceptance of that specific item (Meenakshi et al., 2012). Furthermore, indigenous
crops such as bambara groundnut should be promoted to local farmers to improve the production
and access to these crops. These crops could become cash crops and further provide not only
nutrients, but also income for the local farmers.
Participants from the FGDs perceived the foods to be culturally acceptable and familiar;
however, they made suggestions as to what should be changed to improve the combinations. A few
278
male participants from the FGDs suggested that PVA-biofortified maize should be cooked into stiff
pap and served with curried chicken instead of phutu. A survey conducted at the start of this study,
found that 84.4% of the study participants consumed phutu, whereas only 42.4% consumed stiff
pap. From the combinations investigated, more participants preferred phutu and curried chicken
(n=27), rather than stiff pap and curried chicken (n=20). Although, it was suggested that the PVA-
biofortified maize should be cooked into stiff pap and served with curried chicken, the phutu
combination was still well perceived. Future studies should investigate consumer perceptions of
cooking PVA-biofortified maize into food forms other than phutu, and served with commonly
consumed foods. This would offer a variety of more acceptable foods that individuals could
consume to improve their nutritional status, particularly vitamin A.
The OFSP prepared for the sensory evaluation in this study seemed to retain water. Some of
the participants mentioned that they would have enjoyed it more if it were boiled for longer in less
water. The same amount of water and time taken for straining was used to cook the CFSP. A
possible reason for excess water content could be attributed to a relatively lower dry matter content
of the OFSP (Kathabwalika et al., 2016). The genotypes found in the different varieties of OFSP
influence the dry matter content and affect consumer acceptability (Kathabwalika et al., 2016).
Some participants suggested that the curried bambara groundnut needed to be cooked for a longer
period of time and that less water should be used when cooking OFSP. Further studies could
investigate the acceptance of OFSP when prepared with different amounts of water and cooking
times to improve acceptability. If OFSP is well accepted and consumed in areas where VAD is a
significant problem, it has the potential to improve the vitamin A status of these individuals.
Many study participants perceived the OFSP to be butternut due to the orange colour, sweet
taste and visual appeal, which was similar to the findings of a study conducted by Pillay et al.
(2018) on the acceptance of OFSP (Pillay et al., 2018). Moreover, other studies have also reported
that OFSP has been compared to pumpkin (Tomlins et al., 2007; Laurie et al., 2013). Although
OFSP may be unfamiliar to some individuals, it resembles other familiar food items. Participants
can therefore relate to it and are more likely to consume it. Generally, individuals are more inclined
to consume foods that are familiar to them (Chowdhury et al., 2011). The participants mentioned
that they would not have enjoyed PVA-biofortified phutu on its own. This was possibly due to the
undesirable sensory properties of biofortified foods and some participants being unfamiliar with it
(Nuss and Tanumihardjo, 2010; Chapman, 2012). This further suggests that if yellow maize is
consumed with another food item, it may mask the undesirable sensory changes noted with
279
biofortified foods, thus increasing its acceptance. Participants’ also indicated that the PVA-
biofortified phutu was appealing when served with curried chicken or curried bambara groundnut.
These results were consistent with the study conducted by Amod et al. (2016).
Many participants expressed that yellow maize was used as an animal feed or during drought.
This was similarly expressed in other studies (Muzhingi et al., 2008; Nuss et al., 2012; Govender
et al., 2014; Amod et al., 2016). However, study participants expressed a willingness to grow and
purchase PVA-biofortified maize and OFSP if seeds were made available or they could be found
in shops. At the time of the study, the crops used in this study were experimental and not available
on the market. Although PVA-biofortified foods have been found to be less acceptable by some
studies, foods investigated in the study were positively perceived by most of the FGD participants.
Therefore, PVA-biofortified maize and OFSP could replace white maize and CFSP, respectively,
as these foods are rich in vitamin A and could contribute to addressing VAD, which is prevalent in
rural areas of SA. However, there is a need to provide education on the health benefits of these
crops especially to the younger generation, who are not accustomed to these crops, to improve their
acceptance.
9.5 Conclusions
Provitamin A-biofortified foods served on their own have been well-accepted in some studies,
while other studies have found a poor acceptance due to several factors. The results of this study
were encouraging as foods investigated in this study were positively perceived by the majority of
the study participants. This study indicates that the undesirable properties of PVA-biofortified
foods that were found in other studies could be masked by serving it with another commonly
consumed food item, thus improving its acceptance. Although phutu and curried bambara
groundnut were not as preferred in comparison to the other composite dishes investigated, it was
rated as ‘good’ for all the sensory attributes. This indicated that although it was least preferred in
comparison to the other composite dishes, if served on its own it would be acceptable to consumers.
Phutu and curried chicken was the most preferred composite dish, however, it contains animal
protein which is less affordable to impoverished individuals. Bambara groundnut can be used as
an alternative affordable plant-based protein source; however, the acceptance needs to be further
investigated in other food products, such as incorporating the bambara groundnut and phutu during
cooking, addition of bambara groundnut to maize meal to make a traditional drink or serving it
with another form of cooked maize meal. Overall, it appears that PVA-biofortified maize combined

280
with curried cabbage, chicken, bambara groundnut and boiled OFSP have the potential to be used
as healthy alternatives to white maize combined with curried cabbage chicken, bambara groundnut
and boiled CFSP. However, more studies need to be conducted on trying to improve the exposure
to and acceptance of PVA-biofortified maize and bambara groundnut together, especially to the
younger generation. The bambara groundnut and PVA phutu combination could be used in school
feeding programmes as a cheaper alternative to animal protein. Not only will it improve the
nutritional intake of young children, but provide exposure of these crops to consumers at a young
age. Additionally, more education needs to be conducted on the nutritional benefits of PVA-
biofortified crops and bambara groundnut, especially for the younger generation as many of them
are not familiar with these crops. Moreover, PVA-biofortified crops (maize and sweet potato) and
bambara groundnut should be promoted to local farmers. Local farmers should be educated on the
production of these crops and possibly be given or sold seeds at a reduced cost. This would result
in an increased production of these crops by farmers, which could lead to improved consumption.
This study suggests that PVA-biofortified maize and OFSP could be incorporated into the diets of
the rural communities studied to contribute to combating VAD, which is a major problem in SA
and SSA.
References
ADELEKE OR, ADIAMO OQ, and FAWALE OS (2018) Nutritional, physiochemical, and functional
properties of protein concentrate and isolate of newly-developed bambara groundnut (Vigna subterranea
L.) cultivars. Food Sci Nutri 6 229-242.
AGRICULTURE, FORESTRY AND FISHERIES (2016) Bambara groundnuts (Vigna subterranean).
Department of Agriculture, Forestry and Fisheries, Pretoria.
ALLEN LH (2000) Anemia and iron deficiency: effects on pregnancy outcomes. Am J Clin Nutri 71(sup
1) 1280S-1284S.
ALTMAN M, HART T and JACOBS P (2009) Food Security in South Africa. Centre for poverty
employment and growth; HSRC.
AMOD R PILLAY K SIWELA M and KOLANISI U (2016) Acceptance of a complementary food based
on provitamin A-biofortified maize and chicken stew KRE J Hum Ecol 55 152-159

281
APPLETON KM, HEMINGWAY A, RAJSKA J and HARTWELL H (2018) Repeated exposure and
conditioning stratergies for increasing vegetable liking and intake: systematic review and meta-anlyses of
the published literature. Am J Clin Nutr 108 842-856.
AWOBUSUYI TD, SIWELA M, KOLANISI U and AMONSOU EO (2016). Provitamin A retention and
sensory acceptability of amahewu, a non-alcoholic cereal based beverage made with provitamin A-
biofortified maize. J Sci Food Agri 961356-1361.
BAIN LE, AWAH PK, GERALDINE N, KINDONG NP, SIGAL Y, BERNARD N, and TANJEKO AT
(2013) Malnutrition in Sub-Saharan Africa: burden, causes and prospects. Pan-Afri Med J 15 120.
doi.10.11604/pamj.2013.15.120.2535
BAJEC MR, PICKERING GJ and DECOURVILLE N (2012) Influence of stimulus temperature on
orosensory perception and variation with taste phenotype. Chemosensory Perc doi: 10.1007/s12078-012-
9129-5.
BARBOUR R (2018) Doing focus groups. London: SAGE publications.
BATTERSBY J and PEYTON S (2014) The geography of supermarkets in Cape Town: supermarket
expansion and food access Urban Forum 25, 153-164
BOGART KR, TICKLE-DEGNEN L, and JOFFE MS (2012) Social interaction experiences of adults with
Moebius Syndrome: a focus group. J Health Psych 17(8) 1212-1222.
BOUIS HE and SALTZMAN A (2017) Improving nutrition through biofortification: A review of evidence
from HarvestPlus, 2003 through 2016. Global Food Secur 12 49-58.
BOYE J, ZARE F, and PLETCH A (2010) Pulse proteins: processing, characterization, functional properties
and applications in food and feed. Food Res Int 43 414-431.
CHAPMAN MS (2012) Vitamin A: History, uses, and controversies. Seminars in Cutaneous Med Surgery
31(1), 11-16.
CHIBARABADA TP, MODI AT and MABHAUDHI T (2017) Expounding the value of grain legumes in
the semi-and arid tropics Sustain 9, 60; https://doiorg/103390/su9010060
CHIBARABADA TP, MODI A and MABHAUDHI T (2017) Expounding the value of grain legumes in
the semi-and arid tropics. Sustainability 9, 60.
282
CHIVENGE P, MABHAUDHI T, MODI AT, and MAFONGOYA P (2015) The potential of neglected
and underutilised crop species as future crops under water scarce conditions in sub-Saharan Africa. Int J
Environ Res Public Health 12(6) 5685-5711.
CHOWDHURY S, MEENAKSHI JV, TOMLINS KI and OWORI C (2011) Are consumers in developing
countries willing to pay more for micronutrient-dense biofortified foods? Evidence from a field experiment
in Uganda. Am J Agri Eco 93 (1) 83-97.
DE GROOTE H and KIMENJU SC (2008) Comparing consumer preferences for color and nutritional
quality of maize: Application of a semi-double bound logistic model on urban consumers in Kenya Food
Policy 33 362-370
DE GROOTE H, KIMENJU SC and MORAWETZ UB (2011) Estimating consumer willingness to pay for
food quality with experimental auctions: the case of yellow versus fortified maize meal in Kenya Agric Econ
42 1-16.
DE GROOTE H, TOMLINS K, HALEEGOAH J, AWOOL M, FRIMPONG B, BANERJI A,
CHOWDURY S and MEENAKSHI JV (2010) Assessing rural consumers’ WTP for orange biofortified
maize in Ghana with experimental auctions and a stimulated radio message Contributed paper presented at
the joint 3rd African association of agricultural economics (AAAE) and 48th agricultural economist
association of South Africa (AEASA) Cape Town South Africa September 19-23 2010
DEPARTMENT OF AGRICULTURE FORESTRY AND FISHERIES (DAFF) (2017) Trends in the
Agricultural Sector 2017 1-77
http://wwwdaffgovza/Daffweb3/Portals/0/Statistics%20and%20Economic%20Analysis/Statistical%20Inf
ormation/Trends%20in%20the%20Agricultural%20Sector%202017pdf (accessed on 09/09/18)
DEPARTMENT OF HEALTH (DOH), UNITED NATIONS CHILDREN’S FUND (UNICEF) (2007) A
Reflection of the South African Maize Meal and Wheat Flour Fortification Programme (2004 to 2007)
https://wwwuniceforg/southafrica/SAF_resources_wheatfortificationnpdf (Accessed on 17/8/2017)
DEPARTMENT OF HEALTH (DoH) (2018) Standard operating procedures on the prevention and
management of malnutrition in KZN. DoH: Pietermaritzburg.
DEPARTMENT OF HEALTH (DoH) (2019) Edendale Hospital.
http://www.kznhealth.gov.za/edendalehospital.htm (accessed on 01/10/19).
DEVELOPMENT INITIATIVES (2017) Global Nutrition Report 2017: Nourishing the SDGs Bristol:
Development Initiatives
283
EMILY KB, HUGGINS CE, HUGGINS CT, MCCAFFREY TA, PALERMO C, and BONHAM M (2017)
Influences on dietary choices during day versus night shift in shift workers: A mixed methods study
Nutrients 9 (193), doi:103390/nu9030193
ESCOTT-STUMP S (2015) Nutrition and Diagnosis-Related Care, 8th ed Wolters Kluwer, Philadelphia
FABER M and KRUGER HS (2005) Dietary intake, perceptions regarding body weight, and attitudes
toward weight control of normal weight, overweight, and obese black females in a rural village in South
Africa Ethnicity Dis 15, 238-244
FABER M, and BENADÉ AJS (2007) Breastfeeding, complementary feeding and nutritional status of
6-12-month-old infants in rural KwaZulu-Natal. S Afri J Clin Nutr 20(1) 16-24.
FABER M, and WENHOLD F (2007) Nutrition in contemporary South Africa Water SA 33(3) 393-400
FABER M, LAUBSCHER R, and LAURIE S (2013) Availability of, access to and consumption of fruits
and vegetables in a peri-urban in KwaZulu-Natal, South Africa. Maternal and Child Nutrition 9(3) 409-
424.
GOVENDER L, PILLAY K, DERERA J, and SIWELA M (2014) Acceptance of a complementary food
prepared with yellow, provitamin A-biofortified maize by black caregivers in rural KwaZulu-Natal S Afri J
Clin Nutr 27(4) 217-221
GOVENDER L, PILLAY K, SIWELA M, MODI A and MABHAUDHI T (2017) Food and Nutrition
Insecurity in Selected Rural Communities of KwaZulu-Natal South Africa – Linking Human Nutrition and
Agriculture Int J Environ Res Public Health 14 17 doi: 103390/ijerph14010017
GOVENDER L, PILLAY K, SIWELA M, MODI A and MABHAUDHI T (2019) Improving the dietary
vitamin A content of rural communities in South Africa by replacing non-biofortified maize and sweet
potato in traditional dishes. Nutrients 11, 1198 doi:10.3390/nu11061198.
HARVESTPLUS (2018) Crops: It all starts will a seed http://wwwharvestplusorg/what-we-do/crops
(accessed on 09/09/18)
HEYMANN H (1995) Three-day advance sensory analysis workshop. Agricultural research council (ARC),
Irene, Pretoria, South Africa, 19-21 April 1995.
HUMA N, ANJUM FM, SEHAR S, KHAN MI and HUSSAIN S (2008) Effect of soaking and cooking on
nutritional quality and safety of legumes Nutr Food Sci 38, 570-577
284
JACOBS P, BAIPHETHI M, NGCOBO N and HART T (2010) The potential of social grants expenditure
to promote local economic development and job creation.
http://repository.hsrc.ac.za/handle/20.500.11910/4286 (accessed on 22/01/19).
KAMPHUIS CB, DE BEKKER-GROB EW and VAN LENTHE FJ (2015) Factors affecting food choices
of older adults from high and low socioeconomic groups: a discrete choice experiment Am J Clin Nutr
104(4), 768-774
KATHABWALIKA D, CHILEMBWE E and MWALE V (2016) Evaluation of dry matter, starch and beta-
carotene content in orange-fleshed sweet potato (ipomoea batatas l.) genotypes tested in three agro-
ecological zones of Malawi. African Journal of Food Science 10: 320-326.
KEARNEY J (2010) Food consumption trends and drivers Philos Trans Royal Soc 365, 2793-2807
KEMP SE, HORT J and HOLLOWOOD T (2018) Descriptive Analysis in Sensory Evaluation. West
Sussex: John Wiley and Sons.
Khumalo TP, Schönfeldt HC and Vermeulen H (2011) Consumer acceptability and perceptions of maize
meal in Giyani, South Africa. Dev S Afr 28(2), 271-281.
KOLAHDOOZ F, SPEARING K, and SANGITA S (2013) Dietary adequacies among South African adults
in rural KwaZulu-Natal. PLos ONE 8(6) e67184 doi:10.1371/journal.pone.0067184.
KRUEGER R and CASEY M (2009) Focus Groups: A Practical Guide for Applied Research. London: Sage
Publications.
LABADARIOS D and VAN MIDDELKOOP AM (1995) The South African Vitamin A Consultative Group
Children Aged 6-71 Months in South Africa 1994; Their Anthropometric Vitamin A Iron and Immunization
Coverage Status Isando South Africa
LABADARIOS D, MOODIE IM, and VAN RENSBURG A (2007) Vitamin A status: In: Labadarios D
National Food Consumption Survey: Fortification Baseline, Chapter 9B: South Africa 2005 Department of
Health, Stellenbosch
LABADARIOS D, STEYN N, MAUNDER E, MACINTYRE U, SWART R, GERICKE G, HUSKISSON
J, DANNHAUSER A, VORSTER HH, and NESAMVUNI EA (2000) The National Food Consumption
Survey (NFCS): children aged 1-9 years, South Africa 1999 Department of Health: Directorate of
Nutrition, Pretoria
285
LABADARIOS D, SWART R,MAUNDER EMW, KRUGER HS, GERICKE GJ, KUZWAYO PMN,
NTSIE PR, STEYN NP, SCHLOSS I, DHANSAY MA, JOOSTE PL, DANNHAUSER A, NEL JH,
MOLEFE D and KOTZE TJVW (2008) The national food consumption survey Fortification baseline
(NFCS:FB-1) SA J Clin Nutri 21(3) (supp 2) 246-271
LAURIE SM and VAN HEERDEN SM (2012) Consumer acceptability of four products made from beta-
carotene-rich sweet potato Afr J Food Sci 6 96-103
LAURIE SM, FABER M, CALITZ FJ, MOELICH EI, MULLER N, and LABUSCHAGNE T (2013). The
use of sensory attributes, sugar content, instrumental data and consumer acceptability in selection of sweet
potato varieties. J Sci Food Agri 93 1610-1619.
LAWLESS HT and HEYMANN H (2010) Sensory Evaluation of Food, 2nd ed. New York: Springer.
LEWU FB and MAVENGAHAMA S (2011) Utilization of wild vegetables in four districts of northern
KwaZulu-Natal Province, South Africa. African Journal of Agricultural Research 6(17), 4159-4165.
LICHTFOUSE E (2016) Sustainable agriculture reviews, 19th ed. Springer international publishing,
Switzerland.
LIM J (2011) Hedonic scaling: A review of methods and theory. Food Quality and Preference 22, 733-747.
LINNEMANN A, and AZAM-ALI S (1993) Bambara groundnut (Vigna subterranean L. verde).
Underutilised crops series II vegetables and pulses. London.
LOW JW and VAN JAARSVELD PJ (2008) The potential contribution of bread buns fortified with beta-
carotene-rich sweet potato in central Mozambique Food Nutr Bull 29 98-107
LOW JW, MWANGA ROM, ANDRADE M, CAREY E, and BALL A (2017) Tackling vitamin A
deficiency with biofortified sweet potato in sub-Saharan Africa. Glob Food Secur 14 23-30
http://dx.doi.org/10.1016/j.gfs.2017.01.004.
MAVENGAHAMA S, MCLACHLAN M and DE CLERCQ W (2013) The role of wild vegetable species
in household food security in maize based subsistence cropping systems. Food Secur 5 227-233.
MEENAKSHI JV, BANERJI A, MANYONG V, TOMLINS K, MITTAL N and HAMUKWALA P (2012)
Using discrete choice experiment to elicit the demand for nutritious food: willingness-to-pay for orange
maize in rural Zambia. Journal of Health Economics 31(1), 62-71.
286
MITRA S (2012) Nutritional status of orange-fleshed sweet potatoes in alleviating vitamin A malnutrition
through a food-based approach J Nutri Food Sci 2 1-3
MODI M, MODI AT, HENDRIKS S (2006) Potential role for wild vegetables in household food security:
A preliminary case study in KwaZulu-Natal, South Africa. Afr J Food Agr Nutr Dev 6 1-13.
MUBAIWA J, FOGLIANO V, CHIDEWE C and LINNEMAN AR (2017) Hard-to-cook phenomenon in
bambara groundnut (vigna subterranean (L.) verdc.) processing: options to improve its role in providing
food security. Food Rev Int 33 167-194.
MUZHINGI T, LANGYINTUO AS, MALABA LC, and BANZIGER M (2008) Consumer acceptability of
yellow maize products in Zimbabwe. Food Policy 33 352-361.
MWALE S, AZAM-ALI S, and MASSAWE FJ (2007) Growth and development of Bambara groundnut
(Vigna subterranea) in response to soil moisture: 1. Dry matter and yield. Eur J Agron 26 345-353.
NATIONAL AGRICULTURAL MARKETING COUNCIL (NAMC) (2019) Markets and economic
research centre: food basket price monthly https://wwwnamccoza/wp-content/uploads/2019/04/NAMC-
Food-Basket-Price-Monthly-Apr-2019pdf (accessed on 20/05/19)
NATIONAL AGRICULTURAL MARKETING COUNCIL (NAMC) (2018) Markets and economic
research centre: food basket price monthly https://wwwnamccoza/wp-content/uploads/2019/04/NAMC-
Food-Basket-Price-Monthly-Apr-2019pdf (accessed on 20/05/19)
NATIONAL DEPARTMENT OF HEALTH (nDoH), STATISTICS SOUTH AFRICA (StatsSA), SOUTH
AFRICAN MEDICAL RESEARCH COUNCIL (SAMRC), ICF (2017). South Africa Demographic and
Health Survey 2016: Key indicators. Health and vital statistics division, Pretoria.
NDIDI US, NDIDI CU, AIMOLA IA, BASSA OY, MANKILIK M, and ADAMU ZC (2014) Effects of
processing (boiling and roasting) on the nutritional and antinutritional properties of bambara groundnuts
(vigna subterranean [L.] verdc.) from Southern Kaduna, Nigeria. J Food Proces.
doi.org/10.1155/2014/472129.
NUSS ET, ARSCOTT SA, BRESNAHAN K, PIXLEY KV, ROCHEFORD T, HOTZ C, SIAMUSANTU
W, CHILESHE J and TANUMIHARDJO SA (2012) Comparative intake of white-versus orange-colored
maize by Zambian children in the context of promotion of biofortified maize. Food Nutr Bull 33 63-71.
Nuss, E.T., Tanumihardjo, S.A., 2010. Maize: A paramount staple crop in the context of global nutrition.
Comp Rev Food Sci Food Saf 9 417-436.
287
OKAFOR JNC, OKAFOR G, LEELAVATHI K, BHAGYA S, and ELEMO GN (2015) Effect of roasted
bambara groundnut (voandzeia subterranean) fortification on quality and acceptability of biscuits. Pak J
Nutr 14 653-657.
OYEYINKA AT, PILLAY K and SIWELA M (2017) Consumer awareness and acceptability of bambara
groundnut as a protein source for use in complementary foods in rural KwaZulu-Natal South Africa J Clin
Nutr 30 87-92
OYEYINKA SA, TIJANI TS, OYEYINKA AT, ANSE AK, BALOGUN MA, KOLAWOLE FL,
OBALOWU MA and JOSEPH KJ (2018) Value added snacks produced from bambara groundnut (vigna
subterranean) paste or flour LWT – Food Sci Techn 58 120-131
PILLAY K, DERERA J, SIWELA M, and VELDMAN FJ (2011) Consumer acceptance of yellow
provitamin A-biofortified maize in KwaZulu-Natal. S Afr J Clin Nutr 24 186-191.
PILLAY K, KHANYILE N, and SIWELA M (2018) Acceptance of an orange-fleshed sweet potato
complementary food by infant caregivers in KwaZulu-Natal province-a preliminary study. S Afr J Child
Health 12(3) 100-104.
PINSTRUP-ANDERSEN P (2009) Food security: definition and measure. J Food Secur 1 5-7.
POLAK R, PHILLIPS EM and CAMPBELL A (2015) Legumes: Health benefits and culinary approaches
to increase intake. Clin Diab 33 198-205.
RAMAKRISHNAN U (2002) Prevalence of micronutrient malnutrition worldwide. Nutr Rev 60: S46-S52.
SERNA-SALDIVAR SO (2010) Cereal grains: properties, processing and nutritional attributes Boca Raton:
CRC Press
SHISANA O, LABADARIOS D, REHLE T, SIMBAYI L, ZUMA K, DHANSAY A, REDDY P, PARKER
W, HOOSAIN E, NAIDOO P, HONGORO C, MCHIZA Z, STEYN NP, DWANE N, MAKOAE M,
MALULEKE T, RAMLAGAN S, ZUNGU N, EVANS MG, JACOBS L, FABER M and SANHANES-1
Team (2013) South African National Health and Nutrition Examination Survey (SANHANES-1) Cape
Town: HSRC Press
SILVERMAN D (2017) Doing Qualitative Research. London: SAGE publications.
SMUTS CM, DHANSAY MA, FABER M, VAN STUIJVENBERG ME, SWANEVELDER S, GROSS R
and BENADÉ AJS (2005) Efficacy of multiple micronutrient supplementation for improving anaemia
micronutrient status and growth in South Africa infants J Nutr 135 653S-659
288
SOUTH AFRICAN SOCIAL SECURITY AGENCY (SASSA) (2018) A Statistical Summary of Social
Grants In South Africa. Fact Sheet: Issue No.21. http://www.sassa.gov.za/index.php/statistical-reports
(accessed on 08/01/19).
STATISTICS SOUTH AFRICA (StatsSA) (2017) Poverty trends in South Africa. An examination of
absolute poverty between 2016 and 2015. Statistics South Africa: Pretoria.
STATISTICS SOUTH AFRICA (StatsSA) (2018) General Household Survey (2017)
http://wwwstatssagovza/publications/P0318/P03182017pdf (accessed on 26/07/18)
STATISTICS SOUTH AFRICA (StatsSA) (2019) General household survey 2018. Statistics South Africa:
Pretoria. http://www.statssa.gov.za/publications/P0318/P03182018.pdf (Accessed on 20/09/2019).
STEVENS R, and WINTER-NELSON A (2008) Consumer acceptance of provitamin A-biofortified maize
in Maputo, Mozambique. Food Policy 33(4) 341-351.
STONE A, MASSEY A, THEOBALD M, STYSLINGER M, KANE D, KANDY D, TUNG A, ADEKOYA
A, MADAN J, DAVERT E (2011) African’s indigenous crops. http://www.NourishingthePlanet.org.
(Assessed on 01/08/2017).
STONE H (2018) Example food: what are its sensory properties and why is that important. Sci Food 2, 1-
3. doi:10.1038/s41538-018-0019-3.
SWART R, SANDERS D, and MCLACHLAN M (2008) Nutrition: A Primary Health Care Perspective
http://healthlink.org.za/uploads/files/chap9_08.pdf (Accessed on 28/01/2016).
TEMPLE NJ and STEYN NP (2009) Food prices and energy density as barriers to healthy food patterns in
Cape Town, South Africa. J Hung Environ Nutri 4 203-213.
TOLLEY EE, ULIN RR, MACK N, ROBINSON ET and SUCCOP SM (2016) Qualitative methods in
public health: a field guide for applied research 2nd ed. San Francisco: Wiley.
TOMLINS K, NDUNGURU C, STAMBUL K, JOSHUA N, NGENDELLO T RWIZA E AMOUR R
RAMADHANI B KAPANDE A WESTBY A (2007) Sensory evaluation and consumer acceptability of
pale-fleshed and orange-fleshed sweet potato by school children and mothers with preschool children J Sci
Food Agri 98 2320-2331
TOMLINS K, OWORI C, BECHOFF A, MENYA G, and WESTBY A (2012) Relationship among the
carotenoid content, dry matter content and sensory attributes of sweet potato. Food Chem 131(1) 14-21.
289
UNITED NATIONS CHILDREN’S FUND (UNICEF) (2016) Stunting reflects chronic undernutrition
during the most critical periods of growth and development in early life.
http://unicef.in/Whatwedo/10/stunting (Accessed on 15/06/2016).
UNITED NATIONS CHILDREN’S FUND (UNICEF), WORLD HEALTH ORGANISATION (WHO),
WORLD BANK GROUP 2017 Levels and trends in child malnutrition
http://datauniceforg/topic/nutrition/malnutrition/ (accessed on 23/07/2017)
UNITED NATIONS CHILDREN’S FUND (UNICEF). 2019. Vitamin A.
https://data.unicef.org/topic/nutrition/vitamin-a-deficiency/ (accessed on 10/07/19).
UNITED NATIONS INTERNATIONAL CHILDREN'S EMERGENCY FUND (UNICEF). 2016. What is
malnutrition? https://www.who.int/features/qa/malnutrition/en/ (accessed on 22/01/19).
UNITED NATIONS INTERNATIONAL CHILDREN'S EMERGENCY FUND (UNICEF)., World Health
Organisation (WHO)., World Bank Group., 2019. Levels and trends in child malnutrition.
https://www.who.int/nutgrowthdb/jme-2019-key-findings.pdf?ua=1 (accessed on 22/01/19).
UVERE P, UWAEGBUTE A, and ADEDEJI E (1999) Effects of malting on the milling performance and
acceptability of bambara groundnut (voandzela subterranea thouars) seeds and products. Plant Food
Human Nutr 54 49-57.
VAN DER HOEVEN M, OSEI J, GREEFF M, KRUGER A, FABER M and SMUTS CM (2013)
Indigenous and traditional plants: South African parents’ knowledge, perceptions and uses and their
children’s sensory acceptance J Ethnobiol Ethnomed 9 78.
WEBB FS and WHITNEY EN (2017) Nutrition: Concepts and Controversies 14th ed. Boston: Cengage.
WENHOLD F ANNANDALE J FABER M and HART T (2012) Water use and nutrient content of crop
and animal food products for improved household food security: A scoping study: report to the water
research commission TT
537/12http://wwwwrcorgza/Knowledge%20Hub%20Documents/Research%Reports/TT%20537-12pdf
(accessed on 03/09/16)
WORLD HEALTH ORGANISATION (WHO) (2019) Micronutrient deficiencies: Vitamin A Deficiency.
https://www.who.int/nutrition/topics/vad/en/ (accessed on 22/01/19).
290
CHAPTER 10
GENERAL CONCLUSIONS AND RECOMMENDATIONS AT Modi and T Mabhaudhi
10.1 General Discussion
The triple burden of malnutrition, under- and over-nutrition as well as micronutrient deficiency,
pose a continuing and serious health concern to South Africa. Undernutrition presents as wasting,
stunting, underweight and micronutrient deficiencies, such as iron, zinc and vitamin A, while over-
nutrition manifests as overweight, obesity and several non-communicable diseases. Vulnerable
groups, such as children under the age of five years and pregnant women, are most affected by
malnutrition. In developing countries, such as South Africa (SA), the major contributing factors to
all forms of malnutrition are poverty, food and nutrition insecurity as well as the shift from
traditional diets towards westernised diets. The malnutrition situation is quite dire in poor rural
households, which coincidentally are located in marginal production areas. In these areas, water
remains the primary limiting factor to successful production. This also makes food production and
access to healthy and diverse foods challenging in these areas. Through a multidisciplinary study
that included dieticians, crop scientists and social scientists working together, this project sought
to determine water use and nutritional water productivity for improved production, nutrition and
health in poor rural communities.
At inception, the project undertook systematic reviews to (i) update available knowledge on
water use and nutritional water productivity, (ii) identify food intake, food sources and nutritional
value of food consumed in poor rural communities, (iii) food intake and sources of food in poor
rural households, and (iv) identify the reasons behind choices of food intake in poor rural
households and nutritional evaluation of food intake. The work took a global perspective as well
as a more focused perspective on the study population of KwaZulu-Natal. The results highlighted
that both under- and over-nutrition remain a public health concern, particularly in children, and
especially among poor rural households. Both stunting and obesity were prevalent in children under
five years, while the prevalence of obesity was highest in adult black African females. Dietary
intake plays an important role in determining nutritional status. The dietary intake patterns of poor
rural households investigated indicated a high carbohydrate and protein intake with a low
291
micronutrient and fibre intake. More than 50% of the sample of children and adults had inadequate
intake of the following nutrients: magnesium, phosphorus, zinc, riboflavin, niacin, folate, vitamin
B12, vitamin A, vitamin C, vitamin E and vitamin K, for most of the age groups. These results
confirmed that malnutrition (under- and over-nutrition) are equally a serious health issue and are
directly linked to the consumption of diets that lack dietary diversity. Although there are
interventions in place to tackle malnutrition, progress is slow, which seems largely due to poor
project designs, most of which lack or have limited linkages between agriculture, environment and
health. To address the challenge of reliance on nutrient-deficient diets and the resultant prevalence
of malnutrition especially among the poor rural households in sub-Saharan Africa, there is a need
for adoption of alternative and/or complementary strategies such as biofortification of staple foods
or the introduction of nutrient-dense indigenous crops, with commitant maximal water use in the
production of the nutrious crops.
The second phase of the study, which built-on from the first phase, then focused on (i)
measuring water use and nutritional water productivity, (ii) modelling yield and water use, and (iii)
formulating best management practices for the range of identified crops. Based on the initial
reviews (cf. Chapters 2 and 3), it was shown that lack of dietary diversity was central to
malnutrition. As such, any crop intervention should focus on crops that have low water use and are
nutrient dense since there was no problem with energy intake but with micronutrient intake.
Therefore, it was decided to focus on legumes (conventional and alternative) and sweet potato
(conventional and alternative). This was also supported by reports of nutritional content values
reported in Deliverable No. 6, which clearly showed that legumes offered great diversity in terms
of nutritional value. As such, the project focused on evaluating conventional (groundnut and dry
beans) and alternative (bambara groundnut and cowpeas) legumes.
This study was a first to benchmark conventional grain legumes to alternative grain legumes
under similar conditions. It was observed that the conventional grain legumes had higher yield
compared to bambara groundnut. In this study, bambara groundnut showed attributes that were not
favourable for farmers. Conventional legumes were also well-adapted relative to bambara
groundnut. Any successful promotion of alternative/underutilised crops should be preceded by crop
improvement for the crops to be accepted by farmers. The study highlighted areas of improvement
for bambara groundnut (improved canopy development, yield and harvest index), which could act
as a starting point for breeders. This study was a first to determine NWP of grain legumes. Crops
differed in their nutrient content. Groundnut had higher fat content relative to the other crops. Any
292
promotion of groundnut should be accompanied with awareness of the risk associated with its over
consumption, such as obesity. Measured protein content (205 and 325 g kg-1) for all grain legumes,
was enough to supply 40-60% of the recommended dietary allowance (RDA) for protein.
Furthermore, dry bean and cowpea can supply 40-60% of the RDA for Fe and Zn. Interestingly,
compared to leafy vegetables in previous reports, cowpea and dry bean contained ≈500% more Zn
content, confirming that grain legumes have a role to play in dietary diversity.
With respect to NWP, it varied among the conventional and alternative crops. With respect to
fat productivity, groundnut was the most productive, producing up to 400 gFAT m-3. For NWP Fe, Zn
and Ca, dry bean was the most productive followed by cowpea. For groundnut, despite the high grain
yield, NWP Fe, Zn and Ca were low due to poor nutrient content. The conventional legumes (groundnut
and dry bean), had the highest NWPprotein, relative to the alternative grain legumes. In the case of
groundnut, this was attributed to high protein content and high yield observed for the crop. For dry
bean, high NWPprotein was attributed to low ET and high protein content. For the alternative grain
legumes (cowpea and bambara groundnut), NWPprotein was low due to low protein content, high
ET and low grain yield for bambara groundnut and low yield for cowpea. Results of NWP further
highlight the issue of crop improvement in alternative grain legumes to improve yield as this also
had negative implications on NWP.
Another first emanating from the project, was to calibrate the FAO AquaCrop model groundnut
and dry bean – the conventional legumes. With respect to the alternative legumes, AquaCrop has
already been calibrated and tested for bambara groundnut (WRC K5/1771//4), while frequent
animal attacks targeting cowpea and subsequent yield losses meant that there was insufficient data
to calibrate and test the model. Model calibration and validation was done under varying water
regimes and environments. AquaCrop was successfully calibrated for both crops; there was a good
match between simulated and observed values. Overall, model performance for simulating yield
and water use was acceptable; the model could be useful for assessing growth, yield and water use
under semi-and arid conditions.
Further to model calibration and validation, the model was then applied to develop best
management practice recommendations for one conventional and alternative crop. Early planting
improved Y and WPET of groundnut; however, during dry seasons, late planting is recommended
as it was associated with Y and WPET improvements. Late planting could also be explored as a
climate change adaptation strategy. Bambara groundnut is day length sensitive, hence it performed
293
poorly due to late planting (Y and WPET decreased by more than 40%). For bambara groundnut,
early planting is recommended. Mulching improved Y and WPET during dry seasons; however, the
feasibility of mulching is of concern due to competing needs for crop residues and labour involved
in obtaining straw. With respect to increasing Y, optimum irrigation is recommended, while deficit
irrigation is recommended if the goal is to optimise WPET. While optimum irrigation reduces the
risk of crop failure, this may not be feasible due to water scarcity, hence deficit irrigation is
recommended. Tied ridges and soil bunds should be promoted as a soil water conservation
technique; they were shown to be most effective during dry seasons. Consistent with the trend of
results, crop diversification remains a viable option for crop production in water scarce
environments; the study observed bambara groundnut to have low risk of crop failure, compared
to groundnut.
The third phase of the project was to then test the feasibility of promoting these alternative
crops among the target populations. For this phase, the study focused on PVA-biofortified maize,
OFSP and bambara groundnut. The aim was to (i) determine the nutrient content of dishes prepared
with these alternative crops, and (ii) consumer acceptability of such dishes. The results were
encouraging as they showed that PVA-biofortified maize had higher PVA carotenoid concentration
relative to white maize. PVA-biofortified phutu composite dishes were shown to be nutritionally
superior compared to non-biofortified composite dishes. Combining the PVA maize phutu with
either curried cabbage, chicken, or bambara groundnut further improved the PVA carotenoid
concentration and overall nutrient content of the composite dishes. For example, the PVA phutu
and curried chicken composite dish also had improved protein content when compared to white
phutu and curried chicken. Because of the cost of animal-sourced foods, the PVA phutu and
bambara groundnut composite dish could be a suitable and affordable alternative for poor rural
households. Similar to PVA-biofortified maize, OFSP was nutritionally superior, in terms of PVA
carotenoid and fibre content relative to CFSP. The OFSP met three times more the EAR for vitamin
A for the 1-3- and 4-5-year age groups. Our findings support the hypothesis that PVA-biofortified
composite dishes could reduce VAD and improve the protein quality of the diet in poor rural
communities.
In terms of consumer acceptability, the PVA-biofortified composite dishes were positively
perceived by the majority of participants. Orange-fleshed sweet potato was similarly acceptable to
CFSP. This was contrary to our initial assumptions that consumer acceptance of composite foods
made with PVA-biofortified maize or OFSP would be low due to the unacceptable sensory
294
properties exhibited by PVA-biofortified foods. Thus, PVA-biofortified composite dishes have the
potential to be used as healthy alternatives to reduce VAD in poor rural communities.
10.2 Conclusions
The general aim of the project was to determine water use and nutritional water productivity for
improved production, nutrition and health in poor rural communities. Secondary to this was to also
identify food intake, food sources and nutritional value of food consumed in poor rural
communities and link these to the choice of crops that could be used to address nutritional gaps in
poor rural communities that also face water scarcity.
Little attention has been given to linking agriculture to nutritional outcomes well.
Consequently, despite well-intentioned agricultural interventions, poor rural households still suffer
unacceptably high levels of malnutrition. Undernutrition, specifically stunting, remains a problem
in children. Over-nutrition, including both overweight and obesity are a problem among black
African females. Malnutrition, in all its forms, in poor rural communities was mainly associated
with a lack of dietary diversity and limited access to and non-availability of nutrient dense foods.
Availability and access to nutritious foods is a major obstacle to improving the diets of poor, rural
people. The majority of them rely on social grants, which restricts them to a narrow food basket
that lacks diversity. Under these circumstances, agriculture offers an opportunity to address the
availability and accessibility of diverse nutrient-dense foods in poor rural communities. In this
regard, promoting underutilised crops that are water use efficient and nutrient dense, as alternative
crops, could increase dietary diversity and increase access to nutrient-dense foods in poor rural
communities.
The study determined water use and nutrient content of two conventional (groundnut and dry
beans) and alternative (bambara groundnut and cowpea) crops. Notably, this was a first with
regards to benchmarking conventional and alternative crops under similar conditions. This study
was also the first to determine NWP of grain legumes. As expected, the conventional crops out-
yielded the alternative crops and had superior yield, water use, water productivity, and NWP.
Although alternative crops had reasonably good nutrient content and NWP, there is a need to
improve them, especially to increase the yield and improve WP. Thus, any successful promotion
of alternative/underutilised crops should be preceded by crop improvement for the crops to be
accepted by farmers.
295
With regards to acceptability of composite dishes prepared using alternative crops such as
PVA-biofortified maize and OFSP as well as bambara groundnut, the project highlighted that such
composite dishes were favourably perceived and there was potential for consumption within poor
rural communities targeted by the study. However, the promotion of alternative crops as part of
composite dishes should be supported by education and awareness campaigns, as much of the
knowledge related to utilisation has been lost.
The project was also the first to calibrate the FAO AquaCrop model for groundnut and dry
bean, both conventional legumes. AquaCrop was successfully calibrated for both crops with
overall, model performance for yield and water use being regarded as acceptable. The availability
of validated crop models will contribute to future research on assessing crop suitability of the
various crops.
10.3 Recommendations
The major recommendations derived from this study are:
• There is a need to link agricultural interventions to nutrition outcomes for improved human
health and well-being. This should include adopting a sustainable food systems approach
that links agriculture, the environment and health outcomes;
• Access to diverse and nutrient foods remains problematic as most rural households cannot
afford to purchase diverse foods. Therefore, promotion of community and homestead
gardens has the potential to address dietary diversity among poor rural households;
• In areas that have limited water availability, crop choice should be informed by more than
just crop suitability. It should also be informed by gaps in nutrition within target areas, food
choices and reasons thereof. Therefore, the use of metrics such as NWP which link water
to nutrition may be useful to advise better advice on nutrient dense crops for water scarce
environments;
• Alternative crops such as underutilised indigenous and traditional crops have the potential
to provide nutrient dense options and may be better suited for production in water scarce
environments; however, they still lack improvement and often produce yields that are lower
than those of conventional crops, making them unattractive. Therefore, crop improvement
should target improving the yield and sensory attributes of these crops; and
296
• The challenges of food and nutritional insecurity are systemic by nature and linked to other
drivers. Therefore, in planning interventions for improving food and nutrition security,
more transdisciplinary approaches that include agriculture, environment and health
practitioners working together, is needed to tackle the growing burden of malnutrition.
Furthermore, education and awareness campaigns are needed to promote nutrient dense
crops and biofortified crops in order to increase their uptake
10.4 Proposed Future Research
Based on the findings of this project, the following future research is proposed:
o Scaling up the study to other rural areas of South Africa, especially Limpopo and the Eastern
Cape, which also face similar circumstances as those described in the current study;
o transitioning rural food systems towards sustainable food systems, with a focus on linking
agriculture, the environment and health;
o investigating the potential of promoting underutilised crops as nutrient dense alternatives in
water scarce environments;
o the role of indigenous fruit trees in agroecology and income generation initiatives for
sustainable rural livelihoods;
o developing metrics such as the NWP that help the assessment of the water-food-nutrition-
health nexus;
o determining the water use of biofortified crops and options for mainstreaming them into
rural diets; and
o building education and awareness among consumers on healthy dietary habits. Finally,
transdisciplinary approaches that straddle the science-policy interface should be promoted
in such research in order to inform policy and decision makers.
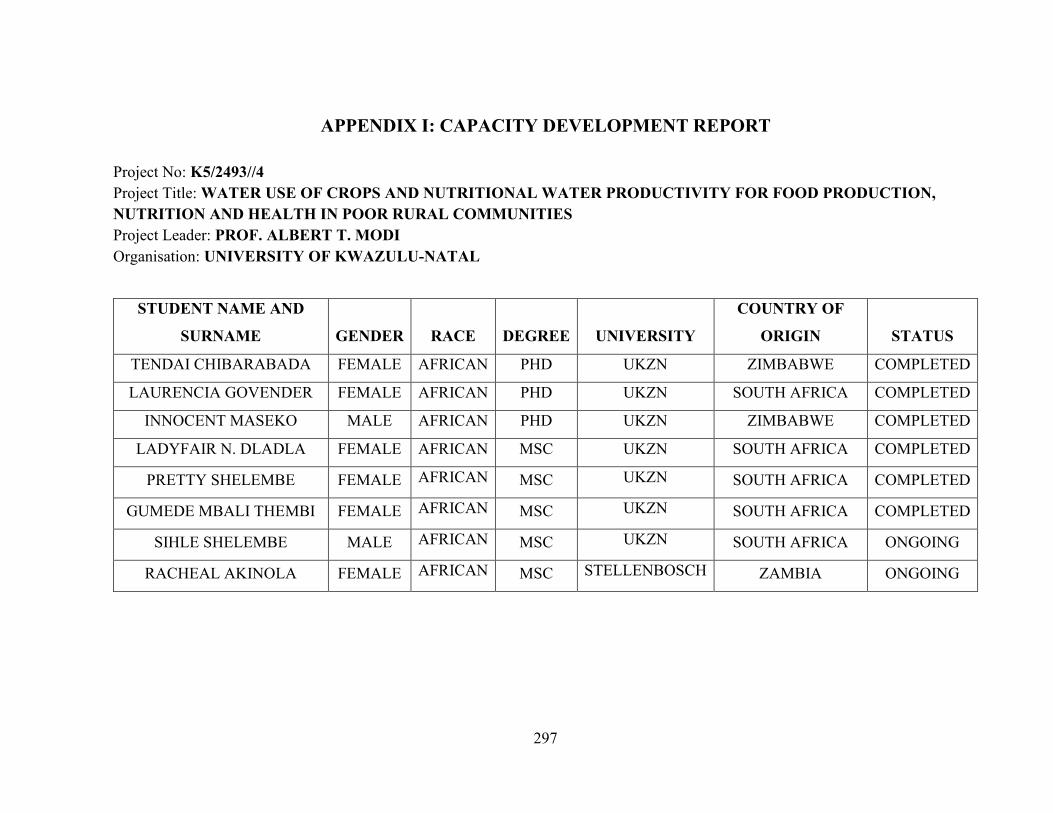
297
APPENDIX I: CAPACITY DEVELOPMENT REPORT Project No: K5/2493//4 Project Title: WATER USE OF CROPS AND NUTRITIONAL WATER PRODUCTIVITY FOR FOOD PRODUCTION, NUTRITION AND HEALTH IN POOR RURAL COMMUNITIES Project Leader: PROF. ALBERT T. MODI Organisation: UNIVERSITY OF KWAZULU-NATAL
STUDENT NAME AND
SURNAME GENDER RACE DEGREE UNIVERSITY
COUNTRY OF
ORIGIN STATUS
TENDAI CHIBARABADA FEMALE AFRICAN PHD UKZN ZIMBABWE COMPLETED
LAURENCIA GOVENDER FEMALE AFRICAN PHD UKZN SOUTH AFRICA COMPLETED
INNOCENT MASEKO MALE AFRICAN PHD UKZN ZIMBABWE COMPLETED
LADYFAIR N. DLADLA FEMALE AFRICAN MSC UKZN SOUTH AFRICA COMPLETED
PRETTY SHELEMBE FEMALE AFRICAN MSC UKZN SOUTH AFRICA COMPLETED
GUMEDE MBALI THEMBI FEMALE AFRICAN MSC UKZN SOUTH AFRICA COMPLETED
SIHLE SHELEMBE MALE AFRICAN MSC UKZN SOUTH AFRICA ONGOING
RACHEAL AKINOLA FEMALE AFRICAN MSC STELLENBOSCH ZAMBIA ONGOING
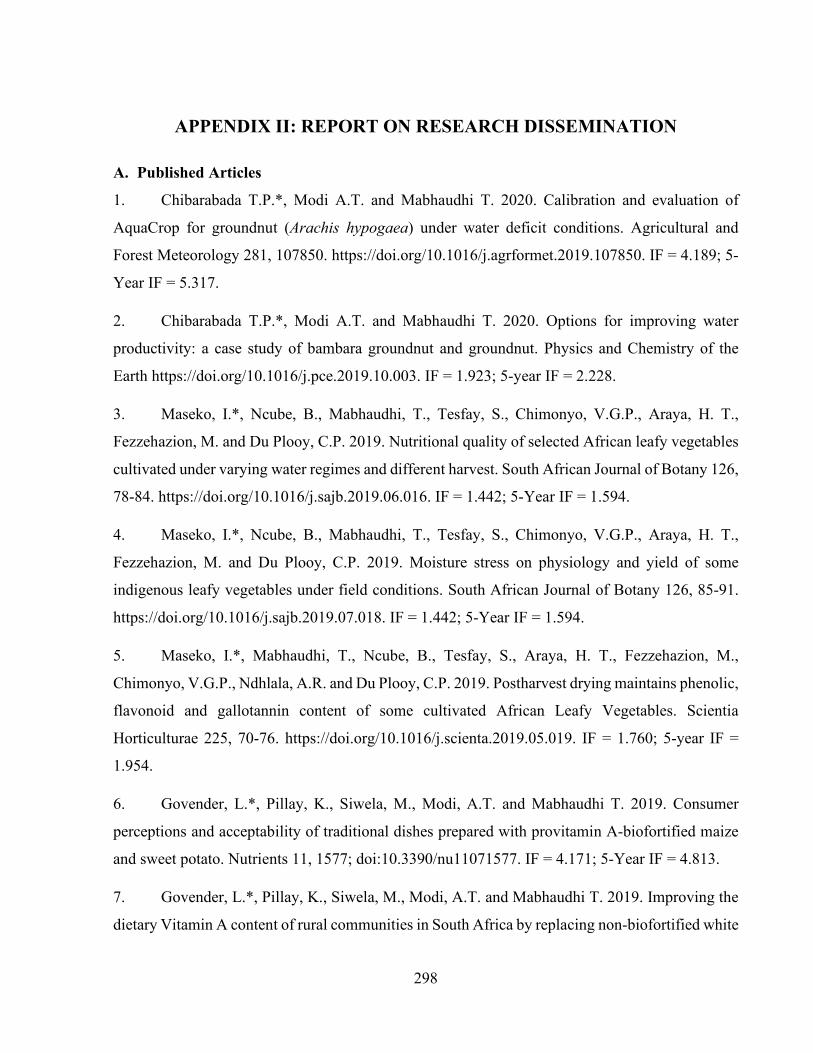
298
APPENDIX II: REPORT ON RESEARCH DISSEMINATION A. Published Articles
1. Chibarabada T.P.*, Modi A.T. and Mabhaudhi T. 2020. Calibration and evaluation of
AquaCrop for groundnut (Arachis hypogaea) under water deficit conditions. Agricultural and
Forest Meteorology 281, 107850. https://doi.org/10.1016/j.agrformet.2019.107850. IF = 4.189; 5-
Year IF = 5.317.
2. Chibarabada T.P.*, Modi A.T. and Mabhaudhi T. 2020. Options for improving water
productivity: a case study of bambara groundnut and groundnut. Physics and Chemistry of the
Earth https://doi.org/10.1016/j.pce.2019.10.003. IF = 1.923; 5-year IF = 2.228.
3. Maseko, I.*, Ncube, B., Mabhaudhi, T., Tesfay, S., Chimonyo, V.G.P., Araya, H. T.,
Fezzehazion, M. and Du Plooy, C.P. 2019. Nutritional quality of selected African leafy vegetables
cultivated under varying water regimes and different harvest. South African Journal of Botany 126,
78-84. https://doi.org/10.1016/j.sajb.2019.06.016. IF = 1.442; 5-Year IF = 1.594.
4. Maseko, I.*, Ncube, B., Mabhaudhi, T., Tesfay, S., Chimonyo, V.G.P., Araya, H. T.,
Fezzehazion, M. and Du Plooy, C.P. 2019. Moisture stress on physiology and yield of some
indigenous leafy vegetables under field conditions. South African Journal of Botany 126, 85-91.
https://doi.org/10.1016/j.sajb.2019.07.018. IF = 1.442; 5-Year IF = 1.594.
5. Maseko, I.*, Mabhaudhi, T., Ncube, B., Tesfay, S., Araya, H. T., Fezzehazion, M.,
Chimonyo, V.G.P., Ndhlala, A.R. and Du Plooy, C.P. 2019. Postharvest drying maintains phenolic,
flavonoid and gallotannin content of some cultivated African Leafy Vegetables. Scientia
Horticulturae 225, 70-76. https://doi.org/10.1016/j.scienta.2019.05.019. IF = 1.760; 5-year IF =
1.954.
6. Govender, L.*, Pillay, K., Siwela, M., Modi, A.T. and Mabhaudhi T. 2019. Consumer
perceptions and acceptability of traditional dishes prepared with provitamin A-biofortified maize
and sweet potato. Nutrients 11, 1577; doi:10.3390/nu11071577. IF = 4.171; 5-Year IF = 4.813.
7. Govender, L.*, Pillay, K., Siwela, M., Modi, A.T. and Mabhaudhi T. 2019. Improving the
dietary Vitamin A content of rural communities in South Africa by replacing non-biofortified white
299
maize and sweet potato with biofortified maize and sweet potato in traditional dishes. Nutrients,
11, 1198; doi:10.3390/nu11061198. IF = 4.171; 5-Year IF = 4. 813.
8. Chibarabada T.P.*, Modi A.T. and Mabhaudhi T. 2019. Water use of selected grain
legumes in response to varying irrigation regimes Water SA 45, 110-120.
http://dx.doi.org/10.4314/wsa.v45i1.13. IF = 0.851; 5-Year IF = 1.052.
9. Mabhaudhi T., Chibarabada T.P.*, Chimonyo V.G.P, Murugani V.G., Pereira L.M.,
Sobratee N., Govender L., Slotow R and Modi A.T. 2019. Mainstreaming indigenous crops into
food systems: A South African perspective. Sustainability 11, 172; doi:10.3390/su11010172. IF =
2.075.
10. Dladla L.N.T.*, Modi A.T., Mabhaudhi, T. and Chibarabada T.P. 2019. Yield, water use
and water use efficiency of sweet potato under different environments. Acta Hort. 1253: 287-294.
DOI: 10.17660/ActaHortic.2019.1253.38
11. Mabhaudhi T., Chibarabada T.P.* and Modi A.T. 2019. Nutritional water productivity of
selected sweet potato cultivars (Ipomoea batatas L.). Acta Hort. 1253: 295-302. DOI:
10.17660/ActaHortic.2019.1253.39
12. Maseko I.*, Mabhaudhi T., Beletse Y.G., Nogemane N., Du Plooy C.P. and Modi A.T.
2019. Growth and yield responses of Amaranthus cruentus, Corchorus olitorius and Vigna
unguiculata to nitrogen application under drip irrigated commercial production. Acta Hort. 1253:
303-310. DOI: 10.17660/ActaHortic.2019.1253.40
13. Chibarabada, T.P.*, Modi, A.T. and Mabhaudhi, T. 2018. Adaptation and productivity of
selected grain legumes in contrasting environments of KwaZulu-Natal, South Africa. International
Journal of Plant Production 12: 169-180. DOI 10.1007/s42106-018-0017-z. IF = 0.961; 5-Year IF
= 1.285.
14. Chibarabada, T.P.*, Modi, A.T. and Mabhaudhi, T. 2017. Nutrient content and nutritional
water productivity of selected grain legumes in response to production environment. Int. J. Environ.
Res. Public Health 14, 1300 doi:10.3390/ijerph14111300. IF = 2.145; 5-Year IF = 2.608.
15. Govender, L.*, Pillay, K., Siwela, M., Modi, A. and Mabhaudhi, T. 2017. Food and
nutrition insecurity in selected rural communities of KwaZulu-Natal, South Africa – linking human
300
nutrition and agriculture. Int. J. Environ. Res. Public Health 14, 17; doi:10.3390/ijerph14010017.
IF = 2.145; 5-Year IF = 2.608.
16. Chibarabada, T.P.*, Modi, A.T. and Mabhaudhi, T. 2017. Expounding the value of grain
legumes in the semi- and arid tropics. Sustainability 9, 60; doi:10.3390/su9010060. IF = 2.075; 5-
Year IF = 2.177.
17. Mabhaudhi, T., Chibarabada T*. and Modi, A. 2016. Water-food-nutrition-health nexus:
Linking water to improving food, nutrition and health in Sub-Saharan Africa. Int. J. Environ. Res.
Public Health 13, 1-19. IF = 2.145; 5-Year IF = 2.608.
B. Other publications
18. Govender, L.*, Pillay, K., Siwela, M., Modi, A.T. and Mabhaudhi T. 2019. Rediscovering
indigenous crops. RESOURCE (Special Issue), November/December, 16 (6), 7-8.
19. Mainstreaming of neglected and underutilised crop species in South Africa. Policy Briefing
Note. Sustainable and Healthy Food Systems programme. https://shefsglobal.lshtm.ac.uk/wp-
content/uploads/2019/09/Underutilised-Crops-Brief-SHEFS-FINAL.pdf
C. Theses
1. Dladla, Ladyfair Ntokozo Thobekile. 2017. Nutritional and water productivity of sweet
potato. MSc Thesis. University of KwaZulu-Natal, Pietermaritzburg, South Africa
2. Shelembe, Pretty Jabulisile. 2017. Seed quality and yield of selected traditional and
commercial crops: vegetable water use and nutritional productivity perspectives. MSc
Thesis. University of KwaZulu-Natal, Pietermaritzburg, South Africa
3. Chibarabada, Tendai Polite. 2018. Water use and nutritional water productivity of selected
major and underutilised grain legumes. PhD Thesis. University of KwaZulu-Natal,
Pietermaritzburg, South Africa
4. Maseko Innocent. 2019. Pre and Post-harvest response of selected indigenous leafy
vegetables to stress. PhD Thesis. University of KwaZulu-Natal, Pietermaritzburg, South
Africa
5. Akinola Racheal. 2019. Exploring the potential of Amaranth in mainstream South African
diets. MSc thesis at Stellenbosch University, Cape Town, South Africa
301
6. Mbali Gumede. 2019. Common bean seed quality: Comparing sourced and harvested
material in response to different seeding rates. MSc Thesis. University of KwaZulu-Natal,
Pietermaritzburg, South Africa
7. Govender Laurencia. 2020. The potential of provitamin a-biofortified maize and sweet
potato, and bambara groundnut for improving the nutritional status of rural communities in
KwaZulu-Natal, South Africa. PhD Thesis. University of KwaZulu-Natal,
Pietermaritzburg, South Africa
8. Sihle Shelembe. 2020. Water use and water nutrient productivity of Taro landraces. MSc
Thesis. University of KwaZulu-Natal, Pietermaritzburg, South Africa
D. Conference presentations
1. Siwela, M., Govender, L., Pillay, K., Modi, A.T and Mabhaudhi. T. 2019. Enriching the
nutritional values of traditional meals in KwaZulu-Natal, South Africa by incorporating
provitamin A-biofortified maize and orange sweet potatoes. AACCI meeting (Cereals &
Grains 19) that will be held in Denver Colorado from the 3-5 November 2019.
2. Govender, L., Pillay, K., Siwela, M., Modi, A.T and Mabhaudhi. T. 2019. Dietary patterns
of rural communities of KZN and their willingness to adopt biofortified traditional dishes.
SAAFoST Congress that was held in Johannesburg from the 1-4 September 2019.
3. Chibarabada, T.P., Modi, A.T. and Mabhaudhi T. 2018. Options for improving water
productivity: a case study of bambara groundnut and groundnut. 19th
WaterNet/WARFSA/GWP-SA Symposium, 31 October-2 November 2018, Avani Victoria
Falls Hotel, Zambia.
4. Govender, L., Pillay, K., Siwela, M., Mabhaudhi, T. and Modi, A.T. 2018.Consumer
perceptions of composite dishes made with biofortified maize and sweet potato. 19th World
Congress of Food Science and Technology in Mumbai, India from the 23-27 October 2018.
5. Siwela, M., Govender, L., Pillay, K., Mabhaudhi, T, and Modi, A.T. 2018. Comparative
consumer acceptance of creamed-fleshed and biofortified orange-fleshed sweet potato. 19th
World Congress of Food Science and Technology in Mumbai, India from the 23-27 October
2018.
302
6. Govender, L., Pillay, K., Siwela, M., Mabhaudhi, T. and Modi, A.T. 2018. An assessment
of the nutritional status of four rural communities in KwaZulu-Natal, South Africa.
Nutrition Congress that was held in Johannesburg from the 5-7 September 2018.
7. Dladla N.T., Modi, A.T., Mabhaudhi, T. and Chibarabada T.P. 2018. Yield, water use and
water use efficiency of sweet potato under different environments. The 30th International
Horticultural Congress, 12-16 August 2018, Istanbul-Turkey.
8. Mabhaudhi, T., Chibarabada, T.P. and Modi, A.T. 2018. Nutritional water productivity of
selected sweet potato varieties. The 30th International Horticultural Congress, 12-16
August 2018, Istanbul-Turkey.
9. Chibarabada, T.P., Modi, A.T. and Mabhaudhi T. 2018. Yield, water use and productivity
of selected grain legumes in a controlled environment. African Combined Conference,
Cape Town, South Africa, 14-18 January 2018.
10. Chibarabada, T.P., Modi, A.T. and Mabhaudhi T. 2017. Nutritional water productivity of
tropical grain legumes. WUN Symposium cum Research Summit on Impacts of Grain
Legume Research & Development in Developing Countries, 8-17 June 2017, Chinese
University of Hong Kong, Hong Kong
11. Chibarabada, T.P., Modi, A.T. and Mabhaudhi T. 2017. Water use of crops and nutritional
water productivity for food production, nutrition and health in poor rural communities.
Combined Congress 23-25 January 2017, Klein Kariba, Limpopo, South Africa