
Water Temperature Regimen Analysis of Intensive Fishfarms associated with Cooling Effluents from...
11
Biosystems Engineering (2007) 96 (4), 581–591 doi:10.1016/j.biosystemseng.2007.01.006 AP—Animal Production Technology Water Temperature Regimen Analysis of Intensive Fishfarms associated with Cooling Effluents from Power Plants J.C. Gutie´ rrez-Estrada; I. Pulido-Calvo Dept. Ciencias Agroforestales, Univ. Huelva, EPS, Campus Universitario de La Ra´ bida, 21819Palos de la Frontera (Huelva), Spain; e-mail of corresponding author: [email protected] (Received 26 April 2006; accepted in revised form 19 January 2007; published online 12 March 2007) This work analyses the effect that the electrical market liberalisation has on the variation of water temperature regimes in intensive aquaculture plants, and more specifically, the fishfarms which take advantage of the cooling effluents from power plants. Data were obtained from a facility devoted to the European eels growth which takes the warm water from the cooling effluent from the Puente Nuevo thermal power plant (Co´ rdoba, Spain). The results indicate that the liberalisation of the electrical network has a significant influence on the form and quantity of energy generated by the thermal power plant, and consequently on the thermal regimes of the cooling effluent. A decrease in the mean water temperature (mean water temperature before liberalisation ¼ 255 1C and after liberalisation ¼ 243 1C) and an increase of variation range of water temperature (standard deviation before liberalisation ¼ 17 1C and after liberalisation ¼ 25 1C) inside the fishfarm were observed (without modify the management scheme of the production system) when the electrical market liberalisation was implemented. The growth potential of reared eels estimated from a growth capacity index (GCI) showed significant differences between the mean values in the regulated and liberalised electrical markets. The decrease in the value of GCI was 667% when the electrical market liberalisation was implemented. r 2007 IAgrE. All rights reserved Published by Elsevier Ltd 1. Introduction Water temperature is one of the most important factors for the intensive aquacultural industry, since profitability largely depends on the time between the beginning of production and withdrawal of the harvest shares (stock subset of commercial size). Thus, it is easier to obtain growth rates that allow harvest share extraction of commercial sized fish in a minimal time, if the temperature of water is kept around the physiolo- gical ideal temperature of the reared species. Never- theless, maintaining the water temperature at the physiological ideal during a harvest cycle requires an additional cost of electrical energy. The alternative is to locate the fishfarm close to a source of warm water. In this respect, authors such as Nash and Paulsen (1981), Lund (1986), Coll (1991), Veil (1998) and Lund et al. (2005) indicate the great potential of the cooling effluents for agricultural and aquacultural applications. In the aquacultural industry, this technology (based upon the use in fish hatchery and farming operations thermally polluted cooling water discharged from an electric power plant) is contributing to the rapid growth of inland aquaculture. In Spain, there are 48 generating plants that need water cooling. Only four plants (8%) use the warm water effluent for commercial or experimental fish rearing purposes. These cases are related to the thermal power plants of Puente Nuevo (Co´rdoba), Litoral (Almerı´a), Alcudia (Mallorca) and San Roque (Ca´ diz). This reveals the high potential of installation of new fishfarms associated with cooling effluents of power plants. In this type of fishfarm, a key aspect is the flow regimen of warm water because rapid and high changes of water temperature promptly produces physiological ARTICLE IN PRESS 1537-5110/$32.00 581 r 2007 IAgrE. All rights reserved Published by Elsevier Ltd
Transcript of Water Temperature Regimen Analysis of Intensive Fishfarms associated with Cooling Effluents from...

ARTICLE IN PRESS
doi:10.1016/j.biosystemseng.2007.01.006AP—Animal Production Technology
Biosystems Engineering (2007) 96 (4), 581–591
Water Temperature Regimen Analysis of Intensive Fishfarms associated withCooling Effluents from Power Plants
J.C. Gutierrez-Estrada; I. Pulido-Calvo
Dept. Ciencias Agroforestales, Univ. Huelva, EPS, Campus Universitario de La Rabida, 21819Palos de la Frontera (Huelva), Spain;e-mail of corresponding author: [email protected]
(Received 26 April 2006; accepted in revised form 19 January 2007; published online 12 March 2007)
This work analyses the effect that the electrical market liberalisation has on the variation of water temperatureregimes in intensive aquaculture plants, and more specifically, the fishfarms which take advantage of thecooling effluents from power plants. Data were obtained from a facility devoted to the European eels growthwhich takes the warm water from the cooling effluent from the Puente Nuevo thermal power plant (Cordoba,Spain). The results indicate that the liberalisation of the electrical network has a significant influence on theform and quantity of energy generated by the thermal power plant, and consequently on the thermal regimesof the cooling effluent. A decrease in the mean water temperature (mean water temperature beforeliberalisation ¼ 25�5 1C and after liberalisation ¼ 24�3 1C) and an increase of variation range of watertemperature (standard deviation before liberalisation ¼ 1�7 1C and after liberalisation ¼ 2�5 1C) inside thefishfarm were observed (without modify the management scheme of the production system) when the electricalmarket liberalisation was implemented. The growth potential of reared eels estimated from a growth capacityindex (GCI) showed significant differences between the mean values in the regulated and liberalised electricalmarkets. The decrease in the value of GCI was 6�67% when the electrical market liberalisation wasimplemented.r 2007 IAgrE. All rights reserved
Published by Elsevier Ltd
1. Introduction
Water temperature is one of the most importantfactors for the intensive aquacultural industry, sinceprofitability largely depends on the time between thebeginning of production and withdrawal of the harvestshares (stock subset of commercial size). Thus, it iseasier to obtain growth rates that allow harvest shareextraction of commercial sized fish in a minimal time, ifthe temperature of water is kept around the physiolo-gical ideal temperature of the reared species. Never-theless, maintaining the water temperature at thephysiological ideal during a harvest cycle requires anadditional cost of electrical energy. The alternative is tolocate the fishfarm close to a source of warm water. Inthis respect, authors such as Nash and Paulsen (1981),Lund (1986), Coll (1991), Veil (1998) and Lund et al.(2005) indicate the great potential of the cooling
1537-5110/$32.00 581
effluents for agricultural and aquacultural applications.In the aquacultural industry, this technology (basedupon the use in fish hatchery and farming operationsthermally polluted cooling water discharged from anelectric power plant) is contributing to the rapid growthof inland aquaculture.
In Spain, there are 48 generating plants that needwater cooling. Only four plants (8%) use the warmwater effluent for commercial or experimental fishrearing purposes. These cases are related to the thermalpower plants of Puente Nuevo (Cordoba), Litoral(Almerıa), Alcudia (Mallorca) and San Roque (Cadiz).This reveals the high potential of installation of newfishfarms associated with cooling effluents of powerplants.
In this type of fishfarm, a key aspect is the flowregimen of warm water because rapid and high changesof water temperature promptly produces physiological
r 2007 IAgrE. All rights reserved
Published by Elsevier Ltd
ARTICLE IN PRESS
J.C. GUTIERREZ-ESTRADA; I. PULIDO-CALVO582
and behavioural changes in fish. This stress statuschanges the blood composition and increases/decreasesthe breathing and the heartbeat frequency, causing adecrease of the immune system effectiveness and anincrease of the susceptibility to diseases and attack ofparasites (Palackova et al., 1990). Therefore, somepossible consequences of the high and rapid changesof water temperature are the direct and indirectunfavourable effects on growth rates, mortality ratesand final yield.
The continuity of the flow of warm water from apower station to a fishfarm is directly dependent on thecontinuity of the electricity generation. This is itselfdependent on a large number of factors, but in general,generating stations which are cheaper to run are likely toprovide the most constant supply of warm water. Insome European countries, including the United King-dom, power stations are listed in the order of merit, andthe most efficient and economic are known as ‘baseload’ stations. In Spain, the Law of the Electrical Sector,Law 54/1997 (BOE, 1997) recognises the right to freeinstallation and its functioning is organised according tothe principle of free competition. For this reason, it isnecessary to take into account the electrical productionsystem of the generating plant as well as the possibilityof exploiting this source of warm water. The producersof electric power carry out their economic offers ofenergy sale by means of a market operator. The latterdetermines the functioning order of the production units(e.g. thermal, nuclear power plants) starting from thecheapest offer up to equalising the demand for energy inthis programming period (BOE, 1997). Those plantsthat produce cheaper energy will generate electricity in amore consistent way and be associated with a moreconsistent flow of warm water with few variations intheir temperature regimes.
This work intends to analyse the impact of electricpower market liberalisation and its effect on theparameters of water temperature and yield in fishfarmsassociated with a thermal power plant. The analysis wascarried out in an intensive eel fishfarm located insouthern Spain which did not change the operationscheme of the production system before and afterelectric power market liberalisation.
2. Fishfarm description
Hidrorecursos S.A. is a fishfarm located in the northof the province of Cordoba (southern Spain) whichconcentrates all its production in the growth ofEuropean eels. Placed on the left side of the PuenteNuevo reservoir, it takes the necessary water for itsproduction from two main sources: (a) the Puente
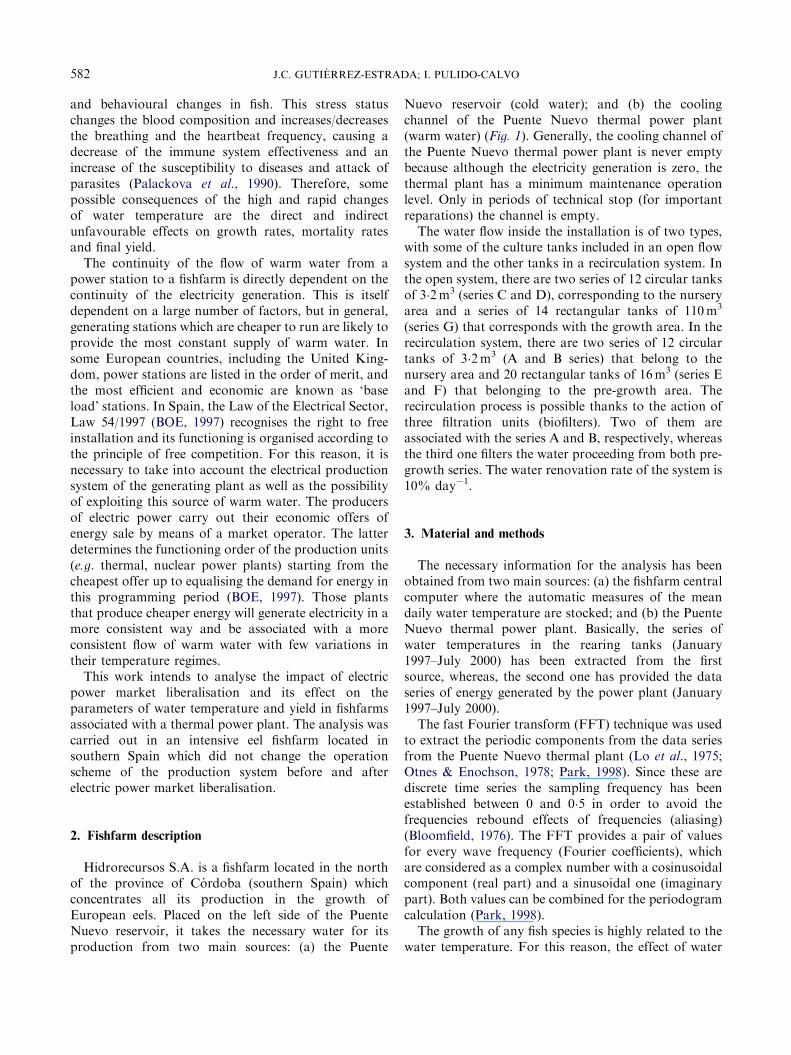
Nuevo reservoir (cold water); and (b) the coolingchannel of the Puente Nuevo thermal power plant(warm water) (Fig. 1). Generally, the cooling channel ofthe Puente Nuevo thermal power plant is never emptybecause although the electricity generation is zero, thethermal plant has a minimum maintenance operationlevel. Only in periods of technical stop (for importantreparations) the channel is empty.
The water flow inside the installation is of two types,with some of the culture tanks included in an open flowsystem and the other tanks in a recirculation system. Inthe open system, there are two series of 12 circular tanksof 3�2m3 (series C and D), corresponding to the nurseryarea and a series of 14 rectangular tanks of 110m3
(series G) that corresponds with the growth area. In therecirculation system, there are two series of 12 circulartanks of 3�2m3 (A and B series) that belong to thenursery area and 20 rectangular tanks of 16m3 (series Eand F) that belonging to the pre-growth area. Therecirculation process is possible thanks to the action ofthree filtration units (biofilters). Two of them areassociated with the series A and B, respectively, whereasthe third one filters the water proceeding from both pre-growth series. The water renovation rate of the system is10% day�1.
3. Material and methods
The necessary information for the analysis has beenobtained from two main sources: (a) the fishfarm centralcomputer where the automatic measures of the meandaily water temperature are stocked; and (b) the PuenteNuevo thermal power plant. Basically, the series ofwater temperatures in the rearing tanks (January1997–July 2000) has been extracted from the firstsource, whereas, the second one has provided the dataseries of energy generated by the power plant (January1997–July 2000).
The fast Fourier transform (FFT) technique was usedto extract the periodic components from the data seriesfrom the Puente Nuevo thermal plant (Lo et al., 1975;Otnes & Enochson, 1978; Park, 1998). Since these arediscrete time series the sampling frequency has beenestablished between 0 and 0�5 in order to avoid thefrequencies rebound effects of frequencies (aliasing)(Bloomfield, 1976). The FFT provides a pair of valuesfor every wave frequency (Fourier coefficients), whichare considered as a complex number with a cosinusoidalcomponent (real part) and a sinusoidal one (imaginarypart). Both values can be combined for the periodogramcalculation (Park, 1998).
The growth of any fish species is highly related to thewater temperature. For this reason, the effect of water
ARTICLE IN PRESS
Spain
Puente NuevoReservoir
RiverGuadalquivir
Province ofCordoba′
Puente Nuevothermal power plant
Warm water pump
Fishfarm
Cooling water
Warmwater
Cold water
Cold water pump
Puente Nuevo reservoir
N
0 50
km
Fig. 1. Geographical location of Hidrorecursos S.A.; schematic representation of the water flow in the fishfarm
WATER TEMPERATURE REGIMEN ANALYSIS OF INTENSIVE FISHFARMS 583
temperature variation on fish growth must be evaluated.Gutierrez-Estrada (2003) and Gutierrez-Estrada et al.(2004) determined the experimental relationship be-tween water temperature T and the growth capacityindex (IGC) for European eel for the rearing conditionsof Hidrorecursos S.A. by means of a polynomialequation:
IF Tp12�9 �C ORX29�9 �C THEN IGC ¼ 0 (1)
IF 12�9 �CoTo29�9 �C THEN IGC
¼ 8�2167� ð1�4918TÞ þ ð0�0857 T2Þ � ð0�0015 T3Þ ð2Þ
where IGC is the growth capacity index.A value for IGC of 1 is the maximum growth capacity
(water temperature ¼ 24�5 1C) and a value for IGC of 0
(water temperature p12�9 1C or water temperatureX29�9 1C) means that there is no growth (Fig. 2). Inthis paper, this relationship was used to estimate theinfluence of water temperature changes on variationgrowth over time.
4. Results
4.1. Energy production in the thermal power plant
The temporal variation of the energy generated by thePuente Nuevo thermal plant during the period betweenJanuary 1997 and July 2000 is shown in Fig. 3. Theenergy production during the year 1997 lightly fluctuatesin the first months of the year, though from the

ARTICLE IN PRESS
1
0.8
0.6
0.4
0.2
0
10.5 14.5 18.5 22.5 26.5 30.5Water temperature, C
Gro
wth
cap
acity
inde
x
Fig. 2. Relationship between water temperature and the growthcapacity index for European eel for the rearing conditions of
Hidrorecursos S.A
8
6
4
2
0
8
6
4
2
0
8
6
4
2
0
8
6
4
2
0
1997
1998
1999
2000
Law 54/1997
J F M A M J J A S O N DMonths
Gen
erat
ed e
nerg
y, G
Wh
day−1
Fig. 3. Generated energy (GW h day�1) by the Puente Nuevothermal power plant between January of 1997 and July of 2000
J.C. GUTIERREZ-ESTRADA; I. PULIDO-CALVO584
beginning of February it becomes stable. Exactly fromthis moment there is only one technical stop in Octoberwhich separates periods where the produced energy isclose to its possible maximum. From the time the Lawof the Electrical Sector, Law 54/1997 (BOE, 1997),comes into force at the end of November 1997, theproduction of energy would decrease considerably. Inthe first months of 1998, the mean production stabilisesabout 2�1GWh, occurring from this moment a constantincrease up to reaching the maximum annual values.This trend goes on in the years 1999 and 2000. In thisperiod three technical stops occurred: May 1998, March1999 and May 2000.
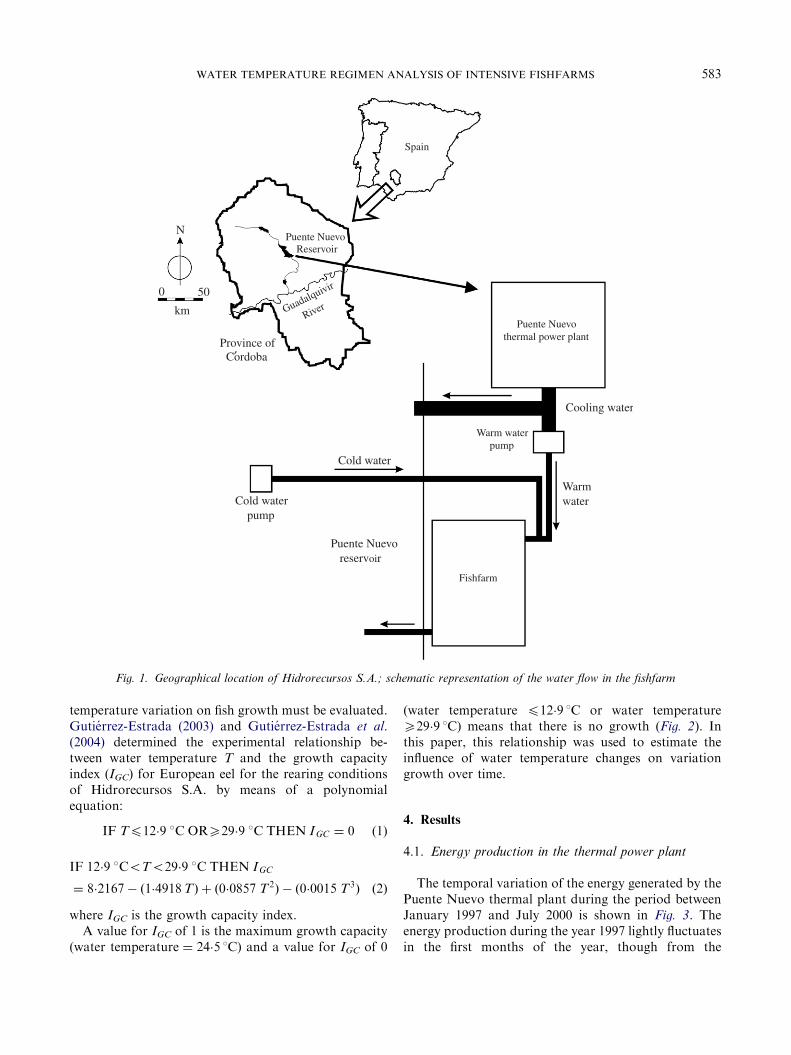
The Fourier transform of the data shows the presenceof coefficients with absolute values, which are signifi-cantly far from the value zero, indicating strongperiodicity of the production. In the period fromJanuary to November 28, 1997, the production cyclechanges monthly form approximately, since there arefrequencies in the periodogram with significant coeffi-cients that correspond to periods of 30, 38 and 51 days(long periods are dominant). After the introduction ofthe Law 54/1997, the periodicity of production is weeklyform approximately, since frequencies that correspondto periods of 7 days are detected (short periods aredominant) (Fig. 4).
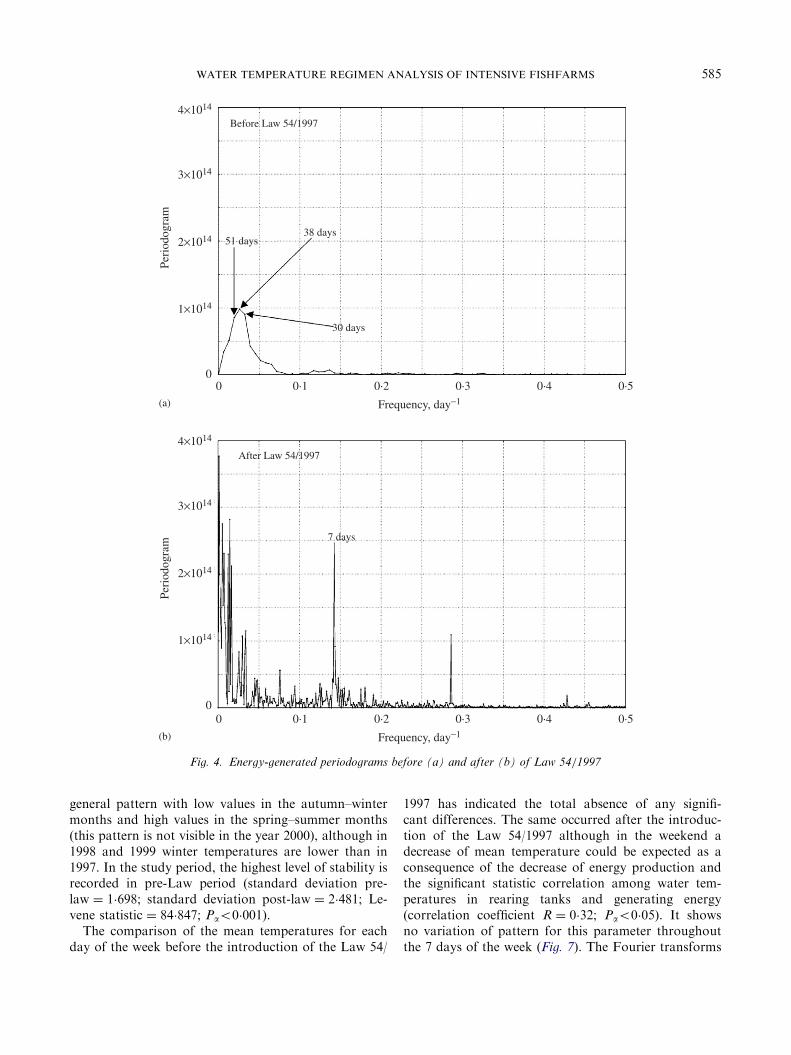
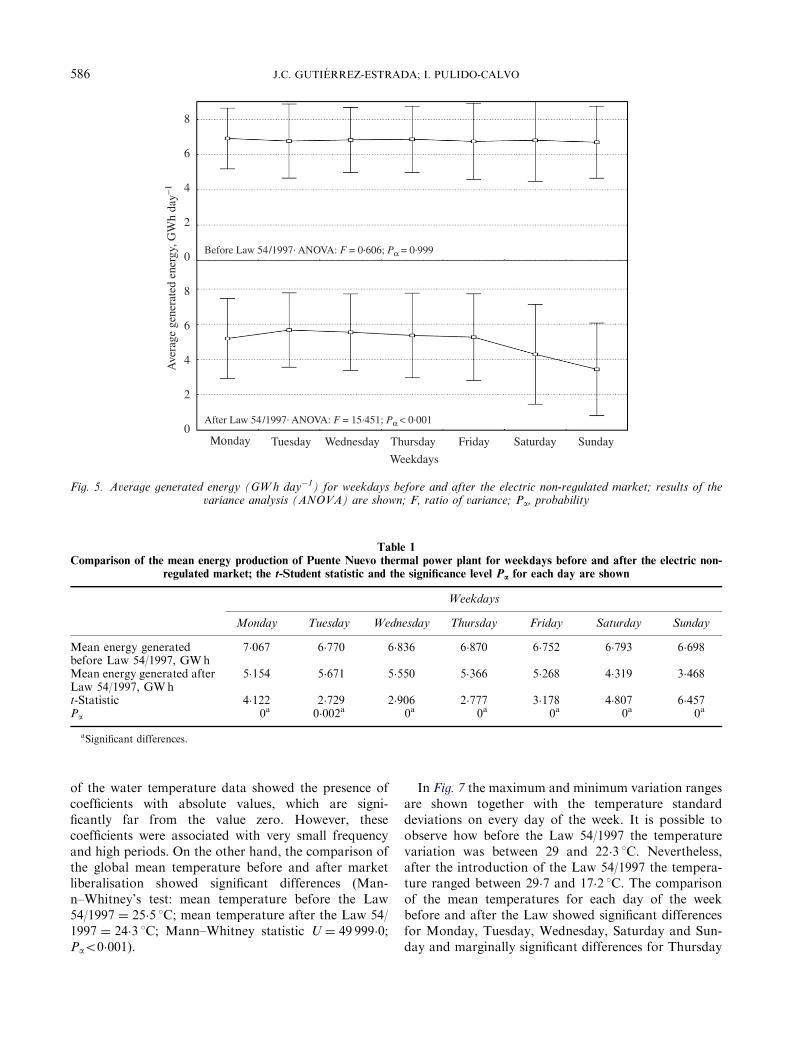
An analysis of the variance (ANOVA) carried outeach day of the week has shown the presence ofsignificant differences in the production level after theintroduction of the Law 54/1997 (Fig. 5). A Tukey’s testshowed later that the 2 days on which the levels ofproduction significantly decreased were Saturday andSunday (Tukey: in all the cases, significance level fromMonday–Tuesday–Wednesday–Thursday-Friday to Sa-turday and Sunday, respectively: PaSaturdayo0�05;PaSundayo0�001). Significant differences were not foundbetween both days (Tukey: PaSaturday–Sunday ¼ 0�052).These differences were not detected before the introduc-tion of the Law 54/1997 (Fig. 5). The comparison of themean production values for weekdays before and afterthe Law 54/1997 showed significant differences in allcases (Table 1). This indicates that the electrical marketliberalisation has not only affected the way anddistribution moment of the energy but has also beenresponsible for the decrease of the energy generated bythe Puente Nuevo thermal plant.
4.2. Analysis of the water temperature inside the fishfarm
and growth capacity index
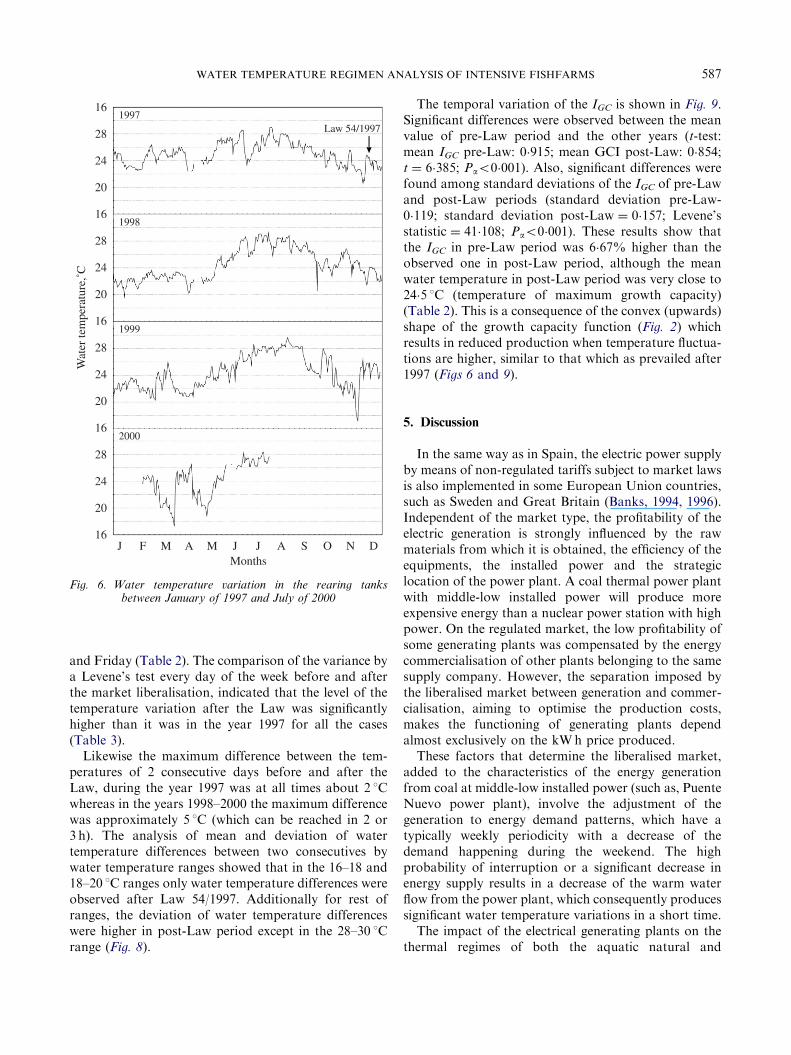
The temporal evolution of the water temperature inthe rearing tanks is shown in Fig. 6. During 1997, 1998and 1999 the water temperature fluctuates following a
ARTICLE IN PRESS
4×10¹⁴
3×10¹⁴
2×10¹⁴
1×10¹⁴
0
4×10¹⁴
3×10¹⁴
2×10¹⁴
1×10¹⁴
0
0 0.1 0.2 0.3 0.4 0.5
Frequency, day−1
0 0.1 0.2 0.3 0.4 0.5
Frequency, day−1
Before Law 54/1997
After Law 54/1997
51 days38 days
30 days
7 days
Peri
odog
ram
Peri
odog
ram
(a)
(b)
Fig. 4. Energy-generated periodograms before (a) and after (b) of Law 54/1997
WATER TEMPERATURE REGIMEN ANALYSIS OF INTENSIVE FISHFARMS 585
general pattern with low values in the autumn–wintermonths and high values in the spring–summer months(this pattern is not visible in the year 2000), although in1998 and 1999 winter temperatures are lower than in1997. In the study period, the highest level of stability isrecorded in pre-Law period (standard deviation pre-law ¼ 1�698; standard deviation post-law ¼ 2�481; Le-vene statistic ¼ 84�847; Pao0�001).The comparison of the mean temperatures for each
day of the week before the introduction of the Law 54/
1997 has indicated the total absence of any signifi-cant differences. The same occurred after the introduc-tion of the Law 54/1997 although in the weekend adecrease of mean temperature could be expected as aconsequence of the decrease of energy production andthe significant statistic correlation among water tem-peratures in rearing tanks and generating energy(correlation coefficient R ¼ 0�32; Pao0�05). It showsno variation of pattern for this parameter throughoutthe 7 days of the week (Fig. 7). The Fourier transforms
ARTICLE IN PRESS
8
6
4
2
0
8
6
4
2
0Μοnday Tuesday Wednesday Thursday Friday Saturday Sunday
Weekdays
Ave
rage
gen
erat
ed e
nerg
y, G
Wh
day−1
Before Law 54/1997. ANOVA: F = 0.606; Pα = 0.999
After Law 54/1997. ANOVA: F = 15.451; Pα < 0.001
Fig. 5. Average generated energy (GW h day�1) for weekdays before and after the electric non-regulated market; results of thevariance analysis (ANOVA) are shown; F, ratio of variance; Pa, probability
Table 1
Comparison of the mean energy production of Puente Nuevo thermal power plant for weekdays before and after the electric non-regulated market; the t-Student statistic and the significance level Pa for each day are shown
Weekdays
Monday Tuesday Wednesday Thursday Friday Saturday Sunday
Mean energy generatedbefore Law 54/1997, GWh
7�067 6�770 6�836 6�870 6�752 6�793 6�698
Mean energy generated afterLaw 54/1997, GWh
5�154 5�671 5�550 5�366 5�268 4�319 3�468
t-Statistic 4�122 2�729 2�906 2�777 3�178 4�807 6�457Pa 0a 0�002a 0a 0a 0a 0a 0a
aSignificant differences.
J.C. GUTIERREZ-ESTRADA; I. PULIDO-CALVO586
of the water temperature data showed the presence ofcoefficients with absolute values, which are signi-ficantly far from the value zero. However, thesecoefficients were associated with very small frequencyand high periods. On the other hand, the comparison ofthe global mean temperature before and after marketliberalisation showed significant differences (Man-n–Whitney’s test: mean temperature before the Law54/1997 ¼ 25�5 1C; mean temperature after the Law 54/1997 ¼ 24�3 1C; Mann–Whitney statistic U ¼ 49 999�0;Pao0�001).
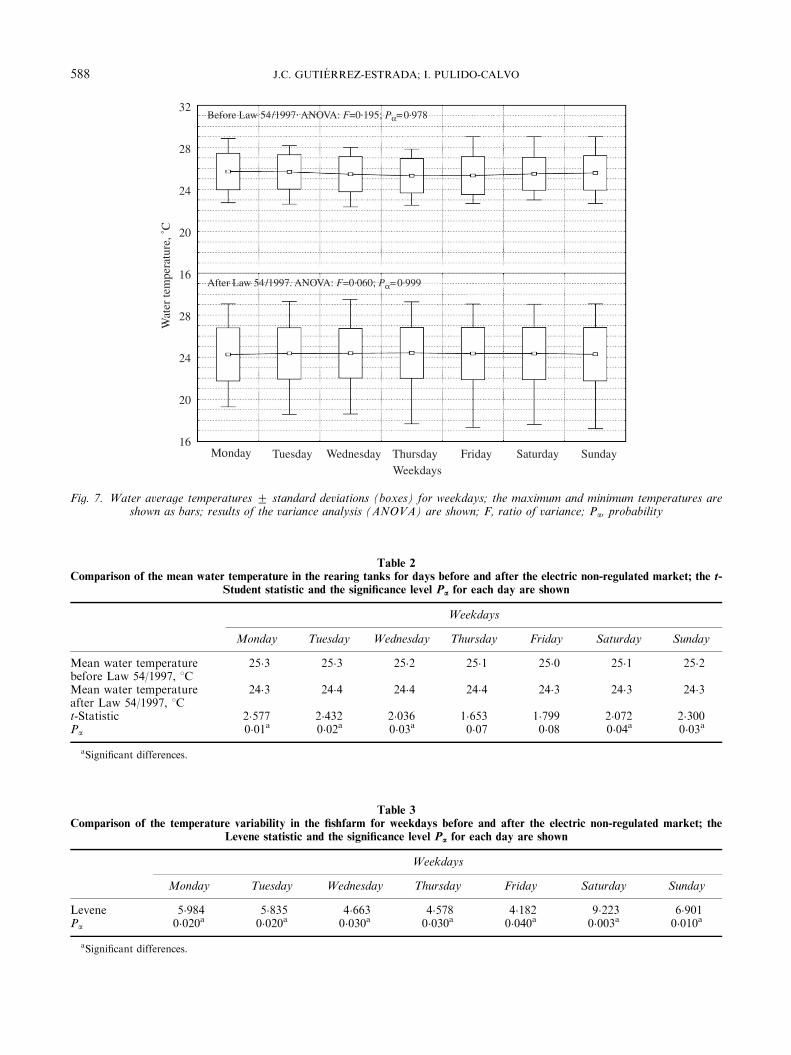
In Fig. 7 the maximum and minimum variation rangesare shown together with the temperature standarddeviations on every day of the week. It is possible toobserve how before the Law 54/1997 the temperaturevariation was between 29 and 22�3 1C. Nevertheless,after the introduction of the Law 54/1997 the tempera-ture ranged between 29�7 and 17�2 1C. The comparisonof the mean temperatures for each day of the weekbefore and after the Law showed significant differencesfor Monday, Tuesday, Wednesday, Saturday and Sun-day and marginally significant differences for Thursday
ARTICLE IN PRESS
16
28
24
20
16
28
24
20
16
28
24
20
16
28
24
20
16J J J A S O N DF M A M
Months
Wat
er te
mpe
ratu
re,˚
C
1997
1998
1999
2000
Law 54/1997
Fig. 6. Water temperature variation in the rearing tanksbetween January of 1997 and July of 2000
WATER TEMPERATURE REGIMEN ANALYSIS OF INTENSIVE FISHFARMS 587
and Friday (Table 2). The comparison of the variance bya Levene’s test every day of the week before and afterthe market liberalisation, indicated that the level of thetemperature variation after the Law was significantlyhigher than it was in the year 1997 for all the cases(Table 3).Likewise the maximum difference between the tem-
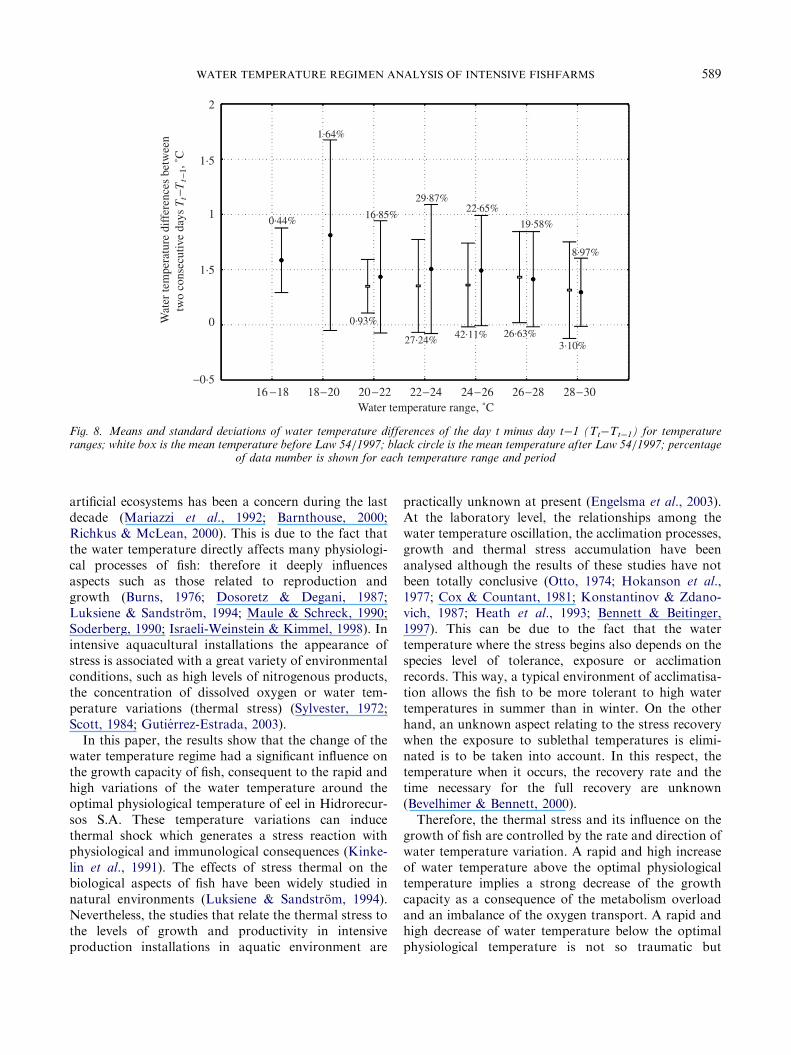
peratures of 2 consecutive days before and after theLaw, during the year 1997 was at all times about 2 1Cwhereas in the years 1998–2000 the maximum differencewas approximately 5 1C (which can be reached in 2 or3 h). The analysis of mean and deviation of watertemperature differences between two consecutives bywater temperature ranges showed that in the 16–18 and18–20 1C ranges only water temperature differences wereobserved after Law 54/1997. Additionally for rest ofranges, the deviation of water temperature differenceswere higher in post-Law period except in the 28–30 1Crange (Fig. 8).
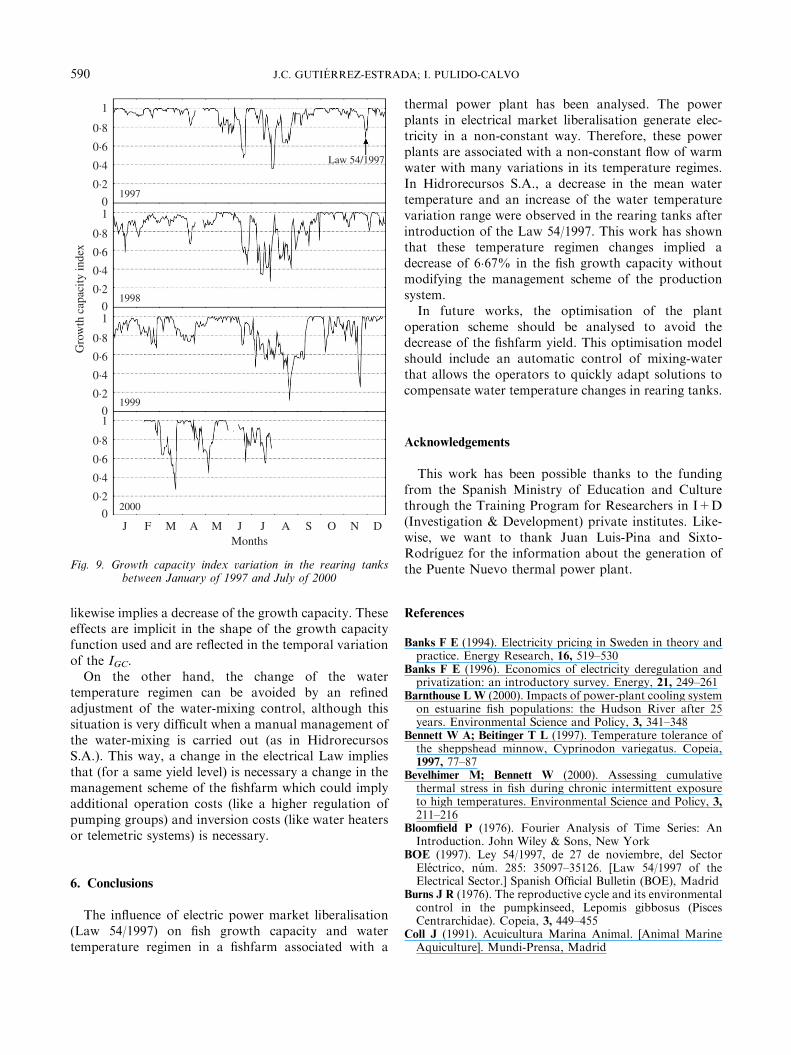
The temporal variation of the IGC is shown in Fig. 9.Significant differences were observed between the meanvalue of pre-Law period and the other years (t-test:mean IGC pre-Law: 0�915; mean GCI post-Law: 0�854;t ¼ 6�385; Pao0�001). Also, significant differences werefound among standard deviations of the IGC of pre-Lawand post-Law periods (standard deviation pre-Law-0�119; standard deviation post-Law ¼ 0�157; Levene’sstatistic ¼ 41�108; Pao0�001). These results show thatthe IGC in pre-Law period was 6�67% higher than theobserved one in post-Law period, although the meanwater temperature in post-Law period was very close to24�5 1C (temperature of maximum growth capacity)(Table 2). This is a consequence of the convex (upwards)shape of the growth capacity function (Fig. 2) whichresults in reduced production when temperature fluctua-tions are higher, similar to that which as prevailed after1997 (Figs 6 and 9).
5. Discussion
In the same way as in Spain, the electric power supplyby means of non-regulated tariffs subject to market lawsis also implemented in some European Union countries,such as Sweden and Great Britain (Banks, 1994, 1996).Independent of the market type, the profitability of theelectric generation is strongly influenced by the rawmaterials from which it is obtained, the efficiency of theequipments, the installed power and the strategiclocation of the power plant. A coal thermal power plantwith middle-low installed power will produce moreexpensive energy than a nuclear power station with highpower. On the regulated market, the low profitability ofsome generating plants was compensated by the energycommercialisation of other plants belonging to the samesupply company. However, the separation imposed bythe liberalised market between generation and commer-cialisation, aiming to optimise the production costs,makes the functioning of generating plants dependalmost exclusively on the kWh price produced.
These factors that determine the liberalised market,added to the characteristics of the energy generationfrom coal at middle-low installed power (such as, PuenteNuevo power plant), involve the adjustment of thegeneration to energy demand patterns, which have atypically weekly periodicity with a decrease of thedemand happening during the weekend. The highprobability of interruption or a significant decrease inenergy supply results in a decrease of the warm waterflow from the power plant, which consequently producessignificant water temperature variations in a short time.
The impact of the electrical generating plants on thethermal regimes of both the aquatic natural and
ARTICLE IN PRESS
28
32
24
20
16
28
24
20
16Μοnday Tuesday Wednesday Thursday Friday Saturday Sunday
Weekdays
Wat
er te
mpe
ratu
re, ˚
C
Before Law 54/1997. ANOVA: F=0.195; Pα=0.978
After Law 54/1997. ANOVA: F=0.060; Pα=0.999
Fig. 7. Water average temperatures 7 standard deviations (boxes) for weekdays; the maximum and minimum temperatures areshown as bars; results of the variance analysis (ANOVA) are shown; F, ratio of variance; Pa, probability
Table 2Comparison of the mean water temperature in the rearing tanks for days before and after the electric non-regulated market; the t-
Student statistic and the significance level Pa for each day are shown
Weekdays
Monday Tuesday Wednesday Thursday Friday Saturday Sunday
Mean water temperaturebefore Law 54/1997, 1C
25�3 25�3 25�2 25�1 25�0 25�1 25�2
Mean water temperatureafter Law 54/1997, 1C
24�3 24�4 24�4 24�4 24�3 24�3 24�3
t-Statistic 2�577 2�432 2�036 1�653 1�799 2�072 2�300Pa 0�01a 0�02a 0�03a 0�07 0�08 0�04a 0�03a
aSignificant differences.
Table 3
Comparison of the temperature variability in the fishfarm for weekdays before and after the electric non-regulated market; the
Levene statistic and the significance level Pa for each day are shown
Weekdays
Monday Tuesday Wednesday Thursday Friday Saturday Sunday
Levene 5�984 5�835 4�663 4�578 4�182 9�223 6�901Pa 0�020a 0�020a 0�030a 0�030a 0�040a 0�003a 0�010a
aSignificant differences.
J.C. GUTIERREZ-ESTRADA; I. PULIDO-CALVO588
ARTICLE IN PRESS
2
1.5
1.5
−0.5
1
0
16 −18 18−20 20−22 22−24 24−26 26−28 28−30Water temperature range, ˚C
Wat
er te
mpe
ratu
re d
iffe
renc
es b
etw
een
tw
o co
nsec
utiv
e da
ys T
t−T
t−1,
˚C
1.64%
16.85%
27.24%
29.87%22.65%
42.11% 26.63%
19.58%
8.97%
3.10%
0.44%
0.93%
Fig. 8. Means and standard deviations of water temperature differences of the day t minus day t�1 (Tt�Tt�1) for temperatureranges; white box is the mean temperature before Law 54/1997; black circle is the mean temperature after Law 54/1997; percentage
of data number is shown for each temperature range and period
WATER TEMPERATURE REGIMEN ANALYSIS OF INTENSIVE FISHFARMS 589
artificial ecosystems has been a concern during the lastdecade (Mariazzi et al., 1992; Barnthouse, 2000;Richkus & McLean, 2000). This is due to the fact thatthe water temperature directly affects many physiologi-cal processes of fish: therefore it deeply influencesaspects such as those related to reproduction andgrowth (Burns, 1976; Dosoretz & Degani, 1987;Luksiene & Sandstrom, 1994; Maule & Schreck, 1990;Soderberg, 1990; Israeli-Weinstein & Kimmel, 1998). Inintensive aquacultural installations the appearance ofstress is associated with a great variety of environmentalconditions, such as high levels of nitrogenous products,the concentration of dissolved oxygen or water tem-perature variations (thermal stress) (Sylvester, 1972;Scott, 1984; Gutierrez-Estrada, 2003).In this paper, the results show that the change of the
water temperature regime had a significant influence onthe growth capacity of fish, consequent to the rapid andhigh variations of the water temperature around theoptimal physiological temperature of eel in Hidrorecur-sos S.A. These temperature variations can inducethermal shock which generates a stress reaction withphysiological and immunological consequences (Kinke-lin et al., 1991). The effects of stress thermal on thebiological aspects of fish have been widely studied innatural environments (Luksiene & Sandstrom, 1994).Nevertheless, the studies that relate the thermal stress tothe levels of growth and productivity in intensiveproduction installations in aquatic environment are
practically unknown at present (Engelsma et al., 2003).At the laboratory level, the relationships among thewater temperature oscillation, the acclimation processes,growth and thermal stress accumulation have beenanalysed although the results of these studies have notbeen totally conclusive (Otto, 1974; Hokanson et al.,1977; Cox & Countant, 1981; Konstantinov & Zdano-vich, 1987; Heath et al., 1993; Bennett & Beitinger,1997). This can be due to the fact that the watertemperature where the stress begins also depends on thespecies level of tolerance, exposure or acclimationrecords. This way, a typical environment of acclimatisa-tion allows the fish to be more tolerant to high watertemperatures in summer than in winter. On the otherhand, an unknown aspect relating to the stress recoverywhen the exposure to sublethal temperatures is elimi-nated is to be taken into account. In this respect, thetemperature when it occurs, the recovery rate and thetime necessary for the full recovery are unknown(Bevelhimer & Bennett, 2000).
Therefore, the thermal stress and its influence on thegrowth of fish are controlled by the rate and direction ofwater temperature variation. A rapid and high increaseof water temperature above the optimal physiologicaltemperature implies a strong decrease of the growthcapacity as a consequence of the metabolism overloadand an imbalance of the oxygen transport. A rapid andhigh decrease of water temperature below the optimalphysiological temperature is not so traumatic but
ARTICLE IN PRESS
1
0.8
0.6
0.4
0.2
01
0.8
0.6
0.4
0.2
01
0.8
0.6
0.4
0.2
01
0.8
0.6
0.4
0.2
0J J JF M MA A S O N D
Months
Gro
wth
cap
acity
inde
x
2000
1999
1998
1997
Law 54/1997
Fig. 9. Growth capacity index variation in the rearing tanksbetween January of 1997 and July of 2000
J.C. GUTIERREZ-ESTRADA; I. PULIDO-CALVO590
likewise implies a decrease of the growth capacity. Theseeffects are implicit in the shape of the growth capacityfunction used and are reflected in the temporal variationof the IGC.
On the other hand, the change of the watertemperature regimen can be avoided by an refinedadjustment of the water-mixing control, although thissituation is very difficult when a manual management ofthe water-mixing is carried out (as in HidrorecursosS.A.). This way, a change in the electrical Law impliesthat (for a same yield level) is necessary a change in themanagement scheme of the fishfarm which could implyadditional operation costs (like a higher regulation ofpumping groups) and inversion costs (like water heatersor telemetric systems) is necessary.
6. Conclusions
The influence of electric power market liberalisation(Law 54/1997) on fish growth capacity and watertemperature regimen in a fishfarm associated with a
thermal power plant has been analysed. The powerplants in electrical market liberalisation generate elec-tricity in a non-constant way. Therefore, these powerplants are associated with a non-constant flow of warmwater with many variations in its temperature regimes.In Hidrorecursos S.A., a decrease in the mean watertemperature and an increase of the water temperaturevariation range were observed in the rearing tanks afterintroduction of the Law 54/1997. This work has shownthat these temperature regimen changes implied adecrease of 6�67% in the fish growth capacity withoutmodifying the management scheme of the productionsystem.
In future works, the optimisation of the plantoperation scheme should be analysed to avoid thedecrease of the fishfarm yield. This optimisation modelshould include an automatic control of mixing-waterthat allows the operators to quickly adapt solutions tocompensate water temperature changes in rearing tanks.
Acknowledgements
This work has been possible thanks to the fundingfrom the Spanish Ministry of Education and Culturethrough the Training Program for Researchers in I+D(Investigation & Development) private institutes. Like-wise, we want to thank Juan Luis-Pina and Sixto-Rodrıguez for the information about the generation ofthe Puente Nuevo thermal power plant.
References
Banks F E (1994). Electricity pricing in Sweden in theory andpractice. Energy Research, 16, 519–530
Banks F E (1996). Economics of electricity deregulation andprivatization: an introductory survey. Energy, 21, 249–261
Barnthouse L W (2000). Impacts of power-plant cooling systemon estuarine fish populations: the Hudson River after 25years. Environmental Science and Policy, 3, 341–348
Bennett W A; Beitinger T L (1997). Temperature tolerance ofthe sheppshead minnow, Cyprinodon variegatus. Copeia,1997, 77–87
Bevelhimer M; Bennett W (2000). Assessing cumulativethermal stress in fish during chronic intermittent exposureto high temperatures. Environmental Science and Policy, 3,211–216
Bloomfield P (1976). Fourier Analysis of Time Series: AnIntroduction. John Wiley & Sons, New York
BOE (1997). Ley 54/1997, de 27 de noviembre, del SectorElectrico, num. 285: 35097–35126. [Law 54/1997 of theElectrical Sector.] Spanish Official Bulletin (BOE), Madrid
Burns J R (1976). The reproductive cycle and its environmentalcontrol in the pumpkinseed, Lepomis gibbosus (PiscesCentrarchidae). Copeia, 3, 449–455
Coll J (1991). Acuicultura Marina Animal. [Animal MarineAquiculture]. Mundi-Prensa, Madrid

ARTICLE IN PRESS
WATER TEMPERATURE REGIMEN ANALYSIS OF INTENSIVE FISHFARMS 591
Cox D K; Countant C C (1981). Growth dynamics of juvenilestriped bass as a function of temperature and ration.Transactions of the American Fishery Society, 110, 226–238
Dosoretz C; Degani G (1987). Effect of fat rich diet andtemperature on growth and body composition of europeaneels (Anguilla anguilla). Comparative Biochemistry andPhysiology, 87A, 733–736
Engelsma M Y; Hougee S; Nap D; Hofenk M; Rombout J H WM; van Muiswinkel W B; Lidy B M; Kemenade V V (2003).Multiple acute temperature stress affects leucocyte popula-tions and antibody responses in common carp, Cyprinuscarpio L. Fish and Shellfish Immunology, 15, 397–410
Gutierrez-Estrada J C (2003). Desarrollo y evaluacion demodelos para la toma de decisiones. Caracterizacion de laproduccion de anguilas (Anguilla anguilla L.) en sistemasintensivos. [Development and evaluation of managementmodels. Characterisation of the eels (Anguilla anguilla L.)yield in intensive systems.] PhD Thesis, Escuela TecnicaSuperior de Ingenieros Agronomos y de Montes, Universi-dad de Cordoba, Spain.
Gutierrez-Estrada J C; De-Pedro E; Lopez-Luque R; Pulido-
Calvo I (2004). Influencia del mercado liberalizado de laenergıa electrica sobre instalaciones de acuicultura intensiveasociadas a efluentes de refrigeracion. [Effect of the liberal-ised electric market on intensive aquiculture plants asso-ciated with cooling effluents]. Informacion TecnicaEconomica Agraria (ITEA), 100A, 89–106
Heath A G; Turner B J; Davis W P (1993). Temperaturepreferences and tolerances of three fish species inhabitinghyperthermal ponds on mangrove islands. Hydrobiologia,259, 47–53
Hokanson K E F; Kleiner C F; Thorslund T W (1977). Effects ofconstant temperatures and diel temperature fluctuations onspecific growth and mortality rates and yield of juvenilerainbow trout, Salmo gairdneri. Journal of the FisheriesResearch Board of Canada, 34, 639–648
Israeli-Weinstein D; Kimmel E (1998). Behavioral response ofcarp (Cyprinus carpio) to ammonia stress. Aquaculture, 165,81–93
Kinkelin P; Michel C; Ghittino P (1991). Tratado de lasenfermedades de los peces. [Handbook of the fish diseases].Acribia S.A., Zaragoza (Spain)
Konstantivov A S; Zdanovich V V (1987). Peculiarities of fishgrowth in relation to temperature fluctuation. Journal ofIchthyologia, 26, 65–74
Lo K M; Chen C S; Clayton J T; Adrian D D (1975).Simulation of temperature and moisture changes in wheatstorage due to weather variability. Journal of AgriculturalEngineering Research, 20(1), 47–53
Luksiene D; Sandstrom O (1994). Reproductive disturbance ina roach (Rutilus rutilus) population affected bycooling water discharge. Journal of Fish Biology, 45,
613–625Lund J W (1986). Agriculture and aquaculture applications ofgeothermal energy. Geothermics, 15, 415–420
Lund J W; Freeston D H; Boyd T L (2005). Direct applicationof geothermal energy: 2005 Worldwide review. Geothermics,34, 691–727
Mariazzi A A; Donadelli J L; Arenas P; DiSiervi M A; Bonetto
C (1992). Impact of a nuclear power plant on water qualityof Embalse del Rıo Tercero reservoir (Cordoba, Argentina).Hydrobiologia, 246, 129–140
Maule A G; Schreck C B (1990). Changes in numbers ofleukocytes in immune organs of juvenile Coho salmon afteracute stress or cortisol treatment. Journal of AquaticAnimal Health, 2, 298–304
Nash C E; Paulsen C L (1981). Water quality changes relevantto heated effluents and intensive aquaculture. Proceedings ofthe World Symposium on Aquaculture ‘Heated Effluentsand Recirculation System’, Berlin.
Otnes R K; Enochson L (1978). Applied Time Series Analysis.Wiley Interscience, New York
Otto R G (1974). The effects of acclimation to cyclic thermalregimes on heat tolerance of the western mosquitofish.Transactions of the American Fisheries Society, 103,
331–335Palackova J; Gajdusek S; Jirasek J; Fasaic K (1990). Effect ofsublethal concentration of ammonia in water on changes inand correlations of some biochemical indices in carp fry(Cyprinus carpio L.). Ichthyologia, 22, 57–67
Park H H (1998). Analysis and prediction of walleye pollock(Theragra chalcogramma) landings in Korea by time seriesanalysis. Fisheries Research, 38, 1–7
Richkus W A; McLean R (2000). Historical overview of theefficacy of two decades of power plant fisheries impactassessment activities in Chesapeake Bay. EnvironmentalScience and Policy, 3, 283–293
Scott N R (1984). Livestock buildings and equipment: Areview. Journal of Agricultural Engineering Research, 29(2),93–114
Soderberg R W (1990). Temperature effects on the growth ofblue tilapia in intensive aquaculture. Progressive Fish-Culturist, 52, 155–157
Sylvester J R (1972). Possible effects of thermal effluents onfish: a review. Environmental Pollution, 3, 205–215
Veil A J (1998). The potential for effluent trading in theenergy industries. Environmental Science and Policy, 1,
39–49