
Water Resources Engineering -1 Unit 1 Lecture Notes 1 ...
18
Water Resources Engineering -1 Unit 1 Lecture Notes 1 Introduction to Engineering Hydrology and Its Applications Hydrology: It is the science which deals with the occurrence, distribution and movement of water on the earth’s surface including that in the atmosphere and below the earth Surface. Water occurs in the atmosphere is in the form of vapour. On the ground surface as water or ice. Below the earth surface as ground water occupying all the voids with in the geological stratum. Hydrological Cycle and their Components Hydrological Cycle: Except for very deep ground waters, the total water supply of earth is in contact Circulation from earth’s surface to the atmospheric and back to the earth’s sur face. The earth’s water circulatory system is known as hydrological cycle. (Or) hydrological cycle is the process of transfer of moisture from the atmosphere to the earth’s surface in the Form of precipitation and evaporation of water back to the atmosphere. Diagram Showing Hydrological Cycle Hydrological cycle consists of the following Processes. 1. Evaporation and Transpiration (E) The water from the surface of the ocean, rivers and also from the moist soil evaporates.
-
Upload
khangminh22 -
Category
Documents
-
view
3 -
download
0
Transcript of Water Resources Engineering -1 Unit 1 Lecture Notes 1 ...

Water Resources Engineering -1
Unit 1
Lecture Notes 1
Introduction to Engineering Hydrology and Its Applications
Hydrology It is the science which deals with the occurrence distribution and movement
of water on the earthrsquos surface including that in the atmosphere and below the earth Surface
Water occurs in the atmosphere is in the form of vapour
On the ground surface as water or ice
Below the earth surface as ground water occupying all the voids with in the geological
stratum
Hydrological Cycle and their Components
Hydrological Cycle
Except for very deep ground waters the total water supply of earth is in contact
Circulation from earthrsquos surface to the atmospheric and back to the earthrsquos surface
The earthrsquos water circulatory system is known as hydrological cycle (Or) hydrological cycle
is the process of transfer of moisture from the atmosphere to the earthrsquos surface in the
Form of precipitation and evaporation of water back to the atmosphere
Diagram Showing Hydrological Cycle
Hydrological cycle consists of the following Processes
1 Evaporation and Transpiration (E)
The water from the surface of the ocean rivers and also from the moist soil evaporates
The vapours are carried over the land by air in the form of clouds Transpiration is the
Process of water being lost from the leaves of the plants from their pores
Total evaporation (E) including transpiration consists of the following
a Surface evaporation Evaporation from moist soil
b Water surface evaporation Evaporation from river surface from oceans
c Evaporation from plants and leaves (Transpiration)
d Atmospheric evaporation
2 Precipitation (P)
Precipitation may be defined as fall of moisture from the atmosphere to the earthrsquos Surface in any
form
Precipitation may be two forms
Liquid Precipitation - rain
Frozen form consist of - Snow Hail sleet freezing rain
3 Run off (R)
Runoff is that portion of precipitation that is not evaporated When moisture falls to the ground in
the form of precipitation a part of precipitation will be evaporated by means of soil surface water
surface and plants The remaining part of precipitation is available as a runoff which ultimately
reaches ocean through surface and sub surface streams The run off may be classified as
following
Surface Run-off
Water flow over the land surface and first it reaches the streams and rivers ultimately this quantity
of water is discharged in oceans
Inter flow (or) Sub-surface Run-off
It is the part of precipitation that infiltrates below the earthrsquos surface Infiltrates Capacity depends
on the geology of the basin runs as a sub surface flow ultimately reaches to oceans through rivers
and streams
Ground Flow (or) Base flow Run-off
It is also a portion of precipitation which after infiltration percolates down and joins the ground
water reservoir This ultimately reaches the oceans
Precipitation = Evaporation + Run off
Measurement of Rain fall
Rain fall is the main source of water used for various purposes Knowledge of rain fall quantity
intensity of rain fall amp distribution of rain fall is extremely useful for irrigation engineering
The amount of rain fall is measured in centimeters (inches)which is falls on a level surface
and is measured by rain gauges
The intensity of rain fall is the rain fall per unit time It is expressed as cmhr
The following are the main types of rain Gauges used for measurement of rain fall
Non-automatic rain gauges
Non automatic rain gauges are non-recording type
Eg Symons rain gauge
Automatic rain gauges
Automatic rain gauges are recording type They are of three types
Weighing bucket type rain gauge
Tipping bucket type rain gauge
Float type rain gauge
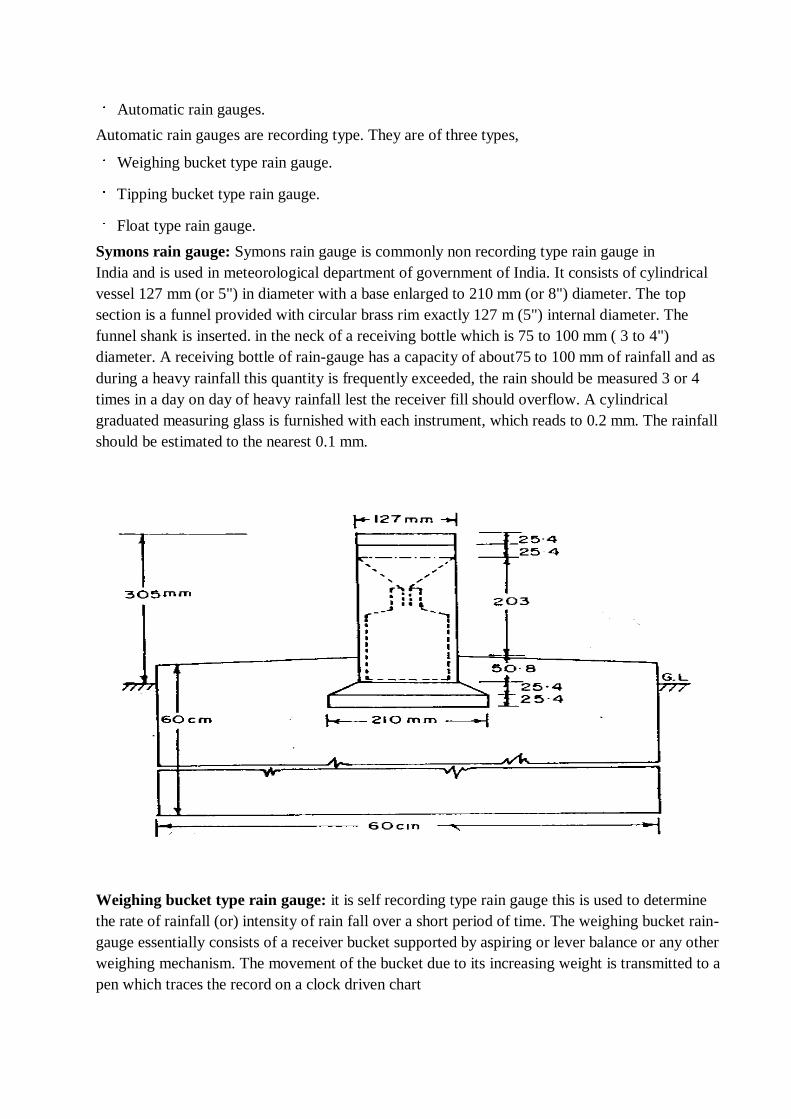
Symons rain gauge Symons rain gauge is commonly non recording type rain gauge in
India and is used in meteorological department of government of India It consists of cylindrical
vessel 127 mm (or 5) in diameter with a base enlarged to 210 mm (or 8) diameter The top
section is a funnel provided with circular brass rim exactly 127 m (5) internal diameter The
funnel shank is inserted in the neck of a receiving bottle which is 75 to 100 mm ( 3 to 4)
diameter A receiving bottle of rain-gauge has a capacity of about75 to 100 mm of rainfall and as
during a heavy rainfall this quantity is frequently exceeded the rain should be measured 3 or 4
times in a day on day of heavy rainfall lest the receiver fill should overflow A cylindrical
graduated measuring glass is furnished with each instrument which reads to 02 mm The rainfall
should be estimated to the nearest 01 mm
Weighing bucket type rain gauge it is self recording type rain gauge this is used to determine
the rate of rainfall (or) intensity of rain fall over a short period of time The weighing bucket rain-
gauge essentially consists of a receiver bucket supported by aspiring or lever balance or any other
weighing mechanism The movement of the bucket due to its increasing weight is transmitted to a
pen which traces the record on a clock driven chart
Tipping bucket type rain gauge The tipping bucket type rain-gauge consists of 30 eudiometer
sharp edge receiver At the end of the receiver is provided a funnel A pair of buckets are pivoted
under the funnel in such a way that when one bucket receives 025mm (001 inch) of precipitation
it tips discharging its contents into a reservoir bringing the other bucket under the funnel Tipping
of the bucket completes an electric circuit causing the movement of pen to mark on clock driven
revolving drum which carries are cord sheet
Float Type Automatic Rain-gauge The working of a float type rain-gauge is similar to the
weighing bucket type gauge A funnel receives the rain water which is collected in rectangular
container A float is provided at the bottom of the container The float is raised as the water level
rises in the container its movement being recorded by a pen moving on a recording drum actuated
by a clock work When the water level in the contain erases so that the float touches the top the siphon
comes into operation and releases the water thus all the water in the box is drained out
Site Selection for Rain Gauge
The rain gauge should be installed on a plain surface
The distance between rain gauge and nearest objective should be at least twice the height of
the objective
The rain gauges should not be provided side and top of the hill
Advantages of recording type rain fall over none recording type rain Gauge
Rain fall is recorded automatically and hence no attender is necessary
By using automatic rain gauge records the intensity of rain fall where as in the Case of non
automatic rain fall rain gauges only rain fall depth is measured
Rain fall is recorded automatically thatrsquos why it can be placed even inaccessible points also
Human errors are avoided
Disadvantages
It is costly
Fault may be developed in electric ampmechanical mechanism for recording the readings
Optimum number of rain Gauges
The optimum number of rain gauges depending up on the coefficient of variation (CV) of the
mean annual rain fall values at the existing stations and available gauge error (e) Optimum
numbers of rain gauge stations are equal to (Cve) sup2
Cv = coefficient of variation
e = error expressed in ()
Cv = σ macrp
Where σ = standard deviation= radicΣ (p-macrp)n-1
macrp =average annual rainfall over the catchment area= Σpn
n = number of existing rain gauge stations
Σp = sum of annual rain fall of total rain gauge stations
The additional rain gauges required = m - n
m = Optimum numbers of rain gauge stations
n = existing numbers of rain gauge stations
1) Determine the optimum number of rain gauges in a catchment area from the following data
a) Number of existing rain gauges = 8
b) Mean annual rain fall at the gauges=1000 950 900 850 800 700 600 amp 400 mm
c) Permissible error =6
Sol
Optimum numbers of rain gauge stations = (Cve) sup2
Cv = (σ macrp) x100
macrp = Σpn = 1000+950+900+850+800+700+600+400
8
6200 = 775mm
8
Standard deviation σ =radic [Σ(p- macrp ) (n-1)]
Σ (p-macrp)2 =(1000-775)2+(950-775)2+(900-775)2+(850-775)2+(800-775)2+(700-775)2+(600-
775)2+(400-775)2
Standard deviation σ = 200
Cv = (200 775) x100 = 258
Optimum numbers of rain gauge stations = (Cve) sup2 = 2586 =184 say 19
Additional rain gauges = m ndash n = 19 -8 = 11numbers
Estimation of missing rainfall data
Missing rainfall data of the rain gauge stations can be calculated from the mean annual rainfall of
the existing rain gauge stations called index stations From the determination of missing rainfall
data we know the mean annual rainfall of all the rain gauge stations including the station with
missing rainfall data
The normal annual rainfall of a station is the average value of the annual rainfall over a i
specific period 30years
The normal annual rainfall is updated every 10 years
The missing rainfall data can be calculated by using the following methods-
1 Comparison method
2 Normal ratio method
3 Isohyetal method
Comparison method The missing data can be estimated by comparing the mean annual rainfalls
of missing rainfall station X with that of an adjacent rain gauge station A
PX = NX
PA NA
Where PX and PA precipitation of stations X and A
NX and NA mean annual rainfall of stations X and A
Normal ratio method X is the missing rainfall of rain gauge station AB C is the adjoining rain
gauge stations
(a) When the mean annual rainfall at each of the Index station A B and C is with in 10 of the
mean annual rainfall of the station X is Simple Average value of three
PX = 13(PA+ PB+ PC)
(b) When the mean annual rainfall at each of the Index station differs from the station X by more
then 10 the normal ratio method is used
PX = NX3 (PANA + PBNB + PCNC )
Symbol N is used for mean annual rainfall when there are m Index stations
PX = NXm (PANA + PBNB + PCNC +---- PMNM )
Isohyetal method Isohyets are the Counters of equal rain fall depth An Isohyets map is
prepared from the record of various rain gauge stations by interpolation
(1)The rain gauge station X was inoperative for apart of a month during which a storm occurred
The storm rain fall recorded at the three surrounding stations AB and C was 75mm59mm and
85mm respectively if the average annual rainfall of the station ABC and X are 750650850 and
700mm respectively estimate the storm rain fall of station X
Sol Given data PA = 75mm NA = 750mm
PB = 59mm NB = 650mm
PC = 85mm NC = 850mm
NX = 700mm
Because the difference in average annual rainfall is more then 10
PX = NX3 (PANA + PBNB + PCNC )
= 7003(75750 + 59650 + 85850) = 678mm
Computation of average rainfall over a basin
If a basin or catchment area contains more than one rain-gauge station the computation of
average precipitation or rainfall may be done by the following methods
1 Arithmatic average method
2 Thiessen polygon method
3 Isohyetal method
Arithmatic Average Method
If the rainfall is uniformly distributed on its areal pattern the simplest method of estimating
average rainfall is to compute the arithmatic average of the recorded rainfall values at various
stations Thus if P1 P2 P3helliphelliphellip Pn etc are the precipitation or rainfall values measured at n gauge
stations we have
Pav = P1+ P2+ P3helliphellip Pn = ΣPn
n
Arithmatic Average Method
Station
No
Precipitation(mm)
Average Precipitation
1
2
3
4
5
126
188
148
104
162
ΣP = 728mm
Pav = 7285 = 146
Thiessen Polygon Method
The arithmetic average method is most approximate method since rainfall varies in intensity and
duration from place to place Hence rainfall recorded by each rain-gauge station should be
weighed according to the area Thiessen polygon method is a more common method of weighing
the rain-gauge observations according to the area Thiessen polygon method is also called
weighted mean method and is more accurate than the arithmetic average method
Procedure
1 Join the adjacent rain-gauge stations A B C D etc by straight lines
2 Construct the perpendicular bisectors of each of these lines
3 A Thiessen network is thus constructed The polygon formed by the perpendicular bisectors
around a station encloses an area which is everywhere closer to that station than to any other
station Find the area of each of these polygons as shown in figure below
4 Multiply the area of each Thiessen polygon by the rain gauge value of the enclosed station
5 Find the total area ΣA of the basin
6 Compute the average precipitation or rainfall from the equation
Pav = A1 P1+ A2P2+ A3P3helliphellip AnPn
A1 + A1 + A1 hellip An
Thiessen Polygon Method
Rain-gauge
Station
Area of Thiessen
Polygon(A)
Precipitation(P)
AxP
A
B
C
D
45 sq kin
38 sq kin
30 sq kin
40 sq km
308 mm
346 mm
326 mm
246 mm
1386
1315
978
974
Sum 153 sq-km 4663
Pav = ΣAxP ΣA = 4663153 = 305
Isohyetal Method
The basic assumption in the Thiessen Polygon method is that a rain-gauge station best represents
the area which is close to it However this may not always be valid specially when the rainfall is
controlled by topography or results from intense convection The Isohyetal method is the most
elaborate and accurate in such conditions An Isohyet is a line on a rainfall map of the basin
joining places of equal rainfall readings An isohyetal map showing contours of equal rainfall
presents a more accurate picture of the rainfall distribution over the basin
Procedure
1 From the rainfall values recorded at various rain-gauge stations prepare the isohyetal map for
the storm causing the rainfall over the area
2 Measure the areas enclosed between successive isohyets with the help of planimeter
3 Multiply each of these areas by the average rainfall between the isohyets
4 The average rainfall is then computed from the expression
Pav = ΣAx [P1 + P22]
ΣA
Isohyetal Method
Isohyets(cm)
Area between
Isohyets(A)
(sq-km)
Average precipitation
frac12( P1 + P2)
Product
=Ax(P1
+P2)2
9
10
11
12 13 14 15
22
80
105 98 78 16
95
105
115 125 135 145
209
840
1208
1225
1053
232
Sum 399 4767
Pav = ΣAx [P1 + P22]
ΣA
= 4767399 = 1192cm
215 Average rainfall depth The time of rainfall record can vary and may typically range from 1
minute to 1 day for non ndash recording gauges Recording gauges on the other hand continuously
record the rainfall and may do so from 1 day 1 week depending on the make of instrument For
any time duration the average depth of rainfall falling over a catchment can be found by the
following three methods bull The Arithmetic Mean Method bull The Thiessen Polygon Method bull The
Isohyetal Method Arithmetic Mean Method The simplest of all is the Arithmetic Mean Method
which taken an average of all the rainfall depths as shown in Figure
In Figure 1 a catchment of a river is shown with four rain gauges for which an assumed
recorded value of rainfall depth have been shown in the table
assumed recorded value of rainfall depth have been shown
in the table Time (in hours)
Total Rainfall
First Second Third Fourth
Rain(mm) A 15 10 3 2 30
B 12 15 8 5 40
C 8 10 6 4 28
D 5 8 2 2 17
It is on the basis of these discrete measurements of rainfall that an estimation of the average
amount of rainfall that has probably fallen over a catchment has to be made Three methods are
commonly used which are discussed in the following section
Depth-Area-Duration curves
In designing structures for water resources one has to know the areal spread of rainfall within
watershed However it is often required to know the amount of high rainfall that may be expected
over the catchment It may be observed that usually a storm event would start with a heavy
downpour and may gradually reduce as time passes Hence the rainfall depth is not proportional
to the time duration of rainfall observation Similarly rainfall over a small area may be more or
less uniform But if the area is large then due to the variation of rain falling in different parts the
average rainfall would be less than that recorded over a small portion below the high rain fall
occurring within the area Due to these facts a Depth-Area-Duration (DAD) analysis is carried
out based on records of several storms on an area and the maximum areal precipitation for
different durations corresponding to different areal extents
The result of a DAD analysis is the DAD curves which would look as shown in Figure
Intensity-Duration-Frequency curves The analysis of continuous rainfall events usually lasting for periods of less than a day requires
the evaluation of rainfall intensities The assessment of such values may be made from records of
several part storms over the area and presented in a graphical form as shown in Figure
Two new concepts are introduced here which are
bull Rainfall intensity
This is the amount of rainfall for a given rainfall event recorded at a station divided by
the time of record counted from the beginning of the event
bull Return period
This is the time interval after which a storm of given magnitude is likely to recur This
is determined by analyzing past rainfalls from several events recorded at a station A
related term the frequency of the rainfall event (also called the storm event) is the
inverse of the return period Often this amount is multiplied by 100 and expressed as a
percentage Frequency (expressed as percentage) of a rainfall of a given magnitude
means the number of times the given event may be expected to be equaled or exceeded
in 100 years
Analysis for anomalous rainfall records Rainfall recorded at various rain gauges within a catchment should be monitored regularly for
any anomalies For example of a number of recording rain gauges located nearby one may have
stopped functioning at a certain
point of time thus breaking the record of the gauge from that time onwards Sometimes a
perfectly working recording rain gauge might have been shifted to a neighbourhood location
causing a different trend in the recorded rainfall compared to the past data Such difference in
trend of recorded rainfall can also be brought about by a change in the neighbourhood or a change
in the ecosystem etc These two major types of anomalies in rainfall are categorized as
bull Missing rainfall record
bull Inconsistency in rainfall record
Missing rainfall record
The rainfall record at a certain station may become discontinued due to operational reasons One
way of approximating the missing rainfall record would be using the records of the three rain
gauge stations closet to the affected station by the ldquoNormal Ratio Methodrdquo as given below
Where P4
is the precipitation at the missing location N1 N
2 N
3 and N
4 are the normal annual
precipitation of the four stations and P1 P
2 and P
3 are the rainfalls recorded at the three stations 1
2 and 3 respectively
Inconsistency in rainfall record
This may arise due to change in location of rain gauge its degree of exposure to rainfall or
change in instrument etc The consistency check for a rainfall record is done by comparing the
accumulated annual (or seasonal) precipitation of the suspected station with that of a standard or
reference station using a double mass curve as shown in Figure
From the calculated slopes S0 and S
c from the plotted graph we may write
Where Pc and P
0 are the corrected and original rainfalls at suspected station at any time S
c and S
0
are the corrected and original slopes of the double mass-curve
2110 Probable extreme rainfall events
Two values of extreme rainfall events are important from the point of view of water resources
engineering These are
Probable Maximum Precipitation (PMP)
This is the amount of rainfall over a region which cannot be exceeded over at that place The PMP
is obtained by studying all the storms that have occurred over the region and maximizing them for
the most critical atmospheric conditions The PMP will of course vary over the Earthrsquos surface
according to the local climatic factors Naturally it would be expected to be much higher in the
hot humid equatorial regions than in the colder regions of the mid-latitudes when the atmospheric
is not able to hold as much moisture PMP also varies within India between the extremes of the
dry deserts of Rajasthan to the ever humid regions of South Meghalaya plateau
Standard Project Storm (SPS)
This is the storm which is reasonably capable of occurring over the basin under consideration and
is generally the heaviest rainstorm which has occurred in the region of the basin during the period
of rainfall records It is not maximized for the most critical atmospheric conditions but it may be
transposed from an adjacent region to the catchment under considerations
The methods to obtain PMP and SPS are involved and the interested reader mayfind help in text
books on hydrology such as the following
bull Mutreja K N (1995) Applied Hydrology Tata McGraw Hill
bull Subramanya K (2002) Engineering Hydrology Tata McGraw Hill
2111 Evapotranspiration
As discussed earlier evapotranspiration consists of evaporation from soil and water bodies and
loss of water from plant leaves which is called transpiration It is a major component of the
hydrologic cycle and its information is needed to design irrigation projects and for managing
water quality and other environmental concerns In urban development evapotranspiration
flood control The term consumptive use is also sometimes used to denote the loss of water
molecules to atmosphere by evapotranspiration For a given set of atmospheric conditions
evapotranspiration depends on the availability of water If sufficient moisture is always available
to completely meet the needs of vegetation fully covering the area the resulting
evapotranspiration is called potential evapotranspiration (PET) The real evapotranspiration
occurring in a specific situation is called actual evapotranspiration (AET)
2112 Measurement of evapotranspiration
There are several methods available for measuring evaporation or evapotranspiration some of
which are given in the following sub-sections
Potential Evapotranspiration (PET)
bull Pan evaporation
The evaporation rate from pans filled with water is easily obtained In the absence of rain
the amount of water evaporated during a period (mmday) corresponds with the decrease
in water depth in that period Pans provide a measurement of the integrated effect of
radiation wind temperature and humidity on the evaporation from an open water surface
Although the pan responds in a similar fashion to the same climatic factors affecting crop
transpiration several factors produce significant differences in loss of water from a water
surface and from a cropped surface Reflection of solar radiation from water in the shallow
pan might be different from the assumed 23 for the grass reference surface Storage of
heat within the pan can be appreciable and may cause significant evaporation during the
night while most crops transpire only during the daytime There are also differences in
turbulence temperature and humidity of the air immediately above the respective surfaces
Heat transfer through the sides of the pan occurs and affects the energy balance
Notwithstanding the difference between pan-evaporation and the evapotranspiration of
cropped surfaces the use of pans to predict ETo
for periods of 10 days or longer may be
warranted The pan evaporation is related to the reference evapotranspiration by an
empirically derived pan coefficient
ETo = K
p E
pan
Where
ETo reference evapotranspiration [mmday]
Kp pan coefficient [-]
Epan
pan evaporation [mmday]
bull Evapotranspiration gauges The modified Bellani plate atmometer has been offered
as an alternative and simpler technique to combination-based equations to estimate
evapotranspiration (ET) rate from green grass surface
Actual Evapotranspiration (AET)
bull Simple methods
1048707 Soil water depletion method
Evapotranspiration can be measured by using soil water depletion method This method is
usually suitable for areas where soil is fairly uniform Soil moisture measured at
various time intervals Evapotranspiration can be measured from the difference of soil
moisture at various time levels
1048707 Water balance method
The method is essentially a book-keeping procedure which estimates the balance between
the inflow and outflow of water In a standard soil water balance calculation the
volume of water required to saturate the soil is expressed as an equivalent depth of
water and is called the soil water deficit The soil water balance can be represented by
Ea = P - Gr + ΔS ndash Ro
Where Gr = recharge
P = precipitation
Ea = actual evapotranspiration
ΔS = change in soil water storage and
Ro = run-off
bull Complex methods
1048707 Lysimeters
A lysimeter is a special watertight tank containing a block of soil and set in a field of
growing plants The plants grown in the lysimeter are the same as in the surrounding
field Evapotranspiration is estimated in terms of the amount of water required to
maintain constant moisture conditions within the tank measured either volumetrically
or gravimetrically through an arrangement made in the lysimeter Lysimeters should
be designed to accurately reproduce the soil conditions moisture content type and
size of the vegetation of the surrounding area They should be so hurried that the soil is
at the same level inside and outside the container Lysimeter studies are time-
consuming and expensive
1048707 Energy balance method
The energy balance consists of four major components net radiation input energy
exchange with soil energy exchange to heat
the air (sensible heat) and energy exchange to evaporate water (latent energy) Latent
energy is thus the budget involved in the process of evapotranspiration Net Radiation
-Ground Heat Flux = Sensible Heat + Latent Energy
The energy balance method of determining Evapotranspiration can be used for hourly
values during daylight hours but accurate night time values are difficult to obtain
Eddy diffusion equations can be used and combinations of these procedures can be
used also to calculate evapotranspiration The method used is governed often by the
data available the accuracy needed and the computational capability
1048707 Mass transfer method
This is one of the analytical methods for the determination of lake evaporation This
method is based on theories of turbulent mass transfer in boundary layer to calculate
the mass water vapour transfer from the surface to the surrounding atmosphere

The vapours are carried over the land by air in the form of clouds Transpiration is the
Process of water being lost from the leaves of the plants from their pores
Total evaporation (E) including transpiration consists of the following
a Surface evaporation Evaporation from moist soil
b Water surface evaporation Evaporation from river surface from oceans
c Evaporation from plants and leaves (Transpiration)
d Atmospheric evaporation
2 Precipitation (P)
Precipitation may be defined as fall of moisture from the atmosphere to the earthrsquos Surface in any
form
Precipitation may be two forms
Liquid Precipitation - rain
Frozen form consist of - Snow Hail sleet freezing rain
3 Run off (R)
Runoff is that portion of precipitation that is not evaporated When moisture falls to the ground in
the form of precipitation a part of precipitation will be evaporated by means of soil surface water
surface and plants The remaining part of precipitation is available as a runoff which ultimately
reaches ocean through surface and sub surface streams The run off may be classified as
following
Surface Run-off
Water flow over the land surface and first it reaches the streams and rivers ultimately this quantity
of water is discharged in oceans
Inter flow (or) Sub-surface Run-off
It is the part of precipitation that infiltrates below the earthrsquos surface Infiltrates Capacity depends
on the geology of the basin runs as a sub surface flow ultimately reaches to oceans through rivers
and streams
Ground Flow (or) Base flow Run-off
It is also a portion of precipitation which after infiltration percolates down and joins the ground
water reservoir This ultimately reaches the oceans
Precipitation = Evaporation + Run off
Measurement of Rain fall
Rain fall is the main source of water used for various purposes Knowledge of rain fall quantity
intensity of rain fall amp distribution of rain fall is extremely useful for irrigation engineering
The amount of rain fall is measured in centimeters (inches)which is falls on a level surface
and is measured by rain gauges
The intensity of rain fall is the rain fall per unit time It is expressed as cmhr
The following are the main types of rain Gauges used for measurement of rain fall
Non-automatic rain gauges
Non automatic rain gauges are non-recording type
Eg Symons rain gauge
Automatic rain gauges
Automatic rain gauges are recording type They are of three types
Weighing bucket type rain gauge
Tipping bucket type rain gauge
Float type rain gauge
Symons rain gauge Symons rain gauge is commonly non recording type rain gauge in
India and is used in meteorological department of government of India It consists of cylindrical
vessel 127 mm (or 5) in diameter with a base enlarged to 210 mm (or 8) diameter The top
section is a funnel provided with circular brass rim exactly 127 m (5) internal diameter The
funnel shank is inserted in the neck of a receiving bottle which is 75 to 100 mm ( 3 to 4)
diameter A receiving bottle of rain-gauge has a capacity of about75 to 100 mm of rainfall and as
during a heavy rainfall this quantity is frequently exceeded the rain should be measured 3 or 4
times in a day on day of heavy rainfall lest the receiver fill should overflow A cylindrical
graduated measuring glass is furnished with each instrument which reads to 02 mm The rainfall
should be estimated to the nearest 01 mm
Weighing bucket type rain gauge it is self recording type rain gauge this is used to determine
the rate of rainfall (or) intensity of rain fall over a short period of time The weighing bucket rain-
gauge essentially consists of a receiver bucket supported by aspiring or lever balance or any other
weighing mechanism The movement of the bucket due to its increasing weight is transmitted to a
pen which traces the record on a clock driven chart
Tipping bucket type rain gauge The tipping bucket type rain-gauge consists of 30 eudiometer
sharp edge receiver At the end of the receiver is provided a funnel A pair of buckets are pivoted
under the funnel in such a way that when one bucket receives 025mm (001 inch) of precipitation
it tips discharging its contents into a reservoir bringing the other bucket under the funnel Tipping
of the bucket completes an electric circuit causing the movement of pen to mark on clock driven
revolving drum which carries are cord sheet
Float Type Automatic Rain-gauge The working of a float type rain-gauge is similar to the
weighing bucket type gauge A funnel receives the rain water which is collected in rectangular
container A float is provided at the bottom of the container The float is raised as the water level
rises in the container its movement being recorded by a pen moving on a recording drum actuated
by a clock work When the water level in the contain erases so that the float touches the top the siphon
comes into operation and releases the water thus all the water in the box is drained out
Site Selection for Rain Gauge
The rain gauge should be installed on a plain surface
The distance between rain gauge and nearest objective should be at least twice the height of
the objective
The rain gauges should not be provided side and top of the hill
Advantages of recording type rain fall over none recording type rain Gauge
Rain fall is recorded automatically and hence no attender is necessary
By using automatic rain gauge records the intensity of rain fall where as in the Case of non
automatic rain fall rain gauges only rain fall depth is measured
Rain fall is recorded automatically thatrsquos why it can be placed even inaccessible points also
Human errors are avoided
Disadvantages
It is costly
Fault may be developed in electric ampmechanical mechanism for recording the readings
Optimum number of rain Gauges
The optimum number of rain gauges depending up on the coefficient of variation (CV) of the
mean annual rain fall values at the existing stations and available gauge error (e) Optimum
numbers of rain gauge stations are equal to (Cve) sup2
Cv = coefficient of variation
e = error expressed in ()
Cv = σ macrp
Where σ = standard deviation= radicΣ (p-macrp)n-1
macrp =average annual rainfall over the catchment area= Σpn
n = number of existing rain gauge stations
Σp = sum of annual rain fall of total rain gauge stations
The additional rain gauges required = m - n
m = Optimum numbers of rain gauge stations
n = existing numbers of rain gauge stations
1) Determine the optimum number of rain gauges in a catchment area from the following data
a) Number of existing rain gauges = 8
b) Mean annual rain fall at the gauges=1000 950 900 850 800 700 600 amp 400 mm
c) Permissible error =6
Sol
Optimum numbers of rain gauge stations = (Cve) sup2
Cv = (σ macrp) x100
macrp = Σpn = 1000+950+900+850+800+700+600+400
8
6200 = 775mm
8
Standard deviation σ =radic [Σ(p- macrp ) (n-1)]
Σ (p-macrp)2 =(1000-775)2+(950-775)2+(900-775)2+(850-775)2+(800-775)2+(700-775)2+(600-
775)2+(400-775)2
Standard deviation σ = 200
Cv = (200 775) x100 = 258
Optimum numbers of rain gauge stations = (Cve) sup2 = 2586 =184 say 19
Additional rain gauges = m ndash n = 19 -8 = 11numbers
Estimation of missing rainfall data
Missing rainfall data of the rain gauge stations can be calculated from the mean annual rainfall of
the existing rain gauge stations called index stations From the determination of missing rainfall
data we know the mean annual rainfall of all the rain gauge stations including the station with
missing rainfall data
The normal annual rainfall of a station is the average value of the annual rainfall over a i
specific period 30years
The normal annual rainfall is updated every 10 years
The missing rainfall data can be calculated by using the following methods-
1 Comparison method
2 Normal ratio method
3 Isohyetal method
Comparison method The missing data can be estimated by comparing the mean annual rainfalls
of missing rainfall station X with that of an adjacent rain gauge station A
PX = NX
PA NA
Where PX and PA precipitation of stations X and A
NX and NA mean annual rainfall of stations X and A
Normal ratio method X is the missing rainfall of rain gauge station AB C is the adjoining rain
gauge stations
(a) When the mean annual rainfall at each of the Index station A B and C is with in 10 of the
mean annual rainfall of the station X is Simple Average value of three
PX = 13(PA+ PB+ PC)
(b) When the mean annual rainfall at each of the Index station differs from the station X by more
then 10 the normal ratio method is used
PX = NX3 (PANA + PBNB + PCNC )
Symbol N is used for mean annual rainfall when there are m Index stations
PX = NXm (PANA + PBNB + PCNC +---- PMNM )
Isohyetal method Isohyets are the Counters of equal rain fall depth An Isohyets map is
prepared from the record of various rain gauge stations by interpolation
(1)The rain gauge station X was inoperative for apart of a month during which a storm occurred
The storm rain fall recorded at the three surrounding stations AB and C was 75mm59mm and
85mm respectively if the average annual rainfall of the station ABC and X are 750650850 and
700mm respectively estimate the storm rain fall of station X
Sol Given data PA = 75mm NA = 750mm
PB = 59mm NB = 650mm
PC = 85mm NC = 850mm
NX = 700mm
Because the difference in average annual rainfall is more then 10
PX = NX3 (PANA + PBNB + PCNC )
= 7003(75750 + 59650 + 85850) = 678mm
Computation of average rainfall over a basin
If a basin or catchment area contains more than one rain-gauge station the computation of
average precipitation or rainfall may be done by the following methods
1 Arithmatic average method
2 Thiessen polygon method
3 Isohyetal method
Arithmatic Average Method
If the rainfall is uniformly distributed on its areal pattern the simplest method of estimating
average rainfall is to compute the arithmatic average of the recorded rainfall values at various
stations Thus if P1 P2 P3helliphelliphellip Pn etc are the precipitation or rainfall values measured at n gauge
stations we have
Pav = P1+ P2+ P3helliphellip Pn = ΣPn
n
Arithmatic Average Method
Station
No
Precipitation(mm)
Average Precipitation
1
2
3
4
5
126
188
148
104
162
ΣP = 728mm
Pav = 7285 = 146
Thiessen Polygon Method
The arithmetic average method is most approximate method since rainfall varies in intensity and
duration from place to place Hence rainfall recorded by each rain-gauge station should be
weighed according to the area Thiessen polygon method is a more common method of weighing
the rain-gauge observations according to the area Thiessen polygon method is also called
weighted mean method and is more accurate than the arithmetic average method
Procedure
1 Join the adjacent rain-gauge stations A B C D etc by straight lines
2 Construct the perpendicular bisectors of each of these lines
3 A Thiessen network is thus constructed The polygon formed by the perpendicular bisectors
around a station encloses an area which is everywhere closer to that station than to any other
station Find the area of each of these polygons as shown in figure below
4 Multiply the area of each Thiessen polygon by the rain gauge value of the enclosed station
5 Find the total area ΣA of the basin
6 Compute the average precipitation or rainfall from the equation
Pav = A1 P1+ A2P2+ A3P3helliphellip AnPn
A1 + A1 + A1 hellip An
Thiessen Polygon Method
Rain-gauge
Station
Area of Thiessen
Polygon(A)
Precipitation(P)
AxP
A
B
C
D
45 sq kin
38 sq kin
30 sq kin
40 sq km
308 mm
346 mm
326 mm
246 mm
1386
1315
978
974
Sum 153 sq-km 4663
Pav = ΣAxP ΣA = 4663153 = 305
Isohyetal Method
The basic assumption in the Thiessen Polygon method is that a rain-gauge station best represents
the area which is close to it However this may not always be valid specially when the rainfall is
controlled by topography or results from intense convection The Isohyetal method is the most
elaborate and accurate in such conditions An Isohyet is a line on a rainfall map of the basin
joining places of equal rainfall readings An isohyetal map showing contours of equal rainfall
presents a more accurate picture of the rainfall distribution over the basin
Procedure
1 From the rainfall values recorded at various rain-gauge stations prepare the isohyetal map for
the storm causing the rainfall over the area
2 Measure the areas enclosed between successive isohyets with the help of planimeter
3 Multiply each of these areas by the average rainfall between the isohyets
4 The average rainfall is then computed from the expression
Pav = ΣAx [P1 + P22]
ΣA
Isohyetal Method
Isohyets(cm)
Area between
Isohyets(A)
(sq-km)
Average precipitation
frac12( P1 + P2)
Product
=Ax(P1
+P2)2
9
10
11
12 13 14 15
22
80
105 98 78 16
95
105
115 125 135 145
209
840
1208
1225
1053
232
Sum 399 4767
Pav = ΣAx [P1 + P22]
ΣA
= 4767399 = 1192cm
215 Average rainfall depth The time of rainfall record can vary and may typically range from 1
minute to 1 day for non ndash recording gauges Recording gauges on the other hand continuously
record the rainfall and may do so from 1 day 1 week depending on the make of instrument For
any time duration the average depth of rainfall falling over a catchment can be found by the
following three methods bull The Arithmetic Mean Method bull The Thiessen Polygon Method bull The
Isohyetal Method Arithmetic Mean Method The simplest of all is the Arithmetic Mean Method
which taken an average of all the rainfall depths as shown in Figure
In Figure 1 a catchment of a river is shown with four rain gauges for which an assumed
recorded value of rainfall depth have been shown in the table
assumed recorded value of rainfall depth have been shown
in the table Time (in hours)
Total Rainfall
First Second Third Fourth
Rain(mm) A 15 10 3 2 30
B 12 15 8 5 40
C 8 10 6 4 28
D 5 8 2 2 17
It is on the basis of these discrete measurements of rainfall that an estimation of the average
amount of rainfall that has probably fallen over a catchment has to be made Three methods are
commonly used which are discussed in the following section
Depth-Area-Duration curves
In designing structures for water resources one has to know the areal spread of rainfall within
watershed However it is often required to know the amount of high rainfall that may be expected
over the catchment It may be observed that usually a storm event would start with a heavy
downpour and may gradually reduce as time passes Hence the rainfall depth is not proportional
to the time duration of rainfall observation Similarly rainfall over a small area may be more or
less uniform But if the area is large then due to the variation of rain falling in different parts the
average rainfall would be less than that recorded over a small portion below the high rain fall
occurring within the area Due to these facts a Depth-Area-Duration (DAD) analysis is carried
out based on records of several storms on an area and the maximum areal precipitation for
different durations corresponding to different areal extents
The result of a DAD analysis is the DAD curves which would look as shown in Figure
Intensity-Duration-Frequency curves The analysis of continuous rainfall events usually lasting for periods of less than a day requires
the evaluation of rainfall intensities The assessment of such values may be made from records of
several part storms over the area and presented in a graphical form as shown in Figure
Two new concepts are introduced here which are
bull Rainfall intensity
This is the amount of rainfall for a given rainfall event recorded at a station divided by
the time of record counted from the beginning of the event
bull Return period
This is the time interval after which a storm of given magnitude is likely to recur This
is determined by analyzing past rainfalls from several events recorded at a station A
related term the frequency of the rainfall event (also called the storm event) is the
inverse of the return period Often this amount is multiplied by 100 and expressed as a
percentage Frequency (expressed as percentage) of a rainfall of a given magnitude
means the number of times the given event may be expected to be equaled or exceeded
in 100 years
Analysis for anomalous rainfall records Rainfall recorded at various rain gauges within a catchment should be monitored regularly for
any anomalies For example of a number of recording rain gauges located nearby one may have
stopped functioning at a certain
point of time thus breaking the record of the gauge from that time onwards Sometimes a
perfectly working recording rain gauge might have been shifted to a neighbourhood location
causing a different trend in the recorded rainfall compared to the past data Such difference in
trend of recorded rainfall can also be brought about by a change in the neighbourhood or a change
in the ecosystem etc These two major types of anomalies in rainfall are categorized as
bull Missing rainfall record
bull Inconsistency in rainfall record
Missing rainfall record
The rainfall record at a certain station may become discontinued due to operational reasons One
way of approximating the missing rainfall record would be using the records of the three rain
gauge stations closet to the affected station by the ldquoNormal Ratio Methodrdquo as given below
Where P4
is the precipitation at the missing location N1 N
2 N
3 and N
4 are the normal annual
precipitation of the four stations and P1 P
2 and P
3 are the rainfalls recorded at the three stations 1
2 and 3 respectively
Inconsistency in rainfall record
This may arise due to change in location of rain gauge its degree of exposure to rainfall or
change in instrument etc The consistency check for a rainfall record is done by comparing the
accumulated annual (or seasonal) precipitation of the suspected station with that of a standard or
reference station using a double mass curve as shown in Figure
From the calculated slopes S0 and S
c from the plotted graph we may write
Where Pc and P
0 are the corrected and original rainfalls at suspected station at any time S
c and S
0
are the corrected and original slopes of the double mass-curve
2110 Probable extreme rainfall events
Two values of extreme rainfall events are important from the point of view of water resources
engineering These are
Probable Maximum Precipitation (PMP)
This is the amount of rainfall over a region which cannot be exceeded over at that place The PMP
is obtained by studying all the storms that have occurred over the region and maximizing them for
the most critical atmospheric conditions The PMP will of course vary over the Earthrsquos surface
according to the local climatic factors Naturally it would be expected to be much higher in the
hot humid equatorial regions than in the colder regions of the mid-latitudes when the atmospheric
is not able to hold as much moisture PMP also varies within India between the extremes of the
dry deserts of Rajasthan to the ever humid regions of South Meghalaya plateau
Standard Project Storm (SPS)
This is the storm which is reasonably capable of occurring over the basin under consideration and
is generally the heaviest rainstorm which has occurred in the region of the basin during the period
of rainfall records It is not maximized for the most critical atmospheric conditions but it may be
transposed from an adjacent region to the catchment under considerations
The methods to obtain PMP and SPS are involved and the interested reader mayfind help in text
books on hydrology such as the following
bull Mutreja K N (1995) Applied Hydrology Tata McGraw Hill
bull Subramanya K (2002) Engineering Hydrology Tata McGraw Hill
2111 Evapotranspiration
As discussed earlier evapotranspiration consists of evaporation from soil and water bodies and
loss of water from plant leaves which is called transpiration It is a major component of the
hydrologic cycle and its information is needed to design irrigation projects and for managing
water quality and other environmental concerns In urban development evapotranspiration
flood control The term consumptive use is also sometimes used to denote the loss of water
molecules to atmosphere by evapotranspiration For a given set of atmospheric conditions
evapotranspiration depends on the availability of water If sufficient moisture is always available
to completely meet the needs of vegetation fully covering the area the resulting
evapotranspiration is called potential evapotranspiration (PET) The real evapotranspiration
occurring in a specific situation is called actual evapotranspiration (AET)
2112 Measurement of evapotranspiration
There are several methods available for measuring evaporation or evapotranspiration some of
which are given in the following sub-sections
Potential Evapotranspiration (PET)
bull Pan evaporation
The evaporation rate from pans filled with water is easily obtained In the absence of rain
the amount of water evaporated during a period (mmday) corresponds with the decrease
in water depth in that period Pans provide a measurement of the integrated effect of
radiation wind temperature and humidity on the evaporation from an open water surface
Although the pan responds in a similar fashion to the same climatic factors affecting crop
transpiration several factors produce significant differences in loss of water from a water
surface and from a cropped surface Reflection of solar radiation from water in the shallow
pan might be different from the assumed 23 for the grass reference surface Storage of
heat within the pan can be appreciable and may cause significant evaporation during the
night while most crops transpire only during the daytime There are also differences in
turbulence temperature and humidity of the air immediately above the respective surfaces
Heat transfer through the sides of the pan occurs and affects the energy balance
Notwithstanding the difference between pan-evaporation and the evapotranspiration of
cropped surfaces the use of pans to predict ETo
for periods of 10 days or longer may be
warranted The pan evaporation is related to the reference evapotranspiration by an
empirically derived pan coefficient
ETo = K
p E
pan
Where
ETo reference evapotranspiration [mmday]
Kp pan coefficient [-]
Epan
pan evaporation [mmday]
bull Evapotranspiration gauges The modified Bellani plate atmometer has been offered
as an alternative and simpler technique to combination-based equations to estimate
evapotranspiration (ET) rate from green grass surface
Actual Evapotranspiration (AET)
bull Simple methods
1048707 Soil water depletion method
Evapotranspiration can be measured by using soil water depletion method This method is
usually suitable for areas where soil is fairly uniform Soil moisture measured at
various time intervals Evapotranspiration can be measured from the difference of soil
moisture at various time levels
1048707 Water balance method
The method is essentially a book-keeping procedure which estimates the balance between
the inflow and outflow of water In a standard soil water balance calculation the
volume of water required to saturate the soil is expressed as an equivalent depth of
water and is called the soil water deficit The soil water balance can be represented by
Ea = P - Gr + ΔS ndash Ro
Where Gr = recharge
P = precipitation
Ea = actual evapotranspiration
ΔS = change in soil water storage and
Ro = run-off
bull Complex methods
1048707 Lysimeters
A lysimeter is a special watertight tank containing a block of soil and set in a field of
growing plants The plants grown in the lysimeter are the same as in the surrounding
field Evapotranspiration is estimated in terms of the amount of water required to
maintain constant moisture conditions within the tank measured either volumetrically
or gravimetrically through an arrangement made in the lysimeter Lysimeters should
be designed to accurately reproduce the soil conditions moisture content type and
size of the vegetation of the surrounding area They should be so hurried that the soil is
at the same level inside and outside the container Lysimeter studies are time-
consuming and expensive
1048707 Energy balance method
The energy balance consists of four major components net radiation input energy
exchange with soil energy exchange to heat
the air (sensible heat) and energy exchange to evaporate water (latent energy) Latent
energy is thus the budget involved in the process of evapotranspiration Net Radiation
-Ground Heat Flux = Sensible Heat + Latent Energy
The energy balance method of determining Evapotranspiration can be used for hourly
values during daylight hours but accurate night time values are difficult to obtain
Eddy diffusion equations can be used and combinations of these procedures can be
used also to calculate evapotranspiration The method used is governed often by the
data available the accuracy needed and the computational capability
1048707 Mass transfer method
This is one of the analytical methods for the determination of lake evaporation This
method is based on theories of turbulent mass transfer in boundary layer to calculate
the mass water vapour transfer from the surface to the surrounding atmosphere

Thiessen Polygon Method
The arithmetic average method is most approximate method since rainfall varies in intensity and
duration from place to place Hence rainfall recorded by each rain-gauge station should be
weighed according to the area Thiessen polygon method is a more common method of weighing
the rain-gauge observations according to the area Thiessen polygon method is also called
weighted mean method and is more accurate than the arithmetic average method
Procedure
1 Join the adjacent rain-gauge stations A B C D etc by straight lines
2 Construct the perpendicular bisectors of each of these lines
3 A Thiessen network is thus constructed The polygon formed by the perpendicular bisectors
around a station encloses an area which is everywhere closer to that station than to any other
station Find the area of each of these polygons as shown in figure below
4 Multiply the area of each Thiessen polygon by the rain gauge value of the enclosed station
5 Find the total area ΣA of the basin
6 Compute the average precipitation or rainfall from the equation
Pav = A1 P1+ A2P2+ A3P3helliphellip AnPn
A1 + A1 + A1 hellip An
Thiessen Polygon Method
Rain-gauge
Station
Area of Thiessen
Polygon(A)
Precipitation(P)
AxP
A
B
C
D
45 sq kin
38 sq kin
30 sq kin
40 sq km
308 mm
346 mm
326 mm
246 mm
1386
1315
978
974
Sum 153 sq-km 4663
Pav = ΣAxP ΣA = 4663153 = 305
Isohyetal Method
The basic assumption in the Thiessen Polygon method is that a rain-gauge station best represents
the area which is close to it However this may not always be valid specially when the rainfall is
controlled by topography or results from intense convection The Isohyetal method is the most
elaborate and accurate in such conditions An Isohyet is a line on a rainfall map of the basin
joining places of equal rainfall readings An isohyetal map showing contours of equal rainfall
presents a more accurate picture of the rainfall distribution over the basin
Procedure
1 From the rainfall values recorded at various rain-gauge stations prepare the isohyetal map for
the storm causing the rainfall over the area
2 Measure the areas enclosed between successive isohyets with the help of planimeter
3 Multiply each of these areas by the average rainfall between the isohyets
4 The average rainfall is then computed from the expression
Pav = ΣAx [P1 + P22]
ΣA
Isohyetal Method
Isohyets(cm)
Area between
Isohyets(A)
(sq-km)
Average precipitation
frac12( P1 + P2)
Product
=Ax(P1
+P2)2
9
10
11
12 13 14 15
22
80
105 98 78 16
95
105
115 125 135 145
209
840
1208
1225
1053
232
Sum 399 4767
Pav = ΣAx [P1 + P22]
ΣA
= 4767399 = 1192cm
215 Average rainfall depth The time of rainfall record can vary and may typically range from 1
minute to 1 day for non ndash recording gauges Recording gauges on the other hand continuously
record the rainfall and may do so from 1 day 1 week depending on the make of instrument For
any time duration the average depth of rainfall falling over a catchment can be found by the
following three methods bull The Arithmetic Mean Method bull The Thiessen Polygon Method bull The
Isohyetal Method Arithmetic Mean Method The simplest of all is the Arithmetic Mean Method
which taken an average of all the rainfall depths as shown in Figure
In Figure 1 a catchment of a river is shown with four rain gauges for which an assumed
recorded value of rainfall depth have been shown in the table
assumed recorded value of rainfall depth have been shown
in the table Time (in hours)
Total Rainfall
First Second Third Fourth
Rain(mm) A 15 10 3 2 30
B 12 15 8 5 40
C 8 10 6 4 28
D 5 8 2 2 17
It is on the basis of these discrete measurements of rainfall that an estimation of the average
amount of rainfall that has probably fallen over a catchment has to be made Three methods are
commonly used which are discussed in the following section
Depth-Area-Duration curves
In designing structures for water resources one has to know the areal spread of rainfall within
watershed However it is often required to know the amount of high rainfall that may be expected
over the catchment It may be observed that usually a storm event would start with a heavy
downpour and may gradually reduce as time passes Hence the rainfall depth is not proportional
to the time duration of rainfall observation Similarly rainfall over a small area may be more or
less uniform But if the area is large then due to the variation of rain falling in different parts the
average rainfall would be less than that recorded over a small portion below the high rain fall
occurring within the area Due to these facts a Depth-Area-Duration (DAD) analysis is carried
out based on records of several storms on an area and the maximum areal precipitation for
different durations corresponding to different areal extents
The result of a DAD analysis is the DAD curves which would look as shown in Figure
Intensity-Duration-Frequency curves The analysis of continuous rainfall events usually lasting for periods of less than a day requires
the evaluation of rainfall intensities The assessment of such values may be made from records of
several part storms over the area and presented in a graphical form as shown in Figure
Two new concepts are introduced here which are
bull Rainfall intensity
This is the amount of rainfall for a given rainfall event recorded at a station divided by
the time of record counted from the beginning of the event
bull Return period
This is the time interval after which a storm of given magnitude is likely to recur This
is determined by analyzing past rainfalls from several events recorded at a station A
related term the frequency of the rainfall event (also called the storm event) is the
inverse of the return period Often this amount is multiplied by 100 and expressed as a
percentage Frequency (expressed as percentage) of a rainfall of a given magnitude
means the number of times the given event may be expected to be equaled or exceeded
in 100 years
Analysis for anomalous rainfall records Rainfall recorded at various rain gauges within a catchment should be monitored regularly for
any anomalies For example of a number of recording rain gauges located nearby one may have
stopped functioning at a certain
point of time thus breaking the record of the gauge from that time onwards Sometimes a
perfectly working recording rain gauge might have been shifted to a neighbourhood location
causing a different trend in the recorded rainfall compared to the past data Such difference in
trend of recorded rainfall can also be brought about by a change in the neighbourhood or a change
in the ecosystem etc These two major types of anomalies in rainfall are categorized as
bull Missing rainfall record
bull Inconsistency in rainfall record
Missing rainfall record
The rainfall record at a certain station may become discontinued due to operational reasons One
way of approximating the missing rainfall record would be using the records of the three rain
gauge stations closet to the affected station by the ldquoNormal Ratio Methodrdquo as given below
Where P4
is the precipitation at the missing location N1 N
2 N
3 and N
4 are the normal annual
precipitation of the four stations and P1 P
2 and P
3 are the rainfalls recorded at the three stations 1
2 and 3 respectively
Inconsistency in rainfall record
This may arise due to change in location of rain gauge its degree of exposure to rainfall or
change in instrument etc The consistency check for a rainfall record is done by comparing the
accumulated annual (or seasonal) precipitation of the suspected station with that of a standard or
reference station using a double mass curve as shown in Figure
From the calculated slopes S0 and S
c from the plotted graph we may write
Where Pc and P
0 are the corrected and original rainfalls at suspected station at any time S
c and S
0
are the corrected and original slopes of the double mass-curve
2110 Probable extreme rainfall events
Two values of extreme rainfall events are important from the point of view of water resources
engineering These are
Probable Maximum Precipitation (PMP)
This is the amount of rainfall over a region which cannot be exceeded over at that place The PMP
is obtained by studying all the storms that have occurred over the region and maximizing them for
the most critical atmospheric conditions The PMP will of course vary over the Earthrsquos surface
according to the local climatic factors Naturally it would be expected to be much higher in the
hot humid equatorial regions than in the colder regions of the mid-latitudes when the atmospheric
is not able to hold as much moisture PMP also varies within India between the extremes of the
dry deserts of Rajasthan to the ever humid regions of South Meghalaya plateau
Standard Project Storm (SPS)
This is the storm which is reasonably capable of occurring over the basin under consideration and
is generally the heaviest rainstorm which has occurred in the region of the basin during the period
of rainfall records It is not maximized for the most critical atmospheric conditions but it may be
transposed from an adjacent region to the catchment under considerations
The methods to obtain PMP and SPS are involved and the interested reader mayfind help in text
books on hydrology such as the following
bull Mutreja K N (1995) Applied Hydrology Tata McGraw Hill
bull Subramanya K (2002) Engineering Hydrology Tata McGraw Hill
2111 Evapotranspiration
As discussed earlier evapotranspiration consists of evaporation from soil and water bodies and
loss of water from plant leaves which is called transpiration It is a major component of the
hydrologic cycle and its information is needed to design irrigation projects and for managing
water quality and other environmental concerns In urban development evapotranspiration
flood control The term consumptive use is also sometimes used to denote the loss of water
molecules to atmosphere by evapotranspiration For a given set of atmospheric conditions
evapotranspiration depends on the availability of water If sufficient moisture is always available
to completely meet the needs of vegetation fully covering the area the resulting
evapotranspiration is called potential evapotranspiration (PET) The real evapotranspiration
occurring in a specific situation is called actual evapotranspiration (AET)
2112 Measurement of evapotranspiration
There are several methods available for measuring evaporation or evapotranspiration some of
which are given in the following sub-sections
Potential Evapotranspiration (PET)
bull Pan evaporation
The evaporation rate from pans filled with water is easily obtained In the absence of rain
the amount of water evaporated during a period (mmday) corresponds with the decrease
in water depth in that period Pans provide a measurement of the integrated effect of
radiation wind temperature and humidity on the evaporation from an open water surface
Although the pan responds in a similar fashion to the same climatic factors affecting crop
transpiration several factors produce significant differences in loss of water from a water
surface and from a cropped surface Reflection of solar radiation from water in the shallow
pan might be different from the assumed 23 for the grass reference surface Storage of
heat within the pan can be appreciable and may cause significant evaporation during the
night while most crops transpire only during the daytime There are also differences in
turbulence temperature and humidity of the air immediately above the respective surfaces
Heat transfer through the sides of the pan occurs and affects the energy balance
Notwithstanding the difference between pan-evaporation and the evapotranspiration of
cropped surfaces the use of pans to predict ETo
for periods of 10 days or longer may be
warranted The pan evaporation is related to the reference evapotranspiration by an
empirically derived pan coefficient
ETo = K
p E
pan
Where
ETo reference evapotranspiration [mmday]
Kp pan coefficient [-]
Epan
pan evaporation [mmday]
bull Evapotranspiration gauges The modified Bellani plate atmometer has been offered
as an alternative and simpler technique to combination-based equations to estimate
evapotranspiration (ET) rate from green grass surface
Actual Evapotranspiration (AET)
bull Simple methods
1048707 Soil water depletion method
Evapotranspiration can be measured by using soil water depletion method This method is
usually suitable for areas where soil is fairly uniform Soil moisture measured at
various time intervals Evapotranspiration can be measured from the difference of soil
moisture at various time levels
1048707 Water balance method
The method is essentially a book-keeping procedure which estimates the balance between
the inflow and outflow of water In a standard soil water balance calculation the
volume of water required to saturate the soil is expressed as an equivalent depth of
water and is called the soil water deficit The soil water balance can be represented by
Ea = P - Gr + ΔS ndash Ro
Where Gr = recharge
P = precipitation
Ea = actual evapotranspiration
ΔS = change in soil water storage and
Ro = run-off
bull Complex methods
1048707 Lysimeters
A lysimeter is a special watertight tank containing a block of soil and set in a field of
growing plants The plants grown in the lysimeter are the same as in the surrounding
field Evapotranspiration is estimated in terms of the amount of water required to
maintain constant moisture conditions within the tank measured either volumetrically
or gravimetrically through an arrangement made in the lysimeter Lysimeters should
be designed to accurately reproduce the soil conditions moisture content type and
size of the vegetation of the surrounding area They should be so hurried that the soil is
at the same level inside and outside the container Lysimeter studies are time-
consuming and expensive
1048707 Energy balance method
The energy balance consists of four major components net radiation input energy
exchange with soil energy exchange to heat
the air (sensible heat) and energy exchange to evaporate water (latent energy) Latent
energy is thus the budget involved in the process of evapotranspiration Net Radiation
-Ground Heat Flux = Sensible Heat + Latent Energy
The energy balance method of determining Evapotranspiration can be used for hourly
values during daylight hours but accurate night time values are difficult to obtain
Eddy diffusion equations can be used and combinations of these procedures can be
used also to calculate evapotranspiration The method used is governed often by the
data available the accuracy needed and the computational capability
1048707 Mass transfer method
This is one of the analytical methods for the determination of lake evaporation This
method is based on theories of turbulent mass transfer in boundary layer to calculate
the mass water vapour transfer from the surface to the surrounding atmosphere

ΣA
Isohyetal Method
Isohyets(cm)
Area between
Isohyets(A)
(sq-km)
Average precipitation
frac12( P1 + P2)
Product
=Ax(P1
+P2)2
9
10
11
12 13 14 15
22
80
105 98 78 16
95
105
115 125 135 145
209
840
1208
1225
1053
232
Sum 399 4767
Pav = ΣAx [P1 + P22]
ΣA
= 4767399 = 1192cm
215 Average rainfall depth The time of rainfall record can vary and may typically range from 1
minute to 1 day for non ndash recording gauges Recording gauges on the other hand continuously
record the rainfall and may do so from 1 day 1 week depending on the make of instrument For
any time duration the average depth of rainfall falling over a catchment can be found by the
following three methods bull The Arithmetic Mean Method bull The Thiessen Polygon Method bull The
Isohyetal Method Arithmetic Mean Method The simplest of all is the Arithmetic Mean Method
which taken an average of all the rainfall depths as shown in Figure
In Figure 1 a catchment of a river is shown with four rain gauges for which an assumed
recorded value of rainfall depth have been shown in the table
assumed recorded value of rainfall depth have been shown
in the table Time (in hours)
Total Rainfall
First Second Third Fourth
Rain(mm) A 15 10 3 2 30
B 12 15 8 5 40
C 8 10 6 4 28
D 5 8 2 2 17
It is on the basis of these discrete measurements of rainfall that an estimation of the average
amount of rainfall that has probably fallen over a catchment has to be made Three methods are
commonly used which are discussed in the following section
Depth-Area-Duration curves
In designing structures for water resources one has to know the areal spread of rainfall within
watershed However it is often required to know the amount of high rainfall that may be expected
over the catchment It may be observed that usually a storm event would start with a heavy
downpour and may gradually reduce as time passes Hence the rainfall depth is not proportional
to the time duration of rainfall observation Similarly rainfall over a small area may be more or
less uniform But if the area is large then due to the variation of rain falling in different parts the
average rainfall would be less than that recorded over a small portion below the high rain fall
occurring within the area Due to these facts a Depth-Area-Duration (DAD) analysis is carried
out based on records of several storms on an area and the maximum areal precipitation for
different durations corresponding to different areal extents
The result of a DAD analysis is the DAD curves which would look as shown in Figure
Intensity-Duration-Frequency curves The analysis of continuous rainfall events usually lasting for periods of less than a day requires
the evaluation of rainfall intensities The assessment of such values may be made from records of
several part storms over the area and presented in a graphical form as shown in Figure
Two new concepts are introduced here which are
bull Rainfall intensity
This is the amount of rainfall for a given rainfall event recorded at a station divided by
the time of record counted from the beginning of the event
bull Return period
This is the time interval after which a storm of given magnitude is likely to recur This
is determined by analyzing past rainfalls from several events recorded at a station A
related term the frequency of the rainfall event (also called the storm event) is the
inverse of the return period Often this amount is multiplied by 100 and expressed as a
percentage Frequency (expressed as percentage) of a rainfall of a given magnitude
means the number of times the given event may be expected to be equaled or exceeded
in 100 years
Analysis for anomalous rainfall records Rainfall recorded at various rain gauges within a catchment should be monitored regularly for
any anomalies For example of a number of recording rain gauges located nearby one may have
stopped functioning at a certain
point of time thus breaking the record of the gauge from that time onwards Sometimes a
perfectly working recording rain gauge might have been shifted to a neighbourhood location
causing a different trend in the recorded rainfall compared to the past data Such difference in
trend of recorded rainfall can also be brought about by a change in the neighbourhood or a change
in the ecosystem etc These two major types of anomalies in rainfall are categorized as
bull Missing rainfall record
bull Inconsistency in rainfall record
Missing rainfall record
The rainfall record at a certain station may become discontinued due to operational reasons One
way of approximating the missing rainfall record would be using the records of the three rain
gauge stations closet to the affected station by the ldquoNormal Ratio Methodrdquo as given below
Where P4
is the precipitation at the missing location N1 N
2 N
3 and N
4 are the normal annual
precipitation of the four stations and P1 P
2 and P
3 are the rainfalls recorded at the three stations 1
2 and 3 respectively
Inconsistency in rainfall record
This may arise due to change in location of rain gauge its degree of exposure to rainfall or
change in instrument etc The consistency check for a rainfall record is done by comparing the
accumulated annual (or seasonal) precipitation of the suspected station with that of a standard or
reference station using a double mass curve as shown in Figure
From the calculated slopes S0 and S
c from the plotted graph we may write
Where Pc and P
0 are the corrected and original rainfalls at suspected station at any time S
c and S
0
are the corrected and original slopes of the double mass-curve
2110 Probable extreme rainfall events
Two values of extreme rainfall events are important from the point of view of water resources
engineering These are
Probable Maximum Precipitation (PMP)
This is the amount of rainfall over a region which cannot be exceeded over at that place The PMP
is obtained by studying all the storms that have occurred over the region and maximizing them for
the most critical atmospheric conditions The PMP will of course vary over the Earthrsquos surface
according to the local climatic factors Naturally it would be expected to be much higher in the
hot humid equatorial regions than in the colder regions of the mid-latitudes when the atmospheric
is not able to hold as much moisture PMP also varies within India between the extremes of the
dry deserts of Rajasthan to the ever humid regions of South Meghalaya plateau
Standard Project Storm (SPS)
This is the storm which is reasonably capable of occurring over the basin under consideration and
is generally the heaviest rainstorm which has occurred in the region of the basin during the period
of rainfall records It is not maximized for the most critical atmospheric conditions but it may be
transposed from an adjacent region to the catchment under considerations
The methods to obtain PMP and SPS are involved and the interested reader mayfind help in text
books on hydrology such as the following
bull Mutreja K N (1995) Applied Hydrology Tata McGraw Hill
bull Subramanya K (2002) Engineering Hydrology Tata McGraw Hill
2111 Evapotranspiration
As discussed earlier evapotranspiration consists of evaporation from soil and water bodies and
loss of water from plant leaves which is called transpiration It is a major component of the
hydrologic cycle and its information is needed to design irrigation projects and for managing
water quality and other environmental concerns In urban development evapotranspiration
flood control The term consumptive use is also sometimes used to denote the loss of water
molecules to atmosphere by evapotranspiration For a given set of atmospheric conditions
evapotranspiration depends on the availability of water If sufficient moisture is always available
to completely meet the needs of vegetation fully covering the area the resulting
evapotranspiration is called potential evapotranspiration (PET) The real evapotranspiration
occurring in a specific situation is called actual evapotranspiration (AET)
2112 Measurement of evapotranspiration
There are several methods available for measuring evaporation or evapotranspiration some of
which are given in the following sub-sections
Potential Evapotranspiration (PET)
bull Pan evaporation
The evaporation rate from pans filled with water is easily obtained In the absence of rain
the amount of water evaporated during a period (mmday) corresponds with the decrease
in water depth in that period Pans provide a measurement of the integrated effect of
radiation wind temperature and humidity on the evaporation from an open water surface
Although the pan responds in a similar fashion to the same climatic factors affecting crop
transpiration several factors produce significant differences in loss of water from a water
surface and from a cropped surface Reflection of solar radiation from water in the shallow
pan might be different from the assumed 23 for the grass reference surface Storage of
heat within the pan can be appreciable and may cause significant evaporation during the
night while most crops transpire only during the daytime There are also differences in
turbulence temperature and humidity of the air immediately above the respective surfaces
Heat transfer through the sides of the pan occurs and affects the energy balance
Notwithstanding the difference between pan-evaporation and the evapotranspiration of
cropped surfaces the use of pans to predict ETo
for periods of 10 days or longer may be
warranted The pan evaporation is related to the reference evapotranspiration by an
empirically derived pan coefficient
ETo = K
p E
pan
Where
ETo reference evapotranspiration [mmday]
Kp pan coefficient [-]
Epan
pan evaporation [mmday]
bull Evapotranspiration gauges The modified Bellani plate atmometer has been offered
as an alternative and simpler technique to combination-based equations to estimate
evapotranspiration (ET) rate from green grass surface
Actual Evapotranspiration (AET)
bull Simple methods
1048707 Soil water depletion method
Evapotranspiration can be measured by using soil water depletion method This method is
usually suitable for areas where soil is fairly uniform Soil moisture measured at
various time intervals Evapotranspiration can be measured from the difference of soil
moisture at various time levels
1048707 Water balance method
The method is essentially a book-keeping procedure which estimates the balance between
the inflow and outflow of water In a standard soil water balance calculation the
volume of water required to saturate the soil is expressed as an equivalent depth of
water and is called the soil water deficit The soil water balance can be represented by
Ea = P - Gr + ΔS ndash Ro
Where Gr = recharge
P = precipitation
Ea = actual evapotranspiration
ΔS = change in soil water storage and
Ro = run-off
bull Complex methods
1048707 Lysimeters
A lysimeter is a special watertight tank containing a block of soil and set in a field of
growing plants The plants grown in the lysimeter are the same as in the surrounding
field Evapotranspiration is estimated in terms of the amount of water required to
maintain constant moisture conditions within the tank measured either volumetrically
or gravimetrically through an arrangement made in the lysimeter Lysimeters should
be designed to accurately reproduce the soil conditions moisture content type and
size of the vegetation of the surrounding area They should be so hurried that the soil is
at the same level inside and outside the container Lysimeter studies are time-
consuming and expensive
1048707 Energy balance method
The energy balance consists of four major components net radiation input energy
exchange with soil energy exchange to heat
the air (sensible heat) and energy exchange to evaporate water (latent energy) Latent
energy is thus the budget involved in the process of evapotranspiration Net Radiation
-Ground Heat Flux = Sensible Heat + Latent Energy
The energy balance method of determining Evapotranspiration can be used for hourly
values during daylight hours but accurate night time values are difficult to obtain
Eddy diffusion equations can be used and combinations of these procedures can be
used also to calculate evapotranspiration The method used is governed often by the
data available the accuracy needed and the computational capability
1048707 Mass transfer method
This is one of the analytical methods for the determination of lake evaporation This
method is based on theories of turbulent mass transfer in boundary layer to calculate
the mass water vapour transfer from the surface to the surrounding atmosphere
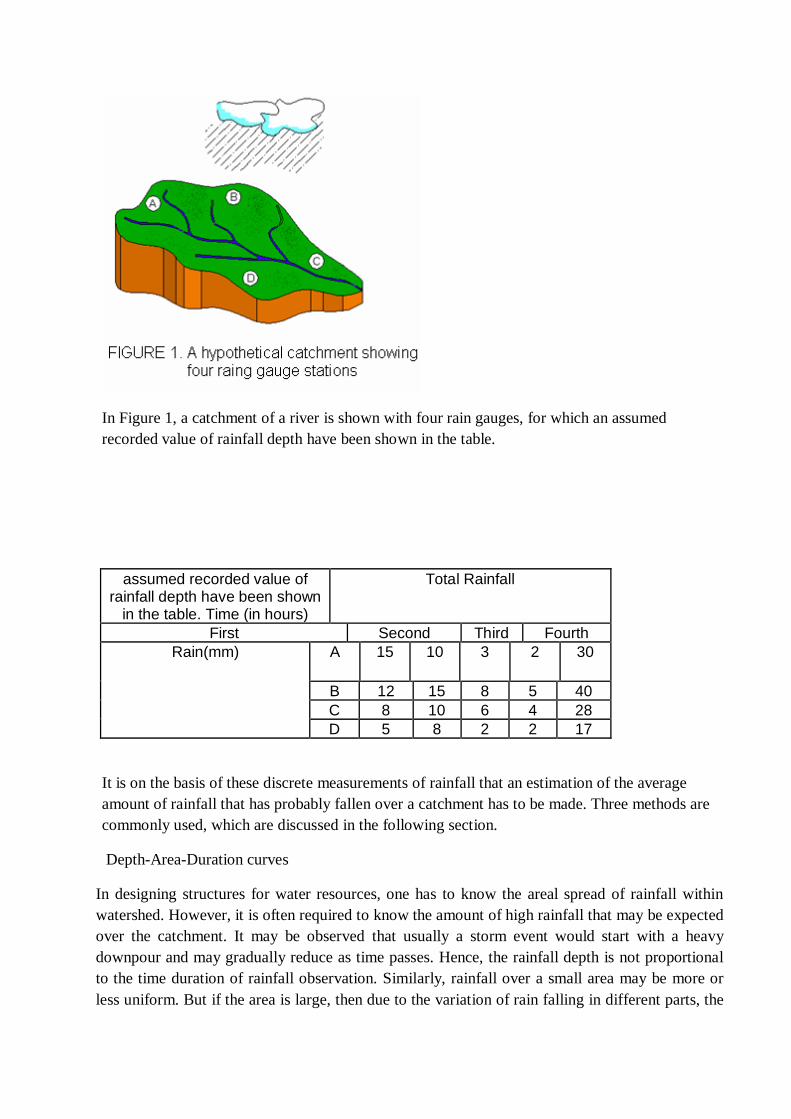

This is one of the analytical methods for the determination of lake evaporation This
method is based on theories of turbulent mass transfer in boundary layer to calculate
the mass water vapour transfer from the surface to the surrounding atmosphere