Water and sediment dynamics at Saint Lawrence River mouth
17
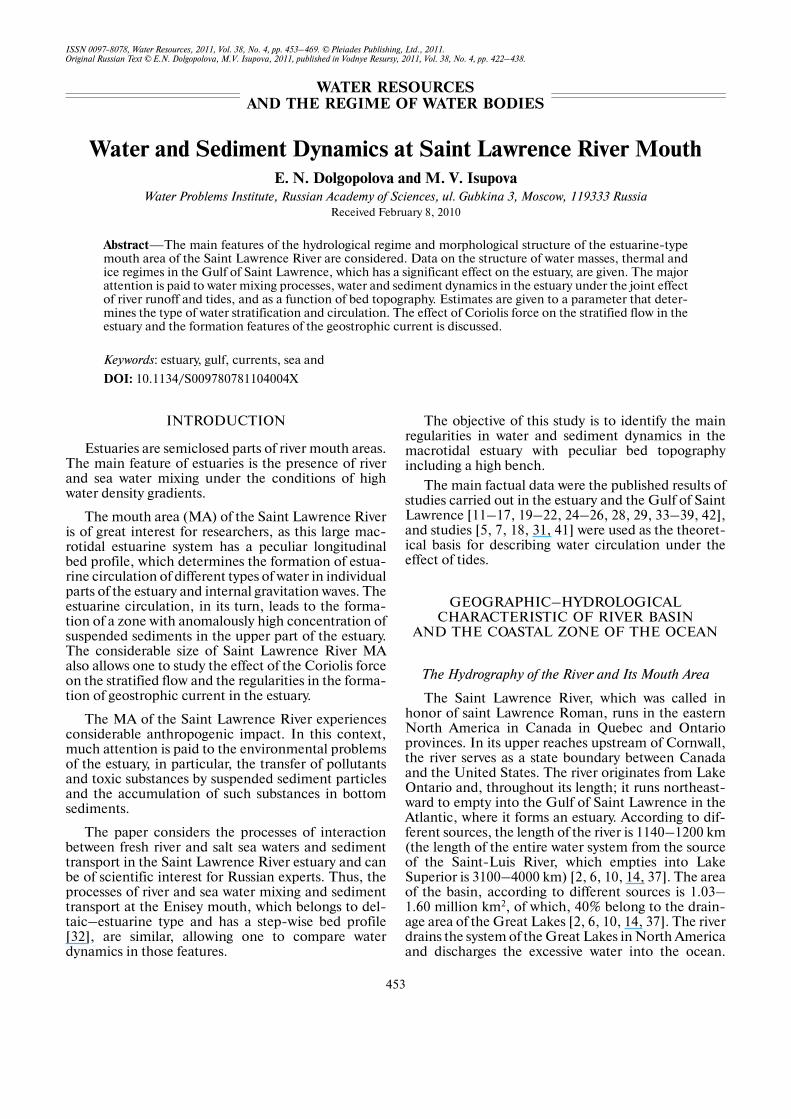
ISSN 00978078, Water Resources, 2011, Vol. 38, No. 4, pp. 453–469. © Pleiades Publishing, Ltd., 2011. Original Russian Text © E.N. Dolgopolova, M.V. Isupova, 2011, published in Vodnye Resursy, 2011, Vol. 38, No. 4, pp. 422–438. 453 INTRODUCTION Estuaries are semiclosed parts of river mouth areas. The main feature of estuaries is the presence of river and sea water mixing under the conditions of high water density gradients. The mouth area (MA) of the Saint Lawrence River is of great interest for researchers, as this large mac rotidal estuarine system has a peculiar longitudinal bed profile, which determines the formation of estua rine circulation of different types of water in individual parts of the estuary and internal gravitation waves. The estuarine circulation, in its turn, leads to the forma tion of a zone with anomalously high concentration of suspended sediments in the upper part of the estuary. The considerable size of Saint Lawrence River MA also allows one to study the effect of the Coriolis force on the stratified flow and the regularities in the forma tion of geostrophic current in the estuary. The MA of the Saint Lawrence River experiences considerable anthropogenic impact. In this context, much attention is paid to the environmental problems of the estuary, in particular, the transfer of pollutants and toxic substances by suspended sediment particles and the accumulation of such substances in bottom sediments. The paper considers the processes of interaction between fresh river and salt sea waters and sediment transport in the Saint Lawrence River estuary and can be of scientific interest for Russian experts. Thus, the processes of river and sea water mixing and sediment transport at the Enisey mouth, which belongs to del taic–estuarine type and has a stepwise bed profile [32], are similar, allowing one to compare water dynamics in those features. The objective of this study is to identify the main regularities in water and sediment dynamics in the macrotidal estuary with peculiar bed topography including a high bench. The main factual data were the published results of studies carried out in the estuary and the Gulf of Saint Lawrence [11–17, 19–22, 24–26, 28, 29, 33–39, 42], and studies [5, 7, 18, 31, 41] were used as the theoret ical basis for describing water circulation under the effect of tides. GEOGRAPHIC–HYDROLOGICAL CHARACTERISTIC OF RIVER BASIN AND THE COASTAL ZONE OF THE OCEAN The Hydrography of the River and Its Mouth Area The Saint Lawrence River, which was called in honor of saint Lawrence Roman, runs in the eastern North America in Canada in Quebec and Ontario provinces. In its upper reaches upstream of Cornwall, the river serves as a state boundary between Canada and the United States. The river originates from Lake Ontario and, throughout its length; it runs northeast ward to empty into the Gulf of Saint Lawrence in the Atlantic, where it forms an estuary. According to dif ferent sources, the length of the river is 1140–1200 km (the length of the entire water system from the source of the SaintLuis River, which empties into Lake Superior is 3100–4000 km) [2, 6, 10, 14, 37]. The area of the basin, according to different sources is 1.03– 1.60 million km 2 , of which, 40% belong to the drain age area of the Great Lakes [2, 6, 10, 14, 37]. The river drains the system of the Great Lakes in North America and discharges the excessive water into the ocean. Water and Sediment Dynamics at Saint Lawrence River Mouth E. N. Dolgopolova and M. V. Isupova Water Problems Institute, Russian Academy of Sciences, ul. Gubkina 3, Moscow, 119333 Russia Received February 8, 2010 Abstract—The main features of the hydrological regime and morphological structure of the estuarinetype mouth area of the Saint Lawrence River are considered. Data on the structure of water masses, thermal and ice regimes in the Gulf of Saint Lawrence, which has a significant effect on the estuary, are given. The major attention is paid to water mixing processes, water and sediment dynamics in the estuary under the joint effect of river runoff and tides, and as a function of bed topography. Estimates are given to a parameter that deter mines the type of water stratification and circulation. The effect of Coriolis force on the stratified flow in the estuary and the formation features of the geostrophic current is discussed. Keywords: estuary, gulf, currents, sea and DOI: 10.1134/S009780781104004X WATER RESOURCES AND THE REGIME OF WATER BODIES
-
Upload
independent -
Category
Documents
-
view
2 -
download
0
Transcript of Water and sediment dynamics at Saint Lawrence River mouth
ISSN 0097�8078, Water Resources, 2011, Vol. 38, No. 4, pp. 453–469. © Pleiades Publishing, Ltd., 2011.Original Russian Text © E.N. Dolgopolova, M.V. Isupova, 2011, published in Vodnye Resursy, 2011, Vol. 38, No. 4, pp. 422–438.
453
INTRODUCTION
Estuaries are semiclosed parts of river mouth areas.The main feature of estuaries is the presence of riverand sea water mixing under the conditions of highwater density gradients.
The mouth area (MA) of the Saint Lawrence Riveris of great interest for researchers, as this large mac�rotidal estuarine system has a peculiar longitudinalbed profile, which determines the formation of estua�rine circulation of different types of water in individualparts of the estuary and internal gravitation waves. Theestuarine circulation, in its turn, leads to the forma�tion of a zone with anomalously high concentration ofsuspended sediments in the upper part of the estuary.The considerable size of Saint Lawrence River MAalso allows one to study the effect of the Coriolis forceon the stratified flow and the regularities in the forma�tion of geostrophic current in the estuary.
The MA of the Saint Lawrence River experiencesconsiderable anthropogenic impact. In this context,much attention is paid to the environmental problemsof the estuary, in particular, the transfer of pollutantsand toxic substances by suspended sediment particlesand the accumulation of such substances in bottomsediments.
The paper considers the processes of interactionbetween fresh river and salt sea waters and sedimenttransport in the Saint Lawrence River estuary and canbe of scientific interest for Russian experts. Thus, theprocesses of river and sea water mixing and sedimenttransport at the Enisey mouth, which belongs to del�taic–estuarine type and has a step�wise bed profile[32], are similar, allowing one to compare waterdynamics in those features.
The objective of this study is to identify the mainregularities in water and sediment dynamics in themacrotidal estuary with peculiar bed topographyincluding a high bench.
The main factual data were the published results ofstudies carried out in the estuary and the Gulf of SaintLawrence [11–17, 19–22, 24–26, 28, 29, 33–39, 42],and studies [5, 7, 18, 31, 41] were used as the theoret�ical basis for describing water circulation under theeffect of tides.
GEOGRAPHIC–HYDROLOGICAL CHARACTERISTIC OF RIVER BASIN
AND THE COASTAL ZONE OF THE OCEAN
The Hydrography of the River and Its Mouth Area
The Saint Lawrence River, which was called inhonor of saint Lawrence Roman, runs in the easternNorth America in Canada in Quebec and Ontarioprovinces. In its upper reaches upstream of Cornwall,the river serves as a state boundary between Canadaand the United States. The river originates from LakeOntario and, throughout its length; it runs northeast�ward to empty into the Gulf of Saint Lawrence in theAtlantic, where it forms an estuary. According to dif�ferent sources, the length of the river is 1140–1200 km(the length of the entire water system from the sourceof the Saint�Luis River, which empties into LakeSuperior is 3100–4000 km) [2, 6, 10, 14, 37]. The areaof the basin, according to different sources is 1.03–1.60 million km2, of which, 40% belong to the drain�age area of the Great Lakes [2, 6, 10, 14, 37]. The riverdrains the system of the Great Lakes in North Americaand discharges the excessive water into the ocean.
Water and Sediment Dynamics at Saint Lawrence River MouthE. N. Dolgopolova and M. V. Isupova
Water Problems Institute, Russian Academy of Sciences, ul. Gubkina 3, Moscow, 119333 RussiaReceived February 8, 2010
Abstract—The main features of the hydrological regime and morphological structure of the estuarine�typemouth area of the Saint Lawrence River are considered. Data on the structure of water masses, thermal andice regimes in the Gulf of Saint Lawrence, which has a significant effect on the estuary, are given. The majorattention is paid to water mixing processes, water and sediment dynamics in the estuary under the joint effectof river runoff and tides, and as a function of bed topography. Estimates are given to a parameter that deter�mines the type of water stratification and circulation. The effect of Coriolis force on the stratified flow in theestuary and the formation features of the geostrophic current is discussed.
Keywords: estuary, gulf, currents, sea and
DOI: 10.1134/S009780781104004X
WATER RESOURCES AND THE REGIME OF WATER BODIES
454
WATER RESOURCES Vol. 38 No. 4 2011
DOLGOPOLOVA, ISUPOVA
Along with this system, the river serves as an importantnatural way connecting the internal parts of Canadaand the United States with the Atlantic. The majortributaries of the Saint Lawrence River are Oswe�gatchie, St. Regis, Richelieu (connected, upstream ofLake Champlain, by a canal with the Hudson R. in theUnited States), Saint�François, and Bécancour (righttributaries), Saint�Maurice, Batiscan, and Saguenay(left tributaries).
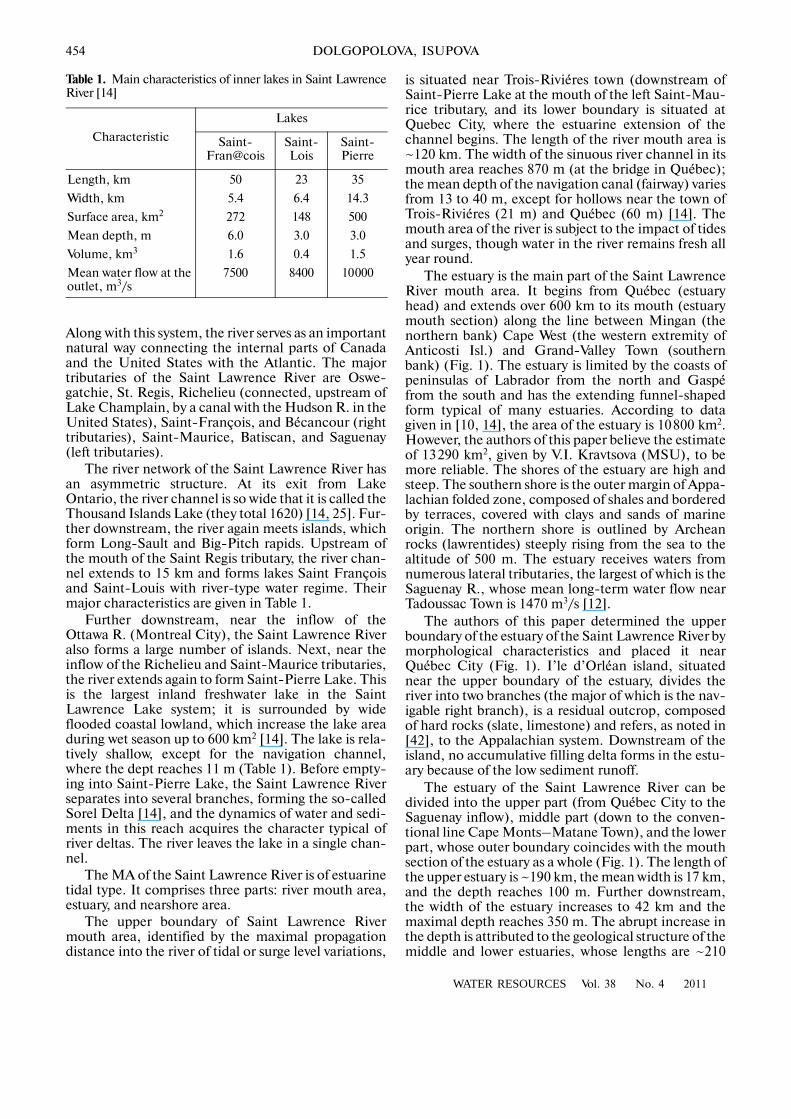
The river network of the Saint Lawrence River hasan asymmetric structure. At its exit from LakeOntario, the river channel is so wide that it is called theThousand Islands Lake (they total 1620) [14, 25]. Fur�ther downstream, the river again meets islands, whichform Long�Sault and Big�Pitch rapids. Upstream ofthe mouth of the Saint Regis tributary, the river chan�nel extends to 15 km and forms lakes Saint Françoisand Saint�Louis with river�type water regime. Theirmajor characteristics are given in Table 1.
Further downstream, near the inflow of theOttawa R. (Montreal City), the Saint Lawrence Riveralso forms a large number of islands. Next, near theinflow of the Richelieu and Saint�Maurice tributaries,the river extends again to form Saint�Pierre Lake. Thisis the largest inland freshwater lake in the SaintLawrence Lake system; it is surrounded by wideflooded coastal lowland, which increase the lake areaduring wet season up to 600 km2 [14]. The lake is rela�tively shallow, except for the navigation channel,where the dept reaches 11 m (Table 1). Before empty�ing into Saint�Pierre Lake, the Saint Lawrence Riverseparates into several branches, forming the so�calledSorel Delta [14], and the dynamics of water and sedi�ments in this reach acquires the character typical ofriver deltas. The river leaves the lake in a single chan�nel.
The MA of the Saint Lawrence River is of estuarinetidal type. It comprises three parts: river mouth area,estuary, and nearshore area.
The upper boundary of Saint Lawrence Rivermouth area, identified by the maximal propagationdistance into the river of tidal or surge level variations,
is situated near Trois�Riviéres town (downstream ofSaint�Pierre Lake at the mouth of the left Saint�Mau�rice tributary, and its lower boundary is situated atQuebec City, where the estuarine extension of thechannel begins. The length of the river mouth area is~120 km. The width of the sinuous river channel in itsmouth area reaches 870 m (at the bridge in Québec);the mean depth of the navigation canal (fairway) variesfrom 13 to 40 m, except for hollows near the town ofTrois�Riviéres (21 m) and Québec (60 m) [14]. Themouth area of the river is subject to the impact of tidesand surges, though water in the river remains fresh allyear round.
The estuary is the main part of the Saint LawrenceRiver mouth area. It begins from Québec (estuaryhead) and extends over 600 km to its mouth (estuarymouth section) along the line between Mingan (thenorthern bank) Cape West (the western extremity ofAnticosti Isl.) and Grand�Valley Town (southernbank) (Fig. 1). The estuary is limited by the coasts ofpeninsulas of Labrador from the north and Gaspéfrom the south and has the extending funnel�shapedform typical of many estuaries. According to datagiven in [10, 14], the area of the estuary is 10800 km2.However, the authors of this paper believe the estimateof 13290 km2, given by V.I. Kravtsova (MSU), to bemore reliable. The shores of the estuary are high andsteep. The southern shore is the outer margin of Appa�lachian folded zone, composed of shales and borderedby terraces, covered with clays and sands of marineorigin. The northern shore is outlined by Archeanrocks (lawrentides) steeply rising from the sea to thealtitude of 500 m. The estuary receives waters fromnumerous lateral tributaries, the largest of which is theSaguenay R., whose mean long�term water flow nearTadoussac Town is 1470 m3/s [12].
The authors of this paper determined the upperboundary of the estuary of the Saint Lawrence River bymorphological characteristics and placed it nearQuébec City (Fig. 1). I’le d’Orléan island, situatednear the upper boundary of the estuary, divides theriver into two branches (the major of which is the nav�igable right branch), is a residual outcrop, composedof hard rocks (slate, limestone) and refers, as noted in[42], to the Appalachian system. Downstream of theisland, no accumulative filling delta forms in the estu�ary because of the low sediment runoff.
The estuary of the Saint Lawrence River can bedivided into the upper part (from Québec City to theSaguenay inflow), middle part (down to the conven�tional line Cape Monts–Matane Town), and the lowerpart, whose outer boundary coincides with the mouthsection of the estuary as a whole (Fig. 1). The length ofthe upper estuary is ~190 km, the mean width is 17 km,and the depth reaches 100 m. Further downstream,the width of the estuary increases to 42 km and themaximal depth reaches 350 m. The abrupt increase inthe depth is attributed to the geological structure of themiddle and lower estuaries, whose lengths are ~210
Table 1. Main characteristics of inner lakes in Saint LawrenceRiver [14]
Characteristic
Lakes
Saint�Fran@cois
Saint�Lois
Saint�Pierre
Length, km 50 23 35
Width, km 5.4 6.4 14.3
Surface area, km2 272 148 500
Mean depth, m 6.0 3.0 3.0
Volume, km3 1.6 0.4 1.5
Mean water flow at the outlet, m3/s
7500 8400 10000
WATER RESOURCES Vol. 38 No. 4 2011
WATER AND SEDIMENT DYNAMICS AT SAINT LAWRENCE RIVER MOUTH 455
Labrador Pen. Strait of Belle�Isle
1625
Jacques Cartier Strait
Anticosti Isl.
Honguedo Strait. (Gaspé)
Gulf of St. Lawrence Newfoundland Isl.
Cabot Straitо�ва Мадлен
Gaspé Pen.
Prince Edward Isl. Cape Breton Island
0 50 100 km
2
2б
2в
14
61312
22
6
21
23
109
57
2417
15
184
8
ile d’Orléan isl.
Saguenay R.
Québec C.
Saint�Pierre L.
2а
1
1920
г. Труа�Ривьер
Montreal C.
St. Lawrence R.
11
3
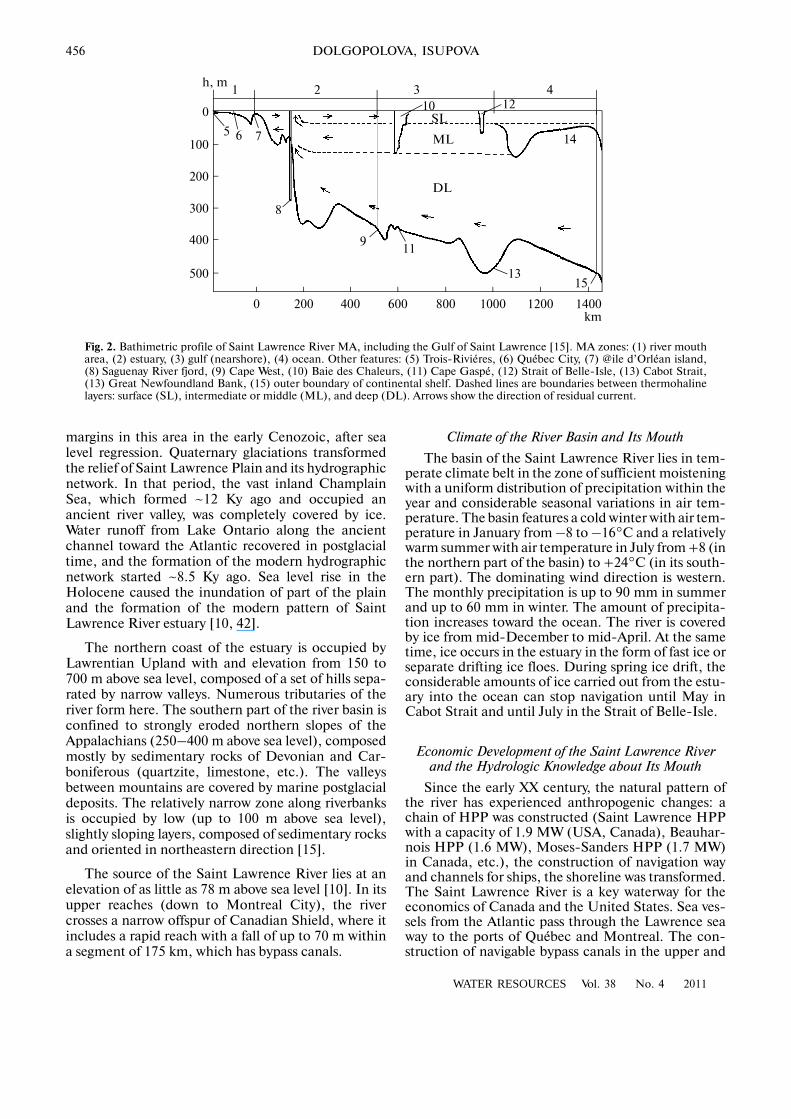
and ~200 km, respectively. The deep LaurentianChannel runs along the northern shore downstream ofthe Saguenay R. Inflow (Fig. 2). This channel, whichis an ancient valley of a river of tectonic origin and hasbeen deepend by a glacier [22], forms an arc 1000 kmlong through Honguedo Strait and the Gulf of SaintLawrence, along Cabot Strait toward the outer edge ofthe shelf.
Foreign researchers suggested somewhat differentzoning of the Saint Lawrence River estuary. Thus,Canadian authors divide it into the river, middle, andmarine estuaries [14, 15, 21, 22, 25, 28]. The riverestuary corresponds to the mouth river reach, identi�fied by the authors of this paper; the middle estuarycorresponds to the upper one, and the marine estuary,to the middle one. Canadian researchers generally donot include the lower estuary into the mouth area,which in our opinion is not justified.
The nearshore area of the Saint Lawrence Rivershould be assumed to be the entire Gulf of Saint
Lawrence (down to Cabot Strait), including its narrowwestern part—the straits of Jacques Cartier andHonguedo (Gaspé), washing Anticosti Island, and theeastern part—the straits of Belle�Isle (on the north)and Cabot (on the south (Fig. 1).
Geological Structure and Relief of the River Basin and Its MA
The valley of the Saint Lawrence River is situatedon a plain with the same name in a vast tectonic hollowat the boundary between the Appalachian Mountains(Adirondack and Notre Dame mountains) and Cana�dian Shield, which has an Archean basement here,composed of crystalline and metamorphic rocks(gneiss, crystalline limestone, and quartzite) and lev�eled by pre�Cambrian erosion. Sedimentary rockshave formed during Paleozoic marine transgressions,creating the basement of Saint Lawrence Plain. Rapidand deep incision of rivers took place on the shield
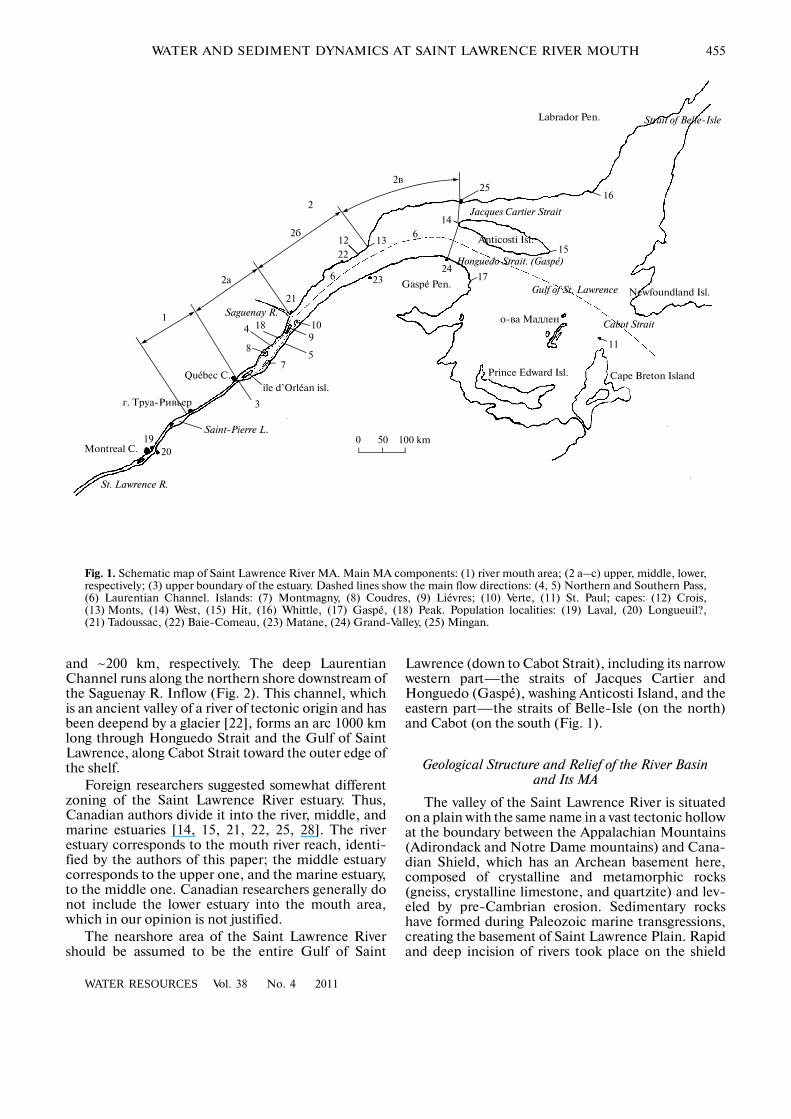
Fig. 1. Schematic map of Saint Lawrence River MA. Main MA components: (1) river mouth area; (2 a–c) upper, middle, lower,respectively; (3) upper boundary of the estuary. Dashed lines show the main flow directions: (4, 5) Northern and Southern Pass,(6) Laurentian Channel. Islands: (7) Montmagny, (8) Coudres, (9) Liévres; (10) Verte, (11) St. Paul; capes: (12) Crois,(13) Monts, (14) West, (15) Hit, (16) Whittle, (17) Gaspé, (18) Peak. Population localities: (19) Laval, (20) Longueuil?,(21) Tadoussac, (22) Baie�Comeau, (23) Matane, (24) Grand�Valley, (25) Mingan.
456
WATER RESOURCES Vol. 38 No. 4 2011
DOLGOPOLOVA, ISUPOVA
margins in this area in the early Cenozoic, after sealevel regression. Quaternary glaciations transformedthe relief of Saint Lawrence Plain and its hydrographicnetwork. In that period, the vast inland ChamplainSea, which formed ~12 Ky ago and occupied anancient river valley, was completely covered by ice.Water runoff from Lake Ontario along the ancientchannel toward the Atlantic recovered in postglacialtime, and the formation of the modern hydrographicnetwork started ~8.5 Ky ago. Sea level rise in theHolocene caused the inundation of part of the plainand the formation of the modern pattern of SaintLawrence River estuary [10, 42].
The northern coast of the estuary is occupied byLawrentian Upland with and elevation from 150 to700 m above sea level, composed of a set of hills sepa�rated by narrow valleys. Numerous tributaries of theriver form here. The southern part of the river basin isconfined to strongly eroded northern slopes of theAppalachians (250–400 m above sea level), composedmostly by sedimentary rocks of Devonian and Car�boniferous (quartzite, limestone, etc.). The valleysbetween mountains are covered by marine postglacialdeposits. The relatively narrow zone along riverbanksis occupied by low (up to 100 m above sea level),slightly sloping layers, composed of sedimentary rocksand oriented in northeastern direction [15].
The source of the Saint Lawrence River lies at anelevation of as little as 78 m above sea level [10]. In itsupper reaches (down to Montreal City), the rivercrosses a narrow offspur of Canadian Shield, where itincludes a rapid reach with a fall of up to 70 m withina segment of 175 km, which has bypass canals.
Climate of the River Basin and Its Mouth
The basin of the Saint Lawrence River lies in tem�perate climate belt in the zone of sufficient moisteningwith a uniform distribution of precipitation within theyear and considerable seasonal variations in air tem�perature. The basin features a cold winter with air tem�perature in January from –8 to –16°C and a relativelywarm summer with air temperature in July from +8 (inthe northern part of the basin) to +24°C (in its south�ern part). The dominating wind direction is western.The monthly precipitation is up to 90 mm in summerand up to 60 mm in winter. The amount of precipita�tion increases toward the ocean. The river is coveredby ice from mid�December to mid�April. At the sametime, ice occurs in the estuary in the form of fast ice orseparate drifting ice floes. During spring ice drift, theconsiderable amounts of ice carried out from the estu�ary into the ocean can stop navigation until May inCabot Strait and until July in the Strait of Belle�Isle.
Economic Development of the Saint Lawrence River and the Hydrologic Knowledge about Its Mouth
Since the early XX century, the natural pattern ofthe river has experienced anthropogenic changes: achain of HPP was constructed (Saint Lawrence HPPwith a capacity of 1.9 MW (USA, Canada), Beauhar�nois HPP (1.6 MW), Moses�Sanders HPP (1.7 MW)in Canada, etc.), the construction of navigation wayand channels for ships, the shoreline was transformed.The Saint Lawrence River is a key waterway for theeconomics of Canada and the United States. Sea ves�sels from the Atlantic pass through the Lawrence seaway to the ports of Québec and Montreal. The con�struction of navigable bypass canals in the upper and
0
100
200
300
400
500
1400120010008002000 600400
h, m1 2 3 4
5 6 7
8
911
1315
14
10 12SL
ML
DL
km
Fig. 2. Bathimetric profile of Saint Lawrence River MA, including the Gulf of Saint Lawrence [15]. MA zones: (1) river moutharea, (2) estuary, (3) gulf (nearshore), (4) ocean. Other features: (5) Trois�Riviéres, (6) Québec City, (7) @ile d’Orléan island,(8) Saguenay River fjord, (9) Cape West, (10) Baie des Chaleurs, (11) Cape Gaspé, (12) Strait of Belle�Isle, (13) Cabot Strait,(13) Great Newfoundland Bank, (15) outer boundary of continental shelf. Dashed lines are boundaries between thermohalinelayers: surface (SL), intermediate or middle (ML), and deep (DL). Arrows show the direction of residual current.
WATER RESOURCES Vol. 38 No. 4 2011
WATER AND SEDIMENT DYNAMICS AT SAINT LAWRENCE RIVER MOUTH 457
middle reaches of the river made it possible for ships topass into the Great Lake system (up to Lake Superior).Nowadays, the guaranteed depth in the navigationcanal is 12.5 m downstream of Québec, 10.7 mupstream of Québec City up to Deschaillons Town,11.3 m near Montreal City, and 8.2 m upstream ofMontreal City [14].
Dredging operations with the withdrawal of>90000 m3 of sand per year are carried out in the upperestuary to maintain the navigation depths in the navi�gation canal running first along the southern shore of@Ile d’Orléan island, next along the northern shore ofthe estuary (the Northern Passage) (Fig. 1) [20]. About20 000 m3 of the dredged sand are discharged in theSouthern Passage, an operation that may have a nega�tive effect on the young of Atlantic and lake sturgeoninhabiting this area [20].
The very rich natural resources (land, forest, fish,etc.), the huge freshwater reserves, and the good con�nection with the ocean facilitate the concentration ofpopulation and intense economic development ofSaint Lawrence River basin. Now, more than 11% ofNorth American population is concentrated here andlarge industrial centers are situated in the area: Chi�cago, Detroit, Cleveland (USA), Montreal (Canada).Grain and cattle�breeding agriculture is widely devel�oped in the Canadian part of the basin. Cities and largetowns on the banks of the Saint Lawrence River gen�erally have ports: Ogdensburg (USA), Kingston,Montreal, Laval, Sorel, Trois�Riviéres, and Québec(Canada).
Studies of Saint Lawrence River MA were began in1931–1939 by experts of Laval University (Québec,Canada). Later, Bedford Institute of Oceanography(Durtmouth, New Scotland); Oceanographic Divi�sion, University of Quebec (Rimouski), HydrographicService of Canada, Marine Science Center, McGillUniversity (Montreal); National Research Council,Canada. Several gauging stations are functioning onthe Saint Lawrence River and its main tributary—theOttawa, including Cornwall, Carillon dam, LaSalle,Saint�François, Québec, etc. A network of stations arein operation in the Gulf of Saint Lawrence, includinga gage on St. Paul Island, where tidal variations inwater level in the gulf are measured. Data of measure�ments collected at these gauges are published in yearlyreports on the oceanographic conditions in the gulf[17].
The Hydrological Regime of the Saint Lawrence River
Water balance in river basin. Water balance compo�nents in the Saint Lawrence River basin (with the areaassumed to be 1.29 million km2) are as follows: precip�itation is 1036 mm (1336 km3/year), runoff is 340 mm(439 km3/year), evaporation accounts for 696 mm(898 km3/year), the runoff coefficient is 0.33 [6].According to data given in [2], the runoff coefficient is
0.26, which in our opinion is a considerable underes�timation.
Water flow. The Saint Lawrence River receivesmixed nutrition (snow and rain). The mean water flowat the exit from Lake Ontario is 6750 m3/s(212 km3/year); it increases to 7350 m3/s(232 km3/year) near Cornwall gauging station. Themaximal river water flow at this gauging station aver�ages 10000, and the minimal one averages 4500 m3/s[27]. At the upper boundary of the estuary (Québecgauging station), the mean water discharge is 11300–12000 m3/s (357–379 km3/year) [12, 15, 33]; towardthe mouth of the estuary, it increases (because of lat�eral inflow) to 14400 (454) [21] in median years and to16800 m3/s (530 êm3/year) in wet years [14]. Theabove data on water flow in the Saint Lawrence Riverdiffer from those given by other authors 320 [2], 349[6], 450 km3/year [37]. In our opinion, the valuesgiven in 2 are underestimations (as well as the runoffcoefficient), while the runoff value given in [37] isoverestimation. The authors of this paper, based ondata from [12], evaluated the mean long�term waterflow in the estuary head over 1955–1999 at 12000 m3/s(379 km3/year) (Table 2).
Water flow in the Ottawa River, the largest tributaryof the Saint Lawrence River, varies from 306 (low�water period) to 8190 m3/s (flood), depending on thephase of water regime [14, 27].
In the long�term variations in water abundance inthe Saint Lawrence River since the 1930s, high�waterand low�water periods with a length of about 30 yearscan be identified [14]. In the most water�abundantyears, the mean maximal water flow at Sorel gaugingstation, located upstream of Saint�Pierre Lake, was19700 (1943) and 20 300 m3/s (1976), while in low�water years, it was 6600 (1934), 6100 (1965) and7000 m3/s (2001).
Water flow is controlled by the Great Lakes and achain of HPPs including six dams on the SaintLawrence River and the Carillon dam on the Ottawatributary upstream of its emptying into the main river.
The within�year distribution of river water flow inestuary head (Québec City) is relatively uniform(Table 2). An increase in water flow (up to~17000 m3/s with a maximal value of 23700 m3/s(1976)) in April–May is due to snow melting on thewatershed; the ratio of April and May water flow valuesto the mean annual value is 1.3–1.4. These monthstaken together account for ~22.7% of the annual run�off, while the shares of other months vary from 7.2 to8.6%. Variations in river water flow within each monthcan be even wider, depending on synoptic conditionsand level variations in the Great Lakes [40].
River runoff regulation caused a decrease in waterlevel variations in inner lakes during the year. Thus,within�year variations in water level in Saint�FrançoisLake under the conditions of natural water regimereached 0.50 m, while now they are 0.15 m [17].
458
WATER RESOURCES Vol. 38 No. 4 2011
DOLGOPOLOVA, ISUPOVA
The runoff of sediments and dissolved solids. Sus�pended sediment concentration in the Saint LawrenceRiver upstream of Saint�Pierre Lake varies within 4–10 mg/l [15]. Water turbidity increases in the moutharea, reaching 30–50 mg/l near Québec City. Overall,the estimated sediment runoff in the estuary head ofthe Saint Lawrence River varies from 1.1 [16] to 4.0–6.9 million t/year [14, 15, 37], of which the riveraccounts for 68%, 19% are due to sediment inflowfrom southern tributaries (Chateauguay, Richelieu,Yamaska, Saint�François, Nicolet, Chaudiére, etc.),and 13% are due to the inflow from the northern trib�utaries (Otawa, Assomption, Saint�Maurice, Batis�can, Sainte�Anne, Jacques Cartier, etc.) [14]. The rel�atively low value of sediment runoff (a characteristicfeature of the Saint Lawrence River) is attributed tothe regulating role of the Great Lakes and the specificfeatures of the geological structure of the river basin.
The river’s bed is mostly composed of sand, finesand (or “limons”), and clays, overlain by gravel inriver reaches with rapid flow. The size of sand sedimentparticles decreases downstream the river [15].
The Saint Lawrence River has three major zones ofsediment accumulation—these are inner lakes. Sedi�ment deposition in the river takes place beyond thenavigation canal, where flow velocities and depth arenot greater than 0.3 m/s and 4.5 m, respectively. Themajor erosion zones are concentrated in the middlereach of the river and mostly confined to canals (Beau�harnois (upstream of Montreal City), etc.) [15].
By its chemistry, water of the Saint Lawrence Riveris classified as hydrocarbonate; mean water mineral�ization is 160 mg/l, and the total runoff of dissolvedsolids into the ocean is 62 million t/year [6, 37]. Thechemical denudation in Saint Lawrence River basin is92.5 thous. t/km2 per year or, for the basin as a whole(including the Great Lakes system) 70.56 milliont/year.
Hydrological Regime of the Coastal Zone of the Ocean
The Gulf of Saint Lawrence (a vast nearshore areaof the river) is bounded by the shores of Labrador Pen�insula, Newfoundland and Cape Breton islands, andNova Scotia and New Brunswick peninsulas; it is con�nected on the west through Jacques Cartier andHonguedo straits, which are parts of the gulf, with theestuary of the Saint Lawrence River and with theNorthern Atlantic on the east by the Strait of Belle�Isle (between Labrador Peninsula and Newfoundland
Island) and Cabot Strait (between Newfoundland andCape Breton islands).
According to different data, the area of the Gulf ofSaint Lawrence is 150 [10], 226 [14], and 247 thous.km2 [15]; the mean depth is >500 m, the maximaldepth is 800 m [10, 14]. However, the first value clearlyis underestimated, and the latter one includes the areaof the lower estuary of the Saint Lawrence River. Thecoastline of the gulf is very indented. The gulf has sev�eral large islands (Anticosti, Prince Edward, CapeBreton, the Mingan Archipelago, etc.). The bed of thegulf is a submarine continental platform (shelf plain)in the occurrence zone of pre�Cenozoic structures; itis overlain by terrigenous deposits (silts, aleurolites).The bed along the shore is mostly composed of sandswith the predominance of fractions 1.0–0.1 mm. Thenorthern coast of the gulf, which features no signifi�cant changes by the sea, has been formed by subaerialand tectonic processes. Contrary to that, the southern,abrasion–accumulative bight shore has been formedby wave processes [1]. Studies of sand transport nearthe southern coast of the bay near Prince EdwardIsland showed that storms erode the seaward slope ofthe barrier bar existing in this area [30]. The increasein water level under the effect of waves caused bynorthern and northeastern winds during 1.5–2 days is~ 35 cm [30].
The Gulf of Saint Lawrence is situated in the mon�soon area of temperate climate zone. Its climate fea�tures a cold winter with lower air humidity and a coolhumid summer. Air temperature at the gulf surface is–12 to –6°C in January (with the minimum of⎯20°C) and +12 to +16°C (with the maximum of+28°C) in July. Temperature variations during a yearreach 26–28°C. In period 1880–2000, the mean airtemperature above the gulf was found to increase from–0.3 to +0.5°C [17]. The mean monthly water tem�perature on the gulf surface varies from 0 (January–April) to +113°C (August); during the warm season(May–October), air temperature is on the average 2°Chigher than water temperature in the surface layer ofthe gulf; however, surface water layer in the bay iswarmer than the air by 2–4°C in the cold season(November–March) and by 10°C during freeze�upperiod. The within�year distribution of precipitation isrelatively uniform with an insignificant peak in wintermonths (November–February). The total annual pre�cipitation is ~1000 mm [1].
Winds of northwestern direction with a mean speedof 3–5 m/s dominate in the cold season. The recur�
Table 2. Within�year distribution of water flow in the Saint Lawrence River at the upper boundary of the estuary atQu@ebec City in 1955–1999 according to [12]
Characteristic Jan. Feb. Mar. Apr. May June July Aug. Sept. Oct. Nov. Dec Year
Q, m3/s 10700 10700 12000 16800 15800 12400 11300 10600 10400 10900 11400 11100 12000
Q, % 7.4 7.4 8.3 11.7 11.0 8.6 7.8 7.4 7.2 7.6 7.9 7.7 100

WATER RESOURCES Vol. 38 No. 4 2011
WATER AND SEDIMENT DYNAMICS AT SAINT LAWRENCE RIVER MOUTH 459
rence of winds with a speed of 16 m/s and more in thistime never exceeds 10%. The direction of windschanges to south�southwestern (3–5 m/s) in the sum�mer. In rare cases, tropic cyclones from the Gulf ofMexico can reach the Gulf of Saint Lawrence.
The area of the Atlantic adjacent to Cabot Strait isamong the southernmost sites in the Northern Hemi�sphere where ice forms on water. The Gulf of SaintLawrence often becomes covered with compact ice(e.g., in 2000 [17]), which covers the largest area byearly March. An anomalous drop in mean air temper�ature by 1°C in March 2003 caused an appreciable (ascompared with the mean value over 1971–2000)increase in ice cover area to 190000 km2 [17], i.e., thegulf was almost completely covered by ice. The volumeof ice transferred to the shelf through Cabot Strait inthe spring of 2003 reached the maximal value, equal tothat recorded earlier in 1941. The mean boundary ofice cover propagation into the ocean over the period of1962–1987 runs southeast of the line connecting theislands of Cape Breton and Newfoundland, and thattoward the Saint Lawrence River, runs near the lowerboundary of the middle estuary at Cape Monts.
Ice formation begins in December in the northernpart of the gulf. Individual ice floes may be transferredsouthward by northern and northwestern windstoward Cabot Strait and further into the ocean, wherethey accumulate on the shelf of Nova Scotia [19, 23].Pressed to the shore, ice accumulations form a benchand protect the shore against abrasion during winterstorms, when the dominating winds blow landward.
A characteristic feature of the Gulf of SaintLawrence is the existence of a cold intermediate layerin the water mass throughout the summer (Fig. 2). Thegulf water mass can be divided into four layers: a warmsurface layer (0–30 m) with water temperature in Julyvarying from 8 to 12°C; a cold intermediate layer (30–100 m); a transitional layer (100–200 m); and a rela�tively warm salt deep layer (200–300 m). The minimalten�say water temperature in the intermediate layervaries from –1 to +1°C [26]. The authors of [26] men�tion a rise in the minimal temperature of the interme�diate layer by 0.6°C in 1999 relative to 1988. However,its value remained below the mean long�term value(0.02°C over 1961–1990). A tendency toward temper�ature rise persisted in 2000, when the temperature ofthe intermediate layer increased by 0.15°C more and,for the first time since 1983, exceeded the meanannual value over 1961–1990 [17].
Flood tidal barotropic wave penetrates into theGulf of Saint Lawrence from the Northern Atlanticthrough Cabot and Belle�Isle straits. The tide is ofirregular, semidiurnal type. The magnitude of theflood tide increases toward the shore from 1.0 to 2.1 mat the northern and to 3 m at the southern coast. AtAnticosti Island, flood tide magnitude is 1 m duringneap tide and 2 m during spring tide. Water salinity ongulf surface never exceeds 30°.
A major portion of water volume entering the gulffrom the Saint Lawrence estuary through HonguedoStrait moves along the southern coast. Next the cur�rent divides into two branches moving in the directionsof Cabot and Belle�Isle straits. At the same time, mar�ginal branches of the cold alongshore Labrador cur�rent penetrate through Cabot Strait and, to a lesserextent, through the Strait of Belle�Isle into the Gulf ofSaint Lawrence, where they become involved in gen�eral water circulation in the gulf.
HYDROLOGICAL PROCESSESIN THE MOUTH AREA OF THE SAINT
LAWRENCE RIVER
Tide Propagation into the Estuary and over the Mouth Area of the River
Tides penetrate into Saint Lawrence River MA upto Trois�Riviéres City (the maximal distance duringspring tide in low�flow period).
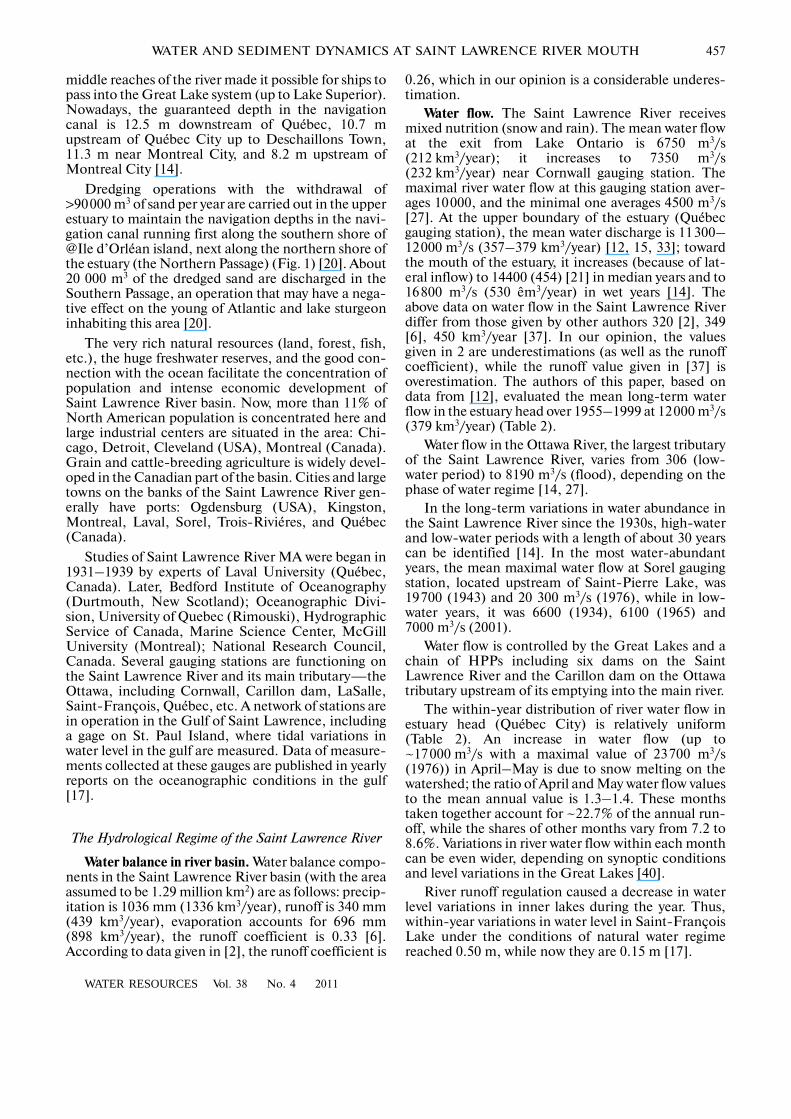
When penetrating into the Gulf of Saint Lawrence,the tidal wave moves toward estuary head, and the tideheight increases in the same direction (Fig. 3). Thetide height is 1–2 m at the eastern extremity of Anti�costi Island in the gulf, it increases to 4.2 m at theboundary between the middle and lower estuary, andreaches 4.9 m during spring tide and 2.8 m during neaptide in estuary head (Québec City) [11]. The maximaltide magnitude of up to 5.0–7.5 m was recorded atSaint�François gauging station [1, 28] on the south�eastern extremity of @ile d’Orléan island. The velocityof the flood tidal current in the estuary may reach 2–3 m/s. In the mouth reach of the river upstream ofQuébec City, tidal level variations and current velocityrapidly decrease because of the effect of friction at thebed. Near Trois�Riviéres Town, maximal tidal varia�tions in water level never exceed 0.2 m.
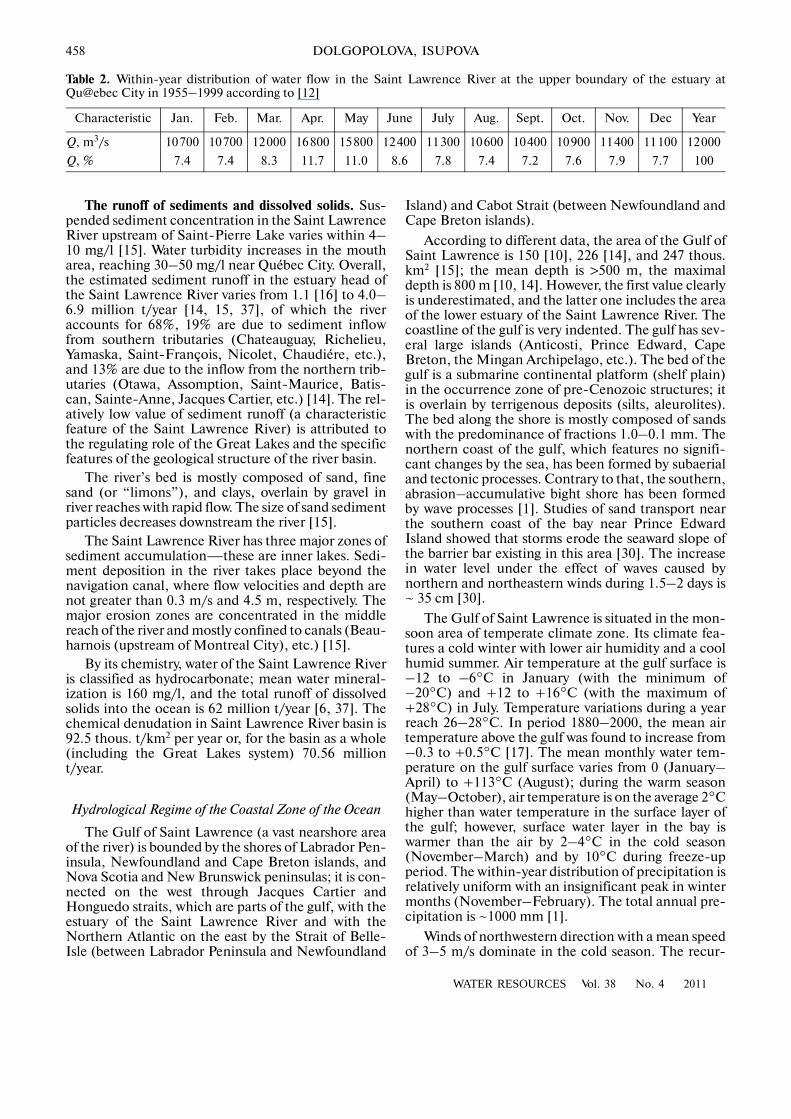
The results of measuring current velocity in theupper estuary during different tidal phases described in[13] were obtained north of @Ile�aux�Liévres island~20 km upstream of Saguenay River mouth and~125 km downstream of @ile d’Orléan island (Fig. 1).The vertical profiles of flow velocity exemplified inFig. 4 suggest the formation of a two�layer current inall tidal phases except for periods 1 h before the highwater (HW) and 2 h before the low water (LW) [13].
Depending on the phase of the spring–neap cycle,the Saint Lawrence estuary passes through four majorstages of water circulation [33]: complete filling(within 3 days after full or change); water level drop,accompanied by the highest flow velocities in thelower estuary along Gaspé Peninsula (3–4 days beforethe first or last phase of the moon); low water (3 daysafter the first or last phase of the moon); filling of theestuary (3–4 days before full or change). The residual(averaged over the tidal cycle) current is directedtoward the river in the first and fourth phases and

460
WATER RESOURCES Vol. 38 No. 4 2011
DOLGOPOLOVA, ISUPOVA
toward the gulf during the second and third phases.This current deviates toward the southern shore in thelower estuary. However, the residual current along thesouthern shore of the estuary (the so�called Gaspécurrent) is directed toward the gulf during all circula�tion phases.
The bench formed by the Laurentian Channel andthe mouth (fjord) of the Saguenay River affects thestratified tidal current and contributes to the forma�tion of water circulation, accompanied by inner waves(or inner tides) [20]. During the flood phase, coldwater from deep layers flows over the bench and, as itis gravitaionally unstable with respect to the ambientwater, it sinks to the bed and enters the middle estuaryand the Saguenay River mouth.
Intrusion of Saline Water into the Estuary
By the character of mixing of river and sea waterand the degree of salinization, the estuary of the SaintLawrence River can be referred to the group of “nor�mal” or “classical” estuaries, in which water runoff
and precipitation exceed evaporation losses, freshwater freshens sea water, and water salinity steadilydecreases along the estuary toward the river. The largedepth of the middle and lower estuary and relativelyhigh flood tides also facilitate seawater intrusions intothe estuary. The upper boundary of saline water intru�sion into the Saint Lawrence estuary shifts dependingon river water flow and the character of tide (its mag�nitude, phase, and spring–neap cycle) [13].
Variations in water salinity in the estuary during atidal cycle are shown in [11] as reflected in the positionof 32.5‰ isohaline near the inflow of the SaguenayRiver. At HW, the position of 32.5‰ isohaline is min�imal—at a depth of 20–25 m. Next, during ebb tide,the depth of this isohaline gradually decreases, reach�ing its maximum of 75 m at LW. At this time, the ver�tical flow velocities, directed toward the bed (positive)gradually increase and reach their maximal values(2.2 mm/s) 4 h after HW. The reverse process takesplace during flood tide: the 32.5‰ isohaline shiftstoward the surface with a mean vertical velocity of 2.3mm/s (it is maximal 2–3 h before HW). When tidechanges from neat to spring, the vertical velocity gra�dient increases almost twice [11].
In the warm season, the upper boundary of salinewater intrusion in the estuary runs near the easternextremity of @ile d’Orl@ean island and moves within20 km, depending on the tidal phase [25]. Within theupper estuary, the mean water salinity on the surfaceincreases from 0.1 (the upper boundary of the estuary)to 18–26 (Saguenay river mouth) [25], and watersalinity at the bed can reach 20–30‰ [41]. In themiddle and lower estuary, water salinity on the surfacevaries from 28 to 32, depending on the season, andincreases with depth to 33–35‰ (water salinity in thegulf) [41].
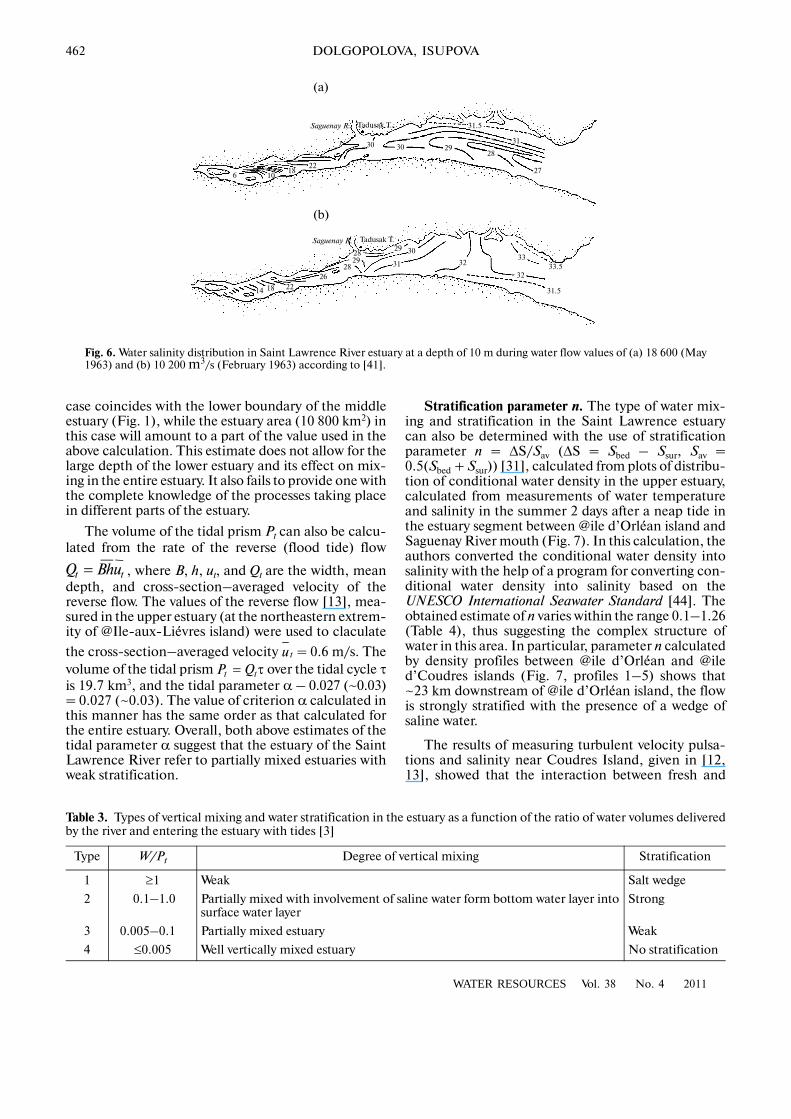
Penetrating into the upper estuary, saline waterforms a considerable longitudinal salinity gradient inboth surface and bottom water layers in the areabetween @ile d’Orléan and @ile d’Coudres islands(Figs. 5, 6). In the area between @ile d’Orléan island
H, m6
4
2
0 2000 4000 6000 8000 10000 12000 14000Time, min
2
1
Fig. 3. Tidal variations in water level (1) in the Gulf of Saint Lawrence (St. Paul Island) and (2) at Québec gauging station onMarch 15–23, 2009.
–3 –2 –1 0 1 2u, m/s
10
20
30
40
50
60
1
2
3
4
h, m
5
Fig. 4. Vertical profiles of flow velocities measured in theNorthern Passage at @Ile�aux�Liévres island during tidalcycle: (1) 1 h before HW, (2) 2 h after HW, (3) 3 h after HW,(4) 2 h before LW, (5) 3 h after LW [13].

WATER RESOURCES Vol. 38 No. 4 2011
WATER AND SEDIMENT DYNAMICS AT SAINT LAWRENCE RIVER MOUTH 461
and Montmagny Archipelago, water salinity in thewarm season does not exceed 2–3 on the surface and4–6‰ at the bed (Figs. 5, 6a). In winter, at lower riverwater flow, water salinity in the bottom layer in thisarea increases to 6–10‰ (Fig. 6b). Seaward fromCoudres Island, water in the estuary is saline and theeffect of fresh water can be seen only near the inflow oftributaries into the estuary [15].
Vertical Mixing and Water Stratification in the Estuary
The types of water mixing and stratification in atidal river mouth depend on the ratio between the run�off volumes of fresh W and sea Pt water entering theestuary during flood tide [3, 7, 9, 43].
The determining of parameter W/Pt, which is usedto classify estuaries, is approximate; however, it givesan insight into the process of sea and river water mix�ing in the estuary (Table 3).
To determine the type of water mixing and stratifi�cation in Saint Lawrence estuary, one has to take intoaccount the specific longitudinal profile of the bed andthe character of zoning of the estuary. Some research�ers [39] conventionally divide the upper and middleestuary into three segments. The first segment, ~40 kmin length lies in the upper estuary between @iled’Orléan and @ile d’Coudres islands, where the rela�tively small width (2–8 km) and mean depth(<10 m)of the estuary facilitate complete water mixing.
In the second segment, whose lower boundarycoincides with the lower boundary of the upper estu�ary, the width and depth of the estuary increase to 15km and 50–150 m, respectively. A two�layer flowforms here during the tidal cycle, and this part of theestuary can be classified as a partially mixed estuarywith involvement (Table 3) [3].
Involvement is the net vertical transfer of a salinewater mass, resulting from the collapsing of the crestsof inner waves separating from the interface betweenthe upper (freshened) and lower (saline) layers. Riverwater motion in the upper layer of the estuary above astrong tidal current, creating a shift in the shear stressat the interface between the layers and leading to theformation of periodically forming and collapsing innerwaves, was examined by Canadian researchers with theuse of echosounding in different tidal phases in theupper estuary at the eastern extremity of @Ile�aux�Liévres island [12].
In the third segment, seaward from a rapid on theSaguenay River (the middle estuary), water mixing inthe flow, which is already strongly stratified, has thecharacter of a “wedge” of saline water.
Since, as it was mentioned above, the zoning ofSaint Lawrence River MA and the denotations of themarine boundary of the estuary, which are given in thispaper, differ from those given in the literature, theauthors of this paper used various quantitative charac�
teristics and criteria to determine the type of water ver�tical mixing and stratification in the estuary.
Simmons criterion α. The type of vertical mixing ofriver and sea water in an estuary can be determinedwith the help of formulas involving mean characteris�tics of the estuary [7]: , and (F isthe area of the estuary, ΔH is mean tide magnitude).Using data given in [12], the authors evaluated thenormal annual water flow in the Saint Lawrence Riverover 1955–1999, obtaining 12 thous. m3/s (Table 2).Thus, within a tidal cycle (12 h 25 min), the rivers ofSaint Lawrence and Saguenay on the average dis�charge a water volume of W = 0.54 km3 into the estu�ary.
The volume of the tidal prism Pt can be evaluated bytwo methods: first, by using the values of area F and thetide ΔH, and second, by evaluating the volume ofwater passing through estuary cross�section during thereverse current, given the results of measurements ofits velocity ut.
If we take the area of the Saint Lawrence estuary toequal 13 290 km2 (according to improved data of V.N.Kravtsova), and the tide magnitude ΔH to equal 1–2m, the variation range of Pt will be 13.3–26.6 km3, andthe value of the tidal criterion α will be 0.02–0.04.Thus, the entire estuary of the Saint Lawrence Rivercan be referred to partially mixed estuaries with a weakstratification (Table 3).
The estimate of the volume of tidal prism is veryapproximate, because it is strongly dependent on thechoice of the boundary between the estuary and thegulf. For example, in [17], the division of the estuary iscarried out taking into account the longitudinal bedprofile, and the seaward boundary of the estuary in this
tW Pα = tP F H= Δ
Monts C
Baie�Comeau T.
Matane T.
Rimuski T.
Trois�Pistoles T.
Verte Isl.Riviére�du�Loup T.
Saguenay R
Coudres Isl.
@ile d’Orléan isl.St. Lawrence R.
222426
27 2624
2823
2524
2324
2016
10
2221181412
864
2
Fig. 5. Water salinity, ‰, in the surface layer of the upperand middle estuary of the Saint Lawrence River accordingto [15].
462
WATER RESOURCES Vol. 38 No. 4 2011
DOLGOPOLOVA, ISUPOVA
case coincides with the lower boundary of the middleestuary (Fig. 1), while the estuary area (10 800 km2) inthis case will amount to a part of the value used in theabove calculation. This estimate does not allow for thelarge depth of the lower estuary and its effect on mix�ing in the entire estuary. It also fails to provide one withthe complete knowledge of the processes taking placein different parts of the estuary.
The volume of the tidal prism Pt can also be calcu�lated from the rate of the reverse (flood tide) flow
, where B, h, ut, and Qt are the width, meandepth, and cross�section–averaged velocity of thereverse flow. The values of the reverse flow [13], mea�sured in the upper estuary (at the northeastern extrem�ity of @Ile�aux�Liévres island) were used to claculate
the cross�section–averaged velocity = 0.6 m/s. Thevolume of the tidal prism over the tidal cycle τis 19.7 km3, and the tidal parameter α – 0.027 (~0.03)= 0.027 (~0.03). The value of criterion α calculated inthis manner has the same order as that calculated forthe entire estuary. Overall, both above estimates of thetidal parameter α suggest that the estuary of the SaintLawrence River refer to partially mixed estuaries withweak stratification.
t tQ = Bhu
tu
t tP Q= τ
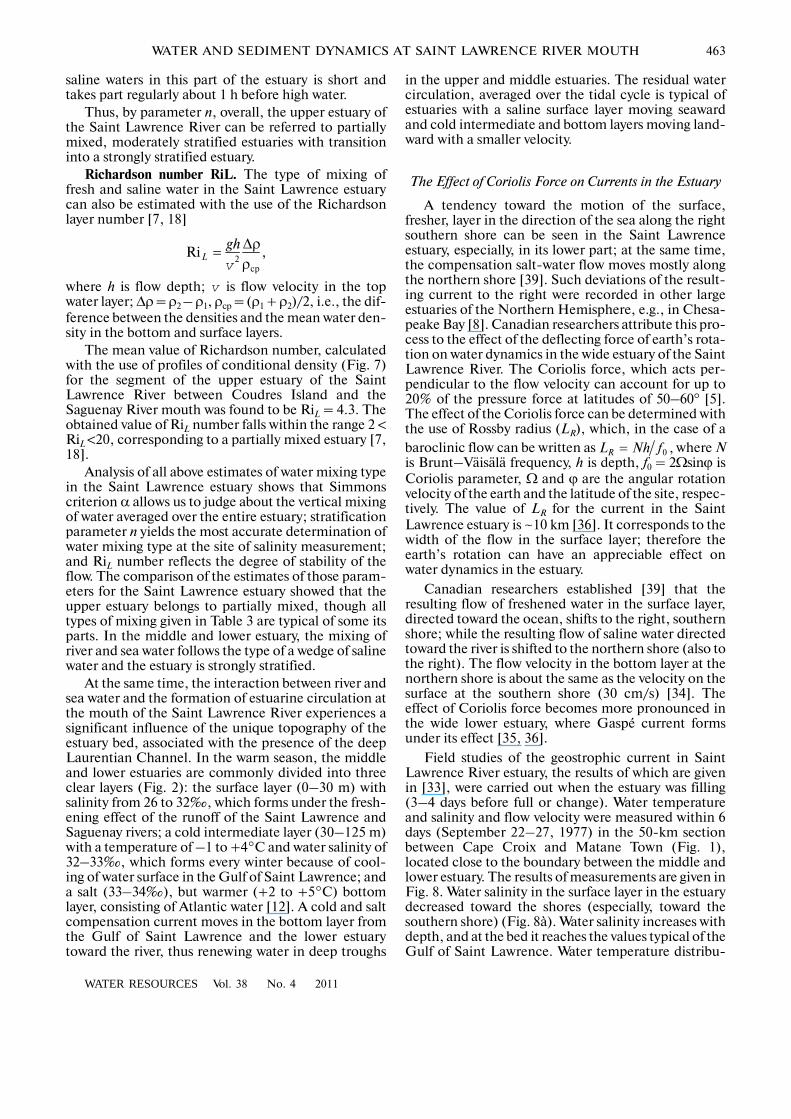
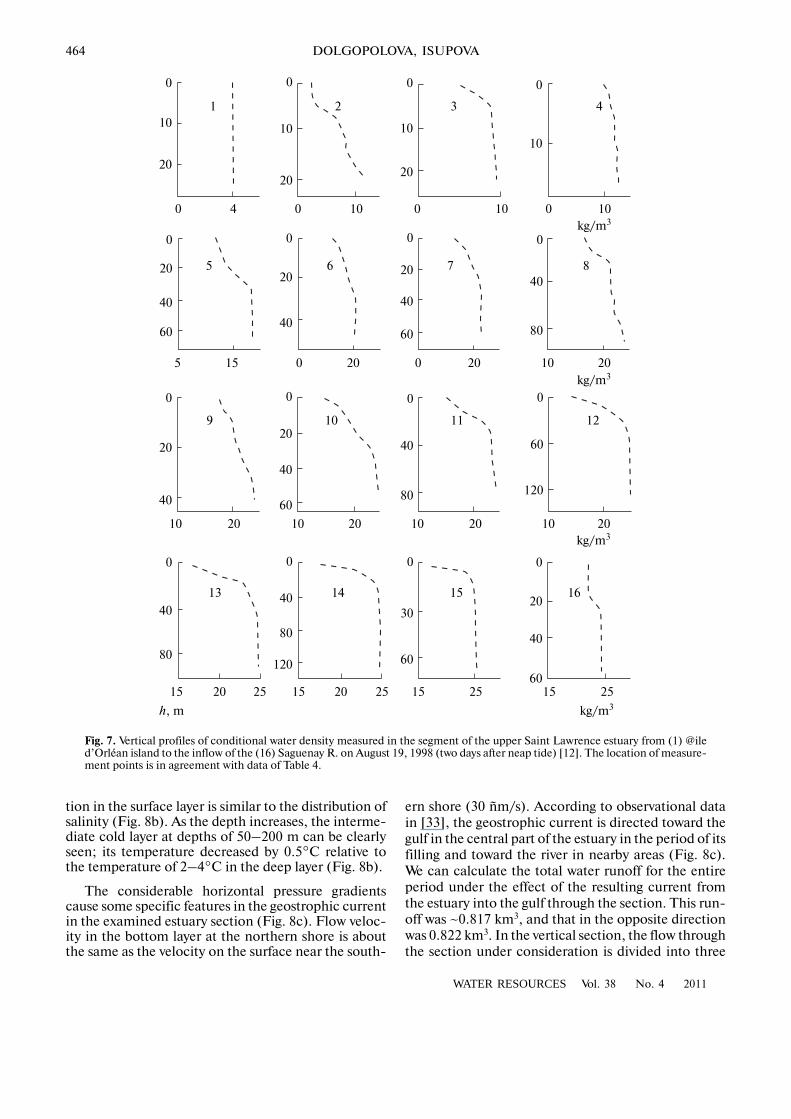
Stratification parameter n. The type of water mix�ing and stratification in the Saint Lawrence estuarycan also be determined with the use of stratificationparameter n = ΔS/Sav (ΔS = Sbed – Ssur, Sav =0.5(Sbed + Ssur)) [31], calculated from plots of distribu�tion of conditional water density in the upper estuary,calculated from measurements of water temperatureand salinity in the summer 2 days after a neap tide inthe estuary segment between @ile d’Orléan island andSaguenay River mouth (Fig. 7). In this calculation, theauthors converted the conditional water density intosalinity with the help of a program for converting con�ditional water density into salinity based on theUNESCO International Seawater Standard [44]. Theobtained estimate of n varies within the range 0.1–1.26(Table 4), thus suggesting the complex structure ofwater in this area. In particular, parameter n calculatedby density profiles between @ile d’Orléan and @iled’Coudres islands (Fig. 7, profiles 1–5) shows that~23 km downstream of @ile d’Orléan island, the flowis strongly stratified with the presence of a wedge ofsaline water.
The results of measuring turbulent velocity pulsa�tions and salinity near Coudres Island, given in [12,13], showed that the interaction between fresh and
6 1018
22
30 29
31.5
28
31
27
14 18 2226
282928
31
29 30
3233
3233.5
31.5
30
Saguenay R. Tadusak T.
Saguenay R.
(а)
(b)
Tadusak T.
Fig. 6. Water salinity distribution in Saint Lawrence River estuary at a depth of 10 m during water flow values of (a) 18 600 (May1963) and (b) 10 200 m3/s (February 1963) according to [41].
Table 3. Types of vertical mixing and water stratification in the estuary as a function of the ratio of water volumes deliveredby the river and entering the estuary with tides [3]
Type W/Pt Degree of vertical mixing Stratification
1 ≥1 Weak Salt wedge
2 0.1–1.0 Partially mixed with involvement of saline water form bottom water layer into surface water layer
Strong
3 0.005–0.1 Partially mixed estuary Weak
4 ≤0.005 Well vertically mixed estuary No stratification
WATER RESOURCES Vol. 38 No. 4 2011
WATER AND SEDIMENT DYNAMICS AT SAINT LAWRENCE RIVER MOUTH 463
saline waters in this part of the estuary is short andtakes part regularly about 1 h before high water.
Thus, by parameter n, overall, the upper estuary ofthe Saint Lawrence River can be referred to partiallymixed, moderately stratified estuaries with transitioninto a strongly stratified estuary.
Richardson number RiL. The type of mixing offresh and saline water in the Saint Lawrence estuarycan also be estimated with the use of the Richardsonlayer number [7, 18]
where h is flow depth; is flow velocity in the topwater layer; Δρ = ρ2 – ρ1, ρср = (ρ1 + ρ2)/2, i.e., the dif�ference between the densities and the mean water den�sity in the bottom and surface layers.
The mean value of Richardson number, calculatedwith the use of profiles of conditional density (Fig. 7)for the segment of the upper estuary of the SaintLawrence River between Coudres Island and theSaguenay River mouth was found to be RiL = 4.3. Theobtained value of RiL number falls within the range 2 <RiL <20, corresponding to a partially mixed estuary [7,18].
Analysis of all above estimates of water mixing typein the Saint Lawrence estuary shows that Simmonscriterion α allows us to judge about the vertical mixingof water averaged over the entire estuary; stratificationparameter n yields the most accurate determination ofwater mixing type at the site of salinity measurement;and RiL number reflects the degree of stability of theflow. The comparison of the estimates of those param�eters for the Saint Lawrence estuary showed that theupper estuary belongs to partially mixed, though alltypes of mixing given in Table 3 are typical of some itsparts. In the middle and lower estuary, the mixing ofriver and sea water follows the type of a wedge of salinewater and the estuary is strongly stratified.
At the same time, the interaction between river andsea water and the formation of estuarine circulation atthe mouth of the Saint Lawrence River experiences asignificant influence of the unique topography of theestuary bed, associated with the presence of the deepLaurentian Channel. In the warm season, the middleand lower estuaries are commonly divided into threeclear layers (Fig. 2): the surface layer (0–30 m) withsalinity from 26 to 32‰, which forms under the fresh�ening effect of the runoff of the Saint Lawrence andSaguenay rivers; a cold intermediate layer (30–125 m)with a temperature of –1 to +4°C and water salinity of32–33‰, which forms every winter because of cool�ing of water surface in the Gulf of Saint Lawrence; anda salt (33–34‰), but warmer (+2 to +5°C) bottomlayer, consisting of Atlantic water [12]. A cold and saltcompensation current moves in the bottom layer fromthe Gulf of Saint Lawrence and the lower estuarytoward the river, thus renewing water in deep troughs
ср
Ri2
,LghΔρ
=ρv
v
in the upper and middle estuaries. The residual watercirculation, averaged over the tidal cycle is typical ofestuaries with a saline surface layer moving seawardand cold intermediate and bottom layers moving land�ward with a smaller velocity.
The Effect of Coriolis Force on Currents in the Estuary
A tendency toward the motion of the surface,fresher, layer in the direction of the sea along the rightsouthern shore can be seen in the Saint Lawrenceestuary, especially, in its lower part; at the same time,the compensation salt�water flow moves mostly alongthe northern shore [39]. Such deviations of the result�ing current to the right were recorded in other largeestuaries of the Northern Hemisphere, e.g., in Chesa�peake Bay [8]. Canadian researchers attribute this pro�cess to the effect of the deflecting force of earth’s rota�tion on water dynamics in the wide estuary of the SaintLawrence River. The Coriolis force, which acts per�pendicular to the flow velocity can account for up to20% of the pressure force at latitudes of 50–60° [5].The effect of the Coriolis force can be determined withthe use of Rossby radius (LR), which, in the case of abaroclinic flow can be written as where Nis Brunt–Väisälä frequency, h is depth, f0 = 2Ωsinϕ isCoriolis parameter, Ω and ϕ are the angular rotationvelocity of the earth and the latitude of the site, respec�tively. The value of LR for the current in the SaintLawrence estuary is ~10 km [36]. It corresponds to thewidth of the flow in the surface layer; therefore theearth’s rotation can have an appreciable effect onwater dynamics in the estuary.
Canadian researchers established [39] that theresulting flow of freshened water in the surface layer,directed toward the ocean, shifts to the right, southernshore; while the resulting flow of saline water directedtoward the river is shifted to the northern shore (also tothe right). The flow velocity in the bottom layer at thenorthern shore is about the same as the velocity on thesurface at the southern shore (30 cm/s) [34]. Theeffect of Coriolis force becomes more pronounced inthe wide lower estuary, where Gaspé current formsunder its effect [35, 36].
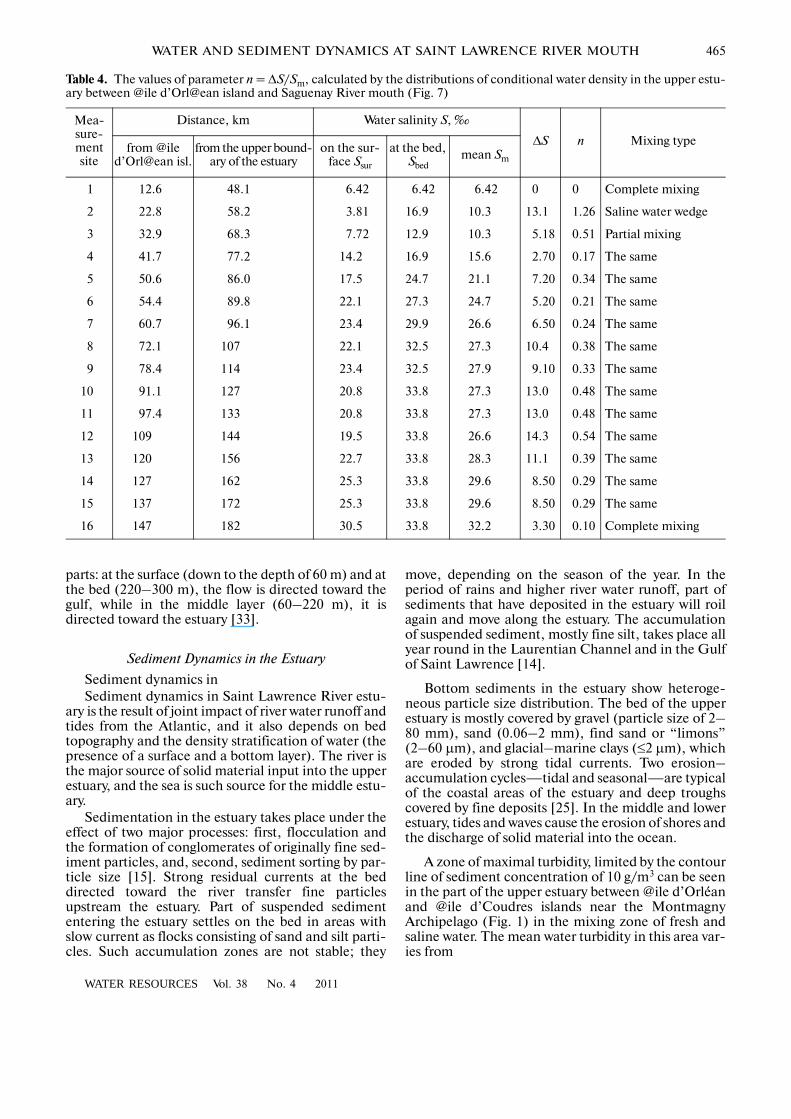
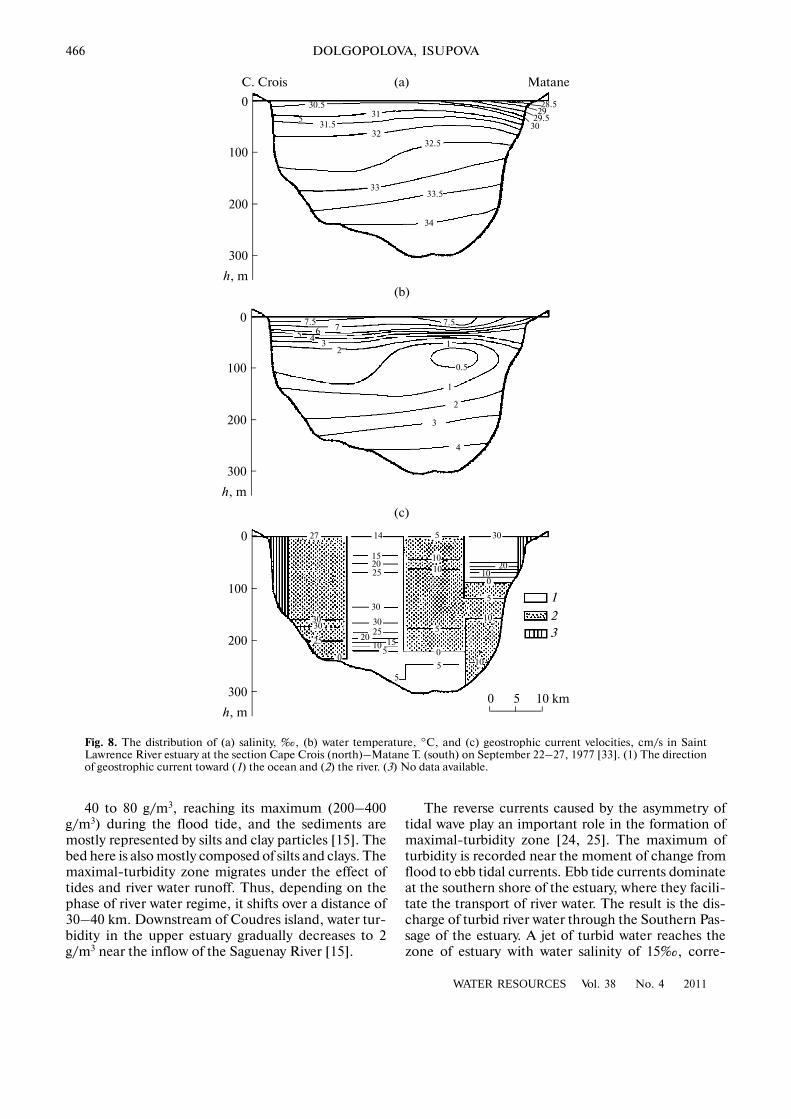
Field studies of the geostrophic current in SaintLawrence River estuary, the results of which are givenin [33], were carried out when the estuary was filling(3–4 days before full or change). Water temperatureand salinity and flow velocity were measured within 6days (September 22–27, 1977) in the 50�km sectionbetween Cape Croix and Matane Town (Fig. 1),located close to the boundary between the middle andlower estuary. The results of measurements are given inFig. 8. Water salinity in the surface layer in the estuarydecreased toward the shores (especially, toward thesouthern shore) (Fig. 8à). Water salinity increases withdepth, and at the bed it reaches the values typical of theGulf of Saint Lawrence. Water temperature distribu�
0 ,RL Nh f=
464
WATER RESOURCES Vol. 38 No. 4 2011
DOLGOPOLOVA, ISUPOVA
tion in the surface layer is similar to the distribution ofsalinity (Fig. 8b). As the depth increases, the interme�diate cold layer at depths of 50–200 m can be clearlyseen; its temperature decreased by 0.5°C relative tothe temperature of 2–4°C in the deep layer (Fig. 8b).
The considerable horizontal pressure gradientscause some specific features in the geostrophic currentin the examined estuary section (Fig. 8c). Flow veloc�ity in the bottom layer at the northern shore is aboutthe same as the velocity on the surface near the south�
ern shore (30 ñm/s). According to observational datain [33], the geostrophic current is directed toward thegulf in the central part of the estuary in the period of itsfilling and toward the river in nearby areas (Fig. 8c).We can calculate the total water runoff for the entireperiod under the effect of the resulting current fromthe estuary into the gulf through the section. This run�off was ~0.817 km3, and that in the opposite directionwas 0.822 km3. In the vertical section, the flow throughthe section under consideration is divided into three
0
10
20
0 4
0
10
20
0 10
0
10
20
0 10
0
10
0 10kg/m3
1 2 3 4
0
20
40
60
5 15
0
20
40
0 20
0
20
40
60
0 20
0
40
80
10 20
0
20
40
10 20
0
20
40
60
10 20
0
40
80
10 20
0
60
120
10 20
0
40
80
15 20 25
0
40
80
120
15 20 25
0
30
60
15 25
0
20
40
6015 25
kg/m3
kg/m3
kg/m3h, m
5 6 7 8
9 10 11 12
13 14 15 16
Fig. 7. Vertical profiles of conditional water density measured in the segment of the upper Saint Lawrence estuary from (1) @iled’Orléan island to the inflow of the (16) Saguenay R. on August 19, 1998 (two days after neap tide) [12]. The location of measure�ment points is in agreement with data of Table 4.
WATER RESOURCES Vol. 38 No. 4 2011
WATER AND SEDIMENT DYNAMICS AT SAINT LAWRENCE RIVER MOUTH 465
parts: at the surface (down to the depth of 60 m) and atthe bed (220–300 m), the flow is directed toward thegulf, while in the middle layer (60–220 m), it isdirected toward the estuary [33].
Sediment Dynamics in the Estuary
Sediment dynamics inSediment dynamics in Saint Lawrence River estu�
ary is the result of joint impact of river water runoff andtides from the Atlantic, and it also depends on bedtopography and the density stratification of water (thepresence of a surface and a bottom layer). The river isthe major source of solid material input into the upperestuary, and the sea is such source for the middle estu�ary.
Sedimentation in the estuary takes place under theeffect of two major processes: first, flocculation andthe formation of conglomerates of originally fine sed�iment particles, and, second, sediment sorting by par�ticle size [15]. Strong residual currents at the beddirected toward the river transfer fine particlesupstream the estuary. Part of suspended sedimententering the estuary settles on the bed in areas withslow current as flocks consisting of sand and silt parti�cles. Such accumulation zones are not stable; they
move, depending on the season of the year. In theperiod of rains and higher river water runoff, part ofsediments that have deposited in the estuary will roilagain and move along the estuary. The accumulationof suspended sediment, mostly fine silt, takes place allyear round in the Laurentian Channel and in the Gulfof Saint Lawrence [14].
Bottom sediments in the estuary show heteroge�neous particle size distribution. The bed of the upperestuary is mostly covered by gravel (particle size of 2–80 mm), sand (0.06–2 mm), find sand or “limons”(2–60 μm), and glacial–marine clays (≤2 μm), whichare eroded by strong tidal currents. Two erosion–accumulation cycles—tidal and seasonal—are typicalof the coastal areas of the estuary and deep troughscovered by fine deposits [25]. In the middle and lowerestuary, tides and waves cause the erosion of shores andthe discharge of solid material into the ocean.
A zone of maximal turbidity, limited by the contourline of sediment concentration of 10 g/m3 can be seenin the part of the upper estuary between @ile d’Orléanand @ile d’Coudres islands near the MontmagnyArchipelago (Fig. 1) in the mixing zone of fresh andsaline water. The mean water turbidity in this area var�ies from
Table 4. The values of parameter n = ΔS/Sm, calculated by the distributions of conditional water density in the upper estu�ary between @ile d’Orl@ean island and Saguenay River mouth (Fig. 7)
Mea�sure�ment site
Distance, km Water salinity S, ‰
ΔS n Mixing typefrom @ile
d’Orl@ean isl.from the upper bound�
ary of the estuaryon the sur�
face Ssur
at the bed, Sbed
mean Sm
1 12.6 48.1 6.42 6.42 6.42 0 0 Complete mixing
2 22.8 58.2 3.81 16.9 10.3 13.1 1.26 Saline water wedge
3 32.9 68.3 7.72 12.9 10.3 5.18 0.51 Partial mixing
4 41.7 77.2 14.2 16.9 15.6 2.70 0.17 The same
5 50.6 86.0 17.5 24.7 21.1 7.20 0.34 The same
6 54.4 89.8 22.1 27.3 24.7 5.20 0.21 The same
7 60.7 96.1 23.4 29.9 26.6 6.50 0.24 The same
8 72.1 107 22.1 32.5 27.3 10.4 0.38 The same
9 78.4 114 23.4 32.5 27.9 9.10 0.33 The same
10 91.1 127 20.8 33.8 27.3 13.0 0.48 The same
11 97.4 133 20.8 33.8 27.3 13.0 0.48 The same
12 109 144 19.5 33.8 26.6 14.3 0.54 The same
13 120 156 22.7 33.8 28.3 11.1 0.39 The same
14 127 162 25.3 33.8 29.6 8.50 0.29 The same
15 137 172 25.3 33.8 29.6 8.50 0.29 The same
16 147 182 30.5 33.8 32.2 3.30 0.10 Complete mixing
466
WATER RESOURCES Vol. 38 No. 4 2011
DOLGOPOLOVA, ISUPOVA
40 to 80 g/m3, reaching its maximum (200–400g/m3) during the flood tide, and the sediments aremostly represented by silts and clay particles [15]. Thebed here is also mostly composed of silts and clays. Themaximal�turbidity zone migrates under the effect oftides and river water runoff. Thus, depending on thephase of river water regime, it shifts over a distance of30–40 km. Downstream of Coudres island, water tur�bidity in the upper estuary gradually decreases to 2g/m3 near the inflow of the Saguenay River [15].
The reverse currents caused by the asymmetry oftidal wave play an important role in the formation ofmaximal�turbidity zone [24, 25]. The maximum ofturbidity is recorded near the moment of change fromflood to ebb tidal currents. Ebb tide currents dominateat the southern shore of the estuary, where they facili�tate the transport of river water. The result is the dis�charge of turbid river water through the Southern Pas�sage of the estuary. A jet of turbid water reaches thezone of estuary with water salinity of 15‰, corre�
0
100
200
300 0 5 10 km
27
3030
25
0
14
152025
30
3025
201510
5
55
0
5
1010
5 30
2010
0
5
10
10
7.5765 4
32
7.5
1
0.5
1
2
3
4
h, m
0
100
200
300
h, m
5
0
100
200
300
h, m
30.5
31.531
3232.5
3333.5
34
28.529
3029.5
C. Crois Matane(а)
(b)
(c)
1
23
Fig. 8. The distribution of (a) salinity, ‰, (b) water temperature, °C, and (c) geostrophic current velocities, cm/s in SaintLawrence River estuary at the section Cape Crois (north)–Matane T. (south) on September 22–27, 1977 [33]. (1) The directionof geostrophic current toward (1) the ocean and (2) the river. (3) No data available.

WATER RESOURCES Vol. 38 No. 4 2011
WATER AND SEDIMENT DYNAMICS AT SAINT LAWRENCE RIVER MOUTH 467
sponding to 50% mixing of sea and river waters. Theso�called hydrological front, separating estuarinewaters by their salinity, temperature, and turbidity,forms here. This front also shows seasonal migrationcaused by changes in river runoff.
Ebb current also facilitates the erosion of coastalshallow zones of marshes and additional input of sus�pended sediments into the estuary.
A considerable portion of debris from the coastalzone of the estuary is carried out from the estuary withice during ice drift.
Three layers can be identified in the distribution ofwater turbidity in the lower estuary and in the Gulf ofSaint Lawrence. In the surface layer (down to 50�mdepth), of which surface water circulation is typical,water turbidity is 0.10–2.9 g/m3. In the middle layer,water turbidity varies within 0.05–0.1 g/m3, increasingin the bottom layer to 0.1–0.4 g/m3. Suspended sedi�ment runoff decreases toward the ocean [15].
The accumulation of fine sediments along thesouthern shore of the upper estuary and north of @iled’Orléan island leads to the accumulation of pollut�ants and toxic substances in bottom sediments. Thearea near @ile d’Orléan island is believed to be themost polluted in the estuary; it shows high concentra�tions of phosphorus, organic matter, and heavy metals(iron, magnesium, zinc, cobalt, nickel, copper, andcadmium).
A correlation between mercury concentration andsediment size was observed at the mouth of theSaguenay River, in the estuary itself, and in the Gulf ofSaint Lawrence. Mercury concentration increaseswith decreasing size of sediment particles. Dependingon sediment texture and sampling site, the total mer�cury concentration varied from 10 to 12300 ng/l withthe mean value of 386 ng/l. the largest value(2980 ng/l) was recorded at Saguenay River mouth,and the least (150 ng/l) in the Gulf of Saint Lawrence.Mercury concentration in the estuary of SaintLawrence River varies from 30 to 950 ng/l. The highestconcentrations are recorded in the accumulation sitesof fine sediments confined to hollows and submarinevalleys. Conversely, the least mercury concentrationsare typical of relatively flat sandy bottom sediments.
CONCLUSIONS
The MA of the Saint Lawrence River refers to estu�ary type and includes the mouth area of the river, theestuary, and the nearshrore—the Gulf of SaintLawrence with Jacques Cartier and Honguedo(Gaspé) straits between Anticosti Island and theshores.
Studies of water and sediment dynamics in theestuary of the Saint Lawrence River showed the effectof bed topography (in this case, the presence of thedeep Laurentian Channel) on the formation of estua�rine water circulation. In the warm season, the middle
and lower estuary are commonly divided into threedistinct thermohaline layers: the surface saline layer(0–30 m), the cold intermediate layer (30–125 m)with a temperature of 0–4°C, and the saline, butwarmer bottom layer of oceanic water.
By the type of river and sea water mixing, the estu�ary of the Saint Lawrence River generally refers to par�tially mixed estuaries with weak stratification, as isconfirmed by estimates of Simmons criterion α. How�ever, the comparison of estimated values of stratifica�tion parameter n and the Richardson number RiL forthe estuary of the Saint Lawrence River has shown thatwhen determining the type of vertical mixing andstratification, one has to divide the estuary into severalsegments. The first segment, which extends from theupper boundary of the estuary to Coudres Island,shows complete mixing. The second segment—fromCoudres Island to lower boundary of the upper estu�ary—is a partially mixed estuary with moderate waterstratification and the involvement of saline water fromthe bottom into the top layer. The third segment,which includes the middle and lower estuaries, is astrongly stratified estuary with mixing of the type ofsaline�water wedge.
The interaction of river and sea water near theintrusion boundary of saline water into the estuaryresults in the formation of a maximal�turbidity zone,which migrates, depending on the tidal phase and sea�sonal variations in river runoff, and is typical of manypartially mixed estuaries.
Because of the large width of the lower estuary,Coriolis force has an appreciable effect on currents init, resulting in a shift of the resulting flow to the right(in thé Current along the southern shore of the estuary.
ACKNOWLEDGMENTS
This study was supported by the Russian Founda�tion for Basic Research, project no. 10�05�00061.
REFERENCES
1. Atlas okeanov. Atlanticheskii i Indiiskii okeany (Atlas ofOceans: Atlantic and Indian Oceans), Leningrad: GUnavigatsii i okeanografii,MO SSSR, 1977.
2. Vodnye resursy Rossii i ikh ispol’zovanie (WaterResources of Russia and Their Use), St. Petersburg:GGI, 2008.
3. Dolgopolova, E.N., Formation of Estuarine Circula�tion Depending on Tide Magnitude, Tr. mezhdunar.konf. “Litodinamika donnoi kontaktnoi zony okeana”(Poc. Intern. Conf. “Lithodynamics of Oceanic Bot�tom Contact Zone), Moscow: Inst. Okeanol. RAS,2009, pp. 14–16.
4. Dolgopolova, E.N. and Isupova, M.V., Classification ofEstuaries by Hydrodynamic Processes, Vodn. Resur.,2010, vol. 37, no. 3, pp. 274–291 [Water Resour. (Engl.Transl.), vol. 37, no. 3, pp. 268–284].

468
WATER RESOURCES Vol. 38 No. 4 2011
DOLGOPOLOVA, ISUPOVA
5. Mak�Douell, D.M. and Konnor, B.A., Gidravlikaprilivnykh ust’ev rek (Hydraulics of Tidal RiverMouths), Moscow: Energoatomizdat, 1983.
6. Mirovoi vodnyi balans i vodnye resursy Zemli (WorldWater Balance and Water Resources of the Earth), Len�ingrad: Gidrometeoizdat, 1974.
7. Mikhailov, V.N., Gidrologicheskie protsessy v ust’yakhrek (Hydrological Processes in River Mouths), Mos�cow: GEOS, 1997.
8. Mikhailov, V.N., Solodovnikova, T.Yu., andMikhailova, M.V., Regularities of Hydrological Pro�cesses in the Chesapeake Bay (USA): Case Study of aClassical Estuary, Vodn. Resur., 2009, vol. 36, no. 2,pp. 139–159 [Water Resour. (Engl. Transl.), vol. 36,no. 2, pp. 127–147].
9. Mikhailova, M.V. and Isupova, M.V., Water and Ice–Thermal Regime of Different Types of Arctic Mouths,Tr. vseros. konf. “Ledovye i termicheskie protsessy navodnykh ob"ektakh Rossii" (Proc. All�Russia Conf. Iceand Thermal Processes on Water Objects in Russia),Moscow: MGUP, 2007, pp. 37–40.
10. Samoilov, I.V., Ust’ya rek (River Mouths), Moscow:Geografgiz, 1952.
11. Borne de Grandré C., El�Sabh M.I. Etude de la circu�lation verticale dans l’estuaire du Saint�Laurent aumoyen de la modelisation mathematique, Atmosphere–Ocean, 1980, vol. 18, no. 4, pp. 304–321.
12. Bourgault, D., and Koutitonsky, V.G., Real�TimeMonitoring of the Freshwater Discharge at the Head ofthe St. Lawrence Estuary, Atmosphere–Ocean, 1999,vol. 37, no. 2, pp. 203–220.
13. Bourgault, D., Saucier, F.J., and Lin, C.A., ShearInstability in the St. Lawrence Estuary, Canada: AComparison of Fine�Scale Observations and EstuarineCirculation Model Results, J. Geophys. Res., 2001, vol.106.
14. Centre Saint�Laurent. Eau et sediments, http://www.qc.ec.gc.ca
15. Couillard, D., Qualite Des Sediments En SuspensionEt De Fond Du Systeme Saint�Laurent (Canada), J.Hydrological Sciences, 1987, no. 32, pp. 445–467.
16. Cranck, K., Dynamics and Distribution of SuspendedParticulate Matter in the St. Lawrence Estuary, Le: Nat�uralist Canadien, 1979, vol. 106, no. 1, pp. 163–173.
17. DFO. Oceanographic conditions in the Gulf of St.Lawrence during year 2000, Science Stock Status. 2001.Report G4–01, pp. 1–5.
18. Dyer, K.R., New, A.S., Intermittency in EstuarineMixing, Estuarine Variability, New York: Academic,1986, pp. 321–339.
19. Dickie, L and Trites, L.M., in Estuaries and EnclosedSeas, Ketchum, B.H., Ed., Quebec, 1983, pp. 403–425.
20. Drapeau, G., Munro, J., and Nellis, P., Long Term Fateof Dredged Sediments at Ile Madame Dumping Site(St. Lawrence Estuary): a Basic Assessment, Proc. 2�ndInter. Symp. on Contaminated Sediments, Quebec, 2003,pp. 36–40.
21. El�Sabh, M., Physical Oceanography of the SaintLawrence Estuary, Hydrodynamics of Estuaries,Kjerfve, B., Ed., Boca Raton, FL: CRC, 1988.
22. El�Sabh, M.I., Levesque, L., and Murty, T.S., Mouve�ments Des Eaux Induits Par La Maree Et Le Vent DansL’Estuaire Du Saint�Laurent, Le Naturalist Canadien,1979, vol. 106, no.1, pp. 89–104.
23. Forbes, D.L., and Manson, G., K., Chagnon, R., et al.,Nearshore Ice and Climate Change in the SouthernGulf of St. Lawrence, Proc. 16th IAHR Symposion onIce, Dundelin, 2002, vol. 1, pp. 344–349.
24. Forrester, W.D., Tidal Transport and Streams in the St.Lawrence Estuary, Int. Hydrograph. Rev., 1972, vol. 48,no. 1, pp. 95–108.
25. Gagnon, M., Bilan Regional. Rive sud de l’estuairemoyen du Saint�Laurent. Zones d’intervention prior�itaire 15, 16 Et 17, Centre Saint�Laurent. Environne�ment Canada–region du Quebec, 1998,www.slv200.qc.ca
26. Gilbert, D. and Pettigrew, B., Interannual Variability(1948–1994) of the CIL Core Temperature in the Gulfof St. Lawrence, Can. J. Fish. Aquat. Sci., 1997, vol. 57,Suppl. 1, pp. 57–67.
27. Global Runoff Data Centre (GRDC),http://grdc.bafg.de
28. Godin, G., La Marée dans le golfe et l’estuaire duSaint�Laurent, Le Naturalist Canadien, 1979, vol. 106,no. 1, pp. 105–121.
29. Government of Canada, Atlas of Tidal Currents fromCap de Bon�Desir to Trois�Rivieres, Department ofFisheries and Oceans, Ottawa: Canadian HydrographicService, 1997.
30. Greenwood, B., and Hale, P.B., Depth Activity, Sedi�ment Flux, and Morphological Change in a BarredNearshore Environment, in The Coastline of Canada,McCann, S.B., Ed., Halifax: Geological Survey ofCanada, 1980, pp. 89–109.
31. Hansen, D.V., and Rattray, M., New Dimensions inEstuary Classification, Limnol. Oceanogr., 1966,vol. 11, no. 3, pp. 319–326.
32. Harms, I.H., Hubner, U., Backhaus, J.O., et al., SaltIntrusions in Siberian River Estuaries: Observationsand Model Experiments in Ob and Yenisei, Proc. EGSXXVII General Assembly. Nice, 2002, pp. 27–46.
33. Koutitonsky, V.G., Transport de masses d’eau al’embouchure de l’estuaire du Saint�Laurent, Le Natu�ralist Canadien, 1979, vol. 106, no. 1, pp. 89–104.
34. Koutitonsky, V.G., and Bugden, G.L., The PhysicalOceanography of the Gulf of St. Lawrence: A Reviewwith Emphasis on the Synoptic Variability of theMotion, Can. Spec. Publ. Fish. Aquat. Sci., 1991,vol. 113, pp. 57–90.
35. Koutitonsky, V.G., Wilson, R.E., and El�Sabh, M.L.,On the Seasonal Response of the Lower St. LawrenceEstuary to Buoyancy Forcing by Regulated River Run�off, Estuarine Coastal Shelf Science, 1990, vol. 31, no. 5,pp. 359–379.
36. Mertz, G., El�Sabh, M.I., Proulx, D., and Condal, A.R.,Instability of a Buoyancy�Driven Coastal Jet: TheGaspé Current and Its Precursor, J. Geophys. Res.,1988, vol. 93, no. C6, pp. 6885–6893.
37. Milliman, J.D., Rutkovski, Ch., and Meybeck, M.,River Discharges to the Sea, A Global River Index(GLORI). LOICZ reports and studies, 1995.

WATER RESOURCES Vol. 38 No. 4 2011
WATER AND SEDIMENT DYNAMICS AT SAINT LAWRENCE RIVER MOUTH 469
38. Muir, L.R., Internal Tides in a Partially Mixed Estuary,Report Ocean Science and Surveys, Central Region,Burlington: Canada Centre for Inland Waters, 1982.
39. Neu, H.J.A., A Study of Mixing and Circulation in theSt. Lawrence Estuary up to 1964, Atl. Ocean. Lab. Bed.Inst. Rep. Ser., 1970, Report 9.
40. Neu, H.J.A., Man�Made Storage of Water Resources.A Liability to the Ocean Environment, Mar. Pollut.Bul., 1982, vol. 13, Pt. I, II, pp. 7–44.
41. Neu, H.J.A., Runoff Regulation for Hydro�Power andEffect on the Ocean Environment, Hydr. Scien. Bull.,XXI, 1976, vol. 3, no. 9, pp. 433–444.
42. Taillefer, F., la morphologie des environs de Québec etla basse�valle du Saint�Laurent, Cahiers de géographiedu Québec, 1958, vol. 2, no. 4, pp. 177–191.
43. Tomczak, M., and Godfrey, J.S., Regional Oceanogra�phy: an Introduction, Delhi: Daya Publ. House, 2003.
44. www.aquatis.ru/sea/test.php
г. Труа�Ривьеро�ва Мадлен