Vulnerability to sea level rise of 8 beaches in shoalhaven: a new multi-dimensional assessment...
13
1 VULNERABILITY TO SEA LEVEL RISE OF 8 BEACHES IN SHOALHAVEN: A NEW MULTI-DIMENSIONAL ASSESSMENT METHODOLOGY FN Tonmoy 1 , A El-Zein 1 , I Ghetti 2 , R Massie 2 1 University of Sydney, Sydney, NSW 2 Shoalhaven City Council, Nowra, NSW Abstract Coastal councils around the world are likely to be affected by future climatic impacts such as sea level rise and extreme flooding. Shoalhaven City Council is responsible for the sustainable management of 165 kilometres of open coast, the longest of any local government area in New South Wales. In order to prepare a comprehensive coastal zone management plan, Council investigated present and expected future coastal risks on its beaches. Detailed studies identified eight beaches where coastal hazards would significantly impact private properties and public assets. In order to help decision-makers in prioritising management actions for the eight areas, an analytical tool is needed that would not only quantify the physical risks to infrastructure but would also be able to integrate social and environmental considerations towards a holistic assessment of the vulnerability of each beach area. Following the Intergovernmental Panel on Climate Change (IPCC) conceptualisation, the vulnerability of a community to a climate hazard can be seen as determined by the degree of physical exposure to the hazard, as well as the community’s sensitivity to its impacts and its ability to cope with, or adapt to, these impacts. Hence, vulnerability assessment presents a number of theoretical and methodological challenges, the most important of which are epitomized by the following questions: 1. how to determine, say whether a community with high exposure and high adaptive capacity is more vulnerable or less vulnerable than a community with lower exposure but lower adaptive capacity? (problem of compensation). 2. how to incorporate the imprecision and value-judgments inevitably present in multi- stakeholder vulnerability assessments while maintaining a consistent and robust scientific process? (problem of fuzziness). A new methodology has been developed at the University of Sydney that addresses these questions and offers a clear and consistent approach for conducting vulnerability assessments. The paper describes the application of this methodology to the ranking of vulnerabilities to sea level rise of eight beaches in Shoalhaven. Introduction World population is growing rapidly along the coast, especially around coastal conglomerations. Of the 63 most populated cities of the world (with 5 million or more inhabitants in 2011), 72 per cent are located on or near the coast (United Nations, 2012). Australia, with more than 60 per cent of its population living in coastal settlements in six
-
Upload
independent -
Category
Documents
-
view
0 -
download
0
Transcript of Vulnerability to sea level rise of 8 beaches in shoalhaven: a new multi-dimensional assessment...
1
VULNERABILITY TO SEA LEVEL RISE OF 8 BEACHES IN SHOALHAVEN: A NEW MULTI-DIMENSIONAL ASSESSMENT
METHODOLOGY
FN Tonmoy1, A El-Zein1, I Ghetti2, R Massie2 1University of Sydney, Sydney, NSW
2Shoalhaven City Council, Nowra, NSW
Abstract
Coastal councils around the world are likely to be affected by future climatic impacts such as sea level rise and extreme flooding. Shoalhaven City Council is responsible for the sustainable management of 165 kilometres of open coast, the longest of any local government area in New South Wales. In order to prepare a comprehensive coastal zone management plan, Council investigated present and expected future coastal risks on its beaches. Detailed studies identified eight beaches where coastal hazards would significantly impact private properties and public assets. In order to help decision-makers in prioritising management actions for the eight areas, an analytical tool is needed that would not only quantify the physical risks to infrastructure but would also be able to integrate social and environmental considerations towards a holistic assessment of the vulnerability of each beach area.
Following the Intergovernmental Panel on Climate Change (IPCC) conceptualisation, the vulnerability of a community to a climate hazard can be seen as determined by the degree of physical exposure to the hazard, as well as the community’s sensitivity to its impacts and its ability to cope with, or adapt to, these impacts. Hence, vulnerability assessment presents a number of theoretical and methodological challenges, the most important of which are epitomized by the following questions:
1. how to determine, say whether a community with high exposure and high adaptive capacity is more vulnerable or less vulnerable than a community with lower exposure but lower adaptive capacity? (problem of compensation).
2. how to incorporate the imprecision and value-judgments inevitably present in multi-stakeholder vulnerability assessments while maintaining a consistent and robust scientific process? (problem of fuzziness).
A new methodology has been developed at the University of Sydney that addresses these questions and offers a clear and consistent approach for conducting vulnerability assessments. The paper describes the application of this methodology to the ranking of vulnerabilities to sea level rise of eight beaches in Shoalhaven.
Introduction
World population is growing rapidly along the coast, especially around coastal conglomerations. Of the 63 most populated cities of the world (with 5 million or more inhabitants in 2011), 72 per cent are located on or near the coast (United Nations, 2012). Australia, with more than 60 per cent of its population living in coastal settlements in six

2
State capital cities, is likely to be affected by future climatic impacts such as sea level rise and extreme flooding (ABS, 2003; Gurran and Blakely, 2007,). Specifically, exposure to long-term and short-term beach recession due to sea level rise as well as increased frequency of inundation or flooding are likely to significantly affect these urban concentrations.
Coastal councils are responsible for the sustainable management of the coast in Australia. They are charged with identifying present and future coastal risks in order to prioritize action and base any risk management and resource allocation decisions they make on evidence-based science. As a result, coastal councils traditionally commission expert coastal studies in order to identify current and future coastal hazards. However, these studies typically cover the bio-physical aspect of the coastal risk, with little or no consideration of its socio-economic dimensions, such as the capacity of the Council and/or the community to react or adapt to the risk in question. Indeed, the vulnerability of a Socio-Ecological System (SES)—such as a beach or a town with their inhabitants, ecologies and physical infrastructures—is a function of the system’s exposure to the risk, its sensitivity to the impacts of that risk as well as its ability to cope with, or adapt to, those impacts, known as its adaptive capacity (IPCC et al., 2001). Most coastal vulnerability assessment studies in the literature have either been conducted at regional or national scales, or have not attempted to include both physical and socio-economic dimensions of the risk (e.g., Alves et al., 2007, Hemer, 2009, Ozyurt and Ergin, 2009, Duriyapong, 2011). Therefore, their usefulness has remained somewhat limited because coastal councils must make decisions that:
a) are local in nature;
b) take into account all dimensions of the risk and not just the biophysical ones, including institutional capacity and resilience; and
c) are based and communicated on the basis of scientific evidence and community consultation, including a multiplicity of value judgements.
As a consequence of points b and c above, two challenges of vulnerability assessment are epitomized by the following questions:
1. how to determine, say whether a community with high exposure and high adaptive capacity is more vulnerable or less vulnerable than a community with lower exposure but lower resilience? (problem of compensation).
2. how to incorporate the imprecision and value-judgments inevitably present in multi-stakeholder vulnerability assessments while maintaining a consistent and robust scientific process? (problem of fuzziness).
El-Zein and Tonmoy (2012); Tonmoy and El-Zein, (2012a) developed a new vulnerability assessment framework, based on an outranking procedure of aggregation of indicators, which tackles these issues and allow precisely this kind of assessments to be conducted. The framework was coded in a computer program called Environmental Vulnerability Assessment (EVA).
In this paper we build an indicator-based model for assessing coastal vulnerability at a local scale and briefly describe how this model can be used in conjunction with EVA to assess coastal vulnerability of 8 beaches in Shoalhaven City Council. The Shoalhaven City Council is responsible for the sustainable management of 165 kilometers of open coast, the longest of any local government area in New South Wales. In order to prepare a comprehensive coastal zone management plan, Shoalhaven City Council investigated the

3
present and future risks presented by coastal hazards on its beaches. Preliminary biophysical assessments of the risk identified 8 beaches where present and future coastal hazards could significantly impact private properties and public assets. In order to help decision-makers in prioritizing adaptation intervention in these eight areas, the Council needs a tool that takes into account not only the physical risks to infrastructures but the social and socio-economic dimensions of vulnerability.
The paper describes the development of a coastal vulnerability assessment model, tailored to Shoalhaven City Council, to achieve the following objectives:
a) rank eight beaches of Shoalhaven council in terms of their vulnerability to sea level rise, as input into the process of prioritizing response action by the council; the beaches are: Callala Beach, Shoalhaven Heads, Culburra Beach, Currarong Beach, Collers Beach, Mollymook Beach, Narrawallee Beach and Collingwood Beach; and
b) help understand the underlying reasons that make households or public infrastructures in some beaches more vulnerable to sea level rise than in others under consideration.
In the remainder of the paper, we describe the model, its data collection requirements and its potential applicability to other local council areas.
Vulnerability Model
Conceptual Model and Definitions
A general conceptual model for coastal vulnerability is shown in Figure 1. Climatic events (e.g., storm surge, flooding and inundation, sea level rise etc) pose certain hazards in the coastal areas (coastal forcing). Their impacts depend on the characteristics of the coast (e.g., geomorphology, coastal structures etc). The social, institutional and financial resources that the community have access to are considered as a reflection of their adaptive capacity.
Figure 1: Conceptual model of coastal vulnerability
The first step in building the most basic vulnerability model is to define the problem at hand by answering the following three questions:
• Which socio-ecological system (SES) is the object of the study? (e.g., geographical area, community, industrial sector etc).
• The vulnerability to which climate related stress(es) or hazard(s) is to be assessed?
• The vulnerability of which valued attribute(s) of this SES(s) is to be assessed?
Coastal
Vulnerability
Coastal
characteristics
Socio-
economic
Coastal
forcing

4
In this study, we take each beach as a socio-ecological system which needs to be ranked. Plausible sea level rise, and associated processes, will be the hazard under consideration. Two valued attributes will be considered separately through two different models:
a) The well-being of households living at or near the beach;
b) The integrity of the public infrastructures at or near the beach and the well being of its users, whether they live at the beach or not.
The reason behind building two separate models is that, despite some similarities, processes that determine vulnerability are quite different for households and infrastructure and its users. For example, the adaptive capacity of households is mainly governed by socioeconomic factors such as income, employment, access to social capital, access to information etc. On the other hand, the vulnerability of the users of a given infrastructure is partly determined by the infrastructure's economic value, the extent to which the service it provides is critical and the ability of the Council and/or the users to deploy an alternative to the disrupted service. In addition, while disruption of beach infrastructure services may well impact beach households, the effects may not be confined to beach residents.
Two separate timeframes will be used in the study, both of which are based essentially in the present. In the first time frame, the beaches will be ranked according to their present vulnerability to recent and present coastal flooding and erosion of beaches. We call this timeframe TF1. In the second time frame (TF2), the analysis will answer the following question: if the projected 2050 sea level rise and associated processes of erosion and inundation were to happen today, which of the 8 beaches would be most vulnerable? This means that, in both cases, we will be assessing the impacts of specific scenarios of plausible sea level rise on the present land use, taking into account present adaptive capacity of the Shoalhaven council and Shoalhaven beach households. Placing the analyses in the present time allows us to avoid uncertain, and often controversial, projections into the future of patterns of land use as well as demographic, institutional and technological change. On the other hand, the study will lay the foundation for subsequent attempts at making such projections, by allowing us to assess the sensitivity of the vulnerability rankings to specific changes in these assumptions.
In the following sections, conceptual models for the two vulnerability models that we have developed namely, EVA-INFRA and EVA-HOUSE, are discussed in detail. For the sake of conciseness, we describe the models associated with TF2 only (the TF1 models are identical, except for the patterns of the hazard).
Vulnerability of Infrastructures and its Users (EVA-INFRA)
A conceptual model for infrastructure vulnerability to sea level rise has been developed for this project and is shown in Figure 2. In this model, sea level rise and severe storm events are taken to be the main driving forces impacting the Shoalhaven coast. A design storm equal in intensity to the storm that hit the NSW coast in May 1974 and that has a 5% probability of being exceeded over a 50-year period has been adopted for this analysis. A sea level rise of 0.4m by 2050 has been assumed, as specified in the guideline of the NSW Sea Level Rise policy statement (NSW, 2009). A design storm causes short-term erosion and inundation in the coastal areas while sea level rise contribute to long-term beach erosion as a result of change in sediment budget. These processes were considered to be the more significant ones when it comes to the Shoalhaven beaches in

5
studies recently commissioned by the councils (Adamantidis et al., 2009, Fletcher, 2011). Exposure to these climatic hazards might impact the infrastructure at or around the beach. Any disruption to the infrastructure due to this will affect its users, whether they live at, near or away from the beach. These can be termed the bio-physical impacts of a climate hazard. On the other hand, the capacity of government institutions (local, state and federal government) to counter and/or mitigate these impacts and the social and/or individual capacities of populations to cope with and diminish the impacts is referred to as the adaptive capacity of the SES. Overall infrastructure vulnerability of the beach is determined by the biophysical impacts on its infrastructure along with its users, minus the capacity of the council as well as individuals to cope with those impacts as shown in Figure 2. We call this model EVA-INFRA. A summary of the definitions underlying it are given in Table 1.
Figure 2: Conceptual model of vulnerability of beach infrastructure to sea level rise (EVA-INFRA)
Table 1: EVA-INFRA: How vulnerable is the beach public infrastructure and its users to sea level rise (SLR) and coastal processes associated with it, namely beach
erosion and inundation (collectively referred to as SLRAP)
Information Type Description
Socio-Ecological System (SES)
The beach defined as the area between the shoreline and the main road running alongside it
Valued attribute of concern (VA)
All public infrastructures and the well-being of their users
Climatic stress SLRAP (sea-level rise as predicted for 2050 + design storm with same magnitude as 1974 NSW storm)
Time Present-day vulnerability to SLRAP
Exposure Extent to which public infrastructures are exposed to SLRAP
Sensitivity 1. Extent to which public infrastructures are susceptible to damage as a result of exposure to SLRAP
2. Extent to which the well-being of the users of the public infrastructure is likely to suffer as a result of disruption to service
Adaptive Capacity 1. Extent to which, and speed with which, government institutions are able to repair damaged infrastructure and restore disrupted services to users or offer substitute services
2. Extent to which, and speed with which, users are able to substitute disrupted services, without help from government institutions

6
Vulnerability of households (EVA-HOUSE)
A conceptual model for household vulnerability to sea level rise has been developed for
this project and shown in Figure 3. In this model, the climatic hazards are similar to those
of EVA-INFRA. However, this model focuses on the impacts of those hazards on beach
residents, including damage to their properties and the effects on their well-being of
disruption to services as a result of damage to infrastructure. We call this model EVA-
HOUSE. A summary of the definitions underlying this model are given in Table 2.
Figure 3: Conceptual model of vulnerability of beach-resident households to sea level rise (EVA-HOUSE)
Table 2: EVA-HOUSE: How vulnerable is the well-being of the beach private residents to SLRAP
Information Type Description
Socio-Ecological System (SES)
The beach defined as the area between the shoreline and the main road running alongside it
Valued attribute of concern (VA)
The well-being of all households at the beach
Climatic stress SLRAP (sea-level rise as predicted for 2050 + design storm with same magnitude as 1974 NSW storm)
Time Present-day vulnerability to SLRAP
Exposure Extent to which houses and households are exposed to SLRAP
Sensitivity Extent to which the well-being of residents at the beach is likely to suffer as a result of that exposure, due partly, but not exclusively, to physical damage to houses and infrastructure services
Adaptive Capacity Extent to which households can adapt to, and mitigate, the impact on their well-being of exposure to SLRAP.

7
Selection of indicators
The next phase is to identify indicators through which EVA-INFRA and EVA-HOUSE can be made operational, i.e. used as a basis for ranking vulnerabilities. Indicator selection aims to represent all of the important processes generating vulnerability (Hinkel, 2011). Indicators proposed for the two vulnerability models are described in the next sections. Two criteria are used in selecting the indicators: a) they capture together the most significant processes driving vulnerability and b) they can be measured with reasonable confidence. In presenting the indicators in tables 3 to 8, we use the following conventions:
“C”: continuous variable (e.g., monetary value of an asset; length of a shoreline) “D”: discrete variable (e.g., population numbers; number of properties at the beach) “O”: ordinal variable (e.g., degree of importance on an increasing scale of 1 to 5) “+”: vulnerability increases with an increase in the value of the indicator “-“: vulnerability decreases with an increase in the value of the indicator
Indicators for EVA-INFRA
Tables 3, 4 and 5 show the selected EVA-INFRA indicators for exposure, sensitivity and adaptive capacity, respectively. We divide the infrastructure systems likely to be affected by SLRAP into 4 categories: sewerage, water supply, roads, and public buildings and other infrastructures. We have chosen these categories based on information available from the council. However, it is possible to extend the model to include other infrastructure components such as electric supply and telecommunications. Exposure is quantified by the monetary value of the exposed infrastructures. Sensitivity is reflected by the number of people affected by a disruption to the service provided by the infrastructures and by the current existence, or lack of it, of beach protection. Finally, adaptive capacity is measured by the importance and substitutability of the infrastructures, as well as the cultural and touristic significance of the beach. The total number of indicators for EVA-INFRA is 38.
Table 3: EVA-INFRA: Indicators of exposure dimension (12 indicators)
Processes Public infra-structures and services
Indicators
Code Description Variable
Type Unit Direction
Short and long term erosion
Sewerage I1 $ value of affected pumping stations C AUD +
I2 $ value of affected rising main C AUD + I3 $ value of affected gravity main C AUD +
Water supply I4 $ value of affected supply main C AUD + Roads I5 $ value of affected roads C AUD + Public buildings and other infra-structures
I6 $ value of other affected infrastructure (e.g., car park)
C AUD +
Periodic and frequent inundation
Sewerage I7 $ value of affected pumping stations C AUD +
I8 $ value of affected rising main C AUD + I9 $ value of affected gravity main C AUD +
Water supply I10 $ value of affected supply main C AUD + Roads I11 $ value of affected roads C AUD + Public buildings and other infra-structures
I12 $ value of other affected infrastructure (e.g., car park etc)
C AUD +

8
Table 4: EVA-INFRA: Indicators of sensitivity dimension (12 indicators)
Processes Public infra-structures and services
Indicators
Code
Population numbers affected by the service disruption due to damage to the following infrastructure (irrespective of place of residence):
Variable type
Unit Direction
Short and long term erosion
Sewerage I13 pumping stations D Capita +
I14 rising main D Capita + I15 gravity main D Capita +
Water supply I16 supply main D Capita + Roads I17 roads D Capita + Public buildings and other infra-structures
I18 other affected infrastructure (e.g., car park)
D Capita +
Periodic and frequent inundation
Sewerage I19 pumping stations D Capita +
I20 rising main D Capita + I21 gravity main D Capita +
Water supply I22 supply main D Capita +
Roads I23 roads D Capita +
Public buildings and other infra-structures
I24 other affected infrastructure (e.g., car park)
D Capita +
Indicators for EVA-HOUSE
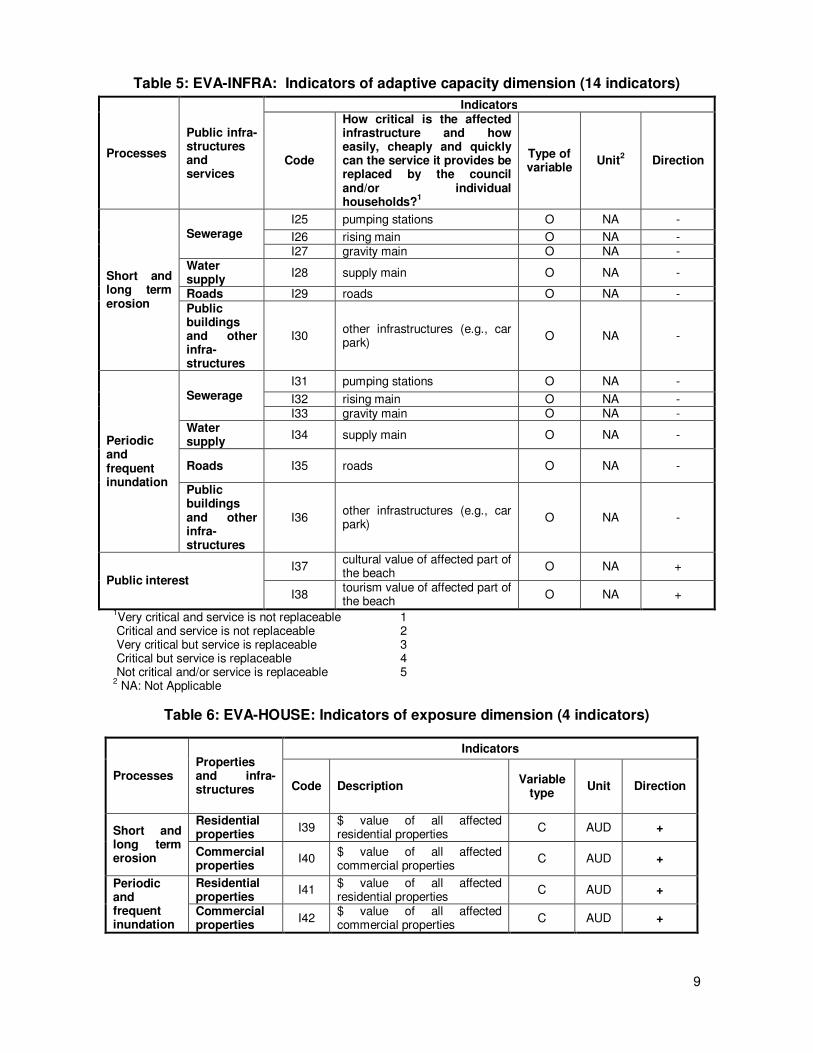
Tables 6, 7 and 8 show the selected EVA-HOUSE indicators for exposure, sensitivity and adaptive capacity, respectively. The exposure of a household living at or near the beach to SLRAP is assumed to occur either through exposure of its property (be it owned or rented) or exposure of infrastructure services that affect it. Sensitivity is measured by the number of people affected by property damage and disruption to infrastructure services but, unlike the sensitivity of EVA-INFRA, only those living at or near the beach. Finally, adaptive capacity is captured through a set of socio-economic indicators either for the whole beach or only the affected part of the beach. Existing literature identifies cultural beliefs, norms and lack of access to resources and political power as important determinants of the capacity to adapt to a certain risk. Key papers in this field (Blaikie P, 1994; Cutter, 1996; Hewitt, 1997; Cutter et al., 2000; Clark et al., 1998; Tobin G et al., 1997) demonstrate that some key demographic and housing characteristics such as age, gender, race, income, education and living conditions are important in amplifying or reducing overall vulnerability to hazard (Wu et al., 2002). Adaptive capacity indicators in for EVA-HOUSE have been selected base on concepts presented in Wu et al. (2002) and adapted to the Shoalhaven Council area. The total number of indicators for EVA-HOUSE is 20.
9
Table 5: EVA-INFRA: Indicators of adaptive capacity dimension (14 indicators)
Processes
Public infra-structures and services
Indicators
Code
How critical is the affected infrastructure and how easily, cheaply and quickly can the service it provides be replaced by the council and/or individual households?
1
Type of variable
Unit2 Direction
Short and long term erosion
Sewerage I25 pumping stations O NA -
I26 rising main O NA - I27 gravity main O NA -
Water supply
I28 supply main O NA -
Roads I29 roads O NA - Public buildings and other infra-structures
I30 other infrastructures (e.g., car park)
O NA -
Periodic and frequent inundation
Sewerage I31 pumping stations O NA -
I32 rising main O NA - I33 gravity main O NA -
Water supply
I34 supply main O NA -
Roads I35 roads O NA -
Public buildings and other infra-structures
I36 other infrastructures (e.g., car park)
O NA -
Public interest I37
cultural value of affected part of the beach
O NA +
I38 tourism value of affected part of the beach
O NA +
1Very critical and service is not replaceable 1
Critical and service is not replaceable 2 Very critical but service is replaceable 3 Critical but service is replaceable 4 Not critical and/or service is replaceable 5 2 NA: Not Applicable
Table 6: EVA-HOUSE: Indicators of exposure dimension (4 indicators)
Processes Properties and infra-structures
Indicators
Code Description Variable
type Unit Direction
Short and long term erosion
Residential properties
I39 $ value of all affected residential properties
C AUD +
Commercial properties
I40 $ value of all affected commercial properties
C AUD +
Periodic and frequent inundation
Residential properties
I41 $ value of all affected residential properties
C AUD +
Commercial properties
I42 $ value of all affected commercial properties
C AUD +

10
Table 7: EVA-HOUSE: Indicators of sensitivity dimension (6 indicators)
Processes Properties and infra-structures
Indicators
Code
Population numbers, living at the beach, affected by damage to properties and public infrastructures
Variable type
Unit Direction
Short and long term erosion
Residential properties
I43 all affected residential properties
D Capita +
Commercial properties
I44 all affected commercial properties
D Capita +
Public infra-structure and services
I45 all affected public infrastructure
D Capita +
Periodic and frequent inundation
Residential properties
I46 all affected residential properties
D Capita +
Commercial properties
I47 all affected commercial properties
D Capita +
Public infra-structure and services
I48 all affected public infrastructure
D Capita +
Table 8: EVA-HOUSE: Indicators of adaptive capacity dimension (10 indicators)
Indicators
Indicator Category
Code Description Variable
type Unit Direction
Demographic profile of the whole beach
I49 Total population D Capita +
I50 % of population passing year 12 D % - I51 No of population under 18 D Capita + I52 No of population over 60 D Capita + I53 No of single-parent household D Capita + I54 No of renter-occupied housing units D H Units + I55 Median household value C AUD -
Demographic profile of affected part of the beach
I56 Total no of affected population C Capita +
I57 Median household income of affected population
C AUD -
I58 % of affected households that owns the house
C % -
Modeling and Aggregation of Indicators
The third step in the vulnerability assessment exercise consists of aggregating the indicators described earlier. This is a process through which the indicators for each dimension of the two models are combined in order to generate a ranking of the beaches according to their exposure, sensitivity and adaptive capacity. The challenge in this step lies in the fact that different indicators are of different types (continuous, discreet, and ordinal) and cannot be converted into the same scale based on reasonable scientific evidence. In other words, they are not usually commensurable. We refer to this as the problem of incommensurability. Various degrees of subjectivity and uncertainty are also present in these indicators. For convenience, we refer here to subjectivity and uncertainty as fuzziness. An example of incommensurability is one in which beach A harbors more critical sewage pumping infrastructure, but less critical water supply main, than beach B
11
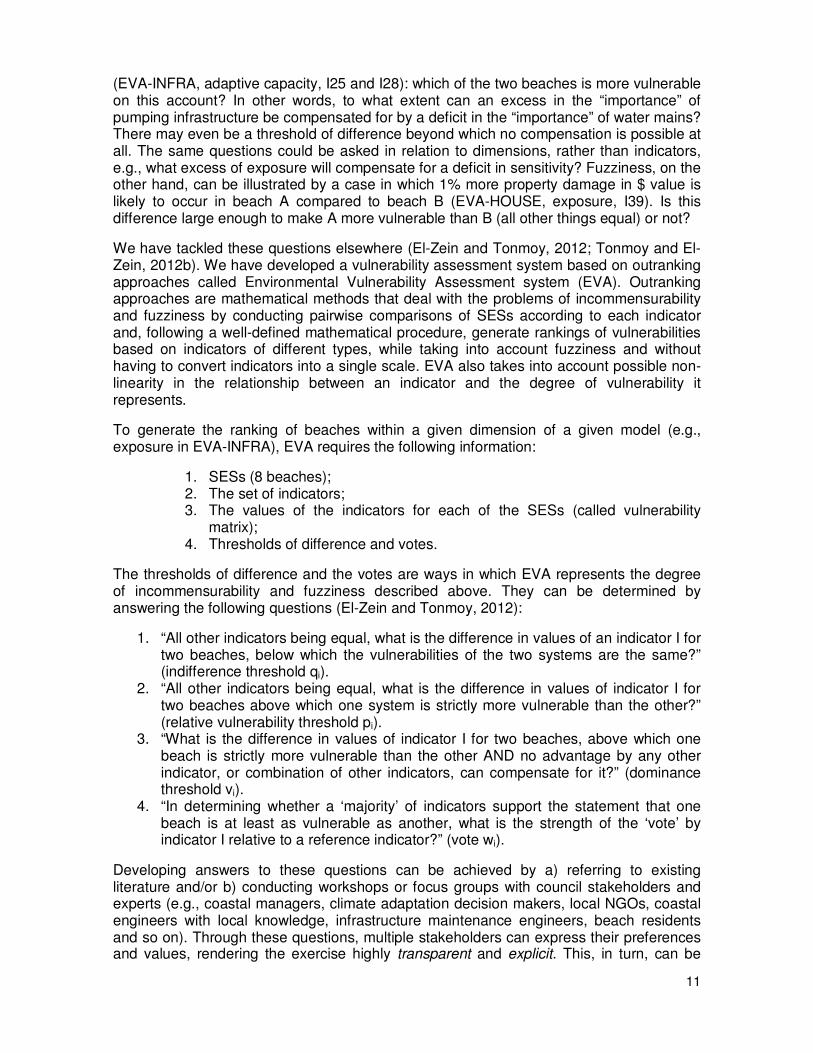
(EVA-INFRA, adaptive capacity, I25 and I28): which of the two beaches is more vulnerable on this account? In other words, to what extent can an excess in the “importance” of pumping infrastructure be compensated for by a deficit in the “importance” of water mains? There may even be a threshold of difference beyond which no compensation is possible at all. The same questions could be asked in relation to dimensions, rather than indicators, e.g., what excess of exposure will compensate for a deficit in sensitivity? Fuzziness, on the other hand, can be illustrated by a case in which 1% more property damage in $ value is likely to occur in beach A compared to beach B (EVA-HOUSE, exposure, I39). Is this difference large enough to make A more vulnerable than B (all other things equal) or not?
We have tackled these questions elsewhere (El-Zein and Tonmoy, 2012; Tonmoy and El-Zein, 2012b). We have developed a vulnerability assessment system based on outranking approaches called Environmental Vulnerability Assessment system (EVA). Outranking approaches are mathematical methods that deal with the problems of incommensurability and fuzziness by conducting pairwise comparisons of SESs according to each indicator and, following a well-defined mathematical procedure, generate rankings of vulnerabilities based on indicators of different types, while taking into account fuzziness and without having to convert indicators into a single scale. EVA also takes into account possible non-linearity in the relationship between an indicator and the degree of vulnerability it represents.
To generate the ranking of beaches within a given dimension of a given model (e.g., exposure in EVA-INFRA), EVA requires the following information:
1. SESs (8 beaches); 2. The set of indicators; 3. The values of the indicators for each of the SESs (called vulnerability
matrix); 4. Thresholds of difference and votes.
The thresholds of difference and the votes are ways in which EVA represents the degree of incommensurability and fuzziness described above. They can be determined by answering the following questions (El-Zein and Tonmoy, 2012):
1. “All other indicators being equal, what is the difference in values of an indicator I for two beaches, below which the vulnerabilities of the two systems are the same?” (indifference threshold qi).
2. “All other indicators being equal, what is the difference in values of indicator I for two beaches above which one system is strictly more vulnerable than the other?” (relative vulnerability threshold pi).
3. “What is the difference in values of indicator I for two beaches, above which one beach is strictly more vulnerable than the other AND no advantage by any other indicator, or combination of other indicators, can compensate for it?” (dominance threshold vi).
4. “In determining whether a ‘majority’ of indicators support the statement that one beach is at least as vulnerable as another, what is the strength of the ‘vote’ by indicator I relative to a reference indicator?” (vote wi).
Developing answers to these questions can be achieved by a) referring to existing literature and/or b) conducting workshops or focus groups with council stakeholders and experts (e.g., coastal managers, climate adaptation decision makers, local NGOs, coastal engineers with local knowledge, infrastructure maintenance engineers, beach residents and so on). Through these questions, multiple stakeholders can express their preferences and values, rendering the exercise highly transparent and explicit. This, in turn, can be

12
immensely valuable for local councils in communicating the scientific basis of their decisions.
We are currently in the process of establishing the vulnerability matrix and the thresholds of difference and votes for the two models. Once these are established, the data will be entered into EVA and rankings generated. The exercise will be conducted for TF1 and TF2.
Applicability of Models
The EVA program can be applied to any indicator-based assessment of vulnerability of any SES to any hazard or combination of hazards. The framework proposed in this paper is specifically targeted at vulnerability of beaches to sea-level rise and associated processes, at local scales. It has been customized for Shoalhaven Council (e.g., in the selected infrastructure categories and the specific indicators used) but can be adjusted to other councils looking at vulnerability assessment at similar scales.
Conclusion
Determining the most suitable climate change adaptation interventions and allocating adaptation resources is a complex policy exercise which carries both technical and political dimensions. It is therefore doubly important that transparent, scientifically-sound methods be used for assessing vulnerability to climate change. These methods should be able to incorporate both physical and socio-economic dimensions of risk and must take into account the participatory, multi-agent, partly subjective and value-laden nature of the assessment exercise. We have proposed such a method for assessing the vulnerability of beaches to sea level rise, at a local scale. The method allows stakeholders to express various forms of preferences which are then incorporated in the assessment exercise, yielding a judgement of vulnerability that is attuned to multiple dimensions of risk.
Acknowledgement:
Fahim Tonmoy is a recipient of an Australian Postgraduate Award (APA) from the Australian federal government. He has also been awarded a top-up scholarship for his Ph.D. studies by the Commonwealth Scientific and Industrial Research Organization (CSIRO) Climate Adaptation Flagship (CAF).
References
AUSTRALIAN BURAU OF STATISTICS. 2003. Census time series profiles, Cat. No. 2003.0, Canberra.
ADAMANTIDIS, C. A., NIELSEN, A. F. & GLATZ, M. 2009. Shoalhaven Coastal Hazard Study- Summary report- prepared by SMEC Australia for Shoalhaven City Council.
ALVES, F. L., DA SILVA, C. P. & PINTO, P. 2007. The Assessment of the Coastal Zone Development at a Regional Level - the Case study of Portugal Central Area. Journal of Coastal Research, 72-76.

13
BLAIKIE P, C. T., DAVIS I, WISNER B 1994. At risk: natural hazards, people's vulnerability, and disasters. , Ruoutledge.
CLARK, G., MOSER, S., RATICK, S., DOW, K., MEYER, W., EMANI, S., JIN, W., KASPERSON, J., KASPERSON, R. & SCHWARZ, H. 1998. Assessing the Vulnerability of Coastal Communities to Extreme Storms: The Case of Revere, MA., USA. Mitigation and Adaptation Strategies for Global Change, 3, 59-82.
CUTTER, S. L. 1996. Vulnerability to environmental hazards. Progress in Human Geography 20, 529–539.
CUTTER, S. L., MITCHELL, J. T. & SCOTT, M. S. 2000. Revealing the vulnerability of people and places: A case study of Georgetown County, South Carolina. Annals of the Association of American Geographers, 90, 713-737.
DURIYAPONG, F. N., K. 2011. Coastal vulnerability assessment: A case study of Samut Sakhon coastal zone. Songklanakarin Journal of Science and Technology, 33, 469-476.
EL-ZEIN, A. & TONMOY, F. N. 2012. Incorporating Uncertainty and Incommensurability in Climate Change Vulnerability Assessments: An Outranking Approach. Climatic Change (Under review).
FLETCHER, M. 2011. Shoalhaven Public Asset Risk Management Review-prepared by BMT WBM Pty Ltd.
GURRAN, N. & BLAKELY, E. 2007. Suffer a Sea Change? Contrasting perspectives towards urban policy and migration in coastal Australia. Australian Geographer, 38, 113-131.
HEMER, M. A. 2009. Identifying Coasts Susceptible to Wave Climate Change. Journal of Coastal Research, 228-232.
HEWITT, K. 1997. Regions of risk: A geographical introduction to disasters, Longman (Harlow).
HINKEL, J. 2011. " Indicators of vulnerability and adaptive capacity": Towards a clarification of the science-policy interface. Global Environmental Change, 21, 198-208.
IPCC, J.J MCCARTHY, O.F CANZIANI, N.A. LEARY, D.J. DOKKEN & (EDS.), K. S. W. 2001. Climate Change 2001: Impacts, Adaptation and Vulnerability. Contribution of Working Group II to the Fourth Assessment Report of the Intergovernmental Panel on Climate Change, Cambridge University Press, Cambridge, UK.
NSW, DEPARTMENT OF ENVIRONMENT CLIMATE CHANGE AND WATER. 2009. NSW Sea Level Rise Policy Statement (accessed at http://www.planning.nsw.gov.au/LinkClick.aspx?fileticket=ukmXcVJesYA%3D&tabid=177 on the 23rd October 2012). Sydney.
OZYURT, G. & ERGIN, A. 2009. Application of Sea Level Rise Vulnerability Assessment Model to Selected Coastal Areas of Turkey. Journal of Coastal Research, 248-251.
TOBIN G & MONTZ B. 1997. Natural hazards: explanation and integration, New York Guildford Press.
TONMOY, F. N. & EL-ZEIN, A. 2012a. Climate Change Vulnerability Assessment by outranking methods: Heat stress in Sydney 6th International Conference on Environmnetal Science and Technology Houston, Texas, USA (In press).
TONMOY, F. N. & EL-ZEIN, A. 2012b. Assessment of vulnerability to climate change using indicators: methodological challenges. In DINCER, I. & COLPAN, C. O. (eds.) "Causes, Impacts, and Solutions to Global Warming", Springer (Under Review).
UNITED NATIONS, DEPARTMENT OF ECONOMIC AND SOCIAL AFFAIRS, POPULATION DIVISION: 2012. World Urbanization Prospects, the 2011 Revision: Highlights. New York.
WU, S.-Y., YARNAL, B. & FISHER, A. 2002. Vulnerability of coastal communities to sea-level rise: a case study of Cape May County, New Jersey, USA. Climate Research, 22, 255-270.