VU Research Portal - Vrije Universiteit Amsterdam
199
VU Research Portal The Determinants of ICT Adoption and Usage among SMEs Kilangi, A.M. 2012 document version Publisher's PDF, also known as Version of record Link to publication in VU Research Portal citation for published version (APA) Kilangi, A. M. (2012). The Determinants of ICT Adoption and Usage among SMEs: The Case of the Tourism Sector in Tanzania. VU University. General rights Copyright and moral rights for the publications made accessible in the public portal are retained by the authors and/or other copyright owners and it is a condition of accessing publications that users recognise and abide by the legal requirements associated with these rights. • Users may download and print one copy of any publication from the public portal for the purpose of private study or research. • You may not further distribute the material or use it for any profit-making activity or commercial gain • You may freely distribute the URL identifying the publication in the public portal ? Take down policy If you believe that this document breaches copyright please contact us providing details, and we will remove access to the work immediately and investigate your claim. E-mail address: [email protected] Download date: 21. Mar. 2022
-
Upload
khangminh22 -
Category
Documents
-
view
0 -
download
0
Transcript of VU Research Portal - Vrije Universiteit Amsterdam

VU Research Portal
The Determinants of ICT Adoption and Usage among SMEs
Kilangi, A.M.
2012
document versionPublisher's PDF, also known as Version of record
Link to publication in VU Research Portal
citation for published version (APA)Kilangi, A. M. (2012). The Determinants of ICT Adoption and Usage among SMEs: The Case of the TourismSector in Tanzania. VU University.
General rightsCopyright and moral rights for the publications made accessible in the public portal are retained by the authors and/or other copyright ownersand it is a condition of accessing publications that users recognise and abide by the legal requirements associated with these rights.
• Users may download and print one copy of any publication from the public portal for the purpose of private study or research. • You may not further distribute the material or use it for any profit-making activity or commercial gain • You may freely distribute the URL identifying the publication in the public portal ?
Take down policyIf you believe that this document breaches copyright please contact us providing details, and we will remove access to the work immediatelyand investigate your claim.
E-mail address:[email protected]
Download date: 21. Mar. 2022

The Determinants of ICT Adoption and Usage among SMEs:
The Case of the Tourism Sector in Tanzania
Albogast Musabila Kilangi


VRIJE UNIVERSITEIT
The Determinants of ICT Adoption and Usage among SMEs:
The Case of the Tourism Sector in Tanzania.
ACADEMISCH PROEFSCHRIFT
ter verkrijging van de graad Doctor aan de Vrije Universiteit Amsterdam,
op gezag van de rector magnificus prof.dr. L.M. Bouter,
in het openbaar te verdedigen ten overstaan van de promotiecommissie
van de faculteit der Economische Wetenschappen en Bedrijfskunde op woensdag 20 juni 2012 om 11.45 uur
in de aula van de universiteit, De Boelelaan 1105
door
Albogast Musabila Kilangi
geboren te Ukerewe, Tanzania

promotoren: prof.dr. E. Masurel
prof.dr.ir. C.A.G.M. van Montfort


i
Table of Contents
Table of Contents ........................................................................................................................................... i
The List of Tables .......................................................................................................................................... iii
The Lists of Figures ........................................................................................................................................ v
Acknowledgement ....................................................................................................................................... vi
Abstract ...................................................................................................................................................... viii
Abstract in Dutch .......................................................................................................................................... x
Abbreviations ............................................................................................................................................... xi
1. Introduction ............................................................................................................................................... 1 1.1 Background to the Research Problem ................................................................................................................. 1 1.2 The Current State of Affairs in Tanzania .............................................................................................................. 4 1.3 Problem Statement ............................................................................................................................................. 7 1.4 Research Objectives ............................................................................................................................................ 9 1.5 Relevance of this Study ..................................................................................................................................... 10 1.6 Key Terms .......................................................................................................................................................... 10 1.7 The Organisation of Chapters in this Study ....................................................................................................... 10
2. Literature Review .................................................................................................................................... 13 2.1 Defining and Conceptualising ICT Adoption and Usage .................................................................................... 13 2.2 SMEs .................................................................................................................................................................. 15 2.3 ICT Adoption ...................................................................................................................................................... 16
3. Conceptual Framework and Hypothesis ................................................................................................. 31 3.1 Criteria Guiding the Conceptual Framework ..................................................................................................... 31 3.2 ICT Adoption in This Study................................................................................................................................. 33 3.3 Hypotheses ........................................................................................................................................................ 34 3.4 Integrated ICT Adoption Model ......................................................................................................................... 42
4. The Tourism Sector in Tanzania ............................................................................................................. 43 4.1 Country Profile .................................................................................................................................................. 43 4.2 The Tourism Sector in Tanzania ........................................................................................................................ 46 4.3 The SMEs Sector in Tanzania ............................................................................................................................. 55 4.4 ICT Development in Tanzania ............................................................................................................................ 58 4.5 The Data Collection Regions .............................................................................................................................. 61
5. Methodology ........................................................................................................................................... 65 5.1 Research Design ................................................................................................................................................ 65 5.2 Designing and Testing the Questionnaire ......................................................................................................... 67 5.3 Data Types and Data Collection Methods ......................................................................................................... 68 5.4 Target Population and Sample Selection........................................................................................................... 71 5.5 Data Analysis ..................................................................................................................................................... 75 5.6 Reliability, Validity and Generalizability ............................................................................................................ 77 5.7 Ethical Issues ..................................................................................................................................................... 79
6. Empirical Results I - Descriptive Statistics .............................................................................................. 81 6.1 Respondents, Firms and ICT Characteristics...................................................................................................... 81
7. The Hypotheses Testing .......................................................................................................................... 93 7.1 Hypotheses Testing and Methodological Choices Made................................................................................... 93 7.2 Measuring the Dependent Variables ................................................................................................................. 93

ii
7.3 Innovation Characteristics, EWA and EWU ....................................................................................................... 96 7.4 Organisational Characteristics, EWA and EWU ............................................................................................... 102 7.5 Environmental Characteristics, EWA and EWU ............................................................................................... 107 7.6 The TOE Characteristics and EWA Integrated Model ...................................................................................... 111 7.7 Overall Hypotheses Testing Summary ............................................................................................................. 119
8. Discussion .............................................................................................................................................. 121 8.1 The Preliminary Discussion .............................................................................................................................. 121 8.2 Innovation Characteristics and ICT Adoption .................................................................................................. 124 8.3 Organisational Characteristics and ICT Adoption ............................................................................................ 128 8.4 Environmental Characteristics and ICT Adoption ............................................................................................ 130 8.5 The TOE Characteristics Indirect Effects on EWA ............................................................................................ 134
9. Conclusions, Implications, Limitations and Future Research ............................................................... 137 9.1 Introduction ..................................................................................................................................................... 137 9.2 Conclusions ...................................................................................................................................................... 137 9.3 Implications of the Study ................................................................................................................................. 140 9.4 Limitations of the Study .................................................................................................................................. 144 9.5 Suggestions for Future Research ..................................................................................................................... 144
Bibliography .............................................................................................................................................. 145
Appendices ................................................................................................................................................ 165 Appendix I: Questionnaire ..................................................................................................................................... 165 Appendix II: Introduction letter from Mzumbe University.................................................................................... 175 Appendix III: Introduction letter from Commission for Tourism ........................................................................... 176 Appendix IV: Internet Access in Tanzania ............................................................................................................. 177 Appendix V: Integrated TOE and EWA Multiple Regression Analysis.................................................................... 178 Appendix VI: Integrated TOE and EWU Multiple Regression Analysis .................................................................. 178

iii
The List of Tables
Table 2-1: European Union SMEs definition ................................................................................................................ 15 Table 2-2: Categories of SMEs in Tanzania .................................................................................................................. 15 Table 4-1. Tourists Arrivals and Receipts in Tanzania .................................................................................................. 49 Table 4-2. Tourists Arrivals by Mode of Transport ...................................................................................................... 50 Table 4-3. Arrivals by Purpose of Visit ........................................................................................................................ 50 Table 5-1. TCT Members Summary .............................................................................................................................. 72 Table 5-2. TALA Licence Types for 2008 ....................................................................................................................... 72 Table 5-3. TALA Licence numbers for 2008 ................................................................................................................ 72 Table 5-4. The Gross and Net Response Rate .............................................................................................................. 75 Table 5-5. Sample by Business Type ............................................................................................................................ 75 Table 5-6. Characteristics in Samples .......................................................................................................................... 75 Table 6-1. Age .............................................................................................................................................................. 81 Table 6-2. Gender ........................................................................................................................................................ 82 Table 6-3. Educational Level ........................................................................................................................................ 82 Table 6-4. ICT Competences ......................................................................................................................................... 83 Table 6-5. Firms Ownership ......................................................................................................................................... 83 Table 6-6. Job Titles ..................................................................................................................................................... 83 Table 6-7. Legal Status ................................................................................................................................................. 84 Table 6-8. Firm Age ...................................................................................................................................................... 84 Table 6-9. Number of Employees ................................................................................................................................. 85 Table 6-10. Firm Location ............................................................................................................................................ 85 Table 6-11. Annual Revenues Estimate........................................................................................................................ 86 Table 6-12. The Annual Capital Investment Estimates ................................................................................................ 86 Table 6-13. Collaboration with Large Firms ................................................................................................................ 87 Table 6-14. Collaboration with Trading Partners......................................................................................................... 87 Table 6-15. ICT Adoption Level .................................................................................................................................... 87 Table 6-16. ICT Adoption Level (Recoded) ................................................................................................................... 88 Table 6-17. Organisational ICT Experience .................................................................................................................. 88 Table 6-18. ICT Budget Estimate .................................................................................................................................. 89 Table 6-19. Internet Services Access ............................................................................................................................ 89 Table 6-20. ICT Adoption Decision-Maker ................................................................................................................... 89 Table 6-21. Percentage of Employees using ICT .......................................................................................................... 90 Table 6-22. ICT Technical Services Support .................................................................................................................. 90 Table 6-23 E-mail and Web Technology Usage .......................................................................................................... 91 Table 7-1 EWU Rotated Matrix and Scale Analysis...................................................................................................... 95 Table 7-2 EWU Summated Scale Correlations ............................................................................................................ 96 Table 7-3 Innovation Characteristics Rotation Matrix, Eigen Value and Scale Analysis .............................................. 98 Table 7-4 Innovation Characteristics Summated Scale Correlations .......................................................................... 99 Table 7-5 Innovation Characteristics and EWA – Multiple Regression Analysis .......................................................... 99 Table 7-6 Innovation Characteristics and EWU - Multiple Regression Analysis ........................................................ 101 Table 7-7 Summary of Innovation Characteristics and EWA Hypotheses Testing ..................................................... 102 Table 7-8 Summary of Innovation Characteristics and EWU - Hypotheses Testing ................................................... 102 Table 7-9 The Organisational Characteristics Rotation Matrix, Eigen Value and Scale Analysis ............................... 104 Table 7-10 The Organisational Characteristics Summated Scale Correlations .......................................................... 104 Table 7-11 Organisational Characteristics and EWA– Multiple Regression Analysis ................................................ 104 Table 7-12 Organisational Characteristics and EWU - Multiple Regression Analysis ................................................ 105 Table 7-13 Summary of Organisational Characteristics and EWA Hypotheses Testing ............................................. 106 Table 7-14 A Summary of OC and EWU - Hypotheses testing ................................................................................... 106 Table 7-15 The Environmental Characteristics Rotation Matrix, Eigen Value and Scale Analysis ............................. 108

iv
Table 7-16 The Environmental Characteristics - Summated Scale Correlations ........................................................ 108 Table 7-17 The Environmental characteristics and EWA – Multiple Regression ....................................................... 109 Table 7-18 The Environmental Characteristics and EWU - Multiple Regressions ...................................................... 110 Table 7-19 A Summary of Environment Characteristics and EWA Hypotheses testing ............................................. 110 Table 7-20 A Summary of EC and EWU- Hypotheses testing ..................................................................................... 111 Table 7-21 The Correlations of the Innovation and Organisational Characteristics .................................................. 114 Table 7-22 The Combined EWA – Multiple Regression Analysis ................................................................................ 115 Table 7-23 Standardized Model Effects ..................................................................................................................... 117 Table 7-24 The TOE Characteristics and EWA- Direct Relationships .......................................................................... 119 Table 7-25 Summary of all Hypotheses Testing ......................................................................................................... 119

v
The Lists of Figures
Figure 2-1: DTI adaption ladder UK Online .................................................................................................................. 13 Figure 2-2. A Model of Five Stages in the Innovation Decision Process ....................................................................... 18 Figure 3-1 Innovation Characteristics Influencing ICT Adoption and Usage Intensity ................................................. 35 Figure 3-2 Organisational Characteristics Influencing Adoption and Usage Intensity ................................................ 38 Figure 3-3 External Environment Characteristics influencing Adoption and Usage Intensity ...................................... 40 Figure 3-4 TOE Characteristics Integrated Research framework ................................................................................. 42 Figure 4-1. Africa ......................................................................................................................................................... 43 Figure 4-2. The Tanzania Emblem ............................................................................................................................... 44 Figure 4-3. Tanzania Flag............................................................................................................................................. 44 Figure 4-4. Uhuru Touch .............................................................................................................................................. 45 Figure 4-5. The Maasai People .................................................................................................................................... 46 Figure 4-6. A map of Tourism Attractions .................................................................................................................... 47 Figure 4-7. Visitors Arrivals in Tanzania (1972 – 1996) ............................................................................................... 48 Figure 4-8. Tanzania Tourism Sector ........................................................................................................................... 51 Figure 4-9. Organisation Chart of the Tourism Division (MNRT) ................................................................................. 52 Figure 4-10. ZATI Office – Zanzibar .............................................................................................................................. 55 Figure 4-11. African Undersea Cables (2012) .............................................................................................................. 59 Figure 4-12. Data Collections Regions ......................................................................................................................... 61 Figure 4-13. Dar es Salaam Map ................................................................................................................................. 61 Figure 4-14. Dar es Salaam View ................................................................................................................................. 62 Figure 4-15. The Arusha Region Map .......................................................................................................................... 63 Figure 4-16. The Kilimanjaro Region Map .................................................................................................................. 63 Figure 4-17. The Unguja Island .................................................................................................................................... 64 Figure 5-1. Research Steps ........................................................................................................................................... 67 Figure 7-1 Innovation Characteristics and EWA Revisited ........................................................................................... 97 Figure 7-2 Innovation Characteristics and EWU– Revisited ....................................................................................... 100 Figure 7-3 Organisational characteristics and EWA– Revisited ................................................................................. 103 Figure 7-4 Organisational Characteristics and EWU– Revisited ................................................................................ 105 Figure 7-5 External Environmental characteristics and EWA– Revisited ................................................................... 107 Figure 7-6 External Environmental Characteristics and EWU– revisited ................................................................... 109 Figure 7-7 The TOE and EWA integrated Research Model – Revisited ..................................................................... 112 Figure 7-8 The TOE Confirmatory Factor Analysis .................................................................................................... 116 Figure 7-9 The TOE and EWA Structural Model (SEM) .............................................................................................. 117 Figure 7-10 The final TOE and EWA Integrated Model ............................................................................................. 118

vi
Acknowledgement
My PhD journey started four years ago, when I and Nsubili Isaga (my wife) sat down in front of our house under a “Mzambarau" tree discussing PhD calls to the NUFFIC. I immediately felt the importance of my wife in the PhD journey, because she was responsible for “fine tuning” my PhD concept paper. I never imagined that I was postponing my family life for four years. I now believe that any PhD thesis cannot be successfully written without many people and organisations helping in various ways the completion of the study programme. The success of my PhD thesis could not be easily attained without the co-operation and assistance that I was accorded by everyone who was connected to my PhD project. I would first and foremost like to express my sincere gratitude on my own behalf and on the behalf of my lovely family to the Netherlands Organisation for International Corporation in Higher Education (NUFFIC) for funding my PhD program through the MUMBA project. The MUMBA project aimed at strengthening Mzumbe University in delivering high quality business education and related research. I would also like to thank my Mzumbe University management for allowing me to pursue the PhD programme in Netherlands. Special thanks should go to Prof. Joseph Kuzilwa (the Vice Chancellor), Dr. Joseph Kimeme (the Dean of the Faculty of Commerce) and Mr. Aloyce Mlolere (the Head of the Department – Procurement and Logistic Management). Special thanks go to my supervisors Prof. Enno Masurel and Prof. Kees van Montfort for their tireless assistance in taking time to lead me and supervise the PhD Project. Their committed supervision was not only a prerequisite for the success of my PhD project, but also a life time inspiration of my career as a lecturer. I am also thankful to Prof. Wim Naudé for his valuable comments during the PhD progress presentation at VU University Amsterdam (VUA). I would like to thank the Faculty of Economics and Business Administration, especially the Amsterdam Centre for Entrepreneurship at VU (ACE@VU) that housed me during the whole period of my research. Special thanks to Helen Couwenberg, Petra de Groot, and Patricia van Hemert for having provided a conducive working environment at VUA. Their everlasting smiles and daily sense of humour made me feel home every time I was at ACE@VU. I would also like to thank the Centre for International Cooperation (CIS) that hosted the MUMBA project. Special appreciations should go to Esther den Hartog for receiving me when I arrived in the Netherlands and showing me the way to Uilenstede and to VUA. I would like also to thank the project coordinator Egide Maassen and Dia Eek for taking care of me financially. I am also indebted to Marissa Popma for giving me a home. I will never forget Wim van Dongen for showing me the mechanisms of fixing computer problems. I am also very much indebted to the staff of the Tourism Confederation of Tanzania (TCT) for their assistance in accessing the SMEs information in the tourism sector in Tanzania. I am very much thankful to Mr. Richard Lugimbana (executive secretary - TCT), Mr. Mustapha Akunaay (executive secretary – Tanzania Association of Tour Operators -TATO), Mr. Tehsin Takim (executive secretary – Tanzania Society of Travel Agents - TASOTA). Special thanks go to Flora Rungu (Dar es Salaam), John Bennett (Kilimanjaro), Ndamungu Mzee (Zanzibar) and Ali Mwinyimkuu (Zanzibar), for their personal assistance during data collection. I am also indebted to all the SMEs officials who took time to fill in my questionnaires, and shared with me their valuable time. Without the participation of the SMEs, this research would not have been completed. I am also thankful to all the government institutions that accorded me important information about tourism development in Tanzania (Ministry of Natural Resources and Tourism), SMEs development (Ministry of Industry Trade and Marketing), and ICT development (Ministry of Communication, Science and Technology). Many thanks to: Aloyce Mlolere,

vii
Dominick Msabila and John Kowa for their diligent support in correcting my grammatical mistakes in English. Your support was very important in rectifying my multi-lingual based sentences. I would particularly like to thank Dr. Jennifer Sessabo, who inspired me all the time when I could not think beyond the PhD challenges. Special thanks to my inspirator, my deceased father (Appollinary Kussaya) and my supporting mother Justina Mtundu. I would like also to extend my heartfelt thanks to my brothers and sisters (Annastazia, Jema, Gelard, Revocatus, Gambo, Baraka, Musaganya, Shukuru, Patrick and Esther). I am also thankful to my in-laws (Gwantwa Mwalukasa and Asombilwe Isaga) for their vital support and taking care of my family when I was away. Their family (Tuse, Tusa, Martha, Tupo, Neema and Faraja) was encouraging support to me. I wish they were the next PhD candidates. It is almost impossible to mention each and every person who assisted me in my PhD project. I would like to thank all indistinguishable people, friends, colleagues and the many acquaintances from VUA and Mzumbe University who were always providing words of support, encouragement and help. Their contributions meant a lot to me, especially in knowing that I have people around me who believed in what I was doing. Lastly but not the least, I wish to extend my heartily thanks to my family. My wife (Nsubili) and my children (Carvin, Kelvin and Kenneth) for the moral as well as material support which they rendered me during the whole period of study. Their tolerance for my extended absence at home was the very important contribution towards the accomplishment of this task. I will never forget when Kenneth (the youngest son) asked me to take him with me to the Netherlands because he was tired of the promises that daddy could soon be done with his PhD and stay home with him. My closest PhD co-student and my lovely wife deserves special gratitude because she never stopped being my wife, even during the times when her supervisors wanted her to meet the submission deadlines. She is my lifetime encouragement for being there when I needed her the most, even though she was also struggling with her own PhD project. To my wife;
“I will always cherish the love and support you accorded me and my family during the entire
journey of my life since I married you”
Musabila A.K VU University Amsterdam

viii
Abstract
Increased Information and Communication Technology (ICT) adoption among small and medium-sized enterprises (SMEs) has enhanced the ability of firms to gain competitive advantage not only locally, but also in the international markets. In recent years, we have witnessed significant ICT developments among SMEs in developing countries. This study examined the factors influencing ICT adoption, as well as its usage among SMEs in the tourism sector in Tanzania. The study took into consideration the Technology-Organisation-Environmental (TOE) characteristics influencing the adoption and usage of ICT among SMEs. The study also examined the indirect effects among TOE characteristics on the adoption of ICT among the SMEs. The term ICT in this study is also used to refer to other information technology terminologies used in the innovation literature, for example, e-commerce, e-business, the internet, and web technologies. We also use the term entrepreneur and owner-manager interchangeably. Our study aimed at filling the empirical gap by studying the factors influencing or limiting ICT adoption and usage among SMEs in the tourism sector in Tanzania. A review of the literature showed that there is little empirical research conducted in Tanzania focusing on ICT adoption and usage among SMEs. The study also sheds light on the conflicting conclusions drawn in previous ICT adoption and utilisation studies. Data collection was carried out in Tanzania. The key informants were the individuals responsible for making decisions on matters related to ICT adoption and usage within their SMEs. In this regard, a questionnaire-based survey was used to collect data from 338 SMEs. However, 295 questionnaires qualified for the data analysis. The net actual figures indicate that Arusha was represented by 86 SMEs, Dar es Salaam was represented by 62 SMEs, Zanzibar was represented by 94 SMEs, and Kilimanjaro was represented by 53 SMEs. The profiles of the respondents and the organisations were analysed using descriptive statistics. The descriptive statistics include techniques such as: sample dispersion measurements, sample distribution measures, central tendency measures, and tabulations techniques. The testing of the hypotheses involved several data analysis techniques which included correlation analysis, factor analysis, multiple regression analysis and structural equation modelling (SEM). The study findings indicate that most of the SMEs have adopted e-mail and some basic applications of web technologies. This study has also confirmed that the private sector is leading in the ICT initiatives. The study continues with factors influencing the adoption of e-mail and web technologies (EWA). Among the ten factors tested, it was found that only compatibility, organisational e-resources and competitive pressure significantly influence EWA. Additionally, EWA is indirectly determined by competitive pressure mediated by organisational e-resources. On the other hand, we find varying conclusions on the effects of TOE characteristics on the usage of e-mail and web technologies (EWU). We classified EWU along business communication, online presence, and online trading. The significant factors influencing business communication include: relative advantage, compatibility, complexity, organisational e-resources, top management support, competitive pressure and technological support. Online presence is influenced by relative advantage, complexity, organisational e-resources, top management support, competitive pressure and non-technological support. Online trading is influenced by compatibility, organisational e-resources, top management support, competitive pressure and technological support.

ix
Our study has implications to various stakeholders involved in ICT and the tourism business in Tanzania as well as the research community. The theoretical implications provide the benefits of the study in the ICT adoption and diffusion literature. The practical implications apply to SMEs, training institutions, ICT vendors and consultants, and the government of Tanzania.

x
Abstract in Dutch
Adoptie en gebruik van Informatie en Communicatie Technologie (ICT) door kleine en middelgrote ondernemingen stelt hen in staat belangrijke concurrentievoordelen te behalen, niet alleen in de nationale markt maar ook in de internationale markt. In de afgelopen jaren hebben zich ook in ontwikkelingslanden belangrijke ICT-ontwikkelingen voltrokken. In dit proefschrift worden de factoren bestudeerd die van invloed zijn op adoptie en gebruik van ICT door kleine en middelgrote ondernemingen in de toerisme sector in Tanzania. De zogeheten TOE-kenmerken zijn hierbij als uitgangspunt genomen (TOE staat voor Technology-Organization-Environment). Niet alleen de directe effecten zijn bestudeerd, ook is gekeken naar de indirecte effecten die de ICT-adoptie. Er is nagenoeg niets bekend over de adoptie en het gebruik van ICT door kleine en middelgrote ondernemingen in de toerisme sector in Tanzania. Op basis van uitgebreid literatuuronderzoek zijn de uitgangspunten voor het veldwerk in Tanzania bepaald. Op bedrijfsniveau is informatie verzameld bij degenen die binnen het bedrijf verantwoordelijk zijn voor de beslissingen met betrekking tot ICT adoptie en gebruik. In totaal hebben 295 ondernemingen aan het onderzoek meegewerkt. Uit het onderzoek blijkt dat de meeste ondernemingen email en een vrij basaal niveau van webtechnologie hebben geadopteerd. Ook blijkt uit het onderzoek dat in Tanzania niet de overheid maar de private sector leidend is in de ontwikkeling van ICT in het land. Voor wat betreft de adoptie van email en webtechnologie blijkt dat van de tien potentieel verklarende factoren alleen compatibiliteit van de innovatie met de organisatie, beschikbaarheid van bronnen binnen de organisatie en concurrentiedruk de adoptie in positieve zin beïnvloeden. Aanvullend is aangetoond dat de adoptie indirect ook wordt bepaald door concurrentiedruk in combinatie met beschikbaarheid van bronnen binnen de organsiatie. Anderzijds is de invloed van de TOE-kenmerken op het gebruik van email en web technologie onderzocht. Dit gebruik is geclassificeerd aan de hand van zakelijke communicatie, online aanwezigheid en online zaken doen. Zakelijke communicatie blijkt te worden beïnvloed door het relatieve voordeel van de innovatie, compatibiliteit van de innovatie met de organisatie, complexiteit van de innovatie, beschikbaarheid van bronnen binnen de organisatie, steun van het top management, concurrentiedruk en technologische ondersteuning. Online aanwezigheid blijkt te worden beïnvloed door het relatieve voordeel van de innovatie, complexiteit van de innovatie, aanwezigheid van bronnen binnen de organisatie, steun van het top management, concurrentiedruk, en niet-technologische ondersteuning. Online zaken doen blijkt te worden beïnvloed door compatibiliteit van de innovatie met de organisatie, aanwezigheid van bronnen binnen de organisatie, steun van het top management, concurrentiedruk en technologische ondersteuning. Het verrichte onderzoek heeft theoretische en praktische implicaties. De theoretische implicaties betreffen het verleggen van de grenzen in onderzoek. De praktische implicaties hebben betrekking op de kleine en middelgrote ondernemingen zelf, op trainingsinstituten, ICT verkopers en de Tanzaniaanse overheid.

xi
Abbreviations
AGFI Adjusted Goodness of Fit Index AICC The Arusha International Conference Centre BAKITA National Council of Kiswahili BEST Business Environment Strengthening for Tanzania BOT Bank of Tanzania BRELA Business Registration and Licensing Agency CAMARTEC Centre for Agricultural Mechanization Rural Technology CBT Compatibility CFA Confirmatory Factor Analysis CR Critical Ration CRDB Cooperative and Rural Development Bank CRS Computer Reservation System CTI Confederation of Trade and Industries DF Degree of Freedom DOI Diffusion of Innovation DRC Democratic Republic of Congo DTI Department of Trade and Industry EAC East Africa Community EDI Electronic Data Interchange ERP Economic Recovery Programme ESAP Economic and Social Action Programme EWA E-mail and Web Technologies Adoption EWU E-mail and Web Technologies Usage Intensity GDP Gross Domestic Product GDS Global Distribution System GFI Goodness-of-Fit Index GoT Government of Tanzania HAT Hotel Association of Tanzania HKAT Hotel Keepers Association of Tanzania HTTI Hotel and Tourism Training Institute IATA International Air Transport Association ICT Information and Communication Technology ILO International Labour Organisation IMF International Monetary Fund IPC Investment Promotion Centres IPI Institute of Production Innovation ISP Internet Service Providers ITTA Intra-Africa Travel & Tourism Association MCST Ministry of Communication, Science and Technology MITM Ministry of Industry Trade and Marketing MKURABITA Property and Business Formalization Programme MLE Maximum Likelihood Estimation MNRT Ministry of Natural Resources and Tourism MPEE Ministry of Planning, Economy and Empowerment NBC National Bank of Commerce NBS National Bureau of Statistics

xii
NTP National Telecommunication Policy NUFFIC Netherlands Organisation for International Cooperation in Higher Education NWA Northern Wildlife Areas OC Organisational Characteristics OR Organisational E-resources RBT Resource-Based Theory RMSEA Root Mean Square Error of Approximation SCF SMEs Competitive Facility SECP Small Enterprise Computerization Programme SEM Structural Equation Modelling SIDA Swedish International Development Cooperation Agency SIDO Small Industries Development Organisation SMEs Small and Medium-sized Enterprises TAHI Tanzania Hotels and Investment Corporation TAHOA Tanzania Hunting Operators Association TALA Tourist Agency Licensing Authority TAOA Tanzania Air Operators Association TASISO Tanzania Small Industries Organisation TASOTA Tanzania Society of Travel Agents TATO Tanzania Association of Tour Operators TBS Tanzania Bureau of Statistics TCRA Tanzania Communications Regulatory Authority TCT Tanzania Confederation of Tourism TEMDO Tanzania Engineering and Manufacturing Design Organisation TIC Tanzania Investment Centre TIRDO Tanzania Industrial Research Development Organisation TNTB Tanzania National Tourist Board TOE Technology Organisation Environment TPHA Tanzania Professional Hunters Association TPTC Tanzania Post and Telecommunication Corporation TTB Tanzania Tourism Board TTC Tanzania Tourist Corporation TTCL Tanzania Telecommunication Company Ltd TTGA Tanzania Tour Guides Association TTLB Tanzania Tourism Licensing Board UDEC University of Dar es Salaam Entrepreneurship Centre UN United Nations UNCTAD United Nations Conference on Trade and Development URT United Republic of Tanzania VIBINDO Vikundi vya Biashara NdogoNdogo ZATI Zanzibar Tourism Investors Association ZCT Zanzibar Commission of Tourism


1
1. Introduction
This PhD dissertation presents an explanation of the factors influencing ICT adoption as well as its usage among SMEs in tourism sector in Tanzania. The introduction chapter starts by detailing the historical background of the research problem. The chapter discusses the on-going research debates and trends on ICT adoption and the extent of ICT usage among SMEs. The chapter also presents the problem statement, the research objectives, and hypotheses. In Chapter 1, we also define the central key variables used in this study. The chapter also discusses the relevance of this study to future researchers, entrepreneurs, government institutions and other interested stakeholders in ICT adoption and the extent of ICT usage among SMEs in the tourism sector in Tanzania. The chapter ends by presenting the dissertation structure.
1.1 Background to the Research Problem SMEs are increasingly becoming a vital part of the economies of both developed and developing countries (Duncombe and Heeks, 1999; Kuzilwa, 2005; Margi et al., 2000; Tagliavini et al., 2001). SMEs play a crucial role in employment creation and income generation in many countries. Therefore, they contribute considerably to the welfare and sustainability of these communities. The importance of SMEs in the economy is well substantiated in the literature, for example:
In the USA, SMEs represent 99.7% of all firms and employ more than 50% of all private sector employees, and present 44% of total USA private payroll (Kobe, 2007);
In the UK, SMEs account for approximately 99% of all enterprises and employ 39.9% of all employees (BIS, 2008);
In Tanzania, SMEs account for 30% of the Gross Domestic Product (GDP) and employ more than 20% of the labour force1 (URT, 1991b).
In developing countries, we find that SMEs can easily be established since their requirements in terms of capital, technology, management, and utilities are not as demanding as those of the large enterprises (URT, 2003b). The United Nations (UN) distinguishes a number of least developed countries in the world, based on gross national income per capita, human assets, and economic vulnerability (UNCTAD, 2008:37). Tanzania is classified as one of the least developed countries (UNCTAD, 2008: 20). In this study we are using the term “least developed countries” and “developing countries” interchangeably. Therefore, growth and survival of SMEs are among the top institutional agenda of the Tanzanian government. In recent years, the adoption and usage of ICT among SMEs has received special attention as a competitive strategy for their sustainable development (King and Konsynski, 1990; King et al., 1994). The SMEs stand a better chance of adopting new technologies as they are small, flexible and quick to adjust to business environment changes as compared to large organisations (see, for example: Molla and Licker, 2005a; Rogers, 2003; Rothwell and Zegveld, 1982). The advent of internet and the World Wide Web in business has revolutionised the business processes in large organisations as well as in SMEs. The decrease in costs associated with doing business on the internet has enabled SMEs to participate in the global market. Rao et al. (2003) suggest that there is undeniably evidence that ICT (e-commerce) contributes to SMEs competitive advantages because of their flexibility, adaptability, and innovative nature. In the current business environment, most of the SMEs in both developed and
1 The interview with SIDO management during the expert interview revealed that the last nation-wide SMEs study was carried
out in the early 1990s. In the recent years, SIDO has not conducted any study on SMEs at national and sectoral level due to lack of funds.

2
developing countries do not have a choice to deploy the internet in their business process if they want to stay in a competitive advantage position, as Porter (2001) suggests:
“The question is not whether to deploy internet technology – companies have no choice if they want to stay competitive – but how to deploy it”……… “Internet technology provides better opportunities for companies to establish distinctive strategic positioning than did previous generations of information technology” (Porter, 2001: 3)
There are significant financial contributions gained by the adoption and usage of ICT. For example, Germany, France and UK spent almost $ 106 billion on e-commerce in 2000. Rusten and Cornford (2003) argue that in 2003 the e-commerce sales doubled in London just after one year when the e-commerce was adopted. We also find that the government of Singapore is strongly supporting e-commerce initiatives (Kendall et al., 2001). The government has established the Electronic Commerce Hotbed (ECH) project. This project aims at bringing together the major e-commerce players in order to hasten the realisation of e-commerce in Singapore. Despite the competitive and financial gains by SMEs from adopting and using ICT, there is an on-going debate on what factors really determine its adoption and usage. Some of the previous studies have used a variety of theories to explain the ICT adoption and usage among SMEs especially in developed countries. However, the current research trend indicates that such studies do not provide a comprehensive explanation of ICT adoption and usage among SMEs (Parker and Castleman, 2009). Some of the examples of theories used to explain ICT adoption and usage among SMEs include:
The theory of planned behaviour (TPB) by Ajzen (1991); The theory of reasoned action (TRA) by Davis1989); The technology acceptance model (TAM) by Venkatesh and Davis, 2000); Diffusion of innovation theory (DOI) by Rogers (1995) and Rogers (2003); Porter’s models (strategies, industry forces and value chain analysis) by Porter (2001); The resource based theory (RBT) by Caldeira and Ward (2003) and Penrose (1959).
Parker and Castleman (2009) carried out a study critically analysing the theories guiding e-business adoption by SMEs. Their findings indicated that most of the previous studies used one to three theories to explain the factors influencing e-commerce adoption among SMEs. However, such models did not address all the internal as well as external complexities associated with ICT adoption and usage among SMEs. We also find a rich body of meta-data studies carried out to examine the trend of ICT adoption by SMEs. Premkumar (2003) carried out a meta-analysis of research on ICT implementation among SMEs. The author developed an integrated research framework to examine the previous studies in ICT implementation among SMEs. Their study revealed that competitive pressure, top management and organisation size were important variables explaining ICT implementation among SMEs. Teo et al. (2004) adopted an integrated research approach (based on technological, environmental and organisational factors) to review the previous studies on ICT adoption and usage by SMEs. The authors conclude that all the factors studied could be categorized into eight factors namely: perceived relative advantage2, perceived compatibility, perceived complexity, knowledge and expertise about e-commerce, management attitudes towards e-commerce, external change agents, pressures from trading partners,
2 In some cases we are using the term relative advantage to refer to perceived relative advantage.

3
and pressures from competitors. The authors also suggest examining the interrelationship among the predicting factors (see also: Frambach and Schillewaert, 2002).
On the other hand, Jeyaraj et al. (2006) found that the best forecasters of ICT adoption by organisations were top management support, external pressure, information system (IS) unit professionalism, and external information sources. However, the innovation characteristics and organisational characteristics at the aggregate level have continued to be the significant determiners of ICT adoption and usage at the organisation level in most of the studies reviewed. Recently, Rodriguez-Ardura and Meseguer-Artola (2010) confirmed the validity of using the integrative approach in explaining the adoption of ICT in business. As we have seen, researchers in ICT have put in significant efforts to explain the factors influencing ICT adoption and usage by the SMEs. However, the inherent characteristics of SMEs make it difficult to develop a generalized or unified ICT adoption and usage theory. The literature has shown that SMEs have diverse inherent characteristics, for example: organisational size, location, and resource availability (see, for example: Acar et al., 2005; Claessen, 2005; Garengo et al., 2005; Van Hoorn, 1979; Welsh and White, 1981). We first examine the differences of SMEs based on the organisational size. The SMEs are quite different from large organisations as:
They have relatively flat organisation structures; They are less formalised; Their operation standards and rules are not well documented; They depend largely on external party assistance on issues related to ICT (Premkumar, 2003).
The entrepreneurs (also called owner-managers in this thesis) play a distinctive role in defining the characteristics of SMEs (Lee and Runge, 2001). The orientations of SMEs towards ICT adoption and usage depend on the orientation of the owner-managers towards ICT. In large organisations, more is formalised and the operations of the organisations are guided by written standards and rules (Zaltman et al., 1973). Therefore, we argue that the ICT adoption and usage models developed in large organisations may not be an exact fit in the SMEs context (see also: Lee and Runge, 2001). The location of SMEs also plays a distinctive role in differentiating one firm from another. The SMEs located in developed countries are not only defined using different criteria, but also the environment surrounding their operations is quite different from those located in developing countries. Even in the literature, most of the ICT adoption and usage studies published are carried out in developed countries (see for example: Del Aguila-Obra and Padilla-Melendez, 2006; Kendall et al., 2001; Van der Veen, 2004). The SMEs located in developed countries have advanced ICT infrastructure, higher ICT education levels, a high possibility of getting funded, low cost of internet connectivity, and different cultural backgrounds. To the contrary, we find limited studies in developing countries, for example on e-commerce adoption among SMEs in South Africa by Molla and Licker (2004), Chile by Nasco et al. (2008), and Kenya by Migiro (2006). Therefore, the ICT adoption and usage models developed in the European context may not exactly fit in the developing countries due to contextual issues. In the third case, we find that ICT itself is a revolving and dynamic product with distinctive unique characteristics. The current ICT trend is characterized by: reduced ICT equipment prices, increased communication and technology convergence, increased portability among ICT facilities, and improved ICT products (user-friendly software such as Microsoft packages) (Foong, 1999). Such technological changes have made ICT adoption affordable to SMEs. Today, some of the SMEs in developing countries are also able to afford internet connectivity as compared to the early 1990s (see also Appendix IV). The increase in ICT adoption is also fuelled by efforts to learn ICT applications, increased portability of mobile internet connectivity, and increased competition among internet service providers (URT, 2009a).

4
We also argue that the ICT adoption studies carried out among SMEs during the 1980s and 1990s were addressing a different context of ICT in terms of functionalities and possibilities as compared to the SMEs in the 2000s. Therefore, there is a need to review the previous studies on ICT adoption and usage by incorporating new technological features. At the same time, it is imperative to test these technologies on what can be supported in developing countries. In the fourth case, we find that there is no universal ICT definition. The commonly used terms refer to the different levels of ICT adoption. These include among others:
E-mail adoption (Hashim et al., 2010); Web technologies adoption (Cheung et al., 2000); Intranet adoption (Damsgaard and Scheepers, 2000); Internet adoption (Dholakia and Kshetri, 2004); EDI adoption (Damsgaard and Lyytinen, 1996); E-commerce adoption (Molla and Licker, 2005b); E-business adoption (Mendo and Fitzgerald, 2005); ICT adoption (Shiels et al., 2003).
The variations of ICT adoption and usage levels may be familiar to SMEs in developed countries. SMEs in developing countries face even more difficulties which hinder them from adopting and using ICT in their businesses. Mbamba (2006) points out that the lack of e-banking services in most of the developing countries seriously hampers the adoption and usage of ICT in those countries. We also find variations in terms of how ICT adoption is conceptualized and measured. The two levels of adopt or not to adopt present the lowest measure of identifying whether an organisation has adopted the ICT innovation. Other ICT adoption measures discussed in literature are: the extent of use, number of applications used, nature of use, and appropriateness of use (see, for example: Petter et al., 2008; Van der Veen, 2004). The presence of variations in defining and measuring ICT adoption makes it hard to compare ICT adoption and usage studies across the developed world and the developing world. The sources of SMEs differences we have examined above require the current ICT adoption and usage studies to take into account the complexities of the SMEs embodied in their inherent characteristics as well as contextual issues (see also: Parker and Castleman, 2007). In order to provide comprehensive answers to the question as to why SMEs adopt ICT innovation in developing countries, we have provided an integrative theoretical approach. This approach includes not only the innovation and organisational factors, but also the environmental factors surrounding the SMEs in developing countries. More important, we suggest the need to examine the interactive impact of TOE characteristics on adoption of ICT in first and second order (see, for example: Frambach and Schillewaert, 2002; Lin, 2006; Teo et al., 2004).
1.2 The Current State of Affairs in Tanzania
1.2.1 SMEs Development in Tanzania The SMEs history in Tanzania goes back to the period after its independence in 1961. Tanzania adopted a socialist ideology in which the state controlled most of the economic and business activities. During the post-independence era, the government business activities and initiatives focused much on large-scale production and import substitution with locally produced goods (Curry, 1990). The government controlled the tourism sector and the Tanzania Tourist Corporation (TTC) was the only institution responsible for running and controlling all the properties and hotels that were available (Wade et al., 2001). The government supported tourism infrastructural works through the TTC while private sector

5
initiatives were discouraged. The role of the government in supporting SMEs development during that era was to provide directives, support and regulations for the communally owned businesses (“maduka ya ujamaa”, Swahili term meaning “communal owned shops”), as well as for the small-scale industries which were under the umbrella of the Small Industries Development Organisation (SIDO). In the mid-1980s, the government adopted economic reforms, among which liberalized trade, and freed the economy from various controls. The government embarked on that adjustment program in order to dismantle the long standing socialist economic controls and also encouraged active participation of the private sector in the economy (Mtatifikolo, 1995). The reform program included a comprehensive package of government policies and regulations which reduced the budget deficit and improved monetary control. The program also substantially depreciated the overvalued exchange rate, removed most price controls, eased restrictions on the marketing of food crops, freed interest rates, and initiated a restructuring of the financial sector (Mtatifikolo, 1995). These government reforms were accompanied by formally recognizing the importance of the SMEs sector in the economy and subsequently established the SMEs national policy under the Ministry of Trade and Industries (URT, 2003a). Since then, the development and support for the SMEs have been given special priority in the government programme. The government has also established the MKURABITA (Mpango wa Kurasimisha Rasilimali na Biashara za Wanyonge Tanzania) programme for supporting the informal business sector to access financial resources through property formalization. Other recent programmes introduced to support business activities include the following: Business Environment Strengthening for Tanzania (BEST), SMEs Competitive Facility (SCP), and the Confederation of Trade and Industries (CTI). In the recent years, the government has intervened a lot in the SMEs business activities and there is an increasing number of SMEs countrywide (URT, 2003b). The presence of the private sector operations has also increased over the past few years within the tourism sector (TALA, 2008). Most of the tour operators, airlines agents and hospitality providers are now privately owned. The Tourism Confederation of Tanzania (TCT) officially represents the private sector in the tourism sector (TCT, 2007; TCT, 2010). However, the biggest challenge facing the country is in bringing the transport, accommodation and ICT sectors up to the standards expected of an international tourism destination (Wade et al., 2001).
1.2.2 ICT Development in Tanzania ICT development in Tanzania dates back to 1965 when the first computer was introduced in the Ministry of Finance (Mbamba, 2006; Mgaya, 1990). The computer was mainly used for basic accounting tasks. In 1974, the Tanzanian government took an abnormal decision and burned the importation of electronic computers and television sets through its Notice Numbers 142 and 202 (Mbamba, 2006; URT, 2003a). It was in 1993 that the burn was lifted through government Notice Number 245. This was after the government adopted trade liberalization in the mid-1980s. Since the uplifting of the government burn and introduction of economic reforms in Tanzania, there have been significant developments of ICT application in the country spearheaded by the private sector (URT, 2009a). The internet service initiatives in Tanzania started in 1989 between Muhimbili University College of Health Sciences (MUCHS) and FidoNet (Sheriff, 2007). In 1995, Star Telecoms Ltd attempted to build a “Tanzanian Internet” which was a network of many users and servers within Tanzania but without a link to the global internet. In 1996, the Cyber Twiga led the way to initiate the first internet live connection to the global network. During that time, SITA and the Telecoms Systems Ltd were the only licensed providers of international data connections. Currently, there have been increases in the number of internet service providers (ISP). The connectivity charges have dropped significantly (Sheriff, 2007). Even

6
though the price of international connectivity dropped dramatically, in Tanzania it was relatively expensive compared to European countries (Sheriff, 2007). Greenberg (2008) confirmed recently that the internet connectivity and its operational costs are still expensive compared to other products locally produced. In some regions (particularly Dar es Salaam), the fibre connectivity is available. However, the internet technology application in business is still far underutilised. On the other hand, the government has established regulations and policies guiding the development of ICT in Tanzania. For example, in 1999 as an incentive towards promoting ICT establishment initiatives and encouraging foreign investment in the ICT sector, the government introduced the zero per cent (0%) import duties on computers and computer accessories (see also: Kamuzora, 2006a). In 2003, the government established the National Information and Communications Technologies Policy (URT, 2003a). The aim of the policy is clearly stated:
“The policy framework makes it possible for “enabling sectors” (such as telecommunications, information, or broadcasting) to work together whereby “enabled sectors” (such as education, health, governance, or agriculture) can become further empowered through the appropriate development and application of ICT” (URT, 2003a: 1).
The ICT policy document acknowledges the importance of ICT applications in supporting education, health, government administration and business activities, but the recent report published by Greenberg (2008) indicates that most of the government institutions have not integrated ICT adoption in their development program. The government has also established the Tanzania Communications Regulatory Authority (TCRA) as independent authority for postal, broadcasting and electronic communications industries in Tanzania. The main authority functions among others include: promoting the availability of regulated services, licensing and enforcing licence conditions for operators, establishing standards for regulated goods and services, and monitoring the implementation of ICT applications. The key areas of the authority services include network facilities, network services, and application services (TCRA, 2007) Based on the importance of ICT adoption for the success of their businesses, various governments and donor agencies have embarked on efforts to boost SMEs growth and performance by providing both infrastructure and resources necessarily for ICT adoption and usage. For example, in 2007 the president of Tanzania pledged that the government had a serious desire to ensure that SMEs reap maximum possible benefits from a special nation-wide fund amounting to 31 billion Tanzanian Shillings (Tshs). In 2007, the National Bank of Commerce (NBC) set aside 100,000 USD to facilitate training programmes for SMEs (Lema, 2007). These initiatives comprise one of the long-term and ambitious drives to support the policy of government and actions to empower SMEs in business performances. Greenberg (2008), in a recent study sponsored by the Swedish International Development Cooperation Agency (SIDA) argued that ICT development in Tanzania is still hampered by a number of problems. The author mentions the lack of skilled personnel, especially in the rural areas, high connectivity costs and the lack of proper ICT infrastructure as some of the most pressing problems in Tanzania. However, the country is experiencing positive responses from some of the government institutions supporting the full adoption and usage of ICT in Tanzania. Greenberg (2008) also observed that the current TCRA is both enlightened and effective in controlling ICT initiatives in Tanzania. On the other hand, the private sector especially operators of mobile phones are also providing internet connectivity to SMEs (see Appendix IV). A good number of universities have started to offer ICT programmes to their students. Additionally,

7
we see ICT professional bodies being established in the country for the first time (see also: Esselaar et al., 2001).
1.2.3 ICT Adoption among SMEs in Tourism Sector in Tanzania ICT development among SMEs in the tourism sector in Tanzania is largely unknown, due to the limited studies conducted in the country. The few examples of those studies include Kamuzora (2006a), Katalambula et al. (2006), Matambalya and Wolf (2001), and Mbamba (2006). Kamuzora (2006b) examined the extent to which ICT, particularly the internet, has supported the marketing of tourist products and services in Tanzania. The study indicates an increase in the application of e-mail and web technologies among the tour operators in the country. The study also acknowledges the limited application of other advanced ICT in the tourism sector. Matambalya and Wolf (2001) examined the role of ICT in the performance of SMEs in East Africa. The study indicates that most of the countries have ICT development plans in place or have the intention to develop them. The donor community through local agencies is enthusiastic about the role of ICT for development, especially empowering the SMEs in ICT initiatives (Greenberg, 2008). The donor community comprises of foreign embassies and various international agencies that provide financial assistance to Tanzania. Such initiatives should not be limited to technology aspects only, but should also include access to credit, managerial and other skills, infrastructure, rule of law etc. Most of the studies conducted in Tanzania either covered SMEs in a limited area of Tanzania or focused on a certain sector, for example, the tourism sector (Kamuzora, 2006a).
1.3 Problem Statement Based on the historical background and the Tanzanian contextual issues discussed in the preceding sections, we adopt several innovation diffusion theories to address the key research question on why SMEs adopt ICT in their businesses. We further use the same conceptual framework to examine the extent of ICT usage in business (see also: Raymond et al., 2005). As it was stated earlier on, conceptualising and measuring the adoption of ICT among SMEs is challenging. In some cases, the term ICT adoption is used to refer to simple ICT applications for example Word for Windows (Lange et al., 2004). In some other cases, the same term refers to a higher level of business application for example: e-commerce adoption (Molla and Licker, 2005a) or e-business adoption (Stone, 2003). The term ICT in this study is used to refer to all kinds of information technology terminologies, for example, e-commerce, e-business, the internet, and web technologies. Given the Tanzanian businesses as well as the environmental context, our study refers to the adoption and the use of e-mail and web technologies in business. In our study, the adoption of ICT is referred to as e-mail and web technologies adoption (EWA). The extent of usage refers to e-mail and web technologies usage (EWU). The tourism sector has proven to be very appropriate for ICT adoption and application due to its dependency on the supply and exchange of information throughout the production and distribution chains (Anckar and Walden, 2000). Efforts to improve the tourism sector in Tanzania need, among other things, a clear strategy to exploit ICT potentials among the SMEs in the country. In Tanzania, this sector is one of the three leading export sectors, together with mining and agriculture. The mining and tourism sectors have been the fastest growing sectors in the country, with an average growth rate of 10% and 5.5% between 1998 and 2002 (MIGA, 2006). In order to answer the question regarding the ICT and SMEs status in tourism in Tanzania, we first examined the characteristics of owner-managers. It is argued that less emphasis is put on the direct effects of the demographic characteristics (Lu et al., 2006). Studying the personal characteristics (for example: age, education, gender, etc.) is still vital, as it can provide a useful insight in the special

8
programs that fit for a certain target group, e.g. the less educated owners in Tanzania (Pijpers et al., 2001; Venkatesh and Morris, 2000). On the other hand, examining organisational characteristics (for example: location, size, experience, number of employees, etc.) is also important as they can shed light on the organisational characteristics that are important for determining the adoption and use of ICT (Gibbs and Kraemer, 2004a; Lee and Kim, 2007). The positive perception of the owner-manager on innovation characteristics has so far provided a foundation for explaining e-mail and web technologies adoption and usage among many studies (see, for example: Khemthong and Roberts, 2006; Lee and Cheung, 2004; Levy et al., 2005; MacGregor and Vrazalic, 2005; Migiro, 2006). Rogers (2003) suggests also that the innovation characteristics to include relative advantage, compatibility, complexity, trialability and observability. However, the first three variables (relative advantage, compatibility and complexity) have been indicated to be more significant than the others in most of the ICT adoption studies (Thong, 1999). Tornatzky and Klein (1982) support the same argument that the three innovation characteristics mentioned above had the most consistent and significant relationships in ICT adoption and usage studies. On the other hand, the social influence or approval studies indicated also an explanation of innovation adoption (Tornatzky and Klein, 1982). Social approval refers to the social status gained as the result of ICT adoption in this study and is the non-financial predictor of ICT adoption in this case. The literature review indicates that the perceived social influence on ICT adoption is not well studied (Carlson and Zmud, 1999; Moore and Benbasat, 1991). Therefore, by including the social aspect of ICT adoption and usage in our study, we aimed at explaining better ICT adoption and usage patterns. Under the organisational characteristics, we found that the organisational location, organisational e-resources, and top management support play a distinctive role in adoption and usage intensity of ICT. Especially top management support is important here: the top management with a broader ICT perspective is in a better position to influence the adoption. The top management also stands in a better position to analyse and exploit ICT opportunities in business. The management also has the mandate to allocate resources necessary for innovation implementation (Yap, 1989). There is also an increasing number of SMEs from developing countries adopting and using ICT as a means of communication and distribution under competitive pressure from suppliers and customers from developed countries (Dholakia and Kshetri, 2004). In the TradeNet program, the government of Singapore provided the initial resources and knowledge building capacity for the establishment of the project aimed at facilitating the adoption of EDI in Singapore (King and Konsynski, 1990). Other institutions, for example ICT vendors and ICT consultants can also facilitate the provision of necessary ICT related technical knowledge and supporting services to SMEs, in order to minimise the knowledge barriers affecting most SMEs (Attewell, 1992; Brock, 2000). In some cases, there is a clear institutional technology push to attract SMEs to use ICT innovations in their businesses, believing that it can contribute to their better performance and growth. An example is the initiatives of the Department of Trade and Industry (DTI) in the UK (Southern and Tilley, 2000). Therefore, examining institutional intervention in this study is important as we have discussed that most of the SMEs in developing countries have limited access to capital and limited knowledge on EWA and EWU related issues (Migiro and Ocholla, 2005; Molla and Licker, 2005b). Thus, successful adoption and increased usage intensity of ICT among other things depends on financial as well non-financial assistance accorded to the SMEs (see also: Attewell, 1992) We also found that the previous studies have not fully examined the extent of adoption and usage of ICT in SMEs. Some of the previous studies findings indicated that most SMEs were not fully utilising all the

9
levels of e-mail and web technologies adoption in their businesses due to various resource constraints and knowledge limitations (see, for example: Levy and Powell, 2003; Rao et al., 2003). The choice of ICT adoption level for the majority of SMEs depends on the underlying specific ICT adoption strategies and business opportunities available to them (Al-Qirim, 2007; Chau and Hui, 2001; Huizingh and Brand, 2009; Mendo and Fitzgerald, 2004). Apart from the contextual issues discussed above, operationalising ICT adoption measures is still among the challenging issues in ICT research. In recent years, the actual ICT usage (for example; processed reports, processing time, and number of records accessed) has increasingly become a popular indicator of measuring ICT impact on organisational performance (Devaraj and Kohli, 2003). Several ICT adoption and usage studies have also adopted ICT actual usage as an alternative measure of adoption (Raymond et al., 2005). We extend the individual models analysis (such as innovation, organisational and environment characteristics models) to an integrated ICT adoption model (see, for example: Gibbs and Kraemer, 2004a; Iacovou et al., 1995; Premkumar and Roberts, 1999; Teo et al., 1997; Thong, 1999). Some of the previous studies have discussed the integrated ICT adoption model among SMEs. For example, Thong (1999) suggested an integrated model comprising of CEO characteristics, information system characteristics, organisational characteristics and environmental characteristics.
By taking into consideration the technological as well as the non-technological factors on board, the integrated framework can better explain the adoption and usage of ICT among SMEs. On the other hand, the examination of the direct effects fails to account for indirect relationships existing among the TOE characteristics (Teo et al., 2004). Frambach and Schillewaert (2002) also argue on the importance of testing variables that influence organisation innovation both in direct as well as indirect manner. The linkage among the TOE characteristics is emerging as one of the debates in the innovation adoption studies. For example, Aragon-Correa et al. (2007) examined how organisational learning and transformational leadership positively influence innovations. At the same time, Lin (2006) investigates the relationship between organisational support and innovation characteristics. Therefore, this study empirically also examined the indirect effects among TOE characteristics on EWA.
A review of the published literature especially from developing countries showed that there is little empirical research conducted in Tanzania focusing on ICT adoption and usage among SMEs (Kamuzora, 2006a; Katalambula et al., 2006; Mbamba, 2006). Hence, this research project aimed at filling the gap by studying the factors influencing ICT adoption and usage among SMEs in tourism sector in Tanzania. The study also sheds light on the conflicting conclusions drawn in the previous ICT adoption and usage studies.
1.4 Research Objectives The main objective of this study was to investigate the key factors explaining the adoption and usage of ICT among SMEs in the tourism sector in Tanzania. Due to the lack of insight towards technological adoption in developing countries, particularly in Tanzania, our study adopted some of the Western developed innovation theories to explain the determinants of ICT adoption and usage (see Chapter 2). The specific objectives in this study include:
1. To determine the current SMEs and ICT status in the tourism sector in Tanzania; 2. To determine the current levels of EWA and EWU in the tourism sector in Tanzania; 3. To identify the main factors which determine the ICT adoption among SMEs in the tourism
sector in Tanzania;
10
4. To determine the strength of each factor in explaining the reasons for ICT adoption and usage among SMEs in the tourism sector in Tanzania;
5. To identify the relationships (indirect effects) among factors determining EWA among SMEs in the tourism sector in Tanzania;
6. To draw theoretical, research and policy implications from the study findings.
1.5 Relevance of this Study This study serves as an important step towards considering the role of ICT adoption and usage in enhancing SMEs performance and growth. In the case of developing countries, the empirical evidence on the effects of investments in ICT in SMEs is limited (Chowdhury, 2006). One of the reasons attributed to this is the lack of official data concerning ICT adoption and usage among SMEs in the tourism sector. Therefore, this study provides a better understanding of e-mail and web technologies adoption and usage among SMEs in developing countries. Secondly, we do not find any study conducted in Tanzania investigating the determinants of ICT adoption and usage particularly by SMEs in the tourism sector. Therefore, our study has served as an instrument to gather and analyse information about:
The types of ICT used by SMEs in Tanzanian tourism; Reasons for adopting and using ICT by SMEs in Tanzanian tourism; How ICT is used by the SMEs in Tanzanian tourism.
Thirdly, the study provides input for government institutions, ICT consultants, and ICT vendors who can target their promotion efforts towards SMEs with positive ICT adoption and usage characteristics and to those SMEs that have not yet adopted ICT or have lower levels of EWA and EWU. Fourthly, the tourism sector is among the fastest growing economic sectors in Tanzania. The geographical diversity of the country contributes to the widening of the ICT gap between rural and urban areas. This study provides a better understanding of the role of the government in facilitating ICT adoption and usage among the SMEs in the tourism sector in Tanzania. Additionally, the study examines the current government ICT led policies, strategies and plans relevant to enhancing ICT adoption and usage by SMEs.
1.6 Key Terms SMEs – in Tanzania refer to firms employing less than 100 employees and having capital of up
to 800 million Tanzania Shillings; Tourism – defined as a composite of services and goods geographically distributed across
destination. It also includes accommodation, transport facilities (air, sea, country transport), activities (what tourists do during their stay), attractions, and auxiliary (banking, telecommunications, hospitals, etc.);
EWA – refers to the adoption of e-mail and web technologies among SMEs. The adoption of e-mail and web technologies in this study is defined as the acquisition of computer and network hardware and software and utilising them in business activities;
EWU – refers to the frequency of using either e-mail or web technologies in doing business.
1.7 The Organisation of Chapters in this Study This study is organised in nine chapters. The study begins with Chapter 1 which details the introduction of the study. Chapter 2 provides an extensive review of innovation adoption. Chapter 3 presents the conceptual framework and specifies the hypotheses guiding this study. Chapter 4 highlights the readers of this study on issues pertaining to Tanzania, particularly the tourism sector. Chapter 5 presents the research methodology used in this study. Chapter 6 and 7 present the empirical results of the research questions. In Chapter 6, we present the descriptive statistics of the sample. Furthermore, in Chapter 7,

11
we present the data analysis addressing each research objective. We discuss the study results in Chapter 8, and finally provide conclusions, implications, limitations and suggestions for future research in Chapter 9.


13
2. Literature Review
In this chapter, we present a comprehensive review of the innovation diffusion and adoption theories that we used to explain the adoption and usage of ICT in our study. The main objective of the chapter is to re-examine the various concepts available in the literature that are associated with ICT adoption and usage among SMEs. We specifically examine the SMEs characteristics and contextual issues that may be relevant in explaining the adoption and usage of ICT among SMEs in developing countries. The Diffusion of Innovation (DOI) theory forms the major theoretical foundation for discussing the determinants of ICT adoption among the SMEs (Rogers, 2003). However, due to the unique characteristics and contextual issues of the SMEs discussed later in this chapter, other theories explaining ICT adoption and usage are also discussed. Those theories explaining ICT adoption and usage among SMEs include:
The Resource Based Theory (RBT) (Caldeira and Ward, 2003; Penrose, 1959); The Institutional Intervention theory (King et al., 1994); The Networks Theory (Abrahamson and Rosenkopf, 1997); The Staged Adoption Theory (Damsgaard and Scheepers, 2000; Nolan, 1973).
The chapter also examines the specific methods used to evaluate of EWA and EWU. Finally, Chapter 2 examines the integrated ICT adoption theory which includes individual adoption theories discussed in the chapter.
2.1 Defining and Conceptualising ICT Adoption and Usage
2.1.1 Defining ICT Adoption ICT adoption can be defined as to use ICT. Martin and Matlay (2001) provide a framework for ICT adoption with five different levels of ICT as indicated in Figure 2-1. The ICT adoption framework suggested by Martin and Matlay (2001) is the leading example of measurement in our study. The framework starts with e-mail adoption, followed by website adoption, e-commerce adoption, e-business adoption and finally the transformed organisation. Each adoption level within the ladder has a different degree of business benefits associated with that level.
Figure 2-1: DTI adaption ladder UK Online
Source: Martin and Matlay, (2001:400)
Furthermore, each adoption level requires different organisational changes and technological sophistications. Some of the recent studies indicate that most SMEs remain in the early stages of ICT

14
adoption, in which they have greater control (see, for example: Levy and Powell, 2003; Mendo and Fitzgerald, 2005; Stockdale and Standing, 2004). The literature suggests a number of problems that hinder the full integration of ICT within SMEs (Acar et al., 2005; Claessen, 2005). Such problems include among others:
The lack of clear strategies to identify the potential business value connected to electronic business (Martin, 2005);
Poor understanding of the nature of internet and its impact on business; The lack of common internet standards (Stockdale and Standing, 2004).
2.1.2 Conceptualising ICT Adoption and Usage ICT adoption in business is assigned different names. As it was detailed in Section 1.1, some of the authors consider ICT adoption as just simple ICT applications, for example the adoption of Microsoft Word for Windows (Lange et al., 2004). Other authors refer to a much higher level of business and ICT integration, for example e-commerce adoption (Molla and Licker, 2005a) or e-business adoption (Stone, 2003). Other terminologies used to describe ICT adoption in business include: internet adoption (Ma et al., 2003; Teo et al., 1997), e-marketing adoption (Bui et al., 2006), internet-retailing adoption (Lee and Cheung, 2004), internet marketing (Hamill and Gregory, 1997), and Electronic Data Interchange (EDI) adoption (Iacovou et al., 1995; Premkumar and King, 1994). On the other hand, Van der Veen (2004) provides a summary of the different dimensions used to conceptualize ICT adoption, as detailed here:
Business process activities – In this dimension, ICT adoption is measured according to the number of business process activities supported by e-business. Such business processes can be customer-ordering process, customer complaints handling process, internal supporting process, etc;
Application – In this dimension, the total number of computer applications used in the firm measure the extent of ICT adoption. Such computer applications may be Word, Excel, e-mail, website, internet, etc;
Value creation – In this dimension, ICT adoption is measured according to the different relative advantages or benefits acquired because of adopting ICT. Some of the studies distinguish strategic value created from operational value created;
Stage of development - In this dimension, the ICT adoption process is a function of organisational change and ICT sophistication. The e-adoption ladder indicates that the lowest level is e-mailing application, followed by website presences, e-commerce, e-business and finally the transformed organisation (see also: Martin and Matlay, 2001).
Additionally, Jeyaraj et al. (2006) identified seven variables that are used as the dependent variables for ICT adoption: perceived system use, intention to use, adoption diffusion, rate of adoption, outcomes, actual system use, and time of adoption. Furthermore, the ICT adoption rate can be measured using the following: frequency count of innovations, binary measure of adopted or not adopted, research and development (R&D) intensity, series of steps taken by the organisation to promote innovation, and a scale of radicallness or newness of the innovation. Goldstein and O'Connor (2000) support that the ICT adoption and usage level in developing countries is mostly limited to e-mail services and website presence only. This is because of the limited bandwidth and high connectivity costs. However, in the recent years, we have witnessed the fibre connectivity reaching even the developing countries in Africa, for example, Tanzania (see for example: Mutula and Mostert, 2010; Schmid, 2009; TCRA, 2007; UNCTAD, 2009).

15
2.2 SMEs
2.2.1 Defining SMEs The term SMEs, being a short form of “small and medium-sized enterprises”, is among the well-researched terms in business and ICT studies. However, previous studies have failed to agree on a single universal definition of SMEs. There are several criteria used to categorise SMEs. For instance, Van Hoorn, (1979) suggests the conventional criteria used to define SMEs to include: the number of employees, annual sales, and balance sheet total. Many countries consider the number of firm employees as one of the indicators to define SMEs. The European Commission defines SMEs as indicated in Table 2-1 (EU, 2005).
Table 2-1: European Union SMEs definition Category Head Count Turnover Balance Sheet Micro ≤ 10 ≤ € 2 million ≤ € 2 million Small 10 ≤ 50 2 ≤ € 10 million 2 ≤ € 10 million Medium-sized 50 ≤ 250 10 ≤ € 50 million 43 ≤ € 43 million
Source: (EU, 2005) We discovered that the definition of SMEs varies in terms of figures, currencies, and other criteria. For instance, the Tanzanian SMEs definition has different employee ranges per SMEs category in contrast to the European Union (EU) definition. Moreover, the Tanzanian definition takes into account the capital investment in machinery, as indicated in Table 2-2.
Table 2-2: Categories of SMEs in Tanzania
Category Employees Capital Investment in Machinery (Tanzania Shillings)
Micro Up to 5 Up to 5 millions Small 6 - 49 Above 5 to 200 millions Medium 50 - 99 Above 200 to 800 millions
Source: (URT, 2003b)
2.2.2 Challenges Related to Defining SMEs There are several challenges related to defining SMEs. Such challenges eventually affect the conclusions of ICT adoption and usage studies carried out in SMEs. For instance, in the above definition of SMEs a micro enterprise defined in the EU is equivalent to a large enterprise in Tanzania based on the figures of capital investment in machinery. Therefore, the conclusions reached in ICT adoption and usage studies carried out in the EU countries may reflect a different level in the Tanzanian context. Another challenge when defining SMEs is to know which criteria to select if an enterprise is falling under two categories (URT, 2003b). For example, in the case of Tanzania, an enterprise may have five employees and a capital investment in machinery of above 200 million Tanzanian shillings. Again, there is no clear demarcating line among micro, small, medium, and large companies even in terms of employee numbers. We conclude that when defining SMEs, other specific characteristics of the firm and the country at large need to be taken into consideration.
2.2.3 SMEs Characteristics The debate about what are the characteristics of SMEs has been in the literature for a long time. Several authors have challenged the notion regarding SMEs as large organisations in small scale. Some of the key titles addressing the need to have specific theories for SMEs include:

16
“Children are not little grown-ups" (Dandridge, 1979) “A small business is not a little big business” (Welsh and White, 1981)
It is common to differentiate SMEs from their counterparts (large firms) using firm size as an indicator (Damanpour, 1992). As stated earlier on, firm size is measured in terms of employee numbers, financial resources, as well as non-financial resources (Damanpour, 1992). Storey (1994) considers characteristics such as uncertainty, innovation and evolution aspects to differentiate SMEs from large firms. In general, SMEs are characterised by: having limited resources (Welsh and White, 1981), lacking the ability to exchange employees within the firm (Dandridge, 1979), and having less tolerances to inefficiencies (Dandridge, 1979). Other writers who have argued about the characteristics of the SMEs include Garengo et al. (2005) who suggest that SMEs have less developed strategic planning, lack human resources, lack managerial capacity, and have limited capital sources. Van Hoorn (1979) focusing on the strategic requirements contends that SMEs have narrow bases for influencing the firm performance, have limited resources, have limited capabilities, have limited work force, have top management posts held by few family members, and have inadequate strategic planning knowledge. The above-mentioned characteristics of the SMEs apply to SMEs in general. Additionally, we find that SMEs in developing countries are also affected by other external business environment forces because they operate in underdeveloped ICT infrastructures. Some of the major challenges facing SMEs in developing countries include: limited bandwidth, high costs of internet connectivity, and security concerns (Goldstein and O'Connor, 2000). SMEs in developing countries have limited access to the relevant internet knowledge and at the same time, often website contents do not reflect the local needs (for example, Kiswahili would be the preferable language in Tanzania). The full adoption and usage of ICT requires a well-connected ICT infrastructure backbone that would enable access to e-banking services for online payment. Lack of such ICT connectivity services which are common in developed countries presents a unique situation for SMEs operating in developing countries (Mbamba, 2006).
2.3 ICT Adoption As we stated earlier in this chapter, explaining ICT adoption and usage among SMEs has not only moved from the innovation diffusion theories, but is also getting more complicated when the developing country context is involved. The decision to adopt and use ICT involves a set of steps in an innovation process. There is no universally accepted number of steps that constitute the innovation adoption process. Focusing on individual innovations (Rogers, 2003;168), suggests that:
“The innovation process is the process through which an individual (or other decision making unit) passes from gaining initial knowledge of an innovation, to form an attitude toward the innovation, to decide to adopt or reject, to implementation of the new idea, and to conform of this decision”.
On the other hand, Zaltman et al. (1973) propose two main stages involved in the innovation process. Those stages include the initiation stage and implementation stage. Each innovation stage is characterised by sub-stages. The initiation stage is composed of knowledge awareness, formation of attitudes towards the innovation and decision-making. The implementation stage is composed of the initial implementation and continued or sustained implementation. Innovation adoption within SMEs has few challenges because they are not composed of bureaucratic and complex systems as is the case with the large organisations. The stages suggested by Zaltman et al. (1973), best fit large organisations, with their written formal rules, procedures and regulations. The organisational structure in SMEs is

17
relatively flat as compared to the structure in large organisations. Thus, SMEs are likely to be more influenced by the characteristics of the owner-managers (Lee and Runge, 2001).
2.3.1 Diffusion of Innovation Diffusion of innovation (DOI) is a theory explaining why and to what extent a new idea or technology reaches individuals or organisations in a social system. Research on the diffusion of innovation gained its momentum during the 1940s and 1950s when rural sociologists investigated the diffusion of agricultural innovations to farmers, and when educational researchers were studying the spread of new teaching ideas and methods (Rogers, 2003). The DOI theory became popular in the earlier 1960s when Rogers (1962) published his first book titled “The Diffusion of Innovation”. Since then, the DOI theory has been constantly updated and re-applied in different research traditions. For example, the theory is used to explain new product diffusion in marketing and management, and is used in ICT management to explain e-commerce diffusion. The DOI theory, which is based on psychological and sociological theories, is perhaps the most used innovation adoption theory in ICT adoption among SMEs (Parker and Castleman, 2009; Teo et al., 2004). Rogers (2003) defines innovation diffusion as:
“the process by which an innovation is communicated through communication channels over times among the members of a social system” (Rogers, 2003: 11).
In the DOI theory, the pattern of communication flow determines the pattern of adoption across the members of the adopting social system. The informed users are persuaded to adopt the innovations. The key important features studied in this process are the persons involved and the communication flow pattern (Rogers, 2003). The DOI theory was developed in the context of an adoption unit making a voluntary decision to adopt or reject an innovation based on the perceived benefits of innovation. The key innovation diffusion elements include:
Innovation – An idea, a practice or an object that is perceived as new by an individual or other unit of adoption. The use of e-mail and web technologies adoption in business is an innovation among SMEs (Khemthong and Roberts, 2006). The innovation is also influenced by the perception of the individual on the attributes of the innovation, which in turn influences the rate of adoption;
Communication channel – The process by which participants create and share information with one another in order to reach a mutual understanding. Mass media channels (such as radio, television, and newspapers) have proven to be effective communication channels for covering large areas and audiences. However, interpersonal communication such as face-to-face communication has been indicated to be most effective in persuading individuals to adopt innovations (Carlson and Zmud, 1999);
Time duration – The duration it takes from the moment an individual gets knowledge about an innovation to confirming the adoption;
Social system – The set of interrelated units that are engaged in joint problem solving to accomplish a common goal. A social system comprises of individuals, informal groups, organisations and subsystems. The adoption rate also depends on the characteristics of the existing system and its attributes. For example, a group of highly educated individuals is expected to adopt faster than less educated people (Pijpers et al., 2001; Zhu and He, 2000).

18
According to Rogers (2003) the innovation decision process involves a sequence of activities: knowledge, persuasion, decision, implementation and confirmation, as indicated in Figure 2-2. The model presents other key components influencing the innovation decision process as well: prior conditions, characteristics of the decisions making unit, perceived characteristics of innovation, and communication channels.
Figure 2-2. A Model of Five Stages in the Innovation Decision Process
Adapted from Rogers (2003: 170)
2.3.1.1 Perceived Characteristics of Innovation Rogers (2003) suggests that the rate at which certain innovations diffuses through the system depends on several innovation attributes. These attributes include: relative advantage, compatibility, complexity, trialability and observability. Rogers (2003) also argues that an innovation that is perceived by adopting individuals/organisations as possessing greater relative advantage, compatibility, trialability, observability and less complexity will be adopted more rapidly than the other innovations. The innovation attributes are detailed as follows:
Relative advantage – “Relative advantage is defined as the degree to which an innovation is perceived as being better than the idea it supersedes” (Rogers, 2003:229). The term relative advantage refers to the perceived benefit dimensions; these include economic profitability, initial costs, decrease in discomfort, social prestige, saving time and efforts, and immediacy of reward;
Compatibility - “Compatibility is the degree to which an innovation is perceived as consistent with the existing values, past experiences, and needs of potential adopters” (Rogers, 2003:240). The term compatibility can be applicable in several dimensions. For instance, an innovation adoption in the organisation can be matched with: existing socio-cultural values and beliefs, previously introduced ideas, and client needs;
Complexity - “Complexity is the degree to which an innovation is perceived as relatively difficult to understand and use” (Rogers, 2003:257). The term complexity refers to the extent to which the system is complicated and difficult to be learned and exploited in the organisation. Complexity may refer to the extent to which the new information system is different from the

19
existing information system. If users perceive the information system as too complex, there is a high possibility of rejecting the new information system;
Trialability – “Trialability is the degree to which an innovation may be experimented with on a limited basis” (Rogers, 2003: 258). Testing an innovation prior to its adoption gives the adopter an opportunity to know which part of the innovation works. Therefore, the organisation may decide to accept, reject or modify the innovation (re-inventing the innovation) to fit the specific needs of the organisation;
Observability – “Observability is the degree to which the results of an innovation are visible to others” (Rogers, 2003: 258). Technology adoption has two distinct components (hardware and software) which have different rates of adoptions based on visibility. While hardware can be easily seen and felt, the software part is more invisible.
The above explained innovation adoption attributes are widely used to predict both the organisational and individual adoption of innovations (Jeyaraj et al., 2006; Thong, 1999). However, the first three variables have been indicated to be more significant in most studies (Premkumar, 2003; Thong, 1999). In ICT research studies, we find that the first three innovation attributes have received more attention than the other components in the adoption model (Teo et al., 2004). Social influence or social approval is also among the key predictors of innovation adoption (Tornatzky and Klein, 1982). Social approval refers to “status gained in the one’s reference group as a function of adopting a particular innovation” (Tornatzky and Klein, 1982:37). Focusing much on ICT innovation, Tornatzky and Klein (1982) claim that the five innovation attributes suggested by Rogers in the DOI theory do not completely explain the adoption of innovations. Therefore, the social status gained may be a driving force for innovation adoption. Additionally, Moore and Benbasat (1991) suggest that image associated with the use of ICT itself is one determinant of the adoption decisions.
2.3.1.2 Characteristics of the Decisions Making Unit Based on the innovation decision process indicated in Figure 2-2, we also find that the characteristics of the decision-making unit are important in the knowledge stage of the decision process. Unlike the attributes of innovation, the characteristics of the decision-making unit have not received much attention in the ICT adoption studies. Rogers (2003) suggests the following characteristics:
Socio-economic characteristics – The social-economic status also plays a significant role in determining the rate of innovation adoption (Rogers, 2003). The adopting unit may be an individual or an organisation. The characteristics associated with individual adoption include: age, education, literacy social status, and upward social mobility (Dholakia, 2006; Yang and Lester, 2005). Premkumar and Roberts (1999) also argue that personal characteristics such as the level of education of the potential adopters are important. The organisation characteristics may include variables such as size, resources, and experience (Damanpour, 1992);
Personality variables – Personality variables are closely linked with innovativeness (Rogers, 2003: 288). The personality characteristics linked to positive adoption of innovation include: greater empathy, less dogmatic, greater ability to deal with abstractions, greater rationality, more favourable attitude toward change, higher ability to cope with uncertainty and risk, favourable attitude toward science, less fatalistic, and higher aspirations;
Communication behaviour – Communication behaviour characteristics refer to the attributes important for creating and sharing information with one another in order to reach a common understanding (Rogers, 2003: 290). Communication behaviour characteristics linked to positive adoption of innovation include: social participation, highly interconnected through interpersonal

20
networks, more cosmopolite, more contacts with the change agent, greater exposure to mass media, greater exposure to interpersonal communication channels, seeking information, and higher degree of opinion leadership.
An organisation is defined as a stable system of individuals that work together to achieve a common goal through a hierarchy of ranks and division of labour (Rogers, 2003). Organisational innovation adoption is more complex compared to individual innovation adoption because its adoption affects all parts of the organisational structure, including people and their roles, organisational goals, technology, business rules and regulations, and authority structures (Zaltman et al., 1973). Such innovation determinants are more evident and visible in innovation studies carried out in large organisations. In contrast, organisational structures of SMEs are characterised by fewer layers of management, hence the top officials are often in direct control of many of the business process decisions, including the innovation adoption decision. Lee and Runge (2001) argue that the success and outcomes of innovation adoption among SMEs depend on the personality and leadership of the owner-managers.
2.3.1.3 DOI Limitations Since its inception, the DOI theory has provided important segments of innovation diffusion which are valid up to date. These include the characteristics of innovations, the stages of the adoption process and the effects of interaction of individuals in the communication channel. Despite the fact that the DOI theory has made a significant contribution in explaining how human behaviour changes in a given social system over time, we find that some key issues were not addressed in theory. Some of these issues include the following:
It has been criticised that the DOI theory assumes that innovation adoption is desirable to every adopting unit. For example, some of the studies indicate that SMEs abandoned e-commerce after being successfully implemented (Martin and Matlay, 2001). In such circumstances, the adoption initiatives are pressurized by sponsoring organisations rather than the need emerging from within the SMEs. Rogers (2003) presents the issue of pro-innovation biases. A pro-innovation bias is caused by funding organisations or politicians in their development agenda. How do we know that the ICT adoption is desirable to every single small firm? Goss (1979) argued that the DOI theory assumed that the innovations would spread and become homogenous in society. However, in some countries the adoption of innovations resulted into widening of the economic and social gaps. In most cases the non-adopters in the community are forgotten;
The DOI theory is also criticised to have ignored other broader issues, for example, organisational context, technological context and environmental context. These issues were earlier addressed by Tornatzky and Fleischer (1990). In recent periods, we have witnessed various studies using the DOI theory combined with other contextual variables. For example: (Iacovou et al., 1995; Premkumar and King, 1994) – electronic data interchange (EDI), (Mehrtens et al., 2001) - internet adoption, (Del Aguila-Obra and Padilla-Melendez, 2006) - internet technology adoption, and (Parker and Castleman, 2009) – future hybrid models.
2.3.2 Resource Based Theory The Resource Based Theory (RBT) pioneered by Penrose (1959) has in recent years gained popularity in ICT research studies. The theory was originally developed to explain the different growth mechanisms and the dynamics of the firm. The author defined a firm as a composition of various productive resources. The RBT assumes that each organisation is the positive relationship of unique resources and

21
capabilities. Since its inception, the RBT has been applied in different research disciplines, such as entrepreneurship, strategy, ICT, etc. (Barney, 2001). The RBT advocates on how a firm can gain competitive advantage by properly exploiting its available resources that are unique (Barney, 2001). For example, Caldeira and Ward (2003) used RBT to examine the factors that determined the relative success in adoption and use of ICT among SMEs in Portugal. The findings indicated that the most successful firms did not depend on external solutions as an alternative to develop internal required capacities. The internal required capacities included ICT knowledge, ICT competences, and ICT internal infrastructure for successful adoption of ICT. Top management support also played a significant role in firm success (Thong, 1999). The RBT can be positioned relative to Porter’s competitive advantage framework (Porter and Millar, 1985). Both frameworks share the common assumption that resources and capabilities are distributed across firms. On the other hand, resources and capabilities differences among organisations may be long lasting. In order for firms to have a sustainable competitive advantage, their resources must be valuable, rare, not inimitable and should have no close substitute (Barney, 1991).
2.3.2.1 Organisational Location The location of the organisation has been suggested to be among the organisational characteristics that influence its innovation decisions. Storey (1994) argues that SMEs located in urban areas or accessible areas experience more rapid growth rates than those in rural areas. Such growth variations would possibly be the result of the varied access to external resources. Nijkamp and Van Ommeren (2004) argue that the SMEs location depends largely on the presence or availability of various networks. Such networks may be physical in nature (for example: ample transport infrastructure, telecommunications infrastructure, etc.) and not physical in nature (for example, ample industrial networks, clubs or discussion forums). The study carried out by Nijkamp and Van Ommeren (2004) indicated that the presence of ICT and telecommunication infrastructure was among the deciding factors for the location of SMEs. Another study indicated that ICT adoption and eventually its usage in SMEs is reflected by the location of the firm (DTI, 2002). The influence of the location of SMEs on ICT adoption is less widely studied in developing countries. One of the reasons attributed to this could be the relative equal access to the necessary ICT infrastructure networks between remote areas and urban centres. However, in developing countries there are significant differences not only between rural and urban centres, but also between one urban centre and another. Lack of access to infrastructural networks is reported as among the barriers to ICT adoption and usage in most developing countries (Migiro and Ocholla, 2005).
2.3.2.2 Organisational E-resources The size of the organisation is probably the far most studied organisational characteristics influencing ICT adoption and usage. It is generally argued that the size of the organisation is positively related to innovation adoption (Frambach et al., 1998; Rogers, 2003). Most of the previous studies addressing ICT adoption and usage compared large firms and SMEs in terms of their access to various resources (for example: Sahadev and Islam, 2005; Thong, 1999). Large organisations stand in a better chance to adopt and use ICT successfully. Several authors have supported this connotation arguing that large firms have stronger cash flows to fund innovation. Large companies have also valuable assets that can be used as collateral for loans from financial institutions. The same companies have access to a wider range of knowledge and human capital skills (see, for example: Damanpour, 1992; Ettlie et al., 1984; Rogers, 2003). Along the same line, Frambach et al. (1998) argue also that organisational size is positively related to the adoption of innovations because of economies of scale. SMEs fail to innovate rapidly as

22
they operate in difficult situations which are characterised by the following: lack of financial resources, lack of in-house ICT expertise and short-term management perspectives (Brock, 2000; Thong, 1999) On the other hand, SMEs stand a better chance to adopt new technologies, as they are small, flexible and quick to adjust themselves to business environment changes compared to large organisations, which are bureaucratic in nature (Molla and Licker, 2005b; Rothwell and Zegveld, 1982). SMEs flexibility is also attributed to their quick ability to adjust incentives for employees for providing optimal innovative adoption efforts. Additionally, SMEs have fewer rigid management structures and rules. SMEs also require relatively less internal communication, less coordination, and less influence to gather innovation adoption support (Damanpour, 1992; Rothwell and Zegveld, 1982). However, the willingness of SMEs to adopt and use ICT depends on the primary objective of the firm. Some of the SMEs prefer to remain small due to anticipated management complexities (Storey, 1994). There are studies which have tried to iron out why there are conflicting results between organisational size and innovation relationships. For example, Damanpour (1992) argues that the conflicting relationship depends on other moderating factors: type of organisation, measure of size, type of innovation, stages of adoption and scope of innovation. When these factors are taken into consideration, it indicates the following observations:-
The relationship between innovation and organisational size is seen much better in the manufacturing and profit oriented organisations;
The association between innovation and organisational size is seen much stronger in a non-personnel measure of organisational size. For example: size of the assets, sales, market shares, and capital investment ;
There is a negligible effect on the relationship between organisational size and innovation based on the type of innovation;
Organisational size is strongly related to the implementation rather than to the initiation of the innovation in the organisation;
The relationship between innovation and size is seen much better in high innovation areas than in low innovation areas.
SMEs barriers to adopt and use ICT addressed in the previous studies need to be re-examined due to the ICT changes that have happened. The current ICT trends are characterized by reduced IT equipment prices, increased communication and technology convergence, increased portability among ICT facilities, and improved IT products (more user-friendly) (Foong, 1999). Such changes have made ICT adoption and usage affordable to SMEs compared to previous times. This is now evident even in some developing countries where ICT adoption and usage is the foremost agenda of government initiatives (Kendall et al., 2001; Martin and Matlay, 2001).
2.3.2.3 Top Management Support In most organisations, individual employees do not have the autonomy regarding innovation adoption and use in their working places. Top management support, especially owner-managers in SMEs can encourage or discourage adoption of such innovations due to the mandate and authority vested in them. Rogers (2003) suggests three types of organisation innovation decisions namely: optional innovation, collective innovation and authority innovation decisions. Several managerial options for encouraging adoptions (for example, provision of adoption incentives or allocating necessary resources, such as infrastructure, training and consultancy support) are regarded as important prerequisites for the adoption of innovations within SMEs. Perception of SMEs owner-managers of ICT adoption benefits emerge as a crucial input to the successful adoption and usage of ICT (Martin and Matlay, 2001). Several

23
studies have indicated that top management characteristics (for example, level of IT skills and education, experiences and attitudes to change) are important in determining the nature of top management support in innovation adoption (Rogers, 2003; Thong, 1999). Two reasons as to why top management with broader ICT perspective is in a better position to influence the adoption of innovations are suggested. It is argued that top management stands in better position to analyse and exploit ICT opportunities in business, and that top management has the mandate to allocate resources necessary for innovation implementation (Yap, 1989).
2.3.3 Market Competition Market competition is one of the driving forces towards ICT adoption and usage in many organisations in developed countries. The advent of electronic technology has created new means of competition. There is also an increasing number of SMEs in developing countries adopting electronic technology as a means of communication and distribution under competitive pressure from suppliers and customers from developed countries (Dholakia and Kshetri, 2004). Currently, the majority of organisations are forced to adopt ICT as Porter (2001) put it:
“The key question is not whether to deploy internet technology – companies have no choice if they want to stay competitive – but how to deploy it” (Porter, 2001:3)
For a long time technological innovation has been one of the principal drivers of change of market competition and industry structure (Porter, 1985). Technological innovations do not only change the industrial structure, but it can also create new products, new industries and new distribution channels. On the other hand, technological innovation can be a deadly weapon to other organisations that do not adopt it appropriately, as it can erode their competitive power in the market. The case of the dot.com downfall in the mid-1990s significantly shows how improper technology can be dangerous to an organisation and finally erode its attractiveness and competitive advantage (Porter, 2001). The author also cautions that not all technological innovations are as important as many business organisations tend to believe. Some of the technological innovations if not well linked with other business processes, structures, and strategy may lead to organisational failure. Porter (1985) argues that technology is important to competition if it significantly affects the competitive advantage of a firm or the industry structure. Technology affects competitive advantage if it has a significant role in determining relative cost position or differentiation. The internet is one of the technologies that is discussed to influence the nature of business competition (Porter, 2001). The internet, if well linked with a technology strategy, can influence the industry structure and sustainable competitive advantage. For example, Ghosh (1998) argues that the internet can enable a business organisation to:
Establish a direct link with other stakeholders (for example, suppliers, customers, trade partners) in the business chain to complete transactions faster and more accurately. The channel can be used to offer more improved and personalised services to customers who can be available for 24 hours, seven days a week;
Bypass other intermediaries in the value chain hence reducing distribution and customer service costs;
Use ICT to meet other new global customers; Become a key player in the industry and set new business rules to other trading partners.

24
Previous studies have indicated that competitive pressure influences the firms to adopt and use ICT as part of their strategy to remain competitive. Some of the studies indicated a significant relationship between competitive pressure and internet innovation adoption among SMEs (Dholakia and Kshetri, 2004). On the other hand, Buhalis and Deimezi (2004) report on the insignificance of competition as a driver for ICT adoption in Greece. However, the authors attribute that conclusion to the general low level of ICT across the whole tourism sector in the country. Significant changes towards ICT adoption and usage have happened even in developing countries (Migiro, 2006; Schmid, 2009). The competitive pressure in Tanzania, especially in the private sector is mounting high. The tourism business is also controlled by market forces, hence many SMEs have at least established their online presences by creating websites (TCT, 2007).
2.3.4 Network Theory Efforts to explain the nature of innovation diffusion or the sequences at which the organisation adopts an innovation are not only limited to the DOI theory, as suggested by Rogers (2003). Network theories have emerged as a supplement to the DOI theory, especially in a situation whereby the adopting organisation is unclear of the profitability or benefits of technological innovations. Network theories provide an explanation of the effects of network structures in influencing innovation adoption (Abrahamson and Rosenkopf, 1997). The authors argue that the diffusion of innovations may be channelled or limited by the structure of the existing networks, and the rate of diffusion will depend on the number of channels available. Such network channels may be e-mail, web technologies, electronic data interchange (EDI), etc. The value of innovation adoption also depends on many other factors. For example, Katz and Shapiro (1986) argue that the value of innovation adoption is a function of the network size and other involved users or stakeholders. We also find that the diffusion of innovations is dependent on the characteristics of the distribution media. For example, Markus (1987) suggests two distinctive innovation characteristics of interactive media. First, it is argued that the widespread usage of technology innovation creates universal access whereby the adopting organisation is not restricted from using such media. Achieving a universal access requires that every organisation and other stakeholders agree to use the medium of interaction on a regular basis. For example, the adoption of e-mail or web technologies in the tourism sector depends largely on the willingness of airliners, tour operators, travel agents and destination services providers to agree to communicate using such a medium of interaction. Secondly, as more organisations adopt an interactive communication innovation, the innovation value to the previous and potential adopters is determined in the give-and-take interdependence of collaborating partners (Markus, 1987; Van Slyke et al., 2007).
2.3.5 Institutional Intervention Theories Technological innovation adoption and usage is well established in developed countries. However, the historical events of its success are sometimes linked with institutional intervention or assistance, as is the case in the UK, Singapore, and Japan (King et al., 1994). In recent years, the role of institutional intervention has received special attention in ICT adoption and usage as an alternative explanation to why organisations adopt and use ICT. Based on institution intervention theories, the government stands in a better position to influence ICT adoption and diffusion by setting regulations that can facilitate the adoption or rejection of an innovation (Damsgaard and Lyytinen, 1996; King et al., 1994). The authors suggest two types of forces that the government can use to influence innovation adoption and usage namely: supply-push and demand-pull. The supply-push theory suggests that the diffusion of an innovation is facilitated by the innovation itself. For example, the recent development of ICT simplification and portability has facilitated its adoption among SMEs. The availability of tailor-made

25
software for special types of business (for example SMEs) has minimised the need for specialised ICT expertise to customise the software. Software suppliers and providers are also designing their products targeting SMEs as a potential market for their products. For example, Microsoft has developed special products targeting the SMEs as stated on their website:
“SMEs have different business and IT needs at different business stages. With the overwhelming choices in the market, what are the right technologies for your business?.... To ensure you have the best return on investment, Microsoft® introduces the right infrastructure for SMEs at different business stages to fit you and your employees' specific needs to aid day-to-day operations, improve sales and lower cost” (Microsoft, 2007)
The demand-pull theory explains that the diffusion of innovations is facilitated by the adopting organisations themselves in search for innovative means of improving their business operations and becoming more competitive in the market. The perceived benefits of innovation among the group of SMEs create a demand for such innovations (Damsgaard and Lyytinen, 1996). In practice, the authors argue that the explanation of an innovation adoption and usage cannot be limited to the pull-push approaches only, as most of the organisations operate in an environment that is influenced by the decisions of the stakeholders. Such stakeholders may be governments, financial institutions, technological institutions, etc. Rothwell and Zegveld (1982) also argue that governments have long been involved in SMEs innovations believing that such intervention would ultimately improve the quality of life detailed in their national development programs. Such government intervention can be directed towards financial services, technical support, market support and management training. Along the same line, King et al. (1994) suggest six strategies that can be used by the government to influence the adoption processes. These include: knowledge building, knowledge deployment, subsidy, mobilization, standard setting and innovative directives. In this regard, the nomenclature of King et al. (1994) is most likeable in the SMEs context because it recognizes the interaction among the key providers and users of technological innovations. The six strategies also suggest different methods of interventions which can be implemented to enhance the adoption and usage of ICT (Damsgaard and Scheepers, 1999).
2.3.5.1 Knowledge Building Knowledge building is undertaken to provide the necessary and required information and skills for creating and making use of the technological innovations among the different organisation (King et al., 1994). The government can directly or indirectly fund knowledge building programmes, as governments fund most of the universities. Therefore, a government may deliberately direct such programmes to facilitate ICT innovations. For example, the Trade Net program whereby the government of Singapore provided the initial resources and knowledge building capacity for the establishment of the Trade Net project aimed at facilitating the adoption of EDI in Singapore (King and Konsynski, 1990). Other institutions (for example ICT vendors and ICT consultants) can also facilitate the provision of the necessary ICT related technical knowledge and supporting services to SMEs (Brock, 2000).
2.3.5.2 Knowledge deployment Apart from knowledge building, the government can also facilitate knowledge deployment. The major objective of knowledge deployment is to stimulate the dissemination of new knowledge among adopting organisations (King et al., 1994). Such diffusion can take several forms, for example; the government can provide education to the adopting organisation through other institutions. A government can also change its education system at various levels to favour the establishment of

26
related courses. On the other hand, a government can encourage already knowledgeable individuals and organisations to come to the country and establish or support operations.
2.3.5.3 Subsidy The perceived relative advantage of innovation adoption may be increased by providing incentives or subsidies to the adopting organisation (Rogers, 2003). There are several organisations/institutions that can benefit from ICT related subsidies, for example ICT vendors, internet service providers (ISP) and ICT consultants. The government may provide direct grants, loans or reduce taxes related to ICT related facilities and trainings (Yap and Thong, 1997). Other forms of subsidy include support for the provision of necessary supporting services to be used with innovative processes; for example, provision of electrical power and telecommunications services (King et al., 1994).
2.3.5.4 Mobilization Mobilization initiatives aim at changing the attitude of the adopting organisations. It forces the actors and organisations to think in a particular way with respect to an innovation (King et al., 1994). The key message delivered through mobilization is awareness of the perceived relative advantage of innovations in terms of benefits and reduction in operation costs (Rogers, 2003). Building ICT awareness influences to a large extent the decision to adopt or reject an ICT adoption (Molla and Licker, 2005b). Yap and Thong (1997) provide evidence of a successful government intervention program (Small Enterprise Computerization Programme - SECP) established by the government of Singapore to facilitate computerisation of SMEs activities. The programme inducements included ICT seminars, the provision of ICT technical expertise in the forms of advisers and consultants and various financial subsidies and loans.
2.3.5.5 Standards Setting ICT collaboration depends largely on common information technology platforms used by the organisations. Standards setting are a form of regulation that enables the different organisations to be able to communicate and collaborate in line with institutional objectives (King et al., 1994). Differences in ICT platforms and business regulations are among the major bottlenecks for inter-organisational collaboration. Setting standards in the ICT context involves creating a common platform whereby one or two firms can easily communicate and collaborate. This involves having the same set of computer networks, data transfer formats, and criteria for describing databases. For example, Ma et al. (2003) argue that ICT systems have been in operation in the tourism sector since the adoption of the Computer Reservation System (CRS) in airlines in the 1950s, and the Global Distribution System (GDS) in the 1980s. The effective use of ICT among SMEs depends on their ability to link their individual ICT systems to these global ICT systems. Some of the SMEs in the tourism sector have no access to these global systems (Anckar and Walden, 2000). A government can support standards setting initiatives among the SMEs ICT systems. Such measures will enable the SMEs to be linked to the global system. Such standards establishment also increases the speed of ICT adoption, while the consumers will more likely be confident with the adopted standards (Damsgaard and Lyytinen, 1996)
2.3.5.6 Innovative Directives A government through its statutory power can provide specific norms that regulate the production or use of innovations (Damsgaard and Lyytinen, 1996). Different governmental incentives, whether financial or resource based, can be tied up to such innovative directives. The implementation of such directives can be carried out through government machineries, for example customs authorities and tax officials. On the other hand, the government can spearhead the adoption of ICT, through allocating resources for research and developing ICT awareness among the SMEs (King et al., 1994). On the

27
contrary, the ICT adoption literature has also evidenced that sometimes government specific orders to adopt ICT end up failing because ICT adoption benefits are not perceived the same way among the SMEs (Mendo and Fitzgerald, 2004). Therefore, the government innovative directives provided should take into consideration the SMEs characteristics.
2.3.6 The Staged Adoption Theories The Staged Adoption Theories are phenomena that have a long history and have proven to be useful in developing knowledge in different fields during their formative stages, for example in describing organisation growth, product life cycles, etc. The Staged Adoption Theory is also used in ICT to describe different phases included in ICT development. For example, Nolan (1973) provides the early set of four stages of ICT development (initiation, contagion, control, and integration). These stages are determined by the growth of computer budgets. Despite the empirical critiques suggested in the staged theories (Benbasat et al., 1984), most of the previous studies show that the staged adoption theory remains the dominant approach explaining ICT adoption (Damsgaard and Scheepers, 2000). The authors also discuss how ICT resources, managerial resources, and organisational strategies change over time and develop from one stage to another. In Table 2-1, we present a summary of previous studies which adopted the Staged Adoption Theories to explain various types of ICT adoption sequences and the number of ICT stages suggested. The majority of these studies developed their models based on the experience from large organisations. In recent years, there have been efforts to conceptualise and develop theories that guide the adoption of ICT among SMEs (Ramsey et al., 2003; Teo et al., 1997).
Table 2-1: ICT Adoption Stages
Author Types of Adoption # Stages Adoption Stages Description
Nolan (1973) Managing Computers 4
1. Initiation 2. Contagion 3. Control 4. Integration
Damsgaard and Scheepers (1999)
Intranet Implementation 5
1. Publishing 2. Transacting 3. Interacting 4. Searching 5. Recording
Teo and Pian (2003) Web Adoption 5
1. No Website 2. Web Presence 3. Prospecting 4. Business Integration 5. Business Transformation
Nambisan and Wang (1999)
Web Adoption 3
1. Information access 2. Work collaboration 3. Core business transaction
Hashim et al. (2006) Internet Adoption 6
1. No internet 2. E-mail Adoption 3. Web Presence 4. Publishing website 5. Database Retrieval 6. Personalised Interaction

28
Table 2-1: ICT Adoption Stages (Cont.)
Author Types of Adoption # Stages Adoption Stages Description
Rao et al. (2003) Electronic Commerce 4
1. Presence 2. Portals 3. Transactions Integration 4. Enterprise Integration
Molla and Licker (2004)
E-commerce Adoption 6
1. No e-mail 2. E-mail Only 3. Static Website 4. Interactive Website 5. Transactive Website 6. Integrated Website
Lamb and Davidson (2005)
Organisational Intranet 4
1. E-mail 2. Website 3. E-commerce 4. E-business
Daniel et al. (2002) E-commerce Adoption 4
1. Developers 2. Communicators 3. Web presence 4. Transactors
DTI (2001) E-commerce Adoption 5
1. E-mail 2. Website 3. E-commerce 4. E-business 5. Transformed Organisation
Sohn and Wang (1999)
Internet Marketing 4
1. Non Adopters 2. Made Adoption Decision 3. Low Level Implementation 4. Sophisticated Implementation
Khemthong and Roberts (2006)
Internet and Website Adoption 4
1. No Website 2. Basic Website 3. Online Booking 4. Online Payments
As stated earlier on, some of the previous studies indicate that sophisticated or higher ICT applications in business are not widely adopted by SMEs (Levy and Powell, 2003; Martin and Matlay, 2001). Furthermore, few studies have examined the factors affecting ICT adoption and usage in the tourism sector (see, also: Sohn and Wang, 1999; Teo and Pian, 2003). During the literature review for the current study, the contingency theory was found to be used as an alternate approach to the commonly known staged theory of ICT adoption. Levy and Powell (2003) argue that there is little evidence indicating that SMEs follow the adoption process in a staged fashion. More importantly, the majority of the SMEs have not gone further than the adoption of e-mail and having a website only. The strategic advantages accrued by the SMEs based on ICT lies in the adoption of e-mail, which mainly reduces transportation cost, minimises delays and increases the reliability of customer services. The e-mail application is also important, nowadays, for the immediate confirmation of any transaction carried out through wire transfer. The transport model is also supported by Teo et al. (1997) who studied the internet adoption in Singapore. As this study aimed at investigating the

29
determinants of e-mail and web technologies adoption, the Staged Adoption Theory is useful (also adopted by: Huizingh and Brand, 2009; Teo and Pian, 2004; Wilson et al., 2008).
2.3.7 System Usage Evaluation System usage refers to the degree or the extent at which the organisation utilises the capabilities of the information system. Delone and Mclean (2004) define ICT usage by referring to the measures of everything from a visit to the website, navigation within the website, and the execution of transactions. System usage may be measured based on the amount of use, frequency of use, nature of use, appropriateness of use, extent of use and purpose of use (Petter et al., 2008). Despite the fact that the fundamental role of ICT in facilitating business transactions and information for decision-making has not changed for a long time, the challenge for developing ICT specific application measuring metrics is on-going. For example, Delone and Mclean (2004) proposed and updated a framework for measuring ICT adoption and usage success or failure. The framework included measuring metrics such as system quality, information quality, service quality, information use, user satisfaction and net benefits. Other ICT assessment metrics dimensions such as system customisation ability, dynamic contents, and easy navigations have been added to the e-commerce measuring metrics (Palmer, 2002). Haines and Lafleur (2008) identified specific ICT applications and usage which were measured in terms of usage frequency per specific application. Raymond et al. (2005) measured the extent of e-business as the assimilation of ICT in business. The term assimilation was conceptualised as a variety of business activities supported by the firm’s use of the internet and web technologies. Such activities were considered at three levels, namely communication functions, business intelligence functions, and transactional functions. On the other hand, ICT measurement metrics are challenged now and then; for example measuring e-commerce net benefits has not been clearly defined as it raises additional questions regarding what qualifies to be net benefits in an organisation, for whom the net benefits are, and at what level of analysis the net benefits are considered (Wang, 2008). Operationalising ICT adoption and usage measures is still among the challenging issues in the ICT research. Some authors have focused on ICT investments in an organisation, while other authors (for example, Delone and Mclean (2004) are against using ICT investment as a measure of ICT adoption because it does not take into account the actual use of an information system). In recent years, actual ICT usage (for example processed reports, processing time, and number of records accessed) is increasingly becoming a popular indicator of measuring the impact of information technology on organisation performance (Devaraj and Kohli, 2003). Some of the previous studies have adopted an actual use as an alternative measure of adoption (Khemthong and Roberts, 2006; Raymond et al., 2005). Focusing on specific usage of ICT among SMEs, it is argued that ICT usage is unique as it varies across different sectors (Kagan et al., 1990). Additionally, Kagan et al. (1990) found that the primary use of computers among SMEs is largely at the business processing levels. There is a slow rate towards adopting advanced processing technologies such as decision support systems or artificial intelligence systems as opposed to their counterparts (large firms). Such information system usage requires advanced ICT knowledge and resources, which are still lacking among SMEs (Migiro, 2006).
2.3.8 Integrated ICT Adoption Theory In this study, we also examined the TOE characteristics integrated model explaining EWA among SMEs in the tourism sector in Tanzania. Various empirical studies and literature reviews have provided a rich body of research on the adoption and diffusion of ICT at both individual and at organisational levels (for

30
example: Jeyaraj et al., 2006; Pflughoeft et al., 2003; Venkatesh et al., 2003). In recent years, several studies in ICT have adopted Structural Equation Modelling (SEM) in examining the individual intentions to adopt ICT (Ngai et al., 2007). However, there is a limited number of studies in the innovation adoption discipline using SEM in investigating the adoption innovation attributes in an integrated model (see, for example: Al-Qirim, 2007; Chwelos et al., 2001; Gibbs and Kraemer, 2004a). Many of the innovation adoption studies have singled out the examination of the direct effects of TOE characteristics on the ICT adoption (see, for example: Kendall et al., 2001; Lee and Runge, 2001; Migiro and Ocholla, 2005; Migiro, 2006). Furthermore, in an attempt to provide a better explanation of innovation adoption and diffusion, some of the studies have examined the direct influence of organisational characteristics on ICT adoption and diffusion (Kuan and Chau, 2001; Molla and Licker, 2005b). As most of the SMEs suffer from a lack of capital, access to information infrastructure and necessary skills and competences in ICT adoption, some of the studies have examined environmental characteristics as the key determiners of technological innovation adoption (Brock, 2000). However, there is a clear indication of the need to integrate the innovation adoption studies in a parsimonious predictive model (Chwelos et al., 2001). The authors have combined readiness, perceived benefits, and external pressure factors into an integrated model determining EDI adoption. The choice of the factors to be included in the integrated model was made based on the factors that have inhibited significance in previous studies (for example: Iacovou et al., 1995). On the other hand, there is an increase in the integration of technology, organisational and environmental characteristics in a coherent framework of explaining the adoption of ICT in organisations (Tornatzky and Fleischer, 1990). The TOE characteristics framework is empirically validated in a number of previous studies (for example: Kuan and Chau, 2001; Lai, 2008). However, Kuan and Chau (2001) did not take into consideration the indirect as well as inter construct effects. Other studies that have adopted the TOE framework include:
Raymond et al. (2005) adopt the TOE framework to examine the extent of e-business assimilation using the SEM technique;
Thong (1999) also adopted an integrated model of information adoption in SMEs whereby he examined the effects of the environment, organisation, information system and CEO characteristics to determine ICT adoption and its extent of adoption;
Teo and Pian (2003) also adopted SEM in examining the influence of contingency factors on the level of internet adoption. However, the study only considered business technology, top management support and technological compatibility factors.
Some of the previous studies have suggested the need to examine the joint effects of the external and internal factors influencing the adoption of innovation. For example, Frambach and Schillewaert (2002) propose that there is an interactive impact of variables on diffusion of innovation in first and second order. The first order innovation elements may involve the perceived innovation characteristics and organisational characteristics (see also: Tornatzky and Klein, 1982). Second order effects may involve the attributes that have an indirect effect on the adoption of an innovation. The second order innovation attributes may include the external business environment characteristics (Goffin and Mitchell, 2005; Lin, 2006; Quaddus and Hofmeyer, 2007)

31
3. Conceptual Framework and Hypothesis
In Chapter 3, we present and discuss the conceptual framework and the hypotheses of this study. In the first part of the chapter, we present the criteria guiding the conceptual framework referred to in this study. Furthermore, we discuss hypotheses suggested in this study. The chapter also presents an integrated conceptual framework that addresses the key factors related to ICT adoption among SMEs in developing countries.
3.1 Criteria Guiding the Conceptual Framework We developed our integrated conceptual framework taking into account the innovation adoption theories reviewed in Chapter 2. In this section, we examine the criteria which guided the formulation of the conceptual framework of our study. The criteria included: the SMEs characteristics, the networked ICT adoption, the influence of external factors on SMEs, and the developing countries context.
3.1.1 SMEs Characteristics As we discussed in Section 2.2.3, we found that SMEs have unique characteristics compared to large organisations (Garengo et al., 2005; Van Hoorn, 1979; Welsh and White, 1981). For example, the literature provides that in most cases the SMEs are owned by individuals or close family members. Therefore, people would be attempted to examine the ICT adoption and usage within SMEs along the family relationship based theories, rather than organisational or institutional theories. Dandridge (1979) examining the need for SMEs having their own organisational theories, suggests to develop an independent theory guiding the operations as well as innovation adoption and usage of the SMEs. As the author puts it:
“Piecemeal or hand-me-down imitation of large firms operating in a different relation to their environment is insufficient to deal with the unique situation and characteristics of small business” (Dandridge, 1979:57)
We find also that the decision to adopt and use ICT within SMEs depends on the personal characteristics of the entrepreneurs rather than the management as is a case in large organisations (Thong, 1999). Therefore, the leadership skills and managerial capability of the entrepreneurs are likely to determine the success of ICT adoption and usage within the SMEs. However, on the other hand, the entrepreneurs may hold back the ICT adoption and usage within SMEs, because they do not know the importance of adopting and using ICT in their business (Levy et al., 2001; Southern and Tilley, 2000). Our literature review also indicates that some of the SMEs do not have internal capabilities to exploit the opportunities offered by ICT adoption and usage. According to Acar et al. (2005) and Claessen (2005), the majority of the SMEs are characterised by the following shortfalls:
Lack of ICT strategy; Limited access to capital; Lack of emphasis in automating; Influence of major customers; Limited ICT skills (see also: Bhagwat and Sharma, 2007; Bruque and Moyano, 2007); Lack of ICT and strategy alignment (see also: Macpherson et al., 2003).
Sometimes the issue of ICT adoption and usage is considered practical and desirable to all SMEs. Rogers (2003) discusses this issue as pro-innovation adoption bias, which is one of the criticisms under the DOI theory. It is evident now that some entrepreneurs do not desire to adopt and use more than e-mail

32
services in business for fear of losing control of their business (Mendo and Fitzgerald, 2005). Therefore, it is also important to examine the perceptions of the entrepreneurs toward ICT adoption and usage as described by the DOI theory (Rogers, 2003; Thong, 1999).
3.1.2 Networked ICT Adoption The type of ICT adoption in this study is a networked technology (e-mail and web technologies), which requires a considerable amount of capital, supporting infrastructure and a group of other stakeholders. SMEs depend on the external networks that the entrepreneurs are associated with, in order to support for the adoption and implementation of ICT in their business. Other resources such as ICT infrastructures, ICT competences and ICT technical services are provided from such networks. Therefore, we opted for the resource based theory (RBT) to explain the essence of resource availability as one of the competitive advantages in business (Caldeira and Ward, 2003). Additionally, we find the Network Theory (NT) and Critical Mass Theory (CMT) appropriate for explaining ICT adoption and usage (Abrahamson and Rosenkopf, 1997). The concept of critical mass is also applicable in ICT adoption and usage because the value of ICT adoption and usage depends on the number of actors in a particular network (Markus, 1987). A networked ICT adoption requires higher ICT competence as compared to a stand-alone application. Therefore, the adopting SMEs have to look for supporting ICT technical services from other sources. For example, Karanasios and Burgess (2008) found that several strategies are employed in most of the developing countries when adopting a networked technology, in order to reduce costs and the risks involved in adopting and using ICT. Such strategies include among others:
Using friends or family members for the ICT technical services; Using low levels of ICT adoption and usage (e-mail and website); Hosting websites in free servers or in one of the developed countries; Using online intermediaries or sharing resources with other companies.
3.1.3 Influence of External Factors on SMEs The entrepreneurs or owner-managers of the SMEs do not have total control over the external environment in which they operate their businesses. As we discussed in section 2.2.3, SMEs are characterised by a lack of resources (Garengo et al., 2005). Therefore, SMEs are likely to be influenced and affected by external factors such as stiff competitive pressure, external support and government intervention. Dholakia and Kshetri (2004) support the fact that competitive pressure significantly influences the adoption and usage of ICT among SMEs. We have therefore adopted Porter’s competitive framework to explain the need for SMEs to acquire competitive advantages through the adoption and usage of ICT in their business (Ghosh, 1998; Porter, 2001). At the same time, we have adopted the institutional intervention approach because a government can either encourage or discourage ICT adoption and usage among SMEs (King et al., 1994)
3.1.4 Developing Countries Context When studying ICT adoption and usage among SMEs in developing countries, there is a need to examine the contextual issues specific to developing countries (Torres and Julien, 2005). In fact, there are significant differences between the business environment found in developed countries and in developing countries. While the availability of ICT supporting infrastructures and services are certain and affordable in developed countries, such facilities and services are only available in a few cities in developing countries. There are as well some ICT related problems, which are common to developed countries. For example, Arendt (2008) found the lack of proper knowledge, education, and skilled labour within SMEs to be the most pressing problems against ICT adoption and usage in developed countries. On the other hand, SMEs in developing countries are much more affected by the lack of ICT support

33
infrastructures as well as the necessary resources to support ICT adoption (Molla and Licker, 2005b). Additionally, SMEs in developing countries specifically suffer from:
Lack of reliable telecommunication infrastructure; High costs of internet connectivity; Lack of qualified staff to develop and support e-commerce websites; Lack of skills among the customers needed to use the internet; Lack of timely and reliable systems to deliver the actual goods; Low bank account and credit card penetration; Lack of trust to the internet and telecommunication services; Low computer penetration (Bingi et al., 2000; Karanasios and Burgess, 2008; Molony, 2006;
UNCTAD, 2009); Therefore, it is important for governments, donor agents and other interested stakeholders to assist in the ICT adoption and usage among SMEs in developing countries. Consequently, we include the institutional intervention theories as one of the explanations in the integrated conceptual framework as stated earlier on. Intervention can either encourage or inhibit the adoption of ICT among the SMEs. For example, in 1973 the Tanzanian government through Notice Number 142 and Number 202 banned the import of television sets, personal computers, and other ICT related equipments (Mbamba, 2006; URT, 2003a). The economic history of Tanzania shows that trade liberalization took place since the mid-1980s. In this study, we are therefore examining a relatively young ICT sector in a new and vibrant entrepreneurial economy (URT, 2003b).
3.2 ICT Adoption in This Study As we discussed in Chapter 2, e-commerce and e-business are the traditional terms used in ICT adoption (Stone, 2003). Given the situation of SMEs in developing countries, this study focuses on the lower levels of ICT adoption and its usage intensity, which is termed as:
E-mail and web technology adoption (EWA). E-mail and web technology usage intensity (EWU).
Our literature review indicates that most of the SMEs in developing countries end up using simple and low cost online activities such as e-mail and basic web publishing (Karanasios and Burgess, 2008). Such lower level of ICT adoption and usage requires minimum ICT skills for system maintenance. Friends or family members of the entrepreneurs often can offer such ICT technical services. Goldstein and O'Connor (2000) also support that the ICT adoption level in developing countries is limited to e-mail services and website presence only. The main reasons attributed to such adoption level are limited bandwidth and high internet connectivity costs. Our ICT adoption level decision is also based on the evidence provided by previous studies conducted in Tanzania (see, for example: Esselaar et al., 2001; Kamuzora, 2006a; Sheriff, 2007).
3.2.1 Measuring EWA We made the choice of EWA stages reflecting the specific context of organisations providing tourist services. The ICT application differs along specific factors, for example: sectors, influencers, cultures and norms (Simmons et al., 2008). We also took into account the availability of supporting technologies for higher ICT services such as online banking services which are limited in Tanzania (Chachage, 2001). We named the adoption stages based on the online activities carried out in the tourism sector. Due to the low levels of ICT adoption in developing countries, the majority of the entrepreneurs would not easily understand the ICT technical jargon such as: interactive website, transactive system or seamless

34
integration. For purposes of this study, EWA is measured along the ICT sophistication adoption levels. The key levels identified in this sub dimension are: e-mail, online presence, online booking (enquires) and online trading (bookings and payments).
The operational variables for measuring EWA was adapted from previous ICT staged studies (for example: DTI, 2001; Teo and Pian, 2003; Molla and Licker, 2004; Khemthong and Roberts, 2006) with minor adjustments to reflect e-mail and web technologies adoption and usage among SMEs in the tourism sector in Tanzania. We also adopted lower definition of ICT adoption to correspond with the lower adoption levels available in developing countries. The lower ICT levels included the SMEs that have adopted public e-mail domains, for example, [email protected], [email protected] and [email protected]. In developing countries the use of public e-mail account for business purposes is common.
3.2.2 Measuring EWU With the term usage intensity in this study we are referring to what extent a certain e-mail or web technology feature is used in business activities. The operationalisation of usage intensity was adopted from Khemthong and Roberts (2006), with minor adjustments to suit our study (also used by: Alam, 2009; Chong et al., 2009). While never used represented one end of the continuum, used more than once a day represented the other end in our measurement scale.
3.3 Hypotheses The theory used to explain ICT adoption and usage in this study is a combination of several theories. Each theory explains part of the black box lying behind ICT adoption and usage among SMEs in developing countries. Our ICT adoption and usage theory is composed of innovation characteristics, organisational characteristics, and environmental characteristics. We proposed an integrated theoretical framework as an attempt to contend most of the challenges addressed in ICT adoption and usage among SMEs in developing countries. Some of the recent studies in ICT adoption and usage among SMEs have proposed the use of integrated approaches in explaining the factors influencing ICT adoption and usage (see, for example: Nguyen, 2009; Parker and Castleman, 2009; Teo et al., 2004).
3.3.1 Perceived Innovation Characteristics The DOI theory probably so far explains the fundamental nature of ICT adoption and usage among SMEs better than any other theory suggested in the innovation adoption literature. In a review of more than 3000 studies of adoption and diffusion of innovation, Rogers (2003) found five innovation attributes that regularly influence the adoption rate among individuals or the adopting organisational units. Rogers (2003) concludes that “most of the variance in the rate of adoption of innovations (from 49 to 87 per cent) is explained by five innovation attributes namely: perceived relative advantage, compatibility, complexity, trialability, and observability” (Rogers, 2003: 221). In recent studies, more innovation attributes are discussed especially in the SMEs context and in developing countries. For example, the social approval and communicability attributes are among the innovation attributes suggested by Tornatzky and Klein (1982). As we stated in Chapter 2, perceived relative advantage, compatibility and complexity have been indicated to be significant in most previous studies (Jeyaraj et al., 2006; Thong, 1999). Therefore, we adopted perceived relative advantage, compatibility, and complexity under the innovation characteristics in our conceptual framework. Furthermore, we added social influence in the innovation characteristics based on the experience from mobile telephone adoption in Tanzania. In Tanzania, the possession of a mobile phone is a symbol of someone being serious and having a high personal value

35
within the community. Therefore, we argue that the adoption and usage of e-mail and web technologies is also influenced by social value perception. The innovation characteristics model is summarised in Figure 3-1.
Figure 3-1 Innovation Characteristics Influencing ICT Adoption and Usage Intensity
3.3.1.1 Perceived Relative Advantage In our conceptual model, we define the term relative advantage as “the degree to which new EWA and EWU are perceived as being better than EWA and EWU systems it supersedes”. The term perceived relative advantage refers to the perceived benefits. Such benefits include: increased economic profitability, reduced operational cost, increased market share, decreased operational discomfort, reduced time and efforts, increased communication efficiency, etc. Tornatzky and Klein (1982) conclude that relative advantage is an ambiguous term used in innovation adoption studies because many items can be dumped in this category. This is one of the reasons possibly explaining why the variable is widely used in innovation studies. Therefore, it is important for researchers to contextualise their studies in a certain domain when examining innovation adoption using the relative advantage variable (Jeyaraj et al., 2006; Tornatzky and Klein, 1982). For example, some of the relative advantages of ICT adoption include the following:
Enhancing communication effectiveness with customers, suppliers and trade partners; Improving the efficiency of the organisation in business and the quality of services offered to
customers; Giving management a greater control of the business; Enabling the establishment of new markets and distribution channels; Enhancing strong relationships between the organisation and its business partners (Khemthong
and Roberts, 2006).
Many previous studies indicated that relative advantage is a strong predictor of the rate of ICT adoptions and usage (for example: Migiro and Ocholla, 2005; Thong, 1999; Tornatzky and Klein, 1982). Kendall et al. (2001) also suggest that relative advantage strongly predicts the adoption of e-commerce among Indonesian SMEs. According to Lee and Runge (2001) the positive perception of the entrepreneurs on relative advantage determines the adoption of ICT. Finally, Thong (1999) argues that relative advantage is an important determinant of ICT adoption, but that it does not affect the extent of information system usage. In examining the effects of relative advantage on EWA and EWU, we hypothesise that:
H1a. The relative advantage of innovation is positively related to e-mail and web technologies adoption.
Innovation Characteristics
1. Relative Advantages 2. Compatibility 3. Complexity 4. Social Influence
E-mail and Web Technologies Adoption and
Usage Intensity
1. EWA 2. EWU

36
H1b. The relative advantage of innovation is positively related to e-mail and web technologies usage intensity.
3.3.1.2 Compatibility “Compatibility is the degree to which EWA and EWU are perceived as consistent with the existing values, past experiences, and needs of potential adopters” (see also: Rogers, 2003). The term compatibility like relative advantage discussed earlier can be applicable in several dimensions. For example, an innovation adoption in the organisation can be matched with the existing socio-cultural values and beliefs, previously introduced ideas and client needs for innovation. ICT innovation has two key aspects of compatibility that need to be observed by the adopting unit namely: the organisational compatibility and the technological compatibility. Organisational compatibility refers to matching innovation adoption to the existing organisational procedures, values and beliefs. It is important to match the organisational beliefs and values to the newly adopted information system because it reduces employee resistance to the new adopted information system. Ma et al., (2003) report on the lower levels of internet application in tourism in China, as the majority of the tourist enterprises in China still prefer to do business face-to-face. This is in fear of network security and trust problems on the internet. Such preferences indicate that business processes are to some extent less compatible with the application of ICT. On the other hand, technological compatibility refers to the extent to which the current system can easily be connected to the existing information system within the organisation. Previous and similar competences in a newly adopted system simplify the learning process and increase the likelihood to adopt the new information technology. Technological compatibility reduces the need for creating interfaces between the systems. It is also quite easy then to transfer skills and experiences from the old information system to the new information system hence reducing the cost of training, consultations, etc. Several previous studies have indicated that the compatibility of the new and old system is a significant predictor of innovation adoption (for example: Kendall et al., 2001; Moore and Benbasat, 1991; Thong, 1999). Additionally, Lee (2004) argues that SMEs owner-managers are likely to adopt new ICT when they perceive the adoption of technology is compatible with their current state of business. In examining the effects of compatibility characteristics on EWA and EWU, we hypothesise that:
H2a. The compatibility of innovation is positively related to e-mail and web technologies adoption.
H2b. The compatibility of innovation is positively related to e-mail and web technologies usage intensity.
3.3.1.3 Complexity “Complexity is the degree to which EWA and EWU are perceived as relatively difficult to understand and use” (see also: Rogers, 2003). The term complexity in ICT refers to the extent to which the system is complicated and difficult to learn and to be used in the organisation. Sometimes, system complexity refers to the extent to which the new information system is different from the existing information system. If users perceive the new information system as too complicated, there is a high possibility of rejecting it. This can happen at the individual level or at the organisation level. The adoption of a networked information technology system poses greater difficulties as it requires all stakeholders in the business process to learn and use the system. Given the resource limitations among SMEs, it may be difficult to adopt new information systems because most of the SMEs cannot afford to hire specialised ICT consultants or ICT training institutions (Attewell, 1992). Some of the previous studies have significantly indicated that information system complexity is negatively related to its adoption and usage (for example: Cheung et al., 2000). However, Khemthong and Roberts (2006) found no significant effects

37
of complexity in the adoption of the internet in hotels in Thailand. Other studies also found no significance of innovation complexity. These include for example, Cheng et al. (2002a), Kendall et al. (2001), and Premkumar and Roberts (1999). In examining the complexity effect on EWA and EWU, we hypothesise that:
H3a. The complexity of innovation is negatively related to e-mail and web technologies adoption.
H3b. The complexity of innovation is negatively related to e-mail and web technologies usage intensity.
3.3.1.4 Social Influence Social influence in our study refers to the “social status gained in one's reference group as a function of EWA and EWU”. Social influence is among the key predictors of innovation based on non-benefits or no-profitability arguments towards innovation adoption (Tornatzky and Klein, 1982). In developing countries, it is possible to adopt ICT simply because society perceives that organisations using ICT in their business are of high social status. Such adoption is not linked to any specific ICT benefits or relative advantages detailed earlier. The literature also suggests that further investigation of social influences on adoption of ICT, especially networked technology is needed. Davis et al. (1989) support that a multi personal information system, for example e-mail is more influenced by social values as compared to a stand-alone computer application like Microsoft Word. Fewer studies have examined the effects of social influences on ICT adoption and usage among SMEs. For example, Lee and Runge (2001) found no significant effects of social expectations on ICT adoption and usage among SMEs. However, they found a stronger correlation between relative advantage and social expectations. In most of the developing countries, it is not easy to determine in advance the benefits of ICT adoption. This is because most of the necessary information for the determination of innovation benefits is not readily available (Molla and Licker, 2005b). In examining the effects of social influence on EWA and EWU, we argue that:
H4a: The social influence of innovation is positively related to e-mail and web technologies adoption.
H4b: The social influence of innovation is positively related to e-mail and web technologies usage intensity.
3.3.2 Organisational Characteristics The organisational characteristics on the e-readiness refer to all the organisational facilities and resources necessary for the successfully adoption and usage of ICT in SMEs (Molla and Licker, 2005b). E-readiness characteristics include among other things: the ICT infrastructure, human resources, financial resources, top management, internal organisation structure, ICT application and services. The internal characteristics of the organisation (like: centralisation, formalisation, complexity, interconnectedness, organisational slacks and size) are important determinants of organisational innovation adoption (Zaltman et al., 1973). As previously stated, Lee and Runge (2001) argue that the success and outcomes of innovation adoption depends on the personality and technological leadership of the entrepreneurs. Based on the ability of the entrepreneurs to influence the outcomes of innovation, this study focuses on the organisational location, organisational e-resources and top management support as the distinct factors determining e-mail and web technologies adoption and usage among the SMEs as detailed in Figure 3-2.

38
Figure 3-2 Organisational Characteristics Influencing Adoption and Usage Intensity
3.3.2.1 Organisational Location Organisational location has been discussed much in information technology literature in relation to “digital divide” or “digital exclusion” between northern and southern countries. Organisational location in our study refers to the geographical location of the SMEs relative to the important supporting ICT infrastructure and supporting services. In recent years, we have seen a widening of the digital divide between SMEs in the same country, especially in developing countries. Firms located in the rural areas have limited access to ICT vendors, internet service providers (ISPs), ICT technicians, and institutions that provide ICT support and training courses. Results of a study conducted in Europe indicated that ICT adoption and eventually its usage in SMEs were reflected in their size and location (DTI, 2002). The survey findings also indicated that SMEs located in rural areas were less likely to have fast and reliable internet connectivity. Limited access to promotion awareness about the potentials of ICT and limited access to support for ICT experts were among the most pressing problems hindering ICT adoption and usage. Some of the previous studies have found that the geographical area where the SMEs are located in relation to the availability of resources acts as a barrier to adoption and usage of ICT for SMEs (Arbore and Ordanini, 2006). Most of the SMEs which are located in remote areas are forced to use satellite communications (V-SAT) to get internet access which is expensive as compared to the other options (Sheriff, 2007). Sheriff (2007) also suggests that the geographical diversity of the country contributes significantly to the varied development of ICT adoption across the country. However, Arendt (2008) found that the main barrier preventing better utilisation of ICT in business among the SMEs is not associated with a lack of access to ICT facilities. The key barriers found included the lack of proper knowledge, education and skilled labour within the enterprises. Nevertheless, the study carried out by Arendt (2008), involved only European countries. These countries have well-established ICT infrastructures, which are accessible throughout their whole countries (Mitchell and Clark, 1999). Arbore and Ordanini (2006) argue for the existence of internal digital divides based on broadband access. In examining the effects of organisational location on EWA and EWU, we hypothesise that:
H5a. Organisational location is positively related to e-mail and web technologies adoption.
H5b. Organisational location is positively related to e-mail and web technologies usage intensity.
3.3.2.2 Organisational E-resources As it was presented in Chapter 2, the access to organisational e-resources influences the decision to adopt and use ICT. Large firms have the possibility to adopt ICT due to their resources. Large firms have
Organisational Characteristics
1. Organisational Location 2. Organisation E-resources 3. Top Management Support
E-mail and Web Technologies Adoption and
Usage Intensity
1. EWA 2. EWU

39
stronger cash flows to fund innovation, they have valuable assets which can be used as collateral for loans from financial institutions, have access to a wider range of knowledge and human capital skills than SMEs do (Ettlie et al., 1984; Rogers, 2004). Organisational e-resources in terms of human, technological and business properties are the key factors, which not only influence the adoption and usage of ICT, but also the extent of its institutionalisation (Molla and Licker, 2005b). The availability of ICT adoption and usage related resources enables the organisation to respond to any arising ICT related challenge or opportunity. Kuan and Chau (2001) also found that organisational e-resources significantly determine the EDI adoption (see also: Ramdani et al., 2009). On the other hand, we find that most of the SMEs are failing to adopt and use ICT rapidly due to the various problems surrounding their businesses. Those firms failing to adopt and use ICT are said to operate in difficult situations, lack financial resources, lack in-house ICT expertise and are strongly characterised by short-term management perspectives (Thong, 1999). The SMEs that are attracted to ICT adoption are said to be more entrepreneurial, willing to take risks, willing to experiment, innovative and creative. ICT adoption also requires SMEs to have adequate ICT infrastructure to access internet services. Due to reduced computer prices, increased ICT convergence and the emergence of mobile phone companies providing internet services, SMEs may still stand a better chance of adopting information technology (Sheriff, 2007). Therefore, in examining the effects of organisational e-resources on EWA and EWU, we hypothesise that:
H6a. Organisational E-resources availability is positively related to e-mail and web technologies adoption.
H6b. Organisational E-resources availability is positively related to e-mail and web technologies usage intensity.
3.3.2.3 Top Management Support In most of the SMEs, an individual employee does not have the autonomy regarding the decision to adopt e-mail or web technology in the working place. The perception of the management on ICT adoption benefits emerges as a crucial input to the successful adoption and usage of ICT for the SMEs (Martin and Matlay, 2001). Therefore, we find that top management support can encourage the adoption of ICT (Premkumar and Roberts, 1999). If the top management has a positive attitude towards ICT adoption and usage, then there is a high likelihood of allocating the necessary resources for ICT adoption and usage. The top management can also spearhead an ICT adoption and usage process through effective communication to the employees. Additionally, Molla and Licker (2005b) found that championship of senior management of e-commerce activities significantly affects the maturity level of e-commerce adoption. Some of the previous studies have indicated a positive relationship between top management support and ICT adoption/usage (for example: Brock, 2000; Thong et al., 1994; Thong et al., 1996). Top management commitment and support are important ingredients of any successful ICT adoption and usage as they play a key role in providing adequate financial and non-financial resources for the ICT adoption process (supported by: Premkumar and Roberts, 1999; Ramdani et al., 2009; Thong, 1999). In examining the effects of top management support on EWA and EWU, we hypothesise that:
H7a. The top management support is positively related to e-mail and web technologies adoption.
H7b. The top management support is positively related to e-mail and web technologies usage intensity.

40
3.3.3 External Environmental Characteristics We should also note that the external environment characteristics play a significant role in the determination of ICT adoption and usage among the SMEs. As we pointed out earlier, individual SMEs have a negligible influence on the external business environment. However, the external business environment is important to the SMEs because it acts as a repository of information and resources about ICT adoption and usage. Such resources can be delivered to the SMEs through the advertising media, government institutions or SMEs networks. On the other hand, the external business environment acts as a playground where things such as competitors, technology-vendor relationship and inter-firm dependency play significant roles. The external environmental characteristics also influence the adoption and usage of ICT among SMEs especially those in developing countries. SMEs in those countries significantly suffer from the lack of capital, access to information infrastructure, computer skills and ICT competence (Brock, 2000). In our study, we examine three external environmental characteristics namely: competitive pressure, external support and institutional interventions as depicted in Figure 3-3.
Figure 3-3 External Environment Characteristics influencing Adoption and Usage Intensity
3.3.3.1 Competitive Pressure As it was stated in the Chapter 2, market competition is increasingly becoming a driving force to adopt and use ICT. Porter (2001) argues that the advent of electronic technology has created a new means of business competition. Currently, firms are competing on how to reach the customers faster and providing high quality services than their counter parts. ICT adoption and usage provide avenues to the SMEs on how to reach customers faster and reliably irrespective of the geographical locations. Therefore, the extent of market competition is indeed one of the driving forces towards ICT adoption and usage among the SMEs in both developed and developing countries. Dholakia and Kshetri (2004) observed an increasing number of SMEs from developing countries adopting and using ICT as a means of communication and product distribution. In Tanzania, the trade liberalization has encouraged competition among SMEs (TCT, 2007). Previous studies have also indicated that competitive pressure influences the firms to adopt and use ICT as part of their strategy (see, for example: Buhalis and Deimezi, 2004; Migiro, 2006). In examining the effects of competitive pressure on EWA and EWU, we hypothesise that:
H8a. Competitive pressure is positively related to e-mail and web technologies adoption.
H8b. Competitive pressure is positively related to e-mail and web technologies usage intensity.
1. Competitive Pressure 2. External Support 3. Institutional Intervention
E-mail and Web Technologies Adoption and
Usage Intensity
External Environmental Characteristics
1. EWA 2. EWU

41
3.3.3.2 External Support The internal capacity of the organisation depends on the availability of various resources from the business environment surrounding the organisation. SMEs in most cases rely on their trusted networks as sources of the required resources to adopt and use ICT (Chaston and Mangles, 2000). Liao et al. (2003) also argue that innovation adoption is the interaction of internal knowledge and external knowledge. Most of the SMEs are characterised by the lack of enough resources to take advantage of technological innovation adoption (Sahadev and Islam, 2005; Thong, 1999). External support is among the sources that play a key role in enhancing the capacities of SMEs in adopting and using ICT. The innovation adoption literature suggests that SMEs depend on external support from various sources. Such sources include either the informal sources (ICT knowledge delivered by friends and colleagues) or the formal sources (ICT suppliers, ICT consultants or ICT related government support). Some of the previous studies have found a positive relationship between external support and ICT adoption (Beckinsale and Levy, 2007; Brock, 2000; Fink, 1998; Lees, 1987; Yap et al., 1992). Therefore, in examining the effects of external support on EWA and EWU, we hypothesise that:
H9a. External support is positively related to e-mail and web technologies adoption.
H9b. External support is positively related to e-mail and web technologies usage intensity.
3.3.3.3 Institutional Intervention The decision whether or not to adopt and usage ICT is not only depending on the rational decisions taken by the entrepreneurs. Other factors influencing such a decision include the pressure from competitors, support from trading partners, and intervention from the government (Beckinsale and Levy, 2007; King et al., 1994). As we pointed out earlier, SMEs (especially those in the developing countries) do not always have enough resources to support the adoption of ICT in their businesses. Therefore, the government through its legal framework and tax regimes can facilitate the adoption and usage of ICT among SMEs or inhibit it. The government can assist ICT adoption and usage among the SMEs through building ICT knowledge to the SMEs, deploying ICT knowledge to the SMEs, setting ICT adoption subsidy on imported equipments, etc. The government may also design the websites that provide information about the business opportunities accrued by adopting ICT or training programmes on ICT (Southern and Tilley, 2000). There are several government intervention examples in the literature, for example, Mendo and Fitzgerald (2005) evidence that the UK government used the adoption staged model to encourage e-business adoption among SMEs. It was the enthusiasm of policy makers that the ICT adoption and implementation would be taken on-board by SMEs. However, some of the SMEs declined to take full advantage of the government assistance. Therefore, Mendo and Fitzgerald (2004) proposed the need to have differentiated institutional intervention programmes for SMEs based on their differences in size, age, managerial structure, location, etc. Martin and Matlay, (2001) also argue that the UK government intended to enable the SMEs in the UK to be the best in the industrially developed world. Therefore the government developed policies and strategies which were designed to assist SMEs to become e-enabled (see also: Beckinsale and Levy, 2007). The major aim was to encourage SMEs to invest in the ICT technologies. Similarly, governments in the European Union and South East Asia have defined active intervention policies and strategies to encourage the adoption and usage of ICT. In examining the effects of institutional intervention on EWA and EWU, we hypothesise that:

42
H10a. Institutional Intervention is positively related to e-mail and web technologies adoption.
H10b. Institutional Intervention is positively related to e-mail and web technologies usage intensity.
3.4 Integrated ICT Adoption Model As detailed in Section 2.3.8, we found it compelling to examine the indirect relationships among the environmental, organisational, and innovation characteristics (TOE) as indicated in Figure 3-4. Therefore, we extended the block of hypotheses on innovation, organisational and environment characteristics to an integrated ICT adoption model (see also: Thong, 1999). Tornatzky and Fleischer (1990) argue that the TOE is a powerful model or framework for understanding the factors affecting the adoption and implementation of e-commerce in SMEs (see also: Scupola, 2003). Most of the studies examining ICT adoption using the TOE framework report that external pressure, organisation readiness, and perceived benefits to be the significant determiners of ICT adoption (Gibbs and Kraemer, 2004a; Premkumar and Roberts, 1999). Additionally, the relationship between the organisational and the innovation characteristics in determining the ICT adoption is not widely studied in ICT literature. Some of the previous studies have examined the indirect effects of organisation readiness characteristics on the intention to adopt ICT in business mediated by attitude characteristics (see for example, Quaddus and Hofmeyer, 2007). Therefore, in this study we attempted to link the relationship examined in the traditional TOE model with testing the indirect effects of environment characteristics and organisational characteristics (see also:Teo et al., 2004). Further rationale for the investigating the indirect effects of organisational and environmental characteristics on the EWA is discussed in section 7.6.1 and section 7.6.2. In examining the integrated effects on the EWA, we hypothesised that:
H11: Organisational characteristics have indirect positive effects on e-mail and web technologies adoption.
H12: Environmental characteristics have indirect positive effects on e-mail and web technologies adoption.
Figure 3-4 TOE Characteristics Integrated Research framework
Organisational Characteristics
Innovation Characteristics
Environmental Characteristics
EWA

43
4. The Tourism Sector in Tanzania
This chapter presents the case setting of this study. Our study aimed at examining the factors influencing ICT adoption and usage among SMEs in the tourism sector in Tanzania. According to the set-up of the government of Tanzania, our study cuts across three ministries. This is because the tourism sector, the SMEs sector and the ICT sector are administered by three different ministries. The tourism sector is under the Ministry of Natural Resources and Tourism (MNRT), the SMEs sector is under the Ministry of Industry, Trade and Marketing (MITM), while the ICT sector is under the Ministry of Communication, Science and Technology (MCST). Therefore, in order to familiarise the reader of this thesis with the case setting, this chapter examines: the profile of the country, the tourism sector, the SMEs sector, and the ICT developments in Tanzania. The Chapter ends by presenting the profiles of the four key regions in which the data was collected. These regions include Dar es Salaam, Kilimanjaro, Arusha, and Zanzibar.
4.1 Country Profile The United Republic of Tanzania (URT) was formed out of the union between Tanganyika and the revolutionary republic of Zanzibar on the 26th April 1964. Tanganyika was previously a sovereign state, which became independent on 9th December 1961. The revolutionary republic of Zanzibar came into existence after the revolution which took place on 12th January 1964 (URT, 2008b). Since 26th April 1964, the new state which was formed has been officially known as the United Republic of Tanzania. However, in this thesis we refer to the United Republic of Tanzania as Tanzania.
4.1.1 Geographical Overview Tanzania is located in the eastern part of the African continent as indicated in Figure 4-1. The country is bordered by the Indian Ocean in the east, hence Tanzania has access to the coast. The coastline of the country is gifted with a range of beautiful beaches stretching over 1,424 kilometres in total. In the north, the country is bordered by Kenya (769 kilometres) and Uganda (396 kilometres). In the west, Tanzania is bordered by Rwanda (217 kilometres), Burundi (451 kilometres), the Democratic Republic of Congo - DRC (459 kilometres), and Zambia (338 km). In the south, Tanzania is bordered by Malawi (475 kilometres) and Mozambique (756 kilometres) (URT, 2008b). Tanzania is endowed with a large area totalling 945,087 square kilometres. The land covers 886,037 square kilometres, while water bodies cover 59,050 square kilometres.
Figure 4-1. Africa
Source: WordAtlas (2010)
A large part of land is suitable for farming and cultivation of both subsistence and commercial products, such as coffee, sisal, cashew nuts, tobacco, cloves, and tea. Some parts of Tanzania are endowed with natural resources such as hydropower, gold, tanzanite, phosphates, iron ore, coal, diamonds,

44
gemstones, gold, natural gas, and nickel. The climate of the country varies from tropical along the coast to temperate in highlands as the country extends from 1o degree latitude to 11o degrees latitude in the southern part. In Tanzania, we also find other geographical features which are unique in the whole of the Africa. For example, Kilimanjaro Mountain is the highest point (5,895 metres) in Africa, Lake Victoria is the second largest fresh water lake in the world, and Lake Tanganyika is the second deepest lake in the world. All of these geographical features add to the beauty of Tanzania as a dream tourist destination with many tourism opportunities (URT, 2002b).
4.1.2 Country Symbols Tanzania as a country is uniquely identified by three prominent symbols (URT, 2008b). The first symbol is the national emblem which is presented in Figure 4-2. Each of the texts and signs included in the emblem has a special meaning to Tanzanians. The term “UHURU NA UMOJA” in the emblem stands for “freedom and unity”. The yellow colour symbolises the natural resources available in the country. The red colour under the flag symbolise the fertile red soil of Tanzania. The lower part of the emblem represents the appearance of Mountain Kilimanjaro. The elephant tusks supported by a man and a woman symbolise co-operation and gender equality among the citizens of Tanzania. At the feet of the emblem are bushes which symbolise agriculture as the backbone of the economy of the country.
Figure 4-2. The Tanzania Emblem
Source: URT (2010)
Figure 4-3. Tanzania Flag
Source: URT (2010)
The second symbol is the national flag which is composed of four colours as presented in Figure 4-3. Each of the four colours has a special meaning in the Tanzanian context. The black colour stands for the citizens of Tanzania. The yellow colour represents the natural resources available in the country. The green symbolises the agriculture and fertility of the land and blue stands for water bodies (ocean, lakes and rivers) available in Tanzania.

45
The third symbol is the Uhuru Torch shown in Figure 4-4. The Uhuru Torch symbolises the freedom and light across the whole county. The torch was first ignited on top of mount Kilimanjaro in 1961. The major aims of the light have been:
To shine in the country and across the borders; To bring hope where there is despair; To bring love where there is enmity; To bring respect where there is hate;
The Tanzania Tourism Board uses these unique symbols as powerful indicators for marketing tourism products available in Tanzania. Various tourism products are using these symbols. For example, clothes, carvings, kitchen utensils, etc.
Figure 4-4. Uhuru Touch
Source: Habarileo (2010)
4.1.3 Population and Culture In 2008, the population of Tanzania was projected to approximately 40,668, 000 people (URT, 2008a). The population of Zanzibar was estimated to approximately 1,193,000 inhabitants, while the Tanzania mainland was projected to be 39,475,000 inhabitants. Based on the 2008 figures, the population density in Tanzania was estimated at 46 inhabitants per square kilometre (URT, 2008a). However, due to urbanisation and internal migration some of the cities and towns were estimated to have higher population densities than others. For example:
The population density of Dar es Salaam was 2,961 inhabitants per square kilometre; The population density of Arusha was 44 inhabitants per square kilometre; The population density of Kilimanjaro was 121 inhabitants per square kilometre; The population density of Zanzibar was 485 inhabitants per square kilometre; Lindi, which is located in the southern part of Tanzania, had the lowest population density of 13
people per square kilometres density (URT, 2008a).
Furthermore, the population figures revealed that inhabitants who are under 15 years old accounted for 44.2 % of the total population. The sex ratio indicated that for every 96 males, there were 100 females in Tanzania. The life expectancy at birth was estimated at 51 years. The crude birth rate was estimated at 40.8 per 1000, and the crude death rate was estimated 14.3 per 1000. However, the under five-child mortality rate was higher at 15.3 per 1000 live births while the infant mortality rate was estimated at 95 per 1000 children. The population characteristics also indicated that the majority of the inhabitants in Tanzania live in the rural areas (74.4%), while the urban centres have only 25.6 % of the total population (URT, 2008a). The majority of the people in Tanzania have attained the basic education level as the literacy rate was estimated at 71.0%.
As far as the ethnicity composition is concerned, 99% of the total population are native Africans and the other ethnicities compose only 1% of the population (URT, 2008b). There are more than 130 tribes with different cultural backgrounds. Hence, it is not easy to generalise the cultural background. The most popular tribe connected with tourism is the Maasai tribe. The Maasai people are semi-nomadic people located in the northern part of Tanzania. They have a special and distinct dressing code for both men and women as shown in Figure 4-5. The elders still decide much of the future of their children in terms of both education pattern and marriage issues. Generally, the people of Tanzania are characterised by

46
high levels of politeness and friendliness. However, they lack the professionalism needed in the tourism sector. This is in comparison to their counterparts in Kenya (URT, 2002b).
Figure 4-5. The Maasai People
Source: Calorielab (2010)
In Tanzania, the dominating religions include Christianity (30%), Islam (35%), and indigenous beliefs (35%) (URT, 2008b). 99% of the Zanzibar residents are Muslims. Therefore, the tour operators at Zanzibar are always warning the tourists on the sensitive issues related to the Muslim citizens. Such issues may be the dress code in the streets or eating in the public during the holy month of Ramadan.
The most popular language used in Tanzania is Swahili, which is an official language joining all the 130 different tribes in the country. Currently, Swahili is spoken in other African countries as well, like Kenya, Uganda, Burundi, Rwanda, Zambia and Democratic Republic of Kongo (DRC).
4.1.4 The Tanzanian Economy Tanzania is among the poorest countries in the world and depends largely on the foreign aid. The economy of the country depends for the most part on agriculture, fishing, industry and construction, and the service sector. The shares of the Gross Domestic Product (GDP) at 2009 prices were as follows: agriculture and forest products (26.9%), fishing (1.5%), industry and construction (24.0%), and services (47.6%) (URT, 2009b). According to the 2009 economic barometers, the GDP was at 28,212 billion Tanzania shillings (URT, 2009b: 15). The GDP growth rate in 2009 decreased to 6.0% compared to the previous year growth rate of 7.4%. Based on the available inflation rate figures, the inflation rate of 2008 reached 10.3 % compared to 5.1% of 2001. The per capita income (GDP) has increased by 10.3% from 628,259 Tanzania shillings in 2008 to 693,185 Tanzania shillings in 2009 (URT, 2009b). As we stated in Chapter 1, the United Nations (UN) classifies Tanzania as among the least developed countries in the world, with poor measures for gross national income per capita, human assets, and economic vulnerability (UNCTAD, 2008).
4.2 The Tourism Sector in Tanzania Tourism in Tanzania is given the highest priority since it is the only country in the world that has protected more than 25% of its landmass as a conservation area, wildlife national parks, and game reserves (MIGA, 2006; URT, 2008b). There are fourteen national parks, thirty-one game reserves, fifty game controlled areas, one conservation area and two marine parks as indicated in Figure 4-6. The country is also endowed with a number of tourism attractions which include among others the following:

47
The Northern Circuit – The Northern Circuit includes: the Arusha region, the Ngorongoro crater, the Serengeti plains, the Lake Manyara National Parks, the Tarangile National Parks, the Kilimanjaro Mountain, the Olduvai Gorge, and the Usambara Mountains;
The Southern Circuit – The Southern Circuit comprises the Selous Game Reserve, the Ruaha National Parks, the Mikumi National Parks, and the Udzundwa National Parks;
The Western Areas – the Western Areas include areas close to the Lake Victoria, the Gombe stream, the Katavi National Parks, and the Mahale Mountains;
The Islands – the popular tourist islands include Zanzibar (including the Unguja and Pemba islands) and Mafia islands;
The Water Front – the Water Front includes the Dar es Salaam and Bagamoyo Beaches.
Figure 4-6. A map of Tourism Attractions
Source: Amani (2010)
Tourism in Tanzania plays a significant role in foreign exchange earnings at national levels. Kweka et al. (2003) argue that the role of tourism in Tanzania is mainly to provide foreign exchange to the country as the country is mainly depending on agriculture. For example, in 2008, a total of 1,288.70 million USD was generated from the tourism sector alone, and the sector also provides employment to many Tanzanian citizens (URT, 2009b). The government is also benefiting from taxes charged on tourism activities. In 2008, the Tanzania Investment Centre (TIC) reported that the tourism sector created 17,822 employment jobs, the centre approved 45 new foreign investments, the centre approved 167 local investment projects, and a total of 680,749 million Tanzania shillings projects were approved by the centre (URT, 2009b).
4.2.1 Development of Tourism in Tanzania The development of tourism in Tanzania has passed through three significant historical periods. The first period is the post-independence period (1960 – 1977), the second period is the post East Africa Community (EAC) collapse (1977-1986), and the third period is the post trade liberalisation and economic restructuring period (1986 – to date). Each of these historical periods was characterised by different economic, political and legal structural changes which affected the tourism sector in either a positive or a negative way.
4.2.1.1 The Post-Independence Period (1960 – 1977) The post-independence era was characterised by a steady growth of tourism in Tanzania. Curry (1990) supports that tourist arrivals grew at a rate of 22.8% per annum between the year 1961 and 1969. However, the arrival rate growth was relatively lower at 6.9% between 1970 and 1976. Tanzania had a wide base for international tourism activities and different attractions which included coastal beaches, game reserves, mountains, historical sites. During this period, the tourism activities were concentrated in both the Northern Wildlife Areas (NWA) around Arusha and the coastal region around Dar es Salaam. In an attempt to reduce the economic gap among the citizens in 1967, the government nationalised all major economic means including the hotels and tourism infrastructure through the Arusha Declaration. However, the declaration did not much affect the tourism sector because most of the tourists were

48
flocking in Tanzania through the Kenyan boarders (Wade et al., 2001). Kenya was a more desired tourist destination centre because the country had a well-developed tourism infrastructure and facilities. During this period, the government made several legislative amendments regarding the tourism sector. For example, the government established the Tanganyika National Tourist Board (TNTB) under the Tanganyika National Tourist Board Act of 1962 (364) (URT, 1962). The tourism board was responsible for regulating tourism activities within the country. The board also ensured that all state-owned tourism facilities offered uniform service standards across the whole country. However, in 1969 the government replaced the TNTB with the Tanzania Tourist Corporation (TTC). The newly established corporation owned all state controlled tourism facilities (Wade et al., 2001). In 1971, the TTC commissioned the Tourism Master Plan for Tanzania. At the same time, the TTC declared Tanzania as one of the major world tourism destinations.
4.2.1.2 The Post East Africa Community Disintegration Period (1977-1985) The EAC collapsed in 1977 after the member states disagreed on issues pertaining to: Tanzania being a socialist country, Uganda being ruled by the dictator Idi Amin and Kenya demanding more voting rights in the community. The border between Kenya and Tanzania was closed in 1977. Hence, the Kenyan tourists could not cross over to visit the NWA in Tanzania (Wade et al., 2001). The move resulted into a significant decline in the number of tourists coming to Tanzania. As indicated in Figure 4-7, the number of tourists kept declining from 1973 up to 1985 when it started to increase again. During the same period, in 1979, Tanzania went to war with Uganda which again reduced the number of tourists visiting Tanzania. Generally, this period was characterised by a steady increase in economic crises in Tanzania. In 1985, the country was under a new president who was moderate on the issue of socialism and the role of the private sector in the development of the national economy. The president immediately initiated the economic recovery programs with the assistance of the World Bank and the International Monetary Fund (IMF) (Mtatifikolo, 1995).
Figure 4-7. Visitors Arrivals in Tanzania (1972 – 1996)
Source: Freisen (1995) (quoted in Wade et al., 2001)
4.2.1.3 The Post Trade Liberalisation and Economic Restructuring Period (from 1985) The Tanzania-Kenya boarder was re-opened in 1985. The re-opening of the boarder influenced the tourism sector in many ways. Many of the foreign companies located in Kenya opened subsidiary offices in Arusha and Kilimanjaro towns, which in turn allowed them to arrange for more tourists to visit Tanzania. During the same period, the tourist arrival rate started to increase again as indicated in Figure 4-7. In 1990, the government made significant changes in the economy by enacting the Investment Promotion Centres (IPC) Act (1990). The act relaxed the investment requirements and conditions in

49
Tanzania. The liberalisation of the economy attracted more foreign investments and operations within the country. The deregulation of air services in the early 1990s also opened more doors for private air operators. In 1992, the TTC was dissolved, and the government formed two separate institutions namely, the Tanzania Hotels and Investment Corporation (TAHI) and the Tanzania Tourism Board (TTB). In 1991, the MNRT adopted the first national tourism policy of Tanzania (URT, 1991a). The policy geared to provide the overall objectives and strategies necessary for ensuring the sustainable tourism development in the country. The tourism policy was later reviewed in 1999 in order to incorporate the new changes. Such new changes included: the 1992 Rio declaration on the environment development, the ICT development, and the changing role of the government from being the sole owner of the tourist facilities to a regulator, promoter, and facilitator of tourism businesses (URT, 1999). In 2002, the MNRT updated the Tourism Master Plan of Tanzania and included more strategies. The strategies included to develop the southern tourism circuit and to develop new tourism packages that would attract fewer tourists but ensure high foreign exchange returns (URT, 2002b). Currently, the newly enacted Tourism Act (2008) guides the tourism activities (URT, 2008d).
4.2.2 Tourism Figures
4.2.2.1 Arrivals and Receipts Performance figures of SMEs in tourism are not readily available in Tanzania (Wade et al., 2001). However, in recent years the Tanzania Bureau of Statistics (TBS) in coordination with MNRT and other government institutions have successfully provided tourism statistics in the country (URT, 2001; URT, 2004b; URT, 2007). For example, Table 4-1 shows the tourist arrival rate and the associated receipts from 1995 to 2007 (URT, 2007). Furthermore, Table 4-1 indicates that the tourist arrival rates and receipts rate had different growth patterns. The number of tourists arriving in Tanzania grew steadily from 1995 up to 2007, with the exception of 1999/2000. The receipts (in USD) increased from 1995 to 2000. In the period between 2000 and 2004, the receipts remained more or less steady. Finally, the receipts increased from 2002 to 2007.
Table 4-1. Tourists Arrivals and Receipts in Tanzania Year Number of
Tourists Arrivals Receipts
(USD Million) Receipts
(Tshs Million) 1995 295,312 259.44 155,663.00 1996 326,188 322.37 194,220.00 1997 359,096 392.39 235,446.00 1998 482,331 570.00 370,500.00 1999 627,325 733.28 586,624.00 2000 501,669 739.06 628,201.00 2001 525,000 725.00 665,115.00 2002 575,000 730.00 705,618.00
2003 576,000 731.00 759,070.40
2004 582,807 746.02 812,676.89
2005 612,754 823.05 929,058.84 2006 644,124 950.00 1,079,137.00 2007 719,031 1037.33 1,290,542.25
Source: URT (2007: 9)

50
4.2.2.2 Arrivals by Mode of Transport Transport by air remains the dominant mode of transportation for the incoming tourist, as indicated in Table 4-2. Air transportation in the tourism sector still accounts for more than half of all the incoming tourists. The Julius Nyerere international airport in Dar es Salaam and the Kilimanjaro international airport in Kilimanjaro region are the key entry points in Tanzania. Based on the statistical figures presented on Table 4-2, we find an increasing number of the tourists arriving by roads.
Table 4-2. Tourists Arrivals by Mode of Transport Transport Mode 1998 1999 2000 2001 2002 2003 2004 2005 2006 2007
Air 311,406 364,575 311,612 315,073 316,000 320,000 257,195 330,587 359,395 388,767 Sea 7,995 6,442 15,081 21,005 20,000 25,000 23,681 10,315 14,171 16,153 Road 152,251 220,300 155,116 173,290 214,000 215,000 297,302 265,852 265,505 309,538 Rail 10,679 36,008 19,860 15,754 25,000 16,000 4,629 6,000 5,053 4,573 Total 482,331 627,325 501,669 525,122 575,296 576,198 582,807 612,754 644,124 719,031
Source: URT (2007: 11)
4.2.2.3 Purpose of Visit The tourism survey also indicates that there is an increasing number of visitors who come to Tanzania for leisure, recreation and holiday purposes only (URT, 2007), as indicated in Table 4-3. Surprisingly, the number of visitors coming for business and professional purposes has steadily decreased from 2003 to 2007.
Table 4-3. Arrivals by Purpose of Visit Purpose of Visit 1998 1999 2000 2001 2002 2003 2004 2005 2006 2007
LRH 299,946 383,155 339,596 341,329 358,000 337,000 458,679 478,024 523,966 625,674 BP 127,994 132,802 130,201 152,285 115,000 133,000 83,415 84,924 70,940 57,374 Other 54,391 111,368 31,872 31,508 102,296 106,198 40,713 49,806 49,218 35,983 Total 482,331 627,325 501,669 525,122 575,296 576,198 582,807 612,754 644,124 719,031
Note: LRH - Leisure, Recreation and Holidays, BP - Business and Professional Source: (URT, 2007: 13)
4.2.3 Institutional Organisation of the Tourism Sector in Tanzania The tourism sector in Tanzania is organised along public and private lines. After the trade deregulation in the mid-1980s, the two setups depend on each other in carrying out the tourism activities in the country (URT, 2002b). Under the government setup, the tourism sector is housed under the tourism division within the MNRT as indicated in Figure 4-8 (URT, 2002b).

51
Figure 4-8. Tanzania Tourism Sector
However, for an organisation to run a tourism business in Tanzania, it must first get a business licence from the Business Registrations and Licensing Agency (BRELA). The BRELA is not housed within the MRTN, but is housed under the Ministry of Industry Trade and Marketing (MITM). Additionally, the organisation must have a valid tourism licence from Tourist Agency Licensing Authority (TALA). However, under the new Tourism Act (2008), the Tanzania Tourism Licensing Board (TTLB) is responsible for issuing tourism licences. The ICT related issues are administered and regulated by the Tanzania Communications Regulatory Authority (TCRA). The TCRA is under the Ministry of Communications Science and Technology (MCST). Additionally, the organisation may register with the Tanzania Investment Centre (TIC) which is housed under the Ministry of Planning, Economy and Empowerment (MPEE). Based on the presentation given above, the tourism organisation for SMEs is to some extent complicated in Tanzania as summarised in Figure 4-8.
4.2.3.1 The Ministry of Natural Resources and Tourism The MNRT is the ministry responsible for tourism activities in Tanzania. The ministry provides policies and regulations guiding tourism businesses. As it was previously discussed, the ministry has issued several tourism policies which include the National Tourism Policies of 1991 and 1999. The ministry has also issued the Tourism Master Plans of 1996 and 2002 (URT, 2002b). The ministry is divided into six units which include: the administration unit, the wildlife division, the forestry and beekeeping division, antiquities, the tourism division, and the antiquities division.
Tourism Industry
Government Institutions
MNRT
Administration Antiquities
Forest and Bee Keeping
Policy and Planning
Tourism
TTB
HTTI
Management
Wildlife
TAWICO
TANAPA (SWRI)
NCAA (CAWM)
MITM
BRELA SMEs Division
Enterprise Promotion
Section
Business Support
Services Section
MPEE
TIC
MCST
TCRA

52
4.2.3.2 The Tourism Division As we pointed out earlier, the Tourism Division is the branch of the MNRT which is responsible for managing the tourism division within the ministry. The tourism division is responsible for the sectoral policy, planning, research, manpower, training, statistics, licensing and quality control of tourist agents (URT, 2002b). The division has three sections as indicated in Figure 4-9:
The tourism development section deals with sectoral policy formulation, national and international cooperation, identification of tourist attractions, diversification of tourism activities, and promotion of domestic tourism;
The research training and statistics section deals with manpower planning and human resources development, information system management, research and training, sector performance monitoring and evaluation;
The licensing and control section deals with monitoring the tourist agents and controlling of the tour operators. The section also houses the TALA.
Figure 4-9. Organisation Chart of the Tourism Division (MNRT)
Source: URT (2002b: 29)
The division is also responsible for supervising the Hotel and Tourism Training Institute (HTTI) and the Tanzania Tourism Board (TTB) institutions which are explained below.
The Hotel and Tourism Training Institute The HTTI is responsible for conducting training in hotel management and tourism at different levels. The courses initially offered included food and beverages, front office, food production and housekeeping courses. However, there is increasing competition from privately owned schools, colleges and universities. Consequently, the institute has been re-allocated to Bandari College with an intention to make it an executive agency and broadening its scope to become the National Tourism College.
Hotel & Tourism Training Institute (HTTI)
Principal
Tourism Division
Director
Tanzania Tourism Board (TTB)
Managing Director
Administration & Accounts Sections
Tourism Development Section
Assistant Director
Research, Training & Statistics Section
Assistant Director
Licensing and Control Section
Assistant Director
Schedule Officers Schedule Officers
Hotel & Tourism Training Institute (HTTI)
Principal
Tourism Division
Director
Tanzania Tourism Board (TTB)
Managing Director
Administration & Accounts Sections
Hotel & Tourism Training Institute (HTTI)
Principal
Tourism Division
Director
Tanzania Tourism Board (TTB)
Managing Director
Administration & Accounts Sections
Licensing and Control Section
Assistant Director
Licensing and Control Section
Assistant Director
Schedule Officers
Licensing and Control Section
Assistant Director
Schedule Officers
Tourism Development Section
Assistant Director
Research, Training and Statistics Section
Assistant Director
Hotel & Tourism Training Institute (HTTI)
Principal
Tourism Division
Director
Tanzania Tourism Board (TTB)
Managing Director
Administration & Accounts Sections
Schedule Officers Schedule Officers
Licensing and Control Section (TALA)
Assistant Director

53
The Tanzania Tourism Board The Tanzania Tourism Board (TTB) is a government agency, which was established under the Tanzania Tourist Board Act of 1992. The board works closely with the Tourism Division to ensure the promotion of Tanzania as a desirable tourist destination. The board is also responsible for promoting and developing all aspects of the tourism sector. The specific activities of the board include among others: to conduct publicity campaigns with the objective of attracting more tourists, to prepare and publish brochures indicating Tanzania as a perfect destination, to provide important information to tourists, to undertake tourism market research, and to establish an up-to-date tourism database.
The Tourist Agency Licensing Authority The Tourist Agency Licensing Authority (TALA) is responsible for issuing licences to organisations operating in the tourism sector in Tanzania. The unit is also responsible for inspecting the travel agencies and tour operators to ensure that they conform to the stipulated regulations (URT, 2002b). The guidelines on tourism licences are written in the handbook for guidelines on Tourism Licences according to the Tourist Agents Act (Licensing Regulation) 1969 and various Tourist Agents Regulations (URT, 2004a: 2). There are six types of tourism businesses: tour operators, car hires, travel agents, mountain climbing, hunting safaris, and tour guides. The tourism licences are categorised into four classes (Class A, Class B, Class C, and Class D). These classes have different annual licence fees (URT, 2004b). For example, “Class A” annual licence fee goes up to 2000 USD per business type. If a firm is operating as a tour operator and at the same time is a travel agent, then the firm is required to pay a total of 4000 USD per annum. By 2008, not all SMEs operating as tour operators were registered under TALA (TALA, 2008). The majority of the SMEs were claiming that the licensing fee and the conditions of having a TALA licence are too high. For example, for a local firm which is fully owned by a Tanzanian citizen requesting a TALA licence to run a tour operator business in Tanzania must fulfil the following:
a. A certificate of registration, memorandum and articles of association of the company registered in Tanzania;
b. Suitable office premises for carrying out the business of tour operators; c. A fleet of not less than five road worth vehicles. The vehicles must be not more than five years
old since their first registration. The vehicles must be registered under the company’s business name;
d. All vehicles must be comprehensively insured and inspected by traffic police; e. All tour vehicles must vividly display in writing the name of the tour operator on each side of
the vehicle. Stickers are not allowed; f. All tour vehicles must vividly display the licence of tourist agent on the vehicles, subject for
inspection (URT, 2004a: 3).
Meeting all these requirements has been a challenge for SMEs, because the highest capital investment for SMEs is 800,000,000 Tanzanian shillings, according to Tanzania’s SMEs definition. The non-citizen owned companies have even higher conditions than the local businesses (URT, 2004b).
4.2.3.3 The Zanzibar Commission of Tourism The Zanzibar Commission of Tourism (ZCT) is equivalent to the MNRT on the Tanzania mainland. The ZCT was established as a public institution dealing with tourism development in Zanzibar in 1992. The institution was granted legal power under the Tourism Promotion Act, 1996 (9). The ZCT is responsible for licensing tourism activities, developing tourism products, grading and classifying tourism facilities,

54
monitoring and supervising the tourism sector, assisting potential tourism investors, conducting public tourism education programmes, and keeping of all records and data on tourism activities in Zanzibar.
4.2.3.4 The Tanzania Investment Centre The Tanzania Investment Centre (TIC) is a government institution responsible for investment promotion in the country. It was established under the Investment Act of 1997 (26). In the follow-up of the economic restructuring in the middle of 1990s, the government created an agency that has been responsible for coordinating, encouraging, promoting and facilitating investment in the country (TIC, 1997). The centre is also responsible for advising the government on issues related to investment. This is a convenient centre for foreign investors as it acts as a one-stop-shop where all necessary information and institutions responsible for investment in Tanzania are located. However, in order to get a TIC certificate for a project that is wholly owned by Tanzania citizens, one must have a minimum capital of USD 100,000. This may be a limitation to most of the SMEs owners as their capital is limited (Olomi, 2006). In Zanzibar, the Zanzibar Investment Promotion Authority (ZIPA) provides the same services as the TIC.
4.2.3.5 The Business Registrations and Licensing Agency The BRELA is a semi-autonomous executive agency under the MITM. The agency was established under the Government Executive Agencies Act no. 30 of 1997 (URT, 1997a). The agency is responsible for business registration in Tanzania. The main functions of BRELA include among others registration of companies (both local and foreign), registration of business names, registration of trade and services marks, granting patents, and industrial licensing. However, the agency registers the names of the companies without categorising them in the nomenclature of SMEs or large firms. Therefore, the government enacted the Business Activities Registration Act 2006, with the aim of harmonising and simplifying the registration procedure at the country level. The new business registration system was implemented by BRELA assisted by local authorities.
4.2.4 The Private Sector in Tourism The private sector in Tanzania has also played a significant role in the development of tourism in Tanzania (MIGA, 2006). In order to enhance and simplify the role of the private sector partnership with the public sector, private firms are organised in different tourism associations. Those associations are housed under the umbrella of the Tanzania Confederation of Tourism (TCT, 2010). The TCT was launched in 2001. Its main role is to facilitate the dialogue between the private sector and the government on issues concerning tourism development in Tanzania and safe guarding the interests of TCT members. The association also advises the government on the appropriate national tourism policies, legal frameworks, and strategies to ensure sustainable tourism growth and protection of Tanzanian natural and cultural heritage. The following is a brief summary of the private sector associations that constitute the TCT in Tanzania:
Tanzania Association of Tour Operators (TATO) – TATO is an association representing tour operators in Tanzania. The association provides input to the government and its institutions in matters pertaining to the formulation of tourism policy, plans and programs that will be favourable to both the private and public sector.
Tanzania Society of Travel Agents (TASOTA) – TASOTA is an association which was formed by travel agents to promote and protect their interests and at the same time ensuring that the TASOTA members adhere and maintain the code of conduct and ethics within the travel sector.

55
The association is also responsible for ensuring smooth collaborations with other TCT member associations.
Intra-Africa Travel & Tourism Association (ITTA) – ITTA is an association of Africa based tour operators which focuses on the domestic tourism as a sustainable pathway to poverty alleviation.
Hotel Association of Tanzania (HAT) – HAT is an association of hoteliers in the tourism sector in Tanzania. The association aims at ensuring that the members are providing better and high quality services. The association is also keen to ensure that the mutual understanding with other stakeholders in the industry prevails.
Tanzania Air Operators Association (TAOA) – TAOA is an association representing air operators in Tanzania. The association was created as a platform for facilitating discussion between the licensed air operators and other key players in the aviation sector.
Tanzania Hunting Operators Association (TAHOA) – TAHOA is the association for supporting hunting organisations in Tanzania. The association works closely with the government and public institutions to ensure a sustainable hunting sector of the highest ethics and standards.
Tanzania Professional Hunters Association (TPHA) - TPHA is an association of professional hunters only working in Tanzania. The association was established in order to set standards for high professionalism in hunting. The association works closely with TAHOA.
Tanzania Tour Guides Association (TTGA) – TTGA is perhaps the most SMEs oriented association because it is an association that represents the tour guides in the tourism sector.
Zanzibar Tourism Investors Association (ZATI) – ZATI is a non-governmental, non-religious and non-political association, which is established to represent the interests of all tourism investors in Zanzibar. ZATI represents all the key stakeholders in the tourism sector, including tour operators, travel agents, hoteliers, etc. The association ensures the sustainability of the tourism sector in Zanzibar by working with its members on the issues of providing highest service standards. At the same time, the association works with the government to arrive at a mutual partnership that will ensure that Zanzibar continues to be the most favourable tourist destination in the world.
Figure 4-10. ZATI Office – Zanzibar
Photo: Musabila (2011)
4.3 The SMEs Sector in Tanzania The existence and rise of the SMEs sector in Tanzania followed the failure of the public sector in the late 1970s and earlier 1980s. The majority of the public enterprises during that period were characterised by huge losses, corruption and poor service delivery (Mtatifikolo, 1995). The government embarked on a major policy of economic reforms through the Economic Recovery Programme (ERP) and the Economic and Social Action Programme (ESAP) (Mtatifikolo, 1995). The implemented policy emphasised on privatization, decontrolling of the domestic and foreign trade, lessening control on the pricing mechanism, tax system simplification, and decontrolling the monetary policy and exchange rate. The main aim of these changes was to create competitive financial and market systems that operate based

56
on market-oriented economic principles (Mtatifikolo, 1995). The reform programmes facilitated the emergence of the private sector. Since 1986, most of the institutions and organisations have recognised the importance of SMEs in the country.
4.3.1 The SMEs Definition in Tanzania In the literature review we conducted, the findings indicate that the most used definition of SMEs in Tanzania is extracted from the Tanzania SMEs Policy (2003) document (URT, 2003b: 3). The SMEs definition as stated in Chapter 2 takes into account the number of employees and capital investment machinery. Table 2-2 provides the limits for classifying micro, small, and medium-sized enterprises. The SMEs policy also provides an exception in case an enterprise belongs to more than one group. In such a case, the level of investment is the deciding factor (URT, 2003b).
4.3.2 The Importance of SMEs in Tanzania The economic importance of the SMEs is well known worldwide. In Tanzania, SMEs also play a significant role in the generation of both income and employment. However, it is difficult to tell the exact figure of the contribution of the SMEs because there is no baseline study that has been conducted countrywide in recent years (Olomi, 2006). Some of the reports suggest that SMEs in Tanzania contribute more than 30% of the GDP (Calcopietro and Massawe, 1999). The unemployment problem is increasing in most of the developing countries. The SMEs sector provides a solution to that problem by creating employment opportunities to the labour force that cannot be absorbed in the public sector (URT, 2003b). For example, in Tanzania it is estimated that 700,000 new entrants are joining the labour market in each year. So far, the public sector can only absorb 40,000 of those people (Olomi, 2006; URT, 2003b). The majority in this category are the fresh school leavers, who have no specialised knowledge. It is estimated that the SMEs sector employs 30% of the labour force in Tanzania (URT, 2003b). On the other hand, SMEs are the source of products in the country as their goods are affordable since they use less expensive labour and their raw materials are extracted from local sources.
4.3.3 The Institutional Organisation of SMEs in Tanzania
4.3.3.1 The Period Before 2003 Before the enactment of the SMEs policy (2003) in Tanzania, the institutional organisation of SMEs was fragmented across several government institutions and agencies. The government institutions addressed only SMEs issues related to their institutions. For example, the Ministry of Labour addressed labour-related issues only. Some of the key institutions that dealt with SMEs included:
The Ministry of Industry and Commerce (MoC); The Ministry of Labour and Youth Development (MLYD); The Ministry of Finance (MoF); The Bank of Tanzania (BoT); The Vice President’s Office (VP); The Planning Commission (PC); The Ministry of Agriculture and Co-operatives (MAC); The Ministry of Community Development, Women Affairs and Children (Calcopietro and
Massawe D., 1999; URT, 2003b).

57
Other agencies that coordinated the different activities of the SMEs included: Small Industries Development Organisation (SIDO); Tanzania Small Industries Organisation (TASISO); Vikundi vya Biashara NdogoNdogo (VIBINDO) (this means small traders groups); Tanzania Industrial Research Development Organisation (TIRDO); Centre for Agricultural Mechanization Rural Technology (CAMARTEC); Tanzania Engineering and Manufacturing Design Organisation (TEMDO); Tanzania Bureau of Standards (TBS); Board of External Trade (BET); Institute of Production Innovation (IPI)
The URT (2003b) spelled out that the key constraints facing the SMEs sector during that time were divided into five major groups. These included the macro and policy environment, the physical and technological infrastructure, the banking and finance structure, the legal and regulatory framework and the marketing capabilities (see also: Calcopietro and Massawe, 1999).
4.3.3.2 The Period After 2003 After the enactment of the SMEs policy in 2003, various strategies to deal with SMEs key problems and challenges were established in Tanzania (URT, 2003b). The strategies focused on the legal and regulatory framework, the physical infrastructure, the business development services, access to finance, the institutional framework development, the SMEs development, the rural industrialisation, and the cross-cutting issues. The new structure required the MITM to have a coordinating role for the implementation of SMEs policy (URT, 2003b). The ministry would specifically:
Function as the hub for all SMEs in the country; Establish the SMEs forum, publish the annual SMEs report, and create the SMEs databank,
which will show all SMEs information per sector; Coordinate and supervise all SMEs stakeholders and be responsible for organising, monitoring
and evaluation of the SMEs policy implementation; In order to facilitate the development of SMEs in Tanzania, the MITM has dedicated an independent division for SMEs development in Tanzania. The division has two independent units dealing with SMEs development in Tanzania. These units include the Enterprises Promotion Section and the Business Support Services Section. The division is actively involved in various SMEs programmes and projects. Currently, the active projects include the Business Incubation Project, the Connecting Rural Entrepreneurs Project (Muunganisho Ujasiriamali Vijijini - MUVI), the SMEs Competitive Facility (SCF), the MSME Baseline Survey project, and the SMEs Credit Guarantee Schemes (URT, 2008c). The MITM is actively working with previously mentioned stakeholders (for example SIDO, TASISO, VIBINDO, TIRDO, CAMARTEC, TEMDO, and TBS), in ensuring the successful implementation of the strategies spelled out in the SMEs policy (URT, 2003b). However, the coordination of SMEs in the tourism sector is very limited as there is no database either at the MNRT or at the MITM regarding the status of SMEs in Tanzania. The only published list of businesses in the tourism sector is the list of TALA licence operators (TALA, 2008). However, the list is not categorized in the SMEs nomenclature. The list provided is based on the business licences offered to the organisations.

58
4.4 ICT Development in Tanzania ICT adoption among developing countries is important because it can contribute to economic growth and improve public services (Molla and Heeks, 2007). Such developments are achieved through enhanced and reduced communication costs within developing countries (Mutula and Mostert, 2010). At the same time, the communication costs between developed countries and developing countries are also significantly reduced through Voice over Internet Protocol (VoIP) technology (Esselaar et al., 2001). The development of ICT in Tanzania goes back to 1965 when the government introduced the first computer in the Ministry of Finance (MoF). Other governmental institutions also adopted the same technology. However, there was poor integration between ICT and public services (Mbamba, 2002).
4.4.1 Historical Perspective ICT development in Tanzania can be divided into two main periods. First, the period before 1993 when the import of any ICT related equipment was prohibited. Second, the period after 1993, the period after abolition of the ICT equipment import ban.
4.4.1.1 The Period Before 1993 In 1965, the MoF installed the first computer (ICT 1500) in Tanzania (Mgaya, 1990). By 1974, there were seven computers in the country, totally owned by the government. The country depended on the import of computer hardware and software as there were no plans to assemble computers within the country. As it was previously stated, the development of ICT application in Tanzania was drastically affected by the government ban of 1974 (URT, 2003a). Due to the ban, there were slow developments of computerisation within the country. The major responsibilities of ICT development were left to the member countries within the East Africa Community (Mgaya, 1990). Following the downfall of the East Africa Community in 1977, the government had no choice but to develop its own ICT network infrastructure. The majority of the government computers were old and out-dated, because in the early 1970s the government was still using the computers bought in the 1960s (Mgaya, 1990). On the part of the government institutions, the Tanzania Post and Telecommunication Corporation (TPTC) was the only governmental institution allowed to provide telecommunication and postal services to the entire country before 1993 (Esselaar et al., 2001). The main communication services offered during that period were the fixed line telecommunication services and postal services. In 1993, the TPTC was dissolved into the Tanzania Postal Corporation (TPC) and the Tanzania Communication Commission (TCC). The TCC was responsible for:
Licensing telecommunications and postal services; Licensing telecommunication equipment vendors; Approving standards for telecommunication services; Monitoring the quality of telecommunication services (URT, 1993b).
In the same year (1993), the government enacted the Tanzania Broadcasting Act 1993 (6) which prohibited any unauthorised broadcasting. The Tanzania Broadcasting Commission (TBC) was also established for regulating and licensing broadcasting in Tanzania. Radio Tanzania and Tanzania Television were allowed to broadcast in Tanzania (URT, 1993a).
During this period, internet connectivity was not popular. As Sheriff (2007) argues, the first email and internet initiatives in Tanzania took place in 1989, between the Muhimbili University College of Health Sciences (MUCHS) and FidoNet. The e-mail services depended on the dial up connectivity to the MUCHS servers. The MUCHS servers were connected to the United Kingdom through a satellite dish. The connectivity was too slow and very expensive (Sheriff, 2007).

59
4.4.1.2 The Period After 1993 After abolition of the import ban in 1993, there was more progress in ICT equipment import and internet connectivity development. In 1995, Star Telecoms Ltd attempted to build a national network of users in Tanzania without connectivity to the outside world (Sheriff, 2007). The development continued until 1996 when CyberTwiga established a live internet connection through the SITA network. The Tanzania telecommunication regulatory framework allowed more freedom to private companies to invest and operate in the telecommunication industry. For example, the telecommunication industry in Tanzania was liberalised in 1997 through the National Telecommunication Policy (NTP) (URT, 1997b). The policy aimed at ensuring the provision of better telecommunication services in the country. The competitive telecommunication industry would also ensure the provision of adequate, sustainable and efficient telecommunication (URT, 1997b). The Tanzania Communication Commission became the regulator of the communication industry.
As telecommunication regulations were more liberalised, more internet service providers were licensed, for example AFSAT, DATEL, etc. Sheriff (2007) argues that the initial connectivity cost were extremely high. The internet connectivity costs and telephone costs since the telecommunication industry liberalisation have continued to decrease. Currently, SEACOM (the first undersea fibre optic cable connecting Tanzania, Mozambique, South Africa, Kenya, India, Egypt and Djibouti to Europe) is promising reduced costs per megabit per second to African connected countries. The private sector is still leading on taking initiatives to implement ICT solutions in the country.
The private sector in ICT is not well organised in associations like the tourism sector. Individual companies are making separate initiatives in technological progress, for example, the deployment of the 3G network by Vodacom, the deployment of CDMA 800 networks by the Tanzania Telecommunication Company Ltd (TTCL) and Zanzibar Telecommunication Ltd (ZANTEL). There are several undersea fibre optic cable projects going on to enable fast internet connectivity to the Africa continent (Mutula and Mostert, 2010; Schmid, 2009).
Figure 4-11. African Undersea Cables (2012)
Source: CC-BY-SA (2010)
The new undersea cables investment is dramatically increasing international connectivity, as indicated in Figure 4-11. For example, the SEACOM cable is linking Kenya, Madagascar, Mozambique, South Africa and Tanzania, with Europe and India. The cable became operational in 2009 (UNCTAD, 2009) Another fibre optic cable project includes the Eastern Africa Submarine Cable System (EASSy) which is linking the Djibouti, Kenya, Madagascar, Mozambique, Somalia, South Africa, Sudan and Tanzania (UNCTAD, 2009).Other fibre optic cable projects include the SAT3/SAFE, the TEAMs, the Lion, the MaIN OnE, the WACS and the ACE project as marked in Figure 4-11 (see also: Mutula and Mostert, 2010).

60
4.4.2 The Institutional Organisation of ICT Before 2003, the efforts to deploy ICT across various government institutions and private companies were carried out in an uncoordinated way (URT, 2003a). After the enactment of the ICT policy and assigning one ministry the role of ICT coordination development in Tanzania there has been significant coordinated development of ICT within the public institutions (URT, 2003a). Under the current government structure, the ICT responsibilities are under the Ministry of Communication, Science and Technology (MCST). The main roles of the ministry are policy formulation, monitoring and evaluation, regulatory and legal matters pertaining to communication, ICT development and application, science, and technology & innovation development in the country. The ministry has several institutions for coordinating ICT development and training within the country. These include:
The Tanzania Communications Regulatory Authority (TCRA); The Tanzania Commission for Science and Technology (COSTECH); The Dar Es Salaam Institute of Technology (DIT); The Tanzania Telecommunications Company Ltd (TTCL); The Mbeya Institute of Science &Technology (MIST); The Nelson Mandela African Institute of Science &Technology (NM-AIST); The Tanzania Posts Corporation (TPC); Tanzania Atomic Energy Commission (TAEC)
4.4.3 Other Stakeholders There are other stakeholders working with the government and the private sector in ensuring ICT development and easy connectivity of the internet through the African continent. The regional key stakeholders are the World Bank, the Economic Commission for Africa (ECA), the Common Market for Eastern and Southern Africa (COMESA), the Southern African Development Community (SADC), The SAT-3/WASC/SAFE Project, The Africa One Project, and The Regional African Communications Organisations (RASCOM) (Mutula and Mostert, 2010; Schmid, 2009; UNCTAD, 2009).
4.4.4 ICT Related Problems Facing SMEs in Tanzania So far, there are limited baseline studies carried out at the national level indicating the ICT status in Tanzania. The few studies carried out indicate that the country has limited ICT infrastructure facilities. ICT awareness especially among government officials is very low (Chachage, 2001; Esselaar et al., 2001). In most cases, SMEs have to import all ICT equipment because there are no local manufacturers of ICT hardware and software (SIDA and Greenberg, 2008). Mbamba (2004) also cautions that most of the Tanzanians lack awareness of e-services, and there is a fear for not being able to get the products they have ordered. Another ICT related problem is the language barrier as most of the users in Tanzania speak Swahili (URT, 2003a). Esselaar et al. (2001) argue on missing a strong industry body representing the interest of the private sector when negotiating with the government. There is also a remarkable shortage of ICT skilled people because there is an ever-increasing demand for ICT experts in Tanzania (SIDA and Greenberg, 2008).

61
4.5 The Data Collection Regions
Figure 4-12. Data Collections Regions
Source: Amani (2010)
Data collection for this study was carried out in in four regions as indicated in Figure 4-12. Those regions are labelled as:
1 – Dar es Salaam 2 – Arusha 3 – Kilimanjaro 4 - Zanzibar
As we argued earlier, the four selected regions represent most of the tourism attractions (TCT, 2007; URT, 2002b). Additionally, most of the SMEs offices dealing with tourism businesses are located in the selected four regions. Therefore, it would be easy to meet the expected respondents. Furthermore, we found that the selected regions are located near the international entry points (Dar es Salaam, Kilimanjaro and Zanzibar).
4.5.1 The Dar es Salam Region Dar es Salaam city is perhaps the most important old city in the country, as its historical background goes back to the invasion of the Arabs. The historical background of the city extends over four colonial rulers which include the Portuguese, the Arabs, the German, and finally the British. The city was taken from the Arabs by the Germans around 1887. The Germans made Dar es Salaam into an administrative town (TCT, 2010). The British took over Dar es Salaam after the First World War. The remnants of colonial presence can be seen on the landmark and architecture around the city. The city’s location also made it the most popular commercial city in East Africa.
Figure 4-13. Dar es Salaam Map
Source: Hauner (2000)
Dare es Salaam is located in the eastern part of the country, with access to the Indian Ocean. It has a considerable area suitable for beaches and most of the tourist hotels are built along the Kinondoni and Kigamboni beaches (refer to Figure 4-13; URT, 2008b). The region has three main districts, namely Ilala, Kinondoni and Temeke. Dar es Salaam is an important city for both the government and businesses. Most of the manufacturing firms are located in Dar es Salaam. Dar es Salaam is also a hub of the Tanzania communication because it has the biggest international airport (Julius Nyerere International Airport) and it has the networks of railway lines.
According to URT (2009c) Dar es Salaam has an area of 1,393 square kilometres. There are 2,487,288 inhabitants.
2
3
4
1

62
Most of the foreign embassies are located in the city. The major government as well as private institutions governing tourism businesses are located in Dar es Salaam. For example, the MNRT, the TTB, the TALA, the TCT, and the majority of tour operators have offices in Dar es Salaam (TCT, 2007; TCT, 2010). The city has also an important port. Most of the big hotels are also located in Dar es Salaam. Dar es Salaam is a highly internet connected region, as most of the internet service providers are located in Dar es Salaam (TCRA, 2007).
4.5.2 The Arusha Region The Arusha region is located in the northern part of Tanzania, as indicated in Figure 4-15. The Arusha region forms an important border in tourism business with Kenya. The tourism history indicates that the majority of the tourists visiting the northern circuit were crossing over from Kenya (Wade et al., 2001). The Arusha region is by far the most famous landscape on the northern region, as it is surrounded by the most popular national parks in the whole of Africa. Such national parks include the Serengeti National Park, the Ngorongoro Crater, the Lake Manyara Park, the Olduvai Gorge, and the Tarangire National Park (TCT, 2010). The Arusha region is also close to the Kilimanjaro Mountain, which is the highest point in Africa. URT ( 2009c) indicates that the Arusha region has an area of 36,486 square kilometres and its population was projected to be 1,288,088 inhabitants by 2008. The region is also best suited for coffee and banana cultivation. Additionally, in recent years, the vegetable and flowers exportation to Europe has opened another venue for economic activity.
Figure 4-14. Dar es Salaam View
Source: Kenosha (2010)
Dar es Salaam is an important city for tourists because it is the biggest international entry point to Tanzania. Generally, more than half of the tourism arrivals pass through Dar es Salaam. Thereafter, the tourists travel to other destinations, for example to Zanzibar, the northern circuit, or the southern circuit (MIGA, 2006). Additionally, Dar es Salaam is endowed with a variety of tourism attractions such as the National Museum and the Makumbusho Villages (TCT, 2010).

63
Figure 4-15. The Arusha Region Map
Source: Thompson (2004)
The Arusha region is a major contributor to the tourism sector in Tanzania. Most of the tourist attractions and the majority of tour operators are located in Arusha. The region has also a relatively well-developed infrastructure. Arusha has also a pleasant climate and greenish environment, suitable for most of the tourists coming from Europe. However, it is argued that the northern circuit is increasingly becoming overcrowded (URT, 2002b). The region is also popular due to other historical and international activities. Arusha was the headquarter of the East Africa community (EAC) before it collapsed in 1977.
The EAC was revived in 2000, and Arusha continued to be the headquarter of the EAC. The Arusha International Conference Centre (AICC) provides also venues for other international activities. For example, the International Criminal Tribunal for Rwanda (1994) is carrying out its activities in Arusha. Arusha is also popular because the Arusha Declaration was signed here in 1967, aimed at empowering Tanzanian citizens with major means of productions.
4.5.3 The Kilimanjaro Region
Figure 4-16. The Kilimanjaro Region Map
Source: Olympus (2010)
The Kilimanjaro Region is located at the bottom of Kilimanjaro Mountain and is also endowed with the Kilimanjaro National Park (URT, 2002b). The Kilimanjaro region has area coverage of 13,309 square kilometres (URT, 2009c). It is estimated that 1,376,702 citizens populate the region. This is a relatively developed centre near to Arusha region. The region is also important because it forms borders with Kenya.
4.5.4 The Zanzibar Islands Zanzibar unlike other regions is a group of islands located in the Indian Ocean. The Zanzibar Islands are 25 to 50 kilometres from the Dar es Salaam coast region (URT, 2008b). As we stated in Section 4.2, Zanzibar is a semi-autonomous country, part of the United Republic of Tanzania. Zanzibar is comprised of two large sub islands, known as Unguja and Pemba. The Unguja Island is popular for beach tourism and the Pemba Island is popular for diving sports. Pemba was formerly popular for clove plantations because the island was the world’s largest producer of cloves. Zanzibar also exports spices, seaweed and raffia. However, the tourism sector remains the major foreign exchange earner of the country. Zanzibar is also popular due to its historical events which go back to the time when it was under the Arabs, the Portuguese, the Germans and finally the British (TCT, 2010). Zanzibar is also popular for organising

64
festivals such as the ZIFF Festival, Dhow Countries films festival and Sauti za Busara Swahili Music Festival. Zanzibar also has few wild animals such as the Zanzibar red colobus, leopard, monkeys, bush pigs and small antelopes.
Figure 4-17. The Unguja Island
Zanzibar (2010)
Zanzibar region covers 2,460 square kilometres with a population of 981,754 inhabitants (URT, 2009c). The majority of people residing in Zanzibar are Muslims. Therefore, it is important for the tourists to observe the Muslim customs. The region was also popular for harbouring the slave trade in East Africa. The remains of the slave trade are among the most interesting part of tourism in Zanzibar. The tourism activities in Zanzibar play a significant role as the region has no major industries (TCT, 2010).

65
5. Methodology
Chapter 5 details the research methodology used in this study. The main objective of this chapter is to explain our methodological choices, and the steps we followed to collect the data and to test the hypotheses presented in Chapter 3. The chapter starts by discussing the research design. Furthermore, the chapter details the research procedures and techniques used to design and test the questionnaire. We also discuss the techniques used to select the sample and collect data. Also in this chapter, we examine the different techniques that we used to analyse the data. Other problems and issues pertaining to the reliability, validity and generalisation of the study are also presented. The chapter ends up by discussing how the ethical issues were assured in this study.
5.1 Research Design A research design is a framework or blue print for conducting a certain study. Usually, it details the procedures necessary for obtaining the information needed to structure and solve the research problems (Malhotra, 2004). The choice of a research design depends on the main question of the study and the convictions of the researcher. We found that the convictions of the researchers are mainly divided into the Positivist and Interpretivist continuums. Our study relies much on the Positivist continuum using quantitative data analysis methods to explain ICT adoption and usage among SMEs in the tourism sector in Tanzania. However, we adopted the qualitative approach in the early stages of our study. This approach was used for the expert interviews and the pilot studies carried out in Tanzania in 2007 and 2008 respectively.
5.1.1 Qualitative Research Design A qualitative design focuses on gaining information from a smaller sample group. The qualitative perspective emphasises on an interpretivist or constructivist view. In this view, the reality is seen as inherent in the perception of individuals (Myers, 1997). The design was developed in social sciences to study social and cultural phenomena. Qualitative researchers have a tendency to see the world as a social construction that demonstrates large differences depending on the observer and the interpreter of the phenomenon in question (Straub et al., 2005). Due to increasing influences of managerial, organisational and network issues in ICT, ICT research is increasingly adopting the qualitative research design (Myers, 1997). Some of the sociological influences on ICT adoption and usage cannot be reduced to definite variables and quantified textual data, which are suitable for the quantitative approach. The choice of a research method also depends on the underlying assumptions. However, the commonly used methods are action research, case study research, ethnography and grounded theory (Myers, 1997). Benbasat et al. (1987) also support that there has been an increasing interest in the use of qualitative research methods in ICT studies. Such interest is motivated by the dissatisfaction arising from the complexity of quantitative design. The dissatisfaction with the quantitative design is attributed to the difficulties encountered in understanding and making proper interpretations of research findings in quantitative studies. Some of the previous ICT studies have adopted the case study approach in order to explain the dynamics of ICT adoption and usage among SMEs (see, for example: Mehrtens et al., 2001; Poon and Swatman, 1997). Additionally, Benbasat et al. (1987) also argue that the case study approach in ICT research is preferred in certain types of problems whereby the underlying theory is still at the early stage or at the formative stage. Sometimes, it is preferred in a situation whereby the problem is more practical based and hence the experiences of the actors are important and the context of action is critical. This study

66
adopted the qualitative method for analysing the expert interviews and the pilot studies carried out before the main quantitative method was applied (Morgan, 1998).
5.1.2 Quantitative Research Design A quantitative research design involves gathering data from a large sample, usually through a survey using a structured questionnaire (Malhotra, 2007). Some of the quantitative research methods are now widely accepted in social research studies, for example the survey method (Myers, 1997). The main advantage of a quantitative research design is its flexibility in the treatment of data. The researcher can carry out several comparative analyses and statistical analyses. The design also allows the possibility of repeating the same study in different contexts to verify the reliability and to support a generalization of the findings (Jones, 1997). On the other hand, the main weakness of quantitative design is its failure to ascertain the deeper underlying meanings and explanations of the studied phenomena. The pre-designed questionnaire with a set of responses may fail to capture all the possible responses from respondents (Churchill, 1995). The survey method has been used extensively for determining the factors influencing the adoption and usage of ICT. In our study, we adopted the quantitative method as the main study method (see also: Morgan, 1998).
5.1.3 Research Designs Triangulation Some of the previous studies aligned to either the qualitative or the quantitative research design. In recent years, researchers have suggested combining more than one research design, also known as research designs triangulation. Combining the research designs is believed to provide a richer basis for interpretation and validation of the results (Kaplan and Duchon, 1988). A combination of the research designs takes advantages of both designs. This is done by introducing the strength of testability (quantitative) and strength of context (qualitative) into ICT research. The literature review conducted by Jeyaraj et al. (2006) within ICT innovation adoption alone revealed 135 independent variables, 80 dependent variables, and 505 relationships between the independent and dependent variables. The conflicting conclusions, inconsistencies of results and potential analytical errors or omissions can be detected by the application of a triangulation strategy (Kaplan and Duchon, 1988) When considering the application of the triangulation method, the researcher should decide on the major research design. Traditionally, the qualitative design has been used as preliminary stage towards the quantitative main study. However, the priority-sequence model suggests that there are four different combinations of research methods based on the principal definition of the main study design (Morgan, 1998). Based on the principal design, design combination possibilities may be:
(a) Preliminary qualitative methods in a quantitative study; (b) Preliminary quantitative methods in a qualitative study; (c) Follow-up qualitative methods in a quantitative study; (d) Follow-up quantitative methods in a qualitative study (Morgan, 1998)
5.1.4 Research Design for this Study Based on the above arguments, this study has adopted the preliminary qualitative methods in a quantitative study. In this approach, the qualitative study provided interpretative resources for understanding the results of the quantitative study. The preliminary qualitative study provided further insights into the data collection instruments used in the quantitative study. As it was pointed out earlier, the adoption and usage of ICT among SMEs in developing countries is increasingly being influenced by

67
not only technological factors, but also by organisational and societal factors. A complete understanding of such a complexity pattern of factors involved in this study necessitated the use of expert interviews and a pilot study as well as the main quantitative study. Several information technology studies have adopted this approach previously. Kamuzora (2006a) adopted also the combined approach of research designs in Tanzania. We summarise our research methodology steps as indicated in Figure 5-1.
Figure 5-1. Research Steps
5.2 Designing and Testing the Questionnaire Designing a questionnaire is still much of an art rather than a science. There are many cautions to avoid when constructing a questionnaire (Churchill, 1995). Such cautions may be avoiding leading questions or avoiding ambiguous questions. Churchill (1995) presents several questions that can be used as a checklist when designing a questionnaire. Such questions include:
What information will be sought? What type of questionnaire will be used? How will the questionnaire be administered? What will be the contents of each question? What will be the form of response? How will each question be phrased? How will the questions be sequenced? What will the questionnaire look like physically?
Designing the questionnaire also involves balancing the length of the questionnaire, the relevance of the individual questions and the comprehensibility of the questionnaire (Malhotra, 2007). In most cases, balancing these objectives needs to make a trade off among them. For example, the researcher would like to gather as much information as possible about the subject studied, but the respondents would like to give as less information and time for such a study as possible
5.2.1 Measurement Scales The measurement scales used to collect the data for this study were adopted from the existing ICT measurement scales. The innovation characteristics were adopted from previous studies and adapted to fit the e-mail and web technologies context (Moore and Benbasat, 1991; Rogers, 2003). The social influence was added as an independent variable because in the context of a developing country it may not be feasible to estimate all the benefits of ICT adoption and usage in advance (Tornatzky and Klein,
Expert Interviews
Pilot Study
Survey
Literature Review

68
1982). Carlson and Zmud (1999) provided the basis for designing the items for measuring the perceived social influences. The organisational characteristics were adopted from Kendall et al. (2001) and Thong (1999). We also adopted items from Van Slyke et al. (2007), who provided the items for measuring the perceived critical mass. The items were used as the basis for designing the competitive pressure items. The external environment characteristics were adopted from Khemthong and Roberts (2006). We also adopted external support items from previous studies (see for example: Brock, 2000; Yap et al., 1992). However, we added more sources of assistance like donor agencies and close relatives, to reflect the situation of the developing country. Government intervention items were selected from the institutional intervention framework suggested by King et al. (1994). The dependent variables were measured along e-mail and web technologies adoption (EWA) and e-mail and web technologies usage (EWU) as suggested by Khemthong and Roberts (2006). As most of the developing countries are still under lower levels of ICT adoption and usage, we suggested the ICT adoption and usage to be e-mail and web technologies related (see also: Khemthong and Roberts, 2006; Premkumar and Roberts, 1999). We changed the measurement scale from a 7- Likert scale to a 5-Likert scale to reflect the ability of the owner-managers of the SMEs to differentiate between agreement levels. We also added a few items to address the context of a developing country.
5.2.2 Questionnaire Translation As we indicated in Chapter 3, we argued that the selection of the conceptual framework of the study took into account the context of developing country. It is clearly understood that the language barrier is one of the bottlenecks hindering ICT adoption and usage among SMEs in developing countries (UNCTAD, 2009). In this study, we also anticipated the language barrier to hinder our study. Therefore, we decided to translate our original English questionnaire into Swahili. Hence, we contacted the National Council of Kiswahili (BAKITA) for the translation. We took the questionnaire in Swahili to the Language Department at Mzumbe University for translation back into English. The questionnaire was translated back into English with some distortions in the ICT terms such as e-mail (barua pepe), ICT (Teknohama), and internet (tovuti). Most of the ICT terminologies are quite new and it is not easy to find their Swahili equivalences. Therefore, we decided to keep the English version for the common words such as e-mail, internet, and website. However, the majority of the respondents were comfortable with the questionnaire in English.
5.2.3 Pilot Study Before the main data collection, the designed questionnaire was tested during the pilot study. The major objective of the pilot study was to test all the aspects of the questionnaire, which included contents, wording, sequence, form and layout, difficulties and instructions (see also: Malhotra, 2007). The designed data collection instrument was also presented to different academic experts in the innovation adoption domain for assessing the face validity of the items suggested. The instrument was piloted to 20 SMEs in Tanzania to gather their opinions about the suitability of those items. The pilot study enabled us to reword some of the items.
5.3 Data Types and Data Collection Methods The data collection process details the systematical approach and techniques used to gather information about the subject (SMEs in this case). The collected information should be able to answer the key research questions, namely identifying the key factors influencing adoption and usage of e-mail and web technologies among SMEs in the tourism sector in Tanzania. In this study, we collected primary data from SMEs in the tourism sector in Tanzania using the attached survey questionnaire in Appendix I.

69
5.3.1 Data Types In order to address our research key objectives, as stated in Chapter 1, we needed to examine the suitability of both the secondary and primary data concerning ICT adoption and usage among SMEs in the tourism sector in Tanzania. However, both secondary and primary data types have advantages and disadvantages in connection to quality and the costs associated with the acquisition of the data (Churchill, 1995).
5.3.1.1 Secondary Data Secondary data are statistics relevant to the objective of the researcher but gathered for other purposes (Malhotra, 2007). Collecting secondary data involves an examination of documents relating to the study in question. Secondary data are cheap and save a lot of time that would have been spent in the field study (Churchill, 1995). However, the accuracy and relevance of secondary data may be questionable. Based on the literature review we conducted and an expert study we carried out, the data available on ICT adoption and usage among SMEs in Tanzania are inadequate to address the main objective of our study. Some of the previous studies in Tanzania which addressed tourism in Tanzania, ICT adoption and SMEs in Tanzania included the following:
The Tanzania Tourism Surveys - In 2001 and 2004, the Ministry of Natural Resources and Tourism (MNRT), the Bank of Tanzania (BOT), the National Bureau of Statistics (NBS), the Immigration Department (ID) and the Zanzibar Commission for Tourism (ZCT) conducted two tourism surveys (URT, 2001; URT, 2004b). The surveys aimed at establishing the existing and credible tourism statistics. The key outputs were length of stay, number of arrivals and the average expenditure per person per night (URT, 2001; URT, 2004b);
The TCT directory (2007) – In 2007, the TCT published a list of TCT members of the seven associations (TCT, 2007). The list contained approximately 311 organisations. The directory list was important for establishing the initial contacts with tourism organisations in Tanzania. However, the directory was not very useful for our study because some of the members are large organisations;
Mbamba (2006) conducted a PhD study in problems of ICT in SMEs in Tanzania. The study compared differences between SMEs and large companies in managing ICT systems in their businesses. The key question addressed in the study was on how SMEs can successfully manage ICT development and its implementations. The study was very useful for creating the ICT adoption case setting in Tanzania for our study;
The University of Dar es Salaam Entrepreneurship Centre (UDEC) conducted a survey in 2004 aiming at assessing the business/technology incubation environment and the need for incubation in Tanzania. The study established the need for incubation services for SMEs;
The Tanzania Gatsby Trust (TGT) and the College of Engineering and Technology (CoET) conducted a countrywide survey on the needs of SMEs in Tanzania and measures to address those need (Katalambula et al., 2006). The study was carried out from 2002 to 2004, but the study covered mainly the production sector and not the tourism sector. The findings also did not present anything about ICT adoption among SMEs (Katalambula et al., 2006).
All the above studies or reports provided inadequate evidence to support all the objectives of this study. There were significant variations pertaining to the outputs of those studies, units of measurements, and

70
key concepts addressed (see, for example: TCT, 2007; URT, 2004b). Due to the lack of existing secondary data in ICT adoption and usage among SMEs in the tourism sector in Tanzania, we were obliged to collect primary data.
5.3.1.2 Primary Data Primary data collection is necessary if the researcher cannot find accurate and relevant data in the secondary sources (Churchill, 1995). There are several methods of collection of primary data. However, the most commonly used methods of primary data collection include observation, interviews, surveys, and experiments. Each method has its advantages as well as disadvantages. Nevertheless, in practise the researcher may combine more than one method of data collection. The final choice is determined among others by the nature of the research problem, method versatility, objectivity and accuracy desired, time availability and financial resources available for the study (Malhotra, 2007). In this study, we opted for a survey method and we administered the structured questionnaire ourselves. This option was the best alternative among SMEs in Tanzania because of the low response rate previously experienced by other researchers (see, for example: Ishengoma, 2005; Kamuzora, 2006a; Mbamba, 2006).
5.3.2 Data Collection Methods The use of data collection methods in a research study is influenced by several factors. Such influential factors may be the type of data (primary or secondary data), experienced response rate, and objective of the study (Malhotra, 2004). As with empirical studies in developing countries, our study also has a few limitations. For example, our study lacked a sampling framework which necessitated us to adopt a snowball sampling technique. In snowball sampling , one subject (respondent) provides the researcher the name of another subject (respondent), who in turn provides the name of a third, and so on (Vogt, 1999). Therefore, the technique could be a source of biasness in our study (Goodman, 1961). As it was stated earlier, the commonly used methods of primary data collection include observation, interviews, surveys, and experiments. In our study, we adopted a combination of personal interviews and survey. Because of the low response rate experienced, we decided to physically visit all the identified and selected SMEs.
5.3.2.1 Personal Interviews This method involves direct face-to-face conversation between the interviewer and the respondents. We used this method for the expert interviews and the pilot study. We also used personal interviews for the larger part of the main survey. We opted for this technique because it would increase the response rate. The method also allowed us to change the sequencing of questions in cases when respondents were not comfortable. Again, the method also allowed for the clarification of ambiguous questions, and permits the easy use of physical objects (see also: Churchill, 1995). On the other hand, this method resulted into high cost of visiting the respondents, and it took us more time than what we had planned for data collection.
5.3.2.2 Surveys Method We used the survey method to collect data for this study with a structured questionnaire. The objective of our study also dictated the survey method to be an appropriate method. The survey method entails using a standardised questionnaire to collect the desired information from the respondents (Malhotra, 2007). As we administered the questionnaire ourselves, the respondents had opportunities of asking additional clarifications on some of the questionnaire items they did not understand.

71
5.4 Target Population and Sample Selection In most cases, a sampling design starts by identifying the target population. As we stated earlier, this study was conducted in Tanzania focusing on ICT adoption and usage among the SMEs within the tourism sector. We opted for the tourism sector because the NUFFIC sponsorship required the PhD student to carry out their study within the SMEs sector in Tanzania. Therefore, the tourism sector being an information intensive sector was thought to be appropriate for adoption and usage of. Anckar and Walden (2000) argue that the tourism sector is one of the largest and fast-growing industries in the world. The sector offers a unique environment whereby the adoption of ICT in business seems to have a significant impact. We also found that most of the incoming tourists are foreign-based (URT, 2007). Consequently, the tourist awareness on ICT applications in business was thought to be an important factor for the adoption and usage of ICT in the tourism sector (see also: Buhalis and Deimezi, 2004).
5.4.1 Target Population The target population of our study was all SMEs in the tourism sector in Tanzania. The SMEs in Tanzania are defined according to the SMEs definition provided by the SMEs policy (URT, 2003b). The SMEs definition criteria are summarised in Table 2-2. The key informants were the individuals responsible for making decisions on matters related to ICT adoption and usage within their SMEs. Such individuals would be either the top management in the SMEs or the SMEs owner-managers (see also: Thong, 1999; Thong and Yap, 1995). We could not cover the whole country in our study. In Chapter 4, we discussed that not all regions in Tanzania are equally endowed with tourism attractions. Therefore, we selected the four regions that are most attractive to the tourists. These areas included the northern and the costal circuits of Tanzania (Dar es Salaam, Arusha, Kilimanjaro, and Zanzibar). Secondly, we found most of the tourism organisations listed in the TCT directory to be located in these regions (TCT, 2007). The TALA list of licensed organisations also indicated that the majority of the licences were issued to the same regions as explained in the TCT directory (TALA, 2008).
5.4.2 Sampling Frame The decision to study a sample instead of the population is influenced by several conditions (Malhotra, 2004). For example, Malhotra (2004) argues that the conditions influencing a researcher to adopt the sample study may be due to:
Small budget available for the study; The study may be limited with short time available; The population available may be too big; The population elements may have small variances in the characteristics; Low cost of sampling errors; Destructive nature of measurement; and High attention needs to individual cases.
According to the findings from the expert interviews we conducted in Tanzania, determining a sampling frame of SMEs in the tourism sector was impossible. The major reason attributed to not have a sampling framework in Tanzania is the lack of an up to date and complete database indicating all SMEs in Tanzania (see also: Ishengoma, 2005; Mbamba, 2006; Molony, 2006). As we discussed in Chapter 4, SMEs organisation and coordination in Tanzania is fragmented across different governmental institutions, donor agencies, and private associations (URT, 2003b). Small Industries Development Organisation (SIDO) is the only institution that was referred to having important data concerning SMEs in Tanzania. The interview with SIDO management during the expert interviews revealed that the last nation-wide SMEs study was carried out in the 1990s. In recent years, SIDO has not conducted any study

72
on SMEs at national and sectoral levels due to lack of funds. We also contacted the Business Registrations and Licensing Agency (BRELA). As it was discussed in Chapter 4, the BRELA registers the name of the company without categorising them into SMEs nomenclature. We also contacted the SMEs division under the Ministry of Industry Trade and Marketing (MITM). However, the division has never conducted any study concerning SMEs in tourism. Therefore, in the absence of an acceptable SMEs sampling framework we used the TCT directory to create our initial list of tourism organisations (TCT, 2007). Based on the TCT directory, we could also get information of the members of TATO, TASOTA, TAOA, HAT, ITTA, and ZATI, as indicated in Table 5-1.
Table 5-1. TCT Members Summary TCT Association Types Total Per cent Tanzania Association of Tour Operators (TATO) 181 58.2 Tanzania Society of Travel Agents (TASOTA) 25 8.0 Tanzania Association of Air Operators (TAOA) 14 4.5 Hotel Association of Tanzania (HAT) 39 12.5 Intra-African Tourism and Travel Association (ITTA) 7 2.3 Tanzania Hunting Operators Association (THOA) N/A 0.0 Tanzania Professional Hunters Association (TPHA) N/A 0.0 Tanzania Tour Guides Association (TTGA) N/A 0.0 Zanzibar Association of Tourism Investors (ZATI) 45 14.5 Total 311 100.0
Source: Compiled from TCT (2007: 114-123) However, the list provided did not include all organisations in the tourism sector. The TCT membership for tourism organisations is voluntary. Additionally, the TCT list did not categorise the organisations into SMEs and large organisations. Furthermore, we used the TALA list issued in 2008 (TALA, 2008). The list included the organisations that were licensed to carry out tourism activities in Tanzania in 2008, see Table 5-2.
Table 5-2. TALA Licence Types for 2008 License Type Number Per Cent % Tour Operator 234 42.9 Travel Agent 50 9.2 Car Hire 33 6.1 Mountain Climbing 66 12.1 Hotel 70 12.8 Lodge 25 4.6 Campsite 27 5.0 Hunting Safaris 24 4.4 Charter Service 3 0.6 Horse Riding 1 0.2 Photographic Safaris 7 1.3 Apartment 1 0.2 Handling Agent 1 0.2 Balloon Safaris 1 0.2 Diving Live Board 1 0.2 Liaison Office for Students 1 0.2 Total 545 100.0
Source: TALA (2008)
Table 5-3. TALA Licence numbers for 2008 Number of
Licenses Organizations Grand Total
One License 429 429 Two Licenses 46 92 Three Licenses 8 24 Total 483 545
Source: TALA (2008)

73
As indicated in Table 5-2, there were 545 tourism licences issued to 483 organisations (refer to Table 5-3). This means that some of the organisations had two tourism licences (46 organisations), while others had three licences (eight organisations). Again, the TALA list included all tourism organisations whether small, medium-sized or large organisations. Therefore, the TALA list could not be used as a sampling framework for SMEs in the tourism sector. However, the TALA list provided additional organisational information such as addresses, telephones, e-mail addresses and websites.
5.4.3 Sample Size Determining the sample size involved estimating the number of respondents that should be interviewed in this study. In practice, determining the sample size is a complex process that involves considering the practical and statistical significances of the study (Hair et al., 2006). The practical significance assesses whether the study results are substantially useful for managerial implications (taking action), while statistical significance refers to whether the study results warrant scientific generalization of the findings. The determination of the sample size is also a function of various quantitative and qualitative factors discussed in the research methodology literature. The qualitative factors include: the importance of the study decision, the nature of the study, the number of variables involved in the model, the nature and type of data analysis, the sample size in similar previous studies, the incidence rate, the completion rate and resources constraints (Malhotra, 2004). The quantitative factors include precision level desires (sampling errors), the desired confidence interval level, standard deviations, and data analysis techniques. In the absence of a sampling framework, the sample size used in this study was determined mainly by: the quantitative research design adopted, the data analysis techniques, and the number of variables included in the conceptual model. The total number of variables (relationships) in the Technology-Organisation-Environmental (TOE) integrated model was 12. According to Hair et al. (2006) the number of respondents required for scientific analysis per variable is estimated to be at least 20. This resulted into 240 respondents. Structural Equation Modelling (SEM) generally requires a large sample compared to other multivariate analysis techniques (for example: Factor Analysis, Correlation Analysis, and Multiple Regression). A large sample produces stable solutions, and the results are readily replicable (Hair et al., 2006). The sample size also depends on the estimation techniques used in SEM, the model complexity, the extent of missing responses, and the level of average errors of variance. When the sample size exceeds 400, the maximum likelihood estimation (MLE) technique tends to be very sensitive to any small variation in the data (Tanaka, 1993). Therefore, the recommended sample size for SEM ranges from 150 to 400 respondents. Consequently, our sample size was expected to be at least 240 respondents to meet the number of variables requirement and at most 400 respondents to meet the SEM requirements.
5.4.4 Sampling Technique Selecting a sampling technique in a research study requires considerable effort to ensure a true representation of the population. The sampling technique must minimize the possibilities of selection bias. The researcher can decide whether to use traditional sampling or probability sampling (Malhotra, 2004). Each approach has distinctive characteristics affecting true representation and minimization of bias. Within the traditional sampling approach, the researcher must also decide whether to have a sample with or without replacement. As the main research design was quantitative, the probability sampling technique would have been used once the sampling frame was established. There are several probability sampling techniques which

74
include: simple random sampling, systematic sampling, stratified sampling, and cluster sampling (Malhotra, 2004). Our study is best suited for the stratified sampling technique because we collected data from more than one region. Again, our study involved several tourism business types. Therefore, the sample should fairly represent the selected tourism regions and the various business types. We applied a combination of stratified sampling based on an estimated quota per region. The exact selection of organisations was made by snowball sampling (Goodman, 1961; Heckathorn, 2002). We used the TALA list and the TCT directory as entry points for contacting SMEs in the tourism sector. Given the fact that we lacked a sampling framework, we created a potential list of organisations based on the TCT directory, TALA list, word-of-mouth, and walking-around strategy. Our contact list included approximately 655 organisations as indicated in Table 5-4. However, more than 40% of the contacted organisations did not meet the SMEs criteria because they had more than 100 employees. Some of the organisations in the contact lists had wrong addresses. Additionally, the experience in Tanzania indicated a high rate of non-responses (see also: Ishengoma, 2005; Kamuzora, 2006a; Molony, 2006). Therefore, we decided to walk around and use the information from the confirmed SMEs to identify other SMEs in the visited region. The most effective way to start contacting SMEs was to walk around the tourist-congested areas. Most of the tourists were found along the airports, shopping centres, tourism office zones, beaches and historical places. Consequently, most of the SMEs were also located in those areas. Each of the identified SMEs owner-managers or contacted persons was asked to mention at least three other SMEs in their networks (also used by: Koenig-Lewis et al., 2010; Molony, 2006). Therefore, once we found one firm, it was easy to be shown the second firm. We continued recording the new entrants in our list and made more contacts. On the other hand, we discovered a group of SMEs that were not registered with TALA, but were actively doing tourism business. The majority of the SMEs claimed that they have not registered with TALA because it was expensive to acquire and renew the annual tourism licence (approximately 2000 USD per licence). Secondly, the SMEs claimed that they were paying too much taxes and fees for each individual tourist they get. Such fees include the following: climbing Mount Kilimanjaro, entering national parks and entering game reserves. Initially, they hesitated to participate in our study fearing that we were government officials looking for TALA unregistered firms. We managed getting their trust through being introduced by someone whom they knew well from their known local networks. This technique not only increased the response rate, but the respondents were also in a confident position to ask for additional information while filling the questionnaire. The introduction letters from Mzumbe University and the Commission for Tourism also added credibility (see appendix II and appendix III). In some cases, we discussed with SMEs owner-managers issues related to tourism in Amsterdam. Such engagement made the owner-managers interested to listen and later on filling in our questionnaire. We also used the snowball sampling method and in some cases, we selected the respondents based on their availability.
5.4.5 Response Rate The data collection exercised started on 01/03/2008 and ended in 13/04/2009. We managed to contact 655 organisations. Only 338 organisations had filled in the questionnaire at the time of ending the data collection exercise. As indicated in Table 5-4, the gross response rate was 51.6%, which takes into account all the 338 organisations which responded. The successful response rate was also contributed by our close follow-up from one organisation to another. Based on the experience from previous studies, we could expect that most of the organisations would not respond to the mailed questionnaire (see, for example: Ishengoma, 2005; Kamuzora, 2006a; Mbamba, 2006)

75
Table 5-4. The Gross and Net Response Rate
Planned
Respondents Gross Actual Frequency
Net Actual Frequency
Gross Actual Per cent
Net Actual Per cent
Arusha 180 92 86 51.1 47.8 Dare es Salaam 180 79 62 43.9 34.4 Zanzibar 175 107 94 61.1 53.7 Kilimanjaro 120 60 53 50.0 44.2 Total 655 338 295 51.6 45.0
Among the 338 organisations which responded, we found that 36 of the SMEs had not adopted or used ICT at all, three organisations did not meet the SMEs conditions, and four questionnaires were not acceptable for further analysis due to the high level of incompleteness. For that reason, the net response rate was 295 SMEs which is equivalent to 45.0% of the response rate as indicated in Table 5-4 25.4% of the respondents were micro enterprises , 65.1% were small enterprises , and 9.5% were medium-sized enterprise.
5.4.6 Sample Representativeness As we stated earlier, we do not have an overview of the complete population of SMEs in Tanzanian tourism. Therefore, we cannot guarantee fully the representativeness of our sample to all SMEs in Tanzanian tourism. Nevertheless, we compared our sample to the TALA and TCT lists. Based on business types, our sample is dominated by tour operators (43.7%). We also find that the organisations carrying out hospitality activities represented 19.1 % of our sample, followed by travel agents (16.9%). Other business type representations were less than 10.0 % (per business type) as indicated in Table 5-5. In some cases, a single firm represented more than one business type. We compared the characteristics of our sample with the list of organisations obtained from TALA and TCT as indicated in Table 5-6. We found a more or less similar structure. Therefore, we can conclude that our sample fairly represented the SMEs in the tourism sector in Tanzanian.
Table 5-5. Sample by Business Type Business Types Total Per cent Tour operator 199 43.7 Travel agents 77 16.9 Air operators 1 0.2 Hunting operators 9 2.0 Car rentals 34 7.5 Tour guides 31 6.8 Hospitality 87 19.1 Destination sports 17 3.7 Total 455 100.0
Table 5-6. Characteristics in Samples Business Types TALA TCT Sample Tour operator 42.9 58.2 43.7 Travel agents 9.2 11.3 16.9 Air operators 0.6 4.5 0.2 Hunting operators 4.4 - 2.0 Car rentals 6.1 - 7.5 Tour guides - - 6.8 Hospitality 22.4 12.5 19.1 Destination sports 2.3 - 3.7 Total 87.9 86.5 100.0
5.5 Data Analysis Based on the main objective of our study, our unit of analysis is the small or medium-sized firm within the tourism sector in Tanzania. However, we also gathered individual information about the respondents who filled in our questionnaire as attached in Appendix I. The hypotheses are tested using the firm as the unit of analysis. The main data analysis was carried out using quantitative software. SPSS was used for the descriptive statistics analysis, univariate analysis, and multivariate analysis. AMOS software was used for SEM (see Chapter 7).

76
5.5.1 Preliminary Steps The main objective of the data analysis was to make sense out of the collected information guided by the underlying theoretical framework. Before conducting the data analysis, we undertook the preliminary analytical steps involving data editing. As we were involved in administering and collecting all the questionnaires from the organisations, we also checked for questionnaire completeness. In some cases, we asked for additional information. However, questionnaires from four organisations were not acceptable for further analysis due to missing information in a large part of the questionnaires. We also tested for normality and outliers, and found that three responding firms employed more than 100 people. The data analysis stage also involves determining the acceptable questionnaires (completeness and accuracy) for further data analysis (Churchill, 1995; Malhotra, 2004). The main aim of this stage is to clean up the data collected and categorise them so that they can be easily used in the advanced data analysis techniques. It is also important to take into account missing responses and to establish the corrective measures. Furthermore, it is also important to establish the codebook which details the coding instructions and the necessary variables in the data set delivered from the conceptual framework (Malhotra, 2004). The completed questionnaires were coded and transcribed in the computer using SPSS. We again run a series of descriptive statistics to examine the accuracy of transcribed data for any omission or typographic error.
5.5.2 Factor Analysis Furthermore, we used (confirmatory) factor analysis to test the validity of the items used in this study. Most of the items used in the questionnaire were adopted from previous studies as discussed above. Some of the items were modified to fit our study context. Therefore, it was imperative to check if the underlying dimensions (factors) grouped together (Malhotra, 2004). Therefore, factor analysis was used to examine the underlying structure among the items (Hair et al., 2006). The factor analysis is done in Chapter 7.
5.5.3 Techniques for Examining Data The profiles of the respondents and organisations were analysed using descriptive statistics. The descriptive statistics include techniques such as: sample dispersion measurements, sample distribution measures, central tendency measures, and tabulations techniques. The graphical representation of the examined data (for example, histogram, box plot, and scatter plot) was used to scrutinize the data patterns and their preliminary relationships. These techniques helped to identify the existence of any outliers in the data. Based on the extent and pattern of the outliers, we took corrective actions. For example, within the 338 organisations responded we found that 36 of the SMEs had not adopted and used ICT at all. Finally, a group of techniques were used to ascertain whether the data collected meet the minimum assumptions for running a particular advanced multivariate data analysis technique. The assumptions based on the advanced techniques include the normality of distribution, homoscedascity, and linearity (Hair et al., 2006). The details of these measures are presented in Chapter 7.
5.5.4 Missing Data Analysis The missing data analysis is used in case one or more variables are missing in the response. The primary objective of this analysis is to identify the patterns and relationships fundamental to the missing data. The extent of the missing data may be ignorable if it is under 15% (Hair et al, 2006). If the extent of missing data level is higher than 15%, then it is important to establish the pattern of missing data whether it is missing at random (MAR) or it is missing completely at random (MCAR). The literature

77
provides corrective measures in both cases (Hair et al., 2006; Malhotra, 2004). In Tanzania, it is evident that society (especially the private sector) does not take research studies very seriously and a low response rate is a common occurrence (Kamuzora, 2006a). Therefore, the researcher administered the questionnaire himself as a strategy to reduce non-response and missing data occurrence. Only four (4) questionnaires out of 338 questionnaires were incomplete, which is 1.2% and hence ignorable.
5.5.5 Multivariate Data Analysis Techniques We have used several multivariate data analysis techniques in our study. The techniques used included the descriptive statistics analysis, correlations analysis, exploratory factor analysis, confirmatory factor analysis, and multiple regression analysis. We measured the dependent variable in two dimensions as a strategy to overcome the weakness of the binary or dichotomy measures used in previous studies in SMEs. In the first dimension, EWA was measured along the IT sophistication adoption levels. In the second dimension, EWU was measured on the extent e-mail and web technologies are used frequently in business activities. Van der Veen (2004) also provides other dimensions under which ICT adoption is operationalised and measured as it was discussed in Chapter 3. We also applied SEM to capture the existing interdependent relationships among the independent variables (Hair et al., 2006). SEM is more powerful than multiple regressions because it considers the modelling of interactions and non-linearity of the multiple latent independent variables (Byrne, 2001; Hair et al., 2006).
5.6 Reliability, Validity and Generalizability Some of the previous studies are challenged or are being questioned due to the lack of valid and reliable measurement procedures (Carmines and Zeller, 1979). Reliability and validity assurance of a study involves an examination of its consistence. In most cases, to evaluate the quality of the research design one needs to also examine the scale reliability and validity indicators especially when the concept to be measured has many indicators addressing the same phenomena (Carmines and Zeller, 1979; Malhotra, 2007). In our study, we have several research variables addressed by several items. For example, relative advantage is measured by nine items, top management support is measured by six items (refer to Appendix I). How sure are we that all items measure relative advantage respectively top management support? Therefore, we provide the details on how the scale evaluation (reliability and validity tests) was carried out in our study as presented in Chapter 7.
5.6.1 Reliability The term reliability in our study refers to the extent to which the test or the measurement produces the same results on the repeated measurements. It is argued in research that the measurement of any phenomenon always contains a certain degree of chance error (Carmines and Zeller, 1979). Therefore, researchers strive to attain a higher degree of consistence on the repeated measures. Other authors, for example (Hair et al., 2006) define reliability as the degree to which the observed variable measures the true value and is “error free”. Malhotra ( 2007) defines reliability as the extent to which the scale produces consistent results if repeated measurements are made. It is expected that the measurement should be consistent throughout the study. It is also difficult in the literature to find a single measure or test for reliability. Therefore, we were obliged to use multiple measures to estimate the reliability of our study. Carmines and Zeller (1979) propose four methods of assessing the reliability. The methods include the Test and Retest Method, Alternative Form, Split Half, and Cronbach’s Alpha measurements.
The first three methods are the simplest to administer. For example, the Test and Retest Method is the simplest test method that involves re-administering the same identical sets of items used at two different times under nearly equivalent conditions as possible (Carmines and Zeller, 1979). However, Malhotra (2007) challenges the method because the first test may influence the second test or the time

78
duration between the first and the second may be too long. Other limitations attached to these methods include the costs involved to create an alternative form for measurement or splitting half the sample into halves cannot guarantee two identical samples (Carmines and Zeller, 1979). Therefore, Hair et al. (2006) suggest the estimation of Cronbach’s Alpha or Coefficient Alpha (α). The measure of internal consistence using Cronbach’s Alpha is not totally enough as a higher value of α may be the result of too many items. Therefore, additional measures such as correlation analysis and factor analysis are important for accurate determination of reliability. The rule of thumb suggests that the item to total correlation should exceed 0.50, and the inter-items correlations should exceed 0.03. As for the recommended limits for the Cronbach’s Alpha measure, it is argued that the Cronbach’s Alpha is very good when it is above 0.80, acceptable when it is above 0.70, moderate when it is above 60, and unacceptable when it is below 0.60 (Hair et al., 2006; Malhotra, 2007). An important behaviour of Cronbach’s Alpha is that it tends to increase by increasing the number of items. Therefore, it is unethical to increase the reliability value by artificially inflating the number of items (Malhotra, 2007) In our study, we carried out factor analysis for all the major characteristics studied: the innovation characteristics, the organisational characteristics and the environmental characteristics. The factor analysis also involved the computation of the correlations among of the items, correlation between the parallel measurements, Cronbach’s Alpha, scale analysis, and summated scale, as detailed in Chapter 7. Additionally, to ensure reliability the questionnaire items used to test our integrated model concepts were extracted from tested previous studies. We have also provided theories supporting the measurement scales used in this study.
5.6.2 Validity In addition to meeting the consistence requirements of the scale, the scale must also do exactly what it is intended to do. Hair et al. (2006) defines validity as the extent to which a measure or set of measures correctly represents the concept of the study, while Malhotra (2007) defines the validity of a scale as the extent to which it reflects the true situation. In general, validity reflects the relationship between the concept and the indicators used to measure the concept. In this study, it is also important to examine whether all the questionnaire items were really addressing the model constructs discussed in Chapter 3. In assessing scale validity, Carmines and Zeller (1979) suggests three types of validity as discussed in relation to our study:
Criterion Validity – The operational indicator of the degree of correspondence between the test and the criterion is usually estimated by the size of their correlation (validity coefficient; Carmines and Zeller, 1979). However, for the test for validity to be useful, the correlations have to be significant. Malhotra (2007) also indicates that there should be some theoretical base for selecting the criterion used in the study, or the measurement scale being extracted from other measurement scales.
Content Validity – This concept depends on the extent to which an empirical measurement reflects a specific domain of the contents (Carmines and Zeller, 1979). Content validity refers to the number of items, enough to successfully explain and measure a concept or phenomena. Content validity is sometimes referred to as face validity and its weakness is on the fact that it is a subjective systematic evaluation of how well the content of a scale represents the measurement scale (Malhotra, 2007). In this study, we also conducted expert interviews that gathered the opinions of experts in the ICT adoption and usage field and in the context of

79
developing countries. We also carried out a pilot study which ensured that the questionnaire contents are well spelled out.
Construct Validity – This concept is concerned with the extent to which a particular measure relates to the theoretically derived hypotheses concerning the concepts that are measured (Carmines and Zeller, 1979). Malhotra (2007) argues that when assessing construct validity, the researcher attempts to answer theoretical questions about why the scale works and what deductions can be made concerning the underlying theory. Usually, this process involves several stages starting with providing the theoretical foundation of the concepts, then examining the relationship between the constructs, and finally making sensible interpretations of the computed results (Carmines and Zeller, 1979). Therefore, construct validity is the most sophisticated and difficult to establish in most studies as it includes other validities such as convergent, discriminant and nomological validity (Malhotra, 2007). We have documented all the steps that we went through to test our hypothesis in this study. In most cases, our arguments were supported with relevant references.
Validity assurance is always ensured by having a theoretical claim behind the concept and the indicator. Carmines and Zeller (1979) argue that those indicators are always having a random error embedded within them. However, researchers should strive to minimise the error and it should not be a systematic error. The source of errors in a research process includes the data coding process and having ambiguous instructions during data collection stages. Therefore, we have rechecked all the above stated stages. In order to ensure the validity, we used professional questionnaire translators and we administered most of the questionnaire ourselves. Another measure to ensure validity was to extract well-existing theories. We also carried out pilot tests to examine for context issues as the study was carried in Tanzania for the first time.
5.6.3 Generalisation The generalisation of the study refers to what extent the study findings and conclusions can be generalised to the universe (Malhotra, 2007). Generalisations depend among other things on the theoretical support of the problem setting, the quality of questionnaire items and sample representations. Even though the sample was not randomly selected from a known sampling framework, we applied a multiple sampling strategy which included region and business types stratification, quota allocations and snowball sampling technique. The comparisons we made with the existing tourism organisations patterns indicated a certain level of similarities.
5.7 Ethical Issues In any research conducted, there are ethical issues that need to be taken into consideration from designing the questionnaire, administering the questionnaire and publishing the report. Kvale (1996) and Malhotra (2007) discuss some ethical issues that may arise at the different stages of the research processes depending on the research design selected. As for the quantitative research design, it is important to ensure ethical requirements which include the informed consent, confidentiality and stating the consequences of the study. In this study, we had an introduction letter from Mzumbe University as indicated in Appendix II that detailed the aim of our study. In Zanzibar, we requested for an additional introduction letter as indicated in Appendix III. The aims of our study were well documented, and the confidentiality of the respondent’s information was assured in those introduction letters. Furthermore, it is important to note that the researcher has ethical responsibility to follow scientific procedures to come up with study conclusions and implications. We clearly defined our research

80
problem. The problem was supported by the theoretical literature review and was supervised by two professors. Finally, during report writing we did not: compromise the research design, deliberately misusing statistics, falsifying figures, altering research results to fit hidden agendas, nor misinterpreting the research results (see also: Malhotra, 2007)

81
6. Empirical Results I - Descriptive Statistics
In this chapter, we present the descriptive statistics regarding the respondents and their firms. We also present the sample details related to ICT adoption and usage among SMEs in the tourism sector in Tanzania.
6.1 Respondents, Firms and ICT Characteristics As we stated previously, this study aimed at determining the current ICT status of SMEs in the Tanzanian tourism sector. Therefore, we examined the respondents, firms and ICT characteristics as presented in the next sections. It is beyond the scope of our study to test the effects of individual characteristics on the EWA and EWU. However, some of the previous studies have indicated that demographic characteristics have an influence on ICT adoption and its usage intensity (see, for example: Morris and Venkatesh, 2000; Pijpers et al., 2001; Yang and Lester, 2005)
6.1.1 Respondents As we stated in Chapter 5, our target respondents were individuals who were in the capacity to make decisions pertaining to ICT adoption and usage within their firms. It is argued in the literature that SMEs are highly influenced by the characteristics of the owner-managers (Lee and Runge, 2001). Thong and Yap (1995) have also examined the influence of the CEO characteristics on ICT adoption and usage among SMEs. Under the profile of the respondent we examine age, gender, educational level, ICT competences, firm ownership, and job position.
6.1.1.1 Age Age is in general positively related to ICT adoption and usage (see, for example: Morris and Venkatesh, 2000; Pijpers et al., 2001). In this study, we find that the majority (64.1%) of the respondents were aged between 21 and 40 years. We also find that individuals aged below 20 years were 2.7% of the sample. Therefore, 66.8% of the respondents are below 40 years. Furthermore, we find that respondents aged between 41 and 60 represented 29.5%. Only a few respondents (3.7%) were above 60 years.
Table 6-1. Age Categories Count Per cent Below 20 years 8 02.7 21 – 40 years 189 64.1 41 – 60 years 87 29.5 61 – 80 years 11 03.7 Total 295 100.0
6.1.1.2 Gender The literature review conducted found that gender is one of the most studied personal characteristics in ICT studies. For example, Van Slyke et al. (2002) found gender to be a significant predictor of an individual intention to make purchases over the web. Some of the ICT studies have examined mediation and moderation effects of gender on ICT adoption and usage rather than the direct relationship of gender with adoption and usage. Gefen and Straub (1997) found that men and women differ in their perception but not in the use of e-mail. Generally, males are more likely to adopt ICT than females. Our sample descriptive statistics in Table 6-2 indicate that male respondents represented 77.3% of the

82
sample. Females accounted for only 22.7%. The results point out that there is a dominance of male respondents in the tourism sector in Tanzania.
Table 6-2. Gender Categories Count Per cent Male 228 77.3 Female 67 22.7 Total 295 100.0
6.1.1.3 Educational Level Educational level is perhaps the most commonly agreed personal characteristic that is positively predicting ICT adoption and usage (see, for example: Pijpers et al., 2001; Zhu and He, 2000). Our study found that the majority of the educational levels is up to a Bachelor’s degree or an Advanced Diploma, which represents 92.6% of the sample (refer to Table 6-3). A large proportion of the respondents had a Certificate or a Diploma educational level (39.0%), Secondary / High school educational level (24.1%) or Bachelor’s degree / Advanced diploma (29.5%). The Tanzanian educational system is based on a system of 7-4-2-3 years. Primary school education lasts for seven years. Secondary school education lasts for four years. A student can either opt to pursue an Advanced Level (A-level) of education which lasts for two years or join a Certificate level course lasting for less than one year. A student can further join a Diploma course which lasts for less than two years. After completing the Advanced Level (A-level) of education or the Diploma course, a student can then join a university for a Bachelor’s degree or join an Institute (for example, the Institute of Finance Management (IFM) – Dar es Salaam) for an Advanced Diploma course which lasts for three years. Both the Bachelor’s degree and the Advanced Diploma certification give a student entry into a Master’s degree course.
Table 6-3. Educational Level Categories Count Per cent Secondary/High school 71 24.1 Certificate/Diploma 115 39.0 Bachelor ‘s degree /Advanced Diploma 87 29.5 Master’s degree 20 06.8 Others 2 00.7 Total 295 100.0
6.1.1.4 ICT Competences In our study, we found that the majority of the respondents (41.4%) acquired ICT competences through learning by experience (or learning by doing) (refer to Table 6-4). A significant portion of our sample (36.6%) represented respondents who have attained ICT competences by attending short courses. Only few respondents had a professional certificate in computer technology. We found that only 12.5% of the respondents had attained a certificate in computer technology. Individuals with a diploma in computer technology represented 5.4%, and respondents with a degree in a computer course represented only 4.1% of the sample. This sample composition was not surprising as most of the academic institutions are only recently establishing courses in ICT (URT, 2003a). The majority of individuals who graduated before the year 2000 had limited chances of studying ICT courses. Therefore, learning by experience or attending short courses remains the major means of acquiring ICT competences in Tanzania.

83
Table 6-4. ICT Competences Categories Count Per cent Learned by experience 122 41.4 Attended a short course 108 36.6 Certificate in computer technology 37 12.5 Diploma in computer technology 16 5.4 Degree in computer technology 12 4.1 Total 295 100.0
6.1.1.5 Firm Ownership We were also interested in knowing whether the respondents were responsible for the decisions made in the SMEs (see also: Lee and Runge 2001; Levy and Powell, 2003). The firm owners represented 50.5% of the sample, as indicated in Table 6-5. Based on the experience from the pilot study we conducted, a significant number of owners refrained from answering the questionnaire. The owners trusted somebody else employed in the organisation who was more familiar with ICT adoption and usage issues. Therefore, the respondents who were not owners represented 49.5 % of the sample. We did not exclude the non-owners in our sample, because our interest was to interview individuals who were responsible for ICT adoption and usage decisions within the SMEs.
Table 6-5. Firms Ownership Categories Count Per cent No 146 49.5 Yes 149 50.5 Total 295 100.0
6.1.1.6 Job Titles We also found that almost half of the respondents were working as managing directors as indicated in Table 6-6. Managing directors represented 49.5% of the respondents interviewed. Sales or marketing managers represented 15.3% of the respondents. Finance or accounts managers represented 4.4% of the respondents. Surprisingly, we find that computer or ICT managers represented only 1.0 %. ‘Normal’ managers represented 12.5% of the respondents. Tour managers represented 6.8% of the respondents. Tour consultants represented 5.1%. Other titles such as administrative assistants, sales supervisors, etc., constituted 5.4% of the sample. It should be noted that during the data collection, we insisted on talking to the SMEs owners. However, in some cases we were referred to other SMEs officials who were more occupied with ICT adoption and usage matters. Therefore, we believed that the SMEs owners trusted their subordinates on issues related to ICT adoption and usage.
Table 6-6. Job Titles Categories Count Per cent Managing director 146 49.5 Sales/Marketing manager 45 15.3 Finance/Accounts manager 13 4.4 Computer/ICT manager 3 1.0 Tour manager 20 6.8 Tour consultant 15 5.1 Manager 37 12.5 Others 16 5.4 Total 295 100.0

84
6.1.2 Firm Characteristics ICT adoption and usage among SMEs can also be analysed from the perspective of the firm. For example, Goode and Stevens (2000) examined the influence of business age, business industry, ICT support, ICT budget, and ICT experience on the adoption of the World Wide Web (also studied by Alsalloum, 2006). In this study, we examined the SMEs by focusing on the legal status (ownership), the age of the firm, the number of employees, the location of the firm, the annual revenues estimate, the annual capital investment estimate, and the business networks.
6.1.2.1 Legal Status In terms of the legal status of the SMEs, we found out that incorporated companies represented 34.6% of the sample (refer Table 6-7). The incorporated companies include the private companies established under the Tanzania Company’s act of 2002 (URT, 2002a). There were hardly any significant variations in the rest of the ownership types. For example, the sole proprietorship represented 18.0% of the sample. The partnership owned business represented 25.1%. The family business accounted for 21.7% of the sample representation.
Table 6-7. Legal Status Categories Count Per cent Sole proprietorship 53 18.0 Partnership 74 25.1 Incorporated company Ltd 102 34.6 Family business 64 21.7 Others 2 0.7
Total 295 100.0
6.1.2.2 Firm Age Our study also found that most of the SMEs (66.8%) were established less than 10 years ago as indicated in Table 6-8. More than one third of the SMEs (39.7%) have been in business for less than five years, while those firms with more than five years, but less than ten years of business experience represented 27.1% of our sample. Organisations with a business experience of between 11 and 15 years, and between 16 and 20 years represented 18.3% and 6.8% of the sample respectively. Only twenty four organisations (8.1%) had more than 20 years of experience in business. Additionally, Goode and Stevens (2000) argue that the age of the organisation is positively related to ICT adoption and usage.
Table 6-8. Firm Age Categories Count Per cent Less than 5 years 117 39.7 6 – 10 years 80 27.1 11 – 15 years 54 18.3 16 – 20 years 20 6.8 More than 20 years 24 8.1 Total 295 100.0
6.1.2.3 Number of Employees The number of employees is a key criterion for categorising SMEs in Tanzania, as it has been discussed previously in Chapter 2. Based on the number of employees criteria specified in Table 6-9, our sample is dominated by small enterprises (65.1%). We also find a significant number of micro enterprises (75 cases) representing 25.4% of the interviewed firms. The medium-sized enterprises constituted only 9.5

85
% of all the organizations that responded to our questionnaire. As we stated in Chapter 5, we include only organisations that met the SMEs criteria as defined in the national SMEs policy (URT, 2003b).
Table 6-9. Number of Employees SMEs Nomenclature Count Per cent Micro enterprises 75 25.4 Small enterprises 192 65.1 Medium-size enterprises 28 09.5 Total 295 100.0
6.1.2.4 Firm Location Nijkamp and Van Ommeren (2004) argue that the location of SMEs nowadays depends largely on the presence or availability of the various networks surrounding the SMEs. Such networks may be physical in nature (for example, transport infrastructure, telecommunications infrastructure, etc.) or business networks (for example, industrial networks, clubs, or discussion forums). Some authors argue that organisations located in urban areas are in a better position to adopt ICT than rural located organisations, because such organisations have better access to the required adoption resources and hence lower costs of ICT adoption and usage (Forman et al., 2005). As it was discussed in Chapter 5, we gathered our data from four key regions in Tanzania. The four regions represent the most important tourist attraction circuits in Tanzania. According to Table 6-10 we found out that the majority of the firms are in Zanzibar (31.9%). We also find that 29.2% of the firms are in Arusha. The SMEs from Dar es Salaam constituted 21.0% of our sample. Kilimanjaro was the last region representing only 18.0% of the sample.
Table 6-10. Firm Location Categories Count Per cent Arusha 86 29.2 Dare es Salaam 62 21.0 Zanzibar 94 31.9 Kilimanjaro 53 18.0 Total 295 100.0
6.1.2.5 Annual revenues estimate The respondents were also asked to estimate their annual revenues for the year 2007. The results indicated in Table 6-11 shows that the largest part of the SMEs (30.2%) estimated their revenue to be below 20 million Tanzania Shillings. The results indicate also that 18.6% of the SMEs estimated their incomes to be between 21 – 40 million Tanzania Shillings. Surprisingly, we find 12.5% of the SMEs indicate their revenue to be above 80 million Tanzania Shillings. The rest of the SMEs that were willing to provide revenues figures estimated their revenues to be between 40 to 80 million. During the pilot study, we found out that some of the SMEs were uncomfortable to provide revenues figures due to the fear that the tax and revenue authority would use the information for taxation purposes. During the main data collection exercise, we found out that 15.9% of the respondents did not want to answer, while 13.2% of the respondents did not know the revenues figures.

86
Table 6-11. Annual Revenues Estimate Measure Categories Count Per cent
Annual Revenues 2007
Bellow 20 million Tshs 89 30.2 21 - 40 Million Tshs 55 18.6 41 – 60 Million Tshs 14 4.7 61 – 80 Million Tshs 14 4.7 Above 80 million Tshs 37 12.5
Valid Sub Total 209 70.8
Missing I don't know 39 13.2 I don't want to answer 47 15.9 Sub Total 86 29.2
Grand Total 295 100.0
6.1.2.6 Annual Capital Investment Estimate According to the definition of SMEs in Tanzania, capital investment can be used as a criterion for categorising SMEs (URT, 2003b). The issue of declaring capital investment in 2007 was also treated as confidential information to some of the respondents. 38 organisations declined to suggest the amount of capital investment (refer Table 6-12). The majority of the organisations, which responded (42.7%), had a capital investment ranging from 5 to 200 million Tanzanian Shillings. We also find that 15.6 % of the organisations had a capital investment of less than 5 million Tanzanian Shillings, while 14.6% of the organisations had a capital investment ranging from 200 million to 800 million Tanzanian Shillings. It is surprising to find that 4.7% of the SMEs had annual capital investment estimates of above 800 million Tanzania Shillings. Capital availability is in most cases associated with a high degree of ICT adoption and usage because the firm can fund the ICT equipments, pay for internet connectivity charges, and hire ICT qualified personnel (see, for example: Damanpour, 1992; Ettlie et al., 1984; Rogers, 2003).
Table 6-12. The Annual Capital Investment Estimates Measure Categories Count Per cent
Annual Capital 2007
Up to 5 Million Tshs 46 15.6 5 to 200 million Tshs 126 42.7 200 to 800 million Tshs 43 14.6 Above 800 million 14 4.7
Valid Sub Total 229 77.8
Missing I don't know 28 9.5 I don't want to answer 38 12.9 Sub Total 66 22.4
Grand Total 295 100.0
6.1.2.7 Business Networks Katz and Shapiro (1986) emphasize that innovation is a function of network size. In our study, we found that the majority of the organizations (71.5%) collaborate with large tourist firms. On the other hand, 71.5% of the organisations had business relationships with other local trading partners (refer to Table 6-13 and Table 6-14). Collaboration with large tourism organisations in Tanzania also provides another venue for reaching out to the tourists.

87
Table 6-13. Collaboration with Large Firms Measure Categories Count Per cent
Large Firms Collaborations
No 84 28.5 Yes 211 71.5 Total 295 100.0
Table 6-14. Collaboration with Trading Partners Measure Categories Count Per cent
Trading partners Collaborations
No 84 28.5 Yes 211 71.5 Total 295 100.0
6.1.3 ICT Characteristics We also examined the characteristics related to ICT adoption and usage. In this regard, we examined the ICT adoption level of the firm, the organisational ICT experience, the ICT budget of the firm, internet access, ICT decision-makers, percentage of employees who use ICT services, and the ICT technical services support.
6.1.3.1 ICT Adoption Level The ICT adoption level is perhaps the most important question in our study because it identifies the extent of e-mail and web technologies adoption. The SMEs in the tourism sector have varied levels of ICT adoption. As indicated in Table 6-15, the majority of the SMEs (43.7%) use e-mail and have an own website for purposes of selling and receiving online bookings, while payments are made offline. We also found that 17.6 % of the organisations have adopted e-mail and an own website just for displaying company information and products offered. We also found that 15.9% of the organisations have adopted e-mail and have an own website where customers can submit various enquiries. The findings also indicate that 11.9% of the organisations have adopted e-mail only. On the other hand, only 6.1% of the SMEs had the ability to make online payments. Finally, we found that 4.7% of the respondents used the internet for purposes of searching for information only.
Table 6-15. ICT Adoption Level Categories Count Per cent E-mail only 35 11.9 E-mail and firm’s website for displaying company information and products offered 52 17.6
E-mail and using internet to get information about other stakeholders 14 4.7
E-mail and firm’s website where customers can submit various enquires through our website 47 15.9
E-mail and firm’s website for selling and receiving online booking, but payment is made offline 129 43.7
E-mail and firm’s website for selling and receiving online booking, and making online payment 18 6.1
Total 295 100.0
We recoded the six ICT adoption stages into four common stages in ICT adoption (see, for example: Doherty et al., 2003; Martin and Matlay, 2001). As indicated in Table 6-16, the majority of the SMEs (59.7%) had adopted the third level (interactive websites) in which one can receive online enquiries. We also found that 22.4% of the firms that had responded had adopted the second level (static website) which only allows them to have an online presence. Therefore, the majority (93.9%) of the SMEs do not have fully integrated online services which could allow them to receive online bookings and payments. Kamuzora (2006a) and Chachage (2001) argue also on the lower ICT adoption levels in Tanzania.

88
Table 6-16. ICT Adoption Level (Recoded) Categories Count Per cent Email Services Only 35 11.9 Online Presence 66 22.4 Online Booking Enquiries 176 59.7 Online Bookings and Payments 18 06.1 Total 295 100.0
In the data analysis, the dependent variable EWA (email and web adoption) is expressed in four levels (see table 6-16). The reasoning for this approach is explained in Section 6.1.3.1. In short: in the questionnaire we used 6 levels of EWA (see Table 6-15), because this was the best way for the respondents to indicate their level of adoption. We recorded the six ICT adoption levels into four common stages in ICT adoption (with common we mean as more general was used in the literature, see also Table 2-1). The five levels of ICT adoption in Figure 2-1 is a leading example of measurement. With this we came to a common and recognizable approach with four levels of ICT adoption.
6.1.3.2 Organisational ICT Experience It is argued that the majority of the firms with a long experience in ICT tend to be slow in adopting new technologies due to the learning process and system adaptability required. However, Goode and Stevens (2000) argue that the length of the time for which a business has been using ICT has positive effects on its adoption. In our study, we find that the majority of the firms adopted ICT after the year 2000. As indicated in Table 6-17, the majority of SMEs (45.1%) adopted ICT between the years 2001 and 2005. Those SMEs that adopted ICT after 2005 made out 28.8% of our sample. We also find a considerable level of adoption of ICT (23.7%) in the years between 1996 and 2000.
Table 6-17. Organisational ICT Experience Categories Count Per cent Before 1990 2 0.7 1991 - 1995 5 1.7 1996 - 2000 70 23.7 2001 - 2005 133 45.1 Above 2005 85 28.8
Total 295 100.0
Very few organisations (0.7%) had ICT services before 1996. As it was pointed out in Chapter 4, ICT activities in Tanzania were banned from 1974 up to 1993 (Shilla, 1994; URT, 2003a). In Chapter 4 we argued that internet access in Tanzania was still expensive and unreliable up to the early 2000s.
6.1.3.3 ICT Budget Estimate A large budget allocated for ICT activities represents a significant enabler for the adoption of e-mail and web technologies (Goode and Stevens, 2000; Grover and Teng, 1992). We also examined the percentage of the firm’s total budget that was spent on email and web technologies for the year 2007 (refer to Table 6-18). The findings indicate that the largest part of the organisations (23.7%) estimate to spend less than 2% of their total budget on e-mail and web technologies. On the other hand, those spending above 10% are represented by 10.5% of all respondents. SMEs spending between 2.1% - 4.0% make up 16.6% of our sample. Organisations spending between 4.1% and 6.0 represent 10.5% of our sample. SMEs spending between 6.1 and 8.0% constitute 8.5% of the sample. Finally, organisations spending between 8.1% and 10.0% represent 6.4% of our sample. We also find that a significant percentage

89
(23.7%) of the organisations rejected to provide the information because it is treated as confidential or unknown in their organisations.
Table 6-18. ICT Budget Estimate Measure Categories Count Per cent
ICT Budget Estimates 2007
Less that 2% 70 23.7 2.1 – 4.0% 49 16.6 4.1 – 6.0% 31 10.5 6.1 – 8.0% 25 8.5 8.1 – 10.0% 19 6.4 Above 10% 31 10.5
Valid Sub Total 225 76.3
Missing I don't know 48 16.3 I don't want to answer 22 7.5 Sub Total 70 23.7
Grand Total 295 100.0
6.1.3.4 Internet Services Access Accessing e-mail and web technologies in Tanzania has been so far the most limiting factor for the advancement of internet application in SMEs (Chachage, 2001; Kshetri, 2007). The results in Table 6-19 indicate that the majority of the SMEs (70.2 %) have their own in-house internet connection. Those depending on outsourcing (access to the internet through other firms) represent 27.1% of our sample. Internet cafes also provide services to some of the SMEs in the tourism sector.
Table 6-19. Internet Services Access Categories Count Per cent In-house 207 70.2 Outsourced 80 27.1 Using internet cafes 8 2.7
Total 295 100.0
6.1.3.5 ICT Decision-Makers The study also examined who made the decision to adopt and use e-mail and web technologies within the responded organisations. The findings indicate that within 55.9 % of the organisations, the decision was made by the owner-managers (refer to Table 6-20). We also find that management committees made 17.6% of the ICT adoption and usage decisions. The findings also indicate that within 23.4% of the organisations, the decision to adopt and use e-mail and web technologies was made by managing directors. Computer managers and others represented only 3.1% of the decision made to adopt and use ICT.
Table 6-20. ICT Adoption Decision-Maker Categories Count Per cent Firms owner(s) 165 55.9 Management committee 52 17.6 Managing director 69 23.4 Computer manager 4 1.4 Finance/accounts manager 1 0.3 Others 4 1.4 Total 295 100.0

90
6.1.3.6 Percentage of Employees Using ICT This study also examined the number of employees using e-mail and web technologies in their business activities. The findings indicate that 36.6% of the organisations have more than 50% of their employees using e-mail and web technologies. We also found that 22.0% of the organisations have less than 10 % of their employees using these technologies. The rest of the organisations (41.4%), as indicated in Table 6-21, range between 11% and 50% of their employees using the technologies.
Table 6-21. Percentage of Employees using ICT Categories Count Per cent Less than 10% 65 22.0 11 – 20% 44 14.9 21 - 30% 17 5.8 31 - 40% 25 8.5 41 – 50% 36 12.2 Above 50% 108 36.6 Total 295 100.0
6.1.3.7 ICT Technical Services Support We also examined the persons responsible for supporting the organisation in terms of ICT technical services. The majority of the organisations (48.5 %) have outsourced this to other organisations or individuals. 16.9 % of the organisations claimed that the owner-managers are responsible for providing ICT technical services. The managing director and the computer manager account for 13.6% and 10.5% respectively. Other employees help with ICT technical problems in only 7.5% of the sample.
Table 6-22. ICT Technical Services Support Categories Count Per cent Firms owner(s) 50 16.9 Managing director 40 13.6 Computer manager 31 10.5 Employee 22 7.5 Outsourced 143 48.5 Others 9 3.1 Total 295 100.0
6.1.4 ICT usage level One of the research questions addressed the extent of e-mail and web technologies usage. Therefore, we computed the average of all usage items as indicated in Table 6-23. By ranking the average, we find that e-mail was used most frequently. E-mail is used mainly to communicate with customers, receive orders from customers, update customers on their orders, and communicate with suppliers. We also found that e-mails are used infrequently to communicate with government institutions or employees. Despite the increasing presence of the websites, transactions are hardly ever carried out through the own websites.

91
Table 6-23 E-mail and Web Technology Usage ( Where 1=used very frequently and 5 = Not used at all) Mean Our firm uses e-mail to communicate with our customers 1.24 Our firm uses e-mail to receive orders from our customers 1.57 Our firm uses e-mail to update customers on their orders 1.67 Our firm uses e-mail to communicate with our suppliers 1.98 Our firm uses e-mail to send orders/e-tickets to our customers 2.08 Our firm uses internet websites to find information relevant to our firm businesses 2.11 Our firm uses the firm's website for advertising the firms' products to our customers 2.23 Our firm uses firm's website for presenting the firm's information online 2.26 Our firm uses e-mail to communicate with tourism associations 2.39 Our firm uses internet websites to find information about our competitors 2.50 Our firm uses internet websites to find information about other business stakeholders 2.59 Our employees use e-mail to communicate with their friends 2.64 Our firm uses the firm's website for receiving online orders and bookings from customers but payments are
made offline 2.77
Our firm uses firm's website for presenting other tourism information e.g. Tanzania map, tour guide, exchange rates etc. 2.82
Our firm uses the firm's website for updating customers on the new products and services offered 2.84 Our firm uses e-mail to communicate with employees. 3.04 Our firm uses the firm's website for receiving customers complains about the firm products and services
offered 3.14
Our firm uses the firm's website for exchanging information with customers online e.g. discussion forums 3.28 Our firm uses e-mail to communicate with the government institutions 3.68 Our firm uses the firm's website for receiving online orders and bookings from customers and payments are
made online e.g. using credit cards 4.59


93
7. The Hypotheses Testing
In this chapter, we present the empirical testing of the hypotheses. As we indicated in Chapter 1, the main objective of this study was to investigate the key factors explaining the adoption and usage of ICT among SMEs in the tourism sector in Tanzania. In Chapter 6, we presented the descriptive statistics addressing the questions related to the respondents, the firms and the use of ICT in the tourism sector in Tanzania. In Chapter 7, we present the various data analysis techniques used to test the hypotheses.. We discuss the direct effects of Technology-Organisation-Environmental (TOE) characteristics on EWA and EWU from Section 7.1 to 7.5. On the other hand, we present the indirect effects testing using structural equation modelling (SEM) in Section 7.6. The chapter ends up by providing the overall hypotheses testing summary in Section 7.7.
7.1 Hypotheses Testing and Methodological Choices Made We have adopted a staged analysis methodology to provide answers to the key research objectives stated in Section 1.4. We used multiple regression analysis to address the objective four in this study. In our study conclusions we have adopted multiple regressions of individual hypotheses blocks rather than combined multiple regression indicated in appendix V and appendix VI. We also adopted SEM to address the fifth objective. Additionally, as detailed in Section 3.3, the study hypotheses were grouped into three blocks. The hypotheses blocks include the following:
The innovation characteristics (relative advantage, compatibility, complexity, and social influence) influence on EWA and EWU as discussed in Section 3.3.1;
The organisational characteristics (organisational location, organisational e-resources, and top management support) influence on EWA and EWU presented in Section 3.3.2;
The environmental characteristics (competitive pressure, external support and institutional intervention) influence on EWA and EWU as discussed in Section 3.3.3.
Therefore, in Section 7.2 through 7.5, we present the results of the hypotheses testing using multiple regression analysis as the major data analysis technique. We carried out the data analysis tests by using SPSS version 17.0. The main data analysis method was preceded with other statistical data analysis techniques such as correlation analysis, factor analysis, and scale analysis (Hair et al., 2006). In Section 7.6, we present the report on testing the integrated effects of the TOE characteristics on EWA. The second part of testing the hypotheses adopts the SEM technique using AMOS version 18.0. Generally, the final sample size used for data analysis throughout testing hypotheses is 295 respondents. This is the final sample size after cleaning data for incompleteness and outliers as discussed in Chapter 5. However, we provide the details of the sample size requirements under each data analysis technique used for hypotheses testing. Our sample did not have missing data as discussed in Chapter 5. Before testing the hypotheses, we tested for the presence of outliers, normality, and multicollinearity (Hair et al., 2006).
7.2 Measuring the Dependent Variables The dependent variables in this study were the e-mail and web technologies adoption (EWA) and the e-mail and web technology usage (EWU). Each dependent variable is measured differently in this study. The different levels for measuring EWA are provided in the questionnaire. The EWU measurement required multiple steps of factor analysis to determine the final usage measures as detailed in the next sections.

94
7.2.1 Measuring EWA As we discussed in Chapter 2, 3 and 5, we initially measured ICT adoption levels using six levels. These ICT adoption levels were suggested based on the evidence provided in previous studies conducted in Tanzania (see, for example: Chachage, 2001; Kamuzora, 2006b; Sheriff, 2007). We named the adoption stages based on the online activities carried out in the tourism sector. Due to the low levels of IT application in developing countries, the majority of entrepreneurs would not easily understand the advanced and technical ICT jargon such as interactive website, transactive system or seamless integration used in other ICT studies (see, for example: Damsgaard and Scheepers, 2000; Daniel et al., 2002; Doherty et al., 2003; Molla and Licker, 2004; Zhu and Kraemer, 2005). The respondents were asked to select the most appropriate EWA level for their firms. As stated earlier, we recoded the six ICT adoption stages into four common ICT adoption stages: email services only; online presence; online booking enquiries; online bookings and payments (see also Section 6.1.3.1).
7.2.2 Measuring EWU (Factor Analysis) As it was discussed in Chapter 3 and 5 , EWU items were adopted from previous studies, with minor adjustments to suit our study (see, for example: Alam, 2009; Chong et al., 2009; Khemthong and Roberts, 2006). While “never used” represented one end of the continuum (5), “used more than once a day” represented the other end (1) in our measurement scale (refer to V500 questions in Appendix I). We carried out a factor analysis in order to find out whether EWU inhibited any pattern in ICT-business usage. The factor analysis extraction was carried out using Principal Component Analysis (PCA) method. We also adopted the VARIMAX as the rotation method. The detailed factor analysis requirement and the suitability of its application in this study are detailed in Section 7.3.1.
7.2.2.1 The EWU Communalities and Sampling Adequacy After running a factor analysis, items 504, 505, 506, 514 and 515 were dropped due to poor loading or cross loading problems. The final factor loadings were relatively high (above 0.600). As previously discussed, the communalities loading cut off is an arbitrary point suggested normally above 0.5 (Hair et al., 2006). We also tested for the presence of adequate correlations among the EWU items. The result of Bartlett’s test of sphericity was significant at the p-value = 0.001 (see also Chi-square = 2303.62, DF = 91). We found the measure of sampling adequacy at 0.881 to be appropriate for further multivariate analysis. The sample size (295) was adequate as it was discussed in Chapter 5.
7.2.2.2 The EWU Eigen Value, Rotation Matrix and Scale Analysis We found the total variance explained (73.0%) to represent four EWU factors as indicated Table 7-1. We also found that online trading contributed more than 50% of the model variance (43.4%). The online presence contributed 12.6%, the business communication contributed 8.9%, and the personal communication contributed 8.0% of the model variance. The final rotated factor matrix presented in Table 7-1 indicates how the individual EWU items loaded in each suggested factor. The acceptable loading value ±0.50 was used as a cut-off point in this study as suggested by Hair et al. (2006) throughout this study.

95
Table 7-1 EWU Rotated Matrix and Scale Analysis
Factor Code Factor Cronbach’s
Alpha Items Cases Question Code
Online Trading
Online Presence
Business Comm.
Personal
Comm.
500a Online Trading 0.883 4 295
(517) .840 .239 .151 .111 (519) .833 .191 .153 .032 (518) .822 .269 .165 .068 (516) .728 .245 .118 .137
500b Online Presence 0.904 4 295
(511) .220 .876 .164 .134 (512) .219 .842 .211 .065 (510) .354 .781 .227 .092 (513) .452 .669 .228 -.076
500c Business Communication 0.821 4 295
(508) .164 .162 .859 .040 (507) .254 .128 .836 .020 (502) .102 .171 .718 .169 (503) .056 .247 .629 .301
500d Personal Communication 0.567 2 295 (509) .042 .165 .134 .806
(501) .155 -.041 .153 .801 Total Variance Explained
Initial Eigen Value Total 6.071 1.771 1.254 1.126 Initial Eigen Value % of Variance (73.0%) 43.364 12.649 8.955 8.040
Overall Cronbach’s Alpha 0.887 14 295
The identified EWU factors and their Alpha coefficients include online trading (α = 0.883), online presence (α = 0.904), business communication (α = 0.821) and personal communication (α = 0.567). We had originally expected only one factor for e-mail communication, but the factor analysis carried out resulted into two components. We labelled these factors as business communication and personal communication. Personal communication was dropped for the advance of multivariate analysis techniques because of the unacceptable Cronbach’s Alpha level (α = 0.567). This low value of Cronbach’s Alpha could be attributed to the low number of items (2). This low Cronbach’s Alpha signified reliability and validity problems with the measurement scale (Hair et al., 2006). We computed the final joint scales (summated scales) of the remaining EWU factors by taking the averages of the factor items indicated in Table 7-1.
7.2.2.3 The EWU Summated Scale Correlations We also computed a bivariate correlation of the identified EWU factors to examine the possibility of multicollinearity problems. As indicated in Table 7-2 the majority of the items are correlated. Pearson’s values are less than 0.9, which indicates the absence of a multicollinearity problem among the factors. However, online presence and online trading indicate a relatively higher positive correlation (r = 0.500, p-value <0.01) compared to the rest of correlations. We were not surprised by the close relationship because online trading is an extension of online presence with additional system functionalities to support online transactions (see, for example: Martin and Matlay, 2001).

96
Table 7-2 EWU Summated Scale Correlations Business
Communication Online
Presence Online Trading
Business Communication 1 Online Presence 0.415** 1 Online Trading 0.400** 0.500** 1
**. Correlation is significant at the 0.01 level (2-tailed).
Therefore, testing the EWU related hypotheses involved examining the individual hypotheses at each EWU factor determined by the factor analysis. The EWU factors identified included Y1 = business communication, Y2 = online presence, Y3 = online trading. These identified EWU levels correspond with the ICT adoptions stages previous discussed in the ICT adoption studies (see, for example: Doherty et al., 2003; Hashim et al., 2006; Khemthong and Roberts, 2006). Therefore, in concluding the hypotheses, the related hypothesis is fully accepted if all factors are supported by the data analysis. If two out of three factors are accepted, then we term it as partially accepted. If only one factor is supported by the data analysis, we term it as partially rejected. The term fully rejected is used if all factors are not supported in the data analysis. The EWA hypotheses have simple decisions as rejected or accepted because the EWA is measured by only one item.
7.3 Innovation Characteristics, EWA and EWU In Section 3.3.1, we discussed the conceptual framework that focused on the innovation characteristics examined in this study. In Figure 7-1, we revisit the first block of hypotheses as discussed in Chapter 3. The revised figure is based on the actual factor analysis carried out in this study. The factor analysis aimed to find out whether the theoretically suggested innovation characteristics factors conform to our study results. The hypotheses for testing EWA include relative advantage (H1a), compatibility (H2a), complexity (H3a), and social Influence (H4a) (see, for example: Jeyaraj et al., 2006; Thong, 1999). In this Section, we focus our discussion on how the first block of hypotheses related to innovation characteristics was tested.
We considered a multiple regression analysis because our study aimed at examining the integrated effects of the independent variables detailed in our conceptual model in Chapter 3 (see also: Figure 3-1). Therefore, the multiple regression analysis enabled us to examine the simultaneous effects of the innovation characteristics on EWA and EWU (Hair et al., 2006). Multiple regression analysis is a suitable method of data analysis, especially when there are several independent variables having effects on a dependent variable, while at the same time those independent variables are correlated (Malhotra, 2007). Malhotra (2007) also suggests that regression analysis can be used to test the existence of relationships among the variables, the strength of relationships, and determine the structure of the relationship among the independent variables and the dependent variable. Therefore, the method is well suited to address objective four of our study. We started the data analysis by carrying out a factor analysis in order to determine the association patterns of the innovation characteristics indicated in the questionnaire (refer to Appendix I). Several researchers examining the effects of various factors on the ICT adoption levels, have also used the multiple regression analysis (see, for example: Al-Qirim, 2005; Brand and Huizingh, 2008; Chong et al., 2009; Zhu and Kraemer, 2005). We assumed linear relations between the dependent and independent variables. Therefore, we used linear regression models and estimated the regression coefficients by using the statistical software package SPSS. The measurement scales of the dependent and independent variables are stated in chapter 5 and 6. Depending on the measurement type of the dependent and independent variables

97
SPSS chooses the correct standard estimation method by default. The estimation results and the interpretation of the estimation results are presented in chapter 7.
Figure 7-1 Innovation Characteristics and EWA Revisited
7.3.1 The Innovation Characteristics - Factor Analysis We carried out a factor analysis in order to find out whether the innovation characteristics inhibit the same attributes suggested in the literature (Rogers, 2003). We treated the 5-point Likert’s items as scales in the data analysis. The extraction was carried out using a Principal Component Analysis (PCA) as it was previously stated. We used the VARIMAX as the rotation method. The VARIMAX method seems to give a clear separation of the factors (Hair et al., 2006). Factor analysis requires a reasonable sample size in order to be conducted. Usually, a factor analysis is not run if a sample has less than 50 observations. Hair et al. (2006) suggest that a preferable sample size to be 100 or above observations. The general rule is that the sample should have a minimum of at least five times as many observations as the number of factors to be analysed. However, the most acceptable sample size in a factor analysis would have a ratio of ten to one (10:1). In this study, the ratio was 29.5:1 (295 respondents / 10 factors), which falls within the acceptable limits. Consequently, we believe that 295 observations provided enough bases for calculation of the correlations between variables.
7.3.1.1 The Innovation Characteristics Communalities and Sampling Adequacy Tests As defined by Hair et al, (2006) communalities refer to the amount of variances on the original variable shared by other variables in the analysis. Hair et al. (2006) suggest the cut-off point (acceptable lower limit) to be 0.50, which is also adopted for factor analysis in this study. As for the innovation characteristics, the communalities loading were relatively higher (above the cut-off point of 0.4). However, the initial factor analysis solution suggested five factors. We experienced cross loading problems as well as lower communality loading in the factor analysis. Subsequently, we removed item 601a (communication enhancement), 601c (service quality improvement), and 603b (easy to use e-mail and web technologies). We also examined the presence of adequate correlations (correlation matrix) among the variables examined. The Bartlett’s test of sphericity measurement (Chi-Square = 3330.67, DF = 190) was significant at 0.001. Hair et al. (2006) suggest that a statistically significant Bartlett’s test of sphericity (p-value < 0.05) indicates that there are sufficient correlations to continue with the factor analysis process. We also examined the measure of sampling adequacy (MSA). The MSA quantifies the degree of inter-correlations among the studied variables, which is an important determiner of running other advanced statistical tools. Hair et al., (2006) provide guidelines for interpreting the results for KMO-MSA
H4a
H3a
H2a
H1a
Perceived Social Influence
EWA Levels
Compatibility
Relative Advantages
Complexity
H4a
H3a
H2a
H1a
Social Influence
EWA Compatibility
Relative Advantage
Complexity

98
whereby: 0.80 is commendable, 0.70 or above is middling, 0.60 or above is mediocre, 0.50 or above is miserable, and below 0.50 is unacceptable. Therefore, we found that the measure for sampling adequacy (0.883) was recommendable for further factor analysis in our study.
7.3.1.2 The Innovation Characteristics Rotation Matrix, Eigen Value and Scale Analysis We opted for Eigen values method as a means of confirming factor models. The literature suggests that factors with Eigen values greater than one (E>1) should be considered for the extraction of factors (Hair et al., 2006). Our final factor analysis results confirmed four innovation characteristics as indicated in Table 7-3. The rotated factor matrix presented in Table 7-3 indicates how each item loaded in each suggested factor.
Table 7-3 Innovation Characteristics Rotation Matrix, Eigen Value and Scale Analysis Factor Code Factor Cronbach's
Alpha Items Cases Questi
on Code
Relative Advantage Complexity Compatibility
Social Influenc
e
V601 Relative Advantage 0.888 8 295
V601e .744 .108 .270 .056 V601i .732 .163 .184 .162 V601d .716 .104 .061 .204 V601b .696 .142 .150 .084 V601h .694 .165 .156 .139 V601g .681 .176 .250 .139 V601f .676 .031 .268 .011 V601c .660 .192 .122 .179
V603 Complexity 0.882 4 295
V603a -.124 .893 -.160 -.066 V603c -.173 .892 -.111 -.084 V603e -.145 .881 -.163 -.101 V603d -.439 .576 -.148 -.060
V602 Compatibility 0.826 5 295
V602c .074 -.129 .820 -.050 V602b .224 -.067 .789 .125 V602d .322 -.171 .763 .030 V602e .368 -.136 .566 .183 V602a .382 -.250 .517 .194
V604 Social Influence 0.859 3 295
V604b .112 -.139 .077 .893 V604c .148 -.114 .084 .890 V604a .247 .001 .073 .783
Total Variance Explained Initial Eigen Value Total 7.642 2.061 1.924 1.446 Initial Eigen Value % of Variance (65.4) 38.211 10.307 9.619 7.228 Overall Cronbach’s Alpha 0.729
The acceptable loading value ±0.50 was used as cut off point in this study as suggested by Hair et al. (2006). All the remaining factors loaded above 0.5. The amount of variance explained by factors of innovation characteristics was 65.4%. Hair et al. (2006) consider 60% or above explained variance to be enough for further analysis. We also find that relative advantages contributed 38.2% of the model variance. Complexity contributed 10.3%, compatibility contributed 9.6% and social influence contributed 7.2% of the model explained variance. We also performed a scale analysis of the identified innovation characteristic factors in the factor analysis to determine the identified factor and their scale reliability. The result of individual IC factors Cronbach’s Alpha is relatively higher above 0.70, which is the minimum acceptable limit (refer also to Table 7-3).

99
7.3.2 The Innovation Characteristics Summated Scale We carried out a bivariate correlation analysis of the identified factors. The results presented in Table 7-4 indicate the correlations among the variables are less than 0.6 (Hair et al., 2006). However, we found a close relationship between relative advantage and compatibility (r = 0.448, p-value < 0.01). We also found a significant negative correlation between complexity characteristics with the rest of the variables (r = -0.351, -0.326, and -0.222, p-value < 0.01). This means that the more complex the ICT the less likely is it to correlate with relative advantage, compatibility and social influence.
Table 7-4 Innovation Characteristics Summated Scale Correlations
Relative Advantage Compatibility Complexity Social
Influence Relative Advantage 1 Compatibility 0.448** 1 Complexity -0.351** -0.326** 1 Social Influence 0.382** 0.187** -.222** 1
**. Correlation is significant at the 0.01 level (2-tailed).
7.3.3 The Innovation Characteristics and EWA – Multiple Regression Analysis We performed a multiple regression analysis in order to test the relationship between the innovation characteristics (H1a – H4a) and EWA (see, also Figure 7-1). The findings indicate that the EWA is significantly influenced by compatibility characteristics (refer to Table 7-5). The compatibility statistical parameters (β = 0.229, p-value = 0.001) indicate a positive relationship with EWA. On the other hand, relative advantage (β = 0.036, p-value = 0.677), complexity (β = 0.027, p-value = 0.584), and social influence (β = 0.015, p-value = 0.787) characteristics are insignificantly related to EWA. Similarly, we investigated the possibility of multicollinearity effects as most of the independent variables were insignificantly related to EWA, and the coefficient of determination was low (5.7%). Multicollinearity can have substantial effects on the predictive ability of the regression model, estimation of regression coefficients and statistical significances (Hair et al., 2006). Hair et al. (2006) argue that the impact of multicollinearity presence in a multiple regression analysis is to reduce any single independent variable’s predictive power by the extent to which it is associated with the other independent variables. As indicated in Table 7-5, a multicollinearity diagnostic analysis involved the examination of tolerances (TOLE) values and the Variance Inflation Factor (VIF) values. The results indicate that relative advantage has a tolerance rate of 0.680 and VIF of 1.472. The literature suggests a tolerance and VIF cut-off points of 0.10 and 10.0 respectively. In case of a smaller tolerance value less than 0.10 or a VIF value more than 10, one needs to make a further investigation (Hair et al., 2006). The results of the innovation characteristics are within acceptable VIF and TOLE limits
Table 7-5 Innovation Characteristics and EWA – Multiple Regression Analysis
DV Hypotheses Independent Variables DF Beta
Coeff t-
values Sig. R2 TOLE VIF Interpretation
EWA
H1a Relative Advantage 294 0.036 0.416 0.677
0.057
0.680 1.472 NS H2a Compatibility 294 0.229 3.543 0.001 0.767 1.303 S H3a Complexity 294 0.027 0.548 0.584 0.833 1.201 NS H4a Social Influence 294 0.015 0.271 0.787 0.845 1.183 NS
DV - Dependent variables, NS – Not Significant, S – Significant , TOLE – Tolerance, VIF - Variance Inflation Factor, DF – Degree of Freedom We also tested a stepwise regression analysis by adding and subtracting the innovation characteristics in the model and found that relative advantage was moderately significant when compatibility was not

100
included in the model. A further examination of the innovation characteristics correlation matrix given in Table 7-4 indicates that relative advantage is significantly correlated with compatibility (r = 0.448, p-value < 0.01). We suggest examining the indirect effects for relative advantage and compatibility in the later stage of data analysis using Structural Equation Modelling (SEM). The model was explained by 5.7% as indicated in Table 7-5 (the coefficient of determination R2). According to Malhotra (2007), the coefficient of determination (R2) is an indicator which provides information about the model’s goodness of fit (GOF). The innovation characteristics model explanation is relatively low, as it indicates that the innovation characteristics suggested account for only 5.7% of the EWA explanation. Based on the coefficient of determination one may conclude that the model suggested is either weak or unreliable. However, the literature indicates that the source low coefficient of determination (R2) may be the presence of undetected outliers or the model variables have multicollinearity problems (see also: Hair et al., 2006). In both cases, the data analysis process was preceded with data cleaning process (refer to Chapter 6).
7.3.4 Innovation Characteristics and EWU– Multiple Regression Analysis In this section, we extend our analysis to include innovation characteristics and all levels of EWU. We carried out a factor analysis of EWU in Section 7.2 and found that the EWU was reclassified into three levels. Consequently, EWU is examined along three levels namely: business communication, online presence and online trading. The innovation characteristics and EWU hypotheses are revisited in Figure 7-2.
Figure 7-2 Innovation Characteristics and EWU– Revisited
Therefore, in our conceptual model, we took into consideration business communication, online presence and online trading as parts of EWU. We carried out a multiple regression analysis of the innovation characteristics and the EWU as indicated in Table 7-6. A multiple regression analysis was carried out three times (Y1 = business communication, Y2 = online presence, Y3 = online trading). Firstly, we found that relative advantage is a significant determiner of business communication (β = 0.350, p-value < 0.001, R2 = 0.192) and online presence (β = 0.500, p-value < 0.002, R2 = 0.107). Surprisingly, we found relative advantage to be an insignificant determiner of online trading (β = 0.259, p-value < 0.105, R2 = 0.151). The relative advantage tolerance is 0.680. Secondly, we found that compatibility positively determines the EWU at two levels. The statistical parameters for business communication are β = 0.143, p-value < 0.022, R2 = 0.192, and those of online
H1b
H4b
H3b
H2b Compatibility
Relative Advantage
Complexity
Social Influence
Online Presence (2)
Business Communication (1)
Online Trading (3)
EWU

101
trading are β = 0.484, p-value < 0.001, R2 = 0.151. The compatibility characteristic is an insignificant determiner of online presence (β = 0.049, p < 0.672, R2 = 0.107). Again, the compatibility tolerance value is 0.767.
Table 7-6 Innovation Characteristics and EWU - Multiple Regression Analysis Dependent Variables Hypotheses Independent
Variables DF Beta Coeff
t- values Sig. R2 TOLE VIF Interp.
Business Communication
(1)
H1a-1 Relative Advantage 294 0.350 4.176 0.001
0.192
0.680 1.472 S H2a-1 Compatibility 294 0.143 2.307 0.022 0.767 1.303 S H3a-1 Complexity 294 -0.127 -2.699 0.007 0.833 1.201 S H4a-1 Social Influence 294 0.001 -0.019 0.985 0.845 1.183 NS
Online Presence
(2)
H1a-2 Relative Advantage 294 0.500 3.178 0.002
0.107
0.680 1.472 S H2a-2 Compatibility 294 0.049 0.424 0.672 0.767 1.303 NS H3a-2 Complexity 294 -0.195 -2.202 0.028 0.833 1.201 S H4a-2 Social Influence 294 0.088 0.894 0.372 0.845 1.183 NS
Online Trading
(3)
H1a-3 Relative Advantage 294 0.259 1.627 0.105
0.151
0.680 1.472 NS H2a-3 Compatibility 294 0.484 4.099 0.001 0.767 1.303 S H3a-3 Complexity 294 -0.170 -1.894 0.059 0.833 1.201 NS H4a-3 Social Influence 294 0.076 0.762 0.447 0.845 1.183 NS
NS – Not Significant, S – Significant, TOLE – Tolerance, VIF - Variance Inflation Factor Thirdly, we found that complexity is a significant determinant of business communication (β = -0.127, p-value < 0.007, R2 = 0.192) and online presence (β = -0.195, p-value < 0.028, R2 = 0.107). Unexpectedly, we found that complexity is not a significant determiner of online trading (β = -0.170, p < 0.059, R2 = 0.151). the tolerance recorded is 0.833, and the VIF is 1.201. Complexity is negatively correlated with other variables namely relative advantage (r = -0.351, p < 0.01), compatibility (r = -0.326, p < 0.01), and social influence (r = -0.222, p < 0.01). Finally, social influence depicted a different picture compared to the other innovation characteristics. The social influence is insignificantly related to all EWU levels namely, business communication (β = 0.001, p < 0.985, R2 = 0.192), online presence (β = 0.088, p < 0.372, R2 = 0.107), and online trading (β = 0.076, p < 0.447, R2 = 0.151). The tolerance measure was at 0.845 (see also the VIF = 1.183). We also found that the explanatory power of the three models is relatively low. The business communication indicated 19.2%, the online presence indicated 10.7%, and online trading indicated 15.1%. We argue that some of the variations are explained by the degree of significant correlation among the variables. We tested for a multicollinearity presence in all cases. The results indicate the absence of multicollinearity. Therefore, we argue for examination of the interaction effects among the independent variables. The argument is also in line with our study objective on examining the joint effects of innovation characteristics in determining EWA.
7.3.5 Innovation Characteristics - Hypotheses Summary Based on the analysis carried out in Section 7.3.3, we provide a summary of the hypotheses testing as indicated in Table 7-7. The results indicate that our study has only accepted the hypothesis that the compatibility of innovation is positively related to EWA. The rest of the hypotheses (relative advantage, complexity and social influence) are rejected.

102
Table 7-7 Summary of Innovation Characteristics and EWA Hypotheses Testing Dependent
Variable Hypotheses Independent variables Significance Nature of
relationship Hypotheses Conclusion
EWA
H1a Relative Advantage Not Significant - Rejected H2a Compatibility Significant +ve Accepted H3a Complexity Not Significant - Rejected H4a Social Influence Not Significant - Rejected
+ve - positively related; -ve – negatively related According to the analysis carried out in Section 7.3.4, we found that the hypotheses concerning relative advantage, compatibility and complexity are partially accepted to be related to EWU (refer also to Table 7-8). It is confirmed that social influence is not positively related to EWU at all levels. It is therefore totally rejected. A detailed discussion of testing the hypotheses is presented in Chapter 8.
Table 7-8 Summary of Innovation Characteristics and EWU - Hypotheses Testing
Hypotheses Independent variables
Dependent Variable Significance Nature of
relationship Hypotheses Conclusion
H1b-1 Relative Advantage Business Communication Significant +ve Partially
Accepted H1b-2 Relative Advantage Online Presence Significant +ve H1b-3 Relative Advantage Online Trading Not Significant -
H2b-1 Compatibility Business Communication Significant +ve
Partially Accepted H2b-2 Compatibility Online Presence Not Significant -
H2b-3 Compatibility Online Trading Significant +ve
H3b-1 Complexity Business Communication Significant -ve Partially
Accepted H3b-2 Complexity Online Presence Significant -ve H3b-3 Complexity Online Trading Not Significant -
H4b-1 Social Influence Business Communication Not Significant -
Fully Rejected H4b-2 Social Influence Online Presence Not Significant -
H4b-3 Social Influence Online Trading Not Significant -
7.4 Organisational Characteristics, EWA and EWU In Section 3.3.2, we presented the second block of hypotheses explaining EWA and EWU among the SMEs in the tourism sector in Tanzania. The hypotheses were grouped under the organisational characteristics as revised in Figure 7-3. As we argued in Chapter 3, most of the SMEs are influenced by inherent characteristics such as the lack of capital, lack of competent management and lack of ICT skills (Levy et al., 2001; Thong, 1999). Our study took place in a developing country context. Therefore, it was important to examine the effects of organisational characteristics on EWA and EWU in the context of a developing country (Torres and Julien, 2005). We revised the hypotheses discussed in Chapter 3 as suggested in the factor analysis carried out (see Figure 7-3). The hypotheses include the organisational location (H5a), organisational e-resources (H6a), and top management support (H7a) influence on EWA. We adopted the same approach for testing the hypotheses (factor analysis, scale and multiple regression analysis) as detailed in Section 7.3.1.

103
Figure 7-3 Organisational characteristics and EWA– Revisited
7.4.1 The Organisational Characteristics - Factor Analysis We performed a factor analysis in order to find out whether the attributes of the organisational characteristics inhibit the same groups suggested in the previous studies in ICT (Molla and Licker, 2005b). As we detailed in Section 7.3.1, our study sample size met the requirements for executing a factor analysis.
7.4.1.1 The Organisational Characteristics Communalities and Sampling Adequacy Tests The initial factor analysis performed indicated problems with cross loading and lower communality loadings. Therefore, we dropped item 702e due to the low community loading and item 702a due to cross-loading problems. The measure of Bartlett’s test of sphericity (Chi-square = 1799.097, DF = 55) was significant at the p-value = 0.001. The measure indicates the appropriateness of factor analysis in our study, as there are sufficient correlations to continue with the factor analysis process. We examined the measure of sampling adequacy, which quantifies the degree of inter-correlations among the studied variables as detailed in Section 7.3.1.1. The measure of sampling adequacy (0.801) was recommendable for further factor analysis.
7.4.1.2 The Organisational Characteristics Rotation Matrix, Eigen Value and Scale Analysis The final factor analysis results suggested three factors which described organisational characteristics as shown in Table 7-9. The rotated factor matrix presented in Table 7-9 indicates how the individual items of the organisational characteristics loaded in each suggested factor. Table 7-9 also indicates that all the factors loaded above 0.6, which is an acceptable limit. The total amount of variance explained by these five factors was 72.98%. Furthermore, we find that top management support contributed more than half of the total variance (43.2%). Organisational e-resources contributed 16.6% and organisational location contributed 13.2%. This indicates that the model of organisational characteristics is highly explained by top management support. It is not astonishing to find that as most of the decision making towards any sort of business investment among SMEs depends largely on the top management (see, for example: Premkumar and Roberts, 1999; Thong et al., 1996). We finally performed a scale analysis of the identified organisational characteristics in the factor analysis to determine the identified factors and their scale reliability. The result of the individual scale analysis presented in Table 7-9 indicated that top management support has a Cronbach’s Alpha of 0.882. Organisational e-resources and organisational location have a Cronbach’s Alpha of 0.880 and 0.855 respectively. All three values are higher than the acceptable lower limits of 0.70 (see also: Hair et al., 2006). We used averages of the items loading to compute summated scales for organisational location, organisational e-resources, and top management support in a multiple regression analysis as discussed in Sections 7.4.3 and 7.4.4.
H5a
H6a
H7a
EWA Organisational E-resources
Organisational Location
Top Management Support

104
Table 7-9 The Organisational Characteristics Rotation Matrix, Eigen Value and Scale Analysis
Factor Code Factor Cronbach's
Alpha Items Cases Question Code
Top Management
Support
Organisational E-resources
Organisational Location
703 Top Management Support 0.882 6 295
(703e) .830 .023 .119 (703a) .807 .015 .031 (703b) .781 .192 .037 (703d) .781 .249 .112 (703f) .708 .235 .247 (703c) .665 .325 .233
702 Organisational E-resources 0.880 3 295
(702c) .154 .917 .049 (702d) .171 .861 .096 (702b) .183 .845 .011
701 Organisational Location 0.855 2 295
(701b) .142 .062 .915 (701c) .174 .053 .913
Total Variance Explained Initial Eigen Values Total 4.7530 1.8210 1.4550 Initial Eigen Values % of variance (72.98) 43.207 16.550 13.223 Overall Cronbach’s Alpha 0.852 11 295 (700)
7.4.2 The Organisational Characteristics Summated Scale We performed a bivariate correlation analysis. The correlation results presented in Table 7-10 indicate correlation among the factors is less than 0.6 (Hair et al., 2006).
Table 7-10 The Organisational Characteristics Summated Scale Correlations Organisational
Location Organisational
E-resources Management
Support Organisational Location 1 Organisational E-resources 0.156** 1 Top Management Support 0.318** 0.384** 1
**. Correlation is significant at the 0.01 level (2-tailed).
7.4.3 The Organisational Characteristics and EWA– Multiple Regression Analysis Based on the factors confirmed in the factor analysis in Section 7.4.1, we executed a multiple regression analysis of the organisational characteristics and EWA. The findings shown in Table 7-11 indicated that organisational location (β = 0.010, p-value = 0.837, R2 = 0.069) and top management support (β = 0.094, p-value = 0.227, R2 = 0.069) are not significantly related to EWA. On the other hand, organisational e-resources (β = 0.160, p-value = 0.001, R2 = 0.069) indicate a significant positive relationship with EWA.
Table 7-11 Organisational Characteristics and EWA– Multiple Regression Analysis
DV Hypotheses Independent Variables DF Beta
Coeff t-
values Sig. R2 TOLE VIF Interp.
EWA Level
H5a Organisational Location 294
0.010 0.206 0.837 0.069
0.897 1.115 NS H6a Organisational E-resources 0.160 3.571 0.001 0.851 1.175 S H7a Top Management Support 0.094 1.210 0.227 0.784 1.276 NS
DV - Dependent variable, NS – Not Significant, S – Significant , TOLE – Tolerance, VIF - Variance Inflation Factor The results also indicated that the top management variable has a tolerance value of 0.784 and VIF 1.276. We also tested a stepwise regression analysis by adding and subtracting the organisational characteristics in the model. The results indicated that top management was moderately significant (β = 0.192, p-value < 0.010) when organisational e-resources was not included in the model. Further examination of the correlation of organisational characteristics matrix given in Table 7-10 indicates that organisational e-resources is significantly correlated with top management support (r = 0.384, p-value <

105
0.01). In case of multivariate analysis, if the independent variables are relatively correlated then one of the independent variables gets more effect hence the remaining variable becomes insignificant. In our case, we find such behaviour between organisational e-resources and top management support. We suggest examining the interaction effects for organisational e-resources and top management support at a later stage of the data analysis using SEM.
7.4.4 Organisational Characteristics and EWU - Multiple Regression Analysis In this section, we examine the influence of the organisational characteristics on EWU. EWU is examined along the three levels suggested by factor analysis in Section 7.2.2. We have revised our initial conceptual model presented in Figure 3-2 to include business communication, online presence and online trading as indicated in Figure 7-4.
Figure 7-4 Organisational Characteristics and EWU– Revisited
In order to test our hypotheses suggested in the conceptual model, we performed a multiple regression analysis of the organisational characteristics and EWU. Table 7-12 provides a summary of multiple regression analysis for business communication, online presence and online trading. In the first case, we found that organisational location is not significantly related to EWU at all levels as exhibited by our model statistical parameters namely business communication (β = 0.034, p-value < 0.469, R2 = 0.102), online presence (β = 0.038, p-value < 0.657, R2 = 0.080), online trading (β = -0.119, p-value < 0.157, R2 = 0.176). The results also indicated that the tolerance value was at 0.897, and the VIF was at 1.115.
Table 7-12 Organisational Characteristics and EWU - Multiple Regression Analysis Dependent Variables
Hypo theses
Independent Variables DF Beta
Coeff t-
values Sig. R2 TOLE VIF Inte
Business Communication
(1)
H5b-1 Organisational Location 294 0.034 0.725 0.469
0.102
0.897 1.115 NS H6a-1 Organisational
E-resources 294
0.114 2.482 0.014 0.851 1.175 S
H7a-1 Top Management Support
294 0.268 3.399 0.001 0.784 1.276 S
Online Presence
(2)
H5b-2 Organisational Location 294 0.038 0.445 0.657
0.080
0.897 1.115 NS H6a-2 Organisational
E-resources 294
0.183 2.212 0.028 0.851 1.175 S
H7a-2 Top Management Support
294 0.430 3.019 0.003 0.784 1.276 S
Online Trading
(3)
H5b-3 Organisational Location 294 -0.119 -1.420 0.157
0.176
0.897 1.115 NS H6a-3 Organisational
E-resources 294
0.396 4.866 0.001 0.851 1.175 S
H7a-3 Top Management Support
294 0.563 4.019 0.001 0.784 1.276 S
NS – Not Significant, S – Significant, TOLE – Tolerance, VIF - Variance Inflation Factor
H5b
H7b
H6b Organizational E-resources
Organisational Location
Top Management Support
EWU Online Presence (2)
Business Communication (1)
Online Trading (3)

106
Secondly, the organisational e-resources are significantly related to EWU at all levels. The statistical parameters are as follows: business communication at (β = 0.114, p-value < 0.014, R2 = 0.102), online presence at (β = 0.183, p-value < 0.028, R2 = 0.080), and online trading (β = 0.396, p-value < 0.001, R2 = 0.176). The results indicate that the organisational e-resource variable has a tolerance value of 0.851 and VIF of 1.175. Therefore, the analysis did not indicate any presence of a multicollinearity problem. However, an examination of the organisational characteristics correlation matrix given in Table 7-10 indicates that organisational e-resources are significantly correlated with top management support (r = 0.384, p-value < 0.01). Finally, we found top management support being a strong determiner of EWU at all levels. The levels included business communication (β = 0.268, p-value < 0.001, R2 = 0.102), online presence (β = 0.430, p-value < 0.003, R2 = 0.080), online trading (β = -0.563, p-value < 0.001, R2 = 0.176). Top management support is by far the most important variable among the factors of organisational characteristics because it accounts for more than 50% of the total model variance explained as shown in Table 7-9. These findings indicate that top management support is equally an important discriminator for all levels of EWU. The model coefficient of determination for business communication (10.2%), online presence (8.0%) and online trading (17.6%) are still relatively low.
7.4.5 Organisational Characteristics - Hypotheses Summary Based on the analysis carried out in Section 7.4.3, we provide a summary of the hypotheses testing as shown in Table 7-13. The results validate that organisational e-resources is significantly related to EWA. To our surprise, we confirm that organisational location and top management support are not positively related to EWA.
Table 7-13 Summary of Organisational Characteristics and EWA Hypotheses Testing Dependent
Variable Hypotheses Independent variables Significance Nature of
relationship Hypotheses Conclusion
EWA H5a Organisational Location Not Significant - Rejected H6a Organisational E-resources Significant +ve Accepted H7a Top Management Support Not Significant - Rejected
+ve - positively related; -ve – negatively related
The hypotheses summary given in Table 7-14 confirms that organisational location is not positively related to EWU. On the other hand, we find fully acceptance of the fact that an organisational e-resources and top management support are positively related to EWU.
Table 7-14 A Summary of OC and EWU - Hypotheses testing
Hypotheses Independent variables
Dependent Variable Significance Nature of
relationship Hypotheses Conclusion
H5b-1 Organisational Location Business Communication Not Significant - Fully
Rejected H5b-2 Organisational Location Online Presence Not Significant - H5b-3 Organisational Location Online Trading Not Significant -
H6b-1 Organisational E-resources Business Communication Significant +ve
Fully Accepted H6b-2 Organisational E-resources Online Presence Significant +ve
H6b-3 Organisational E-resources Online Trading Significant +ve
H7b-1 Top Management Support Business Communication Significant +ve Fully
Accepted H7b-2 Top Management Support Online Presence Significant +ve H7b-3 Top Management Support Online Trading Significant +ve

107
7.5 Environmental Characteristics, EWA and EWU As we recall, in Section 3.3.3, we presented the third block of hypotheses determining EWA and EWU in the tourism sector in Tanzania. Unlike the preceding hypotheses discussed, the hypotheses on environmental characteristics centre on the external factors influencing the adoption of ICT in the SMEs. In our study, we suggested competitive pressure (Chwelos et al., 2001; Porter, 2001), external support (Brock, 2000), and institutional intervention (King et al., 1994) as summarised in the revised conceptual model shown in Figure 7-5. The revisited hypotheses include competitive pressure (H8a), external support (H9a), and institutional intervention (H10a). We adopted the same hypothesis testing approach (factor analysis, scale and multiple regression analysis) as detailed in Section 7.3.1. The factor analysis results suggested that the external support factor be divided into two sub factors. We labelled the new sub factors as technological external support and non-technological external supports as discussed in Section 7.5.1.2.
Figure 7-5 External Environmental characteristics and EWA– Revisited
7.5.1 The Environmental Characteristics - Factor Analysis We performed a factor analysis in order to uncover whether the attributes of environmental characteristics encompass the same categories as suggested in literature (see, for example: Gibbs and Kraemer, 2004a; Premkumar and Roberts, 1999; Rogers, 2003). As we detailed in Section 7.3.1, our study met the requirements for factor analysis.
7.5.1.1 The Environmental Characteristic Communalities and Sampling Adequacy Test We executed a factor analysis for the environmental characteristics (V800). The initial factor loading for some items were below acceptable limits (0.500), for example, item v802e. We also found that items 801b and 802d had cross loading problems. Therefore, we dropped the three items. We also tested the measure of factor analysis appropriateness in the study, and found out that the Bartlett’s test of sphericity (Chi-square = 2858.65, DF = 120) was significant at 0.001. We also examined the measure of sampling adequacy, and found it to be recommendable for further factor analysis at 0.866.
7.5.1.2 The Environmental Characteristic Rotation Matrix, Eigen Value and Scale Analysis The final factor analysis implied that the environmental characteristics have four sub-factors as shown in Table 7-15. Our initial conceptual framework (model) suggested three factors namely competitive pressure, external support, and institutional intervention (refer to Figure 3-3). As we discussed in Section 7.5, the external support resulted into two sub factors namely technological external support and non-technological external supports as indicated in Table 7-15.
H10a
H8a
H9a-1
H9a-2
Technological Support
Competitive Pressure
Institutional Intervention
Non-Technological Support
EWA

108
The total amount of variance explained by the four factors was 71.5%. The institutional intervention represented 37.5%, the technological support represented 17.8%, the competitive pressure represented 9.6%, and non-technological support represented 6.5%. The rotated factor matrix presented in Table 7-15 indicates how the individual environmental items loaded in each suggested factors. All the environmental characteristics remaining factors loaded above 0.5. A scale analysis indicates that the environmental characteristics had Cronbach’s Alpha values greater than 0.70, which is the lowest acceptable limit (Hair et al., 2006). We computed the factors summated scale by taking the average of the individual factor loadings.
Table 7-15 The Environmental Characteristics Rotation Matrix, Eigen Value and Scale Analysis
Factor Code Factor Cronbach's
Alpha Items Cases Question Code.
Inst. Intervention
Techn. Support
Comp. Pressure
Non- Techn.
Support
V803 Institutional Intervention 0.914 5 295
(803d) .874 .318 -.048 .068 (803c) .864 .314 -.066 .070 (803e) .842 .306 .005 .078 (803b) .774 .080 .047 .122 (803a) .737 .229 -.164 .144
V802A Technological Support 0.874 5 295
(802g) .295 .799 -.003 .188 (802f) .270 .762 -.041 .219 (802h) .320 .743 -.043 .180 (802i) .183 .741 .089 .180 (802j) .144 .730 .076 .140
V801
Competitive Pressure
0.792 4 295 (801c) -.029 .037 .863 .068 (801d) .055 .058 .854 -.058 (801e) .008 .067 .784 .101 (801a) -.251 -.100 .634 .210
V802B Non-Technological Support 0.795 3 295
(802a) .080 .250 .056 .826 (802b) .131 .166 .143 .802 (802c) .184 .400 .105 .693
Total Variance Explained Initial Eigen Values Total 6.007 2.848 1.535 1.044 Initial Eigen Values % of variance (71.46) 37.544 17.801 9.591 6.524
Overall Cronbach’s Alpha 19 295 (800)
7.5.2 The Environmental Characteristics Summated Scale Correlations We also carried out a bivariate correlation analysis. The results presented in Table 7-16 shows that the correlations among the factors is less than 0.6 (Hair et al., 2006). However, we find that technological support and institutional interventions are relatively highly correlated compared to other pairs (r = 0.573, p-value < 0.01).
Table 7-16 The Environmental Characteristics - Summated Scale Correlations Competitive
Pressure Technological
Support Non Technological
Support Institutional Intervention
Competitive Pressure 1 Technological Support 0.084 1 Non-Technological Support 0.190** 0.468** 1 Institutional Intervention -0.022 0.573** 0.274** 1
**. Correlation is significant at the 0.01 level (2-tailed).

109
7.5.3 The Environmental Characteristics and EWA – Multiple Regression Analysis In order to test the relationship between the environmental characteristics and the EWA, we performed a multiple regression analysis. The findings indicate that competitive pressure (β = 0.291, p-value = 0.001, R2 = 0.099) is significantly related to EWA. The results also indicated the tolerance was 0.956 and VIF was 1.046. Surprisingly, we find that technological support (β = 0.101, p-value = 0.087, R2 = 0.099), non-technological support (β = 0.025, p-value = 0.584, R2 = 0.099), and institutional intervention (β = -0.015, p-value = 0.788, R2 = 0.099) do not significantly predict EWA. The results indicate that the technological support variable has a tolerance rate of 0.565 and a variance inflation factor of 1.769. We find that the rest of the tolerance variance of 0.435 is explained by other variables in the model.
Table 7-17 The Environmental characteristics and EWA – Multiple Regression
DV Hypotheses Independent Variables DF Beta
Coeff t-
values Sig. R2 TOLE VIF Interp.
EWA
H8a Competitive Pressure
294
0.291 4.670 0.001
0.099
0.956 1.046 S H9a-1 Technological Support 0.101 1.718 0.087 0.565 1.769 NS H9a-2 Non Technological Support 0.025 0.548 0.584 0.757 1.320 NS H10a Institutional Intervention -0.015 -0.269 0.788 0.666 1.502 NS
DV - Dependent variable, NS – Not Significant, S – Significant , TOLE – Tolerance, VIF - Variance Inflation Factor The multicollinearity statistical parameters of the non-technological support (tolerance = 0.757 and VIF = 1.320) did not indicate the presence of any multicollinearity problems. A further examination of the correlation of environmental characteristics matrix given in Table 7-16 indicates that technological support and institutional intervention have a significant correlation (r = 0.573, p-value < 0.01). Again, technological support and non-technological support also have a significant correlation (r = 0.468, p-value < 0.01). Therefore, we suggest the possibility of technological support influencing the institutional intervention. We suggest examining the interaction effects for technological support and institutional intervention at a later stage of data analysis using SEM.
7.5.4 Environmental Characteristics and EWU – Multiple Regression Analysis In this section, we look at the influence of the environmental characteristics on the extent of EWU. We have revised the environmental characteristics to include both the new external support factors (non-technological support and technological support) and the three EWU levels as illustrated in Figure 7-6.
Figure 7-6 External Environmental Characteristics and EWU– revisited
H9b-2 Online Presence (2)
Business Communication (1)
Online Trading (3)
Technological Support
Competitive Pressure
Non-Technological Support EWU
H8b
H9b-1
H10b
Institutional Intervention

110
We performed a multiple regression analysis of the environmental characteristics and EWU as indicated Table 7-18 . Our findings indicated that competitive pressure is significantly related to all EWU levels. The statistical parameters for competitive pressure indicate a positive relationship with business communication (β = 0.420, p-value < 0.001, R2 = 0.174), online presence (β = 0.532, p-value < 0.001, R2 = 0.109) and online trading (β = 0.703, p-value < 0.001, R2 = 0.179).
Table 7-18 The Environmental Characteristics and EWU - Multiple Regressions Dependent
Variable Hyp. Independent Variables DF Beta
Coeff t-
values Sig. R2 TOLE VIF Int
Business Communicati
on (1)
H8b1 Competitive Pressure
294
0.420 6.798 0.001
0.174
0.956 1.046 S H9b-11 Technological Support 0.152 2.603 0.010 0.565 1.769 S H9b-21 Non Technological Support -0.015 -0.318 0.751 0.757 1.320 NS H10b-1 Institutional Intervention -0.018 -0.319 0.750 0.666 1.502 NS
Online Presence
(2)
H8b2 Competitive Pressure
294
0.532 4.629 0.001
0.109
0.956 1.046 S H9b-12 Technological Support 0.046 0.422 0.673 0.565 1.769 NS H9b-22 Non Technological Support 0.188 2.193 0.029 0.757 1.320 S H10b2 Institutional Intervention 0.008 0.083 0.934 0.666 1.502 NS
Online Trading
(3)
H8b3 Competitive Pressure
294
0.703 6.138 0.001
0.179
0.956 1.046 S H9b-13 Technological Support 0.277 2.567 0.011 0.565 1.769 S H9b-23 Non Technological Support 0.027 0.321 0.748 0.757 1.320 NS H10b3 Institutional Intervention 0.103 1.007 0.315 0.666 1.502 NS
DF – Degree of Freedom, NS – Not Significant, S – Significant, TOLE – Tolerance, VIF - Variance Inflation Factor
Secondly, we found that technological support is significantly related to EWU at two levels. The variable is significantly and positively related to business communication (β = 0.152, p-value < 0.010, R2 = 0.174) and online trading (β = 0.277, p-value < 0.011, R2 = 0.179). Surprisingly, we found that technological support is insignificantly related to online presence (β = 0.046, p-value < 0.673, R2 = 0.109). The results also indicated that the technological support has a tolerance of 0.565 and VIF of 1.769.
Thirdly, non-technological support is insignificantly related to business communication (β = - 0.015, p-value < 0.751, R2 = 0.174) and online trading (β = 0.027, p-value < 0.748, R2 = 0.179). We also find that non-technological support is significantly related to online presence (β = 0.188, p-value < 0.029, R2 = 0.109). We also found that non-technological support tolerance is 0.757 and VIF is 1.320. Finally, we find that institutional intervention is an insignificant determiner of EWU at all levels. The institutional intervention statistical parameters indicate no relationship with business communication (β = - 0.018, p-value < 0.750, R2 = 0.174), online presence (β = 0.008, p-value < 0.934, R2 = 0.109), and online trading (β = 0.103, p-value < 0.315, R2 = 0.179). The institutional intervention tolerance is 0.666 and VIF is 1.502.
7.5.5 Environmental Characteristics - Hypotheses Summary Based on the analysis carried out in Section 7.5.3, we provide the summary of the hypotheses testing as shown in Table 7-19. Our study results certify that competitive pressure is significantly related to EWA. Unexpectedly, we confirm that external support (technological and non-technological) and institutional interventions are not significantly positively related to EWA.
Table 7-19 A Summary of Environment Characteristics and EWA Hypotheses testing Dependent
Variable Hypotheses Independent variables Significance Nature of
relationship Hypotheses Conclusion
EWA
H8a Competitive pressure Significant +ve Accepted H9a-1 Technological Support Not Significant - Rejected H9a-2 Non Technological Support Not Significant - Rejected H10a Institutional Intervention Not Significant - Rejected

111
We also performed a multiple regression analysis in Section 7.5.4, and the results were presented in Table 7-18. The results confirm the hypothesis that competitive pressure is positively related to EWU at all levels as indicated in Table 7-20. The study also confirms that the technological support has a partial positive relationship with EWU. We also find that the relationship between non-technological support with EWU is greatly rejected. Finally, Table 7-21 shows that the relationship between institutional intervention and EWU is fully rejected.
Table 7-20 A Summary of EC and EWU- Hypotheses testing
Hypotheses Independent variables
Dependent Variable Significance Nature of
relationship Hypotheses Conclusion
H8b-1 Competitive Pressure Business Communication Significant +ve Fully
Accepted H8b-2 Competitive Pressure Online Presence Significant +ve H8b-3 Competitive Pressure Online Trading Significant +ve
H9b-11 Technological Support Business Communication Significant +ve
Partially Accepted H9b-12 Technological Support Online Presence Not Significant -
H9b-13 Technological Support Online Trading Significant +ve
H9b-21 Non Technological Support Business Communication Not Significant - Greatly
Rejected H9b-22 Non Technological Support Online Presence Significant +ve H9b-23 Non Technological Support Online Trading Not Significant -
H10b-1 Institutional Intervention Business Communication Not Significant -
Fully Rejected H10b-2 Institutional Intervention Online Presence Not Significant -
H10b-3 Institutional Intervention Online Trading Not Significant -
7.6 The TOE Characteristics and EWA Integrated Model As it was stated in Chapter 1, our study aimed also at determining the extent at which the innovation, organisational, and external environmental characteristics can jointly predict EWA (see also: Teo et al., 2004). In Chapter 3, we conceptualised the integrated model as a Technology-Organisation-Environmental (TOE) Model. In this Section, we extend our previously tested block of hypotheses to an integrated TOE framework. The integrated model combines all significant independent variables in determining EWA (see also: Frambach and Schillewaert, 2002; Thong, 1999). We have adopted the SEM analysis to test the joint effects of the TOE characteristics on EWA. In this section, we also revisit the integrated conceptual models (see: Figure 7-7). We also provide the necessary methodological steps that were followed to execute SEM and testing the TOE joint effects on EWA.
7.6.1 Restating the TOE Integrated Research Model In the previous sections, we tested three blocks of hypotheses using a multiple regression analysis (see Section 7.3, Section 0, and Section 7.5). However, the data analysis technique used aimed to explain a single relationship between the TOE characteristics and EWA. Such type of analysis fails to account for indirect relationships and correlations existing among independent variables. Therefore, we used the SEM to shed more insight on the relationships among the TOE characteristics (Hair et al., 2006; Raykov et al., 1991). Frambach and Schillewaert (2002) suggest also that there is an interactive impact of variables on diffusion of innovation in first and second order. The first order effects include all attributes of the innovations that affect directly the adoption of technological innovation. The first order innovation attributes may include the perceived innovation characteristics and adopter characteristics (see also: Tornatzky and Klein, 1982). Second order effects include all attributes of innovations that affect indirectly the adoption of innovation. The second order innovation attributes may include the external business environment characteristics, for example market factors or other contextual factors.

112
The SEM method unlike other multivariate data analysis methods used in this study, enables the examination of interdependence among exogenous and endogenous variables at the same time (Ho, 2006).
The TOE integrated model suggested in this study includes the influence of the TOE characteristics on EWA as revisited in Figure 7-7. Some of the previous studies have attempted to discuss the integrated ICT adoption model among SMEs, for example Thong (1999) suggested an integrated model comprised of CEO characteristics, information system characteristics, organisational characteristics and environmental characteristics (see also, Chapter 3). However, such integrated models did not examine the simultaneous joint effects of the external variables on internal variables when predicting the ICT innovation adoption. Frambach and Schillewaert (2002) also argue that most of the innovation adoption studies test the first order effects and direct effects only. The authors suggest an empirically untested model which takes into consideration the indirect effects and direct effects of environmental influences on innovation adoption mediated by innovation characteristics.
Figure 7-7 The TOE and EWA integrated Research Model – Revisited In addition to the previous findings, our study looked at the joint effects of the environmental and the innovation characteristics in determining EWA. We also tested the relationship between the organisational and innovation characteristics in predicting the EWA (refer to Section 7.6.2). We also examined the indirect effects of environment characteristics and EWA mediated by organisational characteristics, as SMEs has limited influence to the environment. Therefore, we proposed the following hypotheses (H11 and H12) based on the model suggested in Figure 7-7:
H11: Organisational characteristics have indirect positive effects on e-mail and web technologies adoption
H12: Environmental characteristics have indirect positive effects on e-mail and web technologies adoption
Under each block of TOE characteristics, we did not test all the variables as we did in the multiple regression analysis. The indirect effects were examined to the significant hypotheses only under the organisational and environment characteristics (refer to: Section 7.6.4).
Organisational Characteristics
Innovation Characteristics
Environmental Characteristics
EWA
113
7.6.2 Organisational Characteristics and Innovation Characteristics Linkage The indirect relationship between the organisational and innovation characteristics on determining the adoption of ICT is hardly ever tested. Some of the previous ICT adoption studies have examined the direct relationship between either the organisational characteristics and ICT adoption or innovation characteristics and ICT adoption (Del Aguila-Obra and Padilla-Melendez, 2006; Premkumar and Roberts, 1999; Teo et al., 2004). Based on the assertion propounded by Rogers (2003) in the innovation decision process as indicated in Figure 2-1, we find the persuasion stage in the innovation decision process is preceded by the knowledge stage. The knowledge stage occurs when the decision-making unit is exposed to an innovation existence. The decision-making unit then gains an understanding on how the innovation works. Furthermore, the decision-making unit may be persuaded to have a favourable attitude toward the innovation adoption. The characteristics of the decision making unit (the organisation in our case) are also important for the adoption of innovations (Rogers, 2003). Hence, we believe that the characteristics of the decision-making unit (the organisation) also influence the perceived characteristics of innovation before affecting the adoption decision as indicated in Figure 2-1.
In examining the linkage between the organisational and innovation characteristics, we were also inspired by Lin (2006). Lin (2006) found that the organisational support was positively associated with the perception of innovation characteristics, which in turn were positively related to the intention to facilitate knowledge sharing. Other studies have examined the indirect effects of organisational readiness on the intention to adopt the ICT in business mediated by attitude (Quaddus and Hofmeyer, 2007). We also carried out the correlation analysis among the TOE characteristics as indicated in Table 7-21. The organisational characteristics and innovation characteristics are all significantly correlated. Additionally, the environmental characteristics are significantly correlated to most of the innovation characteristics. Based on the above arguments and the details provided in Section 7.6.1, we hypothesised that the organisational characteristics and environment characteristics have indirect positive effects on EWA.

114
Table 7-21 The Correlations of the Innovation and Organisational Characteristics RA CTB CPX SI OL OR TMS CP TS NTS II
Relative Advantage (RA) 1
Compatibility (CBT) .448** 1
Complexity (CPX) -.351** -.326** 1
Social Influence (SI) .382** .187** -.222** 1
Organisational Location (OL) .356** .140* -.300** .408** 1
Organisational E-resources (OR) .270** .479** -.314** .145* .156** 1
Top Management Support (TMS) .532** .439** -.423** .271** .318** .384** 1
Competitive Pressure (CP) .524** .419** -.294** .264** .265** .296** .604** 1
Technical Support (TS) .041 .217** -.195** -.045 -.118* .333** .035 .084 1
Non-Technical Support (NTS) .235** .082 -.200** .177** .063 .291** .155** .190** .468** 1
Institutional Intervention (II) -.063 .162** -.102 -.035 -.134* .186** -.084 -.022 .573** .274** 1
**. Correlation is significant at the 0.01 level (2-tailed). *. Correlation is significant at the 0.05 level (2-tailed).
7.6.3 General Sample Size Requirement for the SEM Analysis The sample size used for the SEM analysis included 295 organisations as explained in Chapter 5 and Chapter 6. The SEM generally requires a large sample compared to other multivariate analysis techniques as a large sample produces stable solutions (Hair et al., 2006). When a sample size exceeds 400, the maximum likelihood estimation (MLE) technique tends to be very sensitive to any small variation in the data (Tanaka, 1993). The recommended sample size for SEM ranges from 150 to 400 respondents. Thus, our final sample size (295) was appropriate for running a SEM. We also adopted the maximum likelihood estimation (MLE) technique in our data analysis. The SEM technique has several estimation methods such as generalised least squares, unweighted least squares, scale-free least squares, and asymptotically distribution free . However, the MLE technique has proven to be robust even in cases when the sample size is relatively small. Therefore, we tested the TOE integrated models by using AMOS version 18. There were no missing data as detailed in Chapter 5.
7.6.4 The TOE Characteristics and EWA Integrated Model The TOE characteristics and EWA integrated model was derived from the significant variables in the multiple regression analysis carried out in the previous sections as summarised in Table 7-22. The TOE characteristics included in the model were compatibility (CTB), organisational e-resources (OR), and competitive pressure (CP) as indicated in Figure 7-8. In order to estimate the measurement model, we performed a CFA of all the TOE characteristics identified in the EWA integrated model to ensure scale validity (see also: Kline, 1998). The latent variables were correlated with each other without restrictions. The CFA is detailed in the next section.

115
Table 7-22 The Combined EWA – Multiple Regression Analysis
DV Hypotheses Independent variables DF Beta
Coeff t-
values Sig. R2 TOLE VIF Interp.
EWA
H2a Compatibility 294 0.229 3.543 0.001 0.057 0.767 1.303 S
H6a Organisational E-resources 294 0.160 3.571 0.001 0.069 0.851 1.175 S
H8a Competitive Pressure 294 0.291 4.670 0.001 0.099 0.956 1.046 S DV - Dependent variable, S – Significant, TOLE – Tolerance, VIF - Variance Inflation Factor
7.6.4.1 Assessing the TOE Measurement Model (CFA) We started the SEM analysis by assessing the measurement model. The measurement model was used to assess the items internal consistence and their reliability (Byrne, 2001; Hair et al., 2006). Normally, the item factor loading above 0.70 in the CFA is considered satisfactory for running the structural model (Hair et al., 2006; Ho, 2006). We also adopted four measurements for goodness of fit indices (GOF) namely: chi-square/df ratio, adjusted goodness of fit index (AGFI), the goodness-of-fit index (GFI), and root mean square error of approximation (RMSEA). The computed measurement model fit indices showed that the chi-square/df ratio was 2.03, which was lower than the recommended value (3.0) for the best measurement model fit. We also found that the AGFI (0.936) and GFI (0.967) of the model met the requirement estimates. The RMSEA value (0.059) was slightly above the recommended limit of 0.05 (Hair et al., 2006). Therefore, all model fit indices were appropriate for SEM except the RMSEA which was on the edge at 0.059. We accepted the model fit indices as the model fit cut off point varies, for example, Hair et al. (2006) suggest cut point of 0.07 or 0.08 combined with other GOF indices. As the tests of goodness of fit indices (GOF) were above the recommended value, we accepted the current measurement model fit. In addition to acceptable GOF indices, the measurement model estimates indicated strong correlation/covariance results among the suggested constructs as indicated in Figure 7-8. All questions items that loaded below 0.70 were dropped in the measurement model. Organisational e-resources and compatibility scored significant correlation impact (β = 0.535). The correlation between competitive pressure and organisational e-resources was at β = 0.325 and the correlation between competitive pressure and compatibility was at β = 0.503. Therefore, the model suggested the possibility of relationships among the TOE characteristics, implying the likelihood of TOE characteristics joint effects in determining EWA.

116
Figure 7-8 The TOE Confirmatory Factor Analysis
7.6.4.2 The TOE and EWA Structural Model Having acceptable measurement model indices fit, we further tested the TOE characteristics and EWA structural model as suggested in Figure 7-9. The model is comprised of the direct relationships among competitive pressure, compatibility and organisational e-resources with EWA. The model path also specifies three indirect paths between competitive pressure and EWA. The overall EWA structural model met the threshold requirements for evaluating the SEM model as suggested in the cut off levels (see, for example: Kline, 1998; McDonald and Ho, 2002). The structural model chi-square/df ratio (1.85), AGFI (0.936), and GFI (0.966) were above the threshold of 0.90 (Hair et al., 2006). The RMSEA (0.056) also is slightly higher than the suggested standard of 0.05.
We also examined the structural model estimates, which are indicated in Figure 7-9. The significant relationships are indicated with bolded lines in Figure 7-9. The SEM results indicate that EWA is significantly determined by competitive pressure (β = 0.243, p-value = 0.001) and organisational e-resources (β = 0.161, p-value = 0.024). Surprisingly, we found that compatibility has an insignificant impact on EWA (β = 0.052, p-value = 0.540). All the constructs influencing the EWA explain only 13.4 % of its variance. The model estimates presented in Figure 7-9 indicated that competitive pressure significantly determines compatibility (β = 0.369, p-value = 0.000). At the same time, organisational e-resources also significantly determines compatibility (β = 0.414, p-value = 0.000).

117
Figure 7-9 The TOE and EWA Structural Model (SEM)
The SEM examines also the direct as well as indirect effects on the model. Therefore, we also examined the direct and indirect effects among the TOE characteristics determining EWA (see Table 7-23). Based on the path diagram coefficients indicated in Figure 7-9 , we find that competitive pressure significantly influences EWA (direct effect β = 0.243 and indirect effect β = 0.078) as summarised in Table 7-23. The competitive pressure total effects on EWA in the model is 0.321 (β = 0.321). The AMOS computation of the indirect effects takes into consideration all possible path combinations between competitive pressure and EWA (Byrne, 2001).
Table 7-23 Standardized Model Effects Total Effects Direct Effects Indirect Effects
CP OR CTB CP OR CTB CP OR CTB OR 0.323 - - 0.323 - - - - - CTB 0.502 0.414 - 0.369 0.414 - .134 - - EWA 0.321 0.182 0.052 0.243 0.161 0.052 .078 .021 -
7.6.4.3 The TOE Indirect Effects and EWA - Hypotheses Summary Based on the analysis carried out in Section 7.6.4.2, we conclude that the relationship between competitive pressure and EWA is also indirectly mediated by organisational e-resources. As indicated in Figure 7-10, the significant path is denoted by the bolded lines marked S (significant).

118
Figure 7-10 The final TOE and EWA Integrated Model
It is surprising that compatibility was insignificant related to the EWA as indicated in Figure 7-10. This conclusion is against the supposition we made in Section 7.3.3, where compatibility was a significant determiner of EWA. This can be explained by taking into consideration the correlation analysis carried out in Table 7-21, whereby compatibility was correlated with organisational e-resources (r = 0.479, p-value = 0.01). Therefore, some of the compatibility characteristics may be explained by organisational e-resources.
Figure 7-10 summarises the TOE and EWA hypothesis conclusions. Our study confirms that competitive pressure have indirect effects on EWA mediated by organisational e-resources. Our study rejects that organisational characteristics have indirect positive effects on e-mail and web technologies adoption (H11). At the same time, our study accepts that environmental characteristics have indirect positive effects on EWA (H12). Our study findings are vital in ICT adoption among SMEs because it signifies the additional nature of indirect effects of competitive pressure on EWA. By examining the direct relationship only, we would have disregarded the significant indirect effects on EWA mediated by organisational e-resource.
7.6.4.4 The TOE and EWA– Direct Relationships As we indicated in the beginning, we used SEM to test for indirect effects between the TOE characteristics and EWA. However, the SEM can also be used to test the direct relationship between the TOE characteristics and EWA. Table 7-24 indicates the summary of the direct relationships tested. We find that an organisational e-resources and competitive pressure conclusions are similar to the multiple regression analysis conclusions. However, compatibility characteristics are not significantly related to EWA in the case of SEM. According to the SEM model, EWA is jointly determined by compatibility, organisational e-resources and competitive pressure. Table 7-21 indicates that competitive pressure is correlated with compatibility (r = 0.419, p-value = 0.01), and with organisational e-resources (r = 0.296, p-value = 0.01). We also found significant correlation between organisational e-resources and compatibility (r = 0.479, p-value = 0.01). Therefore, the compatibility joint relationship with EWA is explained or shared by organisational e-resources. Hence, the resulting effect is the reduction of compatibility effect on the adoption of EWA. Therefore, we believe that the correlation is the cause of compatibility insignificance to EWA (based on the direct relationship only). On the other hand, under the SEM model, we are checking the relationship using predicted values of compatibility and not the actual values. For the rest of the tested TOE characteristics, we found similar results between the multiple regression analysis and SEM.
S - Significant NS – Not Significant
NS
S
S
S
S
S EWA
Organisational E-resources
Compatibility
Competitive Pressure
Indirect Effect Path

119
Table 7-24 The TOE Characteristics and EWA- Direct Relationships TOE
Characteristics Hypotheses Independent variables EWA
Innovation Characteristics
H2a Compatibility Rejected
Organisational Characteristics
H6a Organisational E-resources Accepted
Environmental Characteristics
H8a Competitive Pressure Accepted
7.7 Overall Hypotheses Testing Summary Our study composed of 12 hypotheses as it was discussed in Chapter 3. In Table 7-25, we provide the general summary of all hypotheses tested in this study. As we stated earlier, multiple regression analysis was used to test the block of hypotheses in the first part of Chapter 7. We also examined the integrated TOE model using Multiple Regression as indicated in appendix V and VI. The conclusions are not very significant different from the approach we have adopted for EWA models. The EWU models resulted into different conclusions for some variables as indicated in appendix VI. Nevertheless, as stated in section 7.1, we considered multiple regression along the hypothesis blocks (characteristics clusters). We also used SEM to test the indirect effects of TOE characteristics on EWA.
Table 7-25 Summary of all Hypotheses Testing TOE
Characteristics Hypothesis
Code Independent
variable Dependent
Variable Hypothesis Conclusion Section
Innovation Characteristics
H1a Relative Advantage EWA Rejected
Section 7.3.5
H1b Relative Advantage EWU Partially Accepted H2a Compatibility EWA Accepted H2b Compatibility EWU Partially Accepted H3a Complexity EWA Rejected H3b Complexity EWU Partially Accepted H4a Social Influence EWA Rejected H4b Social Influence EWU Fully Rejected
Organisational Characteristics
H5a Organisational Location EWA Rejected
Section 7.4.5
H5b Organisational Location EWU Fully Rejected H6a Organisational E-resources EWA Accepted H6b Organisational E-resources EWU Fully Accepted H7a Top Management Support EWA Rejected H7b Top Management Support EWU Fully Accepted
Environmental Characteristics
H8a Competitive Pressure EWA Accepted
Section 7.5.5
H8b Competitive Pressure EWU Fully Accepted H9a-1 Technological Support EWA Rejected H9b-1 Technological Support EWU Partially Accepted H9a-2 Non-technological Support EWA Rejected H9b-2 Non-technological Support EWU Greatly Rejected H10a Institutional Intervention EWA Rejected H10b Institutional Intervention EWU Fully Rejected
TOE - Indirect Effects
H11 Organisational characteristics EWA Rejected Section 7.6.4.3 H12 Environment characteristics EWA Accepted

120

121
8. Discussion
In this chapter, we discuss the study findings addressing the research objectives stated in Chapter 1. As we recall from Chapter 1, one of the main objectives of this study was to investigate the key factors explaining the ICT adoption and usage among SMEs in the tourism sector in Tanzania. Therefore, in this chapter, we discuss the research findings detailed in Chapter 6 and 7 against our integrated theoretical framework developed in the first three chapters of this study. Chapter 8 is divided in five sections addressing the first five key research objectives namely: The specific objectives in this study include:
1. To determine the current SMEs and ICT status in the tourism sector in Tanzania (Section 8.1.2);
2. To determine the current levels of EWA and EWU in the tourism sector in Tanzania (Section 8.1.3);
3. To identify the main factors which determine the ICT adoption among SMEs in the tourism sector in Tanzania (Section 8.2, Section 8.3, and Section 8.4);
4. To determine the strength of each factor in explaining the reasons for ICT adoption and usage among SMEs in the tourism sector in Tanzania (Section 8.2, Section 8.3, and Section 8.4);
5. To identify the relationships (indirect effects) among factors determining EWA among SMEs in the tourism sector in Tanzania (Section 8.5).
The integrated theoretical framework used in this study is a hybrid of several theoretical foundations. We considered several criteria in developing the conceptual framework. The criteria guiding the conceptual framework included the SMEs characteristics, the nature of networked ICT adoption and usage, external factors influencing SMEs and developing country context. Therefore, the Diffusion of Innovation (DOI) theory provided the basis for the innovation characteristics (Rogers, 1995; Rogers, 2003). We adopted the Resource Based Theory to account for the explanation of organisational characteristics (Caldeira and Ward, 2003; Penrose, 1959). We also embraced the Network theory and Institutional Intervention theory to examine the role of external parties in explaining ICT adoption and usage among SMEs in Tanzania (see also: Abrahamson and Rosenkopf, 1997; King et al., 1994). Finally, we took on the Staged Adoption theory to explain the different stages included in ICT adoption and usage (see also: Damsgaard and Scheepers, 2000; Nolan, 1973). Therefore, the integrated TOE framework provided a rich picture in ICT adoption and usage among SMEs in the tourism sector in Tanzania.
We also discussed that the adoption and usage of ICT has gained special impetus due to the multi-level phenomena advocated in recent studies. For example, the adoption of e-commerce is not generally an adoption of a single innovation rather it is adoption of separate clusters of innovations (Al-Qirim, 2005; Daniel et al., 2002; Dholakia and Kshetri, 2004; Huizingh and Brand, 2009; Levy and Powell, 2003; Raymond, 2001; Zhu and Kraemer, 2005). Dholakia and Kshetri (2004) also suggested the future studies to examine organisational characteristics influencing various phases of ICT adoption. On the other hand, Rao et al.,(2003) propose ICT as evolving through online presence, portals, transaction integration and enterprise integration. Each stage of ICT adoption is characterised by additional operation costs, increased technological knowledge demands, and increased system complexities (Rao et al., 2003).
8.1 The Preliminary Discussion In this section, we address the research objectives that aimed at describing the status of the SMEs and ICT in the tourism sector in Tanzania (refer to Objective 1 to 3).

122
8.1.1 Examining the SMEs Definition in Tanzania In Chapter 2, we provided the national definition of SMEs in Tanzania. We pointed out that SMEs are defined on the basis of number of employees and capital investment. Based on the statistical evidence provided in Section 6.1.2.3, we found that the definition of SMEs in Tanzania is too wide for small enterprises as the gap between 5 and 49 employees may be misleading. A firm with five employees in the service sector such as travel agents is significantly different from a firm with 48 employees (see also: URT, 2003b). Consequently, the overall tourism sector seems to be dominated by micro-enterprises and small enterprises (see Section 6.1.2.3). Some of the previous studies define SMEs based on the differences in the number of employees or income ranges. Such definitions cannot be generalised at the country level (see, for example: Kamuzora, 2006a). Other institutions for example, the financial institutions, are developing their own criteria for defining SMEs. Therefore, we find it important to re-examine and harmonise the definition of SMEs in order to allow smooth generalisations of SMEs studies in Tanzania. The newly suggested definition should reflect the specific industry or sector. For example, the USA has chosen to set size standards for each individual North American Industry Classification System (NAICS) coded industry (EU, 2005). The NAICS variations categorise the SMEs sizes reflecting the actual industry differences (EU, 2005)
8.1.2 SMEs and ICT in Tanzania In the literature review, we found that the availability of up to date information about SMEs and ICT adoption has been a challenge in most of the studies conducted in developing countries (Molla and Licker, 2005a). Chowdhury (2006) also argue the absence of empirical evidence on the effects of investment in ICT among the SMEs in East Africa. Therefore, our study provides important empirical evidence on the status of the respondents, SMEs and ICT characteristics. The successful adoption of ICT among SMEs depends on, among other things, the availability of competent and vibrant personnel in the industry. Positive opinions of the key decision makers among the SMEs are important for the adoption of ICT (Lee and Runge, 2001). The SMEs sector in Tanzania stands a good chance to successfully adopt ICT because the majority of the key personnel responsible for decision-making are under 40 years old (see also: Morris and Venkatesh, 2000; Pijpers et al., 2001). However, the majority of the respondents have limited education levels (secondary school education or certificate levels education). The low levels of education of the entrepreneurs can be partly explained by the fact that being an entrepreneur in Tanzania is not the first option for highly educated individuals because they can secure employment in the public sector (Olomi, 2009). On the other hand, the private sector is still undergoing changes since the economic reforms started in the mid-1980s (Mtatifikolo, 1995; URT, 2003b). Therefore, it will take some time before an individual chooses to be an entrepreneur as a career option that is driven by the self-motivation of individuals rather than by income or employment push factors. In ICT research, it is assumed that education is positively related to ICT adoption (Pijpers et al., 2001; Zhu and He, 2000). We also found that most of the respondents have acquired ICT competences mainly through experience or attending short courses (refer Section 6.1.1.4). Again, the lack of ICT competences among SMEs owner-managers in Tanzania may be explained by the fact that the ICT education and infrastructure development dates back to 1993 when the ICT ban was lifted (Esselaar et al., 2001; Sheriff, 2007; URT, 2003a). Our study also suggests that ICT adoption became widespread in the 2000s when a large number of data and internet service providers (ISPs) were allowed to operate in the country (see for example: Sheriff, 2007; TCRA, 2007). We also find a significant increase in the number of internet users and penetrations during the 2000s (see also: UNCTAD, 2009).

123
The intensification of competitive business environments among developing countries is an on-going challenge for the business sector. Our findings also indicate that the Tanzanian business environment is relatively new in the economy (Mtatifikolo, 1995). The radical economic reforms or changes are influencing other infrastructural changes such as the development of the ICT sector and introduction of ICT courses in secondary schools up to university level (Mbamba, 2006). Therefore, it is not surprising to find that most of the SMEs interviewed have less than five years in business. Most of the SMEs started adopting e-mail and web technologies in the mid-2000s. Therefore, our study findings imply that the majority of SMEs stand in a better position to adopt ICT because they do not have a lot of experience in using other ICT systems (Goode and Stevens, 2000). The majority of the SMEs in the tourism sector are also characterised by the presence of business networks because more than 71.5% of the SMEs collaborate with large firms and local trade partners (refer to Section 6.1.2.7). The presence of business networks ensures the value of an ICT adoption as many users will be involved (Katz and Shapiro, 1986).
8.1.3 EWA Our study indicated that the majority of the SMEs in the tourism sector have lower levels of EWA in their businesses. This is in line with the general connotation that most of the SMEs do not adopt higher levels of ICT application in business such as e-business or e-commerce. For example, Levy and Powell (2003) argue that ICT adoption among SMEs largely depends on the perceived business value accrued as a result of adopting such technology. The authors argue that most of the SMEs that are at the lower stages (e-mail and websites presence) do not plan business growth and see the value of the internet as quite low. In most cases, the SMEs have adopted e-mail services, and to a certain extent they are experimenting with web development (Levy and Powell, 2003). Additionally, Stockdale and Standing (2004) examining the benefits and barriers of electronic marketing participation also observe the low level of ICT adoption among SMEs. Advanced ICT such as the electronic data interchange (EDI) is still not considered as something that enables SMEs to gain major strategic or competitive advantages (Chau and Hui, 2001). The study findings also confirm that some of the respondents indicated that the websites for their firms could receive online bookings or enquiries (see also Section 6.1.3.1). However, we found out that very few business transactions were carried out through the websites of the SMEs (online booking and payment) as discussed in Section 6.1.4. The ICT establishment experience indicates that most of the SMEs started using e-mail and web technologies in the mid-2000s. Our findings also indicate that the budget of the organisations allocated to ICT activities is still low. However, the majority of the SMEs have in-house internet access. This may be facilitated by the wireless connectivity offered competitively by cellular network companies which have reduced the need to have physical cables connecting buildings (TCRA, 2007; UNCTAD, 2009). The internet connectivity costs have decreased significantly due to an increase in competition (more registration of cellular network companies) and the availability of fibre connectivity (Mutula and Mostert, 2010; Schmid, 2009; Sheriff, 2007). SMEs still largely depend on the outsourced technical services, despite the fact that most of the employees can use ICT facilities in their organisations. The wide application of ICT in SMEs is attributed to increased telecommunication convergence (portability) and applications simplicity. E-mail and web technologies are becoming more user-friendly compared to the earlier software versions or advanced information systems used by large firms (Foong, 1999). However, the country has poor support for ICT services due to the inadequacy of institutions providing technical training. Goldstein and O'Connor (2000) support that the ICT adoption level in developing countries is mostly limited to e-mail services and website presence only (See Section 2.1.2).

124
In Chapter 4, we pointed out that the development of ICT in Tanzania was postponed for 19 years (1974-1993) due to the introduced importation ban on ICT equipment introduced by the government (Mbamba, 2002; Mgaya, 1990; URT, 2003a). Therefore, the uptake of ICT application in business is still low and dominated by the private sector (Sheriff, 2007). Our findings are also in line with Brown and Lockett (2004) who argue that there is a low engagement of SMEs in higher complexity e-business application, for example, EDI (see, also: Mendo and Fitzgerald, 2004). Additionally, Levy and Powell (2003) argue that there is little sign that SMEs see the internet as being a major future change agent. In general, the research on ICT adoption among SMEs reveals that e-business inventiveness has not progressed beyond the basic ICT applications, mainly the e-mail and web presences (see, for example: Brown and Lockett, 2004; Levy and Powell, 2003; Stockdale and Standing, 2004). SMEs also fear the risk of investing their scant resources in the perceived advanced ICT adoption levels (Al-Qirim, 2007).
8.1.4 EWU Apart from explaining the ICT adoption status, our study also examined the extent to which the e-mail and web technologies are used by SMEs in the tourism sector in Tanzania. Our study measured EWU along different ICT application levels. The findings indicated in Section 6.1.4 showed that the majority of the SMEs were using e-mail and basic web technology services. The activities that scored high in usage intensity include communication with customers, receiving orders from customers, updating customers on their orders, and communicating with suppliers. Surprisingly, our findings are not consistent with the adoption level claimed by respondents in Section 8.1.3. The respondents indicated that SMEs have adopted EWA higher levels (such as online presence and online trading) as presented in Section 6.1.3.1. However, the measure for actual usage intensity concludes lower utilisation of e-mail and web technologies (such as business communication). We cannot establish the reasons as to why SMEs are adopting higher ICT technologies than what they can actually use. In developed countries also, it is not surprising to find SMEs using lower levels of e-mail and web technologies. The study findings are in line with the UK government experience in facilitating ICT adoption among SMEs. The results indicated that the majority of SMEs that were assisted in adopting higher ICT levels ended up using lower e-mail and web technologies services (DTI, 2002; Mendo and Fitzgerald, 2005).
8.2 Innovation Characteristics and ICT Adoption In Chapter 1, we indicated that the adoption process by Rogers (2003) was best suited in addressing the key research questions in our study as we are dealing with ICT adoption among SMEs. Our study has a mixed conclusion on the effects of innovation characteristics on EWA and EWU as discussed in the succeeding sections.
8.2.1 Perceived Relative Advantage Characteristics The relative advantage characteristics are discussed along the EWA and EWU levels as detailed in the next sections.
8.2.1.1 Perceived Relative Advantage and EWA Based on the hypotheses summary conclusion presented in Section 7.3.5, we conclude that the relative advantage is not significantly related to EWA. Our conclusion is surprisingly unlike other findings such as Kendall et al. (2001) who found a significant relationship between e-commerce adoption in Indonesia (see also: Lee and Runge, 2001; Migiro and Ocholla, 2005; Migiro, 2006; Ramdani et al., 2009). The insignificant relationship between relative advantage and EWA in Tanzania may be explained by the fact that SMEs owner-managers have limited opportunities for understanding the perception of relative advantage for adopting higher ICT levels. As the findings indicated, SMEs officials have low education

125
levels and limited competence of ICT and hence may not be aware of the full potentialities of advanced ICT applications in business. Levy and Powell (2003) also found that SMEs in the lower levels (brochure ware) perceive little or no benefits of strategic internet use. We also believe that the perception of relative advantage on higher ICT adoption among the SMEs in the tourism sector in Tanzania could be attributed to the newness of the ICT application in Tanzania, as well as to the low levels of ICT infrastructure to support fully e-business in Tanzania (URT, 2003a). As long as the ICT application is a new phenomenon in Tanzania, it will take a considerable time before all the ICT benefits are known among the SMEs community. Currently, the majority of SMEs are experimenting with e-mail applications rather than thinking of adopting advanced ICT application in their business. Teo and Tan (1998) found that it was too early to estimate the benefits of e-commerce before it is widely accepted and implemented. Therefore, in this study we are addressing SMEs owner-managers who have adopted lower levels of e-mail and web technologies (see also: URT, 2003a).
8.2.1.2 Perceived Relative Advantage and EWU The empirical results from this study confirm the previous studies suggesting that perceived relative advantage is positively related to EWU. The analysis carried out in Section 7.3.4 concludes that the relative advantage is positively related to EWU. However, the significant effects are more visible on the lower levels of EWU namely: the business communication and online presence. Khemthong and Roberts (2006) also found that managers in the earlier adoption stages were more likely to perceive the benefits of web technologies compared to other managers in the later stages (see also: Premkumar and Roberts, 1999). Based on the discussion of usage level in Section 8.1.4, most of the SMEs are mainly using e-mail and website presence. Therefore, it is not surprising to find that the perceived relative advantage does not have a positive relationship with online trading. Most of the online trading activities in Tanzania are infrequently carried out due to the technological as well as infrastructural limitations. Lee (2004) found also relative advantage to be significant in lower levels of ICT application domains (electronic mail, business homepage and electronic sales). Additionally, Kaynak et al. (2005) found that the highest ranked usage of ICT application was connected with external communication and acquisition of information for the market and product research, which represent the lowest ICT adoption.
8.2.2 Compatibility characteristics The compatibility characteristics are discussed along the EWA and EWU levels as detailed in the next sections.
8.2.2.1 Compatibility and EWA We also found that compatibility strongly influences EWA among SMEs in tourism sector in Tanzania. As it was expected, we find that compatibility of innovation is positively related to EWA. The compatibility of innovation in this study refers to how using e-mail and web technologies fits well with the business and culture of the firm, existing information systems and existing distribution channels of the firms. Therefore, our study concludes that SMEs owner-managers or officials are concerned that EWA is consistent with the business needs as well as the e-mail and web technological needs (the conclusion is based on their perceptions). Nambisan and Wang (1999) also support that the adoption of ICT higher levels may require a closer incorporation of the compatible technology with the business context. Additionally, the ICT application is probably perceived more compatible in the tourism business compared to other industrial sectors in Tanzania. The tourism-targeted markets mainly are in the European countries. Previous tourism studies have indicated that the tourism sector has proven very

126
appropriate for ICT adoption and application in the industry chain due to the dependency on the supply and exchange of information throughout the production and distribution chains (Anckar and Walden, 2000). Therefore, the significance of the compatibility characteristics on adopting ICT among SMEs may be explained by the lack of proper communication infrastructure, for example, roads, railways, etc. We also believe that the convergence (compatibility) of mobile phone technologies and internet services have increased the availability of internet services through the mobile phones hence encouraging more SMEs to adopt. Our study findings are in line with Khemthong and Roberts (2006) who found that compatibility is a significant determiner of ICT adoption (see also: Kendall et al., 2001; Lee, 2004; Teo et al., 1997; Thong, 1999).
8.2.2.2 Compatibility and EWU We confirm that the compatibility characteristics are positively related to EWU among SMEs in the tourism sector in Tanzania. Specifically, the compatibility characteristics are significantly related to business communication and online trading. We believe that the online trading users perceive the strategic importance of e-mail and web technologies in their business. The e-mail application speeds up such communication while the websites provide a visual appeal of the tourism packages expected. Al-Qirim (2005) found out that compatibility was significantly influencing the adoption of e-commerce for the extended adopters. It is hard to explain why the compatibility characteristics are insignificantly related to online presence. However, one of the reasons may be attributed to the nature of activities involved in each EWU category. Based on the factor analysis carried out in Section 7.2.2.2, business communication involves the use of e-mail communication on tourism activities that are carried out daily such as communication with the customers, receiving orders from customers, updating customers on their orders, and communicating with suppliers. The same business activities are carried out using website technologies under online trading. Therefore, we suggest that the insignificance of compatibility characteristics related to online presence is attributed to the nature of the business activity frequency. Online presence activities do not need the daily utilization of ICT in business. Lee (2004) found compatibility characteristics being fully supported in internet application domains involving: electronic mail, business homepage, electronic sales, and electronic procurement. Surprisingly, Teo and Pian (2003) found that compatibility was insignificantly related to ICT adoption levels. However, such compatibility characteristics insignificance was attributed to the readily available ICT infrastructure in Singapore.
8.2.3 Complexity characteristics The complexity characteristics are discussed along the EWA and EWU levels as detailed in the next sections.
8.2.3.1 Complexity and EWA In our study, we surprisingly find that technological complexity is not a significant determiner of EWA. As detailed in Section 8.1.4, we found that most of the SMEs in Tanzania are using the basic e-mail and web technologies services. Previous ICT studies have indicated that most of the SMEs end up adopting lower levels of ICT (Levy and Powell, 2003; Stockdale and Standing, 2004). Therefore, probably most of the SMEs in Tanzania are not aware of the complexities associated with the adoption of advanced ICT because they have not been exposed to such technologies. In most cases, the SMEs would prefer to be the followers rather than leaders in adopting advanced ICT in their businesses (Kendall et al., 2001). The complexity characteristics of advanced EWA build greater insecurity for the successful adoption of the

127
technology and therefore increase the risk in the decision to adopt advanced ICT levels (Premkumar and Roberts, 1999).
Additionally, some of the studies have revealed the same complexity and ICT adoption conclusions. For example, Kendall et al. (2001) argue that the insignificancy of the complexity characteristics on ICT adoption may be attributed to the applicability of the questions used to test ICT adoption. In our study, we tested the questionnaire during the pilot study. We also translated the English version to Swahili language (see Chapter 5). Therefore, the respondents were familiar with the questions asked. During the data collection, we administered the interviews where respondents could ask additional explanations. In some of the previous ICT studies, the insignificancy of complexity with ICT adoption was attributed to a high level of computer literacy among the respondents (see for example Cheng et al., 2002a). In our case, the findings have indicated that our respondents are not highly qualified in ICT competences.
8.2.3.2 Complexity and EWU We found that some of the previous studies asserted that the complexity characteristics negatively influence the usage frequency of ICT. Our study confirms that such complexity characteristics significantly determine the usage intensity for business communication and online presence. This conclusion concedes with the general argument that most of the SMEs use lower levels of ICT adoptions (Brown and Lockett, 2004). Tornatzky and Klein (1982) in a meta-analysis also found that complexity was among the most significant variables influencing ICT adoption. Hence, we believe that SMEs in Tanzania are still actively involved in lower levels with limited knowledge of ICT as it was previously pointed out in this thesis. However, we were also surprised to find that the complexity characteristics were a non-significant predictor of EWA in the previous chapter. In the previous section, we argued that technology complexity could be attributed to the technology characteristics itself as most of the ICT software becomes more user-friendly (Foong, 1999). In this case, however, we find that the complexity characteristics are significant in the lower EWU. Therefore, we believe the argument suggesting that the majority of SMEs are not actively engaged in the advanced ICT activities. We also anticipate that the SMEs that have managed to use online trading have probably hired more qualified ICT professionals. The descriptive statistics in Chapter 6 indicate that 10.5% of the SMEs had computer managers responsible for ICT technical services support (Section 6.1.3.7). We also found that 4.1% of the respondents have higher ICT competences because they possess degrees in computer technology (Section 6.1.1.4).
8.2.4 Social Influence The social influence characteristics are discussed along the EWA and EWU levels as detailed in the next sections.
8.2.4.1 Social Influence and EWA Social influence on EWA is among the least studied phenomena in the ICT innovation studies. In our study, we found that social influence is insignificantly related to EWA. This means that our study does not provide enough evidence to show that social influence is positively related to EWA. We believed that the social values could influence EWA because Tanzania was under a socialist system since independent in 1961. The economic reforms, which occurred in the 1980s, lead the country into a relatively entrepreneurial economy system. The country at large is still influenced by social values embedded in some artefacts for example, mobile phones and computers are considered a symbol of being modern and global (see also: Donner, 2008). The SMEs status is also influenced by the perceived

128
social value of the technology innovation. Moore and Benbasat (1991) also suggest that the organisational image associated with the use of ICT is itself the determiner of adoption decisions. In our study, we believe that the insignificance of social influence to EWA is attributed to the nature of the tourism business involving multicultural values (western as well as local values).
8.2.4.2 Social Influence and EWU Our study also confirms the rejection of the assertion that the social influence determines the extent of EWU among SMEs in the tourism sector in Tanzania at all levels. As we indicated in our literature review, social status of the organisations can be rooted in the type of ICT technologies used in business (see for example: Tornatzky and Klein, 1982). Therefore, SMEs that use ICT frequently in their business are more sophisticated compared to the non-adopters. However, we believe that the insignificance of social influence on the EWU may be attributed to the nature of business and the diversified base of the customers. Therefore, the social perceptions in Tanzania cannot influence the usage much, but rather the perceived benefits accrued are the driving forces behind the usage frequency (see also:Lee, 2004).
8.3 Organisational Characteristics and ICT Adoption The literature provides a wide range of factors that influence SMEs decisions to adopt information technologies (for example: Jeyaraj et al., 2006). Additionally, Molla and Licker (2005b) have also examined the organisational characteristics that influence ICT adoption in developing countries. In this part of our study, we focused on three organisational characteristics namely: organisational location, organisational e-resources, and top management support.
8.3.1 Organisational Location The organisational location characteristics are discussed along the EWA and the EWU levels as detailed in the next sections.
8.3.1.1 Organisational Location and EWA An organisational location relative to the availability of physical and technological networks supporting the implementation of ICT is important for successful EWA. Most of the SMEs located in remote areas tend to be slow in the adoption of ICT due to a lack of the necessary facilities enabling internet connectivity (Nijkamp and Ommeren, 2004). Migiro and Ocholla (2005) also support that lack of access to network infrastructure is among the stumbling barriers to ICT adoption among SMEs in developing countries. Some of the previous studies have found that the geographical area, where the SMEs are located in relation to the availability of environmental resources, act as a barrier to the adoption of ICT (Arbore and Ordanini, 2006). Surprisingly, our study confirms that organisational location is not a significant determiner of EWA among SMEs in the tourism sector in Tanzania. Our study is consistent with Mack and Grubesic (2009) who found that changes in the broadband provision had no relationship with changes in the location of the firm. Additionally, Martin and Matlay (2001) also found that the ICT adoption in rural areas did not follow the staged adoption pattern. The insignificance of our findings can be attributed to the advancement of connectivity technology. Based on the Tanzanian context and technological revolution that has happened in the world, we can assert that SMEs located in remote rural areas nowadays stand a better chance in connecting to the internet through wireless connectivity (Sheriff, 2007). For example, Vodacom offers broadband connectivity and internet access services using various wireless technologies to the most tourist attractive areas. Wireless connectivity has reduced the lead-time required to set up a telecommunication infrastructure and the associated set-up costs (TCRA, 2007). The traditional internet

129
connectivity such as dial-up connections and Integrated Services Digital Network (ISDN) connections required cable connectivity (Arbore and Ordanini, 2006).
8.3.1.2 Organisational Location and EWU Our study findings confirm that the organisational location does not determine EWU at all levels. In the first case, we argued that the integration of mobile phones and ICT services has revolutionised communication in the developing countries. Therefore, all SMEs have a more or less equal opportunity to access the internet. On the other hand, we found that the communication frequency between the SMEs and the foreign customers are handled by SMEs head offices that are in most cases in big towns or cities or are outsourced to third parties. We also found in our study that 48.5% of the interviewed companies have outsourced their technical services to third companies (see Section 6.1.3.7). As we see in Tanzania, most of the tourism companies are located in the city centres while the majority of the tourist attractions, for example, wild animals and game reserves are located in the remote areas. The continuous communication and coordination efforts between the various SMEs involved in the tourism package are carried out using mobile phones. We again contemplate that the frequency of usage of these levels of e-mail and web technologies is not common as the process of updating and communicating through web technologies is often done at the main office or by a third company.
8.3.2 Organisational E-resources The organisational e-resources characteristics are discussed along the EWA and EWU levels as detailed in the next sections.
8.3.2.1 Organisational E-resources and EWA In our study, we confirm that organisational e-resources are a strong significant determiner of EWA in Tanzania. Organisational e-resources refer to ICT infrastructure existence, ICT expertise and skills, awareness of employees, financial resources and ICT experience. As it was previously discussed in Chapter 3, SMEs in developing countries lack access to financial and knowledge resources that would have helped the firms to take advantage of ICT opportunities (Brock, 2000). Therefore, we believe that SMEs with access to organisational e-resources are more likely to adopt ICT. The adoption of advanced levels of ICT requires the availability of not only technological facilities, but of also human skills necessary for the utilisation of the ICT in business (Gibbs and Kraemer, 2004a). Our study findings are in line with Molla and Licker (2005b) who found that the human, business and technological resources had major effects on the initial e-commerce adoption in South Africa. Kuan and Chau (2001) also found that the perceived organisational resources significantly discriminated ICT adaptors and non-adopters. Iacovou et al. (1995) also found that technological and financial resources are important for the adoption of ICT (see also: Lee, 2004). Doherty et al. (2003) argue that the motivation for the provision of higher ICT adoption (active websites) depends among other things on the capability of the hosting companies and the availability of infrastructure availability. Each stage of ICT adoption is characterised by additional operational costs, increased technological knowledge demands, and increased system complexities (Rao et al., 2003). The movement from one stage to another depends on how fast the SMEs can address the ICT adoption facilitators and barriers of each stage (Rao et al., 2003).
8.3.2.2 Organisational E-resources and EWU Our study also confirms that organisational e-resources are a significant determiner of EWU at all levels. Similarly, Anckar and Walden (2000) found the lack of financial resources and ICT knowledge hindered

130
the adoption and usage of ICT among the tourism SMEs. Raymond (2001) also argues that the organisational related factors influence the strategic assimilation of e-commerce among SMEs. The strategic assimilation of e-commerce is deemed as the highest level of e-commerce after the assimilation of informational and transactional levels. Additionally, Zhu and Kraemer (2005) found organisational resources, especially financial commitment to be more important in determining the e-business actual usage. Ramdani et al. (2009) found that SMEs were more influenced by technological and organisational factors than by the environmental factors in the ICT adoption. Finally, Thong (1999) in consistence with Attewell (1992), found that the extensive ICT usage among SMEs is strongly connected with employees’ ICT competences.
8.3.3 Top Management Support The top management support characteristics are discussed along the EWA and EWU levels as detailed in the next sections.
8.3.3.1 Top Management Support and EWA Top management is by far the most important factor that can contribute or inhibit to the success of technology innovation among SMEs. As previously stated, SMEs top management commitment and their support on ICT adoption emerges in the literature to be one of the crucial successful factors in ICT adoption (Martin and Matlay, 2001; Premkumar, 2003). Additionally, Molla and Licker (2005b) also found that senior management championship of e-commerce activities among other organisational characteristics significantly affects the maturity level of e-commerce adoption. Surprisingly, our study results conclude that the top management support is insignificantly related to the EWA. Again, we argued that the insignificance could be attributed to the factor that most of the top management officials are familiar with EWA.
8.3.3.2 Top Management Support and EWU As expected, our study validates the hypotheses that top management support is positively related to EWU in all levels. As we pointed our earlier, SMEs have a flat organisational structure that makes them to depend on the support and behaviour of the top management (Lee and Runge, 2001). Consequently, the top management commitment and support are important ingredients of any successful ICT adoption and usage as they play a key role in providing adequate financial and non-financial resources for the adoption process (supported by: Premkumar and Roberts, 1999; Thong, 1999). Owner-managers are the important people linking ICT and business among the SMEs. In most cases, they directly interact with their business counterparts, government stakeholders and customers.
8.4 Environmental Characteristics and ICT Adoption Based on the different analyses carried out in Chapter 7, we conclude that adopting higher levels of internet application among SMEs is partly influenced by environmental characteristics. In this part of our study, we focused on the four identified environmental characteristics namely: perceived competitive pressure, technological support, non-technological support and institutional intervention influence on EWA and EWU.
8.4.1 Competitive Pressure The competitive pressure characteristics are discussed along the EWA and EWU levels as detailed in the next sections.

131
8.4.1.1 Competitive Pressure and EWA Our study findings confirm that competitive pressure is a significant predictor of EWA among the SMEs. The increase in market competition intensity has a remarkable effect on the competitive behaviour of a firm. Firms are forced up to adopt new ways of doing business to remain competitive. As Porter and Millar (1985) argue, the adoption of ICT tends to alter the relative position of the adopting firm and changes the industry structure. SMEs are more sensitive to competitive pressure because they are not able to alter the forces of the market due to their small market segment. Most of the SMEs in the tourism sector in Tanzania are marketing the same tourism products. Therefore, the source of competitive power centres more on the model of service delivery, rather than designing new tourism products. Additionally, as detailed in Chapter 4, the Tanzanian government liberalised the economy and business environment since the mid-1980s (Mtatifikolo, 1995; URT, 2003b). Therefore, the tourism sector is among the most liberalised sectors due to its higher dependence on information flow and foreign markets (see also: Anckar and Walden, 2000)
8.4.1.2 Competitive Pressure and EWU Our study findings also confirm that competitive pressure is significantly related to EWU in all levels. As we argued earlier, competitive pressure tends to alter competitive power of the companies. Porter (2001) argues that ICT adoption and usage drastically changes the structure of the industry and the competitive power of an organisation. Proper usage of ICT technologies would essentially reduce operational costs that include communication costs to the customers. The qualities of the services are improved because of the reduced lead-time and the increased ability to respond to customers (Porter, 1985). The online presence (website presence) has also increased competition because the tourist products can be viewed before the customer makes a final choice. Therefore, we see that the EWU is vital for keeping up with competition at all levels. We believe that the stronger the competition the higher the likelihood of adopting and using ICT among SMEs (see also: Thong, 1999). Based on previous studies Molla and Licker (2005b) found marketing forces significantly influencing the institutionalisation of e-commerce. At the same time Zhu and Kraemer (2005) found that competitive pressure is important for determining e-business actual usage. Dholakia and Kshetri (2004) also found a significant relationship between competitive pressure and internet adoption and usage. Additionally, Gibbs and Kraemer (2004a) confirm the importance of external pressure in determining the scope of ICT use (e-commerce). Finally, Lee (2004) argued that the possibility of SMEs adopting ICT depends also on whether the managers find that adopting ICT adds a competitive advantage to the firm.
8.4.2 External Support The external support characteristics are discussed along the EWA and EWU levels as detailed in the next sections. The factor analysis carried out Section 7.5.1.2 suggested two components for external support. The suggested categories reflected technological support and non-technological support. Therefore, our discussion on external support centres on the new identified categories (technological support and non-technological support).
8.4.2.1 External Support and EWA In our study, we confirm that external support is insignificantly related to EWA for both external support categories. The external support for the EWA is viewed as an important source of the organisational e-resources for the SMEs. In Chapter 3, we indicated that most of the SMEs do not have access to either technical resources or non-technical resources (see, for example: Acar et al., 2005; Claessen, 2005; Garengo et al., 2005). Our study findings conclude that technological support is not significantly related

132
to EWA among SMEs in tourism sector in Tanzania. At the same time, we find that non-technological support is neither a significant determiner of EWA. We believe that the insignificance is attributed to low levels of ICT adoption and the lack of SMEs willingness to take risks associated with acquiring the competitive advantage or moving upward in the technological adoption hierarchy (see also: Lee, 2004). Ramdani et al. (2009) also argue that external support is insignificantly related to ICT adoption. As we discussed earlier, in Section 8.1.3 most of the SMEs interviewed have adopted basic e-mail and web technologies. Such technologies include the e-mail services and some level of website presence. SMEs adopt whatever fits their business operations rather than what the technology opportunities can offer (DTI, 2001). Therefore, we argue that the effects of external support to SMEs would be more needed on the adopted technologies rather than the new advanced technology. We also pointed out in Chapter 4 that the ICT infrastructure development is still hindering the advanced development of ICT application in business (URT, 2003a).
8.4.2.2 External Support and EWU Unlike EWA, we find a mixed conclusion for the relationship between external support and EWU. Technological support is a significant determiner of business communication and online trading only. Fink (1998) also found the ICT vendors and the knowledge of the consultants rated very important for the successful adoption and usage of ICT among SMEs. As we suggested in Section 8.2.1.2, business communication and online trading involve frequent interactions between the SMEs and the customers. While business communication relies on e-mail services on customer communications, the online trading relies on the integrated e-mail and web technologies. Therefore, we believe that the SMEs would be in need of such technological support on a daily basis. The study indicates that both the lower level adopters and advanced adopters would significantly require technological support. The same reason explains why non-technological support is insignificantly related to both business communication and online trading. Our study findings also confirm that non-technological support is significantly related to online presence only. We believe that online presence activities do not need technological support on a daily basis. Online presence activities include online search, company information presentation, and product catalogue presentation. Such non-technological support may not be required on a daily basis (Khemthong and Roberts, 2006). On the other hand, we find that technological support is insignificantly related to the online presence. One of the explanations is that the extents of online presence activities are not carried out on a daily basis. For example, the information on the SMEs website may be changed on a weekly or monthly basis. As we found out in Chapter 6, hired companies or personnel may carry out such technical activities.
8.4.3 Institutional Intervention The institutional intervention characteristics are discussed along the EWA and EWU levels as detailed in the next sections.
8.4.3.1 Institutional Intervention and EWA Institutional intervention in our study addressed issues related to the government offering grants and loans to support SMEs adoption of EWA. Other key services examined included the appropriateness of the current government regulations, knowledge building capacity, information infrastructure, and promotion of ICT adoption among SMEs in the tourism sector in Tanzania. Surprisingly, our study confirms that institutional intervention does not influence EWA.

133
The institutional intervention insignificance can be attributed to the fact that ICT adoption in Tanzania is still at its elementary levels. Therefore, the business potential of a complete adoption of ICT is unfamiliar to most of the SMEs officials. The descriptive statistics in Chapter 6 indicated that the majority of responded officials had limited ICT knowledge. Some of the SMEs are not even aware that the government has instituted a tax reduction on some of ICT imported items (URT, 2003a). On the ICT innovation and development, we found that the Tanzanian government is performing worse than the private sector in Tanzania (Esselaar et al., 2001; Matambalya and Wolf, 2001; SIDA and Greenberg, 2008). In fact, most of the communication with the government institutions is still based on paperwork, and the majority of business rules are still favouring the paper-based system. For example, during the tendering process the supplier must submit a tender document in a “stamped sealed envelope”. ICT development in Tanzania dates back to the mid-1990s when the computer ban was lifted (Mgaya, 1990; URT, 2003a). Therefore, no wonder that institutional intervention has not significantly influenced the EWA.
8.4.3.2 Institutional Intervention and EWU Based on our study conclusion, it may be inferred that institutional intervention is not significantly related to EWU at all levels. The study findings imply that SMEs in Tanzania do not perceive the importance of institutional intervention in any context. Furthermore, we examined the descriptive statistics of the institutional intervention question items. The respondent disagreed with the majority of the questions related to the possibilities of the government offering grants and loans for supporting ICT adoption. The respondents also disagreed that the government regulations related to ICT favoured the adoption of ICT. Other issues received negative response included the possibility of the government to provide knowledge or infrastructure building capacity among SMEs. As we indicated in Chapter 4, the government of Tanzania has just started using ICT services in the delivery of public services. Therefore, it is not surprising to see the private sector leading in the ICT initiatives thereby leaving the government to be a follower and inactive in driving ICT development among SMEs as it was the UK situation (DTI, 2001; Martin and Matlay, 2001). Unlike Thailand, Khemthong and Roberts (2006) argue that SMEs at earlier stages were significantly influenced by government support to use the internet and web technologies. Gibbs and Kraemer (2004a) argue that government policy is also likely to play a significant role in firm e-commerce use. The study findings indicated that the lack of a supportive regulatory environment for the proper functioning of ICT, lack of legal protection, lack of e-business supporting law and internet taxation barriers were significant factors for hindering the widening of e-commerce usage scope. The government incentive toward ICT adoption and usage for SMEs is considered to be important in developing countries. For example, Chen (2003) argue that the Taiwanese government was encouraging the local firms to embrace new information technologies in order to strengthen their competitive power against the well-developed multinational firms. Wong (2003) also signifies that the rapid ICT dissemination in Singapore is significantly driven by active and strong government policies. While government incentive is seen important in developing countries, ICT adoption and usage studies evidence the government support ineffectiveness in some of the developed countries (Sadowski et al., 2002). We equally found that the UK government was effectively involved in supporting ICT adoption and usage among SMEs through the Department of Trade and Industry (DTI, 2001; Martin and Matlay, 2001)

134
8.5 The TOE Characteristics Indirect Effects on EWA In the previous discussion, we focused on the direct effects of the Technology-Organisation-Environmental (TOE) factors affecting EWA (and EWU). In this section, we present the discussion on the indirect effects of the TOE characteristics on EWA. The TOE characteristics are discussed along EWA. The initial block of hypotheses referred to the organisational characteristics as a whole (H11) and environmental characteristics as a whole (H12). Our study findings are vital in ICT adoption among SMEs because it signifies the additional nature of indirect effects of competitive pressure on the EWA. By examining the direct relationship only, we would have disregarded the significant indirect effects on EWA mediated by organisational e-resources. Therefore, in order to enhance the understanding of EWA, one needs to address the joint effects of the competitive pressure and organisational e-resources.
8.5.1 Competitive Pressure Our study confirmed an indirect effect between competitive pressure and EWA facilitated by organisational e-resources. There is limited ICT adoption literature that has tested the TOE indirect relationship. However, Thong (1999) asserted that there was some evidence that competition may have indirect effects on information system adoption through the characteristics of an information system. Therefore, our study has empirically validated the previous claim. On the other hand, we confirm the significant first order and second order effects of competitive pressure on EWA (see also: Frambach and Schillewaert, 2002). We also find the presence of a competitive business environment being among the driving forces in the tourism sector. Information dissemination with the sector is fast because the tourists would easily shop around using ICT before making the final decision. Hence, any move taken by one firm to adopt ICT would easily be noticed or even copied by other SMEs. On the other hand, we believe that the competition is facilitated by the lack of much flexibility in creating new tourism products. SMEs are marketing and advertising the same products such as Mt Kilimanjaro, Serengeti Reserves, Ngorongoro Crater, etc. (Curry, 1990; URT, 2001; URT, 2004b; Wade et al., 2001). Therefore, the model of service delivery such as adoption of ICT would significantly differentiate SMEs from each other. Therefore, we argue that EWA will be enhanced if the SMEs will improve their internal organisational e-resources while at the same time ensuring a competitive business environment.
8.5.2 Organisational E-resources Our study confirms the indirect effect mediated by organisational e-resources from competitive pressure. The conclusion of the study signifies the importance of the organisational e-resources in adopting ICT for SMEs. Such resources include among other things: the need for competent human capital, financial capital and ICT supporting infrastructures. These are among the resources that are limited in most developing countries (Molla and Licker, 2005b). The adoption of ICT, for example, online payment, requires a conservable level of ICT knowledge, which is a barrier for many SMEs (Attewell, 1992). The SMEs in the tourism sector in Tanzania depend largely on their own networks as sources of EWA and EWU supporting services (see also: Chwelos et al., 2001). Our study indicated that 48.5% of SMEs depend largely on outsourced technical services (see Section 6.1.3.7). The assistance of an external party lowers the e-mail and web technologies knowledge barriers to the SMEs and hence speeds up adoption of e-mail and web technologies higher levels (Attewell, 1992).
8.5.3 Compatibility We cannot easily argue why compatibility was not a significant mediator of either competitive pressure or organisational e-resources in our study. We can see that compatibility is significantly correlated with organisational e-resources. Premkumar and Roberts (1999) also experienced that the overwhelming

135
influence of some of the variables on the adoption decision lessened the influence of other variables on the dependent variables.


137
9. Conclusions, Implications, Limitations and Future Research
9.1 Introduction This study aimed at providing a clear understanding of the factors influencing ICT adoption and usage among SMEs in the tourism sector in Tanzania. The ICT adoption and usage in Tanzania is quite a new undertaking that gained its momentum in the mid-2000s. Our study findings indicate that innovation, organisational, and environmental factors have contributed to determine the ICT adoption and usage in Tanzania. On the other hand, we found that the recent ICT uptake in the country is highly spearheaded by the private sector. In general, the study has provided the empirical explanations on SMEs and ICT adoption and usage status in Tanzania. The study findings have also provided new insight into the innovation adoption theories by examining not only the EWA levels, but also the extent of EWU. The study not only provides an alternative measure of EWA but also a new method of verifying the extent of ICT usage within the SMEs. Therefore, our study opens up new insights of thinking about diffusion of innovation in both the developed and developing countries. We discuss the study conclusions, implications, limitations and suggestions for future research in the next sections based on the study objectives stated in Chapter 1.
9.2 Conclusions Based on our study findings, we conclude that the simultaneous examination of individual theories and the integrated adoption theories have provided a good explanation for the ICT adoption and usage among SMEs in the tourism sector in Tanzania. The study findings are a significant contribution to both descriptive and hypotheses based objectives addressed in this study. The theoretical and empirical implications drawn from our study findings enrich the ICT adoption and usage studies, and provide foundations for the intervention programmes from the government and other interested stakeholders.
9.2.1 SMEs and ICT in Tanzania Based on the SMEs definition, our study findings conclude that the current SMEs definition used in Tanzania limits the generalisation of research results because the range of employees assigned to the small enterprise category is quite wide. There is a significant difference in the service sector in which enterprises have five employees and others have 49 employees. The personnel requirement for a travel agent firm is significantly less compared to a firm running a fleet of cars in the game safaris. Therefore, the generalisations of SMEs nomenclature based on the current system renders to conclude that the majority of SMEs in the tourism sector are small enterprises. The distinction between the service sector and manufacturing sector would provide more ideal SMEs ranges. The majority of SMEs officials are aged below 40 years with limited levels of education (secondary school education or certificate levels education). The lack of educational institutions providing ICT courses has rendered most of the SMEs officials to rely on short courses which are offered, and to learn from experience. The study findings indicate that the low ICT development in the education sector as well as the ICT supporting infrastructure may be attributed to the former government ban on the importation of ICT related accessories. The study also concludes that most of the interviewed SMEs were established in the late 1990s. Those SMEs started using e-mail and web technologies in the earlier 2000s. We find a close link between the beginning of using ICT and the increase of the cellular network companies. The study findings show that significant ICT developments have taken place in the recent years spearheaded by the private sector

138
especially the cellular network companies. The study findings also indicate significant changes in the government institutions as well as the legislative measures geared towards enhancing the application of ICT in business. The upcoming of fibre connectivity for the internet is further viewed as a revolutionary change that is speeding up the adoption of ICT as the price of internet connectivity is significantly going down.
9.2.2 The ICT Adoption level Our first research objective aimed at describing the current ICT adoption among SMEs in the tourism sector in Tanzania. There have not been substantial studies that have examined the adoption level of the SMEs in the tourism sector in Tanzania. Therefore, this study has examined the SMEs in the tourism sector. The study findings signify that SMEs in the tourism sector have adopted lower levels of e-mail and web technologies. The lower ICT levels involve the adoption of e-mail, static and interactive websites where the SMEs can receive online booking enquiries. The adoption of low levels of e-mail and web technologies in Tanzania could be explained by the already discussed historical, institutional, and ICT infrastructural problems. Additionally, our study assumed that the highest level of ICT adoption and usage among the SMEs should be desirable, which might be not the case in the eyes of the SMEs owners in the context of developing countries (e.g. Tanzania).
9.2.3 The extent of ICT usage In addressing the second research objective, our study also concludes that e-mail services are the most used ICT technologies among SMEs in tourism sector in Tanzania. Further analysis indicated that e-mail services are mostly used for communication with customers, receiving orders from customers, updating customers on their orders, and communicating with suppliers. Surprisingly, the findings indicated that there was limited communication between the SMEs and government institutions carried out through e-mail. As it was previously indicated, the Tanzanian government and its institutions are lagging behind the private sector in ICT adoption and usage. On the other hand, we conclude that the website technologies are rarely used in dealing with tourist activities. Such activities included receiving complaints from customers about the firm products and services offered, exchanging information with customers, receiving online orders and bookings from customers and making payments using on-line facilities. We equally find the same pattern in some of the studies carried out in developed countries, where websites are used mainly as online product catalogues.
9.2.4 Innovation Characteristics and ICT As stated in the fourth research objective, our study aimed at investigating the extent to which the innovation, organisational, and environmental factors determine the adoption and usage of ICT among SMEs in the tourism sector in Tanzania. The study provides varying conclusions depending on EWA or EWU aspects for each group of hypotheses suggested. Under innovation characteristics, we adopted perceived relative advantage, compatibility, complexity, and social influence attributes in our conceptual framework. The Diffusion of Innovation theory has provided a very good foundation for studying the diffusion and adoption of innovations. Our study concludes that compatibility significantly influences EWA. The rest of the innovation characteristics were insignificantly related to EWA. Therefore, the measure to enhance the adoption of EWA should be geared towards educating the owner-managers of the SMEs on: how the firm does business, how the existing information system fits with their business, and how the technology fits well with the management model of working. On the other hand, the study concludes that perceived relative advantage, complexity and social influence are not significantly related to EWA. The insignificance of

139
these characteristics may be attributed to lack of ICT supporting infrastructure (for example: online payment system). The study findings also indicate that most of the owner-managers have limited education levels, and the ICT adoption in the country is still at its elementary stage. The new ICT software used for e-mail and web technologies is user friendly hence reducing ICT complexities. Secondly, our study is greatly supporting the influence of innovation characteristics on EWU. Based on the study findings, we conclude a significant relationship between perceived relative advantage and EWU lower levels (business communication and online presence). We also conclude that the compatibility characteristics are significantly influencing business communication and online trading. Additionally, we conclude a significant relationship between complexity and EWU lower levels (business communication and online presence). It is not surprising to find that the innovation characteristics significantly influence the extent of EWU at lower levels because the study findings indicated that most of the SMEs have adopted low levels of ICT. However, our study findings do not support whether social influence has any significant effects on the EWU.
9.2.5 Organisational Characteristics and ICT Our study confirms that organisational e-resources are a significant determiner of not only EWA, but also EWU. Organisational e-resources such as financial resources, ICT infrastructure, and human capital play a significant role in determining both EWA and EWU among SMEs in the tourism sector in Tanzania. Our conclusions on the organisational e-resources on the one hand and EWA and EWU on the other hand are also supported by several previous studies. Therefore, in order to influence EWA and EWU, SMEs and other stakeholders need to act upon improving the availability of the organisational e-resources among SMEs in the tourism sector in Tanzania. The study results also conclude that top management support is insignificantly related to EWA. We argued that the insignificance could be attributed to the factor that most of the top management officials are familiar with EWA. We also confirm that top management support significantly determines EWU at all levels. ICT usage could probably be among the factors that differentiates strategic advantages of SMEs in the tourism sector. The majority of the SMEs are marketing the same tourist products as it was previous discussed. Therefore, in order to influence the extent of EWU, SMEs and other stakeholders need to act upon enhancing the effectiveness of top management support among SMEs in the tourism sector in Tanzania. The organisational location is insignificant in both EWA and EWU. We have attributed the insignificance to the widely used wireless network in Tanzania. On the other hand, the arrival of fibre optic connectivity has also increased the affordability of the internet connection irrespective of the geographical location. Therefore, the readily available wireless connection and fibre connectivity allows equal access between the city centres and the rural areas.
9.2.6 Environmental Characteristics and ICT The study findings also indicate that environmental characteristics play a significant role in determining EWA and EWU. Our study findings confirm that competitive pressure is a significant factor determining both EWA and EWU in all accounts. SMEs are strongly affected by stiff marketing competition because they cannot control or influence a market segment due to limited resources. Consequently, the SMEs key survival strategy to remain competitive in the business is to adopt ICT in their business. Therefore, we argue that in order to stimulate EWA and EWU, the government and other SMEs stakeholders should take initiatives that enhance fair competition among SMEs in the tourism sector. We also conclude that the external support and institutional intervention were not significant determinants of EWA.

140
On the other side, technological and non-technological support indicated to be significant determiners of some EWU levels. For example, technological support was a significant determiner of business communication and online trading. This is partly explained by the need for frequent technical support on these EWU levels. As it was presented in Chapter 6, the majority of the SMEs (48.5%) still depend on outsourced personnel for their ICT technical services (see Section 6.1.3.7). Therefore, in order to enhance the extent of business communication and online trading, SMEs stakeholders need to facilitate SMEs with technological support. Such technological support may come from ICT vendors, ICT consultants and training institutions, government ICT institutions, etc. Non-technological support influences online presence only. We argue that online presence involves mostly periodic online activities such as publishing online information about the SMEs or their products. Consequently, in order to stimulate the extent of online presence usage the SMEs stakeholders would need to offer more technological support to the SMEs. The study confirms that institutional intervention is insignificant to both EWA and EWU. We are surprised by the study findings because most of the developed and developing countries are significantly engaged in assisting their SMEs to adopt and utilise ICT in their businesses. We believe that the importation ban which took place between 1974 and 1993 contributed significantly to the delay of ICT capacity building on the part of the government. However, the government still has a potential part to play.
9.2.7 The TOE Characteristics Indirect Effects on EWA Most of the previous studies examined the direct effects of the acceptance of ICT. In our study, as indicated in the fifth research objective, we extended the same concept of examining the first order and second order effects of Technology-Organisation-Environmental (TOE) characteristics on EWA. Firstly, the study confirms the indirect effect between competitive pressure and EWA. The indirect relationship is mediated by the organisational e-resources. On the other hand, the organisational e-resources interaction with compatibility is not significantly related with EWA. The examination of first order and second order effects of TOE characteristics on EWA is rarely studied in ICT adoption among SMEs. Therefore, our study has verified how the environmental characteristics and organisational characteristics indirectly predict EWA. The findings have indicated that TOE is a powerful framework for analysing not only the direct effects of ICT adoption, but of also the indirect effects.
9.3 Implications of the Study As stated in Chapter 1, the sixth objective of this study was to draw theoretical and policy implications from the study findings. Our study has implications to various stakeholders involved in ICT and the tourism business in Tanzania as well as the research community. The theoretical implications have to do with the ICT adoption and innovation diffusion literature. We also provide the practical significance that connotes to the managerial and policy issues, which can be implemented by the government or other interested stakeholders.
9.3.1 Theoretical Implications This study has provided evidence that no single independent theory can fully explain EWA and EWU among SMEs in the developing countries. As we stated earlier, such adoption is influenced by the SMEs characteristics, the nature of networked ICT adoption, external factors influencing SMEs, context of developing countries and the need for multi-level measurement phenomena. In conclusion, this study is the first study in Tanzania that has comprehensively examined the explanation of the factors influencing EWA and EWU among SMEs in the tourism sector in Tanzania.

141
9.3.1.1 ICT Innovation Adoption Literature Along the ICT innovation adoption theory, the conclusions from this study contribute to the new emerging stream of research on adoption of ICT at multiple levels. The study examined the factors that influence the hierarchical adoption of ICT (EWA -levels). Additionally, we have examined the integrated indirect effects of TOE characteristics on EWA. Consequently, we argue to view ICT adoption as a series of individual innovation adoptions starting with elementary adoption levels (for example, e-mail) to more advanced ICT adoption levels (such as integrated e-commerce). This view is contrary to some of the previous studies that treated ICT adoption as a single innovation adoption by SMEs. The study also establishes the need to examine ICT usage along a specific SMEs adoption level because the traditional ICT adoption studies, especially in the developed countries, have treated all ICT levels as desirable. Therefore, the study suggests that business communication, online presence and online trading should be dealt with as a specific and independent SMEs adoption domain. In general, the research on ICT adoption among SMEs reveals that ICT has not been adapted to the fully integrated level. Therefore, this study has provided empirical evidence on the fact that some SMEs do not progress beyond the basic ICT applications. This may signify that not all SMEs would like to have all the ICT inventions adopted in their businesses. Therefore, we need a different look as far as ICT adoption and usage among SMEs in the tourism sector in Tanzania are concerned. In terms of empirical evidence contributions, this study has extended previous researches conducted in other countries. Contrary to the majority of the previous studies conclusions, this study has indicated that perceived relative advantage is not a determiner of EWA. Our study has empirically verified the existence of an indirect relationship among TOE characteristics in determining EWA. The examination of the indirect effects of the environmental and organisational characteristics on EWA has contributed the understanding of first order and second order effects of innovation adoption. On research methodological contributions, our sample characteristics can be used as a benchmark for the future studies because there is no sampling framework for SMEs in Tanzania. Our study findings also have increased TOE model robustness. The study also adopted a multi-data analysis strategy (i.e. using the correlation analysis, the multiple regression analysis, and structural equation modelling). The systematic results of the methods assure the reliability and validity of the study carried out in developing countries. On the other hand, this study has adopted a multi-levels measurement of ICT adoption and usage among SMEs by extending the commonly used binary measure of innovation adoption (Adopt/Not Adopt) into a multi-level measurement of ICT adoption levels and usage extent. Our study extends the EWA levels into email services, online presence, online booking enquiries, and online payments. We have also extended EWU into business communication, online presence, and online trading. The adoption of multi-levels also enabled us to distinguish between the reported levels of adoptions against used applications. The study has also verified that factors influencing the lower EWU are different from the factors influencing the advanced EWU.
9.3.2 Practical Implications The practical significance or implications refer to what extent the results can be used for managerial applications or institutional intervention. Therefore, we considered that our study findings are important not only to SMEs, but also to training institutions, ICT vendors and consultants and the government in Tanzania.

142
9.3.2.1 Implications for SMEs Our study has concluded that EWA is influenced by compatibility, organisational e-resources and competitive pressure. Therefore, in order to increase the EWA, there is a need to develop clear organisational strategies that are geared towards enhancing the effectiveness and availability of those significant factors. Such strategies may be provisioning of more business and ICT compatibility education for the SMEs. We also argue that SMEs owner-managers should allocate more resources to ICT investment to facilitate EWA. On the other hand, this study suggests to owner-managers the important factors influencing EWU. In addition to the compatibility education, owner-managers need to improve on their understanding of the perceived relative advantage of e-mail and web technologies in business. The owner-managers may also attend formal or informal training on e-mail and web technologies application to reduce the technological complications. Individual SMEs can take the strategies we have suggested above, or request the tourism associations to organise specific courses for them. In order to adopt ICT, SMEs owner-managers need to examine the compatibility, organisational e-resources as well as competitive pressure issues. The management has control over compatibility and the organisational e-resources characteristics, but not over competitive pressure and ICT infrastructural issues. This study has also provided the description of the ICT and SMEs status to the tourism sector in Tanzania. Therefore, individual SMEs may use the findings as a benchmark tool. The individual SMEs can also evaluate their ICT strategy because information on such items as capital allocation, budget allocation, and technical services assistance is provided in this study. On the other hand, SMEs may use our study findings to evaluate the risks of failing to adopt and use ICT as the study provides evidence on which variables are important for the successful adoption of ICT.
9.3.2.2 Implications for Training Institutions Based on the empirical conclusions, the factors influencing EWA and EWU include organisational e-resources, top management support, compatibility, complexity, perceived relative advantage, technological support and competitive pressure. We found that the TOE characteristics influence differently EWA and EWU among the SMEs. Therefore, we suggest that training institutions design tailor made projects that reflect the specific needs of the SMEs. As most of the SMEs do not have enough resources, educational institutions in collaboration with the government should establish training seminars, workshops and courses as the study has confirmed different needs among SMEs. There should be purposeful measures to assist the entrepreneurs in accessing ICT training in Tanzania. One of the approaches is to include ICT courses either in secondary schools or in vocational training institutions. We strongly recommend ICT education at such lower levels because the majority of the secondary school students do not make it to the university. It is important to link such ICT training with business skills training. We argue that organisational learning, skill development, and knowledge barriers are among the factors hindering the widespread diffusion of innovation and its adoption (for example, e-mail and web technologies). Therefore, proper training in ICT will lower ICT adoption and usage barriers and hence increase the likelihood of ICT adoption and usage. Hands-on training also could be facilitated through trade associations such as Tanzania Association of Tour Operators (TATO), Tanzania Society of Travel Agents (TASOTA), Intra-Africa Travel & Tourism Association (ITTA), Hotel Association of Tanzania (HAT), etc.

143
9.3.2.3 Implications for ICT Vendors and Consultants The study findings have indicated that SMEs owner-managers are individuals with limited education and ICT competence. Therefore, ICT vendors should address such distinctiveness when designing software for SMEs. The software should be less complicated and should enhance easy understanding and usage. We also suggest that the training and coaching offered by ICT vendors or consultants should reflect the local contents needs. Such initiative should include for example, expanding the Swahili version of open software and www.google.com. However, the use of English as a medium of communication did not seem to be a problem because most of the people dealing in the tourism business are familiar with English. Other practical significance includes the ability of the software vendors to design e-mail and web technologies that allow SMEs to choose between lower levels ICT application and higher levels ICT application. The levels of EWA and EWU could be used to design tailor made marketing strategies to the expected SMEs software buyers. Some of the SMEs officials have already passed the age of going back to school. We suggest that the incubation centres in academic institutions will foster the linkage between the academic institutions and the business sector.
9.3.2.4 Implications for the Government The study results also draw the attention of policy makers in developing countries, particularly in Tanzania, as the importance of EWA and EWU in business cannot be overemphasised. The low rate of e-mail and web technologies adoption among the SMEs could be enhanced by providing adoption incentives to the SMEs. Such incentives should be along the characteristics that have indicated significance in this study. The combination of the integrated effects may be the best approach to increasing EWA and EWU. Such adoption incentives could include financial support, technological support as well as educational support through tourist associations, financial institutions or SIDO. The government in Tanzania is currently exempting ICT equipment only. However, such assistance should be extended to internet connectivity costs reduction among the SMEs in the tourism sector in Tanzania. Information should be given to all SMEs to avoid the possibility of discouraging competition fairness among SMEs. Therefore, the best approach would be to provide guarantees for loans to the SMEs as most of them do not have collateral. Lack of e-readiness in terms of e-mail and web technologies awareness is inhibiting government support to the SMEs initiatives in adopting and using ICT in their businesses. This study also increases the awareness of government officials on ICT issues related to EWA and EWU in Tanzania. The government through the MNRT can set up a website for promoting ICT adoption, usage and its advantages. Such initiatives should also be coupled with e-mail and web technologies awareness campaigns. The government should design its adoption strategies focusing on the SMEs with positive adoption and usage characteristics. The government may facilitate the enhancement of innovation characteristics as well organisational characteristics by sponsoring a special training program through the MNRT that is gearing towards enabling SMEs owner-managers to be familiar with business as well as ICT knowledge. The ICT and business education can be subsidised at vocational training institutions. As we indicated in the study case settings, most of the educational institutions need to incorporate ICT courses. As there is a high-level of students ending in primary schools, the government should think of incorporating ICT education in primary schools. The government in collaboration with the educational institutions should establish tailor made ICT-business training seminars, workshops and courses as the study has confirmed different needs among SMEs.

144
The study has indicated significant application of ICT at lower levels. Therefore the government and other institutions should provide motivation for further application of the technology through lowering entrance costs and running costs. In Tanzania, the costs of ICT equipment are not significant as compared to the operational costs in terms of connectivity charges. Therefore, the government could provide subsidies to the companies providing internet connectivity. The current government ICT initiatives such as the fibre connectivity and the universal communication services access project should include the role of assisting the SMEs in the regions. The government should also direct or encourage financial institutions to provide e-banking services in Tanzania that is important for the adoption of integrated online trading among the SMEs in the tourism sector. The study has pinpointed out the differentiated drivers of ICT adoption at various levels. EWA and EWU have indicated in some extent how differently they are influenced by TOE variables. Therefore, policy makers need to differentiate their institutional intervention strategies. We strongly discourage the adoption of the same government incentive strategy to all SMEs in the country. One strategy fits all SMEs used by some of the governments to encourage SMEs to adopt the advanced e-business may not be applicable in Tanzania.
9.4 Limitations of the Study As with all empirical studies in developing countries, our study also has a few limitations. First, the study lacked a sampling framework, which necessitated us to adopt snow bowling sampling. This could be a source of biasness in our study. Therefore, the generalisation of the results of this study should be done with care. Additionally, the study was carried out in a developing country; hence, the generalizability of the study findings to developed countries may be limited due to contextual and technological differences. However, the same findings probably can be generalised to the other countries within the same region for example, Uganda, Kenya, Burundi and Rwanda (East Africa Community Countries) The measure of EWA and EWU was based on the self-reporting of respondents. Additionally, we interviewed only one informant per SME. It may be important to add more respondents per firm in the future. Future researchers also can use other measures such as assessing the actual SMEs website. The self-reported ICT adoption level may be cross-examined against the SMEs official websites. This study also examined SMEs in the tourism sector only. The tourism sector is an information intensive sector that can be best suited for the adoption and usage of ICT compared to other sectors such as the wood and furniture sectors.
9.5 Suggestions for Future Research As for future studies, we suggest further studies on the effects of mobile phone usage in internet access in developing countries such as Tanzania should be examined. Appendix IV indicates an overwhelming increase in mobile users using the mobile phones to access the internet. We also suggest future studies to replicate our TOE characteristics, EWA and EWU models in a different context apart from tourism sector. Future studies in EWA and EWU should include other variables in order to examine the TOE characteristics that were not tested for the indirect effects. The future study may also examine the reasons for differences in EWA and EWU. Our study has examined only the tourism sector. There is a need to carry out research in other sectors as well. The future studies could also compare the service sector and manufacturing sector in adoption of ICT and the extent of ICT usage.

145
Bibliography
Abrahamson, E., and Rosenkopf, L., (1997), Social network effects on the extent of innovation diffusion: A computer simulation: Organization Science, v. 8, no. 3, p. 289-309.
Acar, E., Kocak, I., Sey, Y., and Arditi, D., (2005), Use of information and communication technologies by small and medium-sized enterprises (SMEs) in building construction: Construction Management and Economics, v. 23, no. 7, p. 713-722.
Ajzen, I., (1991), The Theory of Planned Behavior: Organizational Behavior and Human Decision Processes, v. 50, no. 2, p. 179-211.
Al-Qirim, N., (2007), The adoption of eCommerce communications and applications technologies in small businesses in New Zealand: Electronic Commerce Research and Applications, v. 6, no. 4, p. 462-473.
Al-Qirim, N., (2005), An Empirical Investigation of an e-commerce Adoption-Capability Model in Small Businesses in New Zealand: Electronic Markets, v. 15, no. 4, p. 418-437.
Alam, S. S., (2009), Adoption of internet in Malaysian SMEs: Journal of Small Business and Enterprise Development, v. 16, no. 2, p. 240-255.
Alsalloum, O. I., (2006), Factors Affecting the Internet Adoption in Riyadh City: Journal of King Saud University.Administrative Sciences, v. 18, no. 1, p. 1-14.
Amani, (2010), Amani Touris, [Online], Available at: http://www.amani-tours.com/images/tanzania_map.jpg, Available at: 25/05/2010.
Anckar, B., and Walden, P., (2000), Becoming Your Own Travel Agent: A Web of Potentials and Pitfalls: Hawaii International Conference on System Sciences, v. 7, p. 1-10.
Aragon-Correa, J. A., Garcia-Morales, V. J., and Cordo-Pozo, E., (2007), Leadership and organizational learning's role on innovation and performance: Lessons from Spain: Industrial Marketing Management, v. 36, no. 3, p. 349-359.
Arbore, A., and Ordanini, A., (2006), Broadband Divide Among SMEs: The Role of Size, Location and Outsourcing Strategies: International Small Business Journal, v. 24, no. 1, p. 83-99.
Arendt, L., (2008), Barriers to ICT adoption in SMEs:how to bridge the digital divide?: Journal of Systems and Information Technology, v. 10, no. 2, p. 93-108.
Attewell, P., (1992), Technology Diffusion and Organizational Learning - the Case of Business Computing: Organization Science, v. 3, no. 1, p. 1-19.
Barney, J., (1991), Firm Resources and Sustained Competitive Advantage: Journal of Management, v. 17, no. 1, p. 99.

146
Barney, J. B., (2001), Resource-based theories of competitive advantage: A ten-year retrospective on the resource-based view: Journal of Management, v. 27, no. 6, p. 643.
Beckinsale, B., and Levy, M., (2007), SMEs and Internet Adoption Strategy: Who Do SMEs Listen to?: [Online], Available at: http://is2.lse.ac.uk/asp/aspecis/20040016.pdf, Accessed (13/02/2007).
Benbasat, I., Dexter, A. S., Drury, D. H., and Goldstein, R. C., (1984), A Critique of the Stage Hypothesis - Theory and Empirical-Evidence: Communications of the Acm, v. 27, no. 5, p. 476-485.
Benbasat, I., Goldstein, D. K., and Mead, M., (1987), The case research strategy in studies of information systems: Mis Quarterly, v. 11, no. 3, p. 369-386.
Bhagwat, R., and Sharma, M. K., (2007), Information system architecture: a framework for a cluster of small- and medium-sized enterprises (SMEs): Production Planning & Control: The Management of Operations, v. 18, no. 4, p. 283-296.
Bingi, P., Mir, A., and Khamalah, J., (2000), The challenges facing global e-eommerce: Information Systems Management, v. 17, no. 4, p. 26-35.
BIS, (2008), Enterprise Directorate: Small and Medium Enterprise Statistics for the UK and Regions: Department for Business, Innovation and Skills (BIS), United Kingdom.
Brand, M. J., and Huizingh, E. K. R. E., (2008), Into the drivers of innovation adoption: What is the impact of the current level of adoption?: European Journal of Innovation Management, v. 11, no. 1, p. 5-24.
Brock, J., (2000), Information and Communication Technology in the Small Firm, in S Carter and D Jonnes-Evans eds., Enterprise and Small Business: Principles, Practice and Policy: Harlow, Financial Times/Prentice Hall.
Brown, D. H., and Lockett, N., (2004), The Potential of Critical E-Applications for Engaging SMEs in E-business: A Provider Perspective: European Journal of Information Systems, v. 13, no. 1, p. 21-34.
Bruque, S., and Moyano, J., (2007), Organisational determinants of information technology adoption and implementation in SMEs: The case of family and cooperative firms: Technovation, v. 27, no. 5, p. 241-253.
Buhalis, D., and Deimezi, O., (2004), E-tourism developments in Greece: Information communication technologies adoption for the strategic management of the Greek tourism industry: Tourism and Hospitality Research, v. 5, no. 2, p. 103-130.
Bui, T. X., Le, T., and Jones, D., (2006), An exploratory case study of hotel e-marketing in Ho Chi Minh City: Thunderbird International Business Review, v. 48, no. 3, p. 369-388.
Burton-Jones, A., and Gallivan, M. J., (2007), Toward a deeper understanding of system usage in organizations: A multilevel perspective: Mis Quarterly, v. 31, no. 4, p. 657-679.
Byrne, B. M., (2001), Structural Equation Modeling with AMOS: Basic Concepts, Applications, and Programming New Jersey, Lawrence Erlbaum Associates.

147
Calcopietro, C. M., and Massawe D., (1999), Tanzania Small and Medium Scale Enterprise Policy Proposal: United Nations Industrial Development organisation (UNIDO), Available at: http://www.tzonline.org/pdf/smallandmediumscaleenterprises.pdf, Assessed on 12-05-2008.
Caldeira, M. M., and Ward, J. M., (2003), Using resource-based theory to interpret the successful adoption and use of information systems and technology in manufacturing small and medium-sized enterprises: European Journal of Information Systems, v. 12, no. 2, p. 127-141.
Calorielab, (2010), Calorielab, [Online], Available at: http://calorielab.com/news/wp-images/post-images/maasai-group-jumping.jpg, Accessed on 12-07-2010.
Carlson, J. R., and Zmud, R. W., (1999), Channel Expansion Theory and the Experiential Nature of Media Richness Perceptions: The Academy of Management Journal, v. 42, no. 2, p. 153-170.
Carmines, E. G., and Zeller, R. A., (1979), Reliability and Validity Assessment Beverly Hills - London, SAGE Publications.
CC-BY-SA, (2010), African Undersea Cables, [Online], Available at: http://manypossibilities.net/african-undersea-cables, Accessed on 13-06-2010.
Chachage, B. L., (2001), Internet Cafes in Tanzania: a study of the knowledge and skills of end-users: Information Development, v. 17, no. 4, p. 226-233.
Chaston, I., and Mangles, T., (2000), Business networks: assisting knowledge management and competence acquisition within UK manufacturing firms: Journal of Small Business and Enterprise Development, v. 7, no. 2, p. 160-170.
Chau, P. Y. K., and Tam, K. Y., (1997), Factors affecting the adoption of open systems: an exploratory study.: Mis Quarterly, v. 21, no. 1, p. 1-24.
Chau, P. Y. K., and Hui, K. L., (2001), Determinants of Small Business EDI Adoption: An Empirical Investigation: Journal of Organizational Computing and Electronic Commerce, v. 11, no. 4, p. 229-252.
Chen, T. J., (2003), E-Commerce to Protect the Network Relationships: The Case of Taiwan's PC Industry: The Information Society: An International Journal, v. 19, no. 1, p. 59-67.
Cheng, C. H., Cheung, W., and Chang, M. K., (2002a), The use of the Internet in Hong Kong: Manufacturing vs. service: International Journal of Production Economics, v. 75, no. 1, p. 33-45.
Cheung, W., Chang, M. K., and Lai, V. S., (2000), Prediction of Internet and World Wide Web usage at work: a test of an extended Triandis model: Decision Support Systems, v. 30, no. 1, p. 83-100.
Ching, H. L., and Ellis, P., (2004), Marketing in cyberspace: What factors drive e-commerce adoption?: Journal of Marketing Management, v. 20, no. 3/4, p. 409-429.
Chong, A. Y. L., Ooi, K. B., Lin, B., and Tang, S. Y., (2009), Influence of interorganizational relationships on SMEs' e-business adoption: Internet Research, v. 19, no. 3, p. 313-331.

148
Chowdhury, S. K., (2006), Investments in ICT-Capital and Economic Performance of Small and Medium Scale Enterprises in East Africa: Journal of International Development, Vol.18, pp.533-552, v. 18, no. 4, p. 533-552.
Churchill, G. C., (1995), Market Research: Methodological Foundations USA, The Dryden Press, Harcourt Brace College Publisher.
Chwelos, P., Benbasat, I., and Dexter, A. S., (2001), Research report: Empirical test of an EDI adoption model: Information Systems Research, v. 12, no. 3, p. 304-321.
Claessen, E., (2005), Strategic use of IC reporting in small and medium-sized IT companies: A progress report from a Nordic project: Journal of Intellectual Capital, v. 6, no. 4, p. 558-569.
Curry, S., (1990), Tourism Development in Tanzania: Annals of Tourism Research, v. 17, no. 1, p. 133-149.
Damanpour, F., (1992), Organizational Size and Innovation: Organization Studies, v. 13, no. 3, p. 375-402.
Damsgaard, J., and Lyytinen, K., (1996), Government strategies to promote the diffusion of electronic data interchange (EDI): what we know and what we don't know: Information Infrastructure and Policy, v. 5, no. 3, p. 169-190.
Damsgaard, J., and Scheepers, R., (1999), Power, influence and intranet implementation A safari of South African organizations: Information Technology & People, v. 12, no. 4, p. 333-358.
Damsgaard, J., and Scheepers, R., (2000), Managing the crises in intranet implementation: a stage model: Information Systems Journal, v. 10, no. 2, p. 131-149.
Dandridge, T. C., (1979), Children are not "Little grown-ups": Small business needs its own organizational theory: Journal of Small Business Management, v. 17, no. 2, p. 53-58.
Daniel, E., Wilson, H., and Myers, A., (2002), Adoption of E-Commerce by SMEs in the UK: Towards a Stage Model: International Small Business Journal, v. 20, no. 3, p. 253-270.
Davis, F. D., (1989), Perceived Usefulness, Perceived Ease of Use, and User Acceptance of Information Technology: Mis Quarterly, v. 13, no. 3, p. 319-340.
Davis, F. D., Bagozzi, R. P., and Warshaw, P. R., (1989), User Acceptance of Computer-Technology - A Comparison of 2 Theoretical-Models: Management Science, v. 35, no. 8, p. 982-1003.
Del Aguila-Obra, A. R., and Padilla-Melendez, A., (2006), Organizational factors affecting Internet technology adoption: Internet Research, v. 16, no. 1, p. 94-110.
Delone, W. H., and Mclean, E. R., (2004), Measuring e-commerce success: Applying the DeLone & McLean information systems success model: International Journal of Electronic Commerce, v. 9, no. 1, p. 31-47.
DeLone, W. H., and McLean, E. R., (1992), Information Systems Success: The Quest for the Dependent Variable: Information Systems Research, v. 3, no. 1, p. 60-95.

149
Devaraj, S., and Kohli, R., (2003), Performance impacts of information technology: Is actual usage the missing link?: Management Science, v. 49, no. 3, p. 273-289.
Dholakia, R. R., (2006), Gender and IT in the household: Evolving patterns of Internet use in the United States: Information Society, v. 22, no. 4, p. 231-240.
Dholakia, R. R., and Kshetri, N., (2004), Factors impacting the adoption of the Internet among SMEs: Small Business Economics, v. 23, no. 4, p. 311-322.
Doherty, N., Ellis-Chadwick, F., and Hart, C., (2003), An analysis of the factors affecting the adoption of the Internet in the UK retail sector: Journal of Business Research, v. 56, no. 11, p. 887-897.
Donner, J., (2008), Research approaches to mobile use in the developing world: A review of the literature: Information Society, v. 24, no. 3, p. 140-159.
DTI, (2001), International Bench Marking Survey for ICT Use: UK Department of Trade and Industry, London.
DTI, (2002), Business in the Information Age - International Benchmarking Study: Department of Trade and Industry (DTI), London.
Duncombe, R., and Heeks, R., (1999), Information, ICTs and Small Enterprise: Findings from Botswana: Institute for Development Policy and Management, [Online], Available at: http://www.man.ac.uk/idpm/idpm_dp.htm#devinf_wp, Accessed (22/2/2006).
Eid, R., and Trueman, M., (2004), Factors affecting the success of business-to-business international Internet marketing (B-to-B IIM): an empirical study of UK companies: Industrial Management & Data Systems, v. 104, no. 1-2, p. 16-30.
Esselaar, P., Hesselmark, O., James, T., and Miller, J., (2001), A Country ICT Survey for Tanzania: Final Report: Miller Esselaar and Associates for (SIDA), Stockholm, Sweden.
Ettlie, J. E., Bridges, W. P., and O'Keefe, R. D., (1984), Organization Strategy and Structural Differences for Radical Versus Incremental Innovation: Management Science, v. 30, no. 6, p. 682-695.
EU, (2005), SMEs Definition: Europen Commission Enterprise and Industry [Online], Available at: http://ec.europa.eu/enterprise/policies/sme/facts-figures-analysis/sme-definition/index_en.htm (Accessed 20-08/2009).
Exner, O., and Zvara, K., (1999), Coefficient of determination in some atypical situations: use in chemical correlation analysis: Journal of Physical Organic Chemistry, v. 12, no. 2, p. 151-156.
Fink, D., (1998), Guidelines for the Successful Adoption of Information Technology in Small and Medium Enterprises: International Journal of Information Management, v. 18, no. 4, p. 243-253.
Foong, S. Y., (1999), Effect of end-user personal and systems attributes on computer-based information system success in Malaysian SMEs: Journal of Small Business Management, v. 37, no. 3, p. 81-87.

150
Forman, C., Goldfarb, A., and Greenstein, S., (2005), How did location affect adoption of the commercial Internet? Global village vs. urban leadership: Journal of Urban Economics, v. 58, no. 3, p. 389-420.
Frambach, R. T., Barkema, H. G., Nooteboom, B., and Wedel, M., (1998), Adoption of a service innovation in the business market: An empirical test of supply-side variables: Journal of Business Research, v. 41, no. 2, p. 161-174.
Frambach, R. T., and Schillewaert, N., (2002), Organizational innovation adoption: a multi-level framework of determinants and opportunities for future research: Journal of Business Research, v. 55, no. 2, p. 163-176.
Garengo, P., Biazzo, S., and Bititci, U. S., (2005), Performance measurement systems in SMEs: A review for a research agenda: International Journal of Management Reviews, v. 7, no. 1, p. 25-47.
Gefen, D., and Straub, D. W., (1997), Gender differences in the perception and use of E-mail: An extension to the technology acceptance model: Mis Quarterly, v. 21, no. 4, p. 389-400.
Ghosh, S., (1998), Making business sense of the Internet: Harvard Business Review, v. 76, no. 2, p. 126.
Gibbs, J. L., and Kraemer, K. L., (2004a), A Cross-Country Investigation of the Determinants of Scope of E-commerce Use: An Institutional Approach: Electronic Markets, v. 14, no. 2, p. 124-137.
Goffin, K., and Mitchell, R., (2005), Innovation Management: Strategy and Implementation Using the Pentathlon Framework New York, Palgrave Macmillan.
Goldstein, A., and O'Connor, D., (2000), E-commerce for development: Prospects and policy issues: OECD development centre, Working paper no. 164.
Goode, S., and Stevens, K., (2000), An Analysis of the Business Characteristics of Adopters and Non-Adopters of WWW: Technology Information and Management, v. 1, no. 1, p. 129-154.
Goodman, L. A., (1961), Snowball Sampling: Annals of Mathematical Statistics, v. 32, p. 148-170.
Greenberg, A., (2008), Assessment of Comparative Advantages of Swedish ICT Support in Tanzania: [Online] Department for Africa (SIDA), Available at: http://www.sida.se/publications, Accessed on 21-07-2010.
Grover, V., and Teng, J. T. C., (1992), An examination of DBMS adoption and success in American organizations: Information & Management, v. 23, no. 5, p. 239-248.
Habarileo, (2010), Habari Leo, [Online], Available at: http://www.habarileo.co.tz/pics/05_09_p2atbv.jpg, Accessed on 15/08/2010.
Haines, V. Y., and Lafleur, G., (2008), Information technology usage and human resource roles and effectiveness: Human Resource Management, v. 47, no. 3, p. 525-540.
Hair, J. F., Black, W. C., Babin, B. J., Anderson, R. E., and Tatham, R. L., (2006), Multivariate Data Analysis Upper Saddle River, New Jersey, Prentice Hall.

151
Hamill, J., and Gregory, K., (1997), Internet Marketing in the Internationalisation of UK SMEs: Journal of Marketing Management, v. 13, no. 1-3, p. 9-28.
Hashim, N. H., Olaru, D., Scaglione, M., and Murphy, J., (2006), A Theoretical Framework of Factors Relating to Internet Adoption Stages by Malaysian Hotels, in H Martin, M Sigala, and J Murphy eds., Information and Communication Technologies in Tourism 2006: Vienna, Springer, p. 196-208.
Hashim, N. H., Murphy, J., Purchase, S., and O'Connor, P., (2010), Website and email adoption by Malaysian hotels: International Journal of Hospitality Management, v. 29, no. 1, p. 194-196.
Hauner, M., (2000), Dar es Salaam City Centre Map, [Online], Available at: http://african.lss.wisc.edu/swahili/swahili_4/maps/salaam/html/index1.htm, Accessed on 14/05/2010
Heckathorn, D. D., (2002), Respondent-Driven Sampling II: Deriving Valid Population Estimates from Chain-Referral Samples of Hidden Populations: Social Problems, v. 49, no. 1, p. 11-34.
Ho, R., (2006), Handbook of Univariate and Multivariate Data Analysis and Interpretation with SPSS Broken Sound Parkway, NW, Taylor & Francis Group.
Hoffman, K., Parejo, M., Bessant, J., and Perren, L., (1998), Small firms, R&D, technology and innovation in the UK: a literature review: Technovation, v. 18, no. 1, p. 39-55.
Huizingh, E. K. R. E., and Brand, M. J., (2009), Stepwise innovation adoption: a neglected concept in innovation research: International Journal of Technology Management, v. 45, no. 3-4, p. 267-281.
Iacovou, C. L., Benbasat, I., and Dexter, A. S., (1995), Electronic data interchange and small organizations: Adoption and impact of technology: Mis Quarterly, v. 19, no. 4, p. 465-485.
Ishengoma, E. K., (2005), Firm's Resources as Determinants of Manufacturing Efficiency in Tanzania: Managerial and Econometric Approach Hamburg, LIT Verlag.
Jeyaraj, A., Rottman, J. W., and Lacity, M. C., (2006), A review of the predictors, linkages, and biases in IT innovation adoption research: Journal of Information Technology, v. 21, no. 1, p. 1-23.
Jones, I., (1997), Mixing Qualitative and Quantitative Methods in Sports Fan Research: The Qualitative Report, v. 3, no. 4.
Kagan, A., Lau, K., and Nusgart, K. R., (1990), Information System Usage Within Small Business Firms: Entrepreneurship Theory and Practice, v. 14, no. 3, p. 25-37.
Kamuzora, F. K., (2006a), A Synthesis of Utilisation of Information and Communication Technologies in Tanzanian Tourism System: A Multimethodology Approach: School of Informatics, University of Bradford.
Kamuzora, F. K., (2006b), E-commerce for Development: eTourism as a Showcase Morogoro, Mzumbe Book Project.
Kaplan, B., and Duchon, D., (1988), Combining Qualitative and Quantitative Methods in Information-Systems Research - A Case-Study: Mis Quarterly, v. 12, no. 4, p. 571-586.

152
Karanasios, S., and Burgess, S., (2008), Tourism and Internet Adoption: a Developing World Perspective: International Journal of Tourism Research, v. 10, p. 169-182.
Katalambula, H. H., Nyichomba, B. B., Kimambo, C. Z., Mjema, E. A., and Mwamila, B. L., (2006), Country wide survey on the status and needs of small and medium enterprise (SMEs) in Tanzania and measures to address them: TGT and CoET, Tanzania.
Katz, M. L., and Shapiro, C., (1986), Technology Adoption in the Presence of Network Externalities: Journal of Political Economy, v. 94, no. 4, p. 822-841.
Kaynak, E., Tatoglu, E., and Kula, V., (2005), An analysis of the factors affecting the adoption of electronic commerce by SMEs: Evidence from an emerging market: International Marketing Review, v. 22, no. 6, p. 623-640.
Kendall, J. D., Tung, L. L., Chua, K. H., Hong, C., Ng, D., and Tan, S. M., (2001), Receptivity of Singapore's SMEs to electronic commerce adoption: Journal of Strategic Information Systems, v. 10, no. 3, p. 223-242.
Kenosha, W., (2010), Dar es Salaam City – Tanzania, [Online], Available at: http://tznboy.blogspot.com/2010/04/dar-es-salaa-tanzania.html, Acessed on 26/06/2010.
Khemthong, S., and Roberts, L. M., (2006), Adoption of Internet and Web Technology for Hotel. Marketing: A Study of Hotels in Thailand: Journal of Business Systems, Governance and Ethics, v. 1, no. 2, p. 47-66.
King, J., and Konsynski, B., (1990), Singapore TradeNet: A tale of one city: Harvard Business School, Case 9-191-009.
King, J. L., Gurbaxani, V., Kraemer, K. L., Mcfarlan, F. W., Raman, K. S., and Yap, C. S., (1994), Institutional Factors in Information Technology Innovation: Information Systems Research, v. 5, no. 2, p. 139-169.
King, W. R., and Teo, T. S. H., (1994), Facilitators and Inhibitors for the Strategic Use of Information Technology: Information & Management, v. 27, no. 2, p. 71-87.
Kline, R. B., (1998), Principles and Practise of Structural Equation Modeling New York, Guilford Press.
Kobe, K., (2007), The Small Business Share of GDP, 1998-2004: Small Business Administration, Office of Advocacy, No. 299, April, 2007.
Koenig-Lewis, N., Palmer, A., and Moll, A., (2010), Predicting young consumers' take up of mobile banking services: International Journal of Bank Marketing, v. 28, no. 5, p. 410-432.
Kshetri, N., (2007), Barriers to e-commerce and competitive business models in developing countries: A case study: Electronic Commerce Research and Applications, v. 6, no. 4, p. 443-452.
Kuan, K. K. Y., and Chau, P. Y. K., (2001), A perception-based model for EDI adoption in small businesses using a technology-organization-environment framework: Information & Management, v. 38, no. 8, p. 507-521.

153
Kuzilwa, J. A., (2005), The Role of Credit for Small Business Success: A study of the National Entrepreneurship Development Fund in Tanzania: The Journal of Entrepreneurship, v. 14, no. 2, p. 131-161.
Kvale, S., (1996), InterViews - An introduction to qualitative research interviewing. Thousand Oaks, CA: Sage.
Kweka, J., Morrissey, M., and Blake, A., (2003), The Economic Potential of Tourism in Tanzania: Journal of International Development, v. 15, p. 335-351.
Lai, V. S., (2008), The Information System Strategies of MNC Affiliates: A Technology-Organization-Environment Analysis: Journal of Global Information Management, v. 16, no. 3, p. 74-96.
Lamb, R., and Davidson, E., (2005), Understanding intranets in the context of end-user computing: The DATA BASE for Advances in Information Systems, v. 36, no. 1, p. 64-85.
Lange, R., Mcdade, S. R., and Oliva, T. A., (2004), The estimation of a cusp model to describe the adoption of word for windows: Journal of Product Innovation Management, v. 21, no. 1, p. 15-32.
Lee, J., (2004), Discriminant analysis of technology adoption behavior: A case of internet technologies in small businesses: Journal of Computer Information Systems, v. 44, no. 4, p. 57-66.
Lee, J., and Runge, J., (2001), Adoption of information technology in small business: Testing drivers of adoption for entrepreneurs: Journal of Computer Information Systems, v. 42, no. 1, p. 44-57.
Lee, M. K. O., and Cheung, C. M. K., (2004), Internet Retailing Adoption by Small-to-Medium Sized Enterprises (SMEs): A Multiple-Case Study: Information Systems Frontiers, v. 6, no. 4, p. 385-397.
Lee, S., and Kim, K. J., (2007), Factors affecting the implementation success of Internet-based information systems: Computers in Human Behavior, v. 23, no. 4, p. 1853-1880.
Lees, J. D., (1987), Successful development of small business information systems: Journal of Systems Management, v. 38, no. 9, p. 32-39.
Lema, E., (2007), NBC pumps over 1bn/- into SME training: Guardian [Online], Available at: http://216.69.164.44/ipp/guardian/2007/04/04/87726.html, Accessed: 06/04/2007.
Levy, M., and Powell, P., (2003), Exploring SME internet adoption: Towards a Contigent Model: Electronic Markets, v. 13, no. 2, p. 173-181.
Levy, M., Powell, P., and Worrell, W., (2005), Strategic intent and e-business in SMEs: enablers and inhibitors: Information Resources Management Journal, v. 18, no. 4, p. 1-21.
Levy, M., Powell, P., and Yetton, P., (2001), SMEs: aligning IS and the strategic context: Journal of Information Technology, v. 16, no. 3, p. 133-144.
Liao, J., Welsch, H., and Stoica, M., (2003), Organizational absorptive capacity and responsiveness: an empirical investigation of growth-oriented SMEs: Entrepreneurship: Theory and Practice, v. 28, no. 1, p. 63-85.

154
Lin, H. F., (2006), Impact of organizational support on organizational intention to facilitate knowledge sharing: Knowledge Management Research & Practice, v. 4, no. 1, p. 26-35.
Lu, J., Yu, C., and Liu, C., (2006), Gender and Age Differences in Individual Decisions about Wireless Mobile Data Services: A Report from China: Proceedings of Helsinki Mobility Roundtable .Sprouts: Working Papers on Information Systems, v. 6, no. 34.
Ma, J. X., Buhalis, D., and Song, H. Y., (2003), ICTs and Internet adoption in China's tourism industry: International Journal of Information Management, v. 23, no. 6, p. 451-467.
MacGregor, R. C., and Vrazalic, L., (2005), A basic model of electronic commerce adoption barriers: A study of regional small businesses in Sweden and Australia: Journal of Small Business and Enterprise Development, v. 12, no. 4, p. 510-527.
Mack, E. A., and Grubesic, T. H., (2009), Broadband Provision and Firm Location in Ohio: An Exploratory Spatial Analysis: Tijdschrift Voor Economische en Sociale Geografie, v. 100, no. 3, p. 298-315.
Macpherson, A., Jones, O., Zhang, M., and Wilson, A., (2003), Re-conceptualising learning spaces: developing capabilities in a high-tech small firm: Journal of Workplace Learning, v. 15, no. 6, p. 259-270.
Malhotra, N. K., (2004), Marketing Research: An applied Orientation New Jersey, Person Prentice Hall.
Malhotra, N. K., (2007), Marketing Research: An Applied Orientation New Jersey, Person Prentice Hall.
Margi, L., Philip, P., and Les, W., (2000), Strategic Intent and E-Business in SMEs: Enablers and Inhibitors: [Online], Available at: http://is2.lse.ac.uk/asp/aspecis/20040093.pdf (23/3/2006).
Markus, M. L., (1987), Toward A Critical Mass Theory of Interactive Media - Universal Access, Interdependence and Diffusion: Communication Research, v. 14, no. 5, p. 491-511.
Martin, L., (2005), Internet adoption and use in small firms: internal processes, organisational culture and the roles of the owner-manager and key staff: New Technology Work and Employment, v. 20, no. 3, p. 190-204.
Martin, L. M., and Matlay, H., (2001), "Blanket" approaches to promoting ICT in small firms: some lessons from the DTI ladder adoption model in the UK: Internet Research-Electronic Networking Applications and Policy, v. 11, no. 5, p. 399-410.
Matambalya, F., and Wolf, S., (2001), The Role of ICT for the Performance of SMEs in East Africa: Empirical Evidence from Kenya and Tanzania: Centre for Development Research, Discussion Papers No 42 on Development Policy, [Online], Available at: http://www.zef.de/download/zef_dp/Zef-dp42.pdf Accessed (12/3/2006).
Mbamba, U. O. L., (2002), Adoption of Information Technology by Tanzania Entrepreneurs in the service industries: A Business process re-engineering emphasis, in Matambalya F.S. and MJ Assad eds., Enhancing Africa's Competitiveness through Small and Medium Scale Enterprises: Tanzania, Mkuki na Nyota Publishers.

155
Mbamba, U. O. L., (2004), Electronic Commerce in the Tanzanian Context: Implications for Small and Medium Enterprises in Developing Countries, in ES Kaijage and LJ Mwaipopo eds., Entrepreneurship Research and Development in Africa: Achievements, Challenges and Future Prospects: Dar es Salaam, Mkuki na Nyota Publishers Ltd, p. 191-205.
Mbamba, U. O. L., (2006), Problems and Perspectives of Information Systems Management in Small and Medium Enterprises in Tanzania: Theoretical Foundations: PhD Thesis, School of Business and Economics, no. Umeå University.
McDonald, R. P., and Ho, M. H. R., (2002), Principles and practice in reporting structural equations analyses: Psychological Methods, v. 7, no. 1, p. 64-82.
Mehrtens, J., Cragg, P. B., and Mills, A. M., (2001), A model of Internet adoption by SMEs: Information & Management, v. 39, no. 3, p. 165-176.
Mendo, F. A., and Fitzgerald, G., (2004), An analysis of stages of growth models in SMEs e-business progression: European & Mediterranean Conference on Information Systems, 25-27 July 2004, Tunis, Tunisia.
Mendo, F. A., and Fitzgerald, G., (2005), A multidimensional framework for SME e-business progression: Journal of Enterprise Information Management, v. 18, no. 6, p. 678-696.
Mgaya, K., (1990), Development of information technology in Tanzania: [Online], Available at: http://www.unu.edu/unupress/unupbooks/uu19ie/uu19ie0i.htm, Accessed on 25/08/2007.
Microsoft, (2007), The right infrastructure for SMEs: [Online], Available at: http://www.microsoft.com/hk/sme/smerightit.mspx, Accessed on (13/02/2007).
MIGA, (2006), Attracting Investment in Tourism: Tanzania's Investor Outreach Program: World Bank Group: Multilateral Investment Guarantee Agency [Online], Available at: http://www.ipanet.net/investing_in_development/tanzania/tanzaniaweb.pdf, (Accessed 04/02/2007).
Migiro, S. O., and Ocholla, D. D., (2005), Information and Communication Technologies in Small and Medium Scale Tourism Enterprises in Durban, South Africa: Information Development, v. 21, no. 4, p. 283-294.
Migiro, S. O., (2006), Diffusion of ICTs and E-commerce adoption in manufacturing SMEs in Kenya: South African Journal of Library and Information Science, v. 72, no. 1, p. 35-44.
Mitchell, S., and Clark, D., (1999), Business Adoption of Information and Communications Technologies in the Two-tier Rural Economy: Some Evidence from the South Midlands: Journal of Rural Studies, v. 15, no. 4, p. 447-455.
Molla, A., and Heeks, R., (2007), Exploring e-commerce benefits for businesses in a developing country: Information Society, v. 23, no. 2, p. 95-108.
Molla, A., and Licker, P. S., (2004), Maturation Stage of e-Commerce in Developing Countries: A Survey of South African Companies: Information Technologies and International Development, v. 2, no. 1, p. 89-98.

156
Molla, A., and Licker, P. S., (2005a), eCommerce adoption in developing countries: a model and instrument: Information & Management, v. 42, no. 6, p. 877-899.
Molla, A., and Licker, P. S., (2005b), Perceived e-readiness factors in e-commerce adoption: An empirical investigation in a developing country: International Journal of Electronic Commerce, v. 10, no. 1, p. 83-110.
Molony, T., (2006), 'I Don't Trust the Phone; It Always Lies': Trust and Information and Communication Technologies in Tanzanian Micro- and Small Enterprises: Information Technologies and International Development, v. 3, no. 4, p. 67-83.
Moore, G. C., and Benbasat, I., (1991), Development of an instrument to measure the perceptions of adopting an information technology innovation: Information Systems Research, v. 2, no. 3, p. 192-222.
Morgan, D. L., (1998), Practical strategies for combining qualitative and quantitative methods: Applications to health research: Qualitative Health Research, v. 8, no. 3, p. 362-376.
Morris, M. G., and Venkatesh, V., (2000), Age differences in technology adoption decisions: Implications for a changing work force: Personnel Psychology, v. 53, no. 2, p. 375-403.
Mtatifikolo, F. P., (1995), Public and Private Enterprises and the Reform Programme in Tanzania: Journal of Eastern African Research & Development, v. 25, no. 1, p. 171-187.
Mutula, S. M., and Mostert, J., (2010), Challenges and opportunities of e-government in South Africa: Electronic Library, v. 28, no. 1, p. 38-53.
Myers, M. D., (1997), Qualitative research in information systems: Mis Quarterly, v. 21, no. 2, p. 241-242.
Nambisan, Y. M., and Wang, Y. M., (1999), Technical opinion: Roadblocks to Web technology adoption?: Communications of the Acm, v. 42, no. 1, p. 98-101.
Nasco, S. A., Toledo, E. G., and Mykytyn, P. P., (2008), Predicting electronic commerce adoption in Chilean SMEs: Journal of Business Research, v. 61, no. 6, p. 697-705.
Ngai, E. W. T., Poon, J. K. L., and Chan, Y. H. C., (2007), Empirical examination of the adoption of WebCT using TAM: Computers & Education, v. 48, no. 2, p. 250-267.
Nguyen, T. T. M., (2009), Information technology adoption in SMEs: an integrated framework: International Journal of Entrepreneurial Behaviour & Research, v. 15, no. 2, p. 162-186.
Nijkamp, P., and Ommeren, J., (2004), Drivers of entrepreneurial location as an innovative act: International Journal of Entrepreneurship and Innovation Management, v. 6, no. 3, p. 256-264.
Nolan, R. L., (1973), Managing the computer resource: a stage hypothesis: Communications of the Acm, v. 16, no. 7, p. 399-405.
Olomi, D., (2006), Policy Dialogue Seminar Paper on Opportunities and Challenges For Rural SMEs Development In Tanzania: Economic and Social Research Foundation (ESRF), Available at:

157
http://www.tzonline.org/pdf/policydialogueseminarpaperonopportunitiesandchallenges.pdf, Accessed on 13-12-2008.
Olomi, D. R., (2009), African Entrepreneurship and Small Business Development. Dar es Salaam, OTME company Limited.
Olympus, (2010), A Top Expedition to Kilimanjaro, [Online], Available at: http://www.olympus.co.jp/en/gww/kilimanjaro/making/images/map_03.jpg, Accessed on: 12/04/2010
Palmer, J. W., (2002), Web Site Usability, Design, and Performance Metrics: Information Systems Research, v. 13, no. 2, p. 151-167.
Parker, C. M., and Castleman, T., (2007), New directions for research on SME e-Business: insights from an analysis of journal articles from 2003 to 2006: Journal of Information Systems and Small Business, v. 1 , no. 1-2, p. 21-40.
Parker, C. M., and Castleman, T., (2009), Small firm e-business adoption: a critical analysis of theory: Journal of Enterprise Information Management, v. 22, no. 1/2, p. 167-182.
Penrose, E., (1959), Theory of the Growth of the Firm New York, Oxford University Press, Inc.
Petter, S., DeLone, W., and McLean, E., (2008), Measuring information systems success: models, dimensions, measures, and interrelationships: European Journal of Information Systems, v. 17, no. 3, p. 236-263.
Pflughoeft, K. A., Ramamurthy, K., Soofi, E. S., Yasai-Ardekani, M., and Zahedi, F. M., (2003), Multiple conceptualizations of small business web use and benefit: Decision Sciences, v. 34, no. 3, p. 467-512.
Pijpers, G. G. M., Bemelmans, T. M. A., Heemstra, F. J., and van Montfort, K. A. G. M., (2001), Senior executives' use of information technology: Information and Software Technology, v. 43, no. 15, p. 959-971.
Poon, S., and Swatman, P. M. C., (1997), Small business use of the Internet: Findings from Australian case studies: International Marketing Review, v. 14, no. 5, p. 385-402.
Porter, M. E., (1985), Technology and competitive advantage: Journal of Business Strategy, v. 5, no. 3, p. 60-78.
Porter, M. E., (2001), Strategy and the Internet: Harvard Business Review, v. 79, no. 3, p. 62-78.
Porter, M. E., and Millar, V. E., (1985), How Information Gives You Competitive Advantage: Harvard Business Review, v. 63, no. 4, p. 149-160.
Premkumar, G., (2003), A Meta-Analysis of Research on Information Technology Implementation in Small Business: Journal of Organizational Computing & Electronic Commerce, v. 13, no. 2, p. 91-121.
Premkumar, G., and King, W. R., (1994), Organizational Characteristics and Information-Systems Planning - An Empirical-Study: Information Systems Research, v. 5, no. 2, p. 75-109.

158
Premkumar, G., and Roberts, M., (1999), Adoption of new information technologies in rural small businesses: Omega-International Journal of Management Science, v. 27, no. 4, p. 467-484.
Quaddus, M., and Hofmeyer, G., (2007), An investigation into the factors influencing the adoption of B2B trading exchanges in small businesses: European Journal of Information Systems, v. 16, no. 3, p. 202-215.
Ramdani, B., Kawalek, P., and Lorenzo, O., (2009), Predicting SMEs' Adoption of Enterprise Systems: Journal of Enterprise Information Management, v. 22, no. 1/2, p. 10-24.
Ramsey, E., Ibbotson, P., Bell, and Gray, B., (2003), E-opportunities of Service Sector SMEs: an Irish cross-boarder study: Journal of Small Business and Enterprise Development, v. 10, no. 3, p. 250-264.
Rao, S. S., Metts, G., and Monge, C. A. M., (2003), Electronic commerce development in small and medium sized enterprises: A stage model and its implications": Business Process Management, v. 1, no. 1, p. 11-13.
Raykov, T., Tomer, A., and Nesselroade, J. R., (1991), Reporting structural equation modeling results in Psychology and Aging: Some proposed guidelines: Psychology and Aging, v. 6, no. 4, p. 499-503.
Raymond, L., (2001), Determinants of Web site implementation in small businesses: Internet Research-Electronic Networking Applications and Policy, v. 11, no. 5, p. 411-422.
Raymond, L., Bergeron, F., and Blili, S., (2005), The Assimilation of E-business in Manufacturing SMEs: Determinants and Effects on Growth and Internationalization: Electronic Markets, v. 15, no. 2, p. 106-118.
Rodriguez-Ardura, I., and Meseguer-Artola, A., (2010), Toward a Longitudinal Model of e-Commerce: Environmental, Technological, and Organizational Drivers of B2C Adoption: The Information Society: An International Journal, v. 26, no. 3, p. 209-227.
Rogers, E. M., (1962), The Diffusion of Innovations New York, Free Press.
Rogers, E. M., (1995), Diffusion of Innovations New York, Free Press.
Rogers, E. M., (2003), Diffusion of Innovations New York, Free Press.
Rogers, M., (2004), Networks, firm size and innovation: Small Business Economics, v. 22, no. 2, p. 141-153.
Rothwell, R., and Zegveld, W., (1982), Their Role in Employment and in Economic Change London, Frances Printer.
Rusten, G., and Cornford, J., (2003), Web-site strategies and performance in SMEs: performance indicators and regional challenges: Reinventing Regions in the Global Economy Academic Conference Programme [Online], Available at: http://www.regional-studies-assoc.ac.uk/events/pisa03/rusten-cornford.pdf, Accessed 16/8/2007.

159
Sadowski, B. M., Maitland, C., and van Dongen, J., (2002), Strategic use of the Internet by small- and medium-sized companies: an exploratory study: Information Economics and Policy, v. 14, no. 1, p. 75-93.
Sahadev, S., and Islam, N., (2005), Why hotels adopt ICTs: a study on the ICT adoption propensity of hotels in Thailand: International Journal of Contemporary Hospitality Management, v. 17, no. 5, p. 391-401.
Schmid, L., (2009), Africa Harnessing a Broadband Boom: The Journal of E-Government Policy and Regulation, v. 32, no. 4, p. 219-227.
Schreiber, J. B., Nora, A., Stage, F. K., Barlow, E. A., and King, J., (2006), Reporting Structural Equation Modeling and Confirmatory Factor Analysis Results: A Review: Journal of Educational Research, v. 99, no. 6, p. 323-337.
Scupola, A., (2003), The Adoption of Internet Commerce by SMEs in the South of Italy: An Environmental, Technological and Organizational Perspective: Journal of Global Information Technology Management, v. 6, no. 1, p. 52-71.
Sheriff, S., (2007), Rural connectivity in Tanzania: options and challenges in 2007: The International Institute for Communication and Development (IICD), [Online], Available at: http://www.iicd.org/files/Rural-Connectivity-Tz-2007-Suhail-Sheriff.pdf, Accessed (12/01/2008).
Shiels, H., McIvor, R., and O'Reilly, D., (2003), Understanding implications of ICT adoption: insights from SMEs: Logistics Information Management, v. 16, no. 5, p. 312-326.
Shilla, H. M., (1994), Informatics Policies Studies in Africa: Tanzania: Pan Africa Development Information Systems (PAD) [Online], Available at: http://www.africa.upenn.edu/ECA/tanzan.html (Accessed 12/08/2007).
SIDA, and Greenberg, A., (2008), Assessment of Comparative Advantages of Swedish ICT Support in Tanzania: [Online] Department for Africa (SIDA), Available at: http://www.sida.se/publications, Assessed at: 21-07-2010.
Sohn, C., and Wang, T. W., (1999), Diffusion factors and adoption levels of the Internet market: empirical analysis for the computer retailing companies: Proceedings of 1999 AMCIS Conference, Milwaukee, WI, August 13-15.
Sophonthummapharn, K., (2009), The adoption of techno-relationship innovations: A framework for electronic customer relationship management: Marketing Intelligence & Planning, v. 27, no. 3, p. 380-412.
Southern, A., and Tilley, F., (2000), Small firms and information and communication technologies (ICTs): toward a typology of ICTs usage: New Technology Work and Employment, v. 15, no. 2, p. 138-154.
Stockdale, R., and Standing, C., (2004), Benefits and barriers of electronic marketplace participation: Journal of Enterprise Information Management, v. 17, no. 4, p. 301-311.
Stone, M., (2003), SME e-business and supplier-customer relations: Journal of Small Business and Enterprise Development, v. 10, no. 3, p. 345-353.

160
Storey, D. J., (1994), Understanding Small Firms London, Routledge.
Straub, D. W., David, G., and Marie-Claude, B., (2005), Quantitative Research, in D Avison and J Pries-Heje eds., Research in Information Systems: A Handbook for Research Supervisors and Their Students: Amsterdam, Elsevier, p. 221-238.
Tagliavini, M., Ravarini, A., and Antonelli, A., (2001), An Evaluation Model for Electronic Commerce Activities within SMEs: Information Technology and Management, v. 2, p. 211-230.
TALA, (2008), The List of Licensed Tourist Agents 2008: Ministry of Natural Resources and Tourism (URT) [Online], Available at: http://www.mnrt.go.tz Accessed (20/12/2008).
Tanaka, J., (1993), Multifaceted Conceptions of Fit in Structural Equation Models, in KA Bollen and JS Long eds., Testing Structural Equations Models: Newbury Park, CA, Sage.
TCRA, (2007), Tanzania Communications Regulatory Authority (TCRA): [Online], Available at: http://www.tcra.go.tz/index.php, Accessed (23/06/2007).
TCT, (2007), Tanzania Travel and Tourism Directory including Zanzibar and Pemba Stone Town Zanzibar, ZG Design.
TCT, (2010), Tanzania Travel and Tourism Directory including Zanzibar and Pemba: Tanzania Confederation of Tourism Publication, v. Stone Town Zanzibar, no. ZG Design.
Teo, T. L., Chan, C., and Parker, C. M., (2004), Factors affecting e-commerce adoption by SMEs: a meta-analysis: 15th Australasian Conference on Information Systems, 1-3 December, p. Hobart, Australia.
Teo, T. S. H., and Pian, Y., (2004), A model for Web adoption: Information & Management, v. 41, no. 4, p. 457-468.
Teo, T. S. H., and Pian, Y. J., (2003), A contingency perspective on Internet adoption and competitive advantage: European Journal of Information Systems, v. 12, no. 2, p. 78-92.
Teo, T. S. H., and Tan, M., (1998), An empirical study of adopters and non-adopters of the Internet in Singapore: Information & Management, v. 34, no. 6, p. 339-345.
Teo, T. S. H., Tan, M., and Buk, W. K., (1997), A contingency model of Internet adoption in Singapore: International Journal of Electronic Commerce, v. 2, no. 2, p. 95-118.
Thompson, K. D., (2004) Maelezo ya Utamaduni, [Online], Available at: http://african.lss.wisc.edu/utamaduni/culturalrefs.htm, Accessed on 15/09/2010.
Thong, J. Y. L., (1999), An integrated model of information systems adoption in small businesses: Journal of Management Information Systems, v. 15, no. 4, p. 187-214.
Thong, J. Y. L., Yap, C. M., and Raman, K. S., (1994), Engagement of external expertise in information systems implementation: Journal of Management Information Systems, v. 11, no. 2, p. 209-231.

161
Thong, J. Y. L., and Yap, C. S., (1995), CEO Characteristics, Organizational Characteristics and Information Technology Adoption in Small Businesses: Omega-International Journal of Management Science, v. 23, no. 4, p. 429-442.
Thong, J. Y. L., Yap, C. S., and Raman, K. S., (1996), Top management support, external expertise and information systems implementation in small businesses: Information Systems Research, v. 7, no. 2, p. 248-267.
TIC, (1997), Tanzania Investment Centre (TIC): [Online], Available at: http://www.tic.co.tz/, Accessed (23/06/2007)
Tornatzky, L., and Fleischer, M., (1990), The Processes of Technological Innovation New York, NY, Lexington Books.
Tornatzky, L. G., and Klein, K. J., (1982), Innovation characteristics and innovation adoption-implementation: A meta-analysis of findings: Ieee Transactions on Engineering Management, v. 29, no. 1, p. 28-45.
Torres, O., and Julien, P. A., (2005), Specificity and Denaturing of Small Business: International Small Business Journal, v. 23, no. 4, p. 355-377.
UNCTAD , (2008), Handbook on the Least Developed Country Category: Inclusion, Graduation and Special Support Measures New York, United Nations.
UNCTAD, (2009), Information Economy Report 2009: Trends and Outlook in Turbulent Times: United Nations Publication, UNCTAD/IER/2009, Switzerland.
URT, (1962), The Tanganyika National Tourist Board Act, 1962 (25): The National Assembly, The United Republic of Tanzania.
URT, (1991a), National Tourism Policy (1991): The Ministry of Natural Resources and Tourism, The United Republic of Tanzania.
URT, (1991b), Tanzania The Informal Sector Survey: Planning Commission and Ministry of Labour and Youth Development, The United Republic of Tanzania.
URT, (1993a), The Broadcasting Services Act, 1993 (6): The National Assembly, The United Republic of Tanzania.
URT, (1993b), The Tanzania Communication Act. 1993 (18): The National Assembly, The United Republic of Tanzania.
URT, (1997a), The Government Executive Agencies Act 1997, (30): The National Assembly, The United Republic of Tanzania.
URT, (1997b), The National Telecomunications Policy (1997): Ministry of Communications and Transport, The United Republic of Tanzania.

162
URT, (1999), Revised National Tourism Policy: The Ministry of Natural Resources and Tourism, The United Republic of Tanzania.
URT, (2001), The 2001 Tanzania Tourism Sector Survey: Ministry of Natural Resources and Tourism, The United Republic of Tanzania.
URT, (2002a), The Companies Act, 2002 (12): The National Assembly, The United Republic of Tanzania..
URT, (2002b), Tourism Master Plan: Strategy and Actions: Ministry of Natural Resources and Tourism, The United Republic of Tanzania.
URT, (2003a), National Information and Communications Technologies Policy: Ministry of Communication and Infrastructure, United Republic of Tanzania.
URT, (2003b), Small and Medium Enterprise Development Policy: Ministry of Industry and Trade, United Republic of Tanzania.
URT, (2003c), The Tanzania Communications Regulatory Authority Act, 2003 (12): The National Assembly, The United Republic of Tanzania.
URT, (2004a), Guidelines on Tourism Licences: Ministry of Natural Resources and Tourism (Tourism Division), United Republic of Tanzania.
URT, (2004b), The 2004 Tanzania Tourism Sector Survey: Ministry of Natural Resources and Tourism, The United Republic of Tanzania.
URT, (2006), The Universal Communication Service Access Act, 2006 (11): The National Assembly, The United Republic of Tanzania.
URT, (2007), Tourism Statistical Bulletin: Ministry of Natural Resources and Tourism, The United Republic of Tanzania.
URT, (2008a), Tanzania in Figures 2008: The National Bureau of Statistics, Ministry of Finance and Economic Affairs, The United Republic of Tanzania.
URT, (2008b), Tanzania Profile: Ministry of Natural Resources and Tourism, The Republic of Tanzania.
URT, (2008c), The Small and Medium Enterprises: Minister For Industry,Trade and Marketing, The United Republic of Tanzania.
URT, (2008d), The Tourism Act. 2008 (29): The National Assembly, The United Republic of Tanzania.
URT, (2009a), Pulications and Statistics: Tanzania Communications Regulatory Authority, United Republic of Tanzania.
URT, (2009b), Tanzania Economy Survey 2009: The National Bureau of Statistics, Ministry of Finance and Economic Affairs, The United Republic of Tanzania.
URT, (2009c), The Key Statistics by Region of the United Republic of Tanzania: National Bureau of Statistics, The United Republic of Tanzania.

163
URT, (2010), Country Profile, Ministry of Foreign Affairs and International Co-operation, United Republic of Tanzania.
Van der Veen, M., (2004), Explaining e-business adoption: PhD Thesis Report, University of Twente, Enschede.
Van Hoorn, T., (1979), Strategic planning in small and medium-sized companies: Long Range Planning, 12, no. 2, p. 84-91.
Van Slyke, C., Comunale, C. L., and Belanger, F., (2002), Gender differences in perceptions of Web-based shopping: Communications of the Acm, v. 45, no. 8, p. 82-86.
Van Slyke, C., Ilie, V., Lou, H., and Stafford, T., (2007), Perceived critical mass and the adoption of a communication technology: European Journal of Information Systems, v. 16, no. 3, p. 270-283.
Venkatesh, V., and Davis, F. D., (2000), A theoretical extension of the Technology Acceptance Model: Four longitudinal field studies: Management Science, v. 46, no. 2, p. 186-204.
Venkatesh, V., and Morris, M. G., (2000), Why don't men ever stop to ask for directions? Gender, social influence, and their role in technology acceptance and usage behavior: Mis Quarterly, v. 24, no. 1, p. 115-139.
Venkatesh, V., Morris, M. G., Davis, G. B., and Davis, F. D., (2003), User Acceptance of Information Technology: Toward a Unified View: Mis Quarterly, v. 27, no. 3, p. 425-478.
Vogt, W. P., (1999), Dictionary of Statistics and Methodology: A Nontechnical Guide for the Social Sciences London, Sage.
Wade, D. J., Mwasaga, B. C., and Eagles, P. F. J., (2001), A history and market analysis of tourism in Tanzania: Tourism Management, v. 22, no. 1, p. 93-101.
Wang, Y., and Ahmed, P. K., (2009), The moderating effect of the business strategic orientation on eCommerce adoption: Evidence from UK family run SMEs: Journal of Strategic Information Systems, v. 18, no. 1, p. 16-30.
Welsh, J. A., and White, J. F., (1981), A Small Business is not a Little Big Business: Harvard Business Review, v. 59, no. 4, p. 18-32.
Wilson, H., Daniel, E., and Davies, I. A., (2008), The diffusion of e-commerce in UK SMEs: Journal of Marketing Management, v. 24, no. 5, p. 489-516.
Wong, P. K., (2003), Global and national factors affecting e-commerce diffusion in Singapore: Information Society, v. 19, no. 1, p. 19-32.
WorldAtlas, (2010), [Online], Available at: http://www.world-atlas.us/africa-map.gif, Accessed (10/10/2010)
Yang, B. J., and Lester, D., (2005), Gender differences in e-commerce: Applied Economics, v. 37, no. 18, p. 2077-2089.

164
Yang, K. C. C., (2005), Exploring factors affecting the adoption of mobile commerce in Singapore: Telematics and Informatics, v. 22, no. 3, p. 257-277.
Yap, C. S., (1989), Issues in Managing Information Technology: The Journal of the Operational Research Society, v. 40, no. 7, p. 649-658.
Yap, C. S., and Thong, J. Y. L., (1997), Programme evaluation of a government information technology programme for small businesses: Journal of Information Technology, v. 12, no. 2, p. 107-120.
Yap, C., Soh, C. P. P., and Raman, K. S., (1992), Information systems success factors in small business: Journal of Management Science, v. 20, no. 5/6, p. 597-609.
Zaltman, G. N., Duncan, R. B., and Holbek, J., (1973), Innovations and Organizations New York, John Wiley & Sons.
Zanzibar, (2010), Zanzibar Direct Tours, [Online], Available at: http://www.zanzibardirecttours.com/media/pemba_thumb.jpg, Accessed 22/08/2010
Zhu, J. J. H., and He, Z., (2000), Perceived characteristics, perceived needs, and perceived popularity - Adoption and use of the Internet in China: Communication Research, v. 29, no. 4, p. 466-495.
Zhu, K., and Kraemer, K. L., (2005), Post-Adoption Variations in Usage and Value of E-Business by Organizations: Cross-Country Evidence from the Retail Industry: Information Systems Research, v. 16, no. 1, p. 61-84.
Zhu, K., Kraemer, K. L., and Xu, S., (2006), The Process of Innovation Assimilation by Firms in Different Countries: A Technology Diffusion Perspective on E-Business: Management Science, v. 52, no. 10, p. 1557-1576.

165
Appendices
Appendix I: Questionnaire
QUESTIONNAIRE
The key determinants for Technological Innovation adoption in SMEs
The Case of E-mail and web technologies application in Tourism Industry in Tanzania
March 2008 – February 2009
The VU University and Mzumbe University under
sponsorship of the NUFFIC in the Netherlands made
this study possible
The data provided in this survey is confidential and will be used only for scientific purposes by the
researcher.
Start Time _______________
End Time ________________
Date ____________________
Researcher’s name: Musabila Albogast, Phone: 0713476318, E-mail: [email protected]

166
PART I a: GENERAL BACKGROUND INFORMATION (100)
The questions asked in this section will be used for classification purposes only. The information gathered will not be used in any other way and will be kept strictly confidential.
Please Tick [√] the most appropriate alternative/s (106) What type of business is your firm engaged in
(Tick all that applies in your firms) (102a) Are you the Owner of this organisation?
Travel agent No Tour operator Yes Air Operators
(102b) What is your current position in the firm? Hunting Operators Car rentals Managing director Tour Guides Sales/marketing manager Hospitality (Hotel/Restaurant /Cafe) Finance/accounts manager Destination Activities and Sports Computer/IT manager Others (specify) _____________________ Tour Manager Tour Consultant Other (Specify)___________________________
(103) Which of the following categories best
describes your age? (104) What is your highest education level?
Bellow 20 years Primary school 21 – 40 years Secondary/High school 41 – 60 years Certificate/Diploma 61 – 80 years Bachelor degree/Advanced Diploma Above 80 years Master’s degree Other level (specify) ____________________
(105) Which of the following categories best
describes the total number of your firm employees?
(101) Which of the following categories best describes your firm ownership?
1 – 4 employees Sole proprietorship 5 – 49 employees Partnership 50 – 99 employees Incorporated company More that 100 employees Family business Other (specify) __________________________
(107) How long has your firm been in this business? (108) Where is your firm head office located?
Less than 5 years Arusha 6 – 10 years Dare es Salaam 11 – 15 years Zanzibar 16 – 20 years Kilimanjaro More than 20 years Others (specify) _______________________

167
(109) Which of the following categories can best describes the amount of your firms capital investments in year 2007
(110) Which of the following categories can best describes your firm’s annual revenue estimates in year 2007
Up to 5 Million Tshs Below 20 million Tshs 5 to 200 million Tshs 21 - 40 Million Tshs 200 to 800 million Tshs 41 – 60 Million Tshs Above 800 million 61 – 80 Million Tshs I don’t know Above 80 million Tshs I don’t want to answer I don’t know I don’t want to answer
(111) Does the firm have collaboration with large tourist operators (e.g. Hotels, Tour Operators)?
(112) Does the firm have relationship with other local trading partners?
No No Yes (Please mention Them) ______________ Yes (Please mention Them) _________________
(113) What is your gender/sex? (114) Does your firm use e-mail or web technologies in its business activities?
Male No Female Yes
PART II: HOW E-MAIL AND WEB TECHNOLOGIES USED IN BUSINESSES (200)
In the following questions asked please Tick [√] the most appropriate alternative
(201) Please rate the level of e-mail or web technologies services adoption in your firm [Please [√] Tick only one appropriate alternative]
(202) Please indicate in which year your firm started using e-mail and web technologies as per your
choice in question 201.
E-mail only E-mail _____Year
E-mail and firm website for displaying company information and products offered E-mail _____Year Website _____Year
E-mail and using internet to get information of other stakeholders (suppliers, competitors, etc) E-mail _____Year Website _____Year
E-mail and firm’s website where customers can submit various enquiries through our website E-mail _____Year Website _____Year
E-mail and firm’s website for selling and receiving online booking, but payment is made offline E-mail _____Year Website _____Year
E-mail and firm’s website for selling and receiving online booking, and making online payment E-mail _____Year Website _____Year
Other levels (Specify) ____________________

168
(203) How is your firm accessing e-mail and web
technologies services? (204) Where is your firm’s website hosted?
In-house (we have our own internet connection)
In house (within the firms’ servers )
Outsourced (we access internet through another firm)
Outsourced (Website hosting company)
Using internet cafes Others (specify) ________________________
(205) Who made the decision to use e-mail or web technologies for in your firm?
(206) Who influenced the decision to use e-mail or web technologies in your firm?
Firms owner/s Firms owner/s Management committee Management committee Managing director Managing director Computer manager Computer manager Finance/accounts manager Finance/accounts manager Others (specify)_____________________ Others (specify)___________________________
(207) How best can you describe your understanding on how to use e-mail and web technologies?
(208) What percentage of employees in your organisation can use e-mail and web technology services?
Learned by experience Less than 10 per cent Attended short course 11 – 20 per cent I have a certificate in computer technology 21 - 30 per cent I have a diploma in computer technology 31 - 40 per cent I have a degree in computer technology 41 – 50 per cent Other (specify)_____________________ Above 50 per cent
(209) What percentage of the firm’s total budget was spent on e-mail and web technologies budget for the year 2007?.
(210) Who is responsible for e-mail and web technology technical services in your firm?
Less that 2% Firms owner/s 2.1 – 4.0% Managing director 4.1 – 6.0% Computer manager 6.1 – 8.0% Employee 8.1 – 10.0% Outsourced (a person outside the firm) Above 10% Others (specify)__________________________ I don’t know I don’t want to answer

169
PART V: E-MAIL AND WEB TECHNOLOGIES USAGE IN BUSINESSES (500) Please indicate your frequency level of using e-mail or web technologies by circling the number on the scale against each of the following statements?
(500) How frequently is e-mail and web technologies services used in your firm for the following business activities
More than
once a day
Once a day
Once a week
Once a month
Never used
(501) Our firm uses e-mail to communicate with employees.
1 2 3 4 5
(502) Our firm uses email to communicate with our customers 1 2 3 4 5
(503) Our firm uses e-mail to communicate with our suppliers. 1 2 3 4 5
(504) Our firm uses e-mail to communicate with the government institutions 1 2 3 4 5
(505) Our firm uses e-mail to communicate with
tourism associations 1 2 3 4 5
(506) Our firm uses e-mail to send orders/e-tickets to our customers 1 2 3 4 5
(507) Our firm uses e-mail to receive orders from our customers 1 2 3 4 5
(508) Our firm uses e-mail to update customers on their orders 1 2 3 4 5
(509) Our employees use e-mail to communicate with their friends 1 2 3 4 5
(510) Our firm uses internet websites to find
information relevant to our firm businesses 1 2 3 4 5
(511) Our firm uses internet websites to find information about our competitors 1 2 3 4 5
(512) Our firm uses internet websites to find information about other business stakeholders
1 2 3 4 5
(513) Our firm uses firm’s website for presenting
the firm’s information online 1 2 3 4 5
(514) Our firm uses firm’s website for presenting other tourism information e.g. Tanzania map, tour guide, exchange rates etc
1 2 3 4 5
(515) Our firm uses the firm’s website for advertising the firms’ products to our customers
1 2 3 4 5
(516) Our firm uses the firm’s website for exchanging information with customers online e.g. discussion forums
1 2 3 4 5

170
(500) How frequently is e-mail and web technologies services used in your firm for the following business activities
More than
once a day
Once a day
Once a week
Once a month
Never used
(517) Our firm uses the firm’s website for receiving customers complains about the firm products and services offered
1 2 3 4 5
(518) Our firm uses the firm’s website for updating customers on the new products and services offered
1 2 3 4 5
(519) Our firm uses the firm’s website for receiving online orders and bookings from customers but payments are made offline
1 2 3 4 5
(520) Our firm uses the firm’s website for receiving online orders and bookings from customers and payments are made online e.g. using credit cards
1 2 3 4 5
PART VI: Innovation Characteristics influencing the adoption of internet services among SMEs (600)
Please indicate your level of agreement or disagreement with each of the following statements. For each statement below please circle the number that best describe your view on your firm
(601) Relative Advantage characteristics Strongly Agree Agree
Neither agree or disagree
Disagree Strongly Disagree
(601a) Using e-mail and web technologies enhances communication effectiveness with customers, suppliers and trade partners
1 2 3 4 5
(601b) Using e-mail and web technologies improves our firm’s efficiencies in business 1 2 3 4 5
(601c) Using e-mail and web technologies improves the quality of services offered to our customers
1 2 3 4 5
(601d) Using e-mail and web technologies provides the management a greater control of the business
1 2 3 4 5
(601e) Using e-mail and web technologies increases
our firm’s distribution channel 1 2 3 4 5
(601f) Using e-mail and web technologies enables our firm to reach the new global market 1 2 3 4 5
(601g) Using e-mail and web technologies enables our firm to offer new product or services 1 2 3 4 5
(601h) Using e-mail and web technologies increases the firms profitability 1 2 3 4 5
(601i) Using e-mail and web technologies enhances strong relationships with business partners 1 2 3 4 5

171
(602) Compatibility characteristics Strongly Agree Agree
Neither agree or disagree
Disagree Strongly Disagree
(602a) Using e-mail and web technologies fits well with the way our firm does business 1 2 3 4 5
(602b) Using e-mail and web technologies fits well with our firm business values and culture 1 2 3 4 5
(602c) Using e-mail and web technologies fits well with the existing information system 1 2 3 4 5
(602d) Using e-mail and web technologies fits well with the firm’s existing distribution channel 1 2 3 4 5
(602e) Using e-mail and web technologies fits well with the way our management would like to operate
1 2 3 4 5
(603) Complexity characteristics (603a) Using e-mail and web technologies is easy for our employees 1 2 3 4 5
(603b) Using e-mail and web technologies is easy for our business partners 1 2 3 4 5
(603c) Using e-mail and web technologies is clear and understandable to our employees 1 2 3 4 5
(603d) Using e-mail and web technologies is clear and understandable to our business partners
1 2 3 4 5
(603e) Learning how to use additional e-mail and web technologies services is easy for our employees
1 2 3 4 5
PART VI: Innovation Characteristics influencing the adoption of internet services among SMEs (600) Please indicate your level of agreement or disagreement with each of the following statements. For each
statement below please circle the number that best describes your view on your firm
(604) Perceived Social Influence characteristics Strongly Agree Agree
Neither agree or disagree
Disagree Strongly Disagree
(604a) Business firms that use e-mail and web technologies are more sophisticated than those which do not in our society
1 2 3 4 5
(604b) Business firms that use e-mail and web technologies have higher standard than those which do not in our society
1 2 3 4 5
(604c) Business firms that use e-mail and web technologies have more prestige than those which do not in our society
1 2 3 4 5

172
PART VII: Organisational Characteristics (700) Strongly
Agree Agree Neither agree or disagree
Disagree Strongly Disagree
(701) Organisation’s Location characteristics (701a) Our firm is located nearby organisations
providing e-mail and web technologies services
1 2 3 4 5
(701b) Our firm is located nearby information technology vendors and technicians 1 2 3 4 5
(701c) Our firm is located nearby institutions that provide IT support and training courses 1 2 3 4 5
(702) Organisation’s Size characteristics
(702a) Firm employees are aware of benefits of e-mail and web technologies application in business
1 2 3 4 5
(702b) Our firm had already existing in-house IT infrastructure to support e-mail and web technologies
1 2 3 4 5
(702c) The firm had already in-house IT expertise and skills to support e-mail and web technologies
1 2 3 4 5
(702d) The firm had previous IT experience to support e-mail and web technologies application
1 2 3 4 5
(702e) The firm had enough financial resources to support adoption of e-mail and web technologies
1 2 3 4 5
(703) Top Management Support characteristics (703a) Top management considers e-mail and web
technologies as important for our firms success
1 2 3 4 5
(703b) Top management allocated resources for e-mail and web technologies adoption 1 2 3 4 5
(703c) Top management discusses with employees their support for the e-mail and web technologies adoption
1 2 3 4 5
(703d) Top management enthusiastically supports the adoption of e-mail and web technologies 1 2 3 4 5
(703e) Top management is aware of the benefits of e-mail and web technologies 1 2 3 4 5
(703f) Top management actively encourages employees to use e-mail and web technologies
1 2 3 4 5

173
PART VIII: Environmental Characteristics (800)
Please indicate your level of agreement or disagreement with each of the following statements. For each statement below please circle the number that best describes your view on your firm
(801) Competitive Pressure Strongly Agree Agree
Neither agree or disagree
Disagree Strongly Disagree
(801a) Our customers demand e-mail and web technologies services offered to them 1 2 3 4 5
(801b) Our suppliers demand e-mail and web technologies services offered to them 1 2 3 4 5
(801c) The firm is very alert to e-mail and web technologies opportunities to gain competitive advantages
1 2 3 4 5
(801d) Using e-mail and web technologies is important to keep up with competition in market
1 2 3 4 5
(801e) Our firm responds quickly to other competitors action in e-mail and web technologies adoption
1 2 3 4 5
(802) External Support (802a) Trading partners offered information and
resources on e-mail and web technologies adoption
1 2 3 4 5
(802b) Family friends provided information and resources on e-mail and web technologies adoption
1 2 3 4 5
(802c) Suppliers provided information and resources on e-mail and web technologies adoption
1 2 3 4 5
(802d) Trade associations offered information and resources on e-mail and web technologies adoption
1 2 3 4 5
(802e) Donors provided information and resources on e-mail and web technologies adoption to our firm
1 2 3 4 5
(802f) The business community provided technical support for effective use of e-mail and web technologies
1 2 3 4 5
(802g) Community agencies provided incentives for adoption of e-mail and web technologies
1 2 3 4 5
(802h) There are agencies in the community who provided training of e-mail and web technologies
1 2 3 4 5
(802i) The technology vendors actively market e-mail and web technologies adoption 1 2 3 4 5

174
(802j) The technology vendors promote e-mail and web technologies adoption by offering free training session
1 2 3 4 5
(803) Institutional Intervention
(803a) The government offers grants and loans for adoption of e-mail and web technologies services
1 2 3 4 5
(803b) The current government regulations related to information technology favour the adoption of e-mail and web technologies.
1 2 3 4 5
(803c) The government provides knowledge building capacity for e-mail and web technologies adoption
1 2 3 4 5
(803d) The government provides information infrastructure for adoption of e-mail and web technologies
1 2 3 4 5
(803e) The government promotes the adoption of e-mail and web technologies among SMEs 1 2 3 4 5
(804) What are the other specific reasons for adopting e-mail and web technologies in your firm
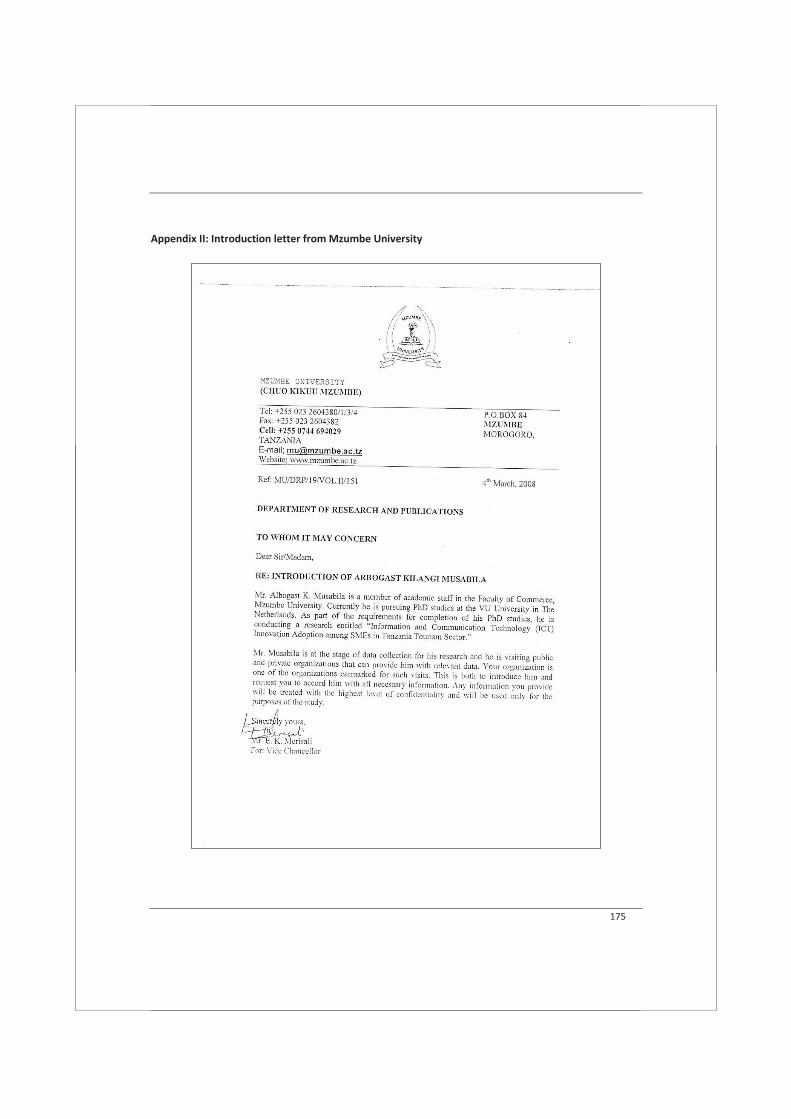
175
Appendix II: Introduction letter from Mzumbe University

176
Appendix III: Introduction letter from Commission for Tourism

177
Appendix IV: Internet Access in Tanzania Internet access via phones up
By Al-amani Mutarubukwa,
More Tanzanians are accessing the Internet via mobile phones than through computers, a recent report revealed. According to the 2010 Digital Life report released over the weekend by the TSN Research International, about 36 per cent of internet users access e-mails via mobile phones against 31 per cent doing the same via computers. Consumers surfing for multimedia and entertainment via mobile phones also stood at 21 per cent compared to 15 per cent accessed the same via computers. The report indicates that internet access through mobile phones in Tanzania is above global average. About 32 per cent used the mobile phone to access the internet compared to the global average of 26 per cent. The report noted, however, that cyber cafés remain the primary access of internet in Tanzania, although mobile phones have a higher potential to grow in future. This could be partly attributed to the recent improvement made by mobile phone manufacturers on handsets as well as the operators’ advancement in technology attained recently in the country. “Both mobile phone service operators and marketers would need to include internet services as the ingredient in their digital engagement strategy,” said Ms Melissa Baker, the chief executive officer of TSN research international, when launching the report for the first time in Dar es Salaam recently. She advised marketers to continue advertising on traditional media while viewing digital as an emerging opportunity that is yet to be tapped. Companies can increase their online presence by giving consumers link to brands for them to get more information on companies products or services. The research was conducted last month in Dar es Salaam where 500 people were interviewed. The findings of the report would maximize opportunities with digital consumers, and thus helping marketers formulating different strategies accordingly. It is also replicated to other 45 countries worldwide. It found out that despite low internet access, ‘digital engagement’ was higher the Africa’s average, which means once access improves there would be an ‘explosion’ of digital activities in Tanzania. Communication dominates internet use in Tanzania. Other internet uses like online shopping are still underdeveloped. This means that e-mail, multi-media, social and news are the ways to engage consumers via mobile phones in Tanzania, noted the report. With the recent landing of two international submarine fibre optic cables, EASSy and Seacom, that link Tanzania to the global high-speed telecommunications network, online branding and shopping, which is currently under-developed, could flourish in the near future, the report suggested. Tanzania ranks among leading African countries with tremendous progress in liberalising the information communication technology (ICT) sector. Such a progress, in turn made the cost of internet in Tanzania to be low and the quality higher than that of other East African countries, notably Kenya and Uganda. Despite the progress in connectivity, overall access to ICT services remains a challenge as internet connection was limited to urban areas, noted the report. There are 520,000-internet users equivalent to 1.3 per cent of the population, as of June 2009, according to Internet World Usage Statistics. As for mobile phones, the 2009 International Telecommunications Union report put Tanzania the fourth highest number of subscribers, after Nigeria, South Africa and Kenya. Within eight years, the number of subscribers in Tanzania has increased from less than 300,000 to over 14 million, which translates to 25 per cent penetration. Source: The Citizen Reporter, Available at: http://www.thecitizen.co.tz/business/-/5789-internet-access-via-phones-up (23/11/2010)

178
Appendix V: Integrated TOE and EWA Multiple Regression Analysis
DV Independent Variable DF Beta Coeff.
t- value Sig R2
EWA
Relative Advantage 294 -.093 -.978 .329
0.136
Compatibility 294 .122 1.694 .091 Complexity 294 .073 1.434 .153 Social Influence 294 -.009 -.151 .880 Organisational Location 294 .029 .571 .568 Organisational E-resources 294 .103 2.042 .042 Top Management Support 294 -.052 -.546 .585 Competitive Pressure 294 .281 3.489 .001 Technological Support 294 .067 1.104 .271 Non Technological Support 294 .039 .795 .427 Institutional Intervention 294 -.032 -.572 .568
Appendix VI: Integrated TOE and EWU Multiple Regression Analysis
Appendix VI-I: TOE Characteristics and Business Communication - Multiple Regression Analysis
DV Independent Variable DF Beta
Coeff. t-
value Sig R2
Business Communication
(1)
Relative Advantage 294 0.298 3.229 0.001
0.242
Compatibility 294 0.053 0.752 0.453 Complexity 294 -0.109 -2.209 0.028 Social Influence 294 0.014 0.255 0.799 Organisational Location 294 -0.022 -0.455 0.649 Organisational E-resources 294 0.029 0.592 0.554 Top Management Support 294 -0.079 -0.852 0.395 Competitive Pressure 294 0.263 3.359 0.001 Technological Support 294 0.130 2.198 0.029 Non Technological Support 294 -0.052 -1.086 0.278 Institutional Intervention 294 -0.016 -0.288 0.773
Appendix VI-II: TOE Characteristics and Online Presence - Multiple Regression Analysis
DV Independent Variable DF Beta
Coeff. t-
value Sig R2
Online Presence
(2)
Relative Advantage 294 0.345 1.965 0.050
0.147
Compatibility 294 -0.089 -0.669 0.504 Complexity 294 -0.141 -1.497 0.135 Social Influence 294 0.082 0.790 0.430 Organisational Location 294 -0.068 -0.728 0.467 Organisational E-resources 294 0.109 1.178 0.240 Top Management Support 294 0.046 0.261 0.794 Competitive Pressure 294 0.309 2.078 0.039 Technological Support 294 0.022 0.198 0.843 Non Technological Support 294 0.111 1.230 0.220 Institutional Intervention 294 0.026 0.256 0.798

179
Appendix VI-III: TOE Characteristics and Online Trading - Multiple Regression Analysis
DV Independent Variable DF Beta
Coeff. t-
value Sig R2
Online Trading
(3)
Relative Advantage 294 0.129 0.752 0.452
0.250
Compatibility 294 0.158 1.219 0.224 Complexity 294 -0.070 -0.764 0.445 Social Influence 294 0.123 1.219 0.224 Organisational Location 294 -0.166 -1.838 0.067 Organisational E-resources 294 0.237 2.623 0.009 Top Management Support 294 0.202 1.180 0.239 Competitive Pressure 294 0.375 2.588 0.010 Technological Support 294 0.180 1.646 0.101 Non Technological Support 294 -0.021 -0.244 0.808 Institutional Intervention 294 0.089 0.891 0.374