Volume 12 Issue 3 2020 Czech Republic Hungary Serbia
169
DETUROPE – THE CENTRAL EUROPEAN JOURNAL OF REGIONAL DEVELOPMENT AND TOURISM Vol. 8 Issue 1 2016 ISSN 1821-2506 0 Volume 12 Issue 3 2020 Czech Republic Hungary Serbia
-
Upload
khangminh22 -
Category
Documents
-
view
2 -
download
0
Transcript of Volume 12 Issue 3 2020 Czech Republic Hungary Serbia
DETUROPE – THE CENTRAL EUROPEAN JOURNAL OF REGIONAL DEVELOPMENT AND TOURISM
Vol. 8 Issue 1 2016 ISSN 1821-2506
0
Volume 12 Issue 3 2020
Czech Republic Hungary Serbia
DETUROPE
THE CENTRAL EUROPEAN JOURNAL OF REGIONAL
DEVELOPMENT AND TOURISM
Volume 12, Issue 3
2020
DETUROPE – the Central European Journal of Regional Development and Tourism is an international online open-access scientific journal publishing results of theoretical and applied research in the fields of regional and rural development and tourism. The articles published in this journal pass through a double-blinded peer reviewing process.
Editorial board
Editor-in-chief:
Kamil Pícha, associate professor, University of South Bohemia Members:
Zsuzsanna Bacsi, professor, Szent István University Dávid Fekete, assistant professor, Széchenyi István University Ernő Kovács, associate professor, Szent István University Zsuzsanna Lőke, associate professor, Szent István University Josef Navrátil, associate professor, University of South Bohemia Imre Nagy, professor, University of Novi Sad; Kaposvar University János Rechnitzer, professor, Széchenyi István University András Ricz, assistant professor, Regional Science Association of Subotica Sándor Somogyi, professor, Regional Science Association of Subotica, honorary editor-in-chief Dagmar Škodová Parmová, associate professor, University of South Bohemia
In memoriam:
Vladimír Dvořák, assistant professor, University of South Bohemia – founding Editorial board member
DETUROPE is covered by Web of Science Emerging Sources Citation Index and indexed in the Scopus, ERIH plus, DOAJ (Directory of Open Access Journals), MTMT (The Hungarian National Scientific Bibliography), and the KoBSON (Serbian Consortium for Coordinated Acquisition of Electronic Resources) databases.
Published by the Regional Science Association of Subotica, Serbia in co-operation with the University of South Bohemia, Faculty of Economics and Szent István University, Georgikon Faculty, Kesthely, Hungary. Address of the contact information: DETUROPE. Regionális Tudományi Társaság Szabadka/Društvo za Regionalne Nauke, Corvin Mátyás/Matije Korvina 9. 24000 Szabadka/Subotica, Serbia, [email protected]
ISSN 1821-2506
3
TABLE OF CONTENTS
Editorial ..................................................................................................................................... 4
TERRITORIAL RESEARCH IN CENTRAL EUROPE – REPORT ON THE 2019
CONFERENCES OF THE HUNGARIAN REGIONAL SCIENCE ASSOCIATION
Szilárd Rácz, Ildikó Egyed ......................................................................................................... 7
Original scientific papers:
ENVIRONMENTAL POLICY INTEGRATION AND ITS SUCCESS ON
SETTLEMENT LEVEL IN HUNGARY
Viktor Varjú ............................................................................................................................. 13
ADAPTATION TO CLIMATE CHANGE THROUGH THEORIES OF URBAN
DEVELOPMENT
Dragana Blagojević, Imre Nagy, Aco Lukić, Dajana Tešić ..................................................... 37
THE ECONOMIC STRUCTURE AND PERFORMANCE OF THE CATCHMENT
AREA OF THE HUNGARIAN REGIONAL CENTERS
Judit Berkes .............................................................................................................................. 58
MISKOLC – A CENTRAL AND EASTERN EUROPEAN CITY IN THE
CROSSROADS
Viktória Józsa ........................................................................................................................... 82
THE ROLE OF TERRITORIAL CAPITAL IN URBAN RENEWAL IN A NON-CORE
CENTRAL EUROPEAN CITY
Ildikó Egyed, Szilárd Rácz ..................................................................................................... 108
ACCESSIBILITY OF MAJOR CENTRAL AND EASTERN EUROPEAN CITIES IN
DANUBE CRUISE TOURISM
Márk Miskolczi, Melinda Jászberényi, András Munkácsy, Dávid Nagy ............................... 133
EXAMINATION OF THE MOTIVATION FOR FURTHER EDUCATION AMONG
HUNGARIAN HIGH SCHOOL STUDENTS IN VOJVODINA
Boglárka Kincses, Sándor Papp ............................................................................................. 151
DETUROPE – THE CENTRAL EUROPEAN JOURNAL OF REGIONAL DEVELOPMENT AND TOURISM
Vol. 12 Issue 3 2020 ISSN 1821-2506
4
EDITORIAL
Urban and territorial research in Central Europe
Dear Reader,
Welcome to the new thematic issue of the international, peer-reviewed DETUROPE (Central
European Journal of Tourism and Regional Development) journal. Our publication provides a
selection of papers presented during the 2019 conferences of the Hungarian Regional Science
Association (HRSA): the 11th Conference of Young Regionalists (Title: Paths of urban
development in Central and Eastern Europe – past, present and future), the 7th Central
European Conference in Regional Science (Flows of resources in the regional economy in the
age of digitalisation) and the 17th Annual Meeting of the HRSA (Territorial research in
Central Europe).
The first paper in the current issue presents a thorough report on the outstanding scientific
events and conferences mentioned above, prepared by the editors, Ildikó Egyed and Szilárd
Rácz.
The papers were selected in two steps. After the conferences, the main organisers of the
events (CERS conference, HRSA meeting) or the chairs of the sessions (Young Regionalists
conference) were requested to propose 15 presentations for publication in the subject of the
thematic issue: urban studies in Central Europe. In the second round, the submitted
manuscripts were subjected to review by two anonymous reviewers. The accepted articles
were revised and corrected according to the provided critical remarks.
The first two papers address the issue of urban sustainability. The study of Viktor Varjú
examines the current state of environmental policy integration and its results on settlement
level in Hungary. The author presents a historical review of the rise of environmental
protection and environmental policy in Hungary, with an outlook to the international context.
The empirical research draws the readers’ attention to the impact of the recent recentralization
process in Hungary on urban-level environmental actions, while also highlighting the role of
settlement size in environmental policy. The paper of Dragana Blagojević, Imre Nagy, Aco
Lukić and Dajana Tešić explores the subject of adaptation to climate change through the lens
of urban development theories and best solutions to mitigating its effects. To avoid the worst
consequences of global climate change, the global population must reduce the active
construction and development of urban capacities and planning processes need to be focused
on the greener side of urban design. A theory of smart cities, eco-city theory, city logistics,
EDITORIAL
5
and sustainable cities are the main strategies whose concepts have upgraded urban planning
and building design that can prevent climatic damage but are still consistent with the
environment. All theories are facing many challenges when it comes to their implementation
or adoption by responsible institutions.
The second group of papers examines the local level (i.e. regional centres of Hungary) in
various dimensions related to economic development or territorial capital. Judit Berkes
presents the economic structure and performance of urban catchment areas of the five largest
Hungarian regional centres. In Hungary, no research has been conducted so far spanning such
a long time period on the largest regional centres and their catchment areas that would allow
to compare them with themselves and each other using a complex methodology. The post-
industrial transition affected two regional centers in Hungary the most, Miskolc and Pécs.
These second-tier cities are analysed by local authors, embedded in a Central European
context. Viktória Józsa narrows the scope of her analysis to local economic development in
the city of Miskolc. The city has been at the crossroads of industries, cultures, borders,
innovations and EU programming periods throughout its history. Thus, in light of the
development path presented in the study, the author advocates an approach based on a return
to the city’s roots, i.e. the ‘welcoming city’, the (re)attraction of talented professionals, the
elimination of divisions and quarrels, and recommends joining all forces in the interest of the
city. In this respect, other Hungarian cities (e.g. Győr and Kecskemét) may provide several
good examples. The paper of Ildikó Egyed and Szilárd Rácz explores the concept of territorial
capital with a view to its policy embeddedness and academic valorisation. The first part of the
paper presents the circumstances of the emergence of territorial capital in cohesion policy
narratives and undertakes the theoretical elucidation of the concept. This is followed by an
examination of Central European contexts of territorial capital. The case study of Pécs
provides a summary of the most influential nodal points and factors shaping the development
path of the city, followed by a reflection on the current obstacles of territorial capital
valorisation.
Two highly important topics constitute the last focal point of the issue: accessibility of
Central European cities in Danube cruise tourism and motivation of school choice in higher
education in the cities of Vojvodina, Serbia. Márk Miskolczi, Melinda Jászberényi, András
Munkácsy and Dávid Nagy present an insight into the largely under-researched issue of river
cruise tourism on the Danube through their explorative analysis. The focus is on attraction
accessibility in the context of the three major cities of pan-European Corridor VII: Vienna,
Budapest and Belgrade. The main conclusion of the research is that key challenges of river
EDITORIAL
6
cruise tourism should be mitigated by actors outside this industry: bodies responsible for
water(way) management, urban mobility management and urban policy. The last paper in this
special edition focuses on higher education choices of Hungarian-speaking students enrolled
at Serbian high schools in Vojvodina. The questionnaire-based results of Boglárka Kincses
and Sándor Papp conclude that higher education in Hungary is a more attractive option for
Serbian Hungarians in the long run. Due to Hungary's EU membership and proximity to the
Hungarian state border, a degree obtained in Hungary is considered more competitive than
one obtained in Serbia.
The current issue of the journal DETUROPE is the 6th thematic issue prepared with the
participation of the Hungarian Regional Science Association. The journal has maintained a
fruitful collaboration with HRSA over the recent years. Issue number 2/2015 of DETUROPE
(edited by Szilárd Rácz) was the first thematically focused issue, accepting only English-
language papers. Since then, the journal has crossed important milestones to
internationalisation (Web of Science, Scopus). The Association also organizes large-scale and
successful international events (for example, it obtained the right to host the 61st ERSA
Congress in Pécs). All this contributes greatly to the realisation of our common objectives:
internationalisation and supporting regional studies. The Presidency of HRSA hereby
expresses its gratitude to the Editorial Board of the journal DETUROPE and especially its
Editor-in-chief, Dr. Kamil Pícha.
We hope that you will find inspiring articles in this collection of studies aiming to
represent the diversity of research topics explored by the partners and researchers of the
Hungarian Regional Science Association.
We wish you a good reading,
Szilárd Rácz and Ildikó Egyed1
Editors of the thematic issue
1 The research of Szilárd Rácz and Ildikó Egyed (research fellows of CERS Institute for Regional Studies) is
supported by the János Bolyai Scholarship of the Hungarian Academy of Sciences.
DETUROPE – THE CENTRAL EUROPEAN JOURNAL OF REGIONAL DEVELOPMENT AND TOURISM
Vol. 12 Issue 3 2020 ISSN 1821-2506
7
TERRITORIAL RESEARCH IN CENTRAL EUROPE – REPORT ON
THE 2019 CONFERENCES OF THE HUNGARIAN REGIONAL
SCIENCE ASSOCIATION
Szilárd RÁCZa, Ildikó EGYEDb
a CERS Institute for Regional Studies, H-7621 Pécs, Papnövelde u. 22., [email protected];
Széchenyi István University, H-9026 Győr, Egyetem tér 1. b CERS Institute for Regional Studies, H-7621 Pécs, Papnövelde u. 22., [email protected]
Three major scientific events were organized by Hungarian Regional Science Association
(HRSA) in the year 2019. The report presents these in a chronological order.
11TH CONFERENCE OF YOUNG REGIONALISTS
The HRSA, the West Hungarian Research Department of the Hungarian Academy of Sciences,
Centre for Economic and Regional Studies, Institute for Regional Studies (IRS) and the
Doctoral School for Regional and Economic Sciences of the Széchenyi István University
organised the 11th Conference of Young Regionalists in Győr entitled „Paths of urban
development in Central and Eastern Europe – past, present and future” on 21-22 June, 2019.
The conference series was launched in 1999 and has enjoyed relentless popularity ever since.
Each year, the conference programme divided into 6 to 12 sections is structured around a major
topic and introductory lectures are held by prominent researchers and experts of the discipline.
The programme also includes a presentation of major projects, scientific journals and newly
published books. Through the past years, a total of 80 to 100 participants held 70 to 80 lectures
during the conference, enabling young researchers to contribute to scientific debates and
providing an outstanding opportunity for a meeting of generations, a platform worth attending.
As in the previous years, the 2019 event was organized around a specific topic. The common
specificities and engines of urban development in Central and Eastern Europe formed the main
thematic focus, with a specific emphasis on factors beyond traditional economic resources. The
event also served as the opening conference for the research entitled „The role of territorial
capital and innovative milieu in the development of Central and Eastern European regional
centers”.
The plenary sessions took place during the first day of the conference. In a novel approach
compared to the previous ten conferences and more faithful to the title of the conference,
REPORT ON THE 2019 CONFERENCES OF THE HUNGARIAN REGIONAL SCIENCE ASSOCIATION
8
keynote lectures were held no longer by senior researchers and professors but seven prominent
members of the young generation of postdoctoral scientists, in the following order:
− Dávid Fekete (Széchenyi István University): Current trends of metropolitan governance
in Hungary.
− Gergely Tagai (Central and North Hungarian Research Department of IRS): Urban
development and regional disparities in East Central Europe.
− Ádám Páthy (Széchenyi István University): Territorial capital and urban development –
Development specificities of East Central European regional centers.
− Viktória Józsa (CEO of Nord Consult Kft.): The presentation of the development path
of a large city: Where do you come from and where are you heading, Miskolc?
− Szilárd Rácz (Transdanubian Research Department of IRS): Spatial structural
specificities and urban network processes of post-socialist South Eastern Europe.
− Boglárka Barsi (West Hungarian Research Department of IRS): Happy cities –
territorial aspects of well-being.
− Dániel Kuttor (Miskolc University): The domestic financial space and the position of
cities in Hungary.
Thematic sessions were held after the plenary sessions. The event attracted somewhat less
attention compared to previous years (which might be attributed to the introduction of
attendance fees). A total of 30 presentations were divided among four different sessions:
− Large cities and metropolitan areas in East Central Europe;
− The state of territorial development;
− Innovative economic activities and regional development;
− The concept, limitations and practice of social responsibility.
7TH CENTRAL EUROPEAN CONFERENCE IN REGIONAL SCIENCE
The 7th Central European Conference in Regional Science (CERS) entitled „Flows of
Resources in the Regional Economy in the Age of Digitalisation” was held in Sopron between
9-11 October, 2019. The main organisers of the event were the University of Sopron Alexandre
Lamfalussy Faculty of Economics and HRSA. Further co-organizers with CERS included the
German speaking, Polish and Slovak Sections of European Regional Science Association
(ERSA) and University of Economics in Bratislava, Technical University of Košice. The 2019
CERS was the first to be hosted by a Hungarian institution. The scientific committee was
headed by Prof. Zoltán Gál, president of the HRSA. The president of the organisation
committee was Balázs István Tóth, associate professor of the University of Sopron, operative
tasks were managed by Dénes Hargita (University of Sopron), Sándor Zsolt Kovács (IRS) and
Balázs Páger (IRS), as well as Szilárd Rácz (HRSA).
REPORT ON THE 2019 CONFERENCES OF THE HUNGARIAN REGIONAL SCIENCE ASSOCIATION
9
The history of the conference dates back to 2005. The main organiser of the first six CERS
were members of the Slovakian session of ERSA, more specifically, its honorary president,
Milan Buček, its president Štefan Rehák and vice president Oto Hudec: 2005, 2007 Nový
Smokovec - High Tatras; 2009 Košice; 2012 Bratislava; 2014 Košice; 2017 Banská Bystrica.
In the course of its one-and-a-half decade long history, CERS has developed into one of the
most prominent scientific events of Central European regional science, and HRSA was already
included among its co-organizers in 2017. The conference has significantly contributed to the
integration of experts, doctoral students and young researchers from Central and Eastern
European countries to the international scientific arena. This is demonstrated, on one hand, by
the steadily increasing number of participating researchers and countries, and, on the other
hand, by the list of plenary speakers that includes the most illustrious figures of European
regional science (to name but a few: Roberta Capello, Manfred M. Fischer, Gunther Maier,
Peter Nijkamp, Andrés Rodriguez-Pose).
Plenary sessions organised in the framework of the CERS held in Sopron explored highly
topical issues, and the list of invited speakers was on equal footing with any of the world
congresses. Andrés Rodríguez-Pose, Professor of the London School of Economics, in his
lecture entitled „The Geography of EU Discontent and the Revenge of the Places that Don’t
Matter” discussed the fortune of territories remaining outside the focus of development policy
and their political impacts manifest in electoral outcomes, citing Hungarian examples as well.
The presentation of Alessandra Faggian, Professor of the Gran Sasso Science Institute analysed
the main explanatory factors of hate speech and its geographical aspects. André Torre, President
of ERSA, Professor of Agrotech in Paris held a lecture on the role of the exploitation of
endogenous and exogenous resources in territorial development. Katarzyna Kopczewska
Professor and Vice-Dean at the Faculty of Economics, University of Warsaw explored
opportunities of the integration of „machine learning” into territorial analyses.
During the three days of the 7th CERS, 190 speakers from 20 different countries presented
their state-of-the art research results in the framework of 160 presentations. The scientific
programme was organised into 29 sessions around 14 different topics (two sessions – networks;
regional development – enjoyed outstanding popularity, attendees were able to exchange ideas
in four parallel sessions).
Regular sessions:
− Digital and Smart Solutions;
− Circular Economy and Environmental Challenges;
− Rural Policy and Development;
REPORT ON THE 2019 CONFERENCES OF THE HUNGARIAN REGIONAL SCIENCE ASSOCIATION
10
− Urbanization and Urban Policy;
− Innovation, Knowledge and Universities;
− Regional Development and Smart Specialization;
− Modelling regional growth and economic development;
− EU and Regional Policy.
Thematic sessions:
− Tourism and Regional/Local Development (organiser: Márta Bakucz);
− Contemporary Issues in Regional Corporate Embeddedness (Viktória Józsa);
− The presence and effects of Asian investments in Central Europe (Dániel Kuttor);
− Networks, Development and Disparities in Regions (Balázs Lengyel and Attila Varga);
− Geoeconomic/geopolitical challenges in the EU and CEE (Márton Péti and Géza
Salamin);
− Innovative Solutions to Manage Social Urban Problems in European Small and Medium
Sized Towns (Viktória Szirmai).
A book presentation taking place on the second day of CERS analysed the success and
sustainability of the Central European (post-socialist) model of catching-up. The presented
volumes (Lux, Horváth, 2017; Gorzelak, 2019) were published in the Routledge book series.
The authors of both volumes sought to explore the extent and ways in which convergence of
Central European regions to Western European societies can be demonstrated. In their
presentations, Gábor Lux and Grzegorz Gorzelak analysed the main dimensions of territorial
disparities (urban–rural and Western–Eastern development divide), human capital endowment
and loss of knowledge and skills triggered by migration and issues of institutions and
regionalisation.
Prizes for manuscripts submitted by doctoral students and young researchers are regularly
awarded during the CERS conferences. The President of the evaluating committee at the 2019
Conference was Gunther Maier, Professor of Wirtschaftsuniversität Wien. Based on the
unanimous decision of the committee, the Young Researchers Prize was granted to Andreas
Diemer, doctoral student of the London School of Economics for his paper entitled „Diffusion
of Local Economic Shocks in Social Networks: Evidence from the US Fracking Boom”.
A discussion on the future of the conference was conducted by representatives of the co-
organizer organizations. In its framework, previous commitments were reaffirmed, targeting
widening the range of co-organizers of future CERS conferences, extending participation to the
Polish and Hungarian sessions of ERSA, alongside the Slovakian session, the original main
organiser and founder of the event series. During the closing ceremony of the conference,
leaders of the respective organisations and André Torre, President of ERSA expressed their joy
REPORT ON THE 2019 CONFERENCES OF THE HUNGARIAN REGIONAL SCIENCE ASSOCIATION
11
over the continuation of the cooperation, announcing that Poznań would be hosting the 8th
CERS Conference organised by the Polish session in 2021. In addition, the CERS in Sopron
provided a platform for preparatory works for local organisers (HRSA, IRS & University of
Pécs) of the ERSA Congress to be held in Pécs in August 2022. Presentations of the CERS
Conference were published in Autumn 2020 in a 700-page-long, peer-reviewed and indexed
English language Proceedings volume (Gál et al. 2020).
17TH ANNUAL MEETING OF THE HUNGARIAN REGIONAL SCIENCE
ASSOCIATION
The Annual Meeting of HRSA was organised immediately after the CERS Conference in the
early afternoon hours of 11 October, 2019. The conference, also hosted by the University of
Sopron Alexandre Lamfalussy Faculty of Economics explored various aspects of Central
European territorial researches. Due to the temporal proximity of the two scientific events and
contrary to previous practices, no plenary or English language sessions were organised, after
the General Assembly, lectures continued in parallel regular sessions.
During his introductory speech held at the General Assembly, Gál Zoltán, President of
HRSA requested participants to honor the memory of Bálint Csatári, founding member of
HRSA who passed away in September 2019 at the age of 70.
Due to the expiring mandate of office-holders appointed at the full renewal of the committee
in 2015 and its partial renewal of 2017, new officials were elected for a four-year term in the
framework of the General Assembly. 54 out of the 190 active members of HRSA (paying their
membership fees before the General Assembly) submitted their votes, those present voted on
the issue of 16 posts. Based on the decision of the General Assembly, six new and ten re-elected
members will ensure the leadership of the Association in the 2019 to 2023 period. The mandate
of Zoltán Gál, President of HRSA and Szilárd Rácz, its Secretary were both renewed. The list
of Vice Presidents has not changed, these posts will be filled by Imre Nagy, Pál Szabó and
Attila Varga in the coming four-year session. Newly elected members of the Presidency include
Attila Fábián, Ákos Jakobi, Viktória Józsa, Sándor Zsolt Kovács, Balázs Lengyel, Katalin
Mezei, and external member József Káposzta. György Csomós was elected as the new President
of the Accounting Committee, its members include Katalin Lipták, Zsófia Vas, and Balázs
Forman as an alternate.
The ceremonial granting of the awards issued by the Society took place during the General
Assembly. The award was distributed for the 3rd time. The Society granted the award to
REPORT ON THE 2019 CONFERENCES OF THE HUNGARIAN REGIONAL SCIENCE ASSOCIATION
12
recognize the achievements of György Kocziszky, professor emeritus of the University of
Miskolc, outgoing Head of the North Hungarian Division of HRSA. The Excellent Young
Regional Scientist Award – awarded for the 11th time by the Presidency and the leaders of
regional sections – was granted to Zoltán Elekes, assistant professor of the Faculty of
Economics and Business Administration, University of Szeged in recognition of his outstanding
scientific results, exemplary professional and community activities.
The General Assembly was followed by nine regular sessions. The 70 presentations,
applying a variety of territorial scales and thematic focuses, represent the great diversity of
Central European regional scientific research. A call for the organisation of sessions has been
announced each year since 2017 by HRSA in the first Circular of the Annual Meeting, the list
of sessions organized at the 2019 event is as follows:
− Theoretical and methodological issues related to territorial research;
− Territorial policy and planning in Central Europe;
− Territorial dimensions of consumption;
− Territorial and social disparities in Central Europe;
− Urban development in Central and Eastern Europe;
− Agricultural-, environmental and rural research;
− Social capital and territorial disparities;
− Social, economic and regional impacts of automation.
Further information on the conferences is available on the webpage of the Society
(http://www.mrtt.hu/), photo albums can be accessed on social media
(https://www.facebook.com/mrtt.hu/).
Acknowledgement
This publication was funded by the National Research, Development and Innovation Office of Hungary in
the 128747 OTKA research program titled The role of territorial capital and innovative milieu in the
development of Central and Eastern European regional centers.
REFERENCES
Gál, Z., Kovács, S. Zs. & Páger, B. (Eds.) (2020) Flows of Resources in the Regional Economy
in the Age of Digitalisation: Proceedings of the 7th CERS Conference. Pécs, Hungarian
Regional Science Association.
Gorzelak, G. (Ed.) (2019) Social and Economic Development in Central and Eastern Europe.
Stability and Change after 1990. London: Routledge.
Lux, G. & Horváth, Gy. (Eds.) (2017) The Routledge Handbook to Regional Development in
Central and Eastern Europe. London–New York: Routledge.
DETUROPE – THE CENTRAL EUROPEAN JOURNAL OF REGIONAL DEVELOPMENT AND TOURISM
Vol. 12 Issue 3 2020 ISSN 1821-2506
Original scientific paper
13
ENVIRONMENTAL POLICY INTEGRATION AND ITS SUCCESS
ON SETTLEMENT LEVEL IN HUNGARY
Viktor VARJÚa
a Senior research fellow, KRTK Institute for Regional Studies (Transdanubian Research Department),
7621 Pécs, 22 Papnövelde Street, [email protected]
Cite this article: Varjú, V. (2020). Environmental policy integration and its success on settlement level in
Hungary. Deturope. 12(3): 13-36.
Abstract
This paper aims to present environmental policy integration and its success on settlement level in
Hungary. To do so, firstly, the author gives an overview in historical perspective of the rise of
environmental protection and environmental policy taking a look at the international level and Hungary.
Secondly, the summary of the author’s empirical researches in the topic in the past decades draws the
readers’ attention to the role of the impact of the recent recentralization process in Hungary on the
environmental actions at urban level, and also highlights the role of the size of settlement in
environmental policy. The analyses show that the lack of information is crucial in the failure to make
positive environmental actions. On the other hand, in larger, urbanised settlements, due to their higher
development and investment capacity and risk, the role of environmental assessment related to planning
activities is considered more important.
Keywords: environmental policy, spatial planning, strategic environmental assessment (SEA),
environmental policy integration (EPI)
INTRODUCTION
Urbanisation (currently 55% of the global population live in cities (Rácz, 2019), the increase
of investments and the rapid expansion of artificial surfaces – especially in metropolitan
regions – have caused significant conflicts between nature and society creating challenges for
sustainability (Lennert et al., 2020) and for dynamic equilibrium for the ecosystem (Nagy,
2006) and needs for a more environmentally integrative (urban) development policy. Hence,
‘cities around the world face many environmental health challenges including contamination
of air, water and soil, traffic congestion and noise, and poor housing conditions exacerbated
by unsustainable urban development and climate change’ (Vardoulakis et al., 2016, p.1).
In the modern era, Carson’s (1962) ‘Silent Spring’ initiated the thinking on the connection
of human and nature and triggered the emergence of widespread environmental conscious
discussion (Kozma, 2019), despite several attempts made earlier (e.g. Leopold, 1949). Today,
Varjú, V.
14
the interpretation of the notion varies and can diverge from the original notion depending on
the views of the author (Vujko et al., 2018). From the 1980s the redistribution system of the
European Community (EC) resulted in the implementation of major investment projects and
plans. In parallel, the idea of Sustainable Development and the Environmental Programmes of
the EC have been started and the resulting environmental policy tools (such as Environmental
Impact Assessment (EIA) or Strategic Environmental Assessment (SEA)). While the tool of
Environmental Assessment emerged in the late 1960s in the USA and the 1970s in European
countries (e.g. France, the Netherlands) (Szilvácsku, 2003), their institutionalisation was
postponed to the late 1990s, early 2000s. (The implementation deadline of the directive
2001/42/EC on Strategic Environmental Assessment was June 2004 for the European member
states). SEA, as a new tool can integrate environmental policy concerns into spatial planning
and urban development (Varjú, 2011).
This paper is a summary of the author’s works in the past decade on environmental policy
integration (EPI) on settlement level. After the presentation of the methods and materials used
for this paper, using multiyear and multilevel approach, the aim of this article is twofold.
Firstly, as a theoretical background, the paper gives an overview about the environmental
policy integration into settlement/urban policy, then the focus shifts to Hungarian spatial
policy and environmental policy integration. The second part – in the results and discussion
section – contains a time series empirical research investigating the environmental policy
integration and their urban size differences in Hungary and shows how settlements of
different size could learn and integrate environmental policy.
DATA AND METHODS
Using a systematic literature review, the paper provides a historical overview about
environmental policy integration into urban/spatial policy from the 19th century
internationally, then in Hungary, emphasising the milestones of the integration.
The author conducted an online survey among local governments in Hungary. The first
wave was sent out in 2008 to all local governments. Another wave (with the same questions)
was sent out in 20111. These questions focused on the appearance and use of SEA and
environmental programming at settlement (NUTS 5/LAU2) level. In 2014, under the umbrella
1Similar surveys were conducted in Slovakia and Romania.
Varjú, V.
15
of the ÁROP2 project, surveys for the local governments investigated – among other questions
relating to public services – the orientation of settlement leaders towards environmental
policy and its integration into spatial/urban planning (e.g. waste management, environmental
planning, nature protection). Parts of this survey are also used here.
THEORETICAL BACKGROUND – AN OVERVIEW OF ENVIRONMENTAL
POLICY INTEGRATION
The well-known idea of ‘sustainable development’ (WCED, 1987) has played an increasingly
important role in policy making since 1987. With the strengthening and far-reaching effect of
environmental policy, the idea of Environmental Policy Integration (EPI) came to the fore in
the last decades (Lenschow, 1997). For the safekeeping of the natural environment, European
Community introduced the Environmental Impact Assessment (85/337/EC). This assessment
‘only’ concerned concrete building projects in order to reveal the hazardous effects of
investments on nature. Later on, extending the Assessment and using the practice of some
developed countries, EU introduced the Strategic Environmental Assessment (SEA) in its
‘Directive 2001/42/EC of the European Parliament and the Council on the assessment of the
effects of certain plans and programs on the environment’. Consequently, by the middle of the
2000s, EPI had become an unavoidable element of regional and urban planning policy (Varjú,
2013b), and it requires system-thinking approach (Németh & Péter, 2017). However, how did
we get here? And what is the situation like in Hungary?
Integrating environmental policy into settlement policy – international outlook
In the complex sense, the notion of ‘environmental protection’ is a product of the second half
of the 20th century, becoming widespread in scientific publications from the 1970s. In this
sense, ‘environmental protection’ can be considered as a new issue, but there are three
components of the notion that appeared in the legislation long before the middle of the 20th
century:
− the aim of protecting certain objects of the natural environment against human damage
or pollution,
− protection against damage to certain objects in the natural environment as a result of
spontaneous processes in nature,
2ÁROP 1.1.22-2012-2012-001 project
Varjú, V.
16
− the elimination of the damages of civilization that endanger or disturb human within the
settlement environment (Kilényi, 1978, p. 91).
In order to protect certain elements of the human environment, human activity has been
regulated by individual societies for centuries. England’s water protection laws can be traced
back to 1848 and the birth of laws to protect air quality, to 1863. In France, the first law was
passed in 1810, dealing with environmental damages caused by industry. If we have a look at
not only the laws that comprehensively protect certain elements of the environment, but at the
sporadic provisions related to environmental protection, we can find a number of regulations.
This includes first-century Lex Julia, who banned heavy-duty vehicles from Rome at a time,
which had a population of one million at the time (Julesz, 2008).
The need to protect the natural environment has intensified with industrial development.
Already the medieval British economy had accounted for smoke/air pollution, and royal
decrees punished open-color coal burning. The first regulations concerned mainly forest areas,
as this was precisely the sensitive point at this time that contributed to everyday industrial
activities. But their overuse could be a danger (not only in connection with firewood
extraction, but also due to hunting, the forest was an important food industry base even in the
early 20th century). This is how the Austrian Imperial Forest Act (Reichsforstgesetz) was
created in 1852, and the Swiss Forest Police Act (Forstpolizeigesetz) in 1902. The Dutch
Hinderwet (formerly known as Fabriekwet) (Law on Disturbance and Environmental Impact),
enacted in 1875, defined ‘environmental permitting’ as the predominant task of
municipalities. Thus, the delegation of environmental issues – which affected not only the
natural environment but also the settlements – to the appropriate territorial level took place in
time (Varjú, 2015).
In countries where industrial development started relatively later, the notion is mainly
referred to as ‘environmental conservation’. For example, in the Soviet Union and Bulgaria,
the term environmental protection did not become established for a long time. The reason is
that the term ‘nature conservation’ was used to denote environmental protection (Kilényi,
1978).
The history of Swedish environmental law also dates back to the 19th century with water
and neighborhood regulations, additionally, by 1907, the country had passed their first
conservation law. Due to its geographical location, Denmark also established its first
environmental regulation in the 19th century to protect its coastline (Julesz, 2008).
Environmental policy has been actively appearing in urban planning and urban
development policies since the early 1930s and came to the forefront with the early
Varjú, V.
17
suburbanization processes (Enyedi, 1984) rearranging the urban social structure, accompanied
by environmental and sociological problems (Varjú, 2015). One of the early responses to this
phenomenon was the Athens Charter elaborated by the Fourth Congress of the International
Organization of Modern Architecture, adopted in 1933. The proclamation containing the new
principles of urban planning (Egyed, 2018) was published in 1941 by Le Corbusier under the
title of Charter of Athens. For decades, even after the Second World War, this document was
a definitive document of the ideas of urban development and urban planning (Varjú, 2015).
The Athens Charter (1933) emphasized the notion of functionality and proposed that the
creation of urban areas, the arrangement of cities would take place along their homogeneous
functions. In doing so, the document insisted the planners to ensure a healthy environment in
residential areas and emphasized the importance of green spaces. It also states that the
separation of industrial areas from residential sectors is a basic requirement and that the
distance between the place of work and the place of residence is to be reduced to a minimum.
The central ideas of the Charter were mainly centered around architectural issues, dealing
with the location of buildings, the use of new materials, and the rapid relocation of people and
goods. It outlined an idealized urban structure in which modern technology can fully meet the
needs of people. From a political point of view, it suggested that a city form should be
dictated from above (c.f. top-down governance) instead of formulating as a result of
community participation (c.f. bottom-up approach).
The findings and resolutions of the Athens Charter (1933) were extremely up-to-date and
largely still relevant today. It evaluates the natural, social, political and economic whole of the
city and its surroundings in a systemic approach and attaches great importance to the
physiological and psychological nature of human in relation to urban planning (Hajnal, 2006).
However, the breakthrough in environmental policy and the assessment of our environment
can undoubtedly be traced back to the United States of the beginning of the 1960s when
Rachel Carson’s (1962) book presented the ecological consequences of the widespread,
uncontrolled use of various pesticides.
The widespread international political appearance of environmental problems can be linked
to the speech of U Thant, secretary-general of the 1969 UN Economic and Social Council,
who spoke about the global environmental crisis (Hajnal, 2006). In Europe, the environmental
policies of Sweden and Denmark played an important role in the expansion of environmental
action: the European Environment Agency – based in Copenhagen – held its first major
environmental conference in Stockholm in 1972 (Julesz, 2008). 1972 was an important year
for ex-ante environmental assessments and the strengthening of environmental protection too.
Varjú, V.
18
It was then that the first report of the Club of Rome was published, entitled The Limits of
Growth, which sought to draw attention to the consequences of the overuse of natural
resources (Moser & Pálmai, 1992). Since the 1970s, the Commission has also been doing
more and more to ensure that the integration of environmental protection and environmental
policy is a guiding principle in its basic and other development documents. In 1987, the
European Commission integrated the most important principles of environmental protection
into the Treaty of Rome, many of which are among the general principles of the European
Union. These principles are: the principle of prevention, the principle of integration of
environmental considerations, the polluter pays principle, the principle of state responsibility
and commitment, the principle of international cooperation, individual and collective
participation, and the principle of subsidiarity (Nagy, 2008, p. 309).
The next important step for environmental research and environmental policy is
undoubtedly the so-called Brundtland Report entitled Our Common Future (1987), which
articulated the notion of Sustainable Development, the most cited concepts of in planning and
development.
The UN Conference on Environment and Development was held in 1992 in Rio, which
was also an important milestone. The AGENDA 21 (1992) adopted a number of details on the
subject of sustainable development, emphasizing the active role of the local level that is
unavoidable in urban development thinking. Chapter 28 of Agenda 21, the main document of
the UN Conference on Environment and Development held in Rio de Janeiro in 1992 deals
specifically with the Local Agenda 21, which also harmonizes with the EU principle of
subsidiarity (Varjú, 2013b).
The Maastricht Treaty, signed in 1992, expands the principles of the Union with the
principle of sustainable development (Nagy, 2008) and enshrines the integration of
environmental objectives into economic and sectoral policies (Kerekes & Kiss, 2003).
Certainly, over the last two decades, environmental considerations have been integrated into
several other EU policies, including development ones. Both in the ESDP (1999) and as a
supplement / renewal of the Lisbon Strategy (2000), the Gothenburg Declaration, adopted in
2001, as a priority, identifies the consideration of the principle of sustainable development
and the iterative inclusion of environmental interests in development policy (Varjú, 2011).
The idea of social, economic and environmental sustainability also had an impact on urban
development. The New Athens Charter was published by the European Council of Mayors in
1998, after nearly 4 years of preparation, recognizing new types of problems in European
cities. However, the new Charter does not return to the theses of previous documents, but
Varjú, V.
19
aims to ‘define a sustainable development program for the city living with its surroundings,
define the role of the urban planner in the implementation of the program, and make
recommendations to professionals and urban policy makers at various levels’ (Hajnal, nd, p.
9).
The Charter articulates the need to prioritize mixed land use over the traditional
functionalist approach. It emphasizes that the sustainability of the city depends to a large
extent on land use patterns and transport systems that cannot be managed separately. The
main priorities of the Charter are:
− ensuring real civic participation in planning;
− plans must be based on the principles of sustainable development;
− planning must help economic competitiveness, boost employment;
− planning should promote social and economic cohesion (Hajnal, nd).
The ESDP (European Spatial Development Perspective) draws up spatial development
guidelines for the European Commission and the Member States, based on an assessment of
the social, economic and infrastructural spatial structure of the European Union. The
document was adopted in 1999 after five years of preparation. The directives drawn up at the
Potsdam meeting are not binding, but they play a key role in shaping the institutional system
and planning process of European territorial development. The main objective of the
document is ‘balanced and sustainable territorial development’. One of the key guidelines of
the ESDP is the wise and sustainable management of the natural and cultural heritage (ESDP,
1999).
In March 2000, the European Council adopted the Lisbon Strategy, according to which the
European Union must become the most competitive and dynamically developing knowledge-
based economy in the world by 2010, with increasing employment. At the same time,
economic growth must ensure sustainable development, social cohesion and a high level of
environmental protection, as well as increase the quality of life and living standards of
European citizens (Varjú, 2010).
The European Council in Gothenburg on 15 and 16 June 2001 endorsed the Commission's
strategy for strengthening the environmental pillar ("Sustainable development in Europe for a
better world: a European Union strategy for sustainable development"). The document adds a
third, environmental dimension to the principles of the Lisbon Process for employment and
economic reform and social cohesion. Economic policy guidelines have been set to sustain
growth (sic.) and promote structural reforms. Sustainable development is threatened by
Varjú, V.
20
climate change, deteriorating environmental health conditions, poverty, an aging population, a
decline in biodiversity, and the scale of transport, problems that require a global solution. The
long-term objectives of the strategy include combating climate change and increasing the use
of clean energy sources, tackling public health problems, achieving greater social
responsibility in managing natural resources and conserving biodiversity, and developing
transport, transportation and land use in an environmentally friendly way.
The Leipzig Charter on Sustainable European Cities was adopted by the Ministers for
Spatial Planning of the Member States (together with the Territorial Agenda) at the Informal
Ministerial Meeting on Urban Development and Territorial Cohesion organized by the
European Commission in Leipzig on 24–25 May 2007. The Charter is based on the Green
Paper on the Urban Environment (1990), on the results of urban pilot projects for the period
leading up to the turn of the Structural Funds, on the Lille Work Program, on the Rotterdam
Urban Acquis and on the Bristol Accord.
The key elements of the document are organized around demographic, social exclusion and
environmental issues, and the document itself identifies two main priorities. These are the
emphasis on integrated urban development policy and the priority given to the treatment of
disadvantaged neighborhoods (Varjú, 2015).
The priority of the integrated urban development policy was the need to create high-quality
public spaces, the need to modernize infrastructure networks and increase energy efficiency,
and to emphasize proactive innovation and education policies (Varjú, 2015).
Priority action strategies focusing on deprived neighborhoods will also improve the physical
environment, strengthen the local economy and local labor market policies, proactive
education and training policies (with a focus on the younger generations) and efficient and
affordable urban transport (public transport, pedestrians) and cycling.
The development of the Hungarian environmental policy and its integration into
settlement policy
At the end of the 19th century, the first modern laws related to nature and environmental
protection were enacted in Hungary. The Forest Protection Act of 1879 was amended in 1935
to protect nature more widely. The first steps were partly in accordance with Act XXIII of
1885 on water law, which can be linked to river regulation and the XIX Act of 1888 on
Fisheries (Varjú, 2010).
The concept of environmental protection first appeared in the Hungarian legal literature in
1971. Since then, legislation has accelerated. In 1972, environmental protection was included
Varjú, V.
21
as a national target program (1012/1972 / IV.27 MT) in the national long-term scientific
research plan. In 1973, a proposal to draft a law was made before the National Assembly, and
a year later its social debate took place. The National Environmental Council was established
in 1974, and then in 1976 Act II. on the Protection of the Human Environment (Kilényi &
Tamás, 1980) (which has since been repealed and replaced by Act LIII of 1995) placed the
issue of environmental protection at the highest (sub-constitutional) legal level (Varjú, 2010).
In Hungary, the governmental tasks of environmental protection – with the involvement of
ministries and central authorities – were performed by the National Environment and Nature
Protection Office established in 1977 operating until the end of 1987. The Ministry of
Environment and Water Management was established on 1 January 1988 (Tatai, 1988), which
has since undergone several name changes and changes of responsibilities to supervise
directly and indirectly (through its national and regional authorities) nature protection and
environmental protection.
In the late 1980s, in addition to the growing environmental and scientific considerations,
environmental social movements played an increasingly important role in attacking not only
the state socialist system in Hungary, but also the introduction of ecological aspects into
public thinking. Initially, the problems typically appeared at the local level. There were places
where similar environmental conflict caused more (e.g. in Ajka) upheavel from the
population, there were places where less (e.g. in Százhalombatta) provoked resentment and
publicity. However, in the period of state socialism, these social actions typically appeared
only locally and only to a small extent in the national communication channels (Varjú, 2010).
Following the change of regime, the organizational, institutionalized and civil framework
conditions and systems of environmental protection improved. Besides, urban strategic
planning has also become common in the post-socialist CEEC countries (Bajmóczy et al.
2020). In the 1990s environmental pollutions were clearly reduced (Szirmai, 1999). The
reason for that was the post-socialist socio-economic transformation that has resulted in
unexpected challenges such as brownfields (Dannert and Pirisi, 2017). On the other hand, the
accelerating decline of large-scale industry from the mid-1980s was accompanied by a
decrease in pollution, so environmental issues were partially ‘resolved’. On individual level,
changes in income, existential status have diverted attention from environmental issues
towards society.
Following the change of regime post-1990, environmental policy became increasingly
important at the political level. The environmental profession has also been an active
participant in the strengthening of international environmental protection. In addition to
Varjú, V.
22
Hungary's representation at the policy level at the previously mentioned international
environmental summits, Academician István Láng was also an active participant in the
Brundtland Committee (Varjú, 2010).
There was a change in the dynamics of Hungarian environmental policy in the 2000s, in
which the strengthening of international organizations in Hungary (e.g. Greenpeace) and the
institutionalization of social actors (such as the establishment of Civil Consultation Forum or
the social consultation procedures) played an important role in spatial planning activities
(Glied, 2008).
In the 2000s, environmental policy became an increasingly broad societal issue. The main
reason was that environmental problems were ‘fragmented’. With the transformation of large-
scale industry and collective agriculture, and the improvement of industrial technologies the
residential sector has become the biggest polluter. With the development of the Hungarian
consumer society, the problems can only be remedied by broad social cooperation. Following
the international environmental policy of the 2000s, climate change and energy use and
energy efficiency have become key issues in Hungary as well (Varjú, 2010).
During the process of EU accession, environmental policy became more and more
important, which was facilitated not only by legal harmonization, but also by professional
policy interest. The 1995 LIII. the Act on General Rules for the Protection of the Environment
sets out the details of the elaboration of the National Environmental Protection Program
(NEP). Thus, the Parliament first approved Hungary's Environmental Protection Program in
1997 (EPP-I) and then in 2003 (EPP-II). The second EPP (2003–2008) – learning from the
mistakes of the first – had fixed only 46 objectives as opposed to the 120 of the previous.
Accordingly, the objectives were not fragmented, and it provides a specific, quantified list of
indicators to monitor each objective (Varjú, 2010).
The Appendix to the 4th EPP (2015–2020), adopted in 2015, already defines in detail the
measures required for each strategic goal, clarifying the tasks and responsibilities of
individual actors, the government, local governments, economic organizations, enterprises
and everyday people. The coherence of regional development activities, programming and
planning and environmental policy were promoted not only by the National Environmental
Protection Program, but also by the law of LIII of 1995 on the general rules of environmental
protection, which stipulates (§ 46) that local governments must develop an independent
municipal environmental protection program in their area of competence or adopt it with their
representative body [§ 46 (1) b].
That legislation is in accordance with Section XXI of the law 1996 on Spatial Development
Varjú, V.
23
and Spatial Planning, according to which [§ 3 (3)] the task of spatial planning is to explore
and evaluate environmental conditions and to take into account the load-bearing capacity
when setting development goals.
Environmental integration has been strengthened in the European Union since the early
1980s with the establishment of environmental action programs. In the meantime, the
development of a Strategic Environmental Assessment (SEA) obligation, which will be
incorporated into the legislation of the Member States, began in 1991, and was formulated as
an EU directive only in 2001. Of course, not all Member States wished to apply the test
before the publication of the Directive (Fleischer, 2004).
Annex III to Council Regulation (EC) No 1260/1999 lays down general provisions on the
Structural Funds. Chapter 2 on evaluation already required ex-ante, mid-term and ex-post
evaluations at program level. Of these, there is an increasing emphasis on ex-ante evaluations.
The descriptive nature of environmental impacts and aspects, which goes beyond
assessment and is becoming more and more pronounced, has also increasingly prompted the
EU and the European Commission's XI. (Environment) to develop a stand-alone testing
system for program-level planning from the methods and experience of impact assessments to
date. Considering parts of Council Directive COM/96/0511 and past experience, the European
Parliament and the Council defined and established the Strategic Environmental Assessment
on 27 June 2001 as a stand-alone integrative policy and tool.
Following the practice of the European Union, the Hungarian legislation has also paid
more and more attention to the legal regulation of assessments related to the achievement of
environmental protection and sustainable development. In connection with the plans, the XXI.
s. Section 23 of the Spatial Development Act (in view of the EU EIA regulations following
the signing of the EU Cooperation Agreement in 1995) requires, among other things, the
preparation of environmental impact assessments for all spatial plans. However, this has not
yet been the case for development decisions.
As already mentioned, the EC required member states to incorporate the details of
Strategic Environmental Assessments into their own legislation by mid-2004. Accordingly, in
2004 the Hungarian Parliament amended Act LIII of 1995 on Environmental Protection.
Article 27 of the current legislation states, inter alia, that ‘In order to protect the natural and
built environment in a coordinated manner, the expected environmental effects of the ideas
contained therein must be explored in the spatial development concepts and in the preparation
of spatial planning and settlement structure plans ...’. Sections 43 and 44 of the same law
already provide for environmental assessments to be carried out, but also state that various
Varjú, V.
24
plans and programs are subject to ‘... an environmental assessment, which includes an
environmental assessment under separate legislation. No plan or program may be submitted
without an environmental assessment.’ This special legislation is entitled 2/2005. (I.11.) On
the environmental assessment of certain plans and programs. This legislation already specifies
in which plans and programs it is mandatory to carry out strategic environmental assessment.
However, the legislation only stipulates that the program must be an integral part of this
assessment, the environmental assessment must be agreed with the competent environmental
inspectorate and specifies the content elements and the need for monitoring, but it does not
provide more detailed methodological guidance. It should be noted here that neither the
Hungarian legislation nor the EU directive regulates exactly to what extent it is necessary to
carry out SEA developments. Thus, Hungarian law does not oblige the developer to prepare
an SEA for a regulatory plan prepared for a part of a city. It also gives the planner some
leeway to determine the size of the plan and the expected environmental impact. However, by
referring to this ‘room for maneuver’, municipalities may be able to avoid the obligation to
carry out an environmental assessment in the case of minor modifications (referring to the
otherwise legitimate but, as it turned out, irrelevant suggestion that has a licensing obligation)
(Varjú, 2010).
As indicated above, the legislation that requires urban planners to make settlements
sustainable is not too strict. Hence, the author’s hypothesis is that in Hungary there is
connection between the size and type of settlements and environmental cogitation.
Settlements with high population numbers are significantly more inclined to make
environmental assessment, facing higher risks due to the higher number of developments and
investments.
RESULTS AND DISCUSSION
The SEA is a relatively new tool which ensures the EPI into regional development policy.
SEA appears differently in different national organizations’ development policy. There are
countries where environmental assessment has long experience (e.g. UK, France) and there
are countries (e.g. Hungary, Slovakia) where the implementation of SEA has just started since
the legal enactment.
Prior to the establishment of the Hungarian legal framework, the environmental assessment
of the Regional Operational Program (2007–14) was carried out by the ROP SEA
methodology in 2003. The methodology was developed on the basis of the ex-ante evaluation
Varjú, V.
25
required by Council Regulation (EC) No 1260/1999 on the Structural Funds and the
aforementioned Directive 2001/42 / EC. However, as there was no generally accepted
methodology for the preliminary assessment of the environmental impacts of plans and
programs – only the tools proposed by the European Commission – a methodological
framework was developed for the ROP (Varjú, 2010). This SEA has since been followed by
several SEAs, mainly prepared for strategic plans, but research experience shows that the
process did not reach the urban level, (especially the small settlement level), or was difficult
to reach. Not only the SEA, but also the preparation of the environmental program of the
settlements are missing. Without this, it is difficult to build sustainable conscious settlements.
The empirical survey in 2008
A first examination of the environmental awareness of settlements has been conducted in
2008, partly through the issue of the local application of SEAs. The research focused (in part)
on local governments. At the settlement level, the author also strived for full
representativeness, so he tried to find the e-mail addresses of all local governments in
Hungary. However, only 2352 working e-mail addresses were available in comparison to the
number of settlements of 3152 (TEIR 2008) (including the districts of Budapest), while
without it the number of distributed questionnaires was 2329.
Initial studies have shown that SEA, as a new environmental mechanism, is far less
widespread at the county level than in national or regional development policy. There can be
several reasons for this. On the one hand, it has not been long since the entry into force of the
government decree (early 2005) and the completion of the research presented in the indicated
literature (October 2008) from a planning point of view. During this time, it is assumed that
the development plans of the municipalities have not reached a stage where they should be
updated. If there are those who are still in this state, then it is likely that in smaller, more
disadvantaged settlements the environmental assessment may not be given (sufficient)
emphasis in the renewal of plans, in these municipalities the information on SEA is
incomplete despite the existing notarial function.
The municipal survey conducted in 2008 in the cited research showed that the basic
problem with the municipal level is that 45.8% of the respondents had not even heard about
the SEA, and only 9.8% of the respondents had done so. However, this 9.8% is nuanced by
the fact that in the period under review (between January 2005 and the date of the response)
73% of the responding municipalities had a plan or an amendment to it that should have been
subject to an environmental assessment (Table 1). The settlements that had already heard
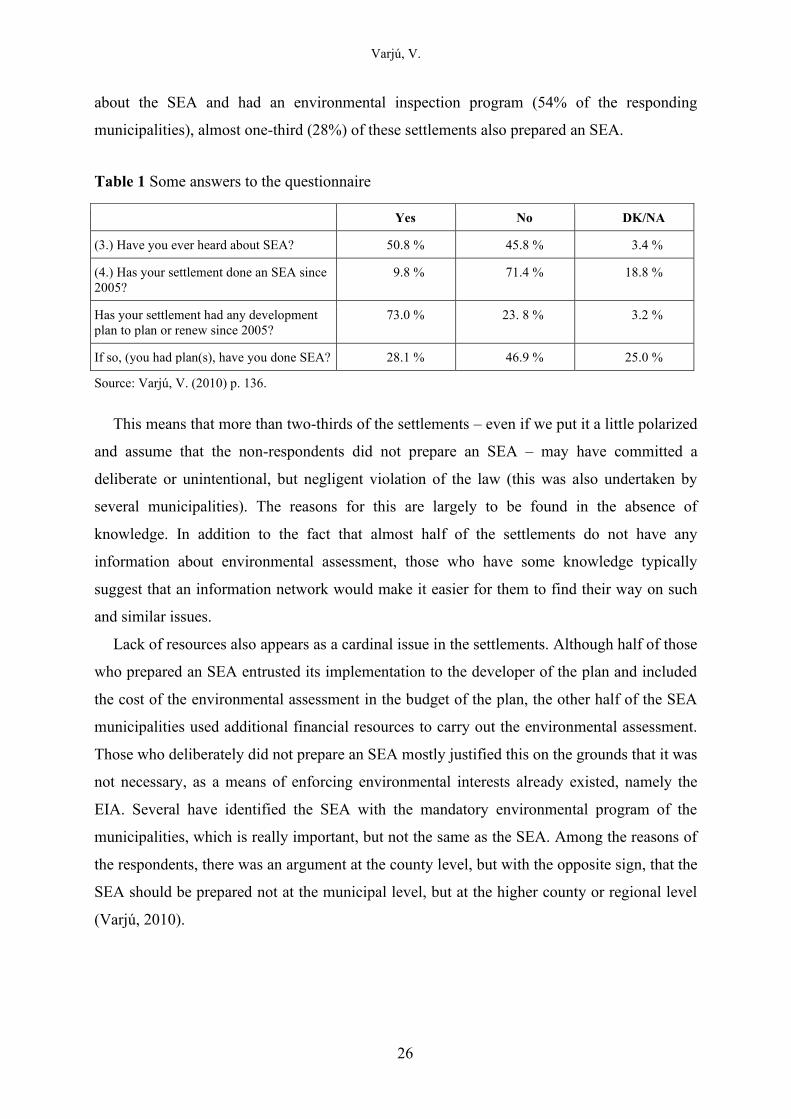
Varjú, V.
26
about the SEA and had an environmental inspection program (54% of the responding
municipalities), almost one-third (28%) of these settlements also prepared an SEA.
Table 1 Some answers to the questionnaire
Yes No DK/NA
(3.) Have you ever heard about SEA? 50.8 % 45.8 % 3.4 %
(4.) Has your settlement done an SEA since
2005?
9.8 % 71.4 % 18.8 %
Has your settlement had any development
plan to plan or renew since 2005?
73.0 % 23. 8 % 3.2 %
If so, (you had plan(s), have you done SEA? 28.1 % 46.9 % 25.0 %
Source: Varjú, V. (2010) p. 136.
This means that more than two-thirds of the settlements – even if we put it a little polarized
and assume that the non-respondents did not prepare an SEA – may have committed a
deliberate or unintentional, but negligent violation of the law (this was also undertaken by
several municipalities). The reasons for this are largely to be found in the absence of
knowledge. In addition to the fact that almost half of the settlements do not have any
information about environmental assessment, those who have some knowledge typically
suggest that an information network would make it easier for them to find their way on such
and similar issues.
Lack of resources also appears as a cardinal issue in the settlements. Although half of those
who prepared an SEA entrusted its implementation to the developer of the plan and included
the cost of the environmental assessment in the budget of the plan, the other half of the SEA
municipalities used additional financial resources to carry out the environmental assessment.
Those who deliberately did not prepare an SEA mostly justified this on the grounds that it was
not necessary, as a means of enforcing environmental interests already existed, namely the
EIA. Several have identified the SEA with the mandatory environmental program of the
municipalities, which is really important, but not the same as the SEA. Among the reasons of
the respondents, there was an argument at the county level, but with the opposite sign, that the
SEA should be prepared not at the municipal level, but at the higher county or regional level
(Varjú, 2010).
Varjú, V.
27
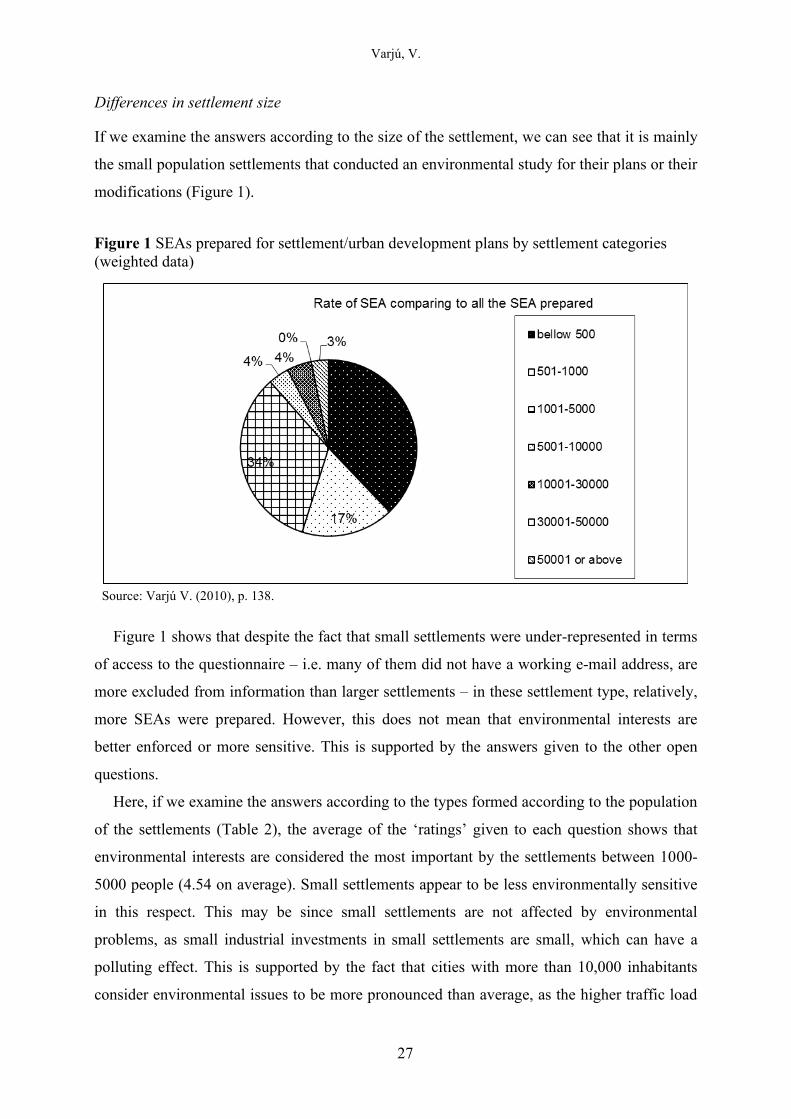
Differences in settlement size
If we examine the answers according to the size of the settlement, we can see that it is mainly
the small population settlements that conducted an environmental study for their plans or their
modifications (Figure 1).
Figure 1 SEAs prepared for settlement/urban development plans by settlement categories
(weighted data)
Source: Varjú V. (2010), p. 138.
Figure 1 shows that despite the fact that small settlements were under-represented in terms
of access to the questionnaire – i.e. many of them did not have a working e-mail address, are
more excluded from information than larger settlements – in these settlement type, relatively,
more SEAs were prepared. However, this does not mean that environmental interests are
better enforced or more sensitive. This is supported by the answers given to the other open
questions.
Here, if we examine the answers according to the types formed according to the population
of the settlements (Table 2), the average of the ‘ratings’ given to each question shows that
environmental interests are considered the most important by the settlements between 1000-
5000 people (4.54 on average). Small settlements appear to be less environmentally sensitive
in this respect. This may be since small settlements are not affected by environmental
problems, as small industrial investments in small settlements are small, which can have a
polluting effect. This is supported by the fact that cities with more than 10,000 inhabitants
consider environmental issues to be more pronounced than average, as the higher traffic load
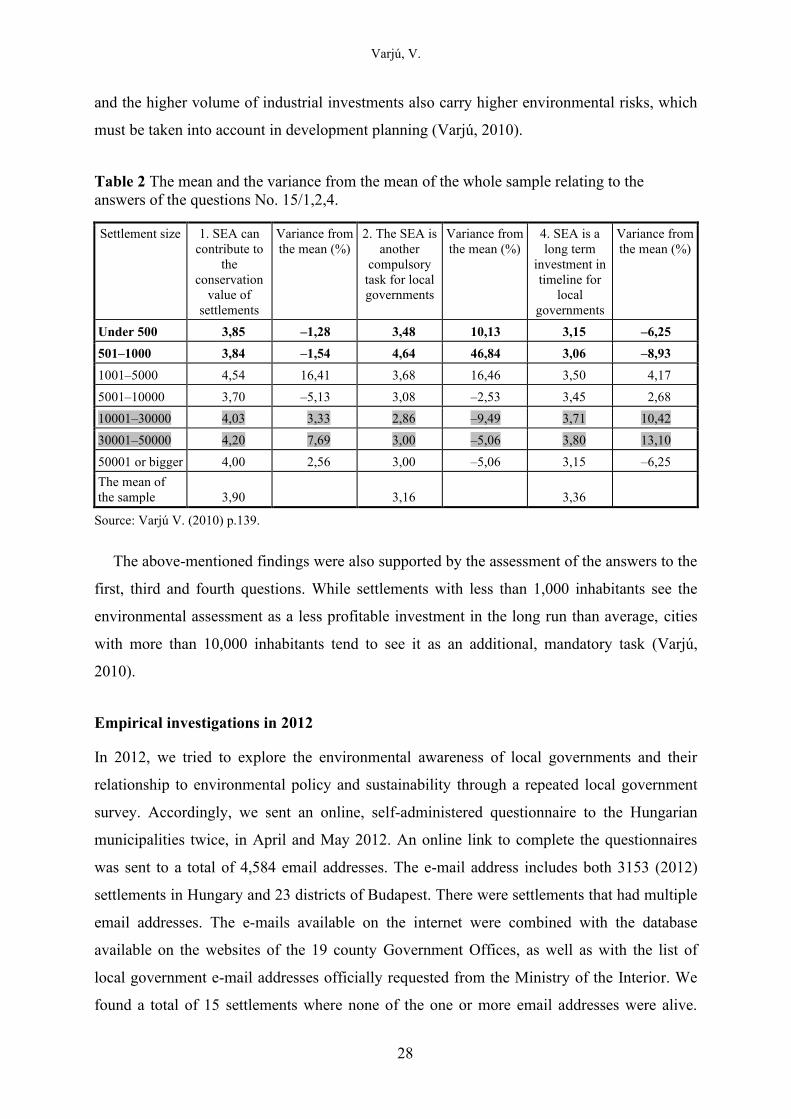
Varjú, V.
28
and the higher volume of industrial investments also carry higher environmental risks, which
must be taken into account in development planning (Varjú, 2010).
Table 2 The mean and the variance from the mean of the whole sample relating to the
answers of the questions No. 15/1,2,4.
Settlement size 1. SEA can
contribute to
the
conservation
value of
settlements
Variance from
the mean (%)
2. The SEA is
another
compulsory
task for local
governments
Variance from
the mean (%)
4. SEA is a
long term
investment in
timeline for
local
governments
Variance from
the mean (%)
Under 500 3,85 –1,28 3,48 10,13 3,15 –6,25
501–1000 3,84 –1,54 4,64 46,84 3,06 –8,93
1001–5000 4,54 16,41 3,68 16,46 3,50 4,17
5001–10000 3,70 –5,13 3,08 –2,53 3,45 2,68
10001–30000 4,03 3,33 2,86 –9,49 3,71 10,42
30001–50000 4,20 7,69 3,00 –5,06 3,80 13,10
50001 or bigger 4,00 2,56 3,00 –5,06 3,15 –6,25
The mean of
the sample 3,90 3,16 3,36
Source: Varjú V. (2010) p.139.
The above-mentioned findings were also supported by the assessment of the answers to the
first, third and fourth questions. While settlements with less than 1,000 inhabitants see the
environmental assessment as a less profitable investment in the long run than average, cities
with more than 10,000 inhabitants tend to see it as an additional, mandatory task (Varjú,
2010).
Empirical investigations in 2012
In 2012, we tried to explore the environmental awareness of local governments and their
relationship to environmental policy and sustainability through a repeated local government
survey. Accordingly, we sent an online, self-administered questionnaire to the Hungarian
municipalities twice, in April and May 2012. An online link to complete the questionnaires
was sent to a total of 4,584 email addresses. The e-mail address includes both 3153 (2012)
settlements in Hungary and 23 districts of Budapest. There were settlements that had multiple
email addresses. The e-mails available on the internet were combined with the database
available on the websites of the 19 county Government Offices, as well as with the list of
local government e-mail addresses officially requested from the Ministry of the Interior. We
found a total of 15 settlements where none of the one or more email addresses were alive.
Varjú, V.
29
Most (3) “inaccessible” settlements were in Borsod-Abaúj-Zemplén county. 80% of the
settlements not reached by e-mail are settlements with less than 1000 inhabitants.
Of the municipalities surveyed, 649 clicked on the link sent and / or started filling in the
questionnaire, and 283 municipalities completed it. After filtering out duplications and
territorially unidentifiable municipalities, 272 fully completed municipal questionnaires were
evaluated. The questionnaires were filled in anonymously, the identification of the received
questionnaires was automatically blocked, so which settlement did not voluntarily provide the
name of the settlement, these settlements were not included in the final analysis. The
municipalities that gave the name of their settlement contributed to the success of the
analysis, however, according to the rules of research ethics and the profession (Héra & Ligeti,
2005) these settlements remain unidentifiable when presenting the results. In the
questionnaires we asked the mayors of the settlements, but there were places where the
questions were answered by the deputy mayor or an employee of the mayor's office
authorized for questions.
9% of all settlements in Hungary gave an evaluable answer to the survey. By county, the
number of responses varied within two percentage points. An exception to this is Borsod-
Abaúj-Zemplén county, where the return rate is below 6%, while in Békés county, the return
rate is above 14%; Baranya county represents the Southern Transdanubia region with a return
of over 11%, Somogy and Tolna counties with a return of 8%.
Most of the valid questionnaires came from settlements between 1001-5000 people (42%).
Based on the replies, it can be said that groups with a settlement size of more than 1000
people are over-represented, while groups with a settlement size of less than 1000 people are
under-represented compared to the national proportions. In order to make the quantifiable
findings on the size of the settlement representative, in the group comparisons compared to
the main average, the answers were weighted based on the ratio of the numbers of the sample
elements of each group to the population.
During the empirical research, we were the first to probe the attitudes of local governments
towards the performance of tasks. We were interested in how important local governments
consider their environmental and nature conservation tasks to be in comparison to their other
tasks. We only dealt with the tasks and attitudes related to environmental protection after that.
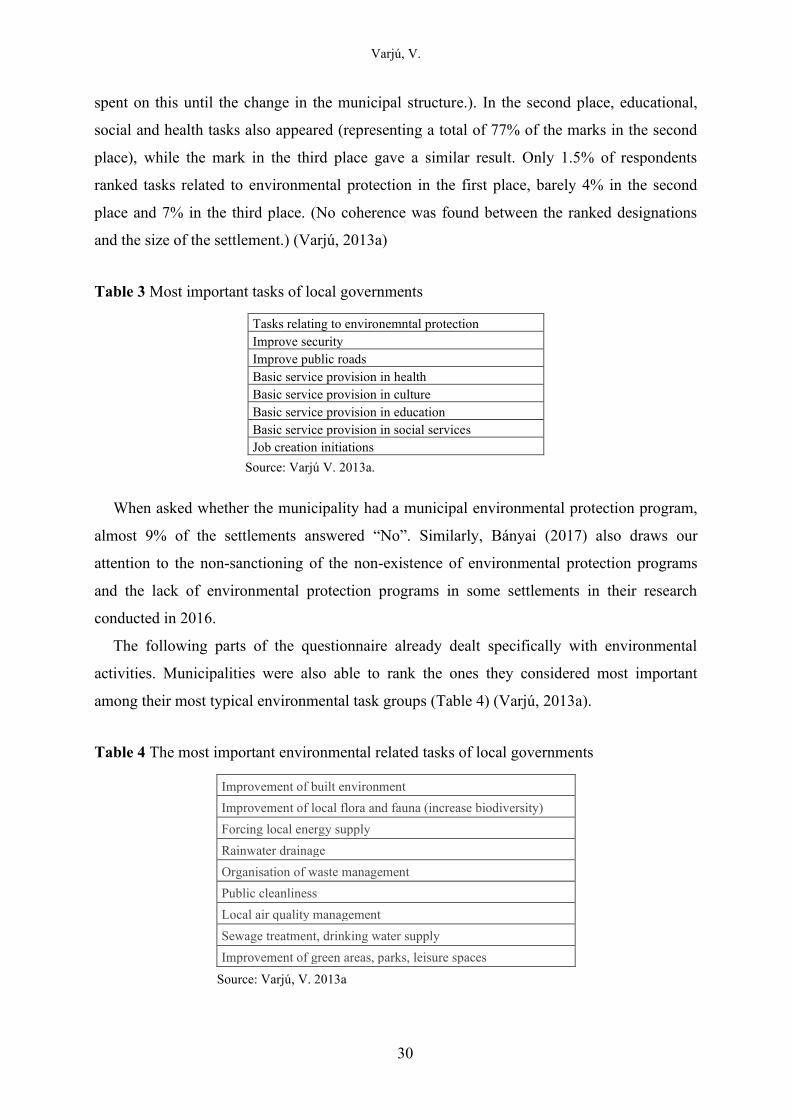
In the questionnaire, we identified eight groups of tasks (Table 3) that local governments had
to rank.
38.6% of the settlements marked the basic education tasks, while 25% indicated the basic
social tasks in the first, most important place. (A significant part of their budget was also
Varjú, V.
30
spent on this until the change in the municipal structure.). In the second place, educational,
social and health tasks also appeared (representing a total of 77% of the marks in the second
place), while the mark in the third place gave a similar result. Only 1.5% of respondents
ranked tasks related to environmental protection in the first place, barely 4% in the second
place and 7% in the third place. (No coherence was found between the ranked designations
and the size of the settlement.) (Varjú, 2013a)
Table 3 Most important tasks of local governments
Tasks relating to environemntal protection
Improve security
Improve public roads
Basic service provision in health
Basic service provision in culture
Basic service provision in education
Basic service provision in social services
Job creation initiations
Source: Varjú V. 2013a.
When asked whether the municipality had a municipal environmental protection program,
almost 9% of the settlements answered “No”. Similarly, Bányai (2017) also draws our
attention to the non-sanctioning of the non-existence of environmental protection programs
and the lack of environmental protection programs in some settlements in their research
conducted in 2016.
The following parts of the questionnaire already dealt specifically with environmental
activities. Municipalities were also able to rank the ones they considered most important
among their most typical environmental task groups (Table 4) (Varjú, 2013a).
Table 4 The most important environmental related tasks of local governments
Improvement of built environment
Improvement of local flora and fauna (increase biodiversity)
Forcing local energy supply
Rainwater drainage
Organisation of waste management
Public cleanliness
Local air quality management
Sewage treatment, drinking water supply
Improvement of green areas, parks, leisure spaces
Source: Varjú, V. 2013a
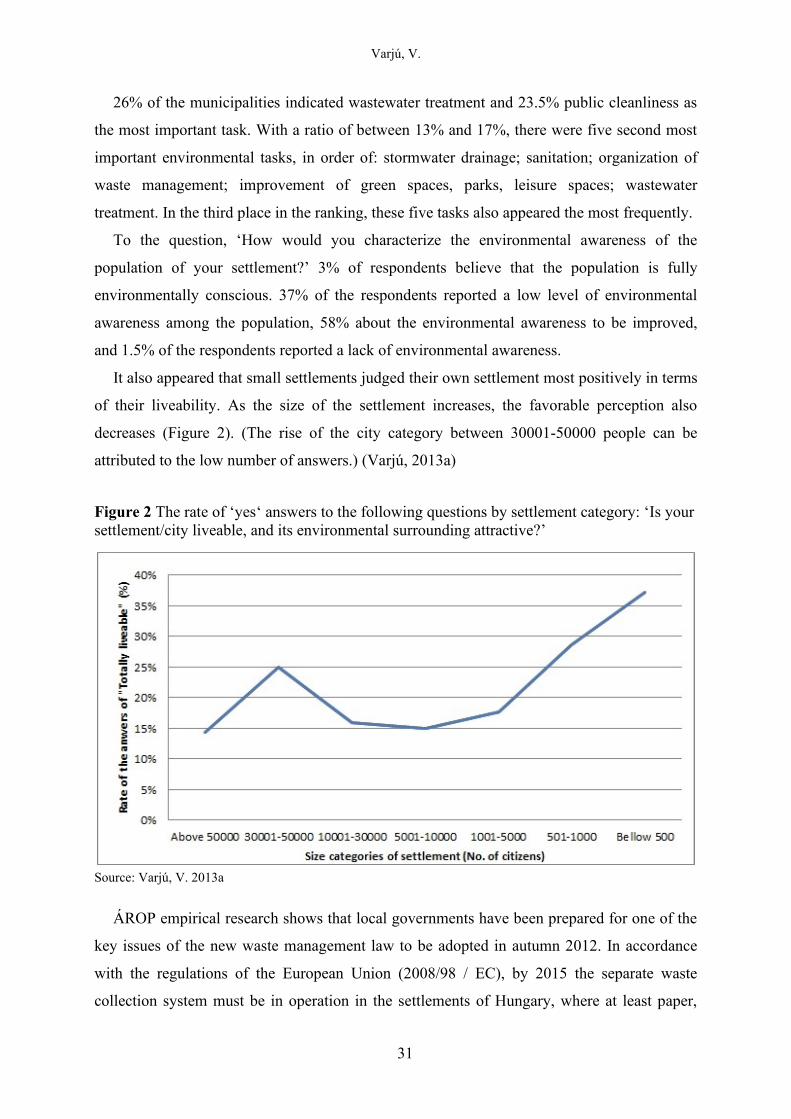
Varjú, V.
31
26% of the municipalities indicated wastewater treatment and 23.5% public cleanliness as
the most important task. With a ratio of between 13% and 17%, there were five second most
important environmental tasks, in order of: stormwater drainage; sanitation; organization of
waste management; improvement of green spaces, parks, leisure spaces; wastewater
treatment. In the third place in the ranking, these five tasks also appeared the most frequently.
To the question, ‘How would you characterize the environmental awareness of the
population of your settlement?’ 3% of respondents believe that the population is fully
environmentally conscious. 37% of the respondents reported a low level of environmental
awareness among the population, 58% about the environmental awareness to be improved,
and 1.5% of the respondents reported a lack of environmental awareness.
It also appeared that small settlements judged their own settlement most positively in terms
of their liveability. As the size of the settlement increases, the favorable perception also
decreases (Figure 2). (The rise of the city category between 30001-50000 people can be
attributed to the low number of answers.) (Varjú, 2013a)
Figure 2 The rate of ‘yes‘ answers to the following questions by settlement category: ‘Is your
settlement/city liveable, and its environmental surrounding attractive?’
Source: Varjú, V. 2013a
ÁROP empirical research shows that local governments have been prepared for one of the
key issues of the new waste management law to be adopted in autumn 2012. In accordance
with the regulations of the European Union (2008/98 / EC), by 2015 the separate waste
collection system must be in operation in the settlements of Hungary, where at least paper,
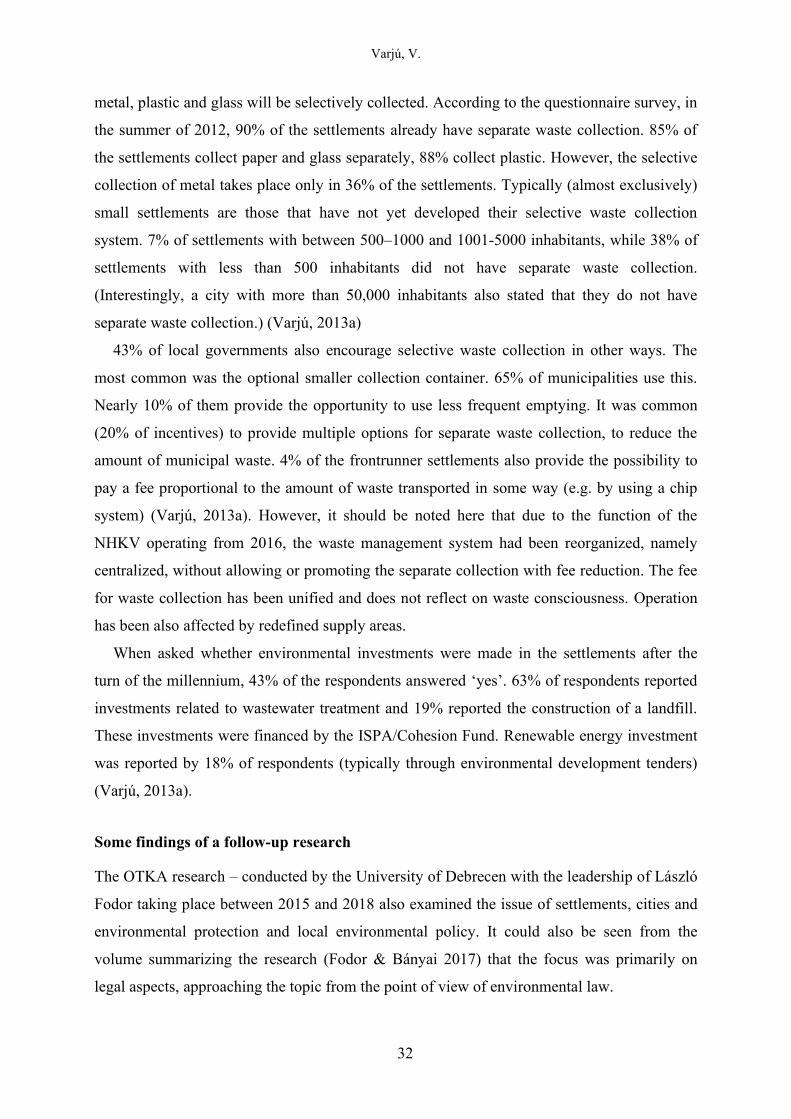
Varjú, V.
32
metal, plastic and glass will be selectively collected. According to the questionnaire survey, in
the summer of 2012, 90% of the settlements already have separate waste collection. 85% of
the settlements collect paper and glass separately, 88% collect plastic. However, the selective
collection of metal takes place only in 36% of the settlements. Typically (almost exclusively)
small settlements are those that have not yet developed their selective waste collection
system. 7% of settlements with between 500–1000 and 1001-5000 inhabitants, while 38% of
settlements with less than 500 inhabitants did not have separate waste collection.
(Interestingly, a city with more than 50,000 inhabitants also stated that they do not have
separate waste collection.) (Varjú, 2013a)
43% of local governments also encourage selective waste collection in other ways. The
most common was the optional smaller collection container. 65% of municipalities use this.
Nearly 10% of them provide the opportunity to use less frequent emptying. It was common
(20% of incentives) to provide multiple options for separate waste collection, to reduce the
amount of municipal waste. 4% of the frontrunner settlements also provide the possibility to
pay a fee proportional to the amount of waste transported in some way (e.g. by using a chip
system) (Varjú, 2013a). However, it should be noted here that due to the function of the
NHKV operating from 2016, the waste management system had been reorganized, namely
centralized, without allowing or promoting the separate collection with fee reduction. The fee
for waste collection has been unified and does not reflect on waste consciousness. Operation
has been also affected by redefined supply areas.
When asked whether environmental investments were made in the settlements after the
turn of the millennium, 43% of the respondents answered ‘yes’. 63% of respondents reported
investments related to wastewater treatment and 19% reported the construction of a landfill.
These investments were financed by the ISPA/Cohesion Fund. Renewable energy investment
was reported by 18% of respondents (typically through environmental development tenders)
(Varjú, 2013a).
Some findings of a follow-up research
The OTKA research – conducted by the University of Debrecen with the leadership of László
Fodor taking place between 2015 and 2018 also examined the issue of settlements, cities and
environmental protection and local environmental policy. It could also be seen from the
volume summarizing the research (Fodor & Bányai 2017) that the focus was primarily on
legal aspects, approaching the topic from the point of view of environmental law.
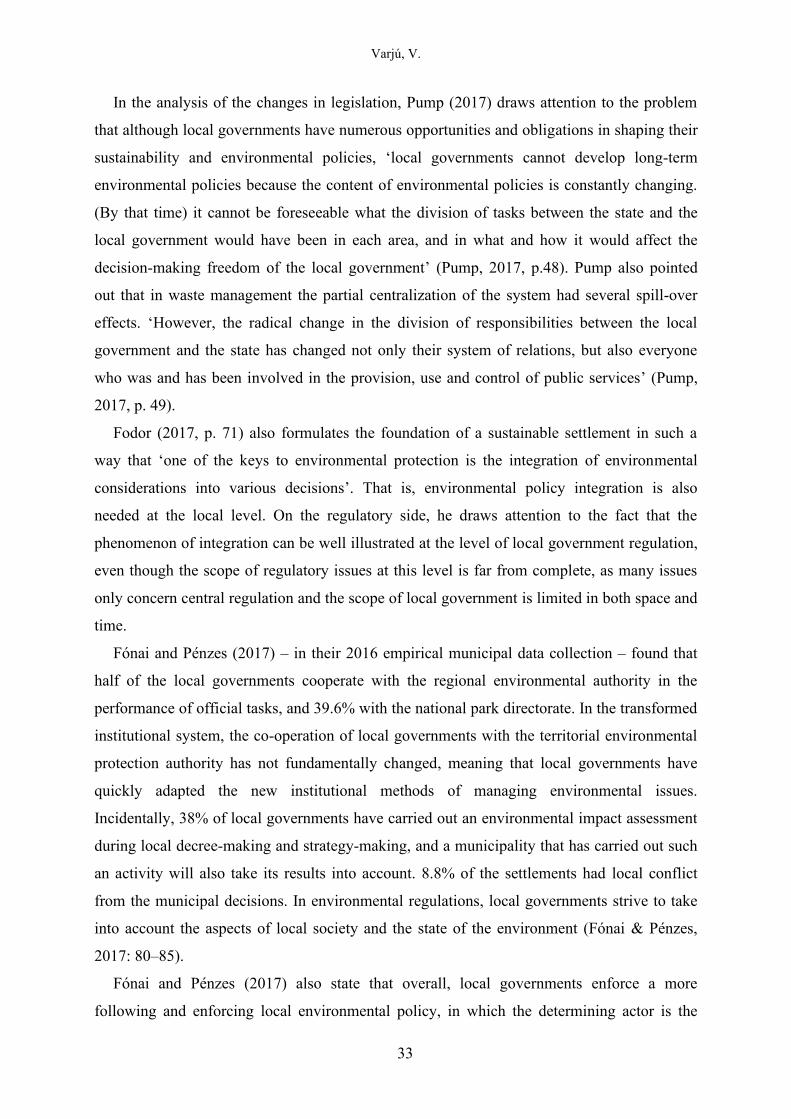
Varjú, V.
33
In the analysis of the changes in legislation, Pump (2017) draws attention to the problem
that although local governments have numerous opportunities and obligations in shaping their
sustainability and environmental policies, ‘local governments cannot develop long-term
environmental policies because the content of environmental policies is constantly changing.
(By that time) it cannot be foreseeable what the division of tasks between the state and the
local government would have been in each area, and in what and how it would affect the
decision-making freedom of the local government’ (Pump, 2017, p.48). Pump also pointed
out that in waste management the partial centralization of the system had several spill-over
effects. ‘However, the radical change in the division of responsibilities between the local
government and the state has changed not only their system of relations, but also everyone
who was and has been involved in the provision, use and control of public services’ (Pump,
2017, p. 49).
Fodor (2017, p. 71) also formulates the foundation of a sustainable settlement in such a
way that ‘one of the keys to environmental protection is the integration of environmental
considerations into various decisions’. That is, environmental policy integration is also
needed at the local level. On the regulatory side, he draws attention to the fact that the
phenomenon of integration can be well illustrated at the level of local government regulation,
even though the scope of regulatory issues at this level is far from complete, as many issues
only concern central regulation and the scope of local government is limited in both space and
time.
Fónai and Pénzes (2017) – in their 2016 empirical municipal data collection – found that
half of the local governments cooperate with the regional environmental authority in the
performance of official tasks, and 39.6% with the national park directorate. In the transformed
institutional system, the co-operation of local governments with the territorial environmental
protection authority has not fundamentally changed, meaning that local governments have
quickly adapted the new institutional methods of managing environmental issues.
Incidentally, 38% of local governments have carried out an environmental impact assessment
during local decree-making and strategy-making, and a municipality that has carried out such
an activity will also take its results into account. 8.8% of the settlements had local conflict
from the municipal decisions. In environmental regulations, local governments strive to take
into account the aspects of local society and the state of the environment (Fónai & Pénzes,
2017: 80–85).
Fónai and Pénzes (2017) also state that overall, local governments enforce a more
following and enforcing local environmental policy, in which the determining actor is the
Varjú, V.
34
local government, which is somewhat influenced by the local society, and much less by
professional organizations.
CONCLUSION
Not surprisingly, the analyses showed that the lack of information is crucial in the failure of
making environmental assessment. ¾ of Hungarian settlements had no knowledge of the
notion of SEA in 2008. Even more problematic is the fact that the recently presented analyses
and the investigation of the mentioned OTKA also showed that around 9% of Hungarian
settlements do not have an environmental programme that is compulsory since 1995.
Respondents (of empirical researches) were lacking practical experience in the field as well,
especially in smaller settlements, where the lack of (human and financial) capacity seems to
be the most challenging issue. The bottlenecks and frequent shortcomings of the institutional
infrastructure (e.g. local civic interest groups, bureaucratic, often shock-laden green
authorities) do not provide an adequate basis for ‘urban environmental consciousness’.
The past decade of recentralization processes has also affected the potential of cities and
rural settlements to be active in environmental improvement. The hierarchical institutional
setting, the dominance of institutional knowledge set back the emergence of local, territorial
interests, hence the emergence and integration of local environmental cogitations.
In larger, urbanised settlements, due to their higher development and investment capacity
and risk, the role of environmental assessment related to planning activities is considered
more important.
Acknowledgement
The research has been implemented with the support provided from the National Research, Development
and Innovation Fund of Hungary (Geopolitical Processes and Imaginaries in Central Europe: States,
Borders, Integration and Regional Development, NKFI K 134903).
REFERENCES
Bajmóczy, Z., Gébert, J., Málovics, Gy., Méreiné Berki, B., & Juhász, J. (2020). Urban
Strategic Planning from the perspective of well-being: evaluation of the Hungarian
practice. European Spatial Research and Policy, 27(1), 221–241.
Bányai, O. (2017). Helyi stratégiák és környezetvédelem. In Fodor, L., & Bányai O. (Eds.), A
települési önkormányzatok szerepe a környezeti politika és jog alakításában (pp. 91–
108). Debrecen: Debreceni Egyetemi Kiadó.
Carson, R. (1962). Silent Spring. Houghton Mifflin Company.
Dannert, É., & Pirisi, G. (2017). Rusty Hungary: New insights in brownfield research.
European Spatial Research and Policy, 24(1), 5–22. doi:10.1515/esrp-2017- 0001
Varjú, V.
35
Enyedi, Gy. (1984). Az urbanizációs ciklus és a magyar településhálózat átalakulása.
(Akadémiai székfoglaló, 1982. december 6.) Budapest: Akadémiai Kiadó.
Egyed, I. (2018). A tértermelés neomarxista kritikája: a technokrata térreprezentációktól a
lefebvre-i városhoz való jog instrumentalizációjáig. In Faragó, L. (Ed.) Kortárs
térelméletek kelet-közép-európai kontextusban (pp. 165–187). Budapest: Dialóg
Campus Kiadó.
ESDP (1999). [online]
https://ec.europa.eu/regional_policy/sources/docoffic/official/reports/pdf/sum_en.pdf
[Downloaded 17.06.2020]
Fleischer, T. (2004). Gondolatok a közlekedés-fejlesztési programok stratégiai környezeti
vizsgálatáról. ÖKO,12(1–2), 56–66.
Fodor, L. (2017). A környezetvédelmi szabályozás helyi szintjei. In Fodor, L., & Bányai O.
(Eds.), A települési önkormányzatok szerepe a környezeti politika és jog alakításában
(pp. 55–71). Debrecen: Debreceni Egyetemi Kiadó.
Fodor, L., & Bányai, O. (Eds.) (2017). A települési önkormányzatok szerepe a környezeti
politika és jog alakításában. Debrecen: Debreceni Egyetemi Kiadó.
Fónai, M., & Pénzes, F. (2017). Önkormányzatok és helyi környezeti politika – egy empirikus
kutatás eredményei. In Fodor, L., & Bányai O. (Eds.), A települési önkormányzatok
szerepe a környezeti politika és jog alakításában (pp. 73–90). Debrecen: Debreceni
Egyetemi Kiadó.
Glied, V. (2008). Civil szervezetek szerepe a környezetügyekben. [online] 15 p.
http://www.publikon.hu/application/essay/413_1.pdf [Downloaded 17.06.2020]
Hajnal, K. (2006). A fenntartható fejlődés elméleti kérdései és alkalmazása a
településfejlesztésben. PhD dissertation, Pécs: PTE TTK Földrajzi Intézet.
Hajnal, K. (nd). Településökológia – A fenntartható fejlődés elméletének alkalmazása a
településfejlesztésben. [online] http://old.foldrajz.ttk.pte.hu/tarsadalom/letoltes/tel.pdf
[downloaded:17.06.2020]
Héra, G., & Ligeti, Gy. (2005). Módszertan. Bevezetés a társadalmi jelenségek kutatásába.
Budapest: Osiris Kiadó.
Julesz, M. (2008). A környezetvédelem institúciótörténete kitekintéssel. Összefoglaló
megállapítások, következtetések, javaslatok. Közigazgatási szemle, 2, 64–71.
Kerekes, S., & Kiss, K. (Eds.) (2003). A megkérdőjelezett sikerágazat. Az EU
környezetvédelmi követelményeinek teljesítése. Budapest: MTA Társadalomkutató
Központ.
Kilényi, G. (1978). A környezetvédelmi jog elméleti alapjai. Budapest: Dissertation for the
title of Doctor of Sciences.
Kilényi, G., & Tamás, A. (Eds.) (1980). A környezetvédelmi jogi szabályozás fejlesztésének
egyes kérdései. Pécs: MTA DTI–OKTH.
Kozma, D. E. (2019). Comparative Analysis of the Sustainable Development Strategies and
Indicators of the V4. Deturope, 11(2), 101–120.
Lenschow, A. (1997). Variation in EC Environmental Policy Integration: Agency Push
within Complex Institutional Structures. Journal of European Public Policy, 4(1), 109–
127.
Lennert, J., Farkas, J.Z., Kovács, A.D., Molnár, A., Módos, R., Baka, D., & Kovács, Z.
(2020). Measuring and Predicting Long-Term Land Cover Changes in the Functional
Urban Area of Budapest. Sustainability, 12, 3331. https://doi.org/10.3390/su12083331
Leopold, A. (1949) [1987]. A Sand County Almanac. Oxford: Oxford University Press.
Moser, M., & Pálmai, Gy. (1992). A környezetvédelem alapjai. Budapest: Nemzeti
Tankönyvkiadó.
Varjú, V.
36
Nagy, I. (2006). A városökológia elméleti megközelítése. In Kiss, A., Mezősi, G., &
Sümeghy, Z. (Eds.), Táj, környezet és társadalom: ünnepi tanulmányok Keveiné Bárány
Ilona professzor asszony tiszteletére (pp. 541–551). Szeged: SZTE Éghajlattani és
Tájföldrajzi Tanszék, SZTE Természeti Földrajzi és Geoinformatikai Tanszék.
Nagy, I. (2008). Városökológia. Budapest–Pécs: Dialóg Campus.
Németh, K., & Péter, E. (2017). System-oriented approaches to the utilization of renewable
energy sources. In Bukor, J., & Korcsmáros E. (Eds.), A Selye János Egyetem 2017-es
„Érték, minőség és versenyképesség – a 21. század kihívásai” Nemzetközi Tudományos
Konferenciájának tanulmánykötete: Zborník medzinárodnej vedeckej konferencie
Univerzity J. Selyeho (pp. 334–346). Komarno: Selye János Egyetem.
Pump, J. (2017). Helyi környezetpolitika – Göröngyök az úton. In Fodor, L., & Bányai O.
(Eds.), A települési önkormányzatok szerepe a környezeti politika és jog alakításában
(pp. 29–53). Debrecen: Debreceni Egyetemi Kiadó.
Rácz, Sz. (2019). Development Processes of Regional Centres in Central and Southeast
Europe – From State Socialism to Dependent Market Economies. Deturope, 11(2), 92–
100.
Szilvácsku, Zs. (2003). Stratégiai környezeti vizsgálatok gyakorlata az Európai Unióban,
Budapest: Vitaregnat Bt.
Szirmai V. (1999). A környezeti érdekek Magyarországon.Budapest: Pallas Stúdió.
Tatai, Z. (1988). Magyarország környezetvédelmi politikája. Földrajzi Közlemények.
36/112,(3–4), 202–221.
Vardoulakis, S., Dear, K., & Wilkinson, P. (2016). Challenges and Opportunities for Urban
Environmental Health and Sustainability: the HEALTHY-POLIS initiative.
Environmental Health 15, S30 https://doi.org/10.1186/s12940-016-0096-1
Varjú, V. (2010). A környezeti politika fejlesztéspolitikába történő integrációja – a stratégiai
környezeti vizsgálat. PhD Dissertation. Pécs: University of Pécs.
Varjú V. (2011). A fejlesztéspolitikába integrált környezeti politika. Társadalomkutatás,
29(4), 444–459. https://doi.org/10.1556%2FTarskut.29.2011.4.3
Varjú, V. (2013a). A települési önkormányzatok környezetvédelmi orientáltsága.
COMITATUS: Önkormányzati Szemle, 23(213), 21–36.
Varjú, V. (2013b). Environmental Policy Integration – A Need for a Complex Understanding
of “Environmental Cohesion” In Pálné Kovács I., Scott. J., & Gál, Z. (Eds.), Territorial
Cohesion in Europe: For the 70th Anniversary of the Transdanubian Research Institute
(pp. 338–347). Pécs: Institute for Regional Studies, Centre for Economic and Regional
Studies, Hungarian Academy of Sciences.
Varjú, V. (2015). Környezetpolitika és/vagy területfejlesztés: A környezeti- és
fenntarthatósági politika dilemmái és viszonya a fejlesztéspolitikához. Budapest–Pécs:
Dialóg Campus Kiadó; Dóm Kiadó.
Vujko, A., Petrović, M.D., Gostović, D., Radovanović, M., & Vuković, D. (2018). The Role
of Natural Resources in the Ecotourism Development – Residents’ Perceptions in
Subotica (Northern Serbia). Deturope, 10(2), 112–123.
WCED (World Commission on Environment and Development) (1987). Our Common
Future, Oxford: Oxford University Press.
DETUROPE – THE CENTRAL EUROPEAN JOURNAL OF REGIONAL DEVELOPMENT AND TOURISM
Vol. 12 Issue 3 2020 ISSN 1821-2506
Original scientific paper
37
ADAPTATION TO CLIMATE CHANGE THROUGH THEORIES OF
URBAN DEVELOPMENT
Dragana BLAGOJEVIĆa,b, Imre NAGYb, Aco LUKIĆb,c, Dajana TEŠIĆb
aBioSense Institute – The Research and Development Institute for Information Technologies in
Biosystems, Novi Sad, Serbia; [email protected] bUniversity of Novi Sad, Faculty of Sciences, Department of Geography, Tourism and Hotel
Management, Novi Sad, Serbia; [email protected]; [email protected] cCharles University, Faculty of Science, Department of Demography and Geodemography, Prague, Czech
Republic; [email protected]
Cite this article: Blagojević, D., Nagy, I., Lukić, A., & Tešić, D. (2020). Adaptation to climate changes through
theories of urban development. Deturope. 12(3): 37-57.
Abstract
The average temperature of the world over the past 100 years has risen by 0.6°C. The rising temperature
will likely present a big challenge for society and the environment in the future. The population has the
ability to respond to it in a variety of ways, especially nowadays when technology is evolving daily. In
order to reduce the harmful impacts of climate change and allow communities to thrive in the face of it,
adaptation strategies are needed. These strategies need to be accepted by local and national governments,
households, and industry. This paper has aimed to derive information about each and discuss the best
solution. A theory of smart cities, eco-city theory, city logistics, and sustainable cities are the main
strategies whose concepts have upgraded urban planning and building design that can prevent climatic
damage but are still consistent with the environment. Innovative cities in developed and developing
countries have demonstrated that with the appropriate strategies resource efficiency can be economically
enhanced while simultaneously reducing pollution and waste. It is shown that this way improves the
quality of life and supports the development of a culture of sustainability.
Keywords: climate change, adaptation, smart city, sustainability, eco-city, city logistics
INTRODUCTION
Global warming is affecting all the world today and the effect is not a good one. It is
estimated that the global average surface temperature has increased by approximately 0.07°C
per decade during the period 1901–2010 (NOAA National Centers for Environmental
Information, 2019; Barry et al., 2018; IPCC, 2001). According to one of the most reliable
sources, The World Meteorological Organization which coordinates weather services around
the globe, the average global temperature, today compared with the second half of the 19th
century, has increased by 0.85°C (Desyatkin, 2018) (Figure 1). It was announced that the
warmest year remains 1998, while each of the last 10 years (1995–2004), apart from 1996, is
one of the warmest 10 years on record (Pittock, 2005).
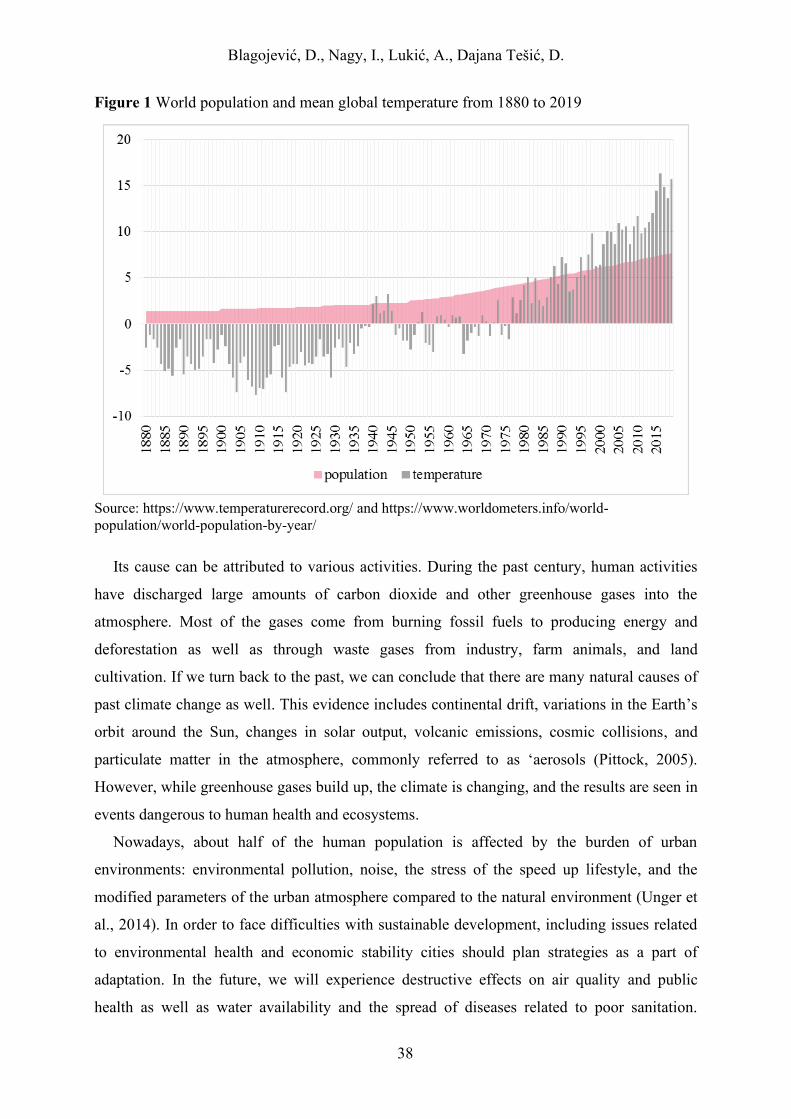
Blagojević, D., Nagy, I., Lukić, A., Dajana Tešić, D.
38
Figure 1 World population and mean global temperature from 1880 to 2019
Source: https://www.temperaturerecord.org/ and https://www.worldometers.info/world-
population/world-population-by-year/
Its cause can be attributed to various activities. During the past century, human activities
have discharged large amounts of carbon dioxide and other greenhouse gases into the
atmosphere. Most of the gases come from burning fossil fuels to producing energy and
deforestation as well as through waste gases from industry, farm animals, and land
cultivation. If we turn back to the past, we can conclude that there are many natural causes of
past climate change as well. This evidence includes continental drift, variations in the Earth’s
orbit around the Sun, changes in solar output, volcanic emissions, cosmic collisions, and
particulate matter in the atmosphere, commonly referred to as ‘aerosols (Pittock, 2005).
However, while greenhouse gases build up, the climate is changing, and the results are seen in
events dangerous to human health and ecosystems.
Nowadays, about half of the human population is affected by the burden of urban
environments: environmental pollution, noise, the stress of the speed up lifestyle, and the
modified parameters of the urban atmosphere compared to the natural environment (Unger et
al., 2014). In order to face difficulties with sustainable development, including issues related
to environmental health and economic stability cities should plan strategies as a part of
adaptation. In the future, we will experience destructive effects on air quality and public
health as well as water availability and the spread of diseases related to poor sanitation.
Blagojević, D., Nagy, I., Lukić, A., Dajana Tešić, D.
39
Extreme weather events will cause widespread damage to infrastructure, loss of life, and
livelihoods. Because of all this, urban centers are key in strategies to reduce greenhouse gas
emissions, especially in reducing dependence on carbon-based fuels. Impacts of climate
change vary according to geographic locations. Inland cities in the desert and subtropical
locations are likely to experience longer and more serious droughts. On the other hand, in the
mountainous and arctic regions, there will be less snow cover as well as shorter winters.
Possibly the most serious impacts will be in coastal areas and small islands where the main
risks will be rising sea levels and more frequent floods, droughts, and cyclones (Handmer et
al., 2012).
The design of cities creates unique microclimates that affect variables including
temperature and wind. The urban heat island effect is an example where cities are warmer
than their surroundings due to the complex topography and mass of buildings, which replaced
previous vegetated surfaces (Hebbert, Jankovic, & Webb, 2011). Because of this, appropriate
urban planning and building design are important. Suitable architecture can prevent buildings
from warming up and ensures comfortable indoor environments. In order to reach the
maximum thermal comfort in urban areas, climatic aspects should be considered at all scales,
from the design of individual buildings to regional planning (Unger et al., 2014). For reasons
such as these, cities often suffer from weather and climate hazards.
THEORETICAL BACKGROUND
Greenhouse gases include carbon dioxide, methane, and oxides of nitrogen, that can absorb
heat radiation from the Sun and the Earth. Moreover, these gases can emit absorbed heat
energy as infrared radiation in all directions. These gases are called greenhouse gases and act
like a thick blanket surrounding the Earth. Natural greenhouse gases include carbon dioxide,
methane, and water vapor. These help to keep Earth some 33°C warmer than if there were no
greenhouse gases and clouds in the atmosphere (Pittock, 2005). The increase in carbon
dioxide has been caused primarily by burning fossil fuels (coal, oil, and natural gas) and the
clearing of forests that held reservoirs of carbon in wood and soils and removed carbon
dioxide from the atmosphere through photosynthesis. The increase in the other two major
greenhouse gases is mostly due to agricultural activities: methane (CH4) through growing rice
and raising cattle, and nitrous oxide (N2O) from the application of the high-temperature
combustion of fossil fuels (The Maryland Commission on Climate Change, 2008). Major
natural sources whose natural cycles increased the atmospheric concentration of CO2 to the
Blagojević, D., Nagy, I., Lukić, A., Dajana Tešić, D.
40
atmosphere are animal respiration, microbial breakdown of dead organic matter and soil
carbon, and ocean to atmosphere exchange (Hardy, 2003). Since inter-annual growth of CH4
slowed and became significantly variable in the 1990s, compared with the 1980s, it has been
suggested that a significant ratio of the current CH4 emissions are anthropogenic rather than
natural (Benson, 2008).
The effects of climate change include variations in biosphere ambient temperature, which
could lead to heat stress, change in rainfall patterns, sea-level rise, saltwater intrusion, loss of
biodiversity, drought, habitat loss, and freshwater depletion and pollution as well as urban
infrastructure damages: electricity, water pollution, increased spread of diseases, sanitation
systems, etc. (Benson, 2008; Bulkeley et al., 2009). Since more than 50% of the world
population is concentrated in cities, the human population is affected by the burden of urban
environments: environmental pollution, noise, the stress of the speed up lifestyle, and the
modified parameters of the urban atmosphere compared to the natural environment (Unger et
al., 2014). In order to face difficulties with sustainable development, including issues related
to environmental health and economic stability cities should plan strategies as a part of
adaptation. Because of all this, urban centers are key in strategies to reduce greenhouse gas
emissions, especially in reducing dependence on carbon-based fuels. Climate change impacts
are different in different geographic locations. Inland cities in the desert and subtropical
locations are likely to experience longer and more serious droughts, while in mountainous and
arctic regions there will be less snow cover as well as shorter winters. Possibly the most
serious impacts will be in coastal areas and small islands where the main risks will be rising
sea levels and more frequent floods, droughts, and cyclones.
As a reasonable approach in dealing with this problem, there is spatial planning.
Developing an urban environment in a way that ensures a safe place to live on the one hand
and a clean, healthy environment on the other hand is the key to reducing emissions and
adapting to possible events. The government and local authorities should encourage certain
planning patterns that will contribute to the reduction of emissions and promote renewable
energy sources (Bulkeley et al., 2009). This can be achieved by considering a range of
solutions to city adaptation such as eco-cities, sustainable cities, smart cities, city logistics,
and so on. This paper will explore these concepts with some examples and discuss the best
urban development decision.
The design of cities creates unique microclimates that affect variables including
temperature and wind. The urban heat island effect is an example where cities are warmer
than their surroundings due to the complex topography and mass of buildings, which replaced
Blagojević, D., Nagy, I., Lukić, A., Dajana Tešić, D.
41
previous vegetated surfaces (Hebbert et al., 2011). Because of this, appropriate urban
planning and building design are important. Suitable architecture can prevent buildings from
warming up and ensures comfortable indoor environments. To reach the maximum thermal
comfort in urban areas, climatic aspects should be considered at all scales, from the design of
individual buildings to regional planning (Unger et al., 2014). For reasons such as these, cities
often suffer from weather and climate hazards.
It is important to mention that forms of adaptation are not uniform due to their dependence
on geographical location. However, a specific urban form in one location might not be
suitable for the other location and vice versa. Therefore it is essential to develop a form that
will conform more to local or regional than global conditions (Yiannakou & Salata, 2017).
The Intergovernmental Panel on Climate Change (IPCC) defined mitigation as any action
designed to either reduce future emissions of greenhouse gases or to enhance the existing
capacity of carbon sinks. In the beginning, the primary scientific focus was on mitigating
greenhouse gas emissions. The main policy outlines of mitigation strategies have been closely
connected to energy policy, with a tendency to increase the share of renewable sources of
power, adopting efficiency goals to power and heating needs, restructuring freight and
passenger transport systems to lower the greenhouse emissions. Mitigation should be
considered as a form of future adaptation, with efforts to reduce current and future emissions
of greenhouse gases, because it is believed that climate changes will be so great as to
overwhelm the adaptive capacity of social and natural systems (Driscoll, 2010).
Mitigation
Cities have a major role in mitigation since urban residents are not just victims of climate
change, but they are part of the problem, therefore they must also contribute to its solution.
The best idea is to start making efforts in emissions control locally to improve the quality of
life and the productivity of cities on a global level. Those efforts are invested today in cities in
sectors such as construction and urban planning because they can ‘lock-in’ a level of
emissions for the time. To avoid the dangerous impacts of climate change, it is important to
do something to reduce global emissions of greenhouse gases. To do so, mitigation needs time
to take effect due to the complexity of the climate system and the time necessary to reduce
emissions sufficiently to stabilize climate.
Pittock (2005) in his book “Climate Change: Turning Up the Heat” defined several general
ways of how mitigation can be achieved. One such solution is by increasing energy efficiency
by reducing carbon dioxide emissions that were closely related to the gross domestic product
Blagojević, D., Nagy, I., Lukić, A., Dajana Tešić, D.
42
(GDP) of individual countries during the early period of the twentieth century. Fuel
substitution is another possible solution. It can be defined as the substitution of one readily
available fuel with another, as distinct from the development of new alternative fuels or
energy sources. Switching from coal to oil or gas can reduce greenhouse gas emissions. The
main problem lies in substitution. For example, China and India are richly endowed with coal
but poorly endowed with oil and gas. Other countries, such as the United States, Japan,
Australia, and western European countries can afford fuel substitution. However, some 70%
of gas reserves are in the former Soviet Union and the Middle East. Limited availability of
reserves of natural gas and costs may limit switching to gas supplies for power generation.
The presence of natural assets (urban parks, forests, green belts) and components (trees,
water) in urban contexts contributes to the quality of life in many ways. They provide
environmental services such as air and water purification, wind and noise filtering, and
microclimatic stabilization (Chiesura, 2004). Cities with varied land areas as distinct urban
land use, however, often comprise a mosaic of warm and cold areas as distinct urban land-use
changes, for example, the change between the park and built-up area can produce intra urban
temperature differences up to 7°C. The urban landscape influences the wind pattern and
regional wind speed is usually reduced by the city. Trees and buildings usually reduce the
effect of the wind but may also create local areas with higher wind speeds and eddy
circulations. All of this indicates how much climate in the city is dependent on factors such as
land use, building geometry, and building materials. Thus, there are many reasons for urban
planners to design whilst bearing climate in mind (Eliasson, 2000).
Natural hazards and their associated risks continued to occur and seemed to increase in
complexity, magnitude, and frequency, causing issues in the social-economic-environmental
support systems of countries affected. The Intergovernmental Panel on Climate Change
(IPCC) predicts that due to climate change, the South Asia region will be affected by heavy
precipitation. Many islands are vulnerable to cyclones, storm surges, tsunamis, and sea-level
rise. It is very difficult to design the best approach to disaster risk reduction when the region
is hit by multiple devastating disasters. Governments across the world start thinking about
investing in proactive approaches with preparedness and mitigation towards disaster risk
reduction. Furthermore, the collaboration and cooperation among different stakeholders,
including UN agencies, regional and international organizations, civil sectors, private sectors,
media, and academics are crucial for effective disaster risk reduction to improve the resilience
of communities (Tyagi et al., 2016).
Blagojević, D., Nagy, I., Lukić, A., Dajana Tešić, D.
43
The main questions this paper attempts to answer are: (1) What needs to be done to
consider these urban development theories as possible solutions for climate change in cities?
(2) Which strategy/theory represents the best solution? (3) What are the main challenges that
these theories are facing?
METHODOLOGY
The applied research methodology consisted of the interpretation and understanding of the
general effects of climate change in cities. The most recent literature on this subject was
examined and discussed with a focus on different ways of adaptation and mitigation. The
main method of the research was qualitative analysis through scientific papers and reports
reviews. This paper aimed to underline the benefits, profits, and usefulness of investigating
smart technologies in cities helping them to adapt to climate change and prepare for emergent
situations. This research attempts to uncover trends in ideas and opinions, and dive deeper
into the problems of urban development.
Firstly, the definition, causes, and effects of climate change needed to be discussed. This
is followed by a brief review of temperature changes of the past and the challenges that big
cities are facing. There are various strategies of city adaptation, but the success of their
implementation depends on the government, urban policies, and citizens as well as a
country’s level of development. Secondly, different theories of adaptation were examined and
introduced including their definitions, benefits, concepts, and application difficulties. Each
city adaptation theory is explained in more detail through direct utilization examples. In the
end, the action of mitigation is considered. Mitigation is an important part of a city’s
adaptation to climate change because it can turn theory into practice. The analysis of theories
and different scientific opinions on this subject is an input for further researches since it
provides a complete overview of current global issues.
RESULTS AND DISCUSSION
According to the United Nations Human Settlements Programme (UN Habitat, 2009), local
government institutions responsible for urban and regional planning and development can
play a proactive and coordinating role in enhancing urban food security and city resilience.
Innovative cities in both the developed and developing world have demonstrated that with the
appropriate strategies they can economically enhance their resource efficiency while
Blagojević, D., Nagy, I., Lukić, A., Dajana Tešić, D.
44
simultaneously reducing harmful pollution and unnecessary waste. This way they have
improved the quality of life of their citizens, strengthened their fiscal capacity and created an
enduring culture of sustainability (Suzuki, Dastur, Moffatt, Yabuki, & Maruyama, 2010).
There are three major types of theories of adaptation: sustainable eco-cities, smart cities,
and city logistics. There are no clear, universally accepted definitions of these terms. They are
interconnected and cannot be implemented individually.
Sustainable cities
There are many definitions of sustainable development. The definition proposed by Stoddart
(2011) is a reliable one: the overall goal of sustainable development is the long-term stability
of the economy and environment, which is only achievable through the integration and
acknowledgment of economic, environmental, and social concerns throughout the decision-
making process.
There is a considerable amount of research that defines and characterizes the form of a
sustainable city. The physical dimensions include its size, shape, land uses, configuration, a
city’s transportation system, and urban design features (Jenks & Jones, 2009). The
environmental (water and energy saving, waste recycling, transportation, etc.) as well as
social and economic criteria are central to each different definition of a sustainable city. The
most important factors that can make the city livable, pleasant, and attractive for citizens are a
great amount of public green spaces, public parks, and recreation areas (Chiesura, 2004). To
create a sustainable urban environment, it is crucial to identify areas of opportunity as well as
concern and to respond by developing realistic sustainability goals with a long-term
perspective. Efficient governance informed by science-driven policies is a critical component
of sustainable development (Science for Environment Policy, 2018). Egger (2006) claims that
the city is not an isolated system. It impacts the sustainability of systems hosted within it, as
well those within which it exists, such as regional and global ecosystems and economies. To
develop cities sustainably, we need to understand the complex interactions between the
environment, economy, and society.
One of the main obstacles to achieving this goal is climate change. A big challenge lies in
our ability to achieve the ecological, economical, and social objectives that define sustainable
cities. Building a qualitative environment is encouraging sustainable development and
adaptive capacity of the city at the same time. Reducing vulnerability to the hazards
associated with current and future climate variability and extremes through specific policies,
Blagojević, D., Nagy, I., Lukić, A., Dajana Tešić, D.
45
and programs, individual initiatives, participatory planning processes, and other community
approaches can reduce vulnerability to climate change.
Eco-cities
The term ‘eco-city’ refers to a human settlement that provides a qualitative standard of living
without depleting the ecosystem, natural resources, and biogeochemical cycles on which it
depends and relies (“Shenzhen Declaration on Eco-city Development 2002”; White, 2002;
Witting, 2007).
The terms ‘eco-city’ and ‘sustainable city’ emerged at different points of time but now
both are firmly embedded in the urban environmental sustainability agenda, more recently in
the context of climate change. In practice, the term ‘eco-city’ is often used to describe new
cities rather than the modification of existing cities (as in the case of ‘sustainable cities’). The
greatest challenge for these developing ideas is their public acceptance since these concepts
produce radical changes in people’s established views, lifestyles, and behavioural patterns
(Koh, Gunawansa, & Bhullar, 2010).
Green infrastructure can provide multiple services for the local economy. These include
pollinating crops on behalf of the agri-food systems, or recharging aquifers on behalf of the
water supply system, or channelling wind toward open hilltops, or creating water basins on
behalf of the local energy utility. They can reduce the average temperature in cities, absorb
carbon dioxide, and release oxygen, they can generally increase physical and mental well-
being (Suzuki et al., 2010).
It is very important to ensure that the construction of eco-cities and the development of
cities produces economic and social benefits, eco-efficiency, and restores the true harmony
between man and nature. Urban green spaces are multifunctional in the urban context that
benefits people’s quality of life. In order to meet the social and psychological needs of
citizens, green spaces need to be distributed throughout the city area, and the total area
covered by green space in the city should be large enough to accommodate the city
population's needs (Mersal, 2017). City plan developments need to include energy-efficient
buildings, renewable energy, efficient distribution of clean water and waste, green transport
schemes, clean air zones. These plans are not only about the construction of infrastructure for
roads, buses, and railways; they are also about pricing and management, regulations applying
to the location of homes, the use of cars, and the complete design of cities. All of these
involve decisions of individuals on where to live, how to move, how to interact, and how to
commute, and their effects on others. No plan fits all cities, each of them should pick a
Blagojević, D., Nagy, I., Lukić, A., Dajana Tešić, D.
46
strategy that is the best for improving their efficiency, making greater use of renewable
sources, and improving the environment for innovation (Rode et al., 2013).
One of the biggest problems that all cities are facing is the cost of green technology since it
requires high initial investments. Therefore, it is very important to attract investments. In
general, different investors and enterprises are invited by local authorities (central, provincial,
or municipal governments) to participate in the construction and development of eco-city
projects. Here, the biggest problem is when some major projects fall into the hands of private
companies that turn them into an opportunity for profit. Therefore the eco-city project
represents an expression of green capitalism (Saiu, 2017).
Overall, cities have a major role in protecting their citizens and economy. City government
adaptation actions should contribute to identifying climate change risks, taking actions and
initiatives to reduce the impacts of climate change, providing information and regulations to
be more resilient to climate change. Calculating the project costs and benefits of a specific
adaptation activity is a key aspect of the city planning process prior to seeking financing
options.
Smart cities
The International Data Corporation – IDC defines smart city development as the use of smart
initiatives combined to boost technology investments in an entire city, with common
platforms increasing efficiency, data being shared across systems, and IT investments. The
mission of a truly smart city is to improve the quality of life for citizens and visitors (Yesner
& Ozdemir, 2017).
Researchers say that a city is “smart” when it can integrate and synchronize formal
leadership and endogenous democratic participation in the IT-based urban ecosystem. Smart
cities are creative and intelligent. Strategic choice, visions, and paths differ from city to city.
These planning steps are defined by the identity and resources of cities. Smart cities should
offer a balanced mix of technologies, institutions, and people. They must be based on the
smart combination of the contribution and activities of citizens with an awareness of the
ecosystem, and the importance of high quality of life. Griffinger et al. (2007) defines five
sectors of a smart city: smart people, smart governance, smart mobility, smart environment,
and smart living.
Research on smart cities has also been propelled by the ever-increasing availability of data
related to the urban environment. Dealing with the life cycle of city data requires de-noising,
cleaning, anonymization, and privacy protection. All of this implies a need for advances and
Blagojević, D., Nagy, I., Lukić, A., Dajana Tešić, D.
47
optimizations in software engineering and service-oriented architectures, together with the
processing of distributed, networked, dynamic city-data. Obtained and analyzed data should
bring tangible services and solutions to citizens. The smart city represents the future
challenge, a city model where the technology serves the individual and his or her economic
and social life quality improvement (Celino & Kotoulas, 2013). Collecting spatial information
in one city can be achieved by using the Internet of Things technology. This means that
various types of sensors are set at different locations and are used for generating information
and creating a database that needs to be analyzed. The coordination and best use of data
provides the main connection between information technologies and smart city concepts. IoT
helps the government and businesses in making strategic plans as well as making the best use
of decision-making processes (Samih, 2019). IoT has a wide usage and application in
different domains such as home automation, healthcare, education, emergency, traffic,
garbage collection, etc. This way huge amounts of data are made transparent and available to
citizens who will be more familiar with the state of their city and involved in managing their
living environment. In addition, the data that is gathered can be analyzed, estimated, and
divided in real-time and finally turned into exploitable knowledge. To accomplish something
like this, information needs to be shared and visible and multiple sectors need to cooperate
and work for the community and the city (Zanella, Bui, Castellani, Vangelista, & Zorzi, 2014;
Jin, Gubbi, Marusic, & Palaniswami, 2014). Zanella et al. (2014) reported a table of services
that should exist in a smart city and are connected with IoT: structural health, waste
management, air quality monitoring, noise monitoring, traffic congestion, city energy
consumption, smart parking, smart lighting, and automation and salubrity of public buildings.
They emphasized that an urban IoT infrastructure depends on the consolidation of different
kinds of technologies with already installed communication technologies. This is important
due to the development of the IoT in a city that wants to be smart.
In fact, both the public and private sectors have a common goal in developing this idea. In
the term of ‘smart cities’ Internet plays a fundamental role in communication, information
sharing, and processing, data transfer, and analysis. Various operations need to be covered:
business, citizens, optimizing energy and water production or consumption, traffic
management, public safety, and emergency response. All of these are proof that the Internet-
based solutions can successfully address societal challenges. Therefore, smart cities are
dependent on country, government, natural resources, IT knowledge, and capacities as well as
their ability to create a smart citizen who will be engaged and empowered and positively
contribute to the city and the community.
Blagojević, D., Nagy, I., Lukić, A., Dajana Tešić, D.
48
City Logistics
The idea of city logistics holds one of the keys to achieving a balance between the benefits of
moving freight in, out of, and within the city and the environmental, social, and economical
nuisance and cost associated with these activities (Benjelloun, Crainic, & Bigras, 2008).
Savelsbergh and Van Woensel (2016) consider that city logistics is finding efficient ways
to transport goods in urban areas while taking into account the negative effects on congestion,
safety, and the environment. One of the main characteristics of city logistics is to recognize
that transporting goods in urban areas has a negative (as well as a positive) impact on the lives
of people living in these urban areas.
According to the Institute of City Logistics, city logistics is “the process for totally
optimizing the logistics and transport activities by private companies in urban areas while
considering the traffic environment, the traffic congestion, and energy consumption within the
framework of a market economy.” (Neto, Galves, Junior, & Tacla, 2008, pp. 139). It concerns
the means to achieve freight distribution in urban areas, by improving the efficiency of urban
transportation, reducing traffic congestion, and mitigating environmental impacts (Neto et al.,
2008).
It is important to emphasize that transportation infrastructure is vulnerable to flooding and
higher temperatures associated with climatic changes. It will be necessary for the coming
decades for spatial planners to systematically analyze the vulnerability of each portion of the
transportation system and attempt to build resiliency. One of the most intractable problems in
many cities is the increasing distance between residences and workplaces that are far larger
than many public transport systems were built to service. As a result, many people resort to
car usage to make daily trips to work, school, retail excursions, or leisure activities (Driscoll,
2010). This can be the main purpose of the city logistics concept of development, to solve
problems such as these in order to protect the environment, health and to prevent drastic
global climate change. There are many benefits to this idea such as: improved productivity,
efficiency, customer service, traffic situation, reduced number of transport movements,
reduced air pollution and noise emission, as well as higher land productivity (Benjelloun et
al., 2010; Neto et al., 2008).
To develop a qualitative transport network, stakeholders must take into account users’
decisions and actions and address their needs. A possible solution is to work from home as
well as car-sharing and cycling. These measures can have a positive impact on traffic
problems and also on people’s health and lifestyles (Rezende Amaral, Šemanjski, Gautama, &
Blagojević, D., Nagy, I., Lukić, A., Dajana Tešić, D.
49
Aghezzaf, 2018). It is well-known that the most important characteristic of human activities is
mobility. Humans are used to being on the move, to change many locations a day enabling
them to have a qualitative social, healthy life. The studies showed that people who use the
“ecological” way of transport are more productive at work and have better performance and
more energy during the day. Active mobility has many positive effects on the lifestyle and
overall health of the population as well as a great impact on the economy and working elan.
This can be achieved by many strategies that involve investments in pedestrian and cycling
infrastructures, better public transport connections, and taking care of their safety (UNECE,
2020).
When planning urban transport cover areas and network lines, stakeholders must be
referred to the urban distribution. This information is essential for achieving the goal to
successfully ensure a stable and constant connection between consumers and suppliers as well
as companies and their workers. They need to follow people's movements, to try to predict
their needs and predetermine the infrastructure accordingly. There are many variations in
mobility. However, it depends on the purpose, intensity, routine, as well as on the part of the
day. All this knowledge is part of the process of totally optimizing urban logistics activities by
considering the social, environmental, economic, financial, energy, and lifestyle factors
(European Platform on Sustainable Urban Mobility Plans, 2019).
The aim of this concept is to support the sustainable development of cities and to address
challenging problems such as high levels of traffic congestion, negative environmental
impacts, high energy consumption, and a shortage of trained labor.
The model
The model (Figure 2) represents each of these adaptation theories as well as their main
advantages. There are problems that society is facing during climate change, hence possible
solutions through mitigation should be considered. Each of these problems can be solved by
using one of these urban development theories or a combination of more. To achieve this,
key-people need to recognize it as an essential tool that they need to investigate. Key-people
represent stakeholders: local community, government, citizens, households, industry, anyone
who is involved in making strategies related to climate change.
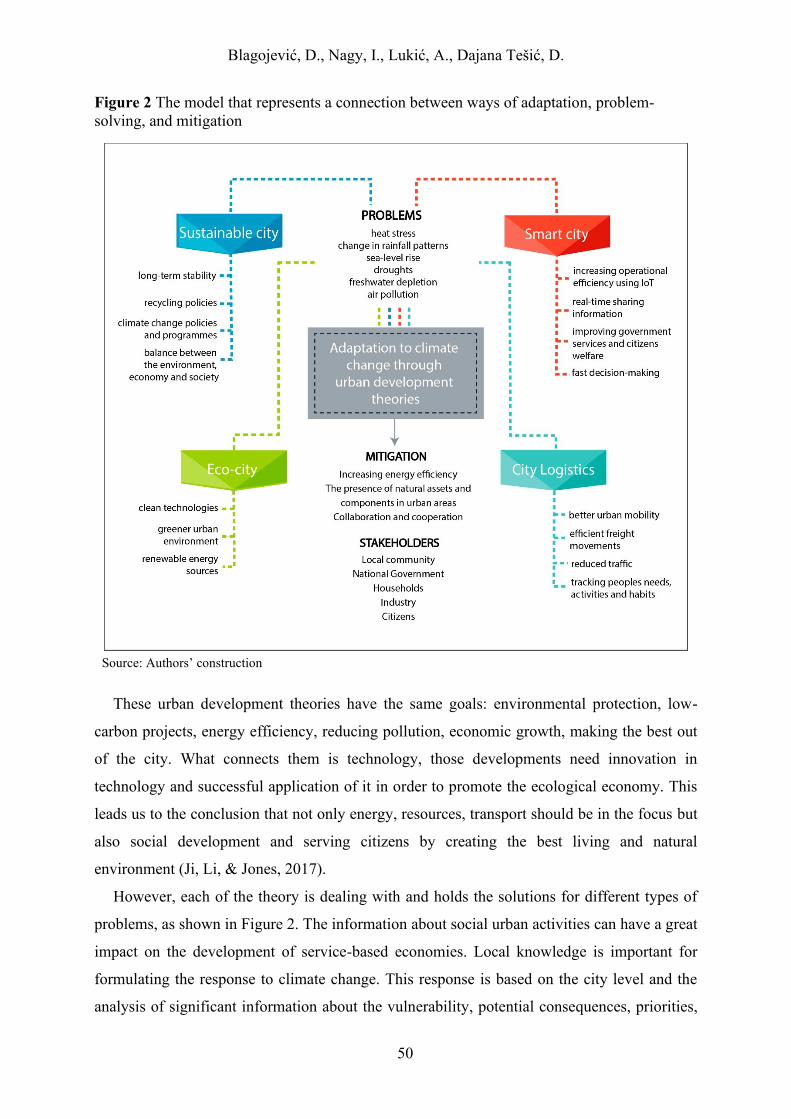
Blagojević, D., Nagy, I., Lukić, A., Dajana Tešić, D.
50
Figure 2 The model that represents a connection between ways of adaptation, problem-
solving, and mitigation
Source: Authors’ construction
These urban development theories have the same goals: environmental protection, low-
carbon projects, energy efficiency, reducing pollution, economic growth, making the best out
of the city. What connects them is technology, those developments need innovation in
technology and successful application of it in order to promote the ecological economy. This
leads us to the conclusion that not only energy, resources, transport should be in the focus but
also social development and serving citizens by creating the best living and natural
environment (Ji, Li, & Jones, 2017).
However, each of the theory is dealing with and holds the solutions for different types of
problems, as shown in Figure 2. The information about social urban activities can have a great
impact on the development of service-based economies. Local knowledge is important for
formulating the response to climate change. This response is based on the city level and the
analysis of significant information about the vulnerability, potential consequences, priorities,
Blagojević, D., Nagy, I., Lukić, A., Dajana Tešić, D.
51
and predictions (Heinrichs, Krellenberg, & Fragkias, 2013). The integration of different
concepts and strategies can be the last vision of these theories of urban development. In
combination, a city can be digital, with green infrastructure, sustainable, and resilient. Urban
sustainability is a concept that gathers all theories and is focused on economic development,
population growth, climate change, and social security, and qualitative life. To deliver these,
sustainability stakeholders must advocate and deliver them to the citizens who, on the other
hand, need to be engaged in this process (Martin, Evans, & Karvonen, 2018; De Jong, Joss,
Schraven, Zhan, & Weijnen, 2015).
Implementations of adaptation theories
Europe plays a leading role in international climate and environmental politics. European
research is developing a great number of projects that consider urban planning strategies and
designing sustainable neighborhoods. The first projects have been constructed mainly in
northern Europe. The most popular examples include those of Ecolonia (Alphen Aan den
Rijn, The Netherlands, 1989–1993), Vauban (Freiburg, Germany, 1997–2008), EVA-
Lanxmeer (Culemborg, The Netherlands, 1994–2009), Solar City (Linz, Austria, 1998–2001)
and BedZed (London, UK, 2000–2002) (Saiu, 2017). In 1992 the United Nations presented
Agenda 21, an action plan that had sustainable development goals on national and
international levels. This strategy established a new global partnership. Chapter 9 Protection
of the atmosphere discusses climate change, environmental protection, air pollution, the
vulnerability of nature, and human impact (United Nations, 1992). More projects from Europe
are the Sustainable Energy Action Plan (SEAP) and Sustainable Energy and Climate Action
Plan (SECAP) in the signatory of the Covenant of Mayors. These plans aim to reduce
greenhouse gas emissions between 2020 and 2030 as well as to adapt to the climate change
impacts (Covenant of Mayors & Joint Research Centre of the European Commission, 2014;
2016). The objective of the EU “to reduce GHG emissions to 80-90% below 1990 levels by
2050” is represented through the Energy roadmap 2050 (2011). Its goal is to realise
development by working as a group. The roadmap focuses on the share of energy use and
contains five so-called “decarbonization scenarios” (European Commission, 2011).
China, which the Global Carbon Project identifies as the biggest carbon polluter in the
world, is the single largest developer of renewable power and heat over the past eight years
and has the greatest number of employees in the renewable energy sector in the world.
Dongtan, Caofeidian, and Tianjin (SSTEC) are the most well-known sustainable projects in
China, which can be allocated to three different approaches to the project. The first

Blagojević, D., Nagy, I., Lukić, A., Dajana Tešić, D.
52
sustainable city developed in India is Lavasa, and Masdar is the World’s first zero-carbon, a
zero-waste city in Abu Dhabi. These last two projects are representative of a more
technological approach, getting closer to the theoretical model of smart cities (Saiu, 2017).
The city-state of Singapore uses sensors and IoT-enabled cameras to monitor the
cleanliness of public spaces, crowd density, and the movement of locally registered vehicles.
Its smart technology helps companies and residents monitor energy use, waste production,
and water use in real-time. In Dubai, the United Arab Emirates, smart city technology is used
for traffic routing, parking, infrastructure planning, and transportation. Barcelona, Spain, uses
a sensor to monitor temperature, pollution, and noise, as well as monitor humidity and rain
levels (Rouse, 2017).
However, the Better World Solutions website analyzed the key objectives of the top 10
eco-cities that were ranked highest in terms of environmental sustainability. The eco-city
number one is Reykjavik, Iceland. This city uses geothermal energy and almost 95% of
heating is provided through this renewable source. It focuses on the development of the public
transportation system and the preservation of green spaces. Upcoming cities are Zurich
(Switzerland), Bristol (South West England), Portland (Oregon), San Francisco (California),
etc. From 2005 to 2010 Bristol was able to reduce domestic energy use by 16%. The target of
this city is to reduce CO2 emissions by 40% by 2020 and by 80% by 2050 (“Top 10 Eco-
Cities”, 2019).
CONCLUSION
To avoid the worst consequences of global climate change, the global population needs to
reduce present active construction and development of urban capacity and to turn their plans
to the greener side of urban design. How we perform that construction and development will
depend on how we accept the growing presence of information technology in all aspects of
our lives (Harrison & Donnnelly, 2011).
There are many strategies for city adaptation, as mentioned above. To be considered as
possible solutions for climate change and its negative impact on cities globally, these
adaptation theories need to be accepted by local and national governments, households, and
industry and they need to act together. This is also the main argument while answering the
first research question. When speaking about climate change adaptation in cities, it must be
emphasized that it also refers to making existing and new infrastructure resistant to the effects
of climate change. Since these strategies are focused on certain actions in terms of
Blagojević, D., Nagy, I., Lukić, A., Dajana Tešić, D.
53
transportation, energy, food and agriculture, urban greening, and green infrastructure, one has
to apply a smart approach in considering which of them, or maybe a combination of these,
will contribute the most to better urban living, better functioning of industry, and protection of
the environment.
Additionally, while adopting the eco-city theory, it is essential to determine its
sustainability since the environmental sustainability of eco-cities is questionable. Eco-cities
employ several ecological ideas and clean technologies to test their potential to reduce the
ecological footprint, but on the other side, they pay less attention to the environmental impact
during the planning and construction stage. Finally, the development and maintenance of eco-
cities will require a reconceptualization of current legal and policy frameworks (Koh et al.,
2010).
A theory of smart cities is developed on the intense interest in the role of information
technology in cities. It is time to develop a solid theoretical foundation and to develop an
understanding of how these technical methods can help to achieve today’s goals and
challenges (Harrison & Donnnelly, 2011). It can be concluded that a smart city is a
municipality that uses information and communication technologies to increase operational
efficiency, share information with the public, and improve both the quality of government
services and citizen welfare. Sustainable and eco-city are often considered as the same term
because of the absence of a universally acceptable definition. The city logistics enables the
mobility of urban freight through the transportation of goods by or for commercial entities
taking place in an urban area. This strategy is centered on ensuring efficient freight
movements and innovative responses to the urban customer and business demands. Based on
these descriptions and definitions of these theories, the answer to the second research question
is that they are not independent. When making a decision on which one to implement,
confusion can easily occur. There is no “one-best” solution because each theory produces
results in different areas, but they work for the same goal and that goal is adaptation to
climate change through specific urban development. Because of this fact, the best strategy is a
multidisciplinary approach to problem solving.
All theories are facing many challenges when it comes to their implementation or adoption
by responsible institutions. The main challenge for city logistics is global urbanization, the
level of concentration of the global population living in cities is increasing (Rácz, 2019). On
the other hand, this population can contribute to the realization of better city connection,
availability of certain industries, better functionality of society and mobility. It depends on the
strategy to meet these challenges by fulfilling the requirements, aims, regulations, and
Blagojević, D., Nagy, I., Lukić, A., Dajana Tešić, D.
54
policies. The greatest challenges for smart city and eco-city theories are high costs of the
required technology and business logistics as well as its inaccessibility to the wider
population. To make society, industry and city sustainable, strategies need to take into
account their habits, mentalities, activities, and understand what they consider sustainable
because after all a city must be customized for people.
To summarize, the rising concentration of carbon dioxide in the atmosphere is a
consequence of the burning of fossil fuels for various economic activities. The other causes of
climate change include agriculture and changes in land-use patterns. To reduce the harmful
impacts of climate change and allow communities to thrive in the face of climate change,
adaptation strategies are needed. It is obvious that some adaptation measures do impact the
urban landscape and the development of green areas changes people’s perception of the city.
Because of this, before making a decision about which strategy is the best it is essential to
consider patterns in human behavior in terms of energy use, and their dwelling or office in
general so that energy consumption in the city can be modified. The second main task is
mitigation. Mitigation strategies should offer feasible and cost-effective ways to reduce
greenhouse gas emissions. these include the use of clean and renewable energy for electricity
production as well as developing greener urban infrastructure.
REFERENCES
Barry, A. A., Caesar, J., Klein Tank, A. M. G., Aguilar, E., McSweeney, C., Cyrille, A. M., ...
& Touray, L. M. (2018). West Africa climate extremes and climate change
indices. International Journal of Climatology, 38, 921–938. DOI: 10.1002/joc.5420
Benjelloun, A., & Crainic, T. G. (2008). Trends, challenges, and perspectives in city
logistics. Proceedings of Transportation and land use interaction, TRANSLU, 8, 269–
284.
Benson, N. (2008). Climate Change, Effects. In S. G. Philander (Ed.), Encyclopedia of Global
Warming and Climate Change (pp. 210–214). USA: Sage Publications, Inc.
DOI: 10.4135/9781412963893.n129
Bulkeley, H., Schroeder, H., Janda, K., Zhao, J., Armstrong, A., Chu, S. Y., & Ghosh, S.
(2009). Cities and Climate Change: The Role of Institutions, Governance and Urban
Planning in Cities and Climate Change: Responding to an Urgent Agenda, Hemdon,
VA, USA: World Bank, 125–159.
Celino, I., & Kotoulas, S. (2013). Smart Cities [Guest editors' introduction]. IEEE Internet
Computing, 17(6), 8–11. DOI: 10.1109/MIC.2013.117
Chiesura, A. (2004). The Role of Urban Parks for the Sustainable City. Landscape and Urban
Planning, 68(1), 129–138. DOI: 10.1016/j.landurbplan.2003.08.003
Covenant of Mayors & Joint Research Centre of the European Commission (2014). Reporting
Guidelines on Sustainable Energy Action Plan and Monitoring. Retrieved from:
Blagojević, D., Nagy, I., Lukić, A., Dajana Tešić, D.
55
http://dev.eumayors.eu/IMG/pdf/Reporting_Guidelines_SEAP_and_Monitoring_v2-0-
2.pdf
Covenant of Mayors & Joint Research Centre of the European Commission (2016). The
Covenant of Mayors for Climate and Energy Reporting Guidelines. DOI:
10.2790/586693
De Jong, M., Joss, S., Schraven, D., Zhan, C., & Weijnen, M. (2015). Sustainable-smart-
resilient-low carbon-eco-knowledge cities; making sense of a multitude of concepts
promoting sustainable urbanization. Journal of Cleaner Production, 109, 25–38. DOI:
10.1016/j.jclepro.2015.02.004
Desyatkin, R. V. (2018). Climate change and the dynamics of permafrost ecosystems of
continental cryolithozone of the northern hemisphere. Vestnik RAS, 88(12), 494-501.
DOI: 10.31857/S086958730003190-7
Driscoll, P. A. (2010). Climate Change Mitigation, Adaptation and Sustainable Urban
Development: A Case Study of Copenhagen and Portland. Urban Planning and
Management (Report No. 3). Aalborg University.
Egger, S. (2006). Determining a sustainable city model. Environmental Modelling &
Software, 21(9), 1235–1246. DOI: 10.1016/j.envsoft.2005.04.012
Eliasson, I. (2000). The use of climate knowledge in urban planning. Landscape and Urban
Planning, 48(1), 31–44. DOI: 10.1016/S0169-2046(00)00034-7
European Commission (2011). Energy roadmap 2050. Retrieved from:
https://ec.europa.eu/energy/sites/ener/files/documents/2012_energy_roadmap_2050_en
_0.pdf
European Platform on Sustainable Urban Mobility Plans (2019). Sustainable Urban logistics
Planning. Retrieved from:
https://www.eltis.org/sites/default/files/sustainable_urban_logistics_planning.pdf
Giffinger, R., Fertner, C., Kramar, H., Kalasek, R., Pichler-Milanovic, N., & Meijers, E.
(2007). Smart cities – Ranking of European medium-sized cities (Report). Vienna
University of Technology, Austria.
Handmer, J., Honda, Y., Kundzewicz, Z. W., Arnell, N., Benito, G., Hatfield, J., Mohamed, I.
F., Peduzzi, P., Wu, S., Sherstyukov, B., Takahashi, K., & Yan, Z. (2012). Changes in
impacts of climate extremes: human systems and ecosystems. In Field, C. B. et al.
(Eds.), Managing the Risks of Extreme Events and Disasters to Advance Climate
Change Adaptation: A Special Report of Working Groups I and II of the
Intergovernmental Panel on Climate Change (IPCC) (pp. 231–290). Cambridge
University Press, Cambridge, UK, and New York, NY, USA.
Hardy, J. T. (2003). Climate change: causes, effects, and solutions. United States: John Wiley
& Sons.
Harrison, C., & Donnelly, I. A. (2011). A theory of smart cities. Proceedings of the 55th
Annual Meeting of the ISSS-2011, 55(1), Hull, UK.
Hebbert, M., Jankovic, V., & Webb, B. (Eds.) (2011). City weathers: Meteorology and urban
design, 1950–2010. Manchester, England: Manchester Architecture Research Centre.
Heinrichs, D., Krellenberg, K., & Fragkias, M. (2013). Urban Responses to Climate Change:
Theories and Governance Practise in Cities of the Global South. International journal of
Urban and Regional Research, 37(6), 1865–1878. DOI: 10.1111/1468-2427.12031
IPCC, 2001: Climate Change 2001: The Scientific Basis. Houghton, J. T., Ding, Y., Griggs,
D. J., Noguer, M., Van der Linden, P. J., & Xiaosu, D. (Eds.), Intergovernmental Panel
on Climate Change. Cambridge University Press, Cambridge, UK. www.ipcc.ch
Jenks, M., & Jones, C. (Eds.). (2009). Dimensions of the sustainable city (Vol. 2). Berlin,
Germany: Springer Science & Business Media.
Blagojević, D., Nagy, I., Lukić, A., Dajana Tešić, D.
56
Ji, Q., Li, C., & Jones, P. (2017). New green theories of urban development in China.
Sustainable Cities and Society 30, 248–253. DOI: 10.1016/j.scs.2017.02.002
Jin, J., Gubbi, J., Marusic, M., & Palaniswami, M. (2014). An Information Framework for
Creating a Smart City Through Internet of Things. IEEE Internet of Things Journal
1(2), 112-121. DOI: 10.1109/JIOT.2013.2296516
Koh, K. L., Gunawansa, A., & Bhullar, L. (2010). “Eco-Cities” and “Sustainable Cities” –
Whither? Social Space, 84–92.
Mersal, A. (2017). Eco City Challenge and Opportunities in Transferring a City into Green
City. Procedia Environmental Sciences, 37, 22–33. DOI: 10.1016/j.proenv.2017.03.010
Maddox, T. (2018, July 2016). Smart cities: A cheat sheet. TechRepublic. Retrieved from
https://www.techrepublic.com/article/smart-cities-the-smart-persons-guide/
Martin, C., Evans, J., & Karvonen, A. (2018). Smart and sustainable? Five tensions in the
visions and practices of the smart-sustainable city in Europe and North America.
Technological Forecasting and Social Change, 133, 269–278. DOI:
10.1016/j.techfore.2018.01.005
Neto, A. P., Galves, M. L., Júnior, O. L., & Tacla, D. (2008). Challenges of urban transport
problems and city logistics: Sao Paulo city center case. WIT Transactions on The Built
Environment, 101, 133–142. DOI: 10.2495/UT080131
NOAA National Centers for Environmental Information, State of the Climate: Global Climate
Report for Annual 2019 (2020). Retrieved from
https://www.ncdc.noaa.gov/sotc/global/201913.
Pittock, B. A. (2005). Turning up the heat. London, United Kingdom: Earthscan.
Rácz, S. (2019). Development Processes of Regional Centres in Central and Southeast Europe
– From State Socialism to Dependent Market Economies. Deturope, 11(2), 92–
100. http://www.deturope.eu/img/upload/content92-100.pdf
Rode, P., Floater, G., Kandt, J., Baker, K., Montero, M., Heeckt, C., Smith, D. & Delfs, M.
(2013). Going Green: How Cities Are Leading the Next Economy. LSE Cities
Rezende Amaral, R., Šemanjski, I., Gautama, S., & Aghezzaf, E-H. (2018). Urban Mobility
and City Logistics – Trends and Case Study. Promet 30(5), 613-622. DOI:
10.7307/ptt.v30i5.2825
Rouse, M. (2017). New Trend in IoT: Digital Twin Tech. IoT Agenda. Retrieved from
https://internetofthingsagenda.techtarget.com/definition/smart-city
Saiu, V. (2017). The Three Pitfalls of Sustainable City: A Conceptual Framework for
Evaluating the Theory-Practice Gap. Sustainability, 9(12), 2311. DOI:
10.3390/su9122311
Samih, H. (2019). Smart cities and internet of things. Journal of Information Technology
Case and Application Research, 21(1), 3–12. DOI: 10.1080/15228053.2019.1587572
Savelsbergh, M., & Van Woensel, T. (2016). 50th anniversary invited article–city logistics:
Challenges and opportunities. Transportation Science, 50(2), 579–590. DOI:
10.1287/trsc.2016.0675
Shenzhen Declaration on Eco-city Development (2002). The Fifth International Eco-City
Conference. Adopted by the attendees of the fifth international eco-city conference,
Shenzhen, China.
Stoddart, H. (Ed.) (2011). A Pocket guide to sustainable development governance. London,
UK: Stakeholder Forum.
Suzuki, H., Dastur, A., Moffatt, S., Yabuki, N., & Maruyama, H. (2010). Eco2cities:
ecological cities as economic cities. Washington, DC: World Bank.
The Maryland Commission on Climate Change (2008). Comprehensive Assessment of
Climate Change Impacts in Maryland. University of Maryland Center for
Environmental Science, Cambridge, Maryland.
Blagojević, D., Nagy, I., Lukić, A., Dajana Tešić, D.
57
Top 10 Eco Cities (2020, February 9). Retrieved from
https://www.betterworldsolutions.eu/top-10-eco-cities/
Tyagi, B., Saluja, S., Srivastava, N., Bharti, N., Bhattacharya, P. K., Aslam, S., & Aggarwal
V. (2016). Effects of Various Disaster Management Approaches: An Evidence
Summary. Contextualisation of Review Findings for South Asia and Bangladesh.
London: EPPI-Centre, Social Science Research Unit, UCL Institute of Education,
University College London.
UNECE (2020). A Handbook on Sustainable Urban Mobility and Spatial Planning. Geneva.
Retrieved from: http://www.unece.org/fileadmin/DAM/trans/main/wp5/publications/
1922152E_WEB_light.pdf
United Nations Human Settlements Programme (UN-Habitat) (2009). Planning Sustainable
Cities – Global Report on Human Settlements, Earthscan, UK and USA.
United Nations (1992). Agenda 21. United Nations Conference on Environmental &
Development, 3–14 June Rio de Janeiro, Brazil. Retrieved from:
https://sustainabledevelopment.un.org/content/documents/Agenda21.pdf
Unger, J., Savić, S., Gál, T., Milošević, D., Kosztolányi, É., & Marković, V. (2014). Urban
climate and monitoring network system in Central European cities. Novi Sad, Serbia:
University of Novi Sad, Faculty of Sciences and University of Szeged, Department of
Climatology and Landscape Ecology.
Yesner, R., & Ozdemir, F. (2017). Understanding Smart City Transformation with Best
Practices. International Data Corporation, Istanbul, Turkey.
Yiannakou, A., & Salata, K. D. (2017). Adaptation to Climate Change through Spatial
Planning in Compact Urban Areas: A Case Study in the City of Thessaloniki,
Sustainability 9(2), 1–18. DOI: 10.3390/su9020271
White, R., R. (2002). Building the Ecological City. Cambridge, United Kingdom: Woodhead
Publishing Ltd.
Wittig, R. (2007). Principles for Guiding Eco-City Development. In Carreiro, M. M. et al.
(Eds.) Ecology, Planning, and Management of Urban Forests: International
Perspectives (pp. 29–34). New York: Springer.
Zanella, A., Bui, N., Castellani, A., Vangelista, L., & Zorzi, M. (2014). Internet of Things for
Smart Cities. IEEE Internet of Things Journal, 1(1), 22–32. DOI:
10.1109/JIOT.2014.2306328
DETUROPE – THE CENTRAL EUROPEAN JOURNAL OF REGIONAL DEVELOPMENT AND TOURISM
Vol. 12 Issue 3 2020 ISSN 1821-2506
Original scientific paper
58
THE ECONOMIC STRUCTURE AND PERFORMANCE OF THE
CATCHMENT AREA OF THE HUNGARIAN REGIONAL CENTERS
Judit BERKESa
a Széchenyi István University, Kautz Gyula Faculty of Business and Economics, H-9026 Győr, Egyetem
tér 1., Hungary; e-mail: [email protected]
Cite this article: Berkes, J. (2020). The economic resource of the catchment area of the Hungarian regional
centers. Deturope. 12(3): 58-81.
Abstract
This study examines the economic structure and performance of urban catchment areas. The five largest
Hungarian regional centers are a traditional part of the Hungarian city network, as they are the five most
populous cities after Budapest. The approach of territorial research is increasingly focused on the fact that
the city as a center should not be studied without its immediate surroundings (agglomeration, region,
catchment area). This study also keeps this in mind. The data were processed for the period between 1992
and 2015, on the basis of which the change can also be examined. Development trajectories show very
different tendencies; Győr operates the catchment area as a strong center, while the surroundings of Pécs
became fragmented due to the weakness of the center. Miskolc is characterized by a stagnant area, where
the operation of another sub-center is very intensive, thus improving economic performance. Szeged is a
solid center, whose catchment area is stabilized by several substations. The area of Debrecen is divided,
the center is not able to energize its area.
Keywords: economic structure, economic performance, economy of Hungarian catchment areas, regional
centers
INTRODUCTION
Cities are important stakeholders of regional processes, as they have a number of functions
that are responsible for the region's quantitative growth and quality improvement. On the
other hand, special mention should be made of the settlements of the area surrounding the city
and their characteristics. In this space, complex “movements” and relationships are created in
which the effects of the participants' developmental processes on each other are expected to
be well defined and have a significant impact on the quality of life of the population.
It is a well-known fact that the imbalance in the Hungarian urban network is constantly
increasing as a result of the social and economic resources of Budapest (Beluszky, 2014;
Kovács, 2017). Some attempts have been made in the past century to slow down or stop the
process, e.g. the National Concept for Settlement Network Development of 1971 and its
predecessor drawing on the main principles of French spatial planning (Egyed, 2016), but
Berkes, J.
59
these were not very successful, although we believe that this process cannot and should not be
slowed down. Budapest's international weight is steadily increasing (Rácz, 2019), although it
is clearly not considered to be a metropolis of European significance (Hajdú et al. 2017), but
its economic strength to attract foreign capital makes it the most suitable city for transnational
corporations, thus the continuity of its growth is organic. However, this study focuses on the
next level of the hierarchy, the role of the network of the five largest regional centers.
The aim of the paper is to present the economic potential of Hungarian cities based on the
specific definition of roles. In this analysis, the economic performance and structure and
changes in the economy of the five largest regional centers and their catchment areas are
organized in a unified structure. The diversity of the cities is the most interesting feature of
the study, as there are no two similar settlements, and these special features make the
Hungarian city network special. Urban development is influenced by the qualities acquired in
the past. The changes in the economic and social system, which were more frequent and more
complex in our region compared to the Western European countries, and the processes of
market transformation sometimes brought the whole country under enormous pressure leading
to the reorganization of territorial processes. The different ages left their marks on the cities,
and this research also aims to identify the most prominent ones. In the case of the largest
regional centers, we seek to investigate the dominant characters that can promote the
development of the settlement network of their environment and support their role and tasks
within their own environment. The aim of the research is to analyze the position of the five
largest regional centers in the Hungarian spatial structure, since we believe that their position
in the Hungarian settlement hierarchy does not determine, but rather influences their
development. The aim is to examine what kind of tasks the domestic regional centers can
fulfill and whether they can fulfill their expected role. Another goal is to explore the functions
through which they can provide resources to their environment.
THEORETICAL BACKGROUND
Most theoretical concepts identify economic potential with employment potential and firm
productivity (Beluszky & Győri, 1999, 2003; Rechnitzer, Csizmadia & Grosz, 2004;
Rechnitzer, Páthy, & Berkes, 2014; KSH, 2014). In this research the interpretation was
formulated in a similar way, but not entirely following this idea. Economic activity is mainly
emphasized in those centers which have a strong presence of economic institutions and a
geographical concentration of enterprises, including large-scale Fordist mass production
Berkes, J.
60
plants. An important basis of the research is the study of Molnár et al. (2018): the character of
Hungarian big cities shows marked differences in the specific economic performance
indicators and the structural characteristics. For the most part, the processing industry is
dominant; Győr shows an outstanding performance, the economic performance of Pécs,
Szeged and Debrecen related to public services is strong. The present study also includes this
approach by including the settlements of the catchment area.
As a result of its strong economic potential, the catchment area will also be the dominant
economic server for the center; suppliers, partners, service providers may appear in
neighboring settlements. It not only concentrates economic potential but also radiates to its
area. Economic potential is examined through two dimensions. On the one hand, the structure
of the economy is a defining characteristic. This refers to the existence and quantity of
economic institutions, the characteristics and demographics of the composition of enterprises.
On the other hand, economic efficiency is the other aspect of the interpretive framework.
Efficiency is usually defined as the materials received from economic activity, the sum value
of production. In addition to the center, we also seek to examine the economic efficiency and
structure of the settlements in the catchment area, because the changes of the last decades
have also had an impact on catchment areas. By change or process we mean the consequences
due to the transformation of the market economy in the nineties, the effect of which is most
visible in the economy – through this, of course, in employment as well.
The basic assumption is that the economic performance and structure can be clearly
determined on a theoretical and methodological level. However, it must be seen that it is very
difficult to determine what economic potential means and assign it an indicator through which
we can make relevant statements about the economy of a city. It is necessary to examine how
balanced the role of cities and catchment areas in the economy is (typical or atypical
processes), how it has changed, whether the economic performance and structure of
catchment area settlements is actually visible or not considered significant.
An area that is connected to the city due to one or even several of its functions, triggering
the physical movement of the population of the surrounding area due to the use of urban
goods, is called a catchment area. One of the tools for this is the institutional system, with the
help of which the center can mediate its functions to the population of the surrounding area,
as well as the economic agglomeration, which creates an employment catchment area.
Commercial and service units and functions can also form an area around the center. In line
with the “central location” theory, it can be stated as a basic law that people living in the
immediate, short-range environment of the center show intense and close attachment to the
Berkes, J.
61
center (agglomeration zone), but the distance is related to the degree of attraction, which may
appear on the horizon of the population (attraction, by which the area of the temporary
attraction zone may be formed).
There are several known methods for delimiting the catchment area, two of which are
highlighted. One group is made up of gravity models based on spatial distance and mass. The
theory states that the more central functions a center performs, the more extensive its area of
attraction will be and the more its area will be able to attract mass (Reilly 1929 quotes Nagy
G. 1996; Kiss & Szalkai, 2014). The testing of the gravity model was also received with
interest by Beluszky (1967), who was mostly concerned with the experimental application of
large-area attractiveness. Other Hungarian researchers were also interested in the model and
its application possibilities (Nagy G. 1996; Süli-Zakar, 1996, Kiss & Bajmócy, 2001), and
even the methodology of the topic inspired researchers (Sikos, 1984; Nemes Nagy & Piros
1984; Dusek, 2003). The gravity model was of great interest in the late 1990s and after the
turn of the millennium, but there were several methodological errors in its application (see the
response of Dusek (2011) to the discussion paper by Nagy (2011) on the possibilities of using
the gravity model to delimit urban areas). We accept and agree that the application of the
gravity model is problematic, inducing a number of methodological questions (rather than
answering them).
Another method is empirical delimitation. Beluszky (1981) was the most emblematic
researcher to use this method; delimiting the catchment area of the cities based on the
frequency of visits to the center (e.g. commuting to work and school, health, customer traffic,
etc.). This method is also widespread in Hungarian research, with the help of which the
catchment area of some Hungarian cities was examined, for example, Eger (Bodor & Pénzes,
2012), Nyíregyháza (Beluszky, 1974), Szolnok (Nagy R. 1988), Gyöngyös (Bujdosó, 2009),
Szekszárd (Fodor & Hajdú, 1985), Debrecen (Papp, 1981), Győr (Hardi, 2014), and
Tiszafüred (Vadász, 1981). Most of these are called complex delimitations, involving several
sectors (e.g. health, education, trade, employment), and the different sectoral catchment areas
(layers) have been formed into one complex. The aim of this study is not to delimit a complex
catchment area, only to highlight the economic-employment space.
There are special sector catchment areas that are delineated according to a certain aspect;
such as transport (Szalkai, 2010; Tóth & Nagy, 2013), trade (Győri 2010), commuting (Szabó
P. 1998, Hardi 2005, 2014), education (Hardi 2007; Kuttor & Péter, 2016), economy (Kozma,
1998; Koppány, Kovács, & Szabó, 2014), labor market (Sütő, 2008; Pénzes, Molnár &
Pálóczi, 2014), and Pálóczi et al. (2016) examined the functional regions in Hungary based on
Berkes, J.
62
commuting data (with a complex method). Among these researches, the following should be
highlighted. Hardi's (2014) independent, calculated catchment area is similarly based on the
proportion of commuters. VÁTI (Salamin, Radvánszky, & Nagy, 2008) carried out a
delimitation of the labor market catchment area similar to the present research in connection
with the RePUS project (Benini & Naldi 2007), the aim of which was mainly to analyze the
characteristics of the settlement network. However, the labor catchment areas organized
around the centers were also presented.
Important and relevant results for the present research are adopted from the study of Koós
(2007) who deals with issues of economic suburbanization (and its relation to employment)
and identifies economic suburbanisation areas in Hungary, which forms the theoretical basis
of the study. He found that in addition to the center, agglomerations also show a significant
economic performance (based on 2004 data), which the study attempts to verify, also
presenting the subsequent processes. The results support the creation of clusters based on firm
density. It depicts a static state and does not show the change, the direction of examination is
also different; the goal is to identify the centers.
Based on the latter detailed studies and agreeing with the findings of Pálóczi et al. “The
most regular and massive personal relationship between the employment centers and the
surrounding settlements is commuting to work” (Pénzes, Molnár, & Pálóczi, 2014: 475), it
became justified to create an independent, calculated, commuting-based catchment method.
OBJECTIVES AND METHODS
Territorial delimitation
As a first step, territorial delimitation is required. As a priority, the center should not be
regarded as a self-standing unit, excluding its surroundings and territorial connections, so we
decided to designate a catchment area. The basis for this is the attraction of labor. The most
important research antecedent of the delimitation is the delimitation of HCSO agglomerations
and settlement complexes in 2014, which has already been discussed before, but here we
present the basic differences between the present research and one carried out by the HCSO1.
1The HCSO has prepared a delimitation of labour market districts, which, although not closely related to the
study, is important to mention. The atlas was developed according to the method of Coombes and Bond (based
on the number of employees), the full version of the study indicates commuters above 5% in each labour market
district, but the districts themselves are based only on the optimal and minimum number and proportion of
employees and not commuters (HCSO, Regional Atlas – Other territorial delimitations, 2014).
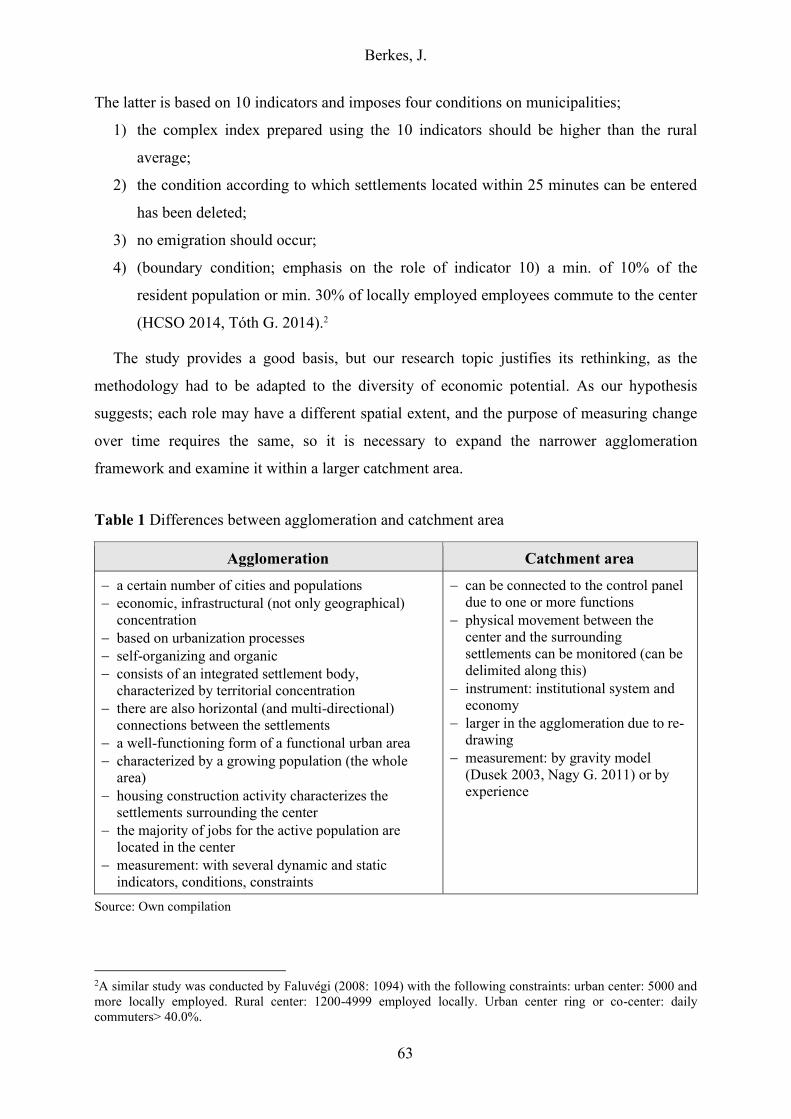
Berkes, J.
63
The latter is based on 10 indicators and imposes four conditions on municipalities;
1) the complex index prepared using the 10 indicators should be higher than the rural
average;
2) the condition according to which settlements located within 25 minutes can be entered
has been deleted;
3) no emigration should occur;
4) (boundary condition; emphasis on the role of indicator 10) a min. of 10% of the
resident population or min. 30% of locally employed employees commute to the center
(HCSO 2014, Tóth G. 2014).2
The study provides a good basis, but our research topic justifies its rethinking, as the
methodology had to be adapted to the diversity of economic potential. As our hypothesis
suggests; each role may have a different spatial extent, and the purpose of measuring change
over time requires the same, so it is necessary to expand the narrower agglomeration
framework and examine it within a larger catchment area.
Table 1 Differences between agglomeration and catchment area
Agglomeration Catchment area
− a certain number of cities and populations
− economic, infrastructural (not only geographical)
concentration
− based on urbanization processes
− self-organizing and organic
− consists of an integrated settlement body,
characterized by territorial concentration
− there are also horizontal (and multi-directional)
connections between the settlements
− a well-functioning form of a functional urban area
− characterized by a growing population (the whole
area)
− housing construction activity characterizes the
settlements surrounding the center
− the majority of jobs for the active population are
located in the center
− measurement: with several dynamic and static
indicators, conditions, constraints
− can be connected to the control panel
due to one or more functions
− physical movement between the
center and the surrounding
settlements can be monitored (can be
delimited along this)
− instrument: institutional system and
economy
− larger in the agglomeration due to re-
drawing
− measurement: by gravity model
(Dusek 2003, Nagy G. 2011) or by
experience
Source: Own compilation
2A similar study was conducted by Faluvégi (2008: 1094) with the following constraints: urban center: 5000 and
more locally employed. Rural center: 1200-4999 employed locally. Urban center ring or co-center: daily
commuters> 40.0%.
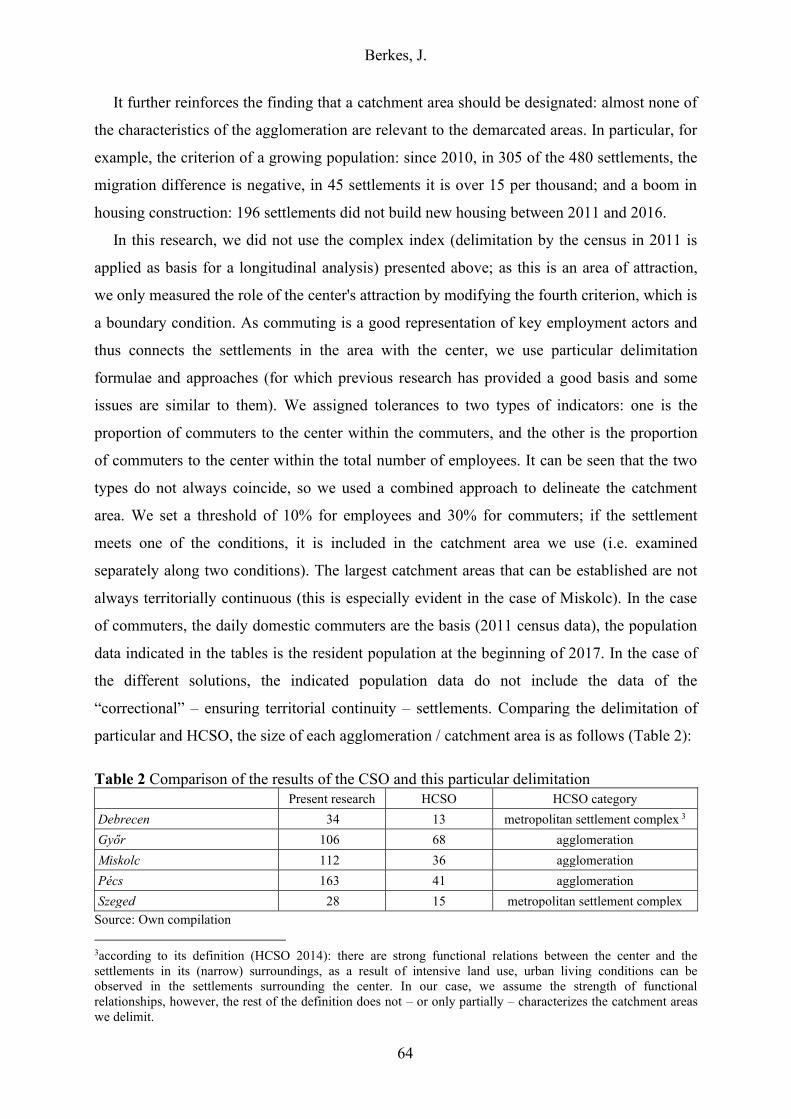
Berkes, J.
64
It further reinforces the finding that a catchment area should be designated: almost none of
the characteristics of the agglomeration are relevant to the demarcated areas. In particular, for
example, the criterion of a growing population: since 2010, in 305 of the 480 settlements, the
migration difference is negative, in 45 settlements it is over 15 per thousand; and a boom in
housing construction: 196 settlements did not build new housing between 2011 and 2016.
In this research, we did not use the complex index (delimitation by the census in 2011 is
applied as basis for a longitudinal analysis) presented above; as this is an area of attraction,
we only measured the role of the center's attraction by modifying the fourth criterion, which is
a boundary condition. As commuting is a good representation of key employment actors and
thus connects the settlements in the area with the center, we use particular delimitation
formulae and approaches (for which previous research has provided a good basis and some
issues are similar to them). We assigned tolerances to two types of indicators: one is the
proportion of commuters to the center within the commuters, and the other is the proportion
of commuters to the center within the total number of employees. It can be seen that the two
types do not always coincide, so we used a combined approach to delineate the catchment
area. We set a threshold of 10% for employees and 30% for commuters; if the settlement
meets one of the conditions, it is included in the catchment area we use (i.e. examined
separately along two conditions). The largest catchment areas that can be established are not
always territorially continuous (this is especially evident in the case of Miskolc). In the case
of commuters, the daily domestic commuters are the basis (2011 census data), the population
data indicated in the tables is the resident population at the beginning of 2017. In the case of
the different solutions, the indicated population data do not include the data of the
“correctional” – ensuring territorial continuity – settlements. Comparing the delimitation of
particular and HCSO, the size of each agglomeration / catchment area is as follows (Table 2):
Table 2 Comparison of the results of the CSO and this particular delimitation
Present research HCSO HCSO category
Debrecen 34 13 metropolitan settlement complex 3
Győr 106 68 agglomeration
Miskolc 112 36 agglomeration
Pécs 163 41 agglomeration
Szeged 28 15 metropolitan settlement complex
Source: Own compilation
3according to its definition (HCSO 2014): there are strong functional relations between the center and the
settlements in its (narrow) surroundings, as a result of intensive land use, urban living conditions can be
observed in the settlements surrounding the center. In our case, we assume the strength of functional
relationships, however, the rest of the definition does not – or only partially – characterizes the catchment areas
we delimit.
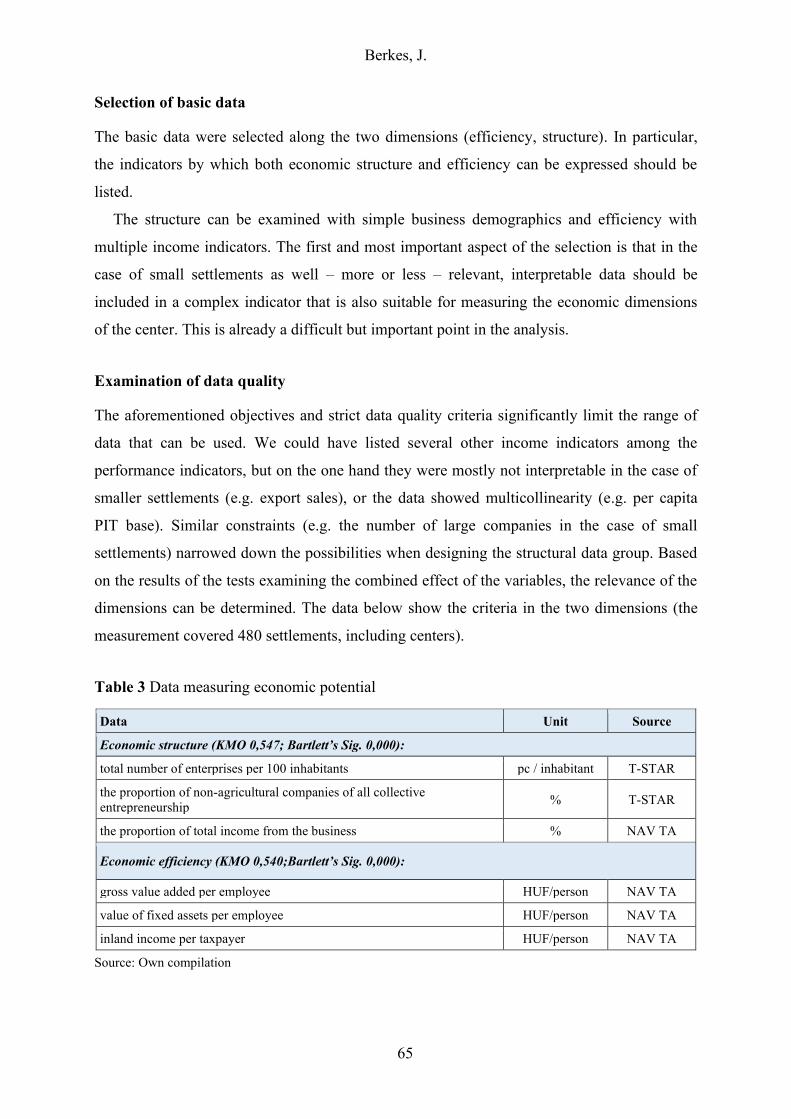
Berkes, J.
65
Selection of basic data
The basic data were selected along the two dimensions (efficiency, structure). In particular,
the indicators by which both economic structure and efficiency can be expressed should be
listed.
The structure can be examined with simple business demographics and efficiency with
multiple income indicators. The first and most important aspect of the selection is that in the
case of small settlements as well – more or less – relevant, interpretable data should be
included in a complex indicator that is also suitable for measuring the economic dimensions
of the center. This is already a difficult but important point in the analysis.
Examination of data quality
The aforementioned objectives and strict data quality criteria significantly limit the range of
data that can be used. We could have listed several other income indicators among the
performance indicators, but on the one hand they were mostly not interpretable in the case of
smaller settlements (e.g. export sales), or the data showed multicollinearity (e.g. per capita
PIT base). Similar constraints (e.g. the number of large companies in the case of small
settlements) narrowed down the possibilities when designing the structural data group. Based
on the results of the tests examining the combined effect of the variables, the relevance of the
dimensions can be determined. The data below show the criteria in the two dimensions (the
measurement covered 480 settlements, including centers).
Table 3 Data measuring economic potential
Data Unit Source
Economic structure (KMO 0,547; Bartlett’s Sig. 0,000):
total number of enterprises per 100 inhabitants pc / inhabitant T-STAR
the proportion of non-agricultural companies of all collective
entrepreneurship % T-STAR
the proportion of total income from the business % NAV TA
Economic efficiency (KMO 0,540;Bartlett’s Sig. 0,000):
gross value added per employee HUF/person NAV TA
value of fixed assets per employee HUF/person NAV TA
inland income per taxpayer HUF/person NAV TA
Source: Own compilation
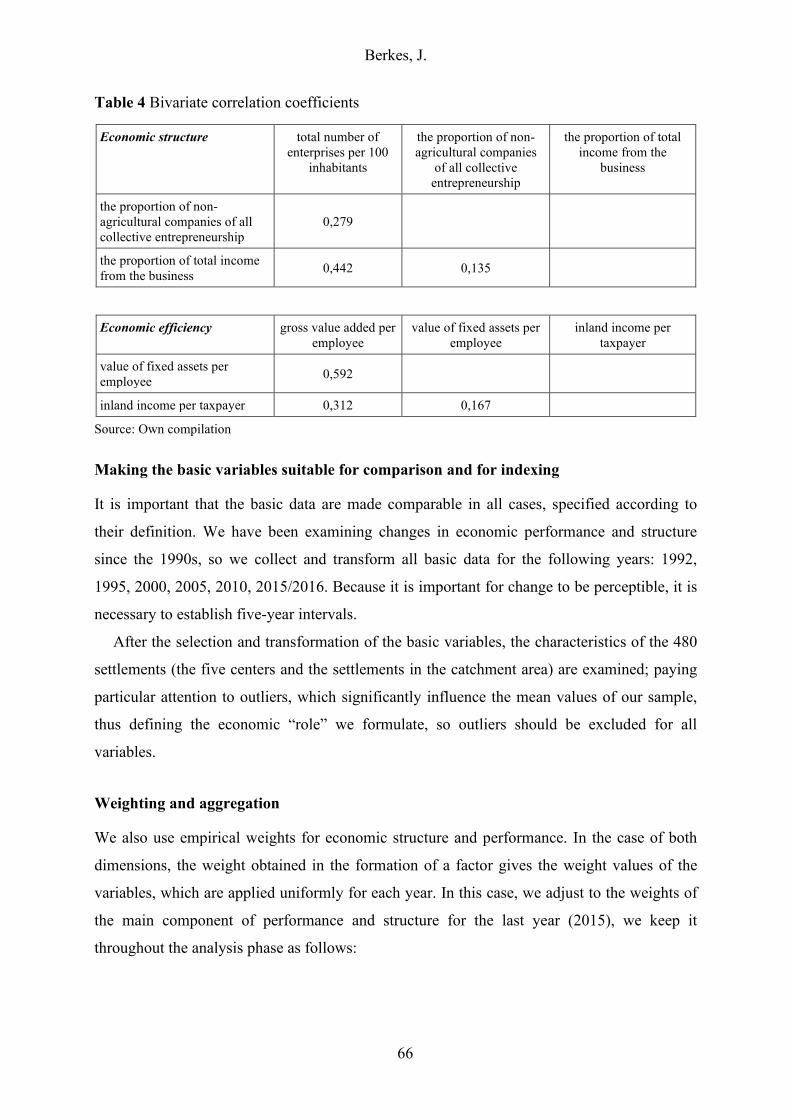
Berkes, J.
66
Table 4 Bivariate correlation coefficients
Economic structure total number of
enterprises per 100
inhabitants
the proportion of non-
agricultural companies
of all collective
entrepreneurship
the proportion of total
income from the
business
the proportion of non-
agricultural companies of all
collective entrepreneurship
0,279
the proportion of total income
from the business 0,442 0,135
Economic efficiency gross value added per
employee
value of fixed assets per
employee
inland income per
taxpayer
value of fixed assets per
employee 0,592
inland income per taxpayer 0,312 0,167
Source: Own compilation
Making the basic variables suitable for comparison and for indexing
It is important that the basic data are made comparable in all cases, specified according to
their definition. We have been examining changes in economic performance and structure
since the 1990s, so we collect and transform all basic data for the following years: 1992,
1995, 2000, 2005, 2010, 2015/2016. Because it is important for change to be perceptible, it is
necessary to establish five-year intervals.
After the selection and transformation of the basic variables, the characteristics of the 480
settlements (the five centers and the settlements in the catchment area) are examined; paying
particular attention to outliers, which significantly influence the mean values of our sample,
thus defining the economic “role” we formulate, so outliers should be excluded for all
variables.
Weighting and aggregation
We also use empirical weights for economic structure and performance. In the case of both
dimensions, the weight obtained in the formation of a factor gives the weight values of the
variables, which are applied uniformly for each year. In this case, we adjust to the weights of
the main component of performance and structure for the last year (2015), we keep it
throughout the analysis phase as follows:
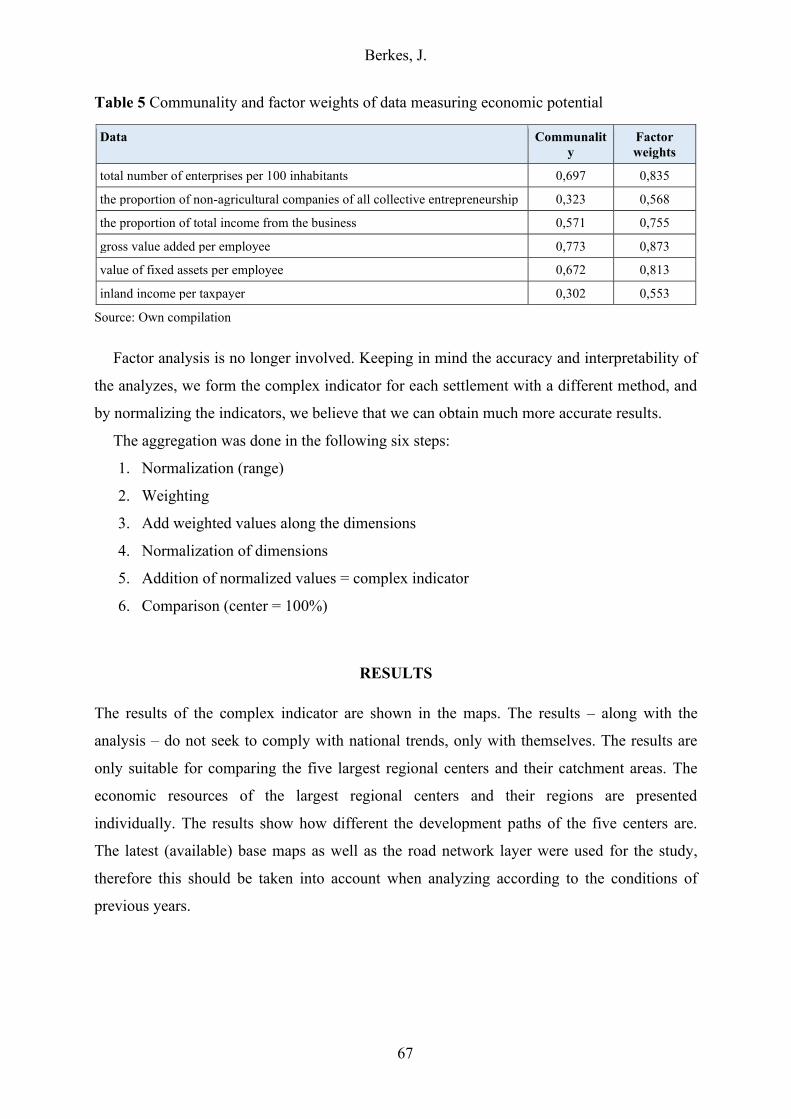
Berkes, J.
67
Table 5 Communality and factor weights of data measuring economic potential
Data Communalit
y
Factor
weights
total number of enterprises per 100 inhabitants 0,697 0,835
the proportion of non-agricultural companies of all collective entrepreneurship 0,323 0,568
the proportion of total income from the business 0,571 0,755
gross value added per employee 0,773 0,873
value of fixed assets per employee 0,672 0,813
inland income per taxpayer 0,302 0,553
Source: Own compilation
Factor analysis is no longer involved. Keeping in mind the accuracy and interpretability of
the analyzes, we form the complex indicator for each settlement with a different method, and
by normalizing the indicators, we believe that we can obtain much more accurate results.
The aggregation was done in the following six steps:
1. Normalization (range)
2. Weighting
3. Add weighted values along the dimensions
4. Normalization of dimensions
5. Addition of normalized values = complex indicator
6. Comparison (center = 100%)
RESULTS
The results of the complex indicator are shown in the maps. The results – along with the
analysis – do not seek to comply with national trends, only with themselves. The results are
only suitable for comparing the five largest regional centers and their catchment areas. The
economic resources of the largest regional centers and their regions are presented
individually. The results show how different the development paths of the five centers are.
The latest (available) base maps as well as the road network layer were used for the study,
therefore this should be taken into account when analyzing according to the conditions of
previous years.
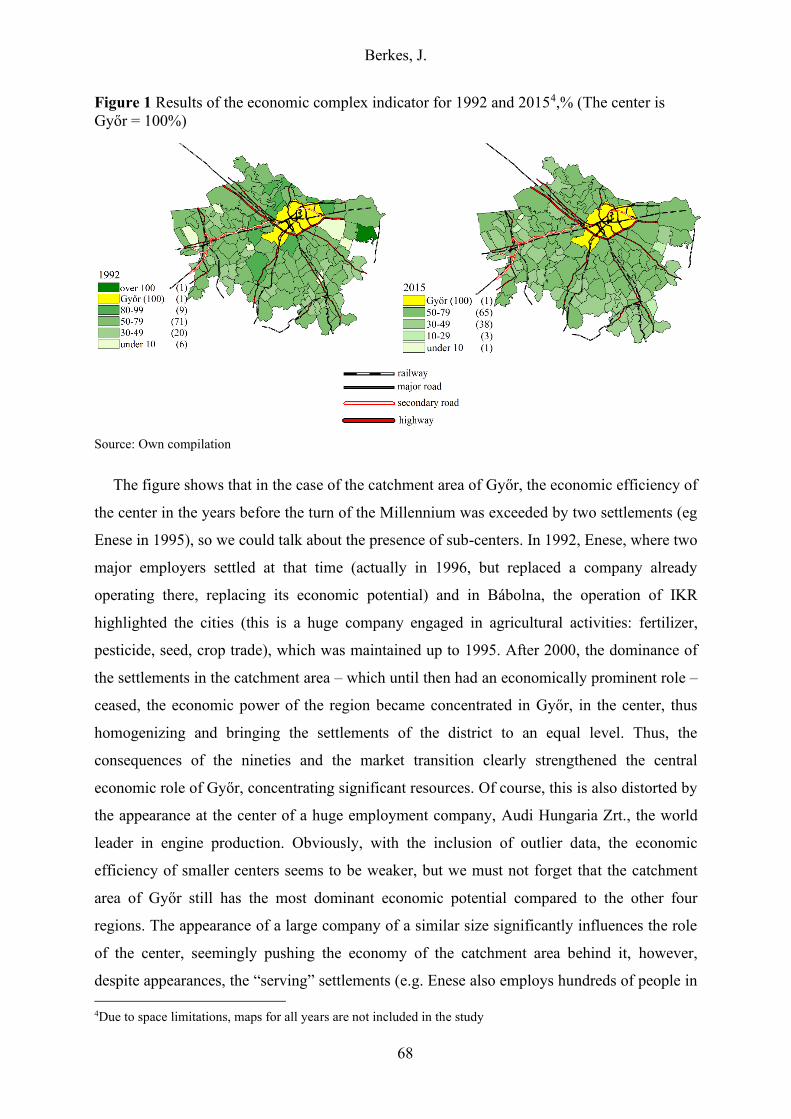
Berkes, J.
68
Figure 1 Results of the economic complex indicator for 1992 and 20154,% (The center is
Győr = 100%)
Source: Own compilation
The figure shows that in the case of the catchment area of Győr, the economic efficiency of
the center in the years before the turn of the Millennium was exceeded by two settlements (eg
Enese in 1995), so we could talk about the presence of sub-centers. In 1992, Enese, where two
major employers settled at that time (actually in 1996, but replaced a company already
operating there, replacing its economic potential) and in Bábolna, the operation of IKR
highlighted the cities (this is a huge company engaged in agricultural activities: fertilizer,
pesticide, seed, crop trade), which was maintained up to 1995. After 2000, the dominance of
the settlements in the catchment area – which until then had an economically prominent role –
ceased, the economic power of the region became concentrated in Győr, in the center, thus
homogenizing and bringing the settlements of the district to an equal level. Thus, the
consequences of the nineties and the market transition clearly strengthened the central
economic role of Győr, concentrating significant resources. Of course, this is also distorted by
the appearance at the center of a huge employment company, Audi Hungaria Zrt., the world
leader in engine production. Obviously, with the inclusion of outlier data, the economic
efficiency of smaller centers seems to be weaker, but we must not forget that the catchment
area of Győr still has the most dominant economic potential compared to the other four
regions. The appearance of a large company of a similar size significantly influences the role
of the center, seemingly pushing the economy of the catchment area behind it, however,
despite appearances, the “serving” settlements (e.g. Enese also employs hundreds of people in
4Due to space limitations, maps for all years are not included in the study
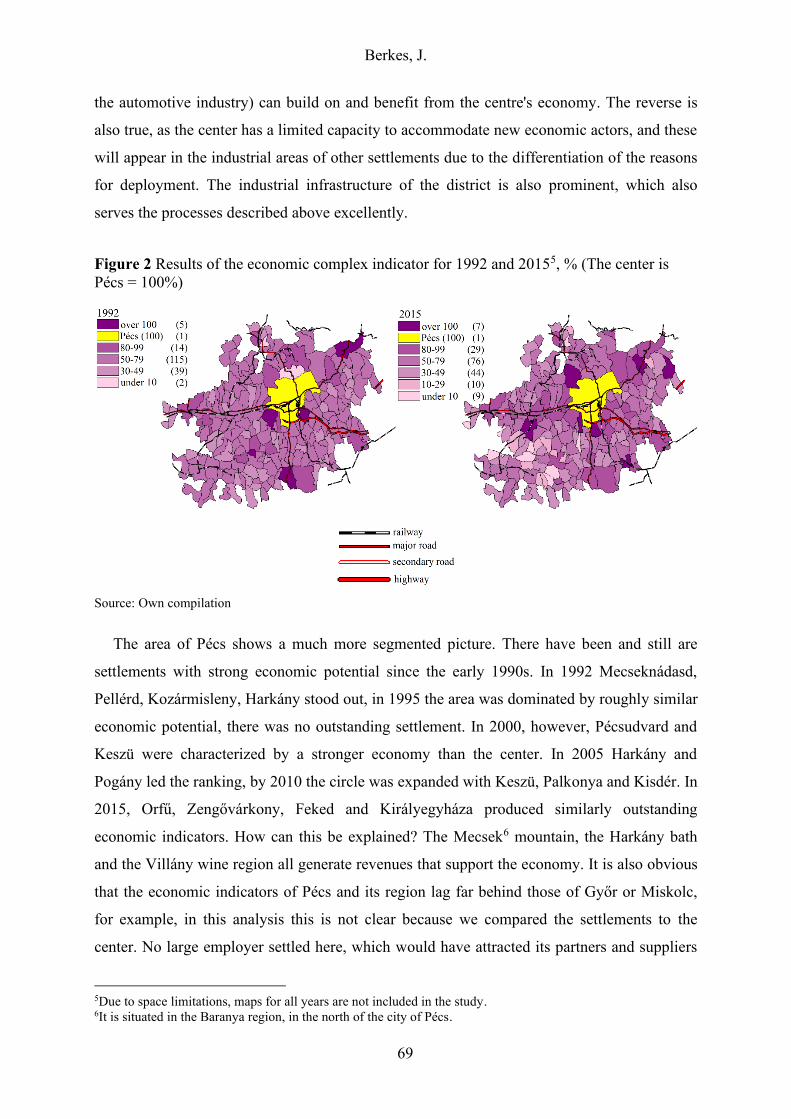
Berkes, J.
69
the automotive industry) can build on and benefit from the centre's economy. The reverse is
also true, as the center has a limited capacity to accommodate new economic actors, and these
will appear in the industrial areas of other settlements due to the differentiation of the reasons
for deployment. The industrial infrastructure of the district is also prominent, which also
serves the processes described above excellently.
Figure 2 Results of the economic complex indicator for 1992 and 20155, % (The center is
Pécs = 100%)
Source: Own compilation
The area of Pécs shows a much more segmented picture. There have been and still are
settlements with strong economic potential since the early 1990s. In 1992 Mecseknádasd,
Pellérd, Kozármisleny, Harkány stood out, in 1995 the area was dominated by roughly similar
economic potential, there was no outstanding settlement. In 2000, however, Pécsudvard and
Keszü were characterized by a stronger economy than the center. In 2005 Harkány and
Pogány led the ranking, by 2010 the circle was expanded with Keszü, Palkonya and Kisdér. In
2015, Orfű, Zengővárkony, Feked and Királyegyháza produced similarly outstanding
economic indicators. How can this be explained? The Mecsek6 mountain, the Harkány bath
and the Villány wine region all generate revenues that support the economy. It is also obvious
that the economic indicators of Pécs and its region lag far behind those of Győr or Miskolc,
for example, in this analysis this is not clear because we compared the settlements to the
center. No large employer settled here, which would have attracted its partners and suppliers
5Due to space limitations, maps for all years are not included in the study. 6It is situated in the Baranya region, in the north of the city of Pécs.
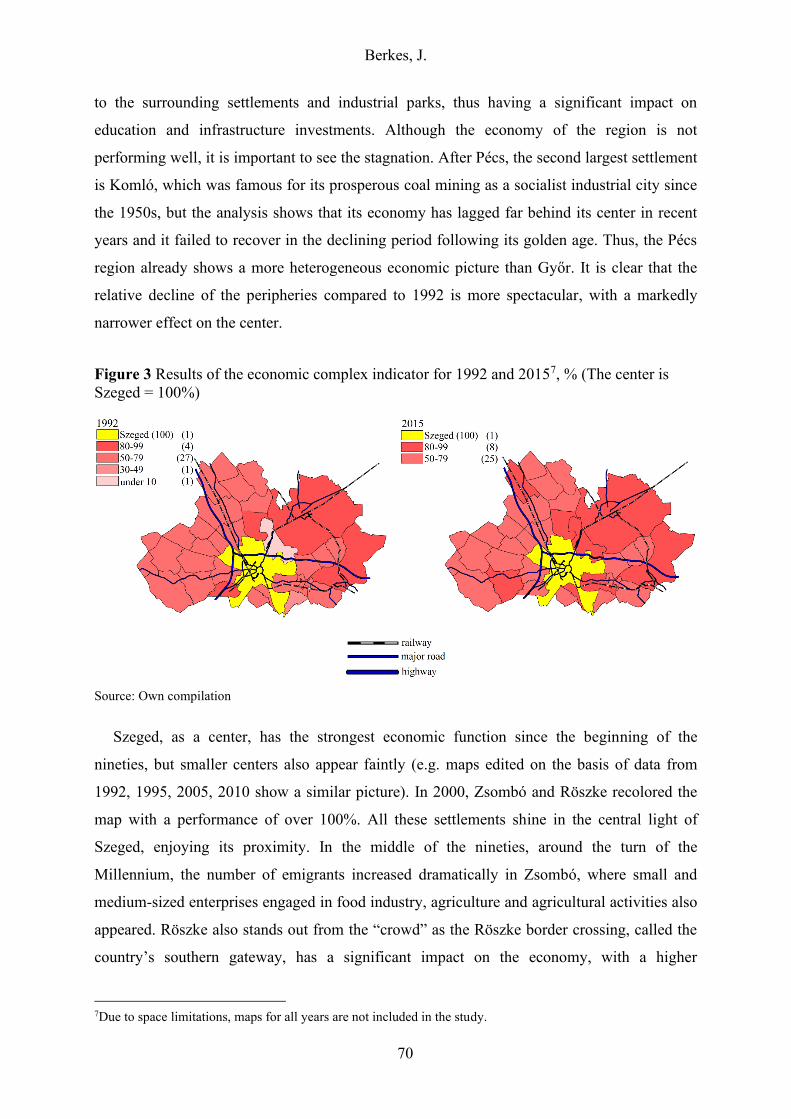
Berkes, J.
70
to the surrounding settlements and industrial parks, thus having a significant impact on
education and infrastructure investments. Although the economy of the region is not
performing well, it is important to see the stagnation. After Pécs, the second largest settlement
is Komló, which was famous for its prosperous coal mining as a socialist industrial city since
the 1950s, but the analysis shows that its economy has lagged far behind its center in recent
years and it failed to recover in the declining period following its golden age. Thus, the Pécs
region already shows a more heterogeneous economic picture than Győr. It is clear that the
relative decline of the peripheries compared to 1992 is more spectacular, with a markedly
narrower effect on the center.
Figure 3 Results of the economic complex indicator for 1992 and 20157, % (The center is
Szeged = 100%)
Source: Own compilation
Szeged, as a center, has the strongest economic function since the beginning of the
nineties, but smaller centers also appear faintly (e.g. maps edited on the basis of data from
1992, 1995, 2005, 2010 show a similar picture). In 2000, Zsombó and Röszke recolored the
map with a performance of over 100%. All these settlements shine in the central light of
Szeged, enjoying its proximity. In the middle of the nineties, around the turn of the
Millennium, the number of emigrants increased dramatically in Zsombó, where small and
medium-sized enterprises engaged in food industry, agriculture and agricultural activities also
appeared. Röszke also stands out from the “crowd” as the Röszke border crossing, called the
country’s southern gateway, has a significant impact on the economy, with a higher
7Due to space limitations, maps for all years are not included in the study.
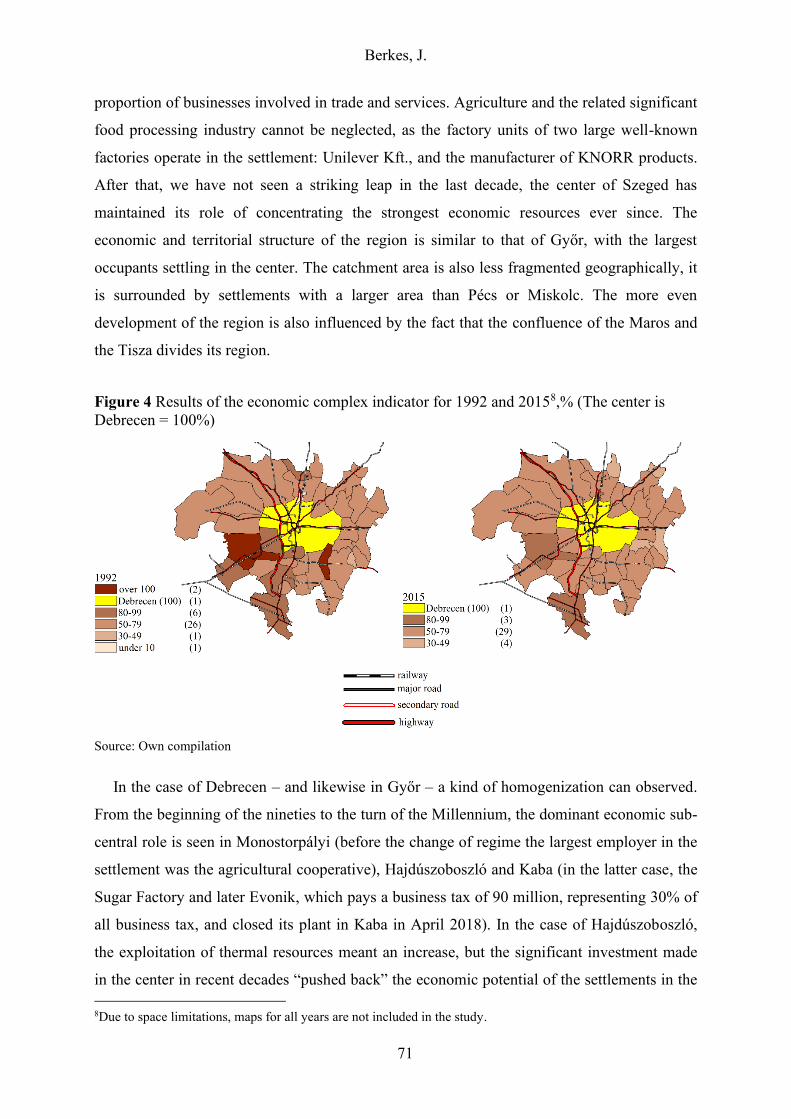
Berkes, J.
71
proportion of businesses involved in trade and services. Agriculture and the related significant
food processing industry cannot be neglected, as the factory units of two large well-known
factories operate in the settlement: Unilever Kft., and the manufacturer of KNORR products.
After that, we have not seen a striking leap in the last decade, the center of Szeged has
maintained its role of concentrating the strongest economic resources ever since. The
economic and territorial structure of the region is similar to that of Győr, with the largest
occupants settling in the center. The catchment area is also less fragmented geographically, it
is surrounded by settlements with a larger area than Pécs or Miskolc. The more even
development of the region is also influenced by the fact that the confluence of the Maros and
the Tisza divides its region.
Figure 4 Results of the economic complex indicator for 1992 and 20158,% (The center is
Debrecen = 100%)
Source: Own compilation
In the case of Debrecen – and likewise in Győr – a kind of homogenization can observed.
From the beginning of the nineties to the turn of the Millennium, the dominant economic sub-
central role is seen in Monostorpályi (before the change of regime the largest employer in the
settlement was the agricultural cooperative), Hajdúszoboszló and Kaba (in the latter case, the
Sugar Factory and later Evonik, which pays a business tax of 90 million, representing 30% of
all business tax, and closed its plant in Kaba in April 2018). In the case of Hajdúszoboszló,
the exploitation of thermal resources meant an increase, but the significant investment made
in the center in recent decades “pushed back” the economic potential of the settlements in the
8Due to space limitations, maps for all years are not included in the study.
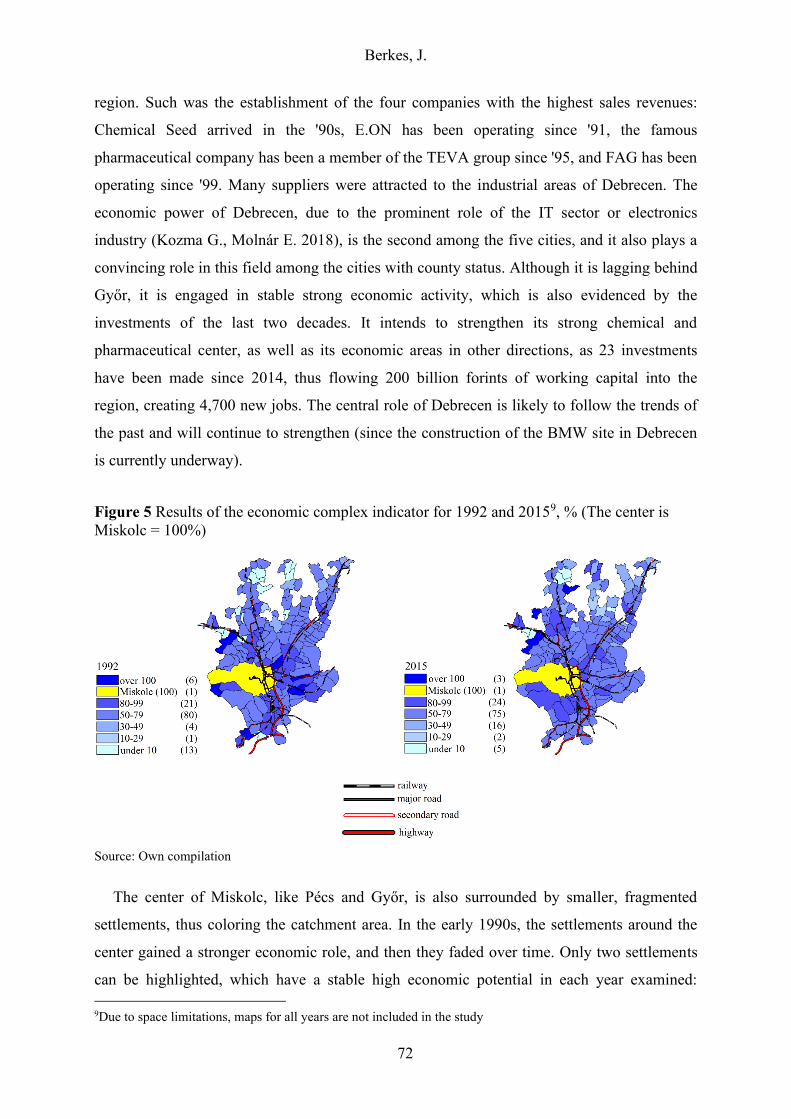
Berkes, J.
72
region. Such was the establishment of the four companies with the highest sales revenues:
Chemical Seed arrived in the '90s, E.ON has been operating since '91, the famous
pharmaceutical company has been a member of the TEVA group since '95, and FAG has been
operating since '99. Many suppliers were attracted to the industrial areas of Debrecen. The
economic power of Debrecen, due to the prominent role of the IT sector or electronics
industry (Kozma G., Molnár E. 2018), is the second among the five cities, and it also plays a
convincing role in this field among the cities with county status. Although it is lagging behind
Győr, it is engaged in stable strong economic activity, which is also evidenced by the
investments of the last two decades. It intends to strengthen its strong chemical and
pharmaceutical center, as well as its economic areas in other directions, as 23 investments
have been made since 2014, thus flowing 200 billion forints of working capital into the
region, creating 4,700 new jobs. The central role of Debrecen is likely to follow the trends of
the past and will continue to strengthen (since the construction of the BMW site in Debrecen
is currently underway).
Figure 5 Results of the economic complex indicator for 1992 and 20159, % (The center is
Miskolc = 100%)
Source: Own compilation
The center of Miskolc, like Pécs and Győr, is also surrounded by smaller, fragmented
settlements, thus coloring the catchment area. In the early 1990s, the settlements around the
center gained a stronger economic role, and then they faded over time. Only two settlements
can be highlighted, which have a stable high economic potential in each year examined:
9Due to space limitations, maps for all years are not included in the study
Berkes, J.
73
Kazincbarcika and Bőcs. In the case of the latter village, the dominant company is the
Borsodi Brewery, which has been operating in the settlement since 1973. Kazincbarcika, the
other famous socialist industrial city, is the “Hungarian chemical citadel”, home to
BorsodChem's 100% foreign-owned company and employing more than two and a half
thousand people, with annual net sales in excess of HUF 500 billion. This is a huge revenue
for the city, so it continues to play the role of economic sub-center in the region. Sajóbábony
was able to preserve the economic potential of the center from the nineties to the turn of the
Millennium presumably because one of the largest employing chemical companies operating
in the settlement (SVIP Kft. – a non-profit Ltd. that maintains the local industrial park (TEVA
Pharmaceutical Industry operates a unit there) was able to overcome the difficulties associated
with the change of regime. In 1992, the Mátra Power Plant showed greater but unstable
economic activity due to the Bükkábrány coal mine. In 2015, Kazincbarcika and Bőcs will
also play a dominant economic role, although Felsőnyárád, Galvács, Szemere (2005), Varbó
(2000), Répáshuta (1992) will appear next to them, behind which we cannot find a real
process (“small settlement effect”). In the case of Miskolc, the strongest proof was obtained
from the assumption that, although it is possible, it is not worthwhile to examine the center
without its area. The strongest “sub-center” can be found here, Kazincbarcika, which showed
an average score of one and a half times the main economic component compared to Miskolc.
Kazincbarcika and Miskolc are important for their coexistence and co-operation – both in
terms of labor flow, employment and increasing urban revenues – and it can be clearly shown
that they influence each other's economic development.
Changes in economic potential
The study can also be extended to measure the change in potential, which helps to identify the
narrow agglomeration that is prospering economically around the five largest Hungarian
regional centers.
We based this on a simple absolute difference. The value of the starting time of the
calculated complex score was subtracted from the data of the last available year. Compared to
the catchment area calculations presented above, these illustrations aim to show how the
settlements in the catchment areas have performed relative to themselves (not the center).
Based on this, the following results were obtained.
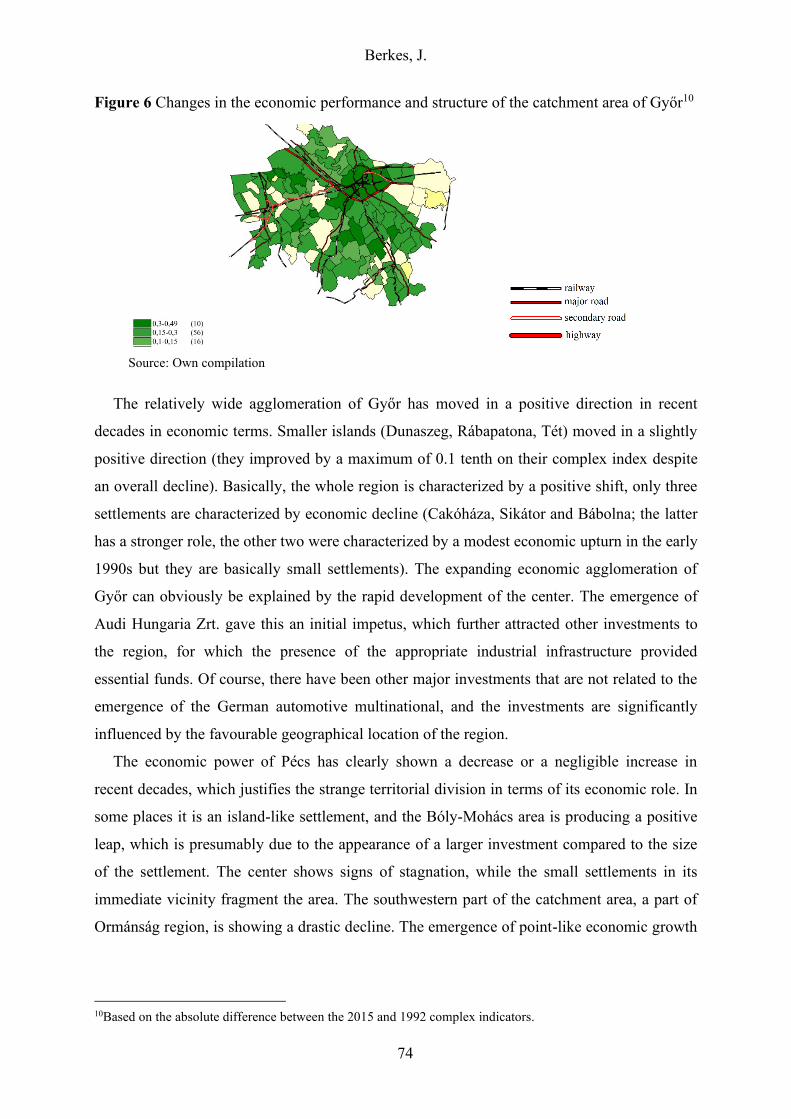
Berkes, J.
74
Figure 6 Changes in the economic performance and structure of the catchment area of Győr10
Source: Own compilation
The relatively wide agglomeration of Győr has moved in a positive direction in recent
decades in economic terms. Smaller islands (Dunaszeg, Rábapatona, Tét) moved in a slightly
positive direction (they improved by a maximum of 0.1 tenth on their complex index despite
an overall decline). Basically, the whole region is characterized by a positive shift, only three
settlements are characterized by economic decline (Cakóháza, Sikátor and Bábolna; the latter
has a stronger role, the other two were characterized by a modest economic upturn in the early
1990s but they are basically small settlements). The expanding economic agglomeration of
Győr can obviously be explained by the rapid development of the center. The emergence of
Audi Hungaria Zrt. gave this an initial impetus, which further attracted other investments to
the region, for which the presence of the appropriate industrial infrastructure provided
essential funds. Of course, there have been other major investments that are not related to the
emergence of the German automotive multinational, and the investments are significantly
influenced by the favourable geographical location of the region.
The economic power of Pécs has clearly shown a decrease or a negligible increase in
recent decades, which justifies the strange territorial division in terms of its economic role. In
some places it is an island-like settlement, and the Bóly-Mohács area is producing a positive
leap, which is presumably due to the appearance of a larger investment compared to the size
of the settlement. The center shows signs of stagnation, while the small settlements in its
immediate vicinity fragment the area. The southwestern part of the catchment area, a part of
Ormánság region, is showing a drastic decline. The emergence of point-like economic growth
10Based on the absolute difference between the 2015 and 1992 complex indicators.
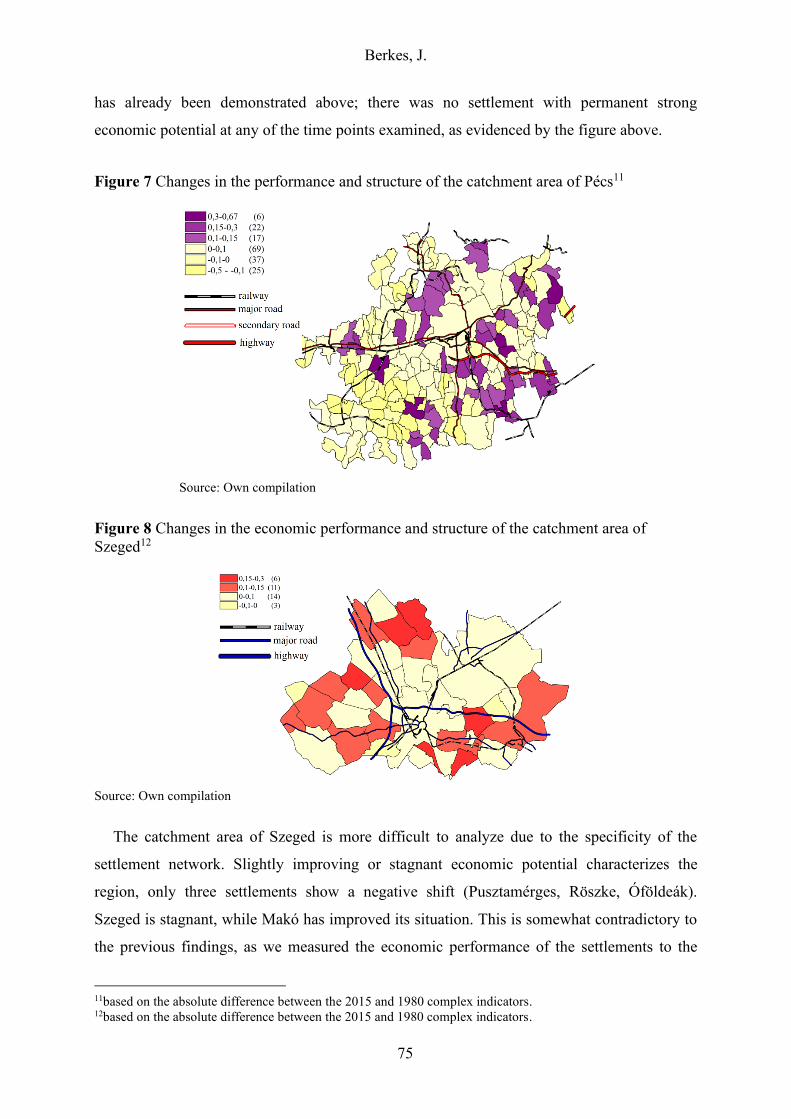
Berkes, J.
75
has already been demonstrated above; there was no settlement with permanent strong
economic potential at any of the time points examined, as evidenced by the figure above.
Figure 7 Changes in the performance and structure of the catchment area of Pécs11
Source: Own compilation
Figure 8 Changes in the economic performance and structure of the catchment area of
Szeged12
Source: Own compilation
The catchment area of Szeged is more difficult to analyze due to the specificity of the
settlement network. Slightly improving or stagnant economic potential characterizes the
region, only three settlements show a negative shift (Pusztamérges, Röszke, Óföldeák).
Szeged is stagnant, while Makó has improved its situation. This is somewhat contradictory to
the previous findings, as we measured the economic performance of the settlements to the
11based on the absolute difference between the 2015 and 1980 complex indicators. 12based on the absolute difference between the 2015 and 1980 complex indicators.
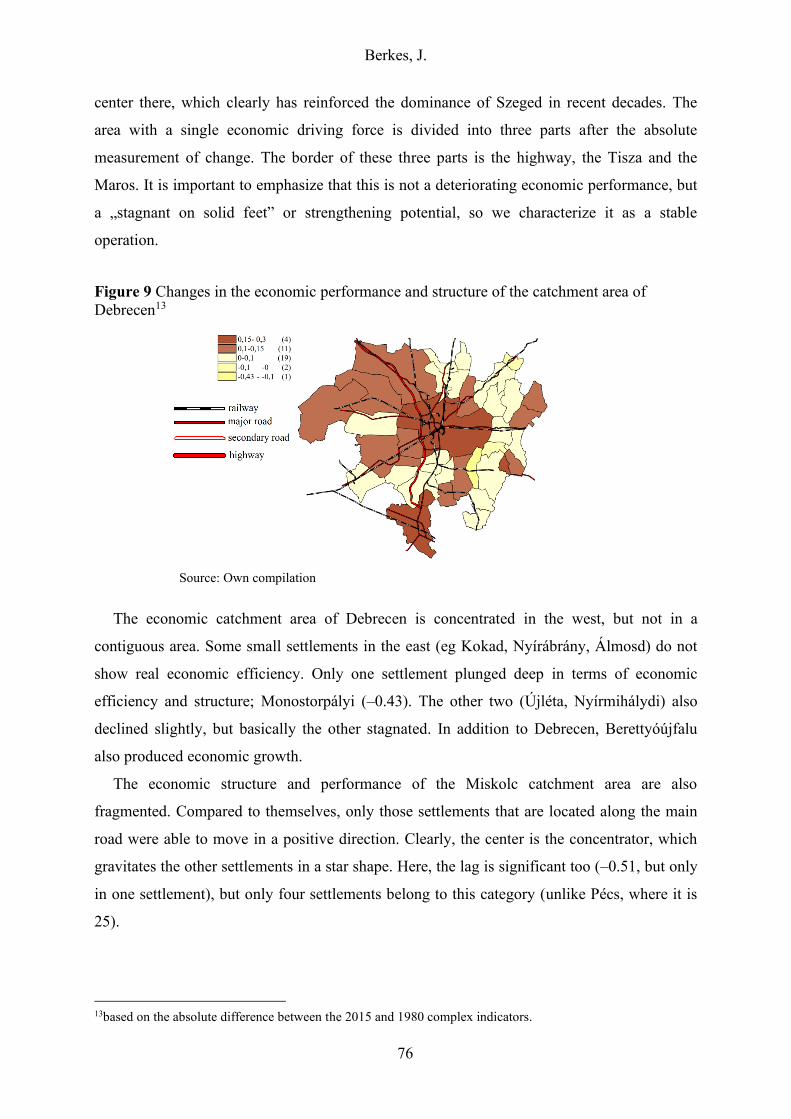
Berkes, J.
76
center there, which clearly has reinforced the dominance of Szeged in recent decades. The
area with a single economic driving force is divided into three parts after the absolute
measurement of change. The border of these three parts is the highway, the Tisza and the
Maros. It is important to emphasize that this is not a deteriorating economic performance, but
a „stagnant on solid feet” or strengthening potential, so we characterize it as a stable
operation.
Figure 9 Changes in the economic performance and structure of the catchment area of
Debrecen13
Source: Own compilation
The economic catchment area of Debrecen is concentrated in the west, but not in a
contiguous area. Some small settlements in the east (eg Kokad, Nyírábrány, Álmosd) do not
show real economic efficiency. Only one settlement plunged deep in terms of economic
efficiency and structure; Monostorpályi (–0.43). The other two (Újléta, Nyírmihálydi) also
declined slightly, but basically the other stagnated. In addition to Debrecen, Berettyóújfalu
also produced economic growth.
The economic structure and performance of the Miskolc catchment area are also
fragmented. Compared to themselves, only those settlements that are located along the main
road were able to move in a positive direction. Clearly, the center is the concentrator, which
gravitates the other settlements in a star shape. Here, the lag is significant too (–0.51, but only
in one settlement), but only four settlements belong to this category (unlike Pécs, where it is
25).
13based on the absolute difference between the 2015 and 1980 complex indicators.
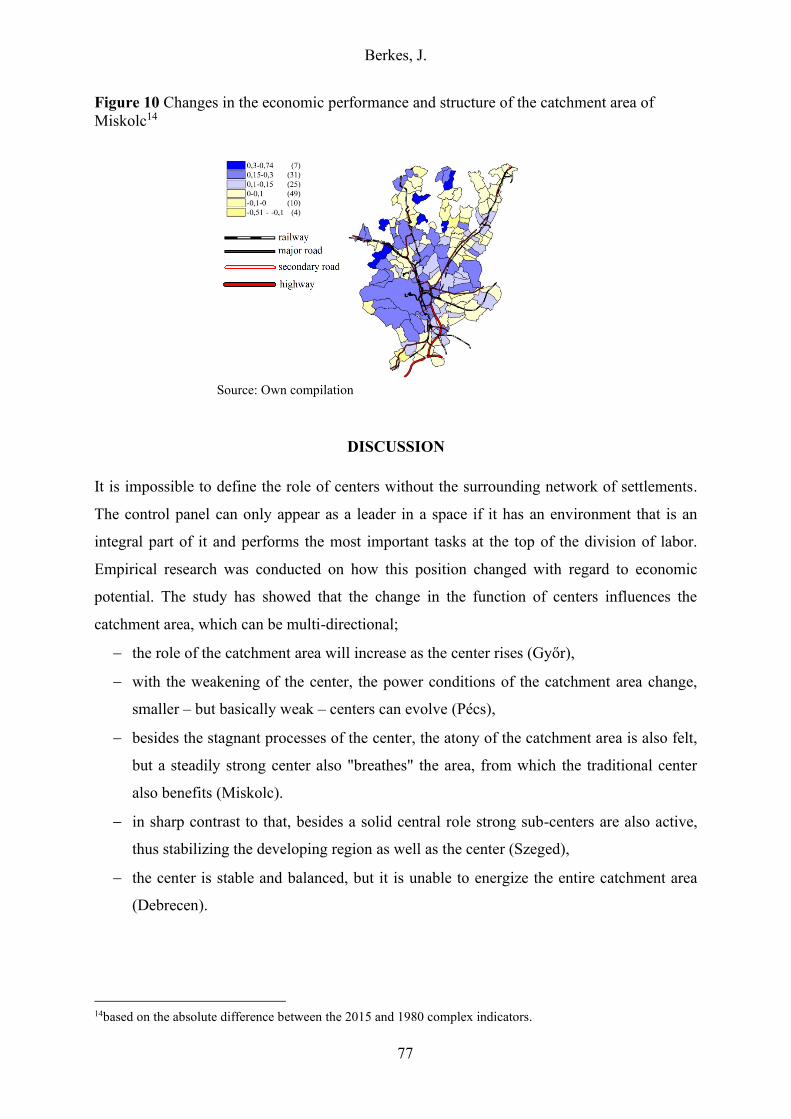
Berkes, J.
77
Figure 10 Changes in the economic performance and structure of the catchment area of
Miskolc14
Source: Own compilation
DISCUSSION
It is impossible to define the role of centers without the surrounding network of settlements.
The control panel can only appear as a leader in a space if it has an environment that is an
integral part of it and performs the most important tasks at the top of the division of labor.
Empirical research was conducted on how this position changed with regard to economic
potential. The study has showed that the change in the function of centers influences the
catchment area, which can be multi-directional;
− the role of the catchment area will increase as the center rises (Győr),
− with the weakening of the center, the power conditions of the catchment area change,
smaller – but basically weak – centers can evolve (Pécs),
− besides the stagnant processes of the center, the atony of the catchment area is also felt,
but a steadily strong center also "breathes" the area, from which the traditional center
also benefits (Miskolc).
− in sharp contrast to that, besides a solid central role strong sub-centers are also active,
thus stabilizing the developing region as well as the center (Szeged),
− the center is stable and balanced, but it is unable to energize the entire catchment area
(Debrecen).
14based on the absolute difference between the 2015 and 1980 complex indicators.
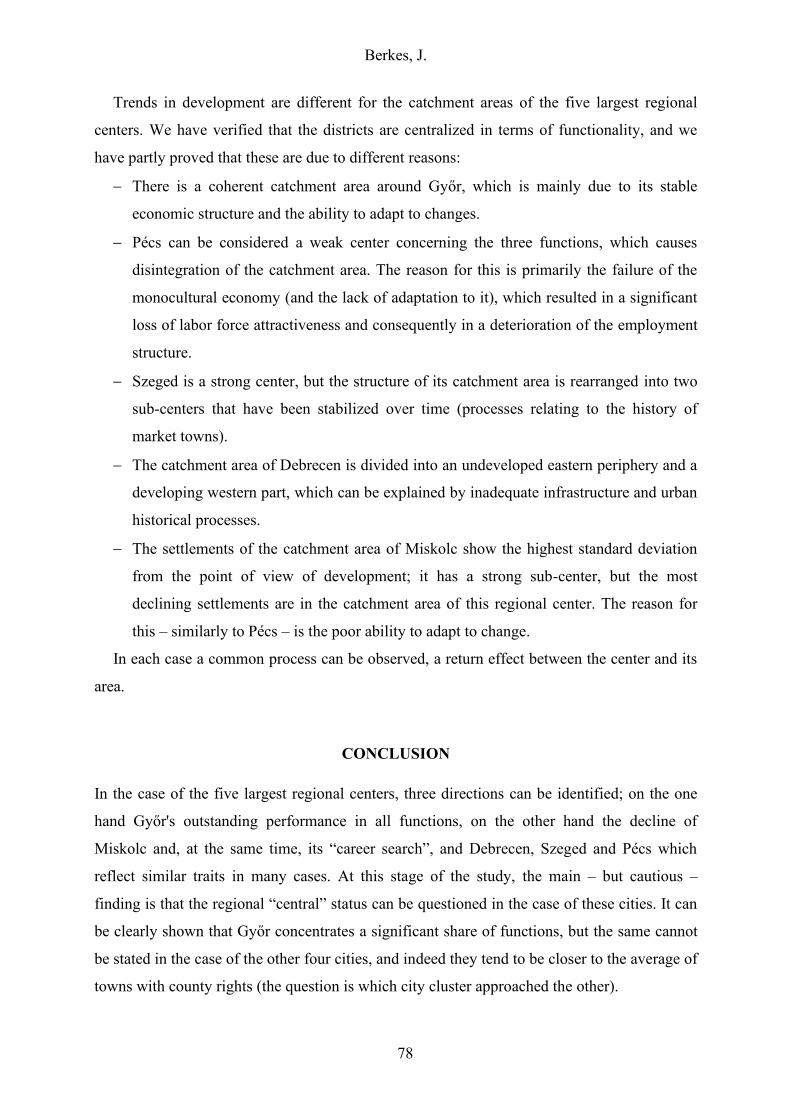
Berkes, J.
78
Trends in development are different for the catchment areas of the five largest regional
centers. We have verified that the districts are centralized in terms of functionality, and we
have partly proved that these are due to different reasons:
− There is a coherent catchment area around Győr, which is mainly due to its stable
economic structure and the ability to adapt to changes.
− Pécs can be considered a weak center concerning the three functions, which causes
disintegration of the catchment area. The reason for this is primarily the failure of the
monocultural economy (and the lack of adaptation to it), which resulted in a significant
loss of labor force attractiveness and consequently in a deterioration of the employment
structure.
− Szeged is a strong center, but the structure of its catchment area is rearranged into two
sub-centers that have been stabilized over time (processes relating to the history of
market towns).
− The catchment area of Debrecen is divided into an undeveloped eastern periphery and a
developing western part, which can be explained by inadequate infrastructure and urban
historical processes.
− The settlements of the catchment area of Miskolc show the highest standard deviation
from the point of view of development; it has a strong sub-center, but the most
declining settlements are in the catchment area of this regional center. The reason for
this – similarly to Pécs – is the poor ability to adapt to change.
In each case a common process can be observed, a return effect between the center and its
area.
CONCLUSION
In the case of the five largest regional centers, three directions can be identified; on the one
hand Győr's outstanding performance in all functions, on the other hand the decline of
Miskolc and, at the same time, its “career search”, and Debrecen, Szeged and Pécs which
reflect similar traits in many cases. At this stage of the study, the main – but cautious –
finding is that the regional “central” status can be questioned in the case of these cities. It can
be clearly shown that Győr concentrates a significant share of functions, but the same cannot
be stated in the case of the other four cities, and indeed they tend to be closer to the average of
towns with county rights (the question is which city cluster approached the other).
Berkes, J.
79
The need to examine the catchment area is indisputable, and two main conclusions can be
drawn. On the one hand, the unquestionable performance of Győr homogenises the area and
there is no other center in the agglomeration, but in the case of Szeged and Debrecen it is less
clear, while the economic respirator of the catchment area of Miskolc is Kazincbarcika, and
Pécs is spectacularly fragmented (not because of the presence of small centers but rather
because it is a weak center). In Hungary no research has been conducted spanning such a long
time period on the largest regional centers and their catchment areas that would allow to
compare them with themselves and each other (using a complex methodology). The utility of
the results of the research is high, as they can support decision-making processes of both city
government and regional development actors.
REFERENCES
Beluszky, P. (1967). A magyar városok központi szerepköre. Statisztikai Szemle, 6, 543–563.
Beluszky, P. (1974). Nyíregyháza vonzáskörzete. (Földrajzi Tanulmányok, 13). Budapest:
Akadémiai Kiadó.
Beluszky, P. (1981). A városi vonzáskörzetek (városkörnyékiség) vizsgálatának elvi
módszertani kérdései. Budapest: ÁSZI.
Beluszky, P. (2014). Budapest – zászlóshajó vagy vízfej? Gödöllő: Szent István Egyetemi
Kiadó.
Beluszky, P., & Győri R. (1999). Magyarországi városhálózat és az EU-csatlakozás.Tér és
Társadalom, 1–2, 1–30. Beluszky, P., & Győri, R. (2003). A város a láz, a nyugtalanság, a munka és a fejlődés.
Magyarország városhálózata a 20. század elején. Korall, 11–12, 199–238.
Benini, R., & Naldi, P. (2007). Strategy for a Regional Polycentric Urban System in Central-
Eastern Europe Economic Integrating Zone. RePUS Final Report. RePUS, s.l.
Bodor N., & Pénzes, J. (2012). Eger komplex vonzáskörzetének dinamikai vizsgálata. Tér és
Társadalom, 3, 30–47.
Bujdosó, Z. (2009). Gyöngyös város vonzáskörzetének változása az elmúlt negyedszázadban.
Földrajzi Közlemények, 1, 59–74.
Dusek, T. (2003). A gravitációs modell és a gravitációs törvény összehasonlítása. Tér és
Társadalom, 1, 41–58.
Dusek, T. (2011). Inadekvát adatok és egyéb módszertani kérdések a gravitációs modell
alkalmazása során. Területi Statisztika, 6, 674–677.
Egyed, I. (2016). From uniformity towards unequality in regional development policy: the
case of France. Deturope, 3, 32–51.
Faluvégi, A. (2008). A foglalkoztatás területi-települési szerkezete Magyarországon.
Statisztikai Szemle, 12, 1077–1102.
Fodor, I., & Hajdú, Z. (Eds.) (1985). Szekszárd vonzáskörzetének vizsgálata. Szekszárd:
Tolna Megyei Tanács, Pécs: MTA RKK Dunántúli Tudományos Intézete.
Győri, R. (2010). A Kisalföld kereskedelmi vonzáskörzet-rendszere 1925-ben. Tér és
Társadalom, 2–3, 303–309.
Hajdú, Z., Horeczki, R., & Rácz, Sz. (2017). Changing settlement networks in Central and
Eastern Europe with special regard to urban networks. In Lux, G., & Horváth, Gy.
Berkes, J.
80
(Eds.), The Routledge Handbook to Regional Development in Central and Eastern
Europe (pp. 123–140).
Hardi, T. (2005). Határon átnyúló ingázás, munkavállalás az osztrák–magyar határtérségben.
Tér és Társadalom, 2, 65–81.
Hardi, T. (2007). A Széchenyi István Egyetem vonzáskörzete. In Lados, M., & Rechnitzer, J.
(Eds.), Egyetem a régióért (pp. 93–112). Pécs–Győr: MTA Regionális Kutatások
Központja.
Hardi, T. (2014). Az ingázás térbeli jellegzetességeinek változása az Észak-Dunántúlon,
különös tekintettel Győr munkaügyi vonzáskörzetére. In Lados, M. (Ed.): A
gazdaságszerkezet és vonzáskörzet alakulása (pp. 49–69). „A győri járműipari körzet, mint
a térségi fejlesztés új iránya és eszköze” c. kutatás monográfiái 5. Győr: Universtitas-Győr
Nonprofit Kft.
Kiss, J., & Bajmócy, P. (2001). Városi funkciójú központok és elméleti vonzáskörzeteik az
Alföldön. Tér és Társadalom, 1, pp. 65–89.
Kiss, J. P., & Szalkai, G. (2014). A foglalkoztatás területi koncentrációjának változásai
Magyarországon a népszámlálások ingázási adatai alapján, 1990–2011. Területi Statisztika,
5, 415–447.
Koppány, K., Kovács, N., & Szabó D. R. (2014). Város és vonzáskörzete: gazdasági
kapcsolatrendszer és növekedés Vázlat a győri járműipari körzet regionális
makromodelljének kidolgozásához. Tér és Társadalom, 2, 1–31.
Kovács, Z. (2017). Városok és urbanizációs kihívások Magyarországon. Magyar Tudomány,
3, 302–310.
Kozma, G. (1998). A gazdasági élet szereplőinek térbeli preferenciái. Falu-Város-Régió, 5, 7–
14.
Kozman, G., & Molnárn, E. (2018). The role of industrial parks in the economic development
of Debrecen. Tér Gazdaság Ember, 4, 35–49.
HCSO (2014). Magyarország településhálózata I. Agglomerációk, településegyüttesek.
Budapest: Központi Statisztikai Hivatal.
HCSO (2014). Regional Atlas – Other territorial delimitations. In
http://www.ksh.hu/regionalatlas_other_territorial_delimitations (Downloaded:
2020.09.30.)
Koós, B. (2007). A szuburbanizációs folyamat a magyar gazdaságban. Közgazdasági Szemle,
4, 334–349.
Kuttor, D., & Péter, Zs. (2016). Changing Position and Catchment Area of the University of
Miskolc, Faculty of Economics. Deturope, 3, 124–137.
Molnár, E., Dézsi, Gy., Lengyel, I. M., & Kozma, G. (2018). Vidéki nagyvárosaink
gazdaságának összehasonlító elemzése. Területi Statisztika, 6, 610–637.
Nagy, G. (1996). A gravitációs modell alkalmazási lehetőségei a településen belüli mozgások
tanulmányozására. Tér és Társadalom, 2–3, 149–156.
Nagy, G. (2011). A gravitációs modell felhasználásának lehetőségei a várostérségek
lehatárolásában. Területi Statisztika, 6, 656–673.
Nagy, R. (1988). Szolnok város vonzásviszonyai (1949–1980). Alföldi Tanulmányok, 12,
219–236.
Nemes Nagy, J., & Piros, Gy. (1984). Térbeli népesség- és anyagáramlások vizsgálata
gravitációs modellel. Matematikai és statisztikai módszerek alkalmazási lehetőségei a
területi kutatásokban. (Földrajzi Tanulmányok, 19). Budapest: Akadémiai Kiadó.
Papp, A. (1981). Debrecen vonzáskörzete. Alföldi Tanulmányok, 5, 177–204.
Pénzes, J., Molnár, E., & Pálóczi, G. (2014). Helyi munkaerő-piaci vonzáskörzetek az
ezredforduló utáni Magyarországon. Területi Statisztika, 5, 474–490.
Berkes, J.
81
Pálóczi, G., Pénzes, J., Hurbánek, P., Halás, M., & Klapka P. (2016). Attempts to delineate
functional regions in Hungary based on commuting data. Regional Statistics, 1, 23–41.
Rácz, Sz. (2019). Development Processes of Regional Centres in Central and Southeast
Europe - From State Socialism to Dependent Market Economies. Deturope, 2, 92–100.
Rechnitzer, J., Páthy, Á., & Berkes, J. (2014). A magyar városhálózat stabilitása és változása.
Tér és Társadalom, 2, 105–127.
Rechnitzer, J., Csizmadia, Z., & Grosz, A. (2004). A magyar városhálózat tudásalapú
megújító képessége az ezredfordulón. Tér és Társadalom, 2, 117–156.
Reilly, W. J. (1929). Methods for the Study of Retail Relationships. University of Texas
Bulletin, No. 2944.
Salamin, G., Radvánszki, Á., Nagy, A. (2008). A magyar településhálózat helyzete: értékelés.
Falu Város Régió, 3, 6–26.
Sikos, T. T. (Ed.) (1984). Matematikai és statisztikai módszerek alkalmazási lehetőségei a
területi kutatásban (Földrajzi Tanulmányok 19). Budapest: Akadémiai Kiadó.
Süli-Zakar, I. (1996). A régió: földrajzi integráció. In Süli-Zakar, I. (Ed.), A terület- és
településfejlesztés alapjai (pp. 139–159). Budapest–Pécs: Dialóg Campus.
Sütő, A. (2008). Város és vidéke rendszerek és típusaik Magyarországon. Falu-Város-Régió,
3, 51–64.
Szabó, P. (1998). A napi ingázás kérdésköre a kilencvenes években Magyarországon. Tér és
társadalom, 4, 69–89.
Szalkai, G. (2010). Várostérségek lehatárolása a közúti forgalom nagysága alapján a magyar
határok mentén. Tér és Társadalom, 4, 161–184.
Tóth, G., & Nagy, Z. (2013). Eltérő vagy azonos fejlődési pályák? A hazai nagyvárások és
térségek összehasonlító vizsgálata. Területi Statisztika, 6, 593–612.
Tóth, G. (2014). Az agglomerációk, településegyüttesek lehatárolásának eredményei. Területi
Statisztika, 3, 289–299.
Vadász, I. (1981). Tiszafüred vonzáskörzete (Studia Geographica, 4). Debrecen: KLTE
Földrajzi Intézet.
DETUROPE – THE CENTRAL EUROPEAN JOURNAL OF REGIONAL DEVELOPMENT AND TOURISM
Vol. 12 Issue 3 2020 ISSN 1821-2506
Original scientific paper
82
MISKOLC – A CENTRAL AND EASTERN EUROPEAN CITY IN
THE CROSSROADS
Viktória JÓZSAa
a Nord Consult Ltd. 1106 Budapest, 45 Jászberényi Road, [email protected]
Cite this article: Józsa, V. (2020). Miskolc – a Central and Eastern European city in the crossroads. Deturope.
12(3): 82-107.
Abstract
The main objective of this study is to present the overarching history of a second-tier city (Miskolc,
Hungary) in Central and Eastern Europe from its foundation to the current era and beyond, to the plans
for the next EU programming period between 2021–2027. The city has been in the crossroads of
industries, cultures, borders, innovations and EU programming periods throughout its history. Our basic
hypothesis was that with the overarching but systematically structured analysis and presentation of the
history of the city, we can define its main development stages and gain deeper insights in the roots of the
present and future tendencies. Thus, we studied and synthetized the literature about the history of the city
and identified six phases in its development path based on two main aspects (1) geopolitics and legal
status and (2) local economy and society. With a strong focus on the 20th century, we summarized the
main tendencies and city forming forces, actors and catalysts, and also identified some critical points.
Finally, the determining and newest initiative for the next EU programming period between 2021–2027 is
introduced (Creative Region), that is expected to shape the future of the examined city and its region.
Some conclusions are presented in the last chapter of the study.
Keywords: large cities, development path, Central and Eastern Europe
INTRODUCTION
„Miskolc is the Hungarian city with the brightest future …
There is such vitality in this city, that if the smallest opportunity opens for it, enormous
energies will start to operate”
(Zsigmond Móricz, 1930)
The main objective of this study is to present the overarching history of a second-tier city in
Central and Eastern Europe from its foundation to the current era and beyond, to the plans for
the next EU programming period between 2021–2027. Mid-size cities and their
agglomerations (and city-regions) have been in the focus of Cohesion Policy between 2014–
2020 already, with a focus shift from ‘Europe of the Regions’ to ‘Europe of the City-regions’.
Miskolc is a typical example of a Central and Eastern European city that has experienced
through its history all global tendencies and major shocks starting from an oppidum, through
the privileged free royal city status to municipal law rights, prioritized beneficiary of socialist
Józsa, V.
83
industrialisation and soon after one of the main industrial crisis zones of the county to
depression, pathfinding, slow recovery and repositioning in our days. Our basic hypothesis
was that with the overarching but systematically structured analysis and presentation of the
history of the city, we can define its main development stages and gain deeper insights in the
roots of the present and future tendencies. As a provincialist born and raised in Miskolc, the
author not only aims to provide a transparent overview of the city’s development path until
today, but also to generate common thinking about the possible future scenarios of Miskolc
and so many similar cities.
THEORETICAL BACKGROUND
The history of Miskolc stems from the prehistoric age. The territory of the current settlement
was already inhabited in the prehistoric age, according to the relics of human communities
from 60-70 thousand years ago. Additionally, Miskolc has an outstandingly important role in
the birth of the Hungarian prehistoric archaeology, through the works of Ottó Herman at the
end of the 19th century. There is a major geographic reason why mankind has been
continuously present in this area; Miskolc is situated in the junction of the Great Plain and the
Bükk Mountains in a 20 km long valley. Three types of relief can be found in its area,
dolomitic mountains, hill-country formed by the sea and terrestrial sedimental and volcanic
rocks (Avas), and plain countryside (bordered by Sajó river and streams arriving from the
mountains such as Szinva, Hejő and Bódva). These were good preconditions for both crop
production (especially graveyards) and animal husbandry. Thus, the area of Miskolc has been
a North-East Hungarian target location for the continuous migrations of historic ages.
On the other hand, the constructed environment of the oppidum was formulated by three
large firestorms in 1746, 1781 and 1843 and a huge flooding in 1878, when the downtown of
the city was almost totally destroyed by the water from the streams arriving from the Bükk
Mountains. This catastrophe forced the elaboration of urban regulations and spatial planning.
The road network of the city was formulated in the Middle Ages, only the significance of the
specific roads has been changed from that time. Before the establishment of Greater Miskolc
(1945/1950), the area of the city was much smaller and more homogenous, from that time the
city has become the inheritor of districts with different historical roots (mainly separate
agrarian villages). Regarding the founding of the city, the founding documents are not
available, but the Clan Miskoucz was mentioned at first in a degree dated in 1236, while the
Benedictine Abbey in Tapolca was first mentioned in 1214 (Kubinyi, 1996). With the lack of
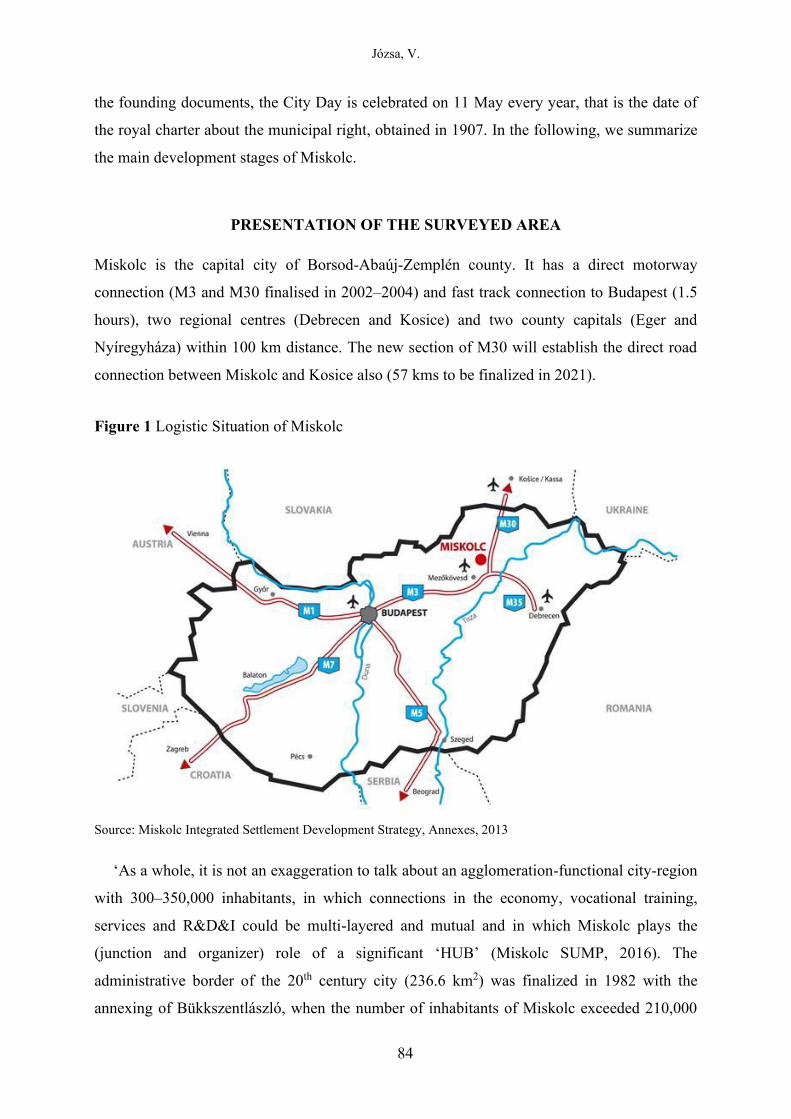
Józsa, V.
84
the founding documents, the City Day is celebrated on 11 May every year, that is the date of
the royal charter about the municipal right, obtained in 1907. In the following, we summarize
the main development stages of Miskolc.
PRESENTATION OF THE SURVEYED AREA
Miskolc is the capital city of Borsod-Abaúj-Zemplén county. It has a direct motorway
connection (M3 and M30 finalised in 2002–2004) and fast track connection to Budapest (1.5
hours), two regional centres (Debrecen and Kosice) and two county capitals (Eger and
Nyíregyháza) within 100 km distance. The new section of M30 will establish the direct road
connection between Miskolc and Kosice also (57 kms to be finalized in 2021).
Figure 1 Logistic Situation of Miskolc
Source: Miskolc Integrated Settlement Development Strategy, Annexes, 2013
‘As a whole, it is not an exaggeration to talk about an agglomeration-functional city-region
with 300–350,000 inhabitants, in which connections in the economy, vocational training,
services and R&D&I could be multi-layered and mutual and in which Miskolc plays the
(junction and organizer) role of a significant ‘HUB’ (Miskolc SUMP, 2016). The
administrative border of the 20th century city (236.6 km2) was finalized in 1982 with the
annexing of Bükkszentlászló, when the number of inhabitants of Miskolc exceeded 210,000
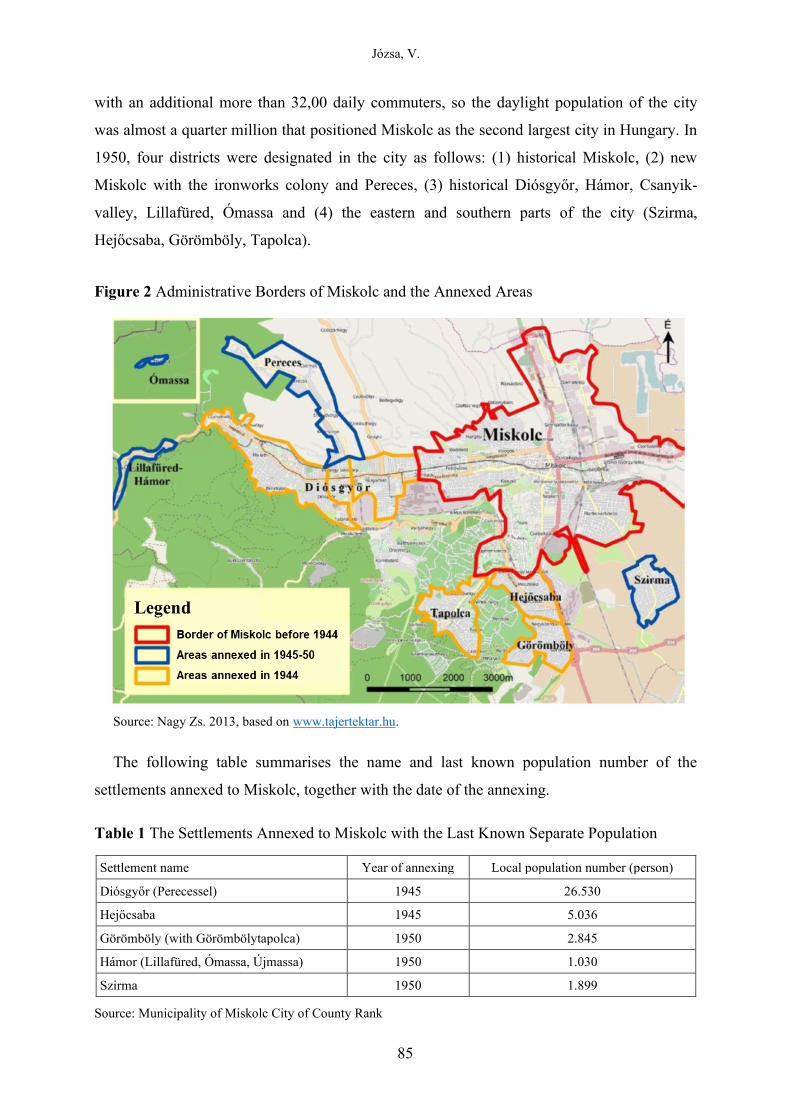
Józsa, V.
85
with an additional more than 32,00 daily commuters, so the daylight population of the city
was almost a quarter million that positioned Miskolc as the second largest city in Hungary. In
1950, four districts were designated in the city as follows: (1) historical Miskolc, (2) new
Miskolc with the ironworks colony and Pereces, (3) historical Diósgyőr, Hámor, Csanyik-
valley, Lillafüred, Ómassa and (4) the eastern and southern parts of the city (Szirma,
Hejőcsaba, Görömböly, Tapolca).
Figure 2 Administrative Borders of Miskolc and the Annexed Areas
Source: Nagy Zs. 2013, based on www.tajertektar.hu.
The following table summarises the name and last known population number of the
settlements annexed to Miskolc, together with the date of the annexing.
Table 1 The Settlements Annexed to Miskolc with the Last Known Separate Population
Settlement name Year of annexing Local population number (person)
Diósgyőr (Perecessel) 1945 26.530
Hejőcsaba 1945 5.036
Görömböly (with Görömbölytapolca) 1950 2.845
Hámor (Lillafüred, Ómassa, Újmassa) 1950 1.030
Szirma 1950 1.899
Source: Municipality of Miskolc City of County Rank
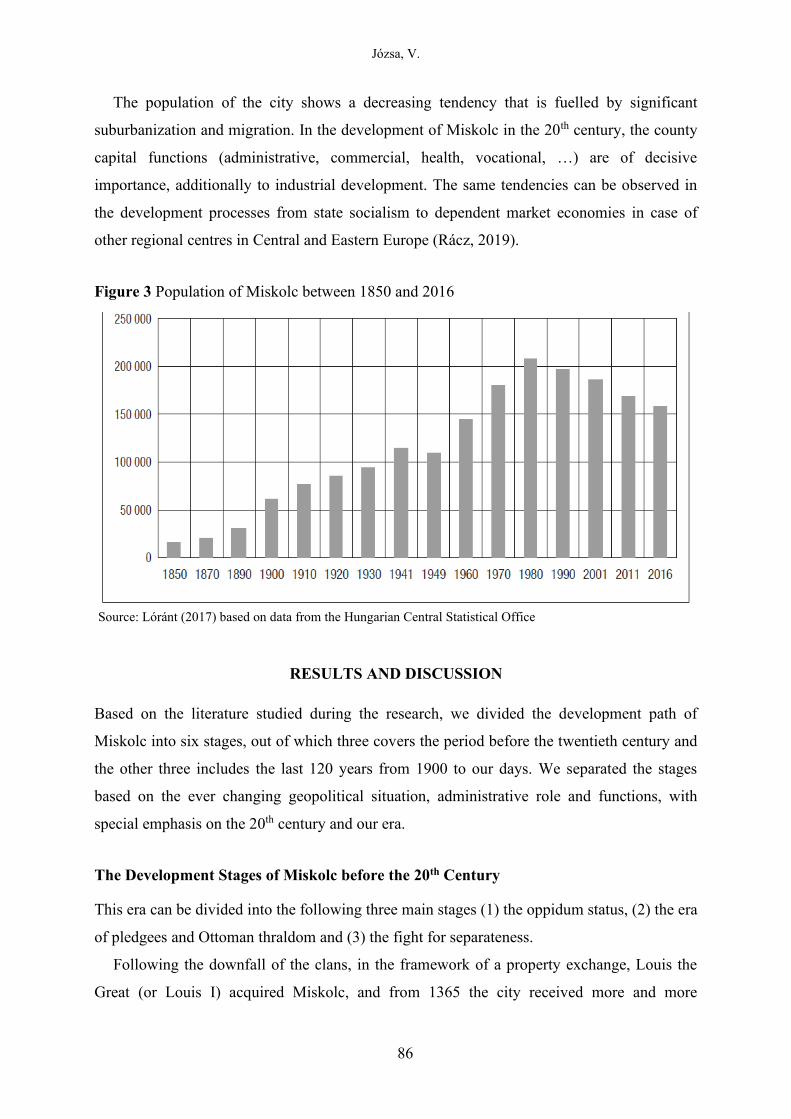
Józsa, V.
86
The population of the city shows a decreasing tendency that is fuelled by significant
suburbanization and migration. In the development of Miskolc in the 20th century, the county
capital functions (administrative, commercial, health, vocational, …) are of decisive
importance, additionally to industrial development. The same tendencies can be observed in
the development processes from state socialism to dependent market economies in case of
other regional centres in Central and Eastern Europe (Rácz, 2019).
Figure 3 Population of Miskolc between 1850 and 2016
Source: Lóránt (2017) based on data from the Hungarian Central Statistical Office
RESULTS AND DISCUSSION
Based on the literature studied during the research, we divided the development path of
Miskolc into six stages, out of which three covers the period before the twentieth century and
the other three includes the last 120 years from 1900 to our days. We separated the stages
based on the ever changing geopolitical situation, administrative role and functions, with
special emphasis on the 20th century and our era.
The Development Stages of Miskolc before the 20th Century
This era can be divided into the following three main stages (1) the oppidum status, (2) the era
of pledgees and Ottoman thraldom and (3) the fight for separateness.
Following the downfall of the clans, in the framework of a property exchange, Louis the
Great (or Louis I) acquired Miskolc, and from 1365 the city received more and more
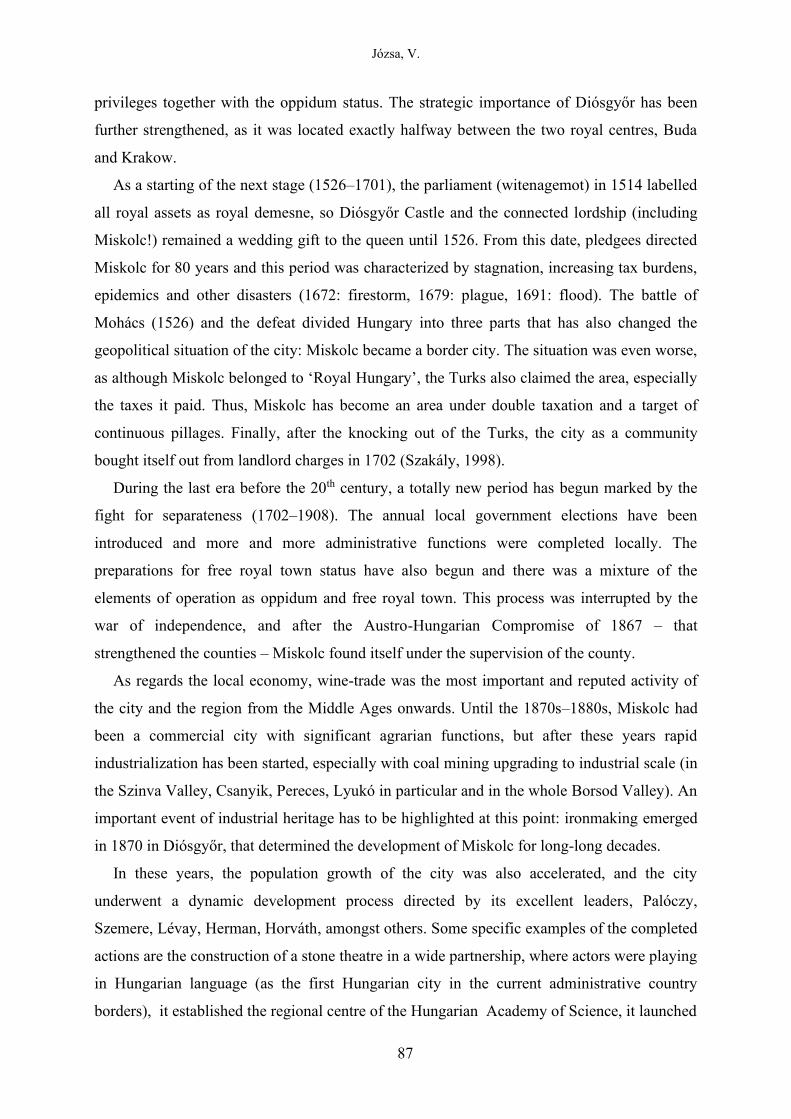
Józsa, V.
87
privileges together with the oppidum status. The strategic importance of Diósgyőr has been
further strengthened, as it was located exactly halfway between the two royal centres, Buda
and Krakow.
As a starting of the next stage (1526–1701), the parliament (witenagemot) in 1514 labelled
all royal assets as royal demesne, so Diósgyőr Castle and the connected lordship (including
Miskolc!) remained a wedding gift to the queen until 1526. From this date, pledgees directed
Miskolc for 80 years and this period was characterized by stagnation, increasing tax burdens,
epidemics and other disasters (1672: firestorm, 1679: plague, 1691: flood). The battle of
Mohács (1526) and the defeat divided Hungary into three parts that has also changed the
geopolitical situation of the city: Miskolc became a border city. The situation was even worse,
as although Miskolc belonged to ‘Royal Hungary’, the Turks also claimed the area, especially
the taxes it paid. Thus, Miskolc has become an area under double taxation and a target of
continuous pillages. Finally, after the knocking out of the Turks, the city as a community
bought itself out from landlord charges in 1702 (Szakály, 1998).
During the last era before the 20th century, a totally new period has begun marked by the
fight for separateness (1702–1908). The annual local government elections have been
introduced and more and more administrative functions were completed locally. The
preparations for free royal town status have also begun and there was a mixture of the
elements of operation as oppidum and free royal town. This process was interrupted by the
war of independence, and after the Austro-Hungarian Compromise of 1867 – that
strengthened the counties – Miskolc found itself under the supervision of the county.
As regards the local economy, wine-trade was the most important and reputed activity of
the city and the region from the Middle Ages onwards. Until the 1870s–1880s, Miskolc had
been a commercial city with significant agrarian functions, but after these years rapid
industrialization has been started, especially with coal mining upgrading to industrial scale (in
the Szinva Valley, Csanyik, Pereces, Lyukó in particular and in the whole Borsod Valley). An
important event of industrial heritage has to be highlighted at this point: ironmaking emerged
in 1870 in Diósgyőr, that determined the development of Miskolc for long-long decades.
In these years, the population growth of the city was also accelerated, and the city
underwent a dynamic development process directed by its excellent leaders, Palóczy,
Szemere, Lévay, Herman, Horváth, amongst others. Some specific examples of the completed
actions are the construction of a stone theatre in a wide partnership, where actors were playing
in Hungarian language (as the first Hungarian city in the current administrative country
borders), it established the regional centre of the Hungarian Academy of Science, it launched
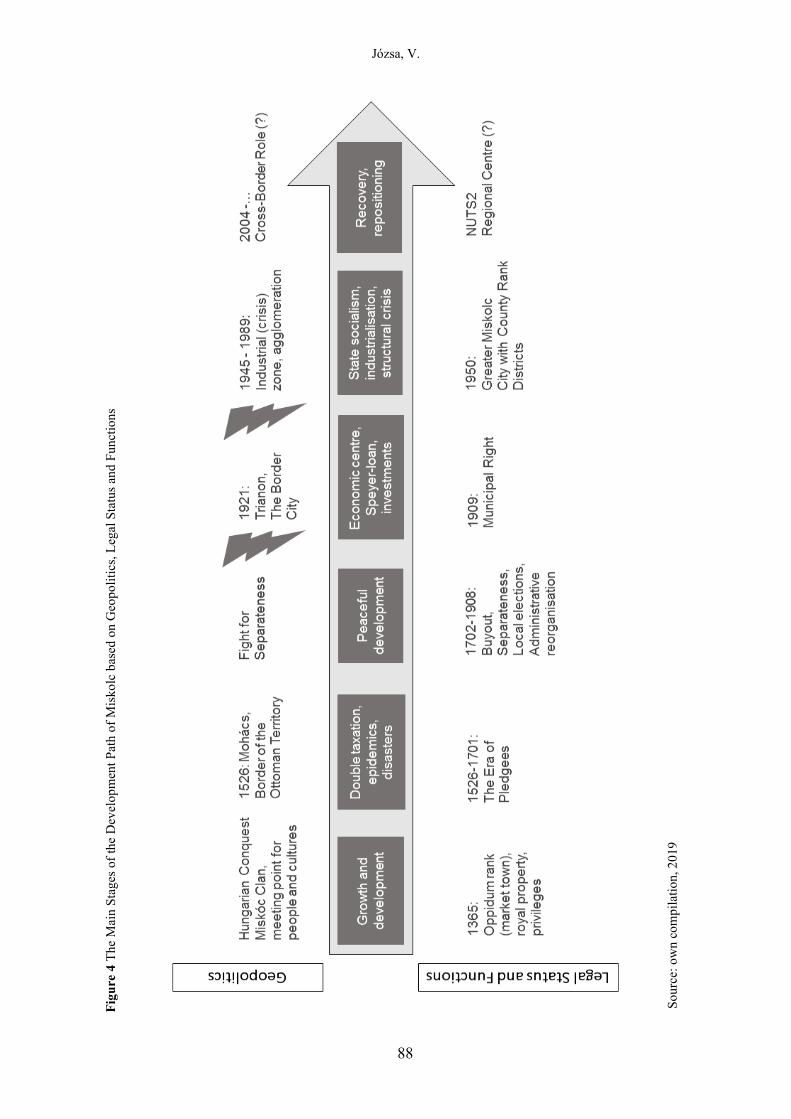
Józsa, V.
88
Fig
ure
4 T
he
Mai
n S
tag
es o
f th
e D
evel
op
men
t P
ath
of
Mis
ko
lc b
ased
on G
eop
oli
tics
, L
egal
Sta
tus
and
Fu
nct
ion
s
So
urc
e: o
wn
co
mp
ilat
ion
, 2
019
Józsa, V.
89
a musical education system, and organized tram transport as the first Hungarian city in the
countryside.
Around the turn of the century, more and more industrial plants began their operation in-
and outside the city, but massive industrialization did not start before the first years of the 20th
century. In these years, the formerly dominant agricultural production lost its primacy over
commerce and rapidly developing industry. Thematic fairs took over the place of traditional
national sales and weekly markets, and these thematic fairs (especially for wheat, malting
barley and cotton) were considered as the most important fairs of Upper-Hungary (Veres,
2003). Public transport and transfer penetrated into everyday life with the appearance of
railway (1870: handover of the railway between Budapest and Miskolc), which further
strengthened the central position of Miskolc, as trains arrived and departed from three
directions – making Miskolc the gate of the highlands.
As a summary, we can state that by the turn of the 20th century Miskolc had lost its feudal
bonds, and separated from the Diósgyőr lordship and the county, embarking on its own
development path. As this process was completed merely in a few decades following the
Compromise, our hypothesis is that the intellectual potential has been long present in the city,
waiting for the best moment to discover and exploit the latent resources of the city in an
innovative way.
The fight for separateness of Miskolc was terminated in 1907, when the house of
representatives accepted its request for municipal law. This title resulted in positive
tendencies and the strengthening of local patriotism also.
The Development Stages of Miskolc in the 20th Century
Miskolc the Border City, the Regional Capital and the Second Largest City of Hungary
The role of Miskolc has completely changed after the Treaty of Trianon. Following the
Compromise (1867), there have been two major central cities in North-East Hungary, Kosice
and Miskolc, that have been rivals for quite a while. This situation was immediately and
fundamentally changed by the decision in Trianon. The disannexing of Kosice did not only
end the rivalry, but also positioned Miskolc as the capital of the region from one day to
another. For this reason, from this time on, the all-time leaders of the city set a new objective:
the establishment of Greater Miskolc.
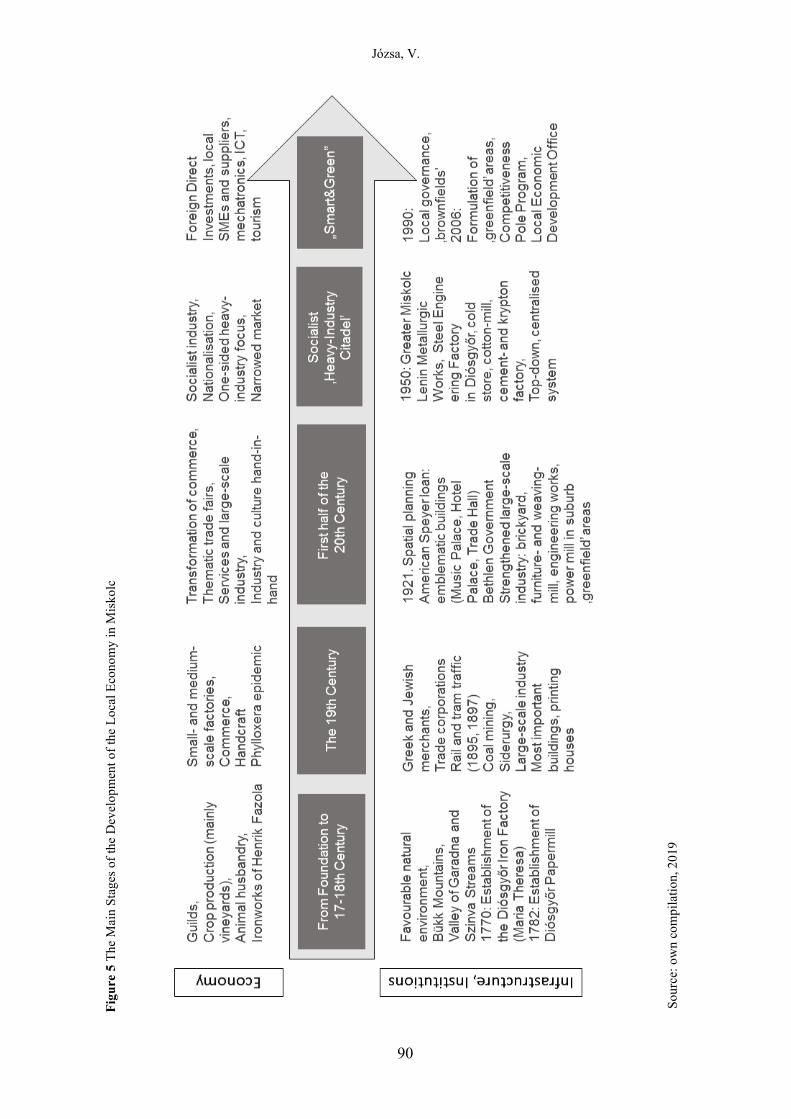
Józsa, V.
90
Fig
ure
5 T
he
Mai
n S
tag
es o
f th
e D
evel
op
men
t o
f th
e L
oca
l E
con
om
y i
n M
isk
olc
So
urc
e: o
wn
co
mp
ilat
ion
, 2
019
Józsa, V.
91
In this period, Miskolc was also labelled as the centre of the Hungarian Ruhr area, or the
capital of Upper Hungary. The Bethlen Government and the American Speyer-loan had a
significant role in the uprise of Miskolc, as a specific example, the Palace Hotel in Lillafüred
was built from this loan and established the area as the social centre of the 1930s. The
relationship between the city and the county has also progressed (as demonstrated by the
publication of an urban development concept entitled Greater Miskolc in Borsod Country).
Miskolc undertook more and larger responsibilities in administrative issues of national
importance also, for example when the reform of territorial governance was born in 1929, the
city organized the cultural congress of the cities east from the Danube, and as a result, the
Cultural Alliance of the Hungarian (Rural) Cities was formed in Miskolc also.
Several factories have been established in the city, the most important facilities were the
brick- and furniture factories, the cloth-mills, the two engineering (machine) works, the
steam-mill and the car-shops plant connected to the railway. By 1920, the past due works of
the sewage and water pipe network had been started (that consumed a significant part of the
Speyer loan) and 30-35% of the population of the city was working in the local industry.
Although the explosive development of the city in the first decades of the 20th century was
concetrated at the outskirts of the town (outside the administrative border, for example the
siderurgy in Diósgyőr and the coal-mining in Pereces), it influenced the life, social structure,
and the composition of the population to a large extent. At this point, it is important to
highlight that the site where the operation of the factory began was part of the
administratively independent Diósgyőr of that time, so the plant was established in an unbuilt
area between Miskolc and Diósgyőr, as a real ‘greenfield investment’ in the recent
terminology.
Scientists, economists, lawyers and politicians were working together on the concept that
mostly compared the regional role of Miskolc to that of Budapest, and regularly published
and negotiated its conclusions even in the year of the war with the widest possible public
audience. This long preparatory work was fruitful, as Greater Miskolc was born on 1 January
1945 based on the resolution of the National Committee of Miskolc.
During the second World War the city suffered significant casualties and its social
structure has changed, for example the loss of almost 4/5 of its Jewish community resulted in
a major diminution of the city’s former commercial and civilian character after 1945.
Józsa, V.
92
The Era of State Socialism: The Flourishing Industrial City and the Collapse
After World War II, the construction of socialism was immediately started, in parallel to the
recovery, although the framework of civil development has barely evolved. It triggered a
fundamental transformation of the administrative system and a shift to centrally planned
(command) economy. As a result, in the 1950s, the city’s population of about 100,000
increased with more than 70,000 in six years!
Due to the fast industrial development measures in the 1950s (including the establishment
of the Cement- and Lime Works in Hejőcsaba, the Miskolc Refrigeration Company and the
Borsod County Dairy Factory, the continuous development of the Lenin Metallurgical Works
(LKM), and the separation of the Diósgyőr Machine Works (DIGÉP)), the city has once again
become a major target location for immigration, not for the first time in its history. As a direct
consequence, with the increasing number and ratio of immigrants, the former commercial-
civilian character of the city has been progressively transformed to an industrial-worker
character. Miskolc has lost its civilian traditions and the immigrants from small rural
settlements could hardly accommodate to the urban environment. This tendency has
determined the milieu, culture and façade of the city also for a long period. Localism, that has
been so strong previously in Miskolc, took a back seat.
Although the fast transformation during socialism was very attractive to inmoving workers,
it influenced the reputation of the city in a negative way at the same time; the image of the
city with a great cultural heritage has been transformed in public thinking into an industrial
centre with all its disadvantageous attributes, such as dirty, unhealthy (poor air quality) and
uncultured. The emblematic Avas Mountain of the city has become prey to the vast and rapid
housing estate projects, completed from brick with traditional technology initially, but
followed by panel technology from the 1960s. One of the country’s largest panel residential
districts was constructed in Miskolc during this period, called Southern Avas District.
Some positive features of the dynamic development were the advanced educational system,
the child protection of national reputation, the well-developed health and social network, and
finally, in the early 1950s, a long-awaited dream of the city has also come true: the Technical
University of Heavy Industry was constructed, forming furnace-, mechanic- and mining
engineers for the region.
From the 1950s to the 1980s, Miskolc was characterized by a flourishing industrial city
era, while 18,000 workers were employed in several shifts in the two large factories in
Diósgyőr (Diósgyőr Machine Works and Lenin Metallurgical Works).
Józsa, V.
93
On the other hand, from the late 1980s, thunder clouds began to appear in the form of
decreased order numbers, and people could feel that the phenomenon of unemployment (last
experienced before WWII) could return…
The main tendencies were the following:
− unstable population of the city (large absorption but small retention capacity);
− replacement and downscaling of the population (loss of qualified workforce and
inmoving of low-skilled workers);
− self-catalysing character of the above tendencies aggravated by the rigid, one-sided and
low-efficiency nature of the economy (Dobrossy, 2002).
Fuelled by the global economic changes, an erosion of the local economy and society has
begun that resulted in large-scale unemployment and exodus of the population from Miskolc
to other parts of Hungary. Miskolc has become one of the major industrial crisis areas of
Hungary. More detailed analysis of this era can be studied in some recent essays (see, e.g.,
Lóránt, 2017; Drótos, Lóránt, 2016; Józsa, 2019) together with the description of similar
urban tendencies in the transition period with a wider (for example Central and Eastern
European) geographical scope (Hajdú, Horeczki, & Rácz, 2017).
From the Change of Regime to Our Days – The Early-Birds and the Main Economic
Actors
Starting from the change of regime, several international companies have selected Miskolc as
a location site for their production activities, although with a decade-long delay compared to
the Western part of the country. In parallel to these inter- and multinational companies,
numerous Hungarian-owned small- and medium-sized companies have been operating in the
city also. The city’s economy could be characterized as diverse, in sectoral terms, with mainly
first- and second-level (Tier-1 and Tier-2) supplier companies.
One of the first international companies, the Japanese Shinwa (manufacturing plastic
components and solutions, and recently electronic devices also for automotive industry)
settled in the city in 1998, and was followed first by the power tool division of Robert Bosch
company group (Robert Bosch Power Tool Kft.) in 2001, and later the automotive division
(Robert Bosch Energy and Body Systems Kft.) in 2003. In our days, more than a hundred
development engineers are working at these two companies, the number of employees
exceeds 5,000 and the companies perform continuous investment projects, introduce
Industry4.0 solutions, operate corporate training workshop, and play an active role in dual
Józsa, V.
94
vocational training and higher education, cooperative research and development activities
mainly with the University of Miskolc (Józsa, 2014).
SEG Automotive (Starters E-Components Generators Automotive Hungary Kft.) has been
operating as a separate entity in Miskolc from 2018, owned by the Chinese Zhengzhou Coal
Mining Machinery Group Co. and an investor company that had formerly purchased the
global starter engine and generator division of Robert Bosch group. The location in Miskolc
not only manufactures starter engines and generators but also includes a corporate research
and development centre in the field.
As local companies, we can mention the MINE-SCREEN Kft., Mirelite Mirsa Zrt., Star-
Plus Kft., and Fux Zrt., (without being exhaustive) that have completed significant investment
projects in the last years in Miskolc, and the companies settled in and operating in the so-
called Mechatronics Industrial Park (Mechapark), one of the flagship projects of the
Technopolis Competitiveness Pole Program (co-financed by the European Structural Funds),
such as WET WIPE Kft., Gustav Wolf Miskolci Drótgyár Kft., SeM-KER Kereskedelmi Kft.,
Aventis Consult Üzleti Tanácsadó Kft., VIZI & CO. Építőipari és Kereskedelmi Kft., and the
Toolstyle Kft.
As the latest achievements, Joyson Safety Systems (formerly: Takata) was settled to the
Miskolc Southern Industrial Park in 2014 and constructed its 60,000 m2 production capacity,
using solely geothermal energy for heating, within 10 months. In its neighbourhood,
Hungarian-owned Spinto Hungária Kft. completed an investment project of HUF 5.9 billion
(EUR 18 million) and started its operation in 2018. The latest large companies to settle down
in the city are the Japanese battery producer, GS Yuasa and the Chinese Chervon Auto,
producing automotive components for both traditional and electric vehicles. The fact that
these are both supplier companies further strengthens the presence of Tier-1 and Tier-2 level
suppliers in Miskolc, but also the position of the automotive sector in the city’s economy. All
of the latest industry settlements have been greenfield investments in the Southern part of the
city (see more details below under the presentation of the industrial parks).
As regards service sector, the ICT giant Vodafone Magyarország Zrt. has to be highlighted
with its regional Shared Service Centre project in 2009, creating 300 new employment
opportunities in the first step and an additional 240 in the second. Finally, PannErgy
Geotermikus Erőművek Zrt. should be mentioned also, as a company operating in energy
industry, completing a flagship geothermal project of primary significance to the energy
supply of the city.
Józsa, V.
95
These companies jointly have a major influence on the local economy, but none of them
could generate this impact separately, contrary to other large Hungarian cities where OEMs
(Original Equipment Manufacturers, for example vehicle and/or engine producers) operate. If
we examine the main location (localization) factors in the case of Miskolc, we can identify
some general, common elements, such as industrial heritage, traditions, educational
background, culture, well-skilled workforce, good transport connections, but also point out
some specific features per company, for example the highly-educated and foreign language-
speaking young graduates and the availability of ‘A’ category office space (Macropolis) for
Vodafone, the outstanding air quality and clarity in Csanyik-Walley for healthcare-industry
player Sanofi, or the continuously widening and deepening level of corporate embeddedness
in case of the reinvestment decisions of the Bosch companies and S.E.G.A (Józsa, 2019).
As a final sectoral aspect, it is important to highlight the role of tourism in the local
economy, with a dynamically increasing importance. This can be followed in both absolute
and relative terms (compared to other county capitals), as the number of guest nights in
commercial accommodation establishments have doubled (from 200,000 to 400,000) between
2010–2017, positioning Miskolc at the fourth place in the list of cities with county rank in
Hungary. This tendency is fuelled by the large development projects completed in the last 15
years in the main touristic locations of the city (e.g.: Lillafüred, Tapolca, Diósgyőr Castle,
historical city centre). Lastly, as a horizontal issue, speaking of the last two decades we also
have to highlight the significant amount of state aids arriving to Hungary, and more
specifically to the region and the city, in the form of non-refundable cash subsidies (grants)
and financial instruments also. These incentives and financial resources had (and still have) a
major role not only in the renewal of the city and its built heritage, but also in the increased
competitiveness and continuous development of local companies (for more detailed results on
the effects of public funds on enterprises in Hungary, see Nyikos-Béres-Laposa, 2020).
Industrial Parks, Industrial and Business Infrastructure
As industrial parks and areas are the main infrastructural tools of local economic development
(Egyed, 2012), it is of major importance to all settlements which kind of sites – preferably
greenfield areas – could be designated for the purposes of both new industry settlement
projects and the reinvestments of existing economic actors. In case of Miskolc, this factor has
had an even higher significance in the last decades for two reasons; firstly, because the city
possesses extensive brownfield areas on the ruins of the collapsed metallurgy (almost 200
Józsa, V.
96
hectares, out of which 45 hectares as DIGÉP site)1, and secondly, because up to 2008, the city
had been located in the circle of greenfield industrial parks and areas (for example Alsózsolca,
Felsőzsolca, Szikszó, Sajóbábony) that absorbed potential investors, with the lack of an own
greenfield industrial area, or a dedicated industrial park (maybe uniquely from the Hungarian
cities with county rank). The breakthrough, the city’s first own greenfield industrial park
(Mechatronics Industrial Park, or Mechapark) was developed in the framework of the
Technopolis Competitiveness Pole Program between 2006–2008.
At the moment, there are three industrial parks and one industrial area in municipal
ownership, the Miskolc Industrial Park (MIP) in the Northern part of the city (including the
Mechapark), the Miskolc Southern Industrial Park (MIDIP), and the new industrial area of
1000 hectares that was nominated as part of the Modern Cities Program (Rechnitzer-Berkes-
Filep, 2019), the so-called Miskolc Eastern Industrial Area. Additionally, a private-owned
industrial park (20 ha) is also operating in the city, on the revitalized area of the former
metallurgical spoil-bank that has a railway side-track also, the Európa Center Miskolc
Business and Logistic Park. The latest initiative of the city is to formulate a new industrial
area on the former airport with sport function, that could be connected to the Mechapark.
Business Networks, Clusters
Two major accredited clusters are operating in Miskolc and its region, one in the field of
automotive industry and the other in the field of information and communication technologies
(ICT). The North Hungarian Automotive Cluster (NOHAC) was established at the end of
2006, by three leading supplier companies, the Chamber of Commerce of Boorsod-Abaúj-
Zemplén county and the Innovation Management and Cooperative Research Centre of the
University of Miskolc. At the moment, NOHAC has 77 members (NOHAC, 2020), including
manufacturing-, design-, certifying- and other service-related companies. Both Bosch
companies in Miskolc are members of the cluster and its current president is the director of
the Robert Bosch power tool factory.
The North Hungarian Informatics Cluster (Infocluster) was established in 2007 by five
companies, in our days the cluster has 41 members (Infoklaszter, 2020). The member
companies also accomplish research and development activities.
1Function change of brownfield areas is still hampered by the fact that they are extensively polluted, densely
built-in, unaccessible by roads (’cities in the city’), and the municipality does not have (dominant) ownership in
these areas. Even in the case of DIGÉP site, only utilisation was solved, but not rehabilitation.
Józsa, V.
97
The third large segment of the city’s economy, tourism and culture, is represented by the
Miskolc Cultural Cluster (kultMIX) and the Miskolc Gastro Cluster, as one of the latest and
most colourful players.
Innovative Forces and Energies
The city has always been well-known for its musical education and choir culture. The
renowned Hungarian Symphony Orchestra Miskolc was established in 1963, and several
cultural events and festivals of national and international reputation have been hosted by the
City, for example the Kaláka folkfestival, the Bartók+ Opera Festival, the Dixieland, or the
Jelly Festival in wintertime. From the 2000s, the city focused on the ‘Culture Builds the City’
slogan and was a finalist on the national round of the European Capital of Culture competition
in 2010 (second place after Pécs). In connection to the International Dance Day, Miskolc
Ballet was formed on 28 April, 2013 (and operates as part of the Miskolc National Theatre).
The Technical University of Heavy Industry established in 1949 has been operating under
the name of University of Miskolc from 1990, and the organizational integration completed in
the 2000/2001 school year has positioned it as a real ‘universitas’. The institution that was
well-known formerly from its traditionally industry-related and legal educational profiles, has
acquired new faculties enriching its portfolio. These new educational profiles are for example
arts-, teacher-, musician- and other humanities type trainings but economic as well. The
University of Miskolc plays a decisive role in the life of Miskolc and Borsod-Abaúj-Zemplén
county, and recently signed a cooperation agreement with CERN (European Council for
Nuclear Research, or Conseil Européen pour la Recherche Nucléaire in French original) based
in Ghent valid until 20382. The Engineering and Intelligent Systems Divisions of Bay Zoltán
Nonprofit Ltd. for Applied Research are also operating in Miskolc. As good examples of local
innovative companies, Admatis Kft. could also be mentioned that is a cooperation partner and
supplier of NASA, the European Space Agency and Airbus, together with IND Group that
provides ICT solutions for the banking industry and was purchased by the American Misys in
2014 for HUF 18 billion (Bitport, 2014).
Cooperations in the field of Research and Development and Innovation (RDI)
The University of Miskolc has been completing several RDI projects in cooperation with
business partners, of which the Higher Education and Industry Cooperation Centre (FIEK)
2The cooperation focuses on the development and testing of superconductor components of the next generation
hadron collider.
Józsa, V.
98
project in the field of Advanced Materials and Intelligent Technologies is an outstanding
example. The results of RDI activities are directly transferred into curricula (for e.g.: BSc,
MSc, PhD and adult education), further increasing the role of corporate departments, for
example Chemical Technology Department (Wanhua-BorsodChem) and Robert Bosch
department of Mechatronics (FIEK, 2018). Additionally to these, it is important to mention
the collaborative research projects co-financed by ESIF (European Structural and Investment
Funds) funds coordinated by the cooperating industrial partners, from which five received
positive decision between 2015–2018 and have been launched with the allocation of a HUF
4.5 billion non-refundable cash state aid.3
Inclusive and Supportive Local Business Environment
Miskolc has always been a welcoming host environment for merchants, craftsmen, producers
and other actors of the economy, although recovery from the collapse of heavy industry
required more than a decade. Even in the 2000s, heated debates were generated among local
leaders on the need to construct a greenfield industrial park in the city. The general public
opinion was that the rehabilitation of brownfield areas was more necessary, and these areas
were the main sites of foreign direct investment (FDI) support activities coordinated and
operated at the national level. For this reason, the Technopolis Competitiveness Pole
Programme – and the development of the Mechatronics Industrial Park in particular – was a
real milestone and was of outstanding importance. In this respect, the changing attitude of
local decision-makers, but also benchmarking activities conducted with other (competing?)
cities, mapping of international good practices, advanced cooperation with the national level,
sectoral ministries and policies, (re)strengthening of local partnerships, identity and patriotism
played a part.
Local economic development activities by the local municipality were launched in parallel
to the establishment of Miskolc Holding Zrt., based on international and national good
practices with the addition of some institutional innovations also (for example that of
Debrecen city, the major difference being that economic development was not included
among the activities of the asset management company).
The first step was strategic programming, namely the development of the Technopolis
Strategy based on a wide partnership, in a bottom-up process, including a project matrix as
3Out of which two are connected to e-mobility (for one project Robert Bosch Energy and Body Systems Kft. is
the project consortium leader), one to health ndustry, one to services (ICT, call center and one to bank
informatics.
Józsa, V.
99
well. The main identified objectives were (i) modern infrastructure tailored to investors’
needs, (ii) efficient, coordinated local organization and business-friendly environment, (iii)
cooperative local partnership, (iv) international visibility (Józsa & Nagy, 2013).
As a second step, the Local Economic Development (LED) Office was established in 2007,
with a detailed action plan for the forthcoming years. The third step included
operationalization of the projects in the strategy, in the following order:
− development of ‘hard’ infrastructure (Mechatronics Industrial Park, direct motorway
connection, application for the title of Miskolc Southern Industrial Park);
− development of ‘soft’ infrastructure (one-stop-shop, FDI promotion activities,
management of flagship investment projects, red-tape reduction measures in local
administration and public services, local FDI support regulation4);
− development of local partnership (coordination, role of local hero and catalyst,
Technopolis Coordinative Committee, annual conferences, investor roundtables,
information days, FDI aftercare, benchmarking activities, supplier- and other database
development);
− achievement of international visibility (repositioning, new marketing tools, international
competitions, e.g. Financial Times FDI competition (2008), European Enterprise Award
(2009), umbrella brand, multilingual FDI promotion materials, joint representation on
international conferences and fairs with large companies operating in Miskolc).
The success of the local economic development system was well-illustrated by the industry
settlement and reinvesting decisions, such as the new industrial hall of Robert Bosch (2008),
the settling of Vodafone and Patec (2009), and the first investors in the Mechapark. These
important investment decisions were made in the period of the global economic and financial
crisis, in a distressed and resourceless era. From the 2010s onwards, several more investment
projects have been completed in the city (as presented above), and regarding the most recent
years, the technology-intensive reinvestment decisions of the two Bosch companies and the
settlement of Lufthansa Technik’s service centre (planned opening in 2022) should be
mentioned.
City-forming Energies, the Catalysts of Transformation
At the end of the 1980s, the city turned back to its forgotten values, and the reconstruction of
the historical city centre and the renewal of the cultural institutions were started. The early
4This was strengthened and supported by the General block exemption Regulation (800/2008/EC) of the Eropean
Commission on temporary state aids because of the global financial and economic crisis.
Józsa, V.
100
1990s opened a new chapter in urban planning and development, although these historical
years also brought a great deal of uncertainties in local governance; the disintegration of the
former social systems and coordinating mechanisms were accompanied with a frequently
changing legal-regulatory background and waning governmental financial resources.
The decade following the change of regime was mostly marked by the belief that the city’s
traditional heavy industry – that secured steady living conditions for the citizens – could still
be resurrected. This was supported by local decision-makers also, as they delayed the
recognition that Miskolc needed new visions – a part of its history was closed and now
something new should begin. Thus, only the second decade after the change of regime
brought the insight that the city should be repositioned.
As a result, in the 2000s, the new city marketing was focused on the outstanding cultural
heritage of the city, on its beautiful districts (Lillafüred, Tapolca, Diósgyőr and the historical
city centre), natural environment and untapped potentials – instead of industry. A new city
slogan was introduced: Miskolc – the City of Open Gates, that expressed the well-known
friendly and welcoming attitude of Miskolc citizens. The completed investment projects also
showed that the city imagined its future on a new development path that focused on
mechatronics, automotive industry, ICT, energy industry and tourism. The development
process continued in the 2010s, and the city committed itself to becoming a ‘smart city’
through its several international cooperation projects as well. Some completed flagship
projects are the beach in Tapolca, the Green Arrow tramway reconstruction project, the
purchasing of CNG buses, the geothermal energy project, the TIMI application, the passenger
information system, the digitalization of waste transport, the wifi connection and LED walls
in public spaces, the availability of two urban ‘open data’ platforms, the GIS-based
geoinformatics development project and the digital community project (that provided 17,000
notebooks for local citizens free of charge). Public safety is significantly advanced, and the
local economy strengthened as reflected in increasing local taxes paid by local actors.
As seen from the above, several city forming energies are operating in the city at both the
institutional and individual level. On the other hand, despite the positive tendencies, their
interconnections and mutually beneficial, strengthening, synergetic effects are still very
limited. The separate smaller communities of a higher education institution, a large company,
the leading art, educational, administrative and other institutions do not form a local,
settlement level community, thus local identity in Miskolc could be evaluated as weak,
compared to other county capitals in Hungary (to a large extent due to historical causes
presented previously). Currently – and starting from the change of regime – the
Józsa, V.
101
transformation of Miskolc has been coordinated and fuelled by the settled/settling foreign
direct investors and the leading local institutions presented above, in parallel to each other,
joining their forces only on an ad-hoc basis, for the sake of a separate project, but not at a
systemic level, in strategic cooperations. The joining of these separate high intellectual level
potentials, and the institutionalization of the cooperations, the forming of a regular platform,
efficient and sustainable partnerships and lobby towards the national government are still
tasks for the future.
The Creative Region Initiative
The aim of the „Creative Region – Development without borders in Northeast Hungary
National, Economic and Cultural Zone” program is to create a single economic, educational
and cultural zone of Northeast Hungary (the counties of Borsod-Abaúj-Zemplén, Hajdú-
Bihar, Jász-Nagykun-Szolnok and Szabolcs-Szatmár-Bereg) and the cross-border areas. In
March 2020, the mayors of the concerned cities (Miskolc, Debrecen, Nyíregyháza, and
Szolnok) agreed on a workshop (moderated by the Minister for Innovation and Technology)
on the common goals of increased attractiveness for citizens and competitiveness for
businesses, together with infrastructural, economic and cultural development. The mayors
emphasized that they plan to implement synergetic and cross-border development projects in
the next EU programming period (2021–2027). Thematic working groups have been
established in the framework of the Coordination Forum, as follows: (1) social innovation, (2)
infrastructure, (3) competitiveness, (4) development of the cities of county rank, (5)
involvement of cross-border areas. The preparation phase will continue according to the
original schedule and with due regard to available local and EU resources.
The National Development 2030 (National Development and Territorial Development
Concept) contains the future spatial structure that formed the basis of the Creative Region
development programme. The spatial structure vision outlines so-called functional areas
(Figure 6), where specific zones of national importance could be developed for economic,
social and/or environmental functions/tasks. In the concept, the necessity of new aspects, such
as investment stimulating spatial structure (especially the establishment of attractive
locational conditions) are specified, additionally to the reduction of territorial imbalances and
inequalities in social and economic development. The Debrecen-Miskolc-Nyíregyháza
network and the cross-border relations of the three cities are clearly the bases of strategic
economic development (Figure 7).
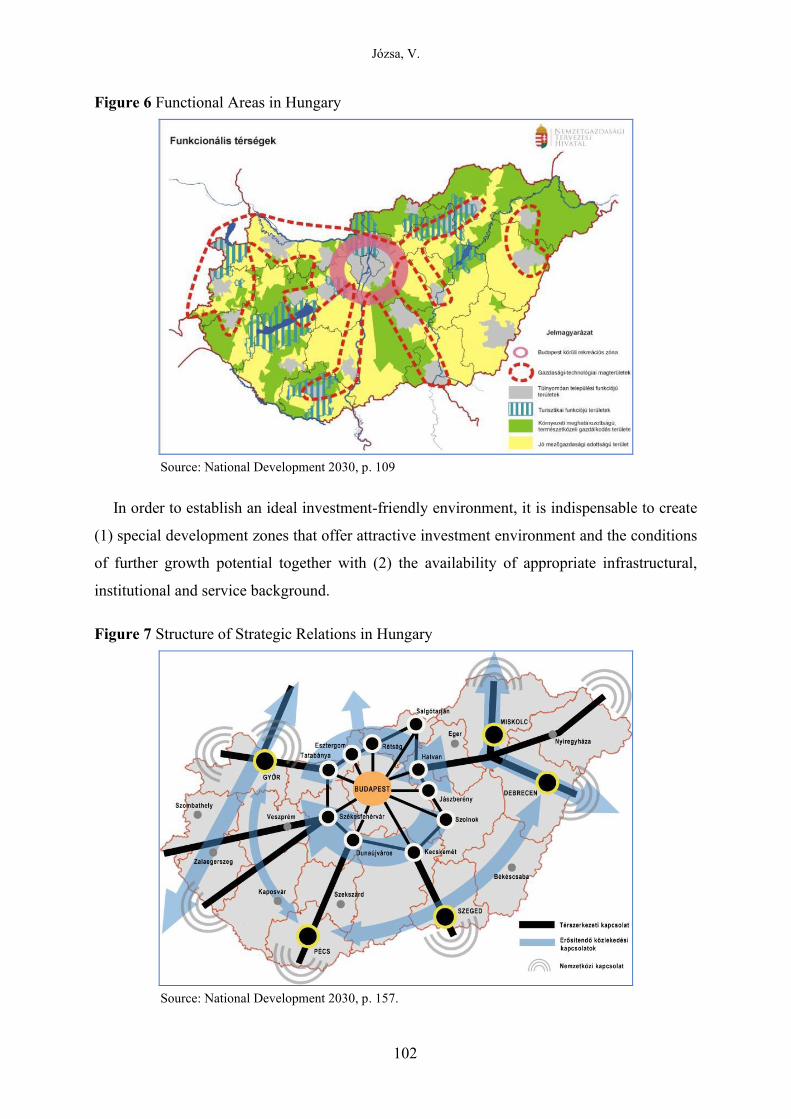
Józsa, V.
102
Figure 6 Functional Areas in Hungary
Source: National Development 2030, p. 109
In order to establish an ideal investment-friendly environment, it is indispensable to create
(1) special development zones that offer attractive investment environment and the conditions
of further growth potential together with (2) the availability of appropriate infrastructural,
institutional and service background.
Figure 7 Structure of Strategic Relations in Hungary
Source: National Development 2030, p. 157.
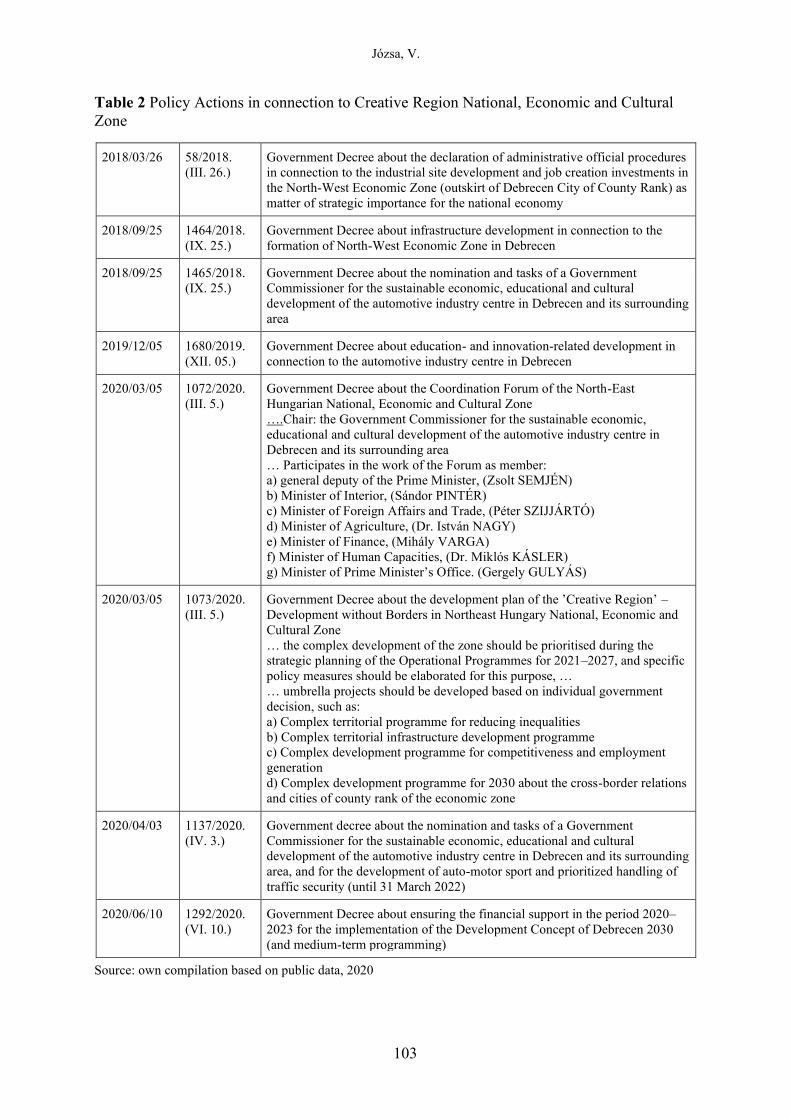
Józsa, V.
103
Table 2 Policy Actions in connection to Creative Region National, Economic and Cultural
Zone
2018/03/26 58/2018.
(III. 26.)
Government Decree about the declaration of administrative official procedures
in connection to the industrial site development and job creation investments in
the North-West Economic Zone (outskirt of Debrecen City of County Rank) as
matter of strategic importance for the national economy
2018/09/25 1464/2018.
(IX. 25.)
Government Decree about infrastructure development in connection to the
formation of North-West Economic Zone in Debrecen
2018/09/25 1465/2018.
(IX. 25.)
Government Decree about the nomination and tasks of a Government
Commissioner for the sustainable economic, educational and cultural
development of the automotive industry centre in Debrecen and its surrounding
area
2019/12/05 1680/2019.
(XII. 05.)
Government Decree about education- and innovation-related development in
connection to the automotive industry centre in Debrecen
2020/03/05 1072/2020.
(III. 5.)
Government Decree about the Coordination Forum of the North-East
Hungarian National, Economic and Cultural Zone
….Chair: the Government Commissioner for the sustainable economic,
educational and cultural development of the automotive industry centre in
Debrecen and its surrounding area
… Participates in the work of the Forum as member:
a) general deputy of the Prime Minister, (Zsolt SEMJÉN)
b) Minister of Interior, (Sándor PINTÉR)
c) Minister of Foreign Affairs and Trade, (Péter SZIJJÁRTÓ)
d) Minister of Agriculture, (Dr. István NAGY)
e) Minister of Finance, (Mihály VARGA)
f) Minister of Human Capacities, (Dr. Miklós KÁSLER)
g) Minister of Prime Minister’s Office. (Gergely GULYÁS)
2020/03/05 1073/2020.
(III. 5.)
Government Decree about the development plan of the ’Creative Region’ –
Development without Borders in Northeast Hungary National, Economic and
Cultural Zone
… the complex development of the zone should be prioritised during the
strategic planning of the Operational Programmes for 2021–2027, and specific
policy measures should be elaborated for this purpose, …
… umbrella projects should be developed based on individual government
decision, such as:
a) Complex territorial programme for reducing inequalities
b) Complex territorial infrastructure development programme
c) Complex development programme for competitiveness and employment
generation
d) Complex development programme for 2030 about the cross-border relations
and cities of county rank of the economic zone
2020/04/03 1137/2020.
(IV. 3.)
Government decree about the nomination and tasks of a Government
Commissioner for the sustainable economic, educational and cultural
development of the automotive industry centre in Debrecen and its surrounding
area, and for the development of auto-motor sport and prioritized handling of
traffic security (until 31 March 2022)
2020/06/10 1292/2020.
(VI. 10.)
Government Decree about ensuring the financial support in the period 2020–
2023 for the implementation of the Development Concept of Debrecen 2030
(and medium-term programming)
Source: own compilation based on public data, 2020
Józsa, V.
104
It is also interesting to examine how a new initiative could be formulated and transferred
into practice from the policy level, more specifically: what have been the subsequent steps
and timeline of the establishment of the Creative Region. Table 2 summarises the policy
actions completed so far, based on the relevant government decrees. The intervention logic
was as follows: (1) “flagging” the large-scale investment project in the region, of strategic
importance for the national economy (e.g.: prioritisation in administrative processes), (2)
connected “hard infrastructure” development, (3) delegating a representative from the
government (commissioner), (4) connected “soft infrastructure” development, (5)
establishment of the decision-making body, (6) elaboration of the programming document, (7)
widening of the activity scope of the government representative (8) allocation of resources for
short-term project implementation and mid-term programming.
CONCLUSION
It can be concluded as a starting point that the so-called Bükk culture that evolved already in
B.C. 5000 is special and unique. The openness and ambition to continuous innovations
accompany the history of the city, especially in taxation, spatial planning, technologies and
sciences, without being exhaustive. Throughout its history, the city has had a pioneering or
outstanding role in several aspects distinguishing it from other cities in Hungary. In parallel to
these, the fight for separateness and internal division have characterized Miskolc for
centuries.
The acquisition of municipal right from 1909 gave a boost to spatial planning and urban
development, and the administrative border of the city was significantly extended in the mid–
20th century (with the formation of Greater Miskolc). On the other hand, we cannot ignore the
tendencies that shaped the life of citizens in Miskolc and Northern Hungary in the first
decades of the 20th century, namely World War I, the migration waves at the turn of the
century, after Trianon and then in the 1930s, the subsequent changes of county borders and
the personal losses during World War II. As a summary, the first half of the 20th century was a
troubled period in the history of Miskolc, characterized with outstanding performances and
large traumas and ruptures.
Post-WWII, in the era of state socialism, forced industrialization further strengthened the
one-sided heavy industry-based character of the local economy, and at the same time,
positioned Miskolc as one of the major immigration targets (not for the first time in its
history). The local population reached its peak (over 210,000 inhabitants) in 1985, from
Józsa, V.
105
which date it shows a continuously decreasing trend. Currently, the population of Miskolc is
about 155,000, and although the break or reversal of the decreasing trend would be welcome,
we should also mention that this is the size for which the local infrastructure forms an optimal
background.
With the collapse of heavy industry, several tens of thousands of workplaces were
destroyed, causing a severe structural crisis in the city. At the end of the 1980s, the city turned
towards its forgotten values and in the 1990s, a new chapter was opened in the history of
spatial planning and urban development, accompanied by the uncertainties of local
governance. In the decade following the change of regime, city leaders were still hoping that
heavy industry could be revitalized, and the recognition that the city should be repositioned
only arrived in the 2000s. From these years, the city has embarked on a road towards a
sustainable, liveable, safe, smart and environment-cautious city image.
Based on our hypothesis and as a summary of the analysis, we can conclude that there are
some characteristics of the city that could be detected at each stage of its development path,
such as its openness to innovation and creativity, its friendliness and inclusiveness to all
people (e.g: visitors, workers, settling families), its skilled and creative workforce curious and
ready for the newest technologies and sciences, its beautiful natural environment, built
heritage and good logistic position, and its capability and willingness for regeneration. On the
other hand, internal division, the relative lack of cohesive forces and patriotism, local identity
and consciousness as a community, culture of cooperation and trust are also characteristics of
the city. Miskolc is not unique in Central and Eastern Europe with these features in our days:
as a recent study demonstrates, a stronger cohesion in the social dimension, as a general
feature, can be observed when examining CEE countries, alongside indicators in territorial
cohesion and sharp differences in physical and social geography (Szabó, Kukely, & Bártfai
2019).
It is hard to tell what the future will bring for Miskolc, but in economic terms the city is
stabilized to date. In social terms, there is still a lot to do, especially in the field of local
patriotism and identity, community development and the institutionalization of collaborations.
Competition for international investment projects, talent, resources, positions, high value-
added activities will be even fiercer in the forthcoming years. Thus, based on the development
path presented in the study, it would be advisable to return to our roots, to the ‘welcoming
city’, the (re)attraction of talented professionals, the elimination of divisions and quarrels, and
to join all forces in the interest of the city. In this respect, other Hungarian cities may provide
Józsa, V.
106
several good examples. Collaboration and community-building efforts of those who are eager
to work for the city are the key and token for the future of Miskolc.
Acknowledgement
The research has been implemented with the support provided from the National Research, Development
and Innovation Fund of Hungary (Geopolitical Processes and Imaginaries in Central Europe: States,
Borders, Integration and Regional Development, NKFI K 134903).
REFERENCES
Dobrossy, I. (2002). Miskolc 19–20. századi városrendezési tervei és megvalósulásuk. In
Veres, L., & Viga, Gy. (Eds.), A Herman Ottó Múzeum Évkönyve 41. (pp. 171–206).
Miskolc: Herman Ottó Múzeum.
Drótos, L., & Lóránt, K. (2016). Tanulmány Miskolc város és vonzáskörzete
iparszerkezetének átalakulásáról, kiemelten az egykori Lenin Kohászati Művek (LKM)
állami vállalat megsemmisítésének körülményeiről, RETÖRKI.
Egyed, I. (2012). A regionális tudomány az elmélet és a gyakorlat között. Tér és Társadalom,
26(4), 17–36. doi: 10.17649/TET.26.4.2092
Hajdú, Z., Horeczki, R., & Rácz, Sz. (2017). Changing settlement networks in Central and
Eastern Europe with special regard to urban networks. In Lux, G., & Horváth, Gy.
(Eds.), The Routledge Handbook to Regional Development in Central and Eastern
Europe (pp. 123–140). http://doi.org/10.4324/9781315586137
Józsa, V., & Nagy, H. (2013). Helyi gazdaságfejlesztés – megéri-e a befektetést, és ha igen,
kinek? A miskolci helyi gazdaságfejlesztési rendszer kialakításának lépései és
tapasztalatai. In Rechnitzer, J., Somlyódyné Pfeil, E., & Kovács, G. (Eds.), A hely
szelleme – a területi fejlesztések lokális dimenziói: A Fiatal Regionalisták VIII.
Konferenciáján elhangzott előadások. Győr: Széchenyi István Egyetem Regionális- és
Gazdaságtudományi Doktori Iskola.
Józsa, V. (2014). A Robert Bosch csoport miskolci letelepedése és beágyazódásának
folyamata. Tér és Társadalom, 28(2), 199–213. doi: 10.17649/TET.28.2.2616.
Józsa, V. (2019). A helyi beágyazódás útjai Magyarországon. Budapest: Dialóg Campus.
Kubinyi, A. (Ed.) (1996). Miskolc története I. A kezdetektől 1526-ig. In Dobrossy, I.
(Főszerk.), Miskolc története 6 kötetben. I. kiadás. Miskolc: Borsod-Abaúj-Zemplén
Megyei Levéltár; Herman Ottó Múzeum.
Lóránt, K. (Ed.) (2017). Az Acélváros végnapjai. Hogyan semmisült meg húszezer ember
munkahelye a Lenin Kohászati Művekben. Lakitelek: Antológia Kiadó.
Móricz, Zs. (1930). Mai Napok Miskolc. Nyugat, 22.
Nagy, Zs. (2013). Az ipari tevékenység városfejlődésre gyakorolt hatása három Borsod-
Abaúj-Zemplén megyei példán keresztül – Miskolc, Kazincbarcika és Tiszaújváros,
szakdolgozat. Miskolc: Miskolci Egyetem Műszaki Földtudományi Kar.
Nyikos, Gy., Béres, A., & Laposa, T. (2020). Micro-economic effects of public funds on
enterprises in Hungary. Regional Studies Regional Science, 7(1), 346–361.
Rácz, Sz. (2019). Development Processes of Regional Centres in Central and Southeast
Europe – From State Socialism to Dependent Market Economies. Deturope, 11(2), 92–
100. http://www.deturope.eu/img/upload/content92-100.pdf
Rechnitzer, J., Berkes, J., & Filep, J. (2019). The most important city development initiatives
of Hungary. Regional Statistics, 9(2), 20–44. DOI: 10.15196/RS090204
Józsa, V.
107
Szabó, P., Bártfai, G., & Kukely, Gy. (2019). Társadalmi, gazdasági és területi kohézió a
XXI. század Kelet-Közép-Európájában. Közép-Európai Közlemények, 12(1), 9–26.
Szakály, F. (Ed.) (1998). Miskolc története II. 1526-tól 1702-ig. In Dobrossy, I. (Főszerk.),
Miskolc története 6 kötetben. I. kiadás. Miskolc: Borsod-Abaúj-Zemplén Megyei
Levéltár; Herman Ottó Múzeum.
Veres, L. (Ed.) (2003). Miskolc története IV/2. 1848-tól 1918-ig. In Dobrossy, I. (Főszerk.),
Miskolc története 6 kötetben. I. kiadás. Miskolc: Borsod-Abaúj-Zemplén Megyei
Levéltár; Herman Ottó Múzeum.
Miskolc Integrated Settlement Development Strategy, Annexes, 2013
Miskolc fenntartható mobilitási tervének (SUMP) felülvizsgálata, bírálati dokumentáció,
Közlekedés Fővárosi Tervező Iroda Kft., 2016
NOHAC, 2020: http://www.nohac.hu/index.php/en/about-us
Infoklaszter, 2020: http://www.infoklaszter.hu/index.php/hu/a-klaszterrol
A miskolci FIEK projekt leírása: http://fiek.uni-miskolc.hu/
National Development 2030, page 109
Bitport, 2014, https://bitport.hu/londoni-szoftvergyarto-vette-meg-az-ind-groupot.html
1907. évi LI. törvénycikk Miskolcz rendezett tanácsu városnak törvényhatósági joggal
felruházásáról
Miskolc Megyei Jogú Város Közgyűlési jegyzőkönyve, 2018. október 25.
Miskolc Holding Zrt. (2018) http://miskolcholding.hu/miskolc-holding-zrt
DETUROPE – THE CENTRAL EUROPEAN JOURNAL OF REGIONAL DEVELOPMENT AND TOURISM
Vol. 12 Issue 3 2020 ISSN 1821-2506
Original scientific paper
108
THE ROLE OF TERRITORIAL CAPITAL IN URBAN RENEWAL IN
A NON-CORE CENTRAL EUROPEAN CITY
Ildikó EGYEDa, Szilárd RÁCZb
a CERS Institute for Regional Studies, H-7621 Pécs, Papnövelde u. 22., [email protected] b CERS Institute for Regional Studies, H-7621 Pécs, Papnövelde u. 22., [email protected]; Széchenyi
István University, H-9026 Győr, Egyetem tér 1.
Cite this article: Egyed, I. Rácz, S. (2020). The role of territorial capital in urban renewal in a non-core
Central European city. Deturope. 12(3): 108-132.
Abstract
The concept of territorial capital, presented by the authors as an alternative to exogenous, FDI-driven
economic restructuring strategies, has fertilised regional development policy thinking in multiple ways.
Triggering reflections on the bottom-up reconceptualisation of regional policy, it has a particular salience
in peripheral or lagging regions due to its potential to reverse deeply-entrenched core-periphery relations.
The paper discusses the concept of territorial capital with a view to its policy embeddedness and
academic valorisation. The structure of the paper is as follows. The first section presents the theoretical
antecedents and conceptual evolution of the notion of territorial capital. This is followed by a brief
discussion of the relevance of territorial capital in non-core or peripheral Central European contexts. The
concluding section seeks to identify the main obstacles to collaborative and integrated strategy-making
relying on the territorial capital approach in the case study city of Pécs, demonstrating its crucial absence
from post-2000 top-down regional development programmes.
Keywords: territorial capital, competitiveness, city success, second tier cities, Central Europe, Pécs
INTRODUCTION
Territorial capital, as a useful analytic tool facilitating a nuanced assessment of the
determinants of territorial competitiveness and a better understanding of spatially
heterogenous local and regional development trajectories, has been been widely adopted and
analysed in academic literature. Despite the novelty of the concept, it cannot be regarded as a
new regional development paradigm in the ‘Kuhnian sense’, constituting a major disruption
with respect to existing knowledges legitimised by epistemic communities. A broad-brush
summary of its theoretical antecedents and conceptual evolution demonstrates its
embeddedness in local development currents of the ’80s and territorial cohesion policy
relevance. Avoiding the pitfalls of monocausalistic narratives of urban decline, the theory of
territorial capital has considerable explanatory currency for unveiling the multiple causes of
Egyed, I., Rácz, S.
109
persistent spatial disadvantage, a darker and somewhat more overlooked aspect of the
valorisation of territorial diversity or capital. Territorial capital has a particular salience in
non-core or peripheral contexts with limited opportunities for FDI-driven economic
restructuring. Besides providing a more nuanced view of the determinants of city success, the
territorial capital approach contributes to deconstructing narratives of decline and
monocausality in regard to left-behind or stigmatized places.
By allowing cities to capitalise on their disadvantages, it can help them break the vicious
cycle of self-reinforcing processes of decline feeding from negative perceptions as the authors
demonstrate in their case study on Pécs, a South Hungarian post European Capital of Culture
city in search of new development paths.
THEORETICAL BACKGROUND
Territorial capital in cohesion policy narratives
Emerging outside a strictly scientific context, the concept of territorial capital, largely
coterminous with the endogenous potentials of an area (Nordregio 2009) has fertilised
cohesion policy thinking in a multiple ways. Existing conceptualisations of territorial capital
highlight its contribution to territorial diversity and the crucial significance of soft, intangible
(social, cultural, human, institutional) factors in enhancing regional performance in the EU
(ESPON, 2006; Camagni, 2008). The non-academic origins of territorial capital are pointed
out by numerous studies discussing its conceptual evolution and gradual embrace by cohesion
policy (see, e.g. Fratesi & Perrucca, 2014; Tóth, 2015).
According to the OECD (2001) report on Territorial Economy, a region’s capacity to grow
is conditioned by its capacity to exploit its tangible and intangible territorial capital assets.
The range of local assets listed under the umbrella concept of territorial capital range from
traditional (geographical location, size, factor of production and infrastructure endowment,
climate, traditions, natural resources) to soft factors (quality of life, agglomeration economies,
untraded interdependencies, social capital, industrial atmosphere). Traditional elements of
territorial capital are in the focus of Cohesion Policy’s original rationale, i.e. compensating
regions disadvantaged by ‘first nature determinants of growth’ (physical geography, natural
endowments) for the lack of positive agglomeration effects generated by the single market
that benefit their country as a whole but conspicuously bypass them. With the paradigm
change of regional policy (see Garcilazo et al. 2015) the emphasis shifts to ‘second nature
Egyed, I., Rácz, S.
110
determinants of growth’ (constructed factor endowments) and mobilising underutilised
potential in lagging regions. A more recent taxonomy of territorial capital classifies the
various components according to their relevance for spatial planning and development policy
(Faragó, 2019), highlighting the importance of factors modifiable through policy intervention
in the short-to-medium term, such as governance structures, management, resource allocation
and investment decisions, political, economic, financial and legal institutional frameworks
and ownership relations.
Cohesion policy’s gradual alignment with general EU policy objectives subsumes
territorial capital under the goals of the EU’s Lisbon and Gotheburg Agendas (Melbye, 2006).
The Bacground document for the EU’s Territorial Agenda (EC 2005: 5.) states, for instance
that ‘…many of the components of territorial capital and human resources (economic and
non-economic, social, environmental, cultural, and the ’genius loci’), including their
integration and connectivity (both cross-border and transnational) to other areas, can lead to
productivity gains and generate growth’ and assigns a key role to territorial development
policy in strengthening territorial capital.
The integration of the concept of territorial capital into Cohesion Policy thinking was a key
milestone in the bottom-up reorientation of regional policy (OECD, 2009; OECD, 2011;
Barca, 2009, 2012). Place-based policies promoting territorial capital accumulation highlight
that each region may contribute to national economic performance, irrespective of their level
of development. The objective of targeted interventions is to assist regions to reach their
potential endogenously (OECD, 2009), i.e. by exploiting their pre-existing economic
structures, entrepreneurial abilities, relational skills rooted in local culture and history. The
introduction of the notion of territorial cohesion rooted in the key principles (polycentricity,
spatial justice) of French spatial planning (Faludi, 2006; Luukkonen, 2010) serves EU
regional policy objectives of countering the multi-speed development of the EU’s territory
that questions the foundations of the European social model.
Besides their social injustice dimension, spatial disparities are seen as a drag on national
productivity growth in incumbent EU member states, conducive to the so-called “productivity
paradox” (McCann, 2016). Spatially selective regional growth and low-income convergence
that slow down the catching-up of post-accession Central European (CE) countries are
attributed, inter alia, to the low absorptive capacity of lagging regions and capital-city centric
spatial structure.
Territorial cohesion, largely coterminous with the capacity to exploit the potentials of
territorial capital in all countries and regions of the EU is about helping places make the most
Egyed, I., Rácz, S.
111
of their territorial capital (Faludi & Peyroni, 2011). It is presented in 2007–13 OPs ‘as a
strategy to better exploit regional potentials and territorial capital by strengthening the
regions’ profiles making use of Europe’s territorial diversity’ (Nordregio, 2009: 92).
As argued by empirical studies positing a strong correlation between territorial capital and
territorial cohesion policy outcomes, structural funds are less likely to generate productivity
growth in areas poorly endowed in territorial capital. This trend is confirmed by the case of
Central and Eastern European regions which tend to invest more in basic infrastructure and
less in soft infrastructure (Fratesi & Perucca, 2014). Studies have equally demonstrated a
higher efficiency of investments in immaterial assets in regions more richly endowed in
territorial capital, while the quality of institutions is reported to have a major influence on
policy outcomes (OECD, 2011; Rodríguez-Pose & Garcilazo, 2015).
Place-based policies targeting the stimulation of territorial assets (ESPON, 2018: 3.)
highlight the determining role of context in the success of local development strategies. By
virtue of their role in reducing persistent inefficiency (below subsistence income) and
persistent social exclusion (number of people falling below a certain level of income and
well-being) in less developed areas (Barca, 2009: 4.) place-based policies add an important
spatial justice dimension to EU spatial policy (Davoudi et al. 2008). Emphasising context,
history, institutions and path dependence as explanatory factors conditioning local economic
development, spatially sensitive approaches help supersede the myopic focus of mainstream
economic theories on bigness and metropolitanisation as the ‘one-best-way’ for city success.
People-based or counter-regional policies informed by new economic geography or new
regionalism (e.g. 2003 Sapir Report, 2008 World Bank Report) designed without an explicit
consideration of space are impervious to the needs of ‘ordinary’ cities disadvantaged in terms
of the main drivers of postmodern urban change (high-level service functions, R&D,
relational capital).
Demonstrating the counter-productivity of area-based interventions focusing on lagging
areas (e.g. amenities-or regeneration-based strategies), NEG inspired policies promote an
unimpended concentration of capital and people in prosperous city regions in order to
maximise national aggregate growth. In contrast, the proponents of place-based policies argue
that maximising the contribution of second-and-third tier cities to national productivity
growth may produce superior outcomes than a selective focus on already successful core
agglomerations (Pugalis & Gray, 2016; Capello & Camagni, 2013; ESPON, 2014). Besides,
place-based policies have the potential to mitigate the distortive impacts of aspatial
Egyed, I., Rácz, S.
112
(macroeconomic and sectoral) policies on spatial development leading to a suboptimal
utilisation of territorial capital (Faragó, 2019).
Territorial capital is strongly emphasised in the polycentric vision of urban development
(see ESPON, 2018) subsumed under the non-territorialized objectives of Europe 2020 (EC
2011, §3), particularly in medium-sized cities designated as potential growth centres of
underdeveloped regions. Rejecting arguments in favor of promoting scale, size and density in
the largest agglomerations, Camagni et al. (2015) demonstrate the existence of agglomeration
externalities in second-tier cities generated by high-quality territorial capital assets, e.g.
superior tertiary functions or horizontal cooperation networks with other cities of similar
ranking.
The development trajectories of cities functioning as nodes of polycentric urban networks
are shaped by the quality and structure of their (complex) territorial capital and interactions of
their various components (Rechnitzer, 2016: Faragó, 2019). Post-crisis experiences of
European countries highlight the role of second-tier cities in national productivity growth and
the negative externalities associated with excessive capital-centricity. The contribution of
territories to national economic performance is hugely significant (Faragó, 2019). A county-
level analysis of the factors of economic growth in Hungary reveals that the main driver of
national productivity growth is not the capital city with the highest concentration of
postindustrial drivers of urban development (APS, R&D, highly qualified workers) but a
limited number of counties dominated by manufacturing FDI (Lengyel & Varga, 2018; Józsa,
2019). More recent place-based policies promoting regional economic upgrading and related
diversification through smart specialisation (Foray et al. 2009, 2017) converge with the
territorial capital approach in their emphasis on regional particularisms and self-sustaining
endogenous development dynamics underpinned by pre-existing regional economic structures
and expertises.
Territorial cohesion policy outcomes are fundamentally shaped by the quality of territorial
governance whose central role is to ensure the development of territorial capital in a non-
destructive way (ESPON, 2006; Medeiros, 2016). Territorial governance, represented in EU
policy discourse as a desirable alternative to the monolithic concept of state power,
contributes to the increasing autonomy and capacity of mobilisation of sub-national, regional-
local arenas in regional programming (Gualini, 2004). Subnational empowerment, i.e.
increasing the potential of city or regional power to compete with the existing state structure
(Schragger, 2016; Pasquier, 2015), is a fundamental pre-requisite to territorial capital
mobilisation conceived as a bottom-up process relying on local expertises and institutional
Egyed, I., Rácz, S.
113
capabilities. The EU’s Territorial Agenda defines territorial cohesion as an essentially
participative process, ‘involving the various actors and stakeholders of territorial development
at the political, administrative and technical level’, characterised ‘by the history, culture and
institutional arrangements in each Member State.’ (Territorial Agenda, 2007: 1). Subnational
diversity and self-organisation are key principles underpinning the notion of the EU as a
complex multi-level and polycentric polity.
Theoretical elucidation of the concept of territorial capital
In academic literature, the concept of territorial capital emerged in the field of territorial
economy (Lacquement & Chevalier, 2016). Camagni defines territorial capital as a system of
local, tangible and intangible, endogenous and exogenous assets, of public and private nature,
that constitute the development potential of an area and whose presence enhances the
efficiency of local production activities and place attractiveness (Camagni, 2008; Camagni &
Capello, 2013). The success of cities and regions is determined by their capacity to fully
exploit these assets. Camagni’s seminal contribution to the comprehensive taxonomy of
territorial capital factors (Camagni, 2008) has been widely adopted by studies examining the
valorisation of territorial capital in multiple contexts, generally adopting the definitions
proposed by the former (Fratesi & Perrucca, 2016, 2020), and more rarely subjecting those to
a critical scrutiny (Grünhut & Bodor, 2014). Faragó (2019) in his novel post-structuralist
approach to Camagni’s territorial capital taxonomy, instead of prioritising given capital types
over others, highlights the fluidity of local/territorial assemblages shaped by dynamically
evolving interrelations (coupling and decoupling) of various components of territorial capital.
In his view, the success of territorial capital mobilisation is conditioned not so much by the
quality of individual subcomponents of territorial capital but their local interrelations, the
efficiency of their network type functioning.
Camagni’s 3x3 matrix (Fig. 1.) contains a unique representation of traditional and
innovative forms of territorial capital valorisation, focusing on the properties and
interrelations of the various subcomponents. The matrix classifies local endogenous assets
according to their degree of materiality (tangible/intangible/mixed goods) and rivalry
(public/private/club/impure public goods). Elements of the traditional square (pure public and
private goods, social and human capital), constitute the subject of old regional policy
interventions, while the „innovative cross” representing an intermediate class of club goods
highlights the importance of relationality and innovative forms of governance (proprietory
networks, collective goods, relational capital, agglomeration economies, innovation networks,
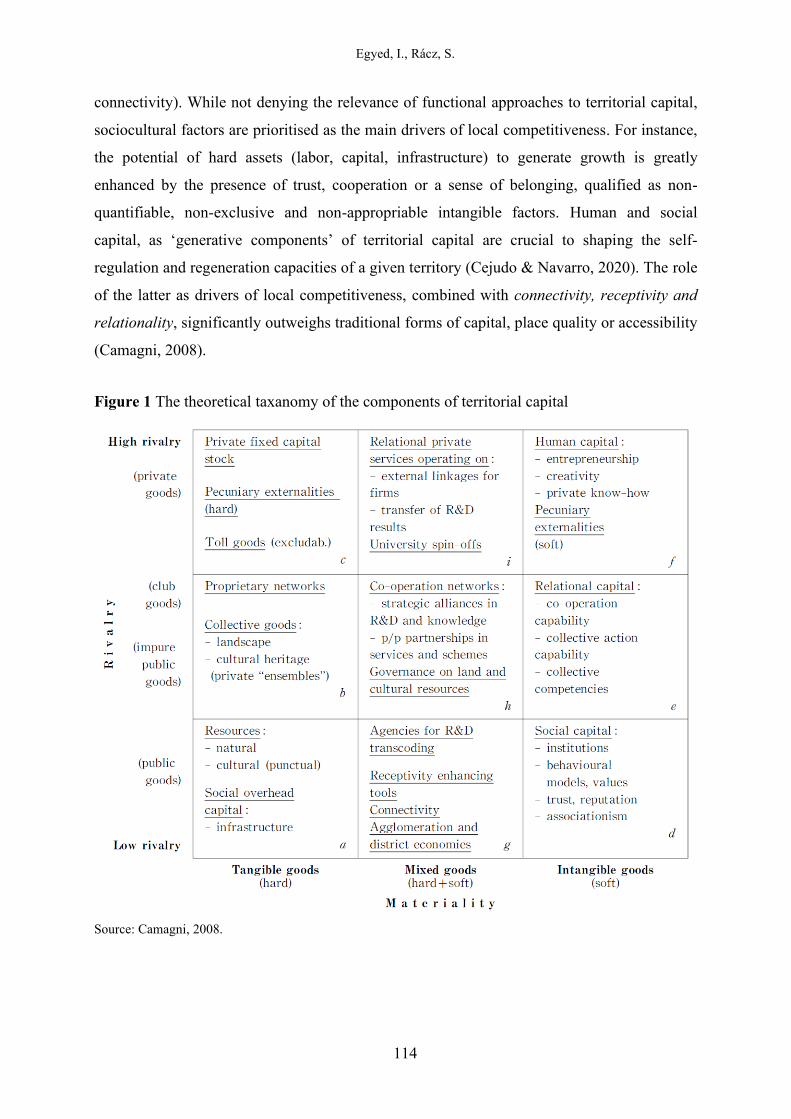
Egyed, I., Rácz, S.
114
connectivity). While not denying the relevance of functional approaches to territorial capital,
sociocultural factors are prioritised as the main drivers of local competitiveness. For instance,
the potential of hard assets (labor, capital, infrastructure) to generate growth is greatly
enhanced by the presence of trust, cooperation or a sense of belonging, qualified as non-
quantifiable, non-exclusive and non-appropriable intangible factors. Human and social
capital, as ‘generative components’ of territorial capital are crucial to shaping the self-
regulation and regeneration capacities of a given territory (Cejudo & Navarro, 2020). The role
of the latter as drivers of local competitiveness, combined with connectivity, receptivity and
relationality, significantly outweighs traditional forms of capital, place quality or accessibility
(Camagni, 2008).
Figure 1 The theoretical taxanomy of the components of territorial capital
Source: Camagni, 2008.
Egyed, I., Rácz, S.
115
Relational capital (Camagni, 1999) as a specific type of club good is identified with the
term ‘innovative milieu’ in the matrix. As the bridging component of social capital, it is an
indicator of cooperation propensity with local and external partners and the collective
competencies of actors. The introduction of the concept of innovative milieu by Italian
scholarship on territorial innovation models (Aydalot, 1986; Camagni, 1991; Camagni &
Capello, 2002) has long since highlighted the spatial embeddedness of collective learning
processes and the role of spatial and social proximity in generating relational capital.
Relationality is at the centre of Camagni’s definition of territory interpreted as a system of
localized externalities, a system of socio-economic relations and a system of local governance
(Camagni, 2006; Capello, 2007). The local milieu is described as an uncertainty reducing
device for firms, providing high quality human capital, access to information and various
operators enabling firms to assess, transcode information and forms of coordination and
cooperation (Camagni, 1999, 2013). The innovative performance of local production systems
is sustained by a continuous interaction between the milieu and the innovation networks
engendered during the process of the identification/mobilisation of resources acting as inputs
to innovation (Crevoisier, 2000). Territory is interpreted as a unique repository of potentials
and resources convertible into economically valorisable assets (knowledge, competences,
skills) through a process of specification (Lacquement & Chevalier, 2016; Pecqueur, 2005).
The role of mixed assets combining tangible and intangible goods (cooperation networks,
R&D transfer institutions, public agencies, etc.) is to contribute to the transformation of
locally existing assets into capital. Local governance structures, coordinating the collective
production of resources are viewed as factors of place attractiveness in themselves (Servillo et
al. 2012). The success of bottom-up and collaborative strategies of territorial capital
valorization is conditioned by local stakeholders’ propensity to coalesce around common
development projects and to formulate common value-based judgments on what they consider
worthy, appropriate and valuable resources conducive to local development (Faragó, 2019).
Informal (network-type) and formal institutions – reflecting a particular and context-sensitive
view of local development – play a quintessential role in the generation and mobilisation of
relational capital. With its sophisticated governance structures, the city as the supreme
resource among all resources (Lefebvre, 1968) or the milieu innovateur par excellence
(Camagni, 1991) structures economic agents’ relations along principles of competition and
emulation rather than reciprocity (as in smaller, more organised milieus). Cities as diverse and
heterodox knowledge-creating milieus are capable of continuous renewal and self-reinvention
by virtue of their superior relational capital relative to other settlement types.
Egyed, I., Rácz, S.
116
Central European contexts and limitations of territorial capital
As noted by Camagni (2008) the role of space as a source of local competitive advantages has
been amply demonstrated by new industrial geography (innovative milieu, neo-Marshallian
districts, technopolises, neo-institutionalism, post-Fordist flexible territorial production
systems, etc.). Territorial models of innovation attribute the stickiness of advanced economic
activities to the presence of soft locational factors (creative capital, entrepreneurial culture,
tacit knowledge, R&D resources) driving heterogenous regional economic performance. The
co-evolution between the firm and its territory instead of searching for cost-minimising
alternatives is conditioned by the presence of rare and valuable assets concentrated in highly
productive local milieus. The spatial anchoring of atmosphere-type, synergy-inducing soft
factors may counteract the hypermobility of global production factors (Camagni & Capello,
2015).
For FDI-incongruent localities, abandoning the mobility assumption of standard economic
theories has important policy implications. Instead of pursuing costly FDI-attraction strategies
(location subsidies, grants, enterprise zones, etc.), investments are encouraged in the
development of the business environment, focusing on institutional and relational components
of territorial capital. Since territorial capital as other physical capital assets is subject to
accumulation and depreciation processes through its repeated use in different production
cycles (Camagni, 2008), its conservation and renewal determines the sustained economic
health of places. The benefits of capital enhancement strategies, however, due to decreasing
returns to scale, are less obvious in prosperous places that are richly endowed in territorial
capital as pointed out by Camagni (2013). According to the quantitative analysis of Camagni
& Capello (2013), regional growth in European regions is driven by transport infrastructure
and creativity in the case of non ST-driven Eastern regions, while Western regions closer to
the technological frontier are more sensitive to an increase of entrepreneurship and
receptivity. In an analysis of Hungarian subregions, Jóna (2015) finds that the cultural
economy is a key determinant of territorial capital formation.
The territorial capital approach converges with endogenous growth theories in its
conceptualisation of cities and regions as quasi-individuals responsible for shaping their
economic fortunes and its focus on supply-side factors (Hadjimichalis & Hudson, 2014). In a
neoliberal discursive framing, territories competing with each other for production factors and
goods are ranked according to their position within the international division of labor.
Lagging regions with a shortage of disctinctive competitive advantages and a poor capacity to
Egyed, I., Rácz, S.
117
mobilise their economic growth potential are facing irreversible decline, and ultimately,
desertification. This can easily be demonstrated by the exclusion of peripheral CE regions
from international markets whose sole competitive advantages are cheap and unskilled labor
and basic infrastructure (Camagni, 2006; Lux, 2014).
Emphasising underemployed local potentials and place-specific impediments to growth,
municipal strategies targeting the enhancement of territorial capital are believed to obviate the
failures of one-best-way regional development policies. Space-blind subsidy-based
interventions dominating old regional policy created a culture of dependency and new
regional development traps instead of the anticipated effects of bringing jobs and investment
to peripheries (Rodríguez-Pose & Garcilazo, 2015). Exemplifying failed attempts to induce
state-led industrial decentralisation, the policy of growth poles based on the propulsive effects
of lead industries has attracted criticism for neglecting contextual (cultural, social, human,
historical) factors and its inability to reverse polarisation. Not seeking to propose universal
recipes for growth, place-based approaches encouraging the mobilisation of local
stakeholders, local knowledges, (strong, adaptable) institutions to ensure the valorisation of
indigeneous (natural and/or socially constructed and endogenous (internal) assets are expected
to produce more favorable spatial development outcomes in the long term. Despite their
constrained autonomy, local municipalities are encouraged to capitalise on their assets and
make corresponding long-term policy choices tailored to their needs and preferences. Cities
and regions are represented not merely as passive subjects of top-down interventions but
artisans of their own destinies, enabled, through a wise utilisation of their territorial capital, to
pursue their socio-economic goals more efficiently. Thus, disadvantaged non-core cities
(abandoned in their efforts to achieve economic restructuring in unsupportive national
contexts) should be able to lift themselves out of decline endogenously, fostering a sense of
self-determination in local communities. Such policy optimism concerning the role of local
capabilities while undermining the role of exogenous factors (e.g. general characteristics of
the national economy, the given settlement’s position in the national settlement network, etc.)
in driving place inequalities of territorial capital valorisation is common to endogenous
development theories (Hadjimichalis & Hudson, 2014).
Notwithstanding its contribution to the rich body of endogenous development literature
and high discursive currency in EU policy-making, problems of quantification and low
institutional awareness led to a poor visibility of territorial capital in territorial development
strategies and programmatic documents (Tóth, 2015; Amodio et al. 2019). Its translation into
national policy has been marginal, with a few notable exceptions in decentralized and
Egyed, I., Rácz, S.
118
polycentric contexts (e.g. Poland). The experience of advanced economies gives more credit
to place-based narratives of territorial capital valorisation in the presence of decentralized
institutional frameworks and devolved public finances (Pike et al. 2015). At less advanced
stages of development, exogenous elements appear to outweigh the role of endogenous factors
in regional growth (Capello‒Fratesi, 2013). Numerous obstacles stand in the way of
translating the theory of territorial capital into local development strategies in the CE context
(see Lacquement & Chevalier, 2016). Primarily, path dependent factors stemming from
belated urbanisation have played an incontestable role in the general absence of the key
ingredients of successful endogenous urban development paths, such as local self-
determination, city power, anti-interventionism, new governance styles, relationality and co-
operation. Economic and political peripherality (Rácz, 2019) explain the poor capacity of
municipalities in CE to design self-tailored development strategies and leverage external
capital for their investment projects. This points to significant disparities of territorial capital
mobilisation among resource-dependent municipalities in former command and control
economies and their Western counterparts operating under free market conditions. The
weakness of civic traditions, social capital, governance and institutional structures impedes
the emergence of horizontal development coalitions fundamental to local stakeholder
mobilisation and collaborative strategy making (Lux, 2014; Füzér, 2017).
The demand for spatial policies addressing the „rebalancing challenge” is particularly
evident in monocentric and centralized countries such as Hungary where the capital city
region produces 47% of the national GDP (for the sake of comparison, the relevant figures are
23.7% in the UK, and 30% in France, respectively). In CE capital cities and their regions
acted as (sometimes the only) hubs of economic growth (Hajdú et al. 2017). This makes
particularly salient the abandoning of public policy bias toward economically prosperous core
areas and the implementation of place-based policies assisting all regions to reach their
potential, given the spatial and sectoral selectivity of FDI inflows and the exacerbation of
regional inequalities it entails. Up to the 1970s, the objectives of diversionary regional
policies aiming to promote the development of second-tier cities through top-down industrial
decentralisation showed a certain degree of convergence on both sides of the Iron Curtain
(Hajdú, 2005). In fact, Faragó (2019) refers to voluntary socialist industrialisation in Hungary
as a ‘proto industrial growth pole strategy’, due to the similarity of objectives (strenghtening
secondary poles through planned industrial decentralisation) and results (regional
rebalancing).
Egyed, I., Rácz, S.
119
The post-1970 era marked by the dissolution of the Fordist Compromise and the demise of
the Keynesian Welfare State brought the ascendancy of endogenous growth theories, cultural
and regional autonomy movements and alternative forms of capital in the West, while the
centralising command-and-control economies left no room for maneouvre for municipalities
to experiment with locally-owned endogenous development strategies.
The post-1990 implementation of local governmental autonomy and formal (non-
substantive) decentralization left a fragmented and underresourced system of municipalities
increasingly dependent on central financing. The 2011 Local Government Act interpreted by
commentators as a quasi-loss of autonomy and deresponsibilisation of local governments
(Pálné et al. 2016) heralded a new era of centralization that prompted a return to the vertical
hierarchical approach to the exercise of state power. The distortive effects of political
favoritism and the centralised allocation of investments, aggravated by the residual role of
regional policy continue to shape city success or decline in more fundamental ways than
spatially heterogenous and status-dependent municipal capacities of territorial capital
mobilization (Simó et al. 2018). The notion of city or regional power is devoid of substance in
peripheral development contexts with a lack of meaningful alternatives to state power (Pálné
2019), which raises the question of the universal applicability of neoliberal-minded urban
development discourses and recipes.
RESULTS AND DISCUSSION – TERRITORIAL CAPITAL VALORISATION IN
THE CASE STUDY CITY OF PÉCS
Obstacles to territorial capital valorisation
The over 2000-year old city of Pécs situated in South-western Hungary is one of the five
regional centres that form the core of the Hungarian settlement network (Rechnitzer et al.
2014, Berkes 2016). Pécs is the regional capital of South Transdanubia, a region historically
dominated by agriculture, whose highly fragmented settlement network, low population
density, underdeveloped transport infrastructure, remoteness from manufacturing core areas,
weak endogenous industrial base and disadvantaged position in terms of postindustrial drivers
of urbanisation place it among the least urbanised and industrialised regions of Hungary (Rácz
et al. 2020). Mirroring national trends, the region belongs to the group of moderate innovators
and regional GDP per capita barely exceeds one-third of the EU average (Nick et al. 2019).
Egyed, I., Rácz, S.
120
Pécs as the fifth largest city in Hungary (KSH 2020) with its population of 141,843 (the
urban agglomeration has 177,753 inhabitants and 41 settlements) is not a large city according
to European standards but rather an advanced mid-sized with regional economic functions,
performing a historical role of a cultural, ecclesiastic and administrative centre to its wider
hinterland area. The city’s integration in the national and international division of labor is
hindered by its multidimensional peripherality partially explained by first nature determinants
of growth. Its regional organising role remained limited explained partially by the embryonic
stage of region-building efforts. As pointed out by Hajdú (2006), top-down imposed regional
institutions (RDAs) were too weak to become the drivers of regional integration in South
Transdanubia, and uncoordinated, sporadic developments hindered the realisation of regional-
scale developments.
The post-industrial transition of the urban economy was marked by the erosion of the
traditional manufacturing base and successive waves of capital flight (e.g. Elcoteq in 2011),
triggering a loss of ‘regional particularisms’ (e.g. coal, uranium mining) on which to base its
competitive advantages. Under socialist industrialisation, exogenously driven ‘low road
strategies’ to local development based on the exploitation of generic assets (cheap labor and
natural resources) provided favorable conditions for the development of labor intensive
sectors such as coal mining, electricity and gas production. Urban economic upgrading to a
‘high road strategy’ appears to be a daunting task in the absence of strong multi-level
governance and durable competitive advantages. The latter are conditioned by the availability
of a ‘place surplus’ increasingly sought by firms, i.e. those unique, rare and non-transferable
assets (relational capital, R&D, high skill labor, engineering schools, local industrial traditions
and know-how) that may decourage delocalisation strategies. Major disruptions in the
industrial base triggered by exogenous factors – top-down public policy decisions and extra-
regional corporate strategies of multinational enterprises (MNEs) –, a shortage of engineering
competences and qualified labor force induced by the massive outmigration of the young age
population – common to peripheral regions lacking postmodern drivers of urbanisation – are
expected to erode the prospects of a high skills and high value added path (Faragó, 2012; Lux,
2020). This, in turn, exposes the local economy to a permanent risk of capital flight and
increases its reliance on a small number of strategic sectors (health, culture, environment).
Negative external perceptions of Pécs as a “city-in-decline”, an “industrial periphery” or a
“shrinking city” have been fed by high level of municipal indebtedness, a lack of business
opportunities and the unfavorable demographic composition of the South Transdanubia
region. This is well reflected by the declining rate of industrial employment of Baranya
Egyed, I., Rácz, S.
121
County peaking at 53.3% in the 1970s and dropping to 20% by 2018. The unemployment rate
in Baranya (9.4%) is steadily rising and exceeds the national average of 3.5% (EC, 2020).
The Chamber of Commerce and Industry of Pécs and Baranya ‒ as a key local economic
development stakeholder and an outstandingly active institution in national comparison ‒
plays an important albeit contested role in the reproduction of social and relational capital
(Lux, 2020). Despite their weaker territorial embeddedness and influence on economic
development processes relative to their Western counterparts, Hungarian chambers provide
important (pecuniary and non-pecuniary) support to local businesses operating under their
jurisdiction. In addition, they act as catalysts of the development of local business networks
and the emergence of territorial or sectoral clusters connecting local small and medium sized
enterprises and large firms or ISEs looking for regional subcontractors (Póla 2020). The
emergence of clusters, however, is hindered by the low level of trust characterizing Hungarian
society and the business sector. In Baranya County, local business operating outside the
relatively advanced machine and construction industrial clusters are characterized by weak
horizontal co-operative linkages.
Employment figures highlight the crucial dependence of the local economy on the public
sector: the Municipality of Pécs in itself employs 2250 people. The three major municipally-
owned service provider companies (urban management, waterworks, district heating) employ
an additional 1000 persons. The University of Pécs is the main employer in Baranya county
with a total of 6700 employees. A number of state deconcentrated organs (tax authority, state
treasury, etc.) provide administrative, legal and business employment opportunities for people
with intermediate and higher educational qualifications. The unsustainable financial operation
of the local council renders public sector-driven employment creation illusory in the near
future.
Exogenous-driven local development paths in the City of Pécs
Under the joint influence of the cognitive turn of the economy and the rise of EU project-
based urban development strategies in the post-2000 era (see Füzér, 2017), soft and intangible
factors (quality of life, business environment, social capital, human capital) came to dominate
the city’s efforts to achieve economic restructuring and overcome peripherality. The
insufficiency of hard infrastructural investments – e.g. motorway connection (Fig. 2.) and
industrial estates (South Industrial Park, Pécs Industrial Park, Pannova) – to incentivize FDI
was demonstrated by the city’s poor connection to the international economic circuit.
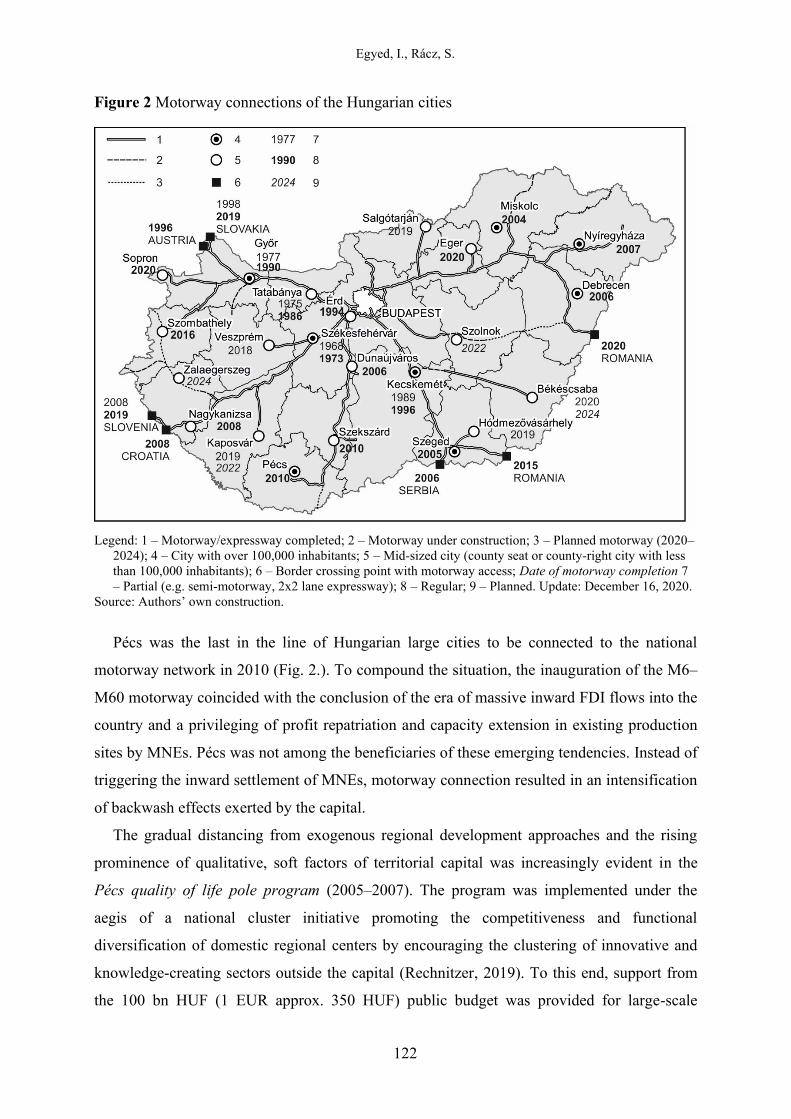
Egyed, I., Rácz, S.
122
Figure 2 Motorway connections of the Hungarian cities
Legend: 1 – Motorway/expressway completed; 2 – Motorway under construction; 3 – Planned motorway (2020–
2024); 4 – City with over 100,000 inhabitants; 5 – Mid-sized city (county seat or county-right city with less
than 100,000 inhabitants); 6 – Border crossing point with motorway access; Date of motorway completion 7
– Partial (e.g. semi-motorway, 2x2 lane expressway); 8 – Regular; 9 – Planned. Update: December 16, 2020.
Source: Authors’ own construction.
Pécs was the last in the line of Hungarian large cities to be connected to the national
motorway network in 2010 (Fig. 2.). To compound the situation, the inauguration of the M6–
M60 motorway coincided with the conclusion of the era of massive inward FDI flows into the
country and a privileging of profit repatriation and capacity extension in existing production
sites by MNEs. Pécs was not among the beneficiaries of these emerging tendencies. Instead of
triggering the inward settlement of MNEs, motorway connection resulted in an intensification
of backwash effects exerted by the capital.
The gradual distancing from exogenous regional development approaches and the rising
prominence of qualitative, soft factors of territorial capital was increasingly evident in the
Pécs quality of life pole program (2005–2007). The program was implemented under the
aegis of a national cluster initiative promoting the competitiveness and functional
diversification of domestic regional centers by encouraging the clustering of innovative and
knowledge-creating sectors outside the capital (Rechnitzer, 2019). To this end, support from
the 100 bn HUF (1 EUR approx. 350 HUF) public budget was provided for large-scale
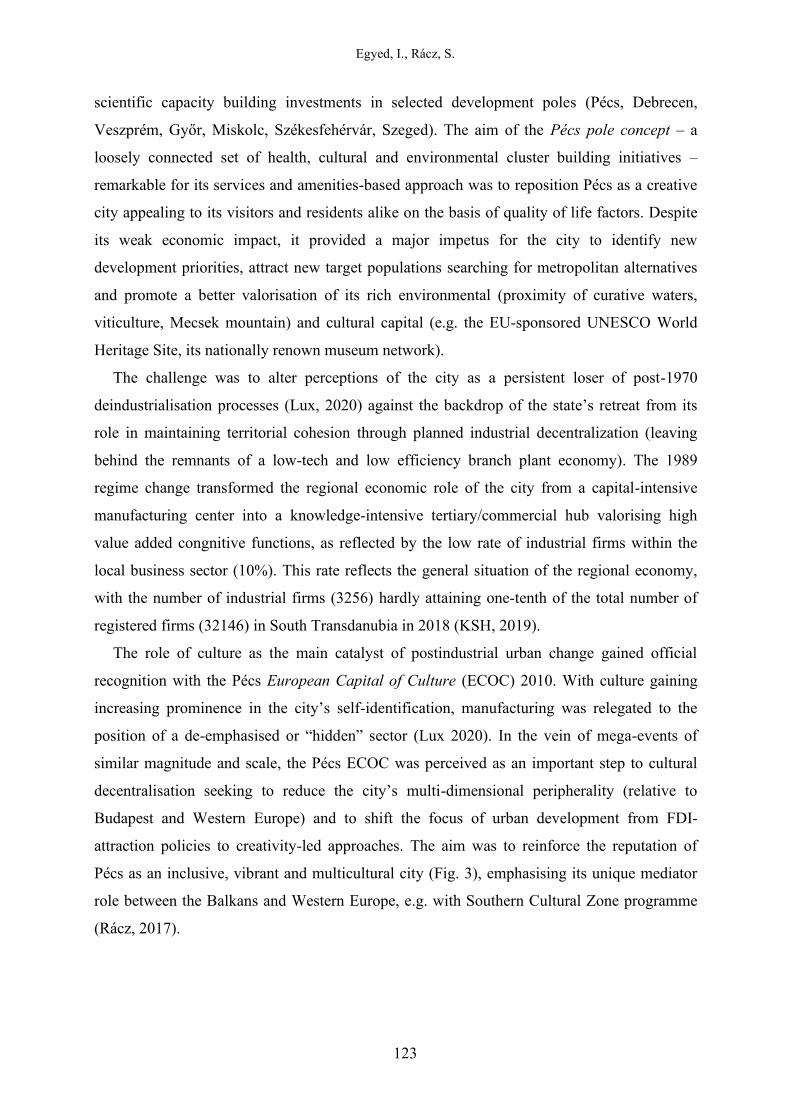
Egyed, I., Rácz, S.
123
scientific capacity building investments in selected development poles (Pécs, Debrecen,
Veszprém, Győr, Miskolc, Székesfehérvár, Szeged). The aim of the Pécs pole concept – a
loosely connected set of health, cultural and environmental cluster building initiatives –
remarkable for its services and amenities-based approach was to reposition Pécs as a creative
city appealing to its visitors and residents alike on the basis of quality of life factors. Despite
its weak economic impact, it provided a major impetus for the city to identify new
development priorities, attract new target populations searching for metropolitan alternatives
and promote a better valorisation of its rich environmental (proximity of curative waters,
viticulture, Mecsek mountain) and cultural capital (e.g. the EU-sponsored UNESCO World
Heritage Site, its nationally renown museum network).
The challenge was to alter perceptions of the city as a persistent loser of post-1970
deindustrialisation processes (Lux, 2020) against the backdrop of the state’s retreat from its
role in maintaining territorial cohesion through planned industrial decentralization (leaving
behind the remnants of a low-tech and low efficiency branch plant economy). The 1989
regime change transformed the regional economic role of the city from a capital-intensive
manufacturing center into a knowledge-intensive tertiary/commercial hub valorising high
value added congnitive functions, as reflected by the low rate of industrial firms within the
local business sector (10%). This rate reflects the general situation of the regional economy,
with the number of industrial firms (3256) hardly attaining one-tenth of the total number of
registered firms (32146) in South Transdanubia in 2018 (KSH, 2019).
The role of culture as the main catalyst of postindustrial urban change gained official
recognition with the Pécs European Capital of Culture (ECOC) 2010. With culture gaining
increasing prominence in the city’s self-identification, manufacturing was relegated to the
position of a de-emphasised or “hidden” sector (Lux 2020). In the vein of mega-events of
similar magnitude and scale, the Pécs ECOC was perceived as an important step to cultural
decentralisation seeking to reduce the city’s multi-dimensional peripherality (relative to
Budapest and Western Europe) and to shift the focus of urban development from FDI-
attraction policies to creativity-led approaches. The aim was to reinforce the reputation of
Pécs as an inclusive, vibrant and multicultural city (Fig. 3), emphasising its unique mediator
role between the Balkans and Western Europe, e.g. with Southern Cultural Zone programme
(Rácz, 2017).
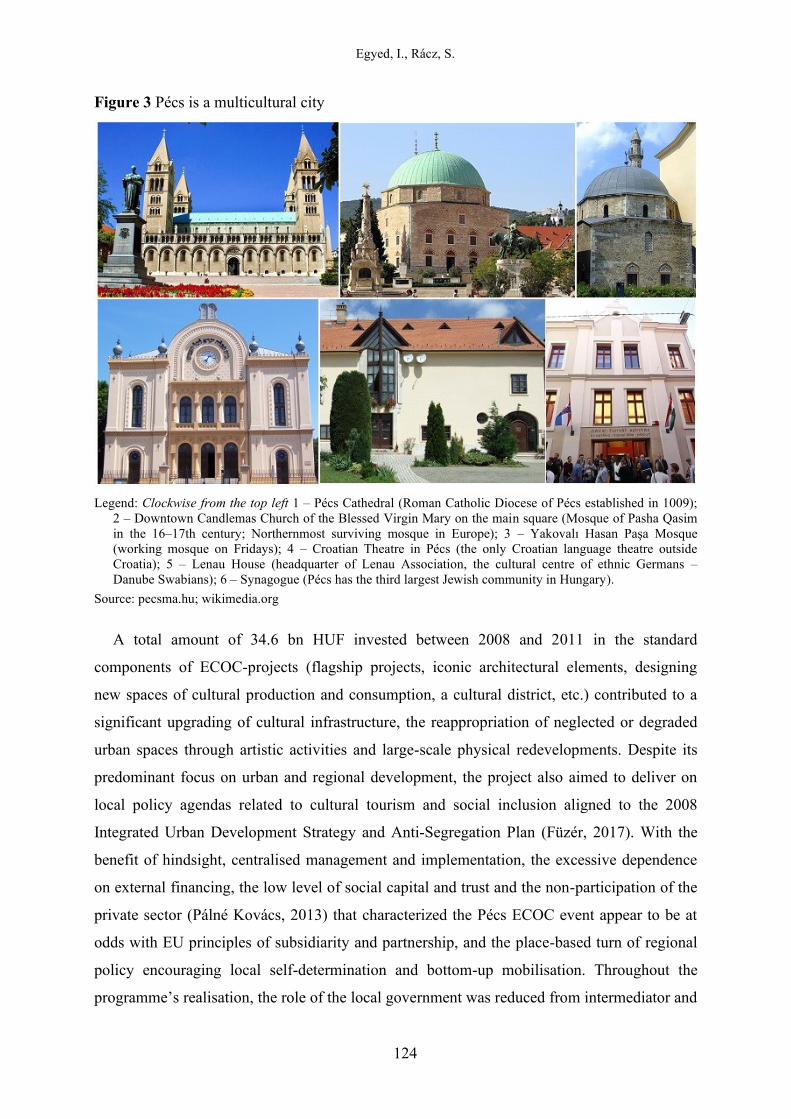
Egyed, I., Rácz, S.
124
Figure 3 Pécs is a multicultural city
Legend: Clockwise from the top left 1 – Pécs Cathedral (Roman Catholic Diocese of Pécs established in 1009);
2 – Downtown Candlemas Church of the Blessed Virgin Mary on the main square (Mosque of Pasha Qasim
in the 16–17th century; Northernmost surviving mosque in Europe); 3 – Yakovalı Hasan Paşa Mosque
(working mosque on Fridays); 4 – Croatian Theatre in Pécs (the only Croatian language theatre outside
Croatia); 5 – Lenau House (headquarter of Lenau Association, the cultural centre of ethnic Germans –
Danube Swabians); 6 – Synagogue (Pécs has the third largest Jewish community in Hungary).
Source: pecsma.hu; wikimedia.org
A total amount of 34.6 bn HUF invested between 2008 and 2011 in the standard
components of ECOC-projects (flagship projects, iconic architectural elements, designing
new spaces of cultural production and consumption, a cultural district, etc.) contributed to a
significant upgrading of cultural infrastructure, the reappropriation of neglected or degraded
urban spaces through artistic activities and large-scale physical redevelopments. Despite its
predominant focus on urban and regional development, the project also aimed to deliver on
local policy agendas related to cultural tourism and social inclusion aligned to the 2008
Integrated Urban Development Strategy and Anti-Segregation Plan (Füzér, 2017). With the
benefit of hindsight, centralised management and implementation, the excessive dependence
on external financing, the low level of social capital and trust and the non-participation of the
private sector (Pálné Kovács, 2013) that characterized the Pécs ECOC event appear to be at
odds with EU principles of subsidiarity and partnership, and the place-based turn of regional
policy encouraging local self-determination and bottom-up mobilisation. Throughout the
programme’s realisation, the role of the local government was reduced from intermediator and
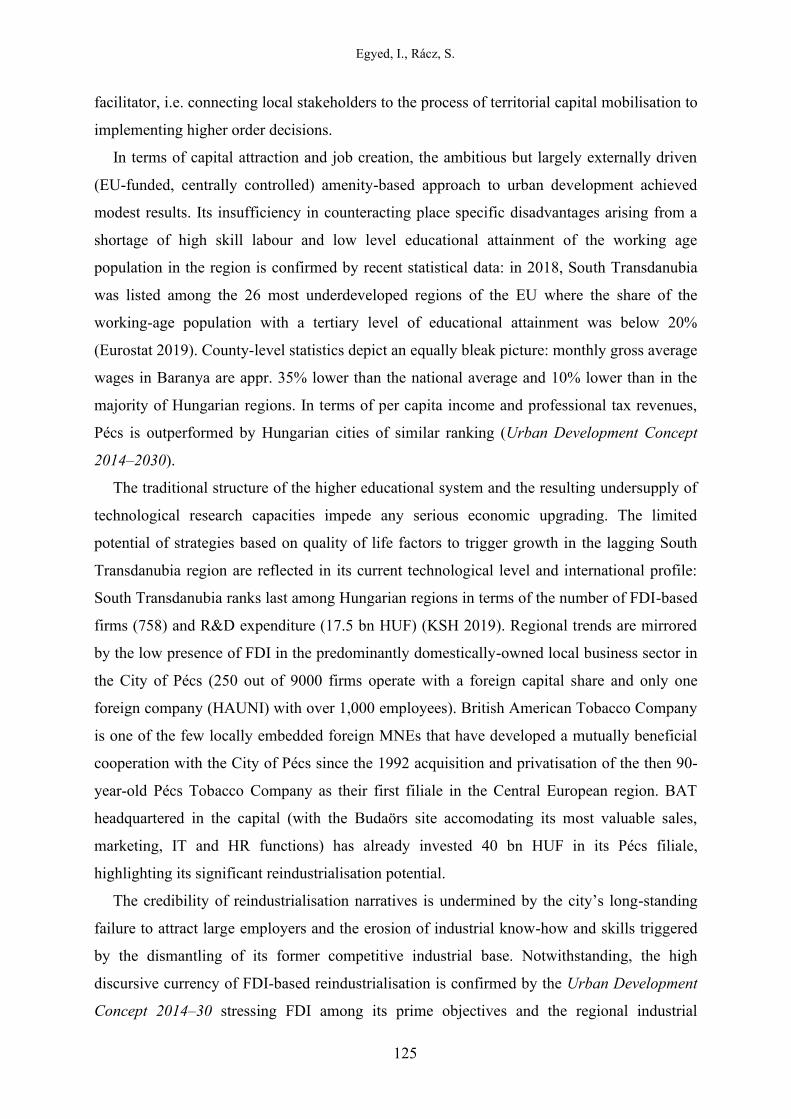
Egyed, I., Rácz, S.
125
facilitator, i.e. connecting local stakeholders to the process of territorial capital mobilisation to
implementing higher order decisions.
In terms of capital attraction and job creation, the ambitious but largely externally driven
(EU-funded, centrally controlled) amenity-based approach to urban development achieved
modest results. Its insufficiency in counteracting place specific disadvantages arising from a
shortage of high skill labour and low level educational attainment of the working age
population in the region is confirmed by recent statistical data: in 2018, South Transdanubia
was listed among the 26 most underdeveloped regions of the EU where the share of the
working-age population with a tertiary level of educational attainment was below 20%
(Eurostat 2019). County-level statistics depict an equally bleak picture: monthly gross average
wages in Baranya are appr. 35% lower than the national average and 10% lower than in the
majority of Hungarian regions. In terms of per capita income and professional tax revenues,
Pécs is outperformed by Hungarian cities of similar ranking (Urban Development Concept
2014–2030).
The traditional structure of the higher educational system and the resulting undersupply of
technological research capacities impede any serious economic upgrading. The limited
potential of strategies based on quality of life factors to trigger growth in the lagging South
Transdanubia region are reflected in its current technological level and international profile:
South Transdanubia ranks last among Hungarian regions in terms of the number of FDI-based
firms (758) and R&D expenditure (17.5 bn HUF) (KSH 2019). Regional trends are mirrored
by the low presence of FDI in the predominantly domestically-owned local business sector in
the City of Pécs (250 out of 9000 firms operate with a foreign capital share and only one
foreign company (HAUNI) with over 1,000 employees). British American Tobacco Company
is one of the few locally embedded foreign MNEs that have developed a mutually beneficial
cooperation with the City of Pécs since the 1992 acquisition and privatisation of the then 90-
year-old Pécs Tobacco Company as their first filiale in the Central European region. BAT
headquartered in the capital (with the Budaörs site accomodating its most valuable sales,
marketing, IT and HR functions) has already invested 40 bn HUF in its Pécs filiale,
highlighting its significant reindustrialisation potential.
The credibility of reindustrialisation narratives is undermined by the city’s long-standing
failure to attract large employers and the erosion of industrial know-how and skills triggered
by the dismantling of its former competitive industrial base. Notwithstanding, the high
discursive currency of FDI-based reindustrialisation is confirmed by the Urban Development
Concept 2014–30 stressing FDI among its prime objectives and the regional industrial
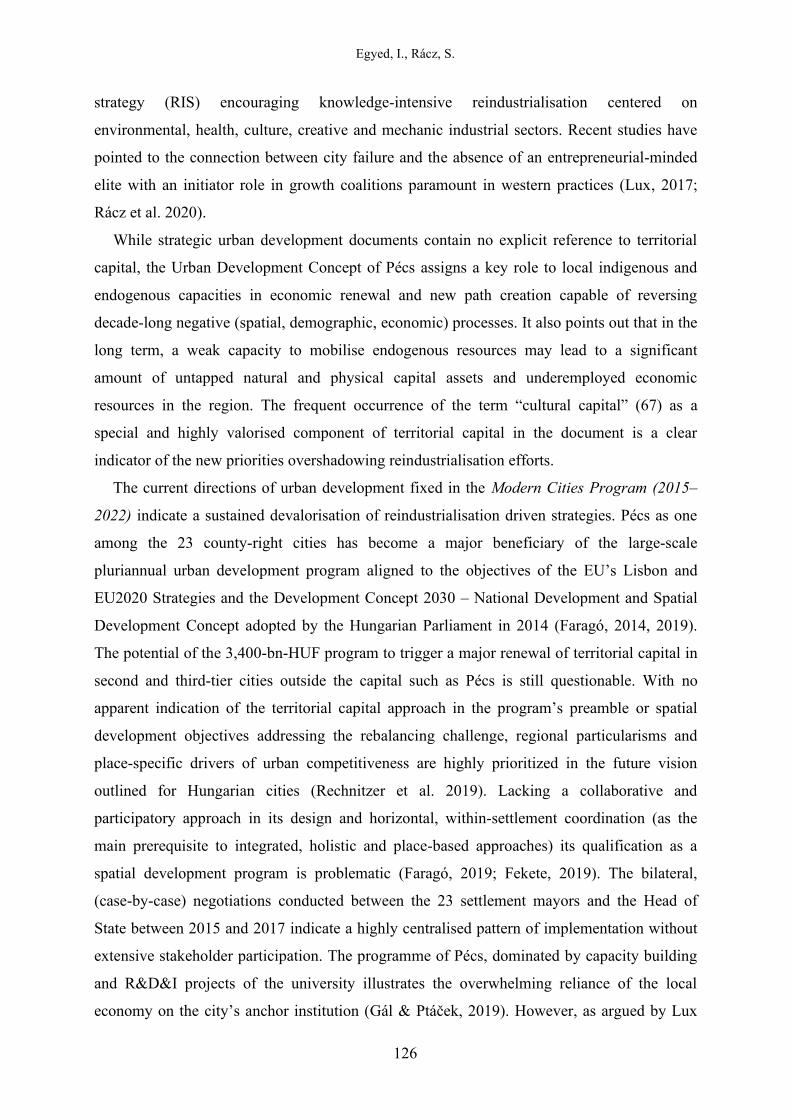
Egyed, I., Rácz, S.
126
strategy (RIS) encouraging knowledge-intensive reindustrialisation centered on
environmental, health, culture, creative and mechanic industrial sectors. Recent studies have
pointed to the connection between city failure and the absence of an entrepreneurial-minded
elite with an initiator role in growth coalitions paramount in western practices (Lux, 2017;
Rácz et al. 2020).
While strategic urban development documents contain no explicit reference to territorial
capital, the Urban Development Concept of Pécs assigns a key role to local indigenous and
endogenous capacities in economic renewal and new path creation capable of reversing
decade-long negative (spatial, demographic, economic) processes. It also points out that in the
long term, a weak capacity to mobilise endogenous resources may lead to a significant
amount of untapped natural and physical capital assets and underemployed economic
resources in the region. The frequent occurrence of the term “cultural capital” (67) as a
special and highly valorised component of territorial capital in the document is a clear
indicator of the new priorities overshadowing reindustrialisation efforts.
The current directions of urban development fixed in the Modern Cities Program (2015–
2022) indicate a sustained devalorisation of reindustrialisation driven strategies. Pécs as one
among the 23 county-right cities has become a major beneficiary of the large-scale
pluriannual urban development program aligned to the objectives of the EU’s Lisbon and
EU2020 Strategies and the Development Concept 2030 – National Development and Spatial
Development Concept adopted by the Hungarian Parliament in 2014 (Faragó, 2014, 2019).
The potential of the 3,400-bn-HUF program to trigger a major renewal of territorial capital in
second and third-tier cities outside the capital such as Pécs is still questionable. With no
apparent indication of the territorial capital approach in the program’s preamble or spatial
development objectives addressing the rebalancing challenge, regional particularisms and
place-specific drivers of urban competitiveness are highly prioritized in the future vision
outlined for Hungarian cities (Rechnitzer et al. 2019). Lacking a collaborative and
participatory approach in its design and horizontal, within-settlement coordination (as the
main prerequisite to integrated, holistic and place-based approaches) its qualification as a
spatial development program is problematic (Faragó, 2019; Fekete, 2019). The bilateral,
(case-by-case) negotiations conducted between the 23 settlement mayors and the Head of
State between 2015 and 2017 indicate a highly centralised pattern of implementation without
extensive stakeholder participation. The programme of Pécs, dominated by capacity building
and R&D&I projects of the university illustrates the overwhelming reliance of the local
economy on the city’s anchor institution (Gál & Ptáček, 2019). However, as argued by Lux
Egyed, I., Rácz, S.
127
(2019), spectacular university-driven developments cannot substitute the role of innovation-
driven reindustrialisation in industrial peripheries such as the lagging South Transdanubian
region.
The University of Pécs, with its 20,000 students (of which 4,500 are foreign students), 10
faculties, 1,700 researchers and educators and appr. 6,700 employees is the main employer
and R&D stakeholder in the region. Its role in building relational capital relies on its historical
linkages with the Municipality of Pécs. As of 2020, the Medical Faculty’s prestigious
Szentágothai Research Center benefits from the presence of two national laboratories
established within the framework of a large-scale national initiative targeting the
commercialization of scientific results. The collective expenditure of the university and its
student population is estimated to attain one-fifth of the locally produced GDP (Rácz et al.
2020). The large and steadily increasing number of foreign students studying on its premises –
predominantly engaged in fee-paying health and medicine training programmes – generate
important housing and consumption demand. For the most part, however, foreign students do
not become integrated into local society or choose Pécs as their permanent residence.
CONCLUSION
Territorial capital, as a useful analytic tool facilitating a nuanced assessment of the
determinants of territorial competitiveness and a better understanding of spatially
heterogenous local and regional development trajectories, has been been widely adopted and
analysed in academic literature. The first part of the paper analysed the emergence of
territorial capital in cohesion policy narratives and undertook the theoretical elucidation of the
concept of territorial capital. This was followed by an examination of Central European
contexts of territorial capital. Territorial capital has a particular salience in non-core or
peripheral contexts with limited opportunities for FDI-driven economic restructuring. Besides
providing a more nuanced view of the determinants of city success, the territorial capital
approach contributes to deconstructing narratives of decline and monocausality in regard to
left-behind or stigmatized places. By allowing cities to capitalise on their disadvantages, it
may break the vicious cycle of self-reinforcing processes of decline feeding from negative
perceptions. This is demonstrated by the authors in their case study on Pécs, a post European
Capital of Culture city in search of new development paths.
The case study of Pécs (regional centre of South Transdanubia) provides a summary of the
most influential nodal points and factors shaping its development path. The study is followed
Egyed, I., Rácz, S.
128
by a reflection on the current obstacles of territorial capital valorisation. The main points of
the case study are as follows. Pécs, a city with a two-millennia-long history has historically
inherited and mutually enforcing central (ecclesiastical, cultural, commercial, administrative)
functions cementing its role as a regional centre. Culture, broadly speaking, has always been a
major driving force behind its development, engendering a plethora of ground-breaking ideas
and innovations. The role of industry has become a major structuring (shaping, developing,
crisis generating, and lately vanishing) force over the past one-and-a-half decades. Post-1990
change, the city has managed to survive the collapse of mining and heavy industry thanks to
spontaneous tertiarization and the dominant role of the public sector. Two factors act as
barriers to the regeneration of the city. Firstly, the multi-layered external environment (global
processes, general forces structuring space, state-led development policy). Secondly, the
specific internal context manifest in long-standing dependency relations, the responsibility of
the local elite and the weakness of the institutional environment. A university-focused
survival strategy may complement the fragmented (in Hungarian comparison)
reindustrialisation efforts. This reveals the contours of a slow and endogenous development
and transformation process integrating a mix of tangible and non-material components of
territorial capital, one that the city has already embarked on.
ACKNOWLEDGEMENT
Research of Ildikó Egyed and Szilárd Rácz supported by the János Bolyai Scholarship of the Hungarian
Academy of Sciences.
REFERENCES
Amodio, T., Bencardino, M., Iovino, G. & Siniscalchi, S. (2019). Emerging Topics in Italy:
The Territorial Capital Value. Bollettino della Società Geographica Italiana, 14(2)
Special Issue: 75–89. https://doi.org/10.13128/bsgi.v2i3.718
Aydalot, P. (Ed.) (1986). Milieux innovateurs en Europe, Paris: GREMI, C3E.
Barca, F. (2009). An Agenda for A Reformed Cohesion Policy: A Place Based Approach to
Meeting European Union Challenges and Expectations, Independent Report, Prepared at
Request of the European Commissioner for Regional Policy, Danuta Hübner, European
Commission, Brussels.
Berkes, J. (2016). I Like Living Here. Social Stratas Attachment to the Hungarian Big Cities.
Deturope, 8(2), 8–22.
Camagni, R. (1991). Local ‘Milieu’, Uncertainty and Innovation Networks: Towards a New
Dynamic Theory of Economic Space. In: Camagni, R. (Ed.), Innovation Networks:
Spatial Perspectives (pp. 121–144). London: Belhaven.
Camagni, R. (1999). The city as a milieu: applying GREMI's approach to urban evolution,
Revue d'Economie Régionale et Urbaine, 3, 591–606.
Egyed, I., Rácz, S.
129
Camagni, R. (2006). Compétitivité territoriale: la recherche d’avantages absolus. Reflets et
Perspectives de la Vie Economique, 1, 95–115.
Camagni, R. (2008). Regional competitiveness: towards a concept of territorial capital. In
Capello, R., Camagni, R., Fratesi, U., & Chizzolini, B. (Eds.): Modelling regional
scenarios for the enlarged Europe (pp. 33–48). Berlin: Springer.
Camagni, R. (2013). Regional competitiveness and territorial capital: a conceptual approach
and empirical evidence from European Union. Regional Studies 47(9), 1383–1402.
https://doi.org/10.1080/00343404.2012.681640
Camagni, R., & Capello, R. (2002). Milieux Innovateurs and Collective Learning: From
Concepts to Measurement. In: Acs, J. Z., de Groot, H. L. F., & Nijkamp, P. (Eds.): The
Emergence of the Knowledge Economy (pp. 15–46). Berlin: Springer.
Camagni, R., & Capello, R. (2013). Regional Innovation Patterns and the EU Regional Policy
Reform: Toward Smart Innovation Policies. Growth and Change, Wiley Blackwell,
44(2), 355–389.
Camagni, R., & Capello, R. (2015). Rationale and design of EU cohesion policies in a period
of crisis. Regional Science Policy & Practice, 7(1), 25–47.
https://doi.org/10.1111/rsp3.12047
Camagni, R., Capello, R., & Caragliu, A. (2015). The Rise of Second-Rank Cities: What Role
for Agglomeration Economies? European Planning Studies, 23(6), 1069–1089.
https://doi.org/10.1080/09654313.2014.904999
Capello, R. (2007). Regional economics. Routledge, New York.
Capello, R., Fratesi, U. (2013). Globalization and Endogenous Regional Growth. In Crescenzi
R., Percoco M. (Eds.), Geography, Institutions and Regional Economic Performance.
Advances in Spatial Science (The Regional Science Series). Berlin, Heidelberg:
Springer. https://doi.org/10.1007/978-3-642-33395-8
Cejudo, E., & Navarro, F. (Eds.) (2020). Neoendogenous Development in European Rural
Areas. Springer Geography. Springer, Cham. https://doi.org/10.1007/978-3-030-33463-
5_14
Crevoisier, O. (2000). Les milieux innovateurs et la ville. In Crevoisier, O., Camagni, R.
(Eds.) Les milieux urbains: innovation, systèmes de production et ancrage (GREMI,
EDES). Neuchâtel, EDES.
Davoudi, S., Evans, N., Governa, F., & Santangelo, M. (2008). Territorial Governance in the
Making. Approaches, Methodologies, Practices, Boletín de la A.G.E, 46, 32–52.
EC (2005). The Territorial State and Perspectives of the European Union, Towards a Stronger
European Territorial Cohesion in Light of the Lisbon and Gothenburg Ambitions. A
background document for the Territorial Agenda of the European Union. May 2005,
European Commission, Luxembourg.
EC (2011). Territorial Agenda of the European Union 2020. Towards an Inclusive, Smart and
Sustainable Europe of Diverse Regions.
EC (2020). Labor market information – Hungary.
(https://ec.europa.eu/eures/main.jsp?acro=lmi&lang=en&parentId=0&countryId=HU.
(Downloaded: Novemver 18, 2020)
ESPON (2006). Territory matters for competitiveness and cohesion. Facets of regional
diversity and potentials in Europe. ESPON Synthesis Report III, results by autumn
2006, Luxembourg.
ESPON (2014). ET2050 Territorial Scenarios and Visions for Europe. Final Report, ESPON
Coordination Unit, Luxembourg.
ESPON (2018). The territorial dimension of future policies, ESPON EGTC working paper.
Eurostat (2019). Eurostat regional yearbook 2019.
Egyed, I., Rácz, S.
130
Faludi, A. & Peyrony, J. (2011). Cohesion Policy Contributing to Territorial Cohesion –
Future Scenarios, European Journal of Spatial Development, 43.
Faludi, A. (2006). From European spatial development to territorial cohesion policy, Regional
Studies, 40:6, 667–678. https://doi.org/10.1080/00343400600868937
Faragó, L. (2012). Urban regeneration in a “city of culture” the case of Pécs, Hungary.
European Spatial Research and Policy, 19(2) 103–120. https://doi.org/10.2478/v10105-
012-0017-4
Faragó, L. (2014). Growth poles/centres in development policy. In: Somlyódyné Pfeil, E.
(Ed.), Industrial Districts and Cities in Central Europe (pp. 13–26). Győr: Universitas-
Győr Nonprofit Ltd.
Faragó, L. (2019). A Modern városok program mint fejlesztéspolitikai rezsim helye a magyar
területfejlesztési politikában. Tér–Gazdaság–Ember, 2–3(7), 181–203.
Fekete, D. (2019). A Modern városok program jelentősége a hazai városfejlődésben, Tér és
Társadalom, 33(1), 27–43. https://doi.org/10.17649/TET.33.1.3066.
Fratesi, U., & Perucca, G. (2014). Territorial capital and the effectiveness of cohesion
policies: An assessment for CEE regions. Investigaciones Regionales, 29, 165–191.
Fratesi, U., & Perucca, G. (2016). Territorial capital and EU Cohesion Policy. EU Cohesion
Policy. In J. Bachtler, P. Berkowitz, S. Hardy, & T. Muravska, (Eds.), EU cohesion
policy: Reassessing performance and direction. Taylor & Francis.
Fratesi, U., & Perucca, G. (2020). EU Regional Policy Effectiveness and the Role of
Territorial Capital. In Della Torre S., Cattaneo S., Lenzi C., & Zanelli A. (Eds.):
Regeneration of the Built Environment from a Circular Economy Perspective. Research
for Development. Springer, Cham. https://doi.org/10.1007/978-3-030-33256-3_4
Füzér K. (2017). A projektesített város. Részvételi városfejleszté az ezredfordulós Pécsett.,
Pécs: Publikon Kiadó.
Gál, Z., & Ptáček, P. (2019). The role of mid-range universities in kowledge transfer and
regional development: the case of five central European regions. In Erdős, K., & Varga,
A. (Eds.), Handbook of Universities and Regional Development (pp. 279–300).
Cheltenham: Edward Elgar Publishing.
Garcilazo, E., Martins, J. & Tompson, W. (2015). The Modern Regional Policy Paradigm:
Rationale and Evidence from OECD Countries. Geography and Spatial Planning
Journal, 7 (June), 9–44. https://doi.org/10.17127/got/2015.7.001
Gualini, E. (2004). Integration, Diversity, Plurality: Territorial Governance and the
Reconstruction of Legitimacy in a European ‘Postnational’ State. Geopolitics, 9(3),
542–563. https://doi.org/10.1080/14650040490478639
Hadjimichalis, C., & Hudson, R. (2014). Contemporary Crisis Across Europe and the Crisis
of Regional Development Theories, Regional Studies, 48(1), 208–218.
https://doi.org/10.1080/00343404.2013.834044
Hajdú, Z. (2005). Hungary's changing geopolitical situation during the transitional period. In
Barta, Gy., G. Fekete, É., Kukorelli Szörényiné, I., & Timár, J. (eds.): Hungarian
spaces and places: patterns of transition (pp. 28–149). Pécs: Centre for Regional
Studies. http://hdl.handle.net/11155/1048
Hajdú, Z. (Ed.) (2006). A Kárpát-medence régiói 3. Dél-Dunántúl. Pécs–Budapes: Dialóg
Campus.
Hajdú, Z., Horeczki, R., & Rácz, Sz. (2017). Changing settlement networks in Central and
Eastern Europe with special regard to urban networks. In Lux, G., & Horváth, Gy
(Eds.), The Routledge Handbook to Regional Development in Central and Eastern
Europe (pp. 123–140). London–New York: Routledge. .
https://doi.org/10.4324/9781315586137
Egyed, I., Rácz, S.
131
Jóna, Gy. (2015). Determinants of the Hungarian sub-regions’ territorial capital, European
Spatial Research and Policy, 22(1), 101–119. https://doi.org/10.1515/esrp-2015-0019
Józsa, V. (2019). A helyi beágyazódás útjai Magyarországon. Budapest: Dialóg Campus.
KSH (2019). Területi Statisztikai Évkönyv 2018.
KSH (2020). Summary tables (STADAT database) Time series of annual, regional statistics.
https://www.ksh.hu/stadat_annual_6_6 (downloaded: November 13, 2020)
Lacquement, G., & Chevalier, P. (2016). Capital territorial et développement des territoires
locaux, enjeux théoriques et méthodologiques de la transposition d’un concept de
l’économie territoriale à l’analyse géographique », Annales de géographie, No. 711
(5/2016), 490–518, Armand Colin. https://doi.org/10.3917/ag.711.0490
Lefebvre, H. (1968). Le Droit à la ville. Collection Société et Urbanisme. Paris: Anthropos.
Lengyel, I., & Varga, A. (2018). A magyar gazdasági növekedés térbeli korlátai – helyzetkép
és alapvető dilemmák. Közgazdasági Szemle, 65(5), 499–524.
http://doi.org/10.18414/KSZ.2018.5.499
Luukkonen, J. (2010). Territorial cohesion policy in the light of peripherality. Town Planning
Review 81 (4), 445–467, DOI: 10.3828/tpr.2010.12.
Lux, G. (2014). Industrial Districts: Building Blocks of the Organised Economy. In
Somlyódyné Pfeil, E. (Ed.) Industrial Districts and Cities in Central Europe (pp. 27–
45). Győr: Universitas-Győr Nonprofit Ltd.
Lux, G. (2017). Újraiparosodás Közép-Európában. Pécs–Budapest: Dialóg Campus.
Lux, G. (2019). A Modern városok program újraiparosítási törekvései. Tér és Társadalom,
33(1), 44–65. https://doi.org/10.17649/TET.33.1.3067
Lux, G. (2020). Manufacturing in the Post-Industrial City: The Role of a „Hidden Sector” in
the Development of Pécs, Hungary. In: Cudny, W., & Kunc, J. (eds.): Urban Growth
and Change: The Case of Central Europe. Routledge, forthcoming. 18 p.
McCann, P. (2016). The UK regional-national economic problem: Geography, globalisation
and governance. Routledge.
Medeiros, E. (2016). Territorial Cohesion: An EU concept, European Journal of Spatial
Development, 60.
Melbye, P. (2006). Territory matters for competitiveness and cohesion. Facets of regional
diversity and potentials in Europe Evidence from the ESPON 2006 Programme.
Nick, G., Várgedő, T., Nagy, C., & Szaller, Á. (2019). The territorial contexts of Industry 4.0
in Hungary, the present and future challenges and expectations of the digital ecosystem.
Deturope. 11(3), 29–58.
Nordregio (2009). The Potential for regional Policy Instruments, 2007-2013, to contribute to
the Lisbon and Göteborg objectives for growth, jobs and sustainable development. Final
Report. Nordregio, Stockholm.
OECD (2001). Territorial Outlook Report – Territorial Economy. Paris: OECD.
OECD (2009). Regions Matter. Economic Recovery, Innovation and Sustainable Growth,
Organisation for Economic Co-operation and Development, Paris.
OECD (2011). OECD Regional Outlook 2011: Building Resilient Regions for Stronger
Economies. OECD Publishing, Paris. http://doi.org/10.1787/9789264120983-en
Pálné Kovács, I. (2013). Pécs, as the victim of multi-level governance: the case of the project
“European Capital of Culture” in 2010. Urban Research and Practice, 6(3), pp. 365–
375. https://doi.org/10.1080/17535069.2013.827907
Pálné Kovács, I. (2019). A magyar önkormányzatok korlátai a helyi gazdaságfejlesztésben,
Tér és Társadalom, 33(2), 3–19. https://doi.org/10.17649/TET.33.2.3088
Pálné Kovács, I., Bodor, Á., Finta I., Grünhut, Z., Kacziba, P., & Zongor, G. (2016). Farewell
to Decentralisation: The Hungarian Story and its General Implications. Croatian and
Egyed, I., Rácz, S.
132
comparative public administration: a journal for theory and practice of public
administration, 16(4), 789–816. https://doi.org/10.31297/hkju.16.4.4
Pasquier, R. (2015). Regional Governance and Power in France. The Dynamics of Political
Space. Basingstoke and New York: Palgrave Macmillan.
Pecqueur, B. (2005). Les territoires créateurs de nouvelles ressources productives : le cas de
l'agglomération grenobloise. Géographie, économie, société, vol. 7(3), 255-268.
https://doi.org/10.3166/ges.7.255-268
Pike, A, Marlow, D, McCarthy, A. (2015). Local institutions and local economic
development: The Local Enterprise Partnerships in England, 2010. Cambridge Journal
of Regions, Economy and Society, 8(2), 185–204.
Póla, P. (2020). Az iparvállalatokat támogató helyi intézményrendszer. In Lux, G. (Ed.), Ipari
középvállalatok és regionális fejlődés (pp. 159–179). Budapest: Dialóg Campus.
Pugalis, L., Gray, N. (2016). New regional development paradigms: An exposition of
placebased modalities. Australasian Journal of Regional Studies, Vol 22(1), 181-203.
Rácz, Sz. (2017). Main characteristics of Hungarian-Croatian political relations and Cross-
Border Co-operations. Geographica Pannonica, 21(1), 54–67.
https://doi.org/10.18421/GP21.01-05
Rácz, Sz. (2019). Development Processes of Regional Centres in Central and Southeast
Europe – From State Socialism to Dependent Market Economies. Deturope, 11(2), 92–
100.
Rácz, Sz., Kovács, S. Zs., & Horeczki, R. (2020). Pécs fejlődési pályája. In: Rechnitzer J.,
Berkes, J. (Eds.), Nagyvárosok Magyarországon. Budapest: Dialóg Campus.
Rechnitzer, J. (2016). A területi tőke a városfejlődésben. A Győr-kód. Budapest–Pécs: Dialóg
Campus.
Rechnitzer, J. (2019). Nagyvárosok a magyar területi politikában és területfejlesztésben a
rendszerváltozástól napjainkig. Tér és Társadalom, 33(1), 3–26.
https://doi.org/10.17649/TET.33.1.3069
Rechnitzer, J., Berkes, J., & Filep, B. (2019). The most important city development initiatives
of Hungary. Regional Statistics, 9(2), 20-44.
Rechnitzer, J., Páthy, Á., & Berkes, J. (2014). A magyar városhálózat stabilitása és változása.
Tér és Társadalom, 28(2), 105–127. https://doi.org/10.17649/TET.28.2.2623
Rodríguez-Pose, A., & Garcilazo, E. (2015). Quality of government and the returns of
investment: Examining the impact of cohesion expenditure in European regions.
Regional Studies, 49(8), 1274–1290. https://doi.org/10.1080/00343404.2015.1007933
Schragger, R. (2016). City power: Urban governance in a global age. Oxford University
Press, N.Y.
Servillo, L., Atkinson, R., & Russo, A. P. (2012). Territorial attractiveness in EU urban and
spatial policy: A critical review and future research agenda. European Urban and
Regional Studies, 19(4), 349–365. https://doi.org/10.1177/0969776411430289
Simó, B., Gordos, T. & Józsa, V. (2018). Regional Institutions at the Doorstep of post 2020
Cohesion Policy – Status Report from Hungary. Deturope, 10(3), 14–32.
Territorial Agenda (2007). Territorial Agenda of the European Union: Towards a More
Competitive and Sustainable Europe of Diverse Regions. Informal Ministerial Meeting
on Urban Development and Territorial Cohesion in Leipzig on 24/25 May 2007.
Tóth, B. I. (2015). Territorial Capital: Theory, Empirics and Critical Remarks, European
Planning Studies, 23:7, 1327-1344, https://doi.org/10.1080/09654313.2014.928675
World Bank (2008). World Bank’s World Development Report 2009: Reshaping Economic
Geography. Washington: The World Bank.
DETUROPE – THE CENTRAL EUROPEAN JOURNAL OF REGIONAL DEVELOPMENT AND TOURISM
Vol. 12 Issue 3 2020 ISSN 1821-2506
Original scientific paper
133
ACCESSIBILITY OF MAJOR CENTRAL AND EASTERN
EUROPEAN CITIES IN DANUBE CRUISE TOURISM
Márk MISKOLCZIa, Melinda JÁSZBERÉNYIb, András MUNKÁCSYc,
Dávid NAGYd
a Corvinus University of Budapest, Institute of Marketing, [email protected] b Corvinus University of Budapest, Institute of Marketing, [email protected] c KTI Institute for Transport Sciences, [email protected] d University of Pécs, Doctoral Programme in Earth Sciences, [email protected]
Cite this article: Accessibility of major Central and Eastern European cities in Danube cruise tourism.
Deturope. 12(3): 133-150.
Abstract
This article aims to provide an insight into the largely under-researched issue of river cruise tourism on
the Danube through an explorative analysis. The focus is on attraction accessibility in the context of the
three major cities of pan-European Corridor VII. (Vienna, Budapest, Belgrade), based on the adaptation
of the accessibility model by Geurs & van Wee (2004). Expert and stakeholder interviews have been
carried out and analyzed to understand the general problems and suggested solutions of port and
attraction accessibility of these cities. Results indicate that accessibility is influenced not only by
transport components: rethinking temporal and individual components as well as developing land-use and
transport components may be relevant to overcoming key issues like low water level, overtourism,
reliability of services, urban traffic congestion and parking problems on roads. Our research results can
serve as a source for urban and transport development strategies and summarizes product development
proposals of the members of the tourism sector for cruise tourism on the Danube to ensure accessibility.
Keywords: components of accessibility, attraction accessibility, Danube cruise tourism, stakeholder
interview, urban mobility
INTRODUCTION
Cruise tourism is a special form of travelling: it is attached to cruise ships, i.e. mixtures of a
tourist attraction, a place for accommodation and a means of transport. Danube cruise tourism
is one of the emerging segments of leisure tourism, which primarily combines cultural and
other alternative service elements (e.g. wine and gastronomy, arts and crafts, etc.) in its offer
(Jászberényi & Miskolczi, 2020). In the high season, the industry can contribute at least €
110.7 million to the regional economy (remarkable destinations of the region: Vienna,
Budapest, Belgrade) (Danube International Programme, 2019). The number of cruise tourists
has been steadily increasing in the 2010s, and tour operators usually sell out packages for a
season even before the previous has been started. However, despite the ever-increasing
Miskolczi, M., Jászberényi, M., Munkácsy, A., Nagy, D.
134
economic performance of the product, it seems to be ignored by tourism (and transport)
research. Previous research is mainly focused on maritime cruises (Johnson, 2002; Brida &
Zapata, 2010; Klein, 2011). River cruise tourism is highly overlooked and only some scholars
– obviously from countries with large navigable rivers – are active in this field, even though
the product can significantly increase the tourism revenue of a destination (Santos et al.,
2019).
This article departs, on the one hand, from the experience that onshore mobility of river
cruise tourists has a significant impact on the transport system in certain points of the
destinations, especially in Budapest, Belgrade and Vienna which are becoming the most
popular cities for cruise tourists. On the other hand, it is supposed that accessibility issues
related to tourist sites might affect the tourism experience in this destination.
Accessibility has been in the focus of transport and land use research for decades. In spite
of this, accessibility of tourism attractions has rarely been studied: some authors focus on how
disabled people access attraction sites (e.g. Israeli, 2002, Yau et al., 2004) and others on how
the general public can access a tourist attraction (e.g. Israeli & Mansfeld, 2003; Toth &
David, 2010). This article aims to contribute to the latter topic, discussing accessibility issues
in river cruise tourism. For this reason, accessibility is considered as a complex phenomenon
including four key components (land-use, transport, temporal, individual) as suggested by
Geurs & van Wee (2004).
Although the research focuses primarily on the ports mentioned above, most of the (urban)
mobility related issues of river cruise tourism are general and not country specific. Thus,
outcomes are expected to be relevant to researchers, planners and decision-makers in cruise
tourism beyond borders, especially in the Danube region.
In the next section of the article, Danube cruise tourism and the role of Vienna, Budapest
and Belgrade are introduced in detail, by highlighting main outcomes of previous research
and reviewing products of the largest service providers. Theoretical background and the
methodology of the primary research are described afterwards. In the remaining parts of the
article, the four components of accessibility are interpreted, and issues of attraction
accessibility are discussed by the outcomes of this qualitative research, followed by
concluding remarks and the collected recommendations.
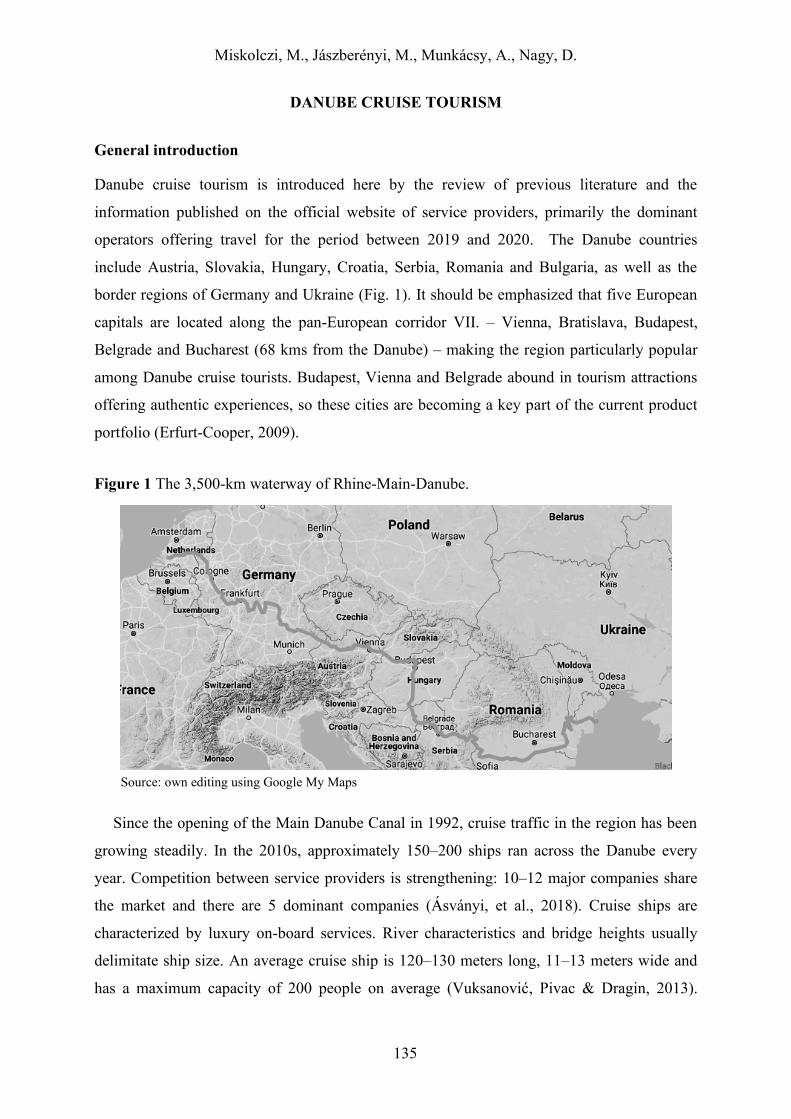
Miskolczi, M., Jászberényi, M., Munkácsy, A., Nagy, D.
135
DANUBE CRUISE TOURISM
General introduction
Danube cruise tourism is introduced here by the review of previous literature and the
information published on the official website of service providers, primarily the dominant
operators offering travel for the period between 2019 and 2020. The Danube countries
include Austria, Slovakia, Hungary, Croatia, Serbia, Romania and Bulgaria, as well as the
border regions of Germany and Ukraine (Fig. 1). It should be emphasized that five European
capitals are located along the pan-European corridor VII. – Vienna, Bratislava, Budapest,
Belgrade and Bucharest (68 kms from the Danube) – making the region particularly popular
among Danube cruise tourists. Budapest, Vienna and Belgrade abound in tourism attractions
offering authentic experiences, so these cities are becoming a key part of the current product
portfolio (Erfurt-Cooper, 2009).
Figure 1 The 3,500-km waterway of Rhine-Main-Danube.
Source: own editing using Google My Maps
Since the opening of the Main Danube Canal in 1992, cruise traffic in the region has been
growing steadily. In the 2010s, approximately 150–200 ships ran across the Danube every
year. Competition between service providers is strengthening: 10–12 major companies share
the market and there are 5 dominant companies (Ásványi, et al., 2018). Cruise ships are
characterized by luxury on-board services. River characteristics and bridge heights usually
delimitate ship size. An average cruise ship is 120–130 meters long, 11–13 meters wide and
has a maximum capacity of 200 people on average (Vuksanović, Pivac & Dragin, 2013).
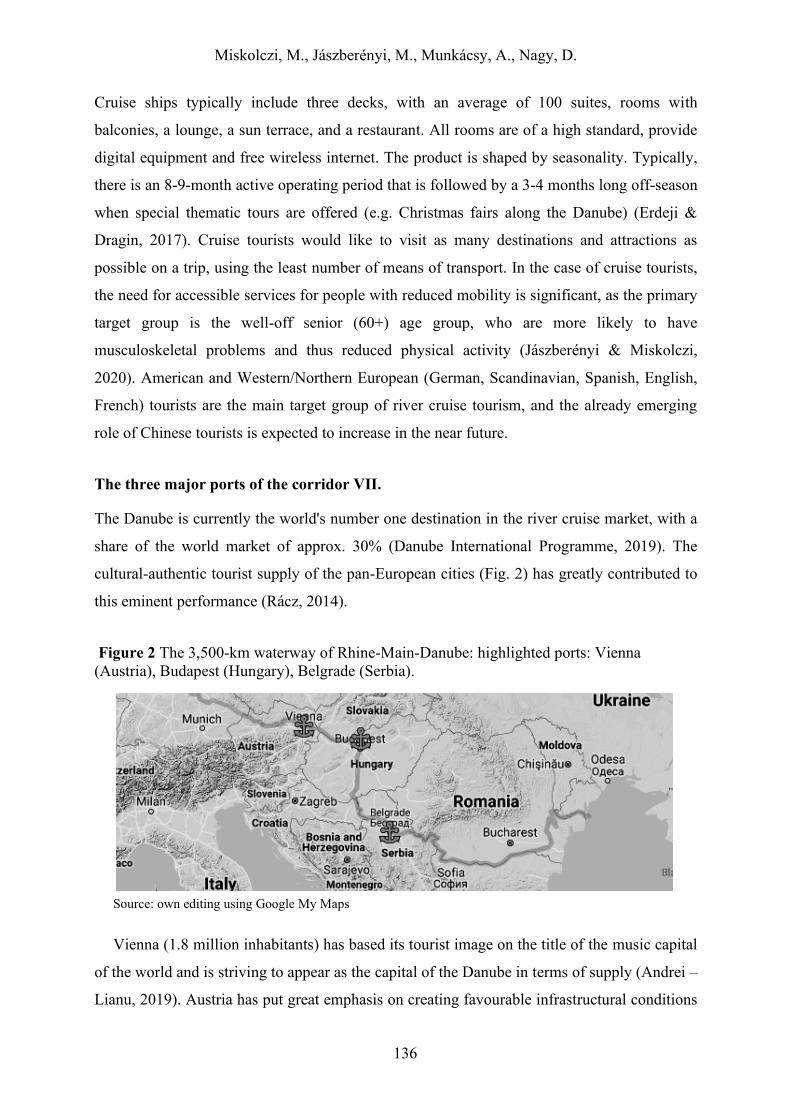
Miskolczi, M., Jászberényi, M., Munkácsy, A., Nagy, D.
136
Cruise ships typically include three decks, with an average of 100 suites, rooms with
balconies, a lounge, a sun terrace, and a restaurant. All rooms are of a high standard, provide
digital equipment and free wireless internet. The product is shaped by seasonality. Typically,
there is an 8-9-month active operating period that is followed by a 3-4 months long off-season
when special thematic tours are offered (e.g. Christmas fairs along the Danube) (Erdeji &
Dragin, 2017). Cruise tourists would like to visit as many destinations and attractions as
possible on a trip, using the least number of means of transport. In the case of cruise tourists,
the need for accessible services for people with reduced mobility is significant, as the primary
target group is the well-off senior (60+) age group, who are more likely to have
musculoskeletal problems and thus reduced physical activity (Jászberényi & Miskolczi,
2020). American and Western/Northern European (German, Scandinavian, Spanish, English,
French) tourists are the main target group of river cruise tourism, and the already emerging
role of Chinese tourists is expected to increase in the near future.
The three major ports of the corridor VII.
The Danube is currently the world's number one destination in the river cruise market, with a
share of the world market of approx. 30% (Danube International Programme, 2019). The
cultural-authentic tourist supply of the pan-European cities (Fig. 2) has greatly contributed to
this eminent performance (Rácz, 2014).
Figure 2 The 3,500-km waterway of Rhine-Main-Danube: highlighted ports: Vienna
(Austria), Budapest (Hungary), Belgrade (Serbia).
Source: own editing using Google My Maps
Vienna (1.8 million inhabitants) has based its tourist image on the title of the music capital
of the world and is striving to appear as the capital of the Danube in terms of supply (Andrei –
Lianu, 2019). Austria has put great emphasis on creating favourable infrastructural conditions
Miskolczi, M., Jászberényi, M., Munkácsy, A., Nagy, D.
137
for cruise tourism. All modes of transport in Vienna are highly developed. Vienna has an
airport (Flughafen Schwechat), which is 22 kms from the city, and it is important for both
passenger and cargo traffic. The port of Vienna plays an important logistical role in the
region. After a significant expansion in 2013, the port area was increased by thirty-five
thousand square meters (Dragin et al., 2017). The development of the Vienna port enables
high-quality cruise traffic, which is a significant competitive advantage among the ports. The
diverse tourist offer of the city is adjusted to the expectations of the primary target group
(senior segment) (Jászberényi & Miskolczi, 2020). The most popular section of Vienna is the
city center (Innere Stadt), which is located between the Danube canal and the castle wall. St.
Stephen's Cathedral, (Stephansdom) with its 97-meter high tower is a symbol of the city
(Dumbrovská & Fialová, 2014). The Ringstraße is a 3.5–4 km long, 57 m wide boulevard,
closed at both ends by the Danube Canal. There are also attractions outside the city center,
such as the Belvedere Palace (Schloss Belvedere), which is also a must-see attraction for
Danube cruise tourists (Kádár, 2012).
Danube cruise tourism grants immense potential for Budapest (1.8 million inhabitants), as
the capital city of Hungary is a regular departure/arrival point of trips due to its geographical
location. In comparison to other cities along the Danube (e.g. Vienna which is a major
competitor of Budapest), the major advantage of Budapest is the UNESCO World Heritage
cityscape by the Danube, where cruise ships usually dock. There are 450,000-500,000
passenger arrivals per year in the city (Ásványi et al., 2018). Budapest is the central transport
hub of Hungary, from where the main railway and road lines start in a radial direction,
creating connections with the counties of Hungary and the major European cities. The
international airport (Liszt Ferenc Nemzetközi Repülőtér) is 15 km from the city center and
serves air transport with two terminals (Jászberényi, 2019). Due to the sections of the national
roads and Budapest-centricity, the capital is extremely congested, the huge transit traffic
causes considerable difficulties. The large number of attractions of Budapest reinforces its
role in Danube cruise tourism: the most popular sites include the Heroes' Square, the authentic
Great Market Hall, the Opera House, the Fishermen's Bastion and the Buda Castle Palace, as
well as many religious heritages (e.g. Matthias Church, Dohány Street Synagogue, St.
Stephen's Basilica) (Dumbrovská & Fialová, 2014). There are a handful of attractions in the
suburbs of Budapest offered as optional tours, such as the artists’ village of Szentendre (along
the Danube), the Royal Palace and Gardens in Gödöllő and –rarely, only in some packages–
the equestrian park in Domony.
Miskolczi, M., Jászberényi, M., Munkácsy, A., Nagy, D.
138
The Serbian or Bulgarian-Romanian section of the Danube is an emerging region (Rácz,
2014). There are several travel packages on offer, which incorporates the cities of the region
(e.g. Belgrade). Belgrade (1.3 million inhabitants) is located at the confluence of two major
rivers, the Danube and the Sava, so it has several bridges, the two most significant are the
Branko Bridge and the Gazela Bridge, which connect the Old Town with the New Town on
the other side of the Sava (Rabotic, 2011). Motorways connect Belgrade to the north with
Novi Sad and Budapest, to the south with Niš and to the west with Zagreb (Dragin – Jovičić –
Lukić, 2010). The city’s airport (Nikola Tesla International Airport) is located 12 kms from
the downtown. Due to the urban growth and the intensified vehicle traffic, congestion is a
serious problem for the city. To make the Serbian section of the Danube even more attractive
for tourists, a new international port was built in Zimony. Belgrade's historic districts and
buildings are the most prominent tourist attractions of the region. These include Skadarlija,
Belgrade's Bohemian Quarter, the National Museum, Nikola Pašić Square, Terazije, Belgrade
Fortress and the surrounding area (Dragin et al., 2017). There are 16 islands in the Danube
and Sava in the interior of Belgrade, many of which are still undeveloped and have a great
tourism potential.
THEORETICAL BACKGROUND
Accessibility usually refers to how a physical object (facility, location of a settlement, etc.) is
accessed, i.e. the transport conditions for getting there (Van Wee et al., 2001). Often, only the
transport and regional aspects (Vickerman et al., 1999; Litman, 2007) are in focus in the
definition of accessibility. Undoubtedly, these factors substantially affect accessibility, but
many other aspects are excluded from the interpretation suggesting only physical access.
Farrington (2007) emphasizes the complexity of accessibility and points out that accessibility
should be understood as a complex social phenomenon that is influenced by temporary and
social factors.
Geurs & van Wee (2004) also address the complexity of accessibility, which may be
understood here as how the regional transport system allows individuals and goods to reach
their destination (Fleischer, 2008; Tóth & Dávid, 2010). Although the transport system seems
to be dominant in this definition, the authors refer to the perspective of individuals and the
time constraints that affect land use as well. Thus, the theory not only suggests a mobility-
centric approach, but also identifies four different accessibility components (Geurs & van
Wee, 2004):
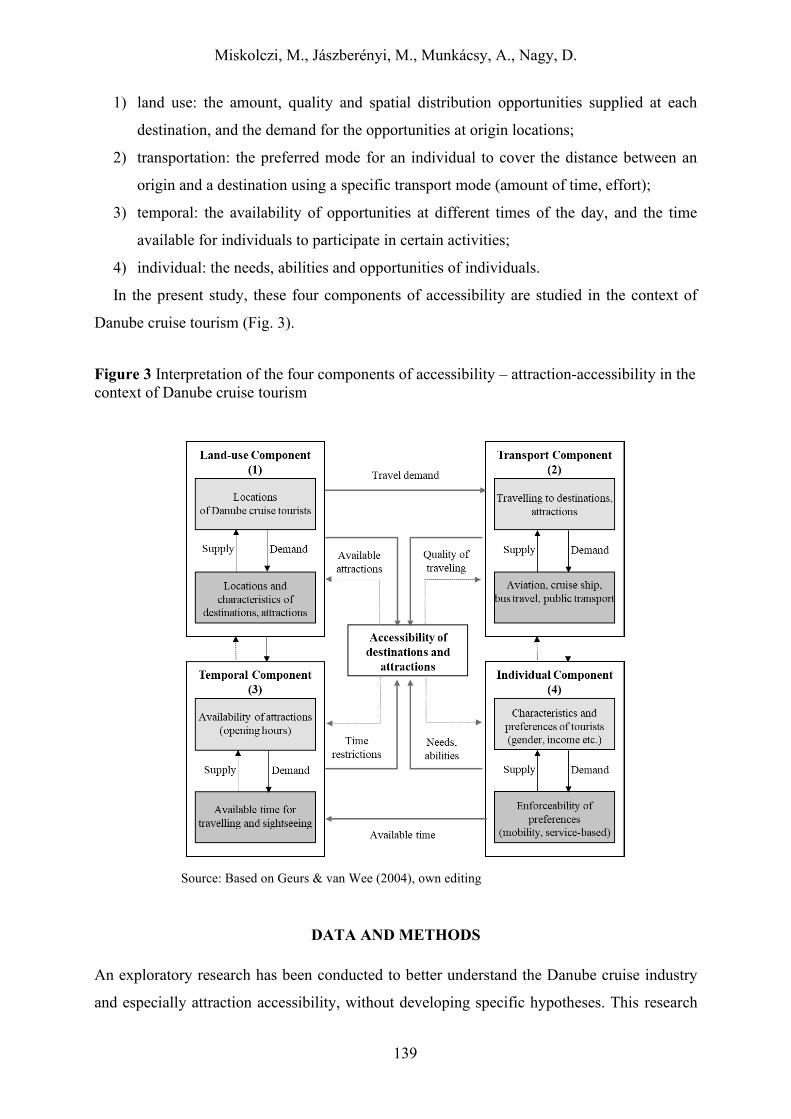
Miskolczi, M., Jászberényi, M., Munkácsy, A., Nagy, D.
139
1) land use: the amount, quality and spatial distribution opportunities supplied at each
destination, and the demand for the opportunities at origin locations;
2) transportation: the preferred mode for an individual to cover the distance between an
origin and a destination using a specific transport mode (amount of time, effort);
3) temporal: the availability of opportunities at different times of the day, and the time
available for individuals to participate in certain activities;
4) individual: the needs, abilities and opportunities of individuals.
In the present study, these four components of accessibility are studied in the context of
Danube cruise tourism (Fig. 3).
Figure 3 Interpretation of the four components of accessibility – attraction-accessibility in the
context of Danube cruise tourism
Source: Based on Geurs & van Wee (2004), own editing
DATA AND METHODS
An exploratory research has been conducted to better understand the Danube cruise industry
and especially attraction accessibility, without developing specific hypotheses. This research
Miskolczi, M., Jászberényi, M., Munkácsy, A., Nagy, D.
140
is based on flexible, semi-structured interviews, which is the best-known method of data
collection in exploratory researches (Popper et al., 1997). Due to the time-consuming nature
of interviews, the number of inquiries made in the research process is usually low (Malhotra
& Simon, 2017). Although the low number of sampling elements cannot be considered
representative, it is useful to extend knowledge about the subject (Babbie, 2014).
In this case, 10 experts have been involved in the research personally: researchers,
transport experts, port authority representatives, attraction managers, and tour operators.
Three of the interviews (lasting 45–60 minutes) have fully or partially been taken online. The
information provided by the interviewees has been processed anonymously.
The semi-structured discussions addressed four main topics:
1) questions about interviewees (job, interest and experience in Danube cruise tourism)
and their general knowledge about cruise tourism,
2) transport for Danube cruise tourism (means of transport applied, transport logistics),
3) accessibility of attractions, identification of accessibility problems (affected
attractions, accessibility, known accessibility problems),
4) suggestions for solving attraction accessibility issues (and recommendations about
further research directions).
RESULTS
Interviewees were asked to identify problems of Danube river cruise tourism. In this chapter,
some general issues are highlighted and interpreted along the four accessibility dimensions.
Based on the analysis of the expert interviews, five general issues related to river cruise
tourism were identified. There is no doubt that the key challenge is the water level of the
Danube (1). In October 2018, measurements by hydrologists at the General Directorate of [the
Hungarian] Water Management (OVF) showed that the water broke a negative record of 71
years. Low water levels (below 1.6 meters) strongly influence the tourism experience, as
tourists may be obliged to travel by bus and stay in hotels instead of cruise ships: “In periods
of severe drought, passengers in Budapest or Vienna had to take a bus to Bratislava. This
means that some programmes had to be cancelled due to low water levels” (attraction
operator, Hungary).
Travelling by bus may influence temporal components as well, as time for visits to some
attractions may be limited and transport of goods and personnel to ships may be rescheduled
or even reorganised. Having in mind that cruise ships may be identified as (at least) four-star
Miskolczi, M., Jászberényi, M., Munkácsy, A., Nagy, D.
141
boutique hotels, rooms of similar category have to be arranged in case of drought. Evidently
this might be challenging, especially in the high season of late summer or early autumn.
Packages, tours and excursions are usually planned, announced and sold years in advance,
so unexpected changes to the accessibility of attractions (e.g. temporal closure due to
reconstructions, new timetables) and to general accessibility (large scale road works, traffic
restrictions, open festivals or runway races in public spaces, etc.) may affect the programme
or its schedule (2). Changes may affect prices, too: “Some prices are not announced in
advance. Last year, one of the attractions raised entrance fees by 20%, and many museums
are raising a lot, which means that we are no longer able to offer them in cruise packages”
(tour operator, Serbia).
Overtourism and related mobility issues (3) are challenging in the top destinations.
Furthermore, especially in small destinations, cruise tourists themselves may cause mobility
problems: “Moving at least 160 people in a small town or attraction is complicated. For
example, Dürnstein, with a total population of 800, is visited annually by 1 million cruise
tourists. This mass of tourists is unable to be managed without disturbing local life” (tourism
consultant, Austria).
Interviewees identified two further key problems, namely traffic congestions in cities (4)
and parking problems (5), which are described below as transport components.
The four components of accessibility
Land use component
Elements of the land use component (1) are the quantity and spatial distribution of facilities
offered by the destination (primarily tourist attractions frequented by cruise tourists), the
spatial distribution of potential users (cruise tourists) and the relationship between these two
factors (supply and demand) in the model. The attractions affected by cruise tourism are
primarily limited to heritage tourist attractions and high-end restaurants. (“Tourists often
spend their life-saving money to visit these historic treasures and to experience this luxurious
service palette” – manager, tourist information office, Hungary.)
In this case, the spatial location of tourists includes the distance between the place of
residence and the visited destination, and the distance between the cruise ship and urban
attractions. As mentioned above, most of the cruise tourism attractions are in the central area
of destinations (e.g. Vienna – Schönbrunn Palace, Budapest – Parliament, Belgrade – The
Church of Saint Sava, etc.) and its close vicinity (e.g. Budapest – Royal Palace of Gödöllő).
Miskolczi, M., Jászberényi, M., Munkácsy, A., Nagy, D.
142
Spatial distribution of facilities includes the key infrastructural features of the wider and
immediate surroundings of the attractions (e.g. the capacity of parking spaces for buses) and
the design of the interior of the attractions (e.g. accessibility for disabled people).
The main users of cruise tourism are Western European (German, Dutch, Swedish,
English, Italian) and overseas (North American, Panamanian, Peruvian, Australian, Chinese)
people. Due the long distances from these countries to the destination, travel needs of cruise
tourists are complex, which affects the range of transport components.
Transport components
Transport components (2) refer to the transport processes between the starting point and the
destination, including the means of transport available for passengers (van Wee et al., 2001).
Although some river cruise tourists (mainly from Germany) use individual or rarely other
modes of transport (car or rail), airplane can be considered the main mode of transport
between the place of residence (see main countries of origin above) and the starting/end
points of the river cruise, usually due to the large distances. From the airport, shuttle services
(usually by car or minibus) are provided, mainly as part of the travel package. Taxi and public
transport are used by some tourists individually.
Within the destination area, to reach attractions, companies hire or use mostly buses, which
are selected under strict quality standards. (“Buses are very carefully selected, and in the case
of several program organizers, the maximum age of a vehicle must be 5 years”, product
manager, cruise company, Switzerland.) For short distances, micromobility vehicles
(traditional or e-bikes, segway, etc.) and mainly walking is applied. Active mobility is
encouraged on thematic cruises and for excursions (e.g. bike, hiking and canoe tours).
Travelling on public transport was unusual for a long time but nowadays it is becoming
efficient for small groups, especially in case of attractions in the city centres, where buses and
even cars may face large traffic and entry or parking restrictions.
In cities, the main mobility problem is traffic congestion (2): “Traffic jams are common
even in off-peak hours. As a result, ships are often unable to depart on time, thus the entire
programme may be delayed.” (port operations manager, Hungary). Another common issue is
the lack of proper parking spaces close to top attractions (3): “There are no parking places
near many attractions of Budapest, tourists can only get on and off. We are in a relatively
lucky position, there is a gas station and a mall nearby and we direct the groups there. Some
tourists are not happy about this (short) distance, but they have to accept the situation”
(attraction operator, Hungary). By making difficult or longer the journeys to attraction areas,
Miskolczi, M., Jászberényi, M., Munkácsy, A., Nagy, D.
143
increasing the time to reach attractions from relatively distant parking places (or bus stops),
these transport components may strongly affect the tourist experience.
In the special case of Budapest, parking problems are not limited to attractions but also to
the port, which is located in the city centre, along a busy north-east bypass. In high season,
several ships are docked here and at least 3 buses per ship are needed to provide transfer to
attractions. Dedicated parking spaces are insufficient there to meet these needs at the same
time. In the case of the other two ports, docking is less of a problem. A specially designed
port is available in Vienna: each berth has a separate lockable garbage collector; vessels can
be connected to the drinking water network and even to the sewage network, so that already
treated wastewater generated on board can be discharged into the land-based sewerage
system. The Belgrade port is not right next to the Danube, but on the banks of the Sava. No
such infrastructure is built in the Sava estuary, but it has been resolved to place office
buildings and shops on huge floating bodies.
Temporal components
The temporal component (3) refers to the time availability of facilities from different aspects:
regular availability (e.g. opening hours of attractions on a certain day, weekly timetable) and
temporal availability (e.g. schedule of temporary exhibitions, seasonal opening of attractions).
In this analysis, the extended interpretation of temporal components (Fleischer, 2008) is
applied. Time constraints (e.g. travel time, seasonality, available leisure time) and the
availability of means of transport and roads (e.g. departure of flights, seasonal schedule, etc.)
are labelled as temporal component here.
The total duration of a river cruise usually varies from 7 to 20 days in the analysed region.
As tours are typically scheduled to a morning or afternoon session (e.g. from 2 pm to 6 pm),
travel time between the port and the attractions is usually not more than 45 minutes. For
example, the above-mentioned Royal Palace of Gödöllő (Hungary) (35 km from Budapest
port, 40-45 minutes) and Schönbrunn Palace (Austria) (8 km from Vienna port, 20–25
minutes) both meet this criterion. Only a few operators or programme organisers offer special
tours to attractions beyond this time limit, e.g. day excursions.
Due to the limited time available for visiting attractions, opening hours must be compatible
with the timetable of packages. It is worth mentioning here that Budapest is typically the
starting or ending point of trips, where pre or post extensions are offered with cruise
packages. This extends the available time for visiting attractions in and near the city, with tour
guides or individually. Vienna and Belgrade appear only as intermediate destinations in the
Miskolczi, M., Jászberényi, M., Munkácsy, A., Nagy, D.
144
packages, so adhering to a tight schedule is a higher difficulty. Taking into consideration tight
schedules, travel time predictability is a critical factor: “Groups and tours need to be very
precise. The plan may often fail due to ten minutes delay because of the very tight schedule.
Tourists have to finish sightseeing usually between 2-6 in the afternoon” (managing director,
destination management company, Austria), which is the busy afternoon peak in urban traffic.
The same applies for the morning peak when most groups depart from the port in the city
centre.
Individual components
The individual components (4) include the personal aspects of access to transport, as well as
the needs and abilities of individuals (tourists). These include:
1) demographic characteristics (age, financial means: willing to pay for attractions),
2) psychographic characteristics (travel motivation, leisure time, mobility patterns), and
individual abilities such as health and mobility (Geurs & van Wee, 2004).
3) Fleischer (2008) extended the role of the individual aspects not only to transport related
aspects but also to accessibility of all kinds of services (e.g. if the tourist is physically
or mentally able to perceive and understand the attraction).
Currently, the demographic characteristics of cruise tourists are the most decisive human
components of attraction accessibility: “The composition of cruise tourists is significantly
different from any other tourism product. We meet a lot of elderly, above 80, with walkers and
wheelchairs and they need a lot more care and accessible attractions” (attraction operator,
Austria).
Due to the tourists’ health status, they are usually transported by bus (or other motorised
vehicles) to attractions. On walking tours, tourists are often grouped in line with their
intentions to walk or their mobility abilities. Thus, tourists with reduced mobility might form
a special group, whose walking distances are minimized and the range of visited attractions is
limited to accessible sites. They can visit fewer attractions but can get a deeper insight of each
of them. In spite of advances toward full accessibility of attractions, the lack of elevators and
ramps still makes it difficult for people with reduced mobility to visit some places (including
public spaces).
In terms of psychographic features, a new trend has been emerging, namely that river
cruise tourists prefer real authentic experiences. They tend to choose more complex but more
promising and odd routes, which allow them to get acquainted with local experience, such as
rural culture, country landscape, family life, etc. On the one hand, this led to new products,
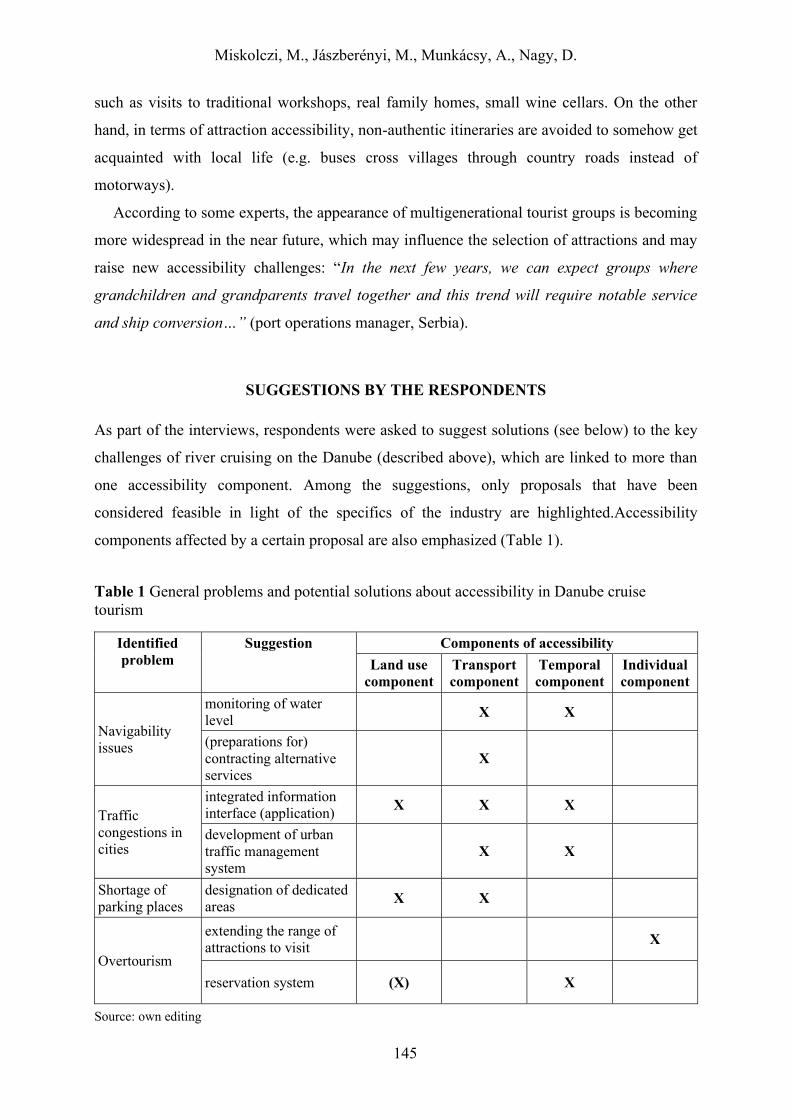
Miskolczi, M., Jászberényi, M., Munkácsy, A., Nagy, D.
145
such as visits to traditional workshops, real family homes, small wine cellars. On the other
hand, in terms of attraction accessibility, non-authentic itineraries are avoided to somehow get
acquainted with local life (e.g. buses cross villages through country roads instead of
motorways).
According to some experts, the appearance of multigenerational tourist groups is becoming
more widespread in the near future, which may influence the selection of attractions and may
raise new accessibility challenges: “In the next few years, we can expect groups where
grandchildren and grandparents travel together and this trend will require notable service
and ship conversion…” (port operations manager, Serbia).
SUGGESTIONS BY THE RESPONDENTS
As part of the interviews, respondents were asked to suggest solutions (see below) to the key
challenges of river cruising on the Danube (described above), which are linked to more than
one accessibility component. Among the suggestions, only proposals that have been
considered feasible in light of the specifics of the industry are highlighted.Accessibility
components affected by a certain proposal are also emphasized (Table 1).
Table 1 General problems and potential solutions about accessibility in Danube cruise
tourism
Identified
problem
Suggestion Components of accessibility
Land use
component
Transport
component
Temporal
component
Individual
component
Navigability
issues
monitoring of water
level X X
(preparations for)
contracting alternative
services
X
Traffic
congestions in
cities
integrated information
interface (application) X X X
development of urban
traffic management
system
X X
Shortage of
parking places
designation of dedicated
areas X X
Overtourism
extending the range of
attractions to visit X
reservation system (X) X
Source: own editing
Miskolczi, M., Jászberényi, M., Munkácsy, A., Nagy, D.
146
Low water levels may essentially increase travel time and/or even prevent tourists from
using the main element of the tourism experience, namely the cruise ship as a place for
accommodation, food, drink, entertainment, etc. and a mode of transport. In order to minimize
the negative impacts, it is necessary to identify in advance and reserve transport and
accommodation alternatives of the same quality.
To reduce the effects of urban traffic congestions, experts suggested solutions far beyond
the cruising industry, namely developing (road) route planners or extending existing route
planning applications with tourism and logistics type options (such as best routes for buses,
routes including stops or parking places for buses, etc.). This is linked to land-use, transport
and temporal components, as it would provide service providers with up-to-date or real-time
information (availability, capacity, current occupancy, etc.) about traffic conditions
(diversions, barriers, etc.) and specific infrastructure (e.g. parking lots for buses, restrictions
for certain types of vehicles). On city level, this could work as part of (or be compatible with)
an urban traffic management system that takes into consideration the already mentioned
tourism and city logistics aspects. One of the key solutions could be some improvements in
transport and land-use components, i.e. dedicated parking spaces could be designated for
buses and other vehicles (trucks, vehicles of the crew, etc.) not far from the port, but not
necessarily in the city centre. Shortcomings of stops close to attractions in central areas could
hardly be overcome due to the lack of space. Experts expect improvements of the
infrastructure and better coordination with other services (especially hop-on/hop-off
sightseeing buses and public transport services) that use these stops. It is worth noting that –
according to some experts– providing high-quality local public transport can solve much of
this problem. The use of a variety of alternative means of transport (especially walking,
biking, pedelecs, segway, etc.) can also help to reduce the negative effects of urban road
traffic, which would result in a more convenient way to reach attractions (especially for small
groups and tourists of younger age).
Overtourism-related mobility issues, especially delays due to congested public spaces and
slow entry to attractions, might be mitigated by reservation systems. Although this is
becoming common in institutions (especially museums), entry to attraction areas (parks,
historical city centres, main squares, etc.) is not controlled or managed. The reservation
system facilitates transport for tourist purposes and reduces the congestion of infrastructure.
Following the same principle, the parking system of the Schönbrunn Palace in Vienna was
redesigned.
Miskolczi, M., Jászberényi, M., Munkácsy, A., Nagy, D.
147
Respondents recommend expanding the range of attractions to be visited. In a time when
people are looking for authentic experiences, less visited and therefore less crowded
attractions can be alternatives to popular sites (waiting for entry, crowding in the attraction
area, etc.) and the mass presence of other tourists may be unattractive. Visits to these
attractions can be organised in smaller groups, on foot, by bicycle or by public transport
(perhaps by car or minibus for longer distances), avoiding traffic congestion and parking
issues.
A general suggestion by respondents is the extension of user groups (targeting people of
younger ages) and therefore the reconsideration of the essentials of river cruising: young
couples, groups of young friends, families with young children, etc. would require more
affordable travel packages, shorter stays and new types of attractions, including the use of
active travel modes to a larger extent.
SUMMARY
In this article, some accessibility issues of tourist attractions have been analyzed in the
context of Danube river cruise tourism. The four accessibility components (land-use,
transport, temporal and individual) have been adapted from the model by Geurs & van Wee
(2004), taking into account remarks by Fleischer (2008). As a general conclusion, the
complexity of accessibility in this context –namely that besides transport components many
other influencing factors shape the accessibility of attractions– has been confirmed by the
results of this qualitative research based on expert and stakeholder interviews.
Five general problems have arisen: water level of the Danube, reliability of pre-arranged
services, overtourism, and –especially in urban areas– traffic congestion and parking issues
for buses. Solutions (identified in line with accessibility components) have also been
suggested by interviewees.
The main conclusion of the research is that key challenges of river cruise tourism
(especially but not only in the context of the three major ports) should be mitigated by actors
outside this industry: bodies responsible for water(way) management, urban mobility
management and urban policy. However, the tourism industry also has its role in improving
conditions of attraction accessibility (by more flexibility in time, better coordination and
communication between operators, etc.) having in mind sustainability and liveability issues
especially in destination areas.
Miskolczi, M., Jászberényi, M., Munkácsy, A., Nagy, D.
148
Among the limitations of the research, it should be mentioned that the analysis was
completed before the outbreak of the current pandemic, which led to a recession and a
significant reorganization of the whole tourism industry. In the post-epidemic period,
accessibility problems are likely to remain valid, however, product development proposals
(e.g., targeting certain consumer groups) may need to be reconsidered.Having this in mind,
next steps of this research would reveal further aspects of accessibility by extending the
research sample (urban experts, crew members, public transport operators, etc.)which
facilitates the updating and comparability of our results. As the demand for river cruise
tourism has not yet been analysed in detail (besides market research), detecting the
expectations, beliefs and needs of target groups, as well as characteristics of actual passengers
(e.g. understanding factors that influence their decisions) would be a relevant contribution to
the literature.
REFERENCES
Andrei, M. T., & Lianu, C. (2019). Branding and tourism development perspectives for small
Romanian cities along the Danube. Annals of Spiru Haret University, Journalism
Studies, 20(2), 338–357.
Avalon Waterways.com (2020). Danube river. Retrieved from:
https://www.avalonwaterways.com/River-Cruises/Danube-River/
Babbie, E. R. (2014). The practice of social research. Cengage, England.
Brida, J. G., & Zapata, S. (2010). Cruises Tourism: Economic, Socio-cultural and
Environmental Impacts. International Journal of Leisure and Tourism marketing. Vol.
1, no. 3, 205–226.
Crystalcruises.com (2020). Crystal Cruises on the Danube. Retrieved from:
https://www.crystalcruises.com/
Danube International Programme (2019). Cruise Tourism in the Danube Region. Final Report
[PDF]; Ministry of Tourism of the Republic of Bulgaria, Sofia, Bulgaria. Retrieved
from: https://danube-region.eu/wp-content/uploads/2020/01/Cruise-Tourism-in-the-
DR_Report_ENG.pdf
Dragin, A. S., Jovičić, D., & Lukić, T. (2010). Cruising along the river Danube:
Contemporary tourism trend in Serbia. Geographica Pannonica, 14(3), 98–108.
Dragin, A., Dragin, V., Košić, K., Demirović, D., & Ivkov-Džigurski, A. (2017). Tourists
motives and residents’ attitude towards cruisers. South. East. Eur. 4, 133–144.
Dumbrovská, V., & Fialová, D. (2014). Tourist intensity in capital cities in Central Europe:
comparative analysis of tourism in Prague, Vienna and Budapest. Czech Journal of
Tourism, 3(1), 5–26.
Erdeji, I., & Dragin, A. (2017). Is cruising along European rivers primarily intended for
seniors and workers from Eastern Europe? Geographica Pannonica, 21(2), 115–123.
Erfurt-Cooper, P. (2009). European waterways as a source of leisure and recreation. River
Tour., 3, 95–116.
Farrington, J. H. (2007). The new narrative of accessibility: its potential contribution to
discourses in (transport) geography. Journal of Transport Geography, 15(5), 319–330.
Miskolczi, M., Jászberényi, M., Munkácsy, A., Nagy, D.
149
Fleischer, T. (2008). Az elérhetőségről: azelérhetőségfogalma. Közúti és mélyépítésiszemle,
58(1–2), 1–6.
Geurs, K. T., & van Wee, B. (2004). Accessibility evaluation of land use and transport
strategies: review and research directions. Journal of Transport Geography, 12(2), 127–
140.
Israeli, A. A. (2002). A preliminary investigation of the importance of site accessibility
factors for disabled tourists. Journal of Travel Research, 41(1), 101–104.
Israeli, Y., & Mansfeld, Y. (2003). Transportation accessibility to and within tourist
attractions in the old city of Jerusalem. Tourism Geographies, 5(4), 461–481.
Jászberényi, M., & Ásványi, K. (2015). The image of Budapest as the best river cruise port
city. Budapest: Corvinus University of Budapest, Economic Geography and Future
Studies Department, pp. 140–148.
Jászberényi, M. (2018). A turizmus a belvízi és tengeri hajózásban. In Jászberényi, M., &
Munkácsy, A. (Eds.), Közlekedés, mobilitás, turizmus. Budapest: Akadémiai Kiadó.
Jászberényi, M. (2019). Vízi turizmus és közlekedés: termékek, trendek, regionalitás.
Budapest: Akadémiai Kiadó.
Jászberényi, M., & Miskolczi, M. (2020). Danube Cruise Tourism as a Niche Product – An
Overview of the Current Supply and Potential. Sustainability, 12(11), 4598.
Johnson, D. (2002). Environmentally Sustainable Cruise tourism: A Reality Check. Marine
Policy, 26, pp. 261–270.
Kádár, B. (2012). Spatial patterns of urban tourism in Vienna, Prague and Budapest.
Metropolitan regions in Europe, 7(1), 277–312.
Klein, R. A. (2011). Responsible Cruise Tourism Issues of Cruise Tourism and Sustainability
Journal of Hospitality and Tourism Management, 18(1), 107–118.
Litman, T. (2008). Evaluating accessibility for transportation planning. Victoria Transport
Policy Institute, Victoria, Canada.
Malhotra, N. K., & Simon, J. (2017). Marketingkutatás. Budapest: Akadémiai Kiadó.
Popper, K. R., Petri, G., & Szegedi, P. (1997). A tudományoskutatáslogikája. Budapest:
Európa Kiadó.
Rabotic, B. (2011). American tourists' perceptions of tourist guides in Belgrade. UTMS
Journal of Economics, 2(2), 151–161.
Rácz, Sz. (2014). New integration period?: Changing tendencies of the urban network in
South-East Europe. DetEurope: Central European Journal of Tourism and Regional
Development, 6(2), 46–63.
Santos, M., Radicchi, E., & Zagnoli, P. (2019). Port’s Role as a Determinant of Cruise
Destination Socio-Economic Sustainability. Sustainability, 11(17), 4542.
Tauck.com (2020). Danube river cruising. Retrieved from: http://www.tauck.com/river-
cruises/european-river-cruises/danube-river-cruising.aspx
Tóth, G., & Dávid, L. (2010). Tourism and accessibility: An integrated approach. Applied
Geography, 30(4), 666–677.
Turtureanu, A. G. (2015). The Current State of Tourism Traffic along the Danube on the
Romanian Territory. Acta Universitatis Danubius. Œconomica, 11(5), 141–148.
Uniworld.com (2020). River cruise collection on the Danube. Retrieved from: Collection
https://www.uniworld.com/eu/
Van Wee, B., Hagoort, M., & Annema, J. A. (2001). Accessibility measures with competition.
Journal of Transport Geography, 9, 199–208.
Vickerman, R., Spiekermann, K., & Wegener, M. (1999). Accessibility and economic
development in Europe. Regional studies, 33(1), 1–15.
Vikingrivercruises.co.uk (2020). Danube river cruises. Retrieved from:
https://www.vikingrivercruises.co.uk/

Miskolczi, M., Jászberényi, M., Munkácsy, A., Nagy, D.
150
Vuksanović, N., Pivac, T., & Dragin, A. (2013). Contemporary trends in nautical tourism on
the example of European river cruising companies. Res. Rev. Dep. Geogr. Tour. Hotel
Manag., 42, 122–138.
Xu, S., Barbieri, C., & Seekamp, E. (2020). Social Capital along Wine Trails: Spilling the
Wine to Residents? Sustainability, 12(4), 1592.
Yau, M. K. S., McKercher, B., & Packer, T. L. (2004). Traveling with a disability: More than
an access issue. Annals of tourism research, 31(4), 946–960.
DETUROPE – THE CENTRAL EUROPEAN JOURNAL OF REGIONAL DEVELOPMENT AND TOURISM
Vol. 12 Issue 3 2020 ISSN 1821-2506
Original scientific paper
151
EXAMINATION OF THE MOTIVATION FOR FURTHER
EDUCATION AMONG HUNGARIAN HIGH SCHOOL STUDENTS IN
VOJVODINA
Boglárka KINCSESa, Sándor PAPPb
a Ph.D. student, University of Szeged, Doctoral School of Geosciences, Department of Economic and
Social Geography, Egyetem utca 2, H-6722 Szeged, Hungary, [email protected] b Ph.D. student, University of Szeged, Doctoral School of Geosciences, Department of Economic and
Social Geography, Egyetem utca 2, H-6722 Szeged, Hungary, [email protected]
Cite this article: Kincses, B., Papp, S. (2020). Examination of the motivation for further education among
Hungarian high school students in Vojvodina. Deturope, 12(3): 151-168.
Abstract
The study focuses on the higher education choices of Hungarian-speaking students studying at Serbian
high schools in Vojvodina. Due to the disorganized nature of Hungarian-language higher education in
Serbia, Hungarian students have little opportunity to study in their mother tongue at state universities and
colleges. A questionnaire was distributed among 442 students at 11 high schools in Vojvodina to find out
about their intention to study after high school, their reasons for and against higher education in Serbia,
and the reasons influencing their choice of higher education institution. The results were analyzed with
frequency tables and word clouds. Eighty percent of respondents said they planned to continue their
studies after high school. Of those, 72% would like to study in one of the Hungarian higher education
institutions, while 25% would like to study in Serbia. Our results showed that for Hungarian high school
students in Vojvodina, language is the most important reason when choosing a higher education
institution, in terms of both a lack of knowledge of Serbian language and a desire to conduct their studies
in their mother tongue. Other influencing reasons were favorable academic programs, future career
opportunities, and geographic proximity.
Keywords: Hungarian language, Serbian language, Vovjodina, Higher education, School choice
INTRODUCTION
The Autonomous Province of Vojvodina is the only historical region and autonomous
province of Serbia. Vojvodina is ethnically, religiously, culturally, and linguistically
heterogeneous. According to the 2011 Serbian census, 67% of the population of Serbia
identified as ethnically Serbian and the remaining 33% was constituted by almost thirty
different ethnic communities. The largest ethnic minority in Serbia is the Hungarian
community, representing 3.5% of the country’s population. The majority of Hungarians in
Serbia live in the Vojvodina region, comprising 13% of the local population (Internet 1). The
majority of Vojvodinian Hungarians live in northern Bačka (along the Hungarian border) and
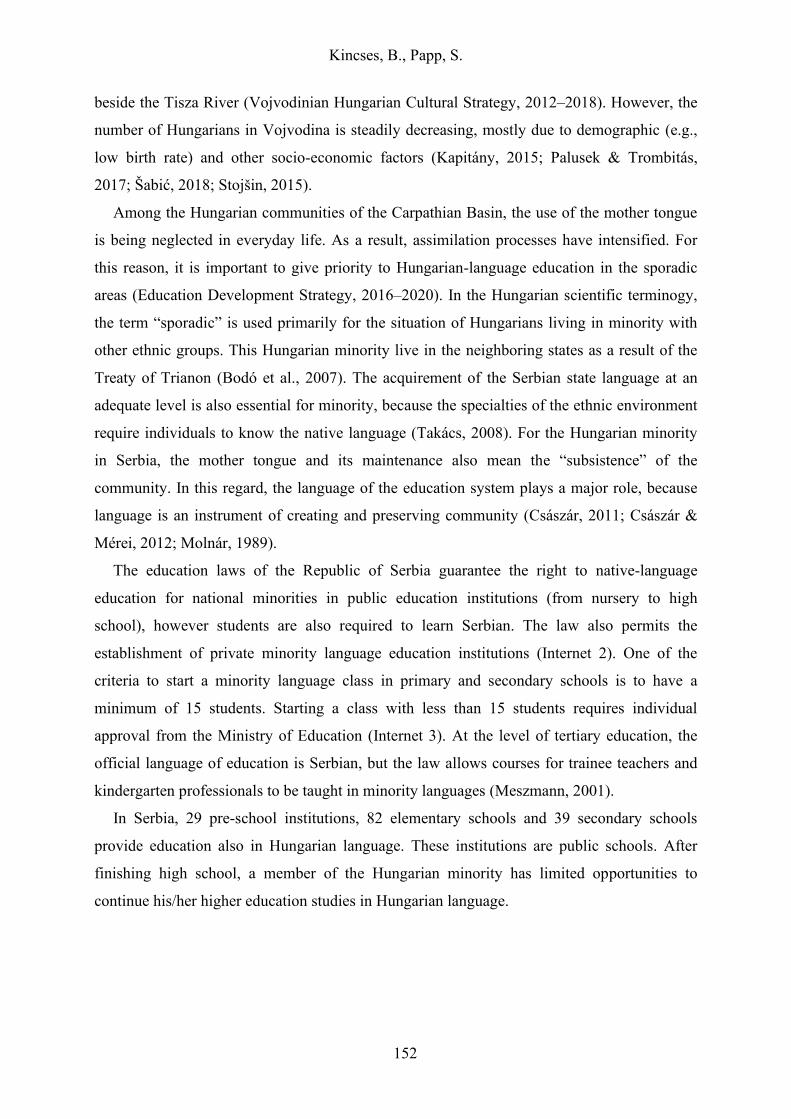
Kincses, B., Papp, S.
152
beside the Tisza River (Vojvodinian Hungarian Cultural Strategy, 2012–2018). However, the
number of Hungarians in Vojvodina is steadily decreasing, mostly due to demographic (e.g.,
low birth rate) and other socio-economic factors (Kapitány, 2015; Palusek & Trombitás,
2017; Šabić, 2018; Stojšin, 2015).
Among the Hungarian communities of the Carpathian Basin, the use of the mother tongue
is being neglected in everyday life. As a result, assimilation processes have intensified. For
this reason, it is important to give priority to Hungarian-language education in the sporadic
areas (Education Development Strategy, 2016–2020). In the Hungarian scientific terminogy,
the term “sporadic” is used primarily for the situation of Hungarians living in minority with
other ethnic groups. This Hungarian minority live in the neighboring states as a result of the
Treaty of Trianon (Bodó et al., 2007). The acquirement of the Serbian state language at an
adequate level is also essential for minority, because the specialties of the ethnic environment
require individuals to know the native language (Takács, 2008). For the Hungarian minority
in Serbia, the mother tongue and its maintenance also mean the “subsistence” of the
community. In this regard, the language of the education system plays a major role, because
language is an instrument of creating and preserving community (Császár, 2011; Császár &
Mérei, 2012; Molnár, 1989).
The education laws of the Republic of Serbia guarantee the right to native-language
education for national minorities in public education institutions (from nursery to high
school), however students are also required to learn Serbian. The law also permits the
establishment of private minority language education institutions (Internet 2). One of the
criteria to start a minority language class in primary and secondary schools is to have a
minimum of 15 students. Starting a class with less than 15 students requires individual
approval from the Ministry of Education (Internet 3). At the level of tertiary education, the
official language of education is Serbian, but the law allows courses for trainee teachers and
kindergarten professionals to be taught in minority languages (Meszmann, 2001).
In Serbia, 29 pre-school institutions, 82 elementary schools and 39 secondary schools
provide education also in Hungarian language. These institutions are public schools. After
finishing high school, a member of the Hungarian minority has limited opportunities to
continue his/her higher education studies in Hungarian language.
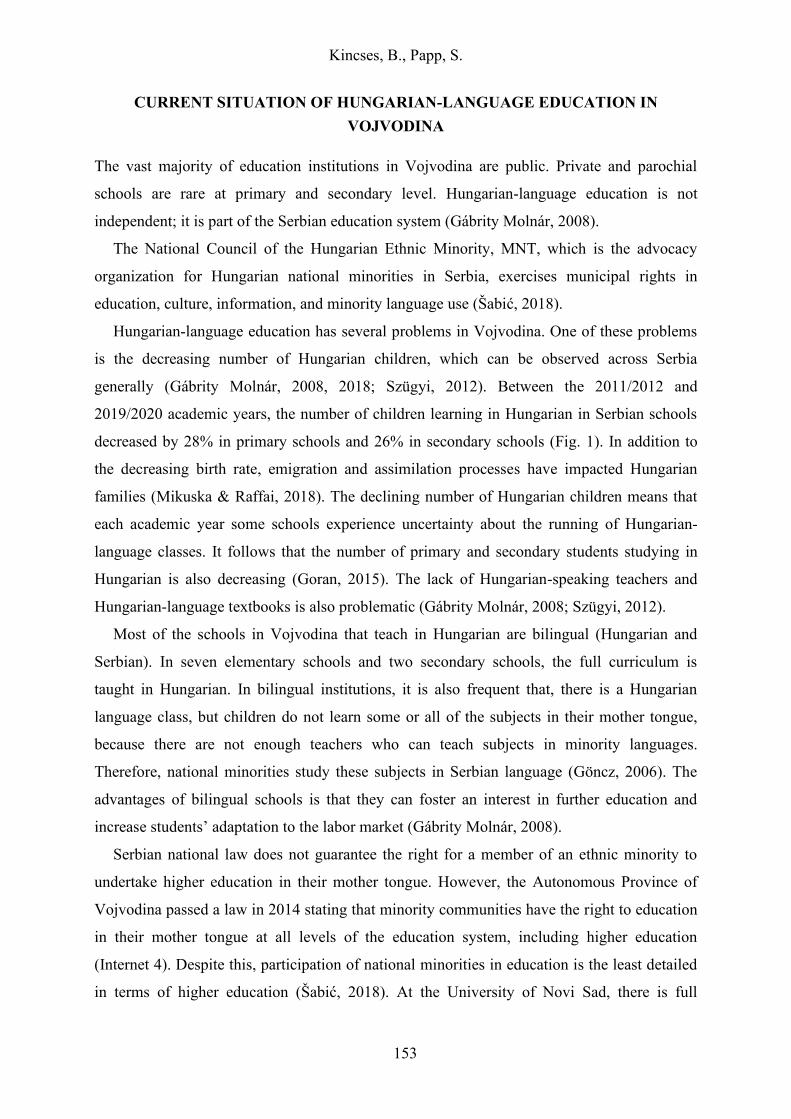
Kincses, B., Papp, S.
153
CURRENT SITUATION OF HUNGARIAN-LANGUAGE EDUCATION IN
VOJVODINA
The vast majority of education institutions in Vojvodina are public. Private and parochial
schools are rare at primary and secondary level. Hungarian-language education is not
independent; it is part of the Serbian education system (Gábrity Molnár, 2008).
The National Council of the Hungarian Ethnic Minority, MNT, which is the advocacy
organization for Hungarian national minorities in Serbia, exercises municipal rights in
education, culture, information, and minority language use (Šabić, 2018).
Hungarian-language education has several problems in Vojvodina. One of these problems
is the decreasing number of Hungarian children, which can be observed across Serbia
generally (Gábrity Molnár, 2008, 2018; Szügyi, 2012). Between the 2011/2012 and
2019/2020 academic years, the number of children learning in Hungarian in Serbian schools
decreased by 28% in primary schools and 26% in secondary schools (Fig. 1). In addition to
the decreasing birth rate, emigration and assimilation processes have impacted Hungarian
families (Mikuska & Raffai, 2018). The declining number of Hungarian children means that
each academic year some schools experience uncertainty about the running of Hungarian-
language classes. It follows that the number of primary and secondary students studying in
Hungarian is also decreasing (Goran, 2015). The lack of Hungarian-speaking teachers and
Hungarian-language textbooks is also problematic (Gábrity Molnár, 2008; Szügyi, 2012).
Most of the schools in Vojvodina that teach in Hungarian are bilingual (Hungarian and
Serbian). In seven elementary schools and two secondary schools, the full curriculum is
taught in Hungarian. In bilingual institutions, it is also frequent that, there is a Hungarian
language class, but children do not learn some or all of the subjects in their mother tongue,
because there are not enough teachers who can teach subjects in minority languages.
Therefore, national minorities study these subjects in Serbian language (Göncz, 2006). The
advantages of bilingual schools is that they can foster an interest in further education and
increase students’ adaptation to the labor market (Gábrity Molnár, 2008).
Serbian national law does not guarantee the right for a member of an ethnic minority to
undertake higher education in their mother tongue. However, the Autonomous Province of
Vojvodina passed a law in 2014 stating that minority communities have the right to education
in their mother tongue at all levels of the education system, including higher education
(Internet 4). Despite this, participation of national minorities in education is the least detailed
in terms of higher education (Šabić, 2018). At the University of Novi Sad, there is full
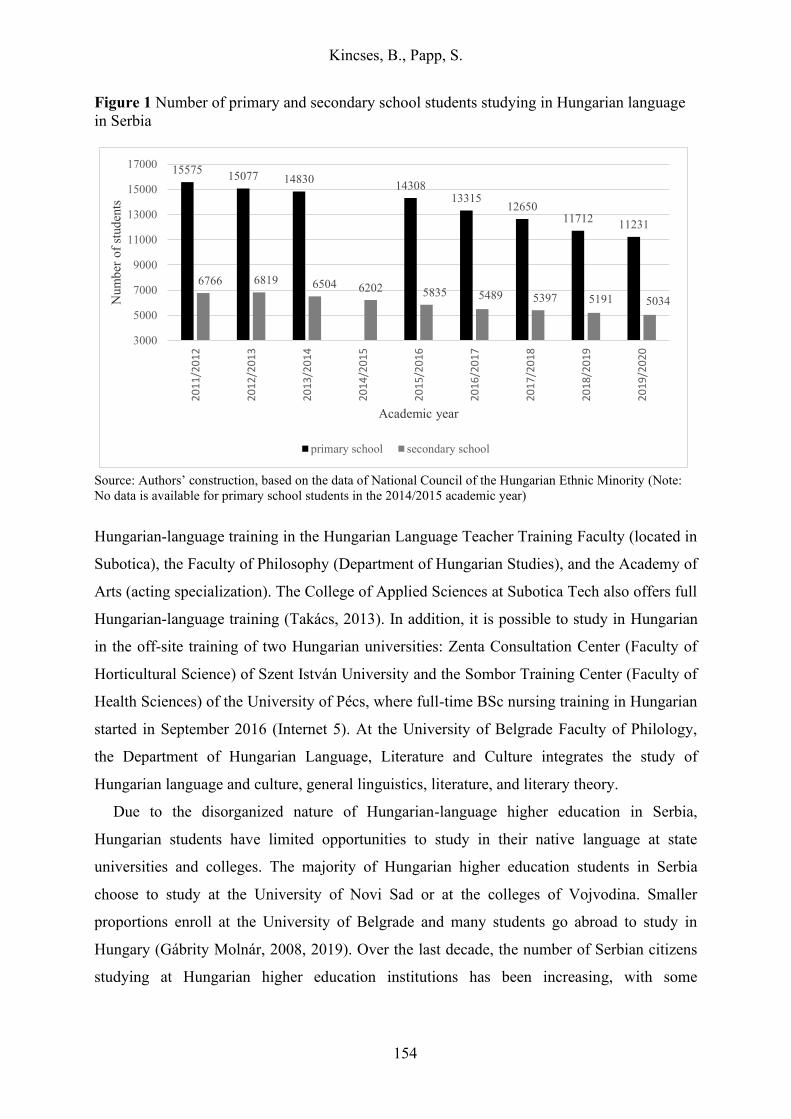
Kincses, B., Papp, S.
154
Figure 1 Number of primary and secondary school students studying in Hungarian language
in Serbia
1557515077 14830
1430813315
1265011712
11231
6766 6819 6504 6202 5835 5489 5397 5191 5034
3000
5000
7000
9000
11000
13000
15000
17000
20
11
/20
12
20
12
/20
13
20
13
/20
14
20
14
/20
15
20
15
/20
16
20
16
/20
17
20
17
/20
18
20
18
/20
19
20
19
/20
20
Num
ber
of
stud
ents
Academic year
primary school secondary school
Source: Authors’ construction, based on the data of National Council of the Hungarian Ethnic Minority (Note:
No data is available for primary school students in the 2014/2015 academic year)
Hungarian-language training in the Hungarian Language Teacher Training Faculty (located in
Subotica), the Faculty of Philosophy (Department of Hungarian Studies), and the Academy of
Arts (acting specialization). The College of Applied Sciences at Subotica Tech also offers full
Hungarian-language training (Takács, 2013). In addition, it is possible to study in Hungarian
in the off-site training of two Hungarian universities: Zenta Consultation Center (Faculty of
Horticultural Science) of Szent István University and the Sombor Training Center (Faculty of
Health Sciences) of the University of Pécs, where full-time BSc nursing training in Hungarian
started in September 2016 (Internet 5). At the University of Belgrade Faculty of Philology,
the Department of Hungarian Language, Literature and Culture integrates the study of
Hungarian language and culture, general linguistics, literature, and literary theory.
Due to the disorganized nature of Hungarian-language higher education in Serbia,
Hungarian students have limited opportunities to study in their native language at state
universities and colleges. The majority of Hungarian higher education students in Serbia
choose to study at the University of Novi Sad or at the colleges of Vojvodina. Smaller
proportions enroll at the University of Belgrade and many students go abroad to study in
Hungary (Gábrity Molnár, 2008, 2019). Over the last decade, the number of Serbian citizens
studying at Hungarian higher education institutions has been increasing, with some
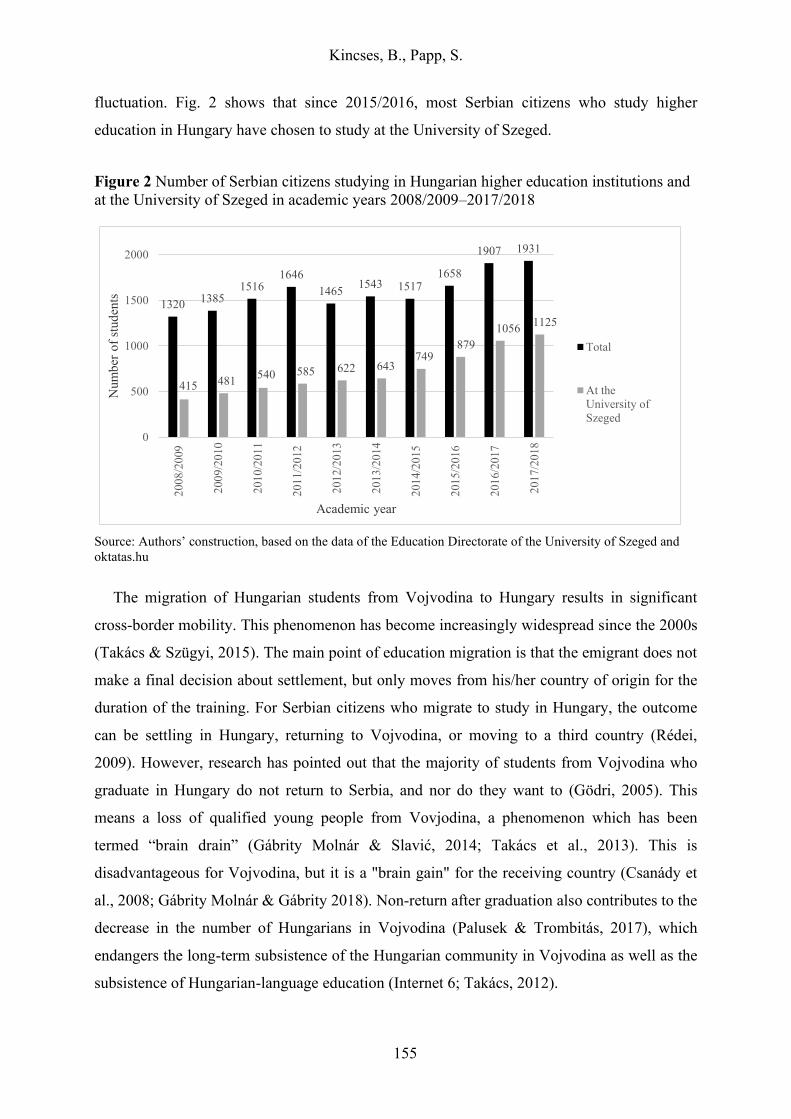
Kincses, B., Papp, S.
155
fluctuation. Fig. 2 shows that since 2015/2016, most Serbian citizens who study higher
education in Hungary have chosen to study at the University of Szeged.
Figure 2 Number of Serbian citizens studying in Hungarian higher education institutions and
at the University of Szeged in academic years 2008/2009–2017/2018
13201385
15161646
14651543 1517
1658
1907 1931
415 481540 585 622 643
749879
10561125
0
500
1000
1500
2000
200
8/2
009
200
9/2
010
201
0/2
011
201
1/2
012
201
2/2
013
201
3/2
014
201
4/2
015
201
5/2
016
201
6/2
017
201
7/2
018
Num
ber
of
stud
ents
Academic year
Total
At the
University of
Szeged
Source: Authors’ construction, based on the data of the Education Directorate of the University of Szeged and
oktatas.hu
The migration of Hungarian students from Vojvodina to Hungary results in significant
cross-border mobility. This phenomenon has become increasingly widespread since the 2000s
(Takács & Szügyi, 2015). The main point of education migration is that the emigrant does not
make a final decision about settlement, but only moves from his/her country of origin for the
duration of the training. For Serbian citizens who migrate to study in Hungary, the outcome
can be settling in Hungary, returning to Vojvodina, or moving to a third country (Rédei,
2009). However, research has pointed out that the majority of students from Vojvodina who
graduate in Hungary do not return to Serbia, and nor do they want to (Gödri, 2005). This
means a loss of qualified young people from Vovjodina, a phenomenon which has been
termed “brain drain” (Gábrity Molnár & Slavić, 2014; Takács et al., 2013). This is
disadvantageous for Vojvodina, but it is a "brain gain" for the receiving country (Csanády et
al., 2008; Gábrity Molnár & Gábrity 2018). Non-return after graduation also contributes to the
decrease in the number of Hungarians in Vojvodina (Palusek & Trombitás, 2017), which
endangers the long-term subsistence of the Hungarian community in Vojvodina as well as the
subsistence of Hungarian-language education (Internet 6; Takács, 2012).
Kincses, B., Papp, S.
156
MNT uses various methods to try to encourage further study in Serbia among Hungarian
students, as well as trying to encourage employment in Serbia for those who obtained their
higher education qualification abroad. For example, scholarships are available for young
people who undertake a degree at bachelor, master, or doctoral level in Serbia. Students can
apply for this scholarship if they have enrolled at any level of Serbian higher education, as
well as if they have been admitted to an accredited college or academic bachelor program in
Serbia. Further terms of the application stipulate that the applicant has completed his/her
primary and/or secondary education in Hungarian and declares that he/she will work in Serbia
for at least three years after graduation, preferably in a job corresponding to the obtained
qualification.
If somebody wants to naturalize their foreign diploma, the costs of naturalization are
refunded by MNT through tendering. The “Europe Dormitory” (Studentski dom “Evropa”) in
Novi Sad (MNT is a co-founder) offers (preferential) housing for Vojvodinian Hungarian
students studying at the University of Novi Sad. The student dormitory was founded to
support Vojvodinian Hungarian students’ academic advancement and thus contribute to
improving the general education level of the Hungarian national community living in the
Autonomous Province of Vojvodina. MNT also organizes Serbian-language preparation
courses for third-year high school students and students who are admitted to one of the
Serbian higher education institutions. In addition, information tours are organized for
secondary school students in connection with opportunities for further education in Serbia.
They also focus on the promotion of talented students (talent development) (Education
Development Strategy, 2016–2020).
In this study, we looked for answers to three main questions. The first question referred to
the intention to pursue higher education among Hungarian high school students in Vojvodina.
Secondly, among those who want to continue their studies, we examined whether they
intended to study in Serbia or elsewhere, and the arguments for and against studying in
Serbia. Thirdly, we enquired about students’ preferred institution for higher education and the
reasons that influenced their choice.
DATA AND METHODS
We collected quantitative and qualitative data to answer our research questions. From
February to May 2019, a questionnaire was administered to 442 students who were learning
in Hungarian at 11 secondary schools in Vojvodina (Tab. 1). Participating schools were
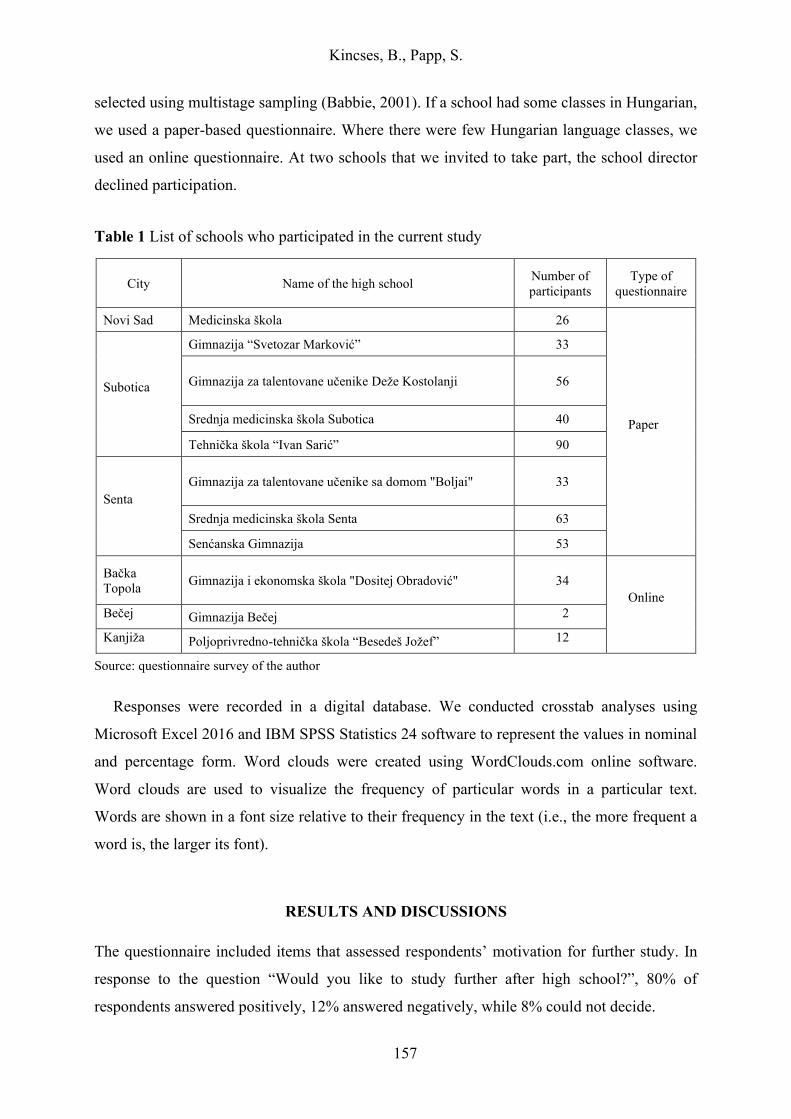
Kincses, B., Papp, S.
157
selected using multistage sampling (Babbie, 2001). If a school had some classes in Hungarian,
we used a paper-based questionnaire. Where there were few Hungarian language classes, we
used an online questionnaire. At two schools that we invited to take part, the school director
declined participation.
Table 1 List of schools who participated in the current study
City Name of the high school Number of
participants
Type of
questionnaire
Novi Sad Medicinska škola 26
Paper
Subotica
Gimnazija “Svetozar Marković” 33
Gimnazija za talentovane učenike Deže Kostolanji 56
Srednja medicinska škola Subotica 40
Tehnička škola “Ivan Sarić” 90
Senta
Gimnazija za talentovane učenike sa domom "Boljai" 33
Srednja medicinska škola Senta 63
Senćanska Gimnazija 53
Bačka
Topola Gimnazija i ekonomska škola "Dositej Obradović" 34
Online
Bečej Gimnazija Bečej 2
Kanjiža Poljoprivredno-tehnička škola “Besedeš Jožef” 12
Source: questionnaire survey of the author
Responses were recorded in a digital database. We conducted crosstab analyses using
Microsoft Excel 2016 and IBM SPSS Statistics 24 software to represent the values in nominal
and percentage form. Word clouds were created using WordClouds.com online software.
Word clouds are used to visualize the frequency of particular words in a particular text.
Words are shown in a font size relative to their frequency in the text (i.e., the more frequent a
word is, the larger its font).
RESULTS AND DISCUSSIONS
The questionnaire included items that assessed respondents’ motivation for further study. In
response to the question “Would you like to study further after high school?”, 80% of
respondents answered positively, 12% answered negatively, while 8% could not decide.
Kincses, B., Papp, S.
158
Only those respondents who said that they would like to study further after high school (n
= 354) were asked the remainder of the questions, which assessed where they would like to
continue their studies (both geographic location and specific institution) and what the pros
and cons for studying in Serbia are. In the questionnaire, we specified 28 reasons that may
have influenced respondents’ choice of higher education institution.
Intended location for further education
To find out where respondents intend to study after high school, we asked “Where would you
like to study further?” Slightly more than half (51%) of respondents said they intended to
study in the city of Szeged, 25% wanted to continue their studies in Serbia, 13% were
planning to study at one of the higher education institutions in Budapest, and 8% planned to
continue their studies elsewhere in Hungary (other than Budapest or Szeged). Therefore, 72%
of those who want to continue their studies are planning to study at one of the Hungarian
higher education institutions. The number of students who would like to study in another EU
country was negligible at 2%. Only five students could not decide where they would like to
continue their studies.
Respondents were also asked about which higher education institution they would to study
at. Most respondents picked more than one option. The University of Szeged was the most
popular choice (56%) for respondents who would like to study in Hungary, followed by
Eötvös Lorand University (Budapest) (6%), University of Pécs (5%), and Semmelweis
University (Budapest) (3%). Those who want to study in Serbia were mostly interested in the
University of Novi Sad (18%) and the Subotica Tech College of Applied Sciences (10%).
Pros and cons of studying in Serbia
We also asked the respondents about why they would like to study in Serbia and why they
would not like to study in Serbia. The answers to this open-ended question were inserted into
the word cloud generator.
Fig. 3 shows the word cloud generated for respondents’ reasons for wanting to undertake
further study in Serbia. The question was “Why do you want to study further in Serbia?” The
main arguments for further education in Serbia can be summarized as attachment to the home
country and subsequent career building opportunities. Some of the responses given were “I
was born here and belong to this ...”, “I would like to live my life here”, “I would like to work
at home after finishing high school”, and “My future is grounded here”. Their subsequent
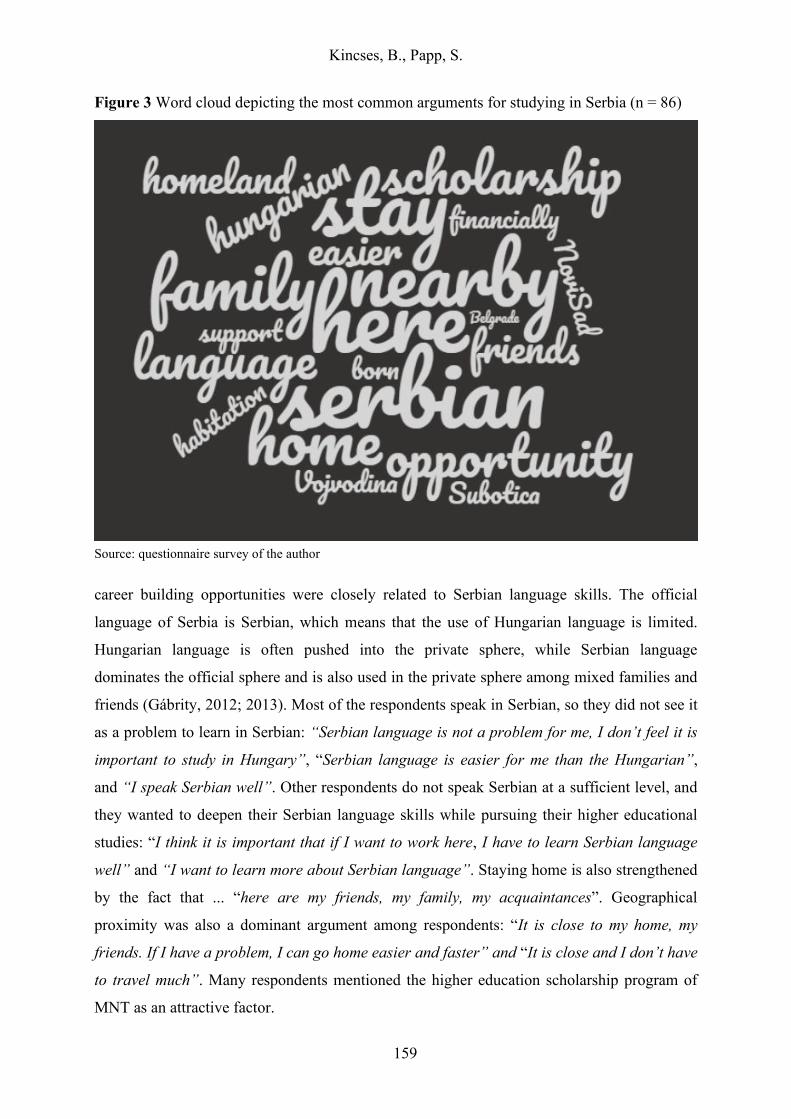
Kincses, B., Papp, S.
159
Figure 3 Word cloud depicting the most common arguments for studying in Serbia (n = 86)
Source: questionnaire survey of the author
career building opportunities were closely related to Serbian language skills. The official
language of Serbia is Serbian, which means that the use of Hungarian language is limited.
Hungarian language is often pushed into the private sphere, while Serbian language
dominates the official sphere and is also used in the private sphere among mixed families and
friends (Gábrity, 2012; 2013). Most of the respondents speak in Serbian, so they did not see it
as a problem to learn in Serbian: “Serbian language is not a problem for me, I don’t feel it is
important to study in Hungary”, “Serbian language is easier for me than the Hungarian”,
and “I speak Serbian well”. Other respondents do not speak Serbian at a sufficient level, and
they wanted to deepen their Serbian language skills while pursuing their higher educational
studies: “I think it is important that if I want to work here, I have to learn Serbian language
well” and “I want to learn more about Serbian language”. Staying home is also strengthened
by the fact that ... “here are my friends, my family, my acquaintances”. Geographical
proximity was also a dominant argument among respondents: “It is close to my home, my
friends. If I have a problem, I can go home easier and faster” and “It is close and I don’t have
to travel much”. Many respondents mentioned the higher education scholarship program of
MNT as an attractive factor.
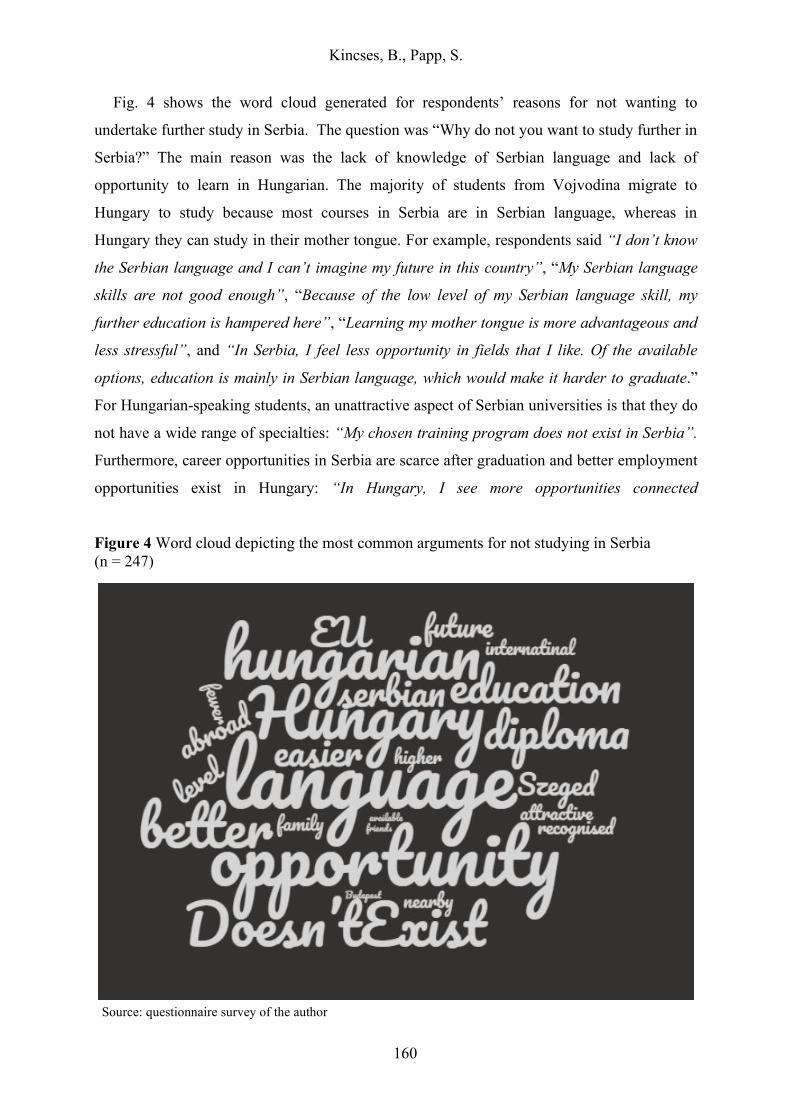
Kincses, B., Papp, S.
160
Fig. 4 shows the word cloud generated for respondents’ reasons for not wanting to
undertake further study in Serbia. The question was “Why do not you want to study further in
Serbia?” The main reason was the lack of knowledge of Serbian language and lack of
opportunity to learn in Hungarian. The majority of students from Vojvodina migrate to
Hungary to study because most courses in Serbia are in Serbian language, whereas in
Hungary they can study in their mother tongue. For example, respondents said “I don’t know
the Serbian language and I can’t imagine my future in this country”, “My Serbian language
skills are not good enough”, “Because of the low level of my Serbian language skill, my
further education is hampered here”, “Learning my mother tongue is more advantageous and
less stressful”, and “In Serbia, I feel less opportunity in fields that I like. Of the available
options, education is mainly in Serbian language, which would make it harder to graduate.”
For Hungarian-speaking students, an unattractive aspect of Serbian universities is that they do
not have a wide range of specialties: “My chosen training program does not exist in Serbia”.
Furthermore, career opportunities in Serbia are scarce after graduation and better employment
opportunities exist in Hungary: “In Hungary, I see more opportunities connected
Figure 4 Word cloud depicting the most common arguments for not studying in Serbia
(n = 247)
Source: questionnaire survey of the author
Kincses, B., Papp, S.
161
to my future”. The better marketability of the Hungarian diploma on the EU market was
another attractive factor: “Serbian diploma is not an EU diploma, so with it I would only be
able to find a job in Serbia”. Geographic proximity and internationally acknowledged
Hungarian universities appear to be other important reasons.
Examination of school choice motivations
To examine respondents’ motivations for their choice of higher education institution, we
collected 28 possible reasons identified in the literature (Bartha, 2014; Erőss et al., 2011;
Mirnics, 2001; Takács & Kincses, 2013; Takács, 2013; Váradi, 2013; Thelin–Niedomysl,
2015) that may have influenced their choice. We grouped these reasons into five topics: (1)
personal factors and family/friendships (five items), (2) education (nine items), (3) university
services, urban living, and lifestyle (seven items), (4) labor market situation and employment
opportunities (four items), and (5) geographic factors (three items). On a 4-point Likert scale,
respondents indicated how important each item was in their choice of institution: 1 = “Not at
all” to 4 = “Fully influenced me”. In addition, “Doesn’t apply to me”, “I don’t know” and “No
answer” were available as options. Table 2 and Table 3 illustrate the impact of these reasons
on respondents’ decision making.
First of all, we examined to what extent the reasons influenced respondents’ intention to
study inside or outside of Serbia. Firstly, the most important reason was linguistic
competence, namely the lack of knowledge of Serbian language and lack of opportunity to
learn in Hungarian. In terms of educational reasons (Tabl. 2), Hungarian-language education
at their preferred institution was a fully influencing reason for 42.4% of respondents, while
(the lack of) knowledge of Serbian language was considered “not at all” and “fully
influencing” by a roughly equal proportion of respondents (24.0% vs. 21.8%, respectively).
We further examined these two reasons by dividing respondents into two groups,
according to where they wanted to pursue higher educational studies: Serbia or Hungary. It is
notable that for that who want to study in Serbia, the lack of knowledge of Serbian language
was not affected their decision (25.8% doesn’t apply to them and 32.6% not at all affected).
This suggests that those who want to study in Serbia either do not have a problem with
learning in Serbian or that they found an adequate academic course that teaches in Hungarian
in Serbia. For those who planned to continue their studies in Hungary, lack of knowledge of
Serbian was a decisive reason (47.7%) in their choice of institution. For them, studying in
Hungarian language was considered much more important, with 49.9% saying this fully
Kincses, B., Papp, S.
162
influenced their decision, as in the case of those who want to study in Serbia (28.1% fully
influenced).
The next most important reasons influencing respondents’ choice of institution was the
quality of teaching and supply of training (Tabl. 2). Respondents indicated that “The chosen
training is not available in Serbia” was not a crucial reason. Responses to “In Serbia, the
quality of training is inadequate” indicate that this was both an influencing and non-
influencing reason. When we divided respondents into their preferred country (Serbia or
Hungary), those who want to study in Hungary indicated that inadequate quality of Serbian
training was an important reason for their choice (49 % either quite a bit or fully).
On the topic of labor market situation and employment opportunities, nearly one third of
respondents answered that their choice of institution was fully influenced by their belief that
they could find a job in the European Union labor market more easily (Tabl. 3). Respondents
based their choice on their belief that Hungary provided better labor market conditions after
graduation than Serbia (60.7 % either quite a bit or fully). It is an unattractive factor that the
career opportunities are limited in Serbia, which appeared as a significant influencing factor
among respondents. Almost half (48.0%) of respondents said that limited career opportunities
in Serbia influenced their choice either quite a bit or fully. Among only those students who
wanted to study in Hungary, this was a major reason for their choice (62.8 % either quite a bit
or fully). Serbian language skills are recognized in Hungary, but the importance of this reason
was small (26.8%). Geographic reasons did not play a very strong role in respondents’ choice
of institution (Tabl. 3).
On the subject of personal factors and family/friendships, 70.9% of respondents’ choice of
institution was fully influenced by self-interest. The presence of personal experiences (“e.g.,
attending open day or other university events”) was a determining reason for many
respondents (Tabl. 2).
Training program, good reputation, available scholarships (educational scholarship, social
assistance and other scholarships such as Erasmus), and excellent student results at their
chosen institution were all further influential reasons (Tabl. 2).
Although these were not mentioned as reasons for and against Serbian higher education in
the open-ended answers, the availability of dormitory spaces (55.4% either quite a bit or fully)
and university student discounts (50%) influenced respondents’ choices as well (Tabl. 3).
There were 11 respondents who indicated that their family has real estate in Hungary (mainly
a flat in Szeged) and this fully contributed to their decision. This is a big advantage for these
respondents, because housing costs in Hungary (property prices and rents) are currently high.
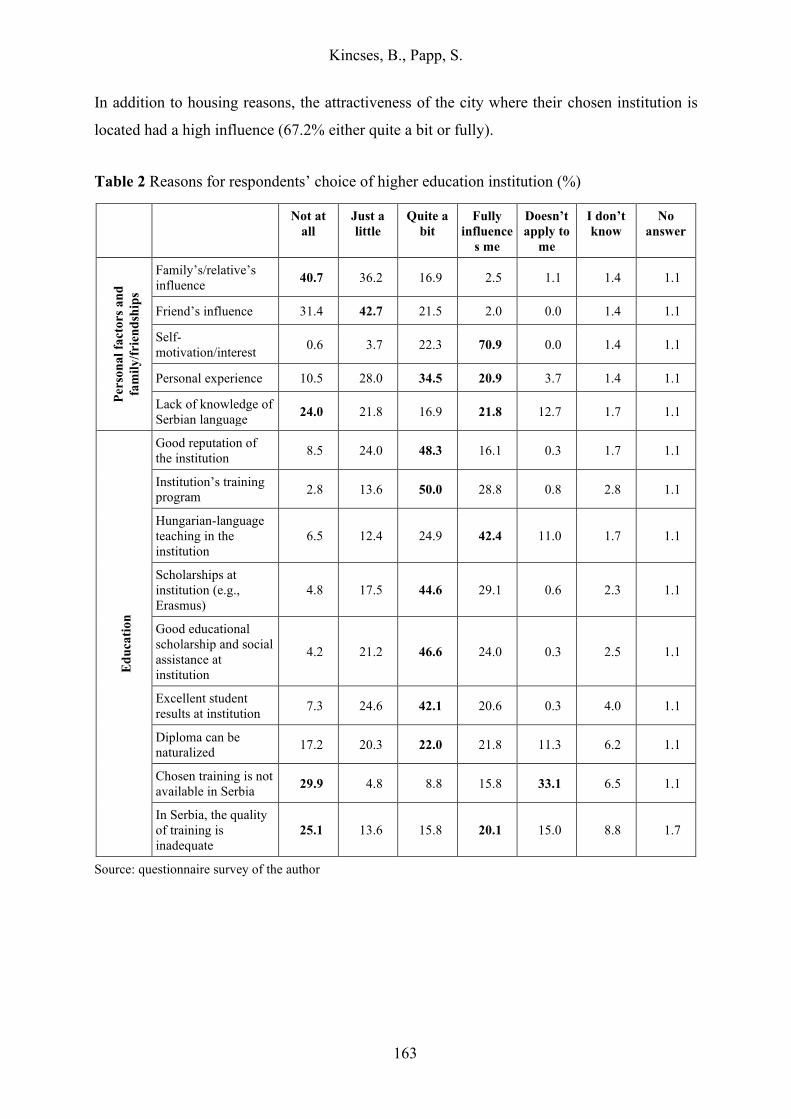
Kincses, B., Papp, S.
163
In addition to housing reasons, the attractiveness of the city where their chosen institution is
located had a high influence (67.2% either quite a bit or fully).
Table 2 Reasons for respondents’ choice of higher education institution (%)
Not at
all
Just a
little
Quite a
bit
Fully
influence
s me
Doesn’t
apply to
me
I don’t
know
No
answer
Per
son
al
fact
ors
an
d
fam
ily
/fri
end
ship
s
Family’s/relative’s
influence 40.7 36.2 16.9 2.5 1.1 1.4 1.1
Friend’s influence 31.4 42.7 21.5 2.0 0.0 1.4 1.1
Self-
motivation/interest 0.6 3.7 22.3 70.9 0.0 1.4 1.1
Personal experience 10.5 28.0 34.5 20.9 3.7 1.4 1.1
Lack of knowledge of
Serbian language 24.0 21.8 16.9 21.8 12.7 1.7 1.1
Ed
uca
tio
n
Good reputation of
the institution 8.5 24.0 48.3 16.1 0.3 1.7 1.1
Institution’s training
program 2.8 13.6 50.0 28.8 0.8 2.8 1.1
Hungarian-language
teaching in the
institution
6.5 12.4 24.9 42.4 11.0 1.7 1.1
Scholarships at
institution (e.g.,
Erasmus)
4.8 17.5 44.6 29.1 0.6 2.3 1.1
Good educational
scholarship and social
assistance at
institution
4.2 21.2 46.6 24.0 0.3 2.5 1.1
Excellent student
results at institution 7.3 24.6 42.1 20.6 0.3 4.0 1.1
Diploma can be
naturalized 17.2 20.3 22.0 21.8 11.3 6.2 1.1
Chosen training is not
available in Serbia 29.9 4.8 8.8 15.8 33.1 6.5 1.1
In Serbia, the quality
of training is
inadequate
25.1 13.6 15.8 20.1 15.0 8.8 1.7
Source: questionnaire survey of the author
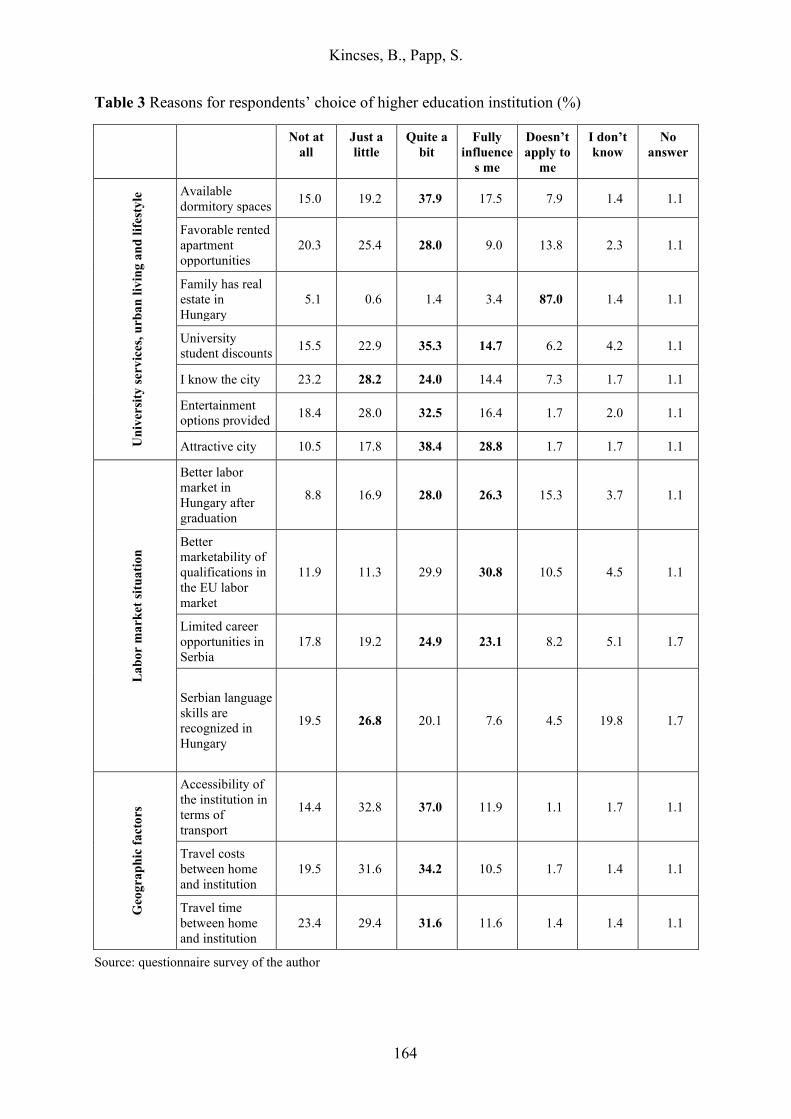
Kincses, B., Papp, S.
164
Table 3 Reasons for respondents’ choice of higher education institution (%)
Not at
all
Just a
little
Quite a
bit
Fully
influence
s me
Doesn’t
apply to
me
I don’t
know
No
answer
Un
iver
sity
serv
ices
, u
rba
n l
ivin
g a
nd
lif
est
yle
Available
dormitory spaces 15.0 19.2 37.9 17.5 7.9 1.4 1.1
Favorable rented
apartment
opportunities
20.3 25.4 28.0 9.0 13.8 2.3 1.1
Family has real
estate in
Hungary
5.1 0.6 1.4 3.4 87.0 1.4 1.1
University
student discounts 15.5 22.9 35.3 14.7 6.2 4.2 1.1
I know the city 23.2 28.2 24.0 14.4 7.3 1.7 1.1
Entertainment
options provided 18.4 28.0 32.5 16.4 1.7 2.0 1.1
Attractive city 10.5 17.8 38.4 28.8 1.7 1.7 1.1
La
bo
r m
ark
et s
itu
ati
on
Better labor
market in
Hungary after
graduation
8.8 16.9 28.0 26.3 15.3 3.7 1.1
Better
marketability of
qualifications in
the EU labor
market
11.9 11.3 29.9 30.8 10.5 4.5 1.1
Limited career
opportunities in
Serbia
17.8 19.2 24.9 23.1 8.2 5.1 1.7
Serbian language
skills are
recognized in
Hungary
19.5 26.8 20.1 7.6 4.5 19.8 1.7
Geo
gra
ph
ic f
act
ors
Accessibility of
the institution in
terms of
transport
14.4 32.8 37.0 11.9 1.1 1.7 1.1
Travel costs
between home
and institution
19.5 31.6 34.2 10.5 1.7 1.4 1.1
Travel time
between home
and institution
23.4 29.4 31.6 11.6 1.4 1.4 1.1
Source: questionnaire survey of the author
Kincses, B., Papp, S.
165
CONCLUSION
In this study, we surveyed Hungarian students studying in Serbian high schools in Vojvodina
to find out about their intention to pursue higher education, their reasons for and against
higher education in Serbia, and the reasons influencing their preferred higher education
institution. As the migration of Vojvodinian Hungarian to Hungary for study purposes has
been a complex problem for decades, its solution was not one of the aims of the article. By
using the data and drawing conclusions from it, we hope we can get closer to understanding
the problem.
Based on the results of our research, we can conclude that higher education in Hungary is
more promising for Serbian Hungarians in the long run. Due to Hungary's EU membership,
the degree obtained in Hungary is more competitive than the one obtained in Serbia. In
addition, the proximity to the boundary, better livelihood opportunities, learning in Hungarian
language, and the University of Szeged as a reputable university with a wide range of
training, are also crucial aspects. Regardless of these attractive factors, the outcome of the
process after the completion of the studies in Hungary is not one-way. Our further interview
research results among Vojvodinian Hungarian students already studying at University of
Szeged show that in many cases the outcome of studying in Hungary is not necessarily
settling in Hungary. Many students choose to go abroad and returning to Serbia is less
common.
MNT tries to encourage further study in Serbia in many ways, at the same time, the
Makovecz Program, launched by the Ministry of Human Capacities (Hungary), also provides
an opportunity for part-time training in Hungary for transborder Hungarian students who take
part in the Hungarian teaching training at one of the higher education institutions of the
neighboring countries. In the territory of Vojvodina, the University of Novi Sad (primarily its
Hungarian Language Teacher Training Faculty in Subotica) and the College of Applied
Sciences at Subotica Tech are member institutions. In addition, Serbia as a partner country of
the Stipendium Hungaricum Programme (established by the Hungarian government), students
from Serbia are able to study in Hungary and earn a full bachelor, master or doctoral degree.
The future of young Hungarians in Vojvodina is highly dependent on the development of
economic and social processes in the region and throughout Serbia.
Kincses, B., Papp, S.
166
REFERENCES
Babbie, E. (2001). A társadalomtudományi kutatás gyakorlata. Budapest: Balassi Kiadó.
Bartha, Zs. (2014). Az iskolaválasztás motivációs hátterének vizsgálata Erdélyben,
hangsúlyosan szórványban. Magyar Kisebbség: Nemzetpolitikai Szemle, 19(2), 60–84.
Bodó, B., Balogh, B., & Ilyés, Z. (2007). Előszó. In Balogh, B., Bodó, B., & Ilyés, Z. (Eds.),
Regionális identitás, közösségépítés, szórványgondozás (pp. 7–12). Budapest: Lucidus
Kiadó.
Csanády, M. T., Kmetty, Z., Kucsera, T. G., Személyi, L., & Tarján, G. (2008). A magyar
képzett migráció a rendszerváltás óta [Hungarian skilled migration since the change of
regime]. Magyar Tudomány, 169(5), 603–616.
Erőss, Á., Filep, B., Rácz, K., Tátrai, P., Váradi, M. M., & Doris, W. W. (2011). Tanulmányi
célú migráció, migráns élethelyzetek: vajdasági diákok Magyarországon. Tér és
Társadalom, 25(4), 3–19. https://doi.org/10.17649/TET.25.4.1936
Gábrity, E. (2012). The intertwining of linguistic identity and ideology among Hungarian
minority commuters from Vojvodina to Hungary. Jezikoslovlje, 13(2), 625–643.
Gábrity, E. (2013). A vajdasági magyar ingázók nyelvi identitása és ideológiái. Tér és
Társadalom, 27(2), 118–130. https://doi.org/10.17649/TET.27.2.2522
Gábrity-Molnár, I. (2008). Oktatásunk látlelete. Újvidék: Fórum Könyvkiadó.
Gábrity-Molnár, I., & Slavić, A. (2014). The impact of emigration from Serbia to Hungary on
the human resources of Vojvodina. Zbornik Matice srpske za drustvene nauke, 2014
(148), 571–581. https://doi.org/10.2298/ZMSDN1448571G
Gábrity-Molnár I., & Gábrity, E. (2018). Migration and language use of experts and educated
population in the cross-border region of Hungary and Serbia. In Borsos, É., Horák, R.,
& Námesztovszki, Zs. (Eds.), Magyar Tannyelvű Tanítóképző Kar Konferenciáinak
Tanulmánygyűjteménye (pp.75–82.). Szabadka: Újvidéki Egyetem, Magyar Tannyelvű
Tanítóképző Kar.
Gábrity-Molnár, I. (2018). A pályaorientáció útvesztői. In Pusztai, G., & Szigeti, F. (Eds.),
Lemorzsolódás és perzisztencia a felsőoktatásban. Oktatáskutatás a 21. században. (pp.
91–106). Debreceni Egyetemi Kiadó/Debrecen University Press.
Gábrity-Molnár, I. (2019). A vajdasági magyar fiatalok társadalmi kilátásai (közérzetmérleg).
In Bali, J., Kovács, T., & Molnár, G. (Eds.), Fiatalok a Kárpát-medencében a 21.
század elején, Nemzetstratégiai Kutatóintézet és a PTE BTK 2018. október 26–27-én
megrendezett II. Doktorandusz Konferenciájának előadásait összefoglaló
tanulmánykötet (pp. 100–113). Budapest: Nemzetstratégiai Kutatóintézet.
Gödri, I. (2005). A bevándorlók migrációs céljai, motivációi és ezek makro- es
mikrostrukturális háttere. In Gödri, I., & Tóth, P. P. (Eds.), Bevándorlás és beilleszkedés
(pp. 69–131). Budapest: KSH Népességtudományi Kutatóintézet.
Göncz, L. (2006). Oktatásunk jövője. In Gábrity-Molnár, I., & Mirnics Zs. (Eds.), Oktatási
oknyomozó. Vajdasági kutatások, tanulmányok (pp. 125–140). Szabadka:
Magyarságkutató Tudományos Társaság.
Goran, B. (2015). Impact of education in minority languages on the internal and external
migrations of national minorities. (Introducing Migration in National Development
Strategies). Belgrade: Swiss Agency for Development and Cooperation, International
Organization for Migration and the United Nations Development Programme
Kapitány, B. (2015). Ethnic Hungarians in the neighbouring countries. In Monostori, J., Őri,
P., & Spéder, Zs. (Eds.), Demographic Portrait of Hungary 2015 (pp. 225–239).
Budapest.
M. Császár, Zs., & Mérei, A. (2012). Ethnic-homogenization processes in the most developed
region of Serbia, the multiethnical Vojvodina. Historia Actual Online, 27, 117–128.
Kincses, B., Papp, S.
167
M. Császár, Zs. (2011). The practice of Minority Education Policy in the Balkans. Revista De
Historia Actual, 9(9), 125–130.
Meszmann, T. (2001). A vajdasági magyar tanügy helyzetéről. Iskolakultúra, 11(2), 7–83.
Mikuska, É., & Raffai, J. (2018). Early childhood education and care for the Hungarian
national minority in Vojvodina, Serbia. Early Years. An International Research
Journal, 38(4), 378–395. https://doi.org/10.1080/09575146.2018.1479682
Mirnics, Zs. (2001). Hazától hazáig. A Vajdaságba és Magyarországon tanuló vajdasági
magyar egyetemi hallgatók életkilátásai és migrációs szándékai. In Gábrity-Molnár, I.,
& Mirnics, Zs. (Eds.), Fészekhagyó vajdaságiak (pp. 163–204). Szabadka:
Magyarságkutató Tudományos Társaság.
Molnár, Cs. L. (1989). A magyar nyelv helyzete Jugoszláviában. Magyar Nyelvőr, 113(2),
162–175.
National Council of the Hungarian Ethnic Minority. Education Development Strategy 2016–
2020. pp. 68.
National Council of the Hungarian Ethnic Minority. Vojvodinian Hungarian Cultural Strategy
2012–2018. pp. 244.
Palusek, E., & Trombitás, T. (2017). Vajdaság demográfiai és migrációs jellemzői. In
Ördögh, T. (Ed.), Vajdaság I.: Vajdaság társadalmi és gazdasági jellemzői (pp. 41–72).
Szabadka: Vajdasági Magyar Doktoranduszok és Kutatók Szervezete.
Rác, L. (2008). A szerbiai oktatási rendszer finanszírozása és néhány kisebbségi vonatkozása.
Regio: kisebbség, politika, társadalom, 19(2), 188–209.
Rédei, M. (2009). A tanulmányi célú mozgás. Budapest: Reg-Info Kft.
Šabić, N. (2018). A Szerbiában élő nemzeti kisebbségek oktatáspolitikai jellemzői. In
Ördögh, T. (Ed.), Vajdaság II.: Variációk autonómiára (pp. 105–129). Szabadka:
Vajdasági Magyar Doktoranduszok és Kutatók Szervezete.
Stojšin, S. (2015). Ethnic Diversity of Population in Vojvodina at the Beginning of the 21st
Century. European Quarterly of Political Attitudes and Mentalities, 4(2), 25-37.
Szügy, É. (2012). Iskolaválasztás a Délvidéken. Kisebbségkutatás, 21(3), 514-535
Takács, Z., & Kincses, Á. (2013). Vajdasági hallgatók Magyarországon. Területi Statisztika,
53(3), 253–270.
Takács, Z., & Szügyi, É. (2015). Student mobility or migration flow? The case of students
commuting from Serbia to Hungary. The Central European Journal of Regional
Development and Tourism, 7(1), 120–136.
Takács, Z. (2008). A munkaerő-kompetencia és az oktatás viszonya. In Gábrity-Molnár, I., &
Mirnics Zs. (Eds.), Regionális erőnlét. A humánerőforrás befolyása Vajdaságban (pp.
267–293). Szabadka: Magyarságkutató Tudományos Társaság.
Takács, Z. (2012). Regionális és határon átívelő felsőoktatási intézménykapcsolatok Észak-
Vajdaságban. Educatio 21 (1), 104–122.
Takács, Z. (2013). Felsőoktatási határ/helyzetek. Szabadka: Magyarságkutató Tudományos
Társaság.
Takács, Z., Tátrai, P., & Erőss, Á. (2013). A Vajdaságból Magyarországra irányuló
tanulmányi célú migráció. Tér és Társadalom, 27(2), 77–95.
https://doi.org/10.17649/TET.27.2.2530
Thelin, M., & Niedomysl, T. (2015). The (ir)relevance of geography for school choice:
Evidence from a Swedish choice experiment. Geoforum, 67, 110–120.
https://doi.org/10.1016/j.geoforum.2015.11.003
Váradi, M. M. (2013). Migrációs történetek, döntések és narratív identitás. A tanulmányi célú
migrációról–másként. Tér és Társadalom, 27(2), 96–117.
https://doi.org/10.17649/TET.27.2.2520
Kincses, B., Papp, S.
168
Internet references
Internet 1: Municipalities and Regions of the Republic of Serbia, (2012). Statistical Office of
the Republic of Serbia https://publikacije.stat.gov.rs/G2012/PdfE/G20122008.pdf
(14.01.2020)
Internet 2: Zakon o zaštiti prava i sloboda nacionalnih manjina
http://www.mnt.org.rs/kozerdeku-informaciok/jogszabalyok-magyarul (22.01.2020)
Internet 3: Zakon o srednjem obrazovanju i vaspitanju http://www.mnt.org.rs/kozerdeku-
informaciok/jogszabalyok-magyarul (28.01.2020)
Internet 4: Statute of the Autonomous Province of Vojvodina (2014) Section 27
https://www.skupstinavojvodine.gov.rs/Strana.aspx?s=statut&j=HU (22.01.2020)
Internet 5: https://felveteli.pte.hu/cimkek/zombor (24.01.2020.)
Internet 6: IDKM (2010). Migrációs szándék a vajdasági magyar egyetemisták körében
[Intention of migration among Vojvodinian Hungarian university students]
http://www.idkm.org/tanulmanyok/Migracios_szandek1.pdf (22.01.2020)