Visualization of Team Skills in Project-Based Learning
8
Visualization of Team Skills in Project-Based Learning Kazuo Misue University of Tsukuba 1-1-1 Tennoudai, Tsukuba 305-8573, Japan [email protected] ABSTRACT In order to improve the effects of project-based learning (PBL), the author developed a visual tool that supports team organization by visually representing the personal skills data of team members. In a PBL activity performed by student teams, the organization of the teams gives rise to unexpected variations in level of learning. However, organizing appropriate teams is not so easy. The tool developed by the author visualizes the skills data of persons and teams in several representations. It makes it easy to identify the features of teams and their members, and helps eliminate trial- and-error in the process of organizing teams. The author also evaluated the adequateness of past team organization by using actual skills data. KEYWORDS Information visualization, mosaic plot, project-based learning, software development team, personal skills data. 1 INTRODUCTION In project-based learning (PBL), students are organized into teams and each team member deals with a subject independently. In this study, we focus on supporting team organization in PBL. The main tasks performed in this PBL involve software development. A team in an enterprise should be organized according to the mission of the team, while taking into account the aptitude of members. On the other hand, in PBL, we should take into account the learning aspect. Organization of the teams gives rise to variations in level of learning. Hence, the organization of appropriate teams is an important subject. While organizing teams, we need to consider certain requirements. Every student must belong to a team. The difference in skill levels between the teams must not be too pronounced. It is expected that members with differing personal characteristics constitute a team. The department (Department of Computer Science) that the author belongs to has the Advanced IT program 1 where the contents of the program focus on software development techniques. A PBL-type course, Research and Development Project, is one of the most important courses in the program. In this course, students are required to organize themselves into teams. Many students did not sufficiently consider the skill differences between teams and the diversity of personal characteristics in each team. Consequently, students who could not voluntarily join a team were grouped into powerless teams. The teaching staff organized teams by taking into account students' preferences. However, they did not have clear indices for judging whether the team groupings were good or bad. The evaluation of the team organization could be performed only after the end of the course. The purpose of our study is to support the organization of software development teams. We aim to give useful advice by using quantitative data. In addition, we make use of personal data for IT skills as reference data for organizing teams. We do this by means of a visual tool that displays the personal skills data that can be used for organizing teams. 1 Practical Software Development Master Program for Fostering Advanced IT Professionals ISBN: 978-0-9891305-1-6 ©2013 SDIWC 8
-
Upload
independent -
Category
Documents
-
view
0 -
download
0
Transcript of Visualization of Team Skills in Project-Based Learning
Visualization of Team Skills in Project-Based Learning
Kazuo Misue University of Tsukuba
1-1-1 Tennoudai, Tsukuba 305-8573, Japan [email protected]
ABSTRACT In order to improve the effects of project-based learning (PBL), the author developed a visual tool that supports team organization by visually representing the personal skills data of team members. In a PBL activity performed by student teams, the organization of the teams gives rise to unexpected variations in level of learning. However, organizing appropriate teams is not so easy. The tool developed by the author visualizes the skills data of persons and teams in several representations. It makes it easy to identify the features of teams and their members, and helps eliminate trial-and-error in the process of organizing teams. The author also evaluated the adequateness of past team organization by using actual skills data. KEYWORDS Information visualization, mosaic plot, project-based learning, software development team, personal skills data. 1 INTRODUCTION In project-based learning (PBL), students are organized into teams and each team member deals with a subject independently. In this study, we focus on supporting team organization in PBL. The main tasks performed in this PBL involve software development. A team in an enterprise should be organized according to the mission of the team, while taking into account the aptitude of members. On the other hand, in PBL, we should take into account the learning aspect. Organization of the teams gives rise to variations in level of learning. Hence, the organization of appropriate teams is an important subject. While organizing teams, we need to consider certain requirements. Every student must
belong to a team. The difference in skill levels between the teams must not be too pronounced. It is expected that members with differing personal characteristics constitute a team. The department (Department of Computer Science) that the author belongs to has the Advanced IT program1 where the contents of the program focus on software development techniques. A PBL-type course, Research and Development Project, is one of the most important courses in the program. In this course, students are required to organize themselves into teams. Many students did not sufficiently consider the skill differences between teams and the diversity of personal characteristics in each team. Consequently, students who could not voluntarily join a team were grouped into powerless teams. The teaching staff organized teams by taking into account students' preferences. However, they did not have clear indices for judging whether the team groupings were good or bad. The evaluation of the team organization could be performed only after the end of the course. The purpose of our study is to support the organization of software development teams. We aim to give useful advice by using quantitative data. In addition, we make use of personal data for IT skills as reference data for organizing teams. We do this by means of a visual tool that displays the personal skills data that can be used for organizing teams. 1 Practical Software Development Master Program for Fostering Advanced IT Professionals
ISBN: 978-0-9891305-1-6 ©2013 SDIWC 8
2 RELATED WORK While team organization considerably affects the performance and output of teams, to our knowledge, there are few visual tools or approaches to support or evaluate team organization. Pham et al. proposed a visual representation that visualizes demographic faultlines in a team [1]. Our proposal is to visualize the capabilities of members in order to give advice on team organization. We assume that the capabilities of a person are expressed as multivariate quantitative data. There are many visual representations for multivariate quantitative data. Well-known fundamental techniques are parallel coordinates plot (PCP) [2], scatter plot matrix (SPLOM) [3], and so on. These techniques have been extended to form several variations [4, 5]. Mosaic Plot [6] and Mosaic Matrix [7] are also visual representations of multivariate data. While these visual representations were originally developed for categorical data, Colored Mosaic Matrix [8] (which is an extension of the fundamental techniques) is proposed for high-dimensional quantitative data. The capability of a team is regarded as the summation of members' capabilities. PCP and SPLOM are not good at representing summation of values. We should use stacked bar charts and stacked area charts to express such data. A stacked area chart and its variations are suitable for time-series multivariate data [9, 10]. A stacked bar chart can be used for expressing an item (record) of multivariate data or items of univariate data. A mosaic plot for multivariate categorical data is an extension of a stacked bar chart, and can be used to represent quantitative data by some mechanism. 3 REQUIREMENTS The purpose of the tool is to support team organization. It is necessary to consider various factors while organizing teams. However, so far, it is not clear what we should take into consideration.
3.1 IT Skills Data The personal skills data that we use in this study is self-assessment data of skill levels for IT-related subjects, especially in information systems and software development. In the Advanced IT program, skill tests have been conducted every year since the start of the program. The skills data so obtained has been used to observe discrepancies in skill levels of students and yearly progress of overall skills. However, it has never been used for the organization of teams. Another purpose of this study is to evaluate the availability of skills data for the organization of teams. 3.2 Requirements for Visual Representations A suitable representation of the skills data is necessary to utilize them for organizing teams. We propose a visual representation that will be valuable as a reference for organizing teams. This representation will enable us to identify the characteristics of each person and each team. We state the requirements in order as follows: • We should be able to identify the ability and
comprehensive power of each person. We should also be able to identify the subjects that they are strong or weak in.
• We should be able to make a comparison of the personal skills of different team members. A comparison of comprehensive power as well as proficiency in each subject is required.
• We should be able to identify the capabilities of teams. We should also be able to discern comprehensive power and the subjects that the team is strong or weak in, as well as its members’ personal characteristics.
• We should be able to compare the ability and comprehensive power of teams.
3.3 Requirements for the Tool The tool being developed is required to display visual representations satisfying the above-mentioned requirements, and to offer some mechanism to manipulate these visual representations. The tool will most probably be
ISBN: 978-0-9891305-1-6 ©2013 SDIWC 9
used at the stage when the teams have not been determined yet. Thus, it is desired to enable the users to organize teams using the tool while simultaneously displaying the characteristics of members and teams. 4 DESIGN OF VISUAL REPRESENTATION We have examined several visual representations to identify the characteristics of persons and teams. 4.1 Target Data Our target data is the skills data, which is multivariate. This data consists of variables corresponding to different subjects, for example, “digitization of information,” “computer hardware,” “computer software,” and so on. Each variable has a score. The data in the field of fundamental information technologies has 36 variables. There is additional data for core skills (24 variables) and personal characteristics (7 variables). Every variable has a quantitative value. The range of values is between 0 and 5 in the field of fundamental information technologies, and is between 0 and 100 in other fields. An entity, i.e., a student, possesses multivariate data of the kind mentioned above. There are about 20 to 40 students in a class. Skill tests have been conducted every year to observe the yearly progress of students in the Advanced IT program. However, we do not consider time-series data in this study. To summarize, the target data is a collection of entities. The number of entities (students) is about 20 to 40. Each entity has multivariate data (7 to 36 variables). Each variable has a quantitative value (positive value). 4.2 Representation of Personal Data Personal data is multivariate in nature. One of the basic methods to represent such data is a bar chart. Bars are aligned on a line, and the length of each bar expresses a positive value. For comparison of two or more personal data items, the alignment of the bars and their orientation should be arranged
suitably. For comparison of comprehensive power, the sum of the values of the multivariate data should be calculated. This can be done by means of a stacked bar chart. 4.3 Representation of Team Data Since a team is a set of persons, one naive way to represent team data is to enclose the representations of members' data with a rectangle. To measure the capability of a team with regard to each subject, the sum of the values for each subject should be presented. One way to do this is by using a stacked bar for each subject. To measure the comprehensive power of a team, the overall sum should be displayed. We use a mosaic plot for this purpose. 4.4 Mosaic Plot Mosaic plot (or mosaic display) is a visualization method for multivariate categorical data[11, Section 4]. This was proposed by Hartigan and Kleiner and further extended by Friendly. We can view a mosaic plot as an extension of a bar chart in order to represent ratios. It is extended in two dimensions and recursively. In a bar chart that represents ratios of univariate data, a bar is divided into sub bars with the lengths equal to that of the corresponding ratios (see Fig. 1(a), 1(b)). In the mosaic plot, each divided bar is further divided according to the ratios of second-level variables (see Fig. 1(c)). The directions of divided bars are alternatively orthogonal. When there are third or fourth variables, each divided bar is further divided recursively in a similar fashion. In principle, a mosaic plot can express multiple dimensions. However, computer displays with limited resolutions cannot show many variates. Furthermore, the corresponding values and rectangular areas are indistinct when the number of variates is more. In practice, the number of variables is limited to about four or five.
ISBN: 978-0-9891305-1-6 ©2013 SDIWC 10
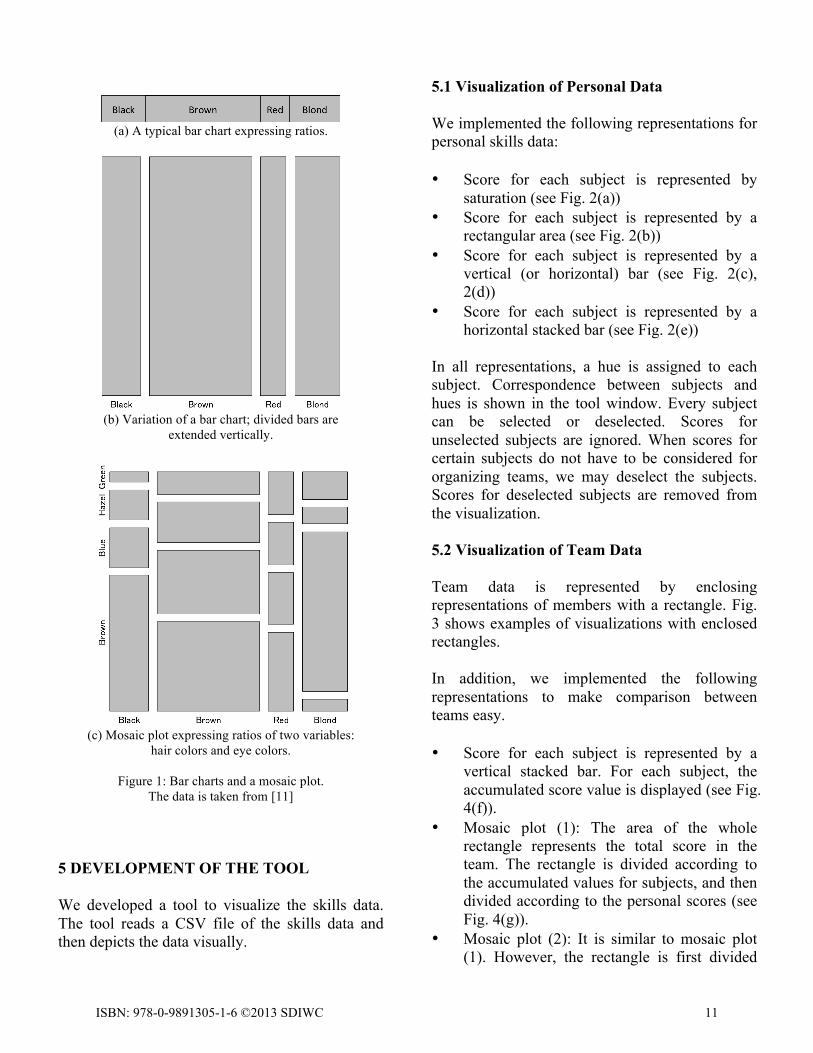
(a) A typical bar chart expressing ratios.
(b) Variation of a bar chart; divided bars are
extended vertically.
(c) Mosaic plot expressing ratios of two variables:
hair colors and eye colors.
Figure 1: Bar charts and a mosaic plot. The data is taken from [11]
5 DEVELOPMENT OF THE TOOL We developed a tool to visualize the skills data. The tool reads a CSV file of the skills data and then depicts the data visually.
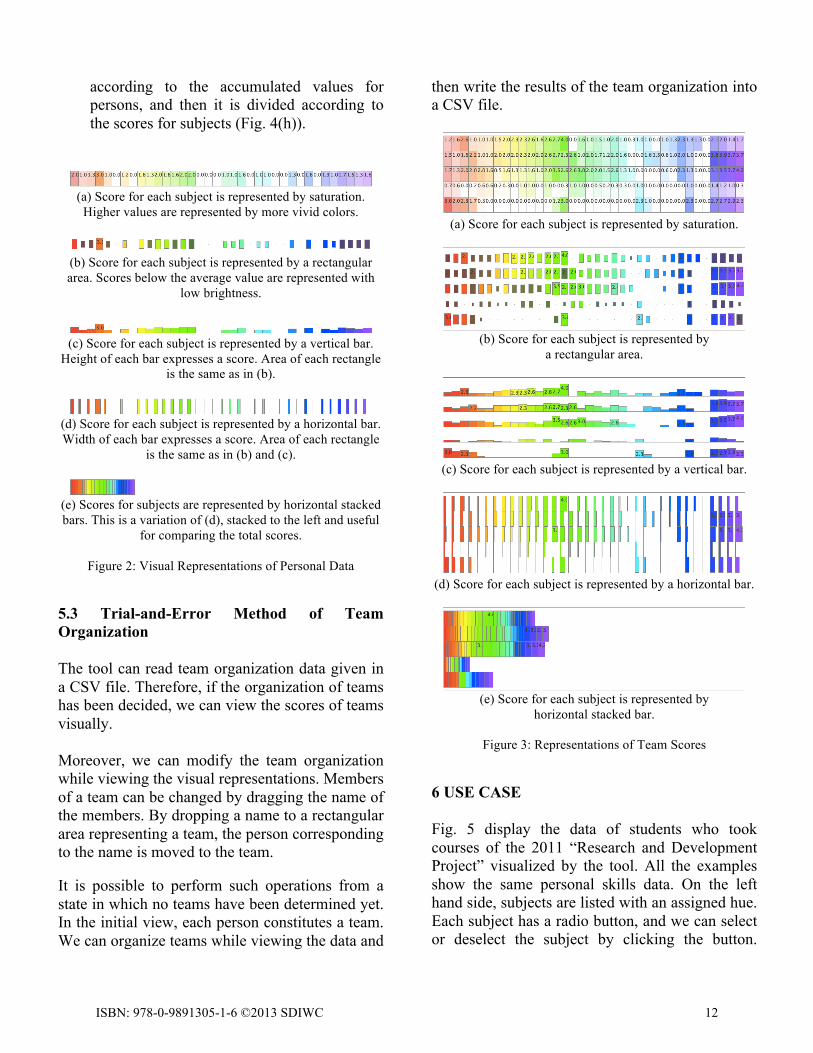
5.1 Visualization of Personal Data We implemented the following representations for personal skills data: • Score for each subject is represented by
saturation (see Fig. 2(a)) • Score for each subject is represented by a
rectangular area (see Fig. 2(b)) • Score for each subject is represented by a
vertical (or horizontal) bar (see Fig. 2(c), 2(d))
• Score for each subject is represented by a horizontal stacked bar (see Fig. 2(e))
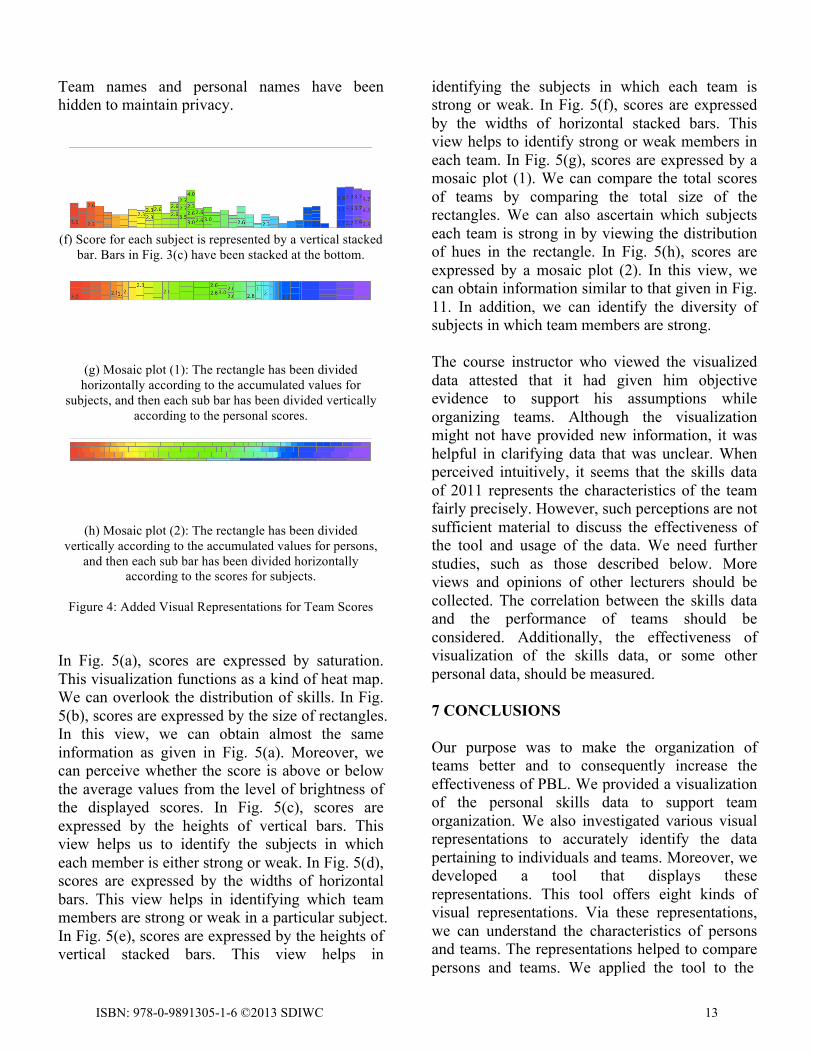
In all representations, a hue is assigned to each subject. Correspondence between subjects and hues is shown in the tool window. Every subject can be selected or deselected. Scores for unselected subjects are ignored. When scores for certain subjects do not have to be considered for organizing teams, we may deselect the subjects. Scores for deselected subjects are removed from the visualization. 5.2 Visualization of Team Data Team data is represented by enclosing representations of members with a rectangle. Fig. 3 shows examples of visualizations with enclosed rectangles. In addition, we implemented the following representations to make comparison between teams easy. • Score for each subject is represented by a
vertical stacked bar. For each subject, the accumulated score value is displayed (see Fig. 4(f)).
• Mosaic plot (1): The area of the whole rectangle represents the total score in the team. The rectangle is divided according to the accumulated values for subjects, and then divided according to the personal scores (see Fig. 4(g)).
• Mosaic plot (2): It is similar to mosaic plot (1). However, the rectangle is first divided
ISBN: 978-0-9891305-1-6 ©2013 SDIWC 11
according to the accumulated values for persons, and then it is divided according to the scores for subjects (Fig. 4(h)).
(a) Score for each subject is represented by saturation. Higher values are represented by more vivid colors.
(b) Score for each subject is represented by a rectangular area. Scores below the average value are represented with
low brightness.
(c) Score for each subject is represented by a vertical bar.
Height of each bar expresses a score. Area of each rectangle is the same as in (b).
(d) Score for each subject is represented by a horizontal bar. Width of each bar expresses a score. Area of each rectangle
is the same as in (b) and (c).
(e) Scores for subjects are represented by horizontal stacked bars. This is a variation of (d), stacked to the left and useful
for comparing the total scores.
Figure 2: Visual Representations of Personal Data
5.3 Trial-and-Error Method of Team Organization The tool can read team organization data given in a CSV file. Therefore, if the organization of teams has been decided, we can view the scores of teams visually. Moreover, we can modify the team organization while viewing the visual representations. Members of a team can be changed by dragging the name of the members. By dropping a name to a rectangular area representing a team, the person corresponding to the name is moved to the team. It is possible to perform such operations from a state in which no teams have been determined yet. In the initial view, each person constitutes a team. We can organize teams while viewing the data and
then write the results of the team organization into a CSV file.
(a) Score for each subject is represented by saturation.
(b) Score for each subject is represented by
a rectangular area.
(c) Score for each subject is represented by a vertical bar.
(d) Score for each subject is represented by a horizontal bar.
(e) Score for each subject is represented by
horizontal stacked bar.
Figure 3: Representations of Team Scores
6 USE CASE Fig. 5 display the data of students who took courses of the 2011 “Research and Development Project” visualized by the tool. All the examples show the same personal skills data. On the left hand side, subjects are listed with an assigned hue. Each subject has a radio button, and we can select or deselect the subject by clicking the button.
ISBN: 978-0-9891305-1-6 ©2013 SDIWC 12
Team names and personal names have been hidden to maintain privacy.
(f) Score for each subject is represented by a vertical stacked
bar. Bars in Fig. 3(c) have been stacked at the bottom.
(g) Mosaic plot (1): The rectangle has been divided
horizontally according to the accumulated values for subjects, and then each sub bar has been divided vertically
according to the personal scores.
(h) Mosaic plot (2): The rectangle has been divided
vertically according to the accumulated values for persons, and then each sub bar has been divided horizontally
according to the scores for subjects.
Figure 4: Added Visual Representations for Team Scores In Fig. 5(a), scores are expressed by saturation. This visualization functions as a kind of heat map. We can overlook the distribution of skills. In Fig. 5(b), scores are expressed by the size of rectangles. In this view, we can obtain almost the same information as given in Fig. 5(a). Moreover, we can perceive whether the score is above or below the average values from the level of brightness of the displayed scores. In Fig. 5(c), scores are expressed by the heights of vertical bars. This view helps us to identify the subjects in which each member is either strong or weak. In Fig. 5(d), scores are expressed by the widths of horizontal bars. This view helps in identifying which team members are strong or weak in a particular subject. In Fig. 5(e), scores are expressed by the heights of vertical stacked bars. This view helps in
identifying the subjects in which each team is strong or weak. In Fig. 5(f), scores are expressed by the widths of horizontal stacked bars. This view helps to identify strong or weak members in each team. In Fig. 5(g), scores are expressed by a mosaic plot (1). We can compare the total scores of teams by comparing the total size of the rectangles. We can also ascertain which subjects each team is strong in by viewing the distribution of hues in the rectangle. In Fig. 5(h), scores are expressed by a mosaic plot (2). In this view, we can obtain information similar to that given in Fig. 11. In addition, we can identify the diversity of subjects in which team members are strong. The course instructor who viewed the visualized data attested that it had given him objective evidence to support his assumptions while organizing teams. Although the visualization might not have provided new information, it was helpful in clarifying data that was unclear. When perceived intuitively, it seems that the skills data of 2011 represents the characteristics of the team fairly precisely. However, such perceptions are not sufficient material to discuss the effectiveness of the tool and usage of the data. We need further studies, such as those described below. More views and opinions of other lecturers should be collected. The correlation between the skills data and the performance of teams should be considered. Additionally, the effectiveness of visualization of the skills data, or some other personal data, should be measured. 7 CONCLUSIONS Our purpose was to make the organization of teams better and to consequently increase the effectiveness of PBL. We provided a visualization of the personal skills data to support team organization. We also investigated various visual representations to accurately identify the data pertaining to individuals and teams. Moreover, we developed a tool that displays these representations. This tool offers eight kinds of visual representations. Via these representations, we can understand the characteristics of persons and teams. The representations helped to compare persons and teams. We applied the tool to the
ISBN: 978-0-9891305-1-6 ©2013 SDIWC 13
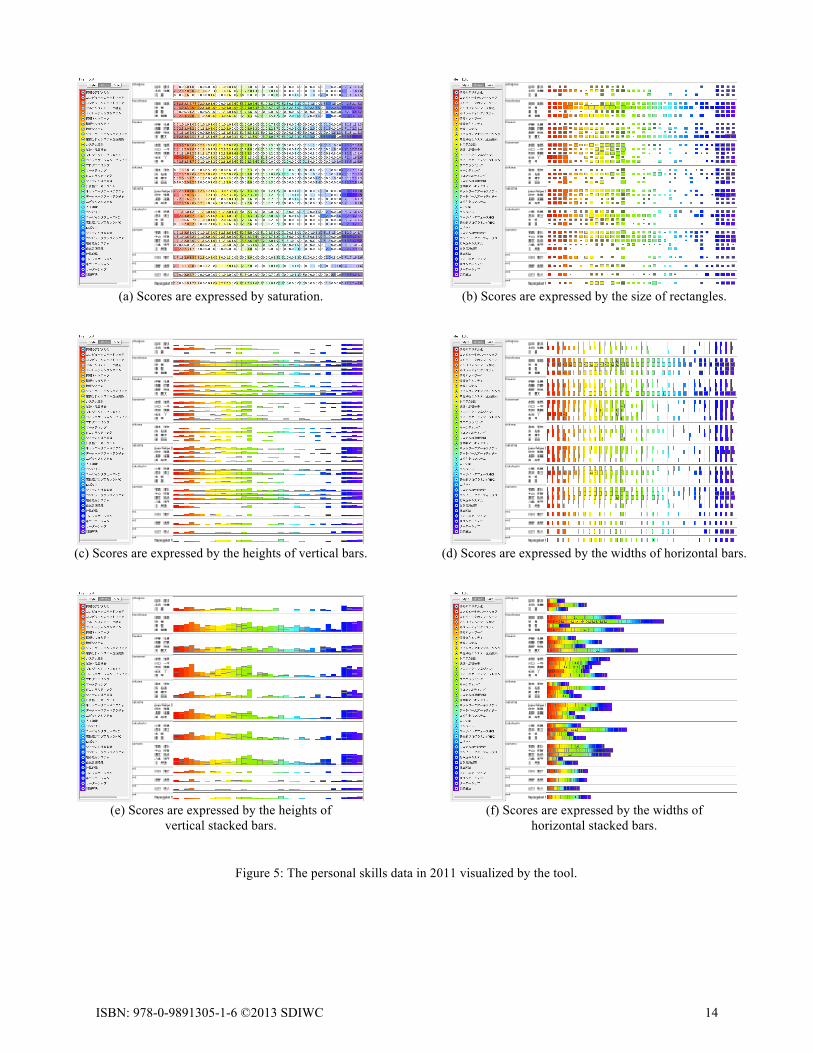
(a) Scores are expressed by saturation.
(c) Scores are expressed by the heights of vertical bars.
(e) Scores are expressed by the heights of
vertical stacked bars.
(b) Scores are expressed by the size of rectangles.
(d) Scores are expressed by the widths of horizontal bars.
(f) Scores are expressed by the widths of
horizontal stacked bars.
Figure 5: The personal skills data in 2011 visualized by the tool.
ISBN: 978-0-9891305-1-6 ©2013 SDIWC 14
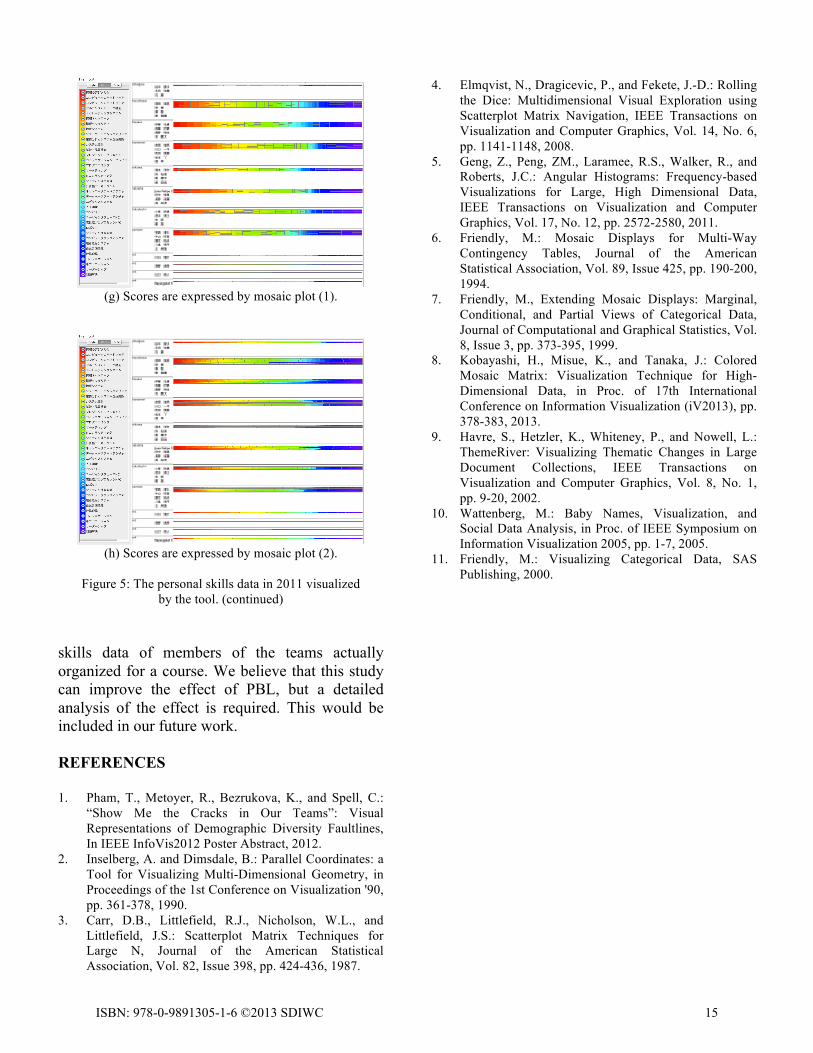
(g) Scores are expressed by mosaic plot (1).
(h) Scores are expressed by mosaic plot (2).
Figure 5: The personal skills data in 2011 visualized
by the tool. (continued) skills data of members of the teams actually organized for a course. We believe that this study can improve the effect of PBL, but a detailed analysis of the effect is required. This would be included in our future work. REFERENCES 1. Pham, T., Metoyer, R., Bezrukova, K., and Spell, C.:
“Show Me the Cracks in Our Teams”: Visual Representations of Demographic Diversity Faultlines, In IEEE InfoVis2012 Poster Abstract, 2012.
2. Inselberg, A. and Dimsdale, B.: Parallel Coordinates: a Tool for Visualizing Multi-Dimensional Geometry, in Proceedings of the 1st Conference on Visualization '90, pp. 361-378, 1990.
3. Carr, D.B., Littlefield, R.J., Nicholson, W.L., and Littlefield, J.S.: Scatterplot Matrix Techniques for Large N, Journal of the American Statistical Association, Vol. 82, Issue 398, pp. 424-436, 1987.
4. Elmqvist, N., Dragicevic, P., and Fekete, J.-D.: Rolling the Dice: Multidimensional Visual Exploration using Scatterplot Matrix Navigation, IEEE Transactions on Visualization and Computer Graphics, Vol. 14, No. 6, pp. 1141-1148, 2008.
5. Geng, Z., Peng, ZM., Laramee, R.S., Walker, R., and Roberts, J.C.: Angular Histograms: Frequency-based Visualizations for Large, High Dimensional Data, IEEE Transactions on Visualization and Computer Graphics, Vol. 17, No. 12, pp. 2572-2580, 2011.
6. Friendly, M.: Mosaic Displays for Multi-Way Contingency Tables, Journal of the American Statistical Association, Vol. 89, Issue 425, pp. 190-200, 1994.
7. Friendly, M., Extending Mosaic Displays: Marginal, Conditional, and Partial Views of Categorical Data, Journal of Computational and Graphical Statistics, Vol. 8, Issue 3, pp. 373-395, 1999.
8. Kobayashi, H., Misue, K., and Tanaka, J.: Colored Mosaic Matrix: Visualization Technique for High-Dimensional Data, in Proc. of 17th International Conference on Information Visualization (iV2013), pp. 378-383, 2013.
9. Havre, S., Hetzler, K., Whiteney, P., and Nowell, L.: ThemeRiver: Visualizing Thematic Changes in Large Document Collections, IEEE Transactions on Visualization and Computer Graphics, Vol. 8, No. 1, pp. 9-20, 2002.
10. Wattenberg, M.: Baby Names, Visualization, and Social Data Analysis, in Proc. of IEEE Symposium on Information Visualization 2005, pp. 1-7, 2005.
11. Friendly, M.: Visualizing Categorical Data, SAS Publishing, 2000.
ISBN: 978-0-9891305-1-6 ©2013 SDIWC 15