Visualising the potential impacts of climate change on rural landscapes
24
Visualising the potential impacts of climate change on rural landscapes Trudie Dockerty a, * , Andrew Lovett a , Gilla S€ unnenberg a , Katy Appleton a , Martin Parry b a School of Environmental Sciences, University of East Anglia, Norwich NR4 7TJ, UK b IPCC, Hadley Centre, UK Meteorological Office, Fitzroy Road, Exeter EX1 3PB, UK Abstract Climate change is an issue that will increasingly require policy consideration, but for which knowledge and information at the local or landscape scale is either lacking or largely inac- cessible. This paper explores the possibility of reinterpreting climate impacts information and presenting it through GIS-based visualisations in a manner that might assist decision-making at the local level. A GIS database was constructed for an agricultural landscape in Norfolk. Future land-use changes under climate change scenario for the 2020s, provided by a land use allocation model at 1 km grid-square resolution, were downscaled to the field-level database using a series of decision rules. The predicted land use changes were then visualised using photorealistic image rendering software. As a technical exercise this work illustrates the extent of recent advances in GIS-based visualisation, but it is also recognised that there needs to be further work on a range of topics (including impact assessment methodologies, the repre- sentation of uncertainty and design guidelines) if such images are to be widely used as a information provision and decision support tool in relation to climate change. Ó 2004 Elsevier Ltd. All rights reserved. Keywords: Climate change; Land use; Scenarios; Landscape visualisation; GIS 1. Introduction There is currently a huge international effort to understand the science of climate change and its impacts, and a growing awareness of the need to adapt policy and behaviours, and to develop possible mitigation strategies. At the local level, however, * Corresponding author. Tel.: +44-1603-591359/592583; fax: +44-1603-591327/593896. E-mail address: [email protected] (T. Dockerty). 0198-9715/$ - see front matter Ó 2004 Elsevier Ltd. All rights reserved. doi:10.1016/j.compenvurbsys.2004.05.004 Computers, Environment and Urban Systems 29 (2005) 297–320 www.elsevier.com/locate/compenvurbsys
-
Upload
independent -
Category
Documents
-
view
0 -
download
0
Transcript of Visualising the potential impacts of climate change on rural landscapes

Computers, Environment and Urban Systems
29 (2005) 297–320
www.elsevier.com/locate/compenvurbsys
Visualising the potential impacts ofclimate change on rural landscapes
Trudie Dockerty a,*, Andrew Lovett a, Gilla S€unnenberg a,Katy Appleton a, Martin Parry b
a School of Environmental Sciences, University of East Anglia, Norwich NR4 7TJ, UKb IPCC, Hadley Centre, UK Meteorological Office, Fitzroy Road, Exeter EX1 3PB, UK
Abstract
Climate change is an issue that will increasingly require policy consideration, but for which
knowledge and information at the local or landscape scale is either lacking or largely inac-
cessible. This paper explores the possibility of reinterpreting climate impacts information and
presenting it through GIS-based visualisations in a manner that might assist decision-making
at the local level. A GIS database was constructed for an agricultural landscape in Norfolk.
Future land-use changes under climate change scenario for the 2020s, provided by a land use
allocation model at 1 km grid-square resolution, were downscaled to the field-level database
using a series of decision rules. The predicted land use changes were then visualised using
photorealistic image rendering software. As a technical exercise this work illustrates the extent
of recent advances in GIS-based visualisation, but it is also recognised that there needs to be
further work on a range of topics (including impact assessment methodologies, the repre-
sentation of uncertainty and design guidelines) if such images are to be widely used as a
information provision and decision support tool in relation to climate change.
� 2004 Elsevier Ltd. All rights reserved.
Keywords: Climate change; Land use; Scenarios; Landscape visualisation; GIS
1. Introduction
There is currently a huge international effort to understand the science of climate
change and its impacts, and a growing awareness of the need to adapt policy and
behaviours, and to develop possible mitigation strategies. At the local level, however,
* Corresponding author. Tel.: +44-1603-591359/592583; fax: +44-1603-591327/593896.
E-mail address: [email protected] (T. Dockerty).
0198-9715/$ - see front matter � 2004 Elsevier Ltd. All rights reserved.
doi:10.1016/j.compenvurbsys.2004.05.004

298 T. Dockerty et al. / Comput., Environ. and Urban Systems 29 (2005) 297–320
in the policy arena which influences the everyday environments in which people live
and work, our experience has been that climate change is often regarded as:
• too abstract: it’s hard to understand the local implications of pronouncements
such as ‘‘the globally averaged surface temperature is projected to increase by
1.4–5.8 �C over the period 1990–2100’’ (Intergovernmental Panel on Climate
Change, 2001, p. 13),
• not relevant to us/our organisation: limited appreciation of possible local impacts,
• too far in the future: there are more urgent things to deal with right now,
• having too much uncertainty to merit adapting policy.
The political reality is also one of relatively short policy lifetimes, typically in the
region of 5–10 years. It is therefore easy to see how it is possible to put off consid-
ering climate change to the next policy round (for further discussion of public
attitudes regarding climate change see Nicholson-Cole, 2004).
In the UK, rural landscapes are fashioned not only by planning law, and the
policy guidance of various government and other agencies with an interest in
landscape, but also, fundamentally, by farming practice. Agricultural land use is a
major determinant of the visual realisation of rural landscapes. Future developmentsin agriculture brought about both by social and economic pressures, and also
increasingly by climate change (acting both directly and indirectly), will be a key
influence on the visual appearance of rural landscapes (DEFRA, 2002; see also
Swetnam, Wilson, Whittingham, & Grice, 2004).
There are many schemes in place to guide desirable landscape developments
(relating to good farming practice, biodiversity conservation, water resource man-
agement etc., e.g. see MacFarlane, 2000; Townshend, Stace, & Radley, 2004).
However, the statutory framework relating to landscape protection in Britain re-mains influenced by two controlling factors––private ownership of land and the
‘voluntary principle’. 1 Success is dependent on engaging the interest of individual
landowners who are largely able to choose whether or not to participate in particular
schemes. Farm enterprise and forestry activities, which have given rise to some of the
greatest landscape changes in recent decades (and are likely to do so in future), are
exempt from most planning controls. Forces behind change in the rural landscape
therefore, are largely beyond the jurisdiction of law; plans put together by agencies
for landscape management may amount to little more than ‘wish lists’ (Dockerty,Lovett, Appleton, & S€unnenberg, 2001). O’Riordan, Wood, and Shadrake (1993, p.
125) point out that
1 Th
manag
imposi
‘‘the landscape in its totality is not envisioned, it simply materialises’’.
at is, where the legislation provides for negotiated agreements between landowners and
ement authorities, with incentives to reward beneficial types of land management, rather than
ng prohibitions.

T. Dockerty et al. / Comput., Environ. and Urban Systems 29 (2005) 297–320 299
Within this complex system, it will become increasingly important to engage the
public and a wide variety of stakeholder organisations in understanding the impact-
implications of climate change, and to enhance decision-making processes relating tolandscape protection.
2. Approach
How can we further understanding of climate change at the local level and help
ensure policies currently being formulated will adequately manage the potential
consequences of climate change? The UK Climate Impacts Programme (UKCIP) has
been addressing the need to evaluate impacts at a more local scale through a series of
regional ‘scoping studies’ that assess vulnerability to climate change, and discuss
options for appropriate responses. It has also published the results of a more detailed
project, REGIS (Regional Climate Change and Response Studies in East Anglia andNorth West England) (Holman et al., 2002), which sought to model the integrated
impacts of climate change on these two regions across a number of sectors––
agriculture, water, biodiversity, coastal and river flood risk. The outputs of that study
were conventionally presented in the form of maps and tables in written reports.
Our work focuses on expressing climate change impacts information in another
way, namely by visualising ‘futurescapes’ i.e. impressions of potential future land-
scapes based on a synthesis of current policy and scientific research. Much of the
existing climate change impacts research has taken place at the international tonational scale (e.g. Harrison & Butterfield, 1996; Parry et al., 1999). Two key
objectives of our study were therefore to assess how far it is possible:
• to ‘downscale’ or re-interpret existing impacts information at a scale more relevant
to the local policy arena,
• to make such information more accessible by using visualisation techniques.
The appeal of the visual format is that information presented in this way isprocessed and absorbed by the human brain much more efficiently than textual,
numerical or even diagrammatic data (Tufte, 1992). Many different visualisation
techniques are available. Examples of pre-computer based representations of rural
landscapes in Britain include Benefield and Bunce’s (1982) visualisation of the
Institute of Terrestrial Ecology’s Land Classification system, which through a series
of drawings portrayed generalised views incorporating features found in each land
class. O’Riordan et al.’s (1993) ‘Landscapes for Tomorrow’ project used a series of
water colour paintings as a means of engaging the public, landowners, farmers andpolicy managers in considering possible changes within the Yorkshire Dales Na-
tional Park.
In recent years there has been a move to digital technologies. These include 3D
object modelling, rendering and animation, developed from computer-aided design
(CAD) software, plus image manipulation programs, which have provided a means
for achieving increased realism in landscape images (Ervin & Hasbrouck, 2001;

300 T. Dockerty et al. / Comput., Environ. and Urban Systems 29 (2005) 297–320
Lange, 2002). Geographical Information Systems (GIS) have also been used for
landscape planning purposes (e.g. Herrmann & Osinski, 1999; SDRI, 1999) and
there is an increasing ability to link GIS databases with more sophisticated visu-alisation tools (e.g. Appleton, Lovett, S€unnenberg, & Dockerty, 2002).
The pre-cursor to the work described in this paper was a GIS-based study re-
ported in O’Riordan, Lovett, Dolman, Cobb, and S€unnenberg (2000), Dolman,
Lovett, O’Riordan, and Cobb (2001) and Lovett et al. (2002). In that work, future
scenarios were devised for an Oxfordshire landscape, based on current policy doc-
uments, a programme of interviews with farmers, and discussions with a number of
stakeholder organisations, that reflected plans for agricultural changes, improved
visual amenity value and biodiversity conservation. The scenarios were visualised inthe form of large format (A0) maps plus Virtual Reality Modelling Language
(VRML) representations of the landscapes that could be viewed and navigated via a
web browser.
Fig. 1 shows two photomontages from the same area. These images were created
as part of initial work on visualising the potential landscape impacts of climate
change. They were based on the results of research into the impacts of climate change
on agriculture (Parry et al., 1999), SPRU (1999) socio-economic scenarios and in-
sights from experimental work being carried out by the Institute of Arable CropResearch, Rothamsted on possible future UK crops. Fig. 1(a) depicts the current
situation and Fig. 1(b) illustrates the kind of landscape that a changing climate might
bring. As the climate warms it will become increasingly possible to grow crops in
England currently seen further south in Europe (e.g. sunflowers). Some agricultural
land may no longer be required for crops presently grown, allowing the land to be
used for other purposes. One example would be the growth of biofuel crops, such as
the tall perennials grasses illustrated, which could be harvested and burned in farm-
Fig. 1. Digital photomontage of an Oxfordshire Landscape (a) current situation, (b) potential landscape
under climate change.

T. Dockerty et al. / Comput., Environ. and Urban Systems 29 (2005) 297–320 301
scale CHP units (centre-left of Fig. 1(b)), supplying the renewable energy market and
providing alternative farm income. Other forms of energy generation could also lead
to landscape change, such as an expansion in wind farms (far left of Fig. 1(b)).Photomontages such as those in Fig. 1 have the advantage of providing detailed
and immediately recognisable landscape views, but it has long been recognised that
there are limits on the types of changes that can be shown and that considerable time
and skill is often required to prepare such images (Sheppard, 1989). The provision of
greater flexibility (e.g. in terms of the ability to alter viewpoints, terrain or the
positions of buildings and vegetation) has been an important factor in the recent use
of GIS-based techniques to visualise landscape changes (e.g. Jude, Jones, Bateman,
& Andrews, 2003; Stock & Bishop, 2002) and for similar reasons such an approach isadopted in the research described in the remainder of this paper.
3. Development of a GIS database for the Norfolk Arable LMI
Part of the region covered by the Norfolk Arable Land Management Initiative
(NALMI) was selected as a case study area to assess the issues involved in visualising
potential climate change impacts. The Land Management Initiative is a CountrysideAgency programme, working with farmers and rural communities in several parts of
Britain to identify means of facilitating more sustainable land management practices
(for further details see http://www.countryside.gov.uk/livinglandscapes/sustain-
able_land_management/LMIs.asp). Previous research for NALMI had included
some assessment of potential climate change impacts in the locality (e.g. Lorenzoni,
Jordan, Favis-Mortlock, Viner, & Hall, 2001) and the area was also considered a
good exemplar of the types of agriculture and environmental conditions present in
much of south-eastern England.The NALMI project area covers just over 17,000 ha and is situated between the
towns of Dereham, Swaffham and Watton (Fig. 2). It is an area of muted relief, with
rivers and brooks draining out to the east and west, forming a number of small
valleys. The landscape of the NALMI area is one of intensive arable agriculture, in
which cereals dominate. High use of pesticides and loss of hedgerow and marginal
habitat through field enlargement have impoverished biodiversity. Mixed farming
has given way to arable, with a decline in the amount of pasture land.
3.1. Database construction
Elevation and topographic data for the NALMI area were obtained from two
Ordnance Survey (OS) products. These were the Panorama� 1:50,000 scale digitalelevation model and the Meridian� mid-scale vector maps (Ordnance Survey, 2004).
Data were downloaded from the Digimap project web site at the University of
Edinburgh and then imported into the Arc/Info GIS software. The NALMI area
consists of 13 parishes and digital boundaries for these administrative units were
constructed using 1991 Census databases available via the MIMAS service at the
University of Manchester.

Fig. 2. The location of the NALMI project and study area.
302 T. Dockerty et al. / Comput., Environ. and Urban Systems 29 (2005) 297–320
OS Land-Line� vector data were used as a framework for more detailed land use
mapping in a 9 km · 5 km sub-region around the upper River Wissey (outlined in
Fig. 2), which essentially constitutes a small river valley with slightly higher eleva-
tions on the northern, eastern and southern sides. The River Wissey flows west from
its source north of Shipham out of the NALMI parishes and joins the Great Ouse

Fig.3.Landuse
intheWisseystudyarea,summer
2001.
T. Dockerty et al. / Comput., Environ. and Urban Systems 29 (2005) 297–320 303

304 T. Dockerty et al. / Comput., Environ. and Urban Systems 29 (2005) 297–320
which drains into The Wash at King’s Lynn. This area was selected for particular
attention as there are several current NALMI projects concerned with future land
management or habitat restoration in the locality.Land-Line� data consist of point, line and annotation features. Polygons have to
be explicitly created within a GIS and this process tends to require an element of
manual editing for some feature types (e.g. fields). There are also limitations in the
attribute coding for many types of landscape features (see Lovett et al., 2002 for
details). Considerable work was therefore required to convert the raw Land-Line�
data into more relevant and structured formats. Manipulation and editing of the
data using the Arc/Info software generated a map layer for the 9 km · 5 km sub-
region that contained over 10,000 polygons. Attributes for features such as buildings,roads and water bodies could be assigned from the Land-Line� information, but to
distinguish categories of land use a field survey was carried out in the area during the
summer of 2001. Over 30 land use classes were distinguished in the survey, some 20
of which referred to different crops or agricultural activities. These survey results
were subsequently used to assign land use codes to polygons in the GIS database. A
simplified version of the survey data (with a number of land use categories com-
bined) is shown in Fig. 3, highlighting the importance of cereal production in the
area.
4. Creating landscape scenarios from climate change information
Making projections of climate change requires knowledge of past and current
emissions of greenhouse gases and an estimation of likely future emissions. The level
of future emissions depends on how society develops, a question that is subject to
rather greater uncertainty than those which remain in understanding the science of
the climate system (UKCIP, 2000). To provide a framework for climate change
projections the IPCC have therefore produced a set of scenarios representing pos-
sible directions for human development over the next 100 years, encompassing dif-
ferent systems of governance and societal structures (Nakicenovic & Swart, 2000).Four equi-plausible scenarios have been formulated that together cover a sig-
nificant proportion of the uncertainties in future demographic, economic and tech-
nological change. These ‘storylines’ are differentiated on two dimensions (see Fig. 4),
with the horizontal axis representing an emphasis on economic development at one
end and sustainability at the other. The vertical axis differentiates systems of gov-
ernance, with the lower extreme denoting a convergence in the policies of individual
governments and globalised markets, while the upper one constitutes a future where
national or regional policy differences are maintained. Combining the two dimen-sions defines a range of societal futures where levels of warming are likely to vary, as
shown in Fig. 4 by the predicted temperature changes from the latest UK projections
prepared by the Tyndall Centre for Climate Change Research (Hulme et al., 2002).
The approach taken in this research in constructing scenarios of potential future
landscape change builds on the method used by O’Riordan et al. (2000). This study
likewise utilises prescriptions from policy guidance documents as the basis for sce-

Fig. 4. Characteristics of future world development pathways (Sources: Hulme et al., 2002; Nakicenovic &
Swart, 2000; SPRU, 1999).
T. Dockerty et al. / Comput., Environ. and Urban Systems 29 (2005) 297–320 305
nario development, but also includes land use changes based on the output of a land
use allocation model (CLUAM) that evaluates the impacts of climate change on the
viability of different farming enterprises (Parry et al., 1999). This inclusion is animportant extension because the economic return available from the land is likely to
be as fundamental an influence on landscape development in the future as it has been
in the past (see also MacFarlane, Stagg, Turner, & Lievesley, 2004).
The process used to derive landscape-scale scenarios is illustrated in Fig. 5. We
have attempted to include information at a hierarchy of scales from national through
regional to local. In the case of policy guidance, the quantity and detail of infor-
mation increases with the move from national to local scale. With climate change
impacts the situation is reversed with most information available at the nationalscale, and virtually nothing of any detail at local scale. All of the information
gathered has been checked for consistency with UKCIP02 climate change scenarios
(see Fig. 4) and UKCIP socio-economic futures (SPRU, 1999), and has been allo-
cated to sit within the most appropriate of the four storylines (i.e. World Markets,
National Enterprise, Global Sustainability, Local Stewardship).
In order to isolate the influence of climate change from other environmental and
socio-economic factors that will shape the future, it is necessary to create futures
scenarios that exclude climate change effects alongside scenarios that include climatechange effects (Parry & Carter, 1998). This feature has been included in our full
range of scenarios (see Fig. 5). In addition it is desirable to adopt scenarios that
reflect possible conditions across the range of uncertainty, as exemplified by the four
storylines mentioned above. Ideally, our impact assessment would present landscape
futures across all four, however at the time of this research CLUAM output was
available for only two of these futures––National Enterprise (A2/Medium–High)

Fig.5.Theprocedure
usedto
derivelandscape-scale
scenarios.
306 T. Dockerty et al. / Comput., Environ. and Urban Systems 29 (2005) 297–320

T. Dockerty et al. / Comput., Environ. and Urban Systems 29 (2005) 297–320 307
and Local Stewardship (B2/Medium–Low). These are not the optimum scenarios of
choice, SPRU (1999) recommends that if utilising a sub-set of the four scenarios, a
combination of World Markets (A1/High) +Local Stewardship (B2/Medium–Low)is most appropriate to obtain maximum contrast. Nevertheless, there are sufficient
differences between the two available scenarios, with National Enterprise emphas-
ising economic development and Local Stewardship strong environmental policies,
to provide a sense of the possible future landscapes.
Insights into potential trends at the regional and local scale have been gleaned
from many documents, including an environmental strategy for the NALMI
(Hawkins & MacMullen, 2001) and a study of possible climate change impacts
(Lorenzoni et al., 2001; Viner, Jordan, Lorenzoni, & Favis-Mortlock, 2000). Thelatter included increased irrigation requirements, risks of soil erosion, changes in
agricultural yields, and importantly, alterations in the distribution of particular
agricultural activities.
5. Land use change modelling
To take account of possible future changes in agricultural activities, particularly
alterations in crop distributions, output from CLUAM (a climate and land use
allocation model) was used. CLUAM incorporates the effects of global climate
change on agriculture in England and Wales through links with a model of world
food trade (the Basic Linked System or BLS) (Hossell et al., 1996; Parry et al., 1999).The BLS is run for a particular socio-economic and climate change scenario and the
outputs (yields, prices and demands for the modelled commodities––crops and grass-
based livestock production) are subsequently input to CLUAM. Base data within
CLUAM are structured around the ITE Land Classification System (Bunce & Heal,
1984) and total areas for each agricultural activity are calibrated to accord with
MAFF Census statistics (Clark, 1982), so providing a baseline against which changes
suggested by individual scenarios can be compared. The current baseline is centred
on the mid-1990s. CLUAM essentially treats England and Wales as a single farmand, for a given scenario and associated constraints, employs linear programming
techniques to allocate 1 km squares to uses in a manner that optimises the gross
margin achievable from all the possible agricultural activities on the different parcels
of land. CLUAM output indicates the percentage land use per 1 km square for each
of the following; wheat, barley, oats, oilseeds, peas/beans, sugar beet, potatoes,
maize, sunflowers, ley grassland, permanent grassland, and rough grassland.
5.1. Comparing CLUAM mid-1990s output with the 2001 land use survey
In order to evaluate modelled projections of future land use it is helpful to have an
idea of how well CLUAM output reflects the current ‘on-the-ground’ experience.
The ideal situation would be to have an actual land use survey for the area in the mid
1990s (i.e. the same baseline as used by CLUAM). Unfortunately such data were not

308 T. Dockerty et al. / Comput., Environ. and Urban Systems 29 (2005) 297–320
available, but there are only a few years between the model baseline and our 2001
survey.
CLUAM baseline data (percentage land use per 1 km square) were extracted forthe 9 km · 5 km Wissey sub-region and compared with the 2001 survey results. All of
the study area was coded as ITE Land Class 3 in CLUAM so, not surprisingly, the
survey recorded more land uses than were present in the modelled data. In order to
allow a more appropriate comparison, those land uses not represented in the
modelled data (e.g. urban, water, woodland, soft fruits) were excluded from tabu-
lated survey data, reducing the total area from 4500 to 3858.5 ha. The surveyed land
uses were then aggregated to match the CLUAM categories and percentages cal-
culated (see Table 1).Due to the wet conditions in autumn 2000 and spring 2001, which meant that it was
not possible to get machinery onto the land for the sowing of crops, quite a high
proportion of land was under set aside in 2001. Taking this situation into account,
along with the possibility that more oil seed rape and linseed might have been grown if
conditions had been more favourable, there is reasonable agreement between our
Table 1
Comparison of recorded and modelled land use data
2001 Land use survey CLUAMmid 1990s baseline
Categories Hectares Total hectares % Categories %
Wheat 1393.1 36 Wheat 29
Barley 529.6 14 Barley 21
Free range pigs 2.2
Ploughed/bare 79.2
Set aside 350.1
431.5 11 Unallocated 3
Maize 63.6 2 Maize 0
Sunflowers 1.5 0 Sunflowers 0
Oats 2.8 0 Oats 0
Rape seed 240.0
Linseed 20.6
260.6 7 Oilseeds 22
Beans 145.8
Peas 128.8
274.6 7 Beans/peas 0
Sugar beet 322.9 8 Sugar beet 0
Potatoes 57.4 1 Potatoes 0
Total 23 Other crops 22
Pasture/grass 359.4 9 Ley 24
Bracken 6.6
Heath 35.9
Paddock 10.6
53.1 1 Permanent grass 1
Rough grazing 108.4 3 Rough grazing 0
Total 13 Grasslands 25
Total 3858.5 100 100

Table 2
Rules for reallocating land use codes
Priority order Action
First Allocate land to Ley: Prescriptions from the Environmental Strategy and other
reports were examined to determine where grassland reversion should be located (e.g.
in river valleys, along water courses, where hedgerows exist––indicating previously
existing livestock land etc.). Some smaller fields in these locations of other land uses
were also reallocated to make contiguous areas of grassland, up to the total area
required
Second Cereal crops in the current land use map are mostly associated with the largest open
fields and brown earth soils away from the river valley. It was assumed that the largest
of these fields would remain the most practical and profitable for cereal growth.
Therefore the current land use coding for these was preserved, except for allowing
transfer from one cereal type to another (e.g. wheat to barley) to adjust to the scenario
proportions of each crop
Third The smaller of the cereal fields and larger of other surplus crop fields were transferred
to maize and other crops to match the scenario proportions
T. Dockerty et al. / Comput., Environ. and Urban Systems 29 (2005) 297–320 309
survey and the CLUAM data for the mid 1990s with respect to cereal and oilseed
crops. The main discrepancy in Table 1 is in the amount of land down to ley grass-
land. We recorded relatively little grassland in the area, and in fact reasonable pro-
portions of other crops such as sugar beet or peas/beans that were not predicted by theCLUAM data. However, the survey area is a very small part of Land Class 3 which
actually covers a broad expanse of south-east England (over 1.5 million ha, around
10% of the land area of England and Wales). It therefore needs to be recognised that
the survey data were most unlikely to have an exact correspondence with model
predictions based on land class averages, and for our purposes the degree of agree-
ment was deemed sufficient to proceed to the downscaling stage of the research.
5.2. Downscaling and applying predicted land use changes to the GIS database
A set of rules was developed to apply the percentages for each 1 km grid square in
the CLUAM scenario output for the 2020s to the field polygons in the GIS database.
This exercise sought to create new polygon coverages for each of the two scenarios
that achieved the percentages of land use in each category suggested by CLUAM
and also resulted in a plausible crop pattern given the nature of the terrain, soils andland use history in the area. Table 2 outlines the approach adopted, with the initial
emphasis being on the allocation of land to ley grass, followed by changes in the
distribution of crops. All the polygon attribute assignments were made using rese-
lection or other editing commands within the Arc/Info GIS, and it proved possible to
approximate the required hectare targets without splitting fields.
6. Visualising landscape change
A raster DEM and shapefiles of the land use distributions were imported into the
Visual Nature Studio (VNS) software (3DNature, 2004) to produce landscape

310 T. Dockerty et al. / Comput., Environ. and Urban Systems 29 (2005) 297–320
visualisations. This software simulates landscape scenes by generating photorealistic
images of the view from camera positions defined by the user (Appleton et al., 2002).
Within VNS, visual properties such as colour, texture and the presence of vegetationcan be assigned to areas of the terrain surface as defined by polygon or grid cell
attributes. Buildings and other structures can be linked to specified points, and other
features such as water, sky and lighting can also be controlled. Externally produced
3D objects can be imported to represent buildings or other structures, and may also
be used for vegetation, although two-dimensional images are more commonly em-
ployed (as in this research) due to high processing loads when they are as numerous
as trees and plants in a rural landscape. For processing reasons, it was also decided
to represent most buildings by simple extrusions of their footprint polygon.In this study, three sets of land use information were involved (for 2001 and the
two climate change scenarios) and search queries in VNS were used to dynamically
relate feature attributes (e.g. as defined in a shapefile) to the relevant visual prop-
erties. The software’s own ‘scenario’ capability was also used to link together and
activate/deactivate different sets of visual properties depending on the landscape to
be simulated. For example, in the National Enterprise scenario grass, trees and
bushes were altered to appear more yellow/brown, additional gaps were added to
hedges, dead trees were introduced, and the river level was reduced to reflect theeffects of greater warming and poor water management.
Table 3 summarises the overall pattern of land use in the 9 km · 5 km study area
as recorded in the 2001 survey and predicted for the A2 National Enterprise and B2
Local Stewardship scenarios in the 2020s. These results suggest that there could be
considerable alterations in agricultural activities by the 2020s and also that the
changes could vary substantially between scenarios. For instance, in the National
Enterprise scenario wheat production remains important, but the drier conditions
and competition for water supplies result in other crops requiring irrigationbecoming less common. Some of this land transfers to new crops (such as sun-
flowers), but there is also predicted to be a shift into animal production systems, as
indicated by an increase in ley grassland. Fig. 6 maps the distribution of land use
Table 3
Changes in land use between 2001 and the two climate change scenarios
Land use 2001 Survey A2 Scenario B2 Scenario
Hectares % Hectares % Hectares %
Wheat 1393.1 31.0 1790.5 39.8 192.8 4.3
Barley 526.6 11.7 348.1 7.7 1747.7 38.8
Maize 63.6 1.4 0.0 0.0 615.6 13.7
Other crops 1536.3 34.1 665.0 14.8 239.6 5.3
Grassland 514.3 11.5 1235.0 27.4 1242.9 27.6
Woodland 171.6 3.8 170.5 3.8 170.5 3.8
Urban/roads 294.5 6.5 290.9 6.5 290.9 6.5
Total 4500.0 100.0 4500.0 100.0 4500.0 100.0
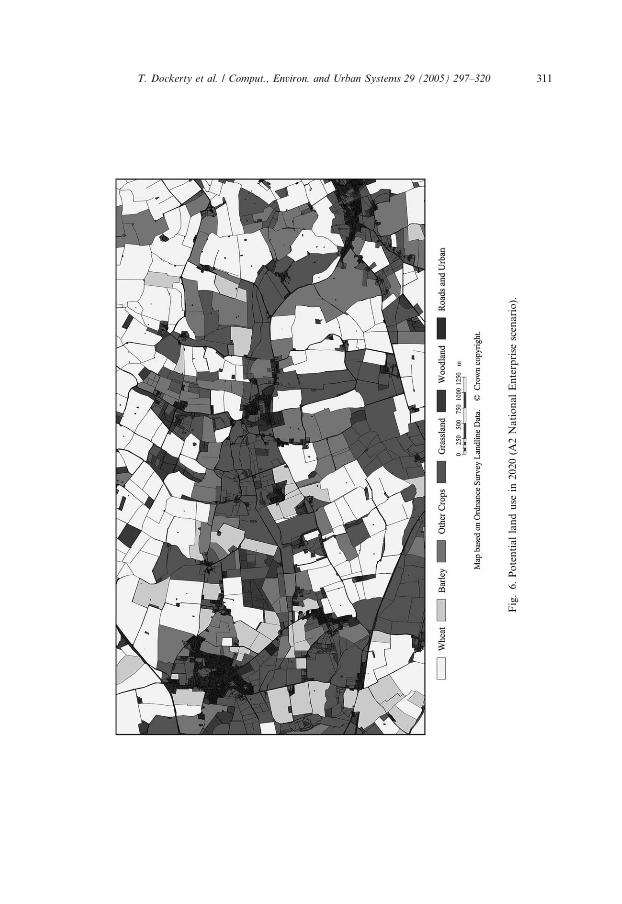
Fig.6.Potentiallanduse
in2020(A
2NationalEnterprise
scenario).
T. Dockerty et al. / Comput., Environ. and Urban Systems 29 (2005) 297–320 311

Fig.7.Potentiallanduse
in2020(B2LocalStewardship
scenario).
312 T. Dockerty et al. / Comput., Environ. and Urban Systems 29 (2005) 297–320

T. Dockerty et al. / Comput., Environ. and Urban Systems 29 (2005) 297–320 313
under this scenario and indicates a particular increase in grassland around the river,
with cereal production mainly situated along the surrounding slopes.
In the Local Stewardship scenario there is more emphasis on environmentalprotection, with less intensive agricultural systems and better water conservation
practices. As with the National Enterprise results, the CLUAM output predicts a
Fig. 8. Landscape visualisations from a bird’s-eye perspective (viewpoint V1) (a) land use in summer 2001,
(b) potential land use in 2020 (A2 scenario), (c) potential land use in 2020 (B2 scenario).

314 T. Dockerty et al. / Comput., Environ. and Urban Systems 29 (2005) 297–320
shift into animal production and increased grassland cover (see Fig. 7). However,
there is also a marked change in crop composition, with wheat production moving to
more favourable climatic conditions further north in England and being replaced bybarley and maize.
Fig. 9. Landscape visualisations from a ground level perspective (viewpoint V2) (a) land use in summer
2001, (b) potential land use in 2020 (A2 scenario), (c) potential land use in 2020 (B2 scenario).

T. Dockerty et al. / Comput., Environ. and Urban Systems 29 (2005) 297–320 315
3D landscape scenes were rendered using the VNS software to illustrate these land
use changes, as well as other alterations in vegetation and the built environment that
would be anticipated under each scenario. Two viewpoints were selected (see loca-tions marked on Fig. 3), the first providing a bird’s-eye perspective looking south
east across the Wissey valley and the second a ground-level view towards the river.
These viewpoints were also chosen to be complementary, one supplying an overview
of the landscape and the other a typical scene that would be observed while walking
along a roadside path.
Fig. 8(a) shows the bird’s-eye view of the 2001 landscape. The River Wissey can
be seen in the foreground, with rough grassland to the left, sugar beet to the right,
and cereal fields in the right middle distance. In Fig. 6(b), the National Enterprisescenario, the sugar beet is replaced by sunflowers as the climate becomes less
favourable for the former and more so for the latter. Changing profit margins also
lead to the introduction of livestock farming, as indicated by the cows on the ley
grassland to the left of the river. The underlying water-stress is indicated by a re-
duced river level and a decline in vigour of hedgerow trees and shrubs, with gaps
appearing where a lower water table leads to die-back. Fossil fuels are still widely
used and the only evidence of adaptation in the built environment is the white-
washing of walls to reflect the heat.In Fig. 8(c) the climate is also warmer than today, but the landscape reflects a
different ethos at work, with greater emphasis on mitigation and adaptation meaning
that water stresses are not so severe. Hedgerows are maintained and the move away
from the use of fossil fuels is indicated by the wind generator and solar panels on the
house in the right foreground and the windfarm on the horizon. Agricultural changes
include maize on the field to the right of the river and a lower density of cattle on the
grassland to the left.
Fig. 9 shows the changes discussed above from a ground-level viewpoint. Therepresentation of different types of vegetation is particularly striking and illustrates
the rapid advances being made in this area of landscape visualisation (Muhar,
2001).
7. Discussion
Viewed in sequence, the images in Figs. 8 and 9 certainly provide more vivid and
immediate illustrations of the potential local impacts of climate change than are
possible with conventional maps. The variation between scenarios also conveys the
point that the future is not fixed and that much will depend on how societies respond
to the challenges posed by climate change. Disseminating such a message isimportant from a policy perspective and, overall, the results demonstrate how
information on the potential impacts of climate change might be made more
accessible using GIS-based landscape visualisation techniques.
Nevertheless, a number of caveats are necessary. In particular, it is important
to recognise that the visualisations are no more than ‘plausible representations’
of possible futures and should not be interpreted too literally. A number of

316 T. Dockerty et al. / Comput., Environ. and Urban Systems 29 (2005) 297–320
assumptions, and no little creative interpretation, were involved in downscaling and
visualising the CLUAM output. Similar types of decision are inherent in the pro-
duction of almost any landscape visualisation (MacFarlane et al., 2004), but suchsubjectivity does mean that it is important for the data sources and production
process to be as transparent as possible if the products are to be regarded as credible
by their intended audiences (Sheppard, 2001). In this paper we have tried to be
thorough and clear regarding the approach taken, but we would be the first to
recognise that there are limitations in what we have done. Crucially, there need to be
improvements in the frameworks and methods for assessing climate change impacts
at the local scale, and there are encouraging signs of progress in this respect (e.g. see
Tyndall Centre, 2004; UKCIP, 2004).In terms of the development and use of landscape visualisations, there are several
ways in which the research described in this paper could be extended. One important
issue is the representation of uncertainty. This occurs in several different forms, one
aspect being the visualisation of boundary zones. Images such as Fig. 8 tend to show
quite abrupt and clearly defined changes in land use, whereas in the real world there
is frequently a visible degree of transition or fuzziness at a boundary (Fisher, 1999).
For instance, in the lowland regions of the UK it is increasingly common to have
uncropped areas at field margins due either to the requirements of agri-environ-mental schemes or simply machinery limitations and the impact of hedgerow wildlife
on peripheral seeds and young crops. Transitions are also important in less heavily
managed landscapes, where there may be a need to show different types of vegetation
merging gradually into one another (e.g. from open heath into varying densities of
scrub, and then into more mature woodland). Facilities do exist in some visualisation
packages (such as Terraffectors in VNS) to define symmetrical variations in land
cover either side of a linear feature (e.g. to represent roadside verges or river banks),
but creating asymmetrical transitions across polygon boundaries does not appearstraightforward at present. Overcoming this limitation will probably require a more
complete integration of GIS analysis tools (e.g. fuzzy membership functions as
discussed by Zhang & Goodchild, 2002) and visualisation software than has been
achieved to date.
Visualising uncertainty is also a key issue when the probability of particular
features being present in a landscape is likely to vary. Sets of images, such as those in
Figs. 8 and 9, can illustrate a range of possible outcomes, but in each view all the
landscape elements appear equally definite. In reality, some components of the scene(e.g. buildings and field boundaries) are more likely to be present in the 2020s than
others (e.g. particular crops in fields). Refining this aspect of the visualisations
obviously requires better understanding and prediction of climate change impacts,
but assuming such scientific knowledge does become available there is still the
question of how to best convey these differences in likelihood. Many different
techniques have been used to represent uncertainty in spatial data (Ehlschlaeger,
Shortridge, & Goodchild, 1997; Hunter & Goodchild, 1996; Kardos, Moore, &
Benwell, 2003), but some of these (e.g. blinking pixels or contrasts in colour satu-ration) do not appear especially suitable in the context of 3D landscape visualisation
because they would impair the realism with which features could be shown. The use

T. Dockerty et al. / Comput., Environ. and Urban Systems 29 (2005) 297–320 317
of paired images, with one depicting a landscape view and the other the likelihood of
different features being present, could be one way forward, and the scope for
employing animations (where duration in a time sequence is related to probability ofoccurrence) also merits investigation. At present, however, it seems likely that
considerable research will be necessary before operational solutions become
available.
Another way in which the research could be extended is through the provision of
more interactive landscape displays. Interactivity can be defined in many ways, but
essentially refers to the situation where a visual display changes in response to user
input (Crampton, 2002). Navigating through a virtual landscape is therefore one
example of interactivity and while this is not possible with the conventional VNSoutput used in this research, a newly released extension, SceneExpress, allows vi-
sualisations to be output to various real-time display formats including Virtual
Reality Modelling Language (VRML). Several other research projects have con-
verted GIS databases to VRML as a means of generating navigable virtual envi-
ronments (see examples in Fisher & Unwin, 2002) and software products such as
TerraVista (Terrex, 2004) now provide more sophisticated means of creating large
terrain databases optimised for interactive landscape display. Researchers are also
beginning to address interactivity in the sense of allowing users to move or alterlandscape elements in real-time (e.g. Stock & Bishop, 2002) and this enhanced
ability to pose ‘what if’ questions is important in facilitating greater stakeholder
engagement in decision-making processes. There is still some tradeoff between
providing interactivity and the degree of realism with which features are repre-
sented, but as the costs of high-end image generation and projection systems
continue to fall the use of real-time landscape display methods seems likely to
become much more widespread.
A final issue concerns the way in which landscape visualisations are used. It isevident that the techniques for generating 3D visualisations have advanced enor-
mously in the past few years (Hudson-Smith & Evans, 2003), but it is also increas-
ingly recognised that there is still much to learn about how best to apply such tools
for environmental management and planning purposes (MacFarlane et al., 2004;
Orland, Budthimedhee, & Uusitalo, 2001). Research is starting to provide insights as
to how the public perception of virtual landscapes is influenced by the realism with
which different features are represented (e.g. Appleton & Lovett, 2003; Lange, 2001)
and this is important in terms of developing guidelines for the production of suchvisualisations (Sheppard, 2001). With respect to climate change, there is also a need
to better evaluate how people respond to images of potential impacts (Nicholson-
Cole, 2004). For instance, to what extent does viewing such images actually motivate
individuals to change aspects of their personal behaviour and adopt decarbonisation
measures? Overall, therefore, it can be concluded that at present the development
and use of landscape visualisations representing the possible local impacts of climate
change is not without its problems, but the scope clearly exists for such images to
contribute to information communication, debate and policy formulation in thefuture.

318 T. Dockerty et al. / Comput., Environ. and Urban Systems 29 (2005) 297–320
Acknowledgements
The initial phase of this research was primarily funded by the Jackson Founda-tion, with additional resources provided by the NALMI project. More recent work
has been supported by the Economic and Social Research Council as part of the
Programme on Environmental Decision Making based at the Centre for Social and
Economic Research on the Global Environment (CSERGE) at the University of
East Anglia. We would like to thank John Terry (NALMI Project Officer) for advice
and two referees for some thought provoking comments. All maps are derived from
Ordnance Survey digital data, � Crown copyright Ordnance Survey. The provision
of these data is an EDINA Digimap/JISC supplied service.
References
3DNature (2004). Available: http://www.3dnature.com. (Visual Nature Studio).
Appleton, K. J., & Lovett, A. A. (2003). GIS-based visualisation of rural landscapes: Defining ‘sufficient’
realism for environmental decision making. Landscape and Urban Planning, 65, 117–131.
Appleton, K. J., Lovett, A. A., S€unnenberg, G., & Dockerty, T. L. (2002). Rural landscape visualisation
from GIS databases: A comparison of approaches, options and problems. Computers, Environment and
Urban Systems, 26, 141–162.
Benefield, C. E., & Bunce, R. G. H. (1982). A preliminary visual presentation of land classes in Britain. ITE
Merlewood Research and Development Paper No. 91. Institute of Terrestrial Ecology, Merlewood,
Cumbria.
Bunce, R. G. H., & Heal, O. W. (1984). Landscape evaluation and the impact of changing land use on the
rural environment: the problem and an approach. In R. D. Roberts & T. M. Roberts (Eds.), Planning
and Ecology. London: Chapman & Hall.
Clark, G. (1982). The Agricultural Census––United Kingdom and United States. Concepts and Techniques
in Modern Geography No. 35. Environmental Publications, Norwich.
Crampton, J. W. (2002). Interactivity types in geographic visualization. Cartography and Geographic
Information Science, 29, 85–98.
DEFRA (2002). The strategy for sustainable farming and food: Facing the future. DEFRA, London.
Dockerty, T., Lovett, A., Appleton, K., & S€unnenberg, G. (2001). Climate change impacts on Landscape:
New approaches to visualising rural landscape change. Working Paper No. 9. Jackson Environment
Institute, University of East Anglia, Norwich.
Dolman, P. M., Lovett, A., O’Riordan, T., & Cobb, D. (2001). Designing whole landscapes. Landscape
Research, 26, 305–335.
Ehlschlaeger, C. R., Shortridge, A. M., & Goodchild, M. F. (1997). Visualizing spatial data uncertainty
using animation. Computers & Geosciences, 23, 387–395.
Ervin, S. M., & Hasbrouck, H. H. (2001). Landscape modeling: Digital techniques for landscape
visualisation. New York: McGraw-Hill.
Fisher, P. F. (1999). Models of uncertainty in spatial data. In P. A. Longley, M. F. Goodchild, D. J.
Maguire, & D. W. Rhind (Eds.), Geographical information systems: Volume 1 principals and technical
issues (pp. 191–205). New York: John Wiley & Sons.
Fisher, P.& Unwin, D. (Eds.). (2002). Virtual reality in geography. London, UK: Taylor & Francis.
Harrison, P. A., & Butterfield, R. E. (1996). Effects of climate change on Europe-wide winter wheat and
sunflower productivity. Climate Research, 7, 225–241.
Hawkins, J., & MacMullen, R. (2001). An environmental strategy for the thirteen parishes within the
Norfolk Arable Land Management Initiative. Morley Research Centre, NALMI Project, Norfolk, UK.

T. Dockerty et al. / Comput., Environ. and Urban Systems 29 (2005) 297–320 319
Herrmann, S., & Osinski, E. (1999). Planning sustainable land use in rural areas at different spatial levels
using GIS and modelling tools. Landscape and Urban Planning, 46, 93–101.
Holman, I. P., Loveland, P. J., Nicholls, R. J., Shackley, S., Berry, P. M., Rounsevell, M. D. A., Audsley,
E., Harrison, P. A., & Wood, R. (2002). REGIS––regional climate change impacts response studies in
East Anglia and North West England. London: DEFRA.
Hossell, J. E., Jones, P. J., Marsh, J. S., Parry, M. L., Rehman, T., & Tranter, R. B. (1996). The likely
effects of climate change on agricultural land use in England and Wales. Geoforum, 27, 149–157.
Hudson-Smith, A., & Evans, S. (2003). Virtual cities: from CAD to 3-D GIS. In P. A. Longley & M. Batty
(Eds.), Advanced spatial analysis: The CASA book of GIS (pp. 41–60). Redlands, California: ESRI
Press.
Hulme, M., Jenkins, G. J., Lu, X., Turnpenny, J. R., Mitchell, T. D., Jones, R. G., Lowe, J., Murphy, J.
M., Hassell, D., Boorman, P., McDonald, R., & Hill, S. (2002). Climate change scenarios for the United
Kingdom: The UKCIP02 scientific report. Tyndall Centre for Climate Change Research, School of
Environmental Sciences, University of East Anglia, Norwich.
Hunter, G. J., & Goodchild, M. F. (1996). Communicating uncertainty in spatial databases. Transactions
in GIS, 1, 13–24.
Intergovernmental Panel on Climate Change (IPCC) (2001). Climate change 2001: The scientific basis.
Contribution of Working Group 1 to the Third Assessment Report of the Intergovernmental Panel on
Climate Change. Cambridge University Press, Cambridge.
Jude, S., Jones, A., Bateman, I., & Andrews, J. (2003). Developing techniques to visualise future coastal
landscapes. In E. Buhmann & S. Ervin (Eds.), Trends in landscape modeling (pp. 228–238). Heidelberg:
Herbert Wichmann Verlag.
Kardos, J. D., Moore, A., & Benwell, G. L. (2003). Visualising uncertainty in spatially referenced attribute
data using hierarchical spatial data structures. In Proceedings of GeoComputation 2003. University of
Southampton, Southampton, UK.
Lange, E. (2001). The limits of realism: perceptions of virtual landscapes. Landscape and Urban Planning,
54, 163–182.
Lange, E. (2002). Visualization in landscape architecture and planning––where we have been, where we are
now and where we might go from here. In E. Buhmann, U. Notthelfer, & M. Pietsch (Eds.), Trends in
GIS and virtualization in environmental planning and design (pp. 8–18). Heidelberg: Herbert Wichmann
Verlag.
Lorenzoni, I., Jordan, A., Favis-Mortlock, D., Viner, D., & Hall, J. (2001). Developing sustainable
practices to adapt to the impacts of climate change: a case study of agricultural systems in eastern
England (UK). Regional Environmental Change, 2, 106–117.
Lovett, A., Kennaway, R., S€unnenberg, G., Cobb, D., Dolman, P., O’Riordan, T., & Arnold, D. (2002).
Visualising sustainable agricultural landscapes. In P. Fisher & D. Unwin (Eds.), Virtual reality in
geography (pp. 102–130). London: Taylor & Francis.
MacFarlane, R. (2000). Managing whole landscapes in the post-productive rural environment. In J. F.
Benson & M. H. Roe (Eds.), Landscape and sustainability (pp. 129–156). London: Spon Press.
MacFarlane, R., Stagg, H., Turner, K., & Lievesley, M. (2004). Peering through the smoke? Tensions in
landscape visualisation. Computers, Environment and Urban Systems, this issue.
Muhar, A. (2001). Three-dimensional modelling and visualisation of vegetation for landscape simulation.
Landscape and Urban Planning, 54, 5–18.
Nakicenovic, N., & Swart, R. (Eds.) (2000). Special report on emissions scenarios. A special report of
Working Group III of the Intergovernmental Panel on Climate Change. Cambridge University Press,
Cambridge.
Nicholson-Cole, S. (2004). Representing climate change futures: A critique on the use of images for visual
communication. Computers, Environment and Urban Systems, this issue.
Ordnance Survey (2004). Available: http://www.ordnancesurvey.co.uk.
O’Riordan, T., Lovett, A., Dolman, P., Cobb, D., & S€unnenberg, G. (2000). Designing and implementing
whole landscapes. Ecos, 21, 57–68.
O’Riordan, T., Wood, C., & Shadrake, A. (1993). Landscapes for tomorrow. Journal of Environmental
Planning and Management, 36, 123–147.

320 T. Dockerty et al. / Comput., Environ. and Urban Systems 29 (2005) 297–320
Orland, B., Budthimedhee, K., & Uusitalo, J. (2001). Considering virtual worlds as representations of
landscape realities and as tools for landscape planning. Landscape and Urban Planning, 54, 139–148.
Parry, M., Carson, I., Rehman, T., Tranter, R., Jones, P., Mortimer, D., Livermore, M., & Little, J.
(1999). Economic implications of global climate change on agriculture in England and Wales. Research
Report No. 1. Jackson Environment Institute, London.
Parry, M., & Carter, T. (1998). Climate impact and adoption assessment. London, UK: Earthscan.
Sheppard, S. R. J. (1989). Visual simulation: A user’s guide for architects, engineers, and planners. New
York: Van Nostrand Reinhold.
Sheppard, S. R. J. (2001). Guidance for crystal ball gazers: Developing a code of ethics for landscape
visualisation. Landscape and Urban Planning, 54, 183–189.
SDRI (1999). QUEST overview. Sustainable Development Research Institute, University of British
Colombia, Vancouver.
SPRU (1999). Non-climatic futures study: Socio-economic futures scenarios for climate impact assessment––
final report. Science and Technology Policy Research Unit, University of Sussex, Brighton.
Stock, C., & Bishop, I. D. (2002). Immersive, interactive exploration of changing landscapes. In
Proceedings of IEMSs 2002––Integrated Assessment and Decision Support (Volume 1, pp. 30–35).
International Environmental Modelling and Software Society, Lugano, Italy.
Swetnam, R. D., Wilson, J. D., Whittingham, M. J., & Grice, P. V. (2004). Designing lowland landscapes
for farmland birds: Scenario testing with GIS. Computers, Environment and Urban Systems, this issue.
Terrex (2004). Available: http://www.terrex.com. (TerraVista).
Townshend, D., Stace, H., & Radley, D. (2004). State of nature: Lowlands––future landscapes for wildlife.
Peterborough: English Nature.
Tufte, E. R. (1992). The visual display of quantitative information. Cheshire, Connecticut: Graphics Press.
Tyndall Centre (2004). Available: http://www.tyndall.ac.uk.
UK Climate Impacts Programme (2000). Socio-economic scenarios for climate change impact assessment: A
guide to their use in the UK Climate Impacts Programme. UKCIP, Oxford, UK.
UK Climate Impacts Programme (2004). Available: http://www.ukcip.org.uk.
Viner, D., Jordan, A., Lorenzoni, I., & Favis-Mortlock, D. (2000). The potential impact of climate change
in the Norfolk Arable Land Management Initiative (NALMI) area over the next 30–50 years. CRU/
CSERGE, University of East Anglia, Norwich, UK.
Zhang, J., & Goodchild, M. F. (2002). Uncertainty in geographical information. London, UK: Taylor &
Francis.