Visual Networking - ePublications at Regis University
111
Regis University ePublications at Regis University All Regis University eses Spring 2010 Visual Networking James Paul Regis University Follow this and additional works at: hps://epublications.regis.edu/theses Part of the Computer Sciences Commons is esis - Open Access is brought to you for free and open access by ePublications at Regis University. It has been accepted for inclusion in All Regis University eses by an authorized administrator of ePublications at Regis University. For more information, please contact [email protected]. Recommended Citation Paul, James, "Visual Networking" (2010). All Regis University eses. 448. hps://epublications.regis.edu/theses/448
-
Upload
khangminh22 -
Category
Documents
-
view
0 -
download
0
Transcript of Visual Networking - ePublications at Regis University

Regis UniversityePublications at Regis University
All Regis University Theses
Spring 2010
Visual NetworkingJames PaulRegis University
Follow this and additional works at: https://epublications.regis.edu/theses
Part of the Computer Sciences Commons
This Thesis - Open Access is brought to you for free and open access by ePublications at Regis University. It has been accepted for inclusion in All RegisUniversity Theses by an authorized administrator of ePublications at Regis University. For more information, please contact [email protected].
Recommended CitationPaul, James, "Visual Networking" (2010). All Regis University Theses. 448.https://epublications.regis.edu/theses/448

Regis University College for Professional Studies Graduate Programs
Final Project/Thesis
DisclaimerUse of the materials available in the Regis University Thesis Collection (“Collection”) is limited and restricted to those users who agree to comply with the following terms of use. Regis University reserves the right to deny access to the Collection to any person who violates these terms of use or who seeks to or does alter, avoid or supersede the functional conditions, restrictions and limitations of the Collection.
The site may be used only for lawful purposes. The user is solely responsible for knowing and adhering to any and all applicable laws, rules, and regulations relating or pertaining to use of the Collection.
All content in this Collection is owned by and subject to the exclusive control of Regis University and the authors of the materials. It is available only for research purposes and may not be used in violation of copyright laws or for unlawful purposes. The materials may not be downloaded in whole or in part without permission of the copyright holder or as otherwise authorized in the “fair use” standards of the U.S. copyright laws and regulations.

VISUAL NETWORKING
A PROJECT
SUBMITTED ON 16 APRIL, 2010
TO THE DEPARTMENT OF INFORMATION TECHNOLOGY
OF THE SCHOOL OF COMPUTER & INFORMATION SCIENCES
OF REGIS UNIVERSITY
IN PARTIAL FULFILLMENT OF THE REQUIREMENTS OF
MASTER OF SCIENCE IN SYSTEMS ENGINEERING
BY
JAMES PAUL
APPROVALS
Erik Moore
Daniel Likarish
Douglas I. Hart

VISUAL NETWORKING Page 2 of 109
Abstract This research presents a case study of the Regis Academic Research Network (ARNe). It will focus on network bandwidth graphs and the information collected over a six month period of time. The case study will provide comparison of network bandwidth graphs. This case study will be used to theorize what is happening on the ARNE. In addition it will be used for creating hypotheses on what will happen to the network in the future. The research will also include a project. The project is to provide the setup and planning of the installation of open source tool set. This project will give Regis network administrators a useful tool in troubleshooting and planning with regards to the ARNE.

VISUAL NETWORKING Page 3 of 109
Acknowledgements I would like to thank my teachers, classmates and family for their knowledge and support while pursuing this project. I would also like to thank the all the in the open source software community for providing robust free enterprise tools to customize, create and implement however needed. Lastly, I would like to thank Steven Huart a Doctor in an unrelated field for providing an unbiased critique of the project and its components.
VISUAL NETWORKING Page 4 of 109
Table of Contents Abstract ........................................................................................................................................... 2 Acknowledgements ......................................................................................................................... 3 Table of Contents ............................................................................................................................ 4 List of Figures ................................................................................................................................. 5 List of Tables ................................................................................................................................... 6 Chapter 1 - Introduction .................................................................................................................. 7
Thesis Statement ......................................................................................................................... 7 Statement of Technical Problem ................................................................................................. 7 Project Relevance ........................................................................................................................ 8 What to Expect ............................................................................................................................ 9
Chapter 2 - Review of Literature and Research .............................................................................. 9 Terms and Definitions ................................................................................................................. 9
Computer ................................................................................................................................ 9 Software ................................................................................................................................ 11 Network ................................................................................................................................ 21 SNMP ................................................................................................................................... 23 MIB ....................................................................................................................................... 24 OID ....................................................................................................................................... 25 Community String ................................................................................................................ 29
Chapter 3 - Methodology............................................................................................................... 29 Chapter 4 - Results ........................................................................................................................ 38
Data Analysis ............................................................................................................................ 38 Time and Accuracy ............................................................................................................... 39 Planning and Implementing .................................................................................................. 42 Troubleshooting .................................................................................................................... 45
Chapter 5 – Project History ........................................................................................................... 60 Implementation ......................................................................................................................... 60
OS ......................................................................................................................................... 61 Packages ............................................................................................................................... 62 NTP ....................................................................................................................................... 66 Cacti ...................................................................................................................................... 67 Cacti Plugin Architecture ..................................................................................................... 69 Plugins .................................................................................................................................. 69 SSL ....................................................................................................................................... 71 Login Page ............................................................................................................................ 73 Access ................................................................................................................................... 74 Network ................................................................................................................................ 75
Cacti Setup ................................................................................................................................ 75 Chapter 6 - Conclusions ................................................................................................................ 83 References ..................................................................................................................................... 85 Appendix A ................................................................................................................................... 90 Appendix B.................................................................................................................................... 90 Appendix C.................................................................................................................................... 90 Appendix D ................................................................................................................................. 100

VISUAL NETWORKING Page 5 of 109
List of Figures Figure 2 - 2 ........................................................................................................................ 26 Figure 2 - 3 ........................................................................................................................ 28 Figure 4 - 1 ........................................................................................................................ 74 Figure 5 - 1 ........................................................................................................................ 76 Figure 5 - 2 ........................................................................................................................ 77 Figure 5 - 3 ........................................................................................................................ 78 Figure 5 - 4 ........................................................................................................................ 79 Figure 5 - 5 ........................................................................................................................ 79 Figure 5 - 6 ........................................................................................................................ 80 Figure 5 - 7 ........................................................................................................................ 81 Figure 5 - 8 ........................................................................................................................ 81 Figure 5 - 9 ........................................................................................................................ 82 Figure 5 - 10 ...................................................................................................................... 82 Figure 5 - 11 ...................................................................................................................... 82 Figure 6 - 1 ........................................................................................................................ 40 Figure 6 - 2 ........................................................................................................................ 41 Figure 6 - 3 ........................................................................................................................ 42 Figure 6 - 4 ........................................................................................................................ 42 Figure 6 - 5 ........................................................................................................................ 44 Figure 6 - 6 ........................................................................................................................ 46 Figure 6 - 7 ........................................................................................................................ 46 Figure 6 - 8 ........................................................................................................................ 46 Figure 6 - 42 ...................................................................................................................... 48 Figure 6 - 43 ...................................................................................................................... 48 Figure 6 - 44 ...................................................................................................................... 49 Figure 6 - 53 ...................................................................................................................... 51 Figure 6 - 54 ...................................................................................................................... 51 Figure 6 - 56 ...................................................................................................................... 52 Figure 6 - 57 ...................................................................................................................... 53 Figure 6 - 58 ...................................................................................................................... 55 Figure 6 - 59 ...................................................................................................................... 56 Figure 6 - 60 ...................................................................................................................... 56 Figure 6 - 61 ...................................................................................................................... 57 Figure 6 - 62 ...................................................................................................................... 58 Figure 6 - 63 ...................................................................................................................... 59 Figure 6 - 64 ...................................................................................................................... 59 Figure 6 - 65 ...................................................................................................................... 60

VISUAL NETWORKING Page 6 of 109
List of Tables Table 1 …………………………………………………………………………..…… 20 Table 2 ……………………………………………………………………………..… 21
VISUAL NETWORKING Page 7 of 109
Chapter 1 - Introduction
Thesis Statement In this case study a small network of network devices will be monitored in the
Regis Academic Research Network (ARNe). There are 13 network devices that will be a
part of the case study. These devices will have data collected from them by the
associated project. The data collected from the project will be observed and compared
over a 6 month period of time in order to develop trends or patterns to understand
network traffic. At the end of the six months the data will be extracted in the form a
graph. The network traffic will then be used to determine if this method is sufficient
infer problems or aid in planning of future projects on the ARNe. The hypothesis is that
a visual network monitoring system would be an effective and efficient way for Regis
network engineers to monitor their network devices.
Statement of Technical Problem Computer networks can experience many problems such as packet loss, data
corruption and latency (Marchette, 2001). Monitoring and managing a network on an
ongoing basis is a daunting task (Frisch, 2002). A network monitor is a system designed
to monitor traffic in and out of the network for the purpose of determining whether the
network is working properly. (Marchette, 2001) How fast can a network monitoring
system identify potential problems in the network compared to a person doing the same
work?
When a computer network is up and all the applications are functioning great the
users are typically happy with the service provided by the network. What happens when
VISUAL NETWORKING Page 8 of 109
things change in the network or add a new service that utilizes the computer network?
How will it be determined if the current computer network will support adding services?
What level of service can be provided a user and/or application if there is no way
to measure it? These problems go unanswered every day because monitoring network
traffic is considered a luxury that is not critical in order for a computer network to
function. Other reasons that computer network monitoring isn’t thought of as an
immediate need is the time it takes to setup a solution, the knowledge base required to
implement the solution, and money. Setting up enterprise network monitoring solutions
takes time and expertise and they are expensive.
Project Relevance
The goal of this research is to explain and implement a method of capturing
statistical data from the ARNE. It is the intent of the research to provide analysis of the
data as well as a monitoring application for RUSP to be used in the future long after the
initial research is over. The monitoring application will have to be user friendly, easy to
use and support a variety of different devices that may be connected to the computer
network.
The results of the case studied and corresponding project should be verified by the
activities and cases that have historically already happened over the past six months in
ARNE. This can be done by comparing open and closed ARNE tickets with the results
and data collect with this project. That can be accomplished by comparing incidents and
time lines with the dates and times of data collection in this project. However this case
study will not compare or contrast those other cases or incidences and will be deemed out
of scope for this project.

VISUAL NETWORKING Page 9 of 109
What to Expect The discussion in the following chapters will focus on the details of the project.
Chapter Two will describe the research methods and resource requirements utilized.
Chapter Three will include terms and definitions plus a review of the literature and
existing research to support the thesis of this project. Chapter Four analyze the data and
present the results of the project. Chapter five defines how the project was designed and
implemented plus the setup of the monitoring tool. The last chapter, Six will end with a
conclusion and summary.
Chapter 2 - Review of Literature and Research
Terms and Definitions To grasp the concepts of the project let’s review some terminology. This is a
detailed list of terms and definitions discussed in the following chapters. It is
recommended the reader review and become familiar with them before continuing.
The project is being built from the ground up and is not an addition or add-on to
any other project. To start off the project a review of basic computer terms and progress
to software terminology and, finally, network terms.
Computer The project that has been built for the case study requires a personal computer
(PC) or server. There are technical differences between the two however they are
irrelevant for this discussion. For this project a PC was chosen for the fact as it was

VISUAL NETWORKING Page 10 of 109
donated, and met minimum specification as set before the project. There are too many
components of a computer to talk about all of them so let’s focus on the CPU, memory
and storage.
The CPU, or central processing unit, is the brains or logic behind the computer.
The CPU will dictate how fast the project will respond to querying and gathering data.
CPUs are normally measured in megahertz (MHz) or gigahertz (GHz) and it reflects the
number of cycles per second a processor can perform. The cycles per second are how
many times a CPU can change its voltage from high to low and back again. This project
is has one purpose and that is to collect network data which is a low processor intensive
action. For that reason the minimum CPU requirements are low.
Memory in a computer is a fast temporary storage place for instructions or data
for the CPU. This type of memory requires electrical power for it to retain data. If power
is lost, data is lost. Memory is measured in megabytes and gigabytes. You can fit 500
pages of text on 1 megabyte of electronic memory (Conjecture, 2009). In context to this
case study and corresponding project the memory will be mainly used to support the
functions of the operating system it will be used slightly for the monitoring application
that collect the network data but memory usage for that application will not exceed 128
megabytes.
Storage in this project is important because the project relies not only on
gathering data but also keeping it for a period of time. Storage allows the function of
keeping data for a long period of time even if power is lost. Storage in 2009 is going to
be measured in gigabytes or terabytes. You can fit 133251 Full Pages and 5266
Characters of text on 1 gigabyte of storage. The storage for this project will be collected
VISUAL NETWORKING Page 11 of 109
on a single hard drive. The data collection for six months will not exceed 10 gigabytes of
hard drive storage space.
Software
The case study and its corresponding project are built off of another project called
LAMP (Linux Apache MySql PHP). The case study will rely on LAMP and its
components to run the monitoring application. Linux is the very first component in
LAMP and it is an computer operating system. This is crucial because Linux is the core
that makes LAMP work. Without Linux it would be like trying to run a car without an
engine. The objective of Linux is to provide the operating system that will run the rest of
the parts of LAMP. There are many different types of Linux distributions and some are
tailored to installing the other three components. A distribution is simply a group or
organization that has packaged a Linux kernel with other tools and programs to make an
operating system. Linux operating systems or distributions are almost always free.
There are exceptions, but in this case it won’t be an issue.
Installing Linux can be really easy or really hard depending on which distribution
is chosen. This project will take on an installation of a Linux distribution that is at a high
level.
The second component of LAMP is Apache. Apache is a web server that is
installed on the Linux operating system. Apache is a service that serves web pages.
When going to a website from your browser, in order to get the content for that website,
the browser actually contacts and communicates to a web server owned by the website
owner. One of the more interesting industry surveys shows that in 2006 nearly 70
percent of all web servers were Apache (Rosen, Host, Klee, Farber and Rosinski 2007).
VISUAL NETWORKING Page 12 of 109
Apache is not just for Linux. Apache can be installed with many different
operating systems like UNIX and Windows. The Apache project was created in 1995
(Rosen, Host, Klee, Farber and Rosinski 2007). It was created from a spin off of another
project that was no longer being developed. It has been said that Apache received its
name from the fact that it was used to patch the other project that was not getting
developed anymore (Rosen, Host, Klee, Farber and Rosinski 2007).
MySql, or my sequel, is a database and is the third component of LAMP. A
database allows website and applications developers to manipulate a lot of data without
having to specify or hard code software to do the same function. A database is like a
smart piggy bank. It’s a container for money or leftover change. However this piggy
bank is smart and it can tell how many dimes are in it or where the dimes were minted.
MySql is a piggy bank for data. It is a central place where data can be kept for other
programs or applications to use. It keeps data in order and accessible.
MySql was developed by T.c.X. DataKonsultAB (Rosen, Host, Klee, Farber and
Rosinski 2007). It is not limited to Linux use but has cross operation system capabilities.
MySql features include speed, ease of use and reliability (MySql AB, 2007). MySql is a
multi-threaded program used for different software program libraries and has multiple
different API’s (application programming interface). An API can be very useful in a
database, especially if all the commands that are needed are unknown to the user. MySql
can be one the hardest parts to setup and get working properly. In the installation of
MySql it is easy to install, however, what is not seen is how hard it is to actually create a
database for it to function.
VISUAL NETWORKING Page 13 of 109
The last part of LAMP is Hypertext Preprocessor (PHP). PHP is primarily a
scripting language for server side computing. PHP is a powerful language that can
connect to the databases just created with MySql. It can also be embedded in html code
that the Apache server displays. PHP was created by Rasmus Lerdorf in 1995 and was
officially released in November 1997 (The PHP Group, 2007).
One issue with PHP is with Apache. To recognize PHP as a scripting language a
PHP module in Apache will need to be loaded. The way to load modules is to edit the
httpd.conf file normally located in the /etc/httpd directory.
What does LAMP do? What is the history? How did these four items come
together to create what has become one of the most dynamic set of tools in web
application development? In December 1998 author Michael Kunze published an article,
“Let There Be Light” (Kunze, 1998). The article centers on free web publishing tools
used to create dynamic customer accessible databases. Since then, LAMP has grown in
popularity. One indication of this is the number of career opportunities that are available
related to LAMP applications.
What is a real life application of LAMP? Imagine there was a small business that
wanted to create a website and sell snowmobile parts online to riders. This business
consisted of the owner and an idea. The owner had shopped around different technology
firms looking for one that would create, design and host this website for the least amount
of money. During his investigation the owner found out that the up front cost was
thousands of dollars more then he had expected. He turned to an acquaintance that was
in the technology field who recommended the open-source tool set called LAMP. The
acquaintance said if he was given a used desktop computer with good hardware he could

VISUAL NETWORKING Page 14 of 109
build it for him for a flat fee of $200 dollars. The flat fee sounded great and the actual
software was free so the owner of the snowmobile website did not have to pay any large
licensing fees for comparable software. The computer builder installed the server with
LAMP on it in a couple of hours.
The owner had the server connected to the Internet via his existing business’s
internet connection because it was not necessary to get a dedicated line while in the
startup. Needless to say, the owner had a fully functional web server with a database to
build the best online snowmobile parts website. However, without content and the
application, the parts of LAMP do absolutely nothing. The owner asked the person who
built the LAMP server for him how to get the website up and running. The server builder
told the owner to hire freelance software developers to build it.
After exhaustive research, the owner found the cost of hiring someone to create
his site was the same as before even though he had his own server and network. The
owner again went back to the LAMP builder for advice. The LAMP builder told the
owner about software that was already made that would instantly give him an online
store. The snowmobile parts website owner wanted to know how much that software
would cost him. The LAMP builder told him it was free but there would be a fee to pay to
have it installed by someone who knew what they were doing and he would do it for
another $200 dollars.
The software that was installed was a combination of a database, html and PHP
code. All the software was installed in the web directory. In that directory there is an
install.php file that would run via a web browser that asks for information like the
database password for MySql. After entering a minimal amount of information the

VISUAL NETWORKING Page 15 of 109
software creates all the databases and files on the web server in order to run an online
shopping cart website. The software that was chosen for this site is called Zen Cart. It
features a full shopping cart with pay pal integration. The owner is given a web interface
to add products, change prices, view orders and perform other accounting functions. The
snowmobile parts owner now had a fully functional LAMP server with a website and
online shopping cart with a database backend and only paid $400 dollars out of pocket.
The biggest limitation for him was cost; he absolutely did not want to pay the $1000 to
$2000 dollars just to get a website up plus the monthly costs to keep it running.
One limitation with these already predefined LAMP compatible software
packages like Zen Cart is limited styles that affect the way the web site can look.
Without a lot of customization the website will look like everyone else’s that downloaded
the same freeware software.
The second case study is not about a website to make money but a productivity
web application. John is a member of a network engineering team that manages 2000
devices for different clients. For security reasons, all 2000 devices have a unique
username and password. The problem for John to solve was how to manage all those
passwords and still make them secure. Currently the team is using an excel spreadsheet
to do this function and there have been issues with not updating the spreadsheet or having
the wrong version that does not have the passwords for new devices.
John knew the best way to keep a lot of data was to put it into a database.
However John was not going to be given any resources or money for this project. John
was also not going to get a database administrator or software to create this database. He
started looking at open-source tools and came across LAMP. John already knew about
VISUAL NETWORKING Page 16 of 109
Linux and Apache so he would have to leARNe two more programs, PHP and MySql, to
be successful in creating a password manager. Linux and Apache would be used to
display the application to the users, PHP would be developed as the user interface, and
MySql would store the passwords.
Since John used a database to store all the passwords he was able take his time
getting familiar with PHP. In fact, he got so good at inserting and displaying database
items with PHP that he was able to create an application that allowed all fields to be
edited. In addition to all these pluses, adding new devices and clients could be done by
the lowest level technician.
John had one thing left to do and that was to make sure that the passwords would
not be compromised by outside hackers. For this he used all parts of LAMP to secure the
data. In Linux he deployed iptables which is a firewall and removed all non-essential
services. With Apache he was able to configure it so that it would only accept SSL
(secure socket layer) connections. This is equivalent to typing https:// in the web
browser. SSL makes sure that the connection between the user and server is encrypted so
no one can eavesdrop on the traffic to try and steal passwords. PHP code was developed
so that no passwords could be viewed from looking at the source code of the application,
not even the ones talking to MySql. For MySql, encryption was placed on the actual
passwords stored in the database.
John created this application out of necessity even though he did not make any
money from it. John chose LAMP because it was free and he already knew half of the
total tool set it took to complete this project. John and his co-worker enjoy a rich

VISUAL NETWORKING Page 17 of 109
customizable application for storing their 2000 passwords with customized searches to
find the right password fast.
Take a look at John’s project and point out one security feature mentioned
previously. Figure 2-1 above is
of the main login page of the
application John built. The
first security feature that was
implemented is that in the
address bar it shows
https://passwordlocker. This
means Apache is doing its job
and securing the connection between user and the server. The second security feature is
that the password to login to the site is unreadable meaning PHP is doing its job. Take a
look at the source file from this page and will notice no password to the database can be
found either. Because this is a real application no other screenshots can be shown.
The two examples above have demonstrated the power and ease of using LAMP.
There are some down sides to using LAMP that are worth noting. The biggest one and
the main reason some corporations will not go to LAMP is that it is open-source. Open-
source operating systems and programs are almost exclusively developed and supported
by a user base peer group. What this means to a corporation is that support is limited and
for a large corporation that intends to make money, that normally is an aspect of open-
source they can not risk. This is also why companies like Microsoft and Oracle still are
Figure 2 - 1

VISUAL NETWORKING Page 18 of 109
large players because they offer a variety of tools with support options that large
corporations feel more comfortable with.
The term open-source also stems from the fact that the source code to that
software is available to anyone who wants it. That can also be problematic because it’s
easier to find holes in software when given the source code. Add the fact that open-
source software is mostly unsupported by the creates for individuals it is hard to patch a
security hole if ones found and that makes corporations shy away from open-source
software. LAMP is a powerful set of tools but when to use them must be chosen wisely.
Not every situation calls for the use of LAMP. In a high volume production web
application this author personally would stick with a manufacturer supported product line
like Microsoft software.
Why LAMP for this project. LAMP has been proven faster, cheaper, more
flexible, and easier than any alternative for the project. In June 2005 CNET published an
article called “Open-Source LAMP a beacon to developers” where it states that more
corporations are moving toward LAMP and calling on developers to fill the positions
(LaMonica, 2005). This allows future developers on the project to use skill sets that
corporations are looking for. LAMP and its components are also requirements for a lot of
the open source monitoring software. There is a strong push to LAMP by vendors
ranging from IBM to Oracle to numerous startups—and these vendors are adding
enterprise-grade capabilities and management to LAMP. There is no question that
LAMP is not a passing trend, but now entering the mainstream as a serious contender to
J2EE and .NET (Yared, 2005). Software like Cacti, Nagios, NeDi, Zenoss all have
installation software that are based off of at least one or more components of LAMP.

VISUAL NETWORKING Page 19 of 109
This project is solely based of the software Cacti which relies on every component of
LAMP.
LAMP is not the only thing required for this project to work. Round robin
database tool (RRDTool) is software that will make all graphing and data collection
happen for the network monitoring tool. “RRDtool is the open-source industry standard,
high performance data logging and graphing system for time series data. Use it to write
the custom monitoring shell scripts or create whole applications using its Perl, Python,
Ruby, TCL or PHP bindings.” (Oetiker, 2009) There are other options to the RRDtool
like Torrus. The monitoring application Cacti that was chosen is engineered and setup to
use the RRDtool to use a different one like Torrus would mean going to a different
monitoring application. This is the brains behind the monitoring software and it is a key
part of making the graphs to be analyzed in the case study.
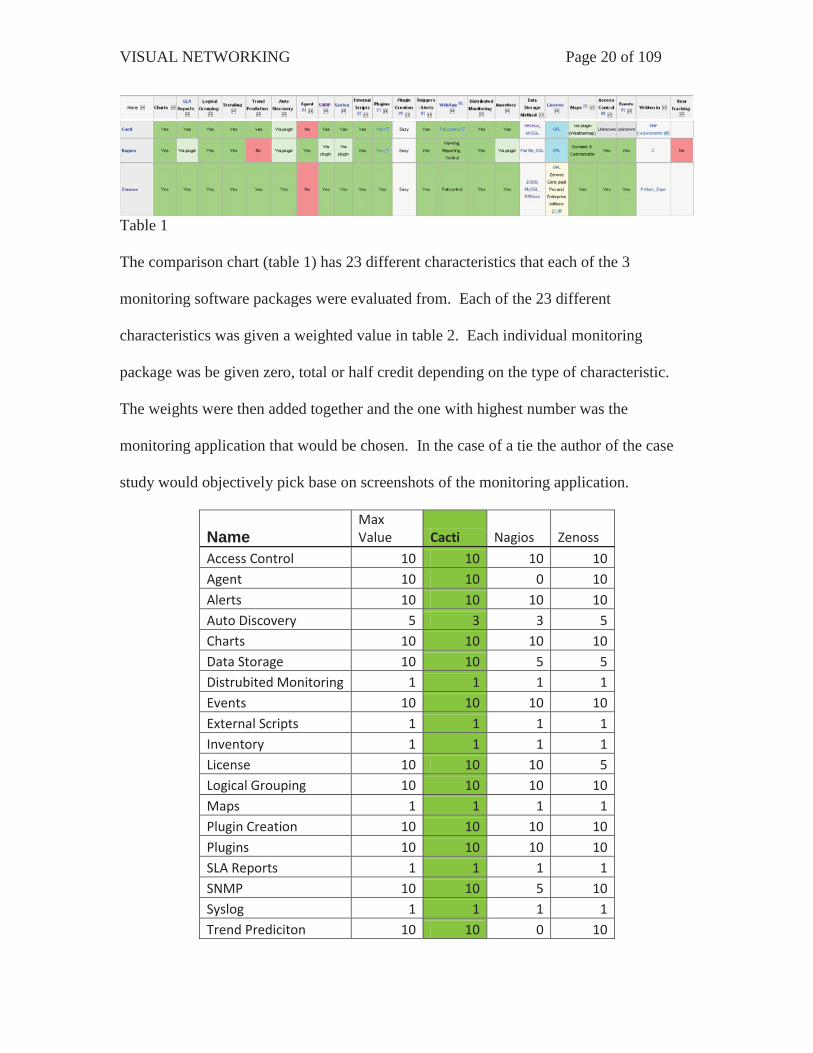
Cacti is the last piece of software to discuss. It was chosen out of a list of well
known open source network monitoring software packages. How this software was
chosen was by doing a comparison of features then picking the features that would best
suit the case study. The comparison chart feature on Wikipedia is one the most
comprehensive comparison charts that is kept up to date. It list both commercial and
open source monitoring software so it was easy to narrow down which software was
exclude completely based on cost. Out of the list on Wikipedia 3 monitoring software
packages were chosen for a more detailed comparison. The 3 packages chosen were
Cacti, Nagios and Zenoss and below are their features from Wikipedia.
VISUAL NETWORKING Page 20 of 109
Table 1
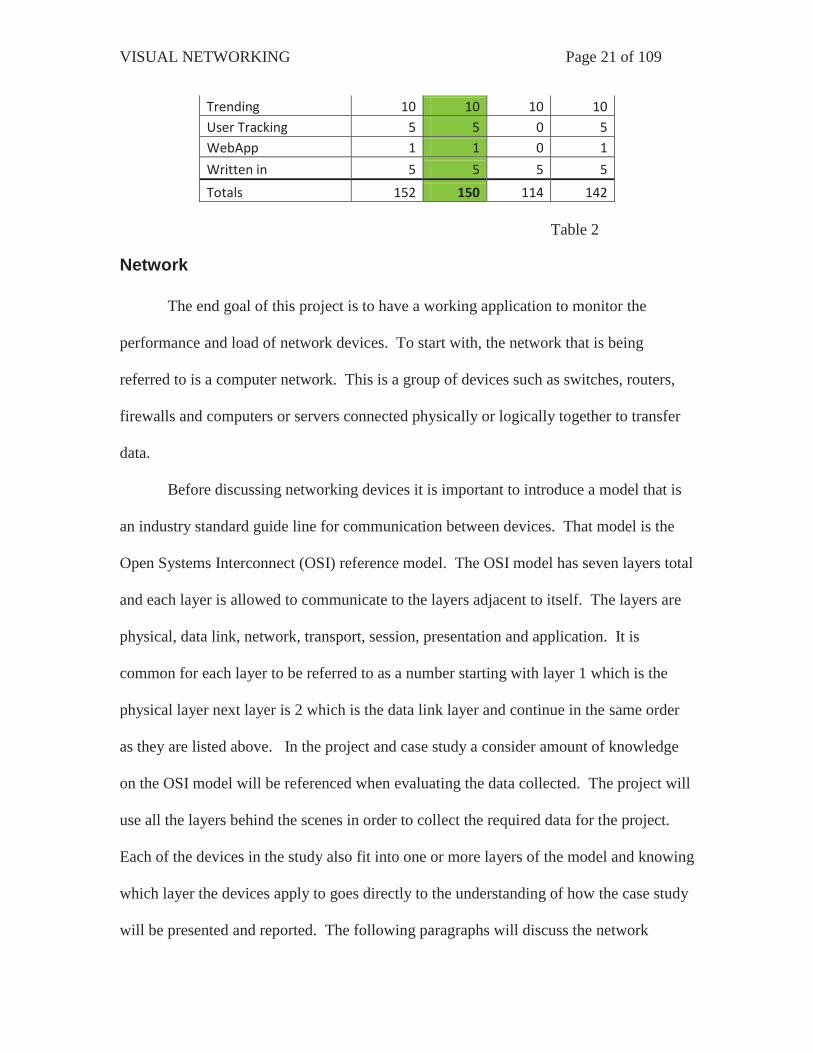
The comparison chart (table 1) has 23 different characteristics that each of the 3
monitoring software packages were evaluated from. Each of the 23 different
characteristics was given a weighted value in table 2. Each individual monitoring
package was be given zero, total or half credit depending on the type of characteristic.
The weights were then added together and the one with highest number was the
monitoring application that would be chosen. In the case of a tie the author of the case
study would objectively pick base on screenshots of the monitoring application.
Name Max Value Cacti Nagios Zenoss
Access Control 10 10 10 10 Agent 10 10 0 10 Alerts 10 10 10 10 Auto Discovery 5 3 3 5 Charts 10 10 10 10 Data Storage 10 10 5 5 Distrubited Monitoring 1 1 1 1 Events 10 10 10 10 External Scripts 1 1 1 1 Inventory 1 1 1 1 License 10 10 10 5 Logical Grouping 10 10 10 10 Maps 1 1 1 1 Plugin Creation 10 10 10 10 Plugins 10 10 10 10 SLA Reports 1 1 1 1 SNMP 10 10 5 10 Syslog 1 1 1 1 Trend Prediciton 10 10 0 10
VISUAL NETWORKING Page 21 of 109
Trending 10 10 10 10 User Tracking 5 5 0 5 WebApp 1 1 0 1
Written in 5 5 5 5
Totals 152 150 114 142 Table 2
Network
The end goal of this project is to have a working application to monitor the
performance and load of network devices. To start with, the network that is being
referred to is a computer network. This is a group of devices such as switches, routers,
firewalls and computers or servers connected physically or logically together to transfer
data.
Before discussing networking devices it is important to introduce a model that is
an industry standard guide line for communication between devices. That model is the
Open Systems Interconnect (OSI) reference model. The OSI model has seven layers total
and each layer is allowed to communicate to the layers adjacent to itself. The layers are
physical, data link, network, transport, session, presentation and application. It is
common for each layer to be referred to as a number starting with layer 1 which is the
physical layer next layer is 2 which is the data link layer and continue in the same order
as they are listed above. In the project and case study a consider amount of knowledge
on the OSI model will be referenced when evaluating the data collected. The project will
use all the layers behind the scenes in order to collect the required data for the project.
Each of the devices in the study also fit into one or more layers of the model and knowing
which layer the devices apply to goes directly to the understanding of how the case study
will be presented and reported. The following paragraphs will discuss the network

VISUAL NETWORKING Page 22 of 109
devices that are a part of the study and which layer or layers of the OSI model they
typically associate themselves with.
A switch is a network device that connects multiple computers together (Mitchell,
2009). Switches come in all shapes, sizes and manufacturers. Switches have different
port density which is how many devices can be connected to one switch. A typical
switch resides at the layer 2 or data link layer. In the case study the switches at this layer
are responsible for connecting smarter or decision make devices together such as PC’s,
servers, routers and firewall. Layer 2 controls physical addressing and the flow of traffic
between devices. The data link layer provides sequencing and flow control for
connection and connectionless oriented services.
Routers are devices that join multiple wired or wireless networks together
(Mitchell, 2009). Routers forward Internet Protocol packets from one network segment
to another. Routers also come in different sizes and from different manufacturers.
Routers operate at the network layer or layer 3 of the OSI model. The network layer
controls logical addressing and most notably indentified as the layer where Internet
Protocol (IP) addresses are defined. Routers operate at the network layer by mapping and
storing different networks and choosing the best path to those networks. In the case study
and corresponding project the routers are analyzed by their utilization of resource on the
router and not specifically for their layer three abilities.
Firewalls are network devices that protect networks from unauthorized access
(Mitchell, 2009). Firewalls are most commonly the first layer of defense within a
network. Applying firewalls is a given when trying to secure a network. There are two
types of firewalls, perimeter firewalls and personal firewalls. Simply put, a perimeter

VISUAL NETWORKING Page 23 of 109
firewall is a firewall that is placed between the network and unknown networks.
Perimeter firewalls are typically hardware devices that normally sit on the outside of the
internal network protecting it from unknown networks. A personal firewall is one that
resides on the computer or servers and can do more application level blocking. A
personal firewall will also protect the computer or server from unknown networks. The
internet is an example of the biggest unknown network. For this project, perimeter
firewalls are the only type of firewall that will be considered. Firewalls can operate at the
network layer through the application layer depending on firewall type. As with routers
the information from the firewall is utilization and not information specifically about a
particular layer.
Personal computers and servers are a part of the network but are not going to be
monitored or reported on as a part of this project. Most computers and servers on a
network sole function are not as network devices when referring to network devices these
will include switches, routers and firewalls. This project will only gather information at
network devices not at computers and servers in order to make an analysis of the
network. Switches, routers and firewalls are the three most common devices in any
network and are the only network devices located as part of the RUSP network.
SNMP The premise of the entire project rests on the understanding of Simple Network
Management Protocol (SNMP). This is the frame work that allows the gathering of
information from a network device or server. SNMP can be divided into two main
categories, GETs and TRAPs. An SNMP GET is when the monitoring software queries a
network device or server. An SNMP TRAP is when a network device or server sends a

VISUAL NETWORKING Page 24 of 109
notification that something happened. This project will only be concerned with SNMP
GETs. Without SNMP there would be no monitoring software or RRDTools.
There are three other terms that are required knowledge when dealing with any
type of network monitoring tool; Management Information Base (MIB), Object Identifier
(OID) and community string. The MIB is a tree structure with individual variables, such
as point status or description, being represented as leaves on a branch (Alvestrand, 1997).
A loft numeric tag or OID is used to distinguish each variable uniquely in the MIB and
SNMP messages. A community string is an access key to the network devices statistics.
When it comes to SNMP there are many possible versions. Each version adds
specific functionality to it. For this project snmp version 2c will be used which is one of
the most common and default setting for a lot of network devices. The basic difference
between the versions is how security is implemented. Since SNMP hosts a wealth of
information about the device it is very important to protect SNMP from unauthorized use.
In summary, SNMP is the protocol that network devices and servers use to communicate
with network monitoring systems in order to gather data and report on it.
MIB MIBs are like a structured database of all the statistics that can be read from a
network device or servers. OIDs are the specific stat that is reported on. For example, in
measuring a piece of paper, the ruler would be the SNMP, measuring in standard or
metric would be the MIB, and the height and width would be the OID.
To help aid in troubleshooting SNMP for this project there are three utilities that
were used; snmpwalk, snmpget and MIB Browser. These tools query the network device
and server taking software monitoring applications out of the picture to narrow down
VISUAL NETWORKING Page 25 of 109
where a problem might occur. SNMPwalk is a command line utility bundled into a
software package called snmp-utilities. What this command does is attach itself to a leaf
on the MIB tree and scan the rest of the leaves displaying the output of all the leaves it
finds for that tree. SNMPget is also a command line utility bundled into the snmp-
utilities software package. It will query a specific OID and display the results. The last
troubleshooting utility is MIB Browser by iReasoning. This allows the user to load MIBs
that are supplied by the network device manufacture and browse the tree structure
graphically. MIB browser can then do a SNMPwalk or SNMPget from any given MIB or
OID.
OID “Object identifiers are, basically, strings of numbers. They are allocated in a
hierarchical manner, so that, for instance, the authority for "1.2.3" is the only one that can
say what "1.2.3.4" means. They are used in a variety of protocols. The formal definition
of OIDs comes from ITU-T recommendation X.208 (ASN.1), which is available from the
ITU. The definition of OID is in chapter 28; the assignment of the "top of the tree" is
given in appendixes B, C and D. The encodings - how to transfer an OID as bits on the
wire - is defined in X.209” (Alvestrand, 1997).
Each position in the OID or string of numbers is a category. Take a Cisco
Firewall MIB for example. It can be downloaded from Cisco.com without even owning a
Cisco firewall, however, it is specific to Cisco firewalls so it does users no good without
owning a Cisco firewall. In the ARNE computer network there is one Cisco firewall and
it will be used as a practical example.

VISUAL NETWORKING Page 26 of 109
Figure 2 - 2
Figure 2 – 2 is a generic version of an OID that really only identifies the
company, which is Cisco. In this example it is critical to leARNe the OID structure so
when trying to monitor a device the information can be used to find the correct string of
numbers for the data or monitoring statistic. Take a closer look at figure 2 – 2. The first
digit, .1, is the first category and is called the Top level OID. There can be three options
here; a 0, 1 or 2. The first digit represents who assigned this particular OID. In this case
the OID was assigned by an organization called ISO. Below is a list of the three different
options available for the first category. All MIB information comes from an article on
Object Identifiers by H. Alvestrand.
0 - ITU-T assigned 1 - ISO assigned 2 - Joint ISO/ITU-T assignment
(Alvestrand, 1997)
The second digit dives deeper into the different levels of who assigned the OID.
The second category has more options than the first but is dependent on the first. The
first digit selected dictates the options for the second digit. In our Cisco example it is .1.3
1.0 - ISO Standard 1.1 - ISO Registration Authority (retired) 1.2 - ISO Member Body 1.3 - ISO Identified Organization
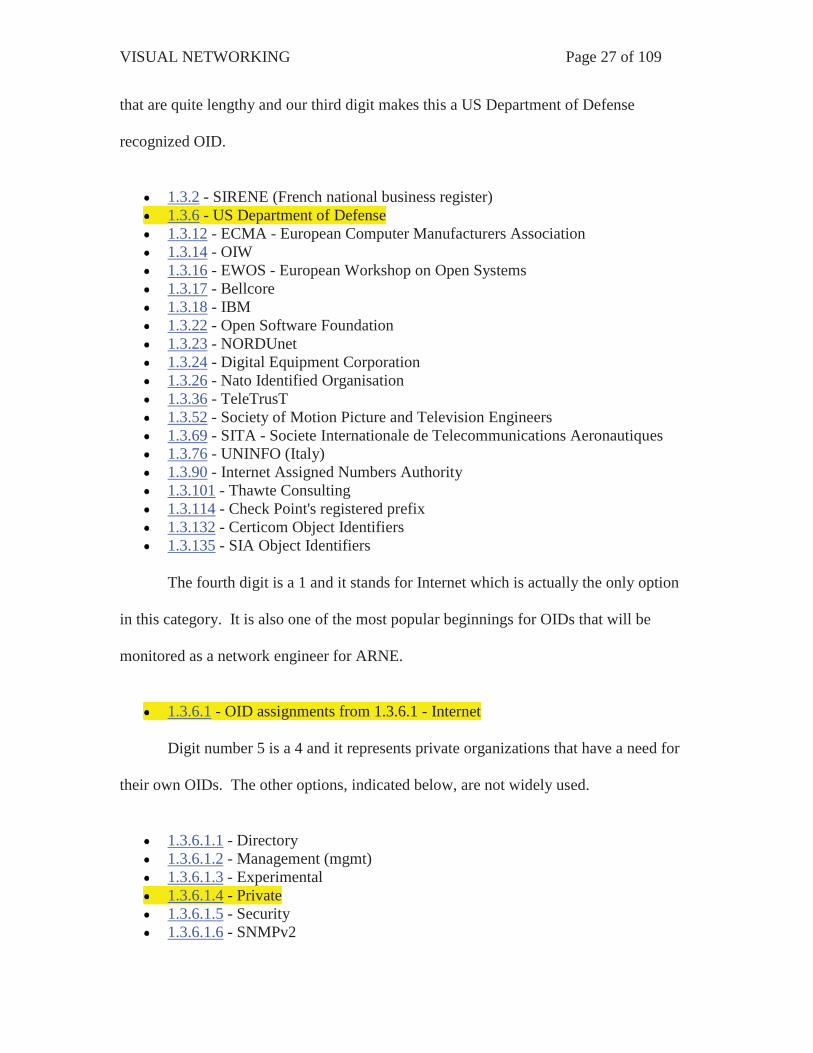
The third digit, which is a 6 in our example, is the category which lists the
organizations that are recognized by ISO. In the list below these have multiple options
VISUAL NETWORKING Page 27 of 109
that are quite lengthy and our third digit makes this a US Department of Defense
recognized OID.
1.3.2 - SIRENE (French national business register) 1.3.6 - US Department of Defense 1.3.12 - ECMA - European Computer Manufacturers Association 1.3.14 - OIW 1.3.16 - EWOS - European Workshop on Open Systems 1.3.17 - Bellcore 1.3.18 - IBM 1.3.22 - Open Software Foundation 1.3.23 - NORDUnet 1.3.24 - Digital Equipment Corporation 1.3.26 - Nato Identified Organisation 1.3.36 - TeleTrusT 1.3.52 - Society of Motion Picture and Television Engineers 1.3.69 - SITA - Societe Internationale de Telecommunications Aeronautiques 1.3.76 - UNINFO (Italy) 1.3.90 - Internet Assigned Numbers Authority 1.3.101 - Thawte Consulting 1.3.114 - Check Point's registered prefix 1.3.132 - Certicom Object Identifiers 1.3.135 - SIA Object Identifiers
The fourth digit is a 1 and it stands for Internet which is actually the only option
in this category. It is also one of the most popular beginnings for OIDs that will be
monitored as a network engineer for ARNE.
1.3.6.1 - OID assignments from 1.3.6.1 - Internet
Digit number 5 is a 4 and it represents private organizations that have a need for
their own OIDs. The other options, indicated below, are not widely used.
1.3.6.1.1 - Directory 1.3.6.1.2 - Management (mgmt) 1.3.6.1.3 - Experimental 1.3.6.1.4 - Private 1.3.6.1.5 - Security 1.3.6.1.6 - SNMPv2

VISUAL NETWORKING Page 28 of 109
1.3.6.1.7 - mail
The sixth digit is interesting because the majority of the time will use 1 as is
highlighted below. The options after 1 are all private enterprises like Cisco who are
given their own digit and they can then create their own MIBs from there.
1.3.6.1.4.1 - IANA-registered Private Enterprises 1.3.6.1.4.1306 - MTA Exim Schema 1.3.6.1.4.3224 - Netscreen 1.3.6.1.4.3609 - Cequs Inc. c=US Virtual Directory MIB 1.3.6.1.4.8300 - State of Wisconsin 1.3.6.1.4.17434 - Bio-Imaging SAS
The last digit in the figure 2 – 2 is a 9 and this represents Cisco. All Cisco OIDs
will start with 1.3.6.1.4.1.9. Below is just a sample of how many options there are.
There are a lot of companies using this convention and IBM, HP and Sun are just a few.
In reality, there could be an infinite number of different companies with their own
seventh digit number under the ISO.ORG.DOD.INTERNET.PRIVATE.ENTERPRISE
MIB.
1.3.6.1.4.1.2 - IBM 1.3.6.1.4.1.9 - Cisco 1.3.6.1.4.1.11 - Hewlett-Packard Company 1.3.6.1.4.1.18 - Wellfleet 1.3.6.1.4.1.23 - Novell 1.3.6.1.4.1.42 - Sun
In the example of the Cisco firewall the snmp string of numbers does not stop at
the seventh digit. After all, Cisco makes more than one product not just firewalls.
Figure 2 - 3
VISUAL NETWORKING Page 29 of 109
The eighth number is always Cisco Mgmt and is always 9 but the ninth digit is the
product category. In this case looking at a firewall MIB and the product number is 147.
Another product for Cisco is a load balancer. The eighth number for that product is 368
not 147. This is a critical category when trying to setup monitoring. Know what product
you are monitoring is important in order to be able to troubleshoot and test the
monitoring solution.
Community String A SNMP String is not a cord of fiber but a generic password for network
monitoring tools to be allowed to read the MIBs of network devices. The community
string must be configured on the network device and the network monitoring tool. They
must be the same on both devices before the network monitoring tool is allowed to read
the network device’s MIB. A community string can be almost any number of characters
that can be found on a keyboard. The default for almost every network device is called
“public”. Since the default of most community strings is public, it is recommended at
minimum that the default be changed. Otherwise, anybody that has access to the network
can start querying the network devices and may find out information that they are not
supposed to have. There are different types of community strings such are read-only and
read-write. In this project the only concern is with read-only strings.
Chapter 3 - Methodology
I. Plan
In implementing this study, the researcher’s intent is to measure bandwidth of the RUSP
network devices interface. In this project the researcher is looking for two things: 1)
VISUAL NETWORKING Page 30 of 109
what kind of bandwidth does RUSP network use and 2) what application or procedure is
used to identify if a network device is being over utilized.
II. Design
The research design is the statistical analysis of visual graphs gathered from the
RUSP network over a six month time period. The analysis will be performed to
determine whether or not this case study supports the use of graphic analysis in managing
the ARNe network to solve problems and/or aid in planning. The case study design is
based on network management practices and protocols that are industry standards as
defined by RFC1157. The Simple Network Management Protocol (SNMP) was to be
used to manage nodes in the Internet community. The Simple Network Management
Protocol (SNMP) is used to communicate management information between the network
management stations and the agents in the network elements (Case, Fedor, Schoffstall, &
Davin, 1990). Therefore, if the results are favorable, this project could be replicated by
other network engineers. It could be used on any computer network, from a large network
like Regis’s with numerous devices and huge bandwidth, to a small computer network.
The criteria for whether the case is successful is based on access, accuracy, ease of use
and customizability.
Accessibility defines whether or not the graphical representation of the ARNe
network could be seen by the network engineers over the course of the study. This is
measured in uptime of the graphing application. Uptime refers to the amount of time the
application has been running. Graphs that cannot be viewed cannot be analyzed.
Accessibility also refers to the speed in which data is accessed which is measured in time.
The faster the statistics can be graphed, the quicker analysis can start. In computer

VISUAL NETWORKING Page 31 of 109
network management the speed with which a problem can be identified and corrected is
directly related to quality of service expectations of the users of that network. Success
factors in accessibility would be 99 to 100 percent uptime on the graphing application
and less than a minute to create a graph from six months of data.
Accuracy is associated closely with reliability. The network engineers need to
know that the graphs collected from the network are correct, that the statistical graphs
match the information off of the devices, and that there is no deviation. This was
measured two ways. First, network devices were measured manually. Second, the
results were presented to ARNe network engineers to demonstrate the graphical analysis
of the data and solicit their feedback. Success factors in accuracy would be 100 percent
of all samples must be the same between actual statistics and graphical form.
Ease of use is how much easier it was for the engineers to use graphical data to
solve problems. At the beginning of the project, the researcher held a meet and greet
with Regis ARNe network engineers. The researcher asked two questions about the
current ARNe network. The first question asked was, “What kind of bandwidth does the
ARNe network use?” The second question was, “What do you use to tell if a network
device is being over utilized?” Not one of the network engineers could answer the
questions. Instead of basing the research off of a comparison between the old method of
data analysis (which was none) and the graphical analysis, the researcher based the
measurement of ease of use by studying similar cases and inferring the results. Success
factor in ease of use would be at the end of the case study the same group of engineers
can answer the questions above.

VISUAL NETWORKING Page 32 of 109
Not all computer networks are created the same so the research has to account for
a wide variety of network devices and be capable of graphing them. The way this was
measured in the case study was by creating graphical data from different types of network
devices like firewalls, routers and switches, and by different manufactures. For the
research to apply to networks in general the devices used in the research will have to
incorporate a wide variety of devices. This criterion is measured by the number of
different devices the research was able to graph and by how many vendors. Success
factors would include creation of graphs by 3 different types of network devices and 2
different vendors of network device as found in the ARNe network.
Supporting the design of the research is going to be a statistical analysis of
RUSP’s network. The case study will consist of six months of statistics and the analysis
of those statistics. Analysis of data in the form of a visual graph will be studied over a
period of time to gather data and make inferences about growth and potential bottlenecks
in the network. Through a descriptive approach it will reveal the nature of the network in
different situations and time.
This study is really designed as a quantitative form of research. In the field, trends
are much harder to quantify even though actual numbers are being used. This study will
look closely at the trends to make judgments which represent an experience based
analysis with factual data to backup the hypotheses. The study will use equipment to
keep track of the data with an outside date and time stamp resource for accuracy. A
computer will be required to collect the raw data. This will allow for an unbiased,
objective and precise measurement of the data. Once the collection equipment is
installed, data will be collected in five-minute intervals over a period of six months.

VISUAL NETWORKING Page 33 of 109
According to Yin (2009) there are four elements for judging the quality of
research design; validity, internal validity, external validity and reliability. The first
element, validity, is the use of correct operational measures for concepts being studied
and will be defined in Chapter 3 of the research paper. The second element is internal
validity. This study applies the principle of internal validity by evaluating the increase in
use of the RUSP network during the months of May and August when traditional classes
end and begin. The third element is external validity which means, can this study be
used to describe other cases like it? The answer is yes. By using industry standards and
methods described in the following chapters the results will stay the same regardless of
the case, i.e., increasing bandwidth or traffic in a network will affect the performance.
The fourth element is reliability. In order to achieve reliability in the current project, the
researcher minimized errors by collecting raw data with a computer. This study could be
replicated by another researcher with similar results.
III. Prepare
Network monitoring is one of the most overlooked and taken for granted areas of
the field according to Dave Piscitello, an authority on network security with more than 30
years experience in data networking and telecommunications (Piscitello, 2005). The
insight gathered from this study will help network administrators understand the tools
they need to monitor and maintain a computer network.
“Network monitoring software makes a practice of regularly taking virtual
snapshots of the network’s workflow (Conjecture, 2009).” With these snapshots, graphs
and charts can be created from the data. The snapshots or data can also be used in
trending and analysis of problems for future growth of the network. This is where the

VISUAL NETWORKING Page 34 of 109
title of Visual Networking comes from. Visual Networking means taking snapshot data
and creating a visual representation of the data to look at the network’s workflow. For
the rest of this study computer network will be referred to as just network.
Network problems come in many forms. One common network problem is packet
loss. When a user requests a website from his local computer the data is transferred
across the network in the form of data packets. Packet loss is data requested that is never
received. In the website example above, most web browsers will help correct for packet
loss by just asking for the missing data again. However, in video communications it is
not as simple as just asking for the packet again. Video is very time dependant. The
user’s experience is greatly depreciated if packets have been lost with video.
One cause of packet loss is network congestion (Zekauskas, 2005). Network
congestion is too much network traffic on one or more critical links in the network.
Almost all networks have multiples links, some in the thousands. How does one look at
them all to find the link or links that have too much traffic on them? A network
monitoring tool will help find those links without having to go to every device and every
server that is connected to a link to manually check the traffic.
The amount of data collection and correlation that needs to happen in order to
monitor a network is almost impossible for a person to do by hand. Data collection must
be fast and efficient in order to keep current and accurate records. Computers have the
ability to do repetitive tasks very fast and this is a critical component in the gathering of
data. The more data collected and the faster it can be collected, the more useful the
results will be.

VISUAL NETWORKING Page 35 of 109
A computer cannot run by just turning it on. The need arises for an operating
system (OS). The operating system for this research study is not as important as the
application. Every operating system has its benefits and limitations. In this research the
requirement for an OS is to be free because there is no funding for this project. The OS
will need to be stable. Even though one of the goals is not to spend money on buying an
operating system it will still need to be well built to get accurate data. CentOS is a Linux
operating system that meets all these requirements. According to the creators of CentOS
it is designed for people who need an enterprise class OS without the cost or dependency
on paid support from a vendor (Nelson, 2005).
IV. Collect
At the heart of the research data collection is the application that will be used. To
write a customized program to do this collection is out of the scope of the project and
would take longer than the study’s allowed timeline for research. The monitoring
application requirements are that it has to be open source (free), capable of doing charts,
trending, be agent less, SNMP and database data storage. An application called Cacti
was chosen because it meets all these requirements. “Cacti is a complete front end to
RRDTool. It stores all of the necessary information to create graphs and populate them
with data in a MySql database. Along with being able to maintain Graphs, Data Sources,
and Round Robin Archives in a database, Cacti handles the data gathering. There is also
SNMP support for those used to create traffic graphs with MRTG” (Cacti Group, 2009).
In the project the low number of devices that the case study is based it is not a concern
that monitoring software package be able to scale to thousands of devices. If that were
the case the Cacti would have to be analyzed for a load perspective. As is stands there
VISUAL NETWORKING Page 36 of 109
are multiple reported users that have hundreds of devices being monitored from Cacti.
Cacti is limited only by the time it takes to pull device information called the polling
cycle. The default poller in Cacti is called cmd.php and the time it takes to run that
command and complete is the key for determining the capacity that the Cacti monitoring
software can handle. The Cacti group has stated that any polling cycle that is under 300
seconds and Cacti’s default poller cmd.php will work fine. With the current case study
the time is 15 seconds this time means that there is and will be no capacity concerns for
immediate future. If there are issue Cacti has other options and ways to modify the
configuration to accommodate a polling cycle time higher than 300 seconds.
V. Analysis
Accessibility is the measurement of time the graphing application was running
and working in the ARNe network. It is a calculation based on when the case study
started and when it finished. This is called uptime and it can accurately determine if the
graphing application was useable during the period of the study. This case study was 6
months in length and uptime is measured in minutes. The total number of minutes in the
case study was 220,320 and the total time the application was up and useable by ARNe
engineers was 220,320. Taking the total time divided by the total time the application
was useable and multiplying it by 100 gives you the total uptime in percentage.
(220320/220430) * 100 = 100 percent uptime during the case study. The success factor
for this accessibility was a percentage of 99 to 100 which in this case was met.
Are the visual graphs accurate enough to troubleshoot and plan changes to the
ARNe network? This case took 5 different attributes from different network devices. An
example of an attribute is CPU utilization and it can actually be measured manually by
VISUAL NETWORKING Page 37 of 109
logging into the device and checking the CPU utilization on an ARNe network Cisco
ASA device. The 5 attributes were: CPU utilization, free memory, used memory and 2
different bandwidth interface measurements. Using these 5 different attributes as test
subjects the researcher compared the actual finding from manually measuring network
devices to the findings from the graphical analysis format designed for the case study. In
each of the 5 tests the graphs displayed the exact data from the network device. In the
sample of the CPU usage from the ARNe network Cisco ASA device, the firewall
reported 1 percent CPU usage and the graphing application also displayed 1 percent CPU
usage. The second validation for accuracy was feedback received when this case study
was presented to ARNe network engineers. In all specific statistical analysis of data the
ARNe network engineers were able to explain the changes to the network. Both the
sample comparisons and the feedback from ARNe network engineers led to the
conclusion that, both statistically and qualitatively, the process used in this case study is
accurate enough to troubleshoot and plan changes to the ARNe network.
Analyzing ease of use was the most difficult to quantify in the study. The
research started out looking at the relationship between text based information and
graphical based information. However, the purpose of this study is not simply to
determine whether graphs are better than text. The purpose is to determine if an ARNe
network engineer with no experience can readily use the proposed graphing application
by just logging in and start identifying problems. This criterion was met at the
presentation given to the ARNe network engineers at end of the study. By looking at the
graphs gathered over the period of time in the case study ARNe network engineers could
now answer the question proposed in the design, i.e., how much bandwidth is being used

VISUAL NETWORKING Page 38 of 109
in the ARNe network. After a one hour presentation on the statistical analysis, the ARNe
network engineers were able to tell the researcher what was happening and why it
happened.
For the study to be applicable to all networks it needed to prove that a graphical
analysis could help all networks. The ARNe network is an educational network meaning
that its equipment is largely donated or procured second hand. This means that makes
and models of network devices will vary. Having this variety of devices was a key
element of this case study helping to prove that it can be applicable for other networks.
The ARNe network in the case study had 2 different manufactures (Cisco and SonicWall)
and 8 different models of devices. Of those 8 different models there were 3 types of
network devices: firewalls, switches and routes. This study met the criteria for multiple
manufacturers and devices. However, before saying that all networks can use this
method, more qualifiers and additional studies would have to be preformed and reported
on. Suggestions for future research would include a larger number of test subjects.
Surveys of engineers that use graphed data to solve network issues could be compared to
engineers who do not use graphs and the amount of time to find a resolution of the
problem compared between the two groups.
Supporting the analysis is Cacti and the collection of data from ARNe. Data will be
analyzed by using graphs created by the project monitoring application. Complete detail
analysis is found in Chapter 6 Data Analysis.
Chapter 4 - Results
Data Analysis

VISUAL NETWORKING Page 39 of 109
Six months of data from the Cacti project was exported from the Cacti server on
November 1st, 2009. It was placed in Appendix B and comprises all data in graphical
format. The data is about 36 megabytes compressed zip files. It has daily, weekly,
monthly and yearly graphs. The data analysis is based off of information by category,
rather than a graph by graph basis. The three categories are time and accuracy, planning
and implementation, and troubleshooting.
Time and Accuracy Six months have passed and it is time to analyze the data gathered. First, take a
look at the video. The video in Figure 6-1 is an exact replication of the data that was just
gathered (clicking on Figure 6-1 will play the video). This sample was done by
collecting the data manually. The start of the video is designed so that the device is
already connected and the spreadsheet was already made. The only time that was
calculated was the time required for data collection.
VISUAL NETWORKING Page 40 of 109
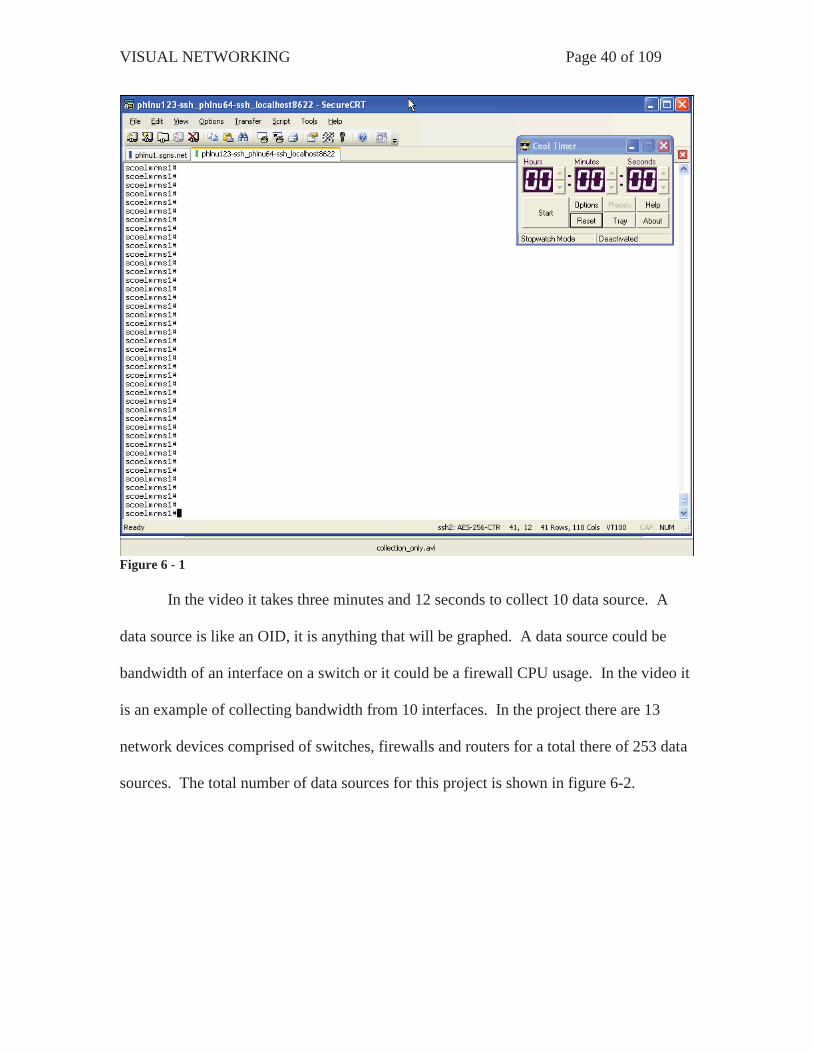
Figure 6 - 1 In the video it takes three minutes and 12 seconds to collect 10 data source. A
data source is like an OID, it is anything that will be graphed. A data source could be
bandwidth of an interface on a switch or it could be a firewall CPU usage. In the video it
is an example of collecting bandwidth from 10 interfaces. In the project there are 13
network devices comprised of switches, firewalls and routers for a total there of 253 data
sources. The total number of data sources for this project is shown in figure 6-2.

VISUAL NETWORKING Page 41 of 109
Figure 6 - 2 Taking the time from the video and performing a calculation of the number of
data sources calculate the amount of time it would take to manually collect data from 253
different data sources.
((192 / 10) * 253) / 60 = 80.96 minutes It would take over an hour to manually collect all the data from 253 data sources.
Even if the user could reduce the time in the video by a minute it would still take about
50 minutes. In the project there is a defined parameter for the frequency of data
collection and that was for all data sources to be polled every five minutes. It is clear that
manually collecting 253 data sources is impossible to do within five minutes let alone
doing it every five minutes. Figure 6-3 shows the statistics for Cacti collecting 253 data
sources. The times range from 15 seconds to a maximum of 16 seconds. There is no
more then a two second variance. Each collection cycle starts every five minutes. All
this leads to integrity and accuracy of the Cacti application and the data it collects.
VISUAL NETWORKING Page 42 of 109
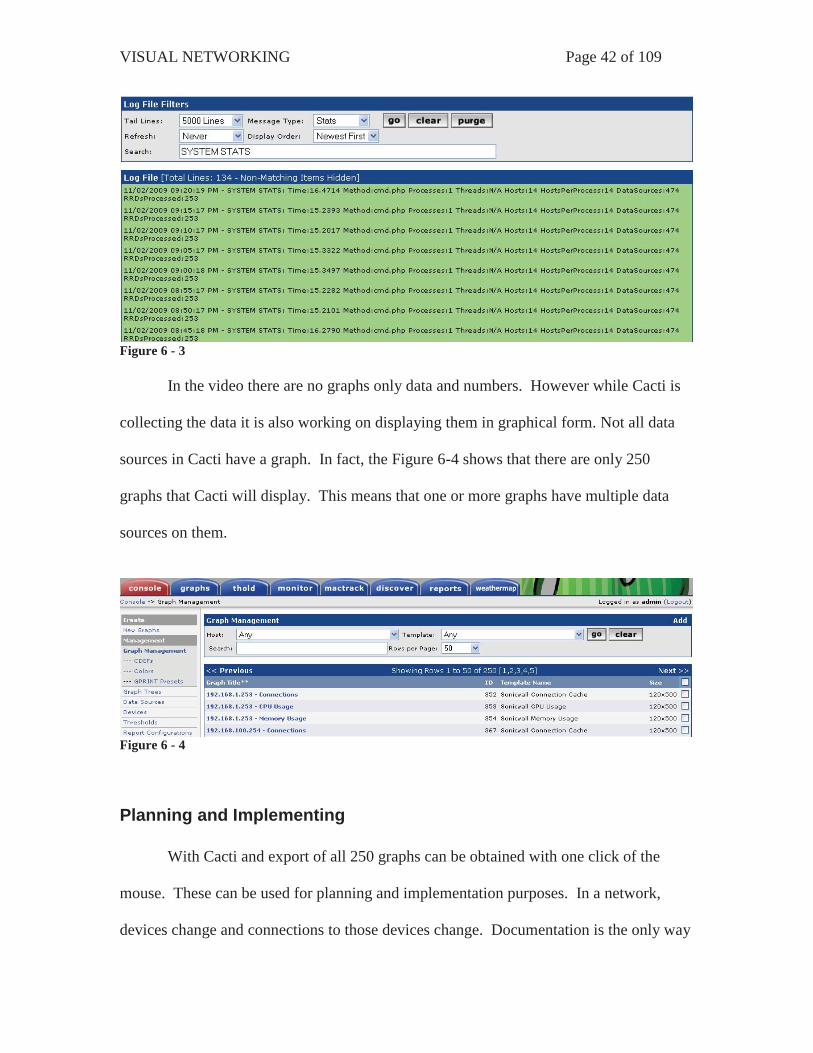
Figure 6 - 3 In the video there are no graphs only data and numbers. However while Cacti is
collecting the data it is also working on displaying them in graphical form. Not all data
sources in Cacti have a graph. In fact, the Figure 6-4 shows that there are only 250
graphs that Cacti will display. This means that one or more graphs have multiple data
sources on them.
Figure 6 - 4
Planning and Implementing With Cacti and export of all 250 graphs can be obtained with one click of the
mouse. These can be used for planning and implementation purposes. In a network,
devices change and connections to those devices change. Documentation is the only way

VISUAL NETWORKING Page 43 of 109
to know what is where at any given point. In the absence of documentation another way
to figure this out is to pull data directly off the device. In the time and accuracy section
of the video the same concept applies. It is unrealistic for a network engineer to access
every device to see if an interface is being used. One way to do this quickly is to export
all the graphs and see if there is any data on them. If there is no data on graphs marked as
interface assume that those interfaces are not being used and mark them available. This
method of port allocation is not recommended but is necessary for networks that are not
well documented.
An export of all the graphs can easily identify high usage on any of the data
sources. The eye can quickly scan multiple graphs and identify which network device
might have an issue. For example, adding more services or bandwidth could affect
existing devices or the implementation of the new services themselves. These high usage
areas are easily identified using graphs.
Analyzing the data gathered from the summary reveals there are a couple of
issues that need to be addressed. The first issue is that the three switches host names
dtcswc94back02, dtcswc94backinternet and dtcswcrouter_room, all have 60 percent CPU
utilization. This could affect new network services if they were plugged into these
switches. 60 percent CPU is high for the corresponding bandwidth that the interfaces are
reporting for each of their respective switches.
The second issue is more administrative than functional but it is hard to
implement or plan with outdated information. About 90 percent of all interfaces have no
description. Of those that do have a description, many have no data. The ones with a
description and no data probably indicate that this service was removed or
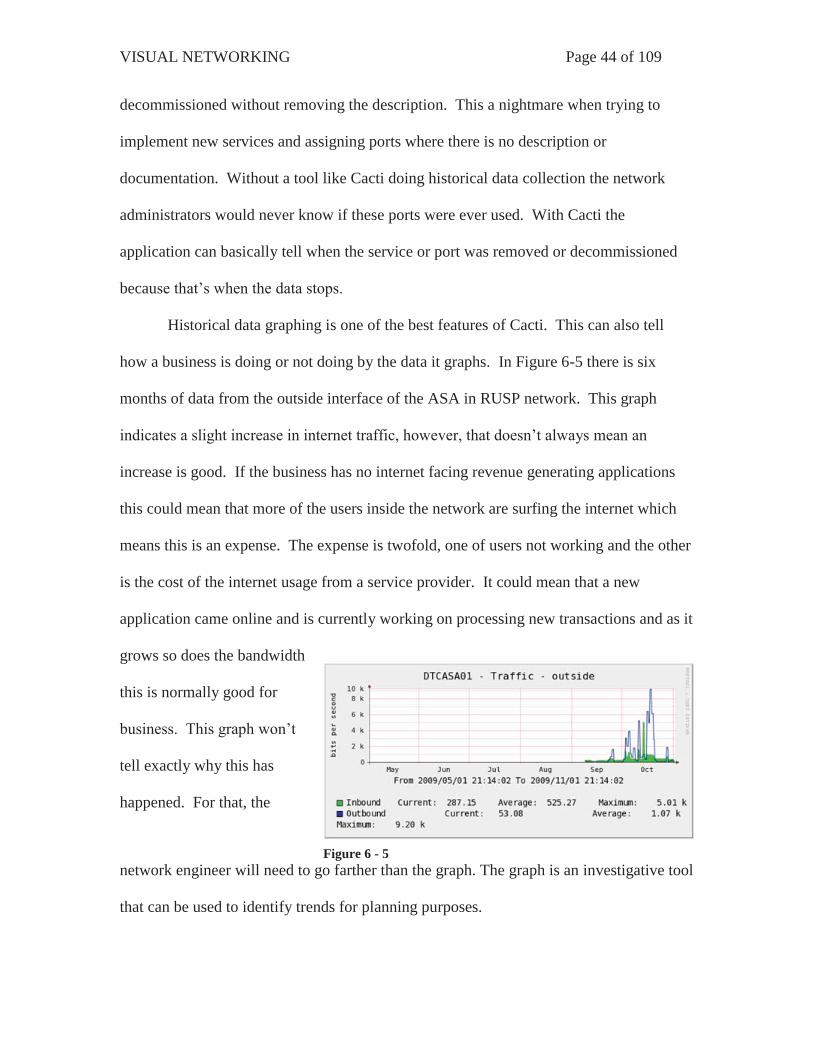
VISUAL NETWORKING Page 44 of 109
decommissioned without removing the description. This a nightmare when trying to
implement new services and assigning ports where there is no description or
documentation. Without a tool like Cacti doing historical data collection the network
administrators would never know if these ports were ever used. With Cacti the
application can basically tell when the service or port was removed or decommissioned
because that’s when the data stops.
Historical data graphing is one of the best features of Cacti. This can also tell
how a business is doing or not doing by the data it graphs. In Figure 6-5 there is six
months of data from the outside interface of the ASA in RUSP network. This graph
indicates a slight increase in internet traffic, however, that doesn’t always mean an
increase is good. If the business has no internet facing revenue generating applications
this could mean that more of the users inside the network are surfing the internet which
means this is an expense. The expense is twofold, one of users not working and the other
is the cost of the internet usage from a service provider. It could mean that a new
application came online and is currently working on processing new transactions and as it
grows so does the bandwidth
this is normally good for
business. This graph won’t
tell exactly why this has
happened. For that, the
network engineer will need to go farther than the graph. The graph is an investigative tool
that can be used to identify trends for planning purposes.
Figure 6 - 5
VISUAL NETWORKING Page 45 of 109
Troubleshooting One of the best reasons for having the Cacti network monitoring solution is for
troubleshooting. The figures and graphs below were taken directly from the RUSP
network. By using the summary graphs to identify which graphs had data and which
ones didn’t. These graphs are six months worth of data and can be used to help
troubleshoot issues that have happened. These troubleshooting inferences are solely
based on the graphs and further investigations would need to be made before any network
changes would be made.
In the planning stage it was identified that one or more switches had high CPU
utilization which may affect new services being installed. Cacti and the graphs it
generates can help troubleshoot this issue. There a three switches in the DTC campus all
indicating above 50 percent usage. Below are the CPU graphs (Figure 6-7, 8, 9) for
hostnames dtcswc94back02, dtcswc94backinternet and dtcswcrouter_room. The six
month analysis of the CPU usage graphs shows that there is a constant percentage and it
fluctuates very little. This indicates that nothing on these switches has demanded any
more or any less CPU resources and that they have reached stability in the network. This
is a good thing for the network and indicates that it could support more resources or
network devices added to these switches.
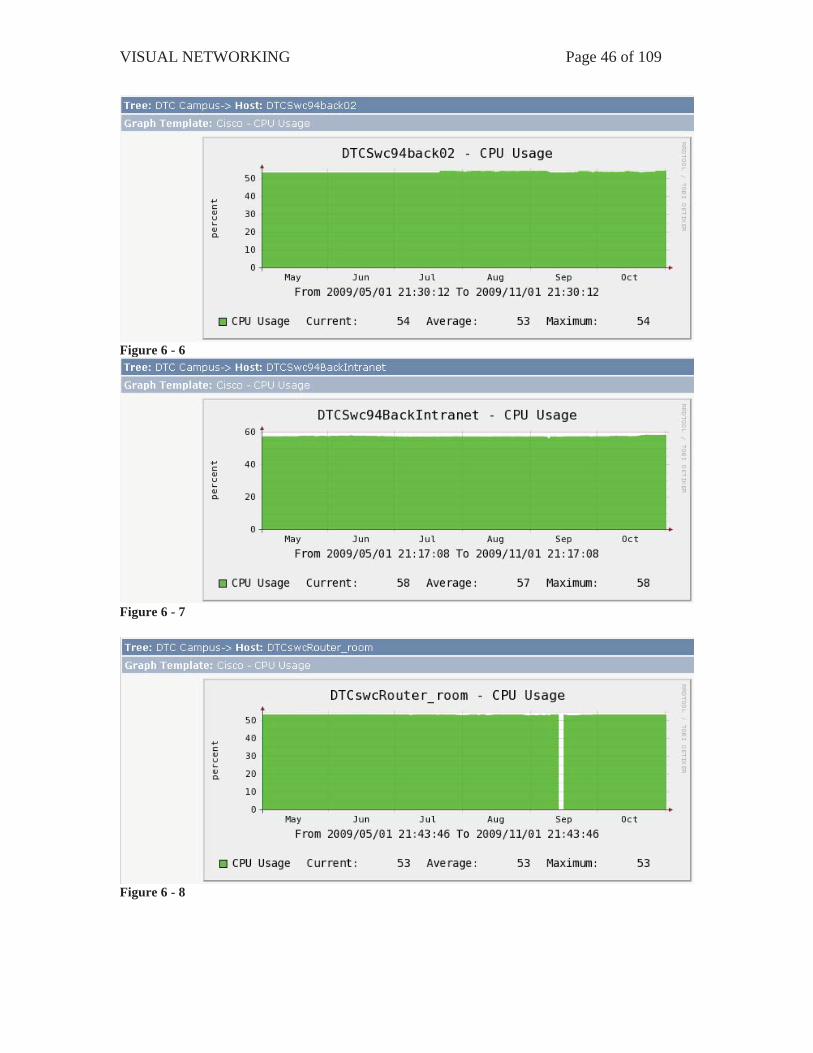
VISUAL NETWORKING Page 46 of 109
Figure 6 - 6
Figure 6 - 7
Figure 6 - 8

VISUAL NETWORKING Page 47 of 109
The next step is to identify why these switches would be just over 50 percent. By
using only the graphs and the monitoring tool that was just implemented analyzing the
individual interfaces and look for a load that would cause a high CPU utilization. For
switches to have high CPU usage it would take multiple interfaces on each switch. The
following is a list of all interfaces for switches dtcswc94back02, dtcswc94backinternet
and dtcswcrouter_room identified above. Not one of these switches has an interface that
is over utilized, let alone multiple interfaces over utilized. In fact, dtcswcrouter_room
has only three active interfaces (Figure 6-42, 43, 44) on the entire switch for the last six
months and nothing over 200 kbps (Figure 6-43). These levels are not enough to create a
50 percent CPU usage for these switches.
With this data there are two possible conclusions. One is that the switches are at
50 percent usage because the software version they are running requires 50 percent of the
CPU just to run idle. This also depends on the CPU in the switches. Old switches have a
smaller CPU. If the switch is running a newer software version that version may require
more processing power to run than originally intended for the switch. It is possible to put
a non recommended version of software on a switch that could also be causing a higher
CPU utilization at idle. This conclusion would require more research to include finding a
current version of the software and cross referencing it with a vendor recommended
solution.
The second possibility is the SNMP OID is incorrect and the data are wrong.
This can be ruled out easily by logging on to the switch and looking at the CPU usage. If
the current setting is around 50 percent then the chances that the readings have been
wrong are low.

VISUAL NETWORKING Page 48 of 109
The next steps are to watch the CPU for these switches when connecting new
devices to them. At 50 percent with few network devices connected, it could be a
wARNeing that something is wrong or could just be the way this switch works with the
current software version. Either way, with Cacti monitoring the setup on these switches
it will be able to see a change even when new devices are connected to the switches.
Figure 6 - 9
Figure 6 - 10
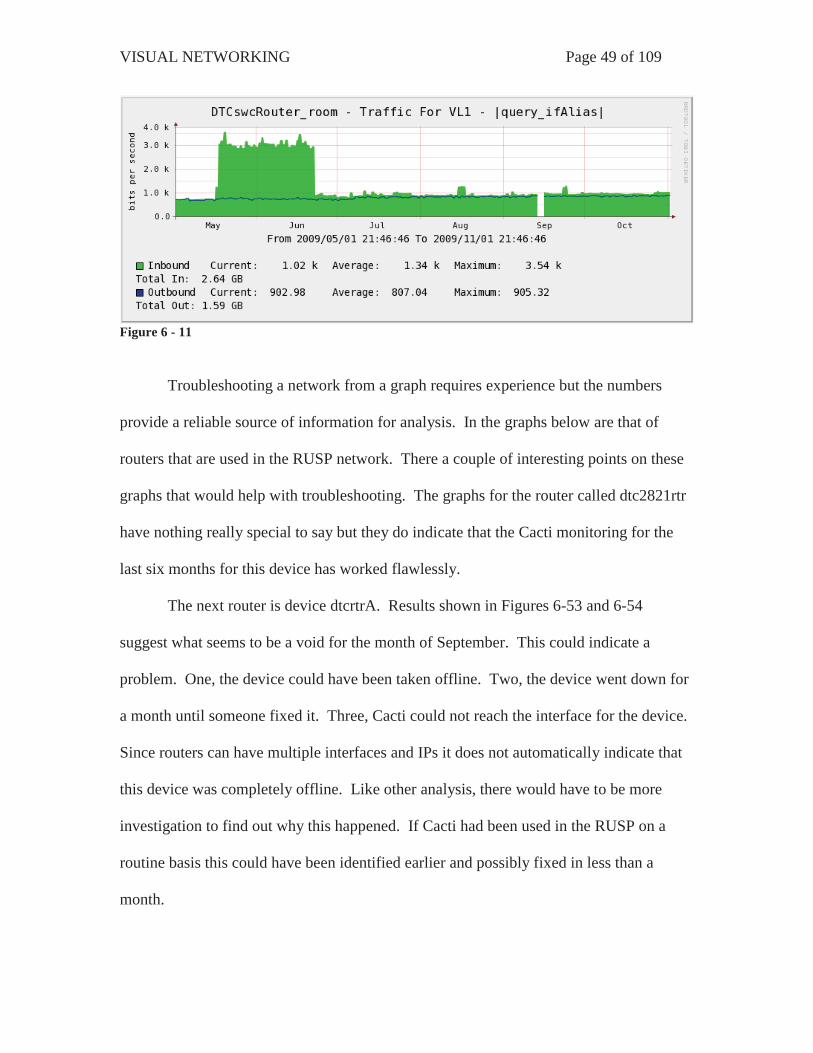
VISUAL NETWORKING Page 49 of 109
Figure 6 - 11 Troubleshooting a network from a graph requires experience but the numbers
provide a reliable source of information for analysis. In the graphs below are that of
routers that are used in the RUSP network. There a couple of interesting points on these
graphs that would help with troubleshooting. The graphs for the router called dtc2821rtr
have nothing really special to say but they do indicate that the Cacti monitoring for the
last six months for this device has worked flawlessly.
The next router is device dtcrtrA. Results shown in Figures 6-53 and 6-54
suggest what seems to be a void for the month of September. This could indicate a
problem. One, the device could have been taken offline. Two, the device went down for
a month until someone fixed it. Three, Cacti could not reach the interface for the device.
Since routers can have multiple interfaces and IPs it does not automatically indicate that
this device was completely offline. Like other analysis, there would have to be more
investigation to find out why this happened. If Cacti had been used in the RUSP on a
routine basis this could have been identified earlier and possibly fixed in less than a
month.

VISUAL NETWORKING Page 50 of 109
DtcrtrB is the last router in the study. It also indicates that something was wrong
with dtcrtrA. The inbound traffic on Figure 6-56 and 6-57 went to zero at the same time
that dtcrtrA appeared to go offline. The outbound traffic on dtcrtrB indicates that this
router was still up and trying to communicate with dtcrtrA. Also interesting about
dtcrtrB is that in the beginning of July something stopped. On dtcrtrB the traffic went
from 100K of bandwidth on the interfaces to almost zero. The reason for that maybe
school let out for summer or a project or service ended.
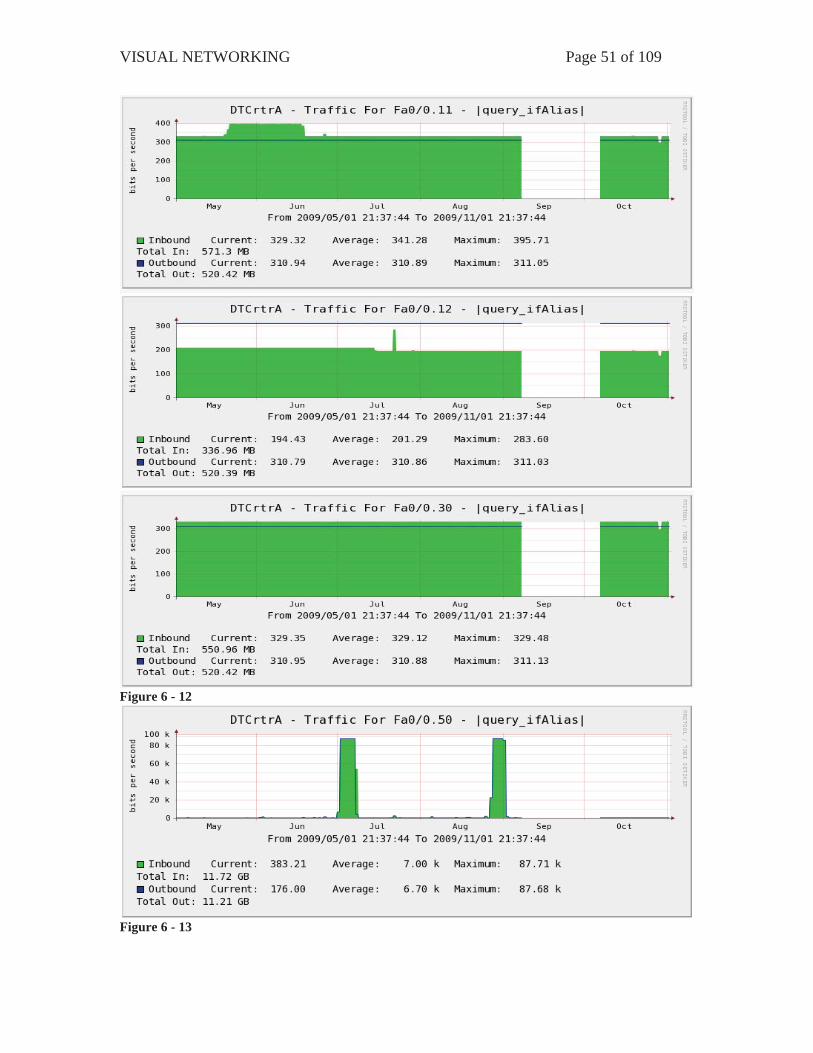
VISUAL NETWORKING Page 51 of 109
Figure 6 - 12
Figure 6 - 13

VISUAL NETWORKING Page 52 of 109
Figure 6 - 14

VISUAL NETWORKING Page 53 of 109
Figure 6 - 15

VISUAL NETWORKING Page 54 of 109
The last set of data analyzed is going to be the firewalls. The firewalls are placed
at the entry point for each location that the RUSP network needed to reach. There are
five total firewalls. Four of them are made by SonicWall and one is made by Cisco.
These devices were the hardest to setup in Cacti. It was discovered after many hours in
setup that the MIBs for the devices were correct but they still didn’t work because of the
version of software the devices were running.
The data collected were still good to analyze. For the Sonic Wall firewalls Cacti
was only able to pull bandwidths on the inside interfaces and outside interfaces. These
interfaces will tell the network engineer about the traffic coming in from and out to the
Internet and the other location of the RUSP. From the Figure 6-59 below it can
determine that the DTC location is the heaviest user of bandwidth but the biggest single
spike came from Figure 6-58, the CSD data center location, at 649 kbps.
In troubleshooting slow networks or applications, the internet links are typically
going to be the slowest part of the network. The internet link is the link that is paid for
by either usage or dedicated bandwidth at a certain rate. If the internet link is paid for
and set at 500 kbps for CSD data center locations, there will be an issue every time that
environment tries to push their max of 649 kbps. Users will notice a slowness they
haven’t experienced before under regular use. Data packets will be dropped by the
internet routers that are handled off the internet link that was purchased. Since the
packets are dropped they will be retransmitted by the sender of the packet causing latency
for whatever application is being used. This is why it is important to be able to monitor
these links for troubleshooting purposes.

VISUAL NETWORKING Page 55 of 109
Another interesting part of the graphs is in Figure 6-58, 59 and 60. You can see a
small gap in data in September. It is on every SonicWall firewall but not the Cisco. This
could indicate that the connection from DTC was compromised. Since the Cacti
monitoring tool resides in the DTC network and the connections to the other sites are
through the DTC SonicWall firewall it means that the issue was most likely on the DTC
SonicWall firewall. The next step in troubleshooting would be to go directly to the logs
of the DTC SonicWall firewall and verify this at the September time frame.
Figure 6 - 16
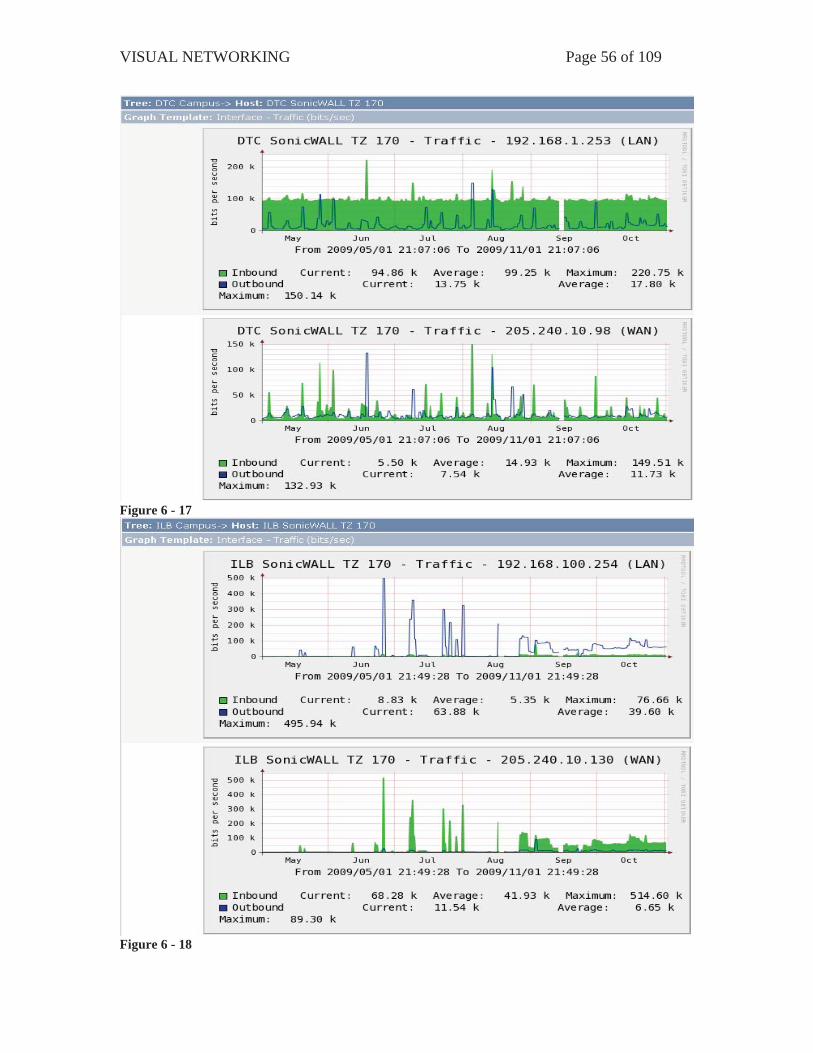
VISUAL NETWORKING Page 56 of 109
Figure 6 - 17
Figure 6 - 18
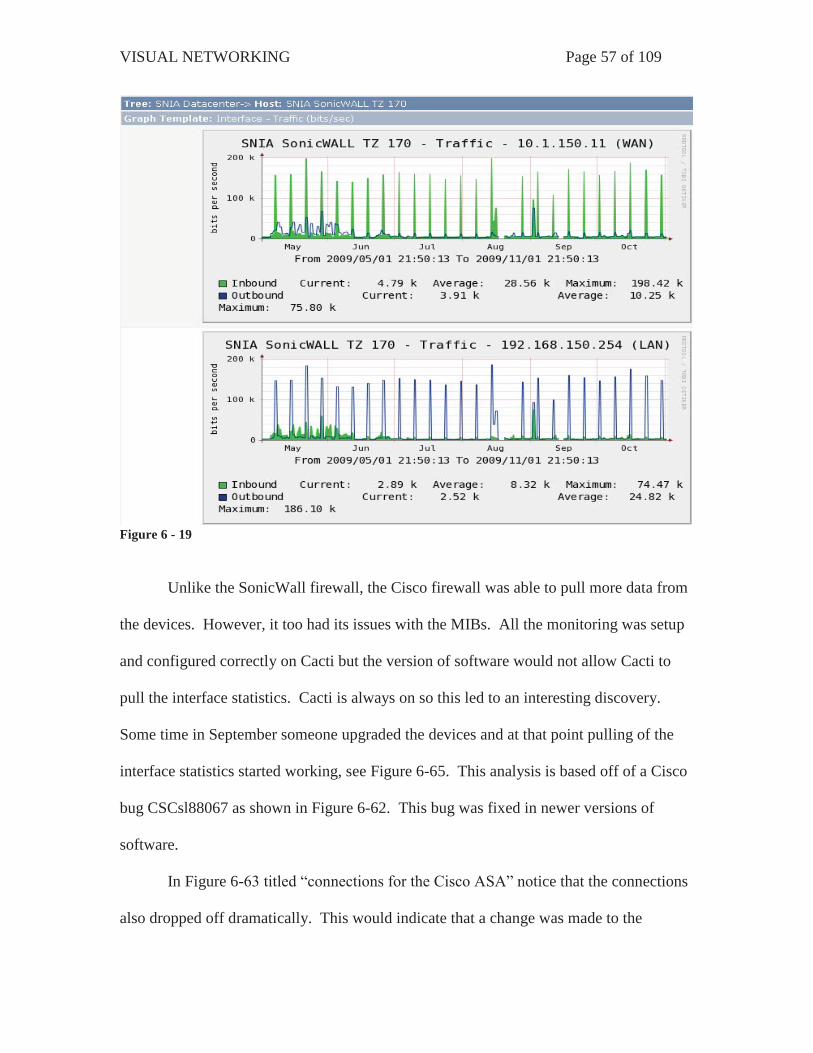
VISUAL NETWORKING Page 57 of 109
Figure 6 - 19 Unlike the SonicWall firewall, the Cisco firewall was able to pull more data from
the devices. However, it too had its issues with the MIBs. All the monitoring was setup
and configured correctly on Cacti but the version of software would not allow Cacti to
pull the interface statistics. Cacti is always on so this led to an interesting discovery.
Some time in September someone upgraded the devices and at that point pulling of the
interface statistics started working, see Figure 6-65. This analysis is based off of a Cisco
bug CSCsl88067 as shown in Figure 6-62. This bug was fixed in newer versions of
software.
In Figure 6-63 titled “connections for the Cisco ASA” notice that the connections
also dropped off dramatically. This would indicate that a change was made to the

VISUAL NETWORKING Page 58 of 109
configuration. Since then, internet access is not allowed when logged into the VPN. This
could mean two things, someone changed the VPN configuration or they changed the
firewall rules to not allow internet traffic outbound. It is clear that something changed in
the beginning of September that would warrant further investigation by reviewing the log
for that device.
Figure 6 - 20
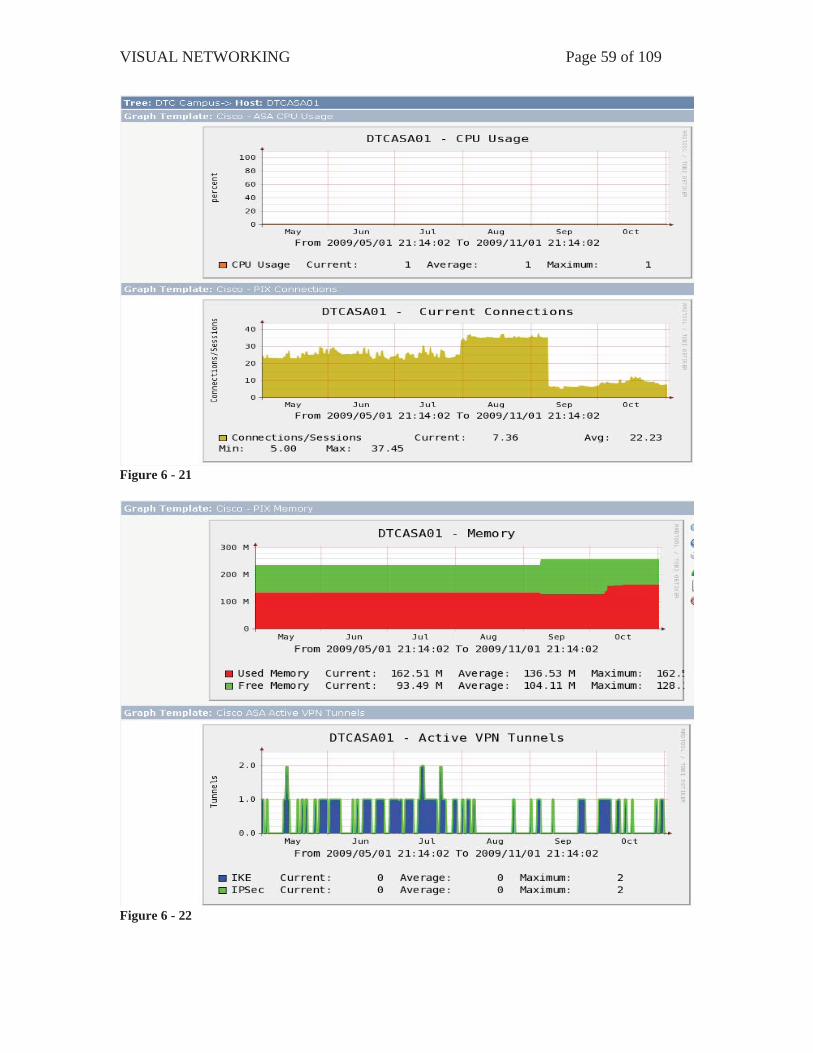
VISUAL NETWORKING Page 59 of 109
Figure 6 - 21
Figure 6 - 22

VISUAL NETWORKING Page 60 of 109
Figure 6 - 23
Chapter 5 – Project History
Implementation The first order of business when starting the implementation was to gather all
known network information about RUSP network. This was one of the hardest tasks
because the network is an educational network that has minimal documentation and is
constantly changing. As people graduate, documentation and knowledge transfers
depreciate which makes this first step hard. Appendix C shows a series of

VISUAL NETWORKING Page 61 of 109
communications. It required over a month of prep work to get the correct information
before the new monitoring server could even be turned on to start capturing data.
After information was gathered, a server, or the hardware that the monitoring
server was going to run on, needed to be selected. Since the project scope was only to
cover known network devices on the RUSP network the hardware did not have to be the
newest or fastest equipment. The server specs are defined below.
Hostname: netmon.ARNe-regis.org OS: Centos 5.2 CPU: 634 Mhz Disk Space: 30GB RAM: 512k
OS The server Operating System installation is a CentOS 5.2 install and is based on
LAMP as described in definitions. Not all computers are created equally. When building
a new server each physical component must have a driver. That means the network
interface card, the hard drives, and any and all other peripherals. The very first computer
selected had a driver issue with the version of CentOS and it would not recognize the
hard drives that were installed. After four hours into the build it was no closer to
completion than the first step. This should have been one of the easiest tasks and should
have taken no longer than an hour from start to finish. Since the computer was not the
focal point of the project it was decided to replace the computer with a similar model
which is the one detailed in the above specifications. After replacing the computer the
install went as planned so no special drivers were needed. Basic setup was completed
successfully. No packages (i.e., Apache, MySql or PHP) were installed. The packages
were installed after the base Operating System.

VISUAL NETWORKING Page 62 of 109
The fist step in installing the operating system was to download it. Since CentOS
is open source there are plenty of places to download it from. The download comes in
the form of an ISO image that has to be converted to a disc for installation on the server.
To do this a Window XP computer to download the CentoOS ISO image and a program
called Image Burn. Image Burn is a freeware program that allows the user to convert
ISO images and burn them to CD. Once on a CD it can be put into the CD-Rom drive of
the computer and the computer can be powered up. Once the computer is turned on the
BIOS setting must confirm that the computer will boot from CD-Rom before booting to
the hard drive. If so, the CD-Rom drive and the CentOS image on the CD will take over.
The complete installation steps and screen shots are shown in Appendix D.
Packages Packages were briefly discussed before. A package can be a program, an
application, or a script. The goal is to have a complete monitor solution base of an
application called Cacti. The Cacti application has a lot of dependency. A dependency is
an application or program that requires another application or program for it to work
properly. On the Cacti website there is an entire chapter dedicated to installation. Using
the online manual (http://www.cacti.net/downloads/docs/pdf/manual.pdf) created by The
Cacti Group was critical in identify the dependant packages needed to complete the
install of Cacti. (Berry, Roman, Adams, Pasnak, Scheck & Conner, 2007). The dependant
packages are:
httpd php php-mysql php-snmp mysql mysql-server
VISUAL NETWORKING Page 63 of 109
net-snmp
The following text will cover what is not in the manual rather than copying what is
already there. It took a lot of research to figure out and to finish the installation of the
Cacti monitoring application. Therefore, it is worth describing so future users of Cacti
can leARNe from this experience.
These packages are installed using a program called YUM (Yellowdog Updater
Modified). Why YUM for this project? The reason for YUM is to install software
package and their dependencies. Just as Cacti is dependent on the software mentioned
above (httpd, php, mysql …) those software packages also have their own dependencies.
Without a program like YUM adding packages is a multi-step processes that will add
time and complexity to the build process because dependencies have to be installed
before you can use any software that has them. However, before YUM is used to find all
the packages required, there has to be some configuration changes to the default
installation that comes with the base install of CentOS. YUM uses repositories that are
database packages that can be used for easier installation of packages. In order to get all
the packages installed additional repositories. If there are not enough repositories when
installing the packages required, a wARNeing message “package not found” will be
displayed. There is a complete guide on CentOS’s website showing how to add the
repositories needed (Herrold, 2009).
Once YUM is configured installing the required packages can be started. Using
YUM requires a very simple command to install the dependant packages. From a
command line prompt in Linux, entering the following commands will install all the
dependencies above:

VISUAL NETWORKING Page 64 of 109
[root@netmon ~]# yum install httpd [root@netmon ~]# yum install php [root@netmon ~]# yum install php-mysql [root@netmon ~]# yum install php-snmp [root@netmon ~]# yum install mysql [root@netmon ~]# yum install mysql-server [root@netmon ~]# yum install net-snmp
It is pretty easy to install packages as the commands above show. Back to the Cacti
installation manual, there are two steps that were not completed that were in the manual.
With the install of Cacti on CentOS version 5.2 it was not a requirement to change the
way PHP or Apache were configured. The httpd.conf and php.conf files were not edited.
Missing from the dependency list were all of the packages needed to install the
RRDTool. This was such a big omission they probably assumed this is pre-existing and
already installed. Either way, installing the RRDTool posed one of the biggest
challenges to get it to work properly. The first attempt to installing the RRDTool went
just like the others above. It did not install because the RRDTool has its own set of
dependencies listed here:
[root@netmon ~]# yum install rrdtool Error: Missing Dependency: cairo >= 1.4.6 is needed by package rrdtool Error: Missing Dependency: dejavu-fonts-lgc-sans is needed by package rrdtool Error: Missing Dependency: dejavu-fonts-lgc-serif is needed by package rrdtool Error: Missing Dependency: pango >= 1.17 is needed by package rrdtool Error: Missing Dependency: dejavu-fonts-lgc-sans-mono is needed by package rrdtool The second attempt was to install all the dependencies listed above and try to re-
install the RRDTool. This didn’t work either. No matter what dependencies were
installed, when installing the RRDTool it always said it was missing one or had a conflict
with a different one. Below is an example of a conflict message received when trying to
install the RRDTool.

VISUAL NETWORKING Page 65 of 109
--> Processing Conflict: dejavu-fonts conflicts fontconfig >= 2.3.0
After three hours of trying to resolve the dependency issue a new approach was
attempted. An older version of the RRDTool was installed in the hope that it would not
have the same issue with the other version of the dependencies that were installed. Install
RRDTool version 1.2.30 fixed the issue of the Errors and Conflicts that displayed
previously. Below is the actual command that it took in order to get the RRDTool
installed. Notice that all dependencies resolved and at the end of the command sequence
below it completed which means it was successful.
[root@netmon localrepo]# yum install rrdtool Loading "priorities" plugin Loading "fastestmirror" plugin Loading mirror speeds from cached hostfile * rpmforge: fr2.rpmfind.net * base: mirror.sourceshare.org * updates: mirror.chpc.utah.edu * addons: mirror.chpc.utah.edu * extras: mirrors.gigenet.com 342 packages excluded due to repository priority protections Setting up Install Process Parsing package install arguments Resolving Dependencies --> Running transaction check ---> Package rrdtool.i386 0:1.2.30-1.el5.rf set to be updated --> Processing Dependency: libart_lgpl_2.so.2 for package: rrdtool --> Processing Dependency: perl(RRDs) for package: rrdtool --> Processing Dependency: perl(RRDp) for package: rrdtool --> Running transaction check ---> Package libart_lgpl.i386 0:2.3.17-4 set to be updated ---> Package perl-rrdtool.i386 0:1.2.30-1.el5.rf set to be updated --> Finished Dependency Resolution Dependencies Resolved ============================================================================= Package Arch Version Repository Size ============================================================================= Installing for dependencies: libart_lgpl i386 2.3.17-4 base 76 k perl-rrdtool i386 1.2.30-1.el5.rf rpmforge 49 k rrdtool i386 1.2.30-1.el5.rf rpmforge 951 k Transaction Summary
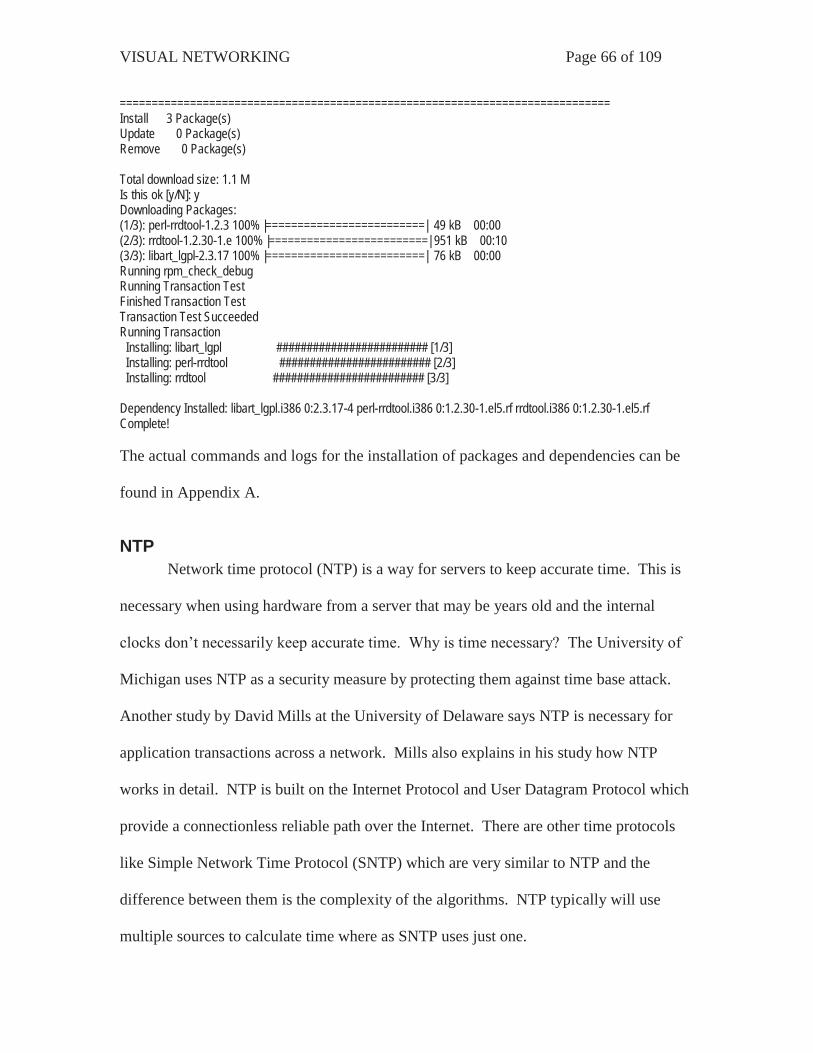
VISUAL NETWORKING Page 66 of 109
============================================================================= Install 3 Package(s) Update 0 Package(s) Remove 0 Package(s) Total download size: 1.1 M Is this ok [y/N]: y Downloading Packages: (1/3): perl-rrdtool-1.2.3 100% |=========================| 49 kB 00:00 (2/3): rrdtool-1.2.30-1.e 100% |=========================| 951 kB 00:10 (3/3): libart_lgpl-2.3.17 100% |=========================| 76 kB 00:00 Running rpm_check_debug Running Transaction Test Finished Transaction Test Transaction Test Succeeded Running Transaction Installing: libart_lgpl ######################### [1/3] Installing: perl-rrdtool ######################### [2/3] Installing: rrdtool ######################### [3/3] Dependency Installed: libart_lgpl.i386 0:2.3.17-4 perl-rrdtool.i386 0:1.2.30-1.el5.rf rrdtool.i386 0:1.2.30-1.el5.rf Complete! The actual commands and logs for the installation of packages and dependencies can be
found in Appendix A.
NTP Network time protocol (NTP) is a way for servers to keep accurate time. This is
necessary when using hardware from a server that may be years old and the internal
clocks don’t necessarily keep accurate time. Why is time necessary? The University of
Michigan uses NTP as a security measure by protecting them against time base attack.
Another study by David Mills at the University of Delaware says NTP is necessary for
application transactions across a network. Mills also explains in his study how NTP
works in detail. NTP is built on the Internet Protocol and User Datagram Protocol which
provide a connectionless reliable path over the Internet. There are other time protocols
like Simple Network Time Protocol (SNTP) which are very similar to NTP and the
difference between them is the complexity of the algorithms. NTP typically will use
multiple sources to calculate time where as SNTP uses just one.

VISUAL NETWORKING Page 67 of 109
For this case study it is the application transactions that are a concern not
necessarily time based attacks security risk. The monitoring server that is being built
relies on accurate time. Without it all the benefits of having a monitoring server go away.
For example, using this monitoring server for troubleshooting and it didn’t keep accurate
time the network engineer would think a problem happened at one time when it could
have happened at some other time. This time error makes the troubleshooting useless.
This server hardware is on the older side of computers so configuring NTP is an absolute
requirement. The complete configuration of this server is in Appendix A and the NTP
configuration is based on a how to guide found on Linux Home Networking dot com.
(Linux Home Networking, 2009)
In the server “netmon” configuration a NTP source that has already been
configured for ARNE engineer will be used. Where applicable in the how to guide,
substitute NTP source server with an IP address identified in the network section later on
in the implementation.
Cacti The installation of Cacti is a simple process and can be done by downloading a
tarball from Cacti.net. Once the tarball is downloaded extract it into the location (file
path) of the web server. In this configuration it was extracted to /var/html as shown in
the screen captures below from the installation of Cacti on server hostname netmon.
[root@netmon www]# tar xzvf cacti-0.8.7d.tar.gz cacti-0.8.7d/ cacti-0.8.7d/color.php cacti-0.8.7d/data_sources.php cacti-0.8.7d/settings.php cacti-0.8.7d/poller.php
VISUAL NETWORKING Page 68 of 109
cacti-0.8.7d/graph_templates_items.php cacti-0.8.7d/logout.php cacti-0.8.7d/data_templates.php cacti-0.8.7d/auth_changepassword.php cacti-0.8.7d/host_templates.php cacti-0.8.7d/about.php cacti-0.8.7d/script_server.php cacti-0.8.7d/LICENSE In picking the path /var/www/cacti, the web service “httpd” that was installed in
the very beginning had to be configured to know how to get to the Cacti path location.
This information is not clearly defined in the Cacti installation manuals. You must know
Linux and Apache web servers in order to read between the lines in the Cacti installation
manual. Below is a configuration reference to an additional step needed to be added to
Apache in order for Apache to locate Cacti.
[root@netmon files-0.8.7d]# vi /etc/httpd/conf.d/cacti.conf Alias / /var/www/cacti/ <Directory /var/www/cacti/> DirectoryIndex index.php Options -Indexes AllowOverride all allow from all AddType application/x-httpd-php .php php_flag magic_quotes_gpc on php_flag track_vars on </Directory> The database has to be setup before continuing to the Cacti web user interface and
start configuring it. Installing the database has been described previously, however, like
everything else the Cacti application has to be configured to work with the database that
was installed. Databases are complex but the idea is simple - it is a place where data is
stored logically. Cacti’s developers make installing the database for Cacti almost
effortless. The Cacti instruction manual is clear and it worked without any issues.

VISUAL NETWORKING Page 69 of 109
Cacti Plugin Architecture “The Plugin Architecture for Cacti was designed to be both simple in nature and
robust enough to allow freedom to do almost anything in Cacti. Cacti itself is designed
nicely enough that integrating into it is fairly easy with very little modifications
necessary. Eventually Cacti will come with a standard plugin architecture that will allow
addons to be created without the need to modify the installation, but until that time comes
follow the directions below.” (Cacti Users, 2009) This architecture is required for the
plugins that are going to be installed to add functionality to the Cacti application. The
manual used to install the Plugin Architecture is located at
http://cactiusers.org/wiki/PluginArchitectureInstall and a completed list of installation
specific steps is in Appendix A.
Plugins The installation of plugins are as simple as the Cacti installation. Download the
plugin from any site that advertises Cacti plugin compatibility and extract the tarball to
the directory called plugins. The plugin directory was created when the installation of
Cacti was completed. In our server “netmon” that location is /var/html/plugins.
Download [root@netmon plugins]#wget http://cactiusers.org/downloads/mactrack.tar.gz [root@netmon plugins]#wget http://cactiusers.org/downloads/discovery.tar.gz [root@netmon plugins]#wget http://cactiusers.org/downloads/monitor.tar.gz [root@netmon plugins]#wget http://cactiusers.org/downloads/loginmod.tar.gz [root@netmon plugins]#wget http://cactiusers.org/downloads/tools.tar.gz [root@netmon plugins]#wget http://cactiusers.org/downloads/syslog.tar.gz [root@netmon plugins]#wget http://cactiusers.org/downloads/thold.tar.gz [root@netmon plugins]#wget http://cactiusers.org/downloads/update.tar.gz [root@netmon plugins]#wget http://cactiusers.org/downloads/settings.tar.gz [root@netmon plugins]#wget http://cactiusers.org/downloads/ssl.tar.gz
VISUAL NETWORKING Page 70 of 109
Extract [root@netmon plugins]#tar -zxvf mactrack.tar.gz [root@netmon plugins]#tar -zxvf discovery.tar.gz [root@netmon plugins]#tar -zxvf monitor.tar.gz [root@netmon plugins]#tar -zxvf loginmod.tar.gz [root@netmon plugins]#tar -zxvf tools.tar.gz [root@netmon plugins]#tar -zxvf syslog.tar.gz [root@netmon plugins]#tar -zxvf thold.tar.gz [root@netmon plugins]#tar -zxvf update.tar.gz [root@netmon plugins]#tar -zxvf settings.tar.gz [root@netmon plugins]#tar -zxvf ssl.tar.gz The last step is to get Cacti to recognize the new plugin that was installed. For this step a configuration file in Cacti has to be modified. [root@netmon cacti_plugins]# vi /var/www/html/include/global.php In the file global.php find the line that starts like the character below. $plugins = array(); Next, add these lines right under the line that was found above. The complete setup
should look exactly like the lines of code below.
$plugins = array(); $plugins[] = 'mactrack'; $plugins[] = 'discovery'; $plugins[] = 'monitor'; $plugins[] = 'loginmod'; $plugins[] = 'tools'; $plugins[] = 'thold'; $plugins[] = 'update'; $plugins[] = 'settings'; $plugins[] = 'ssl'; This is the basic installation of how all plugins are installed on Cacti. (Cacti Users, 2009)
When some plugins are extracted they will have a file called installation or readme that
will give further installation steps if they are needed in order for the plugin to work

VISUAL NETWORKING Page 71 of 109
properly. If there is an installation file or readme document and only do the basic install,
Cacti will look like the plugin is installed but it will not function properly.
SSL A major concern in today’s world is security. There are many ways to secure
transactions over a network. Rivest, Shamir and Adleman (RSA), Elliptic curve
cryptography (ECC), secure socket layer (SSL) and transport layer security (TLS) are all
for security data transmitted over a network. All of these methods deploy a public key
method of securing data. A public key is something that is known to all and is used to
derive a way for two devices to share data that only those two devices can understand.
How they differ is the procedure and algorithms they use to secure data. Taking a closer
look at SSL and TLS the biggest difference between the two other then TLS being newer
are the ability to define new crypto ciphers. A cipher is the algorithm that performs the
encryption and decryption. TLS is much easier to add new ciphers then SSL. For this
case study SSL was chosen for 3 reasons. The first reason is it’s most popular with
website security method and since Cacti’s user interface is a website one is needed base
off of Netcraft SSL data mining survey and VeriSign who is an industry leader in SSL.
Secondly the Apache web server installed for Cacti has existing add-on software package
that make the installation easy. Third Cacti also has a premade add-on plugin for SSL
and no other encryption method.
The current default web server configuration does not turn on secure socket layer
(SSL). SSL is a way to have encrypted communication over a public area like the
internet. The web server needs to be configured for this to work and before that can be
done two new packages must be installed.

VISUAL NETWORKING Page 72 of 109
[root@netmon httpd]# yum install openssl [root@netmon conf]# yum install mod_ssl “SSL uses the public-and-private key encryption system from RSA, which also includes
the use of a digital certificate.” (Cusack, 2009) On this server not having the money to
pay for third party verification service it will be installed as a self signed certificate. This
means creating both public and private keys to distribute to whoever accesses the Cacti
application web user interface. It will be up to the user to decide whether or not to trust
the Cacti application. This case study is a closed network meaning there shouldn’t be any
direct access from the internet to the Cacti application. This security technique wouldn’t
be absolutely necessary but, none the less, the Cacti application will have sensitive data
that could be used for unethical purposes so best practices apply. A screen capture from
the SSL installation is supplied below. It came from the Cacti server build and complete
installation which can be found in Appendix A.
[root@netmon private]# openssl genrsa -out ca.key 1024 Generating RSA private key, 1024 bit long modulus ....++++++ ............................++++++ e is 65537 (0x10001) [root@netmon private]# openssl req -new -key ca.key -out ca.csr You are about to be asked to enter information that will be incorporated into the certificate request. What is entered is what is called a Distinguished Name or a DN. There are quite a few fields but some can be left blank For some fields there will be a default value, Entering '.', the field will be left blank. ----- Country Name (2 letter code) [GB]:US State or Province Name (full name) [Berkshire]:Colorado Locality Name (eg, city) [Newbury]:Denver Organization Name (eg, company) [My Company Ltd]:Regis Organizational Unit Name (eg, section) []:ARNe Common Name (eg, the name or the server's hostname) []:netmon.ARNe-regis.org Email Address []:
VISUAL NETWORKING Page 73 of 109
Please enter the following 'extra' attributes to be sent with the certificate request A challenge password []: An optional company name []: [root@netmon private]# ls ca.csr ca.key [root@netmon private]# cd .. [root@netmon certs]# ls ca-bundle.crt localhost.crt make-dummy-cert Makefile private [root@netmon certs]# cd private/ [root@netmon private]# ls ca.csr ca.key [root@netmon private]# openssl x509 -req -days 1825 -in ca.csr -signkey ca.key -out ca.crt Signature ok subject=/C=US/ST=Colorado/L=Denver/O=Regis/OU=ARNe/CN=netmon.ARNe-regis.org Getting Private key After the server configuration is completed to allow for SSL connections, the
Cacti application has to be told it’s using SSL. This is a common request in Cacti and it
has a plugin for SSL which was installed using the same techniques described in the
plugin section. The SSL plugin does not require any other installation steps other than
the basic installation.
Login Page This project is for the sole use of Regis University and its practicum network
therefore implementing a redesigned customized login page for the users instead of the
Cacti default login screen is helpful. The purpose of this screen is both aesthetics and to
ensure that anyone who stumbles on it will know that this server requires a user name and
password to get into it.
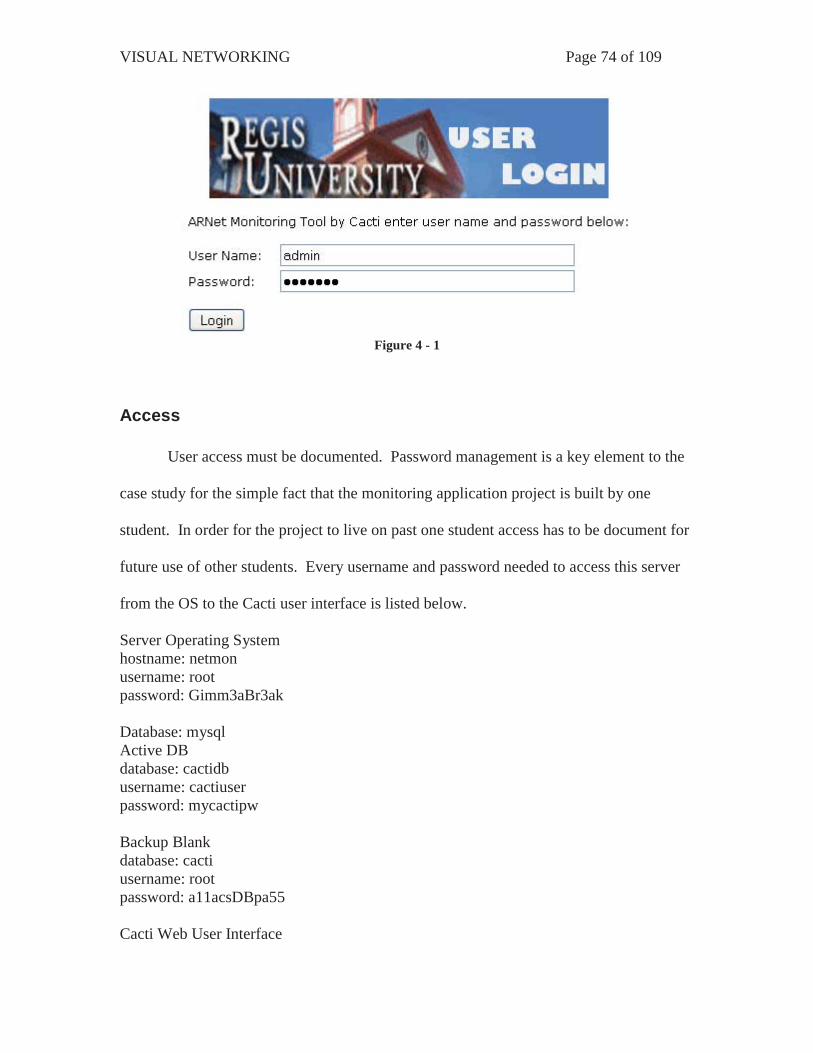
VISUAL NETWORKING Page 74 of 109
Figure 4 - 1
Access User access must be documented. Password management is a key element to the
case study for the simple fact that the monitoring application project is built by one
student. In order for the project to live on past one student access has to be document for
future use of other students. Every username and password needed to access this server
from the OS to the Cacti user interface is listed below.
Server Operating System hostname: netmon username: root password: Gimm3aBr3ak Database: mysql Active DB database: cactidb username: cactiuser password: mycactipw Backup Blank database: cacti username: root password: a11acsDBpa55 Cacti Web User Interface
VISUAL NETWORKING Page 75 of 109
Read and write privileges username: admin password: M0n1t0r Read only username: guest password: guest
Network The network configuration is the last step in the implementation process. These
are the network settings used for the monitor so it can access the network. The server
“netmon” must be placed on the network that has access to all of the network devices it
will monitor. Also identified is the source for NTP server that will be used for accurate
time measurements. This concludes the implementation process. All remaining
installation information can be found in the capture file in Appendix A.
IP: 192.168.1.249 Subnet: 255.255.255.0 Gateway: 192.168.1.253 DNS: 208.67.222.222 208.67.220.220 NTP: 192.168.1.1
Cacti Setup
Up until now nothing has been monitored. All of the previous work was to get to
a point where a monitoring network device is possible. Cacti is now working on the
same network as the devices that need to monitor. Cacti must also be told how to get
there and what community string it will be using. Cacti will be told how to get to a
device by the IP address that the device already has. The community has already been
identified as K1t3sFlyH1gh and configured on the network devices that will be monitored.
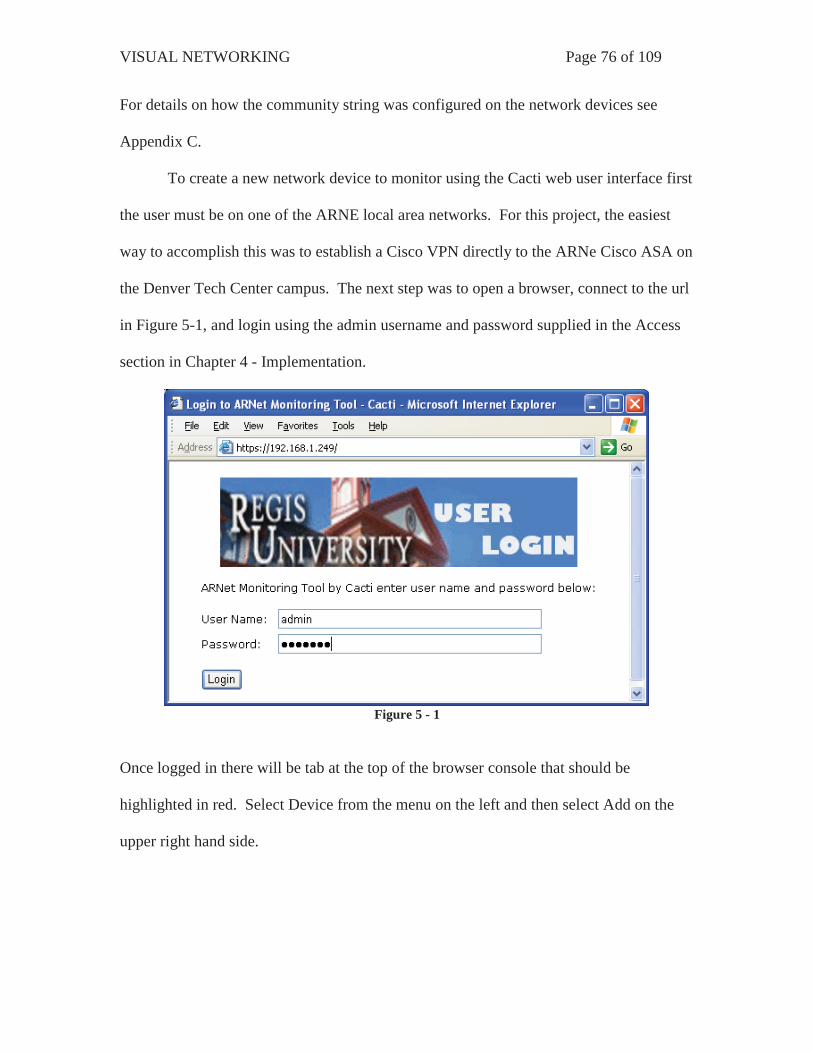
VISUAL NETWORKING Page 76 of 109
For details on how the community string was configured on the network devices see
Appendix C.
To create a new network device to monitor using the Cacti web user interface first
the user must be on one of the ARNE local area networks. For this project, the easiest
way to accomplish this was to establish a Cisco VPN directly to the ARNe Cisco ASA on
the Denver Tech Center campus. The next step was to open a browser, connect to the url
in Figure 5-1, and login using the admin username and password supplied in the Access
section in Chapter 4 - Implementation.
Figure 5 - 1
Once logged in there will be tab at the top of the browser console that should be
highlighted in red. Select Device from the menu on the left and then select Add on the
upper right hand side.
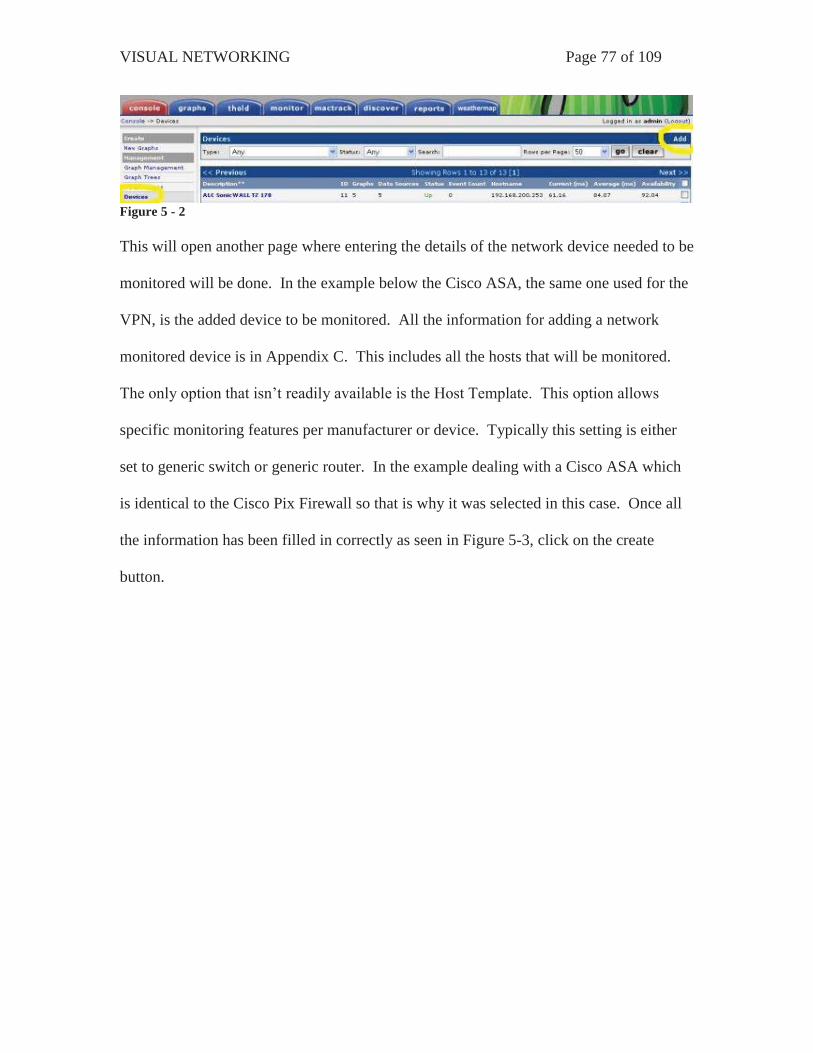
VISUAL NETWORKING Page 77 of 109
Figure 5 - 2 This will open another page where entering the details of the network device needed to be
monitored will be done. In the example below the Cisco ASA, the same one used for the
VPN, is the added device to be monitored. All the information for adding a network
monitored device is in Appendix C. This includes all the hosts that will be monitored.
The only option that isn’t readily available is the Host Template. This option allows
specific monitoring features per manufacturer or device. Typically this setting is either
set to generic switch or generic router. In the example dealing with a Cisco ASA which
is identical to the Cisco Pix Firewall so that is why it was selected in this case. Once all
the information has been filled in correctly as seen in Figure 5-3, click on the create
button.
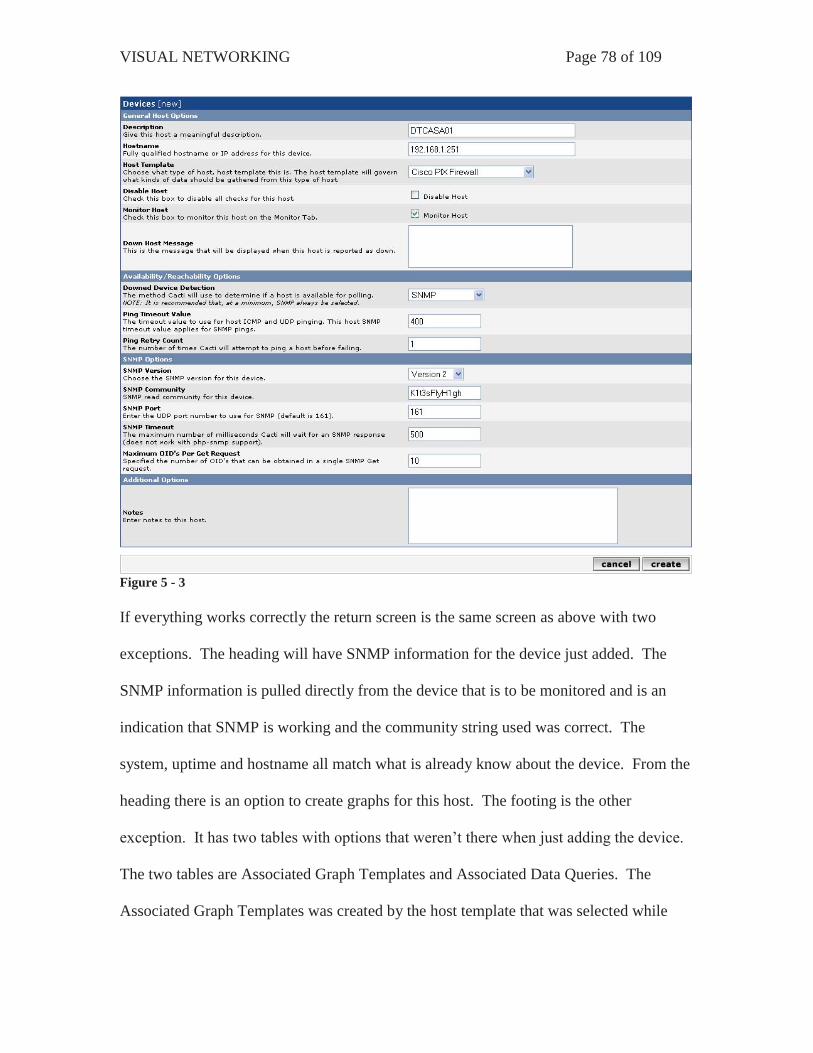
VISUAL NETWORKING Page 78 of 109
Figure 5 - 3 If everything works correctly the return screen is the same screen as above with two
exceptions. The heading will have SNMP information for the device just added. The
SNMP information is pulled directly from the device that is to be monitored and is an
indication that SNMP is working and the community string used was correct. The
system, uptime and hostname all match what is already know about the device. From the
heading there is an option to create graphs for this host. The footing is the other
exception. It has two tables with options that weren’t there when just adding the device.
The two tables are Associated Graph Templates and Associated Data Queries. The
Associated Graph Templates was created by the host template that was selected while
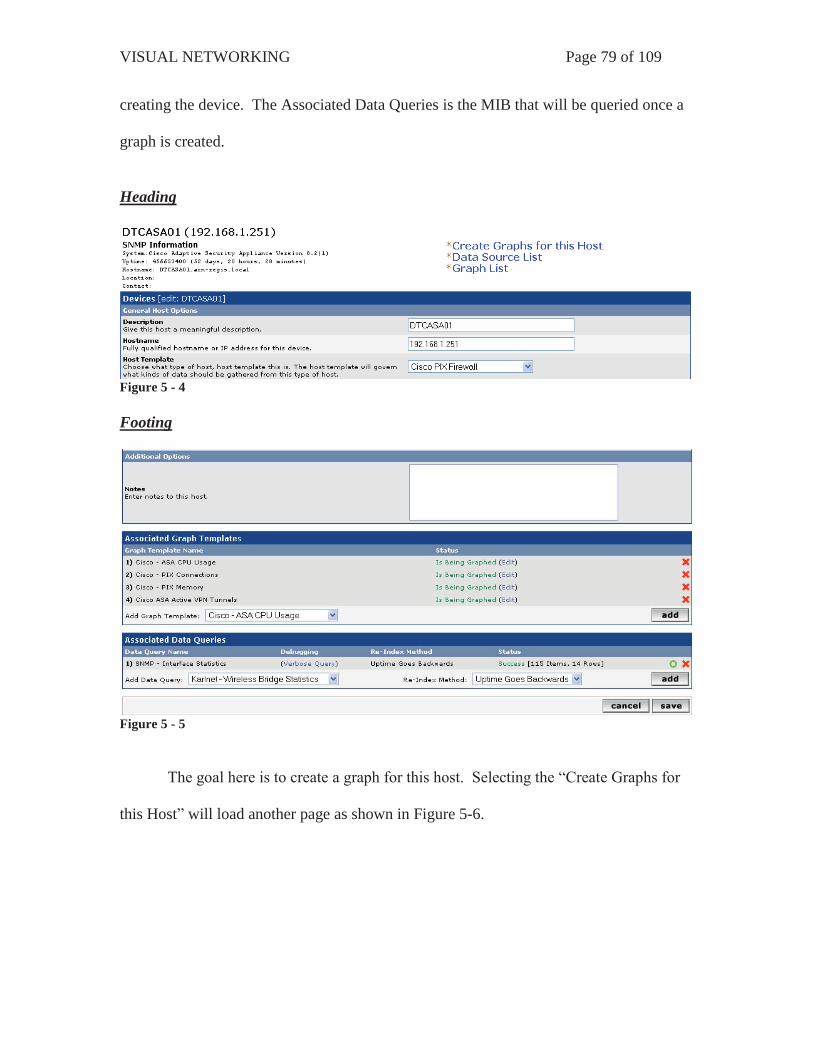
VISUAL NETWORKING Page 79 of 109
creating the device. The Associated Data Queries is the MIB that will be queried once a
graph is created.
Heading
Figure 5 - 4 Footing
Figure 5 - 5 The goal here is to create a graph for this host. Selecting the “Create Graphs for
this Host” will load another page as shown in Figure 5-6.
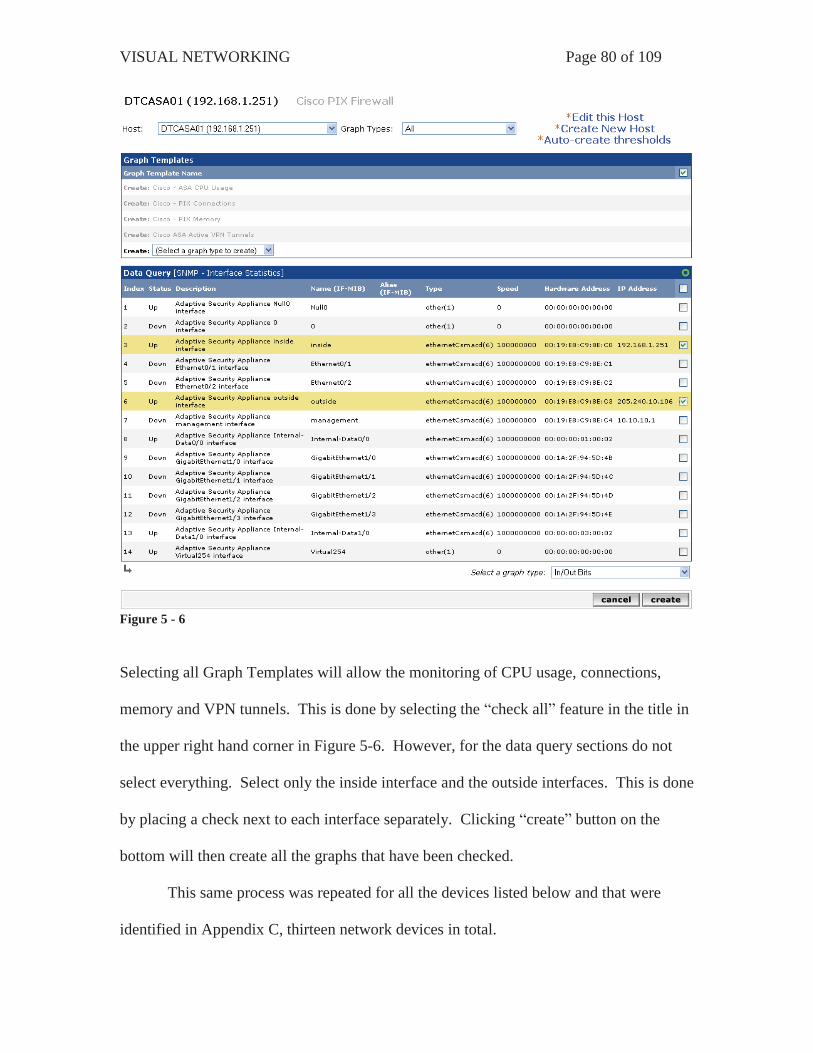
VISUAL NETWORKING Page 80 of 109
Figure 5 - 6
Selecting all Graph Templates will allow the monitoring of CPU usage, connections,
memory and VPN tunnels. This is done by selecting the “check all” feature in the title in
the upper right hand corner in Figure 5-6. However, for the data query sections do not
select everything. Select only the inside interface and the outside interfaces. This is done
by placing a check next to each interface separately. Clicking “create” button on the
bottom will then create all the graphs that have been checked.
This same process was repeated for all the devices listed below and that were
identified in Appendix C, thirteen network devices in total.

VISUAL NETWORKING Page 81 of 109
Figure 5 - 7 The last step is to see the graph just created which requires an extra step. That
extra step is called a graph tree and it allows one to organize the devices in a meaningful
way. The devices that are currently being monitored are geographically in different
campuses or data centers. The graph tree will be laid out like Figure 5-8. By selecting
“Add” in Figure 5-8 it allows the user to add the locations by name. No other options are
required, just a name. It was identified in discovery that there are five locations where
these 13 devices are located.
Figure 5 - 8 The ASA that is in the previous examples is in DTC Campus. Selecting that link pulls up
a page that looks like Figure 5-9 below.

VISUAL NETWORKING Page 82 of 109
Figure 5 - 9 By selecting “Add” in Figure 5-9 another screen will pop up that looks like Figure 5-10
Figure 5 - 10 From here where it says “Parent Item” select “root” and in the “Tree Item Type” select
“Host”. In the “Tree Item Value” section for “Host” option select the drop down items as
listed above. In this case look for the hostname of the ASA in Figure 5-10 and click the
save button. This will have to be done for all the network monitored devices and their
corresponding locations. The DTC Campus has the most network monitored devices and
is displayed below in Figure 5-11.
Figure 5 - 11

VISUAL NETWORKING Page 83 of 109
Chapter 6 - Conclusions The thesis assertion as tested was to determine a method to give the RUSP
network a way to monitor its network devices. This was accomplished by building an
open source monitoring solution in the form of Cacti. Cacti used a combination of other
open source applications like RRDTool, PHP, and MySql to fully implement the desired
functionality. The scope and relevance of this case in relation to similar situations is also
designed to prove that no one could manually pull all the statistics needed for a historic
graphic analysis of the network. The project also showed how a network monitoring tool
can identify problems with the network at a glance.
One thing that could have been done differently in the project is to have a detailed
checklist and evaluate more open source network monitoring applications. During the
study some limitations with the monitoring application were found. Cacti could not
receive SNMP trap information from a network device and report on it. SNMP traps are
error messages or information that the network device sends out to let the users know that
the device is having issues. It would have been helpful to have a monitoring application
that could receive SNMP traps from the network devices and alert on those. With
evaluating more monitoring application this type of SNMP trap monitoring could have
been implemented. Cacti has another limitation and the fact that logs and graphs cannot
be correlated together by time line is one of them. From the case study it refers to
looking at the log for root cause. Cacti can tell if there was a problem it can’t always tell
why it happened.
This project was bigger than originally expected. The time it took to install the
base server operating system and installing the Cacti application took days. Then,

VISUAL NETWORKING Page 84 of 109
configuring Cacti to make it work properly took weeks. The learning experience from
creating a network monitoring tool has greatly increased my current skill set. Network
engineers are rarely offered the opportunity to make global monitoring decisions for a
large corporation. This project provided the opportunity to develop and implement a
system to overcome shortcomings in monitoring that can leave a void in data collection.
Having completed this project using open source software and applications will allow
network administrators to benefit from this research and correct this void without an
increase in cost.
In conclusion the data gathering methods and graphical representations are a part
of network management and created a significant understanding of the ARNe network.
The study showed that graphical representations can be used for troubleshooting
networks. The study also demonstrated that graphical representation can be used in
future planning when adding or modifying network resources. Suggestions for future
research would include replicating the study with a larger number of network devices and
engineers. In addition, a future study should include surveys of engineers that use
graphed data to solve network issues compared to engineers who do not use graphs and
the amount of time required by each study group to find a resolution to the problem.

VISUAL NETWORKING Page 85 of 109
References Conjecture Corporation . (2009). How Much Text is in a Kilobyte or Megabyte. Wise Geek. Retrieved from http://www.wisegeek.com/how-much-text-is-in-a-kilobyte-or-megabyte.htm
This explains how memory works in a computer. This is a common definition and provides analogies in order to explain computer memory. The information is current and relevant today.
Mitchell, B (2009). switch (network switch). Retrieved from http://compnetworking.about.com/od/hardwarenetworkgear/g/bldef_switch.htm
This article identifies what a switch is and what it does. It explains the function and which layer of the OSI model switches operate at. Switches are used to breakup collision domains. It also explains the differences between a switch and other network devices like routers. This article is current and relevant in today networking world. It provides background and supporting information.
Conjecture Corporation, (2009) “What is Network Monitoring?,” What is Network Monitoring, Retrieved March 19, 2009, from http://www.wisegeek.com/what-is-network-monitoring.htm.
The article is a high level overview of what network monitoring is and why network administrators need network monitoring. The website lays out specific examples of types of network monitoring and what its function is. There is no new information presented in the article however it does support the reason for my thesis.
Matt Zekauskas et al., (2005) “NDT Cookbook,” Network Performance Measurement Tools: An Internet2 Cookbook, Retrieved April 3, 2009, from http://209.85.173.132/search?q=cache:lg_DV8SyiGkJ:www.internet2.edu/pubs/tools-cookbook.pdf+Network+Performance+Measurement+Tools:+And+Internet2+Cookbook&cd=1&hl=en&ct=clnk&gl=us.
This article describes in detail how to troubleshoot a network issue by using monitoring tools. It cites case studies and the techniques used to troubleshoot the network issues. The article was written in 2005 which is old in the technology world however the core information is still relevant today. The way that the author describes network issues is clear and concise.
Donavan Nelson, Lance Davis, and CentOS ltd, (2005). “www.centos.org - centos.org content,” Purpose of CentOS, Retrieved April 4, 2009, from http://www.centos.org/modules/tinycontent/index.php?id=3.

VISUAL NETWORKING Page 86 of 109
This article explains why someone would choose the operating system called “CentOS”. It also explains the reason why the operating system exists. My thesis project has operating system requirements and this article explains why “CentOS” meets those requirements.
Frisch, A. (2002). Essential System Administration. Sebastopol, CA, O'Reilly.
This book is a guide how to administer a computer system. The text is not limited to servers but also includes networks. It explains how large a task monitoring a computer network really is. The book is old and is only used to support the reason why automation in computer network monitoring is needed. No new information is presented in this book.
cpu. (2009). In Merriam-Webster Online Dictionary. Retrieved September 19, 2009, from http://www.merriam-webster.com/dictionary/cpu
This link directs to a text book definition of a computer central processing unit. It provides a definition of what it does and what it is used for. This definition is limited and does not provide any examples or added usage. For the purpose of the project this definition will suffice.
Oetiker, T (2009, September 15). About RRDtool. Retrieved from http://oss.oetiker.ch/rrdtool/
This is the complete definition of what RRDtool does and what it’s used for. This is an open source standard for high performance data logging and graphing. It is a critical component for the Cacti application. This application is currently and continually being improved so the information collected at this site is up to date.
Rosen, K, Host, D, Klee, R, Farber, J & Rosinski, R (2007). Unix : The Complete Reference . US: McGraw-Hill.
This book is a complete reference for Unix. It provides background and commands used to install and maintain a Unix server. This book is over two years old but still provides the necessary references for this project.
AB, MySql (2007). What is MySql. Retrieved December 5, 2008, from MySql AB Web site: http://dev.mysql.com/doc/refman/5.0/en/what-is-mysql.html
This article is a detailed description of what MySql is and why it was created. This site also provides command references for maintaining a MySql database. MySql is still in development and actively being updated. The information in this link is current even though it’s two year old.
Group, PHP (2007). History of PHP and related projects. Retrieved December 5, 2008, from PHP Web site: http://us.php.net/history

VISUAL NETWORKING Page 87 of 109
This reference gives the history of PHP. It outlines the different versions of PHP and what was the driving force behind them. This reference has the history of PHP related projects. PHP is also a technology that is continually being developed. The information on this site is current.
Kunze , Michael (1998). Let There be Light. Retrieved December 6, 2008, from LAMP: Freeware Web Publishing System with Database Support Web site: http://www.heise.de/ct/english/98/12/230/
This is a detailed description of LAMP. LAMP is Linux, Apache, MySql and PHP. The article explains why the surge in popularity of LAMP. It also goes over some uses for the LAMP. This article provides no new information on the subject but does support all other findings. The article is out of date but useful for the project.
LaMonica, Martin (2005, June 14). Open-source LAMP a beacon to developers. Retrieved December 5, 2008, from CNET News Web site: http://www.news.com/Open-source-LAMP-a-beacon-to-developers/2100-7344_3-5744767.html
This article details the reasons why companies are moving to LAMP. It is because LAMP is stable and for the most part free. It is based on open source applications that can be developed by any one with a computer. This article also compares LAMP to other proprietary offerings like Microsoft, Net and Sun Java. The article is relatively old, written in 2005, but the message in it still applies today.
Berry, I, Roman, T, Adams, L, Pasnak, J, Scheck, R & Conner, J. (2007). Installing under unix. Retrieved from http://www.cacti.net/downloads/docs/html/install_unix.html
This document was a critical component to this research. This is part of the “how to” manual for Cacti. This website had the dependencies required to install Cacti on a Linux based operating system. The ideas and fundamentals were sound and most still worked even though the document is over two years old.
Herrold, R. (2009, October 20). Installing rpmforge. Retrieved from http://wiki.centos.org/AdditionalResources/Repositories/RPMForge
This document details how to install rmpforge repositories on CentOS to be used with YUM. It is a part of the overall installation process of the monitoring application Cacti that isn’t documented. There are other repositories that can fill this requirement but this one is well known and documented.
Cusack, B. (2009). Secure Sockets Layer. What is. Retrieved (2009, October 26) from http://searchsecurity.techtarget.com/sDefinition/0,,sid14_gci343029,00.html#
VISUAL NETWORKING Page 88 of 109
This is a definition of SSL including what it is and what is does. The article was researched for supporting claims made in the project. The information provide in the article is current and up to date.
Users, Cacti. (2009). Plugin architecture. Retrieved from http://cactiusers.org/wiki/PluginArchitectureInstall
The online document used to install the plugin architecture that is needed to add functionality to Cacti. It was the only reference needed for the basic install of Cacti plugin architecture. The documentation is up to date and well maintained.
Users, Cacti. (2009). Plugins install. Retrieved from http://cactiusers.org/wiki/PluginsInstall
This is the document used to install all the plugins that were needed to add functionality to Cacti. It was the only reference need for the basic install of Cacti plugins. This document also details the removal and upgrade procedures that will be useful in the future. The documentation is up to date and well maintained.
Linux Home Networking. (2009, May 19). Quick howto : ch24 : the ntp server. Retrieved from http://www.linuxhomenetworking.com/wiki/index.php/Quick_HOWTO_:_Ch24_:_The_NTP_Server
This howto document was used for the installation of NTP. NTP is a network time protocol use for the time accuracy. The howto guide has detailed instructions for Linux users from installation to setup. The online documentation was also updated 2009. Linux and NTP haven’t changed that much over the years so this site is staying current.
Linux Home Networking. (2009, May 19). Quick HOWTO : Ch03 : Linux Networking. Retrieved from http://www.linuxhomenetworking.com/wiki/index.php/Quick_HOWTO_:_Ch03_:_Linux_Networking
This “how to” document was used for the configuration of Linux network interfaces. The guide has detailed instructions for Linux users to setup IP addresses, gateways and domains. The online documentation was also updated in 2009. Linux networking hasn’t changed that much over the years so this site is staying current.
Alvestrand, H. (1997, February 10). Object identifiers. Retrieved from http://www.alvestrand.no/objectid/
This article reports a complete description of object identifiers (OID). It lists the most common OIDs. It also lays out the entire tree structure for the most common OIDs. The article is crucial for the understanding of monitoring and its

VISUAL NETWORKING Page 89 of 109
details. The article is over ten years old. It would typically be disqualified as a reference however the information still is relevant on monitoring even new network devices.
Yin, R. (2009). Case study research. United States of America: Sage Publications, Inc..
This book is an outline of how a case study should be completed. The detailed explanations helped develop the outline for the research methodology chapter. The book is current and on its fourth edition.
Case, J, Fedor, M, Schoffstall, M, & Davin, J. (1990, May). A Simple network management protocol (snmp). Retrieved from http://www.ietf.org/rfc/rfc1157.txt

VISUAL NETWORKING Page 90 of 109
Appendix A This appendix has the complete implementation steps used to create this project. It covers hundreds of pages and 3.45 Megabytes of text. It is unrealistic to put it in this study as plain text. These are log file attachments and can be opened in any text viewer.
Appendix B
Appendix C There are two other campus's correct? I'll need the addresses of those network devices and the snmp string applied. If you want to give me a username and password I can do the configs myself. I can send an email with any network changes and wait for your guy's approval then apply the configs myself. On a side note. Do you have a network backup solution where all your network configurations are stored? I'm think on doing snmp config pull and porting it into subversion with websvn implementation? If there already an acceptable solution I don't want to re-invent the wheel. There is also syslog web module for the monitoring tool I personally hate webUI for syslogs but if your trying to teach someone who is new to log surfing it maybe something good to add. [email protected] wrote: > Thanks Rob, > JP, let me know what else we need to do allow you to keep moving. > Erik > > --- On *Mon, 4/13/09, Robert Moon /<[email protected]>/* wrote: > > > From: Robert Moon <[email protected]> > Subject: RE: Fw: Re: Sead Project > To: [email protected], [email protected], [email protected] > Date: Monday, April 13, 2009, 11:50 AM >
VISUAL NETWORKING Page 91 of 109
> I made the change on ASA. > > Rob > > ------------------------------------------------------------------------ > *From:* [email protected] [mailto:[email protected]] > *Sent:* Monday, April 13, 2009 11:44 AM > *To:* [email protected]; [email protected]; Robert Moon; > [email protected] > *Subject:* Re: Fw: Re: Sead Project > > Hi JP, > Sorry, I was a bit distracted during our call. I was in the > middle of a detailed procedure. The best is if I am not in the > middle for this network change. Please work directly with Robert > and/or Eddy regarding this change. Also, I we can set permission > for you to make edits to the ASA. I will check on Tuesday night > and make sure it is addressed. > > --- On *Tue, 4/7/09, JP /<[email protected]>/* wrote: > > > From: JP <[email protected]> > Subject: Re: Fw: Re: Sead Project > To: "Robert Moon" <[email protected]> > Cc: "[email protected]" <[email protected]>, > "Likarish, Daniel" <[email protected]>, "[email protected]" > <[email protected]> > Date: Tuesday, April 7, 2009, 10:16 PM > > Guys I realize this is the last thing you want to be doing so I > apologize if I'm bugging you too much, > > The change I'd like to make on the ASA is: > > crypto isakmp nat-traversal 20 > > Maybe there a pre-existing reason why you don't want this enabled. > I was also unable to vpn in the past two days was there > maintenance? > > Can the 192.168.1.0 network communicate with the other > campus's network > devices. If so I would like to start monitoring those devices > also. > I'll need a list and the community string added to the network > gear. > Any diagrams you have will help. > > > > > > > JP wrote: > > Everyone,
VISUAL NETWORKING Page 92 of 109
> > > > I would like to make a change on the ASA in regards to the > user vpn's > > and do some testing. > > What is the procedure or how does one go about submitting a > change request? > > > > JP > > > > > > > > Robert Moon wrote: > > > >> JP, > >> > >> It is done except for SonicWall FW. I don't have the pw > for it. > >> I do have an old network diagram but I can update it. > >> > >> Let me know if you have any problems. > >> > >> > >> Rob > >> > >> > >> > ------------------------------------------------------------------------ > >> *From:* JP [mailto:[email protected] > <http://us.mc451.mail.yahoo.com/mc/[email protected]>] > >> *Sent:* Sun 3/29/2009 9:09 PM > >> *To:* Robert Moon > >> *Cc:* [email protected] > <http://us.mc451.mail.yahoo.com/mc/[email protected]>; > Likarish, Daniel; [email protected] > <http://us.mc451.mail.yahoo.com/mc/[email protected]> > >> *Subject:* Re: Fw: Re: Sead Project > >> > >> Eddy or Rob, > >> > >> If you want I can apply the community strings I just need a > login. I > >> would like to start capturing data as soon as possible. > >> If there is a community string already applied I can use > that I don't > >> need to use the one listed below. > >> If your not worried about security you can leave off the acl. > >> > >> access-list 7 permit 192.168.1.249 > >> snmp-server community K1t3sFlyH1gh RO 7 > >> > >> Does anyone have current network diagram with hostnames and > IPs? > >> > >> Robert Moon wrote: > >> > >>> JP,
VISUAL NETWORKING Page 93 of 109
> >>> > >>> I can work with you on this via e-mails since I am leaving > for a > >>> conference in DC. > >>> I or Eddy can provide below information you will need from > us and we can > >>> modify the ACL to allow your system to do SNMP walk. I > will be in the > >>> lab on 4/7/2009. > >>> > >>> List of network devices in DTC: > >>> > >>> Cisco Switches: > >>> 192.168.1.58/24 > >>> 192.168.1.62/24 > >>> 192.168.1.63/24 > >>> > >>> Cisco Routers: > >>> > >>> 192.168.1.200/24 > >>> 192.168.1.201/24 > >>> 192.168.1.250/24 > >>> > >>> FW: > >>> > >>> 192.168.1.253/24 Sonic FW > >>> 192.168.1.251/24 Cisco ASA FW > >>> > >>> Let me know if you need more info. > >>> We will try to modify the ACL sometime this week. > >>> > >>> > >>> Rob Moon > >>> > >>> > >>> -----Original Message----- > >>> From: JP [mailto:[email protected] > <http://us.mc451.mail.yahoo.com/mc/[email protected]>] > >>> Sent: Monday, March 23, 2009 6:20 PM > >>> To: [email protected] > <http://us.mc451.mail.yahoo.com/mc/[email protected]> > >>> Cc: Likarish, Daniel; [email protected] > <http://us.mc451.mail.yahoo.com/mc/[email protected]>; > Robert Moon > >>> Subject: Re: Fw: Re: Sead Project > >>> > >>> Hello Everyone, > >>> > >>> I am ready with my project to move into the ARNe network. > Is it possible > >>> to do this tomorrow or next Tuesday? > >>> Eric I don't see Vinny's email. > >>> > >>> Summary of Project: > >>> Graphing tool using snmp polling of network devices. > >>>
VISUAL NETWORKING Page 94 of 109
> >>> What I need: > >>> IP address (must have access to the same network that the > >>> switches/routers/firewalls are on) > >>> Subnet mask > >>> Gateway > >>> DNS (resolvers) > >>> List of IP address of network devices > >>> snmp string per device (if one isn't available see below > for typical > >>> cisco config) > >>> snmp-server community pleas3M0nme RO 7 > >>> access-list 7 permit xxx.xxx.xxx.xxx http > outbound > >>> access ( for updates) ssh and https inbound ( or what ever > method you > >>> use to remotely manage systems ) > >>> > >>> Information on System: > >>> hostname: netmon.ARNe-regis.org > >>> OS: Centos 5.2 > >>> cpu: 634 > >>> hd: 30 gig > >>> ram: 512k > >>> some processes: > >>> httpd > >>> sshd > >>> mysql > >>> php > >>> syslogd > >>> > >>> What else do you need to know from me? > >>> > >>> > >>> > >>> [email protected] > <http://us.mc451.mail.yahoo.com/mc/[email protected]> > wrote: > >>> > >>> > >>>> Hi, yes, I'm working with Eddy Hutson and Robert Moon on > this project. > >>>> > >>>> > >>> > >>> > >>>> We'd be happy to have you on the team. Robert provides > long-term > >>>> high-level support, as he is an alum. Eddy is currently > leading the > >>>> project, and is a practicum member, but he is slated for > graduation in > >>>> > >>>> > >>> > >>> > >>>> May so we will need to hand-off. Give me a call and we
VISUAL NETWORKING Page 95 of 109
> can run > >>>> through where we're at briefly, but once we do that, > getting in touch > >>>> with Eddy and Robert will maximize our effectiveness in > this area. > >>>> Erik > >>>> 303-589-1910 cell > >>>> > >>>> --- On *Wed, 3/18/09, JP /<[email protected] > <http://us.mc451.mail.yahoo.com/mc/[email protected]>>/* > wrote: > >>>> > >>>> > >>>> From: JP <[email protected] > <http://us.mc451.mail.yahoo.com/mc/[email protected]>> > >>>> Subject: Re: Sead Project > >>>> To: "Brown, Jeffrey A" <[email protected] > <http://us.mc451.mail.yahoo.com/mc/[email protected]>> > >>>> Cc: "[email protected] > <http://us.mc451.mail.yahoo.com/mc/[email protected]>" > <[email protected] > <http://us.mc451.mail.yahoo.com/mc/[email protected]>>, > "Likarish, > >>>> Daniel" <[email protected] > <http://us.mc451.mail.yahoo.com/mc/[email protected]>> > >>>> Date: Wednesday, March 18, 2009, 9:00 PM > >>>> > >>>> Erik, > >>>> > >>>> He is a copy of my proposal. I should be ready in > the next two > >>>> weeks to > >>>> actually bring as server on site to start the data > collection and > >>>> customization. The short version of the project is > snmp polling > >>>> > >>>> > >>> to > >>> > >>> > >>>> gather near realtime and keep historical data useful for > >>>> troubleshooting > >>>> and planning. Any increased load or traffic should > be minimal and > >>>> have > >>>> low priority. Part two may useless if there is > already an > >>>> > >>>> > >>> accepted > >>> > >>> > >>>> solution. > >>>> > >>>> As a side note Jeff had mentioned that there was a

VISUAL NETWORKING Page 96 of 109
> project for > >>>> migrating > >>>> of sonicwalls to pix. Are you in charge of the > project? I have > >>>> > >>>> > >>> six > >>> > >>> > >>>> years managing that platform so if you would like > information or > >>>> > >>>> > >>> help > >>> > >>> > >>>> doing software upgrades OS or pdm/asdm prior to > install even > >>>> > >>>> > >>> questions > >>> > >>> > >>>> on how to do something feel free to use me as a resource. > >>>> > >>>> > >>>> > >>>> Brown, Jeffrey A wrote: > >>>> > Erik, I've seen the proposal and it can be used on > the network. > >>>> I don't believe that it flows into other projects > underway. > >>>> > > >>>> > Jeff > >>>> > ________________________________________ > >>>> > From: [email protected] > <http://us.mc451.mail.yahoo.com/mc/[email protected]> > >>>> > >>>> > >>>> > >>> > <http://us.mc451.mail.yahoo.com/mc/[email protected]> > >>> > >>> > >>>> [[email protected] > <http://us.mc451.mail.yahoo.com/mc/[email protected]> > >>>> > >>>> > >>>> > >>> > <http://us.mc451.mail.yahoo.com/mc/[email protected]>] > >>> > >>> > >>>> > Sent: Friday, March 13, 2009 10:05 AM > >>>> > To: Likarish, Daniel; Paul, James > >>>> > Cc: Brown, Jeffrey A
VISUAL NETWORKING Page 97 of 109
> >>>> > Subject: Re: Sead Project > >>>> > > >>>> > Hi, I can help you with most of those things. > Also, please send > >>>> Jeff and me the proposal. we are responsible for > monitoring and > >>>> there are several projects in this area. It would be > good to make > >>>> sure your work cumulative for the network in relation > to other > >>>> projects. > >>>> > Erik > >>>> > 303-589-1910 cell > >>>> > > >>>> > --- On Thu, 3/12/09, JP <[email protected] > <http://us.mc451.mail.yahoo.com/mc/[email protected]> > >>>> > <http://us.mc451.mail.yahoo.com/mc/[email protected]>> > >>>> wrote: > >>>> > > >>>> > From: JP <[email protected] > <http://us.mc451.mail.yahoo.com/mc/[email protected]> > >>>> > <http://us.mc451.mail.yahoo.com/mc/[email protected]>> > >>>> > Subject: Re: Sead Project > >>>> > To: "Likarish, Daniel" <[email protected] > <http://us.mc451.mail.yahoo.com/mc/[email protected]> > >>>> > <http://us.mc451.mail.yahoo.com/mc/[email protected]>> > >>>> > Cc: "Erik Moore" <[email protected] > <http://us.mc451.mail.yahoo.com/mc/[email protected]> > >>>> > >>>> > >>>> > >>> > <http://us.mc451.mail.yahoo.com/mc/[email protected]>>, > >>> > >>> > >>>> "Brown, Jeffrey A" <[email protected] > <http://us.mc451.mail.yahoo.com/mc/[email protected]> > >>>> > <http://us.mc451.mail.yahoo.com/mc/[email protected]>> > >>>> > Date: Thursday, March 12, 2009, 8:59 PM > >>>> > > >>>> > Dan, > >>>> > > >>>> > I'm taking this as an OK to move forward. I have > located a Dell > >>>> > PowerEdge server that I can donate for my project. > I have > >>>> > >>>> > >>> questions > >>> > >>> > >>>> > about the current network. I have looked at a lot
VISUAL NETWORKING Page 98 of 109
> of documents > >>>> in Sead > >>>> > Practicum Website shared documents but I was unable > to location > >>>> > >>>> > >>> the > >>> > >>> > >>>> > information that I was looking for. Is there a > person or > >>>> persons that > >>>> > is the network admin for all changes and requests > for the > >>>> network? Such > >>>> > as security requirements, community strings, IP for > my server, > >>>> find out > >>>> > exactly what monitoring is in place, whats being > graphed, a > >>>> device list > >>>> > ect... > >>>> > > >>>> > Thanks, > >>>> > > >>>> > > >>>> > Likarish, Daniel wrote: > >>>> > > >>>> >> JP, > >>>> >> The idea of developing a network monitoring tool > that has a > >>>> > >>>> > >>> useful > >>> > >>> > >>>> >> display certainly fits within the most useful SEAD > projects. > >>>> The AD > >>>> >> group has built ARNEOLD Academic Research Network > online Display > >>>> >> platform. This project can be an expansion of > the current > >>>> simple GUI. > >>>> >> > >>>> >> Dan > >>>> >> > >>>> >> > >>>> >> On 3/11/09 8:13 AM, "JP" <[email protected] > <http://us.mc451.mail.yahoo.com/mc/[email protected]> > >>>> > >>>> > >>>> > >>> > <http://us.mc451.mail.yahoo.com/mc/[email protected]><http:// > >>> us.mc451.mail.yahoo.com/mc/[email protected]
VISUAL NETWORKING Page 99 of 109
> <http://us.mc451.mail.yahoo.com/mc/[email protected]>>> > >>> > >>> > >>>> wrote: > >>>> >> Has > >>>> >> > >>>> >> Dan, > >>>> >> > >>>> >> I have attached a project overview not sure if > it's right > >>>> or who to > >>>> >> submit this to. > >>>> >> > >>>> >> It would be easier to do the development at > home. I can > >>>> probably > >>>> >> find a > >>>> >> server to use/donate so I can get started > now. Then just > >>>> bring it to > >>>> >> one of the labs to integrate it into the network. > >>>> >> > >>>> >> Thank you, > >>>> >> Jim Paul

VISUAL NETWORKING Page 100 of 109
Appendix D

VISUAL NETWORKING Page 101 of 109
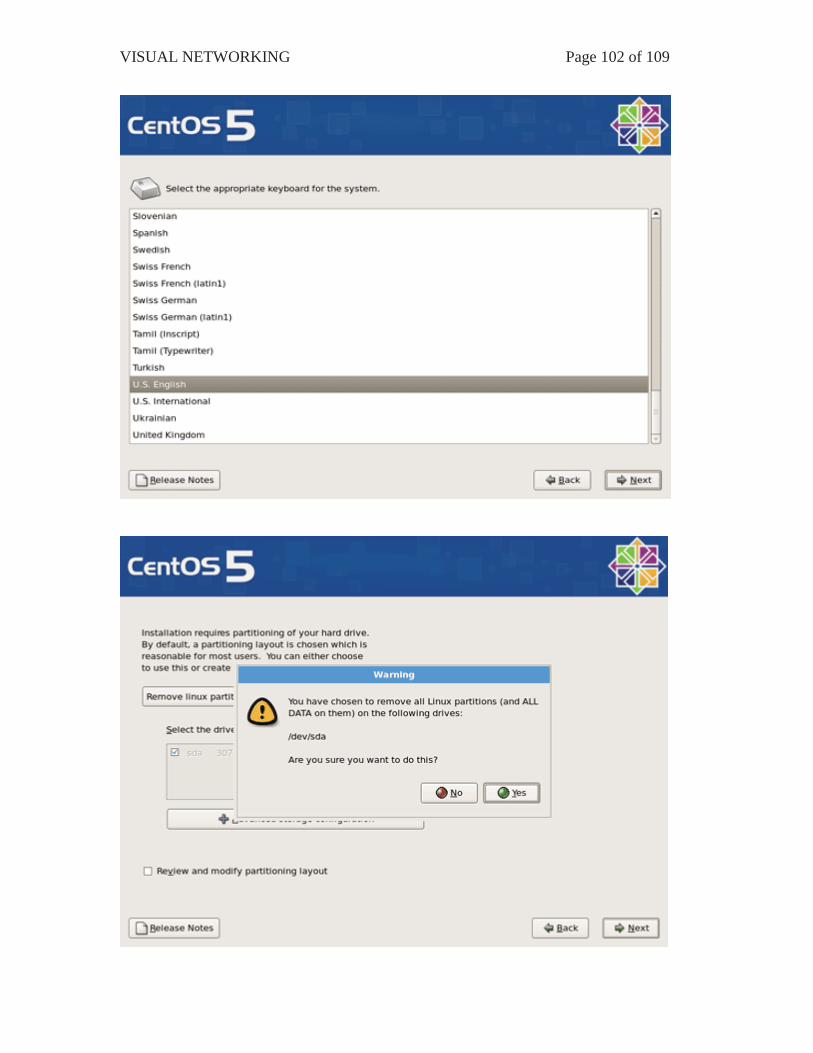
VISUAL NETWORKING Page 102 of 109
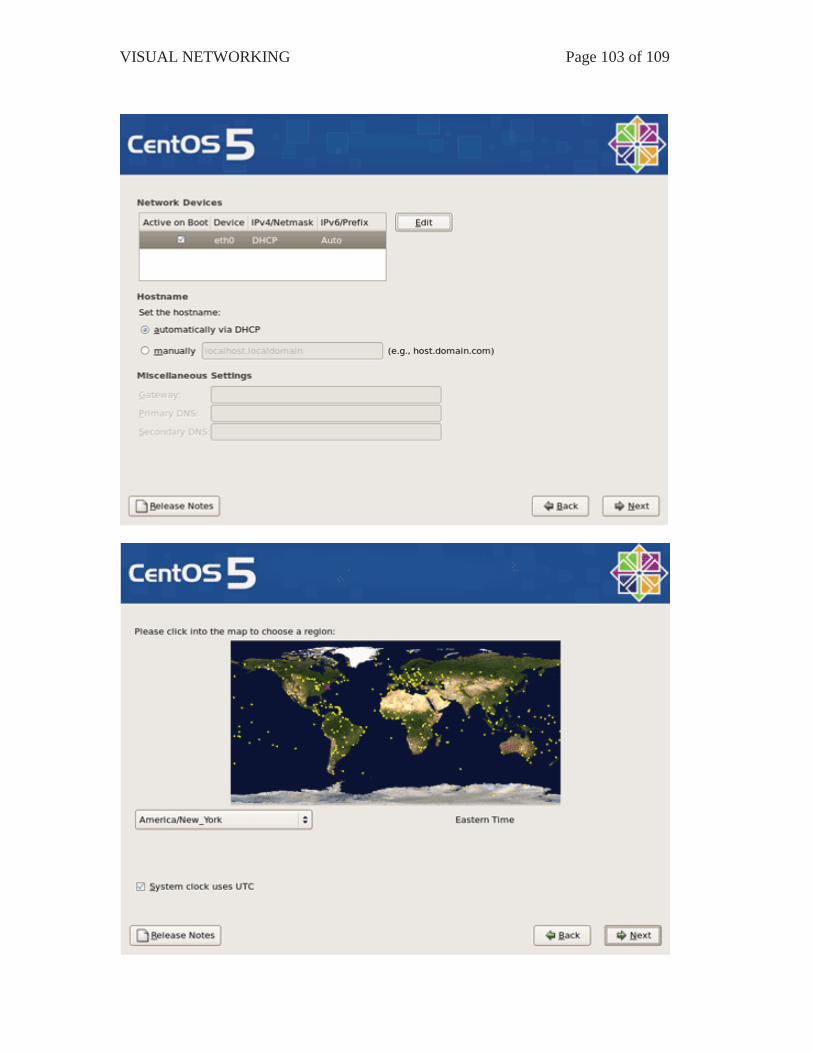
VISUAL NETWORKING Page 103 of 109
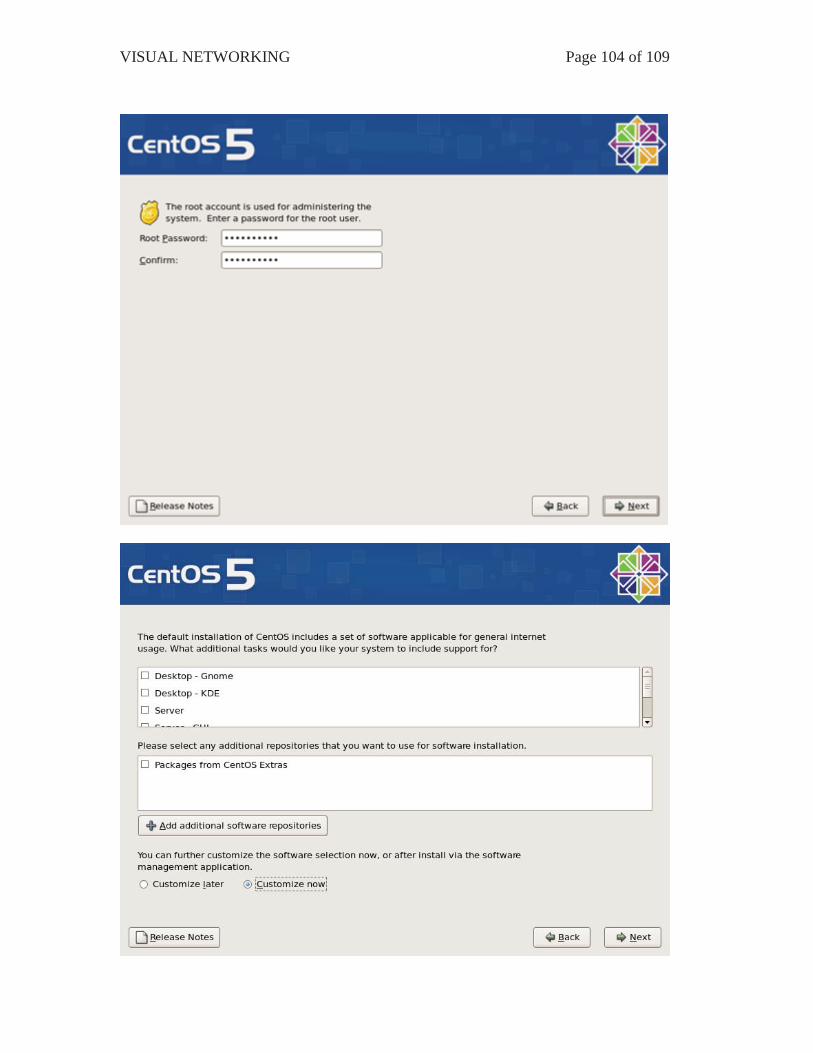
VISUAL NETWORKING Page 104 of 109
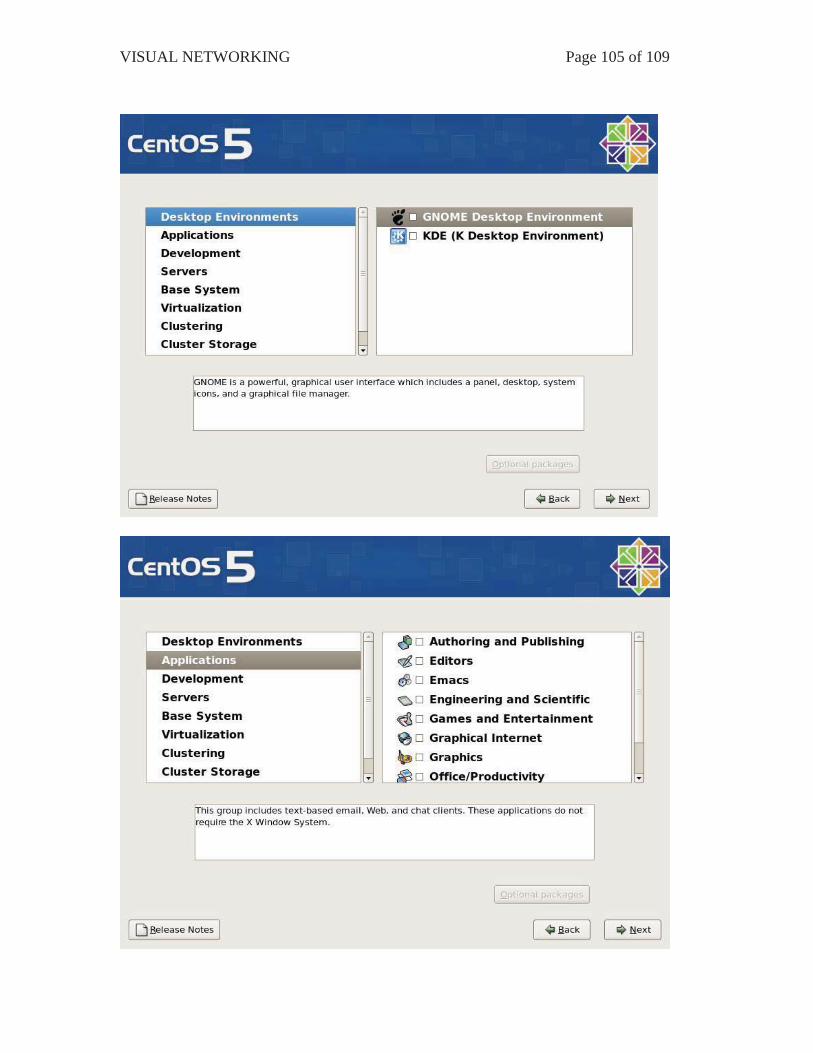
VISUAL NETWORKING Page 105 of 109

VISUAL NETWORKING Page 106 of 109

VISUAL NETWORKING Page 107 of 109
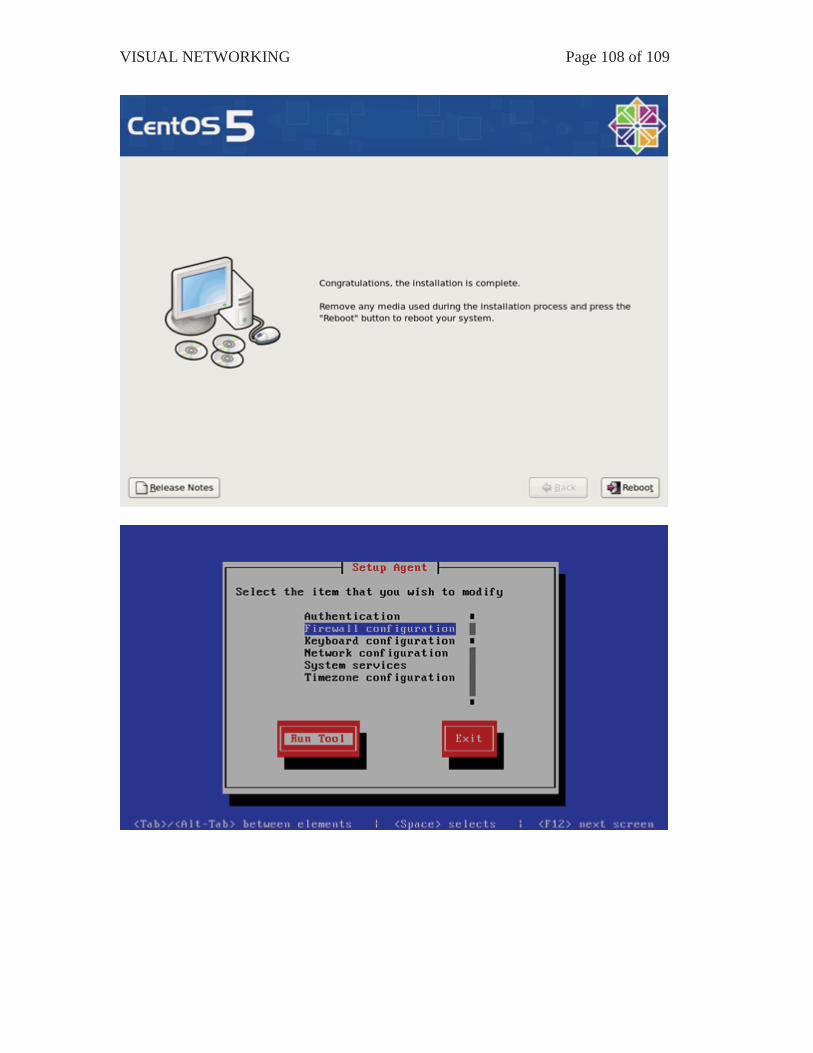
VISUAL NETWORKING Page 108 of 109

VISUAL NETWORKING Page 109 of 109