Visual areas PPA and pSTS diverge from other processing modules during perceptual closure:...
9
Research Report Functional parcellation of the operculo-insular cortex in perceptual decision making: An fMRI study Jose ´ Rebola n , Jo ~ ao Castelhano, Carlos Ferreira, Miguel Castelo-Branco n Visual Neuroscience Laboratory, IBILI (Institute for Biomedical Imaging in Light and Image), Faculty of Medicine, University of Coimbra, Azinhaga de Sta Comba, 3000-548 Coimbra, Portugal article info Article history: Received 25 January 2012 Received in revised form 11 May 2012 Accepted 26 June 2012 Available online 3 July 2012 Keywords: Insula Decision-making fMRI Perceptual closure Uncertainty abstract A current challenge in cognitive neuroscience is to provide an explicit separation of the neural correlates of abstract global decision variables from sensory and integrative ones. In particular, the insular cortex and the adjacent frontal operculum seem to have a crucial but still unclear role in evidence accumulation and decision signaling in perceptual decision-making tasks. Here, we have used a visual decision-making paradigm based on the detection of ambiguous two-tone (Mooney) face stimuli to assess the emergence of holistic percepts. These are constructed using global gestalt rules and not by gradual spatiotemporal increases in sensory evidence. Our paradigm (neurochronometric approach) enabled the experimental separation between multiple cognitive components in perceptual decision validated by both model-driven and data-driven analysis. This strategy allowed for the functional dissection of operculo-insular networks into task related complexes such as anterior (accumulator), middle (decision) and posterior (somatosensory/sensorimotor). We conclude that global perceptual integration based on holistic rules requires a distributed operculo-insular network. & 2012 Elsevier Ltd. All rights reserved. 1. Introduction The elucidation of sensory, perceptual, cognitive control and motor processes in decision making remains an outstanding neuros- cientific challenge (Kayser, Buchsbaum, Erickson, & D’Esposito, 2010; Schall, 2001); for review see (Heekeren, Marrett, & Ungerleider, 2008). Although the involvement of multiple interacting modules is consensual (Gold & Shadlen, 2007; Platt, 2002; Salinas, 2008; Wang, 2008), it is hard to infer the exact role of each because of the simultaneous recruitment of distinct cognitive processes. This overlap of cognitive operations gives rise to different theories about the functions of areas thought to be critical in the decision-making architecture, such as the bilateral anterior insula and the adjacent frontal operculum, placed at the core of such processes by a number of studies (Binder, Liebenthal, Possing, Medler, & Ward, 2004; Ho, Brown, & Serences, 2009; Thielscher & Pessoa, 2007). The cognitive role of the insular cortex has received increasing attention and recent evidence highlighting the anatomical and functional subdivisions of the insula (Cauda et al., 2011; Deen, Pitskel, & Pelphrey, 2010) pave the way for the possibility that this area is not restricted to a single role in the decision-making architecture. Here, we addressed the role of distinct operculo-insular regions in decision making by using functional magnetic resonance imaging (fMRI) in a neurochronometric face detection task during which the time of perceptual decision was experimentally uncoupled both from time of stimulus onset and from the time of response. This research strategy is relevant to the parsing of a complex mental operation into its components (Sigman & Dehaene, 2005). Such components can be obtained both by means of a widespread data- driven decomposition (ICA, independent component analysis) and standard task-related protocols (GLM, general linear model). Hence, we adapted the accumulator-based decision architecture used by Ploran et al. (2007), Ploran, Tremel, Nelson, and Wheeler (2011) and extended it to investigate a general mechanism concerning the integration of holistic perceptual evidence, decision signaling and response. We have chosen a dual-task face detection paradigm using Mooney face stimuli (two-tone abstract-like face images) Mooney (1957) to investigate these questions. The emergence of the global holistic percept in these images occurs in the absence of change in local saliency cues or sensory signal to noise ratios. In the first task, response is executed upon the moment of perception/detection whilst in the second task the time is color-coded (see Section 2) and the response is delayed. The rationale for including this modified version of the response task was that such procedure abolishes immediate response and minimizes motor planning at the moment of decision whilst keeping information on the detection time. This design allowed separation between decision and motor/response processes and by combining the different temporal properties of the Contents lists available at SciVerse ScienceDirect journal homepage: www.elsevier.com/locate/neuropsychologia Neuropsychologia 0028-3932/$ - see front matter & 2012 Elsevier Ltd. All rights reserved. http://dx.doi.org/10.1016/j.neuropsychologia.2012.06.020 Abbreviations: RFX-GLM, Random effects general linear model; ICA, Independent component analysis n Corresponding authors. E-mail addresses: [email protected] (J. Rebola), [email protected] (M. Castelo-Branco). Neuropsychologia 50 (2012) 3693–3701
-
Upload
independent -
Category
Documents
-
view
0 -
download
0
Transcript of Visual areas PPA and pSTS diverge from other processing modules during perceptual closure:...
Neuropsychologia 50 (2012) 3693–3701
Contents lists available at SciVerse ScienceDirect
Neuropsychologia
0028-39
http://d
Abbre
componn Corr
E-m
mcbran
journal homepage: www.elsevier.com/locate/neuropsychologia
Research Report
Functional parcellation of the operculo-insular cortex in perceptualdecision making: An fMRI study
Jose Rebola n, Jo~ao Castelhano, Carlos Ferreira, Miguel Castelo-Branco n
Visual Neuroscience Laboratory, IBILI (Institute for Biomedical Imaging in Light and Image), Faculty of Medicine, University of Coimbra, Azinhaga de Sta Comba,
3000-548 Coimbra, Portugal
a r t i c l e i n f o
Article history:
Received 25 January 2012
Received in revised form
11 May 2012
Accepted 26 June 2012Available online 3 July 2012
Keywords:
Insula
Decision-making
fMRI
Perceptual closure
Uncertainty
32/$ - see front matter & 2012 Elsevier Ltd. A
x.doi.org/10.1016/j.neuropsychologia.2012.06
viations: RFX-GLM, Random effects general lin
ent analysis
esponding authors.
ail addresses: [email protected] (J. Rebola),
[email protected] (M. Castelo-Branco).
a b s t r a c t
A current challenge in cognitive neuroscience is to provide an explicit separation of the neural
correlates of abstract global decision variables from sensory and integrative ones. In particular, the
insular cortex and the adjacent frontal operculum seem to have a crucial but still unclear role in
evidence accumulation and decision signaling in perceptual decision-making tasks. Here, we have used
a visual decision-making paradigm based on the detection of ambiguous two-tone (Mooney) face
stimuli to assess the emergence of holistic percepts. These are constructed using global gestalt rules
and not by gradual spatiotemporal increases in sensory evidence. Our paradigm (neurochronometric
approach) enabled the experimental separation between multiple cognitive components in perceptual
decision validated by both model-driven and data-driven analysis. This strategy allowed for the
functional dissection of operculo-insular networks into task related complexes such as anterior
(accumulator), middle (decision) and posterior (somatosensory/sensorimotor). We conclude that global
perceptual integration based on holistic rules requires a distributed operculo-insular network.
& 2012 Elsevier Ltd. All rights reserved.
1. Introduction
The elucidation of sensory, perceptual, cognitive control andmotor processes in decision making remains an outstanding neuros-cientific challenge (Kayser, Buchsbaum, Erickson, & D’Esposito, 2010;Schall, 2001); for review see (Heekeren, Marrett, & Ungerleider,2008). Although the involvement of multiple interacting modules isconsensual (Gold & Shadlen, 2007; Platt, 2002; Salinas, 2008; Wang,2008), it is hard to infer the exact role of each because of thesimultaneous recruitment of distinct cognitive processes. This overlapof cognitive operations gives rise to different theories about thefunctions of areas thought to be critical in the decision-makingarchitecture, such as the bilateral anterior insula and the adjacentfrontal operculum, placed at the core of such processes by a numberof studies (Binder, Liebenthal, Possing, Medler, & Ward, 2004; Ho,Brown, & Serences, 2009; Thielscher & Pessoa, 2007). The cognitiverole of the insular cortex has received increasing attention and recentevidence highlighting the anatomical and functional subdivisions ofthe insula (Cauda et al., 2011; Deen, Pitskel, & Pelphrey, 2010) pavethe way for the possibility that this area is not restricted to a singlerole in the decision-making architecture.
ll rights reserved.
.020
ear model; ICA, Independent
Here, we addressed the role of distinct operculo-insular regionsin decision making by using functional magnetic resonance imaging(fMRI) in a neurochronometric face detection task during which thetime of perceptual decision was experimentally uncoupled bothfrom time of stimulus onset and from the time of response. Thisresearch strategy is relevant to the parsing of a complex mentaloperation into its components (Sigman & Dehaene, 2005). Suchcomponents can be obtained both by means of a widespread data-driven decomposition (ICA, independent component analysis) andstandard task-related protocols (GLM, general linear model). Hence,we adapted the accumulator-based decision architecture used byPloran et al. (2007), Ploran, Tremel, Nelson, and Wheeler (2011) andextended it to investigate a general mechanism concerning theintegration of holistic perceptual evidence, decision signaling andresponse.
We have chosen a dual-task face detection paradigm usingMooney face stimuli (two-tone abstract-like face images) Mooney(1957) to investigate these questions. The emergence of the globalholistic percept in these images occurs in the absence of change inlocal saliency cues or sensory signal to noise ratios. In the first task,response is executed upon the moment of perception/detectionwhilst in the second task the time is color-coded (see Section 2) andthe response is delayed. The rationale for including this modifiedversion of the response task was that such procedure abolishesimmediate response and minimizes motor planning at the momentof decision whilst keeping information on the detection time. Thisdesign allowed separation between decision and motor/responseprocesses and by combining the different temporal properties of the
J. Rebola et al. / Neuropsychologia 50 (2012) 3693–37013694
tasks we distinguish between sensory regions, motor regions, andthose with a broader role in cognitive control and its relation to theholistic decision process.
The combination of these approaches can help disambiguatethe role, or more importantly, the roles, of the insular cortex/frontal operculum in the decision-making architecture. Further-more, we probe the gradient hypothesis proposed by Craig (2009)and assessed in the connectivity patterns explored by Cerlianiet al. (2011), which suggests that as one moves from posterior tomore anterior sites within the insula, the primary interoceptiverepresentations gradually integrate motivational, social and cog-nitive activity.
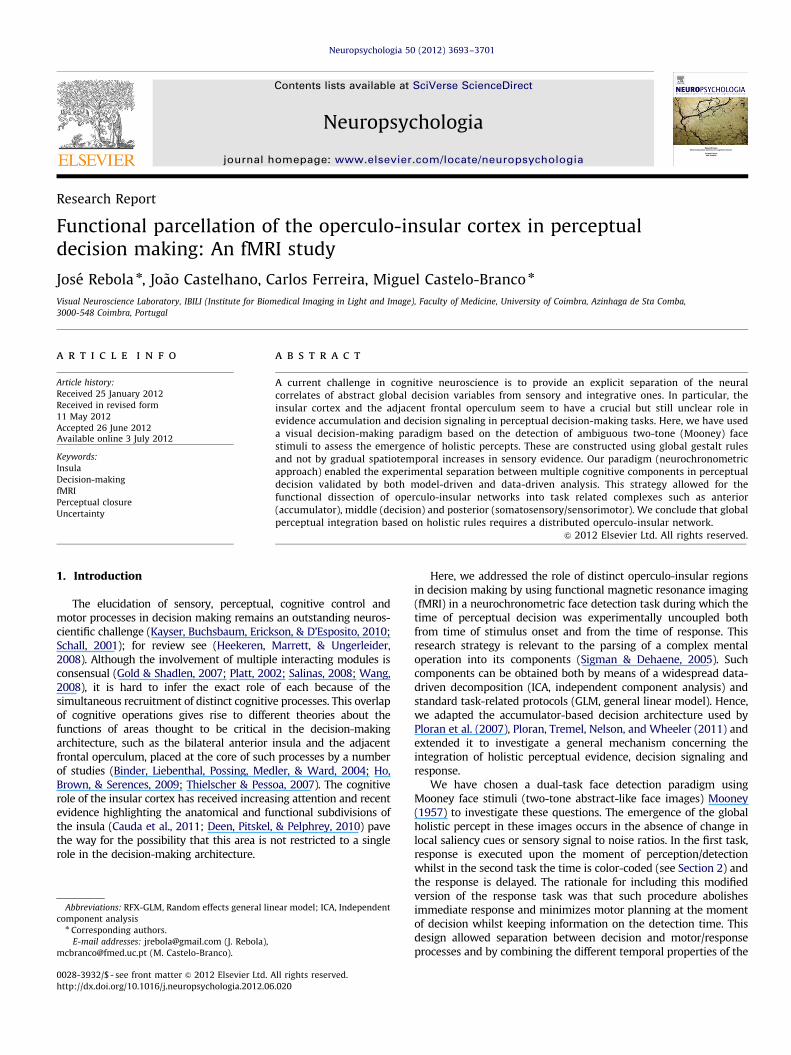
Fig. 1. Timeline of the visual recognition task using Mooney stimuli; A—the face
rotates from inverted to upright and the subject presses a button when (and only
if) a face is detected; B—the ‘‘white component’’ (foreground) of the Mooney face
changes color every TR (acquisition volume) and the subject indicates the moment
of detection only at the end of the trial by selecting from a list the color that
corresponds to detection time.
2. Materials and methods
2.1. Subjects
14 right-handed subjects (8 females, 6 males, ages 21–41, mean age 26.6
years) participated in the study after providing informed consent. All had normal
or corrected to normal vision.
The study followed the tenets of the Declaration of Helsinki, informed consent
being obtained from all subjects for the protocol, which was approved by our local
Ethics Committee.
2.2. Stimuli and task design
Mooney face stimuli (two-tone images) were chosen because they provide a
classical way of generating ambiguous perception (which is enhanced if stimuli
are viewed upside down). These stimuli may appear devoid of any recognizable
object for several seconds until the observer suddenly becomes aware of the
emergence of a holistic face percept. Difficulty levels were adjusted in pilot
experiments to render uncertain the presence of a face and to decrease the
likelihood of immediate detection. Trials where faces were not perceived can
effectively be considered as scrambled controls. These stimuli characteristics were
suited to the research goal of uncoupling sensation from object perception for the
following reasons:
–
sudden global awareness of the face will lead to temporally containedperceptual events that are separable from initial local sensory processing;
differential onset of activity on ‘‘early’’ and ‘‘late’’ detection trials is a
distinguishing characteristic of a neural encoder of perception processes. This
property can advantageously be used in identifying the perceptual networks
involved in the decision process.
–
interpretation of the presence of a face relies on holistic perception and cannoteasily be achieved through local visual analysis, thereby optimizing the delay
between local sensory processing and global perception. Accordingly, the pre-
perceptual period of Mooney face stimuli serves as a sensory control/baseline
–
further high-level processing of the face (identity, emotion, and othercategorical aspects) is deemphasized given stimuli ‘‘abstractedness’’.
2.2.1. Simultaneous decision and response task
Stimuli consisted of 30 movies, each lasting 12 s. The movies show 2-tone
(black and white) images of putative faces (Mooney faces) starting in the inverted
position and slowly rotating 201 per second until they reach upright position
where they rest for 3 s. There were no repeated movies. Stimuli were presented in
a black background and subtended approximately 12.401 of the visual field. Each
experimental run consisted of 30 movies interleaved with 8 s fixation baseline
periods. Subjects were instructed to respond as soon as (but only if) they were
confident they were seeing a face. Response was achieved through a response box,
by the pressing of a button with a finger of the left hand. This task is referred to as
the ‘‘Simultaneous Response Task’’.
2.2.2. Color task: Delayed response vs. decision
Stimuli also consisted of 30 movies, each lasting 12 s. The movies showed
2-tone (black and white) images of putative faces (Mooney faces) starting in the
inverted position and slowly rotating 201 per second until they reached upright
position where they rest for 3 s. The image foreground changes color every TR (2 s)
in the following order (white, blue, yellow, pink, green, light gray). There were no
repeated movies (nor within the run nor from the simultaneous response task
run). Other stimulus properties were identical to the simultaneous response task.
Subjects were instructed to identify the color of the face (in case of detection) at
the moment of perception. That color (encoding time of decision) was selected
from a list presented only at the end of the trial. Selection was made by using two
buttons in one hand to move a cursor up or down until the correct color was
highlighted and then pressing a button with the other hand to confirm the choice.
When the subject responded the color list disappeared, followed by fixation. This
procedure precludes motor responses concomitant to holistic perceptual events
and allows one to keep information on the moment of perception by using a color
code thereby enabling separation of decision and motor processes. This task is
referred to as the ‘‘Color Task’’. Task designs are summarized in Fig. 1.
2.2.3. Rationale for the dual-task paradigm
The use of a dual-task paradigm and the complementary nature of the tasks ensure
the separation between decision and somatosensory or motor response processes.
Even before directly addressing the decision architecture and ideal activation
patterns, let us compare the activity for the two tasks for faces seen, for example,
at 4 s, i.e., after 4 s of rotation. Since the response is delayed in the color task
(buttons will be pressed only at the end of the trial), areas that are involved
merely in the response processes will show a dramatic delay in activity from one
task to the other. Accordingly, its activity peak shifts from the time of detection in
the response task to the end of the trial in the color task. For areas that underlie
evidence accumulation or decision signaling this shift will not happen, since the
only factor that changes between tasks is the response mechanism.
2.3. Image acquisition parameters and pre-processing
Images were obtained on a Siemens Tim Trio 3T scanner using a 12 channel head
coil. Structural images were collected using a T1 weighted MPRAGE (magnetization-
prepared rapid-acquisition gradient echo) (TR¼2300 ms, TE¼2.98 ms, flip angle¼91,
matrix size¼240�256, voxel size¼1 mm3). Standard T2n-weighted gradient-echo echo
planar imaging was used for the functional task runs (TR¼2000 ms; TE¼52 ms; 2�2
in-plane resolution; 3 mm slice thickness with no gap; flip angle¼901; matrix
size¼114�114; number of slices¼23; 455 measurements for the color task and
355 for the simultaneous response task). The slices were oriented to obtain a brain
coverage spanning from the cerebellum to the inferior frontal and parietal lobes,
ensuring insular cortex coverage. All runs were acquired in the same session. Image
processing was performed using BrainVoyager QX v2.1 (Brain Innovation, Maastricht,
The Netherlands) Pre-processing steps included motion correction, slice scan-time
correction, linear trend removal and temporal high-pass filtering of 0.00980 Hz (3
cycles in time course).
2.4. Data analysis
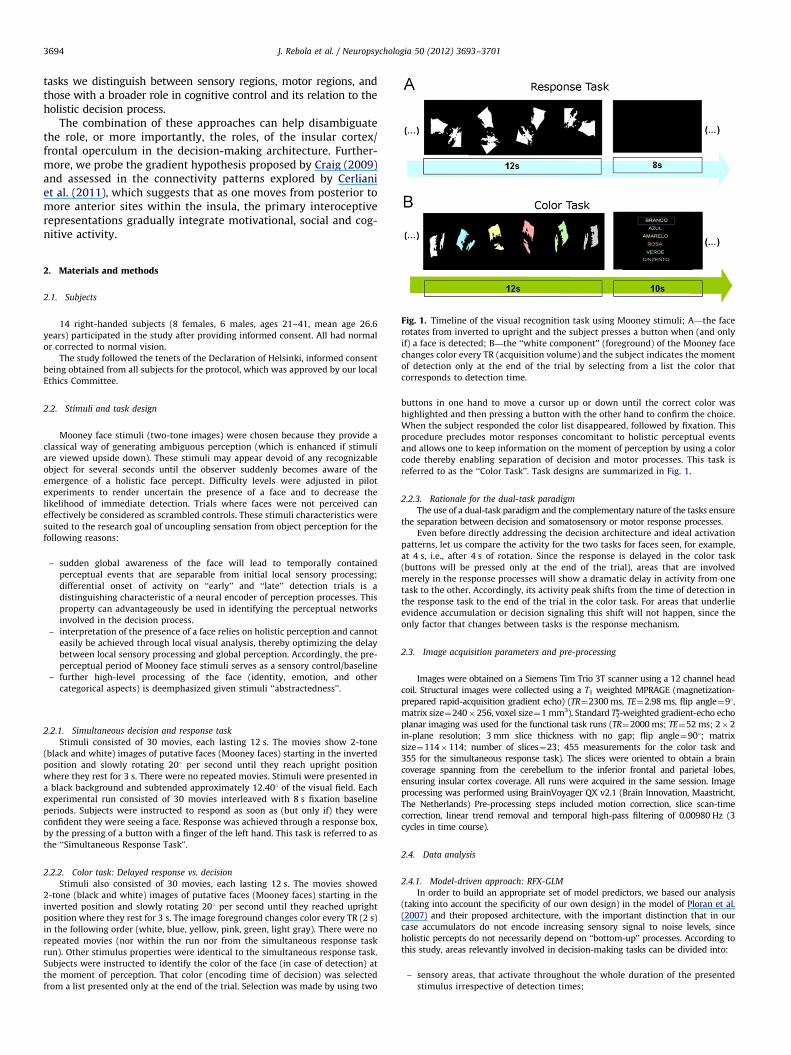
2.4.1. Model-driven approach: RFX-GLM
In order to build an appropriate set of model predictors, we based our analysis
(taking into account the specificity of our own design) in the model of Ploran et al.
(2007) and their proposed architecture, with the important distinction that in our
case accumulators do not encode increasing sensory signal to noise levels, since
holistic percepts do not necessarily depend on ‘‘bottom-up’’ processes. According to
this study, areas relevantly involved in decision-making tasks can be divided into:
–
sensory areas, that activate throughout the whole duration of the presentedstimulus irrespective of detection times;
J. Rebola et al. / Neuropsychologia 50 (2012) 3693–3701 3695
–
Fighem
TabCon
Se
A
D
M
Sum
iden
accumulator areas, that reflect gathering of perceptual evidence favoring
detection, from stimulus onset up to a moment when the decision threshold
is reached (higher accumulation rates imply earlier detection times);
–
decision/detection areas which activate transiently around the moment ofdetection, signaling decision or being recruited by it;
–
motor/somatosensory areas, modeled to account for conditions where motorresponses coincide with the decision moment but also when they are delayed.
–
To mimic such modules, 4 regressors (or predictors) were specified:–
-Stimulus (S), ‘‘on’’ during the whole period of movie presentation.–
Decision_response (DR) regressor, ‘‘on’’ only on the acquisition volume inwhich the decision was reported with the button press (response task only).
–
-Decision_color (DC) regressor, ‘‘on’’ only in the time slot in which the facewas perceived (based on the color selected at the end of the trial—color
task only).
–
-Color_List’’ (CL), ‘‘on’’ during the period used by the subject to choose thecolor from the list (color task only).
Given that the above specified design (Fig. 2) features decision regressors that
are not orthogonal to the stimulus regressor we performed the standard evalua-
tion of colinearity diagnostics. The standard statistics for this evaluation include
the computation of the variance inflation factor (VIF) and its reciprocal, the
tolerance, within the set of predictors (Menard, 1995; Myers, 1990). It is generally
agreed that VIF values under 10 (and consequently tolerance values above 0.1) are
adequate. Our values were all under this and even more conservative thresholds of
5 and 2.5 (Allison, 1999). Thus, the amount of shared variance in the chosen set of
predictors is not a concern. Latency analyses (not shown) confirm the validity of
this approach.
Beta values associated with the regressors could then be contrasted or
combined to find candidate areas statistically consistent with the modeled
functional properties. In particular, sensory processors can be located by studying
the contrast S4(DRþDC), whereas the contrast (DCþDR)4S identifies decision/
detection areas. Accumulator areas were analyzed using the contrast S4baseline
AND (DRþDC)4baseline (AND denotes conjunction). Motor areas were searched
for using the contrast DR4DC. The choice of model and contrasts allows the
assessment of the above mentioned decision architecture while allowing the
identification of task-relevant areas that exhibit slight deviations to the pre-
specified dynamical patterns. This is of importance and in line with Ploran et al.
tenet that ‘‘Although the time course profile predictions are derived from theoretical
accounts and empirical findings, we note that BOLD responses need not necessarily
show these specific time course patterns because some regions may show combina-
tions of such responses (i.e., both accumulator and moment of recognition patterns,
. 2. Chronometry of our decision paradigms and respective predictor timelines used i
odynamic response function). Note that decision predictors vary in time from mo
le 1trasts for standard random effects (RFX)-GLM.
Stimulus
(S)
Decision response
(DR)
nsory processors (1) (0)
ccumulators/mixed
pattern
(1) (1)
ecision/detection areas (0) (1)
otor areas (0) (1)
mary of predictor expected type of level (columns) and classification model for dif
tify the areas for each module in the architecture is shown. (1) means a predictor
which would preclude dissociation), or show responses not otherwise considered a
priori.’’.
The contrast set based on the four predictors is summarized in Table 1, where
‘‘1’’ and ‘‘0’’ depict predictor weight as analyzed by the GLM approach. The
statistical analysis was based on least-squares estimation with correction for
serially autocorrelated observations. BrainVoyager was used to generate the
design matrix by convolving a boxcar function with a model for the BOLD
response function and a response delay of 6 s. Note that the more conservative
random effects (RFX) analysis was used in order to provide generalization of
effects for the population.
2.4.2. Data-driven approach: Independent component analysis (ICA)
Data-driven approaches yield model-independent results from the data, which
can be used to validate pre-specified model-based hypotheses. In this manner, we
have used ICA, a blind source separation algorithm, to investigate if an equivalent
functional parcellation of the insula can be obtained without constraints and the
inherent limitations of the GLM approach.
The ICA decomposition was performed in BrainVoyager software using the
‘‘FastICA’’ deflation approach, a fixed-point ICA algorithm developed by Hyvarinen
and colleagues (see http://www.cis.hut.fi/projects/ica/fastica/). Before applying
spatial ICA, we used a spatial mask to restrict the area of interest to the insular/
opercular cortex and neighboring regions.
ICA applied to fMRI data prioritizes and maximizes spatial independency
(McKeown et al., 1998), and theoretically produces as many components as
there are data points in the processed time course. However, for practicality,
the temporal dimension of the data was reduced using principal component
analysis (PCA) resulting in 20 components, a number under the advised one-sixth
of the number of volumes. The chosen number of ICA components, typically
between 20 and 60 is not a strict parameter and depends on the data (Calhoun,
Liu, & Adali, 2009). We opted for the former limit because of the lower number
of voxels.
ICs were then extracted from both runs for all the 14 subjects, totaling 28 ICA
decompositions. These were scaled to spatial z-scores (i.e., the number of standard
deviations of their whole-brain spatial distribution). These values express the
relative amount a given voxel is modulated by the activation of the component
(McKeown et al., 1998). This set was then used as an input to the self-organizing
group ICA BrainVoyager algorithm (Esposito et al., 2005) that clusters components
across subjects based on their spatial and temporal similarities. The linear
correlation coefficient (computed between two spatial maps and/or two time-
courses of activity) is adopted as the similarity measure in the present version. The
similarity measures are converted to Euclidean distances and these are used to fill
n the random effects (RFX)-GLM for both tasks (shown before convolution with the
vie to movie favoring predictor decorrelation.
Decision color
(DC)
Color list
(CL)
Contrast
(0) – S4(DRþDC)
(1) – S and (DRþDC)4baseline
(1) – DR4S and DC4S
(0) (1) DR4DC
ferent brain regions (Rows). In the last column, the relevant RFX-GLM contrast to
at ‘‘High’’ state and (0) at ‘‘Low’’ state.

J. Rebola et al. / Neuropsychologia 50 (2012) 3693–37013696
a matrix of ‘‘distances’’. Based on the distance matrix, a supervised hierarchical
clustering procedure is run, the supervising constraint consisting of accepting just
one component per subject in each cluster formed by the hierarchical procedure.
We thresholded the input maps at z¼1 before spatial similarity comparison to
reject noise and used no temporal similarity constraints since each performance
timecourse was subject specific.
The statistic for each voxel was calculated as the mean ICA Z-value of that
voxel across the individual maps. Maps were thresholded at z¼1.5. We chose
clusters of interest according to (1) the clusters with the lowest mean intra-cluster
distances, and (2) spatial overlap with the areas of interest. Thus, from the
resulting 20 ‘‘group’’ components, the ones representing structured physiological
noise were discarded as well as those under 0.1 (10%) mean similarity between
subjects.
2.4.3. Event-related averages and timecourse parameters
The understanding of ‘‘when’’ and ‘‘how’’ neural processes occur in the brain is
just as important as understanding their spatial correlates. Accordingly, event-
related average timecourses were calculated for the areas identified with the
previous methods.
For each area, seven conditions were defined, each corresponding to a given
temporal moment of perceptual decision. In this manner, if the face was detected
in the first TR (0–2 s after movie onset), this was a different condition than if the
face is detected on the second TR (2–4 s after movie onset). This yielded six
conditions plus one condition where the face was unseen/undetected.
Such dynamics provide valuable information on the putative functional role of
the insula parcels (for visualization see Fig. 6) by comparing them against the ‘‘ideal’’
activation patterns for the considered decision architecture, shown in Fig. 3.
3. Results
3.1. Behavioral results
The behavioral results are summarized in Table 2 for theoverall data and for each task separately. Relative frequencies ofdetection were similar across tasks (Chi square test, ns). Ranges oftime of detection were also similar (Moses Test, ns). The choice ofdifficulty levels for detection stimuli led to spread in decisiontimes (�75% of the stimuli requiring at least a few seconds fordetection) and a sizeable number of trials where stimuli wereperceived as scrambled.
3.1.1. Identification of regions based on the modeled RFX-GLM
predictors
We have taken advantage from the segregated chronometry ofthe decision process enabled by our dual task paradigm, wherebydetection times were spread in time, to assign different predictorsto key task periods: sensory periods starting prior to perception,decision periods – jittered in time favoring predictor decorrela-tion – and response periods.
Though our focus is the insular/opercular cortex, Table 3 andFig. 4 (panels a–d) show regions identified by RFX-GLM contraststhat responded according to the model proposed by Ploran et al.:(sensory areas, decision/detection areas, accumulators and motorareas). While successfully identifying different insular regionswith three distinct contrasts, the RFX-GLM shows that ‘‘pure’’
Fig. 3. Ideal activation patterns for the dual-task paradigm concerning the
modules in the decision architecture proposed by Ploran et al. (2007). Different
colors, i.e., different conditions, correspond to faces detected at different time
slots, from movie to movie:brown 0–2 s; dark blue 2–4 s; cyan 4–6 s; magenta
6–8 s; green 8–10 s; gray 10–12 s; red represents unseen faces. Panel A shows the
ideal activation pattern for sensory processors (the same for both tasks) whereas
panel B depicts the ideal activation pattern for accumulator areas. From panel C on
one can understand the value of the dual-task paradigm in separating decision and
motor areas. Patterns in motor and decision areas will be indistinguishable in the
Response Task but motor areas will show activity shifted towards the end of the
trial (button presses) in the color task. On the other hand, pure decision areas will
maintain the pattern of the response task, with the addition of a second peak at
the time of button pressing (due to the fact that color selection also implies a
decision). In the last panel three plots are not shown to prevent figure cluttering
since the missing activations are the same as the depicted conditions.
sensory areas are found only in posterior occipital cortex. Inter-mediate visual areas show a profile sharing both sensory andaccumulator features, as well as frontal areas belonging to thecognitive control network.
Concerning the target areas we could identify an anterioraccumulator insular cluster and a decision/detection middlecluster. Activity in this middle operculo-insular region was
J. Rebola et al. / Neuropsychologia 50 (2012) 3693–3701 3697
specifically related to the decision regardless of whether a motorresponse was provided or not (Fig. 4, contrast c).
Finally, contrast d identified posterior regions of the insular-opercular cortex involved in somatosensory/sensorimotor proces-sing, as well as the cerebellum and the parietal operculum (SII),(Fig. 4, contrast d).
This refinement of the insular cortex organization pointstoward functional segregation: clusters specific to accumulationof evidence, detection signaling mechanisms, and posteriorregions purely involved in the motor response components.
3.2. ICA
3.2.1. Component selection
Components were sorted according to similarity mean alongthe 28 decompositions. All clusters under 10% mean similaritywere discarded and considered non-structured noise. Eight clus-ters survived this criterion from among which 5 maps representstructured noise and 3 maps effectively represent task-relatedBOLD spatial patterns (located in the insula).
In order to relate the component maps to their GLM-definedcounterparts, a simple correlation analysis between the component
Table 2Subject behavioral data.
Face detection
interval
Overall (%) Response
task
(%) Color
task
(%)
0–2 s 217 26.1 79 19.2 138 32.8
2–4 s 156 18.7 81 19.7 75 17.8
4–6 s 178 21.4 102 24.8 76 18.0
6–8 s 116 13.9 59 14.3 57 13.5
8–10 s 67 8.0 35 8.5 32 7.6
10–12 s 27 3.2 12 2.9 15 3.5
Unseen faces 70 8.4 43 10.4 27 6.4
Total 831 100 411 100 420 100
Distribution of face detection times across trials and tasks.
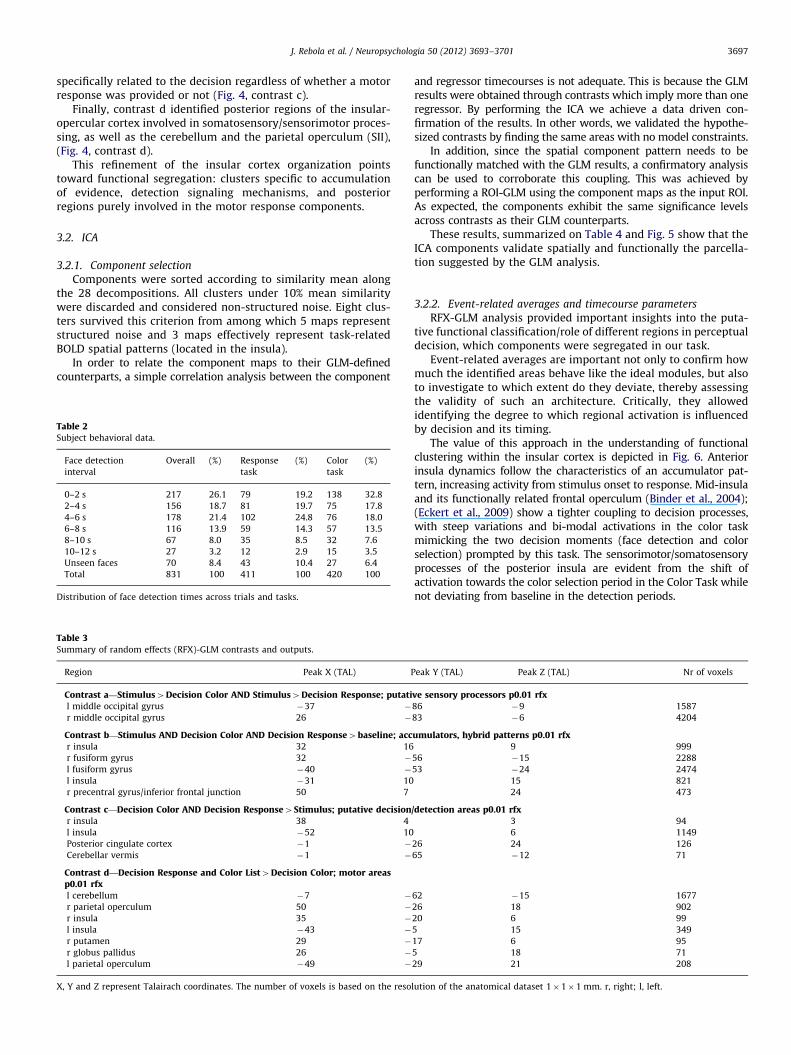
Table 3Summary of random effects (RFX)-GLM contrasts and outputs.
Region Peak X (TAL) P
Contrast a—Stimulus4Decision Color AND Stimulus4Decision Response; putatil middle occipital gyrus �37 �
r middle occipital gyrus 26 �
Contrast b—Stimulus AND Decision Color AND Decision Response4baseline; accr insula 32 16
r fusiform gyrus 32 �
l fusiform gyrus �40 �
l insula �31 10
r precentral gyrus/inferior frontal junction 50 7
Contrast c—Decision Color AND Decision Response4Stimulus; putative decisionr insula 38 4
l insula �52 10
Posterior cingulate cortex �1 �
Cerebellar vermis �1 �
Contrast d—Decision Response and Color List4Decision Color; motor areasp0.01 rfxl cerebellum �7 �
r parietal operculum 50 �
r insula 35 �
l insula �43 �
r putamen 29 �
r globus pallidus 26 �
l parietal operculum �49 �
X, Y and Z represent Talairach coordinates. The number of voxels is based on the reso
and regressor timecourses is not adequate. This is because the GLMresults were obtained through contrasts which imply more than oneregressor. By performing the ICA we achieve a data driven con-firmation of the results. In other words, we validated the hypothe-sized contrasts by finding the same areas with no model constraints.
In addition, since the spatial component pattern needs to befunctionally matched with the GLM results, a confirmatory analysiscan be used to corroborate this coupling. This was achieved byperforming a ROI-GLM using the component maps as the input ROI.As expected, the components exhibit the same significance levelsacross contrasts as their GLM counterparts.
These results, summarized on Table 4 and Fig. 5 show that theICA components validate spatially and functionally the parcella-tion suggested by the GLM analysis.
3.2.2. Event-related averages and timecourse parameters
RFX-GLM analysis provided important insights into the puta-tive functional classification/role of different regions in perceptualdecision, which components were segregated in our task.
Event-related averages are important not only to confirm howmuch the identified areas behave like the ideal modules, but alsoto investigate to which extent do they deviate, thereby assessingthe validity of such an architecture. Critically, they allowedidentifying the degree to which regional activation is influencedby decision and its timing.
The value of this approach in the understanding of functionalclustering within the insular cortex is depicted in Fig. 6. Anteriorinsula dynamics follow the characteristics of an accumulator pat-tern, increasing activity from stimulus onset to response. Mid-insulaand its functionally related frontal operculum (Binder et al., 2004);(Eckert et al., 2009) show a tighter coupling to decision processes,with steep variations and bi-modal activations in the color taskmimicking the two decision moments (face detection and colorselection) prompted by this task. The sensorimotor/somatosensoryprocesses of the posterior insula are evident from the shift ofactivation towards the color selection period in the Color Task whilenot deviating from baseline in the detection periods.
eak Y (TAL) Peak Z (TAL) Nr of voxels
ve sensory processors p0.01 rfx86 �9 1587
83 �6 4204
umulators, hybrid patterns p0.01 rfx9 999
56 �15 2288
53 �24 2474
15 821
24 473
/detection areas p0.01 rfx3 94
6 1149
26 24 126
65 �12 71
62 �15 1677
26 18 902
20 6 99
5 15 349
17 6 95
5 18 71
29 21 208
lution of the anatomical dataset 1�1�1 mm. r, right; l, left.
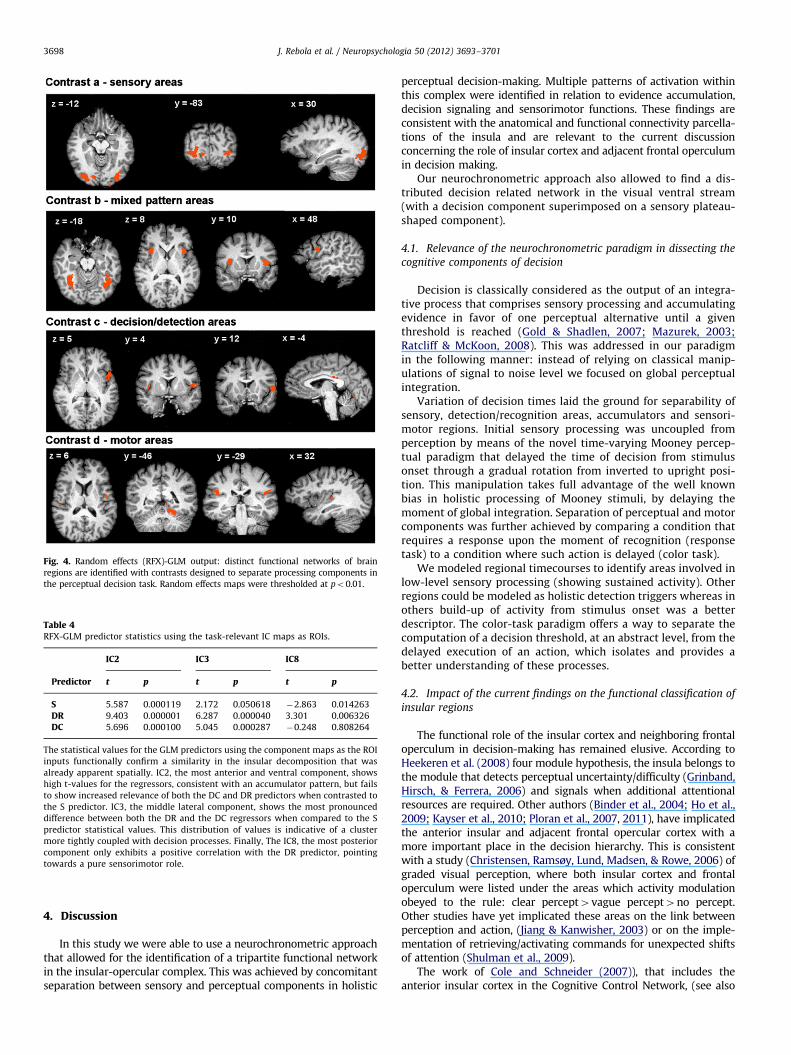
Fig. 4. Random effects (RFX)-GLM output: distinct functional networks of brain
regions are identified with contrasts designed to separate processing components in
the perceptual decision task. Random effects maps were thresholded at po0.01.
Table 4RFX-GLM predictor statistics using the task-relevant IC maps as ROIs.
IC2 IC3 IC8
Predictor t p t p t p
S 5.587 0.000119 2.172 0.050618 �2.863 0.014263
DR 9.403 0.000001 6.287 0.000040 3.301 0.006326
DC 5.696 0.000100 5.045 0.000287 �0.248 0.808264
The statistical values for the GLM predictors using the component maps as the ROI
inputs functionally confirm a similarity in the insular decomposition that was
already apparent spatially. IC2, the most anterior and ventral component, shows
high t-values for the regressors, consistent with an accumulator pattern, but fails
to show increased relevance of both the DC and DR predictors when contrasted to
the S predictor. IC3, the middle lateral component, shows the most pronounced
difference between both the DR and the DC regressors when compared to the S
predictor statistical values. This distribution of values is indicative of a cluster
more tightly coupled with decision processes. Finally, The IC8, the most posterior
component only exhibits a positive correlation with the DR predictor, pointing
towards a pure sensorimotor role.
J. Rebola et al. / Neuropsychologia 50 (2012) 3693–37013698
4. Discussion
In this study we were able to use a neurochronometric approachthat allowed for the identification of a tripartite functional networkin the insular-opercular complex. This was achieved by concomitantseparation between sensory and perceptual components in holistic
perceptual decision-making. Multiple patterns of activation withinthis complex were identified in relation to evidence accumulation,decision signaling and sensorimotor functions. These findings areconsistent with the anatomical and functional connectivity parcella-tions of the insula and are relevant to the current discussionconcerning the role of insular cortex and adjacent frontal operculumin decision making.
Our neurochronometric approach also allowed to find a dis-tributed decision related network in the visual ventral stream(with a decision component superimposed on a sensory plateau-shaped component).
4.1. Relevance of the neurochronometric paradigm in dissecting the
cognitive components of decision
Decision is classically considered as the output of an integra-tive process that comprises sensory processing and accumulatingevidence in favor of one perceptual alternative until a giventhreshold is reached (Gold & Shadlen, 2007; Mazurek, 2003;Ratcliff & McKoon, 2008). This was addressed in our paradigmin the following manner: instead of relying on classical manip-ulations of signal to noise level we focused on global perceptualintegration.
Variation of decision times laid the ground for separability ofsensory, detection/recognition areas, accumulators and sensori-motor regions. Initial sensory processing was uncoupled fromperception by means of the novel time-varying Mooney percep-tual paradigm that delayed the time of decision from stimulusonset through a gradual rotation from inverted to upright posi-tion. This manipulation takes full advantage of the well knownbias in holistic processing of Mooney stimuli, by delaying themoment of global integration. Separation of perceptual and motorcomponents was further achieved by comparing a condition thatrequires a response upon the moment of recognition (responsetask) to a condition where such action is delayed (color task).
We modeled regional timecourses to identify areas involved inlow-level sensory processing (showing sustained activity). Otherregions could be modeled as holistic detection triggers whereas inothers build-up of activity from stimulus onset was a betterdescriptor. The color-task paradigm offers a way to separate thecomputation of a decision threshold, at an abstract level, from thedelayed execution of an action, which isolates and provides abetter understanding of these processes.
4.2. Impact of the current findings on the functional classification of
insular regions
The functional role of the insular cortex and neighboring frontaloperculum in decision-making has remained elusive. According toHeekeren et al. (2008) four module hypothesis, the insula belongs tothe module that detects perceptual uncertainty/difficulty (Grinband,Hirsch, & Ferrera, 2006) and signals when additional attentionalresources are required. Other authors (Binder et al., 2004; Ho et al.,2009; Kayser et al., 2010; Ploran et al., 2007, 2011), have implicatedthe anterior insular and adjacent frontal opercular cortex with amore important place in the decision hierarchy. This is consistentwith a study (Christensen, Ramsøy, Lund, Madsen, & Rowe, 2006) ofgraded visual perception, where both insular cortex and frontaloperculum were listed under the areas which activity modulationobeyed to the rule: clear percept4vague percept4no percept.Other studies have yet implicated these areas on the link betweenperception and action, (Jiang & Kanwisher, 2003) or on the imple-mentation of retrieving/activating commands for unexpected shiftsof attention (Shulman et al., 2009).
The work of Cole and Schneider (2007)), that includes theanterior insular cortex in the Cognitive Control Network, (see also
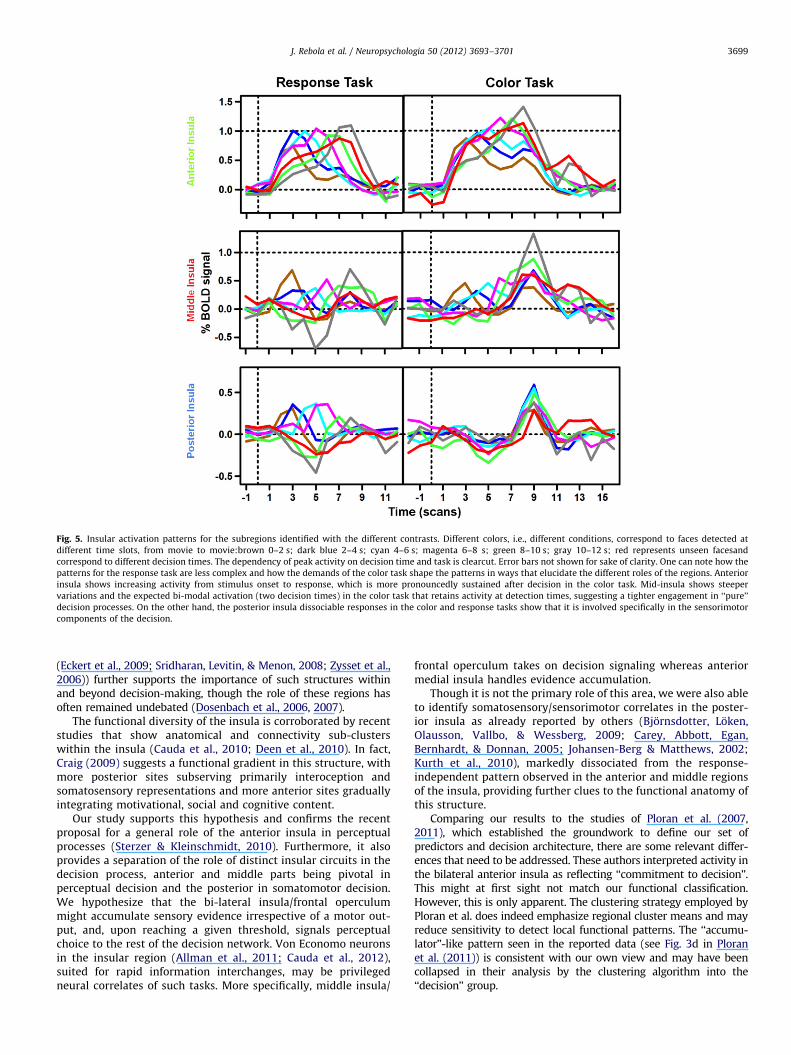
Fig. 5. Insular activation patterns for the subregions identified with the different contrasts. Different colors, i.e., different conditions, correspond to faces detected at
different time slots, from movie to movie:brown 0–2 s; dark blue 2–4 s; cyan 4–6 s; magenta 6–8 s; green 8–10 s; gray 10–12 s; red represents unseen facesand
correspond to different decision times. The dependency of peak activity on decision time and task is clearcut. Error bars not shown for sake of clarity. One can note how the
patterns for the response task are less complex and how the demands of the color task shape the patterns in ways that elucidate the different roles of the regions. Anterior
insula shows increasing activity from stimulus onset to response, which is more pronouncedly sustained after decision in the color task. Mid-insula shows steeper
variations and the expected bi-modal activation (two decision times) in the color task that retains activity at detection times, suggesting a tighter engagement in ‘‘pure’’
decision processes. On the other hand, the posterior insula dissociable responses in the color and response tasks show that it is involved specifically in the sensorimotor
components of the decision.
J. Rebola et al. / Neuropsychologia 50 (2012) 3693–3701 3699
(Eckert et al., 2009; Sridharan, Levitin, & Menon, 2008; Zysset et al.,2006)) further supports the importance of such structures withinand beyond decision-making, though the role of these regions hasoften remained undebated (Dosenbach et al., 2006, 2007).
The functional diversity of the insula is corroborated by recentstudies that show anatomical and connectivity sub-clusterswithin the insula (Cauda et al., 2010; Deen et al., 2010). In fact,Craig (2009) suggests a functional gradient in this structure, withmore posterior sites subserving primarily interoception andsomatosensory representations and more anterior sites graduallyintegrating motivational, social and cognitive content.
Our study supports this hypothesis and confirms the recentproposal for a general role of the anterior insula in perceptualprocesses (Sterzer & Kleinschmidt, 2010). Furthermore, it alsoprovides a separation of the role of distinct insular circuits in thedecision process, anterior and middle parts being pivotal inperceptual decision and the posterior in somatomotor decision.We hypothesize that the bi-lateral insula/frontal operculummight accumulate sensory evidence irrespective of a motor out-put, and, upon reaching a given threshold, signals perceptualchoice to the rest of the decision network. Von Economo neuronsin the insular region (Allman et al., 2011; Cauda et al., 2012),suited for rapid information interchanges, may be privilegedneural correlates of such tasks. More specifically, middle insula/
frontal operculum takes on decision signaling whereas anteriormedial insula handles evidence accumulation.
Though it is not the primary role of this area, we were also ableto identify somatosensory/sensorimotor correlates in the poster-ior insula as already reported by others (Bjornsdotter, Loken,Olausson, Vallbo, & Wessberg, 2009; Carey, Abbott, Egan,Bernhardt, & Donnan, 2005; Johansen-Berg & Matthews, 2002;Kurth et al., 2010), markedly dissociated from the response-independent pattern observed in the anterior and middle regionsof the insula, providing further clues to the functional anatomy ofthis structure.
Comparing our results to the studies of Ploran et al. (2007,2011), which established the groundwork to define our set ofpredictors and decision architecture, there are some relevant differ-ences that need to be addressed. These authors interpreted activity inthe bilateral anterior insula as reflecting ‘‘commitment to decision’’.This might at first sight not match our functional classification.However, this is only apparent. The clustering strategy employed byPloran et al. does indeed emphasize regional cluster means and mayreduce sensitivity to detect local functional patterns. The ‘‘accumu-lator’’-like pattern seen in the reported data (see Fig. 3d in Ploranet al. (2011)) is consistent with our own view and may have beencollapsed in their analysis by the clustering algorithm into the‘‘decision’’ group.

Fig. 6. Anterior-to-posterior insular/opercular parcellation achieved with data-
driven and model-driven methods. Data-driven IC task-relevant maps are taken
from the group clustering after thresholding at z¼1.5. Model-driven results are
taken from the GLM clusters that overlap the insular/opercular cortex. (a) ICA
Decomposition and (b) GLM-RFX.
J. Rebola et al. / Neuropsychologia 50 (2012) 3693–37013700
5. Conclusion
Here we achieved separation of the neural correlates of localsensory (bottom-up) and global gestalt based perceptual decision.We used novel visual recognition/detection tasks with constant signalto noise levels of sensory evidence, enabling the demonstration ofperceptual decision representations along local networks in parti-cular within the insular cortex and adjacent frontal operculum. Theparadigm also permitted the validation of a distributed hierarchicalmodel of holistic perceptual decision based on the modules com-monly accepted on the decision architecture: sensory processors,accumulators and decision/detection regions.
In sum, we have uncovered a pivotal role for bilateral insularcortex/frontal operculum subnetworks in decision making: Acti-vation of anterior and middle insular cortex spans accumulatorand pure decisional processes, respectively, whereas activation ofposterior insular cortex is more related to classical sensorimotor/somatosensory processes.
We believe that the functional approach proposed in this studyprovides a powerful framework to parse the distinct componentsof cognitive processes in general and global gestalt based decisionmaking in particular.
Acknowledgments
We would like to acknowledge the support of BIN (the BrainImaging Network of Portugal). This work was supported by grantsfrom the Foundation for Science and Technology Portugal (PTDC/SAU/NEU/68483/2006, PTDC/PSI/67381/2006, PIC/ IC/ 82986/ 2007and a PhD fellowship to JR) and Bial Foundation Grant 94/06. We
thank Pedro Serranho for his help in statistical approaches and InesViolante for her insightful comments.
Appendix A. Supporting information
Supplementary data associated with this article can be found inthe online version at http://dx.doi.org/10.1016/j.neuropsychologia.2012.06.020.
References
Allison, P. D. (1999). Logistic Regression Using the SAS System: Theory and Applica-tion. New York: SAS Institute Vol. 1, p. 302.
Allman, J. M., Tetreault, N. A., Hakeem, A. Y., Manaye, K. F., Semendeferi, K., Erwin,J. M., et al. (2011). The von Economo neurons in the frontoinsular and anteriorcingulate cortex. Annals of the New York Academy of Sciences, 1225, 59–71.
Binder, J. R., Liebenthal, E., Possing, E. T., Medler, D. A., & Ward, B. D. (2004). Neuralcorrelates of sensory and decision processes in auditory object identification.Nature Neuroscience, 7(3), 295–301 Nature Publishing Group.
Bjornsdotter, M., Loken, L., Olausson, H., Vallbo, A., & Wessberg, J. (2009).Somatotopic organization of gentle touch processing in the posterior insularcortex. Journal of Neuroscience, 29(29), 9314–9320.
Calhoun, V. D., Liu, J., & Adali, T. (2009). A review of group ICA for fMRI data andICA for joint inference of imaging, genetic, and ERP data. NeuroImage, 45(1Suppl), S163–S172 Elsevier Inc.
Carey, L. M., Abbott, D. F., Egan, G. F., Bernhardt, J., & Donnan, G. A. (2005). Motorimpairment and recovery in the upper limb after stroke: behavioral andneuroanatomical correlates. Stroke A Journal of Cerebral Circulation, 36(3),625–629.
Cauda, F., D’Agata, F., Sacco, K., Duca, S., Geminiani, G., & Vercelli, A. (2010).Functional connectivity of the insula in the resting brain. NeuroImage ElsevierInc
Cauda, F., D’Agata, F., Sacco, K., Duca, S., Geminiani, G., & Vercelli, A. (2011).Functional connectivity of the insula in the resting brain. NeuroImage, 55(1),8–23 Elsevier Inc.
Cauda, F., Torta, D. M. E., Sacco, K., D’Agata, F., Geda, E., Duca, S., et al. (2012).Functional anatomy of cortical areas characterized by Von Economo neuronsBrainStructure and Function
Cerliani, L., Thomas, R. M., Jbabdi, S., Siero, J. C. W., Nanetti, L., Crippa, A., et al.(2011). Probabilistic tractography recovers a rostrocaudal trajectory of con-nectivity variability in the human insular cortex. Human Brain Mapping, 000.
Christensen, M. S., Ramsøy, T. Z., Lund, T. E., Madsen, K. H., & Rowe, J. B. (2006). AnfMRI study of the neural correlates of graded visual perception. NeuroImage,31(4), 1711–1725.
Cole, M. W., & Schneider, W. (2007). The cognitive control network: integratedcortical regions with dissociable functions. NeuroImage, 37(1), 343–360.
Deen, B., Pitskel, N. B., & Pelphrey, K. a. (2010). Three systems of insular functionalconnectivity identified with cluster analysis. Cerebral cortex (New York, N.Y.: 1991).
Craig, a D. B. (2009). How do you feel—now? The anterior insula and humanawareness. Nature Reviews Neuroscience, 10(1), 59–70.
Dosenbach, N. U. F., Fair, D. a, Miezin, F. M., Cohen, A. L., Wenger, K. K., Dosenbach,R. a T., et al. (2007). Distinct brain networks for adaptive and stable taskcontrol in humans. Proceedings of the National Academy of Sciences of the UnitedStates of America, 104(26), 11073–11078.
Dosenbach, N. U. F., Visscher, K. M., Palmer, E. D., Miezin, F. M., Wenger, K. K., Kang,H. C., et al. (2006). A core system for the implementation of task sets. Neuron,50(5), 799–812.
Eckert, M. A., Menon, V., Walczak, A., Ahlstrom, J., Denslow, S., Horwitz, A., et al.(2009). At the heart of the ventral attention system: the right anterior insula.Human Brain Mapping, 30(8), 2530–2541.
Esposito, F., Scarabino, T., Hyvarinen, A., Himberg, J., Formisano, E., Comani, S.,et al. (2005). Independent component analysis of fMRI group studies by self-organizing clustering. NeuroImage, 25(1), 193–205.
Gold, J. I., & Shadlen, M. N. (2007). The neural basis of decision making. AnnualReview of Neuroscience, 30, 535–574.
Grinband, J., Hirsch, J., & Ferrera, V. P. (2006). A neural representation ofcategorization uncertainty in the human brain. Neuron, 49(5), 757–763.
Heekeren, H. R., Marrett, S., & Ungerleider, L. G. (2008). The neural systems thatmediate human perceptual decision making. Nature Reviews Neuroscience, 9(6),467–479.
Ho, T. C., Brown, S., & Serences, J. T. (2009). Domain general mechanisms ofperceptual decision making in human cortex. The Journal of Neuroscience: TheOfficial Journal of the Society for Neuroscience, 29(27), 8675–8687.
Jiang, Y., & Kanwisher, N. (2003). Common neural substrates for response selectionacross modalities and mapping paradigms. Journal of Cognitive Neuroscience,15(8), 1080–1094.
Johansen-Berg, H., & Matthews, P. M. (2002). Attention to movement modulatesactivity in sensori-motor areas, including primary motor cortex. ExperimentalBrain Research: Experimentelle Hirnforschung. Experimentation Cerebrale, 142(1),13–24.

J. Rebola et al. / Neuropsychologia 50 (2012) 3693–3701 3701
Kayser, A. S., Buchsbaum, B. R., Erickson, D. T., & D’Esposito, M. (2010). Thefunctional anatomy of a perceptual decision in the human brain. Journal of
Neurophysiology, 103(3), 1179–1194.Kurth, F., Eickhoff, S. B., Schleicher, A., Hoemke, L., Zilles, K., & Amunts, K. (2010).
Cytoarchitecture and probabilistic maps of the human posterior insular cortex.Cerebral Cortex, 20(6), 1448–1461.
Mazurek, M. E. (2003). A role for neural integrators in perceptual decision making.Cerebral Cortex, 13(11), 1257–1269.
McKeown, M. J., Makeig, S., Brown, G. G., Jung, T. P., Kindermann, S. S., Bell, a J.,et al. (1998). Analysis of fMRI data by blind separation into independentspatial components. Human Brain Mapping, 6(3), 160–188.
Menard, S. (1995). Applied logistic regression analysis. in: M. S. Lewis-Beck (Ed.),Online, 106 (p. 111). Sage Publications.
Mooney, C. M. (1957). Age in the development of closure ability in children.Canadian Journal of Psychology, 11(4), 219–226.
Myers, R. H. (1990). Classical and modern regression with applications. (N. Ed, Ed.) The
Duxbury Advanced Series in Statistics and Decision Sciences, 2nd, 488 Duxbury.Platt, M. L. (2002). Neural correlates of decisions. Current Opinion in Neurobiology,
12(2), 141–148.Ploran, E. J., Nelson, S. M., Velanova, K., Donaldson, D. I., Petersen, S. E., & Wheeler,
M. E. (2007). Evidence accumulation and the moment of recognition:dissociating perceptual recognition processes using fMRI. The Journal of
Neuroscience: The Official Journal of the Society for Neuroscience, 27(44),11912–11924.
Ploran, E. J., Tremel, J. J., Nelson, S. M., & Wheeler, M. E. (2011). High quality butlimited quantity perceptual evidence produces neural accumulation in frontaland parietal cortex. Cerebral Cortex, 21(November), 2650–2662.
Ratcliff, R., & McKoon, G. (2008). The diffusion decision model: theory and data fortwo-choice decision tasks. Neural Computation, 20(4), 873–922 MIT Press.
Salinas, E. (2008). So many choices: what computational models reveal aboutdecision-making mechanisms. Neuron, 60(6), 946–949.
Schall, J. D. (2001). Neural basis of deciding, choosing and acting. Nature ReviewsNeuroscience, 2(1), 33–42.
Shulman, G. L., Astafiev, S. V., Franke, D., Pope, D. L. W., Snyder, A. Z., McAvoy, M. P.,et al. (2009). Interaction of stimulus-driven reorienting and expectation inventral and dorsal frontoparietal and basal ganglia-cortical networks. TheJournal of Neuroscience: The Official Journal of the Society for Neuroscience,29(14), 4392–4407.
Sigman, M., & Dehaene, S. (2005). Parsing a cognitive task: a characterization ofthe mind’s bottleneck. PLoS Biology, 3(2), e37.
Sridharan, D., Levitin, D. J., & Menon, V. (2008). A critical role for the right fronto-insular cortex in switching between central-executive and default-modenetworks. Proceedings of the National Academy of Sciences of the United Statesof America, 105(34), 12569–12574.
Sterzer, P., & Kleinschmidt, A. (2010). Anterior insula activations in perceptualparadigms: often observed but barely understood. Brain Structure & Function,214(5-6), 611–622.
Thielscher, A., & Pessoa, L. (2007). Neural correlates of perceptual choice anddecision making during fear-disgust discrimination. The Journal of Neu-roscience: The Official Journal of the Society for Neuroscience, 27(11), 2908–2917.
Wang, X.-J. (2008). Decision making in recurrent neuronal circuits. Neuron, 60(2),215–234 Elsevier Inc.
Zysset, S., Wendt, C. S., Volz, K. G., Neumann, J., Huber, O., & von Cramon, D. Y.(2006). The neural implementation of multi-attribute decision making: aparametric fMRI study with human subjects. NeuroImage, 31(3), 1380–1388.