Visitor Use/Non-Use Parks Study
68
2015-2016 Visitor Use/Non-Use Parks Study Visitor Use/Non-Use Parks Study SAN MATEO COUNTY PARKS DEPARTMENT 2015-2016 Nina S. Roberts, PhD, Professor & Principal Investigator Ruby N. Turalba, MPH, Lecturer & Research Associate Patrick Tierney, PhD, Professor & Research Associate Ryan Tachibana, Research Assistant Lindsey Marsh, Research Assistant
-
Upload
khangminh22 -
Category
Documents
-
view
1 -
download
0
Transcript of Visitor Use/Non-Use Parks Study

2015-2016
Visitor Use/Non-Use Parks StudyVisitor Use/Non-Use Parks Study
SAN MATEO COUNTY PARKS DEPARTMENT 2015-2016
Nina S. Roberts, PhD, Professor & Principal InvestigatorRuby N. Turalba, MPH, Lecturer & Research AssociatePatrick Tierney, PhD, Professor & Research AssociateRyan Tachibana, Research AssistantLindsey Marsh, Research Assistant

Mirada SurfCounty Park
James V. FitzgeraldMarine Reserve
WunderlichCounty Park
HuddartCounty Park
San Pedro Valley County Park
Junipero Serra County Park Coyote Point
Recreation Area
MemorialCounty Park
Sam McDonald County Park
San Bruno Mountain State and County Park
Pescadero Creek County
Park
Quarry Park
Pigeon Point Overlook
Sanchez AdobeHistoric Site
Devil’s Slide Trail
Pillar Point Blu�
Moss Beach Park
Edgewood County Parkand Natural Preserve
FloodCountyPark
Regional Trail
Crystal Springs
Woodside StoreHistoric Site
FriendshipPark
Coyote Point Marina
San Mateo CountySan Francisco
PA
CI F
I C
OC
EA
N
S AN
F
RA
NC
I S CO
B
AY
1
84
84
1
1
9
1
84
1
84
1
280
280
880
580
280
380
35
35
92
35
92
35
35
101
101
)
)
El GranadaMiramar
12/10/14 v4
Princeton by the Sea
Pacifica
Daly CityBrisbane
Half Moon Bay
San Bruno
San Mateo
Redwood City
Woodside
Menlo Park
Moss Beach
Montara
San Gregorio
Loma Mar
Pescadero
San Mateo CountySanta Cruz County
Santa
County
ClaraSan Mateo County ParksOther parks, open space preserves, watersheds,and wildlife refugesCounty Regional TrailCounty Parks DepartmentHeadquarters
0 1 2
0 1 2 5 miles3 4
3 4 5 kilometers

3Visitor Use/Non-Use Parks Study 2015-2016
Executive SummaryOutdoor recreation plays a vast and inevitable role in our lives across California and the nation. Consequently, research informs the management and delivery of parks and recreation opportunities across both public and private sectors. Although park visitor use research has occurred for many decades, comprehensive studies assessing the attitudes, experiences, use patterns and preferences of San Mateo County residents is limited.
A visitor use study was conducted to help San Mateo County Parks Department better understand its visitors and the needs of the county’s changing demographics. This study utilized both qualitative and quantitative methods including focus groups, on-site visitor intercept surveys, and follow-up surveys. Data collected from this study has the potential to improve park services and guide future decision making and planning. By deepening our knowledge and understanding of current park users as well as the barriers/constraints experienced by under-represented groups, San Mateo County Parks holds the power to expand recreational services that meet the needs of its residents, thereby improving community health, wellness, overall quality of life.
HOW DATA WAS GATHEREDTo learn more about park users’ attitudes and experiences, a total of four focus groups were held between October and November
2015 in Daly City, East Palo Alto, Pescadero, and North Fair Oaks. These key areas were characterized as predominantly culturally diverse and inclusive of mostly underserved populations. Qualitative data from these in-depth interviews revealed valuable information about park users’ experiences, interactions and perceptions of park staff, barriers and constraints, methods of obtaining information about the parks, and recommendations.
The study also included quantitative data from visitors exiting parks and visitor counts at San Mateo County Park sites. An estimated 15,580 visitors were counted at 20 study sites from April to June 2016. A total of 2,414 intercept surveys were completed during a six-week period at varying times of day and days of the week. As a follow-up, 264 people voluntarily completed an online survey via link provided to SurveyGizmo. Exit surveys were administered throughout the following districts/parks:
COASTAL MID-COUNTY SOUTH COUNTY NORTH COUNTY
Devil’s Slide Regional Trail Edgewood Park & Natural Preserve Memorial Park Coyote Point Marina
Fitzgerald Marine Reserve Flood Park Pescadero Creek Park Coyote Point Recreation Area
Mirada Surf Friendship Park Sam McDonald Park Crystal Springs Regional Trail
Moss Beach Park Huddart Park Junipero Serra Park
Pillar Point Bluff Wunderlich Park San Bruno Mountain State & County Park
Quarry Park
San Pedro Valley Park
Mirada SurfCounty Park
James V. FitzgeraldMarine Reserve
WunderlichCounty Park
HuddartCounty Park
San Pedro Valley County Park
Junipero Serra County Park Coyote Point
Recreation Area
MemorialCounty Park
Sam McDonald County Park
San Bruno Mountain State and County Park
Pescadero Creek County
Park
Quarry Park
Pigeon Point Overlook
Sanchez AdobeHistoric Site
Devil’s Slide Trail
Pillar Point Blu�
Moss Beach Park
Edgewood County Parkand Natural Preserve
FloodCountyPark
Regional Trail
Crystal Springs
Woodside StoreHistoric Site
FriendshipPark
Coyote Point Marina
San Mateo CountySan Francisco
PA
CI F
I C
OC
EA
N
S AN
F
RA
NC
I S CO
B
AY
1
84
84
1
1
9
1
84
1
84
1
280
280
880
580
280
380
35
35
92
35
92
35
35
101
101
)
)
El GranadaMiramar
12/10/14 v4
Princeton by the Sea
Pacifica
Daly CityBrisbane
Half Moon Bay
San Bruno
San Mateo
Redwood City
Woodside
Menlo Park
Moss Beach
Montara
San Gregorio
Loma Mar
Pescadero
San Mateo CountySanta Cruz County
Santa
County
ClaraSan Mateo County ParksOther parks, open space preserves, watersheds,and wildlife refugesCounty Regional TrailCounty Parks DepartmentHeadquarters
0 1 2
0 1 2 5 miles3 4
3 4 5 kilometers

4 Visitor Use/Non-Use Parks Study 2015-2016
WHAT WAS LEARNEDFrom the intercept survey data, visitor demographics and characteristics show that:
½ The average age of park visitors was 50 years old, with almost two-thirds between 35-64 years.
½ There were slightly more males than females.
½ Over three quarters had a Bachelor’s degree or higher level of formal education.
½ Income reported in 2015 varied greatly among respondents with nearly 40% reporting an annual income over $125,000, and 11% indicating less than $50,000.
½ Three quarters were white, and nearly 12% self-identified as Hispanic or Latino.
½ English is the primary language spoken. However, for those who speak another language at home, almost 40% reported Spanish followed by Mandarin/Cantonese.
½ About 3% of respondents had a person with a disability in their visitor group.
½ Over a third of all visitors were traveling alone, while slighty under two-thirds were with family and/or friends.
½ About two-thirds were San Mateo County residents and, of these, over one-third (37%) lived within one-mile of the park site where they were surveyed.
½ 10% were from outside California.
½ One out of four were first time visitors, while almost a third reported visiting that particular park almost 50 times in the last year!
In addition, visitors shared that they generally have positive experiences in San Mateo County parks and with park staff:
½ Almost all respondents (80%) agreed the quality of their overall park experience that day was “very good.” (Note: 98.7% = “very good” and “good” combined).
½ Nine out of ten park users were “satisfied” or “very satisfied” with their interactions with other visitors. Conflicts with bikes on trails and dogs off leash were reasons for being “dissatisfied” or “very dissatisfied.”
½ Over 95% indicated they felt “safe” or “very safe.” Dogs, wild animals, not feeling welcome, bikes on trails, or too few people around were the most frequent reasons for feeling “unsafe” or “very unsafe.”
½ 55% liked the park facilities just as they are, while 45% wanted to see future improvements.
½ Over 60% were satisfied with the availability of park staff and of these, 75% were pleased with their interactions with park staff.
The most popular activities identified included:
½ Land-based activities such as walking, hiking, running, jogging, biking, picnicking, and walking dogs.
½ Water-based activities such as relaxing on the beach, tide pooling, swimming/wading, sunbathing, and other beach activities.
½ Nature-based activities including relaxing outdoors, enjoying views, being with family/friends, nature walks, and exploring the outdoors.
Non-visitors were more likely to be Asian, Hispanic/Latino, Black, and speak a language other than English at home; have a lower household income; and have lower formal education levels.
To learn more about the needs of these specific groups, facilitated in-depth interviews were conducted.
Barriers and constraints identified during the focus groups revealed that:
½ Traditionally under-represented communities have limited awareness of park events and regulations, and may not know how to obtain information about the county’s parks.
½ Public transportation and parking and/or limited information about options make it difficult to enjoy the benefits of parks, especially since 19% of focus group participants reported they do not own a vehicle.
½ Language barriers impact Spanish speaking park users’ experiences with park staff, causing negative experiences and misunderstandings, and prevent visitors from comprehending rules, regulations, and other important information.
AREAS WHERE SMC PARKS DEPARTMENT CAN IMPROVETo address the present and future needs and desires of park visitors, we propose eight areas of action and change to improve the park facilities and recreational services throughout San Mateo County.
1. Implementing Community-based Strategies for Communication & Information Dissemination
While many people use county parks for various activities, awareness of county park rules and programs is extremely low. It can be assumed that the San Mateo County Parks website is not a well-known or used source of information, particularly for under-represented communities in the county. Recommendation: San Mateo County Parks partner with local communities to identify best practices for outreach, programming, and engagement.
2. Advancing Park Signage
Informational signage is a powerful resource for educating park visitors and helps connect visitors to their surroundings. Park users acknowledge the importance of informational signage and interpretive signs, and believe they enhance the visitor’s experience. Recommendation: Assess all park signs, maps, and trail markers for upgrades, relevance, and the need for multiple languages.

5Visitor Use/Non-Use Parks Study 2015-2016
3. Promoting Public Transportation & Bicycling
Research over several decades continues to show a variety of constraints to park visitation, specifically related to limited parking and availability or knowledge of public transportation options. Recommendation: Collaborate with local municipal transportation agencies, develop a county parks map to include public transportation options and routes, and provide incentives to encourage cycling and using mass transit.
4. Addressing Language Barriers
Language barriers pose one of the biggest factors inhibiting communication between San Mateo County Parks and park users. In communities whose primary language is not English, sources of park information expressed in English such as signage, brochures, and even conversations with park staff, are ineffective at educating park users about rules, regulations, and safety hazards as well as hinders learning about park programs, events, and activities. Recommendation: Hire bilingual staff to serve specific districts, incorporate cultural competency trainings to more genuinely connect with under-represented communities, and translate informational literature and signage into multiple languages—especially Spanish.
5. Increasing Park Presence & Within Communities
The presence of park rangers and other staff promotes feelings of safety and provides opportunities for learning and engagement. At the same time, study participants shared that they experience no or limited community outreach from park staff. Recommendation: San Mateo County Parks staff increase their physical presence in the parks and at community centers to share knowledge and provide information about the county’s parks, to enforce rules and regulations, and to assure safety and resolve user conflicts.
6. Expanding Programs, Activities & Services
Everyone has their personal preferences for what activities and programs they desire for themselves, friends, and family. Program ideas generated from this study include more ranger-led nature walks and talks, self-guided tours, outdoor evening activities, environmental education, children’s programs, history tours, cultural events, volunteer days, and programs provided directly in the community at various neighborhood centers. Services included additional kiosks and the use of digital media in the form of park apps, signage, and downloadable files. Recommendation: Review and evaluate all current program offerings and services, and implement revisions or additions as needed.
7. Improving and Enhancing Park Facilities & Infrastructure
Suggestions to improve and enhance park facilities and infrastructure vary across the system. Most commonly reported included maintenance and improvements of restrooms, trails, signage, picnic areas, and drinking fountains. Innovative ideas to enhance users’ park experience included having healthy cafes available, incorporating
community gardens, and creating dog-friendly areas within the county’s parks. Recommendation: Create guidelines and policies to assess existing facilities and infrastructure for maintenance and improvements, and to gather additional data on the needs, desires, and resources to build additional park facilities.
8. Evaluating Current Fees & Revenue
An important component of the San Mateo County Parks strategic planning revolves around a comprehensive review of current fee structures, capital improvement needs, and ways to generate revenue overall. Community input from this study regarding fees and revenue included slightly higher fees for camping, the annual park pass, and entrance fees on weekends, holidays, and at busier sites; military discounts; and working with Friends Groups to seek donations through crowdfunding. Recommendation: Implement a systematic review of current fees and revenue, and identify priority areas for capital improvements.
The findings and recommendations outlined above can support park management and programmatic decisions. With a clear vision, fiscal support, collaborative community partnerships, and solid leadership, San Mateo County Parks has the potential to harness the results and implement the recommendations presented in this report to arrive at potential solutions that can be both sustainable and equitable. Improving our county’s parks and recreational services is key to fostering healthy, thriving, and active communities!
6 Visitor Use/Non-Use Parks Study 2015-2016
Executive Summary ���������������������������������������������������������������������������������������������������������������������������������������������� 3
Introduction & Project Goals ������������������������������������������������������������������������������������������������������������������������������� 9
SMPC 5-year Strategic Plan & Review of Literature ����������������������������������������������������������������������������������������� 13
Methods, Limitations, and Challenges ������������������������������������������������������������������������������������������������������������� 14
Phase I: Focus Groups ����������������������������������������������������������������������������������������������������������������������������������������� 15
Phase II: Intercept & Follow-up Surveys ����������������������������������������������������������������������������������������������������������� 18
Results & Findings
Focus Groups: Phase I ........................................................................................................................................................................ 21
Intercept & Follow-up Survey: Phase II ........................................................................................................................................ 30
Recommendations���������������������������������������������������������������������������������������������������������������������������������������������� 41
Discussion & Conclusions����������������������������������������������������������������������������������������������������������������������������������� 44
APPENDICES Appendix A: SMC Department of Parks – Agency Priorities ....................................................................................................... 46
Appendix B: Visitor Use/Non-Use Study Information Sheet ....................................................................................................... 47
Appendix C: Sample Focus Group Recruitment Flier .................................................................................................................... 48
Appendix D: Focus Group Protocol & Interview Questions ........................................................................................................ 49
Appendix E: Focus Group Participant Demographics ................................................................................................................... 53
Appendix F: 2016 SMC Intercept Survey............................................................................................................................................ 54
Appendix G: 2016 SMC Follow-up Survey ......................................................................................................................................... 61
TABLE OF CONTENTS

7Visitor Use/Non-Use Parks Study 2015-2016
LIST OF TABLESTable 1: San Mateo County – Sample Demographics ........................................................................................................................................10
Table 2: Focus Group Details .......................................................................................................................................................................................16
Table 3: List of Parks, Reserves/Preserves, and Trails Included in Study ......................................................................................................19
Table 4: Open Space for Self-Reflection and Awareness ...................................................................................................................................23
Table 5: Use of Parks/Open Space for Emotional Health & Stress Reduction ............................................................................................23
Table 6: Natural, Outdoor Spaces to Strengthen Spiritual Connections .....................................................................................................24
Table 7: Rangers Indicated as Knowledgeable and Informative ....................................................................................................................24
Table 8: Rangers/Staff Exude Feelings of Safety ...................................................................................................................................................24
Table 9: Ranger/Staff Presence Desired for Enforcing Rules & Resolving Conflicts .................................................................................24
Table 10: Transportation and/or Parking as Primary Barrier ............................................................................................................................25
Table 11: Entrance/Parking Fees Not Barrier for Majority .................................................................................................................................25
Table 12: Language Barriers, a Common Constraint ..........................................................................................................................................26
Table 13: Four Key Engagement Outlets and Sample Suggestions ..............................................................................................................26
Table 14: Social Media as Platform for Outreach/Communication ...............................................................................................................27
Table 15: Multiple Languages and Cultural Competence for Rangers .........................................................................................................27
Table 16: Youth Engagement in Parks and Nature ..............................................................................................................................................28
Table 17: Host Diverse Community-Based Cultural Events ..............................................................................................................................28
Table 18: Increase Awareness of Volunteer and Stewardship Programs .....................................................................................................28
Table 19: How Tax Dollar Revenues Can Improve Parks ................................................................................................................................... 28
Table 20: Revenue Generation through Community Engagement ............................................................................................................. 29
Table 21: Surveys Completed, Related % and Visitor Counts by Park Site ................................................................................................. 30
Table 22: Visitor Counts and Average by Survey Site during 3-Hour Survey Period ...............................................................................31
Table 23: Average Visitor Counts for All Sites, by Weekend and Weekday. ................................................................................................ 31
Table 24: Type of Personal Group ..............................................................................................................................................................................32
Table 25: Visitors with Commercial or Other Organized Group ......................................................................................................................32
Table 26: Sources of Information Obtained About Park/Preserve/Trail ...................................................................................................... 33
Table 27: Participation in Land-Based Activities ..................................................................................................................................................34
Table 28: Participation in Water-Based Activties ..................................................................................................................................................34
Table 29: Participation in Nature-Based Activities ...............................................................................................................................................34
Table 30: Level of Satisfaction with Interactions with Other Visitors ............................................................................................................35
Table 31: Level of Feeling Safe in the Park ..............................................................................................................................................................35
Table 32: Impact of Potential Daily Park Pass Price Increase on Visitation ..................................................................................................36
Table 33: Impact of Potential Annual Park Pass Price Increases on Visitation ...........................................................................................36
Table 34: Likelihood of Purchasing Premium Park Pass at Costs above the Regular Annual Parks Pass ..........................................37
Table 35: Impact of Potential Camping Fee Price Increases on Camping Levels ......................................................................................38
Table 36: Who Should Pay for Each of the Services .............................................................................................................................................38
Table 37: Support for Charging Higher Fees in Certain Situations for Maintaining Services at Current Level ..............................39
Table 38: Suggested Facility Improvements ..........................................................................................................................................................39

8 Visitor Use/Non-Use Parks Study 2015-2016
LIST OF FIGURES Figure 1: SMC Educational Attainment....................................................................................................................................................................11
Figure 2: SMC Unemployment Rate Over 22 Years ..............................................................................................................................................12
Figure 3: SMC Population Projections ......................................................................................................................................................................12
Figure 4: Language Spoken at Home .......................................................................................................................................................................12
Figure 5: Map of San Mateo County Park Sites .................................................................................................................................................... 20
Figure 6: Race/Ethnicity of Focus Group Participants ........................................................................................................................................21
Figure 7: Age of Focus Group Participants .............................................................................................................................................................22
Figure 8: Park Activity Themes ....................................................................................................................................................................................22
Figure 9: Types of Physical Activities ....................................................................................................................................................................... 22
Figure 10: Types of Social Gatherings ......................................................................................................................................................................22
Figure 11: Types of Hobbies .........................................................................................................................................................................................23
Figure 12: Type of Transportation Used to Arrive at Park Site .........................................................................................................................33
Figure 13: Top Ten Primary Reasons for Visiting, All Parks, Reserves or Trails ........................................................................................... 34
Figure 14: For Entrance Fees Paid, Value Received ..............................................................................................................................................35
Figure 15: Respondent Evaluation of Value for Camping Fees .......................................................................................................................35
Figure 16: Respondents Who Think a Potential Premium Park Pass is a Good Idea ................................................................................37
Figure 17: Programs of Interest in the Future ........................................................................................................................................................39
Figure 18: Services You Would Like in the Future ...............................................................................................................................................40

9Visitor Use/Non-Use Parks Study 2015-2016
The first phase of this study consisted of four focus groups hosted in priority districts of the county identified by SMCP. The second phase consisted of an on-site visitor intercept survey at 20 of the 22 parks, open spaces, preserves/reserves, marinas, and trails, pathways managed by SMCP (all surveyed except Sanchez Adobe Historic Site and Pigeon Point Overlook). A follow-up survey was then conducted by visitors willing to provide an email address for additional questions. While this project was multifaceted, the overall purpose of the study was to assess visitor satisfaction, motivation, and future demands, and provide new data for decision making. The study also aimed to offer recommendations for park programs, facilities, policies, and innovative ways to enhance community engagement and access. The County of San Mateo, Department of Parks has a growing interest to understand both park users (e.g., patterns, preferences, desires) and non-users/less frequent visitors (constraints and barriers). The mission of SMC Parks is: “To provide recreational opportunities in a safe and effective manner, and to protect and enhance the natural resources of the County.” As noted in the current strategic plan, the top four community priorities include:
1. Recreation Opportunities2. Environmental Protection Programs3. Interpretive and Education Programs4. Volunteer Programs and Community Engagement. According to the County Performance Measures, the percent of customer survey respondents rating park services as “good” or “better,” between FY2011 and FY2015 were between 84%-91% (source: https://performance�smcgov�org/reports/CountyParks-3900B). SMC park staff would like to learn what actions could be taken to facilitate greater customer satisfaction with park services. As noted in the upcoming years’ agency priorities (see Appendix A), there are ten core measures that SMC parks seeks to achieve. This study has the potential for results to contribute towards attaining several of the human dimensions’ aspects of those desired priorities.
Introduction and Project Goals“Through stewardship, San Mateo County Parks preserves our County’s natural and cultural treasures, and provides safe, accessible parks, recreation and learning opportunities to enhance the community’s quality of life.”
OVERVIEWSan Mateo County Parks Department (SMCP), in partnership with San Francisco State University (SFSU), pursued a two-phase study utilizing both qualitative and quantitative methods to better understand the park-related needs of San Mateo County’s changing demographics.
GOALS
½ To provide new information and recommendations for park use and community engagement that are aligned with the current 2013-2018 five-year strategic plan (http://parks�smcgov�org/documents/parks-strategic-plan-2013).
½ To understand visitor desires and preferences regarding park facilities and resources that meet the needs of changing populations.
½ To serve as the “bridge” to breaking down barriers that have prevented underserved communities from visiting County parks.
STUDY OBJECTIVES
½ Examine selected demographics of residents of San Mateo County and compare to park users (including their origin), and non-users; explore park use projections. Determine visitor viewpoints/attitudes about the parks regarding what they think about them and how they “connect” (e.g., sense of place, meaning).
½ Obtain information from park visitors regarding what facilities, programs/activities, or other related resources would enhance the quality of their visit, including what they would be willing to pay for these facilities and services.
½ Understand how people best obtain their information about parks (e.g., communication channels, media, messaging).
½ Learn how best to expand social media and interactive media presence in the community.
½ Seek new insight into ways to enhance programs with partners focused on youth, health, and environmental literacy.
½ Identify barriers of non-users (e.g., why not visit at all or more often); determine if there are any constraints for the population studied in SMC that differs from what is already known in an extensive body of state and national literature.
10 Visitor Use/Non-Use Parks Study 2015-2016
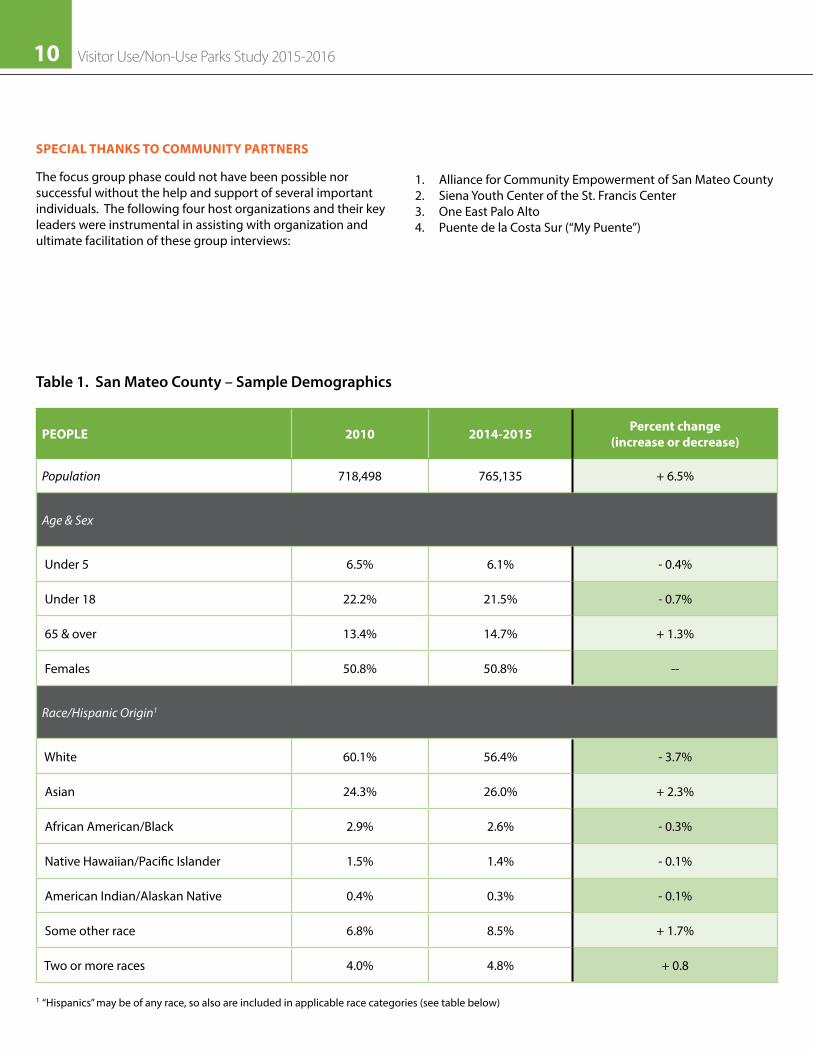
Table 1. San Mateo County – Sample Demographics
PEOPLE 2010 2014-2015 Percent change (increase or decrease)
Population 718,498 765,135 + 6.5%
Age & Sex
Under 5 6.5% 6.1% - 0.4%
Under 18 22.2% 21.5% - 0.7%
65 & over 13.4% 14.7% + 1.3%
Females 50.8% 50.8% --
Race/Hispanic Origin1
White 60.1% 56.4% - 3.7%
Asian 24.3% 26.0% + 2.3%
African American/Black 2.9% 2.6% - 0.3%
Native Hawaiian/Pacific Islander 1.5% 1.4% - 0.1%
American Indian/Alaskan Native 0.4% 0.3% - 0.1%
Some other race 6.8% 8.5% + 1.7%
Two or more races 4.0% 4.8% + 0.8
1 “Hispanics” may be of any race, so also are included in applicable race categories (see table below)
SPECIAL THANKS TO COMMUNITY PARTNERS
The focus group phase could not have been possible nor successful without the help and support of several important individuals. The following four host organizations and their key leaders were instrumental in assisting with organization and ultimate facilitation of these group interviews:
1. Alliance for Community Empowerment of San Mateo County2. Siena Youth Center of the St. Francis Center3. One East Palo Alto4. Puente de la Costa Sur (“My Puente”)

11Visitor Use/Non-Use Parks Study 2015-2016
(Source: TownCharts.com, http://bit�ly/1X9knKc)
Bachelor‘sDegree or higher
Some college orAssociatesDegree
High School orG E D
Less than HighSchool
No schooling
45%
9.8%
16.8%
26.7%
Bachelor‘s degree
Master‘s degree
Associate degree
Professionalschool degree
Doctorate degree
7%
14.3%
21.7%
51.4%
Bachelor‘sDegree or higher
Some college orAssociatesDegree
High School orG E D
Less than HighSchool
No schooling
45%
9.8%
16.8%
26.7%
Bachelor‘s degree
Master‘s degree
Associate degree
Professionalschool degree
Doctorate degree
7%
14.3%
21.7%
51.4%
San Mateo County, Education Attainment (2015)Figure 1. SMC Educational Attainment
SMC Higher Education Attainment (2015)
HISPANIC/LATINO (SMC) 2010 Percent 2014 Percent Percent Change
Total population 704,327 100% 739,837 100%
Hispanic or Latino (any race) 172,151 24.4% 187,635 25.4% + 1.0%
Mexican 112,535 16.0% 120,655 16.3% + 0.3%
Puerto Rican 4,025 0.6% 4,244 0.6% --
Cuban 1,297 0.2% 1,498 0.2% --
Other Hispanic or Latino2 54,294 7.7% 61,238 8.3% + 0.6
Not Hispanic or Latino 535,949 74.6 552,202 74.6% -- 2 This category is comprised of people whose origins are from the Dominican Republic, Spain, and Spanish-speaking Central or South American countries. It also includes general origin responses such as “Latino” or “Hispanic.”
ASIAN (SMC) 2010 Percent 2014 Percent Percent Change
Total population 704,327 100% 739,837 100%
Asian Indian 13,192 1.9% 14,910 2.0% + 0.1
Chinese 60,988 8.7% 72,651 9.8% +1.1%
Filipino 67,543 9.6% 72,429 9.8% + 0.2%
Japanese 9,716 1.4% 9,665 1.3% - 0.1%
Korean 5,942 0.8% 5,486 0.7% - 0.1%
Vietnamese 4,517 0.6% 4,728 0.6% --
Other Asian 9,601 1.4% 12,780 1.7% + 0.3% Source: Census.gov Quick Facts & American Fact Finder: San Mateo County
The data in the charts above are the most recent available. San Mateo County has 88% of its population who have attained a high school education or higher; this is the 3rd most of all other counties in the Bay Area. The county with the highest percentage of high school graduates or better in the area is Marin County with 93% (5% larger). SMC has 45% of its population
with a bachelor’s degree or higher; this is in the mid-range of other counties in this area. The county with the highest percent with a bachelor’s degree or higher is Marin County with 55%. Additionally, SMC has one of the largest proportions of people with a doctorate degree at 3% of the total and is ranked #3 in the state. Only Marin County and Santa Clara County are higher.

12 Visitor Use/Non-Use Parks Study 2015-2016
Figure 2. SMC Unemployment Rate over 22 years Figure 3. SMC Population Projections 2010-2050
Figure 4. Language Spoken at Home
0% 5% 10% 15% 20% 25% Count
Spanish
Chinese
Tagalog
Arabic
Russian
Other Asian
Hindi
Other Paci�c Island
Japanese
Other Indic
French
German
Vietnamese
Persian
Italian
Korean
Portuguese
Greek
Armenian
Other Indo-European
20.3% 139k
7.6% 51.8k
6.5% 44.8k
1.0% 7,086
1.0% 7,063
0.9% 6,383
0.9% 6,216
0.9% 6,191
0.8% 5,771
0.6% 4,012
0.6% 4,000
0.6% 3,818
0.5% 3,530
0.5% 3,516
0.5% 3,377
0.5% 3,286
0.3% 2,299
0.2% 1,210
0.2% 1,059
0.2% 1,040
Percentage of the total population living in households in which a given language is spoken at home.
San Mateo County California
Count number of people speaking given language at home
Scope: population of California and San Mateo County

13Visitor Use/Non-Use Parks Study 2015-2016
0% 5% 10% 15% 20% 25% Count
Spanish
Chinese
Tagalog
Arabic
Russian
Other Asian
Hindi
Other Paci�c Island
Japanese
Other Indic
French
German
Vietnamese
Persian
Italian
Korean
Portuguese
Greek
Armenian
Other Indo-European
20.3% 139k
7.6% 51.8k
6.5% 44.8k
1.0% 7,086
1.0% 7,063
0.9% 6,383
0.9% 6,216
0.9% 6,191
0.8% 5,771
0.6% 4,012
0.6% 4,000
0.6% 3,818
0.5% 3,530
0.5% 3,516
0.5% 3,377
0.5% 3,286
0.3% 2,299
0.2% 1,210
0.2% 1,059
0.2% 1,040
SMCP 5-year Strategic Plan and Review of LiteratureAn understanding of SMCP’s 5-year strategic plan as well as the research literature on park issues helped guide the development of the study’s focus group protocol and survey procedures. Four priority areas identified in the 2013-2018 strategic plan are noted in the introduction.
In addition, the SFSU team, under direction of one of the student research assistants, completed a cursory literature review that was submitted to the San Mateo County Department of Parks in spring 2016. This brief review explored visitor patterns and preferences (trends in activities and participation, willingness to pay, race and culture trends), constraints and barriers to park access, and health and park use (physical, mental, and psychological health). First, we review what is known empirically about participation in outdoor activities and emphasize research that highlights California youth perspectives. This section discusses youth participation in outdoor activities, the benefits of participation in outdoor pursuits, and also highlights racial and cultural trends among California youth. Next, we present sample constraints and barriers reported by youth as aspects in their lives preventing them from experiencing the outdoors more often or at all. We also draw attention to constraints and barriers experienced by specific ethnic populations (all ages) that have been increasing within California, especially San Mateo County (e.g., growth of Latinos and Asians). Third, we discuss the health benefits related to park use, including physical, mental, and psychological benefits. Research on this topic shows that parks play an important role in promoting a
healthy lifestyle, particularly in low-income neighborhoods that do not have easy access to parks or recreational activities. Studies find that parks and related activities also provide opportunities for the community to connect and engage with each other, as well as promote a sense of membership to their neighborhood, which lead to increased feelings of safety. As reflected in our review of literature, current demographic shifts reveal population growth for racial and ethnic minority youth across the U.S. is increasing much faster than the rate for the nation’s population in general (see also Census.gov). And, a growing cadre of urban communities seeks new experiences and new opportunities, including within forests, parks and other public lands. More specifically, access and opportunities for many under-represented populations remains acutely unequal. Use of new media and innovative forms of communication in the outdoors must expand and continue to evolve in order to meet changing needs. To understand how to reach diverse communities effectively and strengthen connections to the land, it is necessary to understand social structures within certain groups of people and identify relevant activities/programs, facilities, media, etc. that resonate with different communities across cultures. Interested individuals can obtain a full copy of the literature review and references online: http://online�sfsu�edu/nroberts/research

14 Visitor Use/Non-Use Parks Study 2015-2016
Methods, Limitations, and ChallengesMETHODOLOGY
San Francisco State University – Internal Review Board An application was submitted to the Office of Research and Sponsored Programs as part of the university policy regarding human subjects. The Office of Human and Animal Protections determined that our project did not require further IRB review because our study primarily focused on intended outcomes deemed evaluative of a specific facility/program within San Mateo County (i.e., parks department). Our team was authorized to proceed with our project as described in our scope of work, adhering to the professional code of ethics within our discipline of recreation, parks, & tourism.
Development of Collateral Materials & ProceduresSFSU created a 1-page project information sheet, focus group recruitment flier, focus group questions and protocol, survey protocol and intercept survey used in the field. The SMCP Department staff reviewed all materials, provided input and feedback, and then materials were finalized and distributed as well as implemented accordingly. The information sheet (Appendix B) and recruitment flyer (Appendix C) described the scope of the project and helped community leaders enlist participants for focus groups. SMCP staff created a large map of the county with each of its park locations, as well as two small boards that displayed statistical charts of the fiscal breakdown of park revenue and expenses.
An online project management system was developed using Google Sites. This platform included space for announcements, file sharing, organizing literature, managing content for each project phase, and general use for remaining organized with administration facets for both phases. The SFSU research team and core SMCP staff all had open access to this site.
For the first phase consisting of focus groups, the SFSU team also developed additional supporting documents such as a participant sign-in sheet, log for signatures acknowledging receipt of gift cards, SMCP budget overview, and a SMCP sign-up sheet (e.g., for anyone requesting a copy of the final report or to be added to the parks department mailing list).
Other materials acquired and used during the focus groups included name tags, pens, Sports Authority gift cards (purchased) and cinch packs (donated), SMCP brochures, and schedules of park-related fall programs. The SFSU team also worked with local caterers to provide dinner and refreshments at each of the four focus groups. Finally, each organization that hosted a focus group was required to complete accounting paperwork from SFSU’s Office of Research and Sponsored Programs to receive a $200 check as a gesture of gratitude for use of their facility.
For the second phase, visitors completing the intercept survey received 1 parks day pass. Anyone filling out the follow-up survey could enter their name into a drawing to win a gift card.

15Visitor Use/Non-Use Parks Study 2015-2016
Phase I: Focus Groups A total of four focus groups were conducted between October and November 2015 in priority districts identified by SMCP: Daly City, East Palo Alto, Pescadero or Half Moon Bay, and North Fair Oaks. These key areas were characterized as predominantly culturally diverse and inclusive of mostly underserved populations.
RationaleFocus groups were chosen as one of the primary methods to elicit the thoughts, feelings, experiences, and recommendations of traditionally under-represented communities in San Mateo County. A focus group is a small group of eight to twelve people, ideally, led through an open discussion by a skilled moderator. The group needs to be large enough to generate rich discussion but not so large that some participants are left out or few people dominate the conversation. Additionally, the groups should be homogeneous as homogeneity levels the playing field and reduces inhibitions among people who come together for the purpose of a group interview. Focus groups can reveal a wealth of detailed information and deep insight. When well executed, a focus group creates a welcoming environment that allows participants to feel at ease and encourages thoughtful, honest answers providing added meaning to question responses. As a valid methodology, focus groups were chosen as the primary approach to elicit the thoughts, feelings, experiences, and recommendations of traditionally under-represented communities in San Mateo County.
In addition, focus groups have the ability to generate rich qualitative data that comes from individual participants engaging in deep conversation, potentially capturing themes that would be missed from other qualitative or quantitative methods. Furthermore, focus groups foster a safe place for participants to be open and honest, particularly among people who use English as a second language.
Focus Group Protocol The focus group protocol used for this study was created by the SFSU team and included a description of the overall study, participant guidelines, focus group questions, and logistical information. Focus group questions were developed by both SFSU and SMCP teams based on models from prior studies, questions that were included in the project scope of work, information from the SMCP 5-year strategic plan, and
cursory literature review. A set of two-tiered questions were developed in which Tier 1 questions were prioritized and asked about visitors’ frequency of park use and experience, level of comfort within parks, constraints or barriers to accessing parks, modes of obtaining information about the county’s parks, fiscal and funding concerns, environmental literacy, general recommendations, and program/facility recommendations. Tier 2 questions were to be asked if additional time permitted, and involved the themes of safety/maintenance as well as health and wellness. Appendix D includes the final focus group protocol and questions used during this study.
RecruitmentThis study used a purposive sampling method in which focus group participants were recruited by leaders of community organizations referred by the SMCP Community Programs Specialist. An initial introductory email was first sent out, followed by a more detailed email from the SFSU team. That is, community leaders were contacted by the SFSU research assistant through an email containing a brief project overview along with the information sheet and 1-page recruitment flier expressing the overarching goals and how the team planned to achieve them. Community organizations were then prioritized based on willingness to help, response time, and proximity to priority districts.
A total of 18 organizations and 21 leaders were contacted and invited to talk about their potential to support this study. The SFSU team received responses from 10 organizations who expressed interest in participating. Host organizations were expected to recruit at least 12 participants from their community and provide a space to host the focus group. In return, host organizations received $200 for their supporting tasks and participation. In addition, focus group participants were provided with a $50 gift certificate to Sports Authority as an incentive along with Sports Authority Cinch Packs donated for this project.
ImplementationFour focus groups (n = 48 people total) were held between October and November of 2015 (see Table 2).

16 Visitor Use/Non-Use Parks Study 2015-2016
As shown in Table 2, four public settings (familiar to participants) were selected in a convenient location with ample parking and public transportation lines as needed. As participants arrived at the respective location, the SFSU team collected basic demographic data and primary transportation type for each focus group participant using a brief questionnaire as part of the participant sign-in sheet. As people arrived they were invited to enjoy a meal before the interview process began. The SFSU Principal Investigator and Research Associate (“investigators”) were the focus group moderators who nurtured authenticity in an understandable format. The goal was to generate a maximum number of different opinions, experiences, attitudes, and ideas from as many people in the group in the time allotted. As reflected in the protocol, the focus groups were structured around a set of carefully predetermined questions but the discussion was free-flowing. That is, participant comments stimulated and influenced the thinking and sharing of others.
The investigators facilitated the interview process using the protocol and questions as outlined in Appendix D. They established comfort during meal time as well as through a general ice breaker question when the focus group commenced to get the group thinking about parks and park use or non-use. All prepared questions were asked within the 90-minute time allotted and the investigator was responsible for getting all participants to talk and fully explain their answers using helpful probes (e.g., “Can you say more about that?”; “Help us understand what you mean?” and “Can you give an example?”). The investigators demonstrated active listening and occasionally paraphrased long or ambiguous comments, or sought clarification for analysis purposes and/or summarized responses for the whole group. Research assistants recorded the focus groups using the smart-phone Apps, “Recorder” and “SmartVoice Recorder.” At the end of each focus group, participants were thanked and received the donated Cinch Pack and gift card; this item required a signature and was tracked by the SFSU team for accounting purposes. In addition, a participant contact information sheet was passed
Table 2. Focus group details
Organization Location Participants (n=48) Date Facilitator
Alliance for Community Empowerment (ACE) of
San Mateo County
Pilipino Bayanihan Resource Center, Daly City n = 12 Tuesday 10/13/15 Ruby Turalba
Siena Youth Center (SYC) of the St. Francis Center
North Fair Oaks Redwood City n = 11 Tuesday 11/13/15 Ruby Turalba
One East Palo Alto East Palo Alto n = 11 Thursday 11/05/15 Nina Roberts
Puente de la Costa Sur(“My Puente”) Pescadero n = 14 Thursday 11/12/15 Nina Roberts
around to anyone who wished to receive the final report and/or be added to the SMCP mailing list. Audio files were immediately uploaded onto computers and posted on the project’s website for review and transcription as well as for data storage and backup.
Transcription & Data Analysis The interviews were captured via audio and the research assistants took notes on a laptop, while the investigators moderated; each interview was then transcribed verbatim. An independent translator was hired to translate and transcribe the focus groups at Siena Youth Center (SYC) and Puente de la Costa Sur, which were held primarily in monolingual Spanish. The research assistant transcribed the audio files of the focus groups conducted at ACE and One East Palo Alto, both spoken in English. Audio files were transcribed using the web App “oTranscribe” and the word processing software. The research assistant compiled all four focus group transcriptions into a single document and drafted key emerging themes from the comprehensive file. The Principal Investigator (PI) conducted a final review of the transcriptions and audio files for each focus group, and checked for completeness of themes and accuracy of supporting quotes.
In order for all participant comments to be understandable and useful, they were boiled down to essential information using a systematic and verifiable process. That is, a content analysis procedure took place for obtaining results of the focus groups. Question content categories were first identified then emerging themes with groupings were entered into a Word document. Subsequently, the list of key emerging themes were extracted and explored then reviewed by each SFSU team member. Corroboration of findings occurred and analyses were discussed in detail at subsequent meetings. The PI reviewed, edited, and approved the final emerging content which was then further organized into domains/categories, themes, and subsets specific to each focus group. Major findings from this phase of the study (along with results from the intercept survey), have been organized to help develop new ideas for strategic planning and offer key recommendations for visitor management, park use, and mitigating barriers.

17Visitor Use/Non-Use Parks Study 2015-2016
LIMITATIONSThe SFSU team made every effort possible to sample a wide range of park users within SMCP’s communities of interest. However, study limitations related to recruitment and sampling, potential information bias, and translation/communication concerns may have affected some of the substance of the data gathered. While phase I study findings and recommendations may be used to guide SMCP in addressing the park-related needs of its underserved communities, the information collected solely represent the ideas and feelings of focus group participants and may not necessarily represent San Mateo County parks users as a whole.
Recruitment ProcessObtaining a list of community organization contacts from SMCP was deemed appropriate given their relationships and current, or desired, partnerships. This practice is well known in establishing focus group procedures with an outside research team. The organizations involved in the focus groups may, therefore, have had a previous or an ongoing relationship with SMCP, and thus bias about park-related experiences may be considered a moderating factor (e.g., influences the strength of a relationship between two variables such as “park” and “participation/visiting”). Focus group participants were recruited by their respective community organizations. Due to this sampling method, a random sample was not obtained as this is not typically common in organizing focus group interviews. Additionally, this sampling method may have created a sampling bias towards a specific demographic and the community organization’s specific mission and purpose. Nonetheless, this recruitment strategy was considered appropriate based on the goals and demographics of San Mateo County. Due to these customary recruitment limitations, the information gathered may not necessarily represent the park-related needs of each community as a whole. Information BiasDuring the introduction section of each focus group interview, participants were informed about the purpose of this study and the focus group guidelines to ensure full inclusion and participation from all participants. Again, focus group guidelines can be found in Appendix D. Focus group participants were asked to report on their park experiences specific to San Mateo County. As typical with most group interviews about “parks,” some respondents may have also shared and generalized their experiences from city, regional, state, or national parks ultimately affecting the specificity of the data. Finally, a participant in the ACE focus group (i.e., predominantly Asians) had a previous relationship working for SMCP and had extensive park-related experiences, also contributing to a potential informational bias. This individual’s contributions, however, also sparked other meaningful content and ideas from other participants throughout the interview process.
ADDITIONAL CHALLENGESOne of the initial challenges of this study was establishing a clear line of communication between SFSU and SMCP Department staff with community leaders. For example, given multiple
emails and phone messages, one community leader from East Palo Alto expressed confusion regarding who was leading this project regarding who her primary contact would be. A couple of other leaders had the same query yet the P.I. provided verbal clarification. The reason for confusion related to three layers of communication from different contacts:
1. First an introductory email from SMCP staff2. A follow-up email from one of the SFSU research assistants3. A confirmation phone call from the SFSU lead Principal
Investigator
An apology was extended with explanation and clarification about the process and lines of communication during the course of the study. While this was not anticipated as an issue, future studies involving community leaders (and local residents) should reduce the number of contact people needed to arrange interviews, focus groups or other qualitative methods. During the planning phase of this study, the SFSU research team communicated to each community leader that a translator could be provided if needed. Staff of the Siena Youth Center did not request this option. Upon arrival at SYC, the SFSU team learned that participants were primarily Spanish-speaking and were in need of a translator to effectively conduct the focus group in both Spanish and English. Thankfully, the host and Youth Program Director, was able to translate with some, but few interruptions, to tend to Center needs as applicable to his work. An occasional lapse of communication/translation between participants and the facilitator may have inhibited participants’ comprehension of the questions. While therefore difficult for the research assistant to take notes on the conversation, the audio files captured key content of participant contributions. Fortunately, the facilitator had basic conversational Spanish skills that helped continue the discussion as needed. Because of language barriers and time constraints, a few Tier 1 questions were not fully addressed, specifically questions about Measure A funds and allocation recommendations, environmental education resources, volunteer opportunities, and suggestions from participants regarding additional programs/activities they might like to see offered. One of the Tier 2 questions regarding health and wellness was also not captured.
Additionally, during the organization of the interviews, the P.I. informed community leaders of the type of adequate space that was required. The focus group at SYC was unfortunately held inside a gymnasium also used as a multi-purpose space (i.e., general recreation, activities). Children of the focus groups participants were unsupervised, causing minor distractions and background noise that intermittently decreased audio quality. Prior to each focus group, the SFSU research team informed the community leader that child care could be provided if needed, however this need was also not expressed.

18 Visitor Use/Non-Use Parks Study 2015-2016
Phase II: Intercept & Follow-Up Surveys An in-park intercept survey was designed by the research associate based on previous research and input from the Project P.I. and SMCP staff. The survey was pre-tested and a final version was approved by park staff before implementation in spring 2016 from April 25 to June 5. A follow-up survey occurred online (to minimize visitor interruption and maximize data collected) which closed on June 10th.
GOALS
Gather and analyze information on San Mateo County park, preserve and trail visitor characteristics, trip purpose, planning and activities.
½ Count and estimate the number of visitors to county parks, preserves and trails.
½ Understand visitor experience and attitudes.
½ Understand visitor desires and preferences regarding park interpretive themes, facilities and resources.
½ Identify visitor use/counts and compare with data from digital counters and other sources.
½ Understand the willingness-to-pay for park services.
SURVEY METHODOLOGY
Intercept/Exit Survey
½ Involved a systematic sample of visitors exiting park/trail at the most popular location at 20 of 22 total county park sites.
½ Twenty survey sites consisted of: 1 Marine Reserve (Fitzgerald); 1 Natural Preserve (Edgewood); 1 Marina, 3 Trails (1 Regional Trail/Crystal Springs; 2 local trails (Mirada Surf and Pillar Point Bluff); and 14 Parks (includes Devil’s Slide Trail which is considered a park with future plans to connect Pedro Point Headlands and Green Valley Trail to the southeast). See Table 3 with all park survey sites listed.
½ Collected data on Samsung 7” and iPad tablets using an electronic off-line survey prepared by SFSU on SurveyGizmo (professional online survey software); paper surveys available as backup or if requested.
½ The survey was stored on the tablet so did not require Wi-Fi or cellular phone service.
½ Skips and data validation were programmed into the survey by SFSU to help speed up completion and improve accuracy of data entered by the visitor.
½ Survey responses were stored on the tablet and later uploaded to the SurveyGizmo database by the SMCP survey coordinator at the designated headquarters.
½ SFSU research assistant reviewed surveys and log sheets entered for obvious/glaring errors to ensure a complete set of accurately entered data.
½ Survey was available in English (online and in paper form) and Spanish (in paper).
½ On average, the survey took no more than 7-8 minutes to complete and consisted of 42 mostly closed-ended (Likert-type) questions along with demographics. Sample topics: previous visits to that park, group and respondent characteristics, information sources, activities undertaken at that site visited, interactions with other visitors, perceived safety, overall quality of the experience, and reasons they felt unsafe or dissatisfied, if applicable.
½ Surveying and visitor counts occurred by SMCP personnel that were trained by SFSU; number of visitors exiting the park/trail during intercept survey period were counted and recorded on log sheets.
½ SMC provided a lead project coordinator to schedule and supervise surveyors and counters and 3 park staff were co-coordinators. All were responsible for checking data and monitoring surveys & logs.
½ A question on the intercept survey asked respondents if they would be willing to provide their name and email address so a follow-up survey could be sent (see Appendix G).

19Visitor Use/Non-Use Parks Study 2015-2016
Table 3: List of parks, reserves/preserves, and trails included in study (n=20)
Follow-up/Online Survey
½ SFSU research assistant sent out follow-up survey electronically to email provided within 5-days of the visitor completing the in-park survey.
½ Designed to allow more open-ended questions to gather data on respondent evaluation of facilities and services used; staff encounters; issues at the park; willingness-to-pay for potential SMCP fee increases; information they would like to learn more about; improvements and programs of interest in the future; and their willingness to assist SMCP in the future.
½ If they agreed to provide their name/email, then SFSU programmed SurveyGizmo to email an invitation with an embedded link to the follow-up survey.
½ Follow-up surveys were estimated to take about 10-12 minutes to complete and consisted of 27 varied, but mostly open-ended questions: Questions asked about respondents’: evaluation of facilities and services used, staff encounters, issues at the park, willingness-to-pay for potential SMCP fee increases, information they would like to learn more about, improvements and programs of interest in the future, and their willingness to assist SMCP in the future.
½ Note: Respondents were the same in both the in-park exit (intercept) survey and follow-up survey; however, given the lower response rate for this latter survey, analyses and results are not weighted the same controlling for the proportion differential.
½ SFSU provided a participant incentive whereby each person completing the follow-up survey was eligible to enter a raffle and two people would win a $100 gift card to Trader Joe’s or one Annual Parks Pass. Using an online random digit generator, two winners were selected and contacted.
Sampling Plan
Data collection was based on a sampling plan developed by SFSU to provide a representative sample of use at each park, preserve, and trail (e.g., “site”). Surveys were conducted at three systematically selected times during the day: morning (7:30 -10:30am), afternoon (11:30-2:30pm) and evening (3:30-6:30pm). Data was collected every weekend day and all weekdays (except Tuesdays). This plan provided for an equal number of weekdays and weekends over the study period, and nearly an equivalent number of times during the three daily survey periods, for each site. On the assigned date and time to administer intercept surveys, a systematic sampling approach was utilized to determine when and which visitor to contact. That is, every “Nth” group of visitors to exit at a designated site was contacted by a trained SMCP-provided surveyor; the group was read a prepared script asking if one of the individuals in the party would complete the survey.
The sampling interval was either every group (at sites with low visitation) to pass the survey location or every 5th group (at higher volume sites). As soon as the survey was started by one visitor from the group, the surveyor would use the assigned sampling interval to contact the appropriate next group. This was an exit survey only to avoid double counting of visitors and to allow the visitor to describe their experience within the park. An incentive of a free one-day pass to SMCP was offered to those who completed the survey. For each group contacted by the surveyor, an entry into the log was completed, even for refusals, and the following data was recorded: contact time, date, weather, sampling interval, group size, sex of group members, group activity (e.g., walk, bike, horseback, jog) and for those agreeing to take the survey, their unique survey number. The log entries allowed for the determination if there were significant differences between those who completed the survey and those who refused to take it.
COASTAL MID-COUNTY SOUTH COUNTY NORTH COUNTY
Devil’s Slide Regional Trail Edgewood Park & Natural Preserve Memorial Park Coyote Point Marina
Fitzgerald Marine Reserve Flood Park Pescadero Creek Park Coyote Point Recreation Area
Mirada Surf Friendship Park Sam McDonald Park Crystal Springs Regional Trail
Moss Beach Park Huddart Park Junipero Serra Park
Pillar Point Bluff Wunderlich Park San Bruno Mountain State & County Park
Quarry Park
San Pedro Valley Park
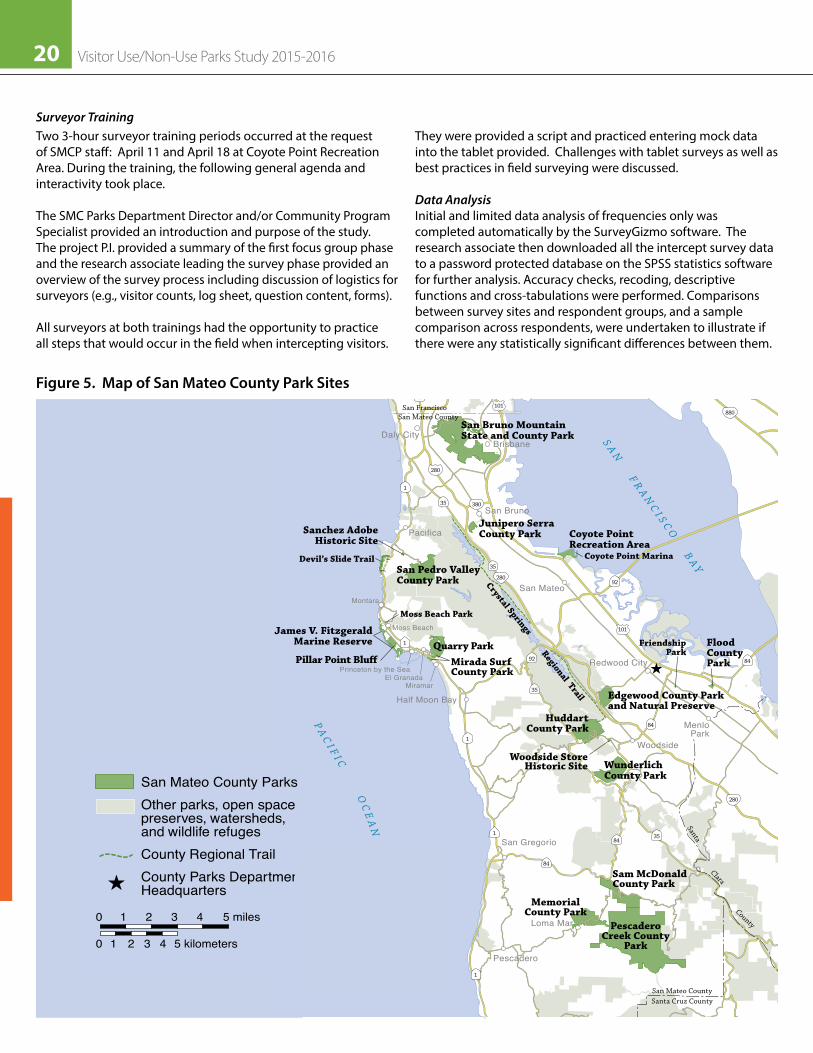
20 Visitor Use/Non-Use Parks Study 2015-2016
They were provided a script and practiced entering mock data into the tablet provided. Challenges with tablet surveys as well as best practices in field surveying were discussed. Data AnalysisInitial and limited data analysis of frequencies only was completed automatically by the SurveyGizmo software. The research associate then downloaded all the intercept survey data to a password protected database on the SPSS statistics software for further analysis. Accuracy checks, recoding, descriptive functions and cross-tabulations were performed. Comparisons between survey sites and respondent groups, and a sample comparison across respondents, were undertaken to illustrate if there were any statistically significant differences between them.
Surveyor Training Two 3-hour surveyor training periods occurred at the request of SMCP staff: April 11 and April 18 at Coyote Point Recreation Area. During the training, the following general agenda and interactivity took place. The SMC Parks Department Director and/or Community Program Specialist provided an introduction and purpose of the study. The project P.I. provided a summary of the first focus group phase and the research associate leading the survey phase provided an overview of the survey process including discussion of logistics for surveyors (e.g., visitor counts, log sheet, question content, forms). All surveyors at both trainings had the opportunity to practice all steps that would occur in the field when intercepting visitors.
Figure 5. Map of San Mateo County Park Sites
Mirada SurfCounty Park
James V. FitzgeraldMarine Reserve
WunderlichCounty Park
HuddartCounty Park
San Pedro Valley County Park
Junipero Serra County Park Coyote Point
Recreation Area
MemorialCounty Park
Sam McDonald County Park
San Bruno Mountain State and County Park
Pescadero Creek County
Park
Quarry Park
Pigeon Point Overlook
Sanchez AdobeHistoric Site
Devil’s Slide Trail
Pillar Point Blu�
Moss Beach Park
Edgewood County Parkand Natural Preserve
FloodCountyPark
Regional Trail
Crystal Springs
Woodside StoreHistoric Site
FriendshipPark
Coyote Point Marina
San Mateo CountySan Francisco
PA
CI F
I C
OC
EA
N
S AN
F
RA
NC
I S CO
B
AY
1
84
84
1
1
9
1
84
1
84
1
280
280
880
580
280
380
35
35
92
35
92
35
35
101
101
)
)
El GranadaMiramar
12/10/14 v4
Princeton by the Sea
Pacifica
Daly CityBrisbane
Half Moon Bay
San Bruno
San Mateo
Redwood City
Woodside
Menlo Park
Moss Beach
Montara
San Gregorio
Loma Mar
Pescadero
San Mateo CountySanta Cruz County
Santa
County
ClaraSan Mateo County ParksOther parks, open space preserves, watersheds,and wildlife refugesCounty Regional TrailCounty Parks DepartmentHeadquarters
0 1 2
0 1 2 5 miles3 4
3 4 5 kilometers

21Visitor Use/Non-Use Parks Study 2015-2016
Results and Findings
FOCUS GROUPS: PHASE IThis exciting interview process revealed many valuable findings. And, important to note is that, at times, participants may be thinking about, and referring to, various local “city parks.” This is not uncommon to occur within focus group interviews. The parks literature explains that many people do not differentiate between park agencies. This further accentuates the need for park agencies to work together; and, this reveals the increasing importance to share such park use/non-use interview results with other park managers as well.
Phase I of this study occurred between October and November 2015 consisted of group interviews with a sample of under-represented populations in San Mateo County. The purpose was to understand park visitors’ use patterns, preferences and needs, as well as its non-visitors’ constraints and barriers, in order for SMCP to better serve the changing demographics of the county. A set of two-tiered questions asked during the focus groups explored the following: visitors’ frequency of park use and experience, level of comfort within parks, barriers to accessing parks, modes of obtaining information about the county’s parks, fiscal and funding concerns, environmental literacy, general recommendations, and program/facility recommendations. Additional questions in tier two (asked if time permitted) involved the themes of safety/maintenance as well as health and wellness. Appendix D includes the final focus group protocol and questions used during this study. In general, the focus group data provided new information and recommendations for park use and community engagement, visitor desires and preferences regarding park facilities and resources, and ideas for breaking down barriers preventing traditionally under-represented communities from visiting their county parks.
Overall, focus group data across all four locations and communities revealed that park users:
½ have positive experiences at county parks that are diverse, meaningful, and significant
½ report positive interactions and perceptions of park staff
½ identify minimal barriers and constraints to park use and access
½ experience gaps in obtaining information from, and communicating with, SMCP
½ suggest innovative ideas for outreach, programming, infrastructure, and generating revenue
DEMOGRAPHICSDemographic information was collected at the onset of each focus group to provide sample descriptive characteristics of residents who were interviewed. A complete table summarizing demographics of the focus group participants, as a whole and by location, is included in Appendix E.
Race, Gender & Age A sample of San Mateo County demographics is provided in the introduction of this report. Focus group demographics of race, gender and age, are reflected in the graphs that follow.
Figure 6 below represents the race/ethnicity of the 48 focus group respondents. Fifty-five percent of the participants identified as Hispanic/Latino, 35% Asian/Pacific Islander, 6% “Other” or Not Specified, and 4% African-American. Additionally, two-thirds focus group participants were female (67%), compared to males (33%).
Additionally, the age range of focus group participants was varied
Latino
55%
African American 4%
Asian 35%
"Other" or n/s
6%
Figure 6. Race/Ethnicity of Focus Group Participants, n =48
Hispanic/Latino
African American
Asian/Pacific Islander
Other or not specified
18-25 yrs 21%
26-35 yrs 17%
36-45 yrs 33%
46-55 yrs 10%
55 & older 19%
Figure 7. Age of Focus Group Participants, n=48
18-25 years
26-35 years
36-45 years
46-55 years
55 years and older
Figure 6. Race/Ethnicity of Focus Group Participants, n =48
and included those who were 18-25 years (21%), 26-35 years (17%), 36-45 years (33%), 46-55 years (10%), and 55 years and older (19%). Figure 7 on next page depicts the age ranges of all 48 participants.

22 Visitor Use/Non-Use Parks Study 2015-2016
Other Demographic DataAdditional information that was collected included occupation, vehicle ownership, and other forms of transportation use. Detailed data counts can be found in Appendix E.
PARK USERS’ EXPERIENCE IS MEANINGFUL, SIGNIFICANT, AND DIVERSE
The majority of participants reported they have positive experiences in county parks. Furthermore, findings revealed their experiences and activities are meaningful, significant, and consistent of a range of diverse involvement.
ActivitiesThe types of activities described by participants that occur during their leisure time were varied and could be categorized into the following three primary themes: 1) physical activities, 2) social gatherings, and 3) hobbies (see Figure 8). The most frequently reported physical activities included walking, hiking, cycling, and use of exercise infrastructure such
as playgrounds or exercise equipment. Social gatherings were described as events or parties with family, friends, or church members and was another common type of activity. Finally, popular hobbies of participants consisted of people and sports watching, and appreciating nature. Figures 9-11 that follow provide a more detailed representation of the three primary domains of park user activities.
The types of park activities reported are indicative of participants
Latino
55%
African American 4%
Asian 35%
"Other" or n/s
6%
Figure 6. Race/Ethnicity of Focus Group Participants, n =48
Hispanic/Latino
African American
Asian/Pacific Islander
Other or not specified
18-25 yrs 21%
26-35 yrs 17%
36-45 yrs 33%
46-55 yrs 10%
55 & older 19%
Figure 7. Age of Focus Group Participants, n=48
18-25 years
26-35 years
36-45 years
46-55 years
55 years and older
Social Gatherings
26%
Hobbies 21%
Physical Activities
53%
Figure 8. Park Activity Themes
Social Gatherings
Hobbies
Physical Activites
Figure 7. Age of Focus Group Participants, n=48
Figure 8. Park Activity Themes
Figure 9. Types of Physical Activities
Figure 10. Types of Social Gatherings
14
6
5
5
3
2
2
2
1
0 2 4 6 8 10 12 14 16
WALKING
HIKING
CYCLING
USE OF EXERCISE INFASTRUCTURE
SPORTS (BASKETBALL, SOCCER, BASEBALL)
EXPLORING
RUNNING
PET EXERCISE
CLIMBING
Frequency
Figure 9. Types of Physical Activities
9
3
3
2
2
1
0 2 4 6 8 10
PARTIES W/ FAMILIES, FRIENDS, CHURCH
PICNIC
BARBECUE
FUNDRAISER
COMMUNITY EVENTS/FESTIVALS
YOUTH PROGRAMS/EVENTS
Frequency
Figure 10. Types of Social Gatherings
5
4
1
1
1
1
1
1
0 1 2 3 4 5 6
PEOPLE & SPORTS WATCHING
NATURE APPRECIATION
PHOTOGRAPHY
SIGHTSEEING
ASTRONOMY OBSERVING
FISHING
CAMPING
PLAYING MUSIC
Frequency
Figure 11. Types of Hobbies

23Visitor Use/Non-Use Parks Study 2015-2016
preferences and desires. This information can help determine how to improve and expand existing services and infrastructure to meet park users’ needs, as well as shape outreach activities to increase park usage and frequency.
An interesting trend found across all four focus groups, however, was that the activities reported did not include attending organized San Mateo County Parks programs or events such as ranger-led hikes/walks or volunteer days. This finding is significant and suggests that park users may have limited interest, knowledge, or awareness of such programs.
Meaning & Significance of Parks Focus group participants revealed that parks are dynamic spaces used for much more than traditional park activities. Parks allow for experiences that are meaningful and significant to their lives. Moreover, findings show park visitors believe that being in natural open spaces allows for deeper self-reflection and awareness, positive emotional health and stress reduction, and strengthens spiritual connections. Additionally, parks provide people with safe places to recreate, exercise, and spend time with others.
Park visitors use natural open spaces for deeper self-reflection and awareness. Focus group respondents asserted that being outdoors and enjoying the natural beauty and scenery allowed for personal inquiry that was positive and life affirming (Table 4 below):
Table 4. Open space for self-reflection and awareness
“I like to go to the parks because I feel inner tranquility…” (Female, 39, Hispanic)
“To be out there in nature is like becoming alive.” (Female Homemaker, 32, Hispanic)
“…it makes me feel alive.” (Age 30, Latina female, North Fair Oaks)
“…gives me perspective. It reminds me of what’s really important.” (Filipino female, journalist)
“We live in a very materialistic world and to feel connected to nature is very important to enjoy the things that are free to you.”
(Latina, House cleaner, North Fair Oaks)
“You see all this green and this natural surrounding…it grounds you and says this is what’s really important…the bigger picture.”
(Female, age 62, Daly City)
Figure 11. Types of Hobbies
9
3
3
2
2
1
0 2 4 6 8 10
PARTIES W/ FAMILIES, FRIENDS, CHURCH
PICNIC
BARBECUE
FUNDRAISER
COMMUNITY EVENTS/FESTIVALS
YOUTH PROGRAMS/EVENTS
Frequency
Figure 10. Types of Social Gatherings
5
4
1
1
1
1
1
1
0 1 2 3 4 5 6
PEOPLE & SPORTS WATCHING
NATURE APPRECIATION
PHOTOGRAPHY
SIGHTSEEING
ASTRONOMY OBSERVING
FISHING
CAMPING
PLAYING MUSIC
Frequency
Figure 11. Types of Hobbies Park visitors represented in the focus groups indicated they use natural open spaces for positive emotional health and stress reduction. As noted in Table 5, they stated the parks are places of relaxation, rejuvenation, and invoke feelings of peace and happiness. Parks are healthy places for residents to reduce the daily stressors of life in our urban and modern world:
Table 5. Use of parks/open space for emotional health & stress reduction
“I just go over there and relax and then that’s it, relax.” (East Palo Alto)
“…get rid of stress.” (Female age 40, Hispanic, North Fair Oaks)
“…I feel inner peace.” (46 yr old male, North Fair Oaks, Server)
“We like to use the parks for relaxation…at the parks, the mind feels free of stress.”
(Hispanic female, age 45, House cleaner)
“They are important because it helps me get rid of stress and to be healthy.” (Male, 46, Hispanic, North Fair Oaks)
“…nature, it takes away my stress and worries.” (North Fair Oaks, Female, 32)
“I forget about all the house responsibilities.”(39 yr old Female, House cleaner, Hispanic)
“When you’re working and you’re focused on the daily grind you forget there is beauty out there.”
(Filipino female, age 62, Daly City)
“…we are in front of the…computer screen, answering emails…and being able to go out there and being detached from it all—for me is a way of decompressing and de-stressing.”
(Male, age 57, Marketing, South San Francisco)
“I really enjoy the peace of nature because there are no city noises…I don’t have to think about traffic, people, work. I feel refreshed, renewed.”
(Latino Male, 29, teacher, North Fair Oaks)
“I guess it provides a break from the toxic urban environment and I think there’s such a nature deficit. I think it’s the…mental health, sense of well-being.”
(Asian Male, East Palo Alto)
Park visitors use natural open spaces to strengthen spiritual connections. Participants highlighted the spiritual and religious component of parks, admitting that when visiting parks they are more appreciative of life and their natural surroundings. As shown in Table 6, parks deepen users’ connection to the world and their spiritual beliefs, fostering an existential feeling of purpose beyond the individual: Table 6. Natural, outdoor spaces to strengthen spiritual connections
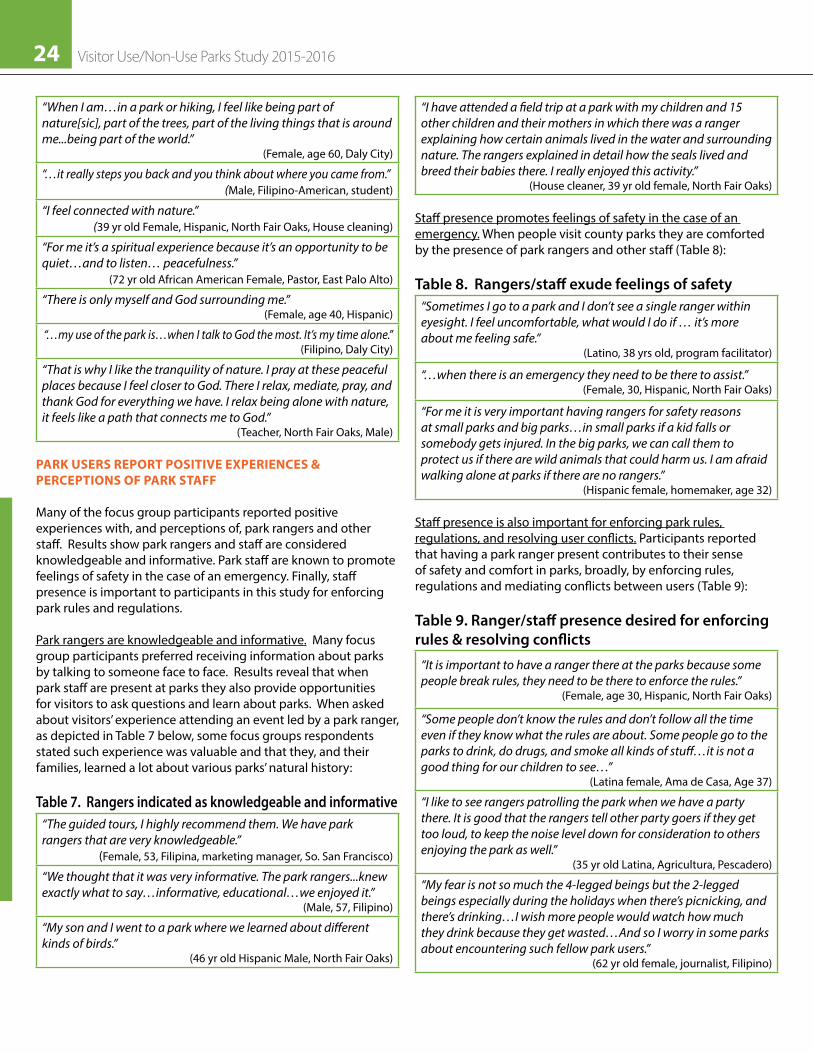
24 Visitor Use/Non-Use Parks Study 2015-2016
“When I am…in a park or hiking, I feel like being part of nature[sic], part of the trees, part of the living things that is around me...being part of the world.”
(Female, age 60, Daly City)
“…it really steps you back and you think about where you came from.” (Male, Filipino-American, student)
“I feel connected with nature.” (39 yr old Female, Hispanic, North Fair Oaks, House cleaning)
“For me it’s a spiritual experience because it’s an opportunity to be quiet…and to listen… peacefulness.”
(72 yr old African American Female, Pastor, East Palo Alto)
“There is only myself and God surrounding me.” (Female, age 40, Hispanic)
“…my use of the park is…when I talk to God the most. It’s my time alone.” (Filipino, Daly City)
“That is why I like the tranquility of nature. I pray at these peaceful places because I feel closer to God. There I relax, mediate, pray, and thank God for everything we have. I relax being alone with nature, it feels like a path that connects me to God.”
(Teacher, North Fair Oaks, Male) PARK USERS REPORT POSITIVE EXPERIENCES & PERCEPTIONS OF PARK STAFF
Many of the focus group participants reported positive experiences with, and perceptions of, park rangers and other staff. Results show park rangers and staff are considered knowledgeable and informative. Park staff are known to promote feelings of safety in the case of an emergency. Finally, staff presence is important to participants in this study for enforcing park rules and regulations.
Park rangers are knowledgeable and informative. Many focus group participants preferred receiving information about parks by talking to someone face to face. Results reveal that when park staff are present at parks they also provide opportunities for visitors to ask questions and learn about parks. When asked about visitors’ experience attending an event led by a park ranger, as depicted in Table 7 below, some focus groups respondents stated such experience was valuable and that they, and their families, learned a lot about various parks’ natural history:
Table 7. Rangers indicated as knowledgeable and informative“The guided tours, I highly recommend them. We have park rangers that are very knowledgeable.”
(Female, 53, Filipina, marketing manager, So. San Francisco)
“We thought that it was very informative. The park rangers...knew exactly what to say…informative, educational…we enjoyed it.”
(Male, 57, Filipino)
“My son and I went to a park where we learned about different kinds of birds.”
(46 yr old Hispanic Male, North Fair Oaks)
“I have attended a field trip at a park with my children and 15 other children and their mothers in which there was a ranger explaining how certain animals lived in the water and surrounding nature. The rangers explained in detail how the seals lived and breed their babies there. I really enjoyed this activity.”
(House cleaner, 39 yr old female, North Fair Oaks)
Staff presence promotes feelings of safety in the case of an emergency. When people visit county parks they are comforted by the presence of park rangers and other staff (Table 8):
Table 8. Rangers/staff exude feelings of safety“Sometimes I go to a park and I don’t see a single ranger within eyesight. I feel uncomfortable, what would I do if … it’s more about me feeling safe.”
(Latino, 38 yrs old, program facilitator)
“…when there is an emergency they need to be there to assist.” (Female, 30, Hispanic, North Fair Oaks)
“For me it is very important having rangers for safety reasons at small parks and big parks…in small parks if a kid falls or somebody gets injured. In the big parks, we can call them to protect us if there are wild animals that could harm us. I am afraid walking alone at parks if there are no rangers.”
(Hispanic female, homemaker, age 32)
Staff presence is also important for enforcing park rules, regulations, and resolving user conflicts. Participants reported that having a park ranger present contributes to their sense of safety and comfort in parks, broadly, by enforcing rules, regulations and mediating conflicts between users (Table 9):
Table 9. Ranger/staff presence desired for enforcing rules & resolving conflicts
“It is important to have a ranger there at the parks because some people break rules, they need to be there to enforce the rules.”
(Female, age 30, Hispanic, North Fair Oaks)
“Some people don’t know the rules and don’t follow all the time even if they know what the rules are about. Some people go to the parks to drink, do drugs, and smoke all kinds of stuff…it is not a good thing for our children to see…”
(Latina female, Ama de Casa, Age 37)
“I like to see rangers patrolling the park when we have a party there. It is good that the rangers tell other party goers if they get too loud, to keep the noise level down for consideration to others enjoying the park as well.”
(35 yr old Latina, Agricultura, Pescadero)
“My fear is not so much the 4-legged beings but the 2-legged beings especially during the holidays when there’s picnicking, and there’s drinking…I wish more people would watch how much they drink because they get wasted…And so I worry in some parks about encountering such fellow park users.”
(62 yr old female, journalist, Filipino)

25Visitor Use/Non-Use Parks Study 2015-2016
“I think it’s important that there are rangers in the parks to enforce the park’s rules for those who do not follow the rules. It is important that they keep the parks safe for all.”
(Latina, house cleaner, age 39, North Fair Oaks)
PARK USERS IDENTIFY MINIMAL BARRIERS & CONSTRAINTSData from focus groups indicated that park users experience some, but not many, constraints and barriers to accessing county parks. The biggest challenge identified, however, related to parking and public transportation. Additionally, focus group respondents stated that park fees were generally not a constraint or barrier to visiting their county parks, especially to support special programs or events.
Park users revealed that lack of public transportation and parking can, in fact, be barriers for their visitation. Approximately 19% of all focus groups participants reported they do not own a vehicle. For these county residents, lack of public transportation and/or limited information about options makes it difficult for them to access and enjoy the benefits of parks. Furthermore, for those participants who do own a vehicle, parking was an issue, especially during weekends or at popular parks. Table 10 provides sample interview comments:
Table 10. Transportation and/or parking as primary barrier“…there is no public transportation that takes you to these parks. It makes it hard to go to some parks that are not nearby where we live….I think my problem could be transportation. I don’t know which one [bus] will take me to the park.”
(Latino male, 46 yrs old, North Fair Oaks)
“…getting to the parks could be difficult if there are no buses that take you there.”
(32 yr old female, homemaker)
“You don’t find rides to the park in the bus station.” (38 yr old male, Latino, East Palo Alto)
“I think transportation is a problem. Some parks are far from us, and I don’t know how to get there…I think having public buses could be a convenience to all.”
(Hispanic female, 40 yrs old, North Fair Oaks)
“For me, one of the reasons I don’t go to the parks during the weekends is because there is no parking available.”
(Teacher, 29 yr old, Male Latino)
“…during holidays they get crowded. If planning on taking the family to the park and we find out that we cannot stay because there is no parking or spaces available, it is very frustrating.”
(Latina female, 32 yrs old)
Participants suggested including a County parks map with public transportation options for how to get to each park via public transit and, second, partnering with San Mateo County Transit District to include more stops at more park entrances.
Focus group participants revealed that park entrance/parking fees are generally not a constraint. As reflected in Table 11, many reported that current fees are affordable and do not affect their
ability to visit parks. In fact, interestingly, many respondents supported additional fees for special events and programs:
Table 11. Entrance/parking fees not barrier for majority
“I don’t think the fees are too much, they seem reasonable.” (Latina female, age 32)
“It is not that expensive, the price is not a barrier or an issue for us.”(Latina, age 35, Pescadero)
“…as someone who uses the park I think it’s justified to at least charge a fee for it…and it helps the bottom line of the city, county, county parks and it helps everybody…from my point of view I feel that it is a very reasonable recreational experience to pay almost nothing to enter the park and its premises.”
(Male, age 57, Filipino, Marketing, So. SF)
“For special events…I would pay extra, for those special events…in the park.”
(Filipino male, 64, auto parts employee)
“I would pay…if you give me a good program that is incentive enough…”
(Latino male, 38)
“I would pay…it’s all about the kind of diversity that the event brings.”
(Male, 43, Polynesian, East Palo Alto)
PARK USERS REPORT GAPS IN INFORMATION & COMMUNICATIONWhile focus group respondents, overall, reported positive park experiences and encounters with park staff, there appeared to be gaps in their ability to obtain information from, and communicate with, SMCP. In general, the findings reveal that residents obtain information about SMCP in various ways—from the Internet to word of mouth. However, despite multiple lines of communication and information, focus group participants expressed what they felt was an overall lack of effective communication from SMCP to their neighborhoods. Specifically, language barriers appeared to be a primary challenge regarding communication with park staff and comprehension of park rules and regulations among Hispanic/Latino communities.
Park users obtain information about SMCP in a variety of ways. These methods range from traditional information outlets such as community centers and churches to more technological approaches such as the use of Internet or social media. Results for how focus group respondents said they obtained information about SMCP is shown in the list below:
Word of Mouth Family Gatherings
Church Gatherings Community Centers & Events
Children’s Schools Telephone
Parents Forums (Online) Online Forums (Broad)
Social Media “Google”
County Website

26 Visitor Use/Non-Use Parks Study 2015-2016
Language barriers are found to impact communication with park staff among focus group participants. For example, women from the Spanish speaking community in North Fair Oaks reported that language barriers (Table 12) impacted park users’ experiences with park staff, causing negative experiences and misunderstandings: Table 12. Language barriers, a common constraint
“I think it is very important having someone that speaks your language because one learn [sic] more when somebody speaks your own language.”
(Female, 30, House cleaner)
“I have gone to Skyline center with my children and there they have American staff that is very nice. However, we felt uncomfortable not understanding what was said to us.”
(Female, age 43, Hogar)
“I also find it hard to make reservations ahead of time. When calling the parks number there is no Spanish speaking personnel to help you.”
(Female, 43, Hogar)
“I think it is very important having Spanish speaking rangers because one time we went to a park, and there were a lot of bees at this park. We tried to tell the ranger about the bees but he could not understand us. Not until one of the children got stung by a bee then he knew what we were trying to tell him. I think having a ranger who do not speak Spanish is not good when there is a dangerous situation.”
(Female, age 37, Ama de casa)
Language barriers cause park visitors to miscomprehend rules, regulations, and other important park information. The responses below come from Latino focus group participants whose primary language is in Spanish, and were translated into English for purposes of transcription and data analysis:
½ “I think that [park] information needs to be in at least two languages.” (Male, 38, E. Palo Alto)
½ “Rules are always in English.” (Female, 39, Pescadero)
½ “The problem is when we don’t understand these rules.” (Female, 32, North Fair Oaks)
SUGGESTIONS FOR OUTREACH, PROGRAMMING & INFRASTRUCTURE
When asked about what recommendations and suggestions they have for improving their park experiences, focus group participants expressed innovative ideas about outreach and communication, educational programming, and infrastructure. Moreover, respondents offered creative suggestions to improve community engagement while generating revenue for parks. The focus group series of questions explicitly asked participants what suggestions they might have for SMC Parks Department. This section includes key findings yet specific agreements based on analyses are included in the recommendations section.
Outreach & CommunicationA multitude of outreach methods and channels were identified by focus group participants. For example, participants recommended building upon existing community resources as a place of outreach. These include schools, churches, and community events and centers. In addition, social media was also identified as a way of reaching communities. Finally, various recommendations were made to address the language and cultural barriers experienced in Spanish speaking communities.
SMCP should consider increasing outreach and communication efforts through existing community resources. Specifically, schools, churches, community events, as well as youth, senior, and cultural centers were identified as effective places to spread the word about SMCP. Table 13 depicts sample remarks for each of these primary engagement outlets:
Table 13. Four key engagement outlets and sample suggestions
Schools & Youth Centers
“Children can spread the word on the activities they find at these parks….If I have a child coming home excited about all of the information received at the park and wanting to visit these parks to explore more what they have to offer. Perhaps children’s friends can spread the word on the activities they find at these parks.”
(Age 24, Female Latina, Pescadero)
“You can go to some of the schools in the district to go to the children, then that goes to the parents.”
(Male, age 42, unemployed, East Palo Alto)
“Leave your brochures in some San Mateo County schools, or maybe after school programs.”
(Filipino male, student, Daly City)
“We have to motivate people in obtaining information through community centers, libraries, homework centers, schools. Because we need to be informed. “
(Hispanic female, age 43, North Fair Oaks)
Faith-Based Institutions
“Another area that can be targeted is the parishes or temples, and you would reach that multigenerational audience. You could have the grandparents and grandchildren…”
(Female, age 62, Filipino, Journalist, Daly City)
“I would say that with especially African American community, the clergy leadership, we see a lot of people on Sunday morning, and maybe us having an announcement during our service would be my recommendation.”
(76 yr old Black Female, Pastor, East Palo Alto)
Community Centers
“Community centers, senior centers, resource centers . . . where people go, especially the seniors.”
(Female, 74, Filipino, Retired Gerontologist)
“…community centers…like the Siena Youth Center.”(Latina, 30 yrs old, House cleaner)

27Visitor Use/Non-Use Parks Study 2015-2016
Community Events
“We have a lot of community events…table at community events with brochures and flyers and let people know that they [parks] exist.”
(Female, Pacific Islander, age 36, Program Coordinator, East Palo Alto)
“I do community organizing and I found that we’re not a flyer people…not much announcement on the radio or on TV, but if I tell you to your face…in a sense, you are obligated. So in order for you to obligate everyone…to come, you have to do it from a person who knows everyone…”
(Latino, 38 year old Male)
SMCP should build upon social media platforms for outreach and communication. Given the increase of access and use of the Internet and social media, focus group participants identified technology (Table 14) as another way of continuing to expand park outreach efforts to culturally diverse communities:
Table 14. Social media as platform for outreach & communication
“…I would like something user friendly, you could subscribe instantly…and unsubscribe just as easily…I don’t want to keep on receiving the emails continuously, so I would like to have complete control, make it very, very user friendly…I’d sign up right away…’cause that gets me out of the house.”
(61 year old retired male, Filipino)
“I think through Facebook.” (Latina, age 30, North Fair Oaks)
“…we are in the era of social media…one group of friends says they are going to this [event], then [others] are more inclined to come and tag along…so a hashtag…the parks in Miami, I remember, they had a Snapchat.”
(Female, 24, Pacific Islander, Mental Health professional)
“…if the park itself has programs, they can advertise through Facebook where people could subscribe and the events will show up [on Facebook] and that makes it easier to organize events.”
(Asian Male, East Palo Alto)
“…you have to market to the youth now and the best way is through social media. The easiest way to get events out is to spread it on all different websites…Instagram, Twitter, Facebook and what not….create a viral…create a hashtag…”
(Filipino Male, Quality Analyst, age 26, Daly City)
SMCP should continue to address Spanish language and cultural barriers. Focus group participants whose primary language is Spanish, for instance, offered multiple recommendations to improve their experience at parks and with park staff (see Table 15). First, these residents suggest creating written information in multiple languages whenever possible. Another recommendation made was for SMCP to employ more bilingual rangers and ensure staff are culturally competent. Participants in these focus groups stated that occasional ineffectual communication with park staff, due to language barriers, can negatively impact their park experience or create a level of intimidation to users. When park staff do not reflect the culture of the community they serve, a cultural barrier may otherwise be erected. Hiring staff that are therefore competent, and providing relevant diversity training, in serving the growing ethnic diversity across San Mateo County is a very real way to connect people to their parks.
Table 15: Multiple languages and cultural competence for rangers
Provide Written Information in Multiple Languages
“We would like to see a bulletin board with Spanish information about county parks…”
(Female, Latina age 39, Agriculture)
Hire Bilingual & Culturally Competent Staff
“I think it’s good having Spanish speaking rangers at the parks because you understand what they are talking about.”
(Latina, age 37, North Fair Oaks)
“I think it could be an issue of safety not being able to communicate in Spanish.”
(Female, Latina, Ama de Casa)
“I always have seen American rangers that are very nice…however, I feel that having them intimidates people to participate in these programs.”
(Age 32, Hispanic, Female, Homemaker, North Fair Oaks)
“To me it is very important having Spanish speaking rangers because we understand and feel more comfortable with them.”
(Female, age 39, Hispanic, House cleaning)
“I would be more inclined to having knowledgeable rangers that understand our culture.”
(Male, 29 yr old, Teacher, North Fair Oaks)
“I think if the park is a part of the city or a part of the county, then it should reflect the different ethnic groups in that particular area.”
(African American female, 76 yr old Pastor, East Palo Alto)
“It would matter if they are culturally competent.” (Filipino, age 62, Female Journalist)

28 Visitor Use/Non-Use Parks Study 2015-2016
Educational Programs & ActivitiesFocus group findings reveal a deep desire for park programs and activities that enhance the park-user experience. Most ideas and suggestions were geared towards youth and promoting parks through other local community and cultural events. Other recommendations included volunteering and stewardship activities.
SMCP should expand its youth outreach and programming. A major concern for the focus group participants is that youth are not spending enough time outdoors connecting with the natural environment (see Table 16). They felt the need to have more engaging activities and programs specifically for children:
Table 16. Youth engagement in parks and nature“Having games for children and exercise outdoors, I think is a good idea.”
(Latina, age 36, Ama de Casa, Pescadero)
“Programs for kids. Some days…I work with kids…they are lazy. They don’t want to go outside and enjoy parks or slides…so I think if they had activities or programs for kids to go outside, in the outdoors and stuff, I’d enjoy it.”
(Black Female, 18, After School Instructor)
“We need to have more activities during the entire year for our children not only during summer. We would like…more activities.”
(39 year old Latina, Pescadero)
“…making education fun…if you give kids something to do where they actually get their hands dirty, and actually in the mix. They’ll be willing to be more interactive with it.”
(24 year old Pacific Island Male, East Palo Alto, Mental Health)
Findings show that parks provide a safe and affordable place for family, friends and loved ones to gather, and thus also acts as places for parents to teach their children about how their culture relates to the environment.
“This is when my kids learn about different insects and most of this stuff that I got to experience next to my house [in home country] . . . [kids] are able to observe how butterflies move, and they observe how the wind moves the trees. And then it makes my kids very, very curious about stuff when they go to the parks, especially the natural parks, not the regular playground. It strikes something of curiosity especially my four kids.”
(Male, 38, Latino, East Palo Alto)
SMCP should promote the use of parks by hosting diverse neighborhood cultural events. When asked about their recom-mendations for additional park programs and activities, focus group respondents from East Palo Alto (Table 17) had innovative ideas such as movie nights, cultural celebrations, and events that promote artistic expression and creativity:
Table 17. Host diverse community-based cultural events“…have something once a month, like...every Friday with movie night.”
(Male, 21, Mixed race, Cook)
“…book clubs…Cinco de Mayo…Pacific Islander day, and June-teenth.(42 yr old Male, Unemployed)
“People like music and all that type of culture.” (Latino, Male)
“…there’s something missing here and its creativity. I haven’t seen a park where you can go and create something…creativity is miss-ing. We are not creating anything when we are going there.”
(Latino Program Facilitator, age 38)
SMCP should raise awareness of its volunteer and stewardship programs. While participants generally agree that volunteering is beneficial for parks and communities, some residents were not aware of such opportunities; other people had recommendations to build upon existing stewardship programs (see Table 18):
Table 18. Increase awareness of volunteer and stewardship programs
“I don’t know if I can volunteer. Will I need to learn English?”(Latina, 39, Pescadero, Homemaker)
“I agree to have a place where we can volunteer. I know a lot of people who volunteer at the Ano Nuevo [state] park.”
(Age 48, Latina, Trabajo en la Escuela, Pescadero)
“Having high school students…do volunteer hours could be good for them.”
(Student, age 24, Latina, Pescadero)
“…reach out to corporations…the company that I worked at, we do our volunteer work, Earth Day…there’s something we do for the environment…”
(Filipino, Male, 57, Daly City)
“…it’s a chance for people to be in the park and appreciate the cleanliness of the park and then, afterwards, have them clean it up after…so you go there and keep it clean, so it’s a way to bring them there and then after that to appreciate the park by cleaning it up.”
(Male, unemployed, age 42)
InfrastructureWhen asked about how tax dollars should be spent to improve their county parks, results show a preference for maintenance of existing infrastructure such as improving signage, picnic areas, and bathrooms (i.e., Table 19). In addition, respondents expressed a desire for new facilities such as playgrounds, outdoor exercise equipment, and dog parks:
Table 19. How tax dollar revenues can improve parks“…it frustrates us when some of the signs are faded…and we can’t see the photos, or when you can’t read about it…”
(42 yr old Male, East Palo Alto)
“Don’t keep the same [sign] for seven years and expect people to continue to read it. I think it should be a seasonal change.”
(Male 24, Pacific Islander, Mental Health)
“Park benches, [more] picnic tables…” (53 yr old Female, Filipino, Marketing Manager)
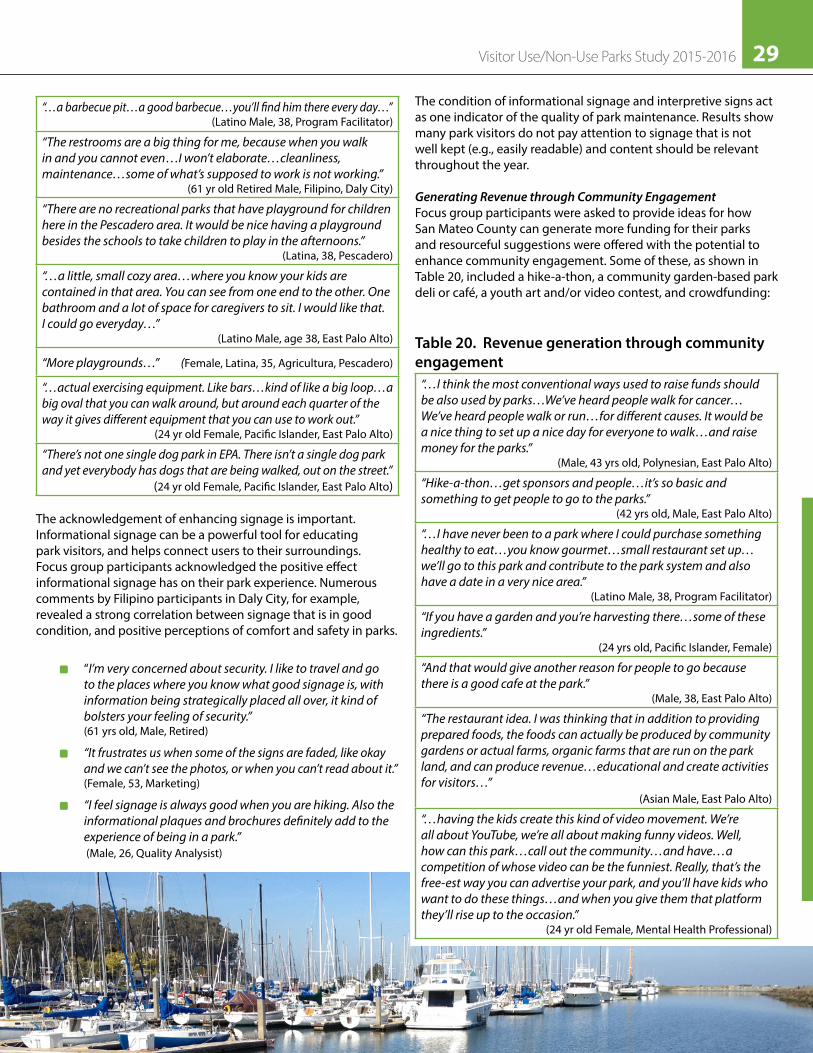
29Visitor Use/Non-Use Parks Study 2015-2016
“…a barbecue pit…a good barbecue…you’ll find him there every day…”(Latino Male, 38, Program Facilitator)
“The restrooms are a big thing for me, because when you walk in and you cannot even…I won’t elaborate…cleanliness, maintenance…some of what’s supposed to work is not working.”
(61 yr old Retired Male, Filipino, Daly City)
“There are no recreational parks that have playground for children here in the Pescadero area. It would be nice having a playground besides the schools to take children to play in the afternoons.”
(Latina, 38, Pescadero)
“…a little, small cozy area…where you know your kids are contained in that area. You can see from one end to the other. One bathroom and a lot of space for caregivers to sit. I would like that. I could go everyday…”
(Latino Male, age 38, East Palo Alto)
“More playgrounds…” (Female, Latina, 35, Agricultura, Pescadero)
“…actual exercising equipment. Like bars…kind of like a big loop…a big oval that you can walk around, but around each quarter of the way it gives different equipment that you can use to work out.”
(24 yr old Female, Pacific Islander, East Palo Alto)
“There’s not one single dog park in EPA. There isn’t a single dog park and yet everybody has dogs that are being walked, out on the street.”
(24 yr old Female, Pacific Islander, East Palo Alto)
The acknowledgement of enhancing signage is important. Informational signage can be a powerful tool for educating park visitors, and helps connect users to their surroundings. Focus group participants acknowledged the positive effect informational signage has on their park experience. Numerous comments by Filipino participants in Daly City, for example, revealed a strong correlation between signage that is in good condition, and positive perceptions of comfort and safety in parks.
½ “I’m very concerned about security. I like to travel and go to the places where you know what good signage is, with information being strategically placed all over, it kind of bolsters your feeling of security.” (61 yrs old, Male, Retired)
½ “It frustrates us when some of the signs are faded, like okay and we can’t see the photos, or when you can’t read about it.” (Female, 53, Marketing)
½ “I feel signage is always good when you are hiking. Also the informational plaques and brochures definitely add to the experience of being in a park.” (Male, 26, Quality Analysist)
The condition of informational signage and interpretive signs act as one indicator of the quality of park maintenance. Results show many park visitors do not pay attention to signage that is not well kept (e.g., easily readable) and content should be relevant throughout the year.
Generating Revenue through Community EngagementFocus group participants were asked to provide ideas for how San Mateo County can generate more funding for their parks and resourceful suggestions were offered with the potential to enhance community engagement. Some of these, as shown in Table 20, included a hike-a-thon, a community garden-based park deli or café, a youth art and/or video contest, and crowdfunding:
Table 20. Revenue generation through community engagement
“…I think the most conventional ways used to raise funds should be also used by parks…We’ve heard people walk for cancer…We’ve heard people walk or run…for different causes. It would be a nice thing to set up a nice day for everyone to walk…and raise money for the parks.”
(Male, 43 yrs old, Polynesian, East Palo Alto)
“Hike-a-thon…get sponsors and people…it’s so basic and something to get people to go to the parks.”
(42 yrs old, Male, East Palo Alto)
“…I have never been to a park where I could purchase something healthy to eat…you know gourmet…small restaurant set up…we’ll go to this park and contribute to the park system and also have a date in a very nice area.”
(Latino Male, 38, Program Facilitator)
“If you have a garden and you’re harvesting there…some of these ingredients.”
(24 yrs old, Pacific Islander, Female)
“And that would give another reason for people to go because there is a good cafe at the park.”
(Male, 38, East Palo Alto)
“The restaurant idea. I was thinking that in addition to providing prepared foods, the foods can actually be produced by community gardens or actual farms, organic farms that are run on the park land, and can produce revenue…educational and create activities for visitors…”
(Asian Male, East Palo Alto)
“…having the kids create this kind of video movement. We’re all about YouTube, we’re all about making funny videos. Well, how can this park…call out the community…and have…a competition of whose video can be the funniest. Really, that’s the free-est way you can advertise your park, and you’ll have kids who want to do these things…and when you give them that platform they’ll rise up to the occasion.”
(24 yr old Female, Mental Health Professional)
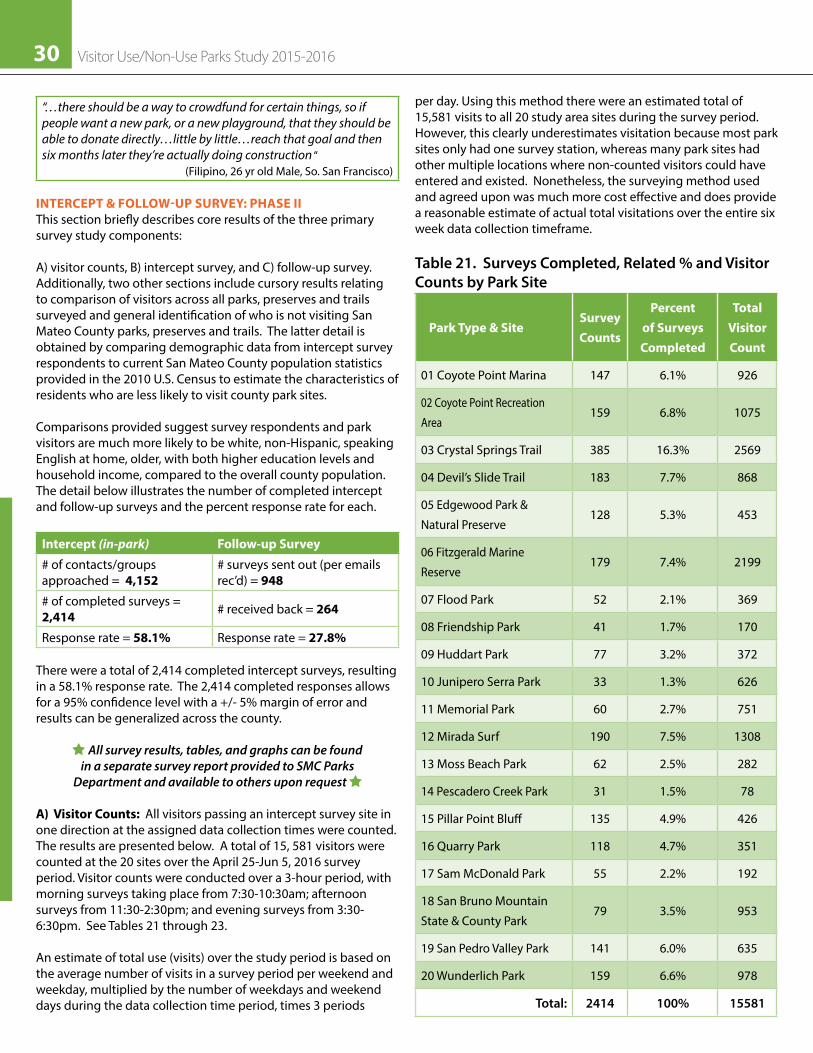
30 Visitor Use/Non-Use Parks Study 2015-2016
“…there should be a way to crowdfund for certain things, so if people want a new park, or a new playground, that they should be able to donate directly…little by little…reach that goal and then six months later they’re actually doing construction “
(Filipino, 26 yr old Male, So. San Francisco) INTERCEPT & FOLLOW-UP SURVEY: PHASE IIThis section briefly describes core results of the three primary survey study components: A) visitor counts, B) intercept survey, and C) follow-up survey. Additionally, two other sections include cursory results relating to comparison of visitors across all parks, preserves and trails surveyed and general identification of who is not visiting San Mateo County parks, preserves and trails. The latter detail is obtained by comparing demographic data from intercept survey respondents to current San Mateo County population statistics provided in the 2010 U.S. Census to estimate the characteristics of residents who are less likely to visit county park sites. Comparisons provided suggest survey respondents and park visitors are much more likely to be white, non-Hispanic, speaking English at home, older, with both higher education levels and household income, compared to the overall county population. The detail below illustrates the number of completed intercept and follow-up surveys and the percent response rate for each.
Intercept (in-park) Follow-up Survey
# of contacts/groups approached = 4,152
# surveys sent out (per emails rec’d) = 948
# of completed surveys = 2,414 # received back = 264
Response rate = 58�1% Response rate = 27�8% There were a total of 2,414 completed intercept surveys, resulting in a 58.1% response rate. The 2,414 completed responses allows for a 95% confidence level with a +/- 5% margin of error and results can be generalized across the county.
All survey results, tables, and graphs can be found in a separate survey report provided to SMC Parks
Department and available to others upon request A) Visitor Counts: All visitors passing an intercept survey site in one direction at the assigned data collection times were counted. The results are presented below. A total of 15, 581 visitors were counted at the 20 sites over the April 25-Jun 5, 2016 survey period. Visitor counts were conducted over a 3-hour period, with morning surveys taking place from 7:30-10:30am; afternoon surveys from 11:30-2:30pm; and evening surveys from 3:30-6:30pm. See Tables 21 through 23.
An estimate of total use (visits) over the study period is based on the average number of visits in a survey period per weekend and weekday, multiplied by the number of weekdays and weekend days during the data collection time period, times 3 periods
per day. Using this method there were an estimated total of 15,581 visits to all 20 study area sites during the survey period. However, this clearly underestimates visitation because most park sites only had one survey station, whereas many park sites had other multiple locations where non-counted visitors could have entered and existed. Nonetheless, the surveying method used and agreed upon was much more cost effective and does provide a reasonable estimate of actual total visitations over the entire six week data collection timeframe.
Table 21. Surveys Completed, Related % and Visitor Counts by Park Site
Park Type & SiteSurvey Counts
Percent of Surveys Completed
Total Visitor Count
01 Coyote Point Marina 147 6.1% 926
02 Coyote Point Recreation
Area159 6.8% 1075
03 Crystal Springs Trail 385 16.3% 2569
04 Devil’s Slide Trail 183 7.7% 868
05 Edgewood Park &
Natural Preserve128 5.3% 453
06 Fitzgerald Marine
Reserve179 7.4% 2199
07 Flood Park 52 2.1% 369
08 Friendship Park 41 1.7% 170
09 Huddart Park 77 3.2% 372
10 Junipero Serra Park 33 1.3% 626
11 Memorial Park 60 2.7% 751
12 Mirada Surf 190 7.5% 1308
13 Moss Beach Park 62 2.5% 282
14 Pescadero Creek Park 31 1.5% 78
15 Pillar Point Bluff 135 4.9% 426
16 Quarry Park 118 4.7% 351
17 Sam McDonald Park 55 2.2% 192
18 San Bruno Mountain
State & County Park 79 3.5% 953
19 San Pedro Valley Park 141 6.0% 635
20 Wunderlich Park 159 6.6% 978
Total: 2414 100% 15581

31Visitor Use/Non-Use Parks Study 2015-2016
Table 22: Visitor counts and average by survey site during 3-hour survey period, by time Visitor Counts Mean Average
Park, Preserve, or Trail (n=20) Total Visitor Count Weekday Weekend All Sessions Weekday Weekend
01) Coyote Pt. Marina 926 390 536 71.2 55.7 89.3
02) Coyote Pt. Recreation Area 1075 566 509 71.7 70.8 72.7
03) Crystal Springs Regional Trail 2569 886 1683 197.6 126.6 280.5
04) Devil’s Slide Trail 868 318 550 57.9 39.8 78.6
05) Edgewood Park & Nature Preserve 453 140 313 34.8 20.0 52.2
06) Fitzgerald Marine Reserve 2199 1210 989 146.6 151.3 141.3
07) Flood Park 369 147 222 28.4 21.0 37.0
08) Friendship Park 170 114 56 11.3 14.3 8.0
09) Huddart Park 372 93 279 28.6 13.3 46.5
10) Junipero Serra Park 626 162 464 41.7 20.3 66.3
11) Memorial Park 751 114 637 57.8 19.0 91.0
12) Mirada Surf (Trail) 1308 418 890 93.4 46.4 178.0
13) Moss Beach Park 282 135 147 21.7 19.3 24.5
14) Pescadero Creek Park 78 23 55 6.5 2.9 13.8
15) Pillar Point Bluff (Trail) 426 155 271 32.8 22.1 45.2
16) Quarry Park 351 214 137 25.1 23.8 27.4
17) Sam McDonald Park 192 100 92 13.7 12.5 15.3
18) San Bruno Mtn. State and County Park 953 251 702 68.1 27.9 140.4
19) San Pedro Valley Park 635 257 378 48.8 36.7 63.0
20) Wunderlich Park 978 314 664 75.2 44.9 110.7
Total: 15581 6007 9574 56.6 39.4 79.1
Total Percent: 100% 38.5% 61.5% 100% 38.5% 61.5%
All “Parks/Recreation Areas” (14) 7700 2808 4892 39.7 26.2 56.8
All “Trails” (3) 4303 1459 2844 107.9 65.1 167.9
All “Marina/Preserves/Reserves” (3) 3578 1740 1838 84.2 75.7 83.1
Note: Under SMC parks management/designations Devil’s Slide is a “park” site
Table 23. Average visitor counts for all sites, by weekend and weekday, and time period
Average Visitor Count
Time of Day Total Count
Total Weekdays
Visitors Week-ends
All Sessions: Aver-age Visitor Count
Weekday Aver-age
Weekend Average
Morning 3378 1590 1788 38.4 26.9 61.7
Afternoon 7220 2549 4671 82.0 70.8 89.8
Evening 4983 1887 3096 51.4 54.3 77.4
Total: 15581 6007 9574 57.3 50.7 76.3

32 Visitor Use/Non-Use Parks Study 2015-2016
B) Intercept Survey (In-Park): There were no significant differences between respondents and non-respondents in their group size and sex. There was a significant difference in activities, in which bicyclists and joggers were more likely to refuse to answer the survey, versus hikers. Sites which were primary trail users, such as the Crystal Springs Trail, were significantly more likely to have refusals than were all the other locations, primarily because there were more bicyclist and joggers, than at parks or reserves.
Readers of this report should keep in mind that walkers/hikers at park and reserve locations are somewhat over-represented and bicyclists, joggers and trails are somewhat under-represented in the survey results. Nonetheless, these differences do not threaten the validity of the study findings. The results that follow are a sample of findings from the full survey report (provided to SMC parks dept. and available to others upon request).
Demographics (sample)
½ AGE: The average age was 50 years old and about 1/3 of visitors were between 35-64 years (approx. 20-21% each); less than 5% of respondents were between the ages of 18-24 years (n=102) and slightly more than 5% were age 75 or older (n=120).
½ SEX: Slightly more males (51.5%) than females (48.5%).
½ EDUCATION: Over 3/4 had a Bachelor’s degree or higher level of formal education.
½ HOUSEHOLD INCOME: Data reported in 2015 varied greatly among respondents, with 11% indicating less than $50,000 and nearly 40% reporting annual income over $125,000.
½ RACE: Primarily white (75%) followed by Asian/Asian American at 18.3%; nearly 12% Hispanic or Latino with less than 5% representing visitors self-identifying as American Indian/Alaska Native (1.5%), Black/African American (1.4%), and Native Hawaiian or Pacific Islander (1.4%)
½ LANGUAGE: After English, Spanish (39%) was the language spoken most frequently at home while Mandarin/Cantonese was second most frequent at over 18%. European languages of German, Italian, or French accounted for 8%. However, non-English speaking characteristics varied a great deal between park units. For example, 82% of Friendship Park users spoke a language other than English at home but only 4% of Quarry park respondents indicated this.
½ DISABILITY: About 3% of respondents indicated they had a person in their visitor group with a disability. The top two were “visual” and “mobility” (at 16% each). Walking, getting to the beach, and across creeks were the most common access problems encountered by persons with disabilities.
Visitor Characteristics
½ One in four were first time visitors, while a third (slightly less) had visited that particular park site over 50 times in the last year.
½ Over 1/3 of all visitors were traveling alone while approximately 2/3 were with family and/or friends.
½ Average group size for all visitors was approximately 3 people where almost 2/3 were San Mateo County residents; 38% of those people lived within one-mile of the park site where they were surveyed and the majority (62%) did not live within 1-mile.
½ Only 10% were from a state outside of California.
Table 24. Type of personal group
Type of Personal Group Percent Count
Alone 35.8% 864
Family 34.6% 835
Friends 16.8% 406
Family and friends 8.8% 213
Other 4.0% 96
Total: 100% 2414
Table 25. Visitors with commercial or other organized group
Type of Group Percent Count
Not with commercial or large organized group 91.6% 2,212
Organized or meet-up groups 2.6% 63
Family reunion of more than 25 people 2.6% 62
School/educational group 1.9% 45
Commercial fitness group 0.3% 8
Commercial guided tour group 0.1% 3
Other commercial group 0.9% 21
Total: 100% 2414

33Visitor Use/Non-Use Parks Study 2015-2016
How park information is obtained: The most frequently identified sources of information about the park/reserve/trail visited as shown in Table 26 were: Past experience; friend or family; the SMCP website, signs and the park brochure.
Table 26. Sources of information obtained about park/preserve/trail
Information Source Percent Count
Past experience in park/preserve/path 41.0% 1357
Friend or family member 23.4% 774
SMC parks website 7.6% 252
Signs along trail or highway 7.5% 249
Park brochure/map 4.1% 137
Live near park 3.7% 122
Talked with a SMC Parks staff person 2.7% 65
Use of cell phone/iPad/tablet/laptop in this park 2.6% 63
Guidebook 1.7% 42
Other Website or Social Media - Write In 0.9% 22
Visited SMC Parks office 0.8% 18
Called SMC Parks Dept. 0.5% 11
Other Source - Write In 0.3% 6
Google (30)
Bay Area Hiker (5)
News (5)
Total: 3158
Figure 12� Type of transportation used to arrive at park site
Dro
ve/r
ode
in a
Veh
icle
Wal
ked
Rode
a B
icyc
le
Arr
ived
by
Publ
ic T
rans
it (b
us, t
rain
, fer
ry)
Gro
up B
us
Oth
er -
Writ
e In
Air
Trav
el
All
Oth
ers
75
50
25
0
73.3%
20.9%
8.5%
0.3% 0.1% 0.2% 0% 0.6%
Transportation Type Percent Count
Drove/rode in a vehicle 73.3% 1778
Walked 20.9% 506
Rode a bicycle 18.5% 206
Arrived by public transit (bus, train, ferry) 0.3% 7
Group bus 0.1% 3
Other - Write In 0.2% 20
Jogged (13) Reasons for visiting: As shown in Figure 13 the primary reasons for visiting the site that day, in order of popularity, were: hiking/walking (nearly 50%), jogging/running, bicycling on paved trails, walking a dog, and the kids’ playground. Park-only visitors has similar primary reasons, but contrasted with trail users on scenic viewing and visitors to reserves on tide pooling. Furthermore, as also obtained through the follow-up survey, overall, users noted they visit the parks to improve their physical fitness, be with family/friends, connect with nature, improve mental well-being, dog walking, and experience scenic views.
About 3/4 drove to the park site, 21% walked, about 19% rode a bicycle, less than 1% surveyed used public transit

34 Visitor Use/Non-Use Parks Study 2015-2016
Figure 13� Top ten primary reasons for visiting, all parks, reserves or trails
Activities: The most popular land-based activities that were undertaken that day in the park/reserve/trail were: walk/hike, run/jog, bike on paved trails, picnic and walk dog. The most popular water-based activities were: relax on beach, tide pooling, beach activities, swimming/wading, and sunbathing. The most common nature-based activities were: relaxing outdoors, enjoy views, enjoy being with family/friends, nature walk, and explore outdoors. Other popular activities included meditation, using restrooms, taking a scenic drive and reading and attend SMCP program. These varied by whether it was a park, a reserve or a trail and by actual site. Furthermore, 80% of respondents (8 out of 10) who went camping felt it was a “good” or “exceptional value” (see Tables 27 through 29): Table 27. Participation in land-based activities
Land Based Activity Percent Count
Walk/Hike 72.3% 1746
Running/jogging 17.0% 411
Bike on paved trails 10.5% 254
Picnicking 9.7% 234
Walk dog or pet 7.7% 187
Kids playground 7.7% 185
Bike unpaved trails 4.7% 113
Play sports 2.6% 62
Ride horses 0.4% 10
Horseshoes 0.2% 5
Boat ramp/pier 0.2% 5
Archery 0.1% 2
I did not participate in any land activities 2.5% 61
Other - (e.g., Birding) 3.3% 12
Total: 3287
Table 28. Participation in water-based activities Water Based Activity Percent Count
Relax on beach 10.5% 254
Tide pooling 4.9% 117
Beach activities 3.9% 93
Wadding/swimming 2.5% 61
Sunbathing 1.9% 46
Fishing 1.3% 31
Kayaking 0.7% 17
Stand up paddle boarding 0.5% 11
Kiteboarding 0.1% 3
Sailing 0.0% 1
Other water activities 0.2% 47
Surfing (7)
Windsurfing (2)
I did not participate in water activities 82.7% 1997
Total: 2696
Table 29. Participation in nature-based activitiesNature Based Activity Percent Count
Relax outdoors 55.4% 1337
Enjoy views 56.6% 1366
Enjoy being with family/friends 39.9% 964
Nature walk 36.7% 887
Explore outdoors 34.4% 829
Wildlife viewing 28.6% 691
Wildflower viewing 19.0% 458
Bird watching 17.7% 426
Use restroom 0.0% 0.0
Photography/Art 12.8% 310
Other - Write In 5.0% 3
Did not participate in any nature-based activities 12.2% 295
Total: 7669
Feeling Welcome and/or Comfortable in the Parks / Interactions and User Conflicts: Overall, 9 out of 10 respondents were “satisfied” or “very satisfied” with their interactions with other visitors (Table 30). Findings show bikes on the trail and dogs off leash were the top two reasons for being “dissatisfied” or “very dissatisfied.” Other reasons were: people playing loud music, pushy ranger, and other people in our reserved campsite. Over 95% of respondents indicated they felt “safe” or “very safe” at the park site. Dogs, wild animals, not feeling welcome, bikes on the trail, and too few people were the five most frequent reasons for feeling “unsafe” or “very unsafe.” Other sample reasons for feeling unsafe (n=1 person each) included lack of presence of park staff/ranger, bugs/insects, felt vulnerable to attack and scary people encountered. Almost all respondents (80%) agreed the quality of
All Others - 19%
Bike Paved Trails - 7.0%
Bike Unpaved Trails - 1.5%
Walking Dog or Pet - 5.2%
Running/Jogging - 12.8%
Kid Playground - 4.8%
Picknicking - 2.9%
Walk/Hike 46.7%

35Visitor Use/Non-Use Parks Study 2015-2016
their overall park experience that day they visited and filled out the survey was “very good.” When asked what could be done to improve the quality and safety of their park experience the two responses were maintain the trails being overgrown and mitigate ticks.
Table 30. Level of satisfaction with interactions with other visitors
Rating Percent Count
Very Dissatisfied 2.2% 54
Dissatisfied 0.3% 7
Neutral 6.5% 156
Satisfied 28.9% 696
Very Satisfied 62.2% 1449
Total: 2362
Table 31. Level of feeling safe in the park
Rating Percent Count
Very Unsafe 1.3% 31
Unsafe 0.2% 5
Neutral 3.1% 74
Safe 23.7% 572
Very Safe 71.7% 1730
Total: 2414
Entrance Fees: As reflected in Figure 14 below, of the people who responded to this question, 80% indicated the value of their experience at the specific park visited was “good” (42.1%) or “exceptional” (37.9%). Less than 15% (n=52) noted the value was “average.” For the four people (2.5%) who rated this as poor, their reason cited was: it should be free, military should have discount or be free, and too expensive.
Figure 14: For entrance fees paid, what value was received?
Camping Fees: As shown in Figure 15, over 80% of respondents indicated they believe the value they get for their experiences based on camping fees is either “good” or “exceptional,” whereas 17% indicated the value obtained for the fees they pay is “average” and one person indicated the value is “poor” for the fees paid. The reason cited for being of poor value is too expensive.
Figure 15. Respondent evaluation of value for camping fees
C) Follow-up / Online Survey: All results for the online follow-up survey are also available on the full survey report. Of all visitors to the 20 SMCP sites completing the in-park survey, 948 people provided their email address and were therefore sent an invitation with a link to the follow-up survey by email five days after their intercept survey response; that data collection ended June 10, 2016. There were a total of 264 completed resulting in a
Not applicable/Did not spen money to enter the park or in the park - 2.8% I did not go camping today - 1.1%Poor value - 2.5%
Poor value - 1.1%
Average value - 14.7% Average value - 17.6%
Exceptional Value 49.5%Average
Value 17.6%
Exceptional Value 37.9%
Good Value 42.1%

36 Visitor Use/Non-Use Parks Study 2015-2016
response rate of 27.8%. The actual follow-up survey is located in Appendix G. The 264 responses allows for a 95% confidence level with a +/- 10% margin of error for the follow-up survey analysis results. There were not enough completed follow-up surveys to allow a statistical comparison between different parks/preserves or the use of Chi Square statistics in cross-tabulations.
As previously mentioned, the follow-up survey was designed to allow for more open-ended questions to gather data on respondent evaluation of facilities and services used; staff encounters; issues at the park; willingness-to-pay for potential SMCP fee increases; information they would like to learn more about; improvements and programs of interest in the future; and their willingness to assist SMCP in the future. The results section that follows provides core findings relating to the fees and willingness to pay questions; supporting the SMCP Department goals to explore and consider future decisions regarding sources of revenue is paramount.
FEES/COSTS/REVENUE GENERATION: The San Mateo County Parks Department seeks to enhance revenue generating potential of parks and facilities to support long-term financial sustainability; achieving this, while continuing to provide access and programs to meet a wide variety of visitor needs, is vital. In addition to this comprehensive visitor use survey, CHM Government Services (CHMGS) worked with SMCP to identify the components of a revenue generation program. Five key aspects include: user fees, donations, sponsorships, park enterprise, and commercial services.
The area and questions about user fees are most closely aligned with this visitor use study. CHMGS has supported SMCP in developing a conceptual framework to support user fee pricing as well as prices/fees for its park enterprise (Coyote Point Marina), concessions, and permits revenue programs. These initiatives are ongoing and findings from both phases of this current study will help inform future decisions.
Park Passes: Visitors were asked their opinion about the potential for increases in daily and annual park passes, and how fee increases might impact their visitation to San Mateo County Parks. Tables 32 through 34 show results for these questions. Additionally, if the parks department were to institute a “premium pass,” respondents were told such pass may include entry into special member events and one free night at a campsite. The extra price above the annual pass would be tax deductible and go to the future of county parks. As depicted in Figure 16, results show 52% of survey respondents believe a “premium pass” is a good idea. While 30% indicated the “Don’t Know,” 18% (less than 50 people) reported “No, this pass is not a good idea.”
Table 32. Impact of potential daily park pass price increases on visitation
If X Price Increase, Would You … Percent
$1�00
Come as often 67.8%
Not come at all 8.0%
$2�00
Come as often 42.0%
Not come at all 13.6%
$3�00
Come as often 25.0%
Not come at all 20.1%
$4�00
Come as often 20.1%
Not come at all 33.0%
Table 33. Impact of potential annual park pass price increases on visitation (current annual pass is $66.00)1
If X Price Increase, Would You… Percent
$3�00
Will purchase 45.5%
Will not purchase 24.5%
$5�00
Will purchase 40.6%
Will not purchase 27.3%
$10�00
Will purchase 19.3%
Will not purchase 45.0%
$20�00
Will purchase 9.2%
Will not purchase 60.6%
1 The current annual park pass rate is $60, not the amount ($66) stated in the survey. Nonetheless, respondents answered this question about “potential increase” accordingly.

37Visitor Use/Non-Use Parks Study 2015-2016
Figure 16. Respondents who think a potential “premium” park pass is a good idea
Table 34. Likelihood of purchasing premium park pass at following costs above the regular annual parks pass
If X Price More for Premium Pass, Would you …
Percent
$10
Very likely to purchase 40.0%
Not likely to purchase 22.4%
$25
Very likely to purchase 18.5%
Not likely to purchase 42.0%
$50
Very likely to purchase 10.2%
Not likely to purchase 63.3%
$75
Very likely to purchase 4.1%
Not likely to purchase 74.1%
$100
Very likely to purchase 2.0%
Not likely to purchase 83.8%
$250
Very likely to purchase 0.5%
Not likely to purchase 90.3%
More than $250
Very likely to purchase 0.5%
Not likely to purchase 89.9%

38 Visitor Use/Non-Use Parks Study 2015-2016
Camping Fees and Potential Increases: Trends show camping across the state and the U.S. is on the rise, especially “family camping.” Respondents completing the follow-up survey were asked what impact their desire to camp in San Mateo County Parks would have if the camping fee price(s) were to increase and, if so, would they be willing to camp “just as often” or “much less” depending on the price increase. As shown in Table 35, nearly 96% of park users indicated they would “camp just as often” if the fee increased by $3.00 and 3/4 users (75%) noted the same response if the fee were to increase by $5.00. Findings show the majority of respondents would “camp much less” if such fee were to increase by either $10 or $20.
Table 35. Impact of potential camping fee price increases on camping levels (current camping fees vary by site)
If X Price Increase to Camp, Would you… Percent
$3�00
Camp just as often 95.8%
Camp much less 0.0%
$5�00
Camp just as often 75.0%
Camp much less 0.0%
$10�00
Camp just as often 16.7%
Camp much less 16.7%
$20�00
Camp just as often 4.2%
Camp much less 50.0%
Park Services and Who Should Pay: Respondents were invited to share who they believed should pay for the following 10 parks department services: 1) Purchase of land for new parks 2) Protecting natural resources from damage by users 3) Ensuring park resources are preserved for future generations 4) Campgrounds 5) Hiking trails 6) Bike trails 7) Picnic areas 8) Swimming beaches 9) Cabin rentals 10) Park naturalist to teach visitors about park resources
Additionally, visitors completing the online follow-up survey were asked whether or not they would support SMCP department to charge higher fees for certain situations in order to help sustain and maintain those facilities and services (see Table 36).
Table 36. Who should pay for each of the services listed below? Who should pay for what? (Paid by …) Percent
Purchase land for new parks
entirely by SMC taxpayers 25.5%
equally by SMC taxpayers and visitors 31.4%
entirely by park visitors 3.9%
Protecting natural resources from damage by users
entirely by SMC taxpayers 15.1%
equally by SMC taxpayers and visitors 36.7%
entirely by park visitors 8.8%
Ensuring park resources are preserved for future generations
entirely by SMC taxpayers 21.1%
equally by SMC taxpayers and visitors 35.1%
entirely by park visitors 4.0%
Campgrounds
entirely by SMC taxpayers 5.9%
equally by SMC taxpayers and visitors 28.1%
entirely by park visitors 20.7%
Hiking trails
entirely by SMC taxpayers 16.5%
equally by SMC taxpayers and visitors 41.0%
entirely by park visitors 5.6%
Bike trails
entirely by SMC taxpayers 13.2%
equally by SMC taxpayers and visitors 37.6%
entirely by park visitors 11.6%
Picnic areas
entirely by SMC taxpayers 10.8%
equally by SMC taxpayers and visitors 42.6%
entirely by park visitors 10.0%
Swimming beaches
entirely by SMC taxpayers 12.5%
equally by SMC taxpayers and visitors 40.7%
entirely by park visitors 8.1%
Cabin rentals
entirely by SMC taxpayers 4.4%
equally by SMC taxpayers and visitors 15.3%
entirely by park visitors 39.8%
Park naturalist to teach me about park resources
entirely by SMC taxpayers 13.9%
equally by SMC taxpayers and visitors 37.8%
entirely by park visitors 12.7%
Park naturalist to teach kids about park resources
entirely by SMC taxpayers 21.8%
equally by SMC taxpayers and visitors 30.2%
entirely by park visitors 8.7%

39Visitor Use/Non-Use Parks Study 2015-2016
The majority of respondents believe that all services they were asked about (per Table 36) should be paid “equally” by SMC taxpayers and visitors, alike. For cabin rentals, however, nearly 40% believe that this service should be paid entirely by park visitors.
Table 37� Support for charging higher fees in certain situations for maintaining services at current level
Higher Fee Percent “Yes”
Higher entrance fee at busier parks 48.4%
Higher entrance fee on weekends at busier parks 56.9%
Higher camping fee on weekends at busier parks 65.0%
Higher camping fee for more popular campsites within a park 63.4%
Suggestions for SMCP from Park Visitors (onsite & follow-up survey online)In addition to understanding visitor satisfaction, motivations, use patterns and preferences, as well as how and where they would support San Mateo County Parks Department, survey respondents were asked to provide ideas for future services, programs and general overall improvements that they would like to see. The details below provide examples and are also reflected in the recommendations section accordingly. Table 38 and Figures 17 and 18 depict these findings.
Table 38� Suggested Facility Improvements
Improvement Count
Restroom additions, improvements, clean 23
Trail improvements, resurfacing, better maintenance 15
Additional signs or improvements 12
More drinking fountains 12
More garbage cans 5
More convenient parking 4
Add or improve kids playground 3
More bike trails 2
Remove old fences, utility equipment 2
Install rip rap to prevent coastal cliff erosion in parks 2
Total: 76
Figure 17. Programs of interest in the future

40 Visitor Use/Non-Use Parks Study 2015-2016
Figure 18. Services you would like in the future

41Visitor Use/Non-Use Parks Study 2015-2016
Recommendations“Wild Places & Friendly Spaces”
The County of San Mateo Parks Department has ongoing interest in understanding park visitors’ use patterns, preferences and needs, as well as its non-visitors’ constraints and barriers. In order to better understand community desires regarding park programs and services, this project aimed to examine specific communities to learn about residents’ attitudes and perceptions of their county parks, including emotional connections, evaluation of available facilities, desired improvements, willingness-to-pay, as well as any barriers/access issues that may prevent them from visiting parks more frequently, or at all. The components featured in this report provide several lessons and messages that can be used by SMCP to effectively understanding park visitors’ use patterns, preferences and needs, as well as its non-visitors’ constraints and barriers. In this section we detail recommendations supported by our findings.
1� Information and Communication: What Does the Future Hold?While many people use county parks for various activities, awareness of SMCP regulations and events is low. Focus group participants expressed an overall lack of effective communication from the SMCP Department and were unaware of how to obtain information about SMCP. Park visitors overwhelmingly reported they learned about the parks from past experiences or family/friends. It can be assumed that the SMCP website is not a well-known or used source of information for those who participated in this study. Proposed ideas to address gaps in communication and information dissemination include:
½ Consult with community groups to create authentic activities that match the desires of the audience as determined by engagement best practices (e.g., those program and events will resonate more, and are more likely to have an impact to the target audience).
½ Conduct outreach events, classroom education, field trip opportunities, and tabling to better engage with the community.
½ Increase awareness of the social and cultural differences between communities as disparate social groups have varying preferences, use patterns, and desires.
Popular programs in one community may not be favorable for another. Different communities traditionally use parks and open spaces for different reasons; thus, communicating about park infrastructure and facilities should match the desires of the park’s audience (e.g., It was noted that camping is not traditionally a popular activity for the Latino community in Pescadero, despite the close proximity to Memorial Park campgrounds).
½ Promote county parks by designing community specific programs that utilize local parks’ diverse recreational resources, infrastructures, and environments. These programs should accommodate all skill levels, and help reach a variety of users.
½ Conduct outreach through schools and youth centers to create more youth programs and activities designed to empower youth, support responsible development, and foster a sense of park stewardship.
½ Engage younger generations through social media campaigns and contests to promote active use of parks.
½ Further promote the SMCP website as a primary informational resource. Consider polling community use of website to validate ease of navigation to find information and develop site in multiple languages.
½ Promote/advertise programs, events, etc. in various forms of ethnic media (see NewAmericaMedia.org for sample local sources).
½ Mail or drop off printed park materials (e.g., brochures, special event fliers, etc.) to keep locals informed of park opportunities, activities, events (i.e., community centers and recreational centers are a hub of resident use).
½ Improve information about activities or events within park sites as well as information provided on outdoor display boards about the nature or history of the areas (lack of these factors were cited as reasons for being “unsatisfied or very unsatisfied” by survey respondents).
½ The most desired method to receive information about SMCP by survey respondents was overwhelmingly by email, followed by SMCP website, and signs and maps at the park.
2� Advancing SignageInformational signage is a powerful resource for educating park visitors, and helps connect visitors to their surroundings. Park users acknowledge the importance of informational signage and interpretive signs, and believe they enhance the visitor’s experience.
½ Review park signs, maps and trail markers along the trails, and directional signage and determine upgrades and revisions needed to maintain high quality.
½ Clearly communicate park regulations and important information using up-to-date and multi-lingual signage that is strategically placed in multiple locations to enhance the visitor experience.
½ Change educational signage (i.e., waysides/interpretive signs) seasonally to maintain relevance throughout the year which could increase learning (e.g., environmental and natural resource education).

42 Visitor Use/Non-Use Parks Study 2015-2016
3� Breaking Down BarriersResearch over several decades continues to show a variety of constraints to park visitation, particularly around the access to parks using mass transit and limited parking. This study resulted in similar barriers and SMCP can help mitigate these within the unique location and geography of San Mateo County parks.
½ Shuttle: Track & evaluate proposed Edgewood & Wunderlich Parks shuttle – seek to expand to other parks.
½ Institute partnership with San Mateo County’s municipal transportation agency to include more stops at county parks and promote to different neighborhoods accordingly. Lack of public transportation to county parks is a known visitation barrier.
½ Develop a County parks map to include public transportation options to various parks.
½ Provide incentives to encourage cycling, use of public transportation, or other transit options (e.g., carpooling) to county parks.
Lack of parking is an additional issue at popular parks. If park users are able to use public transit to travel to county parks more efficiently, demand for parking could decrease.
4� Speak the Same Language: Dissolve Language BarriersLanguage barriers pose one of the biggest factors inhibiting communication between SMCP and park-users. Many communities use English as a second language. In these communities sources of park information expressed in English, such as signage, brochures, and even conversations with park staff, are ineffective at educating park-users about rules, regulations, and safety hazards. Furthermore, language barriers make it difficult for communities to learn about park programs, events, and activities.
½ Hire bilingual staff that can speak the first language of the district to be served.
Employing Spanish speaking staff will best serve the nearly 140,000 residents (20.3%) across San Mateo County who speak Spanish as their first language. (source: StatisticalAtlas.com)
½ Employ and train staff that are culturally competent as an effective way to address race, socio-economics and power dynamics to more genuinely connect people to their parks.
½ Translate informational literature and park signage into multiple languages, most importantly Spanish. Post translated literature on SMCP’s website.
5� The Messenger Matters: Develop a Positive Presence in the Parks and the CommunityFocus group participants suggest SMCP increase their physical presence in the parks and in the community to promote feelings of safety in case of an emergency, as well as expand outreach and enhance learning. Over 60% of survey respondents were “satisfied” with the availability of park staff, and 75% for having positive interactions with park staff.
½ Ensure and increase park staff presence in parks to share knowledge and provide information about parks (i.e., lack of communication contributes to a knowledge deficit for park users).
½ Enforce park rules, regulations, assure safety, and resolve user conflicts.
½ Create an opportunity for “Ask a Ranger” day at local community/recreation centers to provide opportunities for Q&A in neighborhoods where increased visibility of parks is desired (e.g., Sienna Youth Center, My Puente).
6� What the People Want: Activities, Programming, and Services Everyone has their personal preferences for what activities and programs they desire for self, friends, and family. The ideas summarized below comprise a list of requests from residents of the San Mateo community.
½ Create activities and programs geared towards youth, environmental education and promoting parks (e.g., off season programs for youth, hike-a-thons, and movie night in the parks).
½ Partner with local youth organizations to engage children and youth in promoting SMCP through artistic and creative outlets such as art, video contests, and other.
½ Implement annual events to celebrate traditions and local communities’ cultures.
½ Institute an annual or monthly county parks “frequent user program” such as stamp card (e.g., visit 3 times, get 1 free entry).
½ Expand promotion of volunteer events to high schools and businesses and/or companies in various districts.
½ Organize and promote special events and unique ranger-led activities in parks considered “lower use.”
½ Review current program offerings and consider addition for the following (either more often or at all): nature walks, environmental education, outdoor evening programs (campfire, night sky, etc.), history tours, and children’s programs.
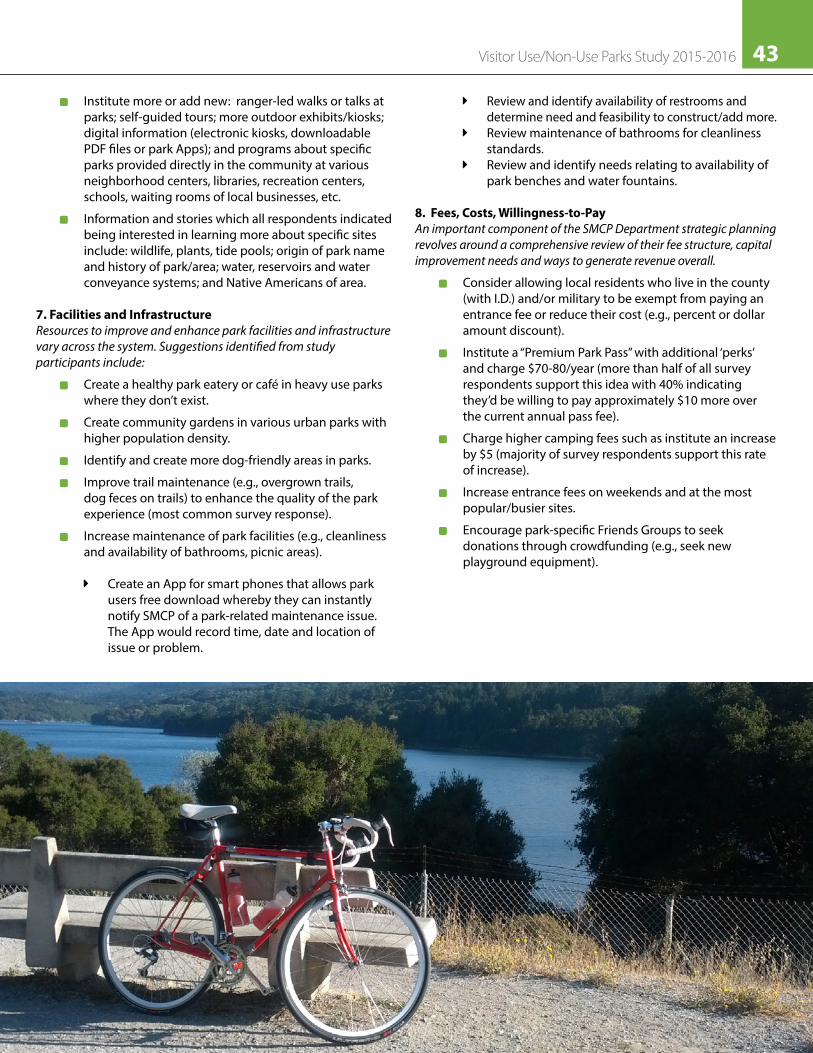
43Visitor Use/Non-Use Parks Study 2015-2016
½ Institute more or add new: ranger-led walks or talks at parks; self-guided tours; more outdoor exhibits/kiosks; digital information (electronic kiosks, downloadable PDF files or park Apps); and programs about specific parks provided directly in the community at various neighborhood centers, libraries, recreation centers, schools, waiting rooms of local businesses, etc.
½ Information and stories which all respondents indicated being interested in learning more about specific sites include: wildlife, plants, tide pools; origin of park name and history of park/area; water, reservoirs and water conveyance systems; and Native Americans of area.
7� Facilities and InfrastructureResources to improve and enhance park facilities and infrastructure vary across the system. Suggestions identified from study participants include:
½ Create a healthy park eatery or café in heavy use parks where they don’t exist.
½ Create community gardens in various urban parks with higher population density.
½ Identify and create more dog-friendly areas in parks.
½ Improve trail maintenance (e.g., overgrown trails, dog feces on trails) to enhance the quality of the park experience (most common survey response).
½ Increase maintenance of park facilities (e.g., cleanliness and availability of bathrooms, picnic areas).
Î Create an App for smart phones that allows park users free download whereby they can instantly notify SMCP of a park-related maintenance issue. The App would record time, date and location of issue or problem.
Î Review and identify availability of restrooms and determine need and feasibility to construct/add more.
Î Review maintenance of bathrooms for cleanliness standards.
Î Review and identify needs relating to availability of park benches and water fountains.
8� Fees, Costs, Willingness-to-PayAn important component of the SMCP Department strategic planning revolves around a comprehensive review of their fee structure, capital improvement needs and ways to generate revenue overall.
½ Consider allowing local residents who live in the county (with I.D.) and/or military to be exempt from paying an entrance fee or reduce their cost (e.g., percent or dollar amount discount).
½ Institute a “Premium Park Pass” with additional ‘perks’ and charge $70-80/year (more than half of all survey respondents support this idea with 40% indicating they’d be willing to pay approximately $10 more over the current annual pass fee).
½ Charge higher camping fees such as institute an increase by $5 (majority of survey respondents support this rate of increase).
½ Increase entrance fees on weekends and at the most popular/busier sites.
½ Encourage park-specific Friends Groups to seek donations through crowdfunding (e.g., seek new playground equipment).
44 Visitor Use/Non-Use Parks Study 2015-2016
.
Discussion & ConclusionsWe have presented a compelling picture of both use and non-use of San Mateo County parks as illustrated in these results of a comprehensive two-phase study. Four focus groups in four different geographic areas county-wide occurred in fall 2015 with 48 people across cultural and socioeconomic lines. Between April and early June 2016, nearly 16,000 visitor counts, more than 2,400 intercept/in-park, and over 260 follow-up surveys were conducted in 20 of the 22 designated county parks.

45Visitor Use/Non-Use Parks Study 2015-2016
The most popular land, nature, and water-based activities were explored along with mode of transportation, primary reasons for visiting the park site, quality and value of the experience, satisfaction measures (e.g., program, facility), user interactions and conflicts, and perceived safety. Visitors willing to respond to additional questions were also invited to complete an online survey with added items relating to obtaining information sources, evaluation of park facilities and suggestions for improvements, ideas for future programs/activities, issues encountered (if any), interest in supporting (e.g., volunteering) SMC Parks, and willingness-to-pay/support for potential fee increases. These types of questions along with constraints and barriers provided the framework for the focus group interviews allowing for an in-depth conversation with residents in traditionally underserved communities.
Based on a comparison of demographic characteristics of intercept survey respondents and the 2014 San Mateo County population characteristics from the American Community Survey (U.S. Census.gov), differences are assumed to be due primarily to actual visitation patterns, not the survey method. Results, for example, showed park visitors were slightly less likely to be female; half as likely to be Hispanic/Latino (11.7% versus 25.4% in SMC); half as likely to be of any race besides White; and three times less likely to speak a language other than English at home. The second largest racial group in SMC is Asians at 26% of the population, yet visitors self-identifying as Asian was 18%. Furthermore, park respondents were on average older: 50 years versus the average age of 39 years in the 2014 San Mateo County population. Younger adults, ages 18-24, were much less likely to be a visitor (4.4%) to SMC, compared to the county population of 11%; similarly individuals age 75 or older were 5% of visitors compared to 7% of the SMC residents. The median household income for county residents in 2014 was $75,000-$99,000 as compared to a median of $100,000-$124,000 for park visitors. Park visitors were 30% more likely to be adults with a bachelor’s degree or higher formal education, compared to the county population. In summary, non-visitors were more likely to be Asian, Black, Hispanic or Latino; speak a language other than English at home; have lower household income; and have lower formal education levels.
The characteristics of non-visitors to San Mateo County Parks are similar to what studies across the state and the nation have found. The continued under-representation suggests additional outreach efforts, consideration of developing innovative programming and improvements to facilities (as needed) are essential to encourage visitation to county park sites by a broader spectrum of county residents. What are the barriers to visitation, and how to best overcome these, were key subjects of the first part of this two-phase research and findings corroborate with a variety of literature on similar communities. Recommendations are based on this comprehensive study and from many suggestions discussed in the research literature. The proposed recommendations will support SMCP moving forward in positive directions as they continue strategic plan implementation.
The focus groups were a qualitatively sound method and an effective approach for tapping into the attitudes, perceptions and experiences of a typically untapped audience. The survey method provided a scientifically valid quantitative assessment during a limited spring time period and it would be beneficial to complete another three seasons of data collection in the near future to determine if seasonal visitors and visitation patterns change significantly. This mixed method approach fosters greater community participation and empowers local residents in the process of offering park-related feedback and ultimately contributing to management decisions. Ideally this study will be performed every 5 to 10 years to evaluate differences over time and to indicate the efficacy of any new initiatives by the San Mateo County Parks Department. Additionally, the parks department could consider studying park partners and potential new partners to help leverage some of the needs, desired goals, and the potential for supporting the strategic plan in deep and ongoing ways.
These findings support results of other research studies verifying there are different recreation behaviors and preferences across demographic and social groups. To remain relevant in a culturally diverse environment such as the California population, San Mateo County park staff should continue to be aware of the differences and have appropriate strategies to train staff across employment levels while also striving to attract a more diverse visitor profile. The core values of the SMCP department should be maintained, and services and programs that appeal to audiences of different ethnic and racial backgrounds should continue to be implemented.
We have provided a set of recommendations to support management and programmatic decisions. In an ideal world, everyone would have all the amenities, finest facilities, and greatest activities possible across the county. With limited resources this isn’t always feasible yet with a vision, fiscal support, and solid leadership, San Mateo County parks can become a world class park system if the parks department can harness the results and implement proposed recommendations presented in this report to arrive at potential solutions that can be both sustainable and equitable. SMC park leaders and field professionals are urged to continue studying the unique characteristics and situations presented by the core issues as well as promising new park opportunities.

46 Visitor Use/Non-Use Parks Study 2015-2016
APPENDIX ASMC Department of Parks – Agency Priorities
64
FISCAL YEAR 2015-17 PRIORITIES
• Establish innovative use of solar power, alternative energies and water conservation
• Establish volunteer stewardship corps• Expand programs focused on youth,
health and environmental literacy with partners
• Update technology, equipment & infrastructure
• Expand presence in social media and interactive media
• Develop and implement large, landscape scale fire fuel reduction plans
• Establish baseline data sets and assess natural resources
• Apply a business approach to park management to increase revenue streams.
• Complete Master Plans for new parks d dd
FISCAL YEAR 2013-15 HIGHLIGHTS
• 2 million visitors• 1,381 additional acres acquired• 6.88 miles of new trails• Completion on 21 capital projects• Completion of the Parks Five Year
Strategic Plan• Transitioned to a stand-alone department• Construction of Dock 29• 30,000 volunteer hours• Devil's Slide Coastal Trail Ambassador
Program• Habitat restoration• Improvement of Coyote Point Marina fuel
dock• Wi-Fi at Coyote Point• Upgrade of Marina main restroom• Improve ball fields and tennis courts at
Flood Park• Connector Trails & parking nodes at
Devil's Slide• Improve application technology• Enhance sustainable funding
APPENDIX A
SMC Department of Parks – Agency Priorities
Source: https://performance.smcgov.org/reports/CountyParks-3900B

47Visitor Use/Non-Use Parks Study 2015-2016
APPENDIX BVisitor Use/Non-Use Study Information Sheet
2015
-201
6
OUR TEAM: SAN FRANCISCO STATE UNIVERSITYNina S. Roberts, PhD, Professor & Principal Investigator, Dept. of Recreation, Parks, & Tourism; 415.338.7576; [email protected] Patrick Tierney, PhD, Professor & Research Associate, Dept. of Recreation, Parks, & TourismRuby Turalba, MPH, Research Associate & Lecturer, Department of Health Education Ryan Tachibana, Undergraduate Research Assistant, Environmental Studies Program Lindsey Marsh, Undergraduate Research Assistant, Department of Psychology, minor in Outdoor Recreation
Visitor Use and Non-Use at San Mateo County Parks: Preparing for the FutureVisitor Use and Non-Use at San Mateo County Parks: Preparing for the FutureVisiting parks has many benefits including improving health and wellness. This project aims to expand recreational services to meet the needs of your community. Find out how!
OVERVIEW & BACKGROUNDOutdoor recreation plays a vast and inevitable role in our lives across California and the nation. Consequently, research informs the management and delivery of parks and recreation opportunities across both public and private sectors. The San Mateo County (SMC) Parks Department has been in operation for more than 90 years and includes 20 parks spanning more than 17,000 acres. On average, 1.7 million visitors a year enjoy amazing habitats to recreate, spend time with their family, friends, and neighbors, and learn about the county’s rich natural, historical and cultural resources. To address the recreational needs of their diverse and growing population, SMC Parks Dept., in partnership with San Francisco State University, is conducting a study of visitor use and non-visitor constraints. The overarching purpose is to examine attitudes, experiences, use patterns, and preferences of park users and identify barriers of non-users or less frequent visitors. Researching both visitor use and constraints will help determine how SMC Parks are supporting their 2013-2018 strategic plan including the Parks Commission addition of “position parks as a community resource for health-focused settings, use, and activities.” Generally, four priorities include:
1. Recreation Opportunities2. Environmental Protection Programs3. Interpretive and Education Programs 4. Volunteer Programs and Community
Engagement
PROJECT GOALS1. Understand visitor desires and
preferences for park facilities, programs/services, fees, and other related resources that meet the needs of changing populations.
2. Learn how people obtain their information about parks (e.g., communication channels, media, messaging) and determine how best to expand social and interactive media presence in the community.
3. Identify barriers preventing underserved/non-traditional communities from visiting SMC parks.
4. Enhance program partnerships regarding youth, health, and environmental literacy.
5. Provide ideas for new programs and facilities to enhance quality of the park user experience.
METHODOLOGY & OVERALL APPROACHIn addition to reviewing the literature and background reports from SMC Parks Dept., a two-phased approach, both qualitative and quantitative, will guide this study.
Phase I: Plan and conduct focus groups from September through November 2015 to examine barriers and constraints to park use
• Collaborate with local community leaders to host interview session and recruit focus group participants from predominantly culturally diverse and underserved populations.
• Implement focus groups at different county locations to ensure mixed representation.
Phase II: Conduct an on-site intercept survey at 10 of 20 park locations exploring visitor attitudes, perceptions, and future recommendations
• We will explore user behaviors, recreational desires, willingness to pay, perceived safety, etc.
• Volunteers will be trained to administer surveys at various trailheads employing a random sample technique to seek heterogeneity of responses.
Daly City
Pacifica
Millbrae
San Mateo
San Carlos
Menlo Park
La Honda
Pescadero
Half Moon Bay
This study will assess visitor satisfaction, motivation, future demands, and provide new data for decision making. We will also offer recommendations for park programs, facilities, and policies, and innovative ways to enhance community engagement and access.
Although park visitor use research has occurred for many decades, this is the first study of its kind for the SMC Parks Dept. Outdoor recreation spaces function as a conscious tool for community revitalization in many ways including resources for economic development, safe spaces, personal wellness, community engagement, help maintain green infrastructure vital for environmental sustainability, aid children in learning, promote public health, and provide a unique setting for arts and cultural programs.
For more information about San Mateo County Parks, Carla Schoof: (650) 599-1306
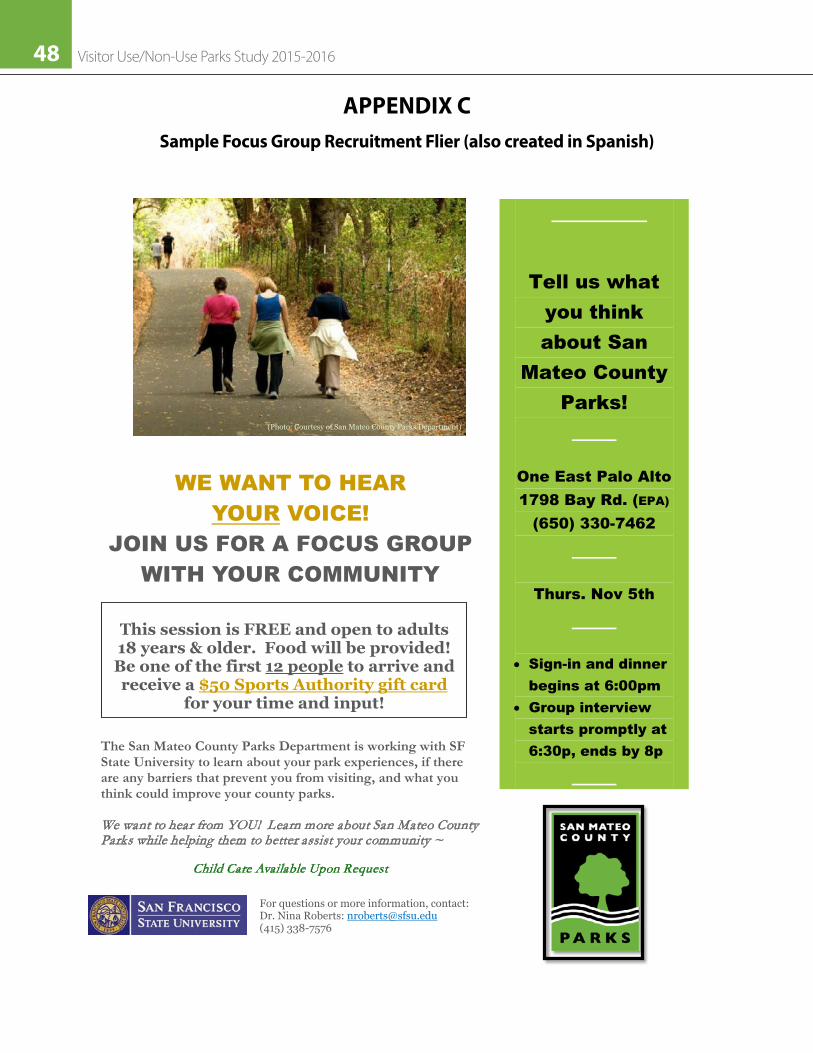
48 Visitor Use/Non-Use Parks Study 2015-2016
APPENDIX CSample Focus Group Recruitment Flier (also created in Spanish)
WE WANT TO HEAR YOUR VOICE!
JOIN US FOR A FOCUS GROUP WITH YOUR COMMUNITY
The San Mateo County Parks Department is working with SF State University to learn about your park experiences, if there are any barriers that prevent you from visiting, and what you think could improve your county parks. We want to hear from YOU! Learn more about San Mateo County Parks while helping them to better assist your community ~
Child Care Available Upon Request
Tell us what you think about San
Mateo County Parks!
One East Palo Alto1798 Bay Rd. (EPA)
(650) 330-7462
Thurs. Nov 5th
• Sign-in and dinner begins at 6:00pm
• Group interviewstarts promptly at 6:30p, ends by 8p
This session is FREE and open to adults 18 years & older. Food will be provided! Be one of the first 12 people to arrive andreceive a $50 Sports Authority gift card
for your time and input!
For questions or more information, contact:Dr. Nina Roberts: [email protected](415) 338-7576
(Photo: Courtesy of San Mateo County Parks Department)

49Visitor Use/Non-Use Parks Study 2015-2016
APPENDIX DFocus Group Protocol & Interview Questions
67
APPENDIX D
Focus Group Protocol & Interview Questions
Equipment & Supplies Needed1) Sign in sheet2) Participant incentive log / accounting sheet3) Name tags4) Protocol copies5) Question copies6) Audio recording device 7) Gift certificates8) Visual charts, graphs, maps & brochures 9) Writing utensils: pens, pencils, sharpies 10) Money for caterer 11) Mailing list sheet
* * * * * *Welcome & IntroductionsHi, my name is [facilitator name] and this is [note taker’s name] from SFSU [student major/department]. Thank you for taking the time to talk to us today and agreeing to be part of this focus group. We’ll do group introductions regarding who you are in a few minutes. This conversation will last about an hour and a half and will be recorded. We would like to record this conversation so we can use the recording to transcribe notes. The recording will be kept in a secure location and will not be used for any other purpose other than this project. No names will be associated with any of the comments you make during this interview. When you signed in today, there was a number next to your name, you’ll use that which I’ll explain in a moment. [Ask if anyone has any issues/problems with being audio-taped].
I will be leading the conversation today and [note taker’s name] will be taking notes. I am first going to go over a few details before we start. If you have any questions, please ask as they come up.
Purpose of the Focus GroupWe are working in partnership with San Mateo County Parks Department to better understand park users’ attitudes, experiences, use patterns, and preferences and to identify barriers/constraints of non-users or less frequent visitors. The information you share will help San Mateo County Parks determine how well they are supporting their strategic plan and contributing to their long-term goals. In addition, the information you provide can help improve existing park resources and services to meet community needs. Your participation is key as this group represents the ideas of [location within the county]. We welcome your input and your voice matters to the parks department so we need you to be honest with us and share your thoughts and opinions openly.
GuidelinesHas anyone ever participated in a focus group? [Ask for show of hands]. For some people being in a focus group can be a new experience. We’ll first discuss general ground rules that

50 Visitor Use/Non-Use Parks Study 2015-2016
68
can help ensure a safe environment where everyone’s ideas are shared and valued, and to ensure we capture what everyone says on the recorder and in our notes. Again, your name will not be attached to your comments, only a number.
1. WE WANT YOU TO DO THE TALKING. We need everyone to participate and talk to each other as you are comfortable. I may call on you if I haven’t heard from you in a while.
2. THERE ARE NO RIGHT OR WRONG ANSWERS. Every person’s experiences and opinions are important. We want to hear what each of you think and feel about parks, in general, and within SMC in particular. If you’re not familiar with parks in SMC, respond based on your knowledge of whatever parks come to mind for you. You don’t need to agree with others, but please listen respectfully to different points of view. If you do agree with what someone says, please speak up, rather than nodding your head or gesturing in some other way. This helps us capture agreement in the notes. Also, if someone else says something that reminds you of something or sparks a thought, please feel free to follow their comments with your own.
3. WHAT IS SAID IN THIS ROOM STAYS HERE. Everything you tell us today is anonymous. That means we will not share anything you say with your name attached.While we might use quotes or ideas that you share, as mentioned, we will never use your name in any way.
4. ONE MIC/1 NBR: Please speak one at a time – this will help us capture everyone’s thoughts and opinions. Before you make your comment, simply state your number first then go for it. For example, I may raise my hand and say, “Number five: I think that parks need to have more…”
5. STEP UP STEP BACK. If you have shared a lot, step back to allow others to share.Are there any questions before we begin?
Icebreaker: Let’s go around the room and introduce ourselves then we’ll turn on the recorder after this. Please state your first name and your favorite park in SMC and why. If you’re not familiar with your county parks, think of any park you’ve been to that you would consider to be one of your favorites anywhere in CA (and why?)
[Student assistant turns on digital recorder and begins taking typed notes on laptop].
Discussion Questions, Tier 1 - (As we move forward, it would be best to reply as it relates to SMC, if you’re not able to that’s fine. Comments about any park experience are fair game).
1. In the last 6 months to 1 year, how many times have you visited any San Mateo county park? [frequency]
2. Please share sample activities you like to do in parks and what you have enjoyed or liked about those parks. [use/experience]a) What have these experiences meant to you? How did it make you feel in terms of being in the outdoors? b) Have you ever attended any activities or programs led by park ranger? Please share your thoughts on these activities/programs.
3. How have you heard about the parks? [info /communication]a) Where do you find information about the parks and its programs?

51Visitor Use/Non-Use Parks Study 2015-2016
69
b) What are some other ways SMC Parks Department can best communicate with you in the future?
4. Do you feel welcome, safe or comfortable in parks? If yes/no, please tell us why or why not. [comfort/welcome]
5. If you haven’t had as many opportunities to visit or use the county’s park, tell us why? What were some barriers for you or your family to visiting the parks? [constraints]a) Park staff representation – Do you feel that there are people who work in the park that represent your community or who you can relate to and feel comfortable with? What makes you feel this way? (Do you notice the race or gender, for example of park staff and does that matter to you at all?)b) Transportation factors – is getting to parks an issue for you? How do you typically visit parks or how would you get there?c) If “time” is an issue, tell us more, why?d) Do rules/park policies-regulations impact your experience?e) Are park-related fees/costs a barrier to visiting (e.g., entrance, camping, food, gas, equip)
6. Are you familiar with Bonds or Measures in San Mateo County? A percentage of the general fund, Measure A (.05c, 10-year sales tax initiative), donations/grants, and park fees to help pay for parks & programs. How would you like this money to be spent? Anything that comes to mind for you relating to your county parks!? [fiscal/$]a) Any ideas for other sources of funding – what might you suggest and why?b) Would you be willing to pay an additional fee for special programs, such as educational events, guided hikes, movie nights, etc? If yes, what are you willing to pay (if stuck, would you pay $10-15 more).
7. What do you think about the natural environment? How does the natural environment affect/impact your experience? [environmental literacy]a) How does environmental education/nature resources influence your experience? (such as educ. signage, visitor centers/science center, trail maps, brochures about flowers/wildlife).
8. Have you ever volunteered with SMC parks (programs, resource management, etc). If yes, tell us what you did/where? What did the experience mean to you? If you’ve never volunteered, would you consider it in future and why/why not?
9. What do think can be done to get more community members to use the county’s parks? What can be improved? [recommendations]
10. What types of programs/activities would you like to see in SMC parks? Are there other types of facilities you might like to have? [program/facility recommendations]
Tier 2 - If Time, Address the Following Questions1. Have you ever had any issues or problems in the parks? [safety, maintenance]2. What do you do to stay “healthy”? What does that mean to you? Is there a better way for
the parks dept to talk about health or integrate health into the programs (e.g., have you ever heard “healthy parks, healthy people” [health/wellness]
3. Others?
Close with: “Does anyone have anything else to add based on what we’ve talked about or something else you’d like to share?”

52 Visitor Use/Non-Use Parks Study 2015-2016
70
Closing & Wrap Up
Thank you all again for participating in this important conversation. The information you provided is significant and meaningful and can really help improve park use throughout the county. If you are interested in the results and findings of this conversation, a summary report can be sent out to you upon request. If so, please give your name and email address, or postal address, to our student assistant.
In appreciation of your time, [note taker’s] will be distributing [incentives]. In order to receive this [incentive] we need you to please sign our receipt log for the university accounting purposes only.
[Student assistant turns off digital recorder, note-taking ends].

53Visitor Use/Non-Use Parks Study 2015-2016
APPENDIX EFocus Group Participant Demographics
71
Appendix EFocus Group Participant Demographics
San Mateo County Name of Host Organization & Location4 Focus Groups (n=48) HICAP of San Mateo Cty Siena Youth Center One East Palo Alto My Puente
Participant Demographics Daly City North Fair Oaks East Palo Alto PescaderoAge Totals
18-25 1 0 5 4 1026-35 1 5 1 1 836-45 0 5 4 7 1646-55 2 1 0 2 555+ 8 0 1 0 9
Total: n=12 n=11 n=11 n=14 48GenderFemale 6 9 5 12 32Male 6 2 6 2 16
Total: n=12 n=11 n=11 n=14 48Ethnicity
White 0 0 0 0 0Hispanic 0 11 2 13 26
African American 0 0 2 0 2Asian/Pacific Islander 12 0 5 0 17Other (Not Specified) 0 0 2 1 3
Total: n=12 n=11 n=11 n=14 48Occupation
Educator/Teacher 0 1 0 3 4Business/Marketing 5 0 0 0 5
Administration/Office 1 0 0 0 1Maintenance/Landscape 0 5 0 3 8
Medical 0 1 1 0 2Retail/Sales 1 0 0 1 2Hospitality 0 1 1 0 2
Religious/Community Ctrs 0 0 4 0 4Student 1 0 3 3 7Retired 4 0 0 0 4
Unemployed 0 3 2 3 8Total: n=12 n=11 n=11 n=13 (1 missing) 47
Own Vehicle?Yes 11 8 7 13 39No 1 3 4 1 9
Total: n=12 n=11 n=11 n=14 48Other Forms of Transportation
Bike 0 0 1 0 1Bus 0 0 3 0 3
Walking 0 3 0 1 4Not Specified/missing 1 0 0 1 2
Total: n=1 n=3 n=4 n=2 10
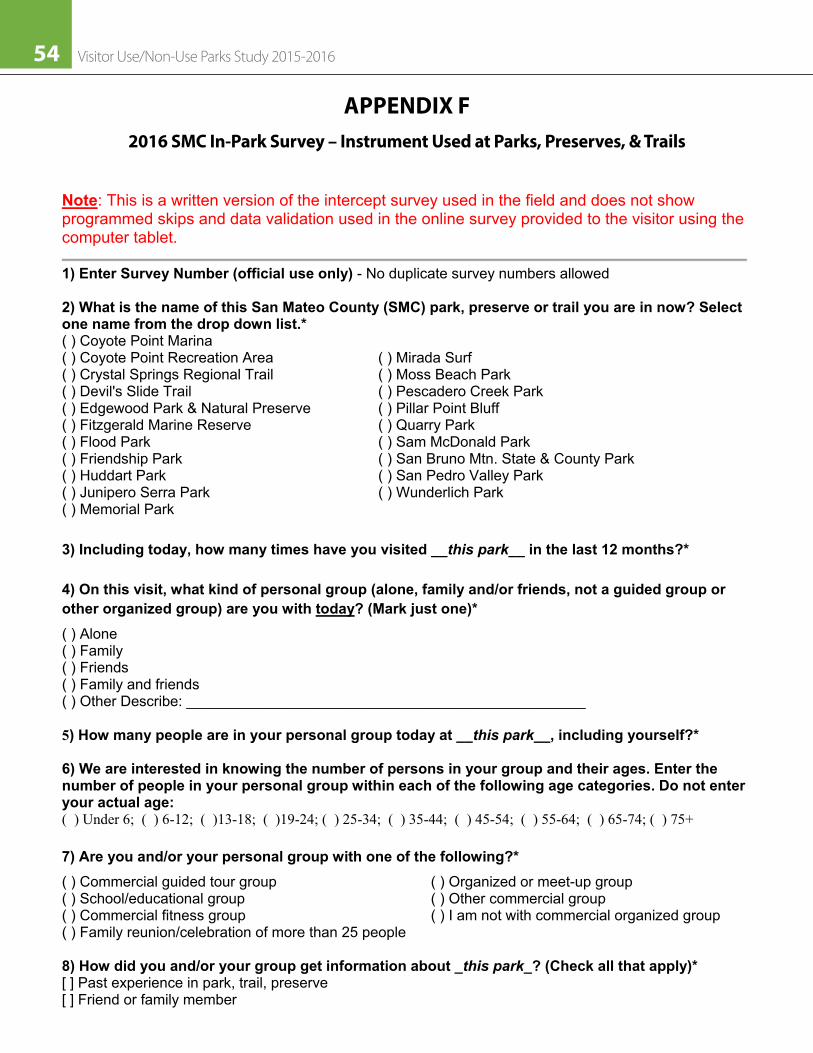
54 Visitor Use/Non-Use Parks Study 2015-2016
APPENDIX F2016 SMC In-Park Survey – Instrument Used at Parks, Preserves, & Trails
72
Appendix F2016 SMC In-Park Survey – Instrument Used at Parks, Preserves, & Trails
Note: This is a written version of the intercept survey used in the field and does not show programmed skips and data validation used in the online survey provided to the visitor using the computer tablet.
1) Enter Survey Number (official use only) - No duplicate survey numbers allowed
2) What is the name of this San Mateo County (SMC) park, preserve or trail you are in now? Select one name from the drop down list.*( ) Coyote Point Marina( ) Coyote Point Recreation Area ( ) Mirada Surf( ) Crystal Springs Regional Trail ( ) Moss Beach Park( ) Devil's Slide Trail ( ) Pescadero Creek Park( ) Edgewood Park & Natural Preserve ( ) Pillar Point Bluff( ) Fitzgerald Marine Reserve ( ) Quarry Park( ) Flood Park ( ) Sam McDonald Park( ) Friendship Park ( ) San Bruno Mtn. State & County Park( ) Huddart Park ( ) San Pedro Valley Park( ) Junipero Serra Park ( ) Wunderlich Park( ) Memorial Park
3) Including today, how many times have you visited __this park__ in the last 12 months?*
4) On this visit, what kind of personal group (alone, family and/or friends, not a guided group or other organized group) are you with today? (Mark just one)*( ) Alone( ) Family( ) Friends( ) Family and friends( ) Other Describe: _________________________________________________
5) How many people are in your personal group today at __this park__, including yourself?*
6) We are interested in knowing the number of persons in your group and their ages. Enter the number of people in your personal group within each of the following age categories. Do not enter your actual age:( ) Under 6; ( ) 6-12; ( )13-18; ( )19-24; ( ) 25-34; ( ) 35-44; ( ) 45-54; ( ) 55-64; ( ) 65-74; ( ) 75+
7) Are you and/or your personal group with one of the following?*( ) Commercial guided tour group ( ) Organized or meet-up group( ) School/educational group ( ) Other commercial group( ) Commercial fitness group ( ) I am not with commercial organized group( ) Family reunion/celebration of more than 25 people
8) How did you and/or your group get information about _this park_? (Check all that apply)*[ ] Past experience in park, trail, preserve[ ] Friend or family member

55Visitor Use/Non-Use Parks Study 2015-2016
73
[ ] San Mateo County Parks website[ ] Other Website or Social Media - Write In: _________________________________________[ ] Called San Mateo County Parks Dept.[ ] Talked with a San Mateo County Parks staff person[ ] Visited San Mateo County Parks office[ ] Signs along trail[ ] Use of cell phone/iPad/tablet/laptop in this park[ ] Park brochure/map[ ] Guidebook[ ] Other Source - Write In: _________________________________________________
9) What forms of transportation did you and/or your group use to arrive at _this park_ today? (Check all that apply)*[ ] Drove/Rode in a vehicle[ ] Walked[ ] Rode a bicycle[ ] Arrived by public transit (bus, train, ferry)[ ] Group bus[ ] Other - Write In: _________________________________________________
10) What LAND-BASED activities did you participate in today at _this park_? (Check all that apply)*[ ] Walk/Hike[ ] Picnicking[ ] Kids Playground[ ] Running/jogging[ ] Walk dog or pet[ ] Group exercise[ ] Bike unpaved trails[ ] Bike on paved trails[ ] Play sports[ ] Ride horses[ ] Horseshoes[ ] Boat ramp/pier[ ] Archery[ ] Other - Write In: _________________________________________________[ ] I did not participate in any land activities
11) What WATER-BASED activities did you participate in today at _this park_? (Check all that apply)*[ ] Relax on beach[ ] Beach activities[ ] Kayaking[ ] Sailing[ ] Fishing[ ] Sunbathing[ ] Wading/Swimming[ ] Tide Pooling[ ] Standup Paddle Boarding[ ] Kiteboarding[ ] Other - Write In: _________________________________________________[ ] I did not participate in any Water-Based activities

56 Visitor Use/Non-Use Parks Study 2015-2016
74
12) What NATURE-BASED activities did you participate in today at_this park_? (Check all that apply)*[ ] Relax Outdoors[ ] Enjoy Being With Family/Friends[ ] Scenic Viewing[ ] Explore Outdoors[ ] Bird Watching[ ] Wildlife Viewing[ ] Nature Walk[ ] Photography/Art[ ] Wild Flower Viewing[ ] Other - Write In: _________________________________________________[ ] I did not participate in any Nature-Based Activities
13) What OTHER activities did you participate in today at _this park_? (Check all that apply)*[ ] Camping[ ] Take a Scenic Drive[ ] Meditation/Solitude[ ] Wedding[ ] Attend Event[ ] Attend SMCP program[ ] Reading[ ] Use Restroom[ ] Other - Write In: _________________________________________________[ ] I Did Not Participate in any of these Other Activities
14) Which ONE activity from above options (Land, Water, Nature or Other) was your primary reason for visiting _this park_ today? (Select from list or write just one activity exactly as shown above)*( ) Walk/Hike( ) Picnicking( ) Kids Playground( ) Running/Jogging( ) Walking Dog or Pet( ) Bike Unpaved Trails( ) Bike Paved Trails( ) Play Sports( ) Relax on Beach( ) Beach Activities( ) Sailing( ) Kayaking( ) Fishing( ) Sunbathing( ) Wading/Swimming( ) Tide Pooling( ) Take a Scenic Drive( ) Meditation/Solitude( ) Attend Event( ) Attend SMCP Program( ) Use Restroom( ) Relax Outdoors( ) Enjoy Being with Family/Friends( ) Scenic Viewing

57Visitor Use/Non-Use Parks Study 2015-2016
75
( ) Explore Outdoors( ) Wildlife Viewing( ) Nature Walks( ) Wildflower Viewing( ) Wildlife Viewing( ) Nature Walk( ) Other - Write In: _________________________________________________
15) You indicated you went camping at _this park_. For the money you or a member of your group paid for camping at the SMC park do you feel you are getting an....( ) Exceptional value( ) Good value( ) Average value( ) Poor value( ) Our group did not spend money for camping in the park( ) I did not go camping today
16) Since you rated for the money you paid for camping at the park today as a "Poor Value," please briefly describe the primary reasons you feel that way?
17) Please rate your satisfaction with interactions with other visitors at _this park_ today, on a scale of Very Dissatisfied to Very Satisfied? (Please mark only one)*( ) Very Dissatisfied ( ) Dissatisfied ( ) Neutral ( ) Satisfied ( ) Very Satisfied
18) Since you felt very dissatisfied or dissatisfied with your interactions with other visitors at_this park_ today, briefly describe why you feel that way.
19) Please indicate how personally safe you felt at _this park_ today on a scale of Very Unsafe toVery Safe ? (Please mark only one response)( ) Very Unsafe ( ) Unsafe ( ) Neutral ( ) Safe ( ) Very Safe
20) Since you felt Very Unsafe or Unsafe at _this park/preserve_ today check the most important reasons which caused you to feel that way. (Check all that were important reasons)[ ] Scary people I encountered[ ] I felt vulnerable to attack by a person[ ] Wild animals[ ] I did not feel welcome[ ] Dogs I encountered[ ] Bugs and insects[ ] Horses on trails[ ] Unsafe trail conditions[ ] Too few people[ ] Too many people[ ] Bikes on trails[ ] Weather (too hot, too cold or rain)[ ] Too isolated[ ] Lack presence of park rangers/staff[ ] Other - Write In: _________________________________________________
21) Overall, how would you rate the quality of your experience at _this park_ during this visit?(Select just one)*( ) Very poor ( ) Poor ( ) Neutral ( ) Good ( ) Very good
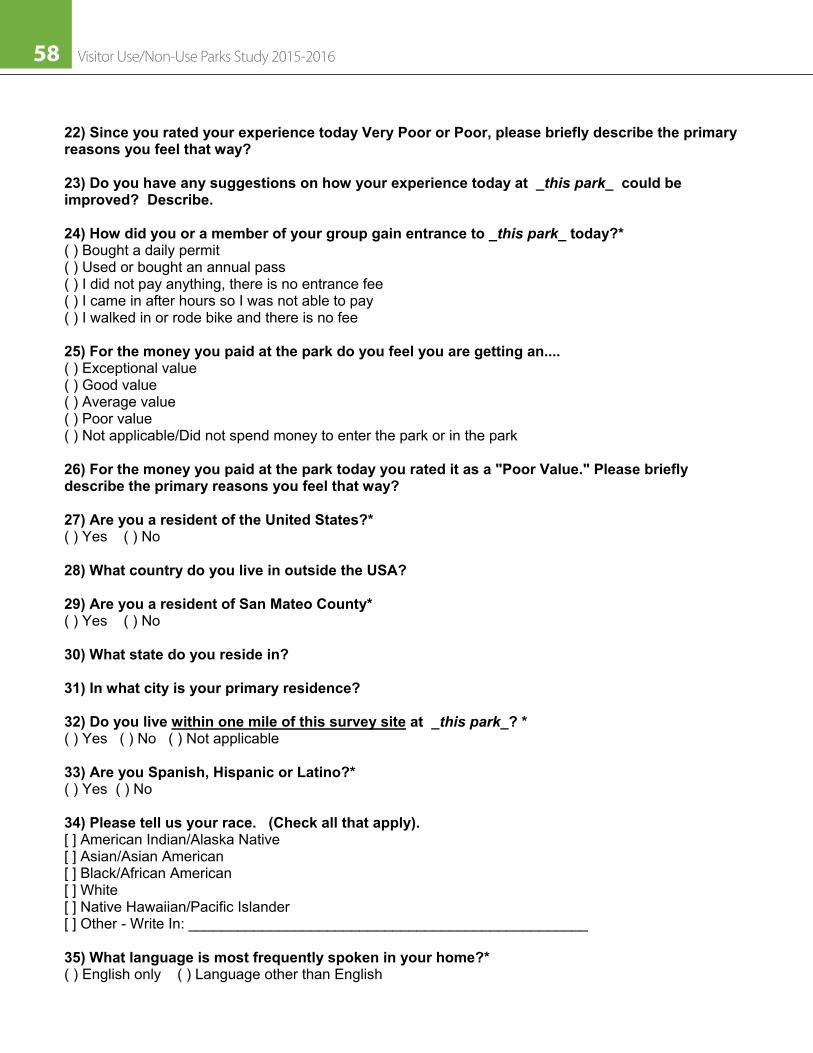
58 Visitor Use/Non-Use Parks Study 2015-2016
76
22) Since you rated your experience today Very Poor or Poor, please briefly describe the primary reasons you feel that way?
23) Do you have any suggestions on how your experience today at _this park_ could be improved? Describe.
24) How did you or a member of your group gain entrance to _this park_ today?*( ) Bought a daily permit( ) Used or bought an annual pass( ) I did not pay anything, there is no entrance fee( ) I came in after hours so I was not able to pay( ) I walked in or rode bike and there is no fee
25) For the money you paid at the park do you feel you are getting an....( ) Exceptional value( ) Good value( ) Average value( ) Poor value( ) Not applicable/Did not spend money to enter the park or in the park
26) For the money you paid at the park today you rated it as a "Poor Value." Please briefly describe the primary reasons you feel that way?
27) Are you a resident of the United States?*( ) Yes ( ) No
28) What country do you live in outside the USA?
29) Are you a resident of San Mateo County*( ) Yes ( ) No
30) What state do you reside in?
31) In what city is your primary residence?
32) Do you live within one mile of this survey site at _this park_? *( ) Yes ( ) No ( ) Not applicable
33) Are you Spanish, Hispanic or Latino?*( ) Yes ( ) No
34) Please tell us your race. (Check all that apply).[ ] American Indian/Alaska Native[ ] Asian/Asian American[ ] Black/African American[ ] White[ ] Native Hawaiian/Pacific Islander[ ] Other - Write In: _________________________________________________
35) What language is most frequently spoken in your home?*( ) English only ( ) Language other than English

59Visitor Use/Non-Use Parks Study 2015-2016
77
36) What language other than English is most frequently spoken in your home?*[ ] Spanish[ ] Mandarin/Cantonese[ ] Tagalog[ ] Vietnamese[ ] German/Italian/French[ ] Russian[ ] Other Language - Write In: _________________________________________________
37) Do you or anyone in your personal group have a physical condition that made it difficult to access or participate in park activities or services? ( ) Yes ( ) No
38) What activities or services did you or the person(s) have difficulty accessing or participating in today? Please be specific.
39) Because of the physical condition, what specific problems did you or the person(s) have? (Check all that apply)[ ] Hearing (difficulty hearing ranger programs, or office staff, even with hearing aid)[ ] Visual (difficulty seeing directional signs, visual aids that are part of programs, etc. even with prescribed glasses or due to blindness)[ ] Mobility (difficulty accessing facilities, services, or programs, even with walking aid and/or wheelchair)[ ] Other - Write In: _________________________________________________
40) In what year were you born? _______________________________________________
41) What sex were you biologically assigned at birth.*( ) Female ( ) Male
42) What is the highest level of formal education you have completed? (Check only one)*( ) 12th grade or less( ) Graduated high school or equivalent( ) Vocational or trade school( ) Some college, no degree( ) Associate 2 year degree( ) Bachelor's 4 year degree( ) Post-graduate or professional degree
43) Which of the following categories best describes your total annual household income for the last calendar year?( ) Less than $25,000( ) $25,000 to $34,999( ) $35,000 to $49,999( ) $50,000 to $74,999( ) $75,000 to $99,999( ) $100,000 to $124,999( ) $125,000 to $149,999( ) $150,000 to $249,999( ) $250,000 or more( ) Prefer not to answer

60 Visitor Use/Non-Use Parks Study 2015-2016
78
44) Are you willing to provide your email address so we can send you a follow-up survey and be entered into a drawing for that $100 prize or annual pass and help improve San Mateo County parks? * SFSU and SMCP will not share your email address with anyone.* ( ) Yes ( ) No
45) Please provide your name so we can contact you if you win:_____________________
46) Provide your email address so you can be entered in a drawing to win a prize after completing the follow-up survey:___________________________
Thank You!

61Visitor Use/Non-Use Parks Study 2015-2016
79
Appendix G2016 SMC Follow up Survey – Instrument Provided Online
Note: This is the follow-up survey sent via email with link to SurveyGizmo to individuals who provided their email at end of intercept survey.
1) In which San Mateo County park, preserve, or trail did you complete the initial survey? Select one name from the drop down list. If you do not remember, select that option and continue.* ( ) Coyote Point Marina ( ) Mirada Surf( ) Coyote Point Recreation Area ( ) Moss Beach Park( ) Crystal Springs Regional Trail ( ) Pescadero Creek Park( ) Devil's Slide Trail ( ) Moss Beac h Park( ) Edgewood Park & Natural Preserve ( ) Pillar Point Bluff( ) Fitzgerald Marine Reserve ( ) Quarry Park( ) Flood Park ( ) Sam McDonald Park( ) Friendship Park ( ) San Bruno Mtn. State & County Park( ) Huddart Park ( ) San Pedro Valley Park( ) Junipero Serra Park ( ) Wunderlich Park( ) Memorial Park( ) I do not recall which park/preserve/trail
2) Have you been back to _park/preserve/trail name_ since you completed the on-site survey?*( ) Yes ( ) No ( ) I don't remember
3) People can have many reasons for visiting San Mateo County parks, preserves and trails. Below are a list of potential reasons for visiting. Please check all responses below that were an Important or Very Important reason for you visiting _park/preserve name_ on the day you completed the initial survey. *[ ] To connect with nature[ ] Convenient to where I live[ ] Convenient to where I work[ ] Dog walking[ ] Experience solitude[ ] Enjoy a safe environment[ ] Be with family/friends[ ] Experience scenic views[ ] Improve my physical fitness[ ] Improve my mental well being[ ] Learn about history & culture[ ] Learn about nature[ ] Volunteer[ ] Experience natural sounds and quiet[ ] For recreation and play[ ] For team sports[ ] Enjoy an affordable outing[ ] Camping[ ] Participate in an organized group outing[ ] Attend an event[ ] Other - Write In: _________________________________________________
APPENDIX G2016 SMC Follow-up Survey (Instrument Provided Online)

62 Visitor Use/Non-Use Parks Study 2015-2016
80
4) Which of the above reasons was the primary reason you visited this _park/preserve name_ on the day you completed the initial survey? Select just one reason from the list below.( ) To connect with nature( ) Convenient to where I live( ) Convenient to where I work( ) Experience solitude( ) Dog walking( ) Enjoy a safe environment( ) Be with family/friends( ) Experience scenic views( ) Improve my physical fitness( ) Improve my mental well being( ) Learn about history & culture( ) Learn about nature( ) Volunteer( ) Experience natural sounds and quiet( ) For recreation and play( ) For team sports( ) Enjoy an affordable outing( ) Camping( ) Attend an event( ) Participate in an organized group outing( ) Other - Write In: _________________________________________________
5) Think about all the facilities (e.g., trails, tables, bathrooms, ball fields, ball courts, pool, planted turf, parking, or trailheads) that you used/saw during your visit to _park or preserve name_ when you completed the initial survey. How satisfied were you with each of the following? Rate each facility on a scale of Very Satisfied to Very Unsatisfied.
Very Satisfied Satisfied Neutral Unsatisfied Very
UnsatisfiedNot
Applicable/Did Not Use
Condition of trails ( ) ( ) ( ) ( ) ( ) ( )
Availability of bicycling trails ( ) ( ) ( ) ( ) ( ) ( )
Benches, water fountains, and trash cans ( ) ( ) ( ) ( ) ( ) ( )
Availability of places to picnic, BBQ, eat together ( ) ( ) ( ) ( ) ( ) ( )
Availability of sports fields ( ) ( ) ( ) ( ) ( ) ( )
Availability of ball courts ( ) ( ) ( ) ( ) ( ) ( )
Planted grassy area andlandscaping ( ) ( ) ( ) ( ) ( ) ( )
Campground ( ) ( ) ( ) ( ) ( ) ( )
Availability of parking ( ) ( ) ( ) ( ) ( ) ( )
Kids playground ( ) ( ) ( ) ( ) ( ) ( )

63Visitor Use/Non-Use Parks Study 2015-2016
81
Availability of restrooms ( ) ( ) ( ) ( ) ( ) ( )
Cleanliness of restrooms ( ) ( ) ( ) ( ) ( ) ( )
Community gardens ( ) ( ) ( ) ( ) ( ) ( )
Condition of natural resources at the site ( ) ( ) ( ) ( ) ( ) ( )
Condition of historic resources at the site ( ) ( ) ( ) ( ) ( ) ( )
Boat ramps ( ) ( ) ( ) ( ) ( ) ( )
Visitor or nature centers ( ) ( ) ( ) ( ) ( ) ( )
6) Why were you unsatisfied with any facilities? Explain.
7) Next we’d like to know how satisfied you were with the staffing and information at _park or preserve name_ on the day you completed the initial survey. Please indicate if you were Very Satisfied to Very Unsatisfied with each item on the list.
Very Satisfied Satisfied Neutral Unsatisfied Very
Unsatisfied
Not Applicable
Did Not Use
Availability of park staff ( ) ( ) ( ) ( ) ( ) ( )
Interactions with park staff ( ) ( ) ( ) ( ) ( ) ( )
Availability of outdoor displays or exhibits about the natural & cultural history of site
( ) ( ) ( ) ( ) ( ) ( )
Availability of information about activities and/or events in the park/preserve
( ) ( ) ( ) ( ) ( ) ( )
Directional signage at the site ( ) ( ) ( ) ( ) ( ) ( )
Signs, maps, trail markers ( ) ( ) ( ) ( ) ( ) ( )
8) Why were you unsatisfied with staff or information availability?
9) What is your preferred method(s) to receive information about San Mateo County parks, programs and activities? Describe.
10) Next is a list of issues that sometimes concern park visitors. Please check all that were a Moderate Problem, or a Serious Problem at _park or preserve name_ when you visited.[ ] Too many visitors at site[ ] Number of visitors encountered on trail[ ] Dogs off-leash[ ] Dog waste[ ] Horses and/or their deposits on trails

64 Visitor Use/Non-Use Parks Study 2015-2016
82
[ ] Speeding bikes on trails[ ] Lack of information about the site’s plant and animal habitats[ ] Trail conflicts between different types of users[ ] Lack of public transit to sites[ ] Limited parking near site[ ] Lack of enforcement of park rules[ ] Visitor-caused noise or disturbances[ ] Unclean restrooms[ ] Trash/litter at park site[ ] I did not have any issues of concern[ ] Other - Write In: _________________________________________________
11) What information, stories, history or features of _park or preserve name_ would you like to learn more about?
12) Are there any special qualities about _park or preserve name_ that make it important to you?( ) Yes ( ) No ( ) Don't know
13) What are these special qualities or aspects? (Describe)
14) Would you like some facility, amenity, or program improvements to _park or preserve name_to enhance your visit there in the future?*( ) No, I like it just the way it is ( ) Yes, I'd like to see some improvements15) Describe any facility improvements you would like to see in the future at _park or preserve name_.
16) On a future visit to _park or preserve name_ which of the following types of programs would you and/or your group be interested in attending? (Check all that apply).[ ] Children’s or youth programs[ ] Environmental education[ ] Family activities (e.g., nature quests, tide-pooling, all-age volunteer program)[ ] Outdoor evening programs (e.g., campfire, night sky programs)[ ] Special events/festivals/outdoor concerts[ ] History tours[ ] Races and competitions[ ] Nature walks[ ] Sport or fitness clinics[ ] Art/photography classes[ ] Other - Write In: _________________________________________________
17) On a future visit to _park or preserve name_ which of the following services would you like to have? (Check all that are of interest).[ ] More outdoor exhibits/kiosks[ ] Digital information (e.g., on-site electronic kiosks, downloadable pdf files or park apps)[ ] Self-guided tours[ ] Ranger-led walks or talks at park[ ] Personal audio/video guides at the park[ ] Programs about the park provided in my community or neighborhood[ ] Other - Write In: _________________________________________________
18) Is there anything else you would like to tell us about your recent visit to _park or preserve name_ or comments about other San Mateo County parks, preserves or trails? (Describe). (Please

65Visitor Use/Non-Use Parks Study 2015-2016
83
continue to next question)
19) The current daily pass price to some SMC parks is $6.00. How would the following potential price increases in a daily pass affect your current visitation level to _park/preserve name_? ( Please select one response from the drop-down menu for each price increase.)*
Influence on your current visitation level$1.00$2.00$3.00$4.00
20) The price for an annual SMC parks pass is $60.00. How would the following potential price increases above the current annual pass price of $60.00, affect your willingness to purchase the annual pass? (Please select one response from the drop-down menu for each price increase.)
Influence on your willingness to purchase an annual parks pass$3.00$5.00$10.00$20.00
21) San Mateo County parks is considering a "Premium Membership" pass that may include an annual pass, plus entry into special member events and one free night at a park campsite. The extra cost above the annual pass price would be tax-deductible and go to the future of county parks. Do you think the "Premium Membership" pass is a good idea?( ) Yes ( ) No ( ) Don't know
22) What is the likelihood of you purchasing a Premium Membership pass at the following costs above the regular annual parks pass price? (Please select one response from the drop-down menu for each price level.)
Costs Above an Annual Parks Pass$10.00$25.00$50.00$75.00$100.00$250.00More than $250.00
23) About how many nights during the last 12 months have you camped at San Mateo County parks?( ) None, I have not camped in SMC parks in the last 12 months( ) 1 night( ) 2 nights( ) 3-5 nights
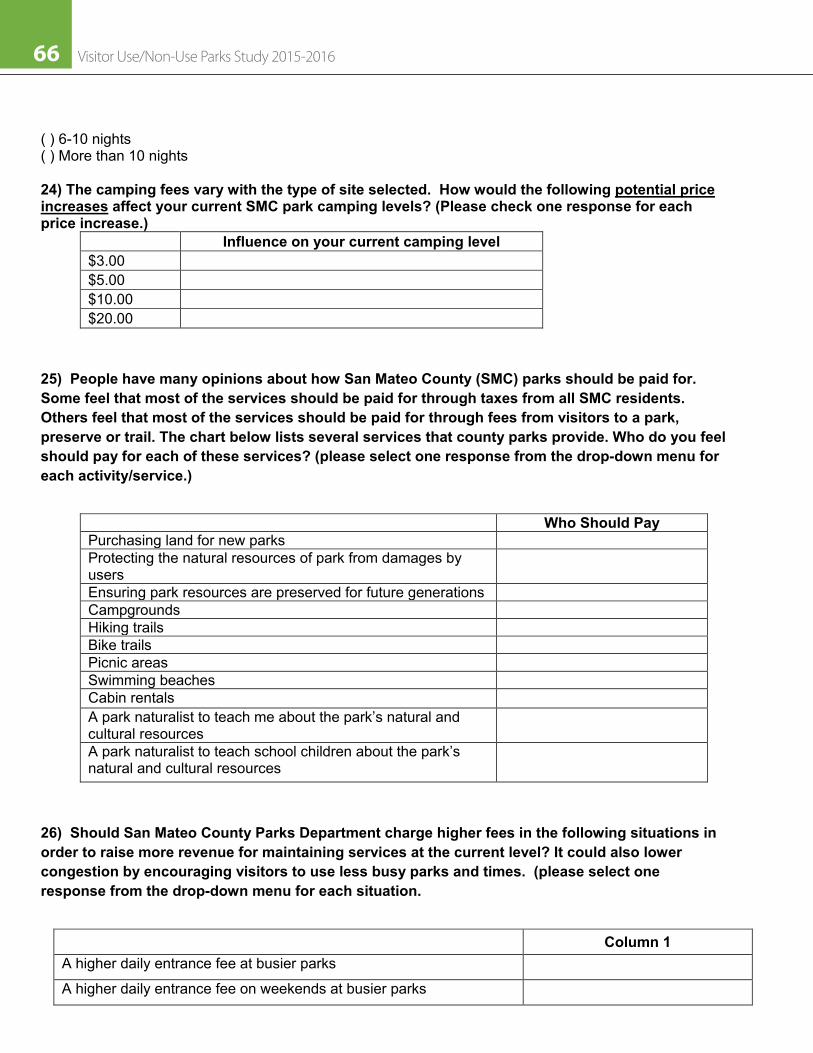
66 Visitor Use/Non-Use Parks Study 2015-2016
84
( ) 6-10 nights( ) More than 10 nights
24) The camping fees vary with the type of site selected. How would the following potential priceincreases affect your current SMC park camping levels? (Please check one response for each price increase.)
Influence on your current camping level$3.00$5.00$10.00$20.00
25) People have many opinions about how San Mateo County (SMC) parks should be paid for. Some feel that most of the services should be paid for through taxes from all SMC residents. Others feel that most of the services should be paid for through fees from visitors to a park, preserve or trail. The chart below lists several services that county parks provide. Who do you feel should pay for each of these services? (please select one response from the drop-down menu for each activity/service.)
Who Should PayPurchasing land for new parksProtecting the natural resources of park from damages by usersEnsuring park resources are preserved for future generationsCampgroundsHiking trailsBike trailsPicnic areasSwimming beachesCabin rentalsA park naturalist to teach me about the park’s natural and cultural resourcesA park naturalist to teach school children about the park’s natural and cultural resources
26) Should San Mateo County Parks Department charge higher fees in the following situations in order to raise more revenue for maintaining services at the current level? It could also lower congestion by encouraging visitors to use less busy parks and times. (please select one response from the drop-down menu for each situation.
Column 1A higher daily entrance fee at busier parks
A higher daily entrance fee on weekends at busier parks
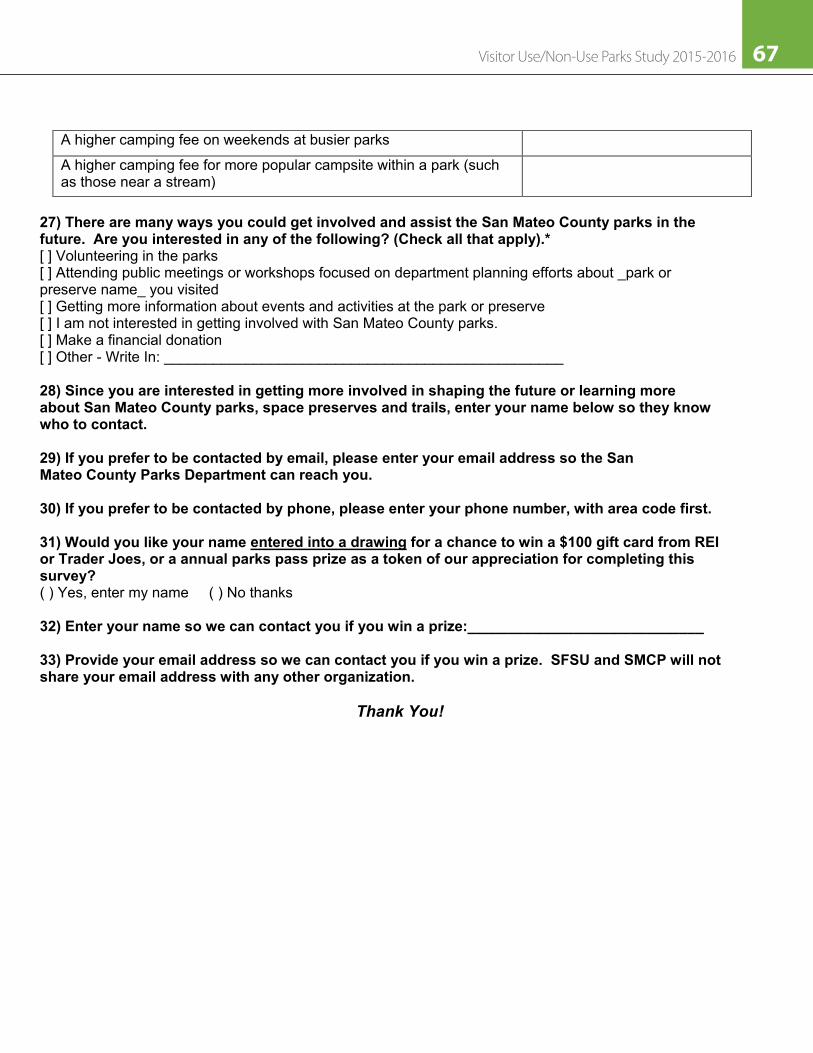
67Visitor Use/Non-Use Parks Study 2015-2016
85
A higher camping fee on weekends at busier parks
A higher camping fee for more popular campsite within a park (such as those near a stream)
27) There are many ways you could get involved and assist the San Mateo County parks in the future. Are you interested in any of the following? (Check all that apply).*[ ] Volunteering in the parks[ ] Attending public meetings or workshops focused on department planning efforts about _park or preserve name_ you visited[ ] Getting more information about events and activities at the park or preserve[ ] I am not interested in getting involved with San Mateo County parks.[ ] Make a financial donation[ ] Other - Write In: _________________________________________________
28) Since you are interested in getting more involved in shaping the future or learning more about San Mateo County parks, space preserves and trails, enter your name below so they know who to contact.
29) If you prefer to be contacted by email, please enter your email address so the San Mateo County Parks Department can reach you.
30) If you prefer to be contacted by phone, please enter your phone number, with area code first.
31) Would you like your name entered into a drawing
( ) Yes, enter my name ( ) No thanks
32) Enter your name so we can contact you if you win a prize:_____________________________
for a chance to win a $100 gift card from REI or Trader Joes, or a annual parks pass prize as a token of our appreciation for completing this survey?
33) Provide your email address so we can contact you if you win a prize. SFSU and SMCP will not share your email address with any other organization.
Thank You!

Contact:
Nina S. Roberts, Ph.D.
Professor & Project P.I.
Dept. of Recreation, Parks, & Tourism
1600 Holloway Avenue, HSS 307
San Francisco, CA 94132
W. 415.338.2030
C. 415.515.2738
http://online.sfsu.edu/nroberts
(Crystal Springs Regional Trail ~ Photo: SMC Parks Dept Archives)