
Visible/UV image projector for sensor testing
12
Page 1 of 12 Can IR scene projectors reduce total system cost? Robert Ginn, Steven Solomon Acumen Scientific, Santa Barbara, CA 93160 ABSTRACT There is an incredible amount of system engineering involved in turning the typical infrared system needs of probability of detection, probability of identification, and probability of false alarm into focal plane array (FPA) requirements of noise equivalent irradiance (NEI), modulation transfer function (MTF), fixed pattern noise (FPN), and defective pixels. Unfortunately, there are no analytic solutions to this problem so many approximations and plenty of “seat of the pants” engineering is employed. This leads to conservative specifications, which needlessly drive up system costs by increasing system engineering costs, reducing FPA yields, increasing test costs, increasing rework and the never ending renegotiation of requirements in an effort to rein in costs. These issues do not include the added complexity to the FPA factory manager of trying to meet varied, and changing, requirements for similar products because different customers have made different approximations and flown down different specifications. Scene generation technology may well be mature and cost effective enough to generate considerable overall savings for FPA based systems. We will compare the costs and capabilities of various existing scene generation systems and estimate the potential savings if implemented at several locations in the IR system fabrication cycle. The costs of implementing this new testing methodology will be compared to the probable savings in systems engineering, test, rework, yield improvement and others. The diverse requirements and techniques required for testing missile warning systems, missile seekers, and FLIRs will be defined. Last, we will discuss both the hardware and software requirements necessary to meet the new test paradigm and discuss additional cost improvements related to the incorporation of these technologies. Keywords: Scene generation, HWIL, infrared, focal plane array testing 1. INTRODUCTION A commonly heard axiom is that, “a good systems engineer allocates the pain of a design making everybody else equally miserable.” How is our poor systems engineer (SE) to know he has done his job with all that screaming? The answer lies in analysis, modeling and experience. When the customer asks for an array operating at 110% BLIP, the SE gently responds with a model showing the possible performance. If a design includes a 12k × 12k infrared focal plane array (IR FPA) with no defective pixels our SE describes the current available state-of-the-art devices and what potential improvements could be made to them. But what happens if what is asked for is not quite so black and white? Our hypothetical customer wants a 2x reduction in defective elements with no dead pixels in the center 128×128. What then? The question that should be asked in response to a specific specification is, “Why?” At the highest level the answer is almost always to improve range, improve the probability of detection, or reduce the probability of false alarm. Specification flow down is a tricky business. Ignore the mechanical, reliability, and interface requirements and you are still left with a plethora of power, noise, response, MTF, spectral bandwidth, noise bandwidth (etc.) parameters that get split between the optics, filters, electronics, coolers and FPAs. Pieces of this then get flowed down to the integrated detective/cooler assembly (IDCA) and FPA, and finally to the detector and ROIC. Many man-centuries of work have been used to develop tools to help our SE make the “best” choice while retaining some of his sanity and hair,
-
Upload
independent -
Category
Documents
-
view
0 -
download
0
Transcript of Visible/UV image projector for sensor testing

Page 1 of 12
Can IR scene projectors reduce total system cost?
Robert Ginn, Steven Solomon Acumen Scientific, Santa Barbara, CA 93160
ABSTRACT
There is an incredible amount of system engineering involved in turning the typical infrared system needs of probability of detection, probability of identification, and probability of false alarm into focal plane array (FPA) requirements of noise equivalent irradiance (NEI), modulation transfer function (MTF), fixed pattern noise (FPN), and defective pixels. Unfortunately, there are no analytic solutions to this problem so many approximations and plenty of “seat of the pants” engineering is employed. This leads to conservative specifications, which needlessly drive up system costs by increasing system engineering costs, reducing FPA yields, increasing test costs, increasing rework and the never ending renegotiation of requirements in an effort to rein in costs. These issues do not include the added complexity to the FPA factory manager of trying to meet varied, and changing, requirements for similar products because different customers have made different approximations and flown down different specifications.
Scene generation technology may well be mature and cost effective enough to generate considerable overall savings for FPA based systems. We will compare the costs and capabilities of various existing scene generation systems and estimate the potential savings if implemented at several locations in the IR system fabrication cycle. The costs of implementing this new testing methodology will be compared to the probable savings in systems engineering, test, rework, yield improvement and others. The diverse requirements and techniques required for testing missile warning systems, missile seekers, and FLIRs will be defined. Last, we will discuss both the hardware and software requirements necessary to meet the new test paradigm and discuss additional cost improvements related to the incorporation of these technologies.
Keywords: Scene generation, HWIL, infrared, focal plane array testing
1. INTRODUCTION
A commonly heard axiom is that, “a good systems engineer allocates the pain of a design making everybody else equally miserable.” How is our poor systems engineer (SE) to know he has done his job with all that screaming? The answer lies in analysis, modeling and experience. When the customer asks for an array operating at 110% BLIP, the SE gently responds with a model showing the possible performance. If a design includes a 12k × 12k infrared focal plane array (IR FPA) with no defective pixels our SE describes the current available state-of-the-art devices and what potential improvements could be made to them. But what happens if what is asked for is not quite so black and white? Our hypothetical customer wants a 2x reduction in defective elements with no dead pixels in the center 128×128. What then? The question that should be asked in response to a specific specification is, “Why?” At the highest level the answer is almost always to improve range, improve the probability of detection, or reduce the probability of false alarm.
Specification flow down is a tricky business. Ignore the mechanical, reliability, and interface requirements and you are still left with a plethora of power, noise, response, MTF, spectral bandwidth, noise bandwidth (etc.) parameters that get split between the optics, filters, electronics, coolers and FPAs. Pieces of this then get flowed down to the integrated detective/cooler assembly (IDCA) and FPA, and finally to the detector and ROIC. Many man-centuries of work have been used to develop tools to help our SE make the “best” choice while retaining some of his sanity and hair,

Page 2 of 12
yet there remains a huge amount of “guesstimation” in the final allocation of requirements. Most of these tools are mean value or worst case calculations without realistic attempts to model the real world distributions of devices. A typical example of the flow down of a single requirement (NEDT) is seen in Figure 1i. The complexity of this flowdown is apparent.
Temperature
Detector Cutoff
Unit Cell Size
F/#
Scene Temperature
Frame Rate
Array Format
Response
η∗ff
# Outputs
Read time
Available τint
Collected Photons
Charge Capacity
Collected Photo-carriers
Detector Dark Current
ROIC Noise
NEDT
ROIC Foundry
Foundry Process
τoptics
Data Rate
Photon Noise
Figure 1: Typical SE trade space for a single performance parameter (NEDT).
Now consider the myriad additional requirements, often with overlapping relationships to the parameters in the figure (i.e. MTF depends on unit cell size as well, f/# has a direct effect on optics size and system weight, etc.). A particularly difficult requirement to quantify is pixel outages and clusters of pixel outages, in which case the SE often plays referee in a battle between the system software engineers and the FPA manufacturing engineer.
This is, unfortunately, just the start. When the program starts delivering product there is the never ending specification re-negotiation to allow for the realities of current technology. As the program moves into middle age, “spec creep” appears. This is the insidious re-evaluation of the data for evidence of “strangeness” or, “we had that once and it didn’t NUC out” or, “we’d prefer not to get any more with this.” In an era when the customer is always right, spec creep can be difficult to resist. This situation demands an unbiased, quantitative test in addition to the NEDT-, MTF-, and operability map-driven results engineers have today.
How can we eliminate some of the interpretation affecting the end user. If a missile can be tested with real or computer generated images to evaluate its performance, then why not do similar testing at the IDCA and FPA levels? Generating a set of simulations with defined targets and generic acquisition/tracking software to analyze the FPA output

Page 3 of 12
can be used to calculate the probably of a successful mission, and thus improve the usefulness of the FPA. Can scene projection technology replace all current testing schemes? This is not possible, at least with today’s technology. It can, however, improve screening for defective pixels and clusters, allow more complete MTF testing, and eliminate the never ending, “what IS that and will it show up later” questions – all of which result in significant cost increases in today’s IR systems.
2. CURRENT SCENE GENERATORS
Commercially produced scene projectors encompass several technologies, each with its own advantages and issues. A brief description of the two leading technologies follows.
Thermal emitters, sometimes called “microbolometers run backwards,” are the most mature technology with the highest performance available. They are available in formats up to 1k × 1k with ~ 50 µm pixels. Current is supplied to the pixels, causing them to heat up and emit as pseudo-blackbodies with maximum apparent temperatures of 700-800 K. Work on new designs and materials is expected to increase maximum temperature performance to greater than 2000 K. Santa Barbara Infrared (SBIR) is the principal producer of systems using this technology, shown in Figure 2.
These systems are big and expensive. They require kilowatts of power to run the emitter and cooler and cost on the order of $1M. A very large portion of this cost is associated with the design, fabrication, testing and yield of the emitter chip itself and the size of the current market (i.e. – the nonrecurring cost gets amortized over very few parts). The temporal response of the brightest available emitter pixels is limited to approximately 5 ms, which translates to 200 Hz frame rates. Since they are analog devices they do not require any modulation to generate various flux levels and have flickerless performance if the frame time is synchronized to the UUT. The emitters are fabricated on top of a CMOS RIIC (Read In Integrated Circuit) that supplies power distribution, x-y addressing and various other functions. The fabrication process is complicated and fairly low yielding, driving up the system cost. Pixel operability is a major cost and performance issue with the best arrays demonstrating ~ 99.8% operability. The radiometric correctability of the system is ~ 1%. With a 700 K effective temperature, thermal resolution of the system is between 40 mK (14-bit DAC) and 170 mK (12-bit DAC). The inherent nonlinearity of the emitter array makes the step size larger at higher temperatures,, and provides the finest thermal resolution at the low-end of the output range – an attribute well-suited to testing of most thermal imaging/tracking systems – although this can reduce the effective resolution for smaller targets.
Figure 2: SBIR Mirage emitter scene projector system and emitter pixelii
Digital Micro Mirror (DMD) technology, which is used in one version of large format televisions, is used by
Optical Sciences Corporation (OSC) to build IR scene projectors. These systems replace the visible source(s) with a pair of blackbodies and, with some optical element replacement, project IR scenes. The DMD chips are relatively inexpensive and have very high operability (~ 100%). The chips come in formats as large as 1280 × 1024 with 16 µm
Page 4 of 12
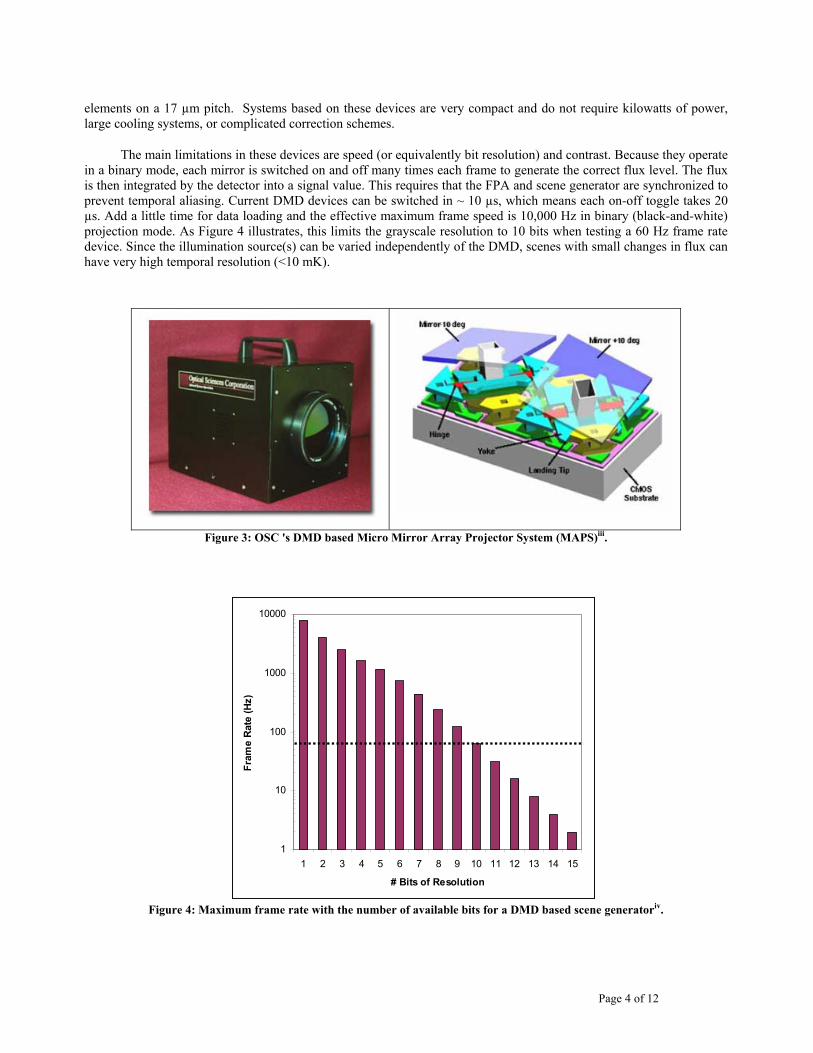
elements on a 17 µm pitch. Systems based on these devices are very compact and do not require kilowatts of power, large cooling systems, or complicated correction schemes.
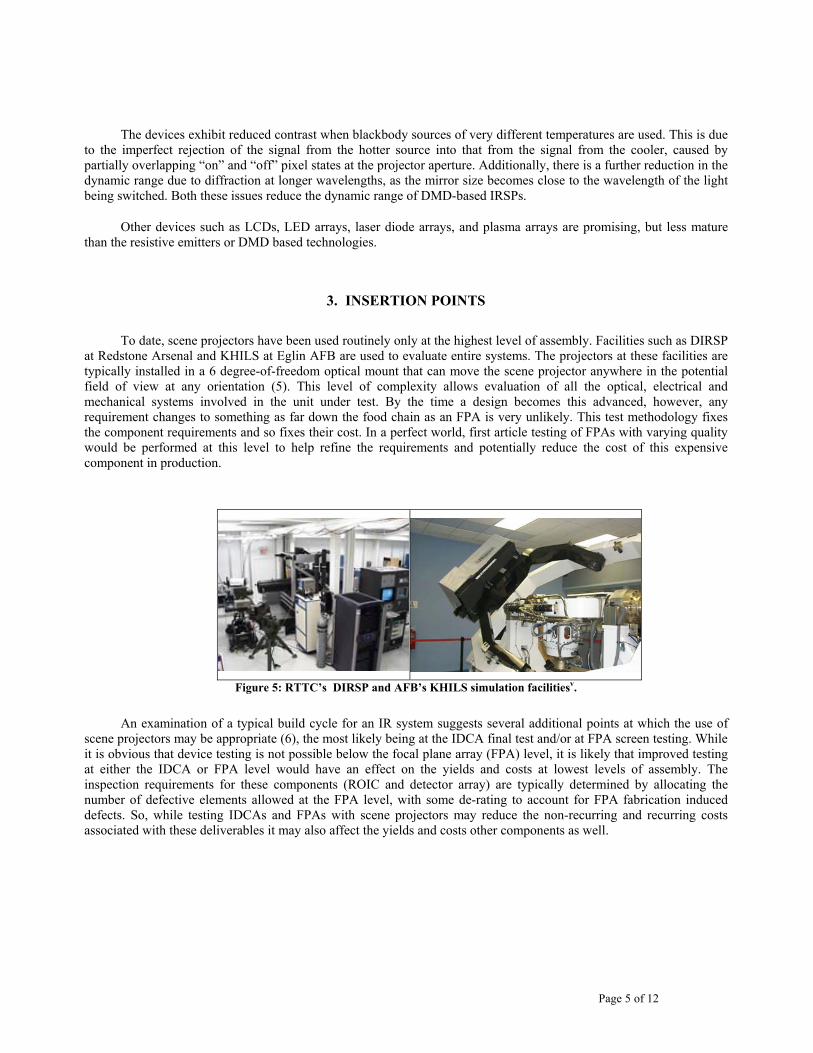
The main limitations in these devices are speed (or equivalently bit resolution) and contrast. Because they operate in a binary mode, each mirror is switched on and off many times each frame to generate the correct flux level. The flux is then integrated by the detector into a signal value. This requires that the FPA and scene generator are synchronized to prevent temporal aliasing. Current DMD devices can be switched in ~ 10 µs, which means each on-off toggle takes 20 µs. Add a little time for data loading and the effective maximum frame speed is 10,000 Hz in binary (black-and-white) projection mode. As Figure 4 illustrates, this limits the grayscale resolution to 10 bits when testing a 60 Hz frame rate device. Since the illumination source(s) can be varied independently of the DMD, scenes with small changes in flux can have very high temporal resolution (<10 mK).
Figure 3: OSC 's DMD based Micro Mirror Array Projector System (MAPS)iii.
1
10
100
1000
10000
1 2 3 4 5 6 7 8 9 10 11 12 13 14 15
# Bits of Resolution
Fram
e R
ate
(Hz)
Figure 4: Maximum frame rate with the number of available bits for a DMD based scene generatoriv.
Page 5 of 12
The devices exhibit reduced contrast when blackbody sources of very different temperatures are used. This is due
to the imperfect rejection of the signal from the hotter source into that from the signal from the cooler, caused by partially overlapping “on” and “off” pixel states at the projector aperture. Additionally, there is a further reduction in the dynamic range due to diffraction at longer wavelengths, as the mirror size becomes close to the wavelength of the light being switched. Both these issues reduce the dynamic range of DMD-based IRSPs.
Other devices such as LCDs, LED arrays, laser diode arrays, and plasma arrays are promising, but less mature than the resistive emitters or DMD based technologies.
3. INSERTION POINTS
To date, scene projectors have been used routinely only at the highest level of assembly. Facilities such as DIRSP at Redstone Arsenal and KHILS at Eglin AFB are used to evaluate entire systems. The projectors at these facilities are typically installed in a 6 degree-of-freedom optical mount that can move the scene projector anywhere in the potential field of view at any orientation (5). This level of complexity allows evaluation of all the optical, electrical and mechanical systems involved in the unit under test. By the time a design becomes this advanced, however, any requirement changes to something as far down the food chain as an FPA is very unlikely. This test methodology fixes the component requirements and so fixes their cost. In a perfect world, first article testing of FPAs with varying quality would be performed at this level to help refine the requirements and potentially reduce the cost of this expensive component in production.
Figure 5: RTTC’s DIRSP and AFB’s KHILS simulation facilitiesv.
An examination of a typical build cycle for an IR system suggests several additional points at which the use of scene projectors may be appropriate (6), the most likely being at the IDCA final test and/or at FPA screen testing. While it is obvious that device testing is not possible below the focal plane array (FPA) level, it is likely that improved testing at either the IDCA or FPA level would have an effect on the yields and costs at lowest levels of assembly. The inspection requirements for these components (ROIC and detector array) are typically determined by allocating the number of defective elements allowed at the FPA level, with some de-rating to account for FPA fabrication induced defects. So, while testing IDCAs and FPAs with scene projectors may reduce the non-recurring and recurring costs associated with these deliverables it may also affect the yields and costs other components as well.

Page 6 of 12
System
IR subsystem
IDCA
FPA Test
ROIC Detector
FPA
ROIC Foundry
Raw Materials
Raw Materials
Detector Fab
Most Current Projector Testing
Potential Projector Testing Some
Figure 6: Build cycle of IR system and possible sub-build scene projector test points
4. COSTS AND SAVINGS
The main cost in implementing scene projector testing is the cost of the projector system. Current capital costs, as previously defined, are between ~ $200k (DMD-based) and $1M (resistive emitter-based). Since the proposed test methodology in this case would not include multi-axis scene motion, a modest optical setup would be required to magnify or reduce the image to match the FPA under test and achieve best focus and field flatness.
There are three major areas to consider in calculating the savings from scene projector technology: systems design and requirements definition, recurring device yield and cost, and operational effectiveness. We will now discuss each area in some detail.
4.1 Systems design and requirements definition.
This is one of the most difficult areas to quantify savings. For any system there are many sub-systems that need significant effort, such as: mechanical, aerodynamic, optical, electrical (power, signal), propulsion, cooling, software, focal plane, and others. Not all systems require all disciplines. As a first order estimate, let us assume that the total systems design and requirements definition team can be represented by X people working for Y years. The nonrecurring work on each subassembly can be logically assumed to be proportional to the amount of money spent on the final system for each subassembly. This implies that the FPA and its related components are ~ 20% of the total and the FPA is 50% of that fraction. Therefore the total part of the non-recurring design phase related to the FPA is 0.10*X*Y man-years. It is safe to assume that not all of this work will be eliminated by the use of improved FPA testing. A quick look at a typical FPA specification reveals that ~ 30% of the specification is related to pixel operability, the definition of defective elements, and test methods to quantify those defects. This could be eliminated and replaced with standard language describing the test scenes to run and the required outcome for the probability of detection and the probability of false alarm. Let us assume that one-half the work remains. That gives us a total savings for requirements definition of the FPA, related to parameters likely to be eliminated by the use of scene projector technology, of 0.015*X*Y man-years. For a reasonably large program with 10 engineers working for 2 years this translates to a savings of 612 hours

Page 7 of 12
(0.015*10 heads * 2 years * 12 months/year * 170 hours/month). With an hourly rate of $150 there is a savings of ~ $90k. This is obviously a very rough estimate, which could change by orders of magnitude depending upon the actual time savings and the size of the program. A parameterized version of this logic is illustrated in Figure 7 with savings plotted versus the SE level of effort (LOE) for a program with 2 or 5 years of nonrecurring, requirements definition activities.
Savings vs LOE
$0
$100,000
$200,000
$300,000
$400,000
$500,000
$600,000
$700,000
$800,000
0 5 10 15 20 25 30 35
LOE (Heads/Year)
Sav
ings
($)
2 Years5 Years
Figure 7: Projected savings in the design phase with the use of scene projector testing at the IDCA/FPA level
4.2 Recurring device yield and cost.
To serve as an example, a simple cost model was developed based on published data for sales of the Northrop Grumman LITENINGvi FLIR, price quotes for FPA and camera assemblies at various manufacturing facilities (Indigo, SCD, Santa Barbara Focal Plane), and the author’s previous experience at various FPA manufacturing facilities. This model calculates the component costs (FPA, FPA-tested, IDCA, Imaging sub-system, final system) based on the cost of the assemblies required to build that component, and their yields. These costs were rationalized so that the final system cost met the published average cost for a LITENING pod. The model was used to calculate relative cost and quantities at various levels of IR subassembly build (Figure 8). This model is a first order approximation, but has the correct trends in terms of cost and quantity. As expected, the cost of the completed system is orders of magnitude more than that for the IDCA or FPA assembly. This seems to indicate that the current testing methodology is appropriate (i.e. expensive testing at the expensive assembly level), however, this misses the trend of much higher quantities at IDCA, and especially FPA, test. In fact, FPA test is typically the lowest yield point in the entire IR system build cycle. Because the yield is low there are many more components required at this step and in those quantities lies the opportunity for savings.

Page 8 of 12
Cost and Quantities of Components
0.0001
0.0010
0.0100
0.1000
1.0000
FPA TestFPAIDCAImaging SubSystem
Level of Build
Rela
tive
Cost
0.00
0.50
1.00
1.50
2.00
2.50
3.00
3.50
4.00
4.50
Rel
ativ
e Q
uant
ity
Figure 8: Relative cost and quantities for a typical "FLIR like" system.
It is very likely that some percentage of the components currently failing FPA test would pass if the “true” system requirements were flowed down exactly. It is also likely that some percentage of the FPAs that pass the current screen test will fail a scene-based test, thus reducing the rework at higher levels of assembly. This cost avoidance has not been included in our calculations. The quantities of parts which flow through at these points make it likely that any additional test that correctly identifies these parts will easily pay for itself. A parameterized graph (Figure 9) illustrates the potential savings vs. the quantity of system deliveries with the increased yield as a parameter.
Savings from FPA Testing
$-
$200,000
$400,000
$600,000
$800,000
$1,000,000
$1,200,000
$1,400,000
$1,600,000
$1,800,000
$2,000,000
0 500 1000 1500 2000 2500 3000 3500
System Deliveries
Savi
ngs
($) 1%
2%5%10%
DMD Based Projectors
Emitter Based Projectors
Figure 9: Potential savings with increased FPA test yield are very large compared to scene projector costs. Parameterized values are increased test yields due to scene based testing.
We can see that a yield improvement of only 1% at FPA test can easily pay for itself on a very large program like the JSF DAS (Distributed Aperture Sensor) with ~ 3000 deliveries. For the vast majority of smaller programs, a greater yield improvement and the use of a DMD-based system could also save considerable cost.

Page 9 of 12
Additional savings available by testing at the IDCA level are estimated to be much lower than those at the FPA level due to the higher yields (and thus lower potential for savings) already typical for this subcomponent. Expected values are shown in Figure 10. Even with the smaller quantities and higher initial yields, a relatively small increase (1-5%) can lead to significantly more cost savings than the hardware costs for a scene projector test.
Savings from IDCA Testing
$-
$200,000
$400,000
$600,000
$800,000
$1,000,000
$1,200,000
$1,400,000
$1,600,000
$1,800,000
$2,000,000
0 500 1000 1500 2000 2500 3000 3500
System Deliveries
Savi
ngs
($)
1%2%5%
DMD Based Projectors
Emitter Based Projectors
Figure 10: Projected savings from the use of scene projector testing at the IDCA assembly level.
4.3 Operational effectiveness
Savings associated with operational effectiveness improvements are even more difficult to quantify than those associated with the requirements definition phase. These savings will vary dramatically based on current practices at each FPA manufacturer. We will discuss some common issues and potential savings.
In order to reduce costs, both customers and FPA manufacturers prefer to use existing FPA designs in their systems, if possible. This tactic saves on the nonrecurring, design phase of a program but, over time leads to a condition where many different specifications are associated with each design. Those not intimate with the current status of FPA manufacturing complexities cannot appreciate the additional costs imposed by a multitude of specifications. A specific example can be seen below in Table 1, supplied by Raytheon Vision Systems. Here we see that a single focal plane is tested to four different sets of requirements. Each set of requirements has its own array average and pixel based parameters as well as operability and pixel clusters in disparate regions. In order to evaluate each FPA, it must be tested under each set of conditions and evaluated against each parameter. These diverse requirements were all derived from similar top level expectations of range, probability of detection, and probability of false alarm. Instead of this multitude of tests and analyses (not to mention specifications, drawings, and manufacturing documentation), the use of a set of images consistent with the intended system(s), and an evaluation of the success of the FPA in performing the expected tasks (i.e. the number of successes vs. the number of trials) would make selection of the right FPA for each program simpler and cheaper.

Page 10 of 12
Table 1: Partial requirements matrix for InSb FPA delivered to four different customers.
Parameter Customer A Customer B Customer C Customer DTemperature XX deg K XX - 2 deg K XX - 17 deg K XX + 5 deg K
Array Mean Sensitivity NEdT < xx mK NEQ < xx ph/cm^2-sec
NEQ < yy ph/cm^2-sec D* > x Jones
Pixel Offset Uniformity within xx mV window None None None
Response Uniformity Mean +/- 20% Mean +/- 25% between 0.5 and 2.0 * mean None
Pixel Sensitivity None NEQ < zz ph/cm^2-sec None D* > z Jones
Allowed Defective Pixel Cluster1 of x pixels, 2 of y pixels, 5 of
z pixelsnone > x pixels Varies by region
and sub-region
none > y pixels and separated by
z pixelsRegion Pixel Requirements Moving 40 x 40 256 x 256 Center 100x100 Center 15x15
256x25 130 Radius Circle
Each region with moving 8x8 and 15x15 subregion
Engineering and manufacturing documentation can be a significant percentage of the total cost of an FPA, particularly for the small quantity builds common in the current state of the industry. These documents must all be duplicated for each and every set of specifications. This waste could largely be eliminated by the simple inclusion of an additional paragraph in the specification describing the scene library to be shown to the part and the required probabilities for success. A partial listing of the likely areas of cost savings based on simplified operations would include manufacturing documentation, test software, recurring test, engineering data evaluation, inspection, tooling, database setup and entry, and manufacturing data analysis. These functions can easily require 20-30% of the total recurring cost of a FPA build, and a savings of ~ 50% of this total (i.e. – 10% of the recurring FPA build) seems conservative.
5. WHAT SYSTEMS?
Incorporation of useful scene projector testing will be more complex for some IR systems than others.
Systems which use some form of automated tracking are the obvious choice as early adopters of scene projector testing. These systems, missile seekers, missile warners, automated search and track; can be mimicked by the use of identical (or similar) software to perform the tracking task at the FPA/IDCA level. A target “movie” would be shown to the FPA/IDCA under test and the output of the UUT given to the tracker algorithm. The outcome of the scene would then be graded (lost track, didn’t lose track) and a running score kept. This sequence would be repeated many times with a variety of targets and aspects to generate a probability of success. This value, when compared to the required probability, produces the desired quantitative grade based upon a realistic operational scenario.
“Man in the loop” devices such as FLIRs and reconnaissance cameras may initially require a different approach. Current testing often includes two separate test sequences. First a radiometric test is performed to evaluate the device’s NEDT, uniformity and defective pixel performance. A second test measures the “imaging quality” with some combination of fixed pattern noise (FPN), imaging artifacts identification, and a “calibrated” engineer evaluation of the

Page 11 of 12
image. Replacement of the static laboratory scene with a dynamic, projected scene would make the engineer’s role more effective, and permit a much more realistic evaluation of the device under test. At a minimum, certain specifications like MTF, that are currently tested only on a very limited number of components in “qualification” could be tested routinely on several locations on each FPA, thereby increasing the probability of a successful integration of that component at the top level assembly.
Use of automated target identification software as a replacement for the “calibrated” eyes of the engineer is the ultimate solution. Testing would then be similar to that used for tracker-based systems with various “targets” projected, and the data from the FPA/IDCA delivered to the target ID software for evaluation. A statistical evaluation of successful identification of a set of target scenes would be used to pass or fail the unit. An intermediate step, using the engineer as the automated target software, might be required if the state-of-the-art in target ID software is not sufficient for the task.
6. HARDWARE AND SOFTWARE REQUIREMENTS
The hardware requirements are for scene projector-based FPA/IDCA testing are similar to those of standard testing methodologies: electrical power, electronics interface and acquisition system, optics and bench, dewar and coolant, blackbody or other IR source, computer for running the acquisition and analysis/database of the result, and a test engineer to run and care for the hardware. The addition of a scene projector test in most existing FPA manufacturer facilities would require little in additional facilitation or material except for scene projector itself.
Software and firmware are quite different, and could require significant time and expense. In general, the requirements would be for image non-uniformity correction (NUC) and defective element substitution, target acquisition and tracking, and the test scenes themselves. There are several approaches which may be followed, each with their own strengths and weaknesses.
1) Image correction, tracking, and scenes based closely on the specific requirements of each program. The advantage to this approach is that the test will be as similar as possible to that required at the system level and so will have the best chance of minimizing any erroneous failure for the unit under test. This is expected to maximize the cost savings based on improved yield and reduced rework but would also be the most expensive to implement as each program would (again) have its own specific software.
2) Image correction and tracker based upon the program with scenes chosen from a standard library. In this case the FPA correction (NUC and defective pixel correction) and tracker algorithms are based upon the system which maximizes the similarity of these important, proprietary designs. Scenes used to test the devices would come from a library of standard scenes appropriate to the application of the component (i.e. – air-to-air missile seeker, air-to-ground missile seeker, surface-to-air missile seeker, etc.). These scenes would need to be generated and controlled by a central source for use by all companies. The advantage to this approach is that the most critical aspects of the system are utilized while a realistic set of scenes is available to test. The cost in creating the scenes is spread over many programs and companies, thus reducing the total implementation cost. The recurring savings should be similar to that for case 1) but the costs to implement would be somewhat less. An additional benefit of this approach is that it provides a “level playing field” for operational comparison of subcomponent-level devices produced by different suppliers.
3) Image correction, tracking and scenes based upon a standard library of software. Standard (2 point) NUC and simple (or no) defective element substitution together with a common generic tracking algorithm is used. The implementation and recurring costs are low but the test potentially is not as accurate as either case 1) or 2). The level of accuracy would almost certainly be an improvement over current test schemes. There would be the additional benefit of a common test across programs and companies allowing better comparison of current performance and improvement trends, as mentioned in 2), above. This could prove very useful to both the FPA manufacturers and their customers, and would be the least expensive approach to implement.

Page 12 of 12
In order to complete the testing as outlined in the approaches discussed here, the required software/firmware would include a standard set of scenes for each system type, NUC and defective pixel substitution algorithms, standard acquisition/tracking software, a method for scoring the result of any test. Many of these already exist or could be generated by modifying existing commercial applications.
7. CONCLUSIONS
While it may seem counter-intuitive to add an expensive test set and increased testing time in order to decrease costs, we have demonstrated the possibility for significant cost savings by incorporation of scene projector based testing at the IDCA/FPA level. This issue needs further review with accurate cost analyses by interested parties and testing of the underlying premise of this analysis: that a significant quantity of FPAs are rejected due to conservative and/or inaccurate specification flowdown and testing. Testing FPAs/IDCAs at a facility with existing scene projector capability to evaluate the potential yield improvement would determine the validity of that premise and lead to more widespread use of this technology. The two main issues preventing such testing today are the lack of a scene library and the unfamiliarity of FPA manufacturers with scene projector capabilities.
In addition to the potential cost improvements, a few other potential advantages to the proposed testing are consistent and comparable testing of components between programs and companies, reduced specification renegotiation, faster system design cycles, more on time deliveries, and more innovation through better use of engineering talent.
8. ACKNOWLEDGEMENTS
Thanks, I think, to Steve Solomon who got me into this business and to Jay James, Buddy Goldsmith, Dave Baley, Brett Beasely and Paul Bryant who gave me information and encouragement.
REFERENCES i Figure is a modified version of that included in a Power Point presentation titled “Dual Band FPA Manufacturing Industry Review”, W. Radford, D. King of Raytheon Vision Systems, May 11, 2005 ii Photos from SBIR website, http://www.sbir.com iii Photos from OSC website, http://www.opticalsciences.com/ iv Data from Brett Beasley, OSC, private conversation v Photos from RTTC website, http://www.rttc.army.mil/whatwedo/primary_ser/eoslab/dirsp.htm and G. Goldsmith, GWEF AFRL, private conservation vi LITENING cost estimate from http://www.defenseindustrydaily.com/2005/07/27m-for-litening-targeting-recon-pods/index.php