
Violation or strengthening of the self-financing doctrine at international airports by SMCP funded...
13
Violation or strengthening of the self-financing doctrine at international airports by SMCP funded PPP schemes? Claus Doll a, * , Kiril Karagyozov b,1 a Fraunhofer Institute for Systems and Innovation Research (ISI), Breslauer Str. 48, 76139 Karlsruhe, Germany b Higher School of Transport (VTU), Department “Technology, Organization and Management of Transport”, 158, Geo Milev Str, 1574 Sofia, Bulgaria Keywords: Aviation Public-Private Partnershops (PPP) Marginal Social Cost Pricing (MSCP) Capacity allocation abstract International airports are among the few examples of transport infrastructures which can well achieve self-financing. The growing interest of private companies in airport construction and operation is the visible testimony to this fact. However, the financing structures of airports are complex, involving not only traffic, passenger and goods handling, but also non-aviation services, such as retail, car parking or intermodal facilities. The integration of social marginal cost pricing schemes into this organizational structure according to the strategic plans of the European Commission, however, is challenging. This paper investigates whether they comply with a second strategic policy objective at European and national level, which is to foster publiceprivate partnerships (PPPs) in transport financing in terms of full cost coverage, risks and incentives. The cases analysed in this paper deal with two sites with very different characteristics: Munich Airport which has been publicly operated since 1991 and the Bulgarian airports Varna and Burgas, which have been managed since 2007 by one concessionaire and whose planning and future development is being accomplished with private capital. The results of both cases showed that self-financing is possible in case congestion costs are considered in the SMCP schemes, and given that air traffic growth rates return to the significant levels prior to the economic crisis. The chapter will discuss the legal implications of congestion pricing at European airports which are violating current EC legislation, as well as the impact of alternative pricing schemes on the environmental performance and technological innovation in aviation. Ó 2010 Elsevier Ltd. All rights reserved. 1. Introduction The operation of international airports differs significantly from that of land-based infrastructures, including an extremely high market dynamics, the absence of sunk assets established centuries ago and tax exemptions for all international and many national movements through the Chicago Convention (ICAO, 2006). In this environment, international aviation has grown into a mature industry with mainly privatised carriers, largely covering its own operating costs. In general, airlines and airports thus underline a self-financing paradigm, which differentiates them from the above mentioned surface transport infrastructures. In view of these thoughts, it could be concluded that funding and pricing measures in aviation constitute no major issue for policy or research. But taking into account the state aids paid to the aviation industry, national airlines and airports (EEA, 2007 for the European scale, Boss & Rosenschon, 2008 for Germany), and in particular to regional ones, the self-financing paradigm of the sector as a whole becomes questionable. It is further remarkable that PPPs to build and extend large international airports are still rare or have failed, as in the case of the German BerlineBrandenburg International Airport (BBI). Finally, aviation causes considerable external effects globally and in the vicinity of airports. The paper analyses the impacts of alternative pricing and fin- ancing schemes on traffic demand, airport revenues, financial risks and incentives provided by these schemes to airport opera- tors. In the light of the European Commission approach towards charging transport sectors according to their marginal social costs (EC, 1998) the following research questions arise: Can the revenues of alternative pricing systems cover airport- specific costs, and if not, which alternatives are available? Which impacts do alternative prices have on demand and how do they impact congestion and environmental effects? Which risks do alternative pricing schemes impose on airport operators and which incentives towards monopolistic profit maximization behaviour need to be considered? * Corresponding author. Tel.: þ49 721 6809 354. E-mail addresses: [email protected] (C. Doll), kkaragyozov@yahoo. com (K. Karagyozov). 1 Tel.: þ359 2 9709 319. Contents lists available at ScienceDirect Research in Transportation Economics journal homepage: www.elsevier.com/locate/retrec 0739-8859/$ e see front matter Ó 2010 Elsevier Ltd. All rights reserved. doi:10.1016/j.retrec.2010.10.009 Research in Transportation Economics 30 (2010) 74e86
-
Upload
independent -
Category
Documents
-
view
4 -
download
0
Transcript of Violation or strengthening of the self-financing doctrine at international airports by SMCP funded...

lable at ScienceDirect
Research in Transportation Economics 30 (2010) 74e86
Contents lists avai
Research in Transportation Economics
journal homepage: www.elsevier .com/locate/retrec
Violation or strengthening of the self-financing doctrine at international airportsby SMCP funded PPP schemes?
Claus Doll a,*, Kiril Karagyozov b,1
a Fraunhofer Institute for Systems and Innovation Research (ISI), Breslauer Str. 48, 76139 Karlsruhe, GermanybHigher School of Transport (VTU), Department “Technology, Organization and Management of Transport”, 158, Geo Milev Str, 1574 Sofia, Bulgaria
Keywords:AviationPublic-Private Partnershops (PPP)Marginal Social Cost Pricing (MSCP)Capacity allocation
* Corresponding author. Tel.: þ49 721 6809 354.E-mail addresses: [email protected] (C
com (K. Karagyozov).1 Tel.: þ359 2 9709 319.
0739-8859/$ e see front matter � 2010 Elsevier Ltd.doi:10.1016/j.retrec.2010.10.009
a b s t r a c t
International airports are among the few examples of transport infrastructures which can well achieveself-financing. The growing interest of private companies in airport construction and operation is thevisible testimony to this fact. However, the financing structures of airports are complex, involving notonly traffic, passenger and goods handling, but also non-aviation services, such as retail, car parking orintermodal facilities. The integration of social marginal cost pricing schemes into this organizationalstructure according to the strategic plans of the European Commission, however, is challenging. Thispaper investigates whether they comply with a second strategic policy objective at European andnational level, which is to foster publiceprivate partnerships (PPPs) in transport financing in terms of fullcost coverage, risks and incentives.
The cases analysed in this paper deal with two sites with very different characteristics: Munich Airportwhich has beenpublicly operated since 1991 and the Bulgarian airports Varna and Burgas,which have beenmanaged since 2007 by one concessionaire and whose planning and future development is beingaccomplished with private capital. The results of both cases showed that self-financing is possible in casecongestion costs are considered in the SMCP schemes, and given that air traffic growth rates return to thesignificant levels prior to the economic crisis. The chapter will discuss the legal implications of congestionpricing at European airports which are violating current EC legislation, as well as the impact of alternativepricing schemes on the environmental performance and technological innovation in aviation.
� 2010 Elsevier Ltd. All rights reserved.
1. Introduction
The operation of international airports differs significantly fromthat of land-based infrastructures, including an extremely highmarket dynamics, the absence of sunk assets established centuriesago and tax exemptions for all international and many nationalmovements through the Chicago Convention (ICAO, 2006). In thisenvironment, international aviation has grown into a matureindustry with mainly privatised carriers, largely covering its ownoperating costs. In general, airlines and airports thus underlinea self-financing paradigm, which differentiates them from theabove mentioned surface transport infrastructures.
In view of these thoughts, it could be concluded that funding andpricing measures in aviation constitute no major issue for policy orresearch. But taking into account the state aids paid to the aviationindustry, national airlines and airports (EEA, 2007 for the European
. Doll), kkaragyozov@yahoo.
All rights reserved.
scale, Boss & Rosenschon, 2008 for Germany), and in particular toregional ones, the self-financing paradigm of the sector as a wholebecomes questionable. It is further remarkable that PPPs to buildand extend large international airports are still rare or have failed, asin the case of the German BerlineBrandenburg International Airport(BBI). Finally, aviation causes considerable external effects globallyand in the vicinity of airports.
The paper analyses the impacts of alternative pricing and fin-ancing schemes on traffic demand, airport revenues, financialrisks and incentives provided by these schemes to airport opera-tors. In the light of the European Commission approach towardscharging transport sectors according to their marginal social costs(EC, 1998) the following research questions arise:
� Can the revenues of alternative pricing systems cover airport-specific costs, and if not, which alternatives are available?
� Which impacts do alternative prices have on demand and howdo they impact congestion and environmental effects?
� Which risks do alternative pricing schemes impose on airportoperators and which incentives towards monopolistic profitmaximization behaviour need to be considered?

C. Doll, K. Karagyozov / Research in Transportation Economics 30 (2010) 74e86 75
These research questions are discussed for two very differentairport locations: firstly, a major international hub in an establishedand prosperous economic centre of the European Union andsecondly, two international airports in the New Member States onthe periphery of the Community. In the first case we chose MunichAirport, located in southern Germany, while in the second case weinvestigate the Bulgarian airports of Varna and Burgas.
The researchworkwas carried out in the research project ENACTfunded by the European Commission between 2007 and 2009(TIS.pt, 2010). The paper starts with a short introduction to theENACTmethodology (Section 2), discusses the approach and resultsfor the two locations (Sections 3 and 4) and finally draws conclu-sions by returning to the research questions (Section 5).
2. The ENACT study
The project ENACT e Design Appropriate Contractual Relation-ships e was funded under the 6th Framework Programme of theEuropean Commission and carried out between May 2007 andDecember 2009, under the co-ordination of TIS.pt, Lisbon (TIS.pt,2010). The objective of the project was to explore suitable designsof publiceprivate partnerships (PPPs) in the transport sector and toexplore the feasibility and the impacts of social marginal costpricing schemes (SMCPs) on them.
The ENACT research started by exploring existing knowledgeabout SMCP and second-best solutions, on contract design,financing schemes and on risk assessment procedures. In a secondstep, the theoretical findingswere used to develop a simulation toolthat allowed assessment of the following six case studies. (A):Italian motorways, (B): Tagus river rail crossing, (C): Varna andBurgas Airports, (D): Munich Airport, (E): Lisbon Area motorwayconcessions and (F): Orkdalsvegen. The primary objectives of thecase studies were to identify and analyse implications of SMCP inPPPs and to discuss available alternatives of pricing and PPP designin transport infrastructure operations.
The ENACT Simulation Tool (EST) provides a multi-periodframework for estimating investment, operating and external costsand revenues of arbitrary infrastructure assets and service opera-tions. Non-linear congestion and environmental cost functions inconjunction with demand elasticity values allow us to estimatedemand risks and profit maximization functions, enabling themodel to calculate incentives for bad behaviour of private opera-tors. A balance sheet functionality finally allows computation ofcost coverage indicators and net present values. The EST is imple-mented in Microsoft Excel to facilitate its application by all projectpartners and to simplify data input and output procedures.
The subsequent sections summarize the twoaviation-relatedcasestudies forMunich Airport and for Varna and Burgas Airports (TIS.pt,2009) by describing their environment, discussing basic transportand economic indicators and presenting the results of the EST.
3. Munich airport
3.1. The application case
Munich “Franz-Josef-Strauss” Airport was built between 1980and 1992. Since it’s opening for traffic in 1992 the new airport hastaken over all business from the historic city airport “MunichRiem”. It consists of two terminals serving two runways, wherebyTerminal 2 was constructed and is operated by a joint venturebetween the airport and Deutsche Lufthansa. With a 5.4% year-by-year growth in passengers between 1992 and 2007, the airportranges among the fastest developing ones in Germany and world-wide. With regard to the number of passengers, Munich Airportranks second in Germany and seventh in Europe (FMG, 2009a,b).
The airport is operated by the “Flughafen München GmbH”(FMG), a company with limited liability to private law. FMG is 100%owned by the city of Munich (23%), the State of Bavaria (51%) andthe German federal government (26%). In the initial phase, thecapital owners supported the development of Munich Airport byloan, onwhich interest is to be paid only in the case of profits, whilein periods closing with operative losses interest payments can betransferred to future years.
Actual runway capacity of 90 flights per hour was completelyutilized during 5 h per day in 2008. Accordingly, a third parallelrunway with a size of 4000 times 60 m to increase hourly capacityto 120 flight movements has been in planning since 2005. Due tothe high number of nearly 60,000 legal claims by citizens’ organi-zations and surrounding communities, it will not be opened totraffic before 2013. The design and construction costs of the runwayare estimated to range between V 500 million and V 1 billion.
In 2008, Munich Airport started a three-year trial period ofcharging aircraft landing fees depending on emissions. These canamount to 5% of total landing fees and are designed to be revenue-neutral to previous landing fees. Other German airports which haveintroduced the system so far are Frankfurt, Stuttgart and Cologne.
The main focus of the subsequent research is to answer thequestion whether the respective marginal social cost pricingschemes suffice to fund airport operation and extension and whichimpacts they have on risks and incentives.
3.2. Demand projections until 2035
In the Munich Airport case study, annual air traffic movements(ATM) represent the single indicator of traffic demand. Otherrevenue determining components like aircraft characteristics,passenger and cargo volumes are considered through average loadrates, maximum take-off weights, noise levels and air emissionfactors. Hourly and seasonal fluctuations in demand are taken intoaccount indirectly, by setting delay and congestion values on thebasis of detailed flight movement analyses. The base year for thedemand forecasts is 2005 and the target year is 2035. Consideringthe planning horizon of the current planning process for the thirdrunway, 2020 constitutes an important intermediate forecast year.
Until 2020, the official forecast (ITP, 2006) considers two cases ofdemand development. With the current two runways, systemcapacity would remain at 470,000 ATMmovements per year, whichimplies the average annual growth rate to be as low as 1.3%. In thecase of adding a third runway, capacity would increase to 630thousand movements, of which 610 thousand movements will bereached in 2020. Starting from 2007 traffic volumes, this implies anannual growth rate of roughly 3.0%.
Within the 30 year forecast horizon we consider none but theplanned runway extension, becoming operational in 2013.Although growth rates are mainly limited by the tight airportcapacity, latest world air traffic forecasts even before the crises(EUROCONTROL, 2009) until 2030 indicate declining growth ratesin the medium to long term. It is argued that traffic growth is notevenly distributed in time, due to the increasing maturity of themarket, i.e. saturation effects, pressure on ticket prices due to risingoil and CO2 prices and increasing airport and airspace congestion.For Germany, we further assume capacity impacts from extendingFrankfurt Airport and opening the new BerlineBrandenburgInternational Airport (BBI), demographic impacts and the rise ofregional airports limiting future traffic growth at Munich Airport.
For the subsequent analyses of pricing and investment schemes,we distinguish between potential demand from realized demand,which again is differentiated by the variants considered. Potentialdemand assumes a growth rate of 2.8% from 2005 until 2020 and1.8% until 2035, derived from EUROCONTROL (2009). This results in

Annual costs of airport operation relation to flight movements at
Munich Airport 1999 to 2007
200
400
600
800
1'000
1'200
250 300 350 400 450
Aircraft Movement
)€.llim
ni(stsoclaunnalatoT
Fig. 2. Development of total costs and revenues with ATM from 1999 to 2007. Source:Compilation using data from FMG (2009a,b) and earlier editions.
C. Doll, K. Karagyozov / Research in Transportation Economics 30 (2010) 74e8676
793,000 movements or a capacity use of 126% and thus seriouslychallenges traffic quality and reliability standards. Realized demandfor the various pricing scenarios assumes growth rates of 2.8%according to current planning documents, and then curbing thegrowth to 0.5% in order not to violate capacity limits of 630,000movements. In addition, two sensitivity variants with low demandaccording to the “fragmented world” scenario in EUROCONTROL(2009a) and with high demand according to EUROCONTROL’s“global growth” scenario are tested. The resulting annual air trafficmovements at Munich Airport are presented in Fig. 1.
3.3. Evolution of cost and revenue structures
For a proper estimation of airport pricing scenarios and theirfinancial viability, we need to have an idea of airport cost andrevenue structures (Fig. 2). Ideally, specific information for theaviation and the non-aviation sector (dual till approach) would berequired to estimate the social marginal infrastructure costs causedby a single air traffic movement. But this information cannot beretrieved from the airport’s financial services, and therefore weconsider the airport as a single utility (single till approach). Theonly information we have is that, of total revenues, 50% are avia-tion-related and that take-off and landing charges, which aresubject for replacement introducing alternative pricing schemes,contribute less than 30% to the airport’s income. Half of these arecurrently depending on the aircrafts’ noise categories and, toa much smaller portion, on their emission standards. Table 1 showsMunich Airport’s cost and revenue structure in 2008.
In order to estimate long-term trends of airport financial figures,we havemade a simple regression of costs and revenues taken fromthe airport’s balance sheets over traffic volumes from 1998 to 2007.The results show a clearly over-proportionate growth of totalairport costs and of total revenues with demand. As data avail-ability requires taking the single till approach, we cannot saywhether this is solely due to expanding business in the non-avia-tion sector or also aviation facilities show such increasing costs andrevenues to scale. Thus we take the simple assumption that bothairport sectors develop proportionally. Landing and take-offcharges, which are later replaced by alternative pricing schemes,are assumed to have a fixed share of 30% of total revenues. On top ofthese we have added the capitalised investment and operationcosts of the third runway.
3.4. Alternative pricing schemes
The revenues to be replaced by marginal social cost pricing feesare those charged to airlines for landing and take-off. We limit the
Air Traffic Movements by Variant 2005 - 2035
300'000
400'000
500'000
600'000
700'000
800'000
900'000
2005 2008 2011 2014 2017 2020 2023 2026 2029 2032 2035
ATM
POTENTIAL DEMAND
V1: BASE
V3: LOW DEMAND
V4: LOW CAPACITY
Fig. 1. Demand development by variants 2005 to 2035. Source: Estimates byFraunhofer-ISI.
scope of this research to the marginal social costs of infrastructureuse, congestion, air pollution and noise. Air accidents are dis-regarded as they are to a great extent influenced by air trafficmanagement and can thus hardly be controlled by airport regula-tions. Accordingly, the security-related costs of public authorities atairports and of air traffic control are ignored. Climate costs are notconsidered because the upcoming inclusion of air traffic in theEuropean Emissions Trading Systemwill internalize this social costcategory. Finally, ground handling is ignored here, as it is regulatedby handling companies on the basis of the EU Ground HandlingDirective 96/97EC (EC, 1996).
Marginal social infrastructure costs are considered in two vari-ants: short-run costs for maintenance and repair measures directlyattributable to aircraft movements, and long-run costs which takeaccount of the capacity demand of each movement, and thus of itsresponsibility for capacity extension needs. Both variants of infra-structure costs are estimated using the results of the GRACE casestudies (GRACE, 2006). Here, short-run infrastructure costs havebeen derived from time series of total annual costs and flightmovements at Munich Airport, while long-run marginal infra-structure costs are estimated by cross airport regressions fora particular year. Translated into air traffic movements, GRACE(2006) arrives at short-run infrastructure costs of roughly V 290and long-run costs of around V 640 per ATM. GRACE also followsthe single till approach, but differentiates costs into ATM-relatedand passenger-/cargo-related shares. Herewe apply the 30%-rule tothe latter segment in order to eliminate non-aviation-related socialmarginal infrastructure costs. While the resulting long-runmarginal costs cover actual average landing fees by at least 89%,short-run marginal infrastructure costs amount to only 40% ofcurrent revenues. For future development we assume that short-
Table 1FMG costs and revenues 2008.
Cost category V m Share Revenue category V m Share
Materials 286.9 26.1% Landing fees by emissions 6.0 0.5%Personnel 314.1 28.6% Landing fees by noise 136.1 12.4%Depreciation 124.4 11.3% Other landing fees 173.7 15.8%Other costs 231.7 21.1% Other aviation revenues 232.1 21.1%Associations
interest124.3 11.3% Non-aviation revenues 495.8 45.1%
Taxes 8.1 0.7% Other revenues 59.6 5.4%Profit transfer
agreement9.7 0.9%
Total 1099.2 Total 1103.3Group profit 4.1
Source: Data from FMG (2009a).
Marginal external costs per ATM at Munich airport
0
200
400
600
800
1'000
1'200
1'400
1'600
1'800
2'000
2005 2035 2005 2035 2005 2035 2005 2035
V1: BASE V2: LRMC V3: DEMAND V4:CAPACITY
MTA/€(stso
C)
MC Infrastructure MC Congestion MC Air Pollution MC Noise
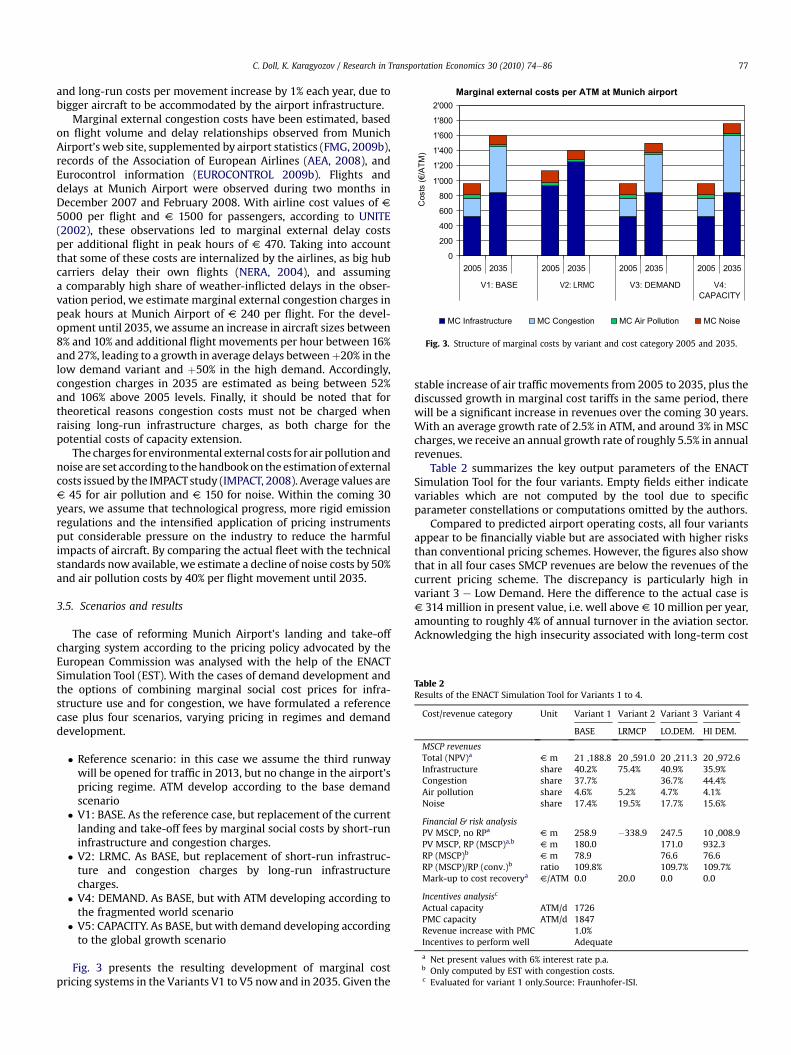
Fig. 3. Structure of marginal costs by variant and cost category 2005 and 2035.
Table 2Results of the ENACT Simulation Tool for Variants 1 to 4.
Cost/revenue category Unit Variant 1 Variant 2 Variant 3 Variant 4
BASE LRMCP LO.DEM. HI DEM.
MSCP revenuesTotal (NPV)a V m 21 ,188.8 20 ,591.0 20 ,211.3 20 ,972.6Infrastructure share 40.2% 75.4% 40.9% 35.9%Congestion share 37.7% 36.7% 44.4%Air pollution share 4.6% 5.2% 4.7% 4.1%Noise share 17.4% 19.5% 17.7% 15.6%
Financial & risk analysisPV MSCP, no RPa V m 258.9 �338.9 247.5 10 ,008.9PV MSCP, RP (MSCP)a,b V m 180.0 171.0 932.3RP (MSCP)b V m 78.9 76.6 76.6RP (MSCP)/RP (conv.)b ratio 109.8% 109.7% 109.7%Mark-up to cost recoverya V/ATM 0.0 20.0 0.0 0.0
Incentives analysisc
Actual capacity ATM/d 1726PMC capacity ATM/d 1847Revenue increase with PMC 1.0%Incentives to perform well Adequate
a Net present values with 6% interest rate p.a.b Only computed by EST with congestion costs.c Evaluated for variant 1 only.Source: Fraunhofer-ISI.
C. Doll, K. Karagyozov / Research in Transportation Economics 30 (2010) 74e86 77
and long-run costs per movement increase by 1% each year, due tobigger aircraft to be accommodated by the airport infrastructure.
Marginal external congestion costs have been estimated, basedon flight volume and delay relationships observed from MunichAirport’s web site, supplemented by airport statistics (FMG, 2009b),records of the Association of European Airlines (AEA, 2008), andEurocontrol information (EUROCONTROL 2009b). Flights anddelays at Munich Airport were observed during two months inDecember 2007 and February 2008. With airline cost values of V5000 per flight and V 1500 for passengers, according to UNITE(2002), these observations led to marginal external delay costsper additional flight in peak hours of V 470. Taking into accountthat some of these costs are internalized by the airlines, as big hubcarriers delay their own flights (NERA, 2004), and assuminga comparably high share of weather-inflicted delays in the obser-vation period, we estimate marginal external congestion charges inpeak hours at Munich Airport of V 240 per flight. For the devel-opment until 2035, we assume an increase in aircraft sizes between8% and 10% and additional flight movements per hour between 16%and 27%, leading to a growth in average delays betweenþ20% in thelow demand variant and þ50% in the high demand. Accordingly,congestion charges in 2035 are estimated as being between 52%and 106% above 2005 levels. Finally, it should be noted that fortheoretical reasons congestion costs must not be charged whenraising long-run infrastructure charges, as both charge for thepotential costs of capacity extension.
The charges for environmental external costs for air pollution andnoise are set according to thehandbookon theestimationof externalcosts issued by the IMPACTstudy (IMPACT, 2008). Average values areV 45 for air pollution and V 150 for noise. Within the coming 30years, we assume that technological progress, more rigid emissionregulations and the intensified application of pricing instrumentsput considerable pressure on the industry to reduce the harmfulimpacts of aircraft. By comparing the actual fleet with the technicalstandards now available, we estimate a decline of noise costs by 50%and air pollution costs by 40% per flight movement until 2035.
3.5. Scenarios and results
The case of reforming Munich Airport’s landing and take-offcharging system according to the pricing policy advocated by theEuropean Commission was analysed with the help of the ENACTSimulation Tool (EST). With the cases of demand development andthe options of combining marginal social cost prices for infra-structure use and for congestion, we have formulated a referencecase plus four scenarios, varying pricing in regimes and demanddevelopment.
� Reference scenario: in this case we assume the third runwaywill be opened for traffic in 2013, but no change in the airport’spricing regime. ATM develop according to the base demandscenario
� V1: BASE. As the reference case, but replacement of the currentlanding and take-off fees by marginal social costs by short-runinfrastructure and congestion charges.
� V2: LRMC. As BASE, but replacement of short-run infrastruc-ture and congestion charges by long-run infrastructurecharges.
� V4: DEMAND. As BASE, but with ATM developing according tothe fragmented world scenario
� V5: CAPACITY. As BASE, but with demand developing accordingto the global growth scenario
Fig. 3 presents the resulting development of marginal costpricing systems in the Variants V1 to V5 nowand in 2035. Given the
stable increase of air traffic movements from 2005 to 2035, plus thediscussed growth in marginal cost tariffs in the same period, therewill be a significant increase in revenues over the coming 30 years.With an average growth rate of 2.5% in ATM, and around 3% in MSCcharges, we receive an annual growth rate of roughly 5.5% in annualrevenues.
Table 2 summarizes the key output parameters of the ENACTSimulation Tool for the four variants. Empty fields either indicatevariables which are not computed by the tool due to specificparameter constellations or computations omitted by the authors.
Compared to predicted airport operating costs, all four variantsappear to be financially viable but are associated with higher risksthan conventional pricing schemes. However, the figures also showthat in all four cases SMCP revenues are below the revenues of thecurrent pricing scheme. The discrepancy is particularly high invariant 3 e Low Demand. Here the difference to the actual case isV 314 million in present value, i.e. well above V 10 million per year,amounting to roughly 4% of annual turnover in the aviation sector.Acknowledging the high insecurity associated with long-term cost
C. Doll, K. Karagyozov / Research in Transportation Economics 30 (2010) 74e8678
and revenue forecasts, the financial viability of the alternativepricing regimes becomes highly questionable.
Revenue risks are estimated taking the principal volume-delayfunction sketched by DLR (2007) for commercial airports con-cerning congestion revenues into consideration. The elasticity ofMSCP revenues with respect to changes in demand is reported,ranging between 4.37 (Variant 4) and 5.04 (Variant 5) whencongestion charges are included. This means that a 1% change indemand implies a roughly 4.7% change in MSCP revenues. Theseelasticities are very high and imply a high revenue risk or insecurityfor the airport operator when prices are strictly set according tomarginal external costs. In case congestion costs are excluded, as inVariants 2 (LRMC) or congestion levels are low, as in Variant 3 (LODEMAND), revenue elasticity to demand is close to unity. Nospecific revenue risk on top of the demand risk exists in these cases,which makes them more attractive to risk-averse investors.
3.6. Impacts on risks and incentives
Air traffic volumes, and thus the income of airports, are verysensitive to external factors, such as world economic development,sabotage like the terrorist attacks of 9/11, strikes, fuel costs or theeconomic performance and business models of airlines. Theconditions for airports become even more difficult as airlines pushtowards shifting more fees from fixed tariffs based on aircraftweight, into variable, passenger-dependent elements. We thusassume a relatively high risk premium under current pricingconditions of 10%.
For all variants charging for congestion costs, Table 2 reportsa risk premium which is roughly 10% above the conventionalpremium. Although the expected differences to the current systemof airport charges are not big, the transition to marginal social costprices leads to a more risky and less profitable situation. Taking thisincreased revenue risk into account reduces the net present value(NPV) for the BASE and LO DEMAND variants by roughly 30%.
But it must be emphasised that these figures still do not takeinto account the congestion solved by the several air traffic controlentities in the airspace. To get the full picture of demand andcapacity risks in the aviation sector, the airports should thus beconsidered jointly with the air traffic management for flightsapproaching and leaving the airport. The current setting deliversonly a partial picture of the true conditions and inter-relations.
Eventually, financial risks external to the airport operator arisefrom investment decisions at competing locations, namely Frank-furt and, to a lesser extent, the new BerlineBrandenburg Interna-tional Airport (BBI). A considerable delay or cancellation of the thirdrunway at Munich could change the hub concept of Lufthansa andits alliance partners with drastic implications for Munich’s financialresults.
In the incentives analysis, the EST searches for the level ofinfrastructure capacity which would maximise the infrastructuremanager’s profit, generated either by increasing congestion reve-nues or by additionally attracting demand. In the current case ofMunich Airport, this profit maximizing capacity (PMC) is found tobe well above current capacity for all four variants.
The computed additional capacity ranges around 28% abovecurrent capacity, which would justify a fourth runway. In otherwords, under the assumptions taken, the airport operators are notexpected to have any incentives to artificially shorten capacity toincrease congestion revenues. Until 2035, this additional capacity isexpected to meet potential demand increases which could beattracted by the airport in the absence of capacity limitations. Thepotential slow-down of future market growth rates, however, willmost likely ease the problem of infrastructure scarcity at MunichAirport from occurring, despite investment in the third runway.
4. The construction of Varna and Burgas airports
4.1. The application case
The airports Varna and Burgas serve the Black Sea region andmainly the international tourist traffic, which is generated princi-pally in the summer months (June, July and August). The basis forthe traffic growth is the intensive tourist business development,with its high seasonal profile. Traffic is determined by the demandof generalized tourist service products. Airport charges have aninsignificant share in the aggregate price of the product. There is nopossible alternative mode of transport to serve the Internationaltourist traffic.
This case study considers the pre-history of the concessionprocedure of Burgas and Varna airports, the granting of the con-cession, the nearly 2-year term of operation of the concessionaire, aswell as the predicted results of the concessionaire’s activity in theperiod 2009e2041.
Based on the analysis of international experience with airportoperation, the Bulgarian government accepted a strategy fordeveloping and modernizing Burgas and Varna airports and alsoa publiceprivate partnership (PPP) as the most appropriate form ofconcession. The concession procedure started in 2003 and wascompleted after approx. 40 months due to appeals by the othercandidates. With the choice of concessionaire as operator of bothairports e the shareholder company Fraport Twin Star AirportManagement (capital shares are 60% FRAPORT AG Frankfurt AirportServices Worldwide, Germany and 40% “BM Star” Ltd., Bulgaria),the concession started at the beginning of 2007.
The contracted parameters of the concession (Burgas and VarnaAirports) are: a concession term of 35 years, concession stateremuneration (concession fee) including initial payment of conces-sion tax of V 3 million, and annual state remuneration payment tothe government implemented twice a year in the amount of 19.2% ofthe generated revenues of all activities, both regulated (54e56%) andnon-regulated (44e46%).
The main problems in relation with the capacity of both airportterminals arise during the summer months (June, July and August),as during that period they serve about 70% of the annual passengerdemand and 60% of annual aircraft movements in the long run. Thelong-term forecasts show a stable aviation traffic increment. Thefact that in the last few years the Bulgarian Black Sea resorts havebeen overpopulated creates a potential risk that the growth rate oftourist traffic will decrease. However, the trend towards theincrease in the share of the regular internal flights is positive.
The concession contract determines the allocation of risksbetween the two parties, the concessionaire and the government.All important risks connected with investments and construction,management and exploitation or commercial activities are assumedby the private party. The ownership, especially of the fixed assets, isnot given to the concessionaire. The concessionaire is obliged toinvest the amount of V 403 million in both airports during theconcession period. This fact predetermines that the concessionairefaces a high investment risk which is very sensitive to traveldemand. To ensure full coverage of operating and investment costs,it is thus favourable from the concessionaire’s perspective that traveldemand is inelastic to increments of airport charges.
4.2. Demand projections until 2035
The airports Burgas and Varna are both managed by oneconcessionaire, Fraport Twin Star Airport Management. The initialyear for the case study is 2007, which corresponds to the start of thepubliceprivate partnership (PPP). The long-term horizon matchesthe 35-year period of the concession, i.e. till 2041.

Burgas Airport ATM Forecast
M(t) = 1,364.t - 2724,5base R2 = 0,9807
M(t)= 0,8057t - 1600,1pessim R2 = 0,9965
0
10
20
30
40
50
60
70
5002
0102
5102
0202
5202
0302
5302
0402
5402
Year
)0
00
1(
st
ne
me
vo
M
Burgas Forecasts-Base Burgas Forecasts-Pessim
C. Doll, K. Karagyozov / Research in Transportation Economics 30 (2010) 74e86 79
Traffic forecast data for Varna and Burgas Airports are retrievedfrom the elaborated master plans in three scenarios e base trend,optimistic and pessimistic scenarios. As a result of the recent worldeconomic and financial crisis, compared with the forecast in thebase scenario (given in Burgas airport master plan), there isa certain delay related to the forecast in 2008. This gives us reasonto assume the forecasting of the pessimistic scenario (Figs. 4e6)where in 2008 there are about 2 million passengers. Consequently,further sensitivity or reaction of the model will be investigated inrelation to the pessimistic scenario of the forecast (Fig. 7).
Since the study was carried out in 2008, obviously it does notreport the additional drop in passengers and movements for 2009.Finally, regression equations enablingmovements to be forecast areestablished for three different scenarios as presented in Table 3:
Linear (Burgas Forecasts-Base) Linear (Burgas Forecasts-Pessim )
Fig. 5. Burgas airport ATM forecast.
4.3. Evolution of cost and revenue structuresThe general structure of revenues is 54e55% in regulatedactivities (passenger, landing and aircraft parking charges) and45e46% in non-regulated activities (ramp, passengers and cargoservices, fuel loading, catering and commercial). The generalstructure of costs is 60e62% in regulated activities (including 19.2%of revenue concession fee) and 38e40% in non-regulated activities.The total costs and revenues of both airports Varna (42% of reve-nues, 45% of costs) and Burgas (58% revenues, 55% costs) for 2008are given in Table 4.
On the basis of the detailed investment plan for the 5-yearperiod (2007e2011) and of the predicted demand for thewhole 35-year concession period, the values of the cost and the revenuesfrom the separate groups are forecast. Financial costs forecasts areimplemented on the basis of liabilities variation modelling. Thevariation of the liabilities depends on the forecasted total invest-ments and cash flow after equity increment, loans from share-holders, long-term credits and their debt amortization plans havebeen taken into account.
Profit taxation values are determined with the followingassumptions: 10% rate of profit taxation and depreciation costsbased on depreciation rates of different assets. Subsidies are usedwith a negative sign within the EST to report the paid by theconcessionaire concession fee forecasted as 19.2% of the total reve-nues from regulated and non-regulated activities.
4.4. Alternative pricing schemes
The alternative pricing scheme is based on the analysis of thesocial marginal cost pricing schemes to generate sufficient reve-nues and at the same time to be financial viable. The main marginal
Passenger traffic forecasts
0
2
4
6
8
10
12
2005 2010 2015 2020 2025 2030 2035 2040 2045year
sn
oili
lm
(s
re
gn
es
sa
P)
Burgas base Burgas opt Burgas pessim Varna base Varna opt varna pessim
Fig. 4. Passenger traffic forecasts.
costs considered in the research are infrastructure, congestion, airpollution, global warming and noise costs. Accident costs are nottaken into consideration.
In the present case, 8 scenarios were elaborated for each of thetwo airports, with expressed differences in several aspects: trafficlevel e base and pessimistic, infrastructure costs short-runmarginal costs (SRMC), long-run marginal costs (LRMC), withaviation and non-aviation costs and revenues considered sepa-rately. Considered scenarios are presented in the table below:(Table 5)
Two different cases of values were assumed for infrastructurecosts: average operating costs per movement excluding deprecia-tion are representing short-run marginal costs (SRMC), while long-runmarginal costs (LRMC) are determined by the average operatingcosts per movement, including depreciation based on the invest-ment profile during the concession period. These values are taken inboth the base trend and in the pessimistic scenarios.
The main assumptions are an inflation rate of on average 5.0%for the period 2007e2011 and on average 2.0% after 2011 per yearand a nominal discount rate of 8.1%, corresponding to a realdiscount rate of 6.0%.
On the basis of the income statements forecasts for 2007e2011and projection of their values for the whole concession period, weapproached to the main average values per movement (2007) andgrowth rate factors (2007e2041) by airports and scenarios (Table 6).
The time delays per aircraft movement have been estimated bycreating a delay cost function, which takes into account the impact
Varna Airport ATM Forecast
M(t) = 1,3761.t - 2748,2base R2 = 0,9822
M(t) = 0,6258t - 1237,9pessim R2 = 0,9962
01020
3040506070
5002
0102
5102
0202
5202
0302
5302
0402
5402
Year
st
ne
me
vo
M(
00
01
)
Varna Forecasts-base Varna Forecasts-pessimLinear (Varna Forecasts-base) Linear (Varna Forecasts-pessim)
Fig. 6. Varna airport ATM forecast.

Table 4Costs and revenues 2008 (Varna and Burgas airports).
Cost category MV Share 2008/2007
Revenue category MV Share 2008/2007
Materials 2.3 7.1% �10.4% Aviation (landingand Pax fee)
21.9 53.9% �1.4%
Personnel 12.1 37.3% �17.0% Other aviationrevenues
13.2 32.5% �8.3%
Depreciation 3.9 12.0% 28.7% Non-aviationrevenues
5.5 13.6% 13.0%
Other costs 4.5 14.0% 24.5% Other revenues 0.02 0.1%Concession fee 7.8 24.2% �1.5%Interests 0.8 2.5% 42.5%Taxes 0.9 2.9% �4.7%TOTAL 32.3 62.2% TOTAL 40.7 100.0%Net Profit 8.3
Monthly Movements - Burgas and Varna Airports for the Period 2006 - 2008
0
500
1000
1500
2000
2500
3000
3500
4000
4500
1 2 3 4 5 6 7 8 9 10 11 12Months
st
ne
me
vo
M
Burgas 2008Varna 2008
Burgas 2006 Burgas 2007
Varna 2006Varna 2007
Fig. 7. Monthly Movement Traffic 2006e2008 d Varna and Burgas Airports. Source:Fraport.
C. Doll, K. Karagyozov / Research in Transportation Economics 30 (2010) 74e8680
of the seasonal character of demand. It can be seen in Fig. 4 thatthere is a high monthly fluctuation in the number of movementsthat could be ascribed to the seasonal character of the traffic.
4.4.1. On the basis of the above, three periods in the yearcharacterizing the traffic level can be fixed
� Peak period which is 3 months long (June, July and August)when for the separate years the total number of movements forboth airports varies from 57.9% up to 61.6% of all movements,and the demand from 70.4% up to 71.4% of summary yearlydemand;
� Medium periodse in themonthsMay and September when forthe separate years the total number of movements for bothairports varies from 22.4% up to 24% of all movements, and thedemand from 21.6% up to 22.9% of summary yearly demand;
� Non-peak periods in the other 7months (1e4,10e12) when forthe separate years the total number of movements for bothairports varies from 14.4% up to 19.6% of all movements, andthe demand from 6.6% up to 7.4% of summary yearly demand.
According to the data above, the greatest demand and capacityutilization of the airports are observed during peak months due totourist trips. The expansion process of airport terminals andcapacity increment till 2008 is accompanied with the realization ofcosts because of delays. If there are delays, they only occur at thepeak periods since at this time the demand value approaches thecapacity figure. Delay cost shares are highest in these months. Thatis why in off-peak periods there are actually no delay costs, or ifthey do occur, they are negligibly small. Therefore determiningannual delay costs necessitates the creation of a function todescribe the relationship between the average yearly delay toservice time ratio, depending on the movements and the capacity.With this target in view we created a function based on thefollowing assumption: the function has to report the annual fluc-tuation of capacity utilization, i.e. reflect the fact that actual delaycosts are generated during the peak period and for the remainingperiods of time e medium and non-peak e the delay costs share
Table 3Movement forecasts (Varna and Burgas airports).
Scenario Airport Total Movements M(t) ¼ Mo.(1 þ a.t)
Base Trend Burgas M(t) ¼ Mo.(1 þ 0.058.t)Varna M(t) ¼ Mo.(1 þ 0.056.t)
Optimistic Burgas M(t) ¼ Mo.(1 þ 0.075.t)Varna M(t) ¼ Mo.(1 þ 0.063.t)
Pessimistic Burgas M(t) ¼ Mo.(1 þ 0.047.t)Varna M(t) ¼ Mo.(1 þ 0.036.t)
Note: Mo ¼ Movements (2007) and t e year.
can be ignored. The function is established on the basis of the 3month peak period. Multiplying the average month demand atpeak period by twelve, we arrive at an equivalent one-year demand.
Congestion cost function determination is accomplished afterapplying the model of a runway considering it as a queuing systemof type M/G/1.
Generally, we can approach the function that describes themarginal congestion costs depending on the total annual delayexpressed in minutes per year, multiplied by the value of 1 mindelay determined for the appropriate year. Then the marginalcongestion cost per LTO Ccong(t) can be determined using thefollowing formula:
CcongðtÞ ¼ kwZt$tservLTOt
$Cdel$ð2006Þ$InfAcðtÞ (1)
where:LTOt e number of landing and take-off cycles;Cdel e value of 1 min delay;InfAcðtÞ e cumulative inflation factor towards 2007 year;Zt e total yearly delay Sy to average for runway service time tserv
per movement ratio and based on the value for the practical hourlymaximal capacity Caph ¼ 35 movements per hour;
kw e 0.58 with accepted coefficient of variation of service timeCs¼ 0.4.
Based on the value of Cdel ¼ 72 V/min for ATM delay (Euro-Control, “Standard Inputs for Eurocontrol Cost Benefit Analyses”2005 Edition) that is given in V at 2004 price levels, the value of1 min delay has been inflated from the value of an inflation rate of2.2% in 2005 and 2.2% in 2006. So the value calculated for 2006became equal to Cdel ¼ 75 V/min. (Fig. 8)
The congestion cost for each scenario is achieved bymultiplyingthe marginal congestion cost per LTO Ccong(t) by LTO in year t.
Concerning global warming, the status is that we have forecastvalues and estimates for the CO2 and NOX emissions released in theatmosphere. Actually, there is no specialised cost taxation of global
Table 5Pricing variants and demand scenarios.
Considered Scenarios
Airport Marginal costs Revenues and costs
Base demand Pessimisticdemand
Varna SRMC V.1.1 V.2.1LRMC V.1.2 V.2.2
Burgas SRMC B.1.1 B.2.1LRMC B.1.2 B.2.2
Revenues and costs e aviation/non-aviation separated.

Table 7Investment plans (2007e2041).
Investments (V million) Airport
Varna Burgas
Constructionand planning
Equipmentacquisition
Constructionand planning
Equipmentacquisition
Immediate andintermediateimprovements(2007e2011)
48,348 16,775 55,260 17,511
Long-term investments(2012e2021)
31,898 13,735 34,398 16,229
Long term investments(2022e2041)
50,957 26,070 48,447 43,521
Total investments 131,203 56,580 138,105 77,261
Table 6Costs and revenues 2008 (Varna and Burgas airports).
Airports Scenarios SMC Values (2007) Growth rate (2007e2041)
Burgas Base trend SRMC 598 1.83%LRMC 679 2.39%
Pessimistic SRMC 574 1.99%LRMC 651 2.89%
Varna Base trend SRMC 612 0.78%LRMC 698 0.62%
Pessimistic SRMC 573 1.04%LRMC 653 0.98%
C. Doll, K. Karagyozov / Research in Transportation Economics 30 (2010) 74e86 81
warming in the operating concession and no cash flow is allocatedto funds in this area. Taxes are structured depending on aircraftweight and per passenger and do not depend on the aircraft enginetype. Since transforming some measure units to others is compar-atively difficult, and the global warming costs share of total costs isinsignificant, we followed the same approach as that taken in theMunich case. So we used the same values, but translated themwiththe following equations to determine air pollution and noise costsfor year t:
CAP ¼ 43:8ð1� 0:013ðt � 2007ÞÞ (2)
CN ¼ 145ð1� 0:167ðt � 2007ÞÞ (3)
The investment forecast is based on the anticipated total sum in theconcession contract for investments in both airports that amount toV 403million (45% for Varna and 55% for Burgas) for the concessionperiod. Also included are their development master plans till 2025,approved according to the clauses of the concession contract by theMinister of Transport, forecast costs and revenues reports for theperiod 2007e2011 and balance sheets, and the concessionaire’scosts and revenues reports in 2007.
Investments are subdivided into construction and planning(terminals, runway and other technical facilities) and equipmentacquisition.
The forecast investment figures for both airports depending onthe investment period and on the type of investments are shown inthe table below. (Table 7)
The profile of investments for the life time cycle of the conces-sion for both airports is given in Figs. 9 and 10.
Investments Profile - Varna Airport
20.000)
4.5. Scenarios and results
The study on Varna and Burgas airports, summary of the keyoutput parameters of the ENACT Simulation Tool concerning the 4scenarios for each of the airports Burgas and Varna e base (SRMC
Summary Delay Minutes per Year to Service Time Ratio
Z=Sy/tserv = 891.e0,0001115.M
R2 = 0,9978
Sy = 1527,4.e0,0001115.M
R2 = 0,9978
050000
100000150000200000250000300000350000400000450000500000550000600000650000
15 20 25 30 35 40 45 50 55 60 65 70 75 80Movements
SySy/tservExpon. (Sy/tserv)Expon. (Sy)
Fig. 8. Total Delay to Service Time Ratio.
and LRMC) and pessimistic demand (SRMC and LRMC) is given inTable 8 and Table 9 (Fig. 11).
The summarized output simulation results of the EST for presentvalues (PV) of SMC pricing (with actual demand) for all scenariosare depicted in Fig. 12 and the share of the SMC category in theSMCP structure for the whole concession period for both airportswhen the base trend scenario (LRMC) is considered are shown inFigs. 12 and 13 respectively.
It was found that all scenarios are feasible under social marginalcost pricing (SMCP), except for Varna (SRMC) and Burgas (SRMC)pessimistic demand scenarios.
The division of Burgas and Varna airports into separateaccounting units in order to more distinctively illustrate theiroperating activities, depending on forecasted demand for each ofthem, is to a certain extent artificial. Both airports are jointlymanaged and the government regulation rules are exercised on thebasis of their common performance measure (ROI of regulatedactivities). From this point of view, the joint airport managementrealizes diversification of risk connected with incomes, respectivelyof demand. Therefore it is logical that the final results for theairports should be aggregated. The following results illustrate thedescribed approach: (Table 10)
The reported figures also show that with LRMC the revenues ofthe current pricing scheme are lower than MSCP revenues in allcases. In the base demand scenario with LRMC for both airports,LRMC exceeds NVP (actual pricing scheme) at V 39,337 m in thecase without risk premium and atV 10,519 m in the case with “full”risk premium for SMCP. For the 35-year concession period, thesefigures are about 5.1% and 1.38% of the NVP of the generatedrevenues of the concessionary, which is notable.
0
2.500
5.000
7.500
10.000
12.500
15.000
17.500
2005 2010 2015 2020 2025 2030 2035 2040 2045
Year
so
ru
e0
00
1(
tn
em
ts
ev
nI
Construction and planning Equipment aquisition Total investments
Fig. 9. Varna Airport Investments Profile.

Investments Profile - Burgas Airport
0
2.500
5.000
7.500
10.000
12.500
15.000
17.500
20.000
22.500
25.000
2005 2010 2015 2020 2025 2030 2035 2040 2045
Year
)s
or
ue
00
01
(t
ne
mt
se
vnI
Construction and planning Equipment aquisition Total investments
Fig. 10. Burgas Airport Investments Profile.
Table 8Burgas airport e Output results from ENACT simulation tool for scenarios.
Airport Burgas
Costs/revenues Measure unit
Financial evaluation resultsDiscount Rate % NominalNVP SMCP KVNVP SMC, RP conv. KVNVP SMC, RP SCMP KVFeasibility of MSCPRequired Price Markup V/MovementExcess Revenues MV
Balance SheetCostsTotal costs (SMCP) KVTotal costs (actual) KVIncl. other costs KV
RevenuesTotal revenues (SMCP) KVTotal revenues (actual) KVSMC pricing (with actual demand) KVUser charges (actual) KV
Concession fee KV
Other type of revenuesAsset residual value KVOther revenues KV
CASH FLOWS (in kV)Cash flow (SMCP) KVCash flow (actual) KV
Risk evaluationRisk of lower than expected revenuesE(D) � std(D) %E(D) þ std(D) %
Risk premium of demand based revenuesConventional risk premium % of revenuesDifference between SMCP and conventional pricing scheme % of revenues
KV
Incentives analysisActual capacity ATM/DayPMC capacity ATM/DayIncrease of revenues with PMC %
Source: ENACT Simulation Tool.
C. Doll, K. Karagyozov / Research in Transportation Economics 30 (2010) 74e8682
The analysis of the pessimistic demand scenarios shows that thescenarios with SRMC cannot ensure financial viability for bothairports.
On the basis of the operating concession of Varna and Burgasairports, the analysis of the results obtained with EST enables someconclusions concerning the practical application of SMCP to bedrawn:
� The long concession period is a reason for the traffic forecast tobe rather uncertain, which rather questions the financialviability of the concessionary under SMCP. As can be seen fromthe pessimistic scenario, the NVP of the predicted activity ofboth airports is either negative (Varna e NVP (actual) or notlarge (Burgas NVP (actual));
� It is difficult to implement annual adapting of pricing withSMC;
� Prognoses of the activities of both airports are linked with thescheme of contractual parameters of the concession that havethe following characteristics:
Scenarios
Base Demand Pessimistic Demand
B.1.1 SRMC B.1.2 LRMC B.2.1 SRMC B.2.2 LRMC
8.1 8.1 8.1 8.116.930 64.050 �20.720 26.4009264 55.443 �26.752 19.4262531 48.710 �32.385 13.793Yes Yes No Yese e 30.339 e
2531 48.710 e 13.793
�360.780 �360.780 �316.894 �316.894�374.975 �374.975 �326.916 �326.916�59.526 �59.526 �49.124 �49.124
377.710 424.830 296.173 343.294450.107 450.107 361.716 361.716383.264 430.384 301.592 348.712455.460 455.660 367.134 367.134
106.956 106.956 85.952 85.952
0 0 0 0101.402 101.402 80.534 80.534
16.930 64.050 �20.720 26.40075.132 75.132 34.800 34.800
�10.0% �10.0% �10.0% �10.0%10.0% 10.0% 10.0% 10.0%
2.0 2.0 2.0 2.01.76 1.56 1.87 1.626.733 6.733 5.633 5.633
700 700 700 700462 462 351 351105 102 290 275
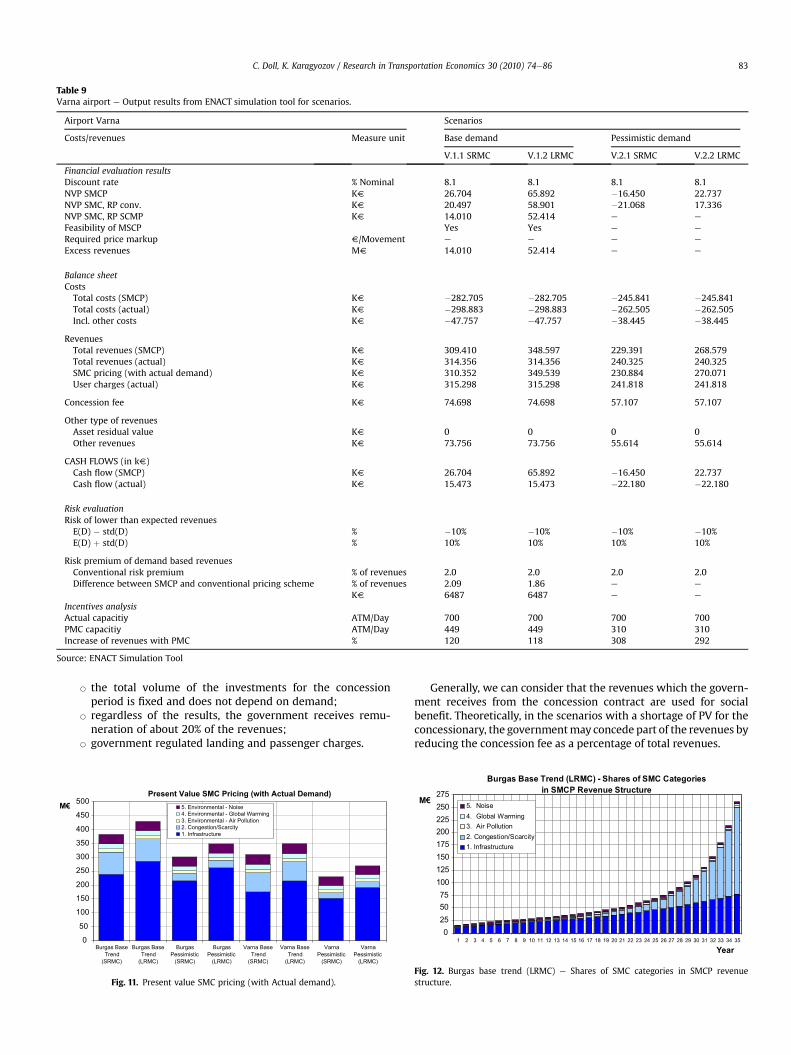
Table 9Varna airport e Output results from ENACT simulation tool for scenarios.
Airport Varna Scenarios
Costs/revenues Measure unit Base demand Pessimistic demand
V.1.1 SRMC V.1.2 LRMC V.2.1 SRMC V.2.2 LRMC
Financial evaluation resultsDiscount rate % Nominal 8.1 8.1 8.1 8.1NVP SMCP KV 26.704 65.892 �16.450 22.737NVP SMC, RP conv. KV 20.497 58.901 �21.068 17.336NVP SMC, RP SCMP KV 14.010 52.414 e e
Feasibility of MSCP Yes Yes e e
Required price markup V/Movement e e e e
Excess revenues MV 14.010 52.414 e e
Balance sheetCostsTotal costs (SMCP) KV �282.705 �282.705 �245.841 �245.841Total costs (actual) KV �298.883 �298.883 �262.505 �262.505Incl. other costs KV �47.757 �47.757 �38.445 �38.445
RevenuesTotal revenues (SMCP) KV 309.410 348.597 229.391 268.579Total revenues (actual) KV 314.356 314.356 240.325 240.325SMC pricing (with actual demand) KV 310.352 349.539 230.884 270.071User charges (actual) KV 315.298 315.298 241.818 241.818
Concession fee KV 74.698 74.698 57.107 57.107
Other type of revenuesAsset residual value KV 0 0 0 0Other revenues KV 73.756 73.756 55.614 55.614
CASH FLOWS (in kV)Cash flow (SMCP) KV 26.704 65.892 �16.450 22.737Cash flow (actual) KV 15.473 15.473 �22.180 �22.180
Risk evaluationRisk of lower than expected revenuesE(D) � std(D) % �10% �10% �10% �10%E(D) þ std(D) % 10% 10% 10% 10%
Risk premium of demand based revenuesConventional risk premium % of revenues 2.0 2.0 2.0 2.0Difference between SMCP and conventional pricing scheme % of revenues 2.09 1.86 e e
KV 6487 6487 e e
Incentives analysisActual capacitiy ATM/Day 700 700 700 700PMC capacitiy ATM/Day 449 449 310 310Increase of revenues with PMC % 120 118 308 292
Source: ENACT Simulation Tool
C. Doll, K. Karagyozov / Research in Transportation Economics 30 (2010) 74e86 83
B the total volume of the investments for the concessionperiod is fixed and does not depend on demand;
B regardless of the results, the government receives remu-neration of about 20% of the revenues;
B government regulated landing and passenger charges.
Present Value SMC Pricing (with Actual Demand)
0
50
100
150
200
250
300
350
400
450
500
Burgas BaseTrend
(SRMC)
Burgas BaseTrend
(LRMC)
BurgasPessimistic
(SRMC)
BurgasPessimistic
(LRMC)
Varna BaseTrend
(SRMC)
Varna BaseTrend
(LRMC)
VarnaPessimistic
(SRMC)
VarnaPessimistic
(LRMC)
M€ 5. Environmental - Noise4. Environmental - Global Warming3. Environmental - Air Pollution2. Congestion/Scarcity1. Infrastructure
Fig. 11. Present value SMC pricing (with Actual demand).
Generally, we can consider that the revenues which the govern-ment receives from the concession contract are used for socialbenefit. Theoretically, in the scenarios with a shortage of PV for theconcessionary, the governmentmay concede part of the revenues byreducing the concession fee as a percentage of total revenues.
Burgas Base Trend (LRMC) - Shares of SMC Categories
in SMCP Revenue Structure
0255075
100125150175200225250275
1 2 3 4 5 6 7 8 9 10 11 12 13 14 15 16 17 18 19 20 21 22 23 24 25 26 27 28 29 30 31 32 33 34 35
Year
M€5. Noise4. Global Warming3. Air Pollution2. Congestion/Scarcity1. Infrastructure
Fig. 12. Burgas base trend (LRMC) e Shares of SMC categories in SMCP revenuestructure.
Varna Base Trend (LRMC) - Shares of SMC Categories
in SMCP Revenue structure
0
25
50
75
100
125
150
175
200
225
250
275
1 2 3 4 5 6 7 8 9 10 11 12 13 14 15 16 17 18 19 20 21 22 23 24 25 26 27 28 29 30 31 32 33 34 35
Year
M€5. Noise4. Global Warming3. Air Pollution2. Congestion/Scarcity1. Infrastructure
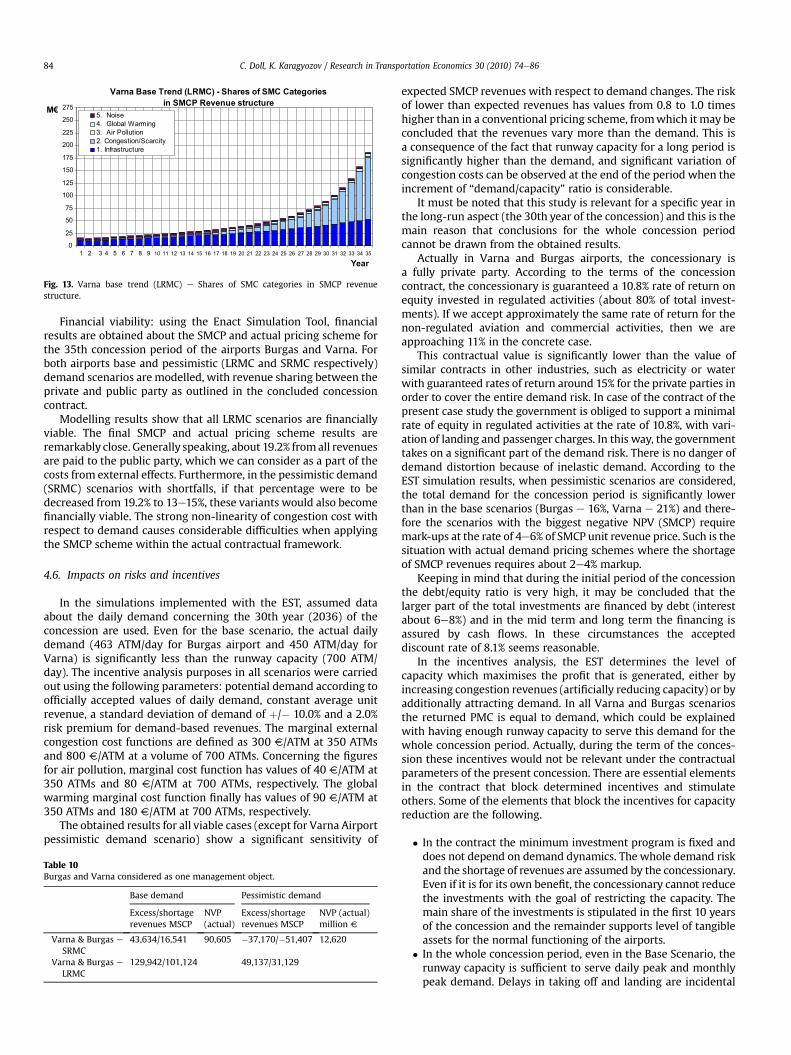
Fig. 13. Varna base trend (LRMC) e Shares of SMC categories in SMCP revenuestructure.
C. Doll, K. Karagyozov / Research in Transportation Economics 30 (2010) 74e8684
Financial viability: using the Enact Simulation Tool, financialresults are obtained about the SMCP and actual pricing scheme forthe 35th concession period of the airports Burgas and Varna. Forboth airports base and pessimistic (LRMC and SRMC respectively)demand scenarios are modelled, with revenue sharing between theprivate and public party as outlined in the concluded concessioncontract.
Modelling results show that all LRMC scenarios are financiallyviable. The final SMCP and actual pricing scheme results areremarkably close. Generally speaking, about 19.2% fromall revenuesare paid to the public party, which we can consider as a part of thecosts from external effects. Furthermore, in the pessimistic demand(SRMC) scenarios with shortfalls, if that percentage were to bedecreased from 19.2% to 13e15%, these variants would also becomefinancially viable. The strong non-linearity of congestion cost withrespect to demand causes considerable difficulties when applyingthe SMCP scheme within the actual contractual framework.
4.6. Impacts on risks and incentives
In the simulations implemented with the EST, assumed dataabout the daily demand concerning the 30th year (2036) of theconcession are used. Even for the base scenario, the actual dailydemand (463 ATM/day for Burgas airport and 450 ATM/day forVarna) is significantly less than the runway capacity (700 ATM/day). The incentive analysis purposes in all scenarios were carriedout using the following parameters: potential demand according toofficially accepted values of daily demand, constant average unitrevenue, a standard deviation of demand of þ/� 10.0% and a 2.0%risk premium for demand-based revenues. The marginal externalcongestion cost functions are defined as 300 V/ATM at 350 ATMsand 800 V/ATM at a volume of 700 ATMs. Concerning the figuresfor air pollution, marginal cost function has values of 40 V/ATM at350 ATMs and 80 V/ATM at 700 ATMs, respectively. The globalwarming marginal cost function finally has values of 90 V/ATM at350 ATMs and 180 V/ATM at 700 ATMs, respectively.
The obtained results for all viable cases (except for Varna Airportpessimistic demand scenario) show a significant sensitivity of
Table 10Burgas and Varna considered as one management object.
Base demand Pessimistic demand
Excess/shortagerevenues MSCP
NVP(actual)
Excess/shortagerevenues MSCP
NVP (actual)million V
Varna & Burgas eSRMC
43,634/16,541 90,605 �37,170/�51,407 12,620
Varna & Burgas eLRMC
129,942/101,124 49,137/31,129
expected SMCP revenues with respect to demand changes. The riskof lower than expected revenues has values from 0.8 to 1.0 timeshigher than in a conventional pricing scheme, fromwhich it may beconcluded that the revenues vary more than the demand. This isa consequence of the fact that runway capacity for a long period issignificantly higher than the demand, and significant variation ofcongestion costs can be observed at the end of the period when theincrement of “demand/capacity” ratio is considerable.
It must be noted that this study is relevant for a specific year inthe long-run aspect (the 30th year of the concession) and this is themain reason that conclusions for the whole concession periodcannot be drawn from the obtained results.
Actually in Varna and Burgas airports, the concessionary isa fully private party. According to the terms of the concessioncontract, the concessionary is guaranteed a 10.8% rate of return onequity invested in regulated activities (about 80% of total invest-ments). If we accept approximately the same rate of return for thenon-regulated aviation and commercial activities, then we areapproaching 11% in the concrete case.
This contractual value is significantly lower than the value ofsimilar contracts in other industries, such as electricity or waterwith guaranteed rates of return around 15% for the private parties inorder to cover the entire demand risk. In case of the contract of thepresent case study the government is obliged to support a minimalrate of equity in regulated activities at the rate of 10.8%, with vari-ation of landing and passenger charges. In this way, the governmenttakes on a significant part of the demand risk. There is no danger ofdemand distortion because of inelastic demand. According to theEST simulation results, when pessimistic scenarios are considered,the total demand for the concession period is significantly lowerthan in the base scenarios (Burgas e 16%, Varna e 21%) and there-fore the scenarios with the biggest negative NPV (SMCP) requiremark-ups at the rate of 4e6% of SMCP unit revenue price. Such is thesituation with actual demand pricing schemes where the shortageof SMCP revenues requires about 2e4% markup.
Keeping in mind that during the initial period of the concessionthe debt/equity ratio is very high, it may be concluded that thelarger part of the total investments are financed by debt (interestabout 6e8%) and in the mid term and long term the financing isassured by cash flows. In these circumstances the accepteddiscount rate of 8.1% seems reasonable.
In the incentives analysis, the EST determines the level ofcapacity which maximises the profit that is generated, either byincreasing congestion revenues (artificially reducing capacity) or byadditionally attracting demand. In all Varna and Burgas scenariosthe returned PMC is equal to demand, which could be explainedwith having enough runway capacity to serve this demand for thewhole concession period. Actually, during the term of the conces-sion these incentives would not be relevant under the contractualparameters of the present concession. There are essential elementsin the contract that block determined incentives and stimulateothers. Some of the elements that block the incentives for capacityreduction are the following.
� In the contract the minimum investment program is fixed anddoes not depend on demand dynamics. The whole demand riskand the shortage of revenues are assumed by the concessionary.Even if it is for its own benefit, the concessionary cannot reducethe investments with the goal of restricting the capacity. Themain share of the investments is stipulated in the first 10 yearsof the concession and the remainder supports level of tangibleassets for the normal functioning of the airports.
� In the whole concession period, even in the Base Scenario, therunway capacity is sufficient to serve daily peak and monthlypeak demand. Delays in taking off and landing are incidental

C. Doll, K. Karagyozov / Research in Transportation Economics 30 (2010) 74e86 85
and only occur during peak hours on peak days, which makescongestion costs growth flat and hence considerably limit theincrement of the SMCP unit price. On other side, with the trafficdynamics, normally the requirements for daily planning ofevenly distributed regular and charter flights are growing, withwhich the peak hour to average hourly demand ratio will bereduced. In general, that is the reason not to raise incentives toincrease capacity, and as has been noted, incentives to delaydevelopment or reduce capacity are not possible.
5. Conclusions and recommendations
5.1. General conclusions
Looking at the principal prerequisites of the application cases,the following comparative conclusions emerge: both cases considerfairly young airports which are both operated under entrepre-neurial conditions. Nevertheless, the nature of investment fundingand ownership of the sites differ fundamentally. The first differenceis the type of project, which is ‘greenfield’ in the case of Munich and‘brownfield’ in the cases of Varna and Burgas. While MunichAirport was constructed by public loans where payments can bedeferred to future periods in case of operative losses, the PPParrangement at Varna and Burgas demands a proper assessment ofreturns on investment and of payback periods. The situation of theBulgarian airports becomes even more difficult as Munich Airportfaces stable demand growth levels, while Varna and Burgas aredominated by highly fluctuating holiday travel.
Given the complexity of first best SMCP schemes, the generalENACT project results confirm previous research by recommendingsecond-best solutions in case private capital is involved and costcoverage has to be ensured. In order not to create perverse effectdue to profit maximization strategies of private parties, it is rec-ommended to de-couple SMCP revenues from the private partiesincome by passing it to the government and granting performance-,usage- or availability payments to the private side. Ports andairports may be an exception to this rule. Risk evaluation isa particularly important issue and it should cover a wide spectrum,from planning and traffic risks to ownership and politicalaccountability. SMCP will lead to greater uncertainty and thereforemay lead to higher risk premium and/or tension for renegotiationand inevitably increase contractual and transaction costs.
It was the purpose of the ENACT case studies, including the twoones on aviation presented here, to test these findings withexisting airports. Returning to the research questions formulatedin the introduction to this paper, we can summarize the case studyfindings as follows:
� Cost recovery: interestingly, the two cases starting from verydifferent demand and capacity utilization levels arrive at moreor less the same conclusion on the financial viability. MSCPschemes are found just to cover total costs in the long run, inthe case of optimistic demand scenarios. The differencebetween long-run infrastructure costs and short-run infra-structure costs plus congestion is not decisive in this respect. Inthe case of the Bulgarian airports, cost coverage even includesthe 20% concession fee to be paid to the government. But bothcase studies hint at the great degree of uncertainty associatedwith the projection of costs and revenue figures over 30 oreven 35 years.
� Risks: Both sites find that cost coverage will not be possible inthe case of low demand figures and that revenues are verysensitive to changes in demand. For example, in Munich a 1%change in demand implies roughly 5% change in revenues. Thisis because of the great importance of congestion costs in the
total revenue stream. Considering the legal and organizationalproblems associated with the introduction of time-variantcharges, this finding makes SMCP schemes less attractive forpractical application than common average cost-based pricingmechanisms.
� Incentives: both cases find no incentives for airport operatorsto artificially increase congestion by decreasing capacity or byattracting extra demand. This fact is partly due to the extensionprograms considered, partly due to the moderating role of airtraffic control.
The implementation of demand-dependent pricing systems,moreover, face legal restrictions at the European level (NERA, 2004)and the complexity of congestion pricing systemswillmost likely notbe acceptable for airports as well as for airlines. Ways to approachthese reservations are to simplify congestion pricing regimes, todevelop transparent pricing information systems and, most impor-tant, to debate about revenue allocation and earmarking regulations.Finally, it should be seriously considered whether to include airtraffic control in the vicinity of the airport when setting up a mar-ginal-cost-based pricing system with congestion components.
5.2. Specific issues by case study
In brief, the Munich Airport case study finds that SMCP schemesin airport infrastructure are technically feasible and, if congestioncosts are included, could be financially viable for dynamic inter-national hub airports. However, the congestion element causesa very high demand risk, which could be relieved by putting caps oncongestion prices or revenues. S schemes with congestion providepositive incentives to airport managers to increase capacity, andthus a transfer of international hub airports to private partieswithin PPP frameworks is only hindered by fiscal and politicalinterests of the public sector.
The main conclusions that can be drawn from the accomplishedcase study of Varna and Burgas airports are as follows: All scenariosbased on long-run marginal costs (LRMC) ensure cost recovery and19.2% share of the revenues transferred to the government asa concession fee. Of the scenarios based on short-run marginalcosts (SRMC), in the case of transfer of 19.2% revenue to thegovernment for both airports, only the scenarios with pessimisticdemand (SRMC) do not ensure costs recovery. In fact, withoutsubtracting the concession fee, the recovery cost ratio is greaterthan 1 for all scenarios.
5.3. Transferability of findings
The investigations of three airports in two very different regionsof the European Union provide only a limited insight into theconditions at European airports in total. Further, the private orga-nization of the airport sector and its dynamic development limitsolid conclusions on current cost structures and, even more, ontheir future development. Thus, a small change in the coefficientsderived for the cost and revenues forecasting models can alter theresults of the financial and risk analysis completely. This diagnosishas two important implications: first, the results presented here areto be considered with care and second, the application of thechosen methodology to other airports could lead to completelydifferent results.
Nevertheless, it is remarkable that the two case studies arrive atthe same cautiously positive diagnosis concerning the financialviability of marginal social cost pricing schemes. The advancedpricing structures in Switzerland, Sweden and recently in Germanyfurther underline the technical feasibility and the acceptability ofvariable pricing schemes, in case the self-financing paradigm of
C. Doll, K. Karagyozov / Research in Transportation Economics 30 (2010) 74e8686
commercial aviation is respected. These implementations and thecurrent research results should encourage undertaking further in-depth studies in the direction of internalizing the external costs ofthis very dynamic transport sector.
All in all, the revenue situation undermarginal social cost pricingconditions in aviation is considered stable, compared to the roadsector,where external cost elements take amuchhigher share.Withtheir comparably high degree of variable costs and the largely publicownerships, European airports can generally rely on a rather stablerevenue basis making them less vulnerable to short-term fluctua-tions in charging income. But this diagnosis is only relative to theroad sector. Given the cautious financial and risk results reportedabove, they do not automatically lead to a recommendation tointroduce social cost pricing schemes at commercial airports.
References
AEA. (2008). Consumer report. 1st. Quarter 2008. Brussels: Association of EuropeanAirlines. (Previous editions of the source included).
Boss, A., & Rosenschon, A. (2008).Der Kieler Subventionsbericht, Eine Aktualisierung. KielDiscussionPapersno.452/453.Kiel: Institute forWorldEconomics (IfW).May2008.
DLR. (2007). Konfigurationsanalyse im Bezug auf Bahnkapazität und Windverhältnisse.Planfeststellungsverfahren 3. Start- und Landebahn. Study commissioned byFlughafen München GmbH. Braunschweig: Duetsches Zentrum für Luft- undRaumfahrt e.V. (DLR).
EC. (1996). Council Directive 96/67/EC of 15 October 1996 on access to the groundhan-dlingmarket at Communityairports.Official Journal L, 272, 0036e0045, 25/10/1996.
EC. (1998). White Paper "Fair Payment for Infrastructure Use: A phased approach toa common transport infrastructure charging framework in the EU. EuropeanCommission. Brussels: Directorate General VII: Transport. 22.7.1998.
EEA. (2007). Size, structure and distribution of transport subsidies in Europe. Copen-hagen: European Environment Agency (EEA).
EUROCONTROL. (2009a). EUROCONTROL long term forecast: IFR flight movements2008e2030. (Belgium).
EUROCONTROL. (2009b). CODA Digest e Delays to Air Transport Delays in Europe,Annaual 2009. European Organisation for the Safety of Air Navigation (EURO-CONTROL), Central Office for Delay Analyses (CODA).
FMG. (2009a). More People. Annual report 2008. Flughafen München GmbH (FMG).FMG. (2009b). Air Traffic Statistics. Annual Traffic Report 2008. Munich: Flughafen
München GmbH (FMG).GRACE. (2006). Marginal cost case studies for air and water transport. GRACE (Gener-
alization of Research on Accounts and Cost Estimation) Deliverable 4. H. Meersman,F. Monteiro, T. Pauwels, E. Van de Voorde, T. Vanelslander, J.C. Martìn, C. Román,P. Socorro-Quevedo, A. Voltes-Dorta, M. Jordans, C. Ruijgrok, P. Bickel and NiklasSieber. EU, 6th framework program, ITS. University of Leeds.
ICAO. (2006). Convention on international Civil aviation (Ninth edition). InternationalCivil Aviation Organisation (ICAO). http://www.icao.int/icaonet/dcs/7300.htmlDOC 7300/9.
IMPACT. (2008). Internalization measures and Policies for all external cost of trans-port (IMPACT). Deliverable 1: Handbook on estimation of external costs in thetransport sector. CE (Delft), Infras (Zurich), Fraunhofer-ISI (Karlsruhe). IWW(University Karlsruhe), University Gdansk. (Study to the European Commis-sion, DG-TREN).
ITP. (2006). Gutachten. Luftverkehrsprognose 2020 für den Flughafen München.Munich: Intraplan Consult GmbH.
NERA. (2004). Study to Assess the effects of different Slot allocation schemes. A reportfor the European Commission. DG-TREN.I. Jones, S. Holder, J.P. van der Veer,E. Bulman, N. Chesters, F. Maunder, P. Kalmus, S. Sorensen and P. Somers. NERAEconomic Consulting.
TIS.pt. (2009). Integrated theoretical framework. Final Guideline for simulation,simulation model application. Deliverable 5 of the research project ENACT fun-ded by the 6th Framework Programme of the European Commission. Lisbon,January 2009.
TIS.pt. (2010). Final report and policy Recommendations. Deliverable 6 of the researchproject ENACT funded by the 6th Framework Programme of the EuropeanCommission. Lisbon, January 2009.
UNITE. (2002). Transport User cost and benefit case studies. UNITE (UNIfication ofaccounts and marginal costs for Transport Efficiency). Deliverable 7. Funded by5th Framework RTD Program. ITS, University of Leeds, Karlsruhe, November2002.