
VIjayawada, andhra PradeSh - IAdapt
204
INTEGRATED CATCHMENT MANAGEMENT PLAN FOR DECEMBER 2019 Supported by Project Consortium VIJAYAWADA, ANDHRA PRADESH International Development Research Centre Centre de recherches pour le développement international
-
Upload
khangminh22 -
Category
Documents
-
view
5 -
download
0
Transcript of VIjayawada, andhra PradeSh - IAdapt

Integrated CatChment management Plan for
deCemBer 2019
Supported by Project Consortium
VIjayawada, andhra PradeSh
International Development Research Centre
Centre de recherches pour le développement international

2 of 66
Table of Contents
1 Introduction ............................................................................................... 4
1.1 About the project ................................................................................................. 6
1.2 Methodology – IAdapt Framework .................................................................... 6
2 IAdapt implementation in Vijayawada ................................................... 9
2.1 Selection of the Micro Catchment ...................................................................... 9
2.2 Pilot Catchment: Overview ................................................................................. 12
2.3 Formulation of RURBAN platform ................................................................... 14
2.4 Baseline Assessment .......................................................................................... 16
2.5 IAdapt Phase 3: Climate Change Vulnerability Assessment ......................... 18 2.5.1 Water Balance ........................................................................................ 19 2.5.2 Vulnerability Assessment...................................................................... 21
2.6 IAdapt Phase 4: Solutions Assessment ........................................................... 25
2.6.1 Group discussions on CMP adapattions………………………………………25 2.6.2 Prioritization matrix for the shortlisted interventions ..................... 62 2.6.3 Decision Support Tool: Structure………………………………………………….74 2.6.4 Decision Support Tool: Application……………………………………………….74
Annex 1 – Iadapt framework for micro catchments
Annex 2 – SWOT analysis report
Annex 3 – Hydrological and climate modelling of Vijayawada
3 of 66
List of Figures
Figure 1.1 CMP Framework .........................................................................................................................8
Figure 2.1 Catchment area delineation in Vijayawada ............................................................................9
Figure 2.2 Micro catchments in Vijayawada .............................................................................................11
Figure 2.3Identified pilot catchment ....................................................................................................... 12
Figure 2.4 Stakeholder mapping for RURBAN platform in Vijayawada .............................................. 15
Figure 2.5 Vijayawada urban household unmet water demand ........................................................ 20
Figure 2.6 Pilot catchment groundwater depletion rates .................................................................... 22
Figure 2.7 Pilot catchment population density ..................................................................................... 23
Figure 2.8 Pilot catchment household water supply coverage ........................................................... 23
Figure 2.9: Pilot catchment water quality............................................................................................... 24
Figure 2.10: Illustration of process of shortlisting interventions ........................................................ 76
List of Tables
Table 1.1 Ranking Based on SWOT Analysis for Vijayawada Micro-catchments ..................................11
Table 2.1 Climate scenario summary table ........................................................................................... 18
Table 2.2: Urban Water Balance .............................................................................................................. 20
Table 2.3: Rural Water Balance ................................................................................................................ 21
Table 2.4: FGD 1-Discussions with Andhra Pradesh State Water Resources Department and Rural
Water Supply and Sanitation, Krishna District ...................................................................................... 27
Table 2.5 FGD 2-Discussions with Vijayawada Municipal Corporation .............................................. 35
Table 2.6 FGD 3-Discussions with MPDOs and Panchayat Secretaries.............................................. 43
Table 2.7 FGD 4-Discussions with farmers and residents ................................................................... 51
Table 2.8 Prioritising resilience interventions ....................................................................................... 62
Table 2.9 Prioritising interventions based on feasibility and impact ................................................. 71
4 of 66
1 Introduction
As defined by UN-Water, water security is the capacity of a population to safeguard
sustainable access to adequate quantities of acceptable quality water for sustaining
livelihoods, human well-being, and socio-economic development, for ensuring
protection against water-borne pollution and water-related disasters, and for preserving
ecosystems in a climate of peace and political stability. It is an increasingly important
development issue in Asia and the Pacific regions, where growing populations and rapid
urbanization have expanded demand and competition for, as well as driven reallocation
of the finite water resources1.
Although 70% of the earth is water, nearly 97% is in the oceans. Ocean water is too salty
for drinking, manufacturing and farming. Therefore, the fresh water available for us to
use is about 3% of the earth’s water supply. However, this 3% of the earth’s water
supply has been depleting or deteriorating due to impacts of climate change, increased
pollution and increased human demand and overuse of water, thereby leading us to a
situation of water scarcity. While there are difficulties accessing fresh surface water
either due to physical or economic water scarcity, people have been getting better at
accessing ground water over the years. However, it is important to understand that
groundwater gets accumulated in aquifers over millenia, and it will take millenia for it to
fill back up. Hence groundwater should only be considered as a savings account which
is used when absolutely necessary, like during droughts.
The approach to addressing water scarcity must focus on effective ways of utilizing the
fresh surface water available by optimizing demand. Currently water is used in wasteful
ways all around the world. For example, in India, sugarcane which is a water intensive
crop is grown in Maharashtra - one of the driest regions in the country. A lot of water
demand management programs around the world focus on optimizing water demand
for personal/household uses. However, personal water use accounts for only 8% of total
water usage per year, while 70% and 22% of water is being consumed for agricultural
and industrial uses respectively. Therefore, the water demand management programs
should increasingly focus on optimizing demand across all water uses. Competing water
uses must be critically analysed and prioritised to be able to efficiently allocate the
scarce fresh water resources across all uses judiciously. While we have acknowledged
physical water scarcity, we also need to address economic water scarcity which is the
result of poor management of the available water resources. According to the United
Nations Development Programme, the latter is found more often to be the cause of
countries or regions experiencing water scarcity.
A composite index called Water Security Index (WSI) quantifies on a scale of 1 to 5, the
access of the population across countries/regions to the various sub-indicators of the
following five key dimensions of water security:
● Household water security
● Urban water security
1 https://qz.com/africa/1272589/how-cape-town-delayed-its-water-disaster-at-least-until-2019/
5 of 66
● Environmental water security
● Economic water security
● Resilience to water related disasters
India has a very low National Water Security Index of 1.6, even though piped water
access at household and urban level, and presence of water treatment facilities in India
are comparatively higher compared to other major South Asian countries. 10% of India’s
rural population and 3% of India’s urban population lack improved access to water.
Compared to other South Asian and South East Asian countries, India also has poor
access to renewable water resources. Water security concerns in the South and South
East Asian countries emerge from a host of factors that are attributed to growing
populations, urbanization, industrial development and the nascent climate change
induced threats . Since water security issues are increasingly becoming potent, affecting
the sustainable livelihoods of human and cattle population as well as the survival of the
environmental and ecosystems, it is all the more important that the countries
concerned be highly sensitive and responsive in terms of mainstreaming the local
governance, institutions and community based activities as well as other local
development agencies for protecting and conserving the water resource system.
Climate variability has a huge impact on the hydrology and availability of water
resources all over the world. Changes in temperature and precipitation patterns as
consequence of the increase in concentrations of greenhouse gases will affect the
hydrology process, availability of water resources, and water use for agriculture,
population, and mining industry, aquatic life in rivers and lakes, and hydropower.
Climate change will accelerate the global hydrological cycle, with increase in the surface
temperature, changes in precipitation patterns, and evapotranspiration rate. The
change in the intensity and frequency of precipitation will affect the magnitude and
frequency of stream flows, thereby leading to increased intensity of floods and
droughts.
The average annual per capita water availability in India is expected to decline from
1545 m3 in 2011 to as low as 1140 m3 per year in 2050. India is expected to reach a
state of water stress i.e. availability falls below 1700 m3 per capita in the recent future
as a result of combined effects of population growth and climate change. As per the
Indian Meteorological Department, the number of days on which it rains have been
coming down, making extreme rainfall events more likely, leading to floods. The overall
monsoon rainfall is expected to increase in India, due to climate change, but the
variability between monsoon seasons is also likely to increase, leading to volatile rainfall
characterized by flooded cities or parched fields, both increasing in severity and
frequency. It has been observed that changes in cropping and land use pattern, over-
exploitation of water storage, and changes in irrigation and drainage in the Gangetic
basin has led to reduction in the Ganges discharge by 60% over 25 years, which has in
turn led to 50% drop in water availability in surface water resources, drop in
groundwater table, and generation of new surface features having different thermal
properties. More studies have to be conducted in different basins, aquifers, and agro-
climatic regions of India to assess the response to climate change.
6 of 66
1.1 About the project
The catchment management plan for Solapur city is developed by ICLEI South Asia in
partnerships with Athena Infonomics LLC, International Water Management Institute
(IWMI) and Indian Institute of Technology, Madras (IITM) under the aegis of Integrated
Rural Urban Water Management for Climate based Adaptations in Indian Cities (IAdapt)
Project. The project is funded by International Development Research Centre, Canada
(IDRC). The overall objective of the project is to institutionalize climate change adaptation
in water resource planning and catchment level policies by implementing climate
adaptive Integrated Urban Water Management approaches through participatory
planning, simple decision support tools and catchment management plans. Cities are
not closed systems and the Catchment Management Plan (CMP) is an initiative to bring
rural and urban authorities and communities together to manage and secure their
common water resources.
1.2 Methodology – IAdapt Framework
To develop the catchment management plan for the selected micro-catchment area, the
study used the IAdapt Framework toolkit developed through the project. The IAdapt
framework is designed to assist rural and urban local governments to come together
and formulate micro-catchment level water management plans guided by the principles
of integrated water resource management. The IAdapt framework is based on the ICLEI
Asian Cities Climate Change Resilience Network (ACCCRN) Process or IAP toolkit, the
Adopting Integrated Urban Water Management toolkit (AdoptIUWM toolkit) and The
Economics of Ecosystems and Biodiversity (TEEB) methodology for ecosystem
assessment. The full framework is attached as Annex 1.
The IAdapt framework promotes an integrated approach to ensuring water security, by
looking at the interactions and interdependencies among water, waste water and storm
water with other sectors such as health, agriculture, solid waste, industry, etc. It bring
together different administrative, planning and regulatory systems by creating a
RURBAN platform that includes both rural and urban stakeholders at various levels such
as local authorities as well as civil society.
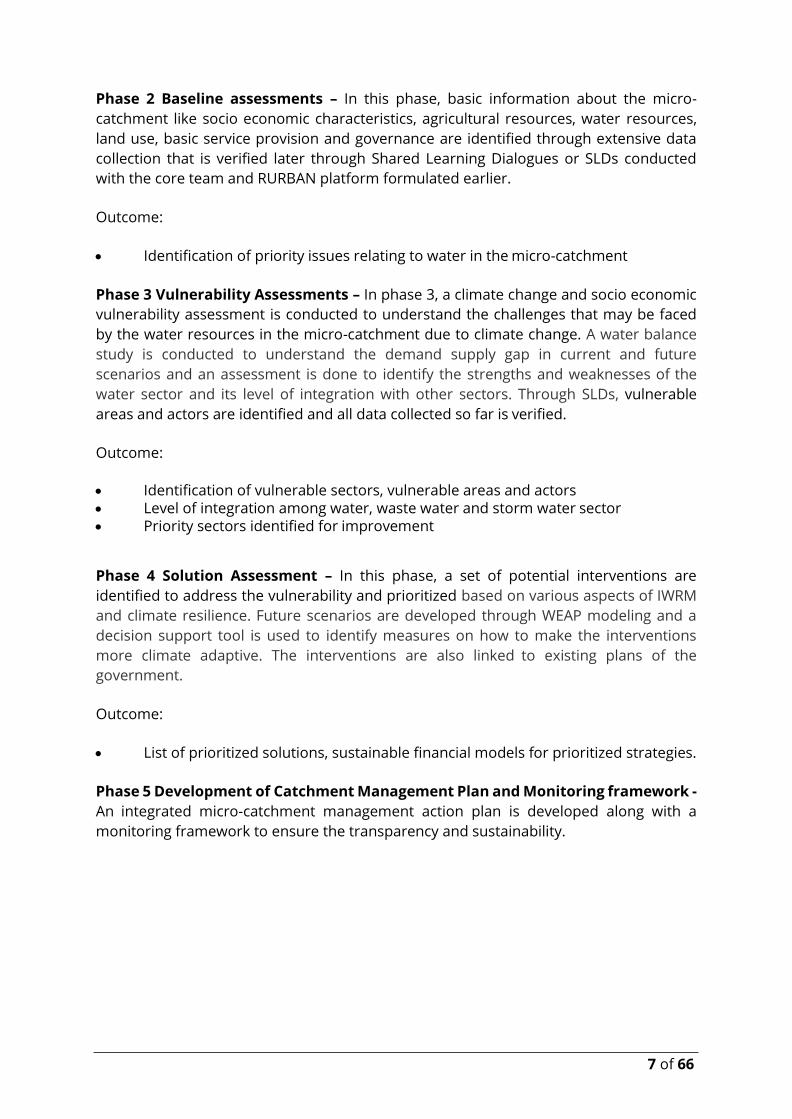
IAdapt Framework has five stages:
Phase 1 Engagement Phase – In this phase, local authorities can gain necessary
political and administrative support by forming a RURBAN Platform that includes
stakeholders from both rural and urban local governments as well as other
stakeholders such as civil society, media, institutions, etc. A core team is also formed to
be able to carry out the activities under the study.
Outcome:
• RURBAN platform is formed
• Core team is set up
7 of 66
Phase 2 Baseline assessments – In this phase, basic information about the micro-
catchment like socio economic characteristics, agricultural resources, water resources,
land use, basic service provision and governance are identified through extensive data
collection that is verified later through Shared Learning Dialogues or SLDs conducted
with the core team and RURBAN platform formulated earlier.
Outcome:
• Identification of priority issues relating to water in the micro-catchment
Phase 3 Vulnerability Assessments – In phase 3, a climate change and socio economic
vulnerability assessment is conducted to understand the challenges that may be faced
by the water resources in the micro-catchment due to climate change. A water balance
study is conducted to understand the demand supply gap in current and future
scenarios and an assessment is done to identify the strengths and weaknesses of the
water sector and its level of integration with other sectors. Through SLDs, vulnerable
areas and actors are identified and all data collected so far is verified.
Outcome:
• Identification of vulnerable sectors, vulnerable areas and actors • Level of integration among water, waste water and storm water sector • Priority sectors identified for improvement
Phase 4 Solution Assessment – In this phase, a set of potential interventions are
identified to address the vulnerability and prioritized based on various aspects of IWRM
and climate resilience. Future scenarios are developed through WEAP modeling and a
decision support tool is used to identify measures on how to make the interventions
more climate adaptive. The interventions are also linked to existing plans of the
government.
Outcome:
• List of prioritized solutions, sustainable financial models for prioritized strategies.
Phase 5 Development of Catchment Management Plan and Monitoring framework -
An integrated micro-catchment management action plan is developed along with a
monitoring framework to ensure the transparency and sustainability.
8 of 66
Figure 1.1 CMP Framework
9 of 66
2 IAdapt implementation in Vijayawada
Vijayawada is the interim capital of the state of Andhra Pradesh. Located in the Krishna
District, it enjoys the benefits from the Krishna river flowing across the city. The city is
known for its agricultural and industrial activities. A detailed and systematic Catchment
Management Plan has been formulated in accordance with the IAdapt framework. It is a
holistic plan considering the current and prospectus water demand between all the user
groups in the catchment area. A robust RURBAN Platform has been institutionalized in
the district, with representations from both urban and rural decision makers as well as
user group organisations. Extensive consultations with the field has paved way for
identification and prioritization of the resilience and adaptation strategies.
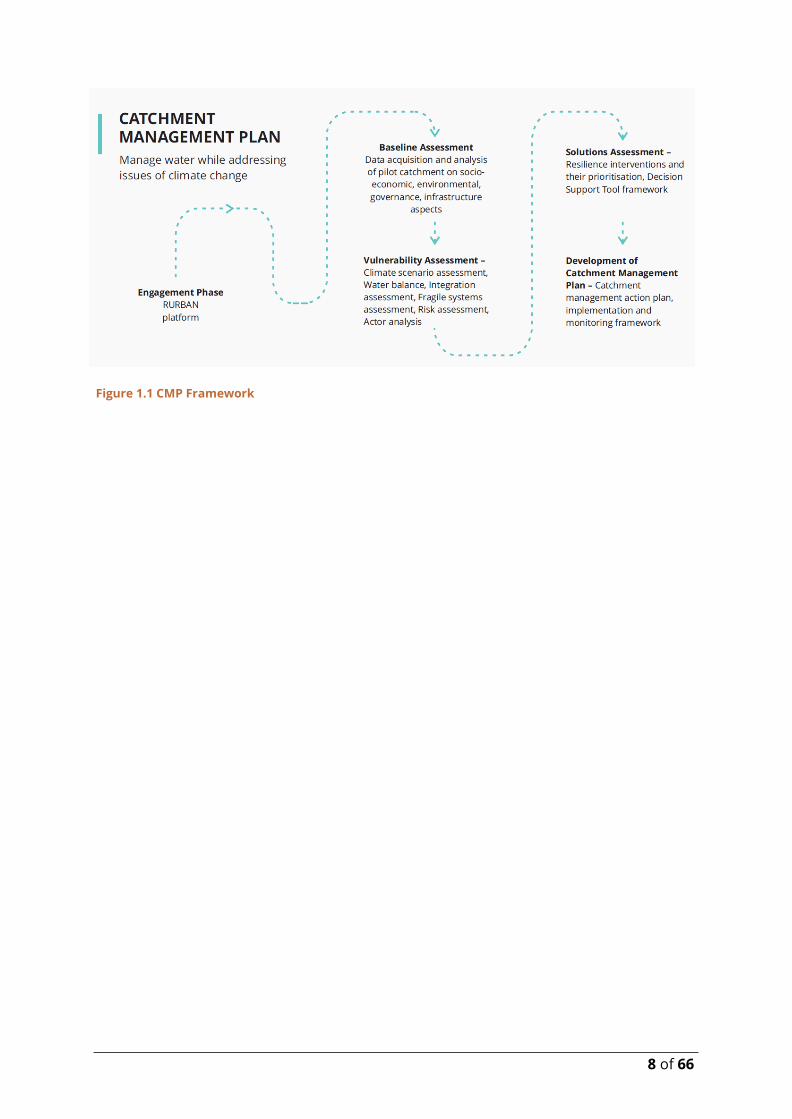
2.1 Selection of the micro catchment
To initiate the preparation of the CMP, the first step was to delineate the geographic
boundaries of the catchment area. The catchments were delineated using hydrological
modeling tool of GIS software. The catchment mapping exercise was carried out to
identify the different micro catchments lying within the study area for Vijayawada using
Digital Elevation Models (DEM).
Figure 2.1 Catchment area delineation in Vijayawada
10 of 66
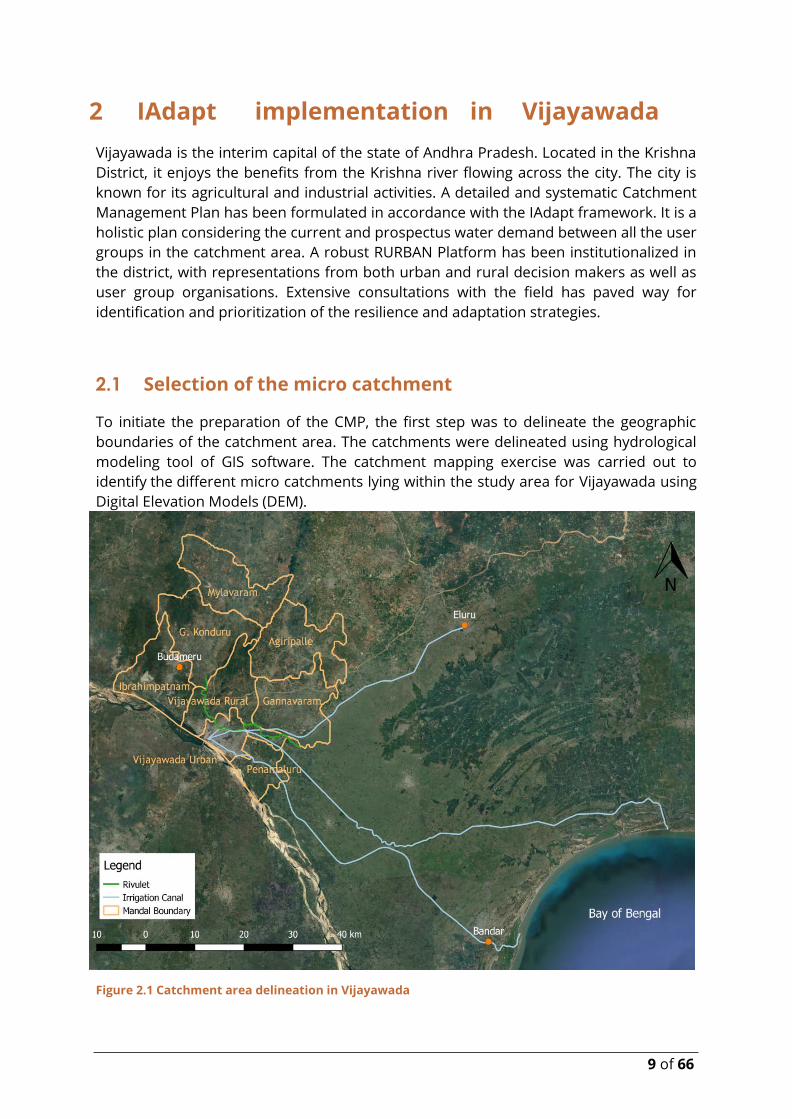
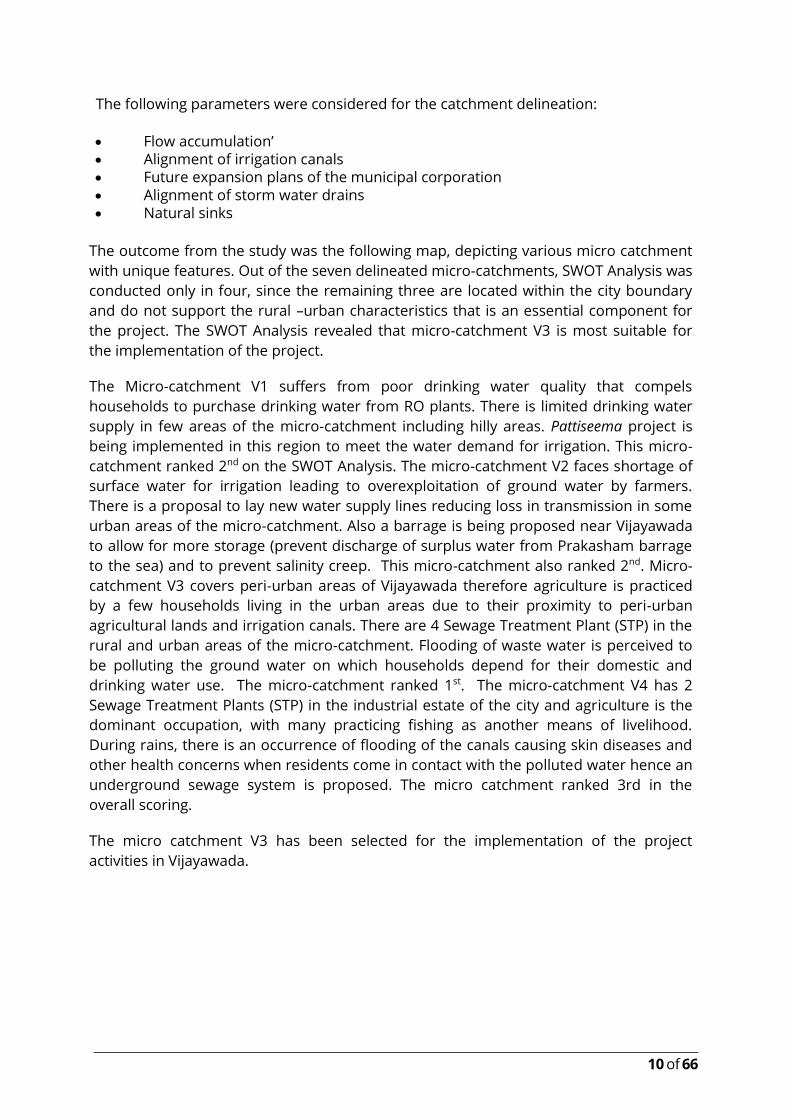
The following parameters were considered for the catchment delineation:
• Flow accumulation’ • Alignment of irrigation canals • Future expansion plans of the municipal corporation • Alignment of storm water drains • Natural sinks
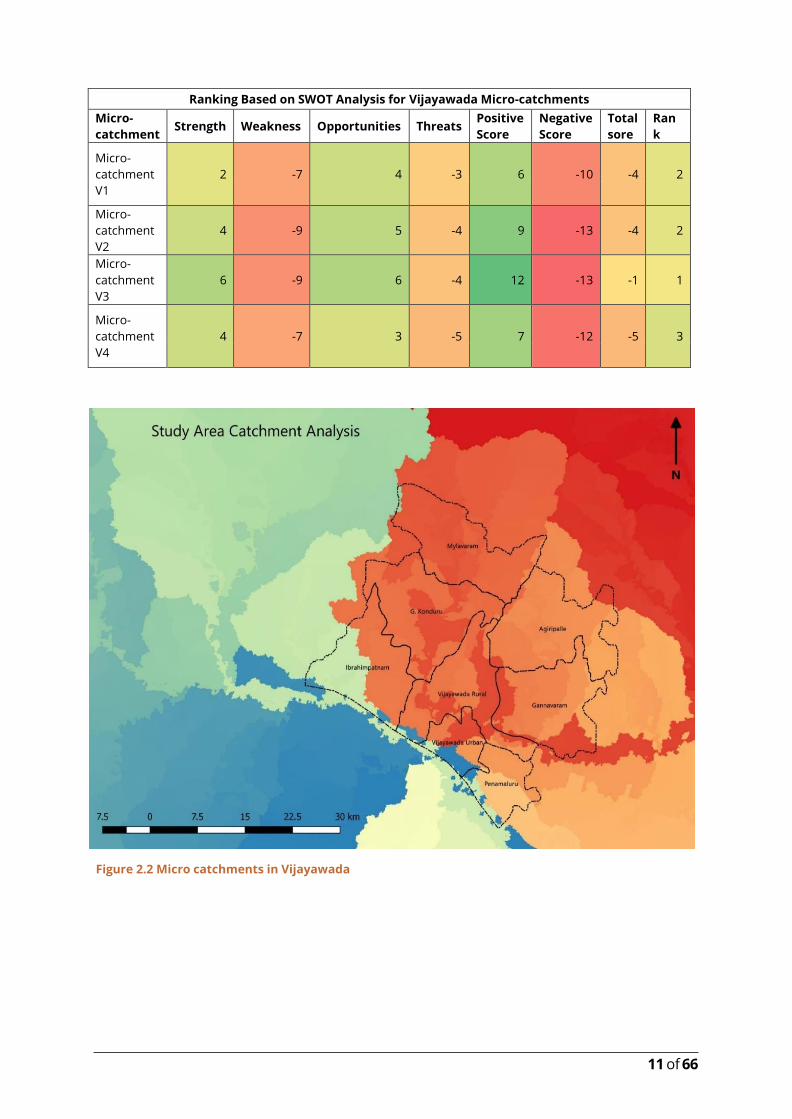
The outcome from the study was the following map, depicting various micro catchment
with unique features. Out of the seven delineated micro-catchments, SWOT Analysis was
conducted only in four, since the remaining three are located within the city boundary
and do not support the rural –urban characteristics that is an essential component for
the project. The SWOT Analysis revealed that micro-catchment V3 is most suitable for
the implementation of the project.
The Micro-catchment V1 suffers from poor drinking water quality that compels
households to purchase drinking water from RO plants. There is limited drinking water
supply in few areas of the micro-catchment including hilly areas. Pattiseema project is
being implemented in this region to meet the water demand for irrigation. This micro-
catchment ranked 2nd on the SWOT Analysis. The micro-catchment V2 faces shortage of
surface water for irrigation leading to overexploitation of ground water by farmers.
There is a proposal to lay new water supply lines reducing loss in transmission in some
urban areas of the micro-catchment. Also a barrage is being proposed near Vijayawada
to allow for more storage (prevent discharge of surplus water from Prakasham barrage
to the sea) and to prevent salinity creep. This micro-catchment also ranked 2nd. Micro-
catchment V3 covers peri-urban areas of Vijayawada therefore agriculture is practiced
by a few households living in the urban areas due to their proximity to peri-urban
agricultural lands and irrigation canals. There are 4 Sewage Treatment Plant (STP) in the
rural and urban areas of the micro-catchment. Flooding of waste water is perceived to
be polluting the ground water on which households depend for their domestic and
drinking water use. The micro-catchment ranked 1st. The micro-catchment V4 has 2
Sewage Treatment Plants (STP) in the industrial estate of the city and agriculture is the
dominant occupation, with many practicing fishing as another means of livelihood.
During rains, there is an occurrence of flooding of the canals causing skin diseases and
other health concerns when residents come in contact with the polluted water hence an
underground sewage system is proposed. The micro catchment ranked 3rd in the
overall scoring.
The micro catchment V3 has been selected for the implementation of the project
activities in Vijayawada.
11 of 66
Ranking Based on SWOT Analysis for Vijayawada Micro-catchments
Micro-
catchment Strength Weakness Opportunities Threats
Positive
Score
Negative
Score
Total
sore
Ran
k
Micro-
catchment
V1
2 -7 4 -3 6 -10 -4 2
Micro-
catchment
V2
4 -9 5 -4 9 -13 -4 2
Micro-
catchment
V3
6 -9 6 -4 12 -13 -1 1
Micro-
catchment
V4
4 -7 3 -5 7 -12 -5 3
Figure 2.2 Micro catchments in Vijayawada
12 of 66
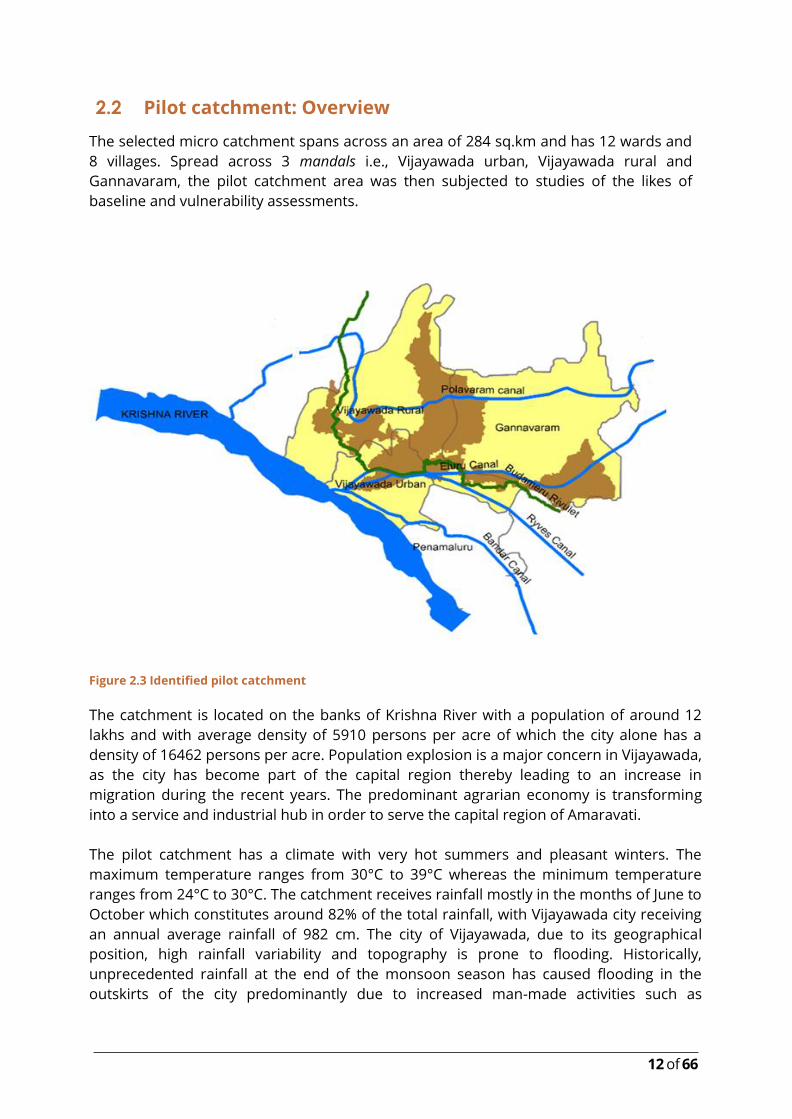
2.2 Pilot catchment: Overview
The selected micro catchment spans across an area of 284 sq.km and has 12 wards and
8 villages. Spread across 3 mandals i.e., Vijayawada urban, Vijayawada rural and
Gannavaram, the pilot catchment area was then subjected to studies of the likes of
baseline and vulnerability assessments.
Figure 2.3 Identified pilot catchment
The catchment is located on the banks of Krishna River with a population of around 12
lakhs and with average density of 5910 persons per acre of which the city alone has a
density of 16462 persons per acre. Population explosion is a major concern in Vijayawada,
as the city has become part of the capital region thereby leading to an increase in
migration during the recent years. The predominant agrarian economy is transforming
into a service and industrial hub in order to serve the capital region of Amaravati.
The pilot catchment has a climate with very hot summers and pleasant winters. The
maximum temperature ranges from 30°C to 39°C whereas the minimum temperature
ranges from 24°C to 30°C. The catchment receives rainfall mostly in the months of June to
October which constitutes around 82% of the total rainfall, with Vijayawada city receiving
an annual average rainfall of 982 cm. The city of Vijayawada, due to its geographical
position, high rainfall variability and topography is prone to flooding. Historically,
unprecedented rainfall at the end of the monsoon season has caused flooding in the
outskirts of the city predominantly due to increased man-made activities such as
13 of 66
encroachment. The Krishna river enters the city from the north leading into Budameru
canal, whose networks are used to discharge excess/flood waters. The low-lying areas
along the river in the city experience water logging, particularly during retreating
monsoon (due to the depressions and cyclones), when reservoirs are almost at full
capacity. The carrying capacity of Budameru canal has also reduced due to silting of
drains, developments and encroachments over the years. Due to various flood control
measures in upstream areas, overall flood risk for the city of Vijayawada has been
reduced over the years. From historical flood data, it can be observed that flood
occurrence has been on the fall in Vijayawada. Even the flood that occurred in 2009 might
be attributed to the cumulative effect of above average rainfall over the previous 6 years
leading to exceeding the storage capacity of the aquifer. The depletion of ground water
table is also a major concern in the pilot catchment due to the increased industrial
activities and over exploitation of ground water in the area. Vijayawada Urban has the
ground water table at a depth of 9 m which is very less when compared to the water table
depth of 21.6 m and 11.8 m at Vijayawada Rural mandal and Gannavaram mandal
respectively.
14 of 66
2.3 Formulation of RURBAN platform
A RURBAN Platform has been institutionalized in the Krishna district, with
representations from both urban and rural decision makers as well as user group
organisations. This multi-stakeholder platform enables dialogue between the otherwise
silo departments and empowers decision making towards integrated water
management.
The RURBAN platform was constituted as part of the project to bring together
rural and urban stakeholders in the catchment to share existing knowledge
regarding water management and to make decisions in collaboration,
considering the needs of different stakeholders. The primary challenge the
RURBAN platform aims to address is the existing institutional silos of governance
of water across boundaries. The expected outcome of the development of the
RURBAN platform is the participatory management of water resources through
an integrated governance mechanism. The RURBAN platform consists of key
individuals from the state, district, and city departments, and ministries
representing urban and rural authorities, who are responsible for interactions
and discussions on integrated water management strategies and actions. The
members of the RURBAN platform have the responsibility of development of
water strategies and actions at the administrative and community level, and they
also provide support for the implementation of water sector related actions at
different levels.
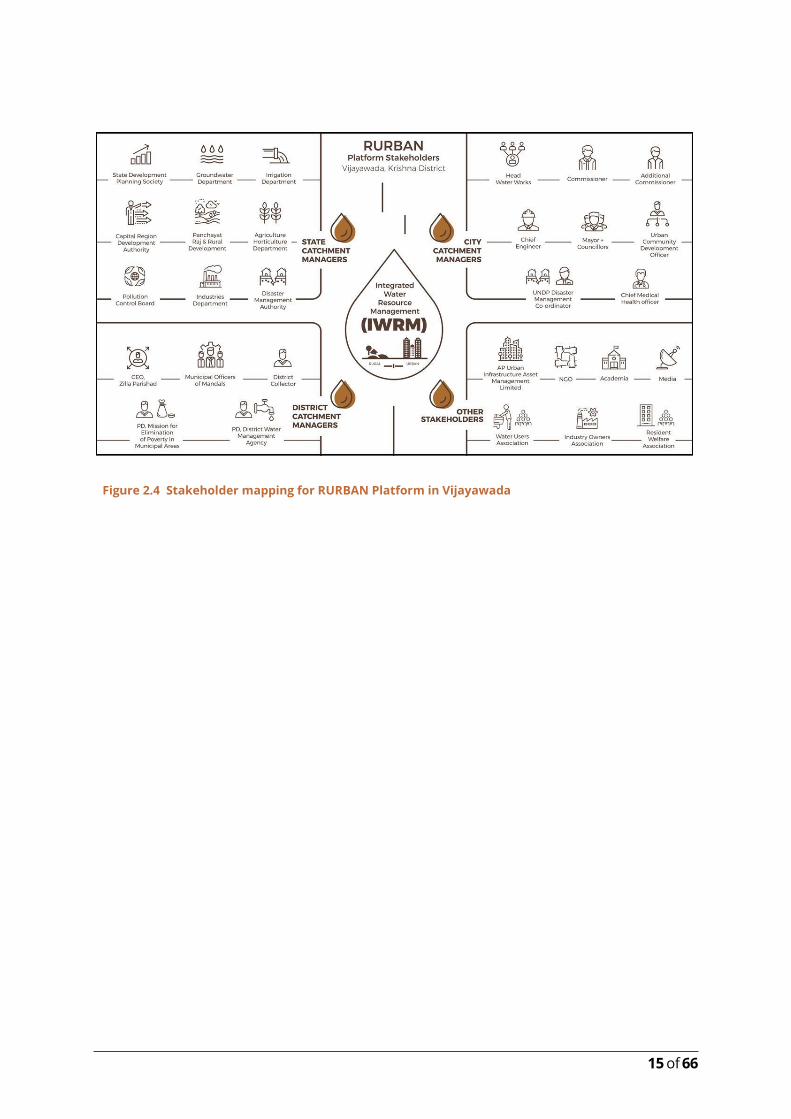
Members of RURBAN Platform include:
• District Magistrate and Collector, Krishna
• Commissioner, Vijayawada Municipal Corporation
• Joint Collector, Krishna
• CEO, Zilla Parishad
• Chief Engineer, Vijayawada Municipal Corporation
• Superintending Engineer, Rural Water and Supply and Sanitation
• Engineer in Chief, Water Resources Department
• District Panchayat Officer, Krishna
• General Manager, DIC
• Joint Director, Agriculture
This District RURBAN Steering Committee has been formed under the chairpersonship
of the District Collector and has been instrumental in conducting several meetings and
stakeholder consultations towards integrated water management in Vijayawada.
15 of 66
Figure 2.4 Stakeholder mapping for RURBAN Platform in Vijayawada
16 of 66
2.4 Baseline Assessment
A thorough and an extensive baseline assessment was carried out for the micro
catchment in Vijayawada and the following represents a summary of the same:
The selected micro-catchment V3 covers 12 villages (Ambapuram, Chegireddipadu,
Done Atkuru, Haveli Mutyalampadu, Jakkulenekkelam, Narasayagudem, Nunna,
Phiryadi Nainavaram, Ramachandrapuram, Surampalle, Vedurupavuluru, Velageru)
and Vijayawada city area. The total area covered by the 12 villages is approximately
16451.3 hectares whereas the city covers an area of about 61.88 km². The micro-
catchment has approximately 12081 households (rural) and 231759 HH (Urban). The
total rural population in the micro-catchment is approximately 42246 whereas the
urban population is about 263,998 .
Ground water, Budameru river and agricultural canals carrying Krishna’s fresh water
are the primary water sources within the micro-catchment.
Based on an analysis of historical data, Vijayawada City witnessed several storms
ranging from Tropical Depressions (31 – 61 km/hr) to very strong storms (88-117
km/hr). In the 137-year period between 1877 and 2013, 33 cyclonic disturbances
passed within 150 km of Vijayawada City, an average of one cyclone in five years .
However, most of the cyclones have weak effects. Exceptions to this rule are found in
the May 1990 super cyclone with winds up to 117 kmph and the November 1977
cyclone with winds up to 183 kmph. Besides the overflowing of banks of Krishna River,
Vijayawada city also experiences floods (mainly water logging) due to flows from
Budameru river. The low-lying areas along the river in the city experience the water
logging particularly during retreating monsoon (due to the depressions and cyclones),
when reservoirs are almost at the full capacity. Our baselines assessment indicated
that wards around Budameru River (drain) area are having a high incidence of water
borne diseases (typhoid, jaundice and diarrhea). The quality of water supply in coastal
regions is at risk from rising sea level and changes in precipitation. Rising sea level and
the occurrence of drought can increase the salinity of both surface water and ground
water through salt water intrusion.The micro-catchment receives rainfall mostly in the
months of June to October which constitutes around 82% of the total rainfall, with
Vijayawada city receiving an annual average rainfall of 982 cm. The city of Vijayawada,
due to its geographical position, high rainfall variability and topography is prone to
flooding. Historically, unprecedented rainfall at the end of the monsoon season has
caused flooding in the outskirts of the city predominantly due to increased man-made
activities such as encroachment.
The Krishna river enters the city from the north leading into Budameru canal, whose
networks are used to discharge excess/flood waters. The carrying capacity of
Budameru canal has also reduced due to silting of drains, developments and
encroachments over the years. Due to various flood control measures in upstream
areas, overall flood risk for the city of Vijayawada has been reduced over the years.
From historical flood data, it can be observed that flood occurrence has been on the
17 of 66
fall in Vijayawada. Even the flood that occurred in 2009 might be attributed to the
cumulative effect of above average rainfall over the previous 6 years leading to
exceeding the storage capacity of the aquifer.
The depletion of ground water table is also a major concern in the micro-catchment
due to the increased industrial activities and over exploitation of ground water in the
area. Vijayawada Urban has ground water table at a depth of 9 m which is very less
when compared to the water table depth of 21.6 m and 11.8 m at Vijayawada Rural
mandal and Gannavaram mandal respectively.
As per Vijayawada Municipal Corporation and Rural Water Supply and Sewerage,
Krishna, it can be observed that the urban micro-catchment has 62.7% coverage of
water supply distribution network with 85% households having access to piped water
supply while approximately 35% households have access to piped water supply in the
rural micro catchment. As on date, 36% of the households are connected to sewage
distribution networks in the urban micro-catchment. Out of the 150 MLD waste water
generated in the city per day, 120 MLD is treated while the rest is let out into the
agricultural canals. Slums pockets are seen to have poor sewerage facilities and water
supply facilities.

18 of 66
2.5 IAdapt Phase 3: Climate Change Vulnerability Assessment
For Vijayawada, climate scenario assessment as per the IAdapt Framework indicates that
there are observed changes in temperature and rainfall. Even though the number of
cyclone disturbances is expected to decrease, the cyclonic systems is expected to
increase. A marginal increase in storm surge level is also expected. The sea level along
the coast is found to be rising at a rate of 1.3mm/year on an average. Krishna district
have had exposure to floods and cyclones, mainly due to their geographic location and
the influence of parameters like deviation of rainfall and exposure to oceanic
disturbances. Also, some mandals in Krishna district have indicated a significant decline
in ground water. With a prediction of 20% reduction in water yield over the years,
Krishna’s abundant surface water supply is expected to be stressed.
A summary of the findings from the study for the catchment is given below:
Changing
Climate
Conditions
Assessments Climate Scenario Summary Statements
Precipitation
change
Regional
Assessments
There is a high level of confidence of an expected
change of 858±10mm to 1280±16 mm in the mean
annual rainfall in the East Coastal region by the year
2030.
Supplementary
Assessments
There is a suggestion of a projected mean southwest
monsoon rainfall in the range from 2-16 mm/day
during 2050s and 2-18 mm/day during 2080s. There
is a suggestion of a projected mean northeast
monsoon rainfall ranges from 1.0- 4.0 mm/day for
2050s and 1.5-4.5 mm/day in 2080s. Also, there is a
suggestion where Krishna district is projected to
have a mean rainfall of 4-6 mm/day.
Temperature
change
Regional
Assessments
There is an expected increase from 28.7±0.6oC to
29.3±0.7oC in the annual air temperature of the East
Coastal region in 2030s with respect to the 1970s.
Supplementary
Assessments
There is a suggestion that the mean annual
predicted temperature varies from 26oC to 32.5oC in
2050s with further rise in range of temperature from
27oC to 33.5oC in 2080s
Extreme
events
Temperature: It is expected that the change in
minimum temperature along the eastern coastal
region will be in the range from 2.0oC to 4.5oC.
Likewise, it is expected that the change in maximum
temperature in 2030s with respect to 1970s will
range between 1oC to 3.5oC
Precipitation: It is expected that in the eastern coast,
the number of rainy days is likely to decrease by 1-5
days. Also, it is expected that the intensity of rainfall
19 of 66
is likely to increase between 1mm/day and 4mm/day
Storm: There is an expected increase of 100-year
return levels of storm from 2.53±0.08 (1961-1990) to
2.94±0.08 (2071-2100)
Cyclone: It is expected that even though cyclonic
disturbances in 2030s is likely to decrease with
respect to 1970s, the cyclonic systems might be
more intense in 2030s
Sea level rise The expected mean sea level rise trend along the
Vishakhapatnam coast is 1.09 mm/yr
2.5.1 Water balance
The water balance modelling was done using Water Evaluation and Planning System
(WEAP), which is a microcomputer tool for integrated water resources planning that
provides a user-friendly framework for policy analysis. In WEAP, the water supply-
demand gap is calculated by the software once the water consumption and supply
details are entered for the various demand and supply nodes. In the water balance
model for the catchment area which consists of 8 mandals, the following data which was
collected from different government departments, has been input in the model:
i. Krishna river headflow
ii. Annual activity level and annual water use rate for the demand nodes (Urban
and rural population, livestock, agriculture, industries and power plants)
iii. Initial storage, maximum withdrawal, natural recharge etc. for groundwater
iv. Maximum diversion for Prakasam barrage
v. Inflows to tanks
vi. Sewage treatment plant capacity
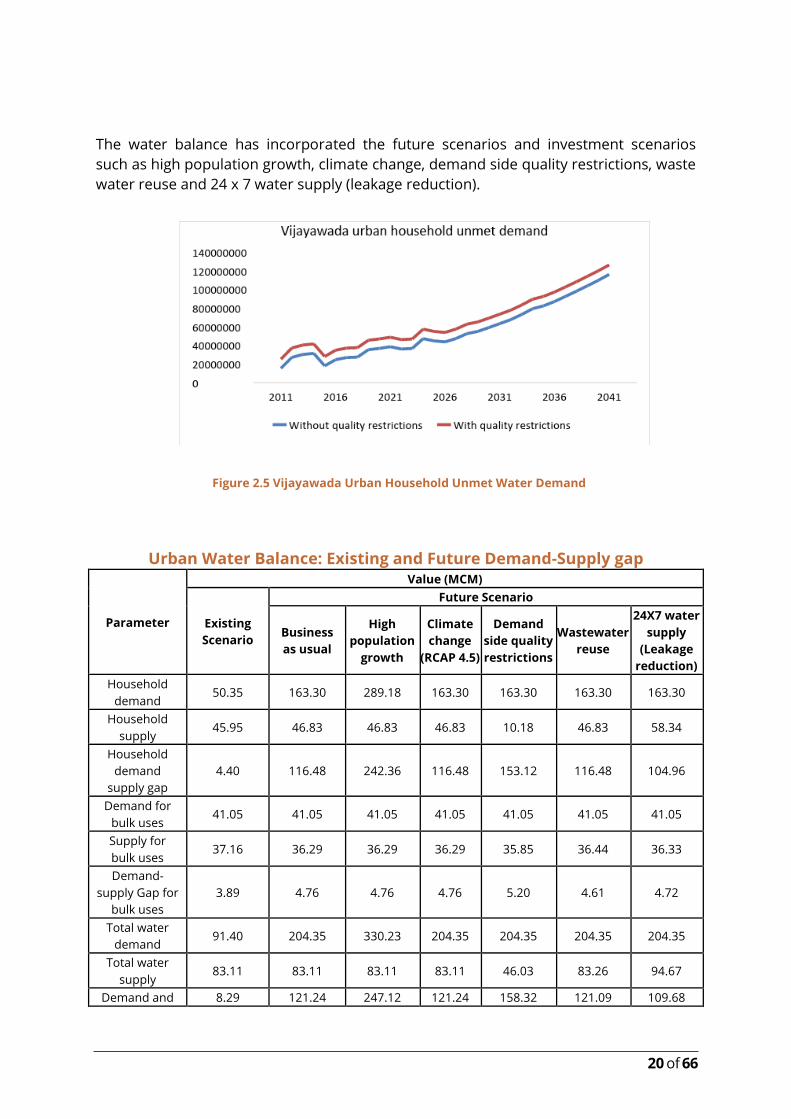
The water balance was calculated for the micro-catchment area through the WEAP
model and it was estimated that there is a current unmet demand of 8 MCM in the
catchment which is estimated to increase to 142.5 MCM by 2041, considering the
current population growth rate.
Water quality in the micro-catchment has been identified as a focus issues and hence
the impact of water quality on the water balance in the catchment is analysed using the
Decision Support Tool. As per the CPCB water quality standards, drinking water sources
after conventional treatment and disinfection should have a maximum BOD
concentration of 3 mg/L only. If the CPCB standards are applied to the water supply in
Vijayawada city, it can be observed that the unmet demand will increase because most
of the groundwater abstracted by the urban population is of lower quality. The major
source of water for Vijayawada city is Prakasam Barrage, and the water supplied from
the barrage meets the CPCB water quality standards. But in rural areas, the BOD
concentration in the water used is significantly higher, and doesn’t meet the CPCB water
quality standards, and hence the unmet demand increases steeply under a scenario
where water supply is restricted based on CPCB quality standards.
20 of 66
The water balance has incorporated the future scenarios and investment scenarios
such as high population growth, climate change, demand side quality restrictions, waste
water reuse and 24 x 7 water supply (leakage reduction).
Figure 2.5 Vijayawada Urban Household Unmet Water Demand
Urban Water Balance: Existing and Future Demand-Supply gap
Parameter
Value (MCM)
Existing
Scenario
Future Scenario
Business
as usual
High
population
growth
Climate
change
(RCAP 4.5)
Demand
side quality
restrictions
Wastewater
reuse
24X7 water
supply
(Leakage
reduction)
Household
demand 50.35 163.30 289.18 163.30 163.30 163.30 163.30
Household
supply 45.95 46.83 46.83 46.83 10.18 46.83 58.34
Household
demand
supply gap
4.40 116.48 242.36 116.48 153.12 116.48 104.96
Demand for
bulk uses 41.05 41.05 41.05 41.05 41.05 41.05 41.05
Supply for
bulk uses 37.16 36.29 36.29 36.29 35.85 36.44 36.33
Demand-
supply Gap for
bulk uses
3.89 4.76 4.76 4.76 5.20 4.61 4.72
Total water
demand 91.40 204.35 330.23 204.35 204.35 204.35 204.35
Total water
supply 83.11 83.11 83.11 83.11 46.03 83.26 94.67
Demand and 8.29 121.24 247.12 121.24 158.32 121.09 109.68
21 of 66
Parameter
Value (MCM)
Existing
Scenario
Future Scenario
Business
as usual
High
population
growth
Climate
change
(RCAP 4.5)
Demand
side quality
restrictions
Wastewater
reuse
24X7 water
supply
(Leakage
reduction)
supply gap
Rural Water Balance: Existing and Future Demand-Supply gap
Parameter
Value (MCM)
Existing
Scenario
Future Scenario
Business as
usual
High
population
growth
Climate
change
(RCAP 4.5)
Demand side
quality
restrictions
Wastewater
reuse
24X7 water
supply
(Leakage
reduction)
Household
demand 7.56 17.41 17.41 17.41 17.41 17.41 17.41
Household supply 7.48 7.48 7.48 7.48 1.02 7.48 7.48
Household
demand supply
gap
0.09 9.93 9.93 9.93 16.39 9.93 9.93
Demand for bulk
uses 57.79 57.57 81.16 57.57 57.57 57.57 57.57
Supply for bulk
uses 55.80 55.59 55.59 55.59 43.07 55.53 55.59
Demand-supply
Gap for bulk uses 1.99 1.99 25.57 1.99 14.51 2.04 1.99
Total water
demand 65.36 74.98 98.57 74.98 74.98 74.98 74.98
Total water supply 63.28 63.06 63.06 63.06 44.08 63.01 63.06
Demand and
supply gap 2.08 11.92 35.50 11.92 30.89 11.97 11.92
2.5.2 Vulnerability assessment
Based on the IAdapt Framework, climate vulnerability of the sectors were analysed.
Vulnerability assessment for the four systems viz. water supply, water pollution, urban
flooding, river flooding were discussed in detailed in the context of climate change.
Expected changes on the systems were identified with respect to temperature and
rainfall changes. Once the climate fragility of the systems was identified discussions
were held to measure the likelihood and consequences of these climate fragilities of
each system to conduct a climate risk assessment of the fragile systems. A score was
assigned from 1 to 5 based on the likelihood of each risk occurring and related
consequences. For each system, the likelihood and consequence score were multiplied
to get the final risk score. Critical systems identified during the discussions were water
supply, ground water, pollution and urban flooding due to waste water, storm water
drainage overflows.
22 of 66
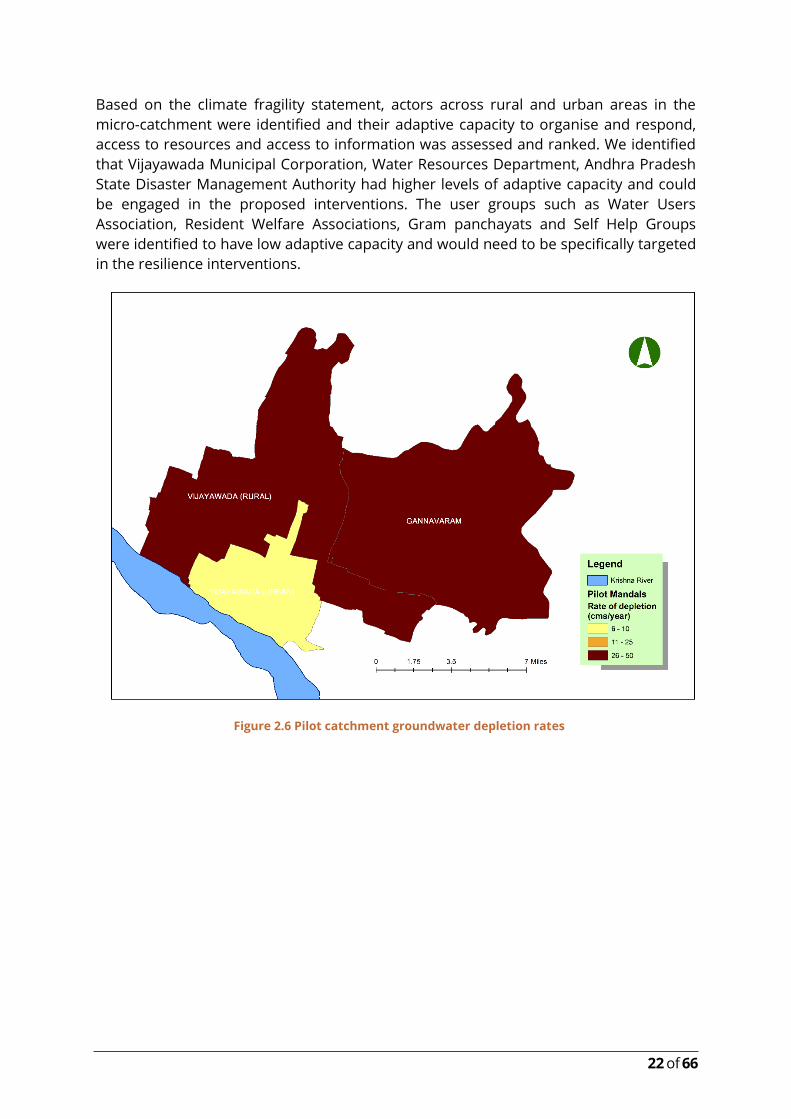
Based on the climate fragility statement, actors across rural and urban areas in the
micro-catchment were identified and their adaptive capacity to organise and respond,
access to resources and access to information was assessed and ranked. We identified
that Vijayawada Municipal Corporation, Water Resources Department, Andhra Pradesh
State Disaster Management Authority had higher levels of adaptive capacity and could
be engaged in the proposed interventions. The user groups such as Water Users
Association, Resident Welfare Associations, Gram panchayats and Self Help Groups
were identified to have low adaptive capacity and would need to be specifically targeted
in the resilience interventions.
Figure 2.6 Pilot catchment groundwater depletion rates
23 of 66
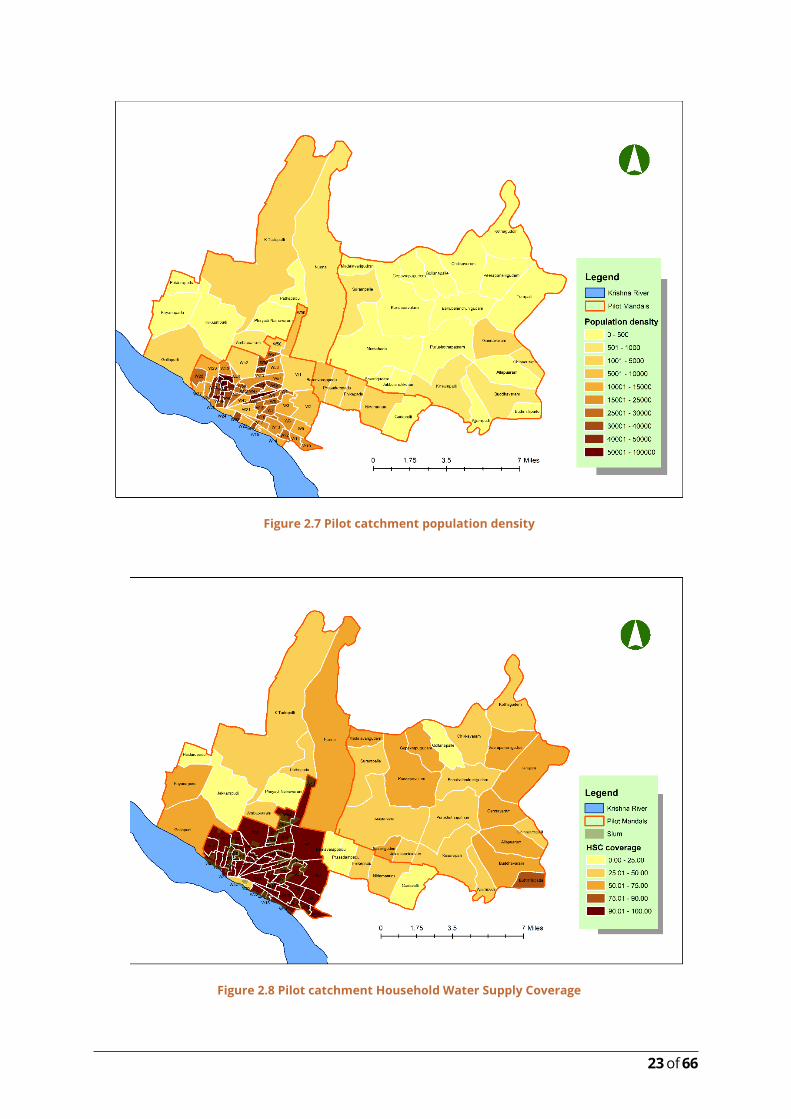
Figure 2.7 Pilot catchment population density
Figure 2.8 Pilot catchment Household Water Supply Coverage
24 of 66
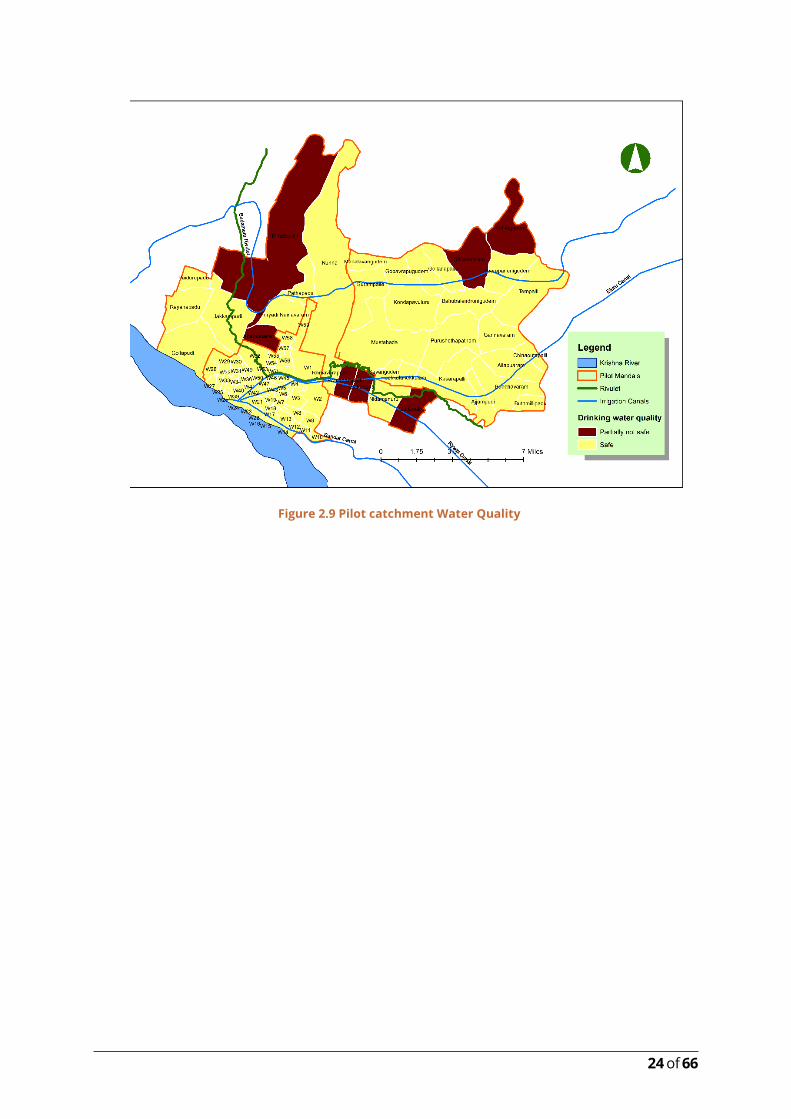
Figure 2.9 Pilot catchment Water Quality
25 of 66
2.6 IAdapt Phase 4: Solutions Assessment
In the fourth phase, a list of interventions is identified based on IUWM and climate
resilience indicators to address and reduce the vulnerability of the water sector,
particularly for the vulnerable areas and actors identified above. Solution
assessment includes strategies best suited to address all identified vulnerable
sectors, actors and areas, to build resilience and achieve sustainability in the
catchment. Once these solutions have been identified, a Water Evaluation and
Assessment Planning tool is employed to help in the decision making and adaptation
finalizations.
2.6.1 Group discussions on CMP adaptations
The objective of the group discussions was to ratify about the focus areas and problems
identified as part of the IAdapt framework along with discussing the solutions that are
feasible in the context of micro-catchment with various stakeholders who are involved
in water management. The feasible solutions as prioritised by stakeholders will be
recommended towards catchment-based approaches in water management.
A total of four group discussions were conducted involving officials from AP state water
resource department, Rural water supply and sanitation, Vijayawada Municipal
corporation, Mandal parishad and gram panchayats, Agriculture department and
farmers.
On the first day, discussions were held with the officials of the Andhra Pradesh state
water resources department and Rural water supply and sanitation department of
Krishna district. It has come to the notice that water bodies have been abused by the
residents of the city and water quality of the canals is pathetic with ammonia content.
Since the source of drinking water for rural settlements is ground water, officials from
RWSS state that the water supplied from PWS scheme is portable which contradicts with
ground reality as most percentage of population still buy on the water from RO plants.
In the discussion we also came to know that the water which is drawn from the ground
for drinking purposes should be passed through the sand filters, for which the sand
filters have to cleaned on regular basis to remove the silt and sediments but this is not
happening due to the truncated financial status of the Gram panchayats. There is no
mechanism for treatment of water before supplying for drinking purposes. The
sewerage and sanitation sector have been a neglected in the rural areas. There were no
steps taken yet to lay underground drainage system till date in the rural areas. Water
resource department mainly concerned about the allocation of water for drinking and
agricultural purposes and post flood mitigation measures. There were no steps taken in
advance to mitigate the flood. Some issues related to usage of water which are
connected to the people stigma need a behavioural change.
On the second day, discussions were held with the officials from Vijayawada Municipal
corporation, the main challenge in the urban water supply is supply of drinking water to
the slums/encroachments in the slum areas and most of the wards with slum pockets
26 of 66
do not have sewerage facilities and sanitation facilities. While the VMC is working on this
issue to provide for better water supply infrastructure and management. As the water
coming into this canal has been polluted by the city inhabitants letting domestic water
and littering solid waste this water is only being used for irrigation purposes. The VMC
had come up with a pilot project ‘Recycling of wastewater from canals’ includes
establishing the Onsite treatment plants and send it to Main pumping stations which
carry to the STPs. This project will encourage the use of surface water for drinking
purposes and increase in the crop yield. The exploitation of ground water both for
irrigation and drinking water purposes in the rural settlements is identifiable.
On the final day, the discussions were held with MPDOs, Panchayat secretaries, Farmers
and residents of the Villages. When we are discussing with MPDOs we came to know
that there is lack of co-ordination between RWSS and Panchayats since the statements
contradict when we ask questions about the drinking water supply and its quality. As
stated previously there is no mechanism for treatment of water before supplying for
drinking purposes. No storm water drains or pits to conserve the rainwater, even the
sewage water, solid waste is let into the roadside kuccha drains. During the monsoons
these drains overflow where the stagnated water come out and spill out on roads
leading for outbreak of diseases.
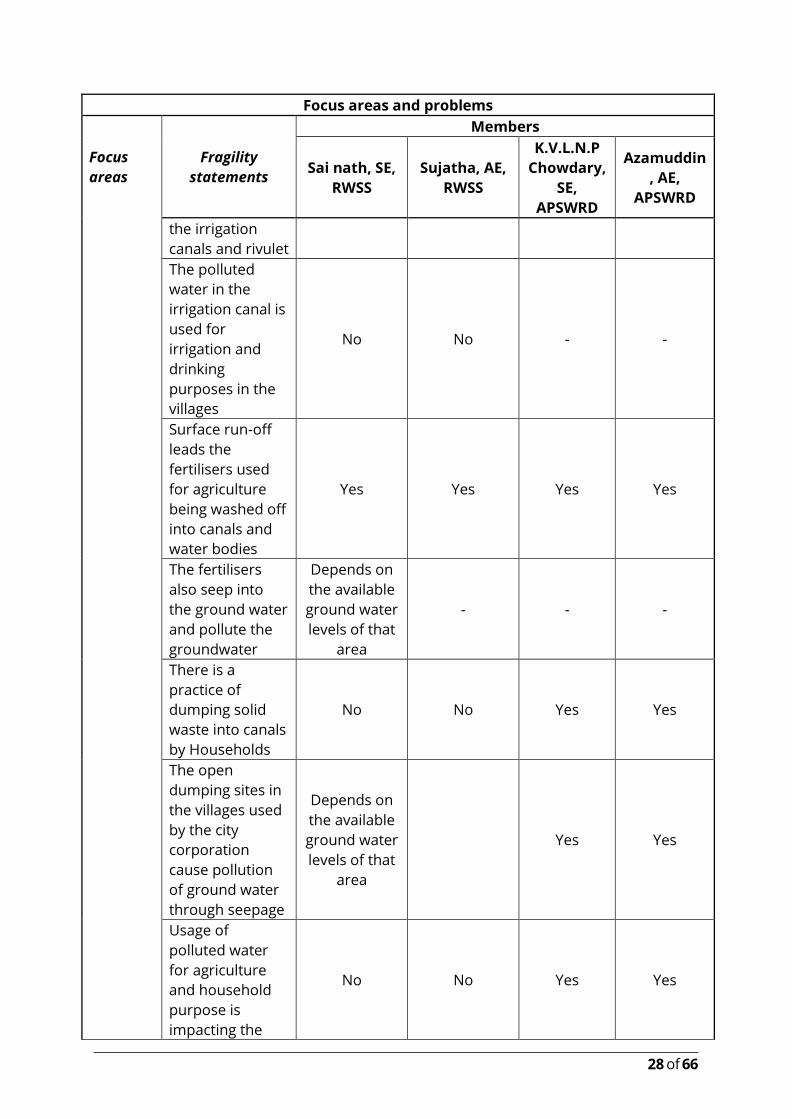
The focus areas, problems and micro catchment solutions were discussed with
respective participants and their responses were collected. The following tables provide
the insights of the participated stakeholders on each solution and problem area.
27 of 66
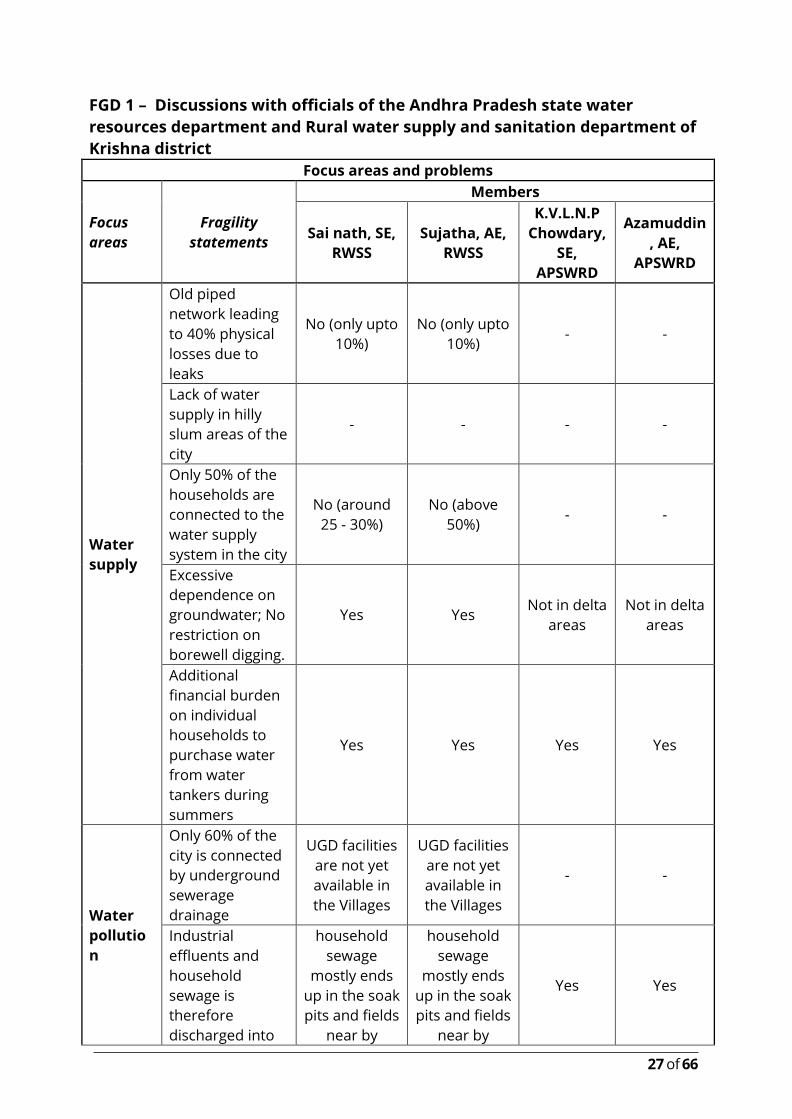
FGD 1 – Discussions with officials of the Andhra Pradesh state water
resources department and Rural water supply and sanitation department of
Krishna district
Focus areas and problems
Focus
areas
Fragility
statements
Members
Sai nath, SE,
RWSS
Sujatha, AE,
RWSS
K.V.L.N.P
Chowdary,
SE,
APSWRD
Azamuddin
, AE,
APSWRD
Water
supply
Old piped
network leading
to 40% physical
losses due to
leaks
No (only upto
10%)
No (only upto
10%) - -
Lack of water
supply in hilly
slum areas of the
city
- - - -
Only 50% of the
households are
connected to the
water supply
system in the city
No (around
25 - 30%)
No (above
50%) - -
Excessive
dependence on
groundwater; No
restriction on
borewell digging.
Yes Yes Not in delta
areas
Not in delta
areas
Additional
financial burden
on individual
households to
purchase water
from water
tankers during
summers
Yes Yes Yes Yes
Water
pollutio
n
Only 60% of the
city is connected
by underground
sewerage
drainage
UGD facilities
are not yet
available in
the Villages
UGD facilities
are not yet
available in
the Villages
- -
Industrial
effluents and
household
sewage is
therefore
discharged into
household
sewage
mostly ends
up in the soak
pits and fields
near by
household
sewage
mostly ends
up in the soak
pits and fields
near by
Yes Yes
28 of 66
Focus areas and problems
Focus
areas
Fragility
statements
Members
Sai nath, SE,
RWSS
Sujatha, AE,
RWSS
K.V.L.N.P
Chowdary,
SE,
APSWRD
Azamuddin
, AE,
APSWRD
the irrigation
canals and rivulet
The polluted
water in the
irrigation canal is
used for
irrigation and
drinking
purposes in the
villages
No No - -
Surface run-off
leads the
fertilisers used
for agriculture
being washed off
into canals and
water bodies
Yes Yes Yes Yes
The fertilisers
also seep into
the ground water
and pollute the
groundwater
Depends on
the available
ground water
levels of that
area
- - -
There is a
practice of
dumping solid
waste into canals
by Households
No No Yes Yes
The open
dumping sites in
the villages used
by the city
corporation
cause pollution
of ground water
through seepage
Depends on
the available
ground water
levels of that
area
Yes Yes
Usage of
polluted water
for agriculture
and household
purpose is
impacting the
No No Yes Yes
29 of 66
Focus areas and problems
Focus
areas
Fragility
statements
Members
Sai nath, SE,
RWSS
Sujatha, AE,
RWSS
K.V.L.N.P
Chowdary,
SE,
APSWRD
Azamuddin
, AE,
APSWRD
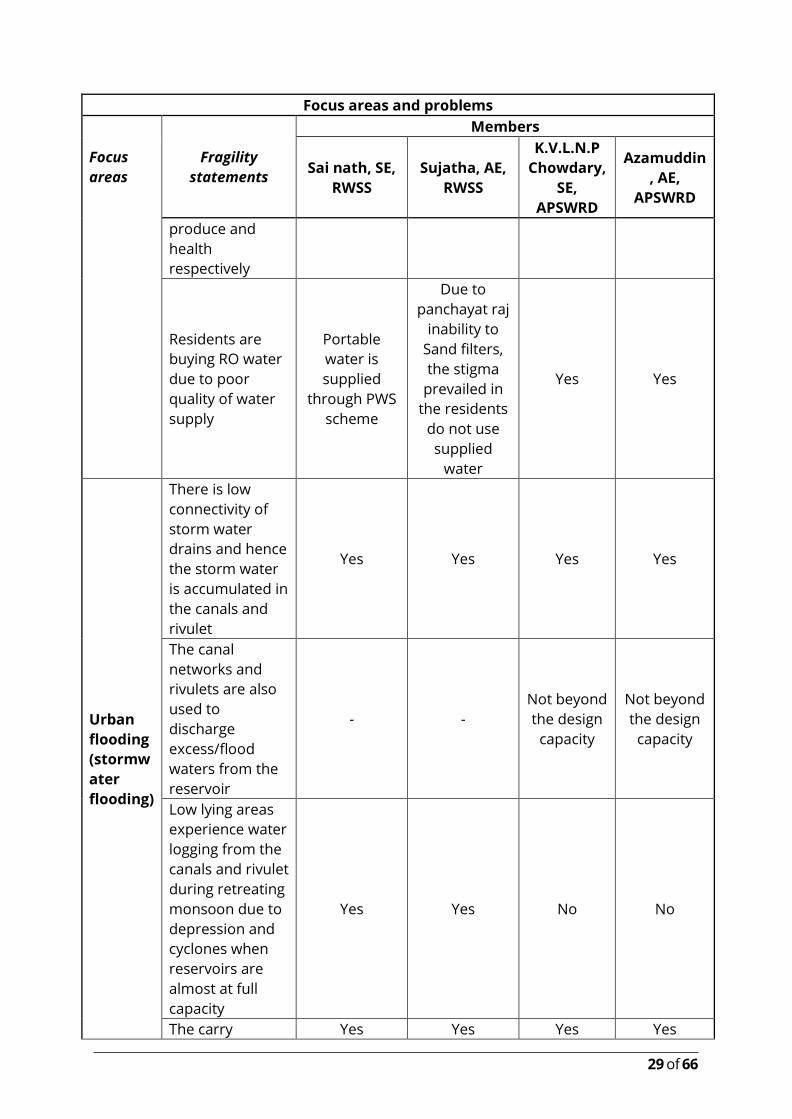
produce and
health
respectively
Residents are
buying RO water
due to poor
quality of water
supply
Portable
water is
supplied
through PWS
scheme
Due to
panchayat raj
inability to
Sand filters,
the stigma
prevailed in
the residents
do not use
supplied
water
Yes Yes
Urban
flooding
(stormw
ater
flooding)
There is low
connectivity of
storm water
drains and hence
the storm water
is accumulated in
the canals and
rivulet
Yes Yes Yes Yes
The canal
networks and
rivulets are also
used to
discharge
excess/flood
waters from the
reservoir
- -
Not beyond
the design
capacity
Not beyond
the design
capacity
Low lying areas
experience water
logging from the
canals and rivulet
during retreating
monsoon due to
depression and
cyclones when
reservoirs are
almost at full
capacity
Yes Yes No No
The carry Yes Yes Yes Yes
30 of 66
Focus areas and problems
Focus
areas
Fragility
statements
Members
Sai nath, SE,
RWSS
Sujatha, AE,
RWSS
K.V.L.N.P
Chowdary,
SE,
APSWRD
Azamuddin
, AE,
APSWRD
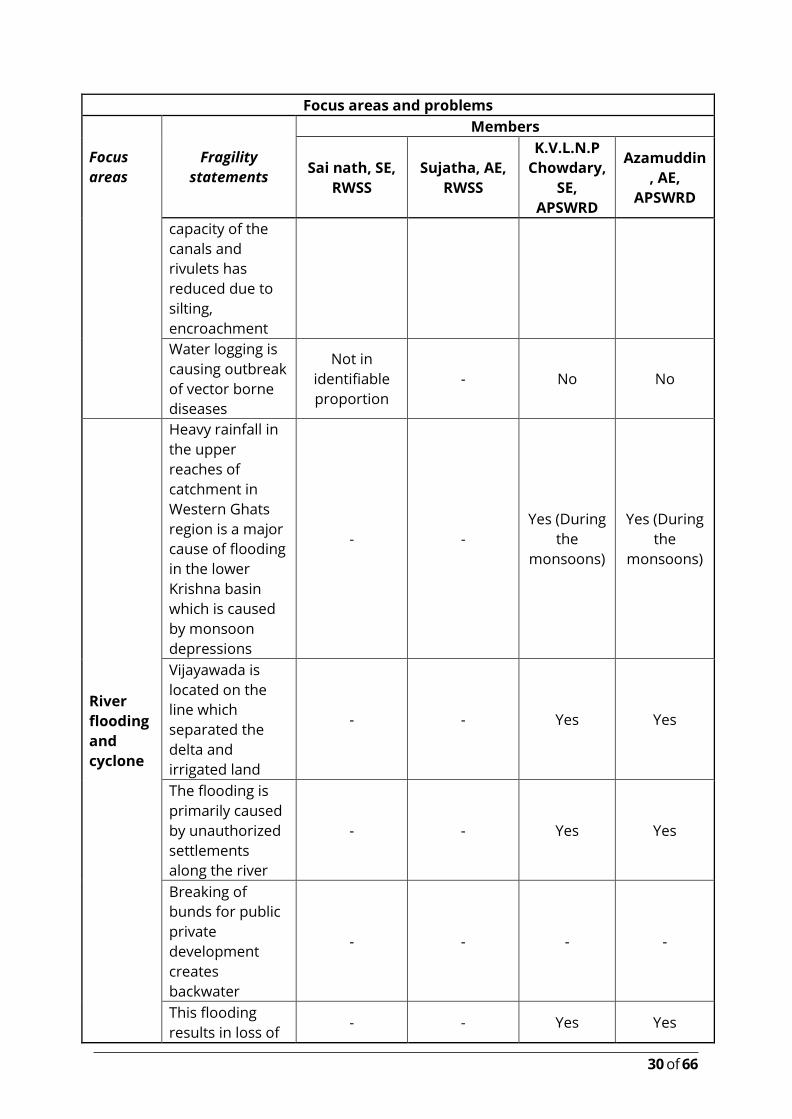
capacity of the
canals and
rivulets has
reduced due to
silting,
encroachment
Water logging is
causing outbreak
of vector borne
diseases
Not in
identifiable
proportion
- No No
River
flooding
and
cyclone
Heavy rainfall in
the upper
reaches of
catchment in
Western Ghats
region is a major
cause of flooding
in the lower
Krishna basin
which is caused
by monsoon
depressions
- -
Yes (During
the
monsoons)
Yes (During
the
monsoons)
Vijayawada is
located on the
line which
separated the
delta and
irrigated land
- - Yes Yes
The flooding is
primarily caused
by unauthorized
settlements
along the river
- - Yes Yes
Breaking of
bunds for public
private
development
creates
backwater
- - - -
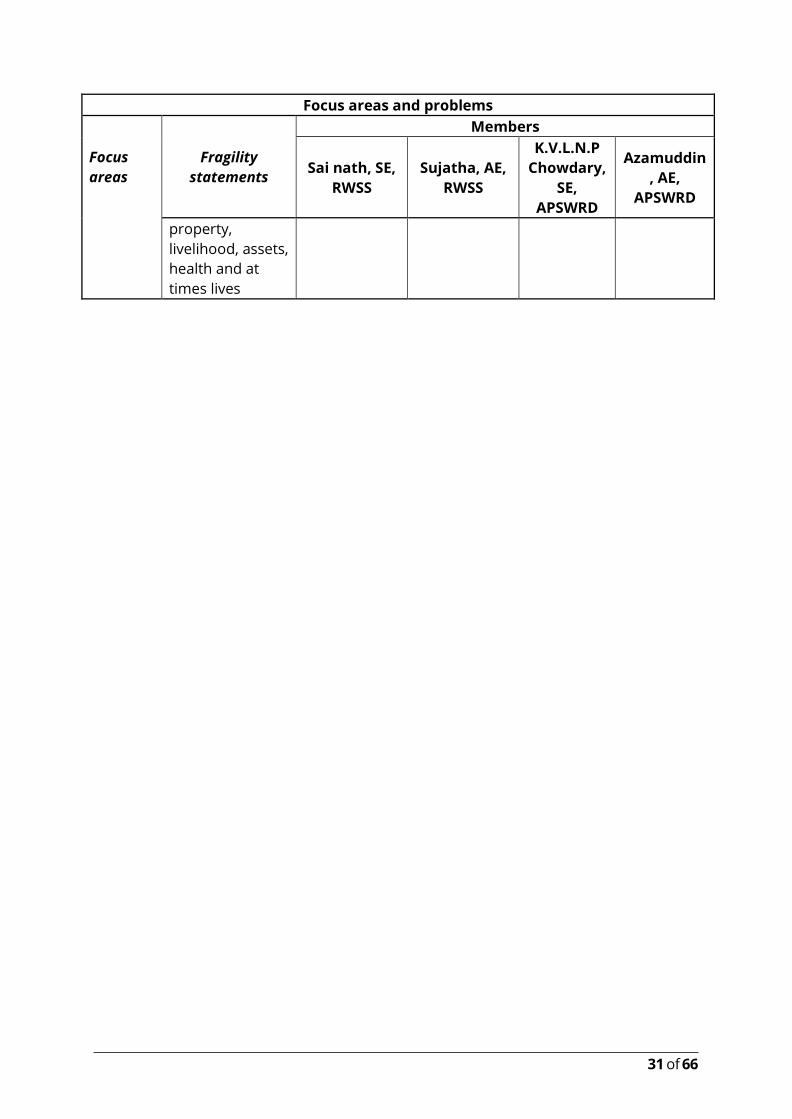
This flooding
results in loss of - - Yes Yes
31 of 66
Focus areas and problems
Focus
areas
Fragility
statements
Members
Sai nath, SE,
RWSS
Sujatha, AE,
RWSS
K.V.L.N.P
Chowdary,
SE,
APSWRD
Azamuddin
, AE,
APSWRD
property,
livelihood, assets,
health and at
times lives
32 of 66
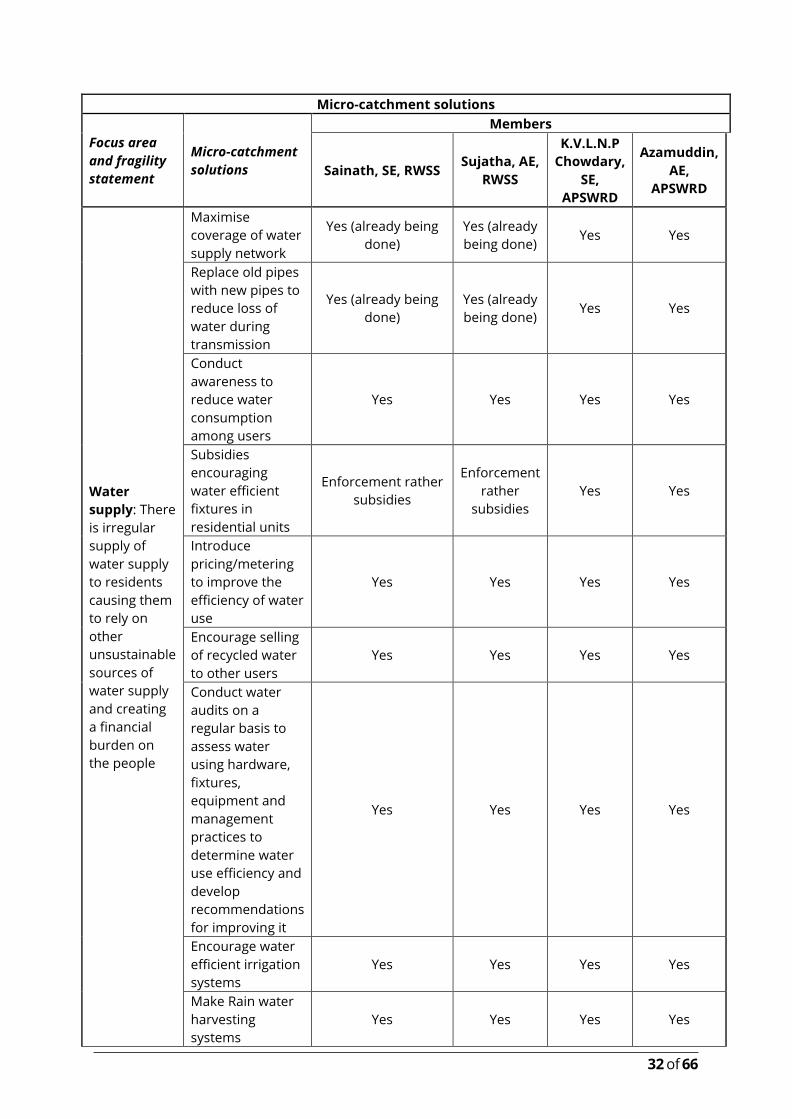
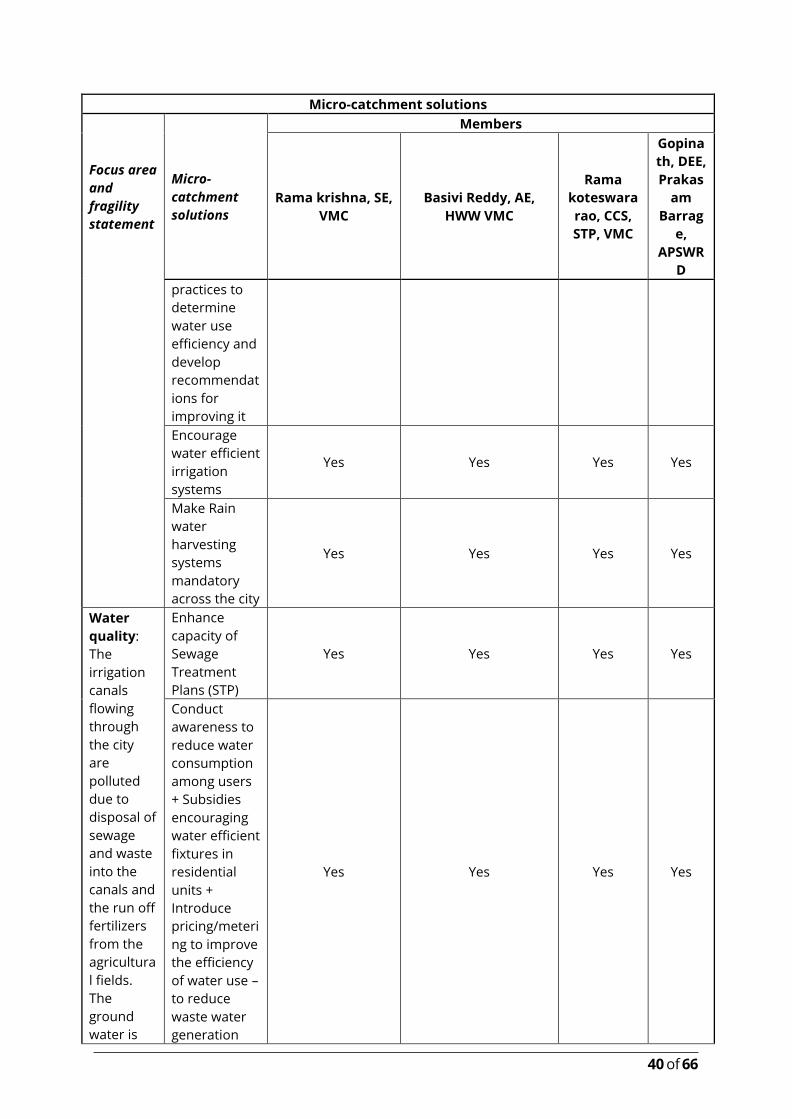
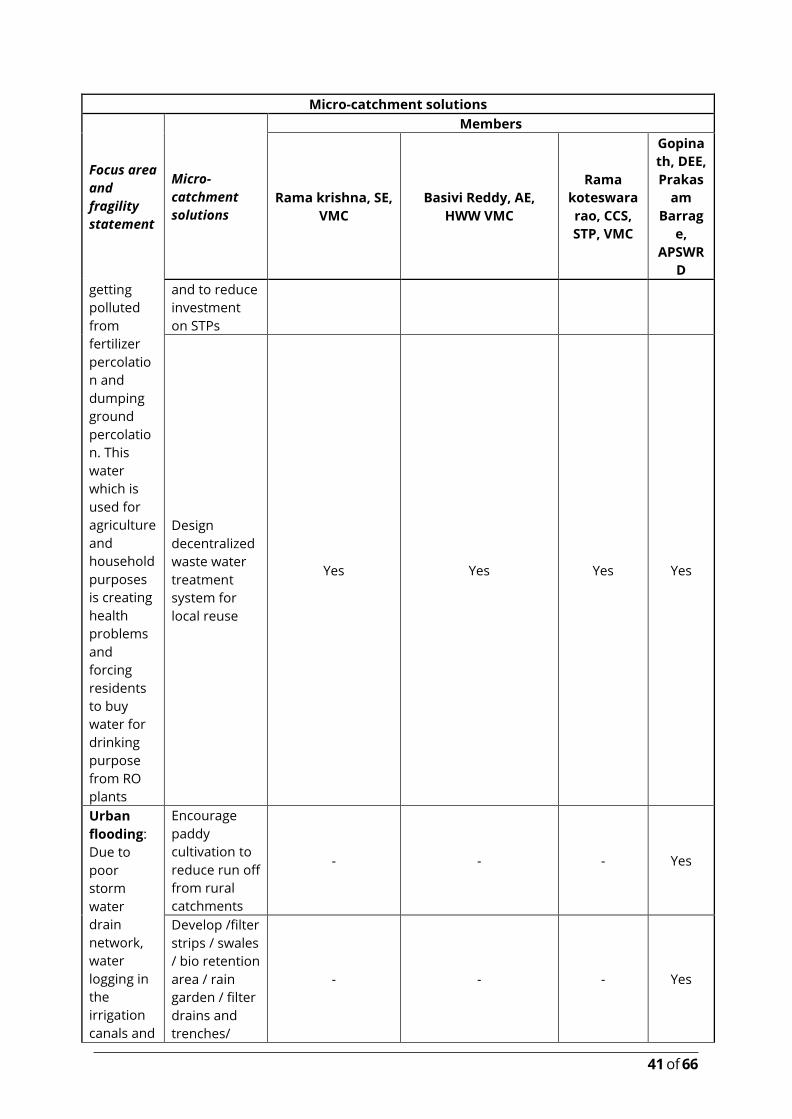
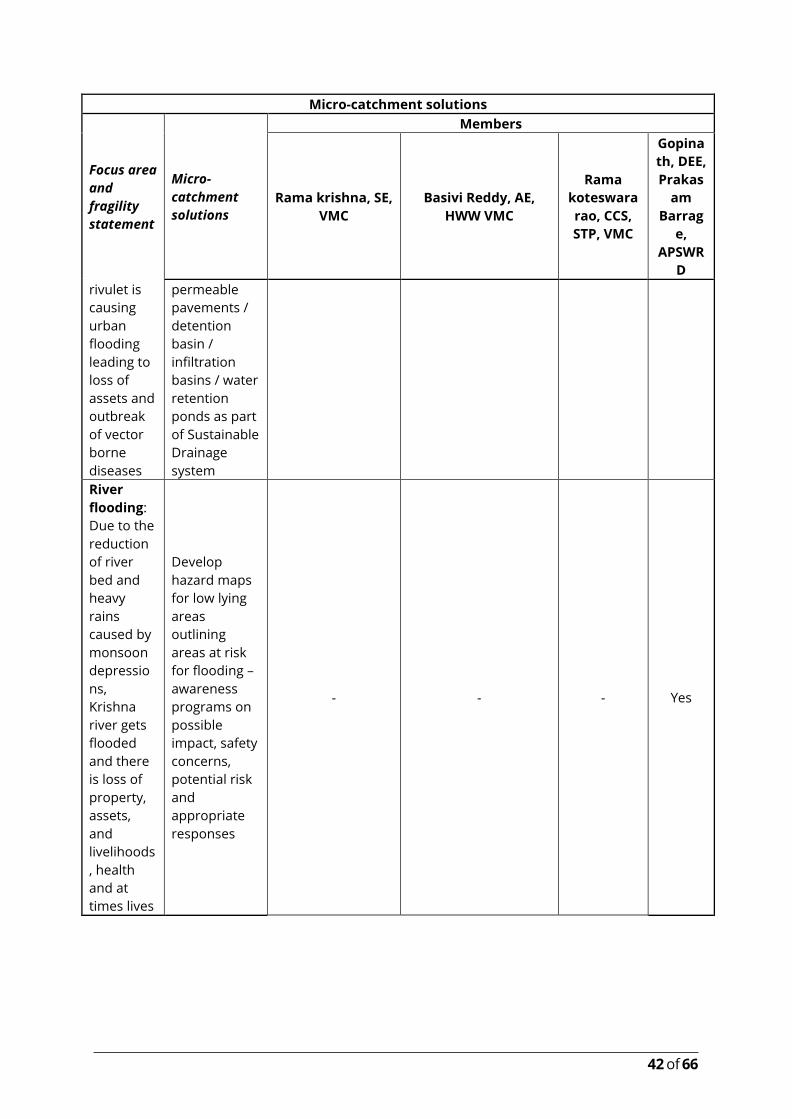
Micro-catchment solutions
Focus area
and fragility
statement
Micro-catchment
solutions
Members
Sainath, SE, RWSS Sujatha, AE,
RWSS
K.V.L.N.P
Chowdary,
SE,
APSWRD
Azamuddin,
AE,
APSWRD
Water
supply: There
is irregular
supply of
water supply
to residents
causing them
to rely on
other
unsustainable
sources of
water supply
and creating
a financial
burden on
the people
Maximise
coverage of water
supply network
Yes (already being
done)
Yes (already
being done) Yes Yes
Replace old pipes
with new pipes to
reduce loss of
water during
transmission
Yes (already being
done)
Yes (already
being done) Yes Yes
Conduct
awareness to
reduce water
consumption
among users
Yes Yes Yes Yes
Subsidies
encouraging
water efficient
fixtures in
residential units
Enforcement rather
subsidies
Enforcement
rather
subsidies
Yes Yes
Introduce
pricing/metering
to improve the
efficiency of water
use
Yes Yes Yes Yes
Encourage selling
of recycled water
to other users
Yes Yes Yes Yes
Conduct water
audits on a
regular basis to
assess water
using hardware,
fixtures,
equipment and
management
practices to
determine water
use efficiency and
develop
recommendations
for improving it
Yes Yes Yes Yes
Encourage water
efficient irrigation
systems
Yes Yes Yes Yes
Make Rain water
harvesting
systems
Yes Yes Yes Yes
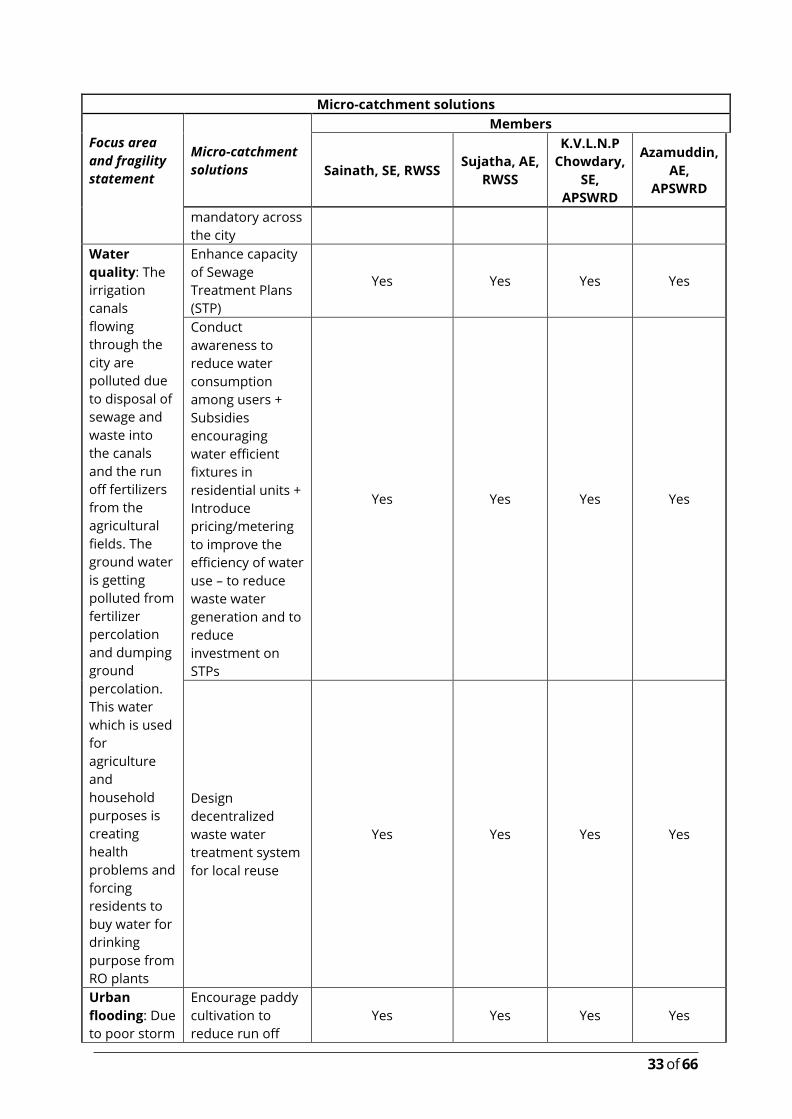
33 of 66
Micro-catchment solutions
Focus area
and fragility
statement
Micro-catchment
solutions
Members
Sainath, SE, RWSS Sujatha, AE,
RWSS
K.V.L.N.P
Chowdary,
SE,
APSWRD
Azamuddin,
AE,
APSWRD
mandatory across
the city
Water
quality: The
irrigation
canals
flowing
through the
city are
polluted due
to disposal of
sewage and
waste into
the canals
and the run
off fertilizers
from the
agricultural
fields. The
ground water
is getting
polluted from
fertilizer
percolation
and dumping
ground
percolation.
This water
which is used
for
agriculture
and
household
purposes is
creating
health
problems and
forcing
residents to
buy water for
drinking
purpose from
RO plants
Enhance capacity
of Sewage
Treatment Plans
(STP)
Yes Yes Yes Yes
Conduct
awareness to
reduce water
consumption
among users +
Subsidies
encouraging
water efficient
fixtures in
residential units +
Introduce
pricing/metering
to improve the
efficiency of water
use – to reduce
waste water
generation and to
reduce
investment on
STPs
Yes Yes Yes Yes
Design
decentralized
waste water
treatment system
for local reuse
Yes Yes Yes Yes
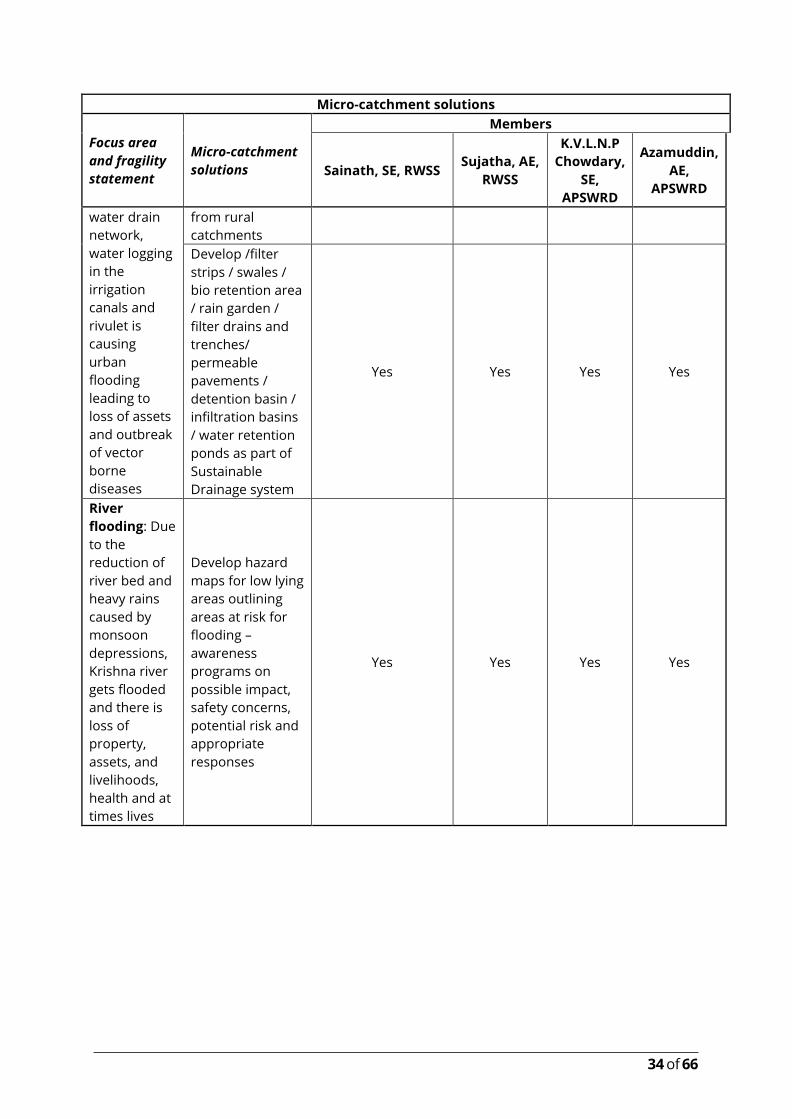
Urban
flooding: Due
to poor storm
Encourage paddy
cultivation to
reduce run off
Yes Yes Yes Yes
34 of 66
Micro-catchment solutions
Focus area
and fragility
statement
Micro-catchment
solutions
Members
Sainath, SE, RWSS Sujatha, AE,
RWSS
K.V.L.N.P
Chowdary,
SE,
APSWRD
Azamuddin,
AE,
APSWRD
water drain
network,
water logging
in the
irrigation
canals and
rivulet is
causing
urban
flooding
leading to
loss of assets
and outbreak
of vector
borne
diseases
from rural
catchments
Develop /filter
strips / swales /
bio retention area
/ rain garden /
filter drains and
trenches/
permeable
pavements /
detention basin /
infiltration basins
/ water retention
ponds as part of
Sustainable
Drainage system
Yes Yes Yes Yes
River
flooding: Due
to the
reduction of
river bed and
heavy rains
caused by
monsoon
depressions,
Krishna river
gets flooded
and there is
loss of
property,
assets, and
livelihoods,
health and at
times lives
Develop hazard
maps for low lying
areas outlining
areas at risk for
flooding –
awareness
programs on
possible impact,
safety concerns,
potential risk and
appropriate
responses
Yes Yes Yes Yes
35 of 66
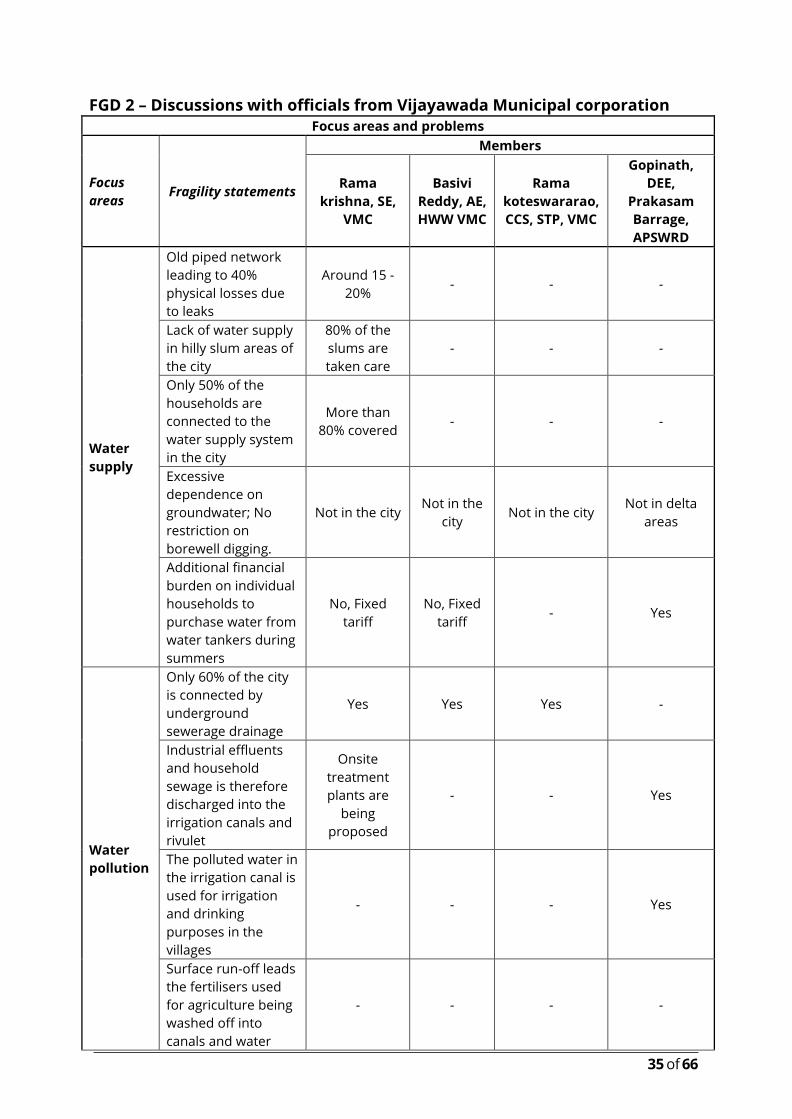
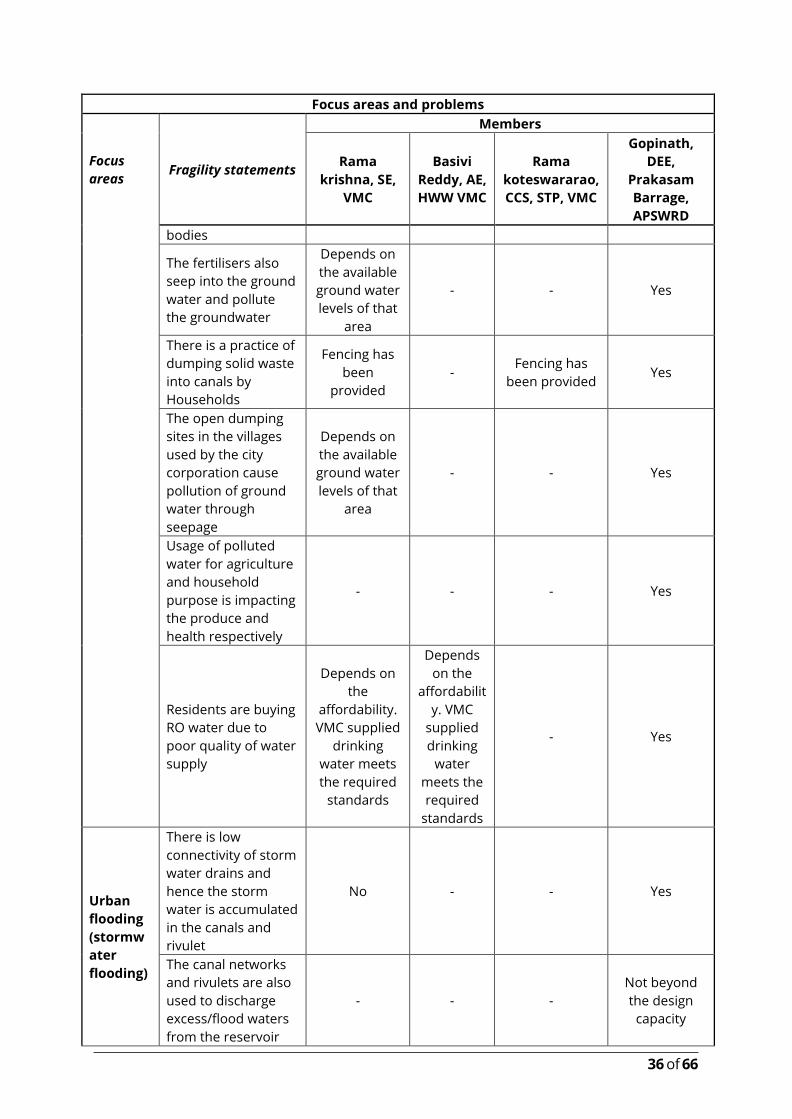
FGD 2 – Discussions with officials from Vijayawada Municipal corporation
Focus areas and problems
Focus
areas Fragility statements
Members
Rama
krishna, SE,
VMC
Basivi
Reddy, AE,
HWW VMC
Rama
koteswararao,
CCS, STP, VMC
Gopinath,
DEE,
Prakasam
Barrage,
APSWRD
Water
supply
Old piped network
leading to 40%
physical losses due
to leaks
Around 15 -
20% - - -
Lack of water supply
in hilly slum areas of
the city
80% of the
slums are
taken care
- - -
Only 50% of the
households are
connected to the
water supply system
in the city
More than
80% covered - - -
Excessive
dependence on
groundwater; No
restriction on
borewell digging.
Not in the city Not in the
city Not in the city
Not in delta
areas
Additional financial
burden on individual
households to
purchase water from
water tankers during
summers
No, Fixed
tariff
No, Fixed
tariff - Yes
Water
pollution
Only 60% of the city
is connected by
underground
sewerage drainage
Yes Yes Yes -
Industrial effluents
and household
sewage is therefore
discharged into the
irrigation canals and
rivulet
Onsite
treatment
plants are
being
proposed
- - Yes
The polluted water in
the irrigation canal is
used for irrigation
and drinking
purposes in the
villages
- - - Yes
Surface run-off leads
the fertilisers used
for agriculture being
washed off into
canals and water
- - - -
36 of 66
Focus areas and problems
Focus
areas Fragility statements
Members
Rama
krishna, SE,
VMC
Basivi
Reddy, AE,
HWW VMC
Rama
koteswararao,
CCS, STP, VMC
Gopinath,
DEE,
Prakasam
Barrage,
APSWRD
bodies
The fertilisers also
seep into the ground
water and pollute
the groundwater
Depends on
the available
ground water
levels of that
area
- - Yes
There is a practice of
dumping solid waste
into canals by
Households
Fencing has
been
provided
- Fencing has
been provided Yes
The open dumping
sites in the villages
used by the city
corporation cause
pollution of ground
water through
seepage
Depends on
the available
ground water
levels of that
area
- - Yes
Usage of polluted
water for agriculture
and household
purpose is impacting
the produce and
health respectively
- - - Yes
Residents are buying
RO water due to
poor quality of water
supply
Depends on
the
affordability.
VMC supplied
drinking
water meets
the required
standards
Depends
on the
affordabilit
y. VMC
supplied
drinking
water
meets the
required
standards
- Yes
Urban
flooding
(stormw
ater
flooding)
There is low
connectivity of storm
water drains and
hence the storm
water is accumulated
in the canals and
rivulet
No - - Yes
The canal networks
and rivulets are also
used to discharge
excess/flood waters
from the reservoir
- - -
Not beyond
the design
capacity
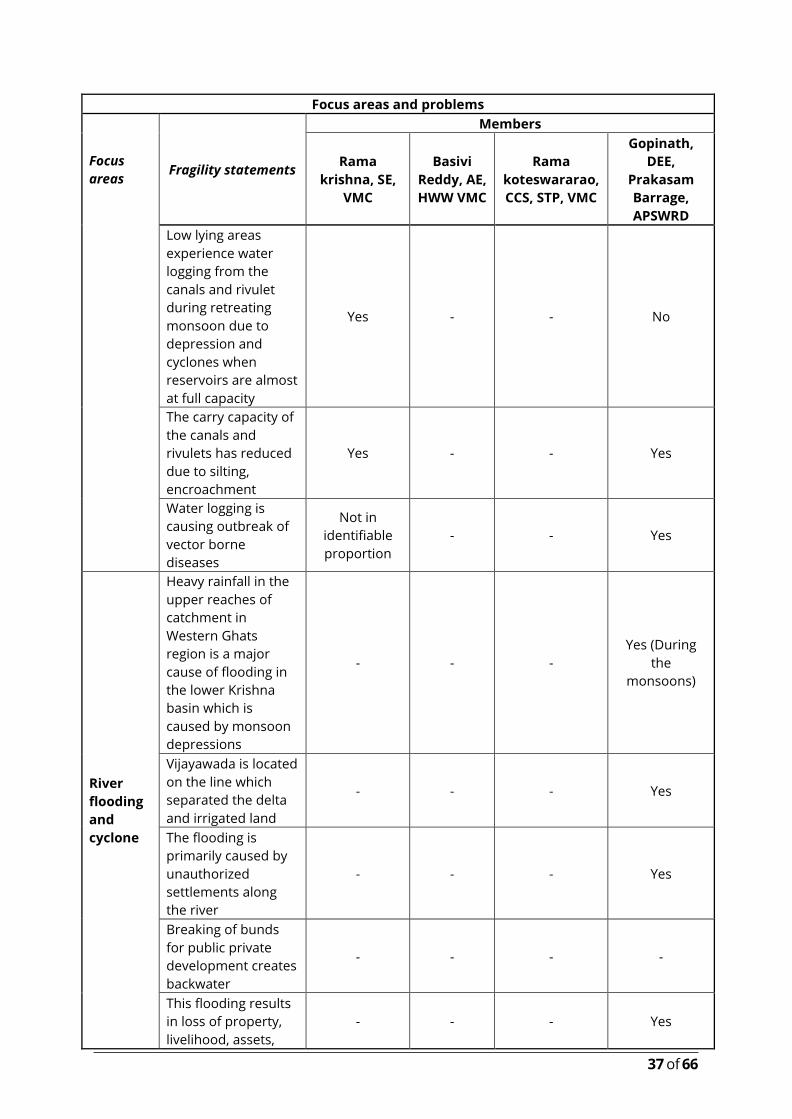
37 of 66
Focus areas and problems
Focus
areas Fragility statements
Members
Rama
krishna, SE,
VMC
Basivi
Reddy, AE,
HWW VMC
Rama
koteswararao,
CCS, STP, VMC
Gopinath,
DEE,
Prakasam
Barrage,
APSWRD
Low lying areas
experience water
logging from the
canals and rivulet
during retreating
monsoon due to
depression and
cyclones when
reservoirs are almost
at full capacity
Yes - - No
The carry capacity of
the canals and
rivulets has reduced
due to silting,
encroachment
Yes - - Yes
Water logging is
causing outbreak of
vector borne
diseases
Not in
identifiable
proportion
- - Yes
River
flooding
and
cyclone
Heavy rainfall in the
upper reaches of
catchment in
Western Ghats
region is a major
cause of flooding in
the lower Krishna
basin which is
caused by monsoon
depressions
- - -
Yes (During
the
monsoons)
Vijayawada is located
on the line which
separated the delta
and irrigated land
- - - Yes
The flooding is
primarily caused by
unauthorized
settlements along
the river
- - - Yes
Breaking of bunds
for public private
development creates
backwater
- - - -
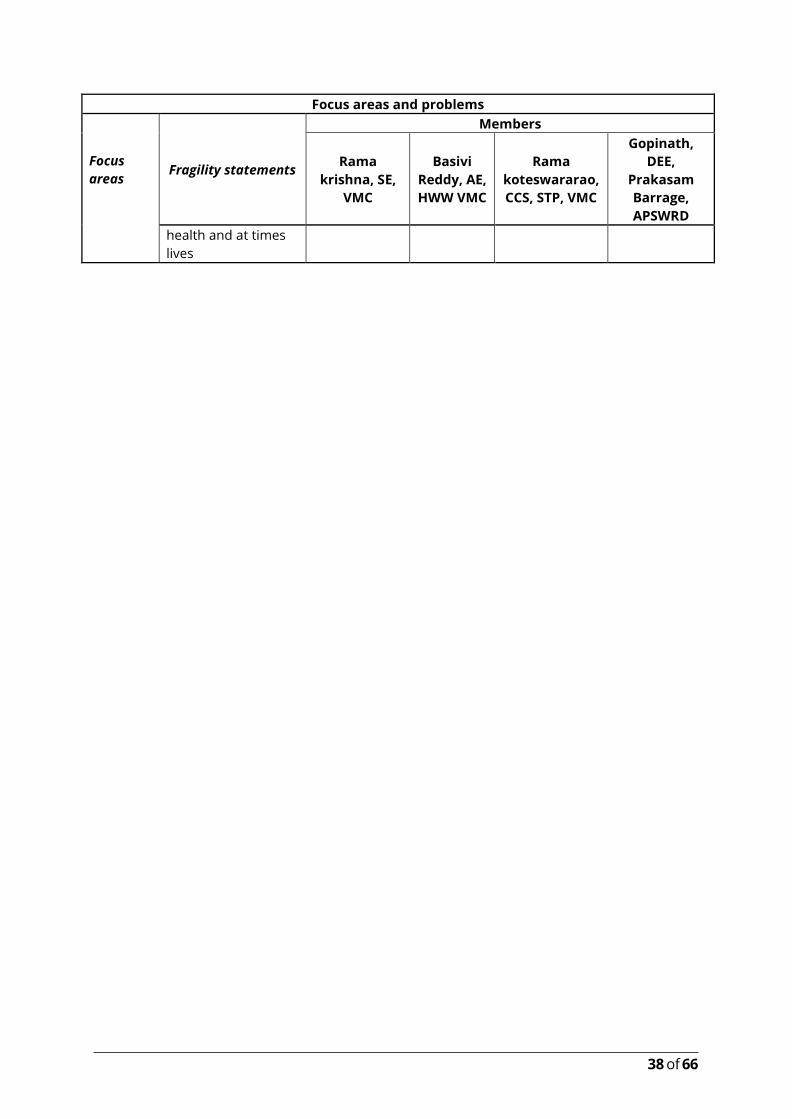
This flooding results
in loss of property,
livelihood, assets,
- - - Yes
38 of 66
Focus areas and problems
Focus
areas Fragility statements
Members
Rama
krishna, SE,
VMC
Basivi
Reddy, AE,
HWW VMC
Rama
koteswararao,
CCS, STP, VMC
Gopinath,
DEE,
Prakasam
Barrage,
APSWRD
health and at times
lives
39 of 66
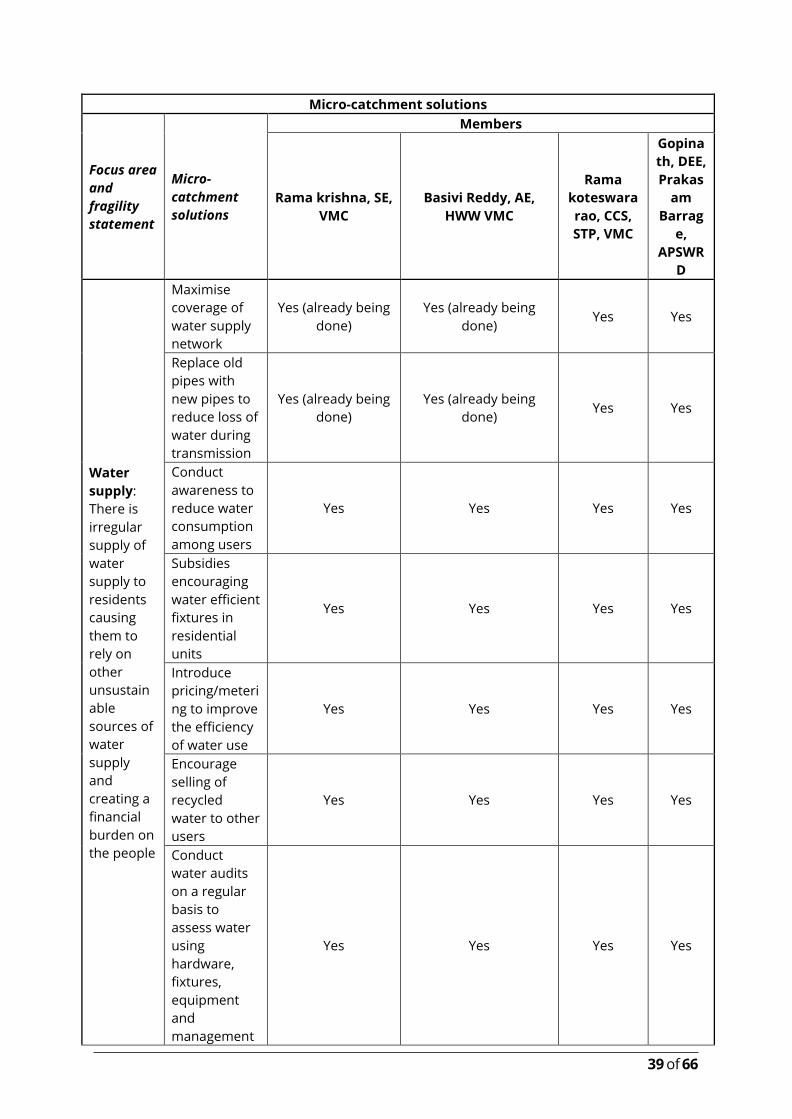
Micro-catchment solutions
Focus area
and
fragility
statement
Micro-
catchment
solutions
Members
Rama krishna, SE,
VMC
Basivi Reddy, AE,
HWW VMC
Rama
koteswara
rao, CCS,
STP, VMC
Gopina
th, DEE,
Prakas
am
Barrag
e,
APSWR
D
Water
supply:
There is
irregular
supply of
water
supply to
residents
causing
them to
rely on
other
unsustain
able
sources of
water
supply
and
creating a
financial
burden on
the people
Maximise
coverage of
water supply
network
Yes (already being
done)
Yes (already being
done) Yes Yes
Replace old
pipes with
new pipes to
reduce loss of
water during
transmission
Yes (already being
done)
Yes (already being
done) Yes Yes
Conduct
awareness to
reduce water
consumption
among users
Yes Yes Yes Yes
Subsidies
encouraging
water efficient
fixtures in
residential
units
Yes Yes Yes Yes
Introduce
pricing/meteri
ng to improve
the efficiency
of water use
Yes Yes Yes Yes
Encourage
selling of
recycled
water to other
users
Yes Yes Yes Yes
Conduct
water audits
on a regular
basis to
assess water
using
hardware,
fixtures,
equipment
and
management
Yes Yes Yes Yes
40 of 66
Micro-catchment solutions
Focus area
and
fragility
statement
Micro-
catchment
solutions
Members
Rama krishna, SE,
VMC
Basivi Reddy, AE,
HWW VMC
Rama
koteswara
rao, CCS,
STP, VMC
Gopina
th, DEE,
Prakas
am
Barrag
e,
APSWR
D
practices to
determine
water use
efficiency and
develop
recommendat
ions for
improving it
Encourage
water efficient
irrigation
systems
Yes Yes Yes Yes
Make Rain
water
harvesting
systems
mandatory
across the city
Yes Yes Yes Yes
Water
quality:
The
irrigation
canals
flowing
through
the city
are
polluted
due to
disposal of
sewage
and waste
into the
canals and
the run off
fertilizers
from the
agricultura
l fields.
The
ground
water is
Enhance
capacity of
Sewage
Treatment
Plans (STP)
Yes Yes Yes Yes
Conduct
awareness to
reduce water
consumption
among users
+ Subsidies
encouraging
water efficient
fixtures in
residential
units +
Introduce
pricing/meteri
ng to improve
the efficiency
of water use –
to reduce
waste water
generation
Yes Yes Yes Yes
41 of 66
Micro-catchment solutions
Focus area
and
fragility
statement
Micro-
catchment
solutions
Members
Rama krishna, SE,
VMC
Basivi Reddy, AE,
HWW VMC
Rama
koteswara
rao, CCS,
STP, VMC
Gopina
th, DEE,
Prakas
am
Barrag
e,
APSWR
D
getting
polluted
from
fertilizer
percolatio
n and
dumping
ground
percolatio
n. This
water
which is
used for
agriculture
and
household
purposes
is creating
health
problems
and
forcing
residents
to buy
water for
drinking
purpose
from RO
plants
and to reduce
investment
on STPs
Design
decentralized
waste water
treatment
system for
local reuse
Yes Yes Yes Yes
Urban
flooding:
Due to
poor
storm
water
drain
network,
water
logging in
the
irrigation
canals and
Encourage
paddy
cultivation to
reduce run off
from rural
catchments
- - - Yes
Develop /filter
strips / swales
/ bio retention
area / rain
garden / filter
drains and
trenches/
- - - Yes
42 of 66
Micro-catchment solutions
Focus area
and
fragility
statement
Micro-
catchment
solutions
Members
Rama krishna, SE,
VMC
Basivi Reddy, AE,
HWW VMC
Rama
koteswara
rao, CCS,
STP, VMC
Gopina
th, DEE,
Prakas
am
Barrag
e,
APSWR
D
rivulet is
causing
urban
flooding
leading to
loss of
assets and
outbreak
of vector
borne
diseases
permeable
pavements /
detention
basin /
infiltration
basins / water
retention
ponds as part
of Sustainable
Drainage
system
River
flooding:
Due to the
reduction
of river
bed and
heavy
rains
caused by
monsoon
depressio
ns,
Krishna
river gets
flooded
and there
is loss of
property,
assets,
and
livelihoods
, health
and at
times lives
Develop
hazard maps
for low lying
areas
outlining
areas at risk
for flooding –
awareness
programs on
possible
impact, safety
concerns,
potential risk
and
appropriate
responses
- - - Yes
43 of 66
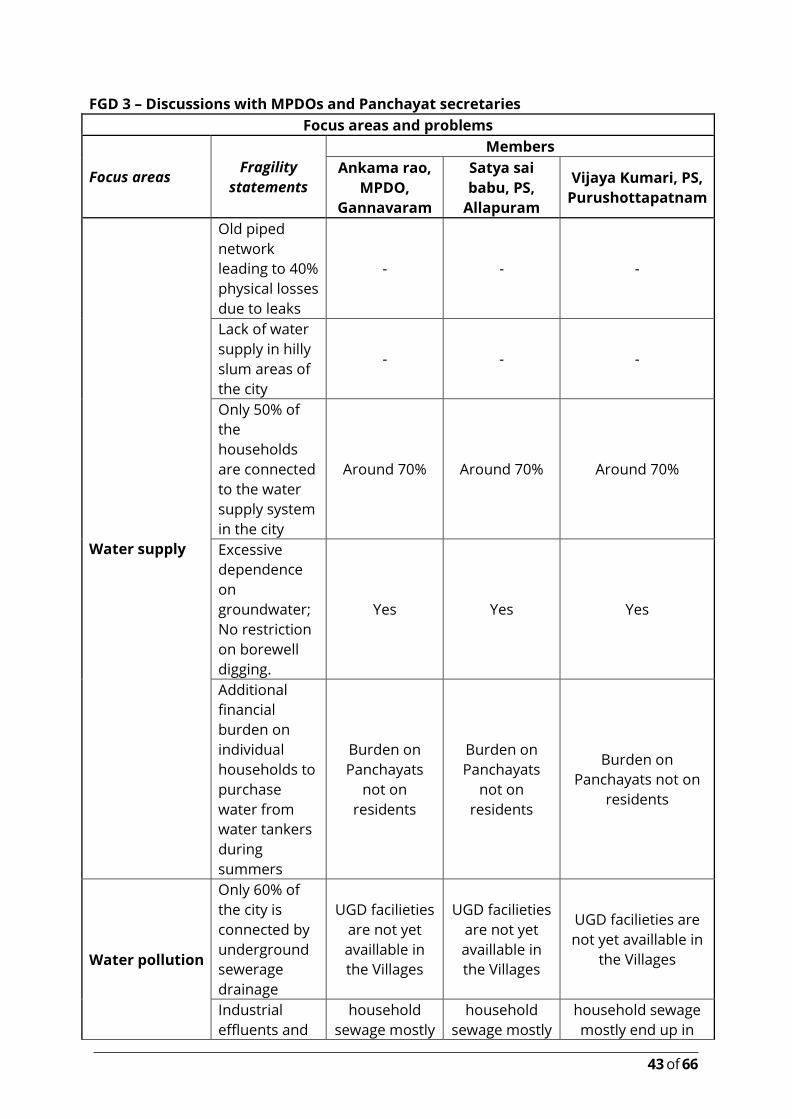
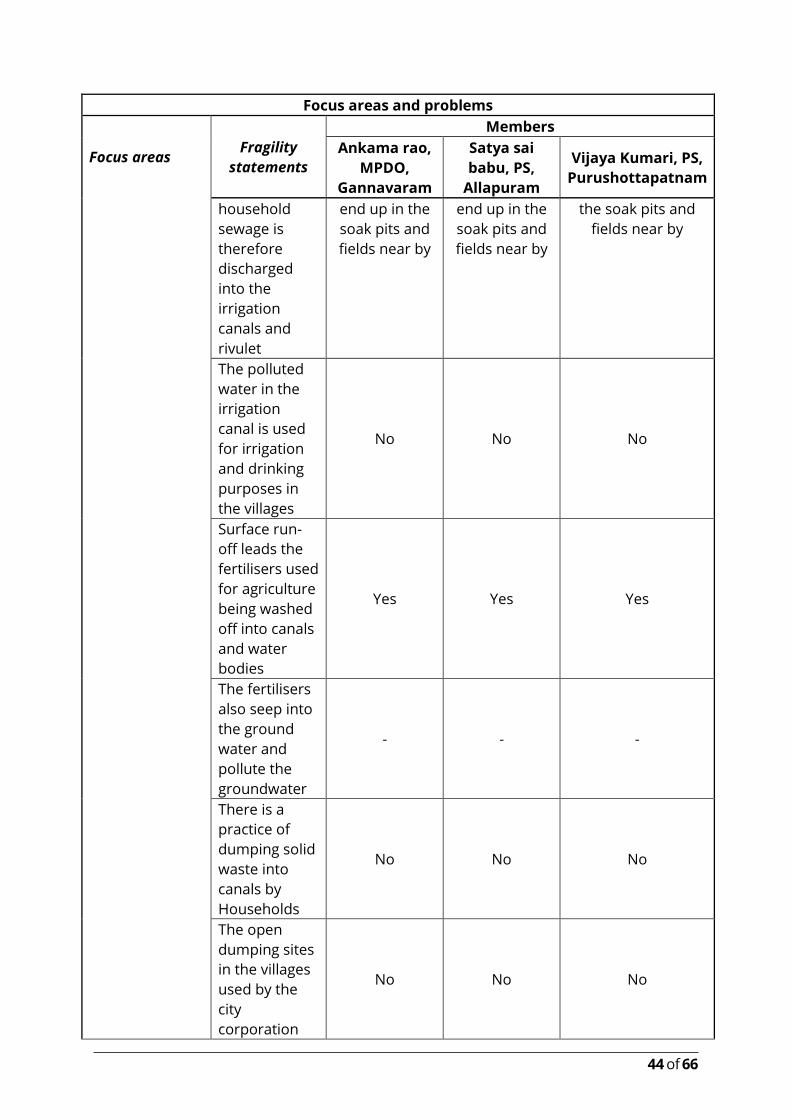
FGD 3 – Discussions with MPDOs and Panchayat secretaries
Focus areas and problems
Focus areas Fragility
statements
Members
Ankama rao,
MPDO,
Gannavaram
Satya sai
babu, PS,
Allapuram
Vijaya Kumari, PS,
Purushottapatnam
Water supply
Old piped
network
leading to 40%
physical losses
due to leaks
- - -
Lack of water
supply in hilly
slum areas of
the city
- - -
Only 50% of
the
households
are connected
to the water
supply system
in the city
Around 70% Around 70% Around 70%
Excessive
dependence
on
groundwater;
No restriction
on borewell
digging.
Yes Yes Yes
Additional
financial
burden on
individual
households to
purchase
water from
water tankers
during
summers
Burden on
Panchayats
not on
residents
Burden on
Panchayats
not on
residents
Burden on
Panchayats not on
residents
Water pollution
Only 60% of
the city is
connected by
underground
sewerage
drainage
UGD facilieties
are not yet
availlable in
the Villages
UGD facilieties
are not yet
availlable in
the Villages
UGD facilieties are
not yet availlable in
the Villages
Industrial
effluents and
household
sewage mostly
household
sewage mostly
household sewage
mostly end up in
44 of 66
Focus areas and problems
Focus areas Fragility
statements
Members
Ankama rao,
MPDO,
Gannavaram
Satya sai
babu, PS,
Allapuram
Vijaya Kumari, PS,
Purushottapatnam
household
sewage is
therefore
discharged
into the
irrigation
canals and
rivulet
end up in the
soak pits and
fields near by
end up in the
soak pits and
fields near by
the soak pits and
fields near by
The polluted
water in the
irrigation
canal is used
for irrigation
and drinking
purposes in
the villages
No No No
Surface run-
off leads the
fertilisers used
for agriculture
being washed
off into canals
and water
bodies
Yes Yes Yes
The fertilisers
also seep into
the ground
water and
pollute the
groundwater
- - -
There is a
practice of
dumping solid
waste into
canals by
Households
No No No
The open
dumping sites
in the villages
used by the
city
corporation
No No No
45 of 66
Focus areas and problems
Focus areas Fragility
statements
Members
Ankama rao,
MPDO,
Gannavaram
Satya sai
babu, PS,
Allapuram
Vijaya Kumari, PS,
Purushottapatnam
cause
pollution of
ground water
through
seepage
Usage of
polluted water
for agriculture
and
household
purpose is
impacting the
produce and
health
respectively
No No No
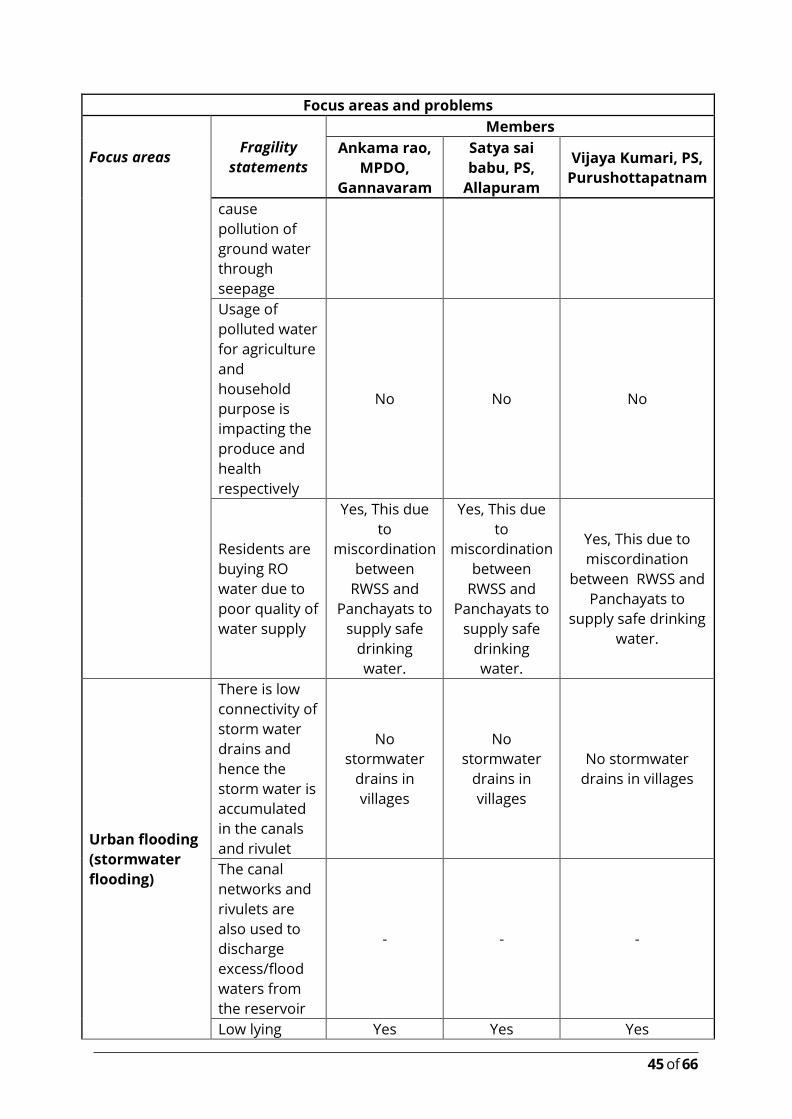
Residents are
buying RO
water due to
poor quality of
water supply
Yes, This due
to
miscordination
between
RWSS and
Panchayats to
supply safe
drinking
water.
Yes, This due
to
miscordination
between
RWSS and
Panchayats to
supply safe
drinking
water.
Yes, This due to
miscordination
between RWSS and
Panchayats to
supply safe drinking
water.
Urban flooding
(stormwater
flooding)
There is low
connectivity of
storm water
drains and
hence the
storm water is
accumulated
in the canals
and rivulet
No
stormwater
drains in
villages
No
stormwater
drains in
villages
No stormwater
drains in villages
The canal
networks and
rivulets are
also used to
discharge
excess/flood
waters from
the reservoir
- - -
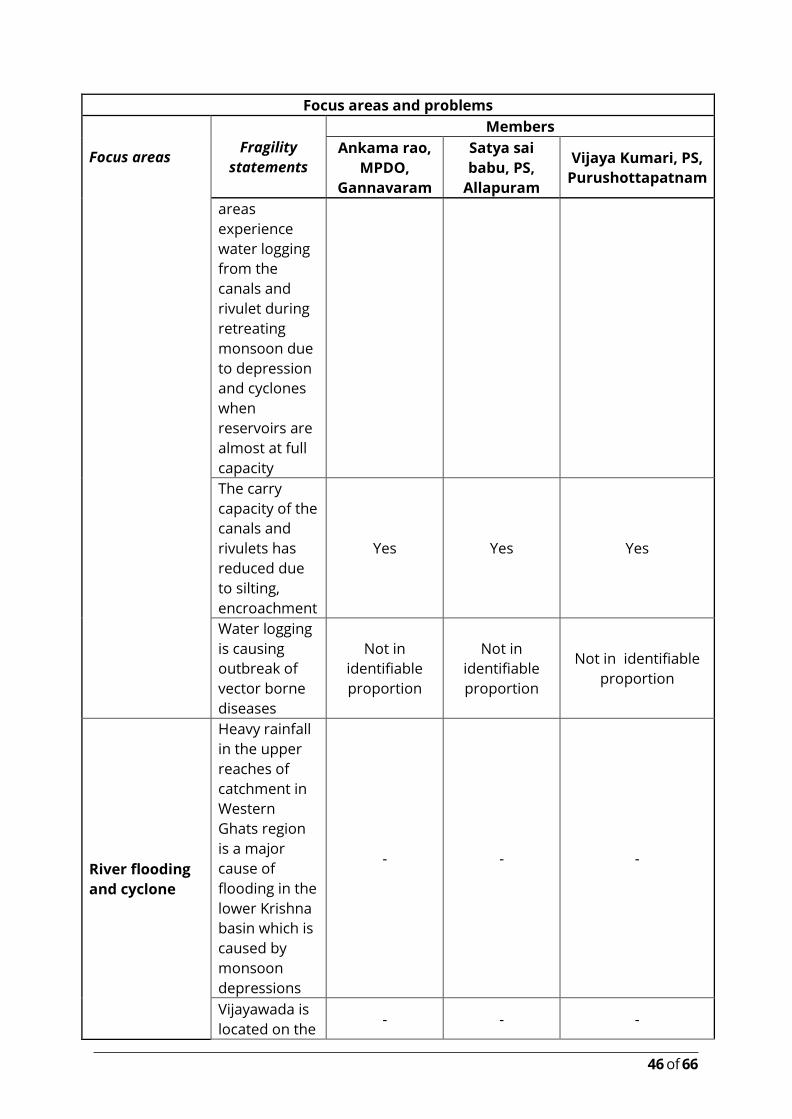
Low lying Yes Yes Yes
46 of 66
Focus areas and problems
Focus areas Fragility
statements
Members
Ankama rao,
MPDO,
Gannavaram
Satya sai
babu, PS,
Allapuram
Vijaya Kumari, PS,
Purushottapatnam
areas
experience
water logging
from the
canals and
rivulet during
retreating
monsoon due
to depression
and cyclones
when
reservoirs are
almost at full
capacity
The carry
capacity of the
canals and
rivulets has
reduced due
to silting,
encroachment
Yes Yes Yes
Water logging
is causing
outbreak of
vector borne
diseases
Not in
identifiable
proportion
Not in
identifiable
proportion
Not in identifiable
proportion
River flooding
and cyclone
Heavy rainfall
in the upper
reaches of
catchment in
Western
Ghats region
is a major
cause of
flooding in the
lower Krishna
basin which is
caused by
monsoon
depressions
- - -
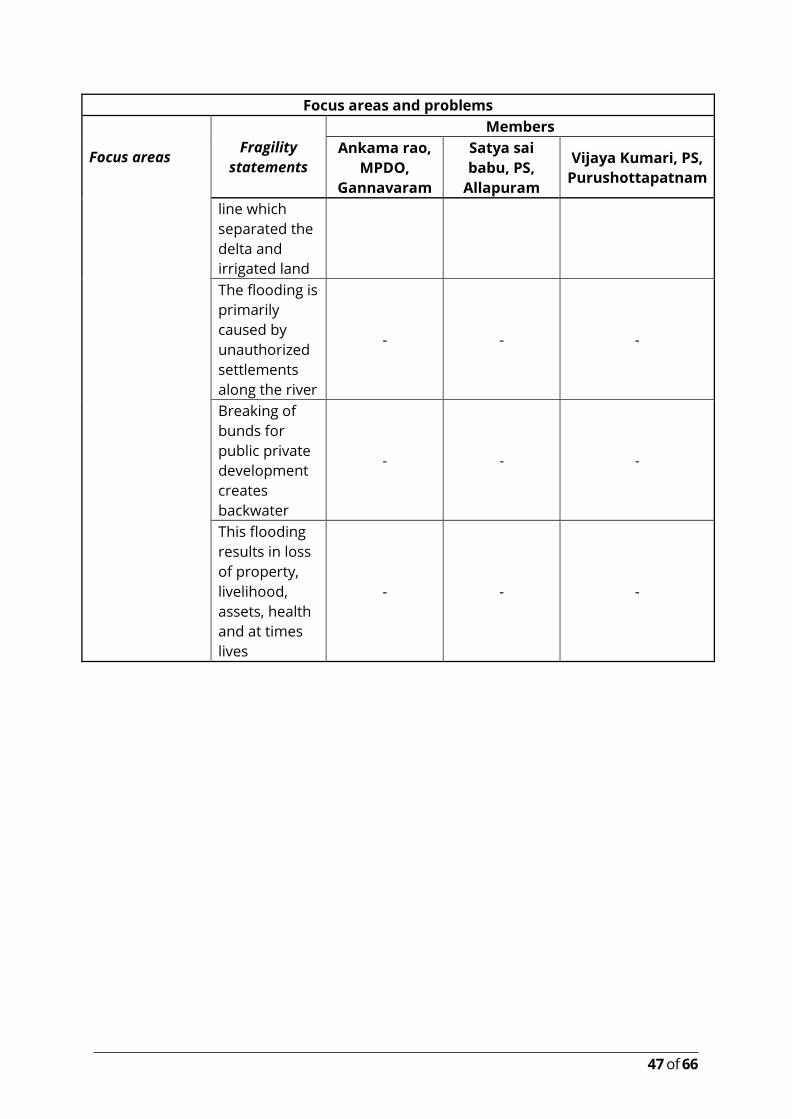
Vijayawada is
located on the - - -
47 of 66
Focus areas and problems
Focus areas Fragility
statements
Members
Ankama rao,
MPDO,
Gannavaram
Satya sai
babu, PS,
Allapuram
Vijaya Kumari, PS,
Purushottapatnam
line which
separated the
delta and
irrigated land
The flooding is
primarily
caused by
unauthorized
settlements
along the river
- - -
Breaking of
bunds for
public private
development
creates
backwater
- - -
This flooding
results in loss
of property,
livelihood,
assets, health
and at times
lives
- - -
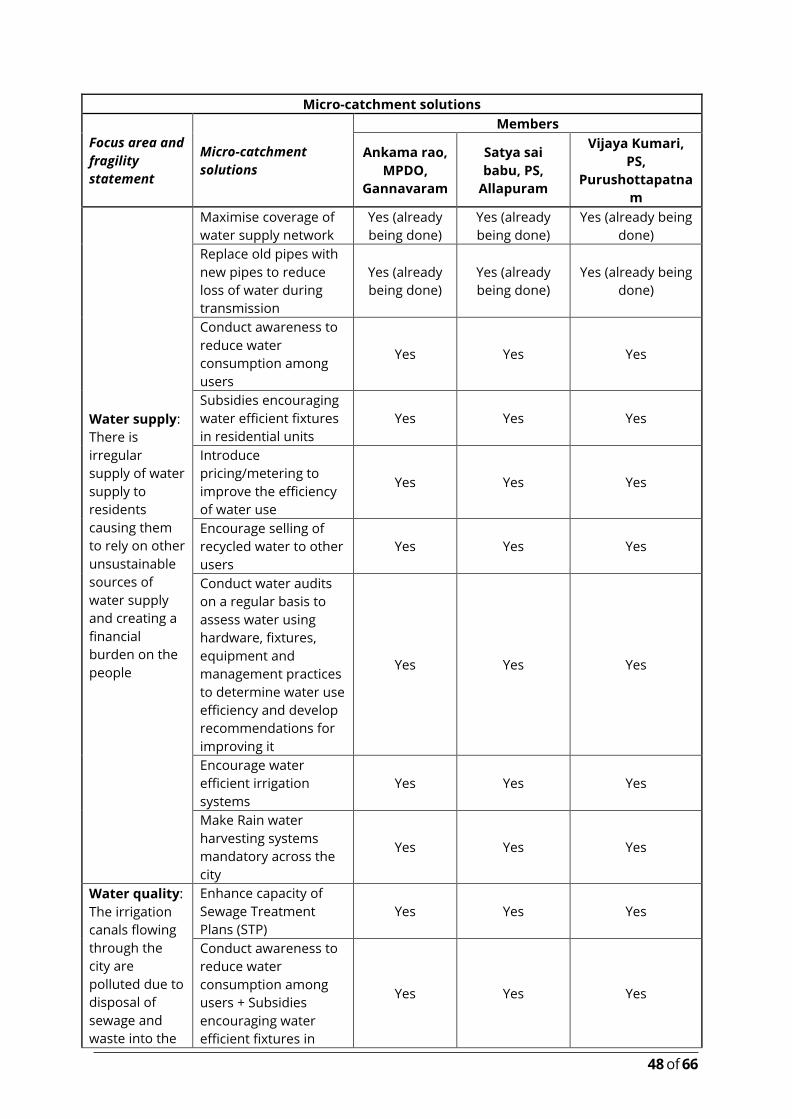
48 of 66
Micro-catchment solutions
Focus area and
fragility
statement
Micro-catchment
solutions
Members
Ankama rao,
MPDO,
Gannavaram
Satya sai
babu, PS,
Allapuram
Vijaya Kumari,
PS,
Purushottapatna
m
Water supply:
There is
irregular
supply of water
supply to
residents
causing them
to rely on other
unsustainable
sources of
water supply
and creating a
financial
burden on the
people
Maximise coverage of
water supply network
Yes (already
being done)
Yes (already
being done)
Yes (already being
done)
Replace old pipes with
new pipes to reduce
loss of water during
transmission
Yes (already
being done)
Yes (already
being done)
Yes (already being
done)
Conduct awareness to
reduce water
consumption among
users
Yes Yes Yes
Subsidies encouraging
water efficient fixtures
in residential units
Yes Yes Yes
Introduce
pricing/metering to
improve the efficiency
of water use
Yes Yes Yes
Encourage selling of
recycled water to other
users
Yes Yes Yes
Conduct water audits
on a regular basis to
assess water using
hardware, fixtures,
equipment and
management practices
to determine water use
efficiency and develop
recommendations for
improving it
Yes Yes Yes
Encourage water
efficient irrigation
systems
Yes Yes Yes
Make Rain water
harvesting systems
mandatory across the
city
Yes Yes Yes
Water quality:
The irrigation
canals flowing
through the
city are
polluted due to
disposal of
sewage and
waste into the
Enhance capacity of
Sewage Treatment
Plans (STP)
Yes Yes Yes
Conduct awareness to
reduce water
consumption among
users + Subsidies
encouraging water
efficient fixtures in
Yes Yes Yes

49 of 66
Micro-catchment solutions
Focus area and
fragility
statement
Micro-catchment
solutions
Members
Ankama rao,
MPDO,
Gannavaram
Satya sai
babu, PS,
Allapuram
Vijaya Kumari,
PS,
Purushottapatna
m
canals and the
run off
fertilizers from
the agricultural
fields. The
ground water
is getting
polluted from
fertilizer
percolation
and dumping
ground
percolation.
This water
which is used
for agriculture
and household
purposes is
creating health
problems and
forcing
residents to
buy water for
drinking
purpose from
RO plants
residential units +
Introduce
pricing/metering to
improve the efficiency
of water use – to
reduce waste water
generation and to
reduce investment on
STPs
Design decentralized
waste water treatment
system for local reuse
Yes Yes Yes
Urban
flooding: Due
to poor storm
water drain
network, water
logging in the
irrigation
canals and
rivulet is
causing urban
flooding
leading to loss
of assets and
outbreak of
vector borne
diseases
Encourage paddy
cultivation to reduce
run off from rural
catchments
- - -
Develop /filter strips /
swales / bio retention
area / rain garden /
filter drains and
trenches/ permeable
pavements / detention
basin / infiltration
basins / water
retention ponds as part
of Sustainable
Drainage system
- - -
River flooding:
Due to the
reduction of
river bed and
Develop hazard maps
for low lying areas
outlining areas at risk
for flooding –
- - -
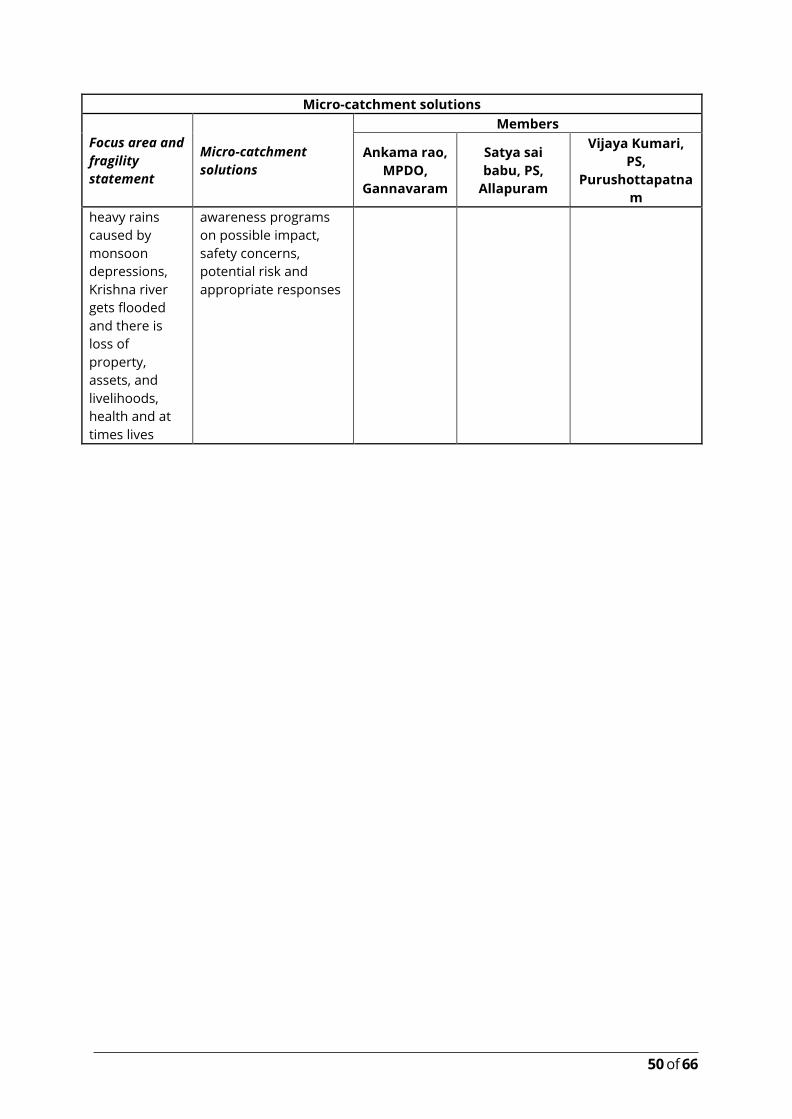
50 of 66
Micro-catchment solutions
Focus area and
fragility
statement
Micro-catchment
solutions
Members
Ankama rao,
MPDO,
Gannavaram
Satya sai
babu, PS,
Allapuram
Vijaya Kumari,
PS,
Purushottapatna
m
heavy rains
caused by
monsoon
depressions,
Krishna river
gets flooded
and there is
loss of
property,
assets, and
livelihoods,
health and at
times lives
awareness programs
on possible impact,
safety concerns,
potential risk and
appropriate responses
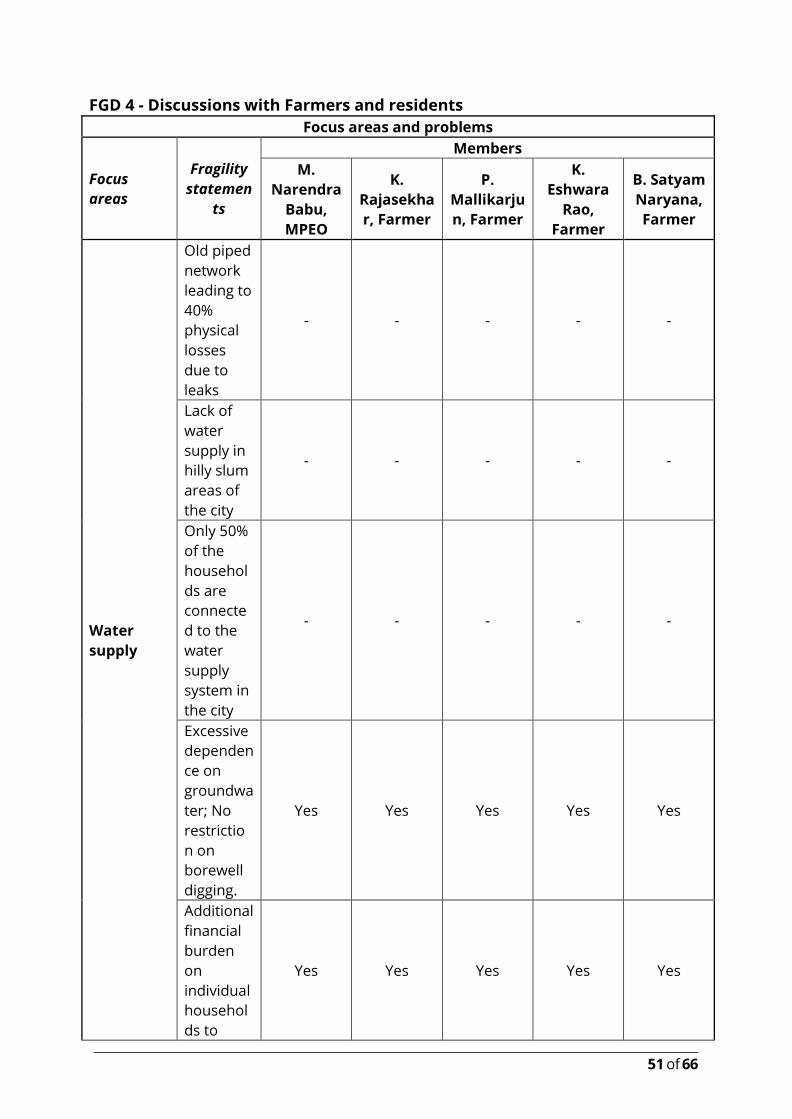
51 of 66
FGD 4 - Discussions with Farmers and residents
Focus areas and problems
Focus
areas
Fragility
statemen
ts
Members
M.
Narendra
Babu,
MPEO
K.
Rajasekha
r, Farmer
P.
Mallikarju
n, Farmer
K.
Eshwara
Rao,
Farmer
B. Satyam
Naryana,
Farmer
Water
supply
Old piped
network
leading to
40%
physical
losses
due to
leaks
- - - - -
Lack of
water
supply in
hilly slum
areas of
the city
- - - - -
Only 50%
of the
househol
ds are
connecte
d to the
water
supply
system in
the city
- - - - -
Excessive
dependen
ce on
groundwa
ter; No
restrictio
n on
borewell
digging.
Yes Yes Yes Yes Yes
Additional
financial
burden
on
individual
househol
ds to
Yes Yes Yes Yes Yes
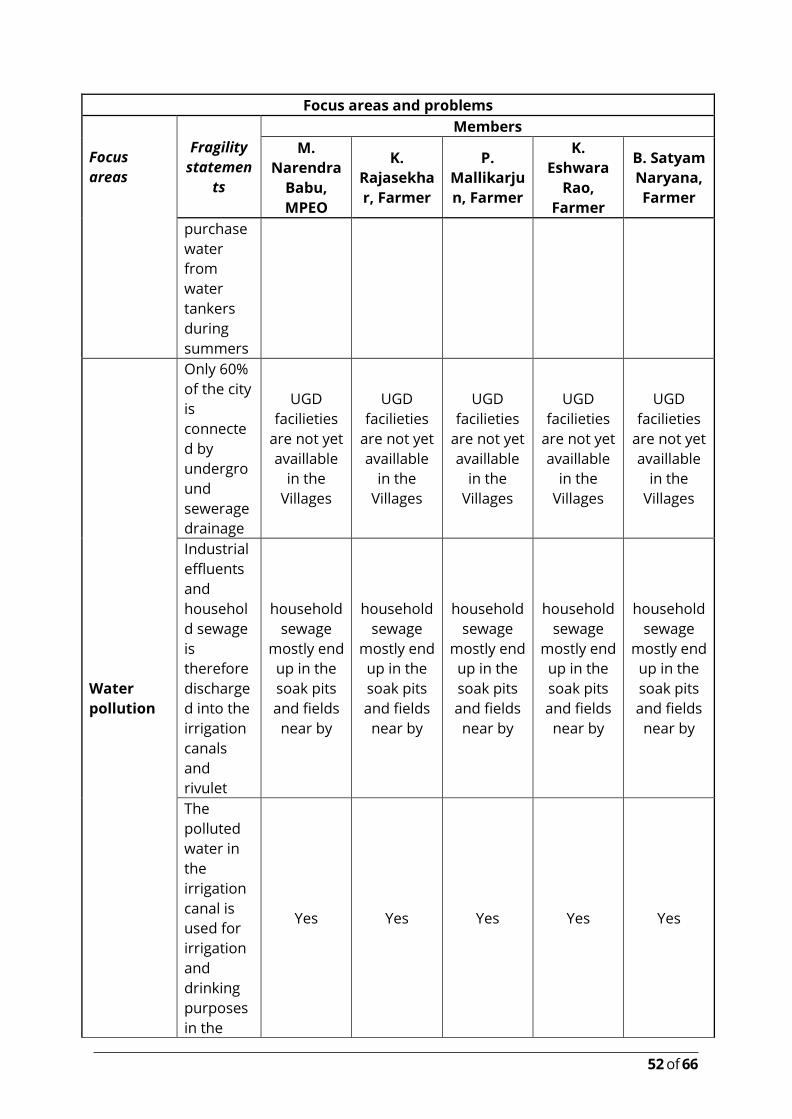
52 of 66
Focus areas and problems
Focus
areas
Fragility
statemen
ts
Members
M.
Narendra
Babu,
MPEO
K.
Rajasekha
r, Farmer
P.
Mallikarju
n, Farmer
K.
Eshwara
Rao,
Farmer
B. Satyam
Naryana,
Farmer
purchase
water
from
water
tankers
during
summers
Water
pollution
Only 60%
of the city
is
connecte
d by
undergro
und
sewerage
drainage
UGD
facilieties
are not yet
availlable
in the
Villages
UGD
facilieties
are not yet
availlable
in the
Villages
UGD
facilieties
are not yet
availlable
in the
Villages
UGD
facilieties
are not yet
availlable
in the
Villages
UGD
facilieties
are not yet
availlable
in the
Villages
Industrial
effluents
and
househol
d sewage
is
therefore
discharge
d into the
irrigation
canals
and
rivulet
household
sewage
mostly end
up in the
soak pits
and fields
near by
household
sewage
mostly end
up in the
soak pits
and fields
near by
household
sewage
mostly end
up in the
soak pits
and fields
near by
household
sewage
mostly end
up in the
soak pits
and fields
near by
household
sewage
mostly end
up in the
soak pits
and fields
near by
The
polluted
water in
the
irrigation
canal is
used for
irrigation
and
drinking
purposes
in the
Yes Yes Yes Yes Yes

53 of 66
Focus areas and problems
Focus
areas
Fragility
statemen
ts
Members
M.
Narendra
Babu,
MPEO
K.
Rajasekha
r, Farmer
P.
Mallikarju
n, Farmer
K.
Eshwara
Rao,
Farmer
B. Satyam
Naryana,
Farmer
villages
Surface
run-off
leads the
fertilisers
used for
agricultur
e being
washed
off into
canals
and water
bodies
Yes Yes Yes Yes Yes
The
fertilisers
also seep
into the
ground
water and
pollute
the
groundwa
ter
- - - - -
There is a
practice
of
dumping
solid
waste
into
canals by
Househol
ds
No No No No No
The open
dumping
sites in
the
villages
used by
the city
corporati
No No No No No
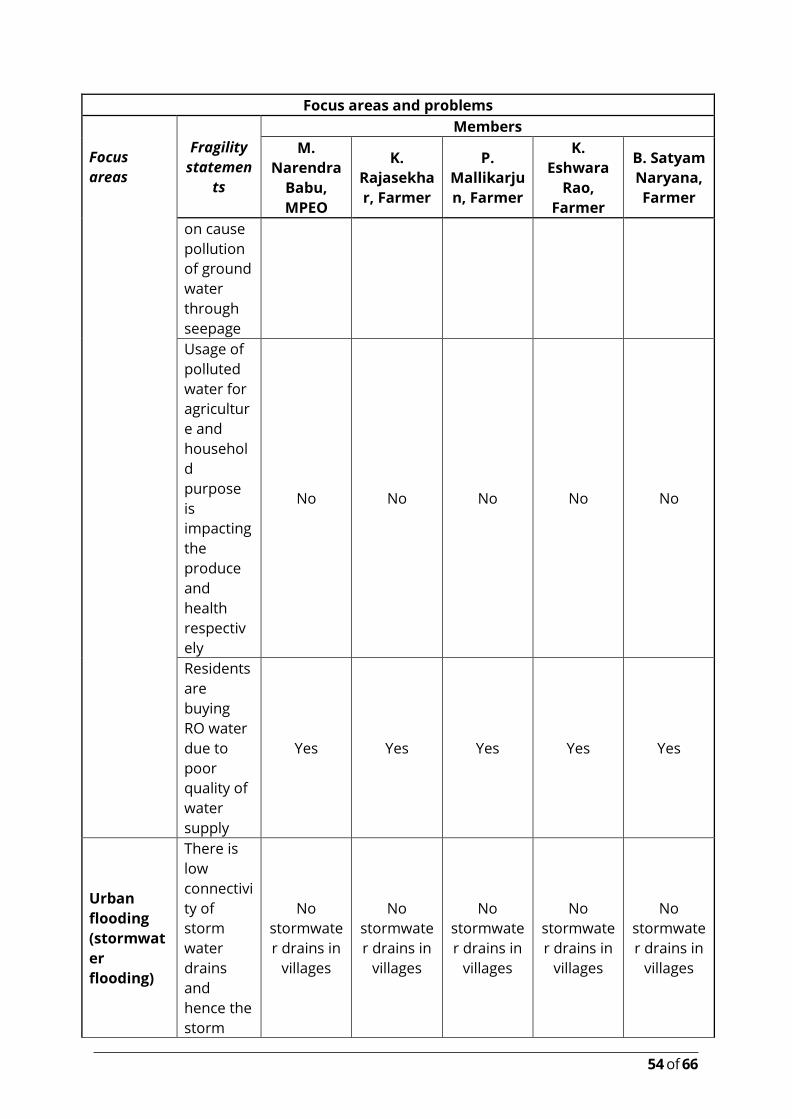
54 of 66
Focus areas and problems
Focus
areas
Fragility
statemen
ts
Members
M.
Narendra
Babu,
MPEO
K.
Rajasekha
r, Farmer
P.
Mallikarju
n, Farmer
K.
Eshwara
Rao,
Farmer
B. Satyam
Naryana,
Farmer
on cause
pollution
of ground
water
through
seepage
Usage of
polluted
water for
agricultur
e and
househol
d
purpose
is
impacting
the
produce
and
health
respectiv
ely
No No No No No
Residents
are
buying
RO water
due to
poor
quality of
water
supply
Yes Yes Yes Yes Yes
Urban
flooding
(stormwat
er
flooding)
There is
low
connectivi
ty of
storm
water
drains
and
hence the
storm
No
stormwate
r drains in
villages
No
stormwate
r drains in
villages
No
stormwate
r drains in
villages
No
stormwate
r drains in
villages
No
stormwate
r drains in
villages
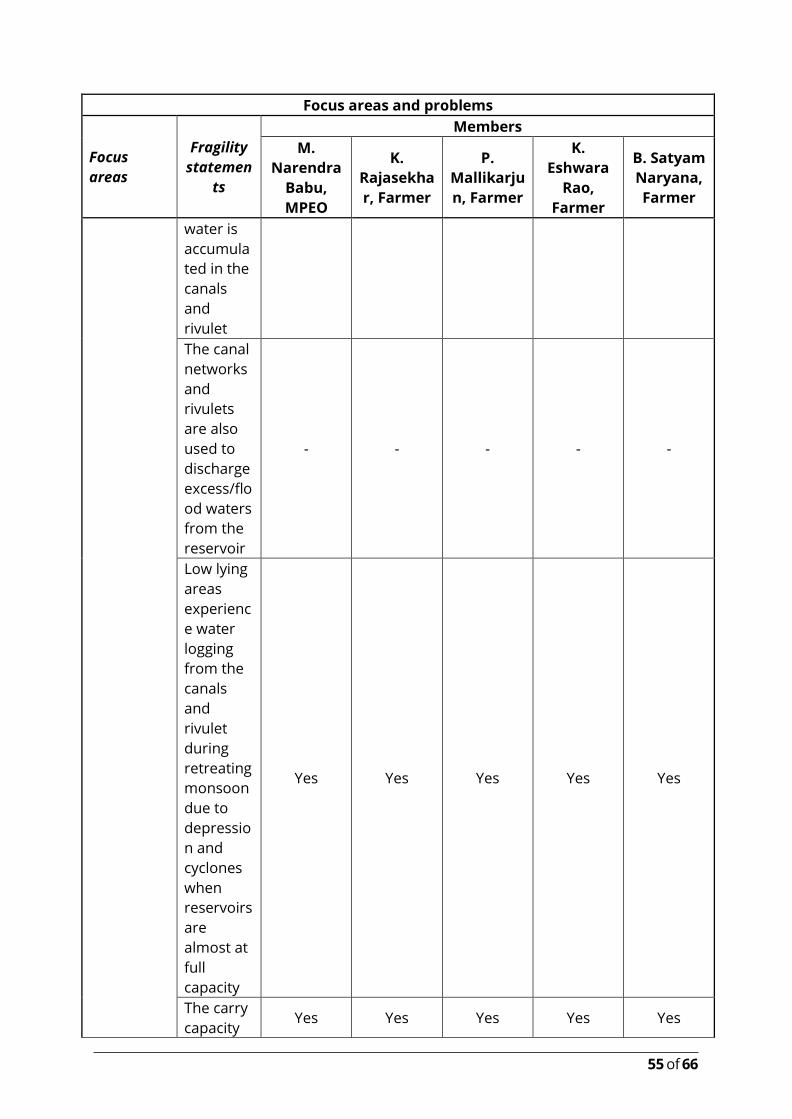
55 of 66
Focus areas and problems
Focus
areas
Fragility
statemen
ts
Members
M.
Narendra
Babu,
MPEO
K.
Rajasekha
r, Farmer
P.
Mallikarju
n, Farmer
K.
Eshwara
Rao,
Farmer
B. Satyam
Naryana,
Farmer
water is
accumula
ted in the
canals
and
rivulet
The canal
networks
and
rivulets
are also
used to
discharge
excess/flo
od waters
from the
reservoir
- - - - -
Low lying
areas
experienc
e water
logging
from the
canals
and
rivulet
during
retreating
monsoon
due to
depressio
n and
cyclones
when
reservoirs
are
almost at
full
capacity
Yes Yes Yes Yes Yes
The carry
capacity Yes Yes Yes Yes Yes
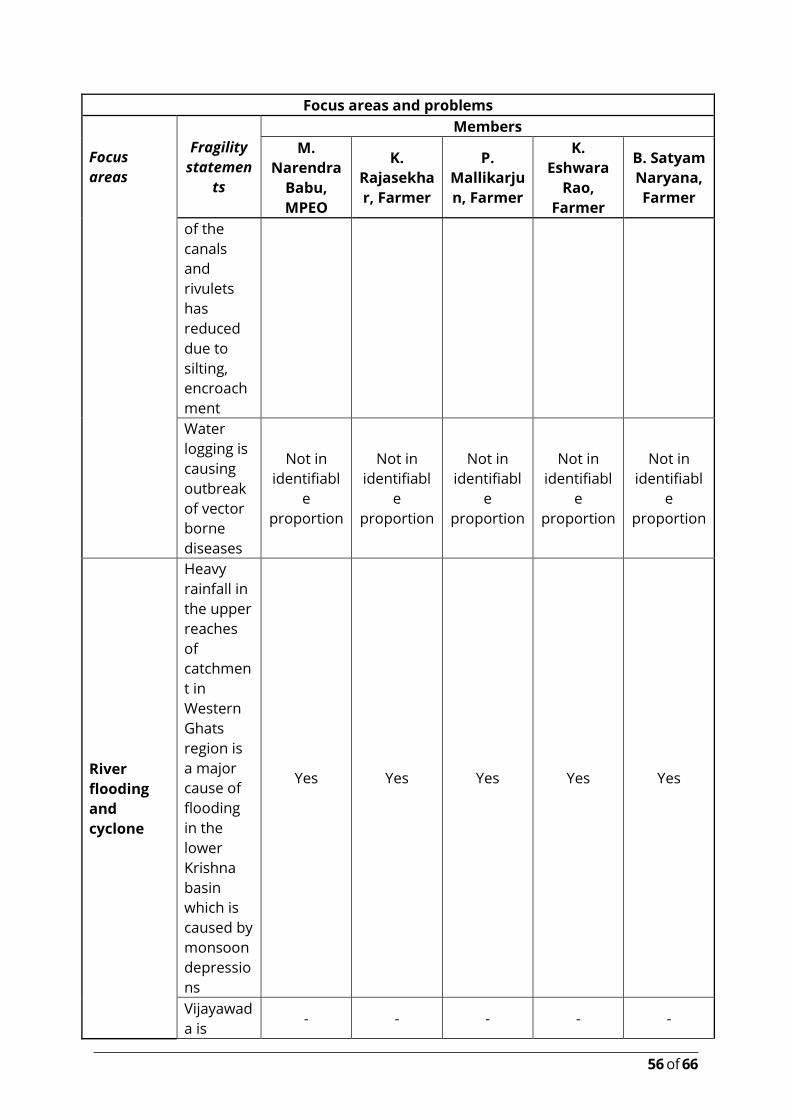
56 of 66
Focus areas and problems
Focus
areas
Fragility
statemen
ts
Members
M.
Narendra
Babu,
MPEO
K.
Rajasekha
r, Farmer
P.
Mallikarju
n, Farmer
K.
Eshwara
Rao,
Farmer
B. Satyam
Naryana,
Farmer
of the
canals
and
rivulets
has
reduced
due to
silting,
encroach
ment
Water
logging is
causing
outbreak
of vector
borne
diseases
Not in
identifiabl
e
proportion
Not in
identifiabl
e
proportion
Not in
identifiabl
e
proportion
Not in
identifiabl
e
proportion
Not in
identifiabl
e
proportion
River
flooding
and
cyclone
Heavy
rainfall in
the upper
reaches
of
catchmen
t in
Western
Ghats
region is
a major
cause of
flooding
in the
lower
Krishna
basin
which is
caused by
monsoon
depressio
ns
Yes Yes Yes Yes Yes
Vijayawad
a is - - - - -
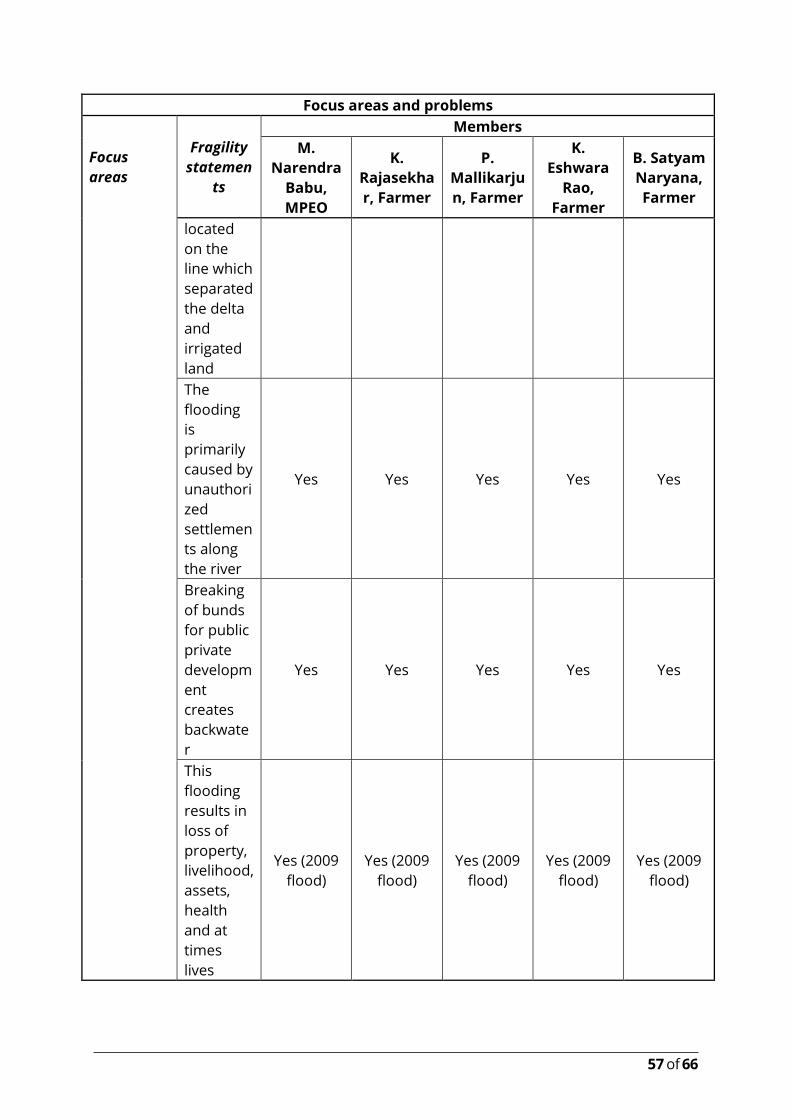
57 of 66
Focus areas and problems
Focus
areas
Fragility
statemen
ts
Members
M.
Narendra
Babu,
MPEO
K.
Rajasekha
r, Farmer
P.
Mallikarju
n, Farmer
K.
Eshwara
Rao,
Farmer
B. Satyam
Naryana,
Farmer
located
on the
line which
separated
the delta
and
irrigated
land
The
flooding
is
primarily
caused by
unauthori
zed
settlemen
ts along
the river
Yes Yes Yes Yes Yes
Breaking
of bunds
for public
private
developm
ent
creates
backwate
r
Yes Yes Yes Yes Yes
This
flooding
results in
loss of
property,
livelihood,
assets,
health
and at
times
lives
Yes (2009
flood)
Yes (2009
flood)
Yes (2009
flood)
Yes (2009
flood)
Yes (2009
flood)
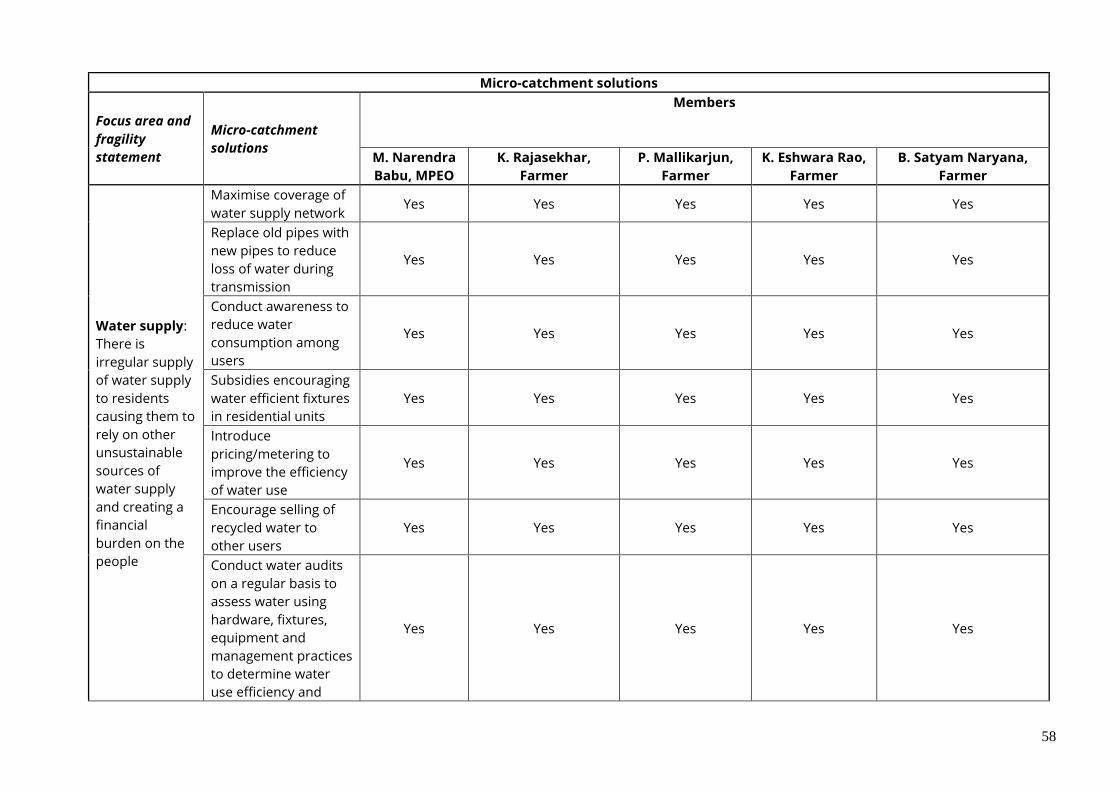
58
Micro-catchment solutions
Focus area and
fragility
statement
Micro-catchment
solutions
Members
M. Narendra
Babu, MPEO
K. Rajasekhar,
Farmer
P. Mallikarjun,
Farmer
K. Eshwara Rao,
Farmer
B. Satyam Naryana,
Farmer
Water supply:
There is
irregular supply
of water supply
to residents
causing them to
rely on other
unsustainable
sources of
water supply
and creating a
financial
burden on the
people
Maximise coverage of
water supply network Yes Yes Yes Yes Yes
Replace old pipes with
new pipes to reduce
loss of water during
transmission
Yes Yes Yes Yes Yes
Conduct awareness to
reduce water
consumption among
users
Yes Yes Yes Yes Yes
Subsidies encouraging
water efficient fixtures
in residential units
Yes Yes Yes Yes Yes
Introduce
pricing/metering to
improve the efficiency
of water use
Yes Yes Yes Yes Yes
Encourage selling of
recycled water to
other users
Yes Yes Yes Yes Yes
Conduct water audits
on a regular basis to
assess water using
hardware, fixtures,
equipment and
management practices
to determine water
use efficiency and
Yes Yes Yes Yes Yes
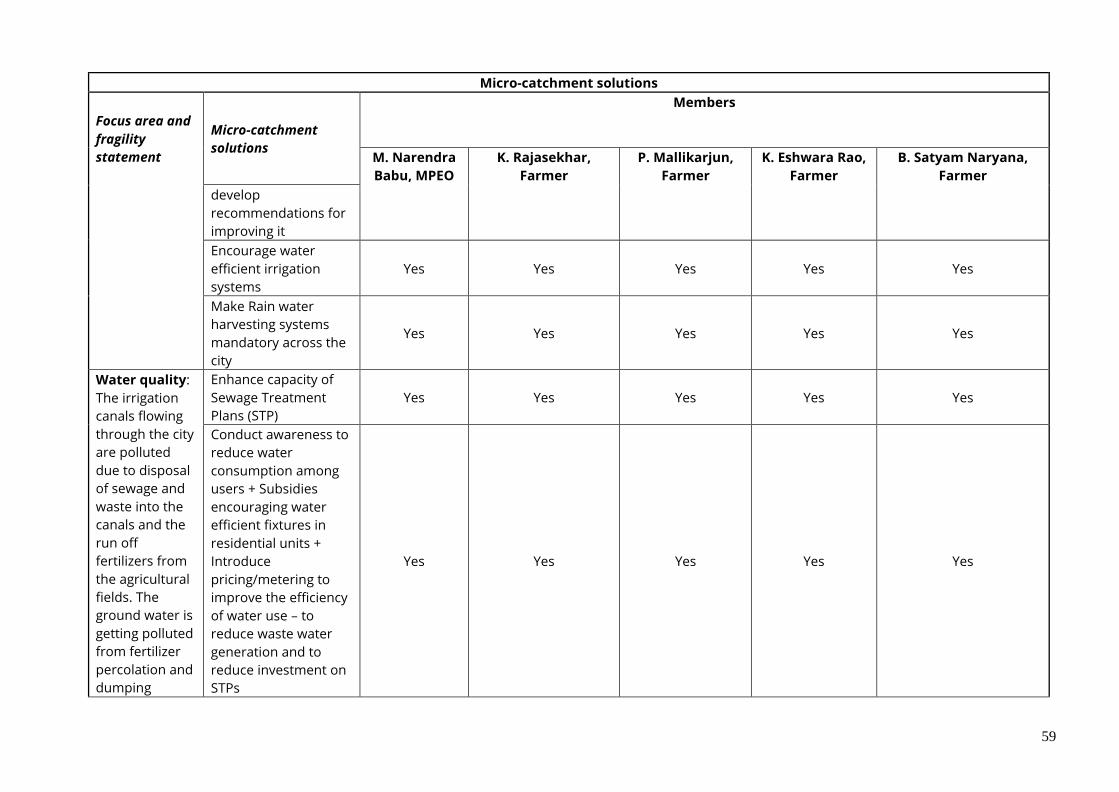
59
Micro-catchment solutions
Focus area and
fragility
statement
Micro-catchment
solutions
Members
M. Narendra
Babu, MPEO
K. Rajasekhar,
Farmer
P. Mallikarjun,
Farmer
K. Eshwara Rao,
Farmer
B. Satyam Naryana,
Farmer
develop
recommendations for
improving it
Encourage water
efficient irrigation
systems
Yes Yes Yes Yes Yes
Make Rain water
harvesting systems
mandatory across the
city
Yes Yes Yes Yes Yes
Water quality:
The irrigation
canals flowing
through the city
are polluted
due to disposal
of sewage and
waste into the
canals and the
run off
fertilizers from
the agricultural
fields. The
ground water is
getting polluted
from fertilizer
percolation and
dumping
Enhance capacity of
Sewage Treatment
Plans (STP)
Yes Yes Yes Yes Yes
Conduct awareness to
reduce water
consumption among
users + Subsidies
encouraging water
efficient fixtures in
residential units +
Introduce
pricing/metering to
improve the efficiency
of water use – to
reduce waste water
generation and to
reduce investment on
STPs
Yes Yes Yes Yes Yes
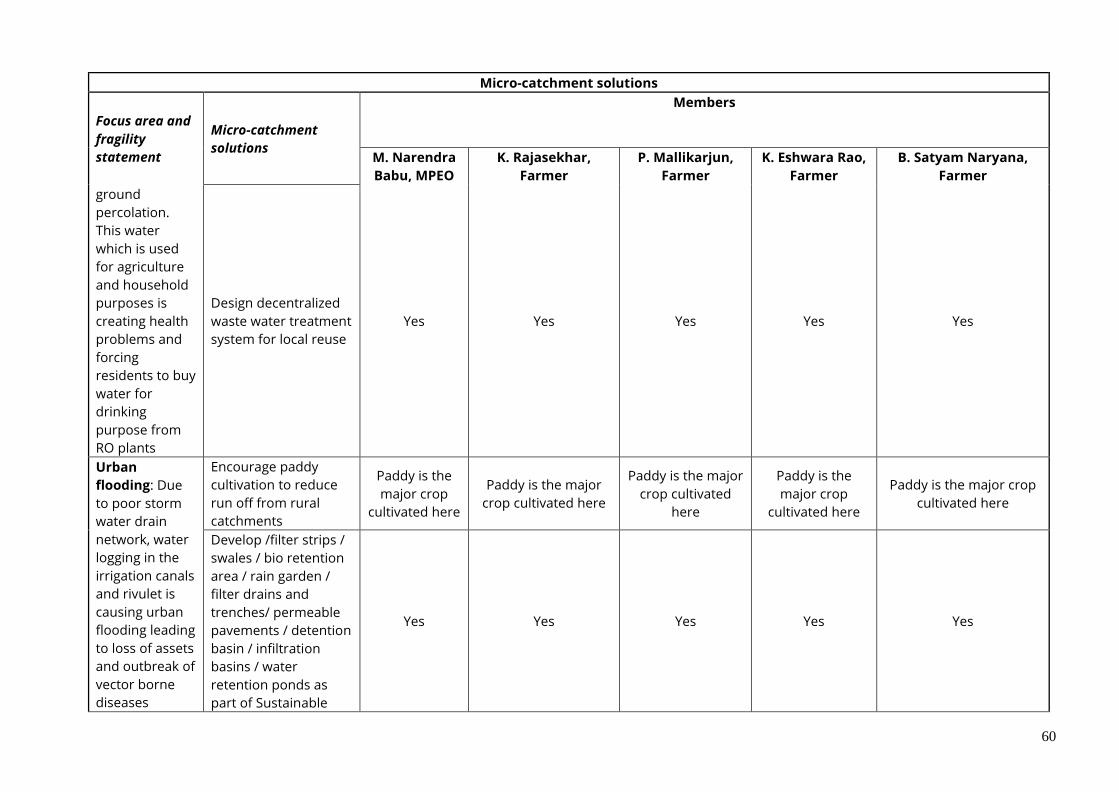
60
Micro-catchment solutions
Focus area and
fragility
statement
Micro-catchment
solutions
Members
M. Narendra
Babu, MPEO
K. Rajasekhar,
Farmer
P. Mallikarjun,
Farmer
K. Eshwara Rao,
Farmer
B. Satyam Naryana,
Farmer
ground
percolation.
This water
which is used
for agriculture
and household
purposes is
creating health
problems and
forcing
residents to buy
water for
drinking
purpose from
RO plants
Design decentralized
waste water treatment
system for local reuse
Yes Yes Yes Yes Yes
Urban
flooding: Due
to poor storm
water drain
network, water
logging in the
irrigation canals
and rivulet is
causing urban
flooding leading
to loss of assets
and outbreak of
vector borne
diseases
Encourage paddy
cultivation to reduce
run off from rural
catchments
Paddy is the
major crop
cultivated here
Paddy is the major
crop cultivated here
Paddy is the major
crop cultivated
here
Paddy is the
major crop
cultivated here
Paddy is the major crop
cultivated here
Develop /filter strips /
swales / bio retention
area / rain garden /
filter drains and
trenches/ permeable
pavements / detention
basin / infiltration
basins / water
retention ponds as
part of Sustainable
Yes Yes Yes Yes Yes
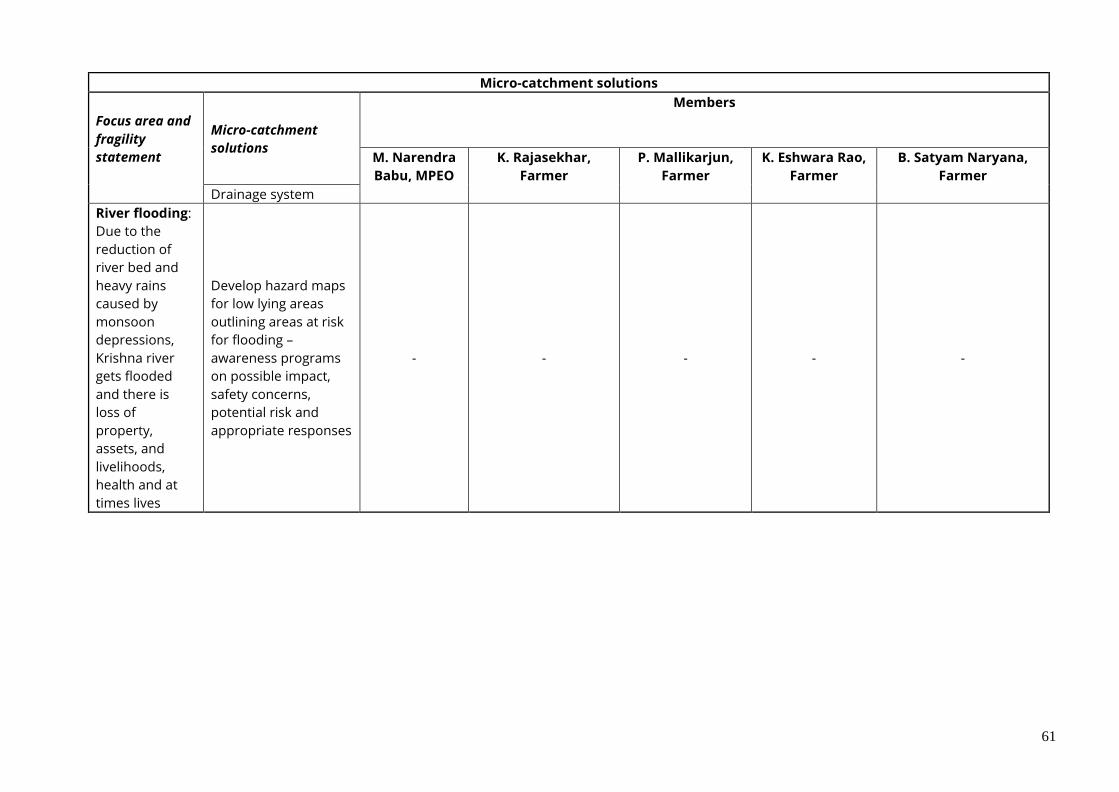
61
Micro-catchment solutions
Focus area and
fragility
statement
Micro-catchment
solutions
Members
M. Narendra
Babu, MPEO
K. Rajasekhar,
Farmer
P. Mallikarjun,
Farmer
K. Eshwara Rao,
Farmer
B. Satyam Naryana,
Farmer
Drainage system
River flooding:
Due to the
reduction of
river bed and
heavy rains
caused by
monsoon
depressions,
Krishna river
gets flooded
and there is
loss of
property,
assets, and
livelihoods,
health and at
times lives
Develop hazard maps
for low lying areas
outlining areas at risk
for flooding –
awareness programs
on possible impact,
safety concerns,
potential risk and
appropriate responses
- - - - -
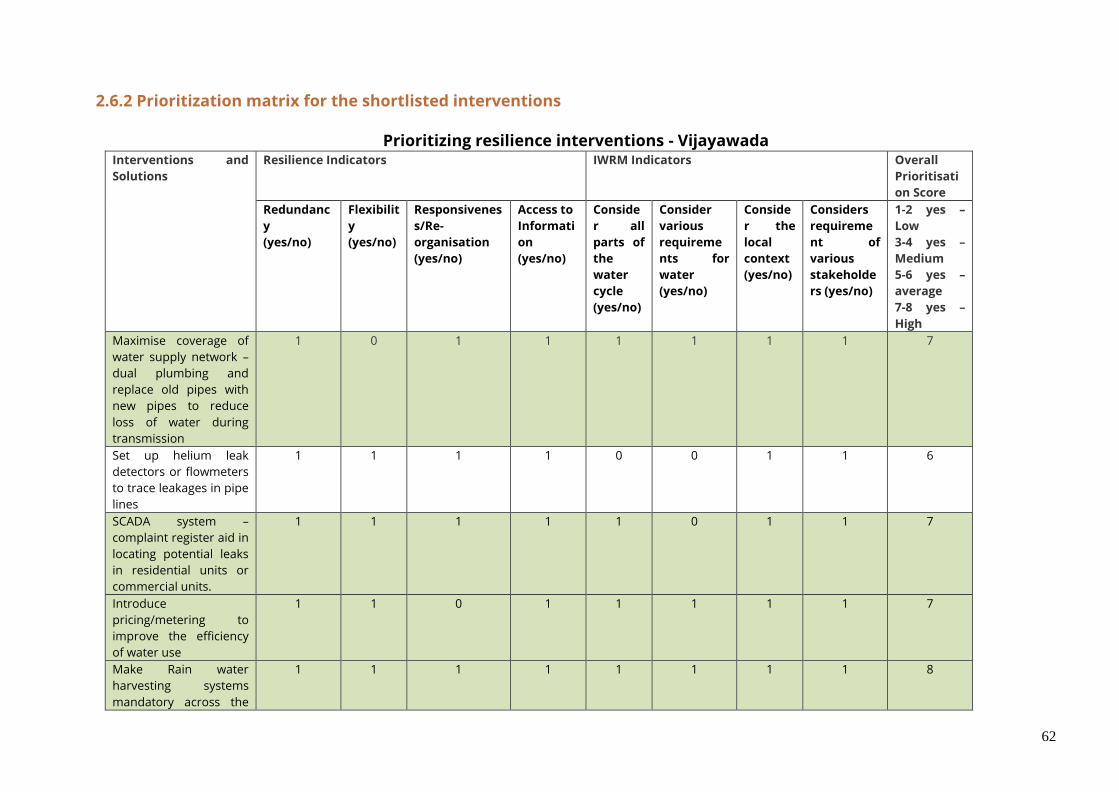
62
2.6.2 Prioritization matrix for the shortlisted interventions
Prioritizing resilience interventions - Vijayawada Interventions and
Solutions
Resilience Indicators IWRM Indicators Overall
Prioritisati
on Score
Redundanc
y
(yes/no)
Flexibilit
y
(yes/no)
Responsivenes
s/Re-
organisation
(yes/no)
Access to
Informati
on
(yes/no)
Conside
r all
parts of
the
water
cycle
(yes/no)
Consider
various
requireme
nts for
water
(yes/no)
Conside
r the
local
context
(yes/no)
Considers
requireme
nt of
various
stakeholde
rs (yes/no)
1-2 yes –
Low
3-4 yes –
Medium
5-6 yes –
average
7-8 yes –
High
Maximise coverage of
water supply network –
dual plumbing and
replace old pipes with
new pipes to reduce
loss of water during
transmission
1 0 1 1 1 1 1 1 7
Set up helium leak
detectors or flowmeters
to trace leakages in pipe
lines
1 1 1 1 0 0 1 1 6
SCADA system –
complaint register aid in
locating potential leaks
in residential units or
commercial units.
1 1 1 1 1 0 1 1 7
Introduce
pricing/metering to
improve the efficiency
of water use
1 1 0 1 1 1 1 1 7
Make Rain water
harvesting systems
mandatory across the
1 1 1 1 1 1 1 1 8
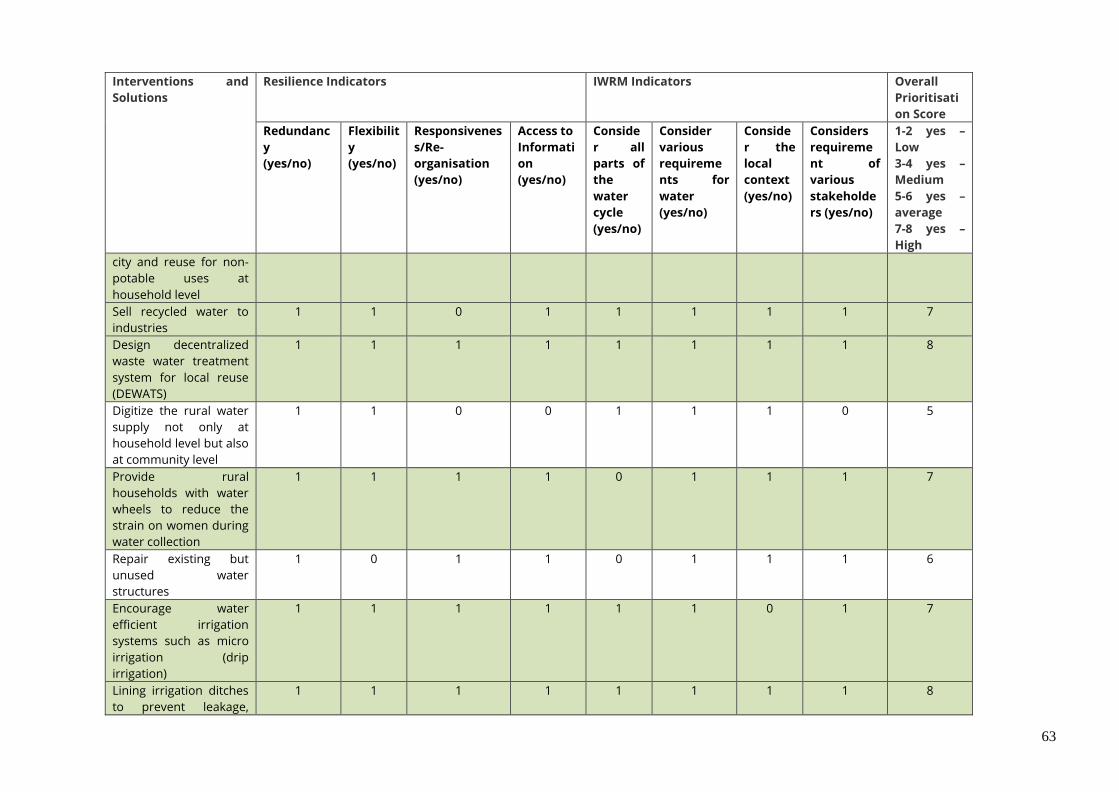
63
Interventions and
Solutions
Resilience Indicators IWRM Indicators Overall
Prioritisati
on Score
Redundanc
y
(yes/no)
Flexibilit
y
(yes/no)
Responsivenes
s/Re-
organisation
(yes/no)
Access to
Informati
on
(yes/no)
Conside
r all
parts of
the
water
cycle
(yes/no)
Consider
various
requireme
nts for
water
(yes/no)
Conside
r the
local
context
(yes/no)
Considers
requireme
nt of
various
stakeholde
rs (yes/no)
1-2 yes –
Low
3-4 yes –
Medium
5-6 yes –
average
7-8 yes –
High
city and reuse for non-
potable uses at
household level
Sell recycled water to
industries
1 1 0 1 1 1 1 1 7
Design decentralized
waste water treatment
system for local reuse
(DEWATS)
1 1 1 1 1 1 1 1 8
Digitize the rural water
supply not only at
household level but also
at community level
1 1 0 0 1 1 1 0 5
Provide rural
households with water
wheels to reduce the
strain on women during
water collection
1 1 1 1 0 1 1 1 7
Repair existing but
unused water
structures
1 0 1 1 0 1 1 1 6
Encourage water
efficient irrigation
systems such as micro
irrigation (drip
irrigation)
1 1 1 1 1 1 0 1 7
Lining irrigation ditches
to prevent leakage,
1 1 1 1 1 1 1 1 8
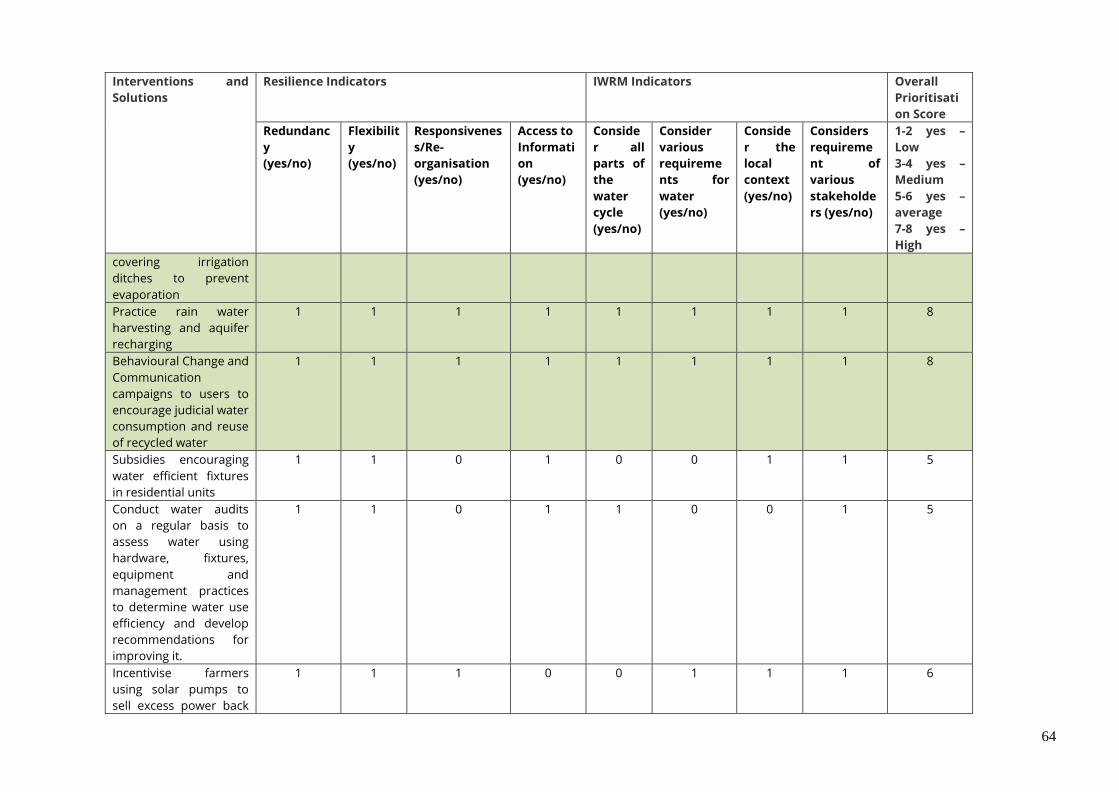
64
Interventions and
Solutions
Resilience Indicators IWRM Indicators Overall
Prioritisati
on Score
Redundanc
y
(yes/no)
Flexibilit
y
(yes/no)
Responsivenes
s/Re-
organisation
(yes/no)
Access to
Informati
on
(yes/no)
Conside
r all
parts of
the
water
cycle
(yes/no)
Consider
various
requireme
nts for
water
(yes/no)
Conside
r the
local
context
(yes/no)
Considers
requireme
nt of
various
stakeholde
rs (yes/no)
1-2 yes –
Low
3-4 yes –
Medium
5-6 yes –
average
7-8 yes –
High
covering irrigation
ditches to prevent
evaporation
Practice rain water
harvesting and aquifer
recharging
1 1 1 1 1 1 1 1 8
Behavioural Change and
Communication
campaigns to users to
encourage judicial water
consumption and reuse
of recycled water
1 1 1 1 1 1 1 1 8
Subsidies encouraging
water efficient fixtures
in residential units
1 1 0 1 0 0 1 1 5
Conduct water audits
on a regular basis to
assess water using
hardware, fixtures,
equipment and
management practices
to determine water use
efficiency and develop
recommendations for
improving it.
1 1 0 1 1 0 0 1 5
Incentivise farmers
using solar pumps to
sell excess power back
1 1 1 0 0 1 1 1 6
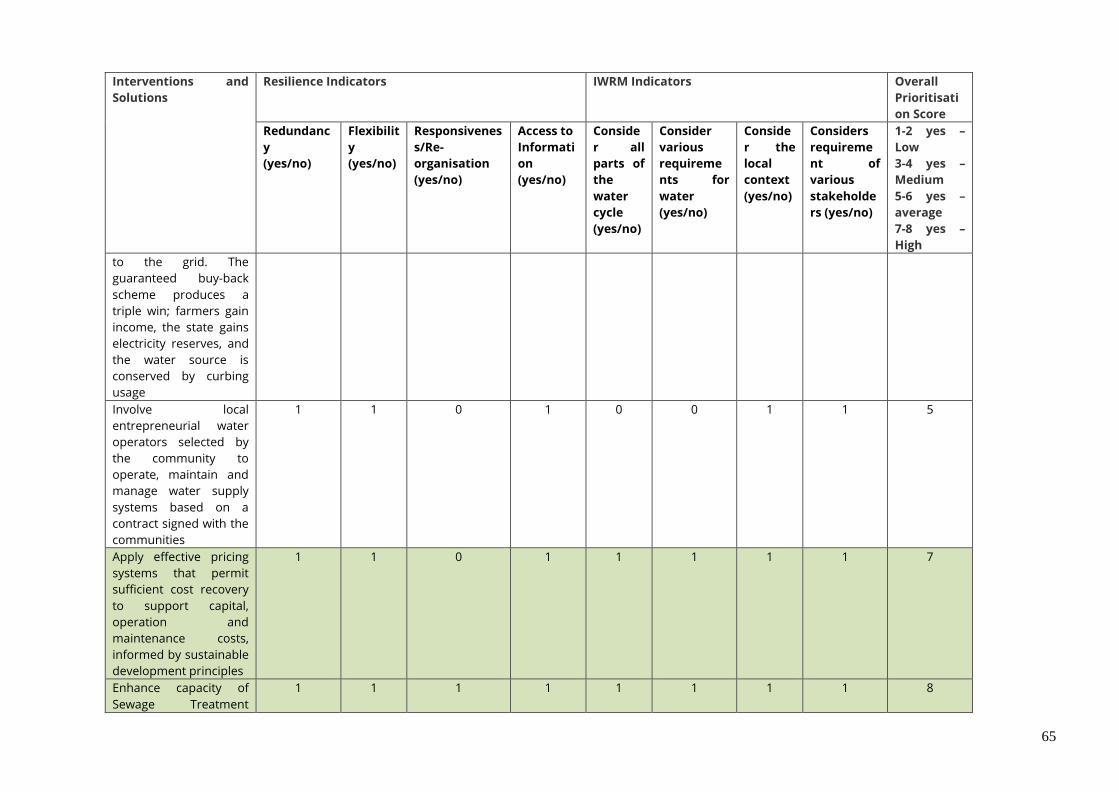
65
Interventions and
Solutions
Resilience Indicators IWRM Indicators Overall
Prioritisati
on Score
Redundanc
y
(yes/no)
Flexibilit
y
(yes/no)
Responsivenes
s/Re-
organisation
(yes/no)
Access to
Informati
on
(yes/no)
Conside
r all
parts of
the
water
cycle
(yes/no)
Consider
various
requireme
nts for
water
(yes/no)
Conside
r the
local
context
(yes/no)
Considers
requireme
nt of
various
stakeholde
rs (yes/no)
1-2 yes –
Low
3-4 yes –
Medium
5-6 yes –
average
7-8 yes –
High
to the grid. The
guaranteed buy-back
scheme produces a
triple win; farmers gain
income, the state gains
electricity reserves, and
the water source is
conserved by curbing
usage
Involve local
entrepreneurial water
operators selected by
the community to
operate, maintain and
manage water supply
systems based on a
contract signed with the
communities
1 1 0 1 0 0 1 1 5
Apply effective pricing
systems that permit
sufficient cost recovery
to support capital,
operation and
maintenance costs,
informed by sustainable
development principles
1 1 0 1 1 1 1 1 7
Enhance capacity of
Sewage Treatment
1 1 1 1 1 1 1 1 8
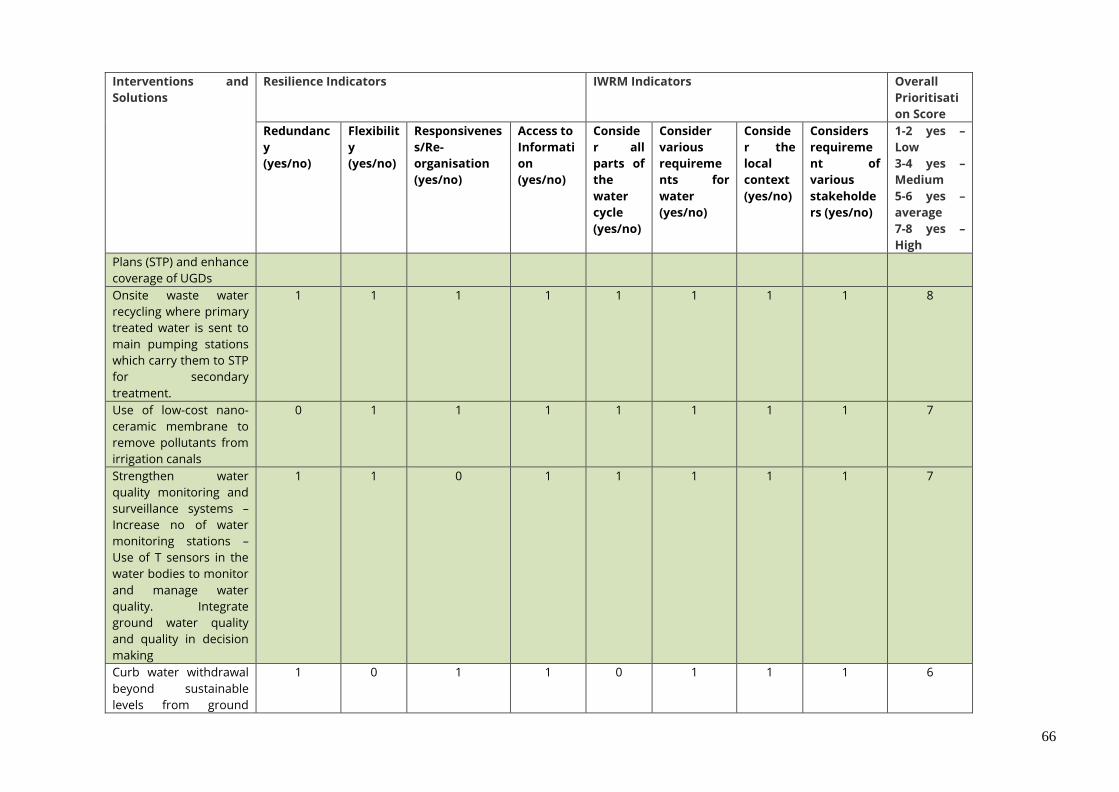
66
Interventions and
Solutions
Resilience Indicators IWRM Indicators Overall
Prioritisati
on Score
Redundanc
y
(yes/no)
Flexibilit
y
(yes/no)
Responsivenes
s/Re-
organisation
(yes/no)
Access to
Informati
on
(yes/no)
Conside
r all
parts of
the
water
cycle
(yes/no)
Consider
various
requireme
nts for
water
(yes/no)
Conside
r the
local
context
(yes/no)
Considers
requireme
nt of
various
stakeholde
rs (yes/no)
1-2 yes –
Low
3-4 yes –
Medium
5-6 yes –
average
7-8 yes –
High
Plans (STP) and enhance
coverage of UGDs
Onsite waste water
recycling where primary
treated water is sent to
main pumping stations
which carry them to STP
for secondary
treatment.
1 1 1 1 1 1 1 1 8
Use of low-cost nano-
ceramic membrane to
remove pollutants from
irrigation canals
0 1 1 1 1 1 1 1 7
Strengthen water
quality monitoring and
surveillance systems –
Increase no of water
monitoring stations –
Use of T sensors in the
water bodies to monitor
and manage water
quality. Integrate
ground water quality
and quality in decision
making
1 1 0 1 1 1 1 1 7
Curb water withdrawal
beyond sustainable
levels from ground
1 0 1 1 0 1 1 1 6
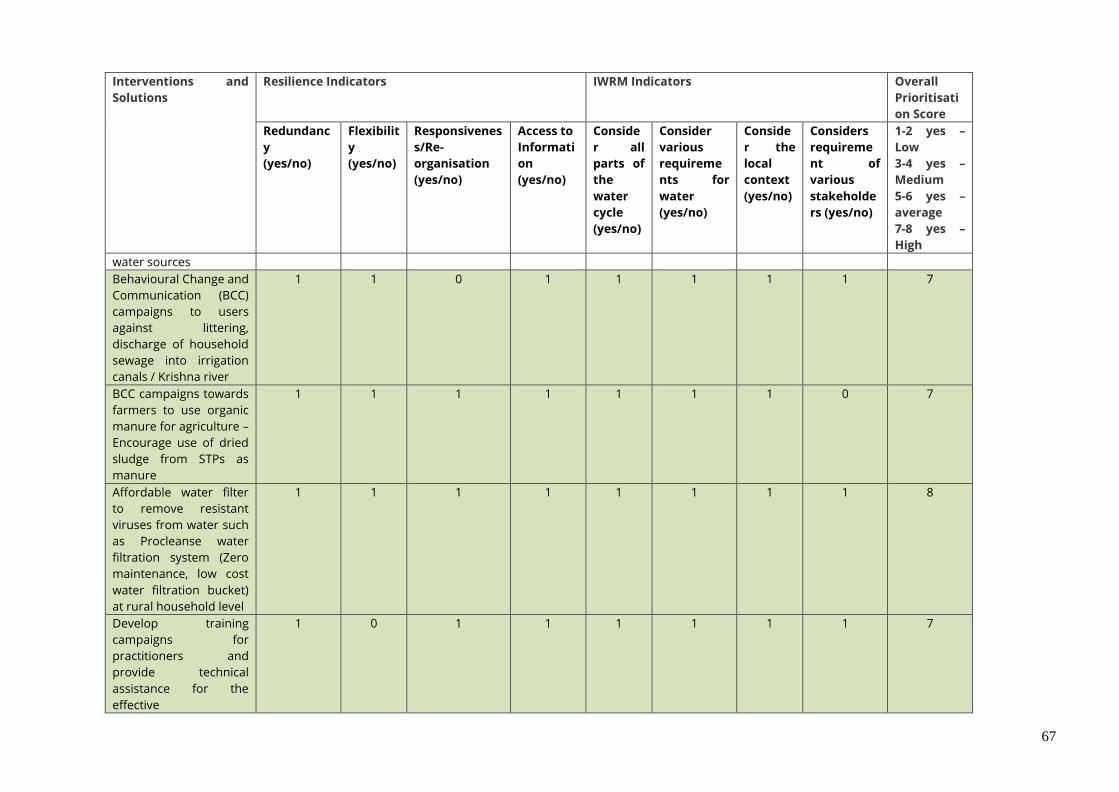
67
Interventions and
Solutions
Resilience Indicators IWRM Indicators Overall
Prioritisati
on Score
Redundanc
y
(yes/no)
Flexibilit
y
(yes/no)
Responsivenes
s/Re-
organisation
(yes/no)
Access to
Informati
on
(yes/no)
Conside
r all
parts of
the
water
cycle
(yes/no)
Consider
various
requireme
nts for
water
(yes/no)
Conside
r the
local
context
(yes/no)
Considers
requireme
nt of
various
stakeholde
rs (yes/no)
1-2 yes –
Low
3-4 yes –
Medium
5-6 yes –
average
7-8 yes –
High
water sources
Behavioural Change and
Communication (BCC)
campaigns to users
against littering,
discharge of household
sewage into irrigation
canals / Krishna river
1 1 0 1 1 1 1 1 7
BCC campaigns towards
farmers to use organic
manure for agriculture –
Encourage use of dried
sludge from STPs as
manure
1 1 1 1 1 1 1 0 7
Affordable water filter
to remove resistant
viruses from water such
as Procleanse water
filtration system (Zero
maintenance, low cost
water filtration bucket)
at rural household level
1 1 1 1 1 1 1 1 8
Develop training
campaigns for
practitioners and
provide technical
assistance for the
effective
1 0 1 1 1 1 1 1 7

68
Interventions and
Solutions
Resilience Indicators IWRM Indicators Overall
Prioritisati
on Score
Redundanc
y
(yes/no)
Flexibilit
y
(yes/no)
Responsivenes
s/Re-
organisation
(yes/no)
Access to
Informati
on
(yes/no)
Conside
r all
parts of
the
water
cycle
(yes/no)
Consider
various
requireme
nts for
water
(yes/no)
Conside
r the
local
context
(yes/no)
Considers
requireme
nt of
various
stakeholde
rs (yes/no)
1-2 yes –
Low
3-4 yes –
Medium
5-6 yes –
average
7-8 yes –
High
implementation of best
practices to address
water pollution
Develop /filter strips /
swales / bio retention
area / rain garden /
filter drains and
trenches/ permeable
pavements / detention
basin / infiltration
basins / water retention
ponds / storm water
tree trench / storm
water planter as part of
Sustainable Drainage
system and thereby
develop a sponge city.
These green
infrastructure building
techniques may be
incorporated in public
and private buildings,
parks and public spaces
1 1 1 1 1 1 1 1 8
Enhance network of
urban drainage system
in the city
1 0 1 1 1 1 1 1 7
Desilting and cleaning
of drains with using
1 0 1 1 1 0 1 1 6

69
Interventions and
Solutions
Resilience Indicators IWRM Indicators Overall
Prioritisati
on Score
Redundanc
y
(yes/no)
Flexibilit
y
(yes/no)
Responsivenes
s/Re-
organisation
(yes/no)
Access to
Informati
on
(yes/no)
Conside
r all
parts of
the
water
cycle
(yes/no)
Consider
various
requireme
nts for
water
(yes/no)
Conside
r the
local
context
(yes/no)
Considers
requireme
nt of
various
stakeholde
rs (yes/no)
1-2 yes –
Low
3-4 yes –
Medium
5-6 yes –
average
7-8 yes –
High
Robots
Raised ridges upto 10 m
wide to be alternated
with shallow canals to
channel water, either
harvested rain or
deviated river water.
0 1 1 1 1 1 1 1 7
Incentivise residents to
create an eco-
roof/green roof in
exchange for an
increase in a building’s
allowable area
1 1 1 1 1 0 1 1 7
Develop hazard maps
for low lying areas
outlining areas at risk
for flooding – Forbid
buildings in the
floodplain. Integrate
flood zone maps in all
spatial maps and plans
such as development
plans/master plans
1 1 1 1 1 1 1 1 8
Develop a system of
micro-dams with a dual
purpose of attenuating
floods and retaining
refuse.
0 1 1 1 1 1 1 1 7
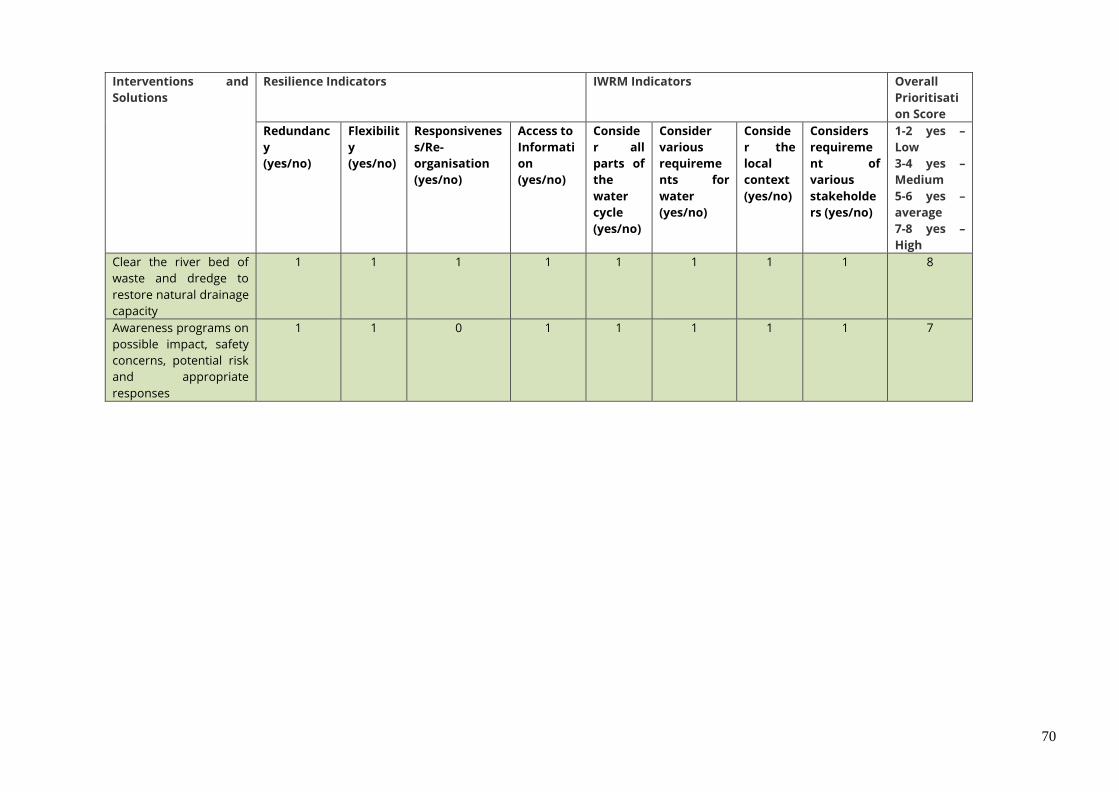
70
Interventions and
Solutions
Resilience Indicators IWRM Indicators Overall
Prioritisati
on Score
Redundanc
y
(yes/no)
Flexibilit
y
(yes/no)
Responsivenes
s/Re-
organisation
(yes/no)
Access to
Informati
on
(yes/no)
Conside
r all
parts of
the
water
cycle
(yes/no)
Consider
various
requireme
nts for
water
(yes/no)
Conside
r the
local
context
(yes/no)
Considers
requireme
nt of
various
stakeholde
rs (yes/no)
1-2 yes –
Low
3-4 yes –
Medium
5-6 yes –
average
7-8 yes –
High
Clear the river bed of
waste and dredge to
restore natural drainage
capacity
1 1 1 1 1 1 1 1 8
Awareness programs on
possible impact, safety
concerns, potential risk
and appropriate
responses
1 1 0 1 1 1 1 1 7
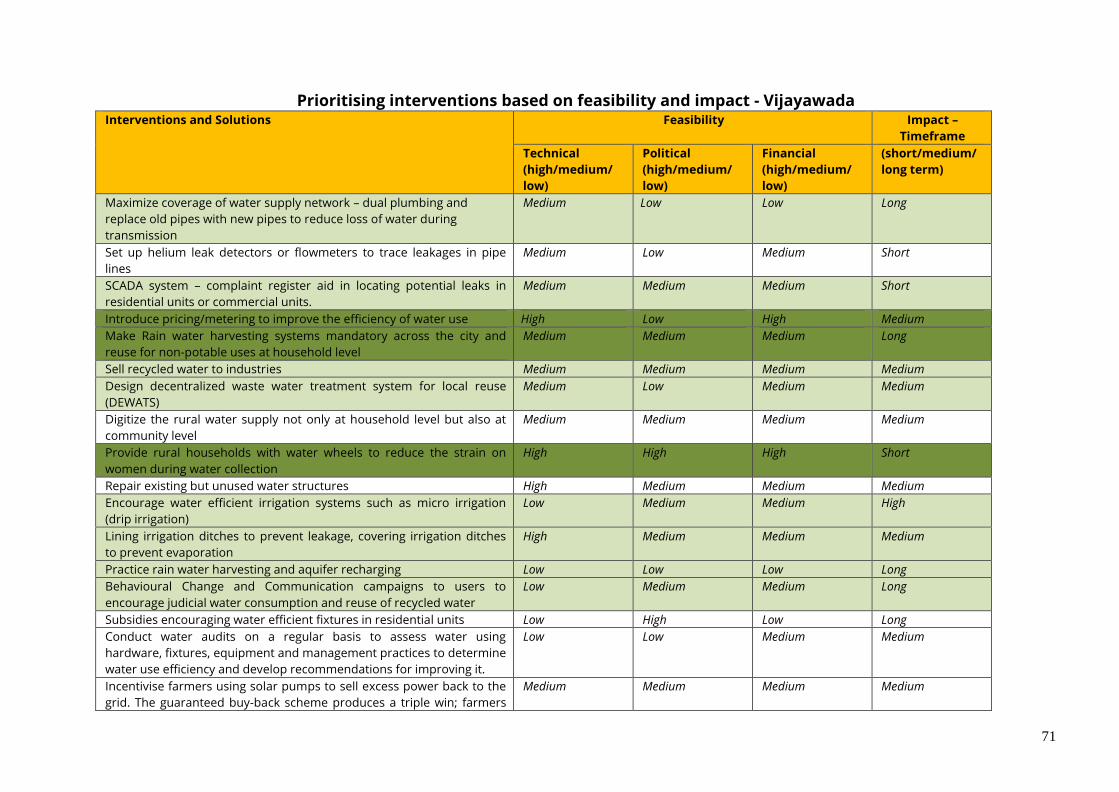
71
Prioritising interventions based on feasibility and impact - Vijayawada Interventions and Solutions Feasibility Impact –
Timeframe
Technical
(high/medium/
low)
Political
(high/medium/
low)
Financial
(high/medium/
low)
(short/medium/
long term)
Maximize coverage of water supply network – dual plumbing and
replace old pipes with new pipes to reduce loss of water during
transmission
Medium Low Low Long
Set up helium leak detectors or flowmeters to trace leakages in pipe
lines
Medium Low Medium Short
SCADA system – complaint register aid in locating potential leaks in
residential units or commercial units.
Medium Medium Medium Short
Introduce pricing/metering to improve the efficiency of water use High Low High Medium
Make Rain water harvesting systems mandatory across the city and
reuse for non-potable uses at household level
Medium Medium Medium Long
Sell recycled water to industries Medium Medium Medium Medium
Design decentralized waste water treatment system for local reuse
(DEWATS)
Medium Low Medium Medium
Digitize the rural water supply not only at household level but also at
community level
Medium Medium Medium Medium
Provide rural households with water wheels to reduce the strain on
women during water collection
High High High Short
Repair existing but unused water structures High Medium Medium Medium
Encourage water efficient irrigation systems such as micro irrigation
(drip irrigation)
Low Medium Medium High
Lining irrigation ditches to prevent leakage, covering irrigation ditches
to prevent evaporation
High Medium Medium Medium
Practice rain water harvesting and aquifer recharging Low Low Low Long
Behavioural Change and Communication campaigns to users to
encourage judicial water consumption and reuse of recycled water
Low Medium Medium Long
Subsidies encouraging water efficient fixtures in residential units Low High Low Long
Conduct water audits on a regular basis to assess water using
hardware, fixtures, equipment and management practices to determine
water use efficiency and develop recommendations for improving it.
Low Low Medium Medium
Incentivise farmers using solar pumps to sell excess power back to the
grid. The guaranteed buy-back scheme produces a triple win; farmers
Medium Medium Medium Medium
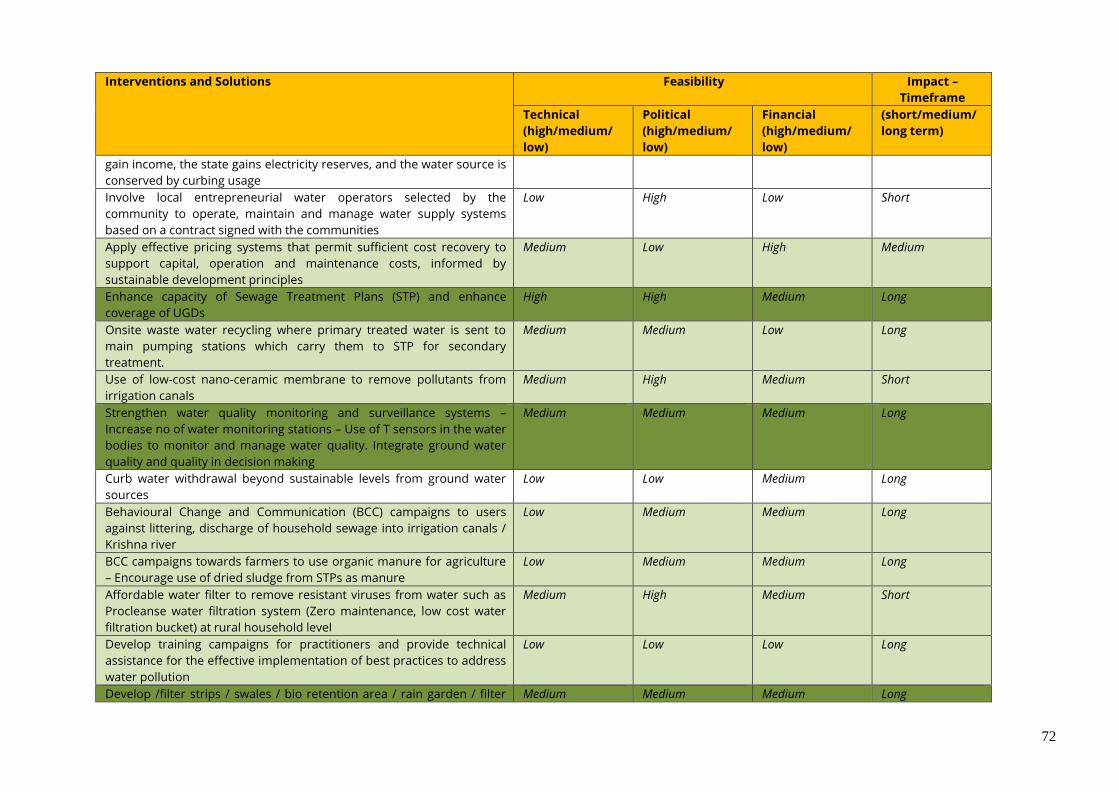
72
Interventions and Solutions Feasibility Impact –
Timeframe
Technical
(high/medium/
low)
Political
(high/medium/
low)
Financial
(high/medium/
low)
(short/medium/
long term)
gain income, the state gains electricity reserves, and the water source is
conserved by curbing usage
Involve local entrepreneurial water operators selected by the
community to operate, maintain and manage water supply systems
based on a contract signed with the communities
Low High Low Short
Apply effective pricing systems that permit sufficient cost recovery to
support capital, operation and maintenance costs, informed by
sustainable development principles
Medium Low High Medium
Enhance capacity of Sewage Treatment Plans (STP) and enhance
coverage of UGDs
High High Medium Long
Onsite waste water recycling where primary treated water is sent to
main pumping stations which carry them to STP for secondary
treatment.
Medium Medium Low Long
Use of low-cost nano-ceramic membrane to remove pollutants from
irrigation canals
Medium High Medium Short
Strengthen water quality monitoring and surveillance systems –
Increase no of water monitoring stations – Use of T sensors in the water
bodies to monitor and manage water quality. Integrate ground water
quality and quality in decision making
Medium Medium Medium Long
Curb water withdrawal beyond sustainable levels from ground water
sources
Low Low Medium Long
Behavioural Change and Communication (BCC) campaigns to users
against littering, discharge of household sewage into irrigation canals /
Krishna river
Low Medium Medium Long
BCC campaigns towards farmers to use organic manure for agriculture
– Encourage use of dried sludge from STPs as manure
Low Medium Medium Long
Affordable water filter to remove resistant viruses from water such as
Procleanse water filtration system (Zero maintenance, low cost water
filtration bucket) at rural household level
Medium High Medium Short
Develop training campaigns for practitioners and provide technical
assistance for the effective implementation of best practices to address
water pollution
Low Low Low Long
Develop /filter strips / swales / bio retention area / rain garden / filter Medium Medium Medium Long
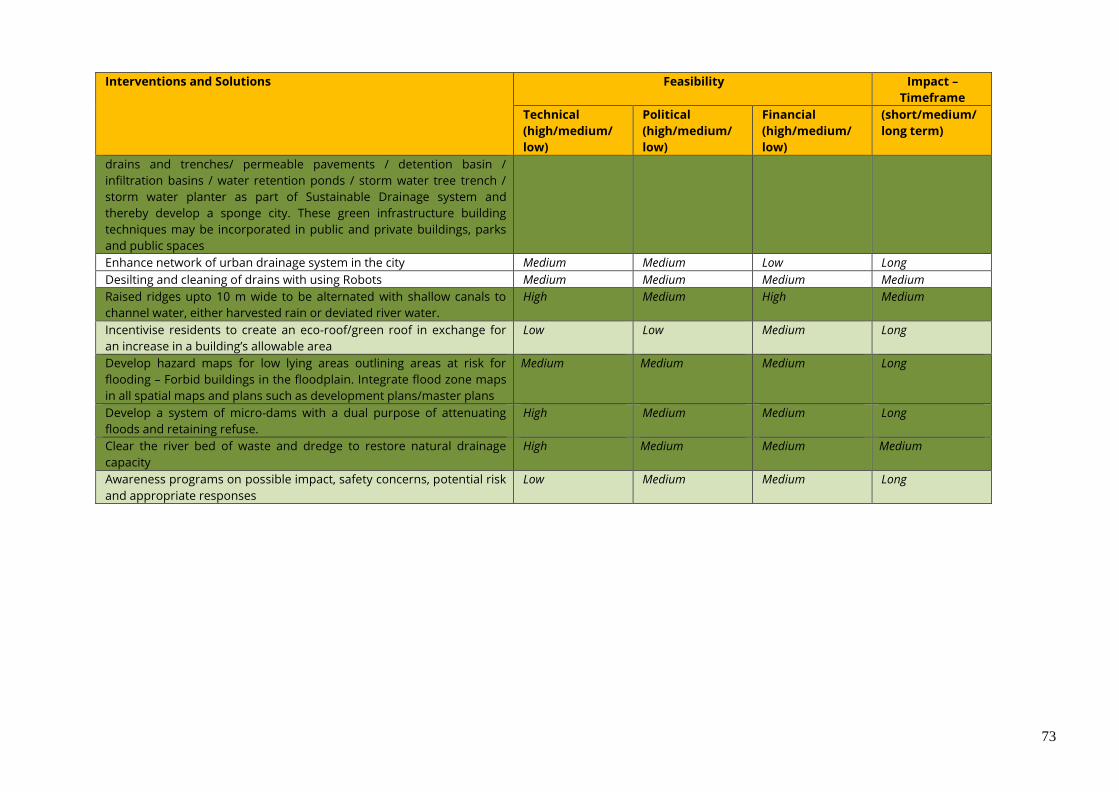
73
Interventions and Solutions Feasibility Impact –
Timeframe
Technical
(high/medium/
low)
Political
(high/medium/
low)
Financial
(high/medium/
low)
(short/medium/
long term)
drains and trenches/ permeable pavements / detention basin /
infiltration basins / water retention ponds / storm water tree trench /
storm water planter as part of Sustainable Drainage system and
thereby develop a sponge city. These green infrastructure building
techniques may be incorporated in public and private buildings, parks
and public spaces
Enhance network of urban drainage system in the city Medium Medium Low Long
Desilting and cleaning of drains with using Robots Medium Medium Medium Medium
Raised ridges upto 10 m wide to be alternated with shallow canals to
channel water, either harvested rain or deviated river water.
High Medium High Medium
Incentivise residents to create an eco-roof/green roof in exchange for
an increase in a building’s allowable area
Low Low Medium Long
Develop hazard maps for low lying areas outlining areas at risk for
flooding – Forbid buildings in the floodplain. Integrate flood zone maps
in all spatial maps and plans such as development plans/master plans
Medium Medium Medium Long
Develop a system of micro-dams with a dual purpose of attenuating
floods and retaining refuse.
High Medium Medium Long
Clear the river bed of waste and dredge to restore natural drainage
capacity
High Medium Medium Medium
Awareness programs on possible impact, safety concerns, potential risk
and appropriate responses
Low Medium Medium Long
74
2.6.3 Decision Support Tool: Structure
The DST model selected for the integrated rural urban water management in
Vijayawada consists of the following components:
● WEAP model: Water Evaluation and Planning (WEAP) is a computer tool
developed by the Stockholm Environment Institute's U.S. Centre for integrated
water resources planning, which provides a comprehensive, flexible, and user-
friendly framework for development of water balances, scenario generation,
planning, and policy analysis.
● Adaptation module: The outcome from WEAP is linked to a meta set of
interventions, and based on the constraints identified by the RURBAN platform
members, it further shortlists interventions and presents a prioritized set of actions
to the RURBAN platform to discuss and integrate into the proposed project.
2.6.4 Decision Support Tool: Application
The Decision Support Tool can be used by the catchment managers to identify
future integrated water management projects/interventions or to modify the
existing projects/interventions to adhere to integrated water management
concepts. In the current context, the Decision Support Tool has several potential
entry points:
● Needs assessment: Evaluation of most critical areas across stakeholders in
the RURBAN platform, based on current and future demand-supply
assessment
● Intervention review: Review of ongoing/already designed projects to
introduce adaptations/augmentations for greater sustainability and better
balance of stakeholder interests
● Intervention design: Design of projects/interventions through assessment of
options on economic, social, environmental, and other costs and benefits
The evaluation of the most critical areas for interventions across stakeholders is
done with the help of a Catchment Management Plan, through an assessment of
economic, social, environmental, and financial benefits. The catchment under
consideration is evaluated for critical areas, and the interventions to manage the
critical areas, are identified based on a climate fragility statement, and an
integration matrix. The areas which require urgent attention have to be identified,
and shortlisted from the list of all interventions proposed in the catchment. The
interventions/projects that are to be implemented can be shortlisted after
analyzing the impacts of all the proposed interventions in the catchment area using
the Decision Support Tool.
The Decision Support Tool can also be used to modify proposed or ongoing/already
designed projects to adhere to integrated water management concepts. The
different water management projects/interventions in the catchment area can be
analyzed using the Decision Support Tool (WEAP) to assess their impact. The
interventions can be assessed under different scenarios to evaluate how they
perform under different environmental, economic, and social conditions. Upon
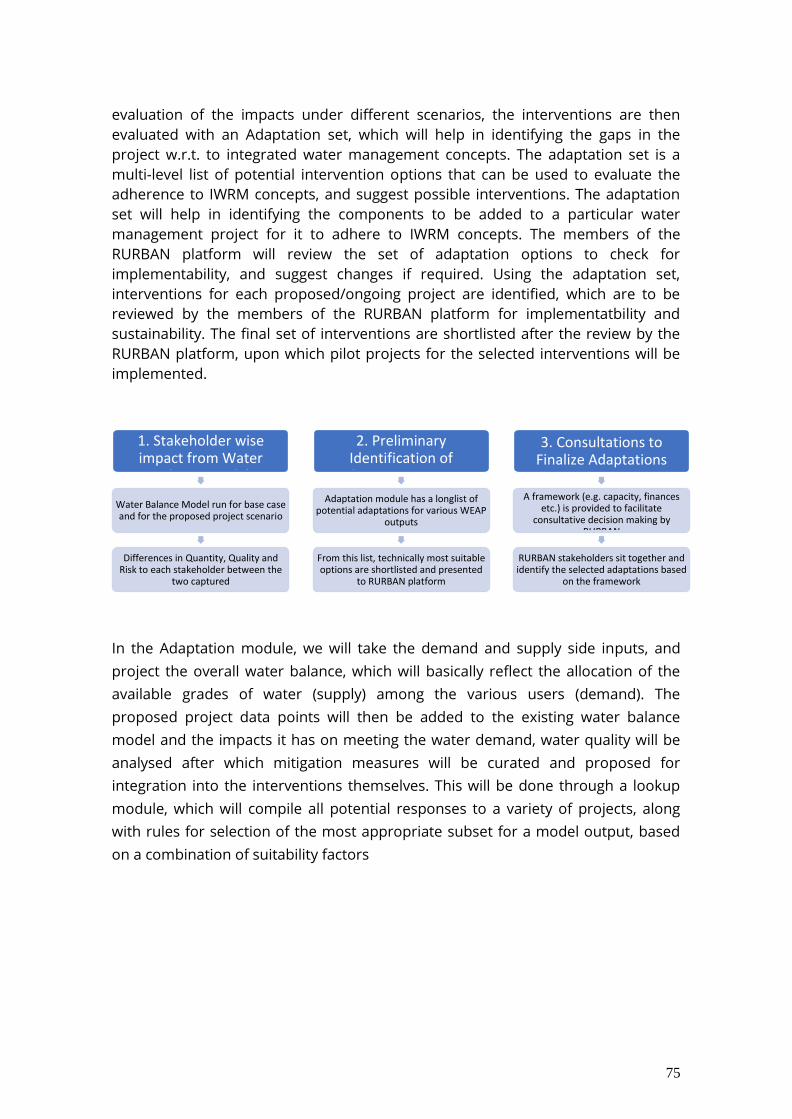
75
evaluation of the impacts under different scenarios, the interventions are then
evaluated with an Adaptation set, which will help in identifying the gaps in the
project w.r.t. to integrated water management concepts. The adaptation set is a
multi-level list of potential intervention options that can be used to evaluate the
adherence to IWRM concepts, and suggest possible interventions. The adaptation
set will help in identifying the components to be added to a particular water
management project for it to adhere to IWRM concepts. The members of the
RURBAN platform will review the set of adaptation options to check for
implementability, and suggest changes if required. Using the adaptation set,
interventions for each proposed/ongoing project are identified, which are to be
reviewed by the members of the RURBAN platform for implementatbility and
sustainability. The final set of interventions are shortlisted after the review by the
RURBAN platform, upon which pilot projects for the selected interventions will be
implemented.
In the Adaptation module, we will take the demand and supply side inputs, and
project the overall water balance, which will basically reflect the allocation of the
available grades of water (supply) among the various users (demand). The
proposed project data points will then be added to the existing water balance
model and the impacts it has on meeting the water demand, water quality will be
analysed after which mitigation measures will be curated and proposed for
integration into the interventions themselves. This will be done through a lookup
module, which will compile all potential responses to a variety of projects, along
with rules for selection of the most appropriate subset for a model output, based
on a combination of suitability factors
1. Stakeholder wise impact from Water
Balance Model
Water Balance Model run for base case and for the proposed project scenario
Differences in Quantity, Quality and
Risk to each stakeholder between the two captured
2. Preliminary
Identification of Adaptation Options
Adaptation module has a longlist of
potential adaptations for various WEAP outputs
From this list, technically most suitable options are shortlisted and presented
to RURBAN platform
3. Consultations to
Finalize Adaptations
A framework (e.g. capacity, finances
etc.) is provided to facilitate consultative decision making by
RURBAN
RURBAN stakeholders sit together and identify the selected adaptations based
on the framework
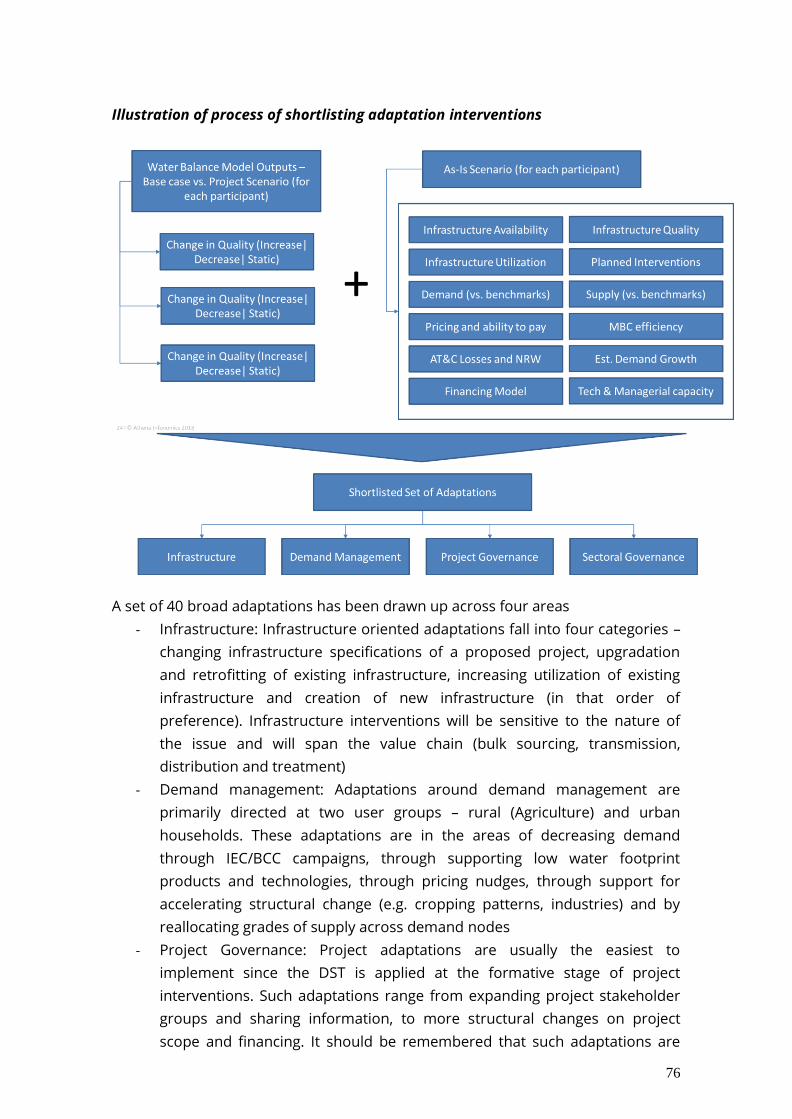
76
Illustration of process of shortlisting adaptation interventions
A set of 40 broad adaptations has been drawn up across four areas
- Infrastructure: Infrastructure oriented adaptations fall into four categories –
changing infrastructure specifications of a proposed project, upgradation
and retrofitting of existing infrastructure, increasing utilization of existing
infrastructure and creation of new infrastructure (in that order of
preference). Infrastructure interventions will be sensitive to the nature of
the issue and will span the value chain (bulk sourcing, transmission,
distribution and treatment)
- Demand management: Adaptations around demand management are
primarily directed at two user groups – rural (Agriculture) and urban
households. These adaptations are in the areas of decreasing demand
through IEC/BCC campaigns, through supporting low water footprint
products and technologies, through pricing nudges, through support for
accelerating structural change (e.g. cropping patterns, industries) and by
reallocating grades of supply across demand nodes
- Project Governance: Project adaptations are usually the easiest to
implement since the DST is applied at the formative stage of project
interventions. Such adaptations range from expanding project stakeholder
groups and sharing information, to more structural changes on project
scope and financing. It should be remembered that such adaptations are
77
not necessarily focused on increasing project costs. In many cases where
there are positive externalities from the project, a share of these can be
monetized and help support project viability
- Sectoral Governance: These include adaptations which are out of scope of
the project, since they go beyond the project mandate, and/or require
resources which cannot be raised within the project

78
Annex 1
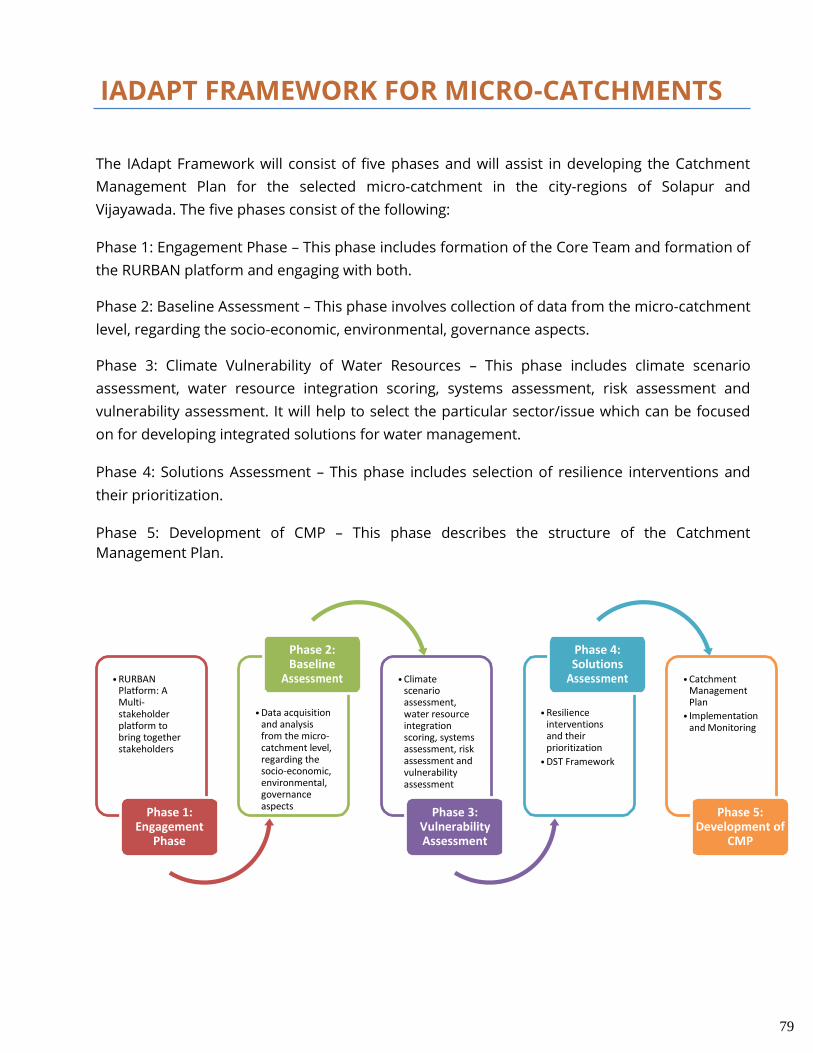
79
• RURBAN Platform: A Multi- stakeholder platform to bring together stakeholders
Phase 2: Baseline
Assessment
• Data acquisition
and analysis from the micro- catchment level, regarding the socio-economic, environmental, governance aspects
• Climate scenario assessment, water resource integration scoring, systems assessment, risk assessment and vulnerability assessment
Phase 4: Solutions
Assessment
• Resilience
interventions and their prioritization
• DST Framework
• Catchment Management Plan
• Implementation and Monitoring
Phase 1: Engagement
Phase
Phase 3: Vulnerability Assessment
Phase 5: Development of
CMP
IADAPT FRAMEWORK FOR MICRO-CATCHMENTS
The IAdapt Framework will consist of five phases and will assist in developing the Catchment
Management Plan for the selected micro-catchment in the city-regions of Solapur and
Vijayawada. The five phases consist of the following:
Phase 1: Engagement Phase – This phase includes formation of the Core Team and formation of
the RURBAN platform and engaging with both.
Phase 2: Baseline Assessment – This phase involves collection of data from the micro-catchment
level, regarding the socio-economic, environmental, governance aspects.
Phase 3: Climate Vulnerability of Water Resources – This phase includes climate scenario
assessment, water resource integration scoring, systems assessment, risk assessment and
vulnerability assessment. It will help to select the particular sector/issue which can be focused
on for developing integrated solutions for water management.
Phase 4: Solutions Assessment – This phase includes selection of resilience interventions and
their prioritization.
Phase 5: Development of CMP – This phase describes the structure of the Catchment
Management Plan.
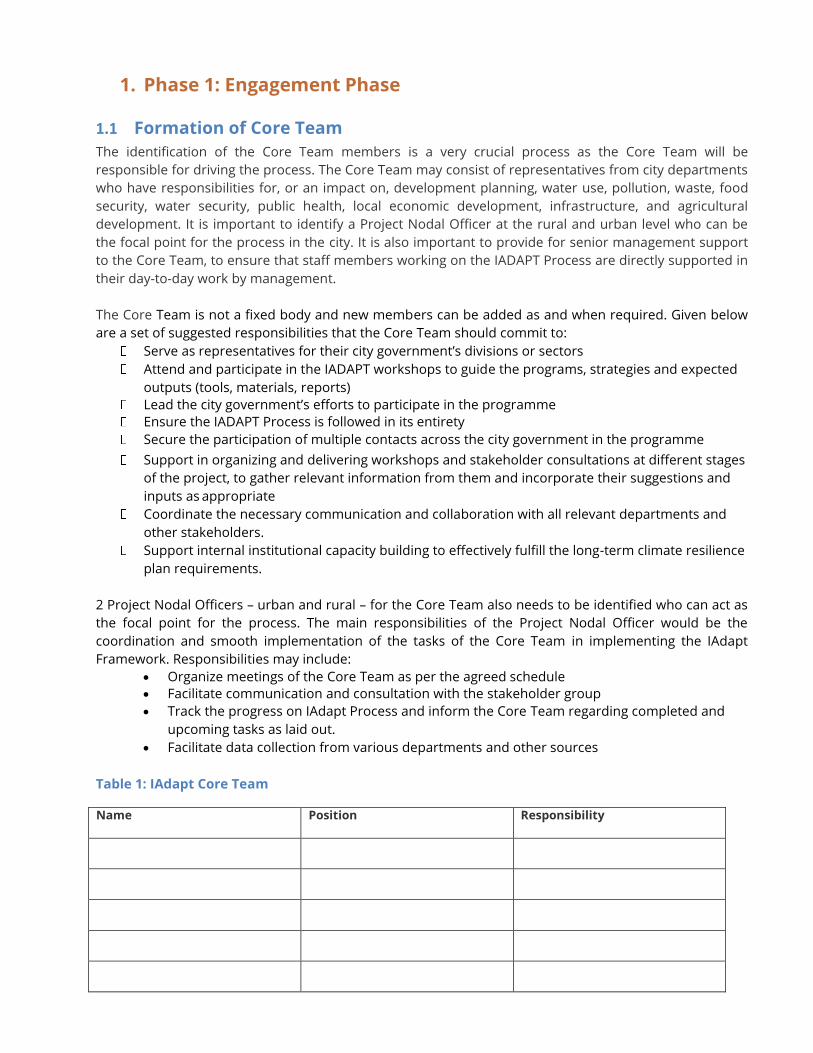
1. Phase 1: Engagement Phase
1.1 Formation of Core Team
The identification of the Core Team members is a very crucial process as the Core Team will be
responsible for driving the process. The Core Team may consist of representatives from city departments
who have responsibilities for, or an impact on, development planning, water use, pollution, waste, food
security, water security, public health, local economic development, infrastructure, and agricultural
development. It is important to identify a Project Nodal Officer at the rural and urban level who can be
the focal point for the process in the city. It is also important to provide for senior management support
to the Core Team, to ensure that staff members working on the IADAPT Process are directly supported in
their day-to-day work by management.
The Core Team is not a fixed body and new members can be added as and when required. Given below
are a set of suggested responsibilities that the Core Team should commit to:
Serve as representatives for their city government’s divisions or sectors
Attend and participate in the IADAPT workshops to guide the programs, strategies and expected
outputs (tools, materials, reports)
Lead the city government’s efforts to participate in the programme
Ensure the IADAPT Process is followed in its entirety
Secure the participation of multiple contacts across the city government in the programme
Support in organizing and delivering workshops and stakeholder consultations at different stages
of the project, to gather relevant information from them and incorporate their suggestions and
inputs as appropriate
Coordinate the necessary communication and collaboration with all relevant departments and
other stakeholders.
Support internal institutional capacity building to effectively fulfill the long-term climate resilience
plan requirements.
2 Project Nodal Officers – urban and rural – for the Core Team also needs to be identified who can act as
the focal point for the process. The main responsibilities of the Project Nodal Officer would be the
coordination and smooth implementation of the tasks of the Core Team in implementing the IAdapt
Framework. Responsibilities may include:
• Organize meetings of the Core Team as per the agreed schedule
• Facilitate communication and consultation with the stakeholder group
• Track the progress on IAdapt Process and inform the Core Team regarding completed and
upcoming tasks as laid out.
• Facilitate data collection from various departments and other sources
Table 1: IAdapt Core Team
Name Position Responsibility
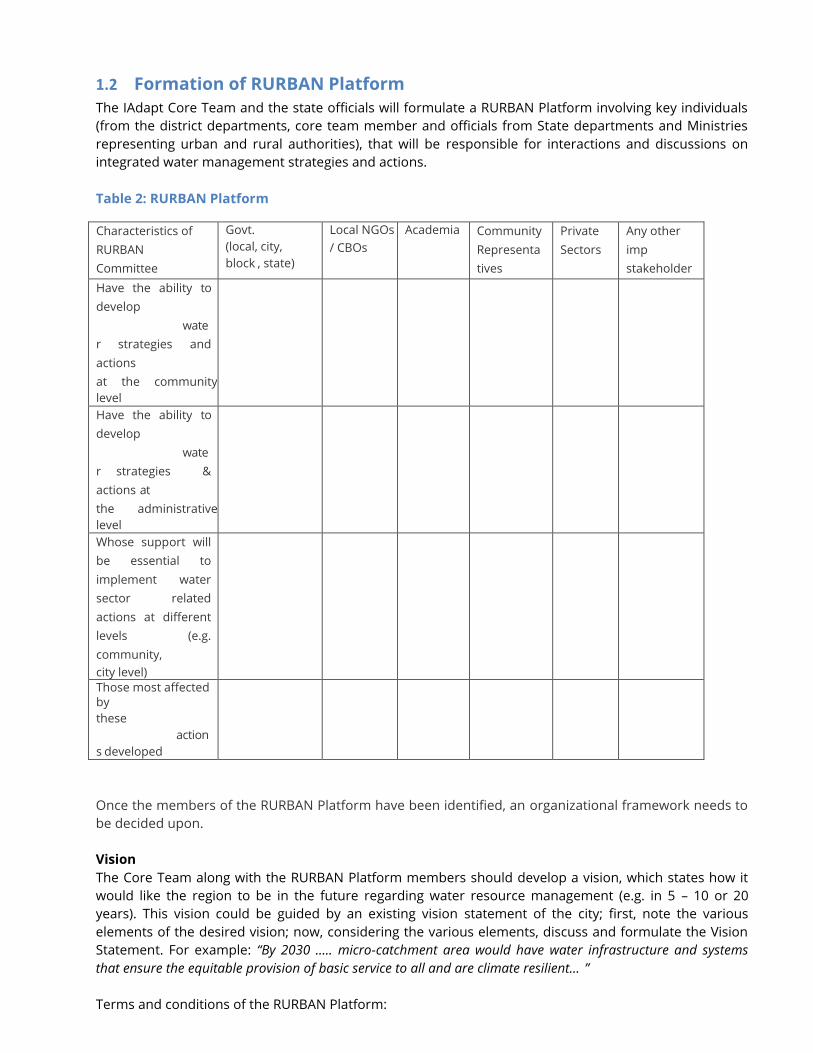
1.2 Formation of RURBAN Platform
The IAdapt Core Team and the state officials will formulate a RURBAN Platform involving key individuals
(from the district departments, core team member and officials from State departments and Ministries
representing urban and rural authorities), that will be responsible for interactions and discussions on
integrated water management strategies and actions.
Table 2: RURBAN Platform
Characteristics of
RURBAN
Committee
Govt.
(local, city,
block , state)
Local NGOs
/ CBOs
Academia Community
Representa
tives
Private
Sectors
Any other
imp
stakeholder
Have the ability to
develop
wate
r strategies and
actions
at the community
level
Have the ability to
develop
wate
r strategies &
actions at
the administrative
level
Whose support will
be essential to
implement water
sector related
actions at different
levels (e.g.
community,
city level)
Those most affected by
these
action
s developed
Once the members of the RURBAN Platform have been identified, an organizational framework needs to
be decided upon.
Vision
The Core Team along with the RURBAN Platform members should develop a vision, which states how it
would like the region to be in the future regarding water resource management (e.g. in 5 – 10 or 20
years). This vision could be guided by an existing vision statement of the city; first, note the various
elements of the desired vision; now, considering the various elements, discuss and formulate the Vision
Statement. For example: “By 2030 ….. micro-catchment area would have water infrastructure and systems
that ensure the equitable provision of basic service to all and are climate resilient… ”
Terms and conditions of the RURBAN Platform:
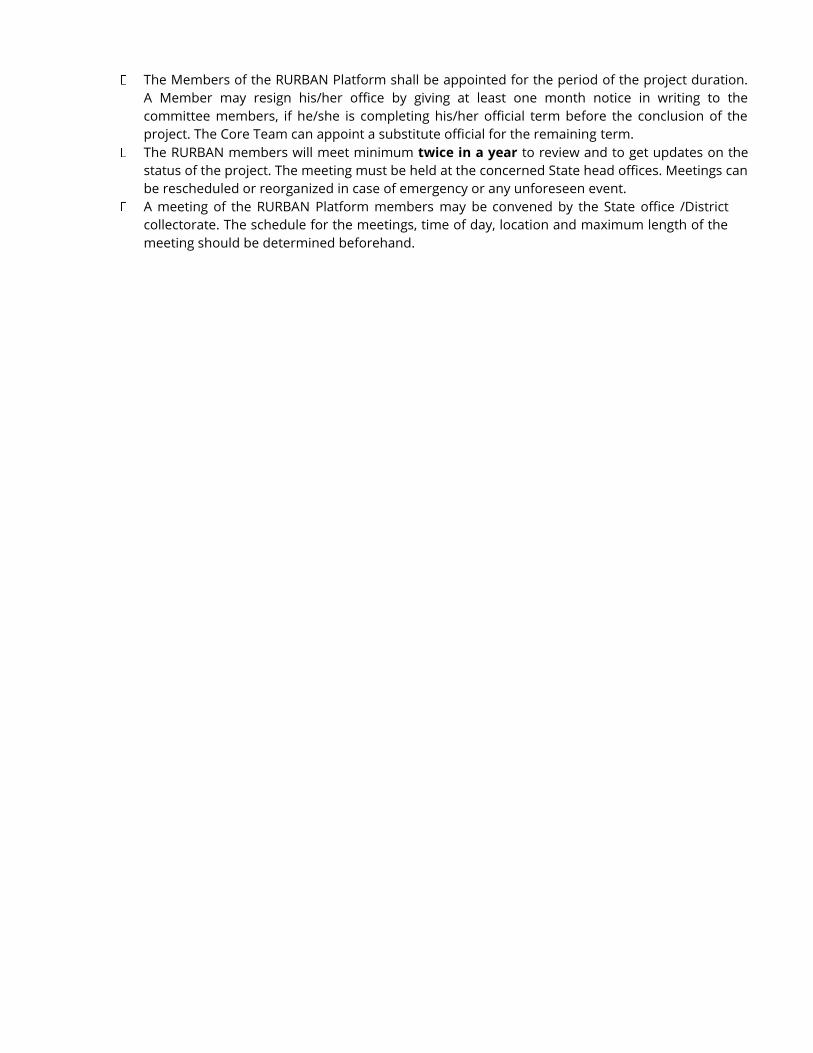
The Members of the RURBAN Platform shall be appointed for the period of the project duration.
A Member may resign his/her office by giving at least one month notice in writing to the
committee members, if he/she is completing his/her official term before the conclusion of the
project. The Core Team can appoint a substitute official for the remaining term.
The RURBAN members will meet minimum twice in a year to review and to get updates on the
status of the project. The meeting must be held at the concerned State head offices. Meetings can
be rescheduled or reorganized in case of emergency or any unforeseen event.
A meeting of the RURBAN Platform members may be convened by the State office /District
collectorate. The schedule for the meetings, time of day, location and maximum length of the
meeting should be determined beforehand.

At the meeting, the following shall preside - The national and state government representatives
Two core team members representing the urban and rural areas
Collector or block representative who is for the time being designated under to represent (nodal officer)
Frequency of meetings should be based on the project plan.
The quorum for the meeting of the RURBAN Platform members shall be at least half of the
members of the committee of whom at least 2 shall be members who are state officers and at
least 4 core team members.
The nodal officer will be responsible for providing the project updates and status of the project to
the RURBAN Platform. The Project Nodal Officer can be in-charge for ensuring the reporting and
thereby monitoring the project. The report will be finalized after the approval of RURBAN
committee. The comments and suggestions from the committee should be incorporated before
the submission of the report.
Every question or other matter for decision or determination at a meeting shall be decided or
determined by a majority of votes of the members present and entitled to vote and, in the event
that voting is equally divided, the National government representative or State member
presiding at the meeting shall have a casting vote.
Outcome of Phase 1:
Identification of the nodal officer
Formulation of the core team
RURBAN platform
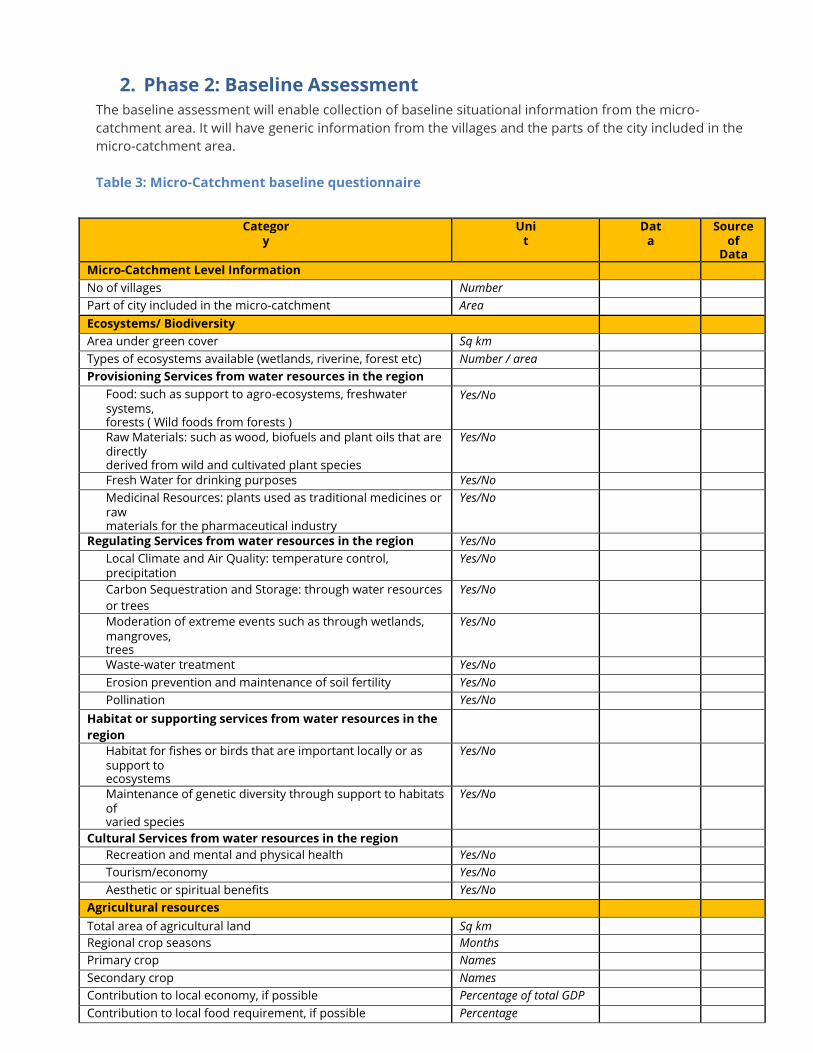
2. Phase 2: Baseline Assessment The baseline assessment will enable collection of baseline situational information from the micro-
catchment area. It will have generic information from the villages and the parts of the city included in the
micro-catchment area.
Table 3: Micro-Catchment baseline questionnaire
Categor
y Uni
t Dat
a Source
of Data
Micro-Catchment Level Information
No of villages Number
Part of city included in the micro-catchment Area
Ecosystems/ Biodiversity
Area under green cover Sq km
Types of ecosystems available (wetlands, riverine, forest etc) Number / area
Provisioning Services from water resources in the region
Food: such as support to agro-ecosystems, freshwater systems, forests ( Wild foods from forests )
Yes/No
Raw Materials: such as wood, biofuels and plant oils that are directly derived from wild and cultivated plant species
Yes/No
Fresh Water for drinking purposes Yes/No
Medicinal Resources: plants used as traditional medicines or raw materials for the pharmaceutical industry
Yes/No
Regulating Services from water resources in the region Yes/No
Local Climate and Air Quality: temperature control, precipitation
Yes/No
Carbon Sequestration and Storage: through water resources
or trees
Yes/No
Moderation of extreme events such as through wetlands, mangroves, trees
Yes/No
Waste-water treatment Yes/No
Erosion prevention and maintenance of soil fertility Yes/No
Pollination Yes/No
Habitat or supporting services from water resources in the
region
Habitat for fishes or birds that are important locally or as support to ecosystems
Yes/No
Maintenance of genetic diversity through support to habitats of varied species
Yes/No
Cultural Services from water resources in the region
Recreation and mental and physical health Yes/No
Tourism/economy Yes/No
Aesthetic or spiritual benefits Yes/No
Agricultural resources
Total area of agricultural land Sq km
Regional crop seasons Months
Primary crop Names
Secondary crop Names
Contribution to local economy, if possible Percentage of total GDP
Contribution to local food requirement, if possible Percentage

Water resources for the micro-catchment
Number of water bodies Number, sq km
Major source of water supply (village wise) List
Classification of water bodies (ponds, lakes, rivers) Number, sq km, list
Depth of ground water table (village wise) Metres, list
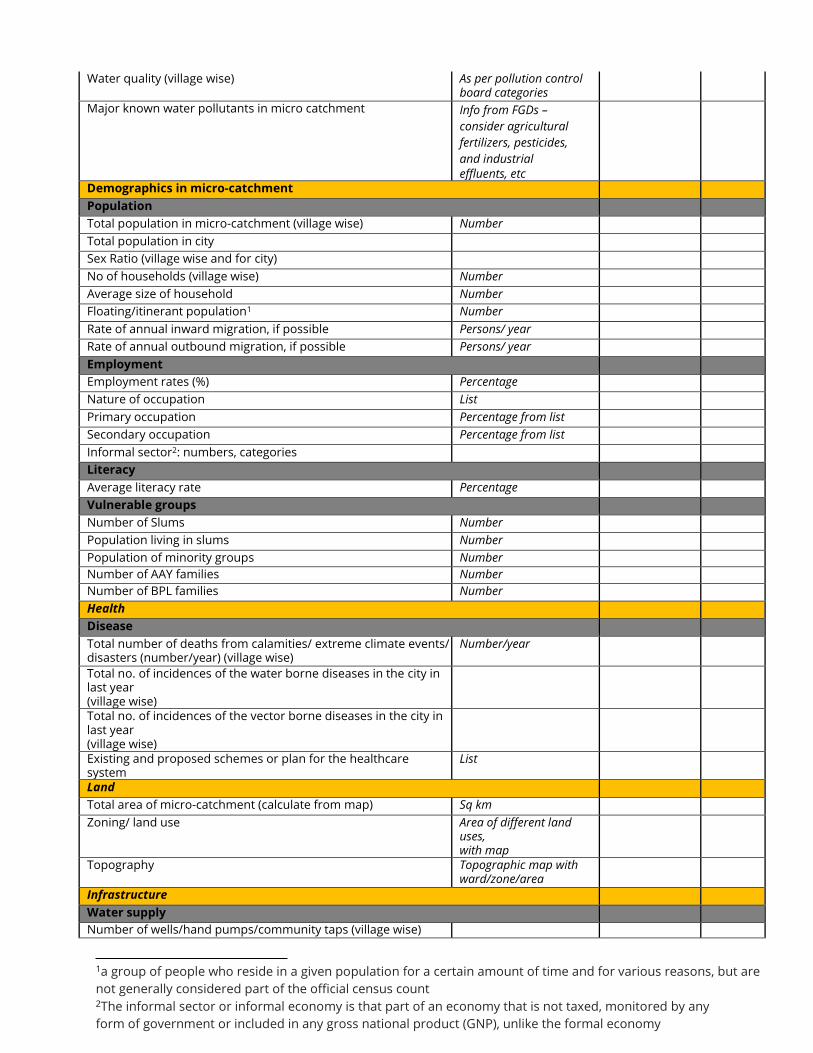
Water quality (village wise) As per pollution control board categories
Major known water pollutants in micro catchment Info from FGDs –
consider agricultural
fertilizers, pesticides,
and industrial effluents, etc
Demographics in micro-catchment
Population
Total population in micro-catchment (village wise) Number
Total population in city
Sex Ratio (village wise and for city)
No of households (village wise) Number
Average size of household Number
Floating/itinerant population1 Number
Rate of annual inward migration, if possible Persons/ year
Rate of annual outbound migration, if possible Persons/ year
Employment
Employment rates (%) Percentage
Nature of occupation List
Primary occupation Percentage from list
Secondary occupation Percentage from list
Informal sector2: numbers, categories
Literacy
Average literacy rate Percentage
Vulnerable groups
Number of Slums Number
Population living in slums Number
Population of minority groups Number
Number of AAY families Number
Number of BPL families Number
Health
Disease
Total number of deaths from calamities/ extreme climate events/ disasters (number/year) (village wise)
Number/year
Total no. of incidences of the water borne diseases in the city in last year (village wise)
Total no. of incidences of the vector borne diseases in the city in last year (village wise)
Existing and proposed schemes or plan for the healthcare system
List
Land
Total area of micro-catchment (calculate from map) Sq km
Zoning/ land use Area of different land uses, with map
Topography Topographic map with ward/zone/area
Infrastructure
Water supply
Number of wells/hand pumps/community taps (village wise)
1a group of people who reside in a given population for a certain amount of time and for various reasons, but are
not generally considered part of the official census count 2The informal sector or informal economy is that part of an economy that is not taxed, monitored by any
form of government or included in any gross national product (GNP), unlike the formal economy
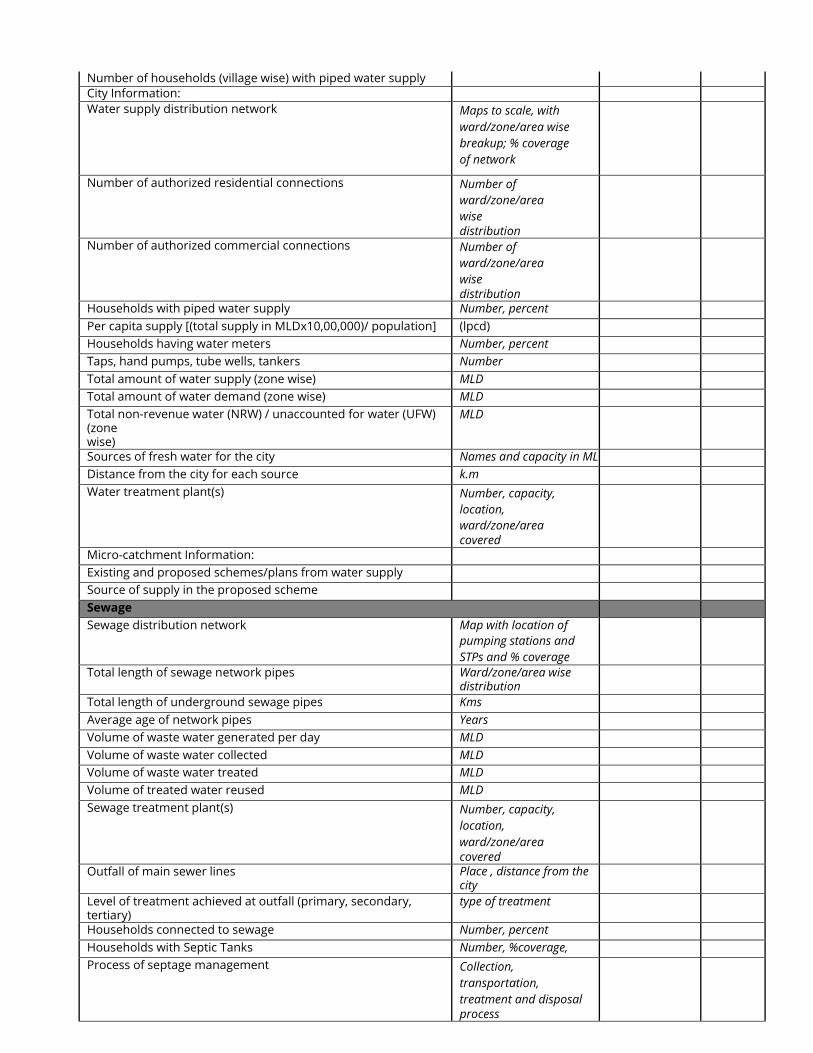
Number of households (village wise) with piped water supply
City Information:
Water supply distribution network Maps to scale, with
ward/zone/area wise
breakup; % coverage
of network
Number of authorized residential connections Number of
ward/zone/area
wise distribution
Number of authorized commercial connections Number of
ward/zone/area
wise distribution
Households with piped water supply Number, percent
Per capita supply [(total supply in MLDx10,00,000)/ population] (lpcd)
Households having water meters Number, percent
Taps, hand pumps, tube wells, tankers Number
Total amount of water supply (zone wise) MLD
Total amount of water demand (zone wise) MLD
Total non-revenue water (NRW) / unaccounted for water (UFW) (zone wise)
MLD
Sources of fresh water for the city Names and capacity in ML
Distance from the city for each source k.m
Water treatment plant(s) Number, capacity,
location,
ward/zone/area covered
Micro-catchment Information:
Existing and proposed schemes/plans from water supply
Source of supply in the proposed scheme
Sewage
Sewage distribution network Map with location of
pumping stations and
STPs and % coverage
Total length of sewage network pipes Ward/zone/area wise distribution
Total length of underground sewage pipes Kms
Average age of network pipes Years
Volume of waste water generated per day MLD
Volume of waste water collected MLD
Volume of waste water treated MLD
Volume of treated water reused MLD
Sewage treatment plant(s) Number, capacity,
location,
ward/zone/area covered
Outfall of main sewer lines Place , distance from the city
Level of treatment achieved at outfall (primary, secondary, tertiary)
type of treatment
Households connected to sewage Number, percent
Households with Septic Tanks Number, %coverage,
Process of septage management Collection,
transportation,
treatment and disposal process

Coverage of pockets of urban poor by sewerage network and/or septic tank provision
Number, percent
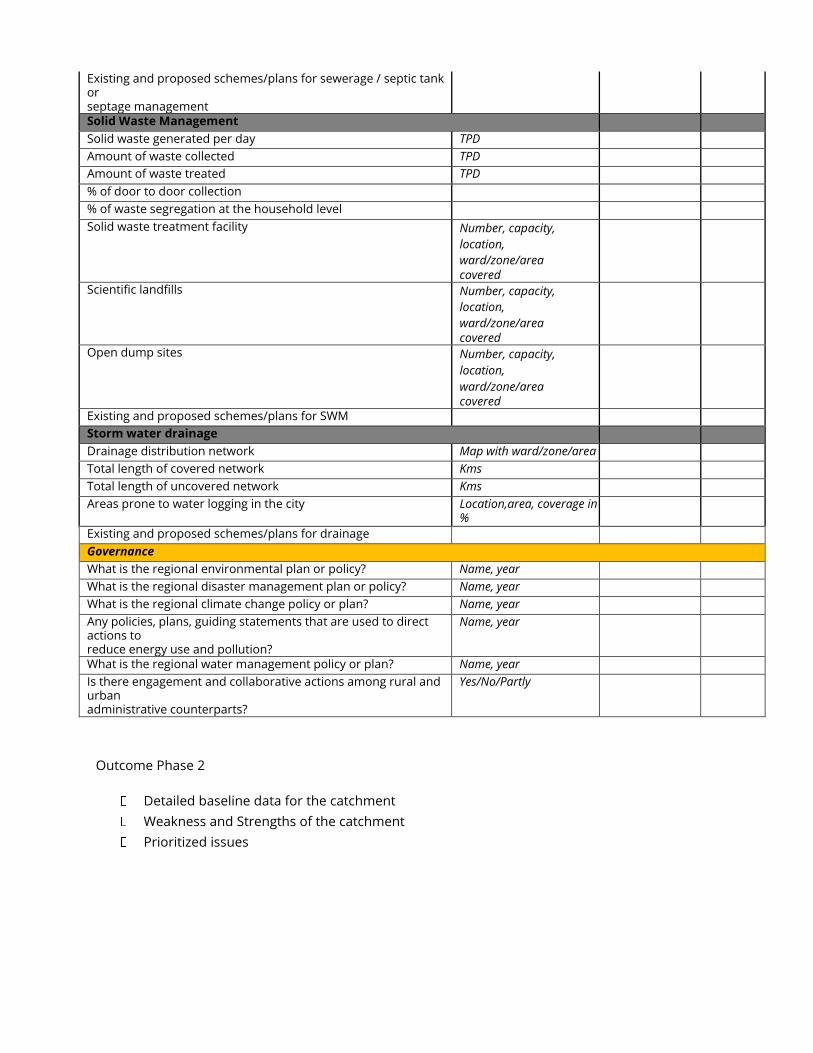
Existing and proposed schemes/plans for sewerage / septic tank or septage management
Solid Waste Management
Solid waste generated per day TPD
Amount of waste collected TPD
Amount of waste treated TPD
% of door to door collection
% of waste segregation at the household level
Solid waste treatment facility Number, capacity,
location,
ward/zone/area covered
Scientific landfills Number, capacity,
location,
ward/zone/area covered
Open dump sites Number, capacity,
location,
ward/zone/area covered
Existing and proposed schemes/plans for SWM
Storm water drainage
Drainage distribution network Map with ward/zone/area
Total length of covered network Kms
Total length of uncovered network Kms
Areas prone to water logging in the city Location,area, coverage in %
Existing and proposed schemes/plans for drainage
Governance
What is the regional environmental plan or policy? Name, year
What is the regional disaster management plan or policy? Name, year
What is the regional climate change policy or plan? Name, year
Any policies, plans, guiding statements that are used to direct actions to reduce energy use and pollution?
Name, year
What is the regional water management policy or plan? Name, year
Is there engagement and collaborative actions among rural and urban administrative counterparts?
Yes/No/Partly
Outcome Phase 2
Detailed baseline data for the catchment
Weakness and Strengths of the catchment
Prioritized issues
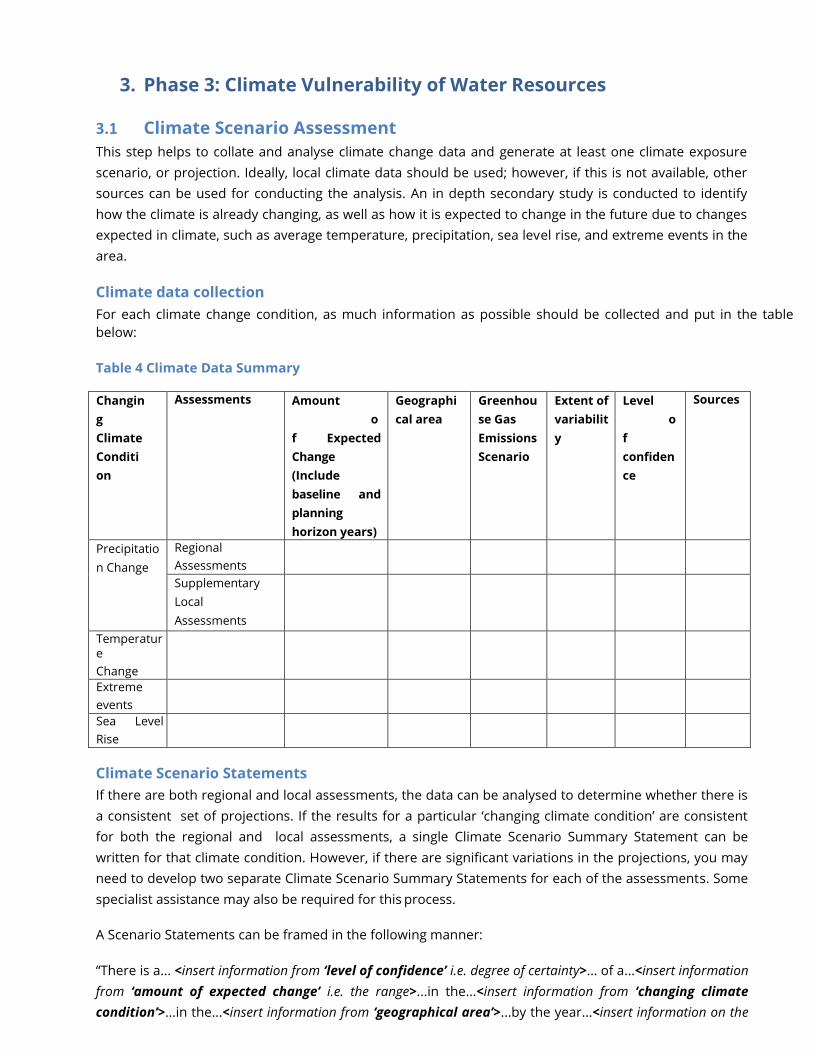
3. Phase 3: Climate Vulnerability of Water Resources
3.1 Climate Scenario Assessment
This step helps to collate and analyse climate change data and generate at least one climate exposure
scenario, or projection. Ideally, local climate data should be used; however, if this is not available, other
sources can be used for conducting the analysis. An in depth secondary study is conducted to identify
how the climate is already changing, as well as how it is expected to change in the future due to changes
expected in climate, such as average temperature, precipitation, sea level rise, and extreme events in the
area.
Climate data collection
For each climate change condition, as much information as possible should be collected and put in the table
below:
Table 4 Climate Data Summary
Changin
g
Climate
Conditi
on
Assessments Amount
o
f Expected
Change
(Include
baseline and
planning
horizon years)
Geographi
cal area
Greenhou
se Gas
Emissions
Scenario
Extent of
variabilit
y
Level
o
f
confiden
ce
Sources
Precipitatio
n Change
Regional
Assessments
Supplementary
Local
Assessments
Temperature
Change
Extreme
events
Sea Level
Rise
Climate Scenario Statements
If there are both regional and local assessments, the data can be analysed to determine whether there is
a consistent set of projections. If the results for a particular ‘changing climate condition’ are consistent
for both the regional and local assessments, a single Climate Scenario Summary Statement can be
written for that climate condition. However, if there are significant variations in the projections, you may
need to develop two separate Climate Scenario Summary Statements for each of the assessments. Some
specialist assistance may also be required for this process.
A Scenario Statements can be framed in the following manner:
“There is a... <insert information from ‘level of confidence’ i.e. degree of certainty>... of a...<insert information
from ‘amount of expected change’ i.e. the range>...in the...<insert information from ‘changing climate
condition’>...in the...<insert information from ‘geographical area’>...by the year...<insert information on the
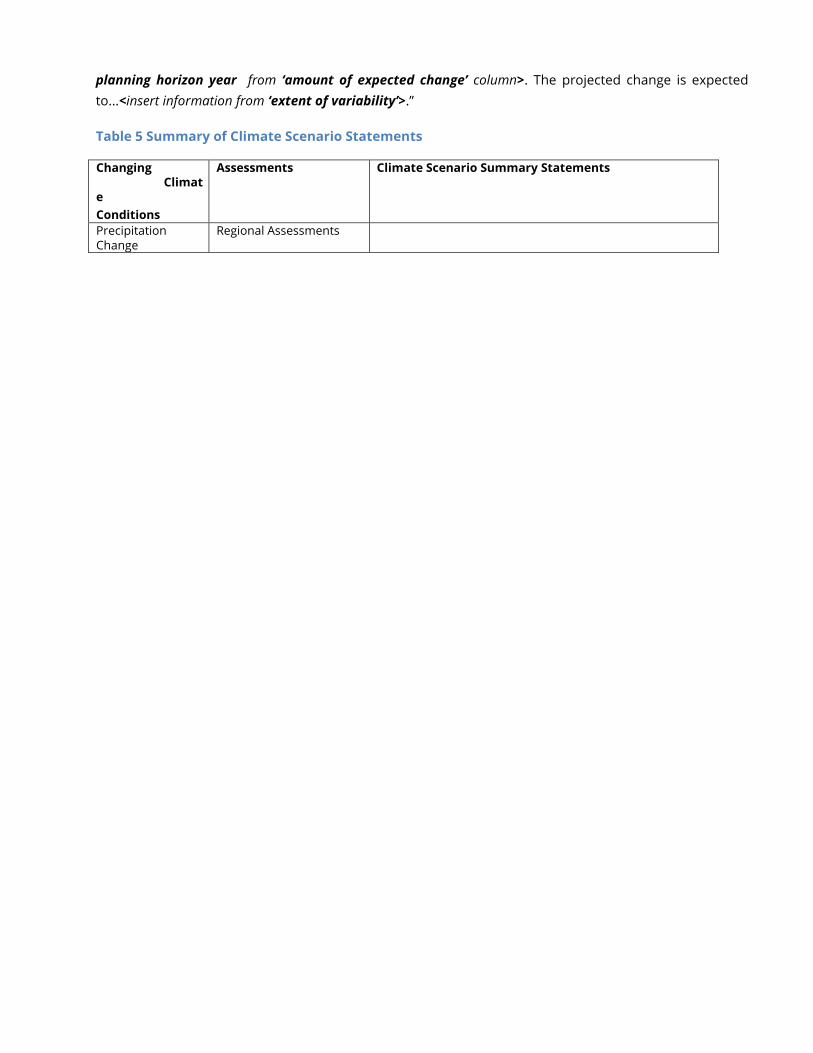
planning horizon year from ‘amount of expected change’ column>. The projected change is expected
to...<insert information from ‘extent of variability’>.”
Table 5 Summary of Climate Scenario Statements
Changing Climate
Conditions
Assessments Climate Scenario Summary Statements
Precipitation Change
Regional Assessments
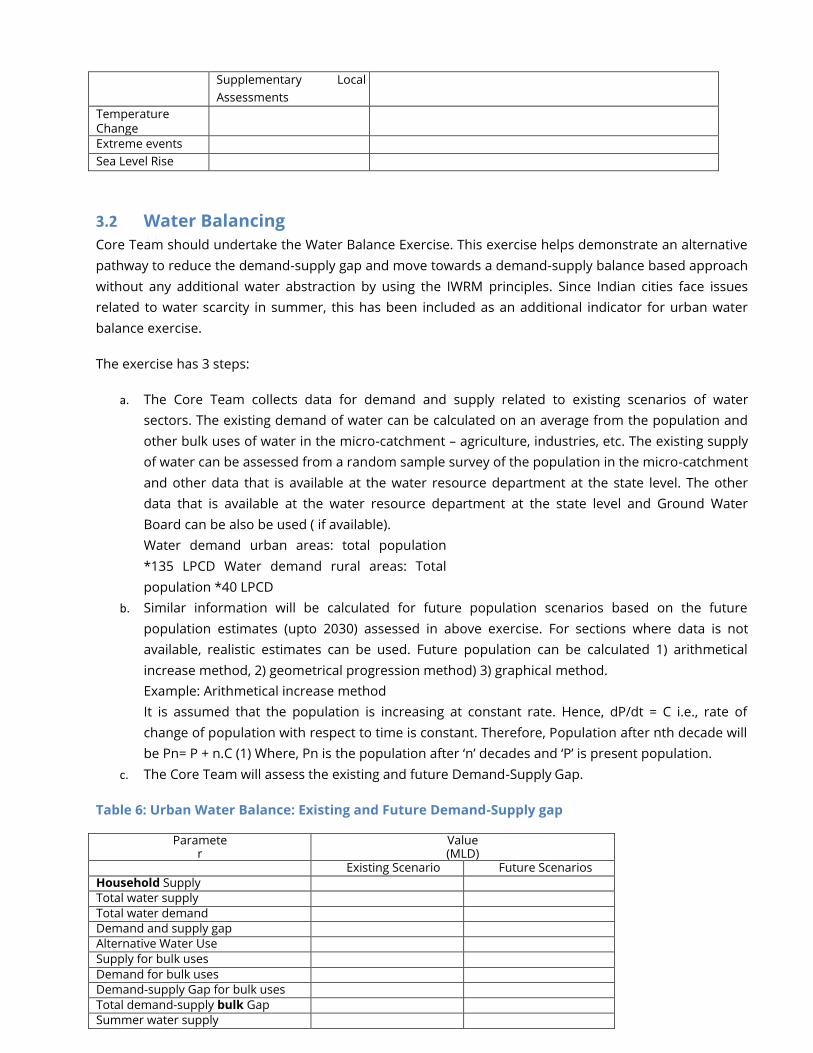
Supplementary Local
Assessments
Temperature Change
Extreme events
Sea Level Rise
3.2 Water Balancing
Core Team should undertake the Water Balance Exercise. This exercise helps demonstrate an alternative
pathway to reduce the demand-supply gap and move towards a demand-supply balance based approach
without any additional water abstraction by using the IWRM principles. Since Indian cities face issues
related to water scarcity in summer, this has been included as an additional indicator for urban water
balance exercise.
The exercise has 3 steps:
a. The Core Team collects data for demand and supply related to existing scenarios of water
sectors. The existing demand of water can be calculated on an average from the population and
other bulk uses of water in the micro-catchment – agriculture, industries, etc. The existing supply
of water can be assessed from a random sample survey of the population in the micro-catchment
and other data that is available at the water resource department at the state level. The other
data that is available at the water resource department at the state level and Ground Water
Board can be also be used ( if available).
Water demand urban areas: total population
*135 LPCD Water demand rural areas: Total
population *40 LPCD
b. Similar information will be calculated for future population scenarios based on the future
population estimates (upto 2030) assessed in above exercise. For sections where data is not
available, realistic estimates can be used. Future population can be calculated 1) arithmetical
increase method, 2) geometrical progression method) 3) graphical method.
Example: Arithmetical increase method
It is assumed that the population is increasing at constant rate. Hence, dP/dt = C i.e., rate of
change of population with respect to time is constant. Therefore, Population after nth decade will
be Pn= P + n.C (1) Where, Pn is the population after ‘n’ decades and ‘P’ is present population.
c. The Core Team will assess the existing and future Demand-Supply Gap.
Table 6: Urban Water Balance: Existing and Future Demand-Supply gap
Parameter
Value (MLD)
Existing Scenario Future Scenarios
Household Supply
Total water supply
Total water demand
Demand and supply gap
Alternative Water Use
Supply for bulk uses
Demand for bulk uses
Demand-supply Gap for bulk uses
Total demand-supply bulk Gap
Summer water supply

Summer water demand
Summer: demand-supply Gap
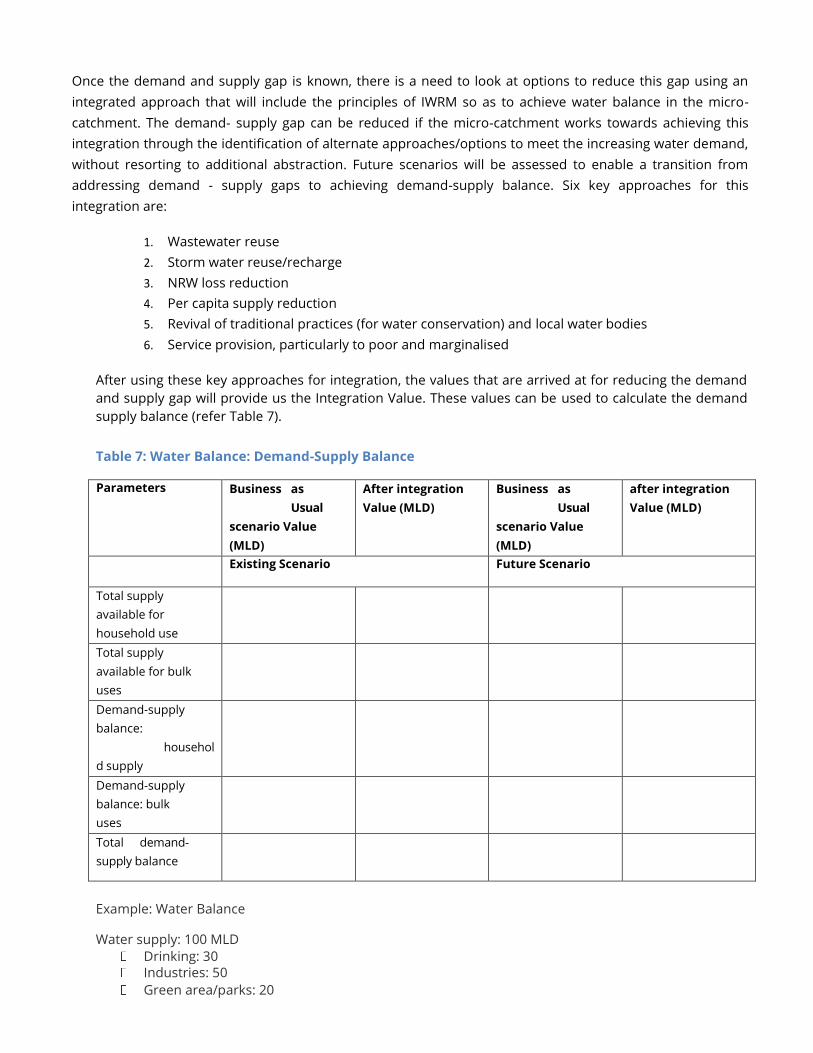
Once the demand and supply gap is known, there is a need to look at options to reduce this gap using an
integrated approach that will include the principles of IWRM so as to achieve water balance in the micro-
catchment. The demand- supply gap can be reduced if the micro-catchment works towards achieving this
integration through the identification of alternate approaches/options to meet the increasing water demand,
without resorting to additional abstraction. Future scenarios will be assessed to enable a transition from
addressing demand - supply gaps to achieving demand-supply balance. Six key approaches for this
integration are:
1. Wastewater reuse
2. Storm water reuse/recharge
3. NRW loss reduction
4. Per capita supply reduction
5. Revival of traditional practices (for water conservation) and local water bodies
6. Service provision, particularly to poor and marginalised
After using these key approaches for integration, the values that are arrived at for reducing the demand
and supply gap will provide us the Integration Value. These values can be used to calculate the demand
supply balance (refer Table 7).
Table 7: Water Balance: Demand-Supply Balance
Parameters Business as
Usual
scenario Value
(MLD)
After integration
Value (MLD)
Business as
Usual
scenario Value
(MLD)
after integration
Value (MLD)
Existing Scenario Future Scenario
Total supply
available for
household use
Total supply
available for bulk
uses
Demand-supply
balance:
househol
d supply
Demand-supply
balance: bulk
uses
Total demand-
supply balance
Example: Water Balance
Water supply: 100 MLD
Drinking: 30 Industries: 50
Green area/parks: 20

Water demand: 150 MLD
Water supply demand GAP: 50 MLD
Integration solution
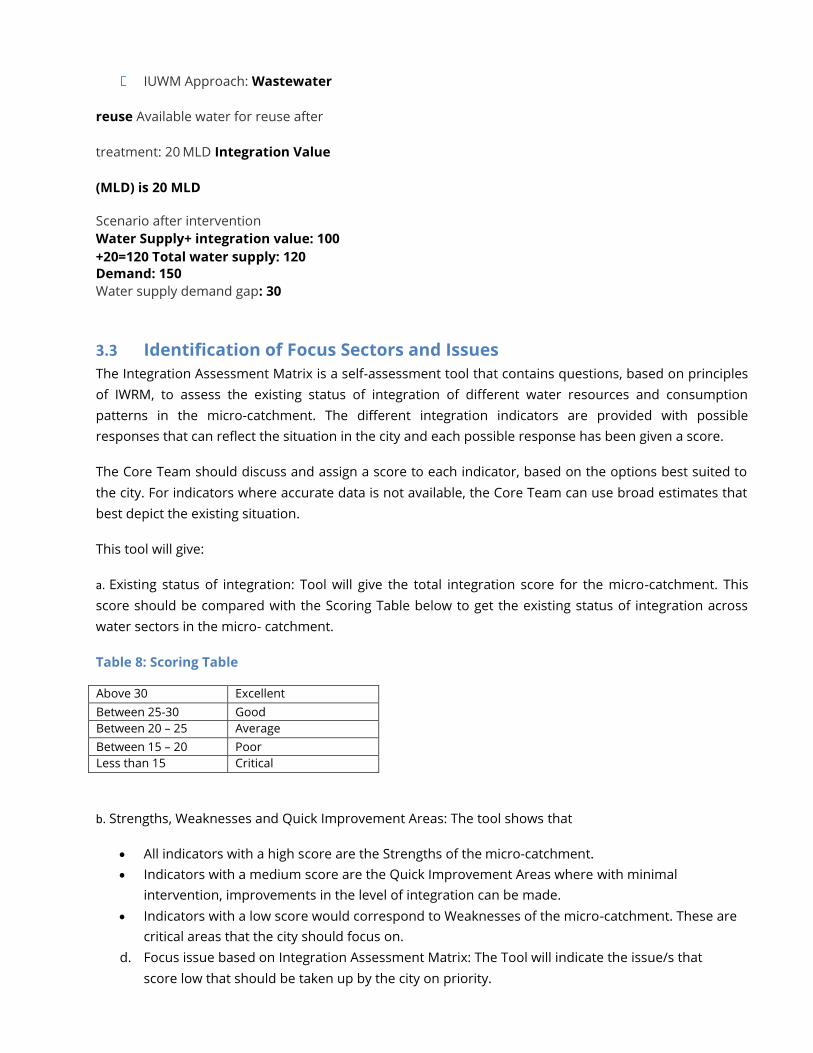
IUWM Approach: Wastewater
reuse Available water for reuse after
treatment: 20 MLD Integration Value
(MLD) is 20 MLD
Scenario after intervention
Water Supply+ integration value: 100
+20=120 Total water supply: 120
Demand: 150
Water supply demand gap: 30
3.3 Identification of Focus Sectors and Issues
The Integration Assessment Matrix is a self-assessment tool that contains questions, based on principles
of IWRM, to assess the existing status of integration of different water resources and consumption
patterns in the micro-catchment. The different integration indicators are provided with possible
responses that can reflect the situation in the city and each possible response has been given a score.
The Core Team should discuss and assign a score to each indicator, based on the options best suited to
the city. For indicators where accurate data is not available, the Core Team can use broad estimates that
best depict the existing situation.
This tool will give:
a. Existing status of integration: Tool will give the total integration score for the micro-catchment. This
score should be compared with the Scoring Table below to get the existing status of integration across
water sectors in the micro- catchment.
Table 8: Scoring Table
Above 30 Excellent
Between 25-30 Good
Between 20 – 25 Average
Between 15 – 20 Poor
Less than 15 Critical
b. Strengths, Weaknesses and Quick Improvement Areas: The tool shows that
• All indicators with a high score are the Strengths of the micro-catchment.
• Indicators with a medium score are the Quick Improvement Areas where with minimal
intervention, improvements in the level of integration can be made.
• Indicators with a low score would correspond to Weaknesses of the micro-catchment. These are
critical areas that the city should focus on.
d. Focus issue based on Integration Assessment Matrix: The Tool will indicate the issue/s that
score low that should be taken up by the city on priority.
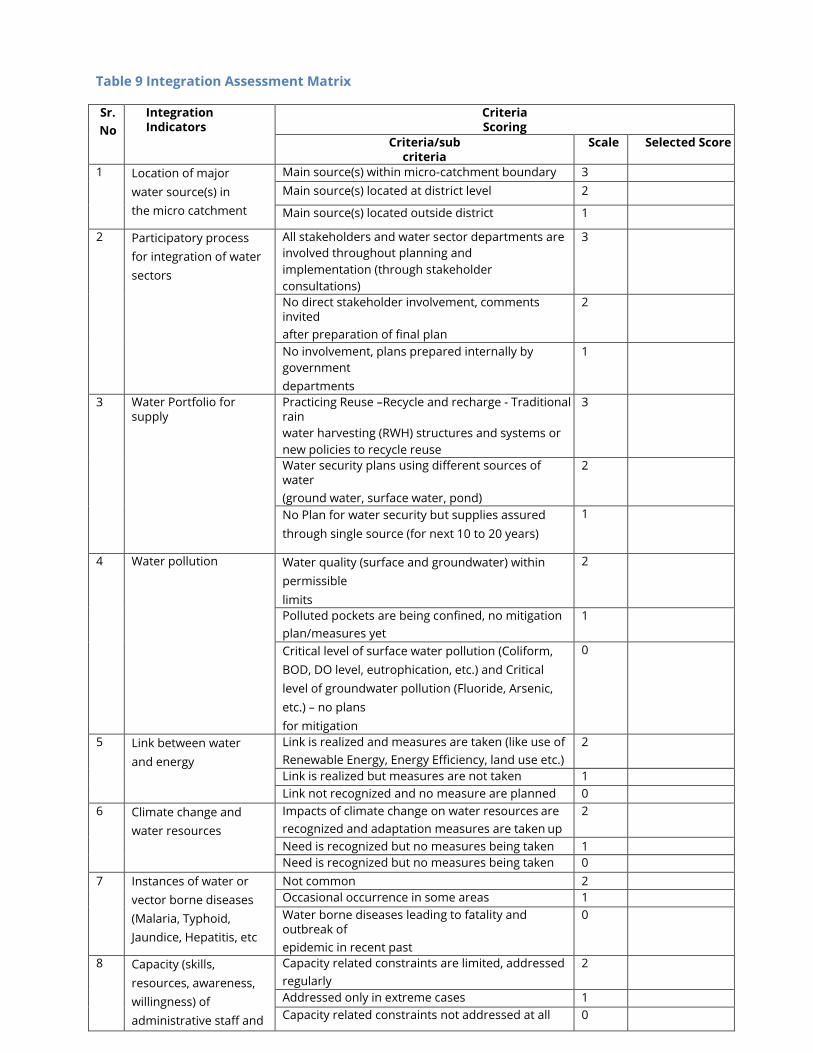
Table 9 Integration Assessment Matrix
Sr.
No
Integration Indicators
Criteria Scoring
Criteria/sub criteria
Scale Selected Score
1 Location of major
water source(s) in
the micro catchment
Main source(s) within micro-catchment boundary 3
Main source(s) located at district level 2
Main source(s) located outside district 1
2 Participatory process
for integration of water
sectors
All stakeholders and water sector departments are
involved throughout planning and
implementation (through stakeholder
consultations)
3
No direct stakeholder involvement, comments invited
after preparation of final plan
2
No involvement, plans prepared internally by
government
departments
1
3 Water Portfolio for supply
Practicing Reuse –Recycle and recharge - Traditional rain
water harvesting (RWH) structures and systems or
new policies to recycle reuse
3
Water security plans using different sources of water
(ground water, surface water, pond)
2
No Plan for water security but supplies assured
through single source (for next 10 to 20 years)
1
4 Water pollution Water quality (surface and groundwater) within
permissible
limits
2
Polluted pockets are being confined, no mitigation
plan/measures yet
1
Critical level of surface water pollution (Coliform,
BOD, DO level, eutrophication, etc.) and Critical
level of groundwater pollution (Fluoride, Arsenic,
etc.) – no plans
for mitigation
0
5 Link between water
and energy
Link is realized and measures are taken (like use of
Renewable Energy, Energy Efficiency, land use etc.)
2
Link is realized but measures are not taken 1
Link not recognized and no measure are planned 0
6 Climate change and
water resources
Impacts of climate change on water resources are
recognized and adaptation measures are taken up
2
Need is recognized but no measures being taken 1
Need is recognized but no measures being taken 0
7 Instances of water or
vector borne diseases
(Malaria, Typhoid,
Jaundice, Hepatitis, etc
Not common 2
Occasional occurrence in some areas 1
Water borne diseases leading to fatality and outbreak of
epidemic in recent past
0
8 Capacity (skills,
resources, awareness,
willingness) of
administrative staff and
Capacity related constraints are limited, addressed
regularly
2
Addressed only in extreme cases 1
Capacity related constraints not addressed at all 0

other stakeholders
9 SWM Segregated waste collection, treatment and disposal
available; no impact on water quality or drainage
3
Simple collection without segregation, treatment
and
disposal available; low impact on water quality or
2
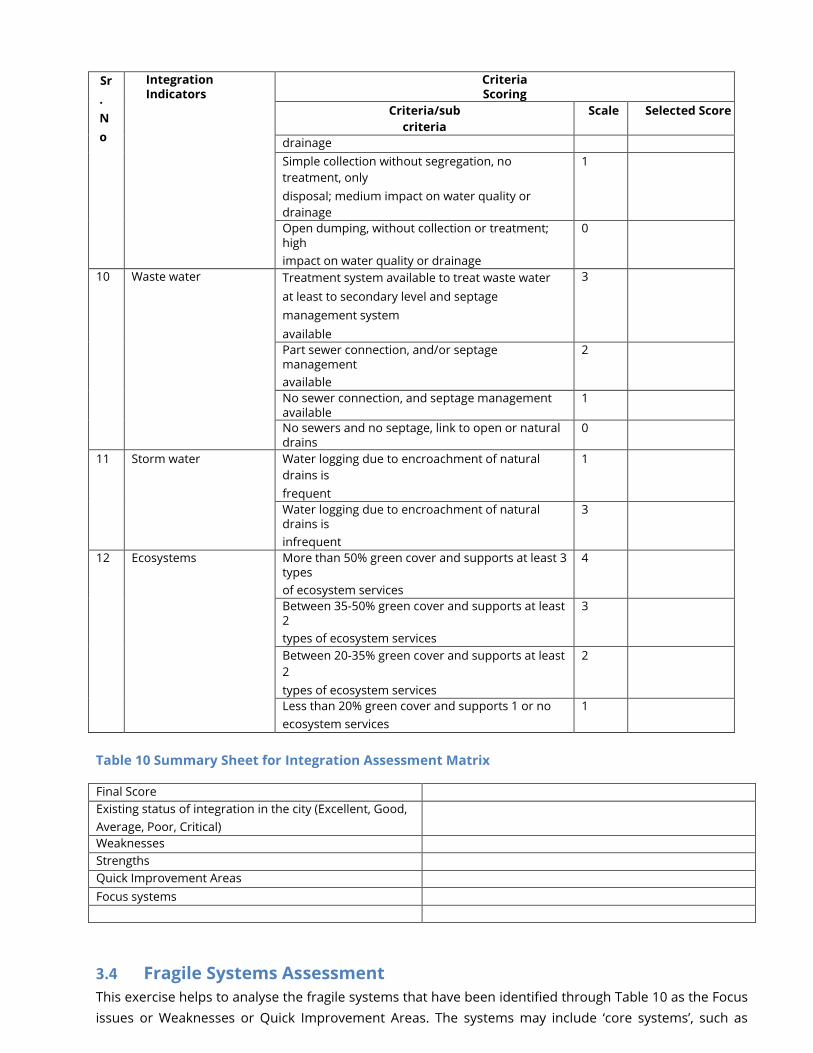
Sr
.
N
o
Integration Indicators
Criteria Scoring
Criteria/sub
criteria
Scale Selected Score
drainage
Simple collection without segregation, no
treatment, only
disposal; medium impact on water quality or
drainage
1
Open dumping, without collection or treatment; high
impact on water quality or drainage
0
10 Waste water Treatment system available to treat waste water
at least to secondary level and septage
management system
available
3
Part sewer connection, and/or septage management
available
2
No sewer connection, and septage management available
1
No sewers and no septage, link to open or natural drains
0
11 Storm water Water logging due to encroachment of natural
drains is
frequent
1
Water logging due to encroachment of natural drains is
infrequent
3
12 Ecosystems More than 50% green cover and supports at least 3 types
of ecosystem services
4
Between 35-50% green cover and supports at least 2
types of ecosystem services
3
Between 20-35% green cover and supports at least
2
types of ecosystem services
2
Less than 20% green cover and supports 1 or no
ecosystem services
1
Table 10 Summary Sheet for Integration Assessment Matrix
Final Score
Existing status of integration in the city (Excellent, Good,
Average, Poor, Critical)
Weaknesses
Strengths
Quick Improvement Areas
Focus systems
3.4 Fragile Systems Assessment
This exercise helps to analyse the fragile systems that have been identified through Table 10 as the Focus
issues or Weaknesses or Quick Improvement Areas. The systems may include ‘core systems’, such as

water and food, essential for the survival, and ‘secondary systems’ such as education and social services,
which rely on the core services. The step helps to do the following:
1. Analysis of “fragile systems” i.e. the systems or services which are already weak or under great
pressure, by looking at them through a water lens.
2. Assessment of the impact of climate change on these fragile systems.

The tool analyses the causes of the fragility in terms of the characteristics of resilient systems -
flexibility and diversity, redundancy and safe failure. This information can be obtained largely from the
baseline questionnaire that collects information on these systems.
Flexibility and diversity - mix of multiple options, key assets and functions are distributed or
decentralised, not all affected by a single event
Example: A network of hospitals rather than a single, central hospital
Redundancy - alternatives / back-up systems / contingency plans, capacity for contingency situations,
multiple pathways and options for service delivery in case one or several options fail
Example: Hospitals and emergency communications facilities have shared or linked backup
electrical generators
Safe failure – ability to absorb sudden shocks or slow onset stress so as to avoid catastrophic failure
Example: Dikes are designed so that if their capacity is exceeded, they fail in predictable ways, channelling
flooding away from populated areas
The systems are also analysed in terms of the impacts of this fragility on other systems and services and
the overall responsibility of these systems. The information is then collated to formulate a Fragility
Statement for the System as shown in table below.
Table 11: Analyse Fragile Urban Systems based on information from baseline questionnaire
System Why is it critical or fragile? What are the existing and
anticipated problems caused
by the fragility of this system?
Responsibility Fragility Statement
Water Flexibility & Diversity: Disruption of water supply to Shared with the The water supply
Supply Traditional water sources have
been
citizens Irrigation & Public system in the city
lost due to the urbanisation
process
• Additional financial burden
on
Health
Department
is old and largely
and the city depends on centralized
individual households to dependent
pumping systems that transport water
purchase water from water on transporting
from significant distances to the
city.
tankers water over large
Supply cannot meet the growing • Water shortage adversely distances,
demand impacts the tourism industry whereby even
Redundancy: Alternatives usually • Increased pollution and minor
disruptions
include water supplied by tankers emissions from the plying of cause significant
(trucks). Given the mountainous water tankers shortages in the
region this limits access of these city in the face of
trucks in addition to them being
an
an ever growing
expensive and polluting fallback demand;
option alternatives are
Safe failure: in case of a disruption
in
not cost effective
water supply, individual or sustainable

households
have to fend for themselves. One of
the systems is over a 100 years old
To assess the impacts of climate change on the fragile systems identified in the table above, we have to
develop a Climate Fragility Statement for each fragile system, considering the climate scenario
summaries and the possible impacts of these climatic changes on the fragile systems.
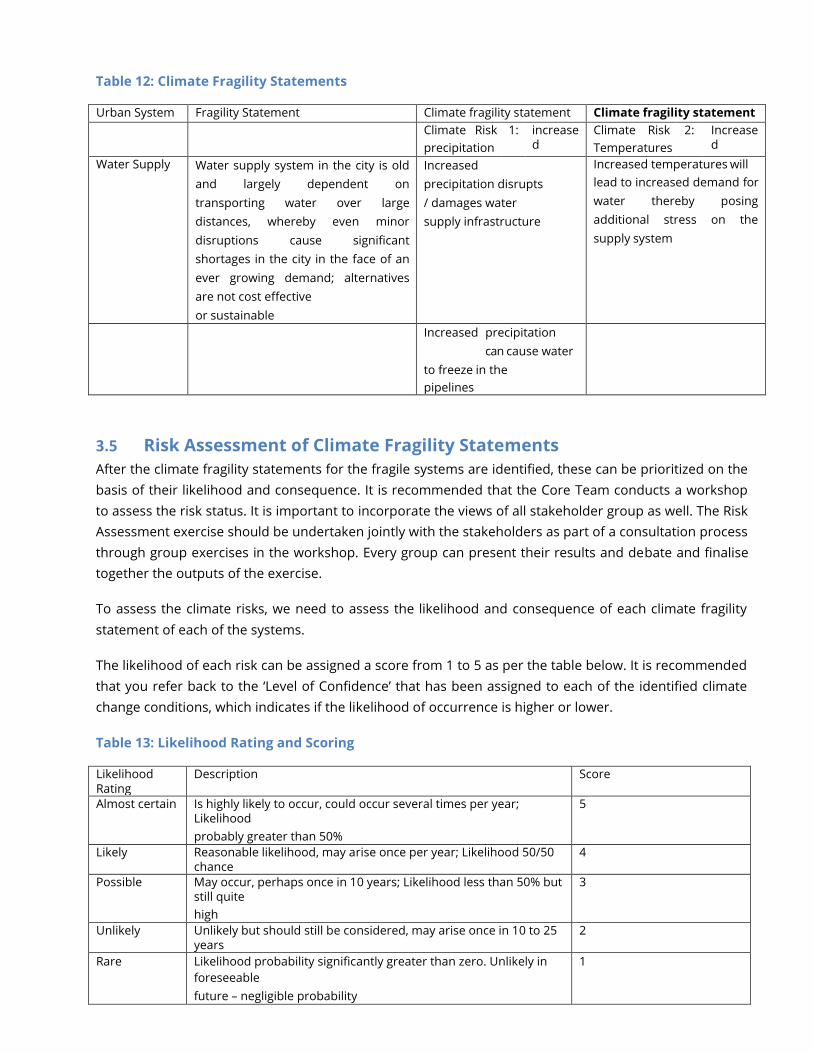
Table 12: Climate Fragility Statements
Urban System Fragility Statement Climate fragility statement Climate fragility statement
Climate Risk
precipitation
1: increased
Climate Risk
Temperatures
2: Increased
Water Supply Water supply system in the city is old
and largely dependent on
transporting water over large
distances, whereby even minor
disruptions cause significant
shortages in the city in the face of an
ever growing demand; alternatives
are not cost effective
or sustainable
Increased
precipitation disrupts
/ damages water
supply infrastructure
Increased temperatures will
lead to increased demand for
water thereby posing
additional stress on the
supply system
Increased precipitation
can cause water
to freeze in the
pipelines
3.5 Risk Assessment of Climate Fragility Statements
After the climate fragility statements for the fragile systems are identified, these can be prioritized on the
basis of their likelihood and consequence. It is recommended that the Core Team conducts a workshop
to assess the risk status. It is important to incorporate the views of all stakeholder group as well. The Risk
Assessment exercise should be undertaken jointly with the stakeholders as part of a consultation process
through group exercises in the workshop. Every group can present their results and debate and finalise
together the outputs of the exercise.
To assess the climate risks, we need to assess the likelihood and consequence of each climate fragility
statement of each of the systems.
The likelihood of each risk can be assigned a score from 1 to 5 as per the table below. It is recommended
that you refer back to the ‘Level of Confidence’ that has been assigned to each of the identified climate
change conditions, which indicates if the likelihood of occurrence is higher or lower.
Table 13: Likelihood Rating and Scoring
Likelihood Rating
Description Score
Almost certain Is highly likely to occur, could occur several times per year; Likelihood
probably greater than 50%
5
Likely Reasonable likelihood, may arise once per year; Likelihood 50/50 chance
4
Possible May occur, perhaps once in 10 years; Likelihood less than 50% but still quite
high
3
Unlikely Unlikely but should still be considered, may arise once in 10 to 25 years
2
Rare Likelihood probability significantly greater than zero. Unlikely in
foreseeable
future – negligible probability
1
Next, for each climate risk, assess the consequence, or impact, if the risk does occur. Consequences can
be assigned a score from 1 to 5, where 5 is Catastrophic and 1 is Insignificant. Table below shows how to
assess the different consequence rating, using “Impact on the System” and “Impact on the City
Government” as measures. It is necessary to consider the impacts on both, the system as well as the
poor and vulnerable, while deciding on the Consequence ratings.
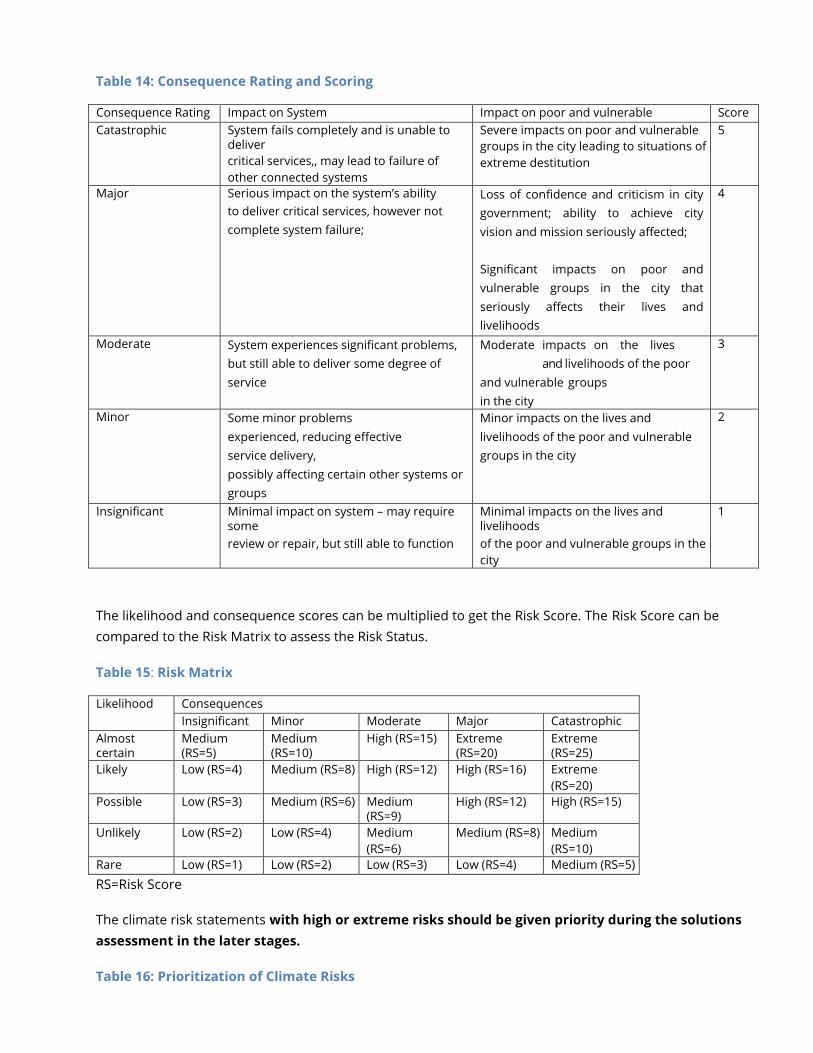
Table 14: Consequence Rating and Scoring
Consequence Rating Impact on System Impact on poor and vulnerable Score
Catastrophic System fails completely and is unable to deliver
critical services,, may lead to failure of
other connected systems
Severe impacts on poor and vulnerable
groups in the city leading to situations of
extreme destitution
5
Major Serious impact on the system’s ability
to deliver critical services, however not
complete system failure;
Loss of confidence and criticism in city
government; ability to achieve city
vision and mission seriously affected;
Significant impacts on poor and
vulnerable groups in the city that
seriously affects their lives and
livelihoods
4
Moderate System experiences significant problems,
but still able to deliver some degree of
service
Moderate impacts on the lives
and livelihoods of the poor
and vulnerable groups
in the city
3
Minor Some minor problems
experienced, reducing effective
service delivery,
possibly affecting certain other systems or
groups
Minor impacts on the lives and
livelihoods of the poor and vulnerable
groups in the city
2
Insignificant Minimal impact on system – may require some
review or repair, but still able to function
Minimal impacts on the lives and livelihoods
of the poor and vulnerable groups in the
city
1
The likelihood and consequence scores can be multiplied to get the Risk Score. The Risk Score can be
compared to the Risk Matrix to assess the Risk Status.
Table 15: Risk Matrix
Likelihood Consequences
Insignificant Minor Moderate Major Catastrophic
Almost certain
Medium (RS=5)
Medium (RS=10)
High (RS=15) Extreme (RS=20)
Extreme (RS=25)
Likely Low (RS=4) Medium (RS=8) High (RS=12) High (RS=16) Extreme
(RS=20)
Possible Low (RS=3) Medium (RS=6) Medium (RS=9)
High (RS=12) High (RS=15)
Unlikely Low (RS=2) Low (RS=4) Medium
(RS=6)
Medium (RS=8) Medium
(RS=10)
Rare Low (RS=1) Low (RS=2) Low (RS=3) Low (RS=4) Medium (RS=5)
RS=Risk Score
The climate risk statements with high or extreme risks should be given priority during the solutions
assessment in the later stages.
Table 16: Prioritization of Climate Risks

Climate Risk Statements Likelihood Consequence Risk Score
(Likelihood X
Consequence)
Risk Status
Increased precipitation disrupts/
damages water supply
infrastructure
4 4 16 High
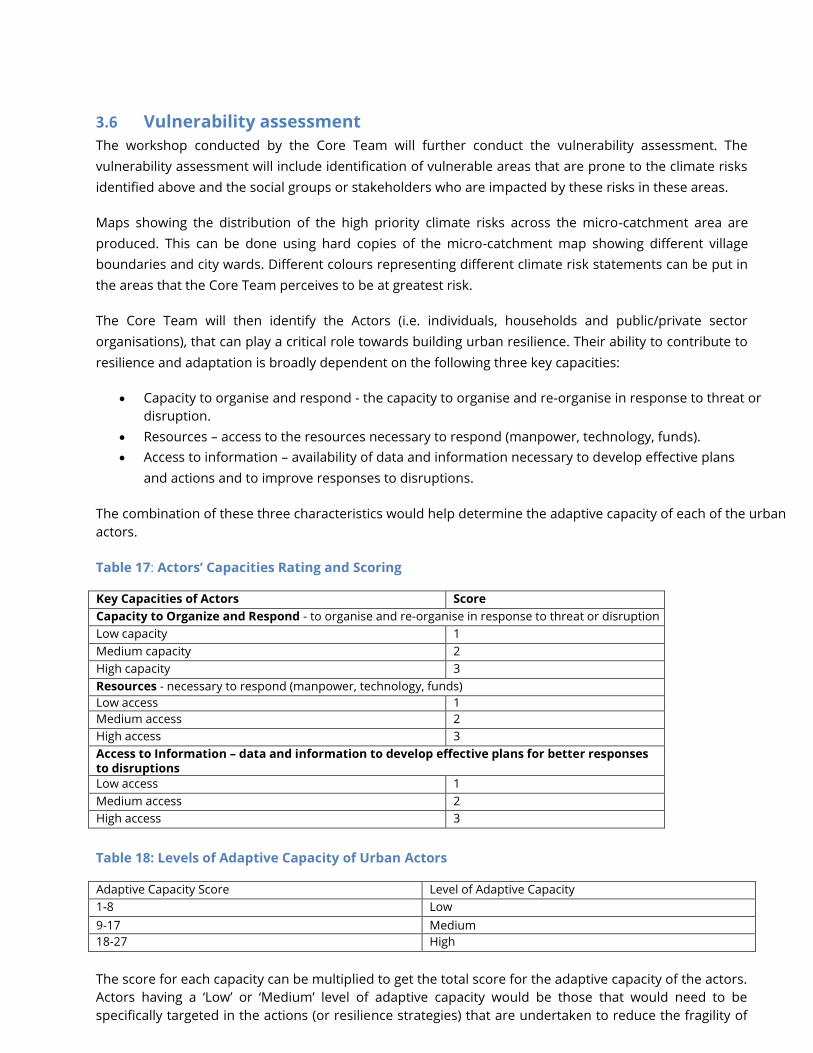
3.6 Vulnerability assessment
The workshop conducted by the Core Team will further conduct the vulnerability assessment. The
vulnerability assessment will include identification of vulnerable areas that are prone to the climate risks
identified above and the social groups or stakeholders who are impacted by these risks in these areas.
Maps showing the distribution of the high priority climate risks across the micro-catchment area are
produced. This can be done using hard copies of the micro-catchment map showing different village
boundaries and city wards. Different colours representing different climate risk statements can be put in
the areas that the Core Team perceives to be at greatest risk.
The Core Team will then identify the Actors (i.e. individuals, households and public/private sector
organisations), that can play a critical role towards building urban resilience. Their ability to contribute to
resilience and adaptation is broadly dependent on the following three key capacities:
• Capacity to organise and respond - the capacity to organise and re-organise in response to threat or
disruption.
• Resources – access to the resources necessary to respond (manpower, technology, funds).
• Access to information – availability of data and information necessary to develop effective plans
and actions and to improve responses to disruptions.
The combination of these three characteristics would help determine the adaptive capacity of each of the urban
actors.
Table 17: Actors’ Capacities Rating and Scoring
Key Capacities of Actors Score
Capacity to Organize and Respond - to organise and re-organise in response to threat or disruption
Low capacity 1
Medium capacity 2
High capacity 3
Resources - necessary to respond (manpower, technology, funds)
Low access 1
Medium access 2
High access 3
Access to Information – data and information to develop effective plans for better responses to disruptions
Low access 1
Medium access 2
High access 3
Table 18: Levels of Adaptive Capacity of Urban Actors
Adaptive Capacity Score Level of Adaptive Capacity
1-8 Low
9-17 Medium
18-27 High
The score for each capacity can be multiplied to get the total score for the adaptive capacity of the actors.
Actors having a ‘Low’ or ‘Medium’ level of adaptive capacity would be those that would need to be
specifically targeted in the actions (or resilience strategies) that are undertaken to reduce the fragility of

the identified fragile system. Actors with a ‘High’ level of adaptive capacity can be engaged in the
proposed actions as they have the capacity to effectively respond to the impacts of the fragile systems.
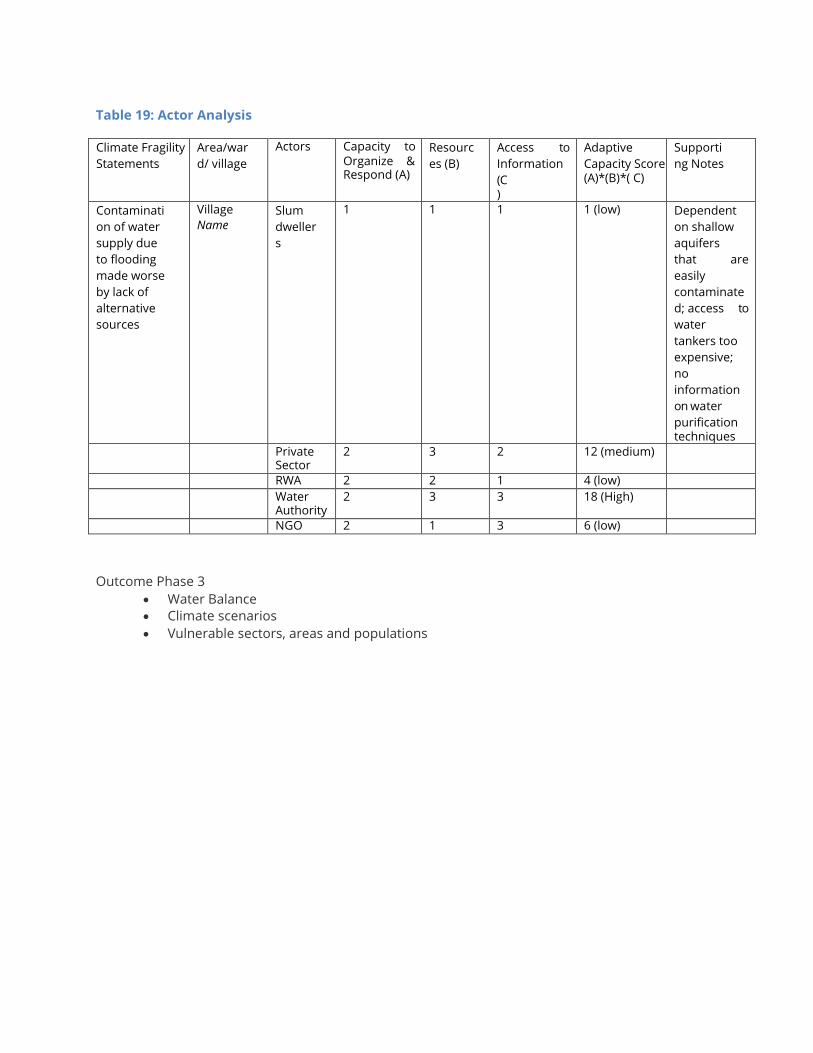
Table 19: Actor Analysis
Climate Fragility
Statements
Area/war
d/ village
Actors Capacity to Organize & Respond (A)
Resourc
es (B)
Access to
Information
(C )
Adaptive
Capacity Score (A)*(B)*( C)
Supporti
ng Notes
Contaminati
on of water
supply due
to flooding
made worse
by lack of
alternative
sources
Village
Name Slum
dweller
s
1 1 1 1 (low) Dependent
on shallow
aquifers
that are
easily
contaminate
d; access to
water
tankers too
expensive;
no
information
on water
purification techniques
Private Sector
2 3 2 12 (medium)
RWA 2 2 1 4 (low)
Water Authority
2 3 3 18 (High)
NGO 2 1 3 6 (low)
Outcome Phase 3
• Water Balance
• Climate scenarios
• Vulnerable sectors, areas and populations
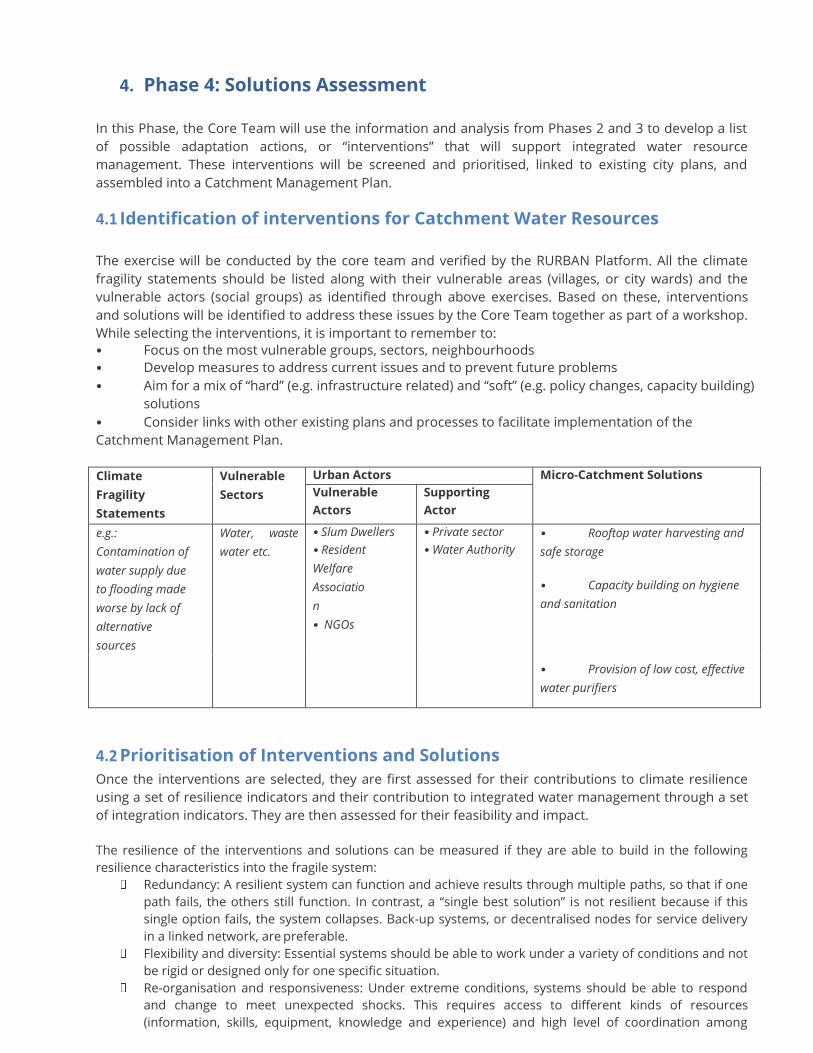
4. Phase 4: Solutions Assessment
In this Phase, the Core Team will use the information and analysis from Phases 2 and 3 to develop a list
of possible adaptation actions, or “interventions” that will support integrated water resource
management. These interventions will be screened and prioritised, linked to existing city plans, and
assembled into a Catchment Management Plan.
4.1 Identification of interventions for Catchment Water Resources
The exercise will be conducted by the core team and verified by the RURBAN Platform. All the climate
fragility statements should be listed along with their vulnerable areas (villages, or city wards) and the
vulnerable actors (social groups) as identified through above exercises. Based on these, interventions
and solutions will be identified to address these issues by the Core Team together as part of a workshop.
While selecting the interventions, it is important to remember to:
• Focus on the most vulnerable groups, sectors, neighbourhoods
• Develop measures to address current issues and to prevent future problems
• Aim for a mix of “hard” (e.g. infrastructure related) and “soft” (e.g. policy changes, capacity building)
solutions
• Consider links with other existing plans and processes to facilitate implementation of the
Catchment Management Plan.
Climate
Fragility
Statements
Vulnerable
Sectors
Urban Actors Micro-Catchment Solutions
Vulnerable
Actors
Supporting
Actor
e.g.:
Contamination of
water supply due
to flooding made
worse by lack of
alternative
sources
Water, waste
water etc.
• Slum Dwellers
• Resident
Welfare
Associatio
n
• NGOs
• Private sector
• Water Authority
• Rooftop water harvesting and
safe storage
• Capacity building on hygiene
and sanitation
• Provision of low cost, effective
water purifiers
4.2 Prioritisation of Interventions and Solutions
Once the interventions are selected, they are first assessed for their contributions to climate resilience
using a set of resilience indicators and their contribution to integrated water management through a set
of integration indicators. They are then assessed for their feasibility and impact.
The resilience of the interventions and solutions can be measured if they are able to build in the following
resilience characteristics into the fragile system:
Redundancy: A resilient system can function and achieve results through multiple paths, so that if one
path fails, the others still function. In contrast, a “single best solution” is not resilient because if this
single option fails, the system collapses. Back-up systems, or decentralised nodes for service delivery
in a linked network, are preferable.
Flexibility and diversity: Essential systems should be able to work under a variety of conditions and not
be rigid or designed only for one specific situation.
Re-organisation and responsiveness: Under extreme conditions, systems should be able to respond
and change to meet unexpected shocks. This requires access to different kinds of resources
(information, skills, equipment, knowledge and experience) and high level of coordination among

departments.
Access to information: Resilient systems have mechanisms to learn from and build on experience, so
that past mistakes are not repeated and lessons from other cities can be integrated into planning. This
requires procedures for monitoring and evaluating that can be shared among different departments.
The contribution of the interventions to the principles of IWRM are also assessed to analyse their priority
for the region. The primary concepts of IWRM are considered:

Consider all parts of the water cycle – whether the intervention helps to include different sources and
forms of water into the water resources for the region.
Consider various requirements for water – whether the intervention helps to assign different quality of
water for different uses.
Consider the local context – whether the intervention is locally relevant and addresses pertinent local issues
Considers requirement of various stakeholders – whether the intervention addresses requirements of
different stakeholders in the region.
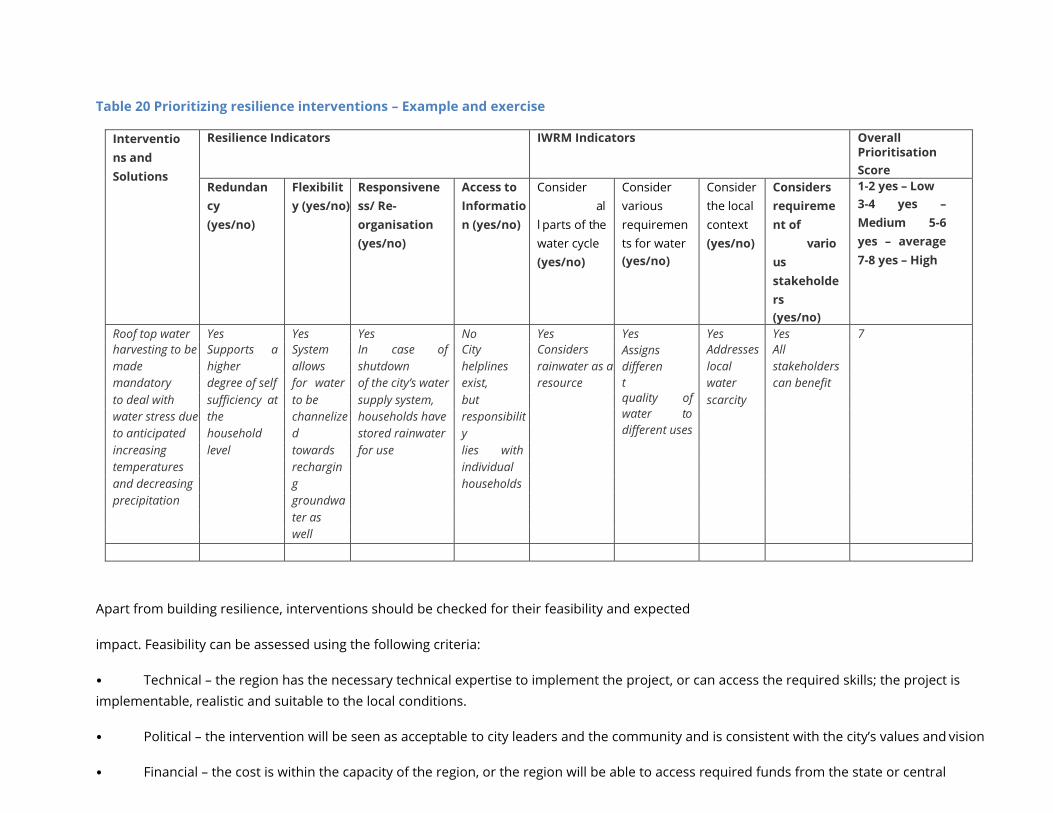
Table 20 Prioritizing resilience interventions – Example and exercise
Interventio
ns and
Solutions
Resilience Indicators IWRM Indicators Overall Prioritisation
Score
Redundan
cy
(yes/no)
Flexibilit
y (yes/no)
Responsivene
ss/ Re-
organisation
(yes/no)
Access to
Informatio
n (yes/no)
Consider
al
l parts of the
water cycle
(yes/no)
Consider
various
requiremen
ts for water
(yes/no)
Consider
the local
context
(yes/no)
Considers
requireme
nt of
vario
us
stakeholde
rs
(yes/no)
1-2 yes – Low
3-4 yes –
Medium 5-6
yes – average
7-8 yes – High
Roof top water Yes Yes Yes No Yes Yes
Assigns
differen
t
quality of
water to
different uses
Yes Yes 7
harvesting to be Supports a System In case of City Considers Addresses All
made higher allows shutdown helplines rainwater as a local stakeholders
mandatory degree of self for water of the city’s water exist, resource water can benefit
to deal with sufficiency at to be supply system, but scarcity
water stress due the channelize households have responsibilit
to anticipated household d stored rainwater y
increasing level towards for use lies with
temperatures rechargin individual
and decreasing g households
precipitation groundwa
ter as
well
Apart from building resilience, interventions should be checked for their feasibility and expected
impact. Feasibility can be assessed using the following criteria:
• Technical – the region has the necessary technical expertise to implement the project, or can access the required skills; the project is
implementable, realistic and suitable to the local conditions.
• Political – the intervention will be seen as acceptable to city leaders and the community and is consistent with the city’s values and vision
• Financial – the cost is within the capacity of the region, or the region will be able to access required funds from the state or central
government, and the anticipated benefits of the action will justify the cost; any low hanging fruits for early implementation
Impact can be assessed using:
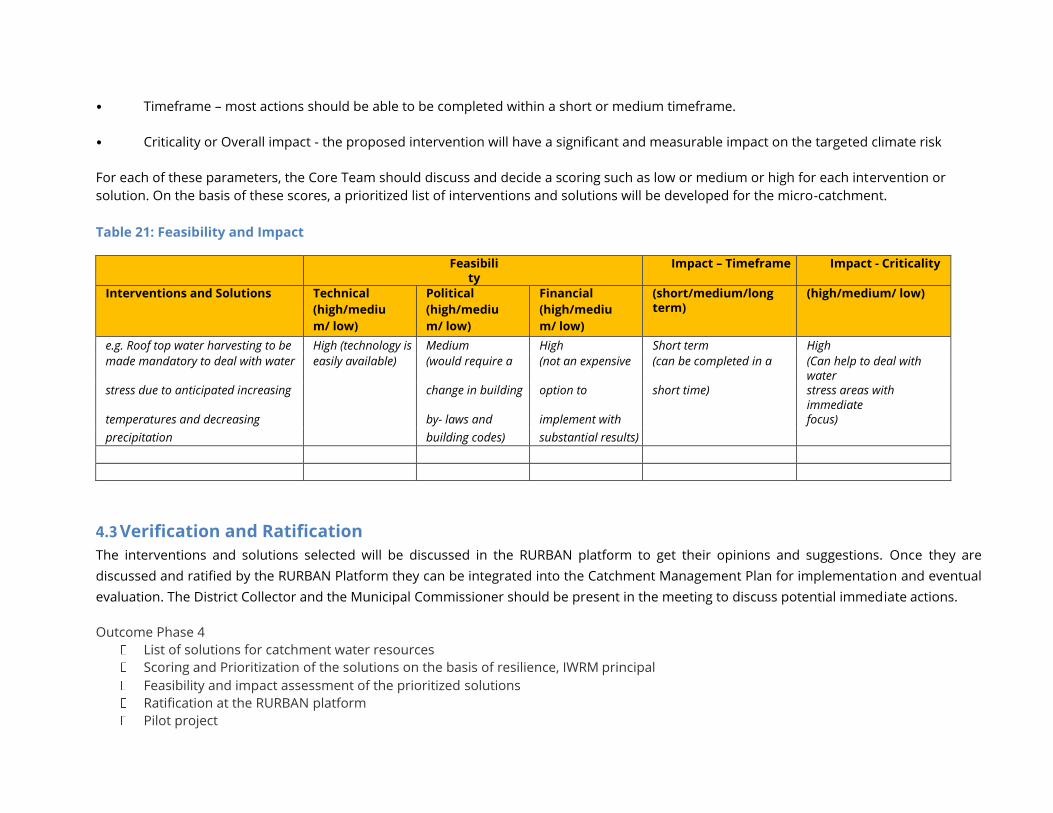
• Timeframe – most actions should be able to be completed within a short or medium timeframe.
• Criticality or Overall impact - the proposed intervention will have a significant and measurable impact on the targeted climate risk
For each of these parameters, the Core Team should discuss and decide a scoring such as low or medium or high for each intervention or
solution. On the basis of these scores, a prioritized list of interventions and solutions will be developed for the micro-catchment.
Table 21: Feasibility and Impact
Feasibility
Impact – Timeframe Impact - Criticality
Interventions and Solutions Technical
(high/mediu
m/ low)
Political
(high/mediu
m/ low)
Financial
(high/mediu
m/ low)
(short/medium/long term)
(high/medium/ low)
e.g. Roof top water harvesting to be High (technology is Medium High Short term High
made mandatory to deal with water easily available) (would require a (not an expensive (can be completed in a (Can help to deal with water
stress due to anticipated increasing change in building option to short time) stress areas with immediate
temperatures and decreasing by- laws and implement with focus)
precipitation building codes) substantial results)
4.3 Verification and Ratification
The interventions and solutions selected will be discussed in the RURBAN platform to get their opinions and suggestions. Once they are
discussed and ratified by the RURBAN Platform they can be integrated into the Catchment Management Plan for implementation and eventual
evaluation. The District Collector and the Municipal Commissioner should be present in the meeting to discuss potential immediate actions.
Outcome Phase 4
List of solutions for catchment water resources
Scoring and Prioritization of the solutions on the basis of resilience, IWRM principal
Feasibility and impact assessment of the prioritized solutions
Ratification at the RURBAN platform
Pilot project
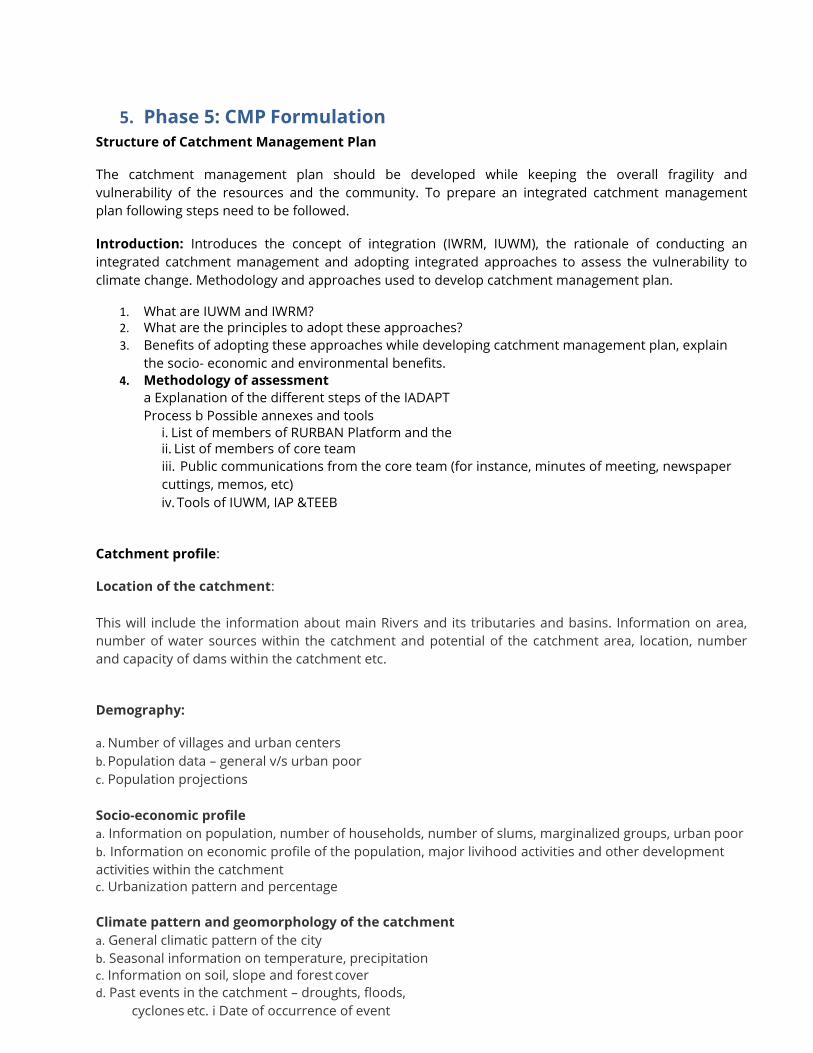
5. Phase 5: CMP Formulation Structure of Catchment Management Plan
The catchment management plan should be developed while keeping the overall fragility and
vulnerability of the resources and the community. To prepare an integrated catchment management
plan following steps need to be followed.
Introduction: Introduces the concept of integration (IWRM, IUWM), the rationale of conducting an
integrated catchment management and adopting integrated approaches to assess the vulnerability to
climate change. Methodology and approaches used to develop catchment management plan.
1. What are IUWM and IWRM? 2. What are the principles to adopt these approaches?
3. Benefits of adopting these approaches while developing catchment management plan, explain
the socio- economic and environmental benefits.
4. Methodology of assessment
a Explanation of the different steps of the IADAPT
Process b Possible annexes and tools
i. List of members of RURBAN Platform and the ii. List of members of core team
iii. Public communications from the core team (for instance, minutes of meeting, newspaper
cuttings, memos, etc)
iv. Tools of IUWM, IAP &TEEB
Catchment profile:
Location of the catchment:
This will include the information about main Rivers and its tributaries and basins. Information on area,
number of water sources within the catchment and potential of the catchment area, location, number
and capacity of dams within the catchment etc.
Demography:
a. Number of villages and urban centers
b. Population data – general v/s urban poor
c. Population projections
Socio-economic profile
a. Information on population, number of households, number of slums, marginalized groups, urban poor
b. Information on economic profile of the population, major livihood activities and other development
activities within the catchment
c. Urbanization pattern and percentage
Climate pattern and geomorphology of the catchment
a. General climatic pattern of the city
b. Seasonal information on temperature, precipitation
c. Information on soil, slope and forest cover
d. Past events in the catchment – droughts, floods,
cyclones etc. i Date of occurrence of event

ii Details of the event (for instance, reasons of occurrence of the event, details of the event)
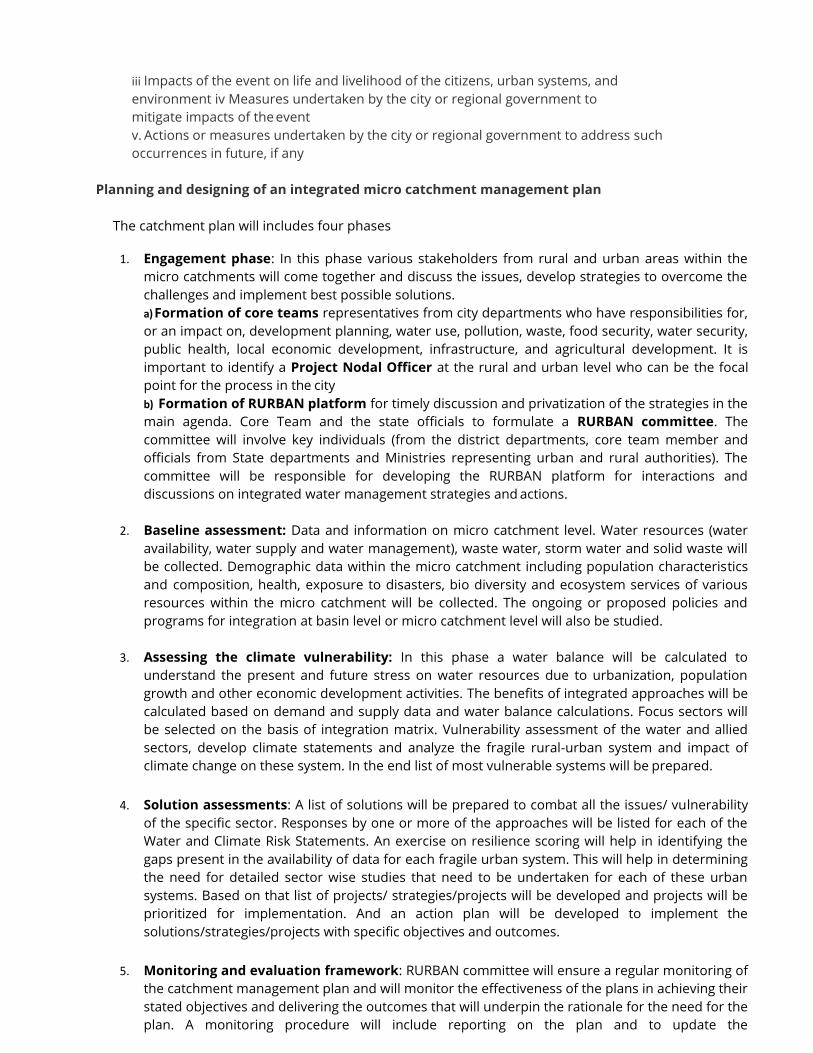
iii Impacts of the event on life and livelihood of the citizens, urban systems, and
environment iv Measures undertaken by the city or regional government to
mitigate impacts of the event
v. Actions or measures undertaken by the city or regional government to address such
occurrences in future, if any
Planning and designing of an integrated micro catchment management plan
The catchment plan will includes four phases
1. Engagement phase: In this phase various stakeholders from rural and urban areas within the
micro catchments will come together and discuss the issues, develop strategies to overcome the
challenges and implement best possible solutions.
a) Formation of core teams representatives from city departments who have responsibilities for,
or an impact on, development planning, water use, pollution, waste, food security, water security,
public health, local economic development, infrastructure, and agricultural development. It is
important to identify a Project Nodal Officer at the rural and urban level who can be the focal
point for the process in the city
b) Formation of RURBAN platform for timely discussion and privatization of the strategies in the
main agenda. Core Team and the state officials to formulate a RURBAN committee. The
committee will involve key individuals (from the district departments, core team member and
officials from State departments and Ministries representing urban and rural authorities). The
committee will be responsible for developing the RURBAN platform for interactions and
discussions on integrated water management strategies and actions.
2. Baseline assessment: Data and information on micro catchment level. Water resources (water
availability, water supply and water management), waste water, storm water and solid waste will
be collected. Demographic data within the micro catchment including population characteristics
and composition, health, exposure to disasters, bio diversity and ecosystem services of various
resources within the micro catchment will be collected. The ongoing or proposed policies and
programs for integration at basin level or micro catchment level will also be studied.
3. Assessing the climate vulnerability: In this phase a water balance will be calculated to
understand the present and future stress on water resources due to urbanization, population
growth and other economic development activities. The benefits of integrated approaches will be
calculated based on demand and supply data and water balance calculations. Focus sectors will
be selected on the basis of integration matrix. Vulnerability assessment of the water and allied
sectors, develop climate statements and analyze the fragile rural-urban system and impact of
climate change on these system. In the end list of most vulnerable systems will be prepared.
4. Solution assessments: A list of solutions will be prepared to combat all the issues/ vulnerability
of the specific sector. Responses by one or more of the approaches will be listed for each of the
Water and Climate Risk Statements. An exercise on resilience scoring will help in identifying the
gaps present in the availability of data for each fragile urban system. This will help in determining
the need for detailed sector wise studies that need to be undertaken for each of these urban
systems. Based on that list of projects/ strategies/projects will be developed and projects will be
prioritized for implementation. And an action plan will be developed to implement the
solutions/strategies/projects with specific objectives and outcomes.
5. Monitoring and evaluation framework: RURBAN committee will ensure a regular monitoring of
the catchment management plan and will monitor the effectiveness of the plans in achieving their
stated objectives and delivering the outcomes that will underpin the rationale for the need for the
plan. A monitoring procedure will include reporting on the plan and to update the

implementation of action plan. Cumulative responsibilities of RURBAN committee and core team
require regular reviews the plans. it is proposed that reporting should be done by nodal officer
and the core team. Yearly discussion with the core team and local residents to understand the
impact and effect of the implementation. After the completion of one project the project
prioritization tool will be re implemented and new projects will be selected.
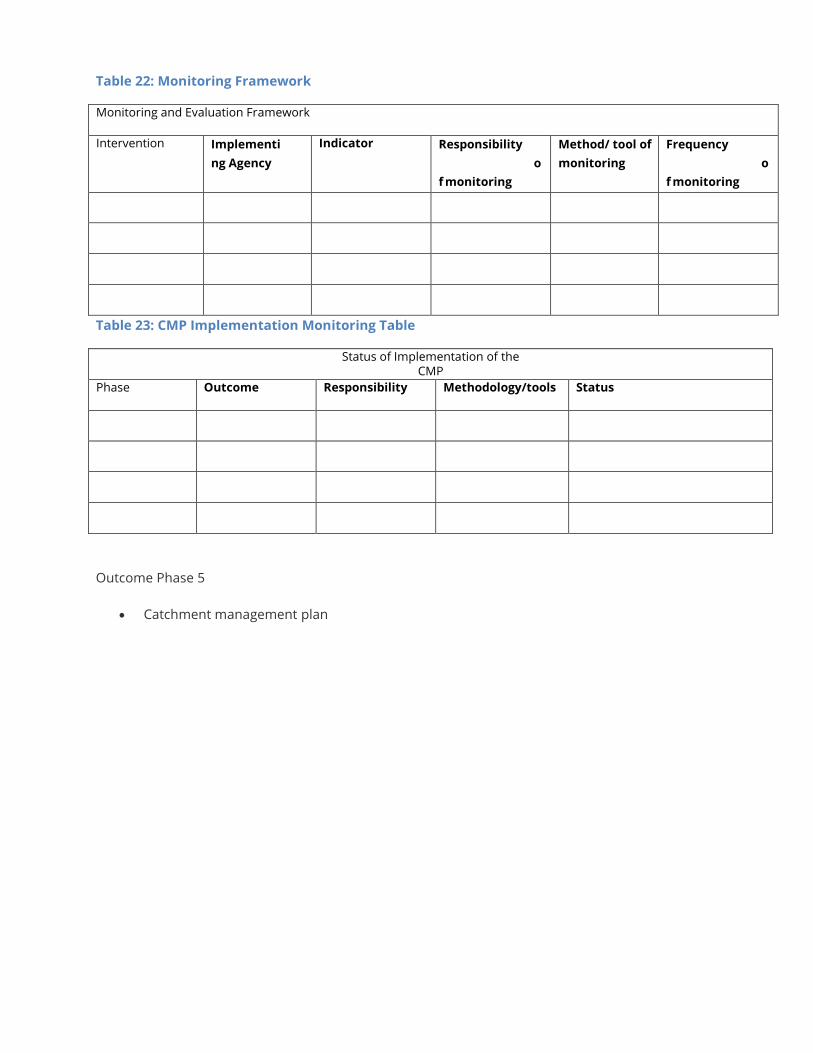
Table 22: Monitoring Framework
Monitoring and Evaluation Framework
Intervention Implementi
ng Agency
Indicator Responsibility
o
f monitoring
Method/ tool of
monitoring
Frequency
o
f monitoring
Table 23: CMP Implementation Monitoring Table
Status of Implementation of the CMP
Phase Outcome Responsibility Methodology/tools Status
Outcome Phase 5
• Catchment management plan

Annex 2
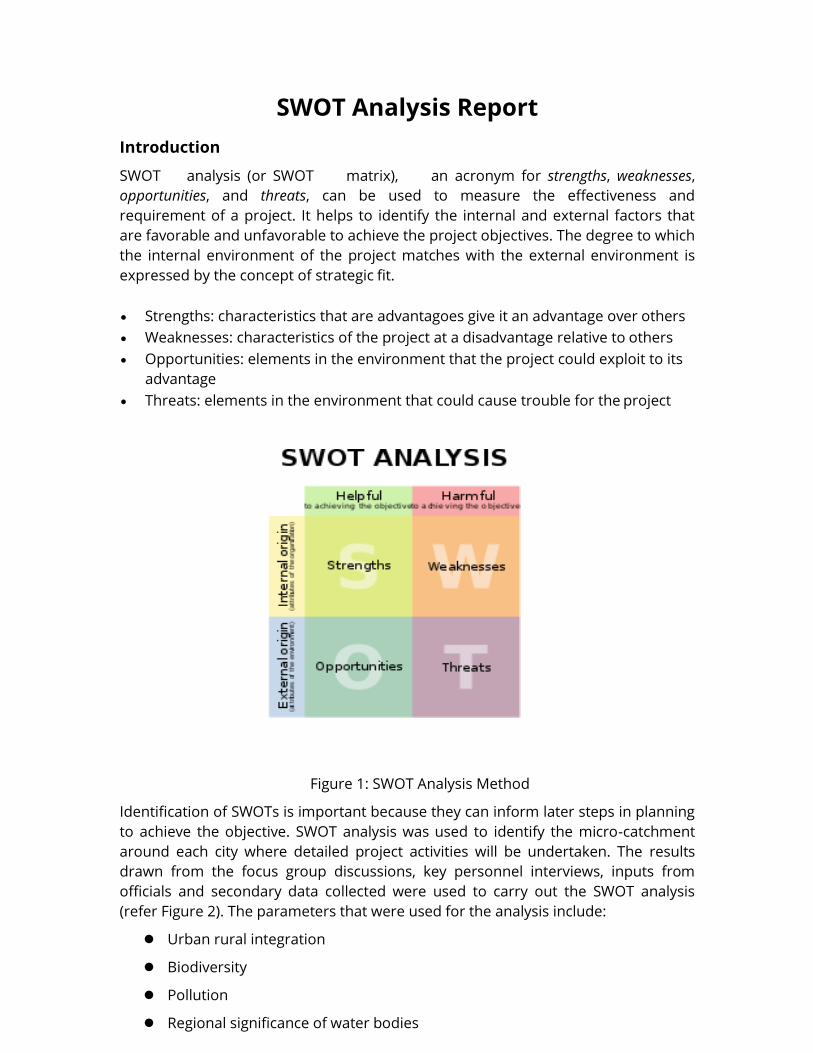
SWOT Analysis Report
Introduction
SWOT analysis (or SWOT matrix), an acronym for strengths, weaknesses,
opportunities, and threats, can be used to measure the effectiveness and
requirement of a project. It helps to identify the internal and external factors that
are favorable and unfavorable to achieve the project objectives. The degree to which
the internal environment of the project matches with the external environment is
expressed by the concept of strategic fit.
• Strengths: characteristics that are advantagoes give it an advantage over others
• Weaknesses: characteristics of the project at a disadvantage relative to others
• Opportunities: elements in the environment that the project could exploit to its
advantage
• Threats: elements in the environment that could cause trouble for the project
Figure 1: SWOT Analysis Method
Identification of SWOTs is important because they can inform later steps in planning
to achieve the objective. SWOT analysis was used to identify the micro-catchment
around each city where detailed project activities will be undertaken. The results
drawn from the focus group discussions, key personnel interviews, inputs from
officials and secondary data collected were used to carry out the SWOT analysis
(refer Figure 2). The parameters that were used for the analysis include:
⚫ Urban rural integration
⚫ Biodiversity
⚫ Pollution
⚫ Regional significance of water bodies
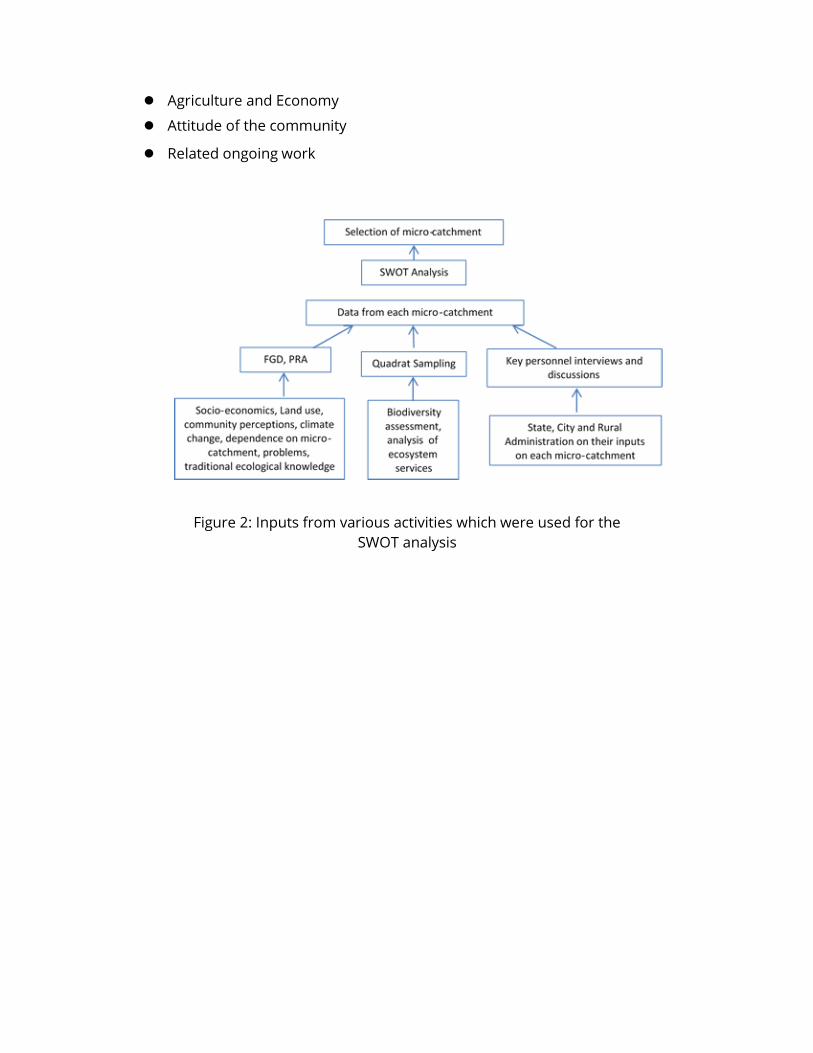
⚫ Agriculture and Economy
⚫ Attitude of the community
⚫ Related ongoing work
Figure 2: Inputs from various activities which were used for the
SWOT analysis
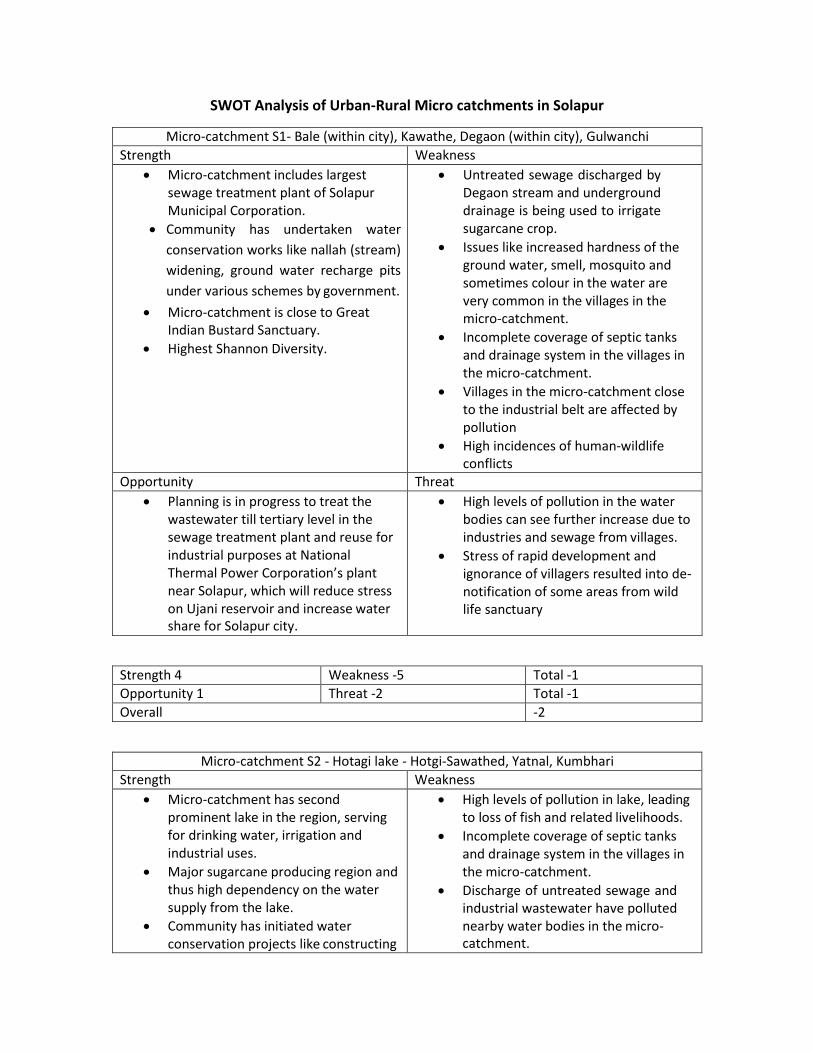
SWOT Analysis of Urban-Rural Micro catchments in Solapur
Micro-catchment S1- Bale (within city), Kawathe, Degaon (within city), Gulwanchi
Strength Weakness
• Micro-catchment includes largest sewage treatment plant of Solapur Municipal Corporation.
• Community has undertaken water
conservation works like nallah (stream)
widening, ground water recharge pits
under various schemes by government.
• Micro-catchment is close to Great Indian Bustard Sanctuary.
• Highest Shannon Diversity.
• Untreated sewage discharged by Degaon stream and underground drainage is being used to irrigate sugarcane crop.
• Issues like increased hardness of the ground water, smell, mosquito and sometimes colour in the water are very common in the villages in the micro-catchment.
• Incomplete coverage of septic tanks and drainage system in the villages in the micro-catchment.
• Villages in the micro-catchment close to the industrial belt are affected by pollution
• High incidences of human-wildlife conflicts
Opportunity Threat
• Planning is in progress to treat the wastewater till tertiary level in the sewage treatment plant and reuse for industrial purposes at National Thermal Power Corporation’s plant near Solapur, which will reduce stress on Ujani reservoir and increase water share for Solapur city.
• High levels of pollution in the water bodies can see further increase due to industries and sewage from villages.
• Stress of rapid development and ignorance of villagers resulted into de- notification of some areas from wild life sanctuary
Strength 4 Weakness -5 Total -1
Opportunity 1 Threat -2 Total -1
Overall -2
Micro-catchment S2 - Hotagi lake - Hotgi-Sawathed, Yatnal, Kumbhari
Strength Weakness
• Micro-catchment has second prominent lake in the region, serving for drinking water, irrigation and industrial uses.
• Major sugarcane producing region and thus high dependency on the water supply from the lake.
• Community has initiated water conservation projects like constructing
• High levels of pollution in lake, leading to loss of fish and related livelihoods.
• Incomplete coverage of septic tanks and drainage system in the villages in the micro-catchment.
• Discharge of untreated sewage and industrial wastewater have polluted nearby water bodies in the micro- catchment.
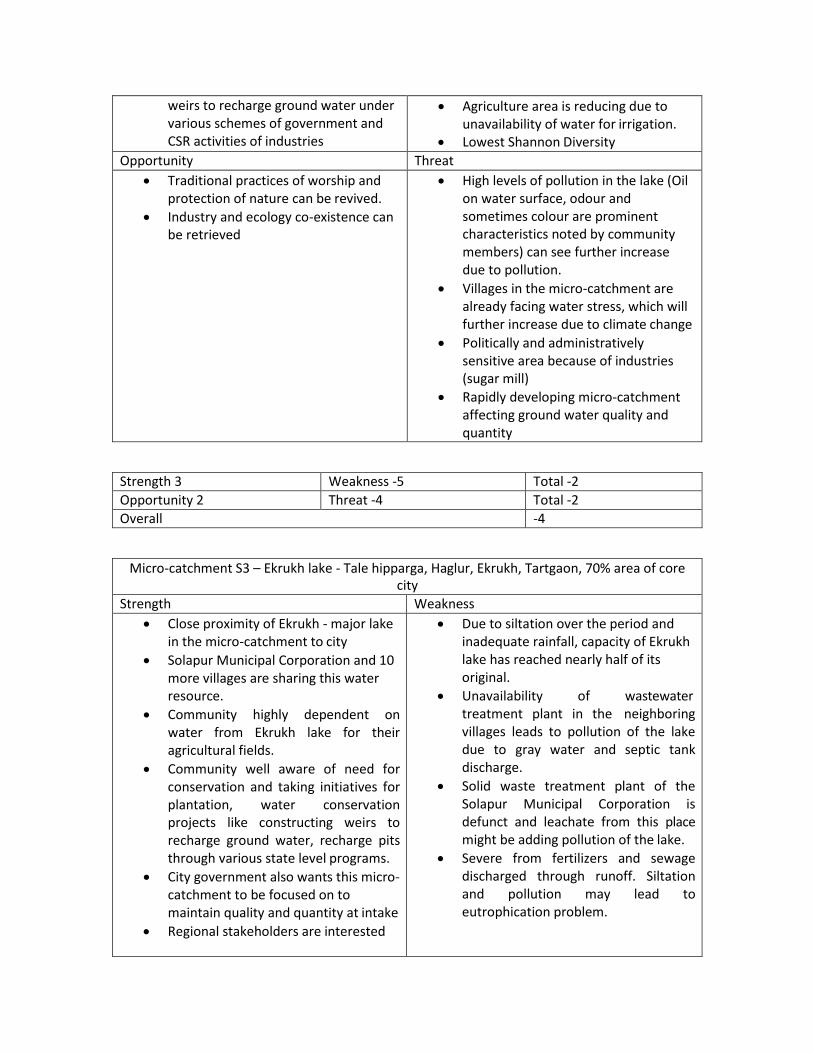
weirs to recharge ground water under various schemes of government and CSR activities of industries
• Agriculture area is reducing due to unavailability of water for irrigation.
• Lowest Shannon Diversity
Opportunity Threat
• Traditional practices of worship and protection of nature can be revived.
• Industry and ecology co-existence can be retrieved
• High levels of pollution in the lake (Oil on water surface, odour and sometimes colour are prominent characteristics noted by community members) can see further increase due to pollution.
• Villages in the micro-catchment are already facing water stress, which will further increase due to climate change
• Politically and administratively sensitive area because of industries (sugar mill)
• Rapidly developing micro-catchment affecting ground water quality and quantity
Strength 3 Weakness -5 Total -2
Opportunity 2 Threat -4 Total -2
Overall -4
Micro-catchment S3 – Ekrukh lake - Tale hipparga, Haglur, Ekrukh, Tartgaon, 70% area of core city
Strength Weakness
• Close proximity of Ekrukh - major lake in the micro-catchment to city
• Solapur Municipal Corporation and 10 more villages are sharing this water resource.
• Community highly dependent on water from Ekrukh lake for their agricultural fields.
• Community well aware of need for conservation and taking initiatives for plantation, water conservation projects like constructing weirs to recharge ground water, recharge pits through various state level programs.
• City government also wants this micro- catchment to be focused on to maintain quality and quantity at intake
• Regional stakeholders are interested
• Due to siltation over the period and inadequate rainfall, capacity of Ekrukh lake has reached nearly half of its original.
• Unavailability of wastewater treatment plant in the neighboring villages leads to pollution of the lake due to gray water and septic tank discharge.
• Solid waste treatment plant of the Solapur Municipal Corporation is defunct and leachate from this place might be adding pollution of the lake.
• Severe from fertilizers and sewage discharged through runoff. Siltation and pollution may lead to eutrophication problem.
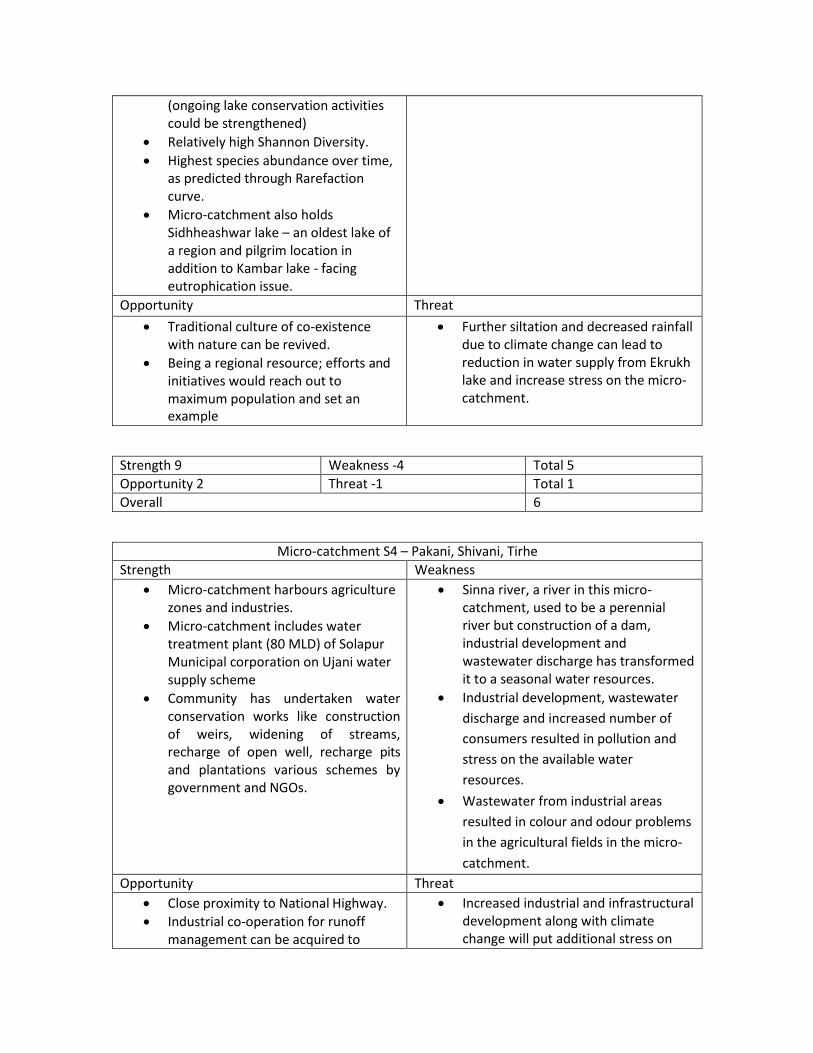
(ongoing lake conservation activities could be strengthened)
• Relatively high Shannon Diversity.
• Highest species abundance over time, as predicted through Rarefaction curve.
• Micro-catchment also holds Sidhheashwar lake – an oldest lake of a region and pilgrim location in addition to Kambar lake - facing eutrophication issue.
Opportunity Threat
• Traditional culture of co-existence with nature can be revived.
• Being a regional resource; efforts and initiatives would reach out to maximum population and set an example
• Further siltation and decreased rainfall due to climate change can lead to reduction in water supply from Ekrukh lake and increase stress on the micro- catchment.
Strength 9 Weakness -4 Total 5
Opportunity 2 Threat -1 Total 1
Overall 6
Micro-catchment S4 – Pakani, Shivani, Tirhe
Strength Weakness
• Micro-catchment harbours agriculture zones and industries.
• Micro-catchment includes water treatment plant (80 MLD) of Solapur Municipal corporation on Ujani water supply scheme
• Community has undertaken water conservation works like construction of weirs, widening of streams, recharge of open well, recharge pits and plantations various schemes by government and NGOs.
• Sinna river, a river in this micro- catchment, used to be a perennial river but construction of a dam, industrial development and wastewater discharge has transformed it to a seasonal water resources.
• Industrial development, wastewater
discharge and increased number of
consumers resulted in pollution and
stress on the available water
resources.
• Wastewater from industrial areas
resulted in colour and odour problems
in the agricultural fields in the micro-
catchment.
Opportunity Threat
• Close proximity to National Highway. • Industrial co-operation for runoff
management can be acquired to
• Increased industrial and infrastructural development along with climate change will put additional stress on

reduce pollution of water resources the water resource in future.
Strength 3 Weakness -3 Total 0
Opportunity 1 Threat -1 Total 0
Overall 0
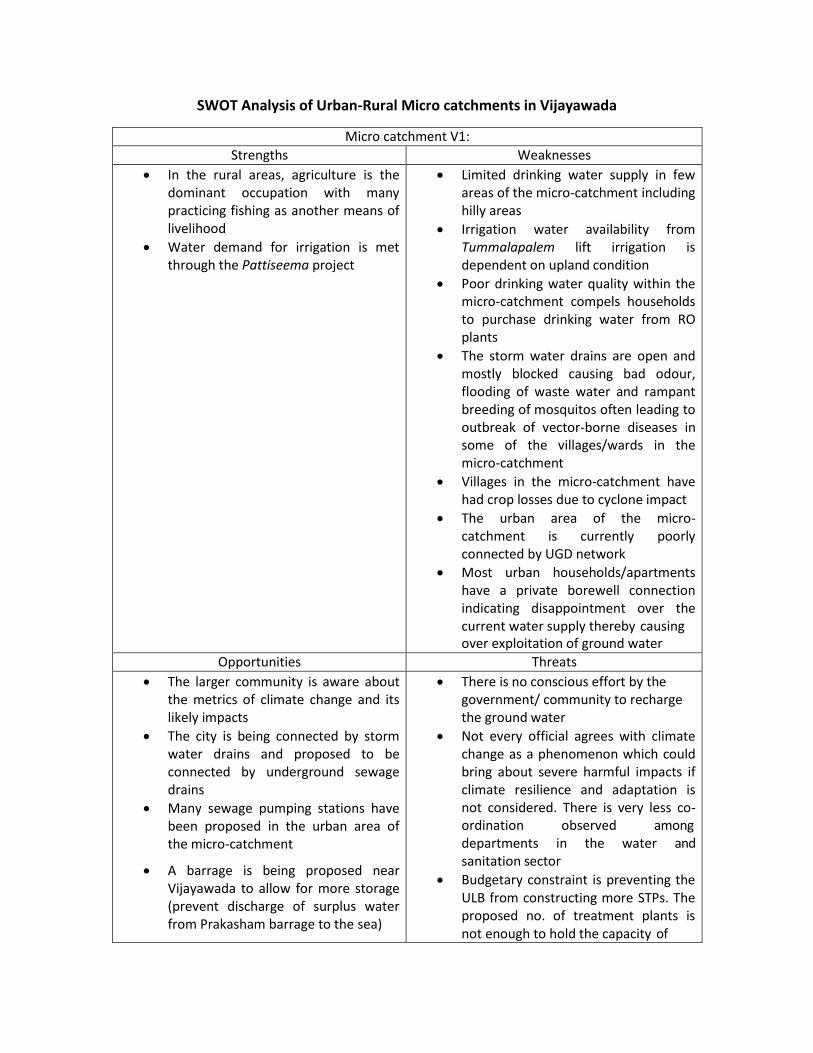
SWOT Analysis of Urban-Rural Micro catchments in Vijayawada
Micro catchment V1:
Strengths Weaknesses
• In the rural areas, agriculture is the dominant occupation with many practicing fishing as another means of livelihood
• Water demand for irrigation is met through the Pattiseema project
• Limited drinking water supply in few areas of the micro-catchment including hilly areas
• Irrigation water availability from Tummalapalem lift irrigation is dependent on upland condition
• Poor drinking water quality within the micro-catchment compels households to purchase drinking water from RO plants
• The storm water drains are open and mostly blocked causing bad odour, flooding of waste water and rampant breeding of mosquitos often leading to outbreak of vector-borne diseases in some of the villages/wards in the micro-catchment
• Villages in the micro-catchment have had crop losses due to cyclone impact
• The urban area of the micro- catchment is currently poorly connected by UGD network
• Most urban households/apartments have a private borewell connection indicating disappointment over the current water supply thereby causing over exploitation of ground water
Opportunities Threats
• The larger community is aware about the metrics of climate change and its likely impacts
• The city is being connected by storm water drains and proposed to be connected by underground sewage drains
• Many sewage pumping stations have been proposed in the urban area of the micro-catchment
• A barrage is being proposed near Vijayawada to allow for more storage (prevent discharge of surplus water from Prakasham barrage to the sea)
• There is no conscious effort by the government/ community to recharge the ground water
• Not every official agrees with climate change as a phenomenon which could bring about severe harmful impacts if climate resilience and adaptation is not considered. There is very less co- ordination observed among departments in the water and sanitation sector
• Budgetary constraint is preventing the ULB from constructing more STPs. The proposed no. of treatment plants is not enough to hold the capacity of
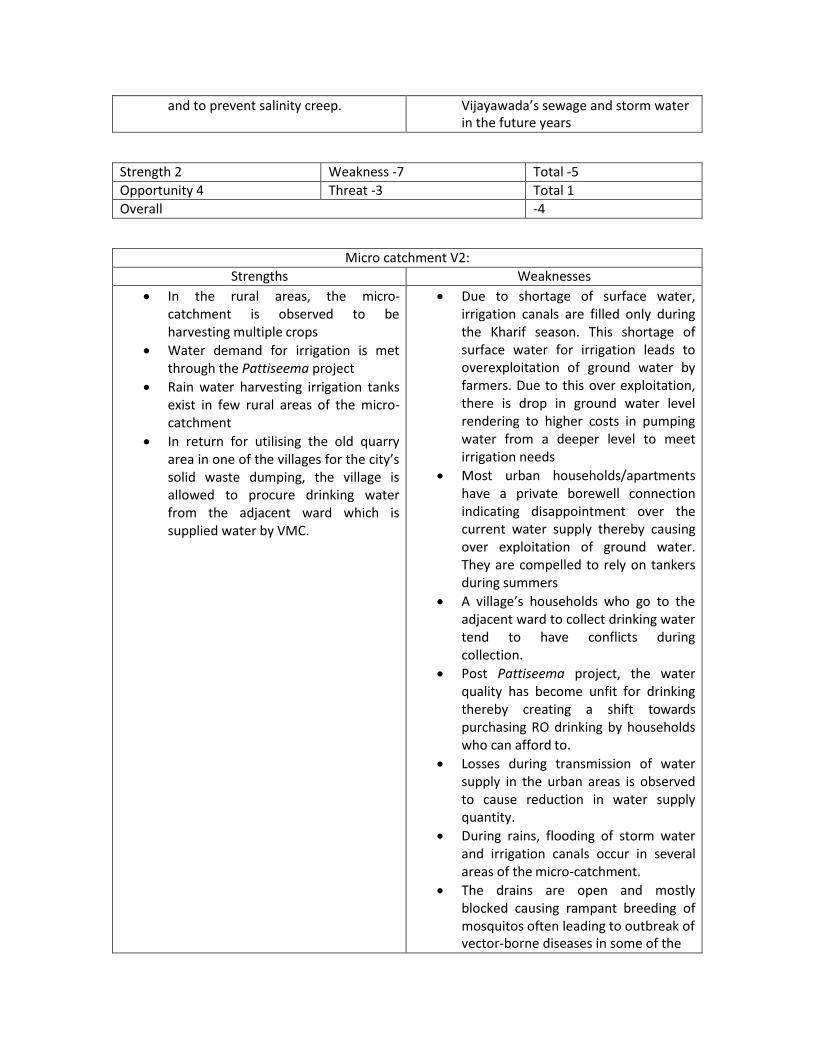
and to prevent salinity creep. Vijayawada’s sewage and storm water in the future years
Strength 2 Weakness -7 Total -5
Opportunity 4 Threat -3 Total 1
Overall -4
Micro catchment V2:
Strengths Weaknesses
• In the rural areas, the micro- catchment is observed to be harvesting multiple crops
• Water demand for irrigation is met through the Pattiseema project
• Rain water harvesting irrigation tanks exist in few rural areas of the micro- catchment
• In return for utilising the old quarry area in one of the villages for the city’s solid waste dumping, the village is allowed to procure drinking water from the adjacent ward which is supplied water by VMC.
• Due to shortage of surface water, irrigation canals are filled only during the Kharif season. This shortage of surface water for irrigation leads to overexploitation of ground water by farmers. Due to this over exploitation, there is drop in ground water level rendering to higher costs in pumping water from a deeper level to meet irrigation needs
• Most urban households/apartments have a private borewell connection indicating disappointment over the current water supply thereby causing over exploitation of ground water. They are compelled to rely on tankers during summers
• A village’s households who go to the adjacent ward to collect drinking water tend to have conflicts during collection.
• Post Pattiseema project, the water quality has become unfit for drinking thereby creating a shift towards purchasing RO drinking by households who can afford to.
• Losses during transmission of water supply in the urban areas is observed to cause reduction in water supply quantity.
• During rains, flooding of storm water and irrigation canals occur in several areas of the micro-catchment.
• The drains are open and mostly blocked causing rampant breeding of mosquitos often leading to outbreak of vector-borne diseases in some of the
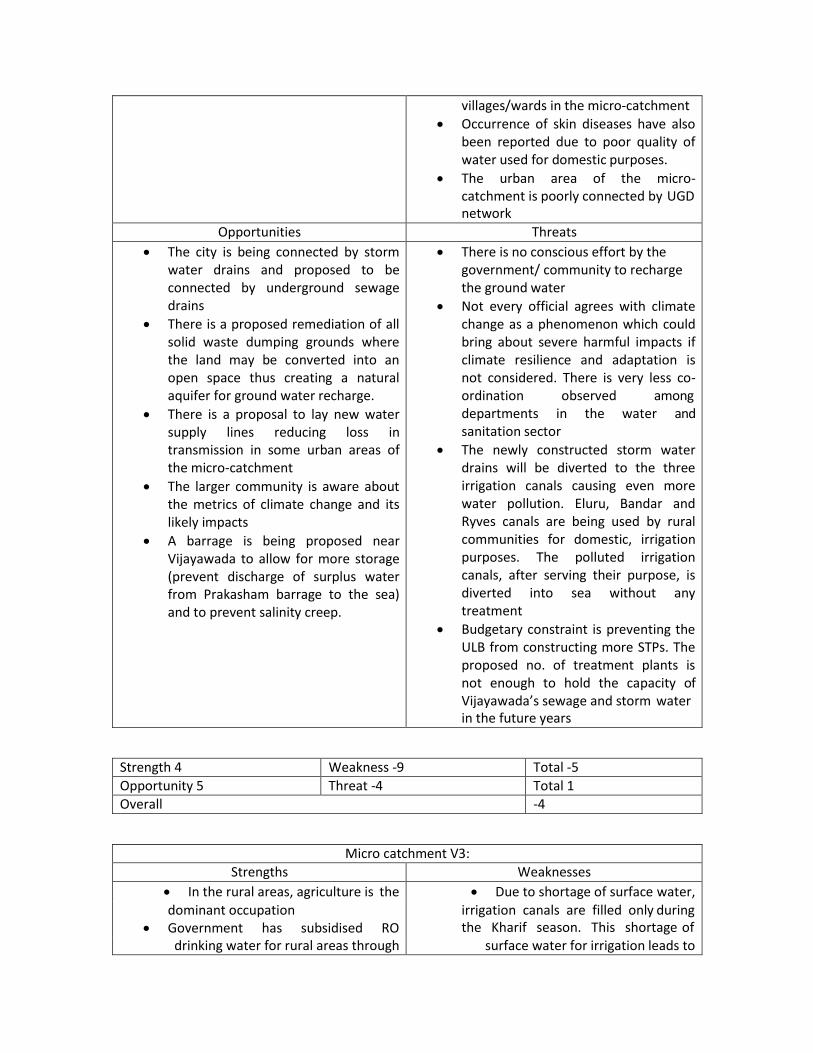
villages/wards in the micro-catchment • Occurrence of skin diseases have also
been reported due to poor quality of water used for domestic purposes.
• The urban area of the micro- catchment is poorly connected by UGD network
Opportunities Threats
• The city is being connected by storm water drains and proposed to be connected by underground sewage drains
• There is a proposed remediation of all solid waste dumping grounds where the land may be converted into an open space thus creating a natural aquifer for ground water recharge.
• There is a proposal to lay new water supply lines reducing loss in transmission in some urban areas of the micro-catchment
• The larger community is aware about the metrics of climate change and its likely impacts
• A barrage is being proposed near Vijayawada to allow for more storage (prevent discharge of surplus water from Prakasham barrage to the sea) and to prevent salinity creep.
• There is no conscious effort by the government/ community to recharge the ground water
• Not every official agrees with climate change as a phenomenon which could bring about severe harmful impacts if climate resilience and adaptation is not considered. There is very less co- ordination observed among departments in the water and sanitation sector
• The newly constructed storm water drains will be diverted to the three irrigation canals causing even more water pollution. Eluru, Bandar and Ryves canals are being used by rural communities for domestic, irrigation purposes. The polluted irrigation canals, after serving their purpose, is diverted into sea without any treatment
• Budgetary constraint is preventing the ULB from constructing more STPs. The proposed no. of treatment plants is not enough to hold the capacity of Vijayawada’s sewage and storm water in the future years
Strength 4 Weakness -9 Total -5
Opportunity 5 Threat -4 Total 1 Overall -4
Micro catchment V3:
Strengths Weaknesses
• In the rural areas, agriculture is the • Due to shortage of surface water, dominant occupation
• Government has subsidised RO irrigation canals are filled only during the Kharif season. This shortage of
drinking water for rural areas through surface water for irrigation leads to
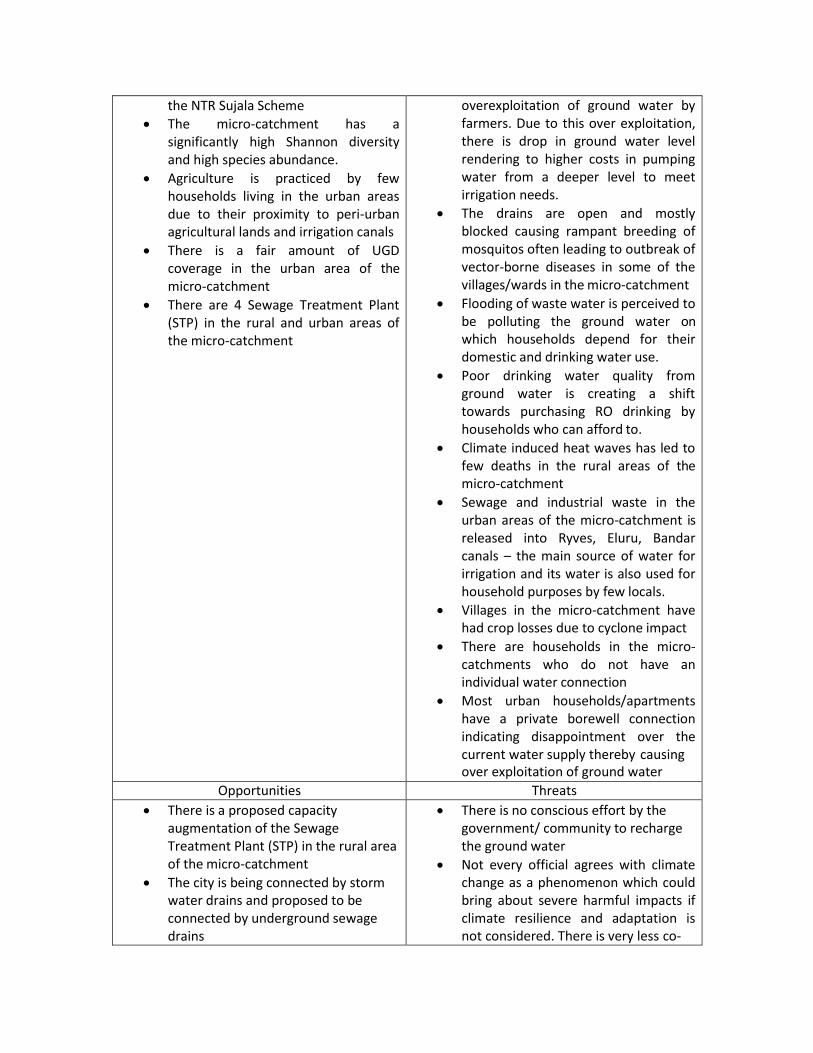
the NTR Sujala Scheme • The micro-catchment has a
significantly high Shannon diversity and high species abundance.
• Agriculture is practiced by few households living in the urban areas due to their proximity to peri-urban agricultural lands and irrigation canals
• There is a fair amount of UGD coverage in the urban area of the micro-catchment
• There are 4 Sewage Treatment Plant (STP) in the rural and urban areas of the micro-catchment
overexploitation of ground water by farmers. Due to this over exploitation, there is drop in ground water level rendering to higher costs in pumping water from a deeper level to meet irrigation needs.
• The drains are open and mostly blocked causing rampant breeding of mosquitos often leading to outbreak of vector-borne diseases in some of the villages/wards in the micro-catchment
• Flooding of waste water is perceived to be polluting the ground water on which households depend for their domestic and drinking water use.
• Poor drinking water quality from ground water is creating a shift towards purchasing RO drinking by households who can afford to.
• Climate induced heat waves has led to few deaths in the rural areas of the micro-catchment
• Sewage and industrial waste in the urban areas of the micro-catchment is released into Ryves, Eluru, Bandar canals – the main source of water for irrigation and its water is also used for household purposes by few locals.
• Villages in the micro-catchment have had crop losses due to cyclone impact
• There are households in the micro- catchments who do not have an individual water connection
• Most urban households/apartments have a private borewell connection indicating disappointment over the current water supply thereby causing over exploitation of ground water
Opportunities Threats
• There is a proposed capacity augmentation of the Sewage Treatment Plant (STP) in the rural area of the micro-catchment
• The city is being connected by storm water drains and proposed to be connected by underground sewage drains
• There is no conscious effort by the government/ community to recharge the ground water
• Not every official agrees with climate change as a phenomenon which could bring about severe harmful impacts if climate resilience and adaptation is not considered. There is very less co-
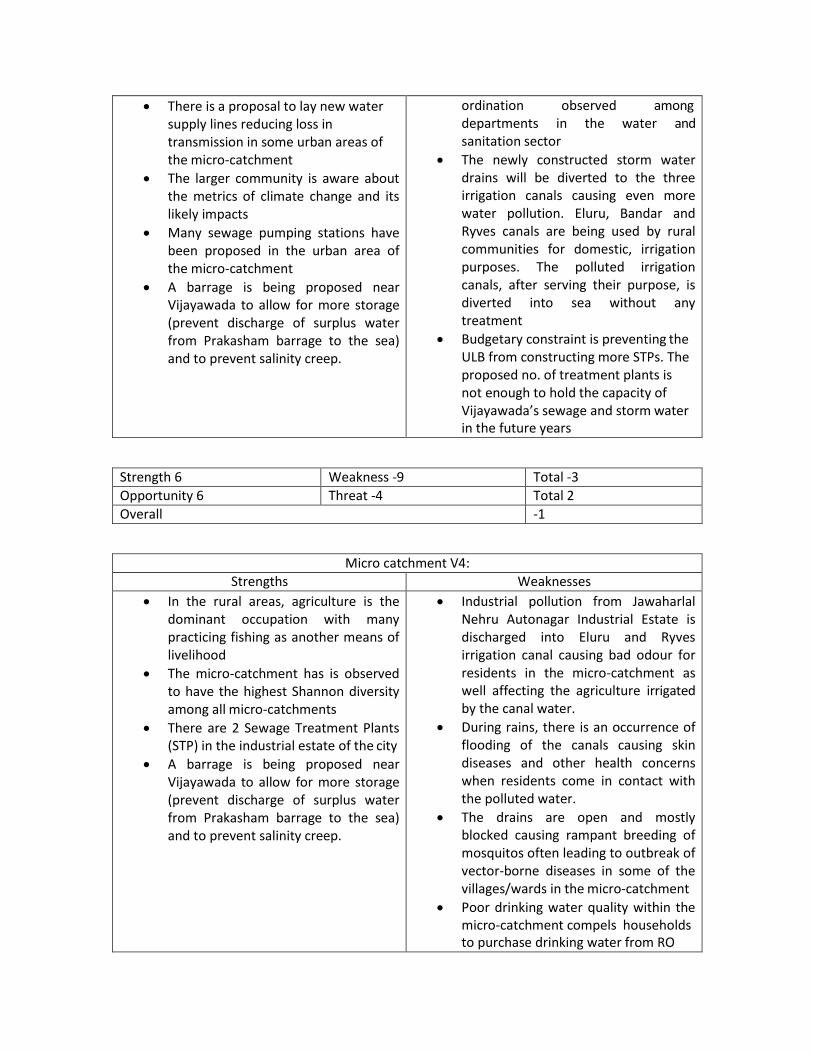
• There is a proposal to lay new water supply lines reducing loss in transmission in some urban areas of the micro-catchment
• The larger community is aware about the metrics of climate change and its likely impacts
• Many sewage pumping stations have been proposed in the urban area of the micro-catchment
• A barrage is being proposed near Vijayawada to allow for more storage (prevent discharge of surplus water from Prakasham barrage to the sea) and to prevent salinity creep.
ordination observed among departments in the water and sanitation sector
• The newly constructed storm water drains will be diverted to the three irrigation canals causing even more water pollution. Eluru, Bandar and Ryves canals are being used by rural communities for domestic, irrigation purposes. The polluted irrigation canals, after serving their purpose, is diverted into sea without any treatment
• Budgetary constraint is preventing the ULB from constructing more STPs. The proposed no. of treatment plants is not enough to hold the capacity of Vijayawada’s sewage and storm water in the future years
Strength 6 Weakness -9 Total -3
Opportunity 6 Threat -4 Total 2
Overall -1
Micro catchment V4: Strengths Weaknesses
• In the rural areas, agriculture is the dominant occupation with many practicing fishing as another means of livelihood
• The micro-catchment has is observed to have the highest Shannon diversity among all micro-catchments
• There are 2 Sewage Treatment Plants (STP) in the industrial estate of the city
• A barrage is being proposed near Vijayawada to allow for more storage (prevent discharge of surplus water from Prakasham barrage to the sea) and to prevent salinity creep.
• Industrial pollution from Jawaharlal Nehru Autonagar Industrial Estate is discharged into Eluru and Ryves irrigation canal causing bad odour for residents in the micro-catchment as well affecting the agriculture irrigated by the canal water.
• During rains, there is an occurrence of flooding of the canals causing skin diseases and other health concerns when residents come in contact with the polluted water.
• The drains are open and mostly blocked causing rampant breeding of mosquitos often leading to outbreak of vector-borne diseases in some of the villages/wards in the micro-catchment
• Poor drinking water quality within the micro-catchment compels households to purchase drinking water from RO
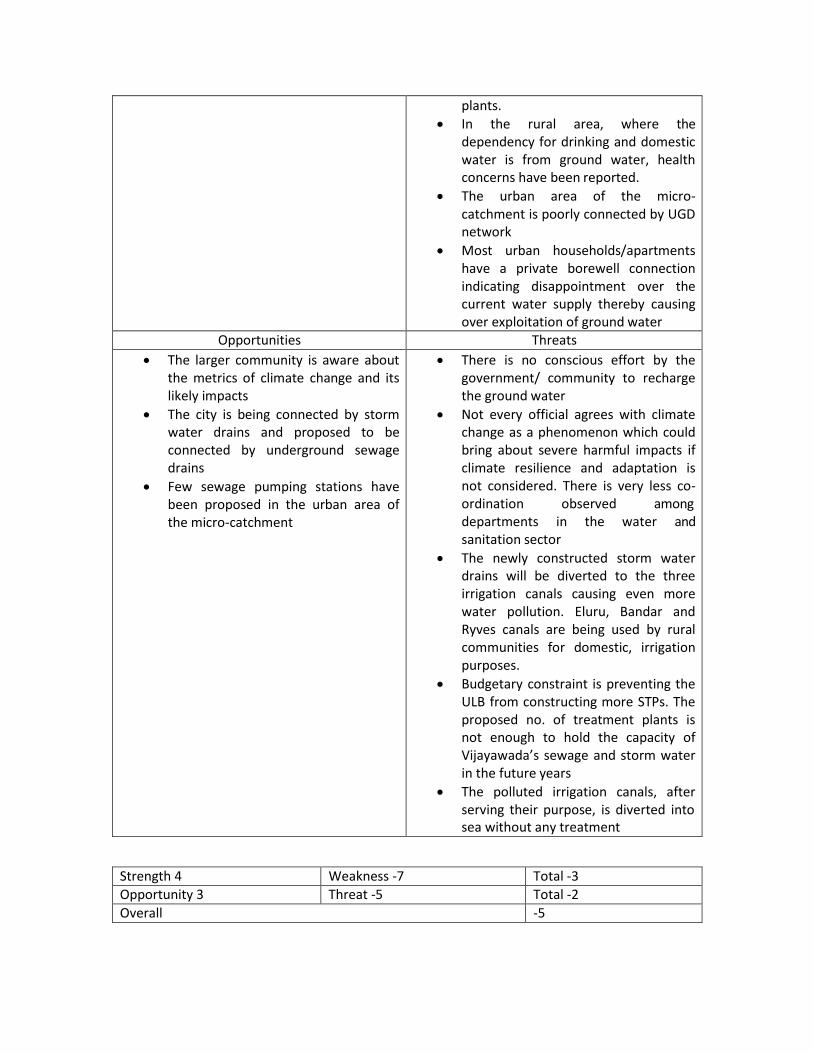
plants. • In the rural area, where the
dependency for drinking and domestic water is from ground water, health concerns have been reported.
• The urban area of the micro- catchment is poorly connected by UGD network
• Most urban households/apartments have a private borewell connection indicating disappointment over the current water supply thereby causing over exploitation of ground water
Opportunities Threats
• The larger community is aware about the metrics of climate change and its likely impacts
• The city is being connected by storm water drains and proposed to be connected by underground sewage drains
• Few sewage pumping stations have been proposed in the urban area of the micro-catchment
• There is no conscious effort by the government/ community to recharge the ground water
• Not every official agrees with climate change as a phenomenon which could bring about severe harmful impacts if climate resilience and adaptation is not considered. There is very less co- ordination observed among departments in the water and sanitation sector
• The newly constructed storm water drains will be diverted to the three irrigation canals causing even more water pollution. Eluru, Bandar and Ryves canals are being used by rural communities for domestic, irrigation purposes.
• Budgetary constraint is preventing the ULB from constructing more STPs. The proposed no. of treatment plants is not enough to hold the capacity of Vijayawada’s sewage and storm water in the future years
• The polluted irrigation canals, after serving their purpose, is diverted into sea without any treatment
Strength 4 Weakness -7 Total -3 Opportunity 3 Threat -5 Total -2
Overall -5

Annex 3
1
Hydrological and Climate Modeling of Vijayawada
Dr. S Mohan
Environmental & Water Resources Engineering, Dept. Of Civil Engineering, Indian Institute of Technology,
Madras (IIT-M)
2
CHAPTER 1
INTRODUCTION
1.1 General
Climate change is currently a key issue in almost all parts of the world. Frequent drought and
flood, the rise in sea levels are a major concern for a country like India. It can be observed
that within a country only, at a time when one part of the country is completely flooded other
is suffering from drought. All these phenomena is a clear sign of need of a sustainable
management plan. This plan can be made only when there is a proper assessment of
demand and supply is available.
In the last 100 years, some parts of the county have seen a clear decline in rainfall pattern
while others have seen an increase in rainfall. Hence, it is important to bring climate change
into consideration to assess water availability. These days GCM models are available which
can be coupled with different GHGs emission scenarios, to get a better estimate of the
hydrological variable.
Impact of climate change can be incorporated in hydrological models to check the correlation
and dependence of one parameter on another.
1.2 Climate Change and Its Impact
The Earth's climate is changing throughout time. In the last 650,000 years, there have been
seven cycles of glacial advance and retreat, with the end of last ice age about 7,000 years
ago which marks the beginning of the modern climate era.
The current warming trend is of prime significance as most of it is extremely likely to be the
result of human activity, since the mid-20th century and proceeding at a rate that is
unprecedented over decades to millennia.
Evidence for rapid climate change:
• Global temperature rise (rise of about 2 degrees Fahrenheit)
• Shrinking ice sheets
• Sea level rise (rise of about 8 inches)
• Extreme events (more flood and drought)
• Ocean acidification (About 30% increase)

3
Anthropogenic greenhouse gas emissions have a significant impact on climate change.
Based on the IPCC report, GHG emission from 1750 to 2011, is about 2040 ± 310 GtCO2,
out of which 405 remained in the atmosphere, 30% has been absorbed by the ocean.
GHG emission, climate change, and our hydrological system are interdependent. Increase in
GHGs emission has resulted in climate change which now has altered the hydrological
system. Changes in many extreme weather and climate events, increase in high sea levels
have been observed since about 1950. Continued emission of greenhouse gases will cause
further warming and long-lasting changes in all components of the climate system.
IPCC baseline report indicates a strong, consistent, almost linear relationship between
cumulative CO2 emissions and global temperature change to the year 2100.
Baes on IPCC report, the Surface temperature is projected to rise over the 21st century
under all assessed emission scenarios. It is very likely that heat waves will occur more often
and last longer, and that extreme precipitation events will become more intense and frequent
in many regions.
1.3 Assessment of Water Availability
Water availability can be assessed in two parts, one is by proper estimation of surface water,
and the other is by groundwater. Surface water can be estimated using any rainfall- runoff
relation. SCS-CN is one such a good option. Surface water for the current study area largely
depends on rainfall. While groundwater assessment requires estimation of groundwater flow,
recharge, and pumping.
1.4 Sustainable Development Plan
Integrated Rural-Urban Water Management for Climate-based adaptation in Indian Cities
(IAdapt) project is being implemented in two Indian cities - Solapur in Maharashtra, and
Vijayawada in Andhra Pradesh and their surrounding catchments – which face issues
related to droughts, floods, and water conflicts. The project will support the project cities to
move from traditional approaches of water management (that plan, establish and operate
water supply, wastewater, and stormwater systems as separate entities) to an ‘Integrated
Approach’ based on the principles of IWRM and IUWM.
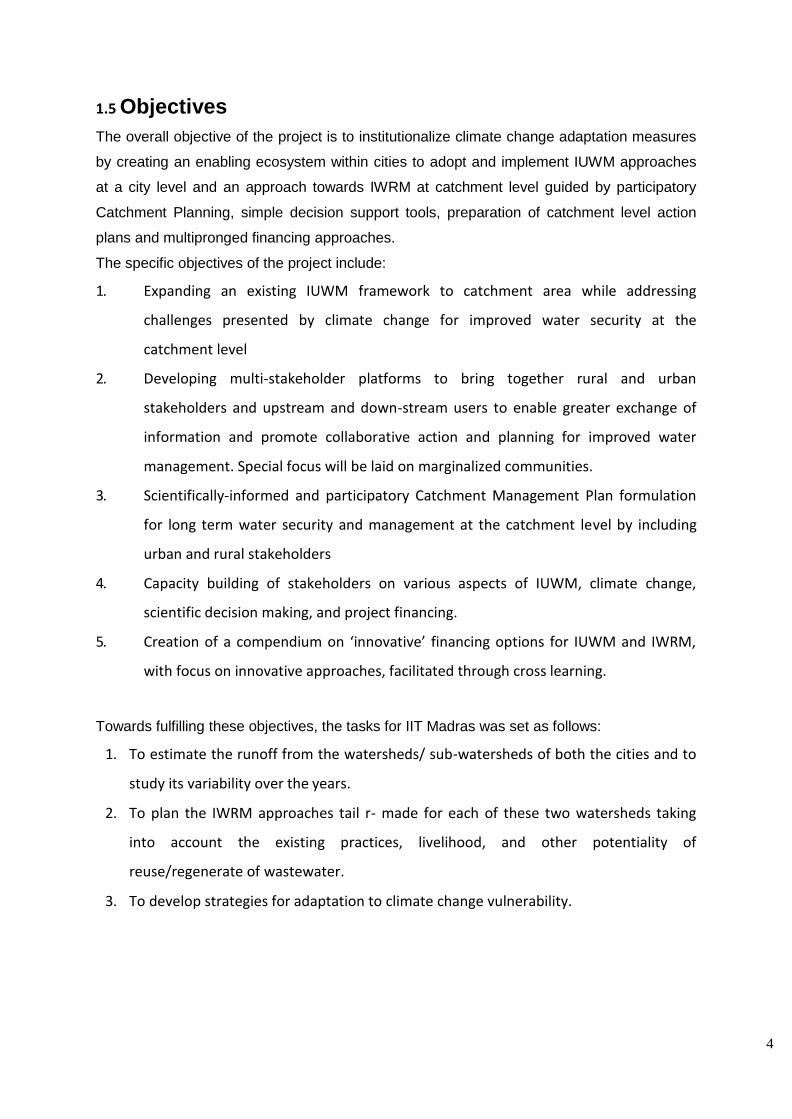
4
1.5 Objectives
The overall objective of the project is to institutionalize climate change adaptation measures
by creating an enabling ecosystem within cities to adopt and implement IUWM approaches
at a city level and an approach towards IWRM at catchment level guided by participatory
Catchment Planning, simple decision support tools, preparation of catchment level action
plans and multipronged financing approaches.
The specific objectives of the project include:
1. Expanding an existing IUWM framework to catchment area while addressing
challenges presented by climate change for improved water security at the
catchment level
2. Developing multi-stakeholder platforms to bring together rural and urban
stakeholders and upstream and down-stream users to enable greater exchange of
information and promote collaborative action and planning for improved water
management. Special focus will be laid on marginalized communities.
3. Scientifically-informed and participatory Catchment Management Plan formulation
for long term water security and management at the catchment level by including
urban and rural stakeholders
4. Capacity building of stakeholders on various aspects of IUWM, climate change,
scientific decision making, and project financing.
5. Creation of a compendium on ‘innovative’ financing options for IUWM and IWRM,
with focus on innovative approaches, facilitated through cross learning.
Towards fulfilling these objectives, the tasks for IIT Madras was set as follows:
1. To estimate the runoff from the watersheds/ sub-watersheds of both the cities and to
study its variability over the years.
2. To plan the IWRM approaches tail r- made for each of these two watersheds taking
into account the existing practices, livelihood, and other potentiality of
reuse/regenerate of wastewater.
3. To develop strategies for adaptation to climate change vulnerability.

5
Chapter 2
METHODOLO
GY
2.1 General
The overall methodology can be divided into four sections, namely, catchment
delineation, trend analysis of hydrological variable under climate change and climate change
projection, estimation of runoff generation and total water availability and sustainable
management plan. Catchment delineation is done using ArcGIS, which classify the
catchment into various sub zones based on land use, soil type, and infiltration capacity.
Trend analysis is done using linear regression, and its significance is tested using student t-
test. Further to assess the impact of climate change on rainfall and temperature, suitable
GCM model has been adopted for different scenario (RCP) of carbon emission. Runoff
generation is calculated using HEC-HMS model. Preliminary runoff estimation every month
is done using the SCS-CN method or in some cases using empirical equations. Based on
the estimate, a further sustainable management plan is made.
2.2 Watershed Delineation
SRTM Digital Elevation Model (DEM) of 90m resolution for the catchment area is
obtained from Earth Explorer. It is then processed in ArcGIS 10.1 for land use and land
pattern.ArcGIS 10.1 software is an updated Geographic Information Software released in
2012 by ESRI (Environmental Systems Research Institute) which is useful for creating maps,
compiling geographic data, analyzing mapped information, etc. ArcGIS supports DEM,
Digital Elevation model that contains all the geographic details for the selected region.
Areas are classified as agricultural, residential, barren land, vegetation, and water body. The
land use and Hydrological Soil Group map (HSG) is generated to calculate the Curve
Number and for the preparation of the rainfall-runoff model by the mean of HEC-HMS.
The extraction of the drainage network of the study area is carried out from ASTER
DEM, in raster format. ArcHYDRO tools in ArcGIS, version 10.1 (ESRI 2008) is used to
extract drainage channels. The delineation of the watershed is followed by running the
following functions: filling, flow accumulation, flow direction, stream definition, stream
Segmentation,
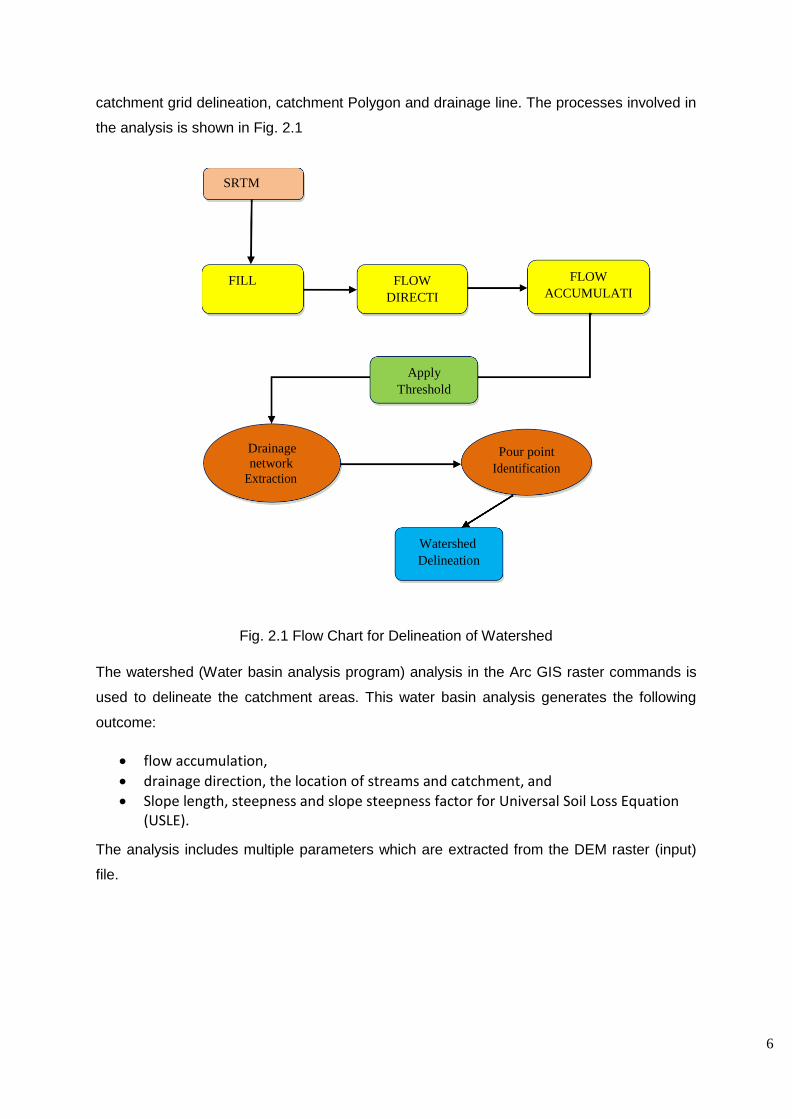
6
SRTM DEM
FILL SINK
FLOW
DIRECTI
ON
FLOW
ACCUMULATI
ON
Apply
Threshold
Drainage network
Extraction
Pour point
Identification
Watershed
Delineation
catchment grid delineation, catchment Polygon and drainage line. The processes involved in
the analysis is shown in Fig. 2.1
Fig. 2.1 Flow Chart for Delineation of Watershed
The watershed (Water basin analysis program) analysis in the Arc GIS raster commands is
used to delineate the catchment areas. This water basin analysis generates the following
outcome:
• flow accumulation,
• drainage direction, the location of streams and catchment, and • Slope length, steepness and slope steepness factor for Universal Soil Loss Equation
(USLE).
The analysis includes multiple parameters which are extracted from the DEM raster (input)
file.
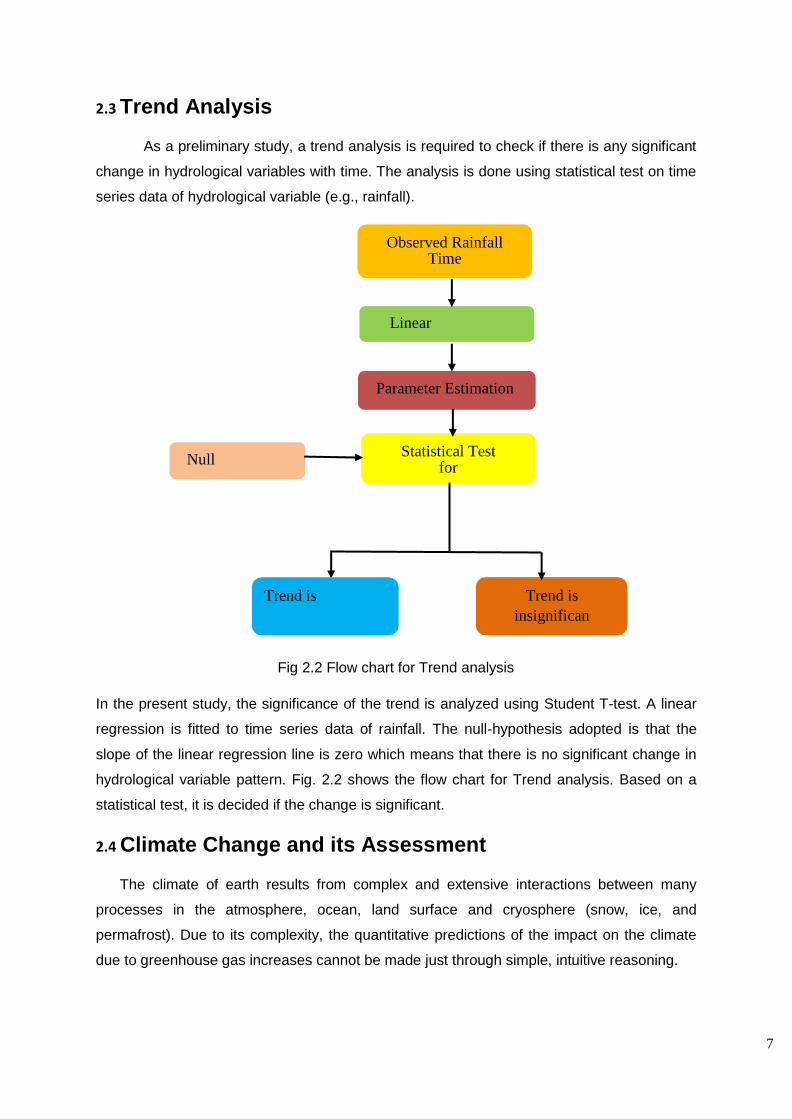
7
Observed Rainfall Time
Series
Linear Regression
Parameter Estimation
Null Hypothesis
Statistical Test for
Significance
Trend is Significant
Trend is
insignifican
t
2.3 Trend Analysis
As a preliminary study, a trend analysis is required to check if there is any significant
change in hydrological variables with time. The analysis is done using statistical test on time
series data of hydrological variable (e.g., rainfall).
Fig 2.2 Flow chart for Trend analysis
In the present study, the significance of the trend is analyzed using Student T-test. A linear
regression is fitted to time series data of rainfall. The null-hypothesis adopted is that the
slope of the linear regression line is zero which means that there is no significant change in
hydrological variable pattern. Fig. 2.2 shows the flow chart for Trend analysis. Based on a
statistical test, it is decided if the change is significant.
2.4 Climate Change and its Assessment
The climate of earth results from complex and extensive interactions between many
processes in the atmosphere, ocean, land surface and cryosphere (snow, ice, and
permafrost). Due to its complexity, the quantitative predictions of the impact on the climate
due to greenhouse gas increases cannot be made just through simple, intuitive reasoning.
8
For this reason, computer models have been developed which try to mathematically simulate
the climate, including the interaction between component systems. An ideal model will
simulate all of the physical, chemical and biological mechanisms.
Anthropogenic greenhouse gas emissions have a significant impact on climate change.
Based on the IPCC report, GHG emission from 1750 to 2011, is about 2040 ± 310 GtCO2,
out of which 405 remained in the atmosphere, 30% has been absorbed by the ocean.
GHG emission, climate change, and our hydrological system are interdependent.
Increase in GHGs emission has resulted in climate change which now has altered the
hydrological system. Changes in many extreme weather and climate events, increase in high
sea levels have been observed since about 1950. Continued emission of greenhouse gases
will cause further warming and long-lasting changes in all components of the climate system.
GHG emissions are mainly driven by population size, economic activity, lifestyle, energy use,
land use patterns, technology, and climate policy.
2.4.1 General Climate Models (GCMs)
Global Climate Models (GCMs) are the primary tool for understanding how the global
climate may change in the future. They are the most advanced tools currently available for
simulating the response of the global climate system to increasing greenhouse gas
concentrations. These are numerical models which represent physical processes in the
atmosphere, oceans, cryosphere and land surface. They depict the climate using a three-
dimensional grid. These models use quantitative methods to simulate the interactions of the
important drivers of climate, including atmosphere, oceans, land surface and ice. They are
used for a variety of purposes from study of the dynamics of the climate system to
projections of future climate.
Atmospheric general circulation models (atmospheric GCMs) are mathematical models
based on numerically discretized versions of differential equations that describe the
atmospheric physics and dynamics, which are utilized to simulate time series of climate
variables globally, accounting for the effects of the concentration of greenhouse gases in the
atmosphere.
9
Three-dimensional models which simulate the atmosphere are called Atmospheric
General Circulation Models (AGCMs) and have been developed from weather forecasting
models. Similarly, Ocean General Circulation Models (OGCMs) have been developed to
simulate the ocean. AGCMs and OGCMs can be coupled to form an atmosphere-ocean
coupled general circulation model (CGCM or AOGCM).
Fig. 2.3 Grid Point Model (Henderson-Sellers, 1985)
Scenarios have long been used by planners and decision-makers to analyze
situations in which outcomes are uncertain. In climate research, emission scenarios are
used to explore how much humans could contribute to future climate change gave
uncertainties in factors such as population growth, economic development, and development
of new technologies. Projections and scenarios of future social and environmental conditions
are also used to explore how much impact lesser or greater amounts of climate change
would have on different possible states of the world, for example, futures with greater or
lesser amounts of poverty. The purpose of using scenarios is not to predict the future, but to
explore both the scientific and real-world implications of different plausible futures.
There are several GCM models are available on the IPCC website. Depending upon the
study area, a particular RCP scenario can be chosen. Any GCM model can be adopted for
the study. It is good to choose several GCM model for the study to get a better forecast
band.
10
2.4.2 Representative Concentration Pathways (RCPs)
The Representative Concentration Pathways (RCP) is the latest generation of
scenarios that provide input to climate models. The word ‘representative’ signifies that each
RCP provides only one of many possible scenarios that would lead to the specific radiative
forcing pathway. Radiative forcing is a measure of the additional energy taken up by the
Earth system due to an increase in climate change pollution. Studies show that the radiative
forces are bound to increase in the future even with the current rate of carbon emission. Fig.
2.4 shows the different representative concentration pathways and the radiative forces at
which these scenarios will stabilize with the rate of sustainable consumptions and production
(SCP) rate.
Fig. 2.4 Radiative forcing for different climate scenarios
RCPs are four greenhouse gas concentration (not emissions) trajectories adopted by the
IPCC for its fifth Assessment Report (AR5) in 2014. It supersedes Special Report on
Emission Scenarios (SRES) projections published in 2000. The pathways describe four
possible climate futures, all of which are considered possible depending on how much
greenhouse gases are emitted in the years to come. The four RCPs RCP2.6, RCP4.5,
RCP6, and RCP8.5 are named after a possible range of radiative forcing values in the year
2100 relative to pre-industrial values. For RCP2.6, the radiative forcing first reaches a value
around 3.1 W/m mid-century, returning to 2.6 W/m2 by 2100. Under this scenario
greenhouse, gas emissions and
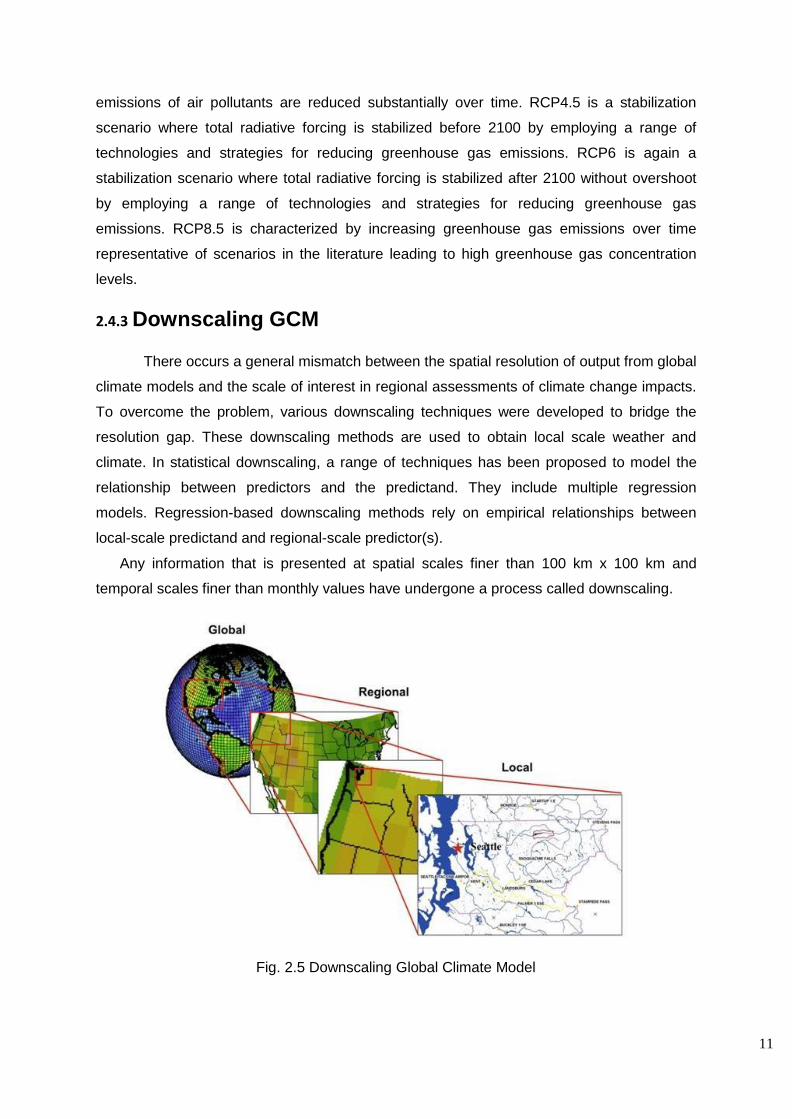
11
emissions of air pollutants are reduced substantially over time. RCP4.5 is a stabilization
scenario where total radiative forcing is stabilized before 2100 by employing a range of
technologies and strategies for reducing greenhouse gas emissions. RCP6 is again a
stabilization scenario where total radiative forcing is stabilized after 2100 without overshoot
by employing a range of technologies and strategies for reducing greenhouse gas
emissions. RCP8.5 is characterized by increasing greenhouse gas emissions over time
representative of scenarios in the literature leading to high greenhouse gas concentration
levels.
2.4.3 Downscaling GCM
There occurs a general mismatch between the spatial resolution of output from global
climate models and the scale of interest in regional assessments of climate change impacts.
To overcome the problem, various downscaling techniques were developed to bridge the
resolution gap. These downscaling methods are used to obtain local scale weather and
climate. In statistical downscaling, a range of techniques has been proposed to model the
relationship between predictors and the predictand. They include multiple regression
models. Regression-based downscaling methods rely on empirical relationships between
local-scale predictand and regional-scale predictor(s).
Any information that is presented at spatial scales finer than 100 km x 100 km and
temporal scales finer than monthly values have undergone a process called downscaling.
Fig. 2.5 Downscaling Global Climate Model
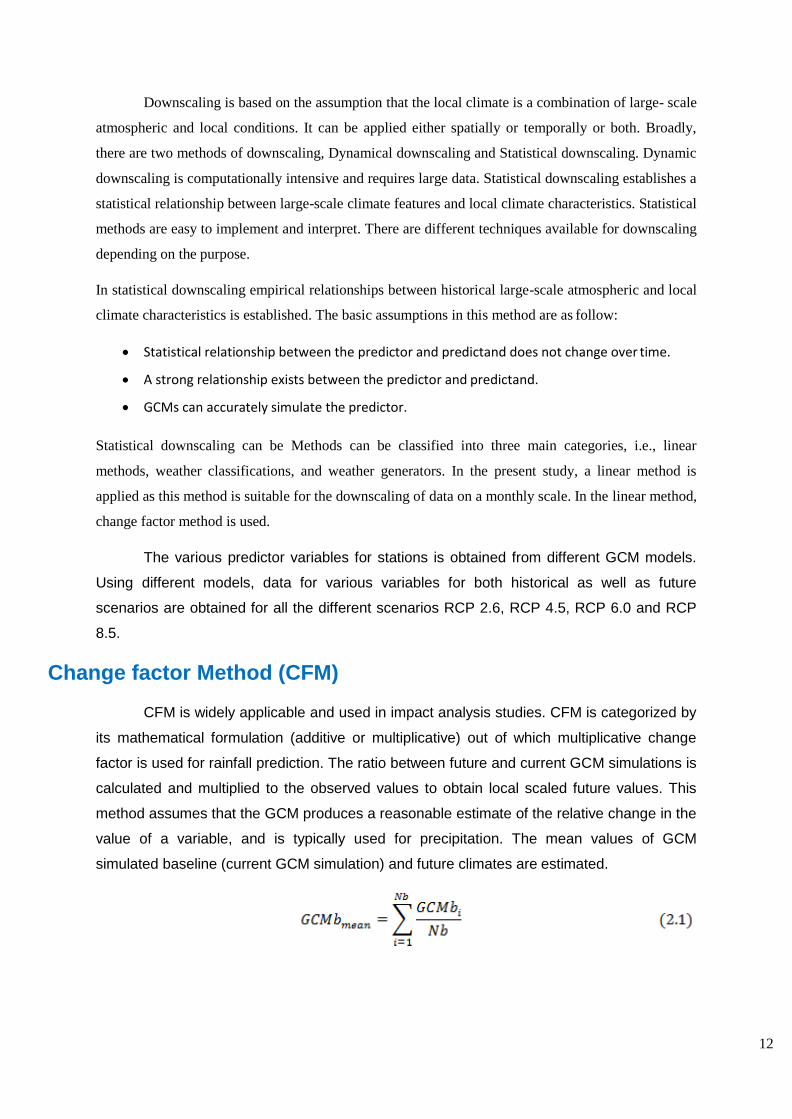
12
Downscaling is based on the assumption that the local climate is a combination of large- scale
atmospheric and local conditions. It can be applied either spatially or temporally or both. Broadly,
there are two methods of downscaling, Dynamical downscaling and Statistical downscaling. Dynamic
downscaling is computationally intensive and requires large data. Statistical downscaling establishes a
statistical relationship between large-scale climate features and local climate characteristics. Statistical
methods are easy to implement and interpret. There are different techniques available for downscaling
depending on the purpose.
In statistical downscaling empirical relationships between historical large-scale atmospheric and local
climate characteristics is established. The basic assumptions in this method are as follow:
• Statistical relationship between the predictor and predictand does not change over time.
• A strong relationship exists between the predictor and predictand.
• GCMs can accurately simulate the predictor.
Statistical downscaling can be Methods can be classified into three main categories, i.e., linear
methods, weather classifications, and weather generators. In the present study, a linear method is
applied as this method is suitable for the downscaling of data on a monthly scale. In the linear method,
change factor method is used.
The various predictor variables for stations is obtained from different GCM models.
Using different models, data for various variables for both historical as well as future
scenarios are obtained for all the different scenarios RCP 2.6, RCP 4.5, RCP 6.0 and RCP
8.5.
Change factor Method (CFM)
CFM is widely applicable and used in impact analysis studies. CFM is categorized by
its mathematical formulation (additive or multiplicative) out of which multiplicative change
factor is used for rainfall prediction. The ratio between future and current GCM simulations is
calculated and multiplied to the observed values to obtain local scaled future values. This
method assumes that the GCM produces a reasonable estimate of the relative change in the
value of a variable, and is typically used for precipitation. The mean values of GCM
simulated baseline (current GCM simulation) and future climates are estimated.
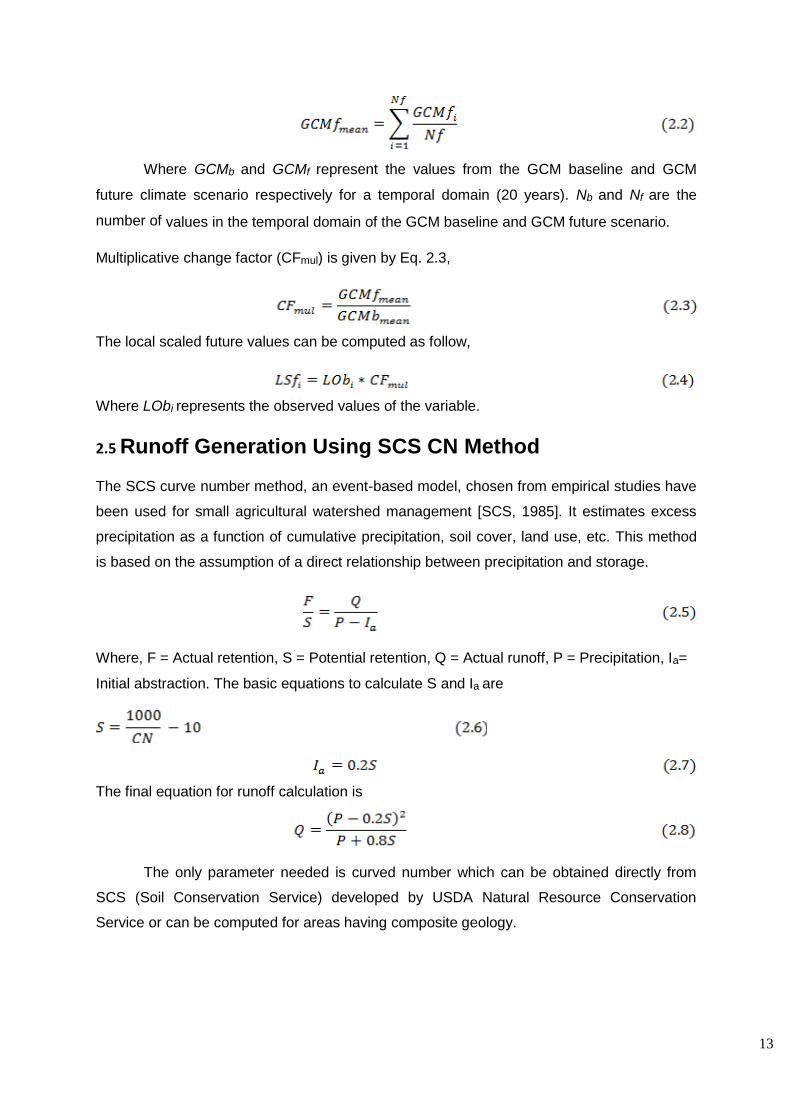
13
Where GCMb and GCMf represent the values from the GCM baseline and GCM
future climate scenario respectively for a temporal domain (20 years). Nb and Nf are the
number of values in the temporal domain of the GCM baseline and GCM future scenario.
Multiplicative change factor (CFmul) is given by Eq. 2.3,
The local scaled future values can be computed as follow,
Where LObi represents the observed values of the variable.
2.5 Runoff Generation Using SCS CN Method
The SCS curve number method, an event-based model, chosen from empirical studies have
been used for small agricultural watershed management [SCS, 1985]. It estimates excess
precipitation as a function of cumulative precipitation, soil cover, land use, etc. This method
is based on the assumption of a direct relationship between precipitation and storage.
Where, F = Actual retention, S = Potential retention, Q = Actual runoff, P = Precipitation, Ia=
Initial abstraction. The basic equations to calculate S and Ia are
The final equation for runoff calculation is
The only parameter needed is curved number which can be obtained directly from
SCS (Soil Conservation Service) developed by USDA Natural Resource Conservation
Service or can be computed for areas having composite geology.
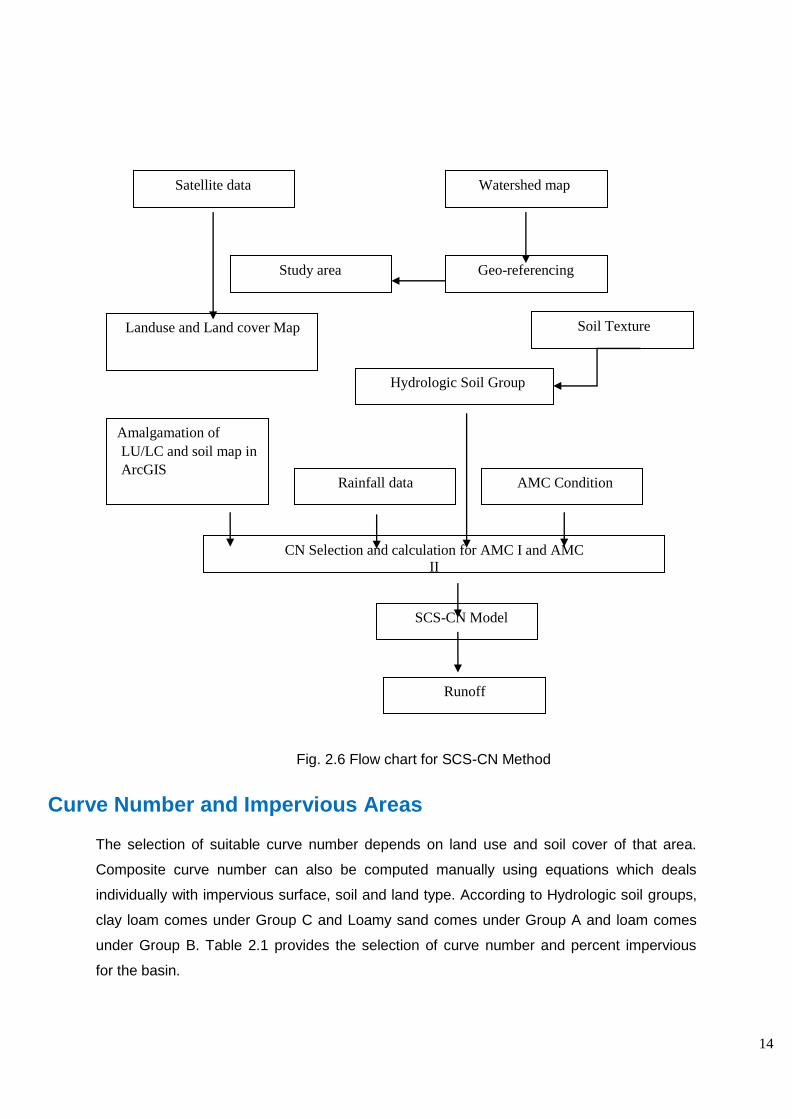
14
Study area Geo-referencing
Landuse and Land cover Map
Hydrologic Soil Group
Soil Texture
Amalgamation of
LU/LC and soil map in
ArcGIS Rainfall data AMC Condition
CN Selection and calculation for AMC I and AMC
II
SCS-CN Model
Runoff
Fig. 2.6 Flow chart for SCS-CN Method
Curve Number and Impervious Areas
The selection of suitable curve number depends on land use and soil cover of that area.
Composite curve number can also be computed manually using equations which deals
individually with impervious surface, soil and land type. According to Hydrologic soil groups,
clay loam comes under Group C and Loamy sand comes under Group A and loam comes
under Group B. Table 2.1 provides the selection of curve number and percent impervious
for the basin.
Watershed map Satellite data
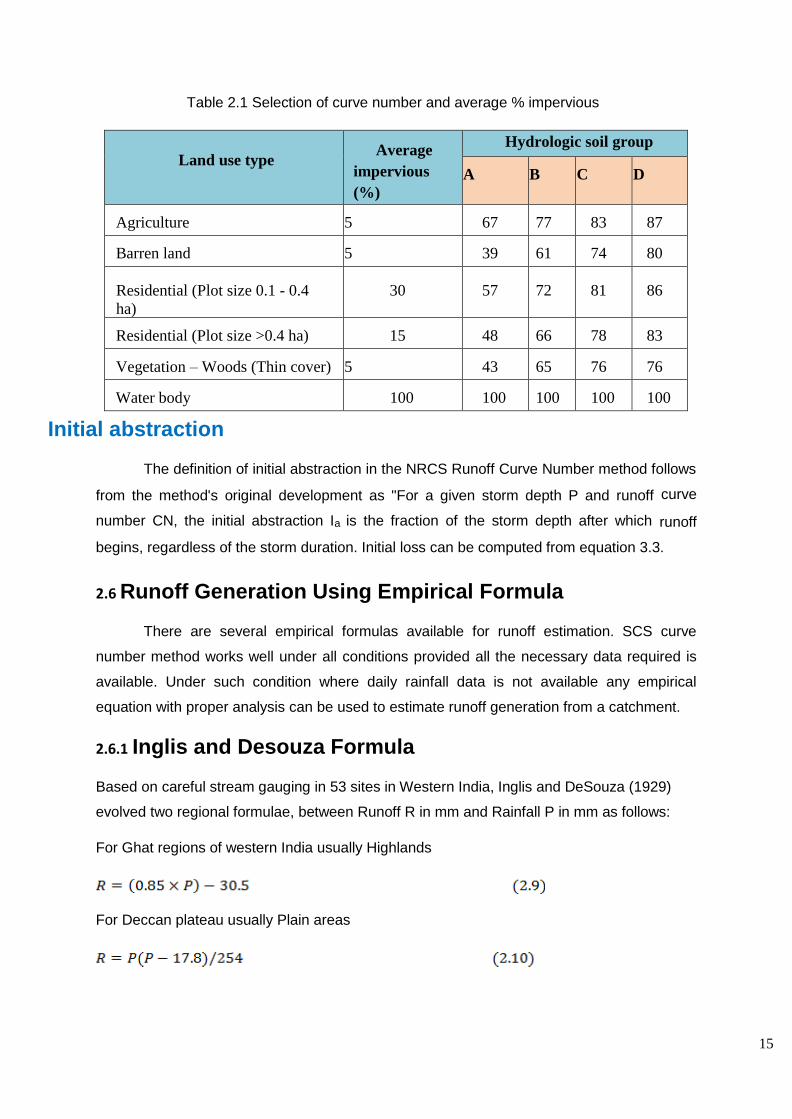
15
Table 2.1 Selection of curve number and average % impervious
Land use type
Average
impervious
(%)
Hydrologic soil group
A B C D
Agriculture 5 67 77 83 87
Barren land 5 39 61 74 80
Residential (Plot size 0.1 - 0.4
ha)
30 57 72 81 86
Residential (Plot size >0.4 ha) 15 48 66 78 83
Vegetation – Woods (Thin cover) 5 43 65 76 76
Water body 100 100 100 100 100
Initial abstraction
The definition of initial abstraction in the NRCS Runoff Curve Number method follows
from the method's original development as "For a given storm depth P and runoff curve
number CN, the initial abstraction Ia is the fraction of the storm depth after which runoff
begins, regardless of the storm duration. Initial loss can be computed from equation 3.3.
2.6 Runoff Generation Using Empirical Formula
There are several empirical formulas available for runoff estimation. SCS curve
number method works well under all conditions provided all the necessary data required is
available. Under such condition where daily rainfall data is not available any empirical
equation with proper analysis can be used to estimate runoff generation from a catchment.
2.6.1 Inglis and Desouza Formula
Based on careful stream gauging in 53 sites in Western India, Inglis and DeSouza (1929)
evolved two regional formulae, between Runoff R in mm and Rainfall P in mm as follows:
For Ghat regions of western India usually Highlands
For Deccan plateau usually Plain areas
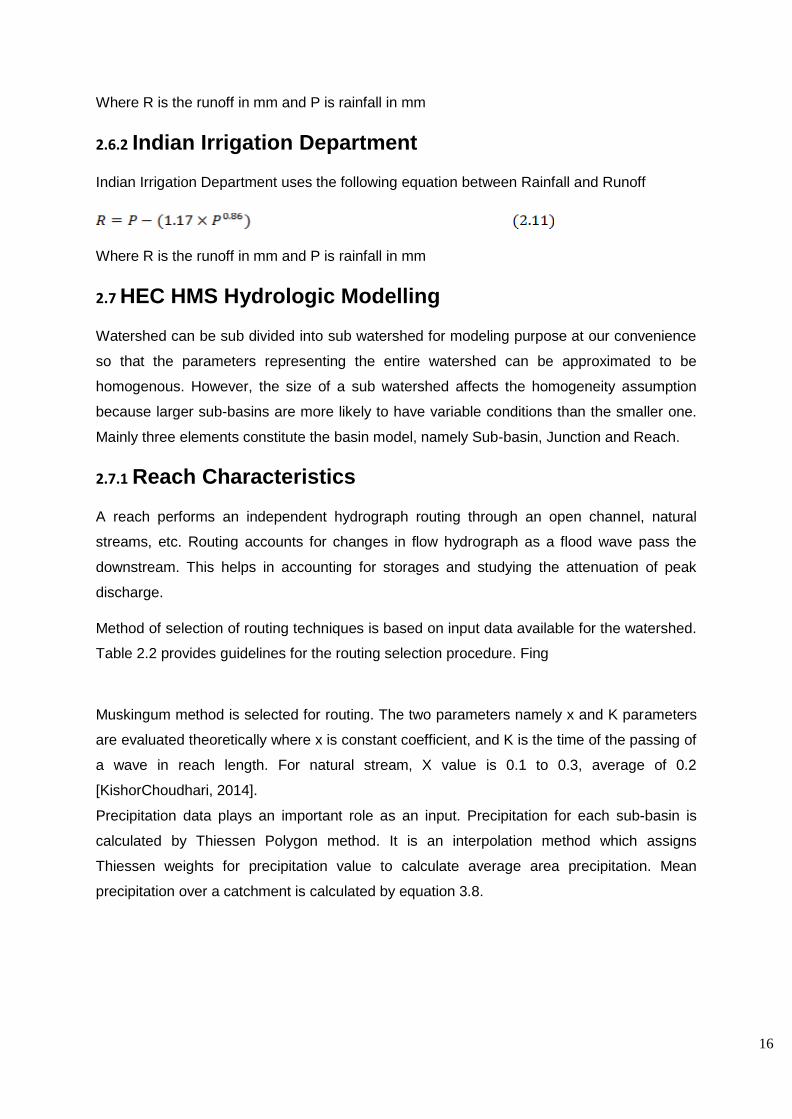
16
Where R is the runoff in mm and P is rainfall in mm
2.6.2 Indian Irrigation Department
Indian Irrigation Department uses the following equation between Rainfall and Runoff
Where R is the runoff in mm and P is rainfall in mm
2.7 HEC HMS Hydrologic Modelling
Watershed can be sub divided into sub watershed for modeling purpose at our convenience
so that the parameters representing the entire watershed can be approximated to be
homogenous. However, the size of a sub watershed affects the homogeneity assumption
because larger sub-basins are more likely to have variable conditions than the smaller one.
Mainly three elements constitute the basin model, namely Sub-basin, Junction and Reach.
2.7.1 Reach Characteristics
A reach performs an independent hydrograph routing through an open channel, natural
streams, etc. Routing accounts for changes in flow hydrograph as a flood wave pass the
downstream. This helps in accounting for storages and studying the attenuation of peak
discharge.
Method of selection of routing techniques is based on input data available for the watershed.
Table 2.2 provides guidelines for the routing selection procedure. Fing
Muskingum method is selected for routing. The two parameters namely x and K parameters
are evaluated theoretically where x is constant coefficient, and K is the time of the passing of
a wave in reach length. For natural stream, X value is 0.1 to 0.3, average of 0.2
[KishorChoudhari, 2014].
Precipitation data plays an important role as an input. Precipitation for each sub-basin is
calculated by Thiessen Polygon method. It is an interpolation method which assigns
Thiessen weights for precipitation value to calculate average area precipitation. Mean
precipitation over a catchment is calculated by equation 3.8.
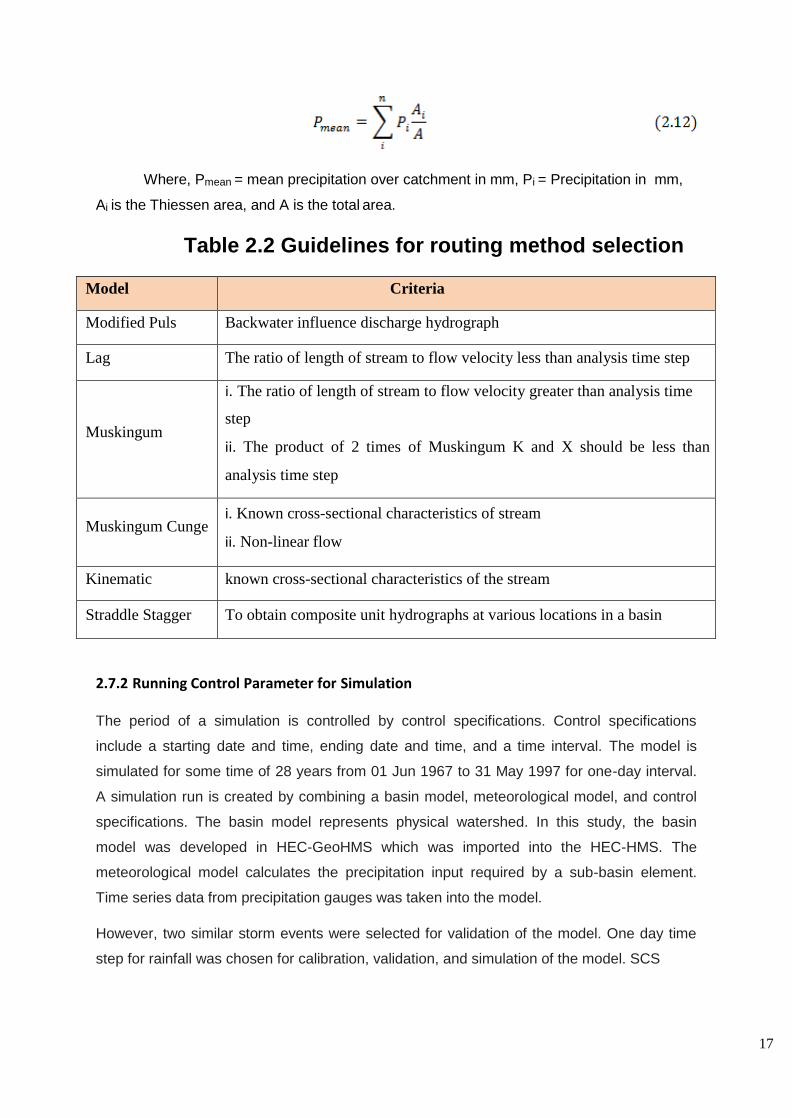
17
Where, Pmean = mean precipitation over catchment in mm, Pi = Precipitation in mm,
Ai is the Thiessen area, and A is the total area.
Table 2.2 Guidelines for routing method selection
Model Criteria
Modified Puls Backwater influence discharge hydrograph
Lag The ratio of length of stream to flow velocity less than analysis time step
Muskingum
i. The ratio of length of stream to flow velocity greater than analysis time
step
ii. The product of 2 times of Muskingum K and X should be less than
analysis time step
Muskingum Cunge i. Known cross-sectional characteristics of stream
ii. Non-linear flow
Kinematic known cross-sectional characteristics of the stream
Straddle Stagger To obtain composite unit hydrographs at various locations in a basin
2.7.2 Running Control Parameter for Simulation
The period of a simulation is controlled by control specifications. Control specifications
include a starting date and time, ending date and time, and a time interval. The model is
simulated for some time of 28 years from 01 Jun 1967 to 31 May 1997 for one-day interval.
A simulation run is created by combining a basin model, meteorological model, and control
specifications. The basin model represents physical watershed. In this study, the basin
model was developed in HEC-GeoHMS which was imported into the HEC-HMS. The
meteorological model calculates the precipitation input required by a sub-basin element.
Time series data from precipitation gauges was taken into the model.
However, two similar storm events were selected for validation of the model. One day time
step for rainfall was chosen for calibration, validation, and simulation of the model. SCS
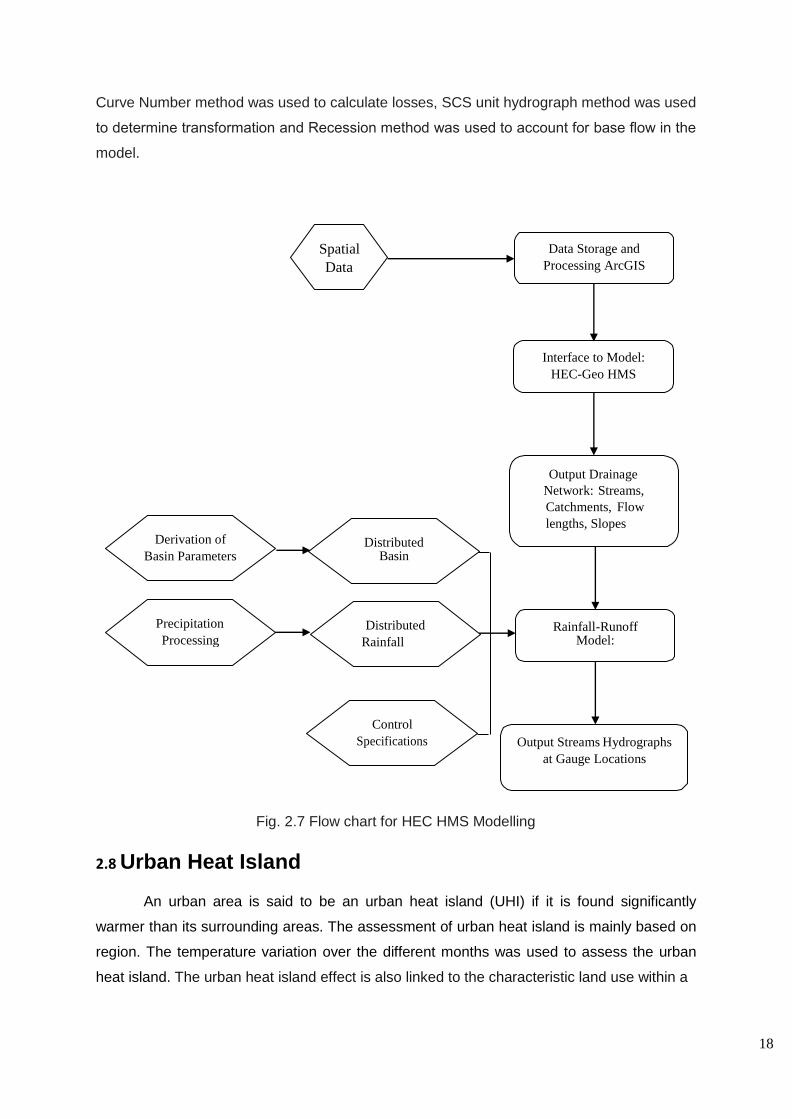
18
Spatial
Data
Data Storage and
Processing ArcGIS
10.1
Interface to Model:
HEC-Geo HMS
Output Drainage
Network: Streams,
Catchments, Flow
lengths, Slopes
Derivation of
Basin Parameters Distributed
Basin
Data
Precipitation
Processing Distributed
Rainfall
Data
Rainfall-Runoff Model:
HEC-HMS
Control
Specifications Output Streams Hydrographs
at Gauge Locations
Curve Number method was used to calculate losses, SCS unit hydrograph method was used
to determine transformation and Recession method was used to account for base flow in the
model.
Fig. 2.7 Flow chart for HEC HMS Modelling
2.8 Urban Heat Island
An urban area is said to be an urban heat island (UHI) if it is found significantly
warmer than its surrounding areas. The assessment of urban heat island is mainly based on
region. The temperature variation over the different months was used to assess the urban
heat island. The urban heat island effect is also linked to the characteristic land use within a
19
city/urban area as such. Land surface temperature, as defined by Barun refers to the
temperature measured in the air close (1 m) to the earth surface in an open area rather at a
higher level at which recorded temperature by weather stations. If a city has a good network
of weather stations for every land use type, UHI can be directly measured. However, for
most of the cities, the measurement of temperature in a spatial network is not available.
Therefore, UHI is determined by processing thermal remote sensing image for each of the
cities using GIS.
The study employed to generate the Land Surface Temperature (LST) maps from Landsat
satellites thermal infrared with 100 m and 120 m spatial resolution. Higher LST is seen in
areas with less vegetated land use and land cover (LULC) and vice versa. LST and
Normalized Difference Vegetation Index (NDVI) have widely been accepted as reliable
indicators of UHI and vegetation abundance respectively.
Quality of urban life and energy cost are mainly affected by Urban Heat Island. With
each degree temperature, the power used for air conditioning is enhanced. The level of
atmospheric temperature gets elevated due to the subsequent increased use of electricity for
cooling. The earth’s rising temperature is the hot issue today in the world since the industrial
revolution the temperature of the planet has been increased.
The very low value of NDVI (0.1 and below) corresponds to the barren area of rock, sand or
snow. Moderate values of NDVI represent shrub and grassland (0.2 to 0.3), while large
values of NDVI (>0.3) indicate temperate and tropical rainforests. From the LST images, it is
clearly understood that surface temperature is more in an urban area compared to rural
areas. It is necessary to estimate the urban heat island so that planning of remedial
measures like planting trees, the revival of water bodies, etc. can be suggested and
implemented.
The study analyses and verifies the spatial pattern of surface temperature with urban
spatial information related to to land use/land cover and NDVI using remotely sensed data
and GIS. The various steps involved in the assessment of urban heat island are as follows:
1) To determine the NDVI value
2) To determine the Brightness temperature
3) To determine the Land Surface Temperature
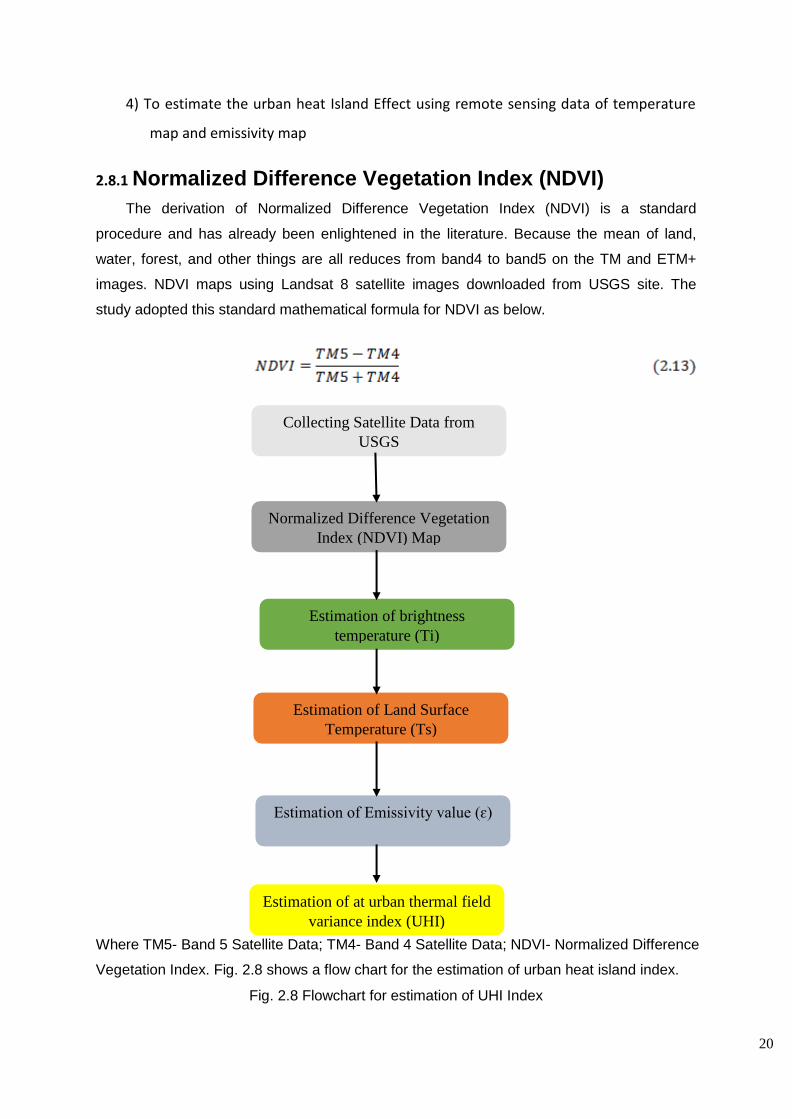
20
Collecting Satellite Data from
USGS
Normalized Difference Vegetation
Index (NDVI) Map
Estimation of brightness
temperature (Ti)
Estimation of Land Surface
Temperature (Ts)
Estimation of Emissivity value (ɛ)
Estimation of at urban thermal field
variance index (UHI)
4) To estimate the urban heat Island Effect using remote sensing data of temperature
map and emissivity map
2.8.1 Normalized Difference Vegetation Index (NDVI)
The derivation of Normalized Difference Vegetation Index (NDVI) is a standard
procedure and has already been enlightened in the literature. Because the mean of land,
water, forest, and other things are all reduces from band4 to band5 on the TM and ETM+
images. NDVI maps using Landsat 8 satellite images downloaded from USGS site. The
study adopted this standard mathematical formula for NDVI as below.
Where TM5- Band 5 Satellite Data; TM4- Band 4 Satellite Data; NDVI- Normalized Difference
Vegetation Index. Fig. 2.8 shows a flow chart for the estimation of urban heat island index.
Fig. 2.8 Flowchart for estimation of UHI Index
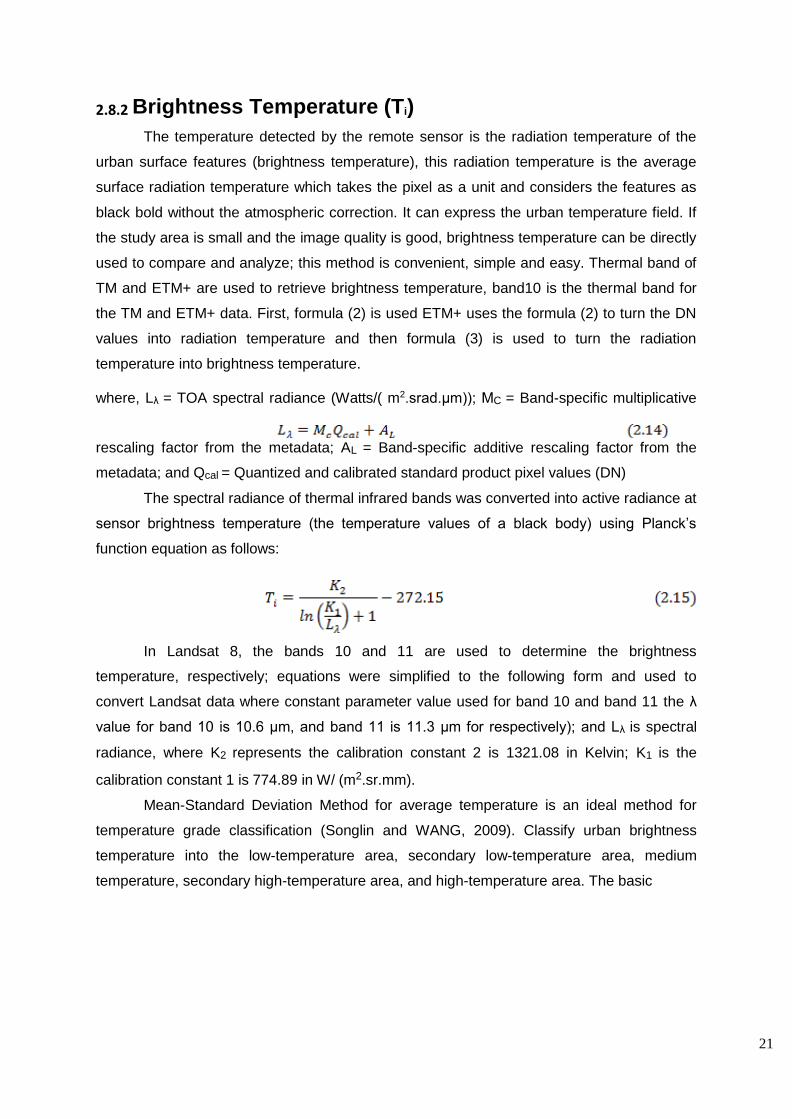
21
2.8.2 Brightness Temperature (Ti)
The temperature detected by the remote sensor is the radiation temperature of the
urban surface features (brightness temperature), this radiation temperature is the average
surface radiation temperature which takes the pixel as a unit and considers the features as
black bold without the atmospheric correction. It can express the urban temperature field. If
the study area is small and the image quality is good, brightness temperature can be directly
used to compare and analyze; this method is convenient, simple and easy. Thermal band of
TM and ETM+ are used to retrieve brightness temperature, band10 is the thermal band for
the TM and ETM+ data. First, formula (2) is used ETM+ uses the formula (2) to turn the DN
values into radiation temperature and then formula (3) is used to turn the radiation
temperature into brightness temperature.
where, Lλ = TOA spectral radiance (Watts/( m2.srad.μm)); MC = Band-specific multiplicative
rescaling factor from the metadata; AL = Band-specific additive rescaling factor from the
metadata; and Qcal = Quantized and calibrated standard product pixel values (DN)
The spectral radiance of thermal infrared bands was converted into active radiance at
sensor brightness temperature (the temperature values of a black body) using Planck’s
function equation as follows:
In Landsat 8, the bands 10 and 11 are used to determine the brightness
temperature, respectively; equations were simplified to the following form and used to
convert Landsat data where constant parameter value used for band 10 and band 11 the λ
value for band 10 is 10.6 μm, and band 11 is 11.3 μm for respectively); and Lλ is spectral
radiance, where K2 represents the calibration constant 2 is 1321.08 in Kelvin; K1 is the
calibration constant 1 is 774.89 in W/ (m2.sr.mm).
Mean-Standard Deviation Method for average temperature is an ideal method for
temperature grade classification (Songlin and WANG, 2009). Classify urban brightness
temperature into the low-temperature area, secondary low-temperature area, medium
temperature, secondary high-temperature area, and high-temperature area. The basic
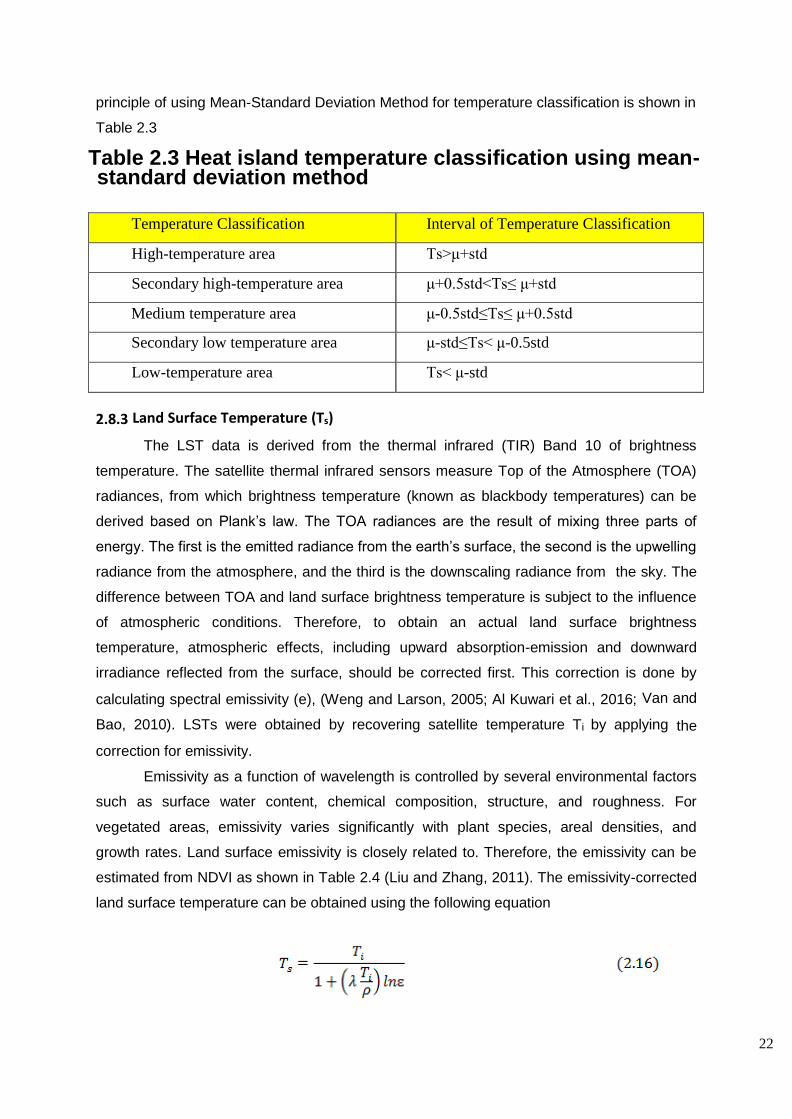
22
principle of using Mean-Standard Deviation Method for temperature classification is shown in
Table 2.3
Table 2.3 Heat island temperature classification using mean-standard deviation method
Temperature Classification Interval of Temperature Classification
High-temperature area Ts>μ+std
Secondary high-temperature area μ+0.5std<Ts≤ μ+std
Medium temperature area μ-0.5std≤Ts≤ μ+0.5std
Secondary low temperature area μ-std≤Ts< μ-0.5std
Low-temperature area Ts< μ-std
2.8.3 Land Surface Temperature (Ts)
The LST data is derived from the thermal infrared (TIR) Band 10 of brightness
temperature. The satellite thermal infrared sensors measure Top of the Atmosphere (TOA)
radiances, from which brightness temperature (known as blackbody temperatures) can be
derived based on Plank’s law. The TOA radiances are the result of mixing three parts of
energy. The first is the emitted radiance from the earth’s surface, the second is the upwelling
radiance from the atmosphere, and the third is the downscaling radiance from the sky. The
difference between TOA and land surface brightness temperature is subject to the influence
of atmospheric conditions. Therefore, to obtain an actual land surface brightness
temperature, atmospheric effects, including upward absorption-emission and downward
irradiance reflected from the surface, should be corrected first. This correction is done by
calculating spectral emissivity (e), (Weng and Larson, 2005; Al Kuwari et al., 2016; Van and
Bao, 2010). LSTs were obtained by recovering satellite temperature Ti by applying the
correction for emissivity.
Emissivity as a function of wavelength is controlled by several environmental factors
such as surface water content, chemical composition, structure, and roughness. For
vegetated areas, emissivity varies significantly with plant species, areal densities, and
growth rates. Land surface emissivity is closely related to. Therefore, the emissivity can be
estimated from NDVI as shown in Table 2.4 (Liu and Zhang, 2011). The emissivity-corrected
land surface temperature can be obtained using the following equation
23
where Ts represents land surface temperature; Ti indicates sensor brightness
temperature in Kelvin, λ is the wavelength of the emitted radiance; e is the land surface
spectral emissivity, and ρ is the Plank’s constant = 1.438*10-2mk.
Table 2.4 NDVI values and its corresponding values of Land-surface spectral emissivity
NDVI Land surface Emissivity(e)
NDVI<-0.185 0.995
-0.185≤NDVI<0.157 0.970
0.157≤NDVI≤0.727 1.0094+0.047ln(NDVI)
NDVI>0.727 0.990
2.8.4 LST Normalization Urban Heat Island (UHI)
Finally, the effect of UHI, at district level taking into consideration socio-economic
parameter, can be quantitatively described using urban thermal field variance index (UTFVI)
given by (Liu and Zhang, 2011; Zhang, 2006):
where is the land surface temperature, Tm is the mean of the land surface temperature of the
study area. UTFVI is divided into six levels by six different ecological evaluation indices (Liu
and Zhang, 2011; Zhang, 2006). Thresholds in the six UTFVI levels are shown in Table 2.5
Table 2.5 Threshold values of urban thermal field variance index
Urban Heat Island Phenomena
Urban thermal field variance index
Very Weak <0
Weak 0 – 0.005
Medium 0.005 – 0.01
Strong 0.01 -0.015
Stronger 0.015 – 0.2
Strongest >0.2
24
2.9 Sustainable Management Plan and Wastewater Reuse
Once an overall estimate of total water available is done, then the only a proper plan can be
made. These management plans include management of demand side as well as on the
supply side. In demand side, another requirement like irrigation, etc. can be optimized. While
on the supply side, a lot of works can be done which include, groundwater recharge,
modification of storage structures, rainwater harvesting, etc. Wastewater reuse is another
good option to be adopted. These wastewater even when it is partially treated can be used for
irrigation purpose. There is a wide scope in wastewater uses.
25
Chapter 4
CLIMATE CHANGE MODELLING
4.1 General
The GCM models developed by IPCC were used for the prediction of climate
variables. Depending upon the geographical coordinates of the study area, the historical
(from 1970 to 1999) and projected (from 2020 to 2079) data for all the RCP scenarios were
extracted from the nearest GCM location to the study area. A total of 7 GCM models were
used. These models were selected from a total of 56 models on the condition, that it has
variables of same realizations.
Presently there are as many as 56 models available under IPCC based on the Fifth
Assessment Report (AR5). And almost 30 different institutions is involved in the
development of these models. In AR5, the simulation is done for the historical data and four
different future scenarios, i.e. RCP 2.6, RCP 4.5, RCP 6.0 and RCP 8.5. These models are
developed for almost all the climate and hydrological variable. Out of the 56 different models,
presently only 21 models have future scenarios for all the RCPs condition. In fact, these 21
models also have a future scenario for a limited number of variables. In the present study,
five variable is considered, rainfall, maximum temperature, minimum temperature, Following
models have been used in the study:
• BCC CSM 1.1 M (Beijing Climate Centre, China)
• BCC CSM 1.1 (Beijing Climate Centre, China)
• FIO ESM (The First Institute of Oceanography, SOA China)
• MIROC ESM CHEM (Atmosphere and Ocean Research Institute, National Institute
for Environmental Studies, and Japan Agency for Marine-Earth Science and
Technology, Japan)
• NCAR CESM 1 (CAM5) (National Center for Atmospheric Research, USA)
• NCC NOR ESM1 -M (Bjerknes Centre for Climate Research, , Norway)
• NIMR KMO KadGEM2 A0 (National Institute of Meteorological Research,
Korea Meteorological Administration, South Korea)
26
4.2 Procedure The methodology consists of five steps:
Step 1. Data filling and error checking
The meteorological data obtained from IMD was first checked of any data error and missing
data. These values were filled based on temporal interpolation and statistical properties
Step 2. Trend analysis
Once a time series is obtained, trend analysis was done on a monthly basis using Student t-
test. Three variables were considered: monthly rainfall, monthly maximum temperature, and
Monthly minimum temperature. The null hypothesis is, the slope of the trend is 0, and,
i.e. there is no net change in the pattern.
Step 3. GCM downscaling
For downscaling the GCM variable, change factor method has been used. In this approach,
for rainfall, multiplicative change factor is used, and for temperature, the additive change
factor has been used. These change factors recalculated based on the change in the mean
monthly value of the variable.
Step 4. Predictions
Based on the change factor calculated, the projection for the variables was made using the
same factor to the historical data of the study area.
Step 5. Indices
To identify the extreme events, the rainfall of the region is divided into seven categories, i.e.
Extreme drought, severe drought, moderate drought, normal rainfall, moderate flood, severe
flood, and extreme flood.
The threshold value for this division is based on the deviation of total annual rainfall from the
mean, i.e. mean ± 0.5 std. dev, mean ± std. dev and mean ± 1.5 std. dev.
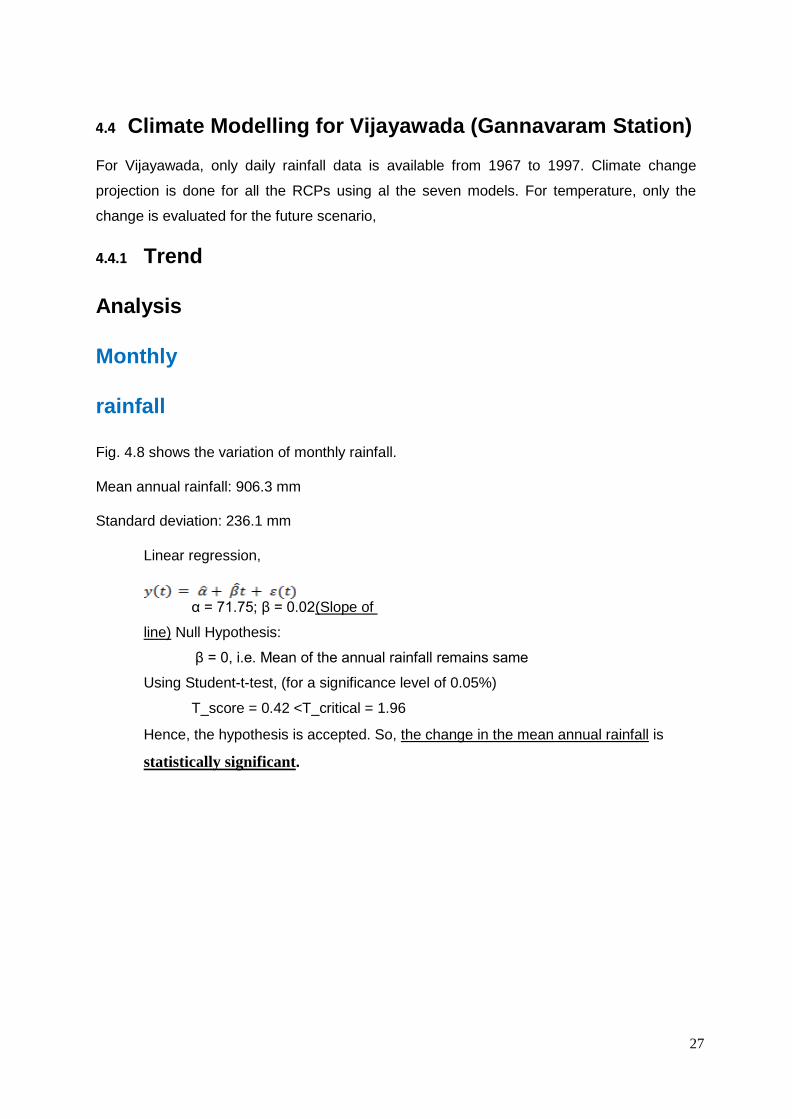
27
4.4 Climate Modelling for Vijayawada (Gannavaram Station)
For Vijayawada, only daily rainfall data is available from 1967 to 1997. Climate change
projection is done for all the RCPs using al the seven models. For temperature, only the
change is evaluated for the future scenario,
4.4.1 Trend
Analysis
Monthly
rainfall
Fig. 4.8 shows the variation of monthly rainfall.
Mean annual rainfall: 906.3 mm
Standard deviation: 236.1 mm
Linear regression,
α = 71.75; β = 0.02(Slope of
line) Null Hypothesis:
β = 0, i.e. Mean of the annual rainfall remains same
Using Student-t-test, (for a significance level of 0.05%)
T_score = 0.42 <T_critical = 1.96
Hence, the hypothesis is accepted. So, the change in the mean annual rainfall is
statistically significant.
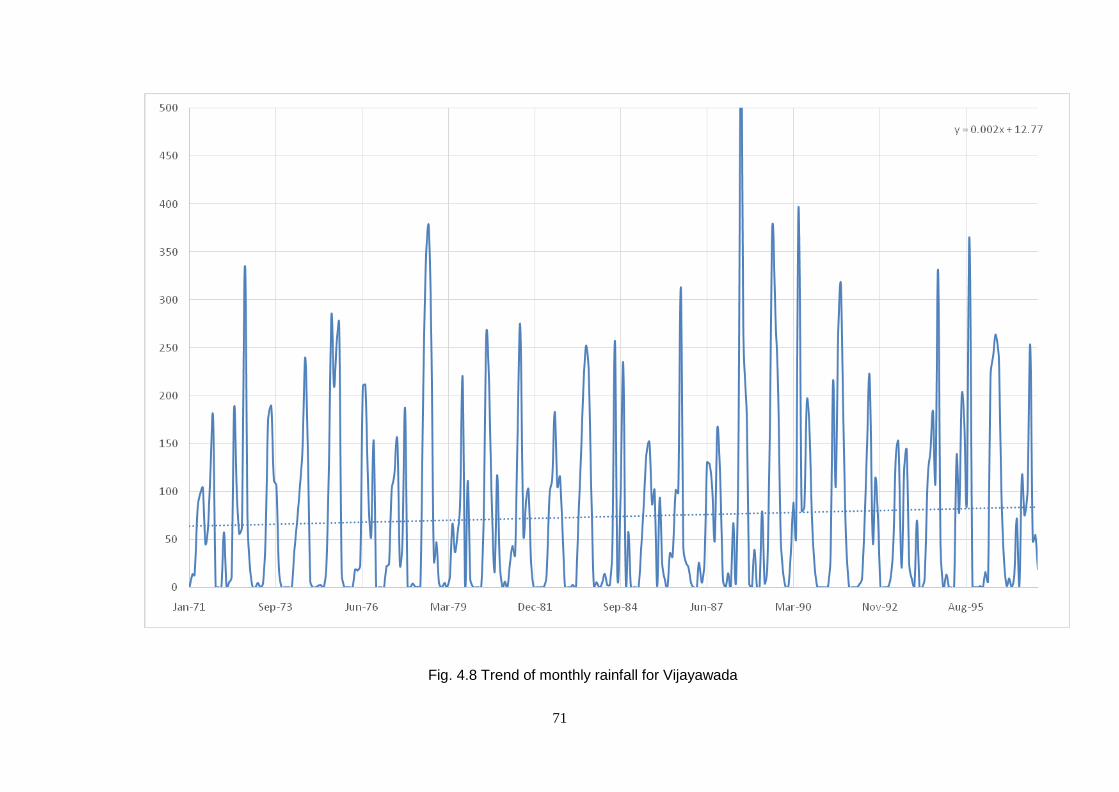
71
Fig. 4.8 Trend of monthly rainfall for Vijayawada
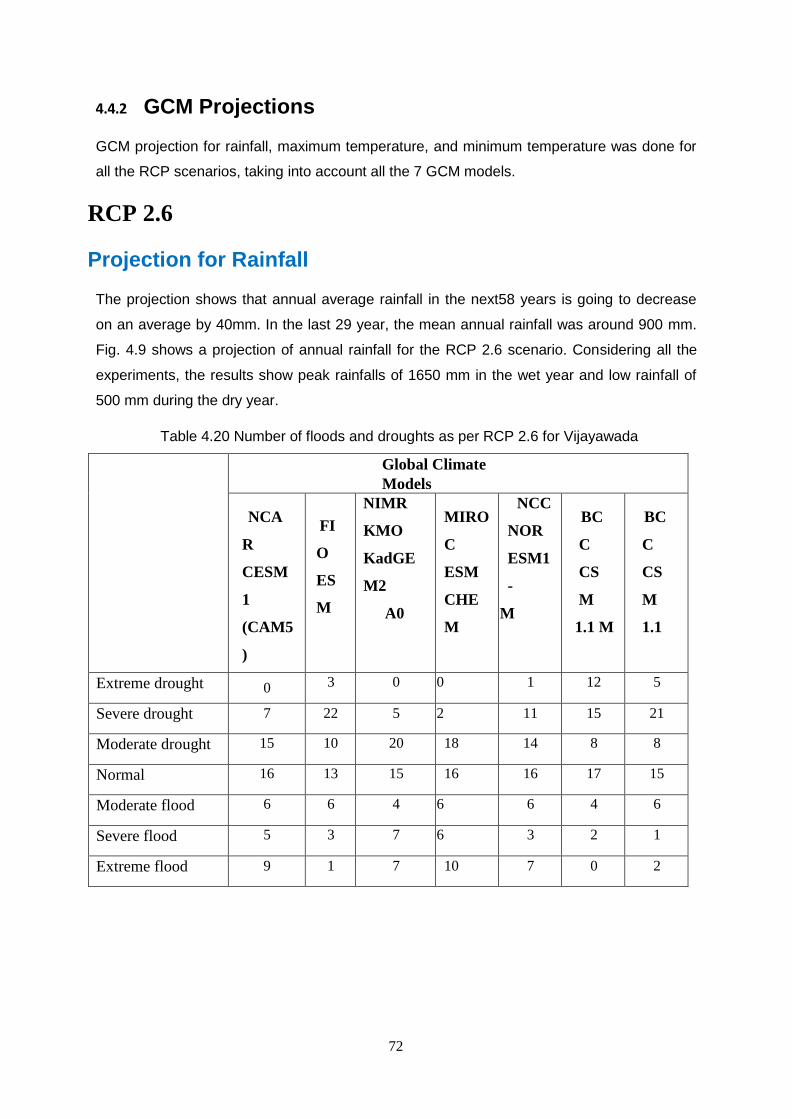
72
4.4.2 GCM Projections
GCM projection for rainfall, maximum temperature, and minimum temperature was done for
all the RCP scenarios, taking into account all the 7 GCM models.
RCP 2.6
Projection for Rainfall
The projection shows that annual average rainfall in the next58 years is going to decrease
on an average by 40mm. In the last 29 year, the mean annual rainfall was around 900 mm.
Fig. 4.9 shows a projection of annual rainfall for the RCP 2.6 scenario. Considering all the
experiments, the results show peak rainfalls of 1650 mm in the wet year and low rainfall of
500 mm during the dry year.
Table 4.20 Number of floods and droughts as per RCP 2.6 for Vijayawada
Global Climate
Models
NCA
R
CESM
1
(CAM5
)
FI
O
ES
M
NIMR
KMO
KadGE
M2
A0
MIRO
C
ESM
CHE
M
NCC
NOR
ESM1
-
M
BC
C
CS
M
1.1 M
BC
C
CS
M
1.1
Extreme drought 0 3 0 0 1 12 5
Severe drought 7 22 5 2 11 15 21
Moderate drought 15 10 20 18 14 8 8
Normal 16 13 15 16 16 17 15
Moderate flood 6 6 4 6 6 4 6
Severe flood 5 3 7 6 3 2 1
Extreme flood 9 1 7 10 7 0 2
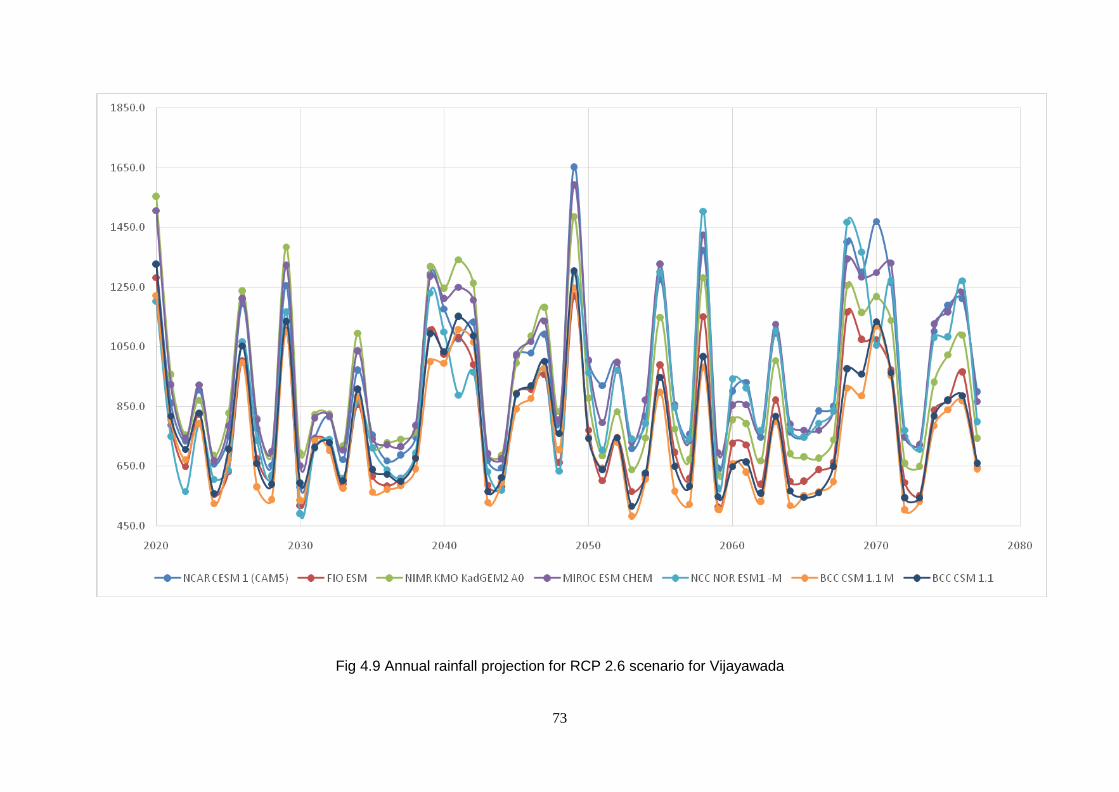
73
Fig 4.9 Annual rainfall projection for RCP 2.6 scenario for Vijayawada
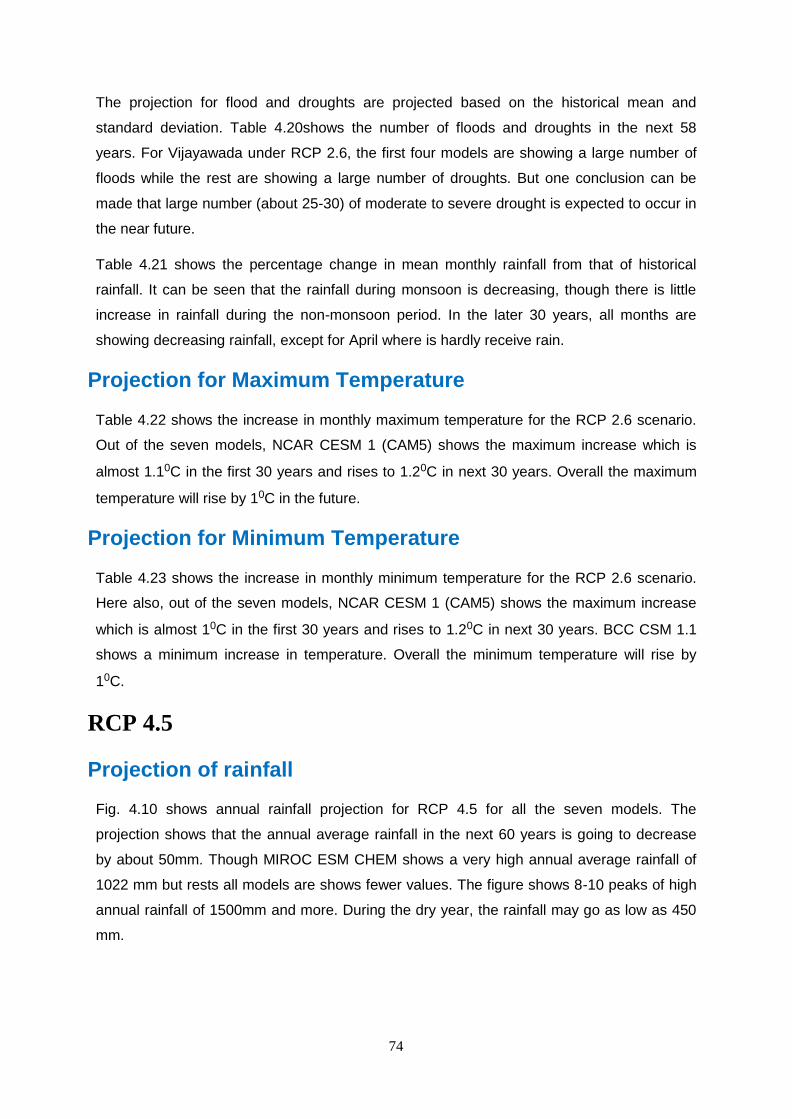
74
The projection for flood and droughts are projected based on the historical mean and
standard deviation. Table 4.20shows the number of floods and droughts in the next 58
years. For Vijayawada under RCP 2.6, the first four models are showing a large number of
floods while the rest are showing a large number of droughts. But one conclusion can be
made that large number (about 25-30) of moderate to severe drought is expected to occur in
the near future.
Table 4.21 shows the percentage change in mean monthly rainfall from that of historical
rainfall. It can be seen that the rainfall during monsoon is decreasing, though there is little
increase in rainfall during the non-monsoon period. In the later 30 years, all months are
showing decreasing rainfall, except for April where is hardly receive rain.
Projection for Maximum Temperature
Table 4.22 shows the increase in monthly maximum temperature for the RCP 2.6 scenario.
Out of the seven models, NCAR CESM 1 (CAM5) shows the maximum increase which is
almost 1.10C in the first 30 years and rises to 1.20C in next 30 years. Overall the maximum
temperature will rise by 10C in the future.
Projection for Minimum Temperature
Table 4.23 shows the increase in monthly minimum temperature for the RCP 2.6 scenario.
Here also, out of the seven models, NCAR CESM 1 (CAM5) shows the maximum increase
which is almost 10C in the first 30 years and rises to 1.20C in next 30 years. BCC CSM 1.1
shows a minimum increase in temperature. Overall the minimum temperature will rise by
10C.
RCP 4.5
Projection of rainfall
Fig. 4.10 shows annual rainfall projection for RCP 4.5 for all the seven models. The
projection shows that the annual average rainfall in the next 60 years is going to decrease
by about 50mm. Though MIROC ESM CHEM shows a very high annual average rainfall of
1022 mm but rests all models are shows fewer values. The figure shows 8-10 peaks of high
annual rainfall of 1500mm and more. During the dry year, the rainfall may go as low as 450
mm.
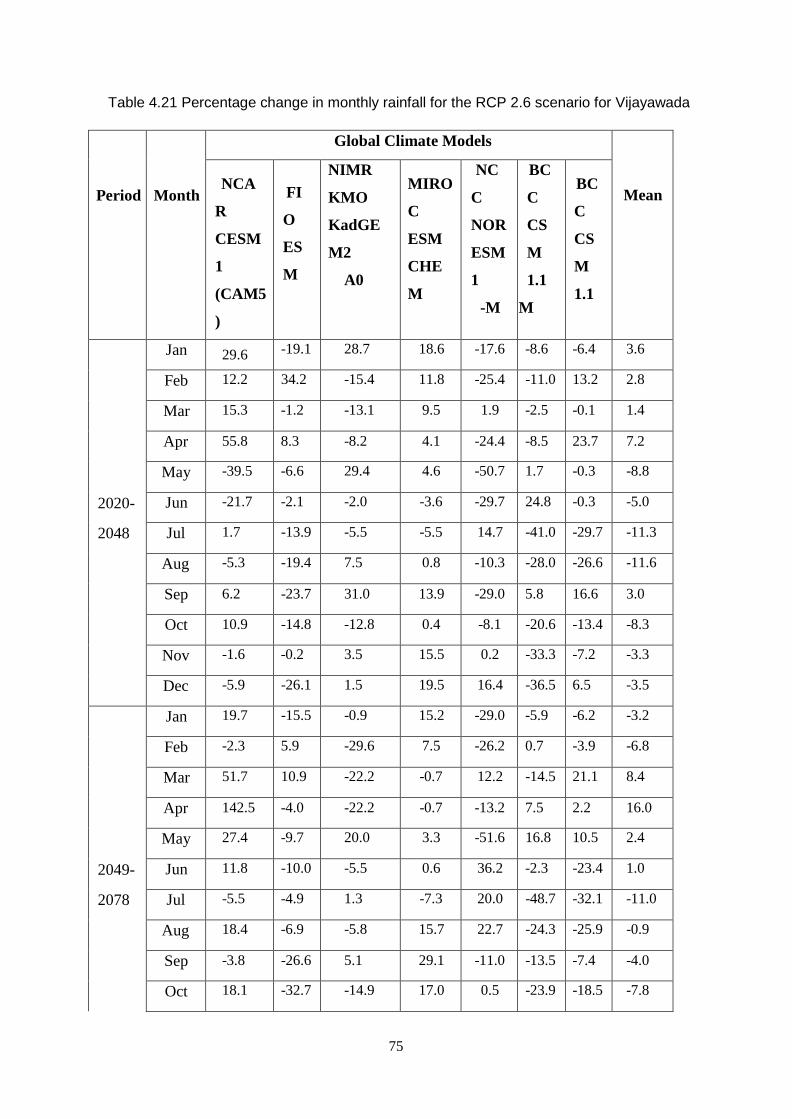
75
Table 4.21 Percentage change in monthly rainfall for the RCP 2.6 scenario for Vijayawada
Period
Month
Global Climate Models
Mean
NCA
R
CESM
1
(CAM5
)
FI
O
ES
M
NIMR
KMO
KadGE
M2
A0
MIRO
C
ESM
CHE
M
NC
C
NOR
ESM
1
-M
BC
C
CS
M
1.1
M
BC
C
CS
M
1.1
Jan 29.6 -19.1 28.7 18.6 -17.6 -8.6 -6.4 3.6
Feb 12.2 34.2 -15.4 11.8 -25.4 -11.0 13.2 2.8
Mar 15.3 -1.2 -13.1 9.5 1.9 -2.5 -0.1 1.4
Apr 55.8 8.3 -8.2 4.1 -24.4 -8.5 23.7 7.2
May -39.5 -6.6 29.4 4.6 -50.7 1.7 -0.3 -8.8
2020- Jun -21.7 -2.1 -2.0 -3.6 -29.7 24.8 -0.3 -5.0
2048 Jul 1.7 -13.9 -5.5 -5.5 14.7 -41.0 -29.7 -11.3
Aug -5.3 -19.4 7.5 0.8 -10.3 -28.0 -26.6 -11.6
Sep 6.2 -23.7 31.0 13.9 -29.0 5.8 16.6 3.0
Oct 10.9 -14.8 -12.8 0.4 -8.1 -20.6 -13.4 -8.3
Nov -1.6 -0.2 3.5 15.5 0.2 -33.3 -7.2 -3.3
Dec -5.9 -26.1 1.5 19.5 16.4 -36.5 6.5 -3.5
Jan 19.7 -15.5 -0.9 15.2 -29.0 -5.9 -6.2 -3.2
Feb -2.3 5.9 -29.6 7.5 -26.2 0.7 -3.9 -6.8
Mar 51.7 10.9 -22.2 -0.7 12.2 -14.5 21.1 8.4
Apr 142.5 -4.0 -22.2 -0.7 -13.2 7.5 2.2 16.0
May 27.4 -9.7 20.0 3.3 -51.6 16.8 10.5 2.4
2049- Jun 11.8 -10.0 -5.5 0.6 36.2 -2.3 -23.4 1.0
2078 Jul -5.5 -4.9 1.3 -7.3 20.0 -48.7 -32.1 -11.0
Aug 18.4 -6.9 -5.8 15.7 22.7 -24.3 -25.9 -0.9
Sep -3.8 -26.6 5.1 29.1 -11.0 -13.5 -7.4 -4.0
Oct 18.1 -32.7 -14.9 17.0 0.5 -23.9 -18.5 -7.8

76
Nov 2.2 -7.1 8.4 16.2 -4.5 -24.9 8.1 -0.2
Dec -8.3 -13.5 -3.7 16.2 -15.0 -14.1 -29.3 -9.7
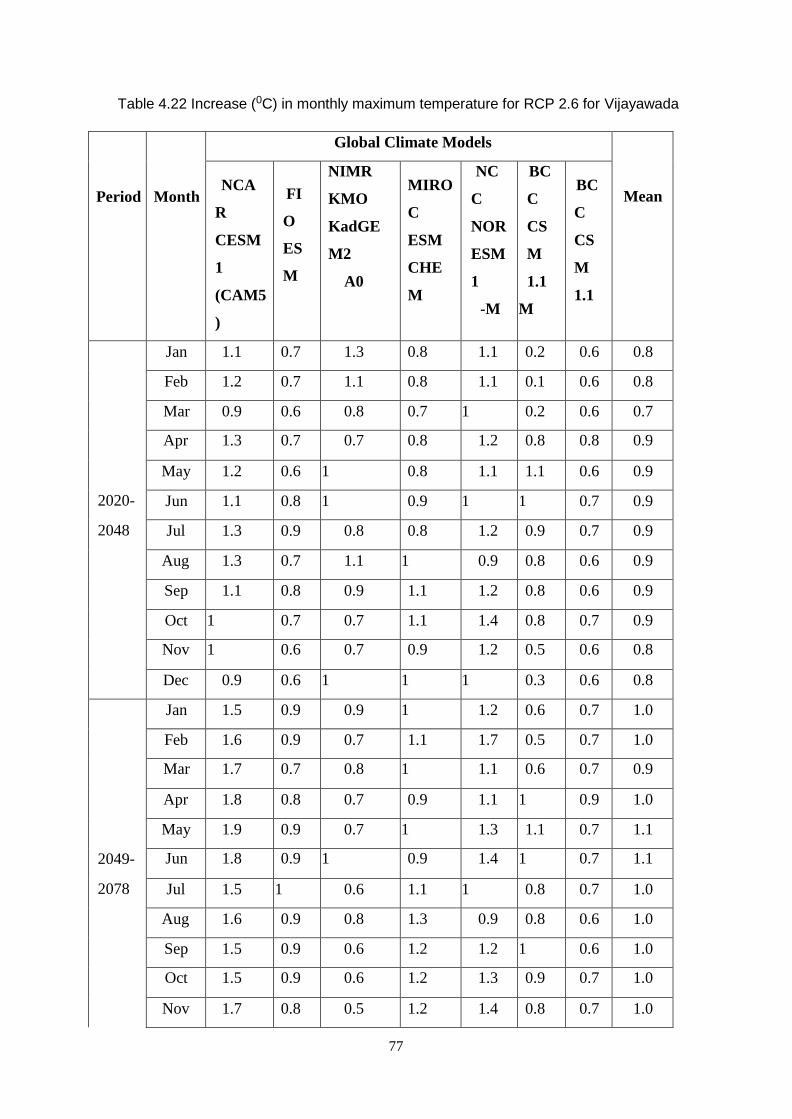
77
Table 4.22 Increase (0C) in monthly maximum temperature for RCP 2.6 for Vijayawada
Period
Month
Global Climate Models
Mean
NCA
R
CESM
1
(CAM5
)
FI
O
ES
M
NIMR
KMO
KadGE
M2
A0
MIRO
C
ESM
CHE
M
NC
C
NOR
ESM
1
-M
BC
C
CS
M
1.1
M
BC
C
CS
M
1.1
Jan 1.1 0.7 1.3 0.8 1.1 0.2 0.6 0.8
Feb 1.2 0.7 1.1 0.8 1.1 0.1 0.6 0.8
Mar 0.9 0.6 0.8 0.7 1 0.2 0.6 0.7
Apr 1.3 0.7 0.7 0.8 1.2 0.8 0.8 0.9
May 1.2 0.6 1 0.8 1.1 1.1 0.6 0.9
2020- Jun 1.1 0.8 1 0.9 1 1 0.7 0.9
2048 Jul 1.3 0.9 0.8 0.8 1.2 0.9 0.7 0.9
Aug 1.3 0.7 1.1 1 0.9 0.8 0.6 0.9
Sep 1.1 0.8 0.9 1.1 1.2 0.8 0.6 0.9
Oct 1 0.7 0.7 1.1 1.4 0.8 0.7 0.9
Nov 1 0.6 0.7 0.9 1.2 0.5 0.6 0.8
Dec 0.9 0.6 1 1 1 0.3 0.6 0.8
Jan 1.5 0.9 0.9 1 1.2 0.6 0.7 1.0
Feb 1.6 0.9 0.7 1.1 1.7 0.5 0.7 1.0
Mar 1.7 0.7 0.8 1 1.1 0.6 0.7 0.9
Apr 1.8 0.8 0.7 0.9 1.1 1 0.9 1.0
May 1.9 0.9 0.7 1 1.3 1.1 0.7 1.1
2049- Jun 1.8 0.9 1 0.9 1.4 1 0.7 1.1
2078 Jul 1.5 1 0.6 1.1 1 0.8 0.7 1.0
Aug 1.6 0.9 0.8 1.3 0.9 0.8 0.6 1.0
Sep 1.5 0.9 0.6 1.2 1.2 1 0.6 1.0
Oct 1.5 0.9 0.6 1.2 1.3 0.9 0.7 1.0
Nov 1.7 0.8 0.5 1.2 1.4 0.8 0.7 1.0

78
Dec 1.4 0.9 0.6 1.2 1.2 0.6 0.6 0.9
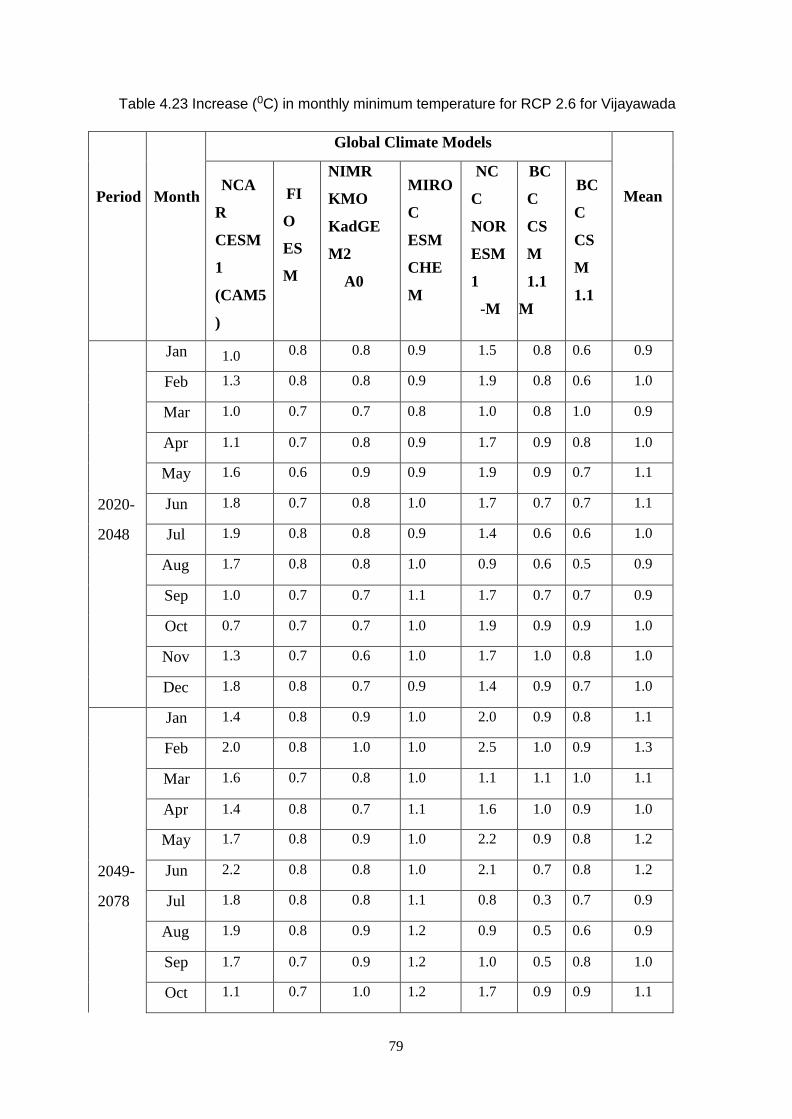
79
Table 4.23 Increase (0C) in monthly minimum temperature for RCP 2.6 for Vijayawada
Period
Month
Global Climate Models
Mean
NCA
R
CESM
1
(CAM5
)
FI
O
ES
M
NIMR
KMO
KadGE
M2
A0
MIRO
C
ESM
CHE
M
NC
C
NOR
ESM
1
-M
BC
C
CS
M
1.1
M
BC
C
CS
M
1.1
Jan 1.0 0.8 0.8 0.9 1.5 0.8 0.6 0.9
Feb 1.3 0.8 0.8 0.9 1.9 0.8 0.6 1.0
Mar 1.0 0.7 0.7 0.8 1.0 0.8 1.0 0.9
Apr 1.1 0.7 0.8 0.9 1.7 0.9 0.8 1.0
May 1.6 0.6 0.9 0.9 1.9 0.9 0.7 1.1
2020- Jun 1.8 0.7 0.8 1.0 1.7 0.7 0.7 1.1
2048 Jul 1.9 0.8 0.8 0.9 1.4 0.6 0.6 1.0
Aug 1.7 0.8 0.8 1.0 0.9 0.6 0.5 0.9
Sep 1.0 0.7 0.7 1.1 1.7 0.7 0.7 0.9
Oct 0.7 0.7 0.7 1.0 1.9 0.9 0.9 1.0
Nov 1.3 0.7 0.6 1.0 1.7 1.0 0.8 1.0
Dec 1.8 0.8 0.7 0.9 1.4 0.9 0.7 1.0
Jan 1.4 0.8 0.9 1.0 2.0 0.9 0.8 1.1
Feb 2.0 0.8 1.0 1.0 2.5 1.0 0.9 1.3
Mar 1.6 0.7 0.8 1.0 1.1 1.1 1.0 1.1
Apr 1.4 0.8 0.7 1.1 1.6 1.0 0.9 1.0
May 1.7 0.8 0.9 1.0 2.2 0.9 0.8 1.2
2049- Jun 2.2 0.8 0.8 1.0 2.1 0.7 0.8 1.2
2078 Jul 1.8 0.8 0.8 1.1 0.8 0.3 0.7 0.9
Aug 1.9 0.8 0.9 1.2 0.9 0.5 0.6 0.9
Sep 1.7 0.7 0.9 1.2 1.0 0.5 0.8 1.0
Oct 1.1 0.7 1.0 1.2 1.7 0.9 0.9 1.1

80
Nov 1.8 0.7 0.8 1.2 2.0 1.0 0.9 1.2
Dec 2.3 0.8 0.8 1.1 2.0 1.0 0.8 1.2
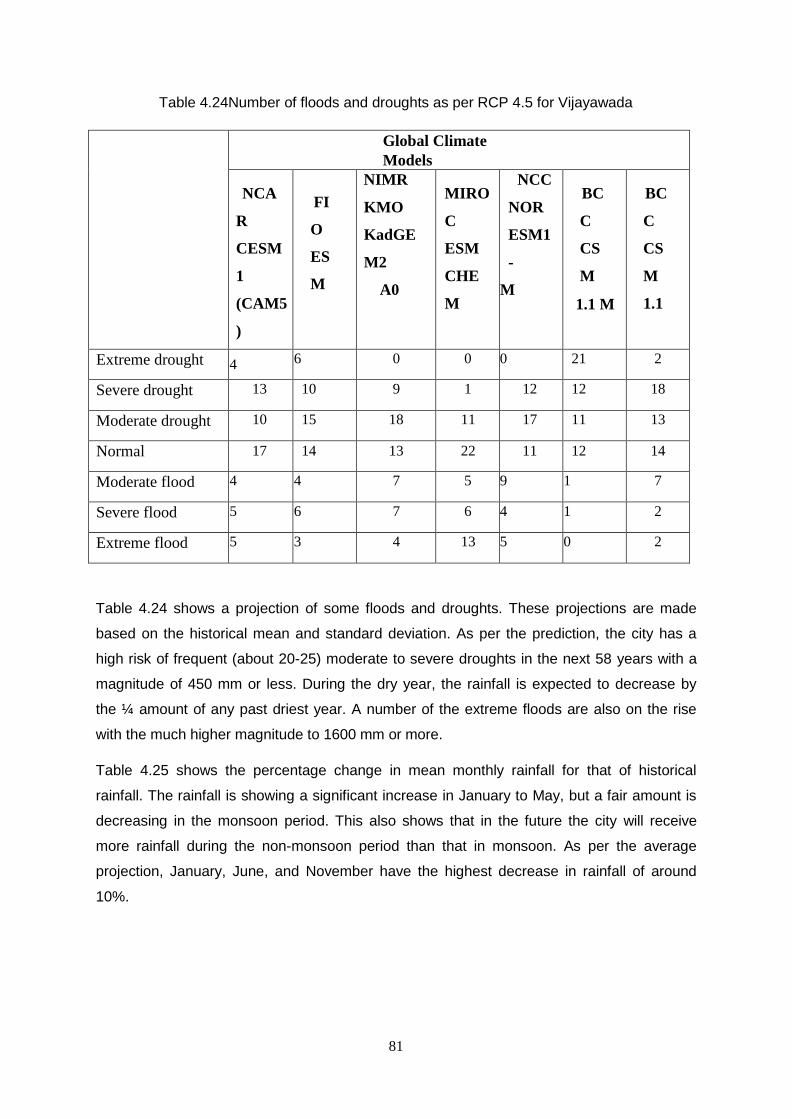
81
Table 4.24Number of floods and droughts as per RCP 4.5 for Vijayawada
Global Climate
Models
NCA
R
CESM
1
(CAM5
)
FI
O
ES
M
NIMR
KMO
KadGE
M2
A0
MIRO
C
ESM
CHE
M
NCC
NOR
ESM1
-
M
BC
C
CS
M
1.1 M
BC
C
CS
M
1.1
Extreme drought 4 6 0 0 0 21 2
Severe drought 13 10 9 1 12 12 18
Moderate drought 10 15 18 11 17 11 13
Normal 17 14 13 22 11 12 14
Moderate flood 4 4 7 5 9 1 7
Severe flood 5 6 7 6 4 1 2
Extreme flood 5 3 4 13 5 0 2
Table 4.24 shows a projection of some floods and droughts. These projections are made
based on the historical mean and standard deviation. As per the prediction, the city has a
high risk of frequent (about 20-25) moderate to severe droughts in the next 58 years with a
magnitude of 450 mm or less. During the dry year, the rainfall is expected to decrease by
the ¼ amount of any past driest year. A number of the extreme floods are also on the rise
with the much higher magnitude to 1600 mm or more.
Table 4.25 shows the percentage change in mean monthly rainfall for that of historical
rainfall. The rainfall is showing a significant increase in January to May, but a fair amount is
decreasing in the monsoon period. This also shows that in the future the city will receive
more rainfall during the non-monsoon period than that in monsoon. As per the average
projection, January, June, and November have the highest decrease in rainfall of around
10%.
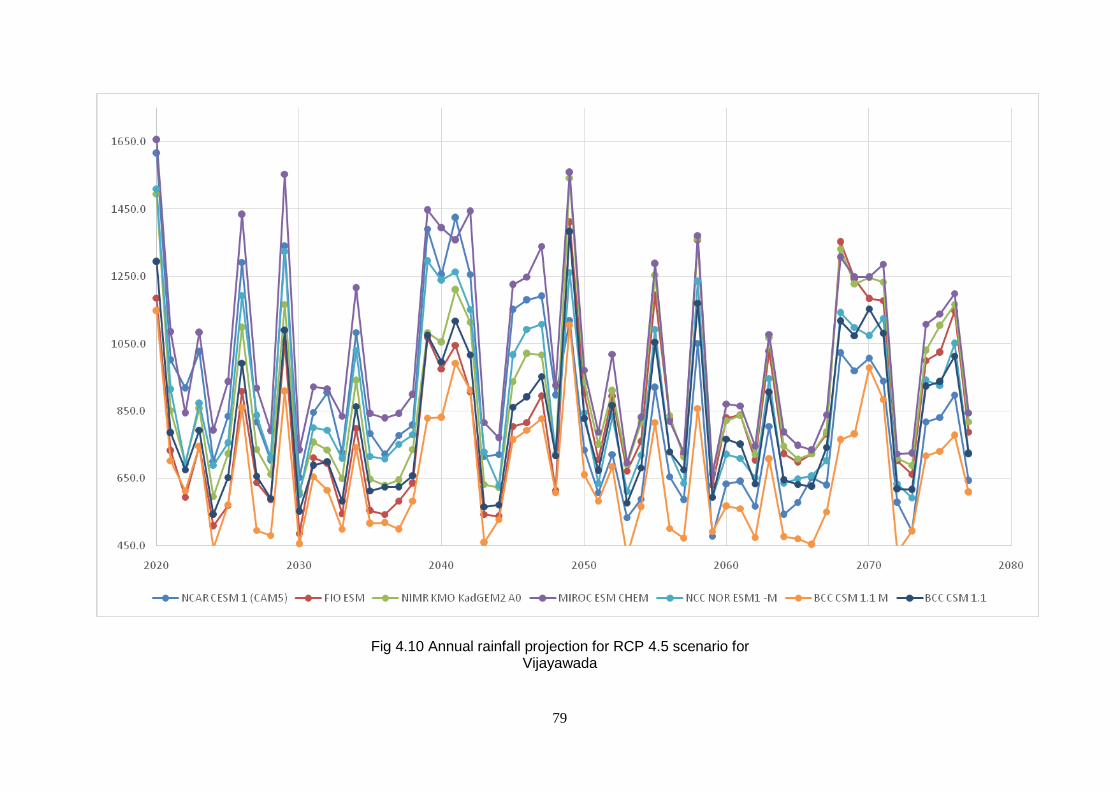
79
Fig 4.10 Annual rainfall projection for RCP 4.5 scenario for Vijayawada
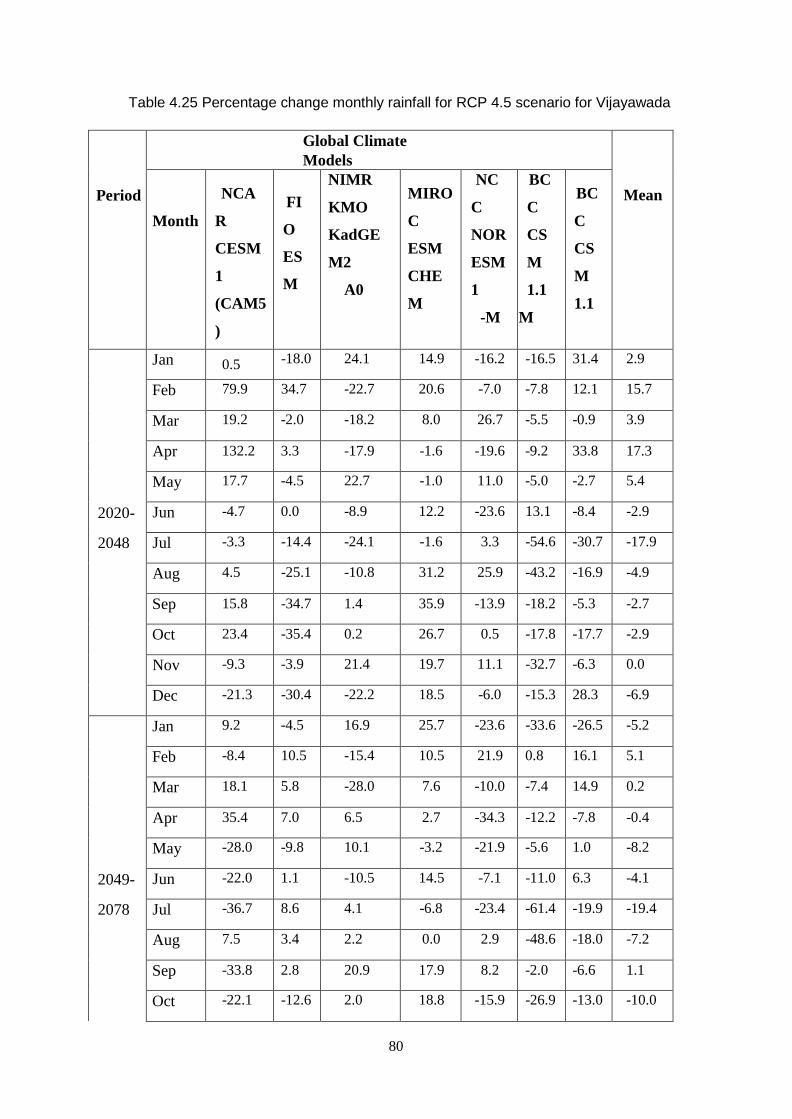
80
Table 4.25 Percentage change monthly rainfall for RCP 4.5 scenario for Vijayawada
Period
Global Climate
Models
Mean
Month
NCA
R
CESM
1
(CAM5
)
FI
O
ES
M
NIMR
KMO
KadGE
M2
A0
MIRO
C
ESM
CHE
M
NC
C
NOR
ESM
1
-M
BC
C
CS
M
1.1
M
BC
C
CS
M
1.1
Jan 0.5 -18.0 24.1 14.9 -16.2 -16.5 31.4 2.9
Feb 79.9 34.7 -22.7 20.6 -7.0 -7.8 12.1 15.7
Mar 19.2 -2.0 -18.2 8.0 26.7 -5.5 -0.9 3.9
Apr 132.2 3.3 -17.9 -1.6 -19.6 -9.2 33.8 17.3
May 17.7 -4.5 22.7 -1.0 11.0 -5.0 -2.7 5.4
2020- Jun -4.7 0.0 -8.9 12.2 -23.6 13.1 -8.4 -2.9
2048 Jul -3.3 -14.4 -24.1 -1.6 3.3 -54.6 -30.7 -17.9
Aug 4.5 -25.1 -10.8 31.2 25.9 -43.2 -16.9 -4.9
Sep 15.8 -34.7 1.4 35.9 -13.9 -18.2 -5.3 -2.7
Oct 23.4 -35.4 0.2 26.7 0.5 -17.8 -17.7 -2.9
Nov -9.3 -3.9 21.4 19.7 11.1 -32.7 -6.3 0.0
Dec -21.3 -30.4 -22.2 18.5 -6.0 -15.3 28.3 -6.9
Jan 9.2 -4.5 16.9 25.7 -23.6 -33.6 -26.5 -5.2
Feb -8.4 10.5 -15.4 10.5 21.9 0.8 16.1 5.1
Mar 18.1 5.8 -28.0 7.6 -10.0 -7.4 14.9 0.2
Apr 35.4 7.0 6.5 2.7 -34.3 -12.2 -7.8 -0.4
May -28.0 -9.8 10.1 -3.2 -21.9 -5.6 1.0 -8.2
2049- Jun -22.0 1.1 -10.5 14.5 -7.1 -11.0 6.3 -4.1
2078 Jul -36.7 8.6 4.1 -6.8 -23.4 -61.4 -19.9 -19.4
Aug 7.5 3.4 2.2 0.0 2.9 -48.6 -18.0 -7.2
Sep -33.8 2.8 20.9 17.9 8.2 -2.0 -6.6 1.1
Oct -22.1 -12.6 2.0 18.8 -15.9 -26.9 -13.0 -10.0

81
Nov -9.9 19.1 16.8 18.5 5.4 -14.6 29.2 9.2
Dec 3.1 -3.8 -14.9 14.1 4.4 -29.5 2.8 -3.4
82
Projection for Maximum Temperature
Table 4.26 shows the increase in monthly maximum temperature for RCP 4.5 scenario. Out
of the seven models, NCAR CESM 1 (CAM5) shows the maximum increase which is about
10C to in the first 30 years and rises to 1.30C to 1.70C in next 30 years. BCC CSM 1.1 shows
a minimum increase in temperature. Overall the maximum temperature will rise by about 10C
in 2020 to 2048 and by 1.50C in 2049-2078.
Projection for Minimum Temperature
Table 4.27 shows the increase in monthly minimum temperature for the RCP4.5 scenario.
Here also, out of the seven models, NCAR CESM 1 (CAM5) shows the maximum increase
which is almost 1.40C in the first 30 years and rises to2.70C in next 30 years. BCC CSM 1.1
shows a minimum increase in temperature. Overall the maximum temperature will rise by
10C in 2020 to 2048 and by 1.50C in 2049-2078.
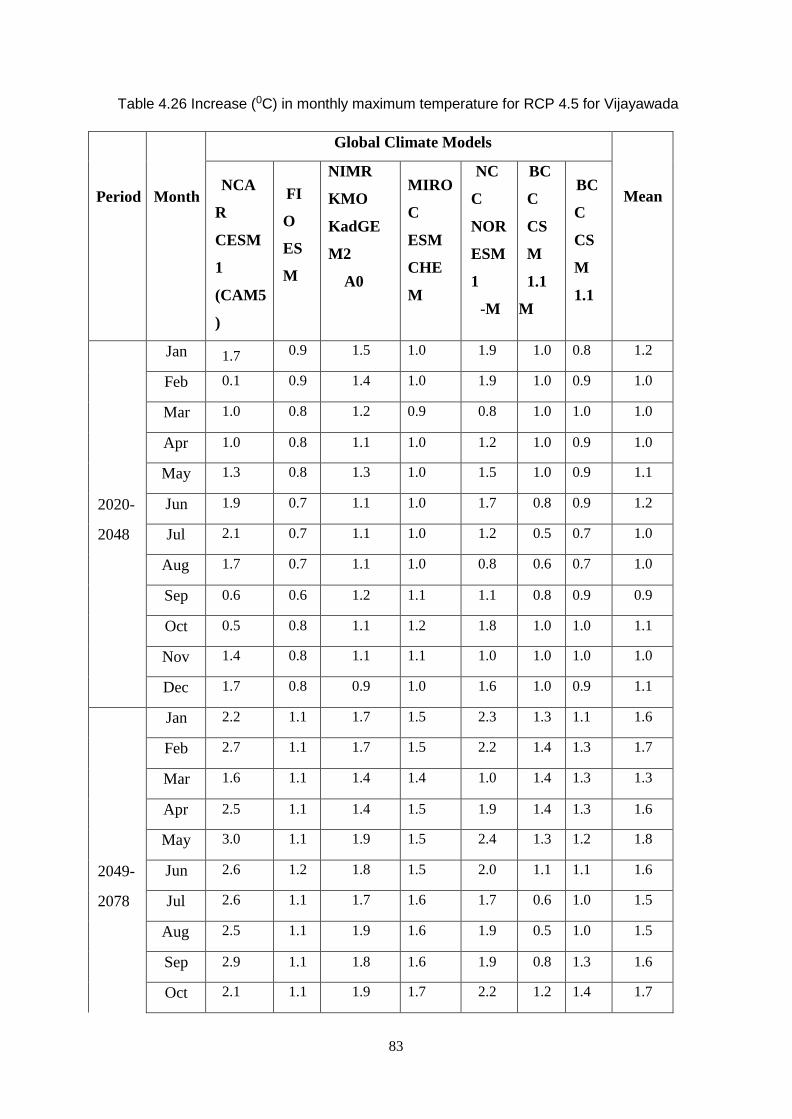
83
Table 4.26 Increase (0C) in monthly maximum temperature for RCP 4.5 for Vijayawada
Period
Month
Global Climate Models
Mean
NCA
R
CESM
1
(CAM5
)
FI
O
ES
M
NIMR
KMO
KadGE
M2
A0
MIRO
C
ESM
CHE
M
NC
C
NOR
ESM
1
-M
BC
C
CS
M
1.1
M
BC
C
CS
M
1.1
Jan 1.7 0.9 1.5 1.0 1.9 1.0 0.8 1.2
Feb 0.1 0.9 1.4 1.0 1.9 1.0 0.9 1.0
Mar 1.0 0.8 1.2 0.9 0.8 1.0 1.0 1.0
Apr 1.0 0.8 1.1 1.0 1.2 1.0 0.9 1.0
May 1.3 0.8 1.3 1.0 1.5 1.0 0.9 1.1
2020- Jun 1.9 0.7 1.1 1.0 1.7 0.8 0.9 1.2
2048 Jul 2.1 0.7 1.1 1.0 1.2 0.5 0.7 1.0
Aug 1.7 0.7 1.1 1.0 0.8 0.6 0.7 1.0
Sep 0.6 0.6 1.2 1.1 1.1 0.8 0.9 0.9
Oct 0.5 0.8 1.1 1.2 1.8 1.0 1.0 1.1
Nov 1.4 0.8 1.1 1.1 1.0 1.0 1.0 1.0
Dec 1.7 0.8 0.9 1.0 1.6 1.0 0.9 1.1
Jan 2.2 1.1 1.7 1.5 2.3 1.3 1.1 1.6
Feb 2.7 1.1 1.7 1.5 2.2 1.4 1.3 1.7
Mar 1.6 1.1 1.4 1.4 1.0 1.4 1.3 1.3
Apr 2.5 1.1 1.4 1.5 1.9 1.4 1.3 1.6
May 3.0 1.1 1.9 1.5 2.4 1.3 1.2 1.8
2049- Jun 2.6 1.2 1.8 1.5 2.0 1.1 1.1 1.6
2078 Jul 2.6 1.1 1.7 1.6 1.7 0.6 1.0 1.5
Aug 2.5 1.1 1.9 1.6 1.9 0.5 1.0 1.5
Sep 2.9 1.1 1.8 1.6 1.9 0.8 1.3 1.6
Oct 2.1 1.1 1.9 1.7 2.2 1.2 1.4 1.7

84
Nov 2.6 1.1 1.5 1.7 2.3 1.3 1.3 1.7
Dec 2.7 1.2 1.4 1.6 1.9 1.2 1.1 1.6
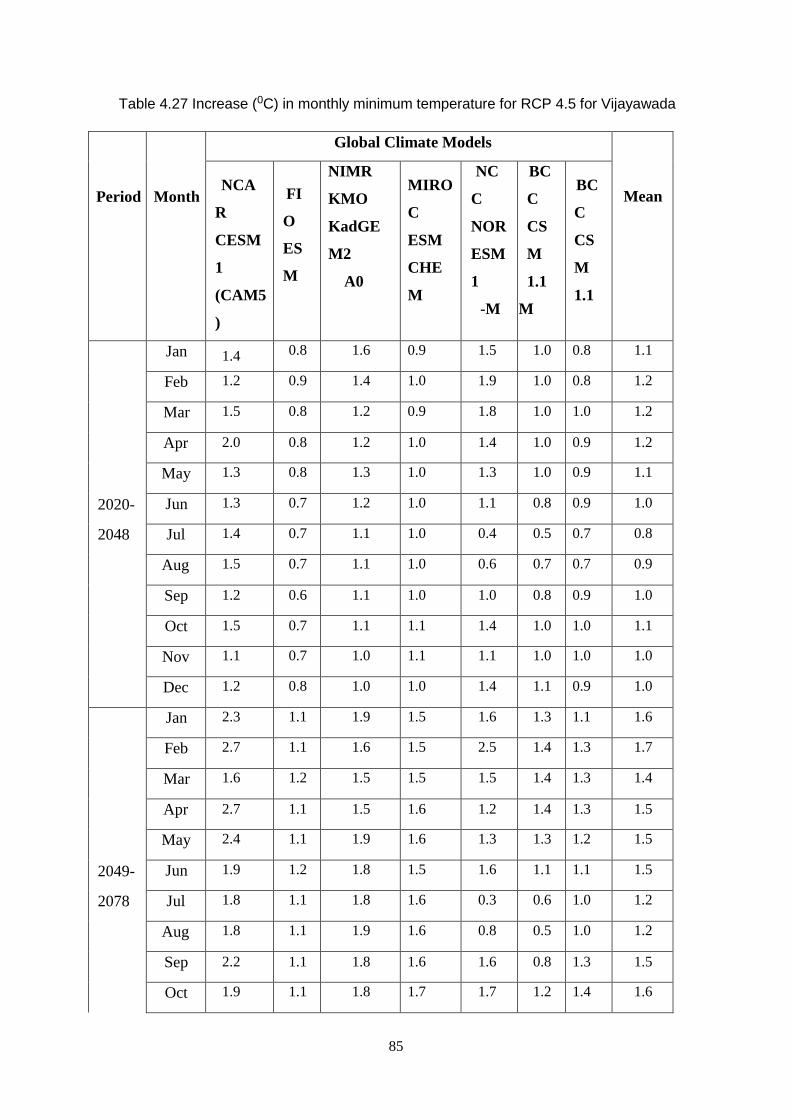
85
Table 4.27 Increase (0C) in monthly minimum temperature for RCP 4.5 for Vijayawada
Period
Month
Global Climate Models
Mean
NCA
R
CESM
1
(CAM5
)
FI
O
ES
M
NIMR
KMO
KadGE
M2
A0
MIRO
C
ESM
CHE
M
NC
C
NOR
ESM
1
-M
BC
C
CS
M
1.1
M
BC
C
CS
M
1.1
Jan 1.4 0.8 1.6 0.9 1.5 1.0 0.8 1.1
Feb 1.2 0.9 1.4 1.0 1.9 1.0 0.8 1.2
Mar 1.5 0.8 1.2 0.9 1.8 1.0 1.0 1.2
Apr 2.0 0.8 1.2 1.0 1.4 1.0 0.9 1.2
May 1.3 0.8 1.3 1.0 1.3 1.0 0.9 1.1
2020- Jun 1.3 0.7 1.2 1.0 1.1 0.8 0.9 1.0
2048 Jul 1.4 0.7 1.1 1.0 0.4 0.5 0.7 0.8
Aug 1.5 0.7 1.1 1.0 0.6 0.7 0.7 0.9
Sep 1.2 0.6 1.1 1.0 1.0 0.8 0.9 1.0
Oct 1.5 0.7 1.1 1.1 1.4 1.0 1.0 1.1
Nov 1.1 0.7 1.0 1.1 1.1 1.0 1.0 1.0
Dec 1.2 0.8 1.0 1.0 1.4 1.1 0.9 1.0
Jan 2.3 1.1 1.9 1.5 1.6 1.3 1.1 1.6
Feb 2.7 1.1 1.6 1.5 2.5 1.4 1.3 1.7
Mar 1.6 1.2 1.5 1.5 1.5 1.4 1.3 1.4
Apr 2.7 1.1 1.5 1.6 1.2 1.4 1.3 1.5
May 2.4 1.1 1.9 1.6 1.3 1.3 1.2 1.5
2049- Jun 1.9 1.2 1.8 1.5 1.6 1.1 1.1 1.5
2078 Jul 1.8 1.1 1.8 1.6 0.3 0.6 1.0 1.2
Aug 1.8 1.1 1.9 1.6 0.8 0.5 1.0 1.2
Sep 2.2 1.1 1.8 1.6 1.6 0.8 1.3 1.5
Oct 1.9 1.1 1.8 1.7 1.7 1.2 1.4 1.6

86
Nov 2.1 1.1 1.5 1.7 2.0 1.3 1.3 1.6
Dec 2.2 1.2 1.6 1.6 1.8 1.2 1.1 1.5
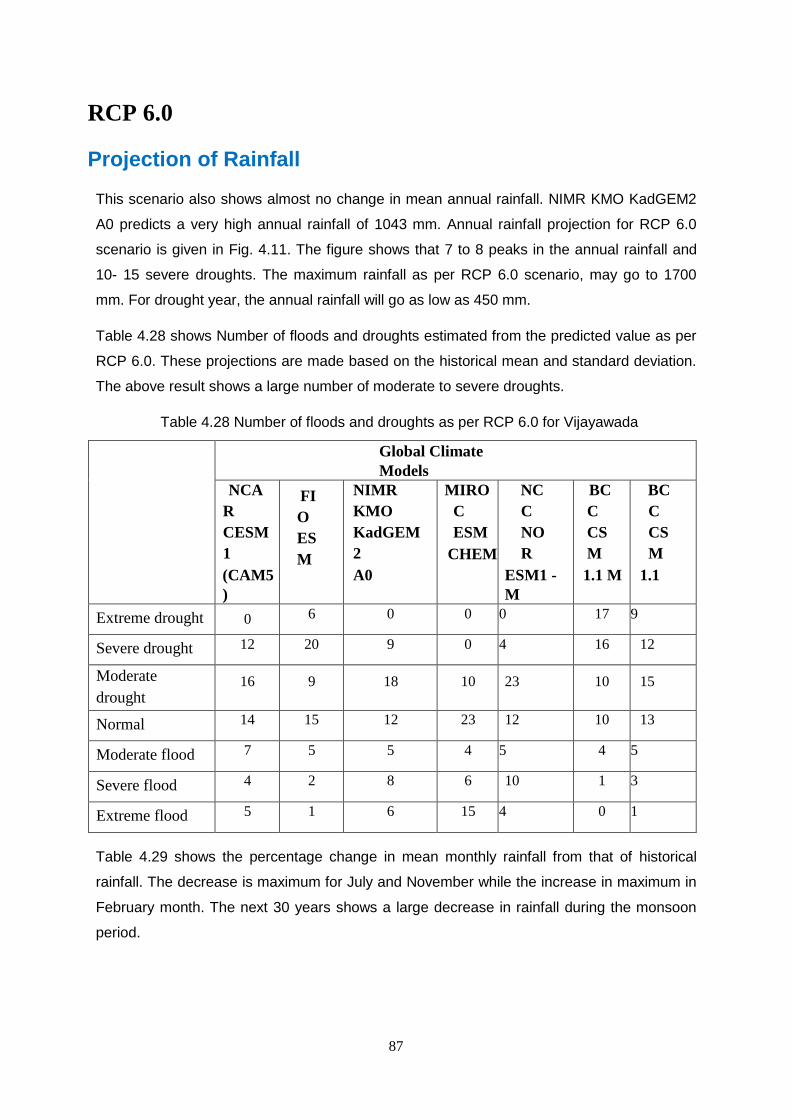
87
RCP 6.0
Projection of Rainfall
This scenario also shows almost no change in mean annual rainfall. NIMR KMO KadGEM2
A0 predicts a very high annual rainfall of 1043 mm. Annual rainfall projection for RCP 6.0
scenario is given in Fig. 4.11. The figure shows that 7 to 8 peaks in the annual rainfall and
10- 15 severe droughts. The maximum rainfall as per RCP 6.0 scenario, may go to 1700
mm. For drought year, the annual rainfall will go as low as 450 mm.
Table 4.28 shows Number of floods and droughts estimated from the predicted value as per
RCP 6.0. These projections are made based on the historical mean and standard deviation.
The above result shows a large number of moderate to severe droughts.
Table 4.28 Number of floods and droughts as per RCP 6.0 for Vijayawada
Global Climate
Models
NCA
R
CESM
1
(CAM5
)
FI
O
ES
M
NIMR
KMO
KadGEM
2
A0
MIRO
C
ESM
CHEM
NC
C
NO
R
ESM1 -
M
BC
C
CS
M
1.1 M
BC
C
CS
M
1.1
Extreme drought 0 6 0 0 0 17 9
Severe drought 12 20 9 0 4 16 12
Moderate
drought 16 9 18 10 23 10 15
Normal 14 15 12 23 12 10 13
Moderate flood 7 5 5 4 5 4 5
Severe flood 4 2 8 6 10 1 3
Extreme flood 5 1 6 15 4 0 1
Table 4.29 shows the percentage change in mean monthly rainfall from that of historical
rainfall. The decrease is maximum for July and November while the increase in maximum in
February month. The next 30 years shows a large decrease in rainfall during the monsoon
period.
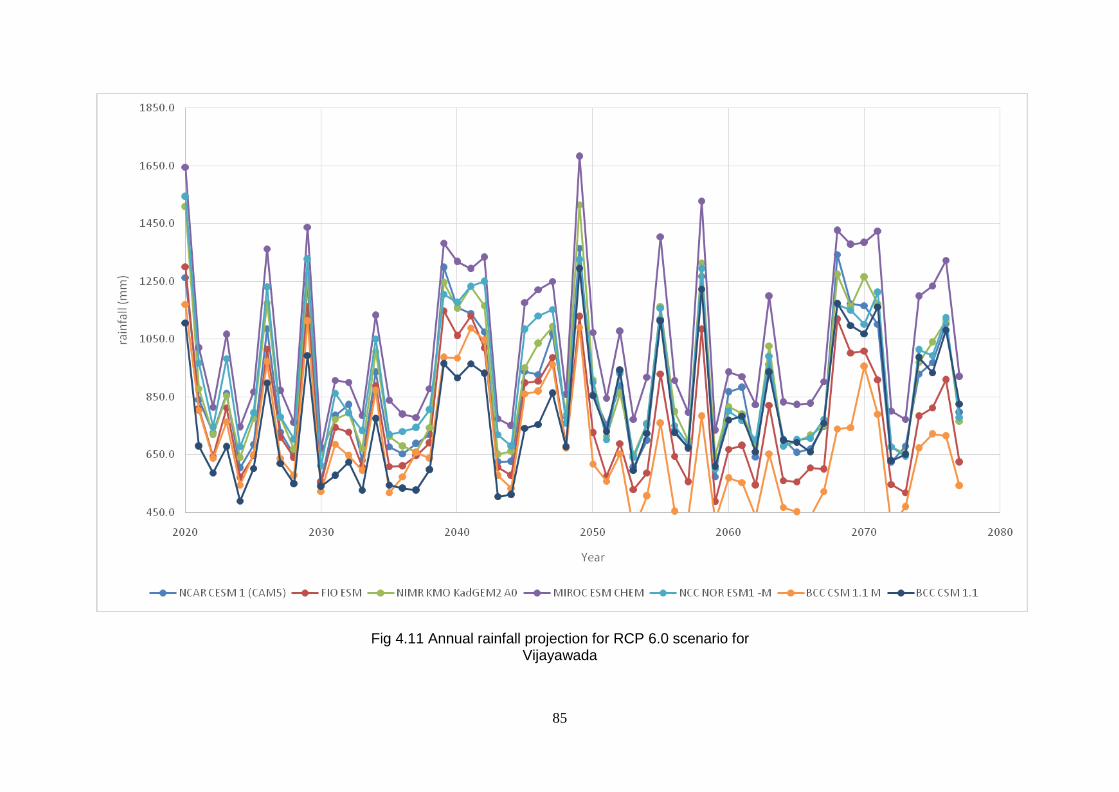
85
Fig 4.11 Annual rainfall projection for RCP 6.0 scenario for Vijayawada
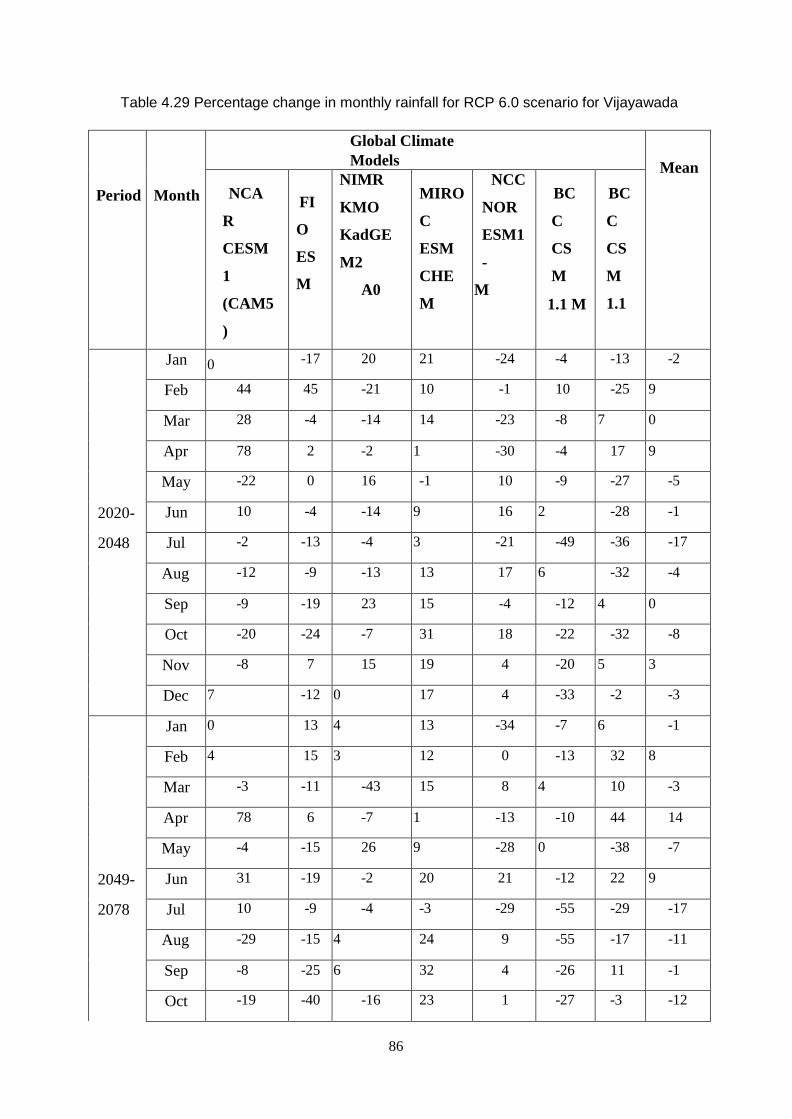
86
Table 4.29 Percentage change in monthly rainfall for RCP 6.0 scenario for Vijayawada
Period
Month
Global Climate
Models
Mean
NCA
R
CESM
1
(CAM5
)
FI
O
ES
M
NIMR
KMO
KadGE
M2
A0
MIRO
C
ESM
CHE
M
NCC
NOR
ESM1
-
M
BC
C
CS
M
1.1 M
BC
C
CS
M
1.1
Jan 0 -17 20 21 -24 -4 -13 -2
Feb 44 45 -21 10 -1 10 -25 9
Mar 28 -4 -14 14 -23 -8 7 0
Apr 78 2 -2 1 -30 -4 17 9
May -22 0 16 -1 10 -9 -27 -5
2020- Jun 10 -4 -14 9 16 2 -28 -1
2048 Jul -2 -13 -4 3 -21 -49 -36 -17
Aug -12 -9 -13 13 17 6 -32 -4
Sep -9 -19 23 15 -4 -12 4 0
Oct -20 -24 -7 31 18 -22 -32 -8
Nov -8 7 15 19 4 -20 5 3
Dec 7 -12 0 17 4 -33 -2 -3
Jan 0 13 4 13 -34 -7 6 -1
Feb 4 15 3 12 0 -13 32 8
Mar -3 -11 -43 15 8 4 10 -3
Apr 78 6 -7 1 -13 -10 44 14
May -4 -15 26 9 -28 0 -38 -7
2049- Jun 31 -19 -2 20 21 -12 22 9
2078 Jul 10 -9 -4 -3 -29 -55 -29 -17
Aug -29 -15 4 24 9 -55 -17 -11
Sep -8 -25 6 32 4 -26 11 -1
Oct -19 -40 -16 23 1 -27 -3 -12

87
Nov -4 -21 15 26 10 -32 20 2
Dec -10 -23 -1 23 22 -29 57 6

88
Projection for Maximum Temperature
Table 4.30 shows the increase in monthly maximum temperature for RCP 6.0 scenario. Out
of the seven models, here also NCAR CESM 1 (CAM5) shows the maximum increase which
is almost 1.90C in the first 30 years and rises to 2.70C in next 30 years. BCC CSM 1.1 shows
a minimum increase in temperature. Overall the maximum temperature will rise by 10C in
2020 to 2048 and 1.50C to 1.70C in 2049-2078.
Projection for Minimum Temperature
Table 4.31 shows the increase in monthly minimum temperature for RCP 6.0 scenario. Here
also, out of the seven models, NCAR CESM 1 (CAM5) shows the maximum increase which
is at most of 1.20C in the first 30 years and rises to 2.50C in the next 30 years. BCC CSM 1.1
shows a minimum increase in temperature. Overall the maximum temperature will rise by
10C in 2020 to 2048 and 1.50C – 1.60C in 2049-2078.
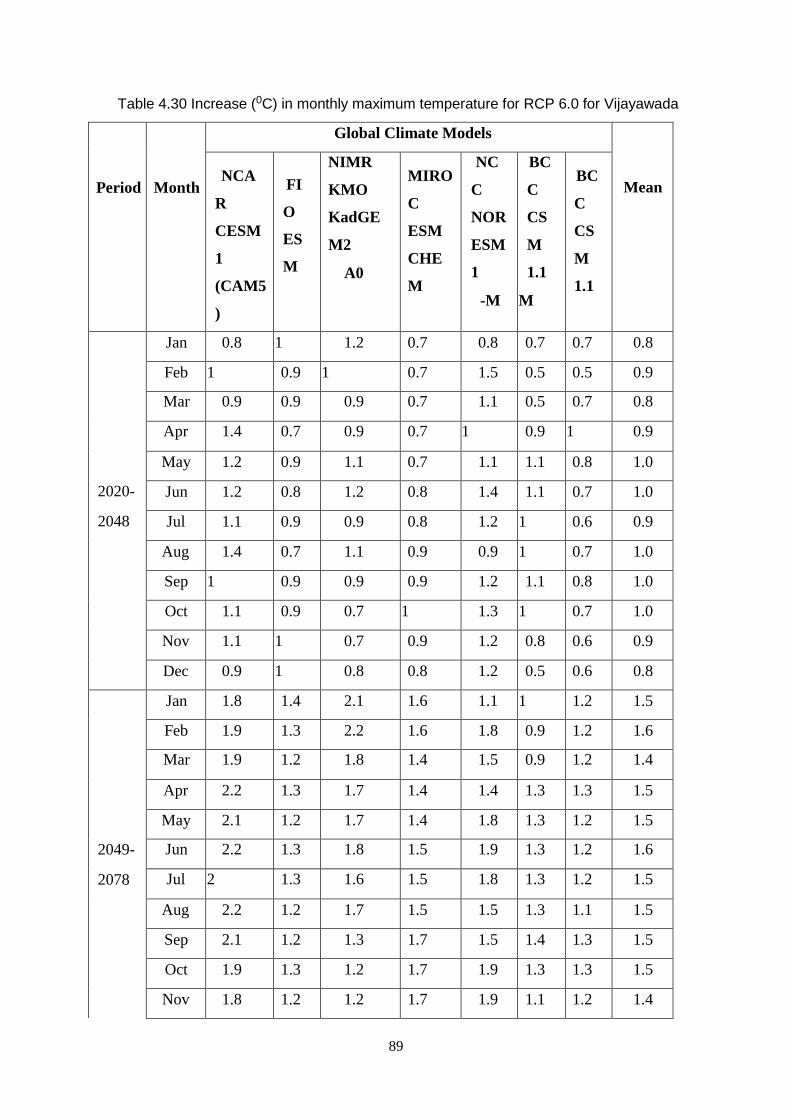
89
Table 4.30 Increase (0C) in monthly maximum temperature for RCP 6.0 for Vijayawada
Period
Month
Global Climate Models
Mean
NCA
R
CESM
1
(CAM5
)
FI
O
ES
M
NIMR
KMO
KadGE
M2
A0
MIRO
C
ESM
CHE
M
NC
C
NOR
ESM
1
-M
BC
C
CS
M
1.1
M
BC
C
CS
M
1.1
Jan 0.8 1 1.2 0.7 0.8 0.7 0.7 0.8
Feb 1 0.9 1 0.7 1.5 0.5 0.5 0.9
Mar 0.9 0.9 0.9 0.7 1.1 0.5 0.7 0.8
Apr 1.4 0.7 0.9 0.7 1 0.9 1 0.9
May 1.2 0.9 1.1 0.7 1.1 1.1 0.8 1.0
2020- Jun 1.2 0.8 1.2 0.8 1.4 1.1 0.7 1.0
2048 Jul 1.1 0.9 0.9 0.8 1.2 1 0.6 0.9
Aug 1.4 0.7 1.1 0.9 0.9 1 0.7 1.0
Sep 1 0.9 0.9 0.9 1.2 1.1 0.8 1.0
Oct 1.1 0.9 0.7 1 1.3 1 0.7 1.0
Nov 1.1 1 0.7 0.9 1.2 0.8 0.6 0.9
Dec 0.9 1 0.8 0.8 1.2 0.5 0.6 0.8
Jan 1.8 1.4 2.1 1.6 1.1 1 1.2 1.5
Feb 1.9 1.3 2.2 1.6 1.8 0.9 1.2 1.6
Mar 1.9 1.2 1.8 1.4 1.5 0.9 1.2 1.4
Apr 2.2 1.3 1.7 1.4 1.4 1.3 1.3 1.5
May 2.1 1.2 1.7 1.4 1.8 1.3 1.2 1.5
2049- Jun 2.2 1.3 1.8 1.5 1.9 1.3 1.2 1.6
2078 Jul 2 1.3 1.6 1.5 1.8 1.3 1.2 1.5
Aug 2.2 1.2 1.7 1.5 1.5 1.3 1.1 1.5
Sep 2.1 1.2 1.3 1.7 1.5 1.4 1.3 1.5
Oct 1.9 1.3 1.2 1.7 1.9 1.3 1.3 1.5
Nov 1.8 1.2 1.2 1.7 1.9 1.1 1.2 1.4

90
Dec 1.6 1.4 1.7 1.7 1.2 1 1.2 1.4
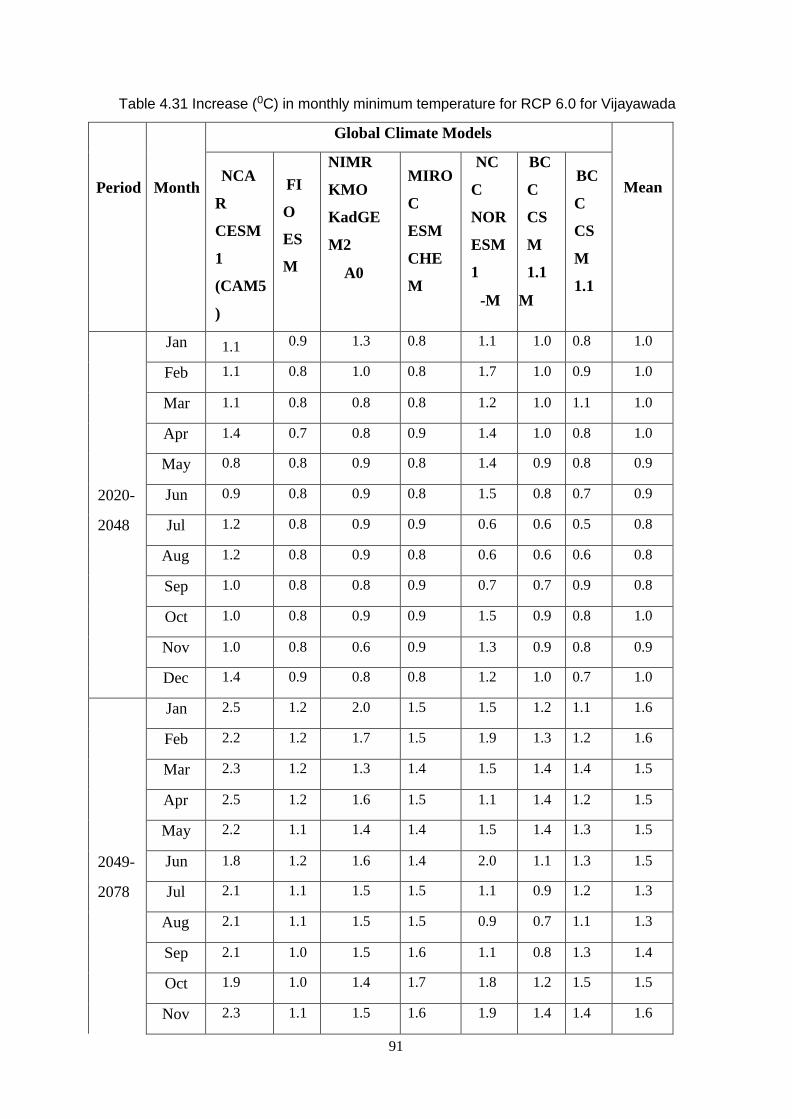
91
Table 4.31 Increase (0C) in monthly minimum temperature for RCP 6.0 for Vijayawada
Period
Month
Global Climate Models
Mean
NCA
R
CESM
1
(CAM5
)
FI
O
ES
M
NIMR
KMO
KadGE
M2
A0
MIRO
C
ESM
CHE
M
NC
C
NOR
ESM
1
-M
BC
C
CS
M
1.1
M
BC
C
CS
M
1.1
Jan 1.1 0.9 1.3 0.8 1.1 1.0 0.8 1.0
Feb 1.1 0.8 1.0 0.8 1.7 1.0 0.9 1.0
Mar 1.1 0.8 0.8 0.8 1.2 1.0 1.1 1.0
Apr 1.4 0.7 0.8 0.9 1.4 1.0 0.8 1.0
May 0.8 0.8 0.9 0.8 1.4 0.9 0.8 0.9
2020- Jun 0.9 0.8 0.9 0.8 1.5 0.8 0.7 0.9
2048 Jul 1.2 0.8 0.9 0.9 0.6 0.6 0.5 0.8
Aug 1.2 0.8 0.9 0.8 0.6 0.6 0.6 0.8
Sep 1.0 0.8 0.8 0.9 0.7 0.7 0.9 0.8
Oct 1.0 0.8 0.9 0.9 1.5 0.9 0.8 1.0
Nov 1.0 0.8 0.6 0.9 1.3 0.9 0.8 0.9
Dec 1.4 0.9 0.8 0.8 1.2 1.0 0.7 1.0
Jan 2.5 1.2 2.0 1.5 1.5 1.2 1.1 1.6
Feb 2.2 1.2 1.7 1.5 1.9 1.3 1.2 1.6
Mar 2.3 1.2 1.3 1.4 1.5 1.4 1.4 1.5
Apr 2.5 1.2 1.6 1.5 1.1 1.4 1.2 1.5
May 2.2 1.1 1.4 1.4 1.5 1.4 1.3 1.5
2049- Jun 1.8 1.2 1.6 1.4 2.0 1.1 1.3 1.5
2078 Jul 2.1 1.1 1.5 1.5 1.1 0.9 1.2 1.3
Aug 2.1 1.1 1.5 1.5 0.9 0.7 1.1 1.3
Sep 2.1 1.0 1.5 1.6 1.1 0.8 1.3 1.4
Oct 1.9 1.0 1.4 1.7 1.8 1.2 1.5 1.5
Nov 2.3 1.1 1.5 1.6 1.9 1.4 1.4 1.6

92
Dec 2.7 1.3 1.6 1.5 1.7 1.4 1.3 1.6
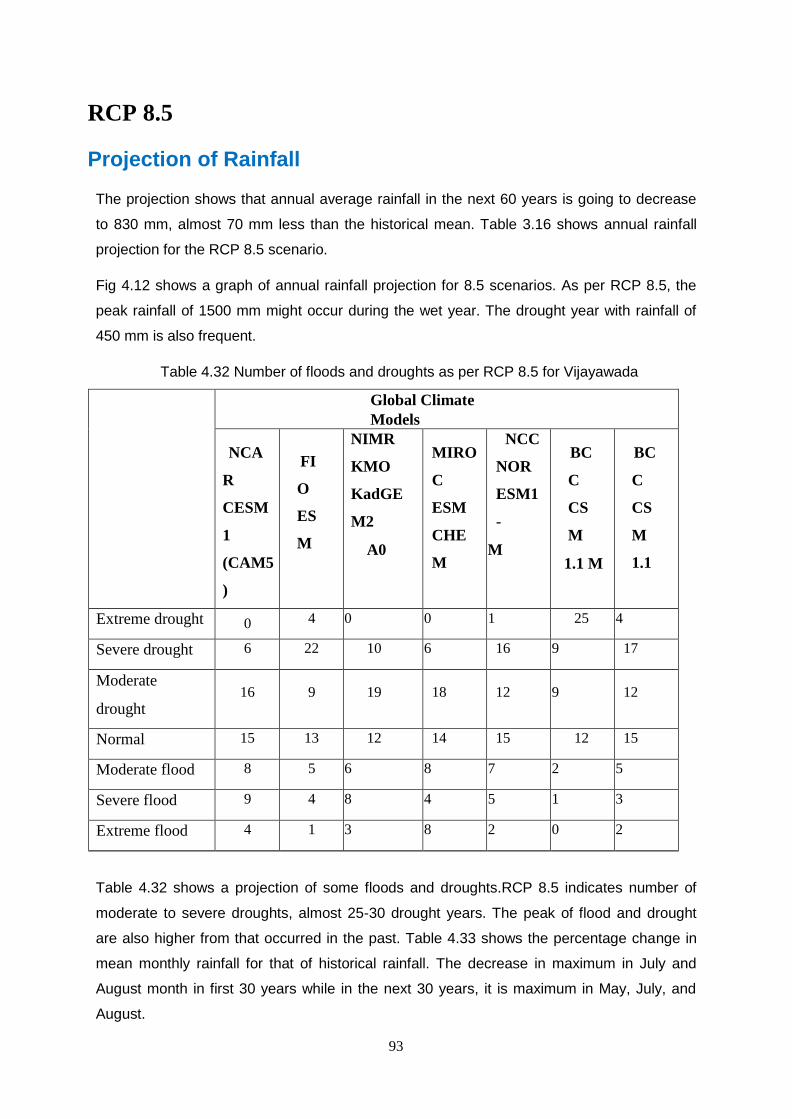
93
RCP 8.5
Projection of Rainfall
The projection shows that annual average rainfall in the next 60 years is going to decrease
to 830 mm, almost 70 mm less than the historical mean. Table 3.16 shows annual rainfall
projection for the RCP 8.5 scenario.
Fig 4.12 shows a graph of annual rainfall projection for 8.5 scenarios. As per RCP 8.5, the
peak rainfall of 1500 mm might occur during the wet year. The drought year with rainfall of
450 mm is also frequent.
Table 4.32 Number of floods and droughts as per RCP 8.5 for Vijayawada
Global Climate
Models
NCA
R
CESM
1
(CAM5
)
FI
O
ES
M
NIMR
KMO
KadGE
M2
A0
MIRO
C
ESM
CHE
M
NCC
NOR
ESM1
-
M
BC
C
CS
M
1.1 M
BC
C
CS
M
1.1
Extreme drought 0 4 0 0 1 25 4
Severe drought 6 22 10 6 16 9 17
Moderate
drought
16
9
19
18
12
9
12
Normal 15 13 12 14 15 12 15
Moderate flood 8 5 6 8 7 2 5
Severe flood 9 4 8 4 5 1 3
Extreme flood 4 1 3 8 2 0 2
Table 4.32 shows a projection of some floods and droughts.RCP 8.5 indicates number of
moderate to severe droughts, almost 25-30 drought years. The peak of flood and drought
are also higher from that occurred in the past. Table 4.33 shows the percentage change in
mean monthly rainfall for that of historical rainfall. The decrease in maximum in July and
August month in first 30 years while in the next 30 years, it is maximum in May, July, and
August.
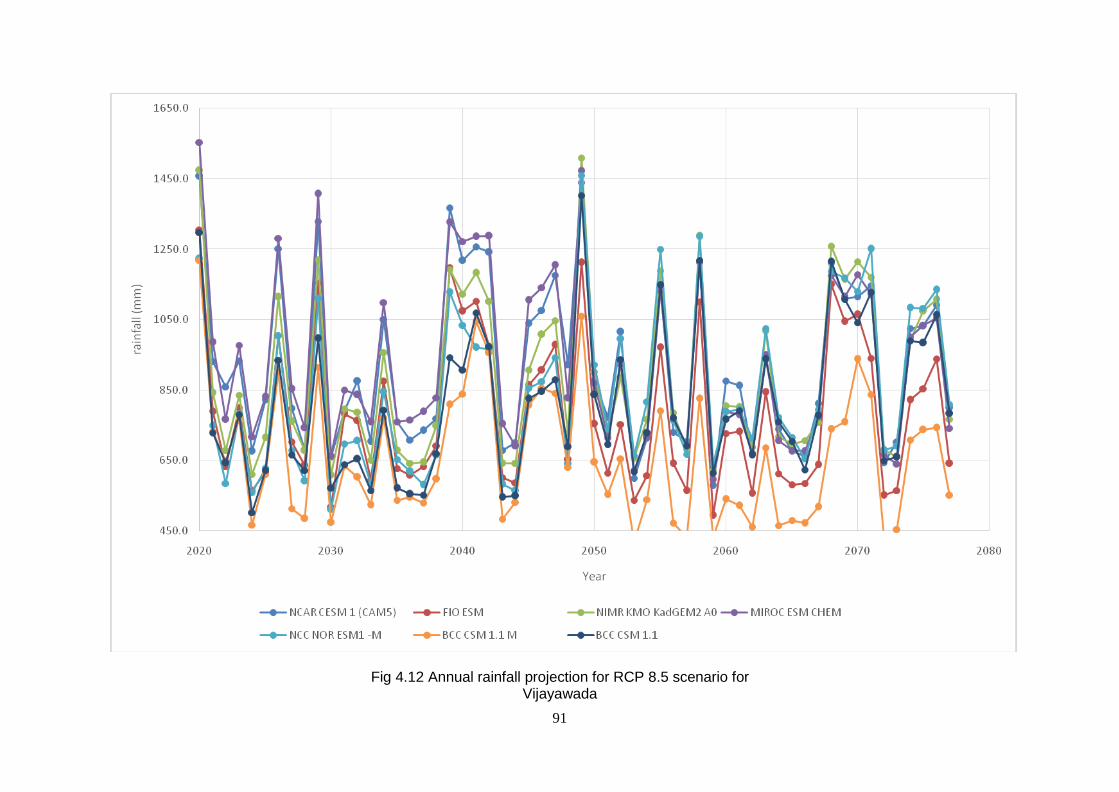
91
Fig 4.12 Annual rainfall projection for RCP 8.5 scenario for Vijayawada
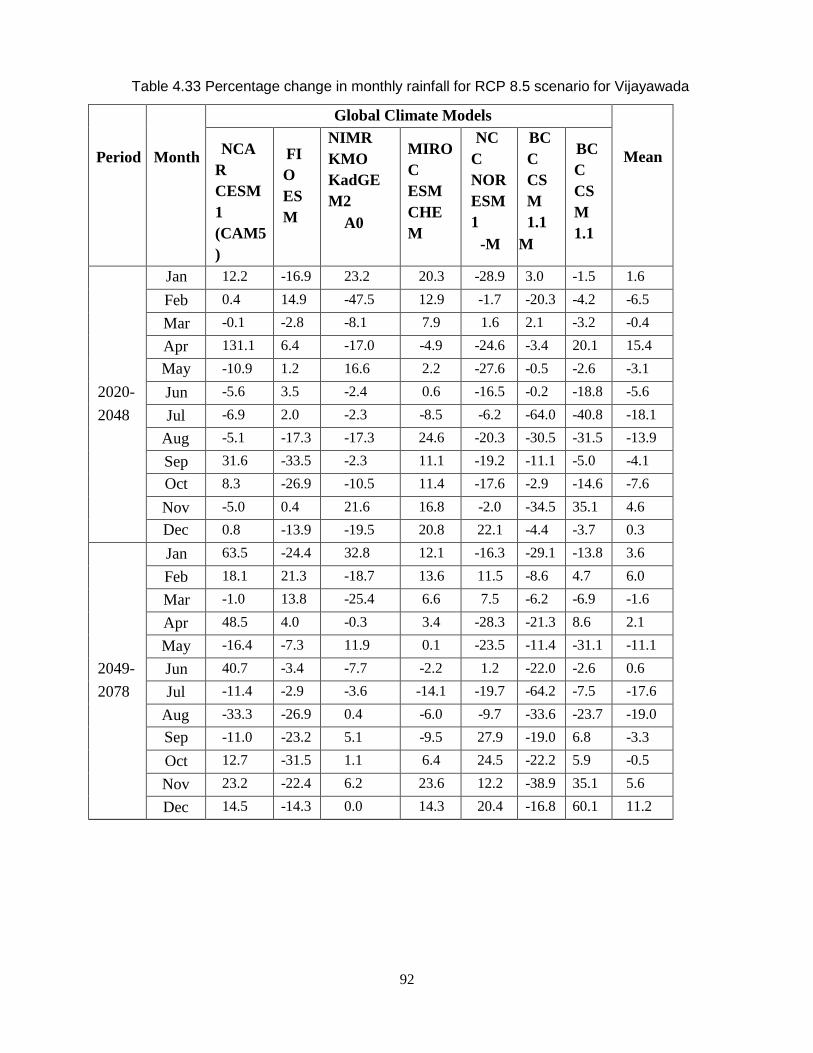
92
Table 4.33 Percentage change in monthly rainfall for RCP 8.5 scenario for Vijayawada
Period
Month
Global Climate Models
Mean
NCA
R
CESM
1
(CAM5
)
FI
O
ES
M
NIMR
KMO
KadGE
M2
A0
MIRO
C
ESM
CHE
M
NC
C
NOR
ESM
1
-M
BC
C
CS
M
1.1
M
BC
C
CS
M
1.1
Jan 12.2 -16.9 23.2 20.3 -28.9 3.0 -1.5 1.6
Feb 0.4 14.9 -47.5 12.9 -1.7 -20.3 -4.2 -6.5
Mar -0.1 -2.8 -8.1 7.9 1.6 2.1 -3.2 -0.4
Apr 131.1 6.4 -17.0 -4.9 -24.6 -3.4 20.1 15.4
May -10.9 1.2 16.6 2.2 -27.6 -0.5 -2.6 -3.1
2020- Jun -5.6 3.5 -2.4 0.6 -16.5 -0.2 -18.8 -5.6
2048 Jul -6.9 2.0 -2.3 -8.5 -6.2 -64.0 -40.8 -18.1
Aug -5.1 -17.3 -17.3 24.6 -20.3 -30.5 -31.5 -13.9
Sep 31.6 -33.5 -2.3 11.1 -19.2 -11.1 -5.0 -4.1
Oct 8.3 -26.9 -10.5 11.4 -17.6 -2.9 -14.6 -7.6
Nov -5.0 0.4 21.6 16.8 -2.0 -34.5 35.1 4.6
Dec 0.8 -13.9 -19.5 20.8 22.1 -4.4 -3.7 0.3
Jan 63.5 -24.4 32.8 12.1 -16.3 -29.1 -13.8 3.6
Feb 18.1 21.3 -18.7 13.6 11.5 -8.6 4.7 6.0
Mar -1.0 13.8 -25.4 6.6 7.5 -6.2 -6.9 -1.6
Apr 48.5 4.0 -0.3 3.4 -28.3 -21.3 8.6 2.1
May -16.4 -7.3 11.9 0.1 -23.5 -11.4 -31.1 -11.1
2049- Jun 40.7 -3.4 -7.7 -2.2 1.2 -22.0 -2.6 0.6
2078 Jul -11.4 -2.9 -3.6 -14.1 -19.7 -64.2 -7.5 -17.6
Aug -33.3 -26.9 0.4 -6.0 -9.7 -33.6 -23.7 -19.0
Sep -11.0 -23.2 5.1 -9.5 27.9 -19.0 6.8 -3.3
Oct 12.7 -31.5 1.1 6.4 24.5 -22.2 5.9 -0.5
Nov 23.2 -22.4 6.2 23.6 12.2 -38.9 35.1 5.6
Dec 14.5 -14.3 0.0 14.3 20.4 -16.8 60.1 11.2
93
Projection for Maximum Temperature
Table 4.34 shows the increase in monthly maximum temperature for RCP 8.5 scenario. Out of
the seven models, NCAR CESM 1 (CAM5) shows the maximum increase which is almost 2.3 0C
in the first 30 years and may rise maximum to 3.40C in the next 30 years. BCC CSM 1.1 shows
a minimum increase in temperature. Overall the maximum temperature will rise by 1.20C –
1.30C in 2020 to 2048 and 2.20C – 2.40C in 2049-2078.
Projection for Minimum Temperature
Table 4.35 shows the increase in monthly minimum temperature for RCP 8.5 scenario. Here
also, out of the seven models, NCAR CESM 1 (CAM5) shows the maximum increase which is
almost 1.80C in first 30 years and may rise to a maximum of 3.90C in next 30 years. BCC CSM
1.1 shows a minimum increase in temperature. Overall the temperature will rise by 10C – 1.20C
in 2020 to 2048 and 20C – 2.30C in 2049-2078.
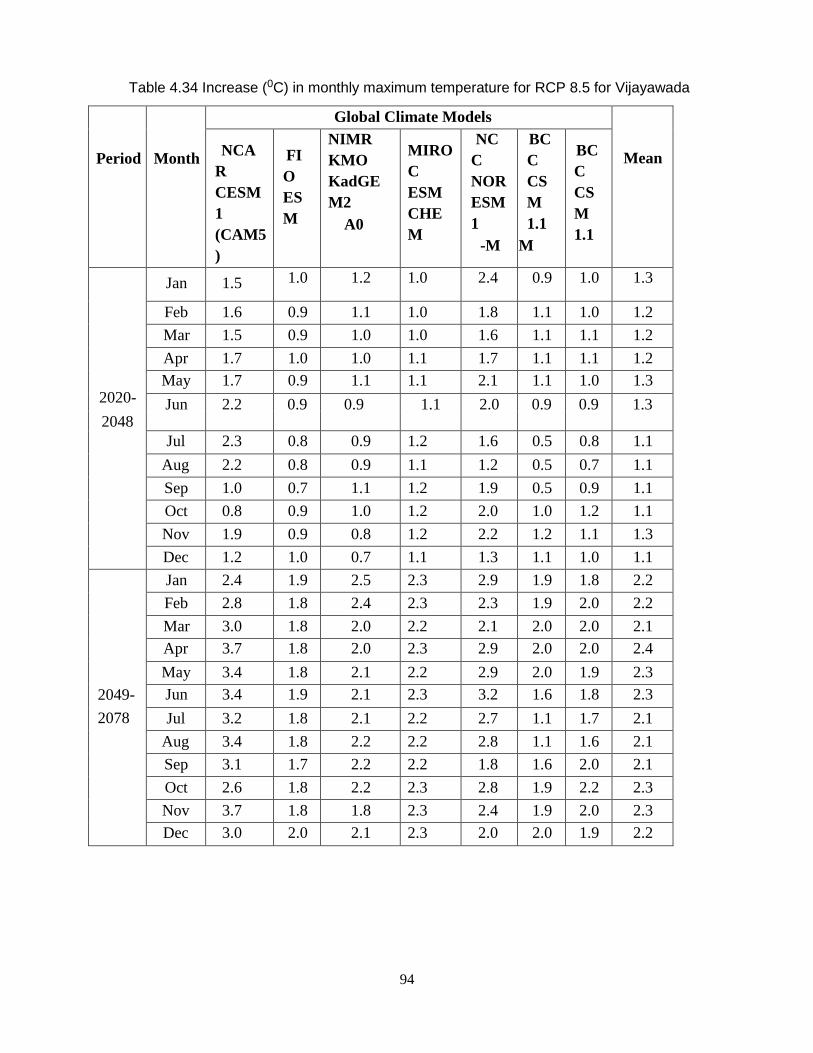
94
Table 4.34 Increase (0C) in monthly maximum temperature for RCP 8.5 for Vijayawada
Period
Month
Global Climate Models
Mean
NCA
R
CESM
1
(CAM5
)
FI
O
ES
M
NIMR
KMO
KadGE
M2
A0
MIRO
C
ESM
CHE
M
NC
C
NOR
ESM
1
-M
BC
C
CS
M
1.1
M
BC
C
CS
M
1.1
Jan 1.5 1.0 1.2 1.0 2.4 0.9 1.0 1.3
Feb 1.6 0.9 1.1 1.0 1.8 1.1 1.0 1.2
Mar 1.5 0.9 1.0 1.0 1.6 1.1 1.1 1.2
Apr 1.7 1.0 1.0 1.1 1.7 1.1 1.1 1.2
2020- May 1.7 0.9 1.1 1.1 2.1 1.1 1.0 1.3
Jun 2.2 0.9 0.9 1.1 2.0 0.9 0.9 1.3 2048
Jul 2.3 0.8 0.9 1.2 1.6 0.5 0.8 1.1
Aug 2.2 0.8 0.9 1.1 1.2 0.5 0.7 1.1
Sep 1.0 0.7 1.1 1.2 1.9 0.5 0.9 1.1
Oct 0.8 0.9 1.0 1.2 2.0 1.0 1.2 1.1
Nov 1.9 0.9 0.8 1.2 2.2 1.2 1.1 1.3
Dec 1.2 1.0 0.7 1.1 1.3 1.1 1.0 1.1
Jan 2.4 1.9 2.5 2.3 2.9 1.9 1.8 2.2
Feb 2.8 1.8 2.4 2.3 2.3 1.9 2.0 2.2
Mar 3.0 1.8 2.0 2.2 2.1 2.0 2.0 2.1
Apr 3.7 1.8 2.0 2.3 2.9 2.0 2.0 2.4
May 3.4 1.8 2.1 2.2 2.9 2.0 1.9 2.3
2049- Jun 3.4 1.9 2.1 2.3 3.2 1.6 1.8 2.3
2078 Jul 3.2 1.8 2.1 2.2 2.7 1.1 1.7 2.1
Aug 3.4 1.8 2.2 2.2 2.8 1.1 1.6 2.1
Sep 3.1 1.7 2.2 2.2 1.8 1.6 2.0 2.1
Oct 2.6 1.8 2.2 2.3 2.8 1.9 2.2 2.3
Nov 3.7 1.8 1.8 2.3 2.4 1.9 2.0 2.3
Dec 3.0 2.0 2.1 2.3 2.0 2.0 1.9 2.2
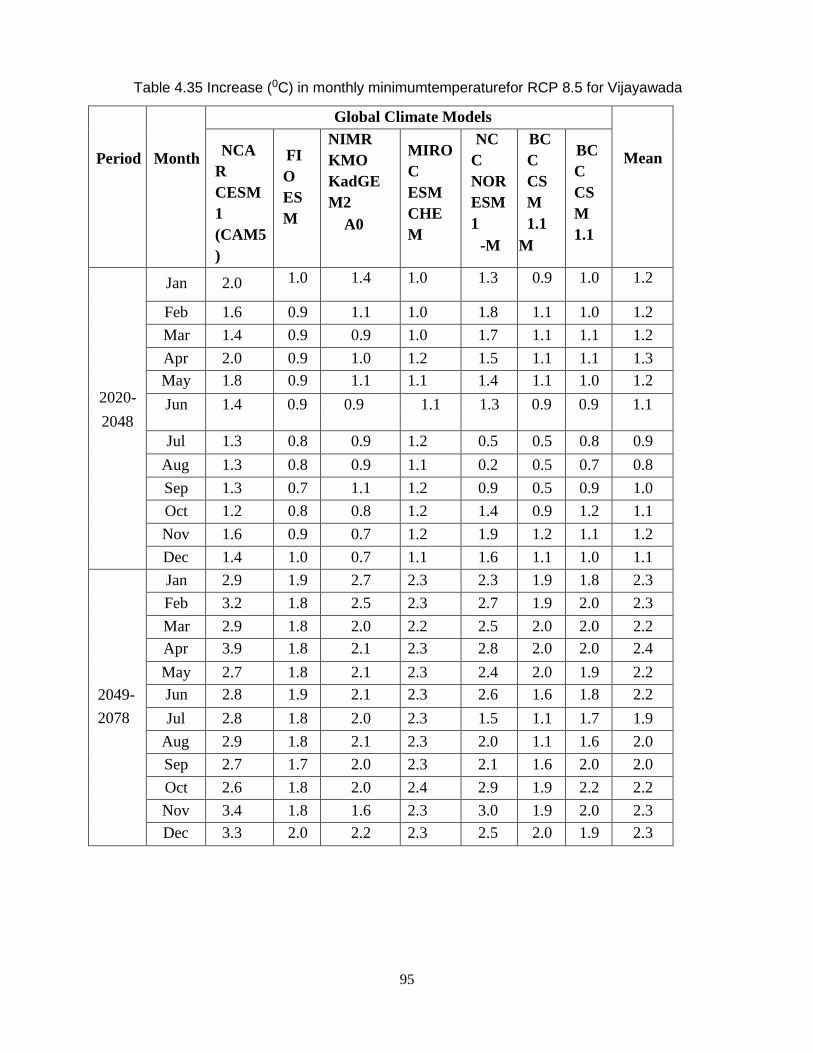
95
Table 4.35 Increase (0C) in monthly minimumtemperaturefor RCP 8.5 for Vijayawada
Period
Month
Global Climate Models
Mean
NCA
R
CESM
1
(CAM5
)
FI
O
ES
M
NIMR
KMO
KadGE
M2
A0
MIRO
C
ESM
CHE
M
NC
C
NOR
ESM
1
-M
BC
C
CS
M
1.1
M
BC
C
CS
M
1.1
Jan 2.0 1.0 1.4 1.0 1.3 0.9 1.0 1.2
Feb 1.6 0.9 1.1 1.0 1.8 1.1 1.0 1.2
Mar 1.4 0.9 0.9 1.0 1.7 1.1 1.1 1.2
Apr 2.0 0.9 1.0 1.2 1.5 1.1 1.1 1.3
2020- May 1.8 0.9 1.1 1.1 1.4 1.1 1.0 1.2
Jun 1.4 0.9 0.9 1.1 1.3 0.9 0.9 1.1 2048
Jul 1.3 0.8 0.9 1.2 0.5 0.5 0.8 0.9
Aug 1.3 0.8 0.9 1.1 0.2 0.5 0.7 0.8
Sep 1.3 0.7 1.1 1.2 0.9 0.5 0.9 1.0
Oct 1.2 0.8 0.8 1.2 1.4 0.9 1.2 1.1
Nov 1.6 0.9 0.7 1.2 1.9 1.2 1.1 1.2
Dec 1.4 1.0 0.7 1.1 1.6 1.1 1.0 1.1
Jan 2.9 1.9 2.7 2.3 2.3 1.9 1.8 2.3
Feb 3.2 1.8 2.5 2.3 2.7 1.9 2.0 2.3
Mar 2.9 1.8 2.0 2.2 2.5 2.0 2.0 2.2
Apr 3.9 1.8 2.1 2.3 2.8 2.0 2.0 2.4
May 2.7 1.8 2.1 2.3 2.4 2.0 1.9 2.2
2049- Jun 2.8 1.9 2.1 2.3 2.6 1.6 1.8 2.2
2078 Jul 2.8 1.8 2.0 2.3 1.5 1.1 1.7 1.9
Aug 2.9 1.8 2.1 2.3 2.0 1.1 1.6 2.0
Sep 2.7 1.7 2.0 2.3 2.1 1.6 2.0 2.0
Oct 2.6 1.8 2.0 2.4 2.9 1.9 2.2 2.2
Nov 3.4 1.8 1.6 2.3 3.0 1.9 2.0 2.3
Dec 3.3 2.0 2.2 2.3 2.5 2.0 1.9 2.3
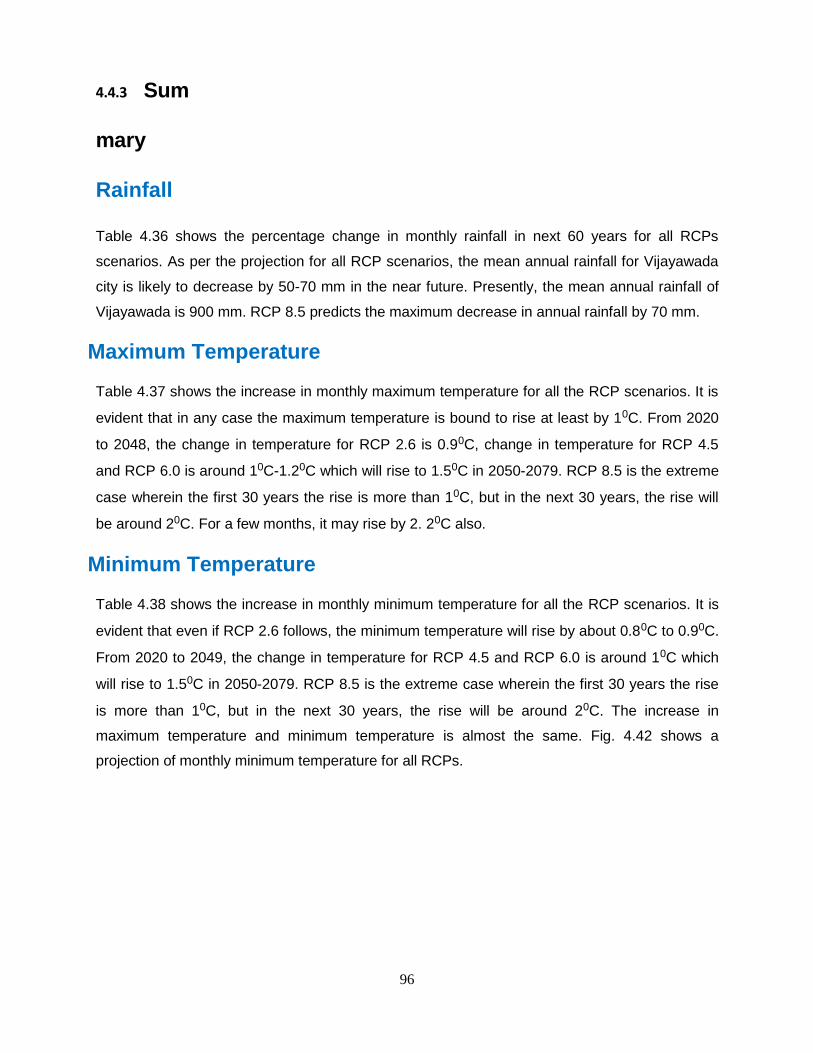
96
4.4.3 Sum
mary
Rainfall
Table 4.36 shows the percentage change in monthly rainfall in next 60 years for all RCPs
scenarios. As per the projection for all RCP scenarios, the mean annual rainfall for Vijayawada
city is likely to decrease by 50-70 mm in the near future. Presently, the mean annual rainfall of
Vijayawada is 900 mm. RCP 8.5 predicts the maximum decrease in annual rainfall by 70 mm.
Maximum Temperature
Table 4.37 shows the increase in monthly maximum temperature for all the RCP scenarios. It is
evident that in any case the maximum temperature is bound to rise at least by 10C. From 2020
to 2048, the change in temperature for RCP 2.6 is 0.90C, change in temperature for RCP 4.5
and RCP 6.0 is around 10C-1.20C which will rise to 1.50C in 2050-2079. RCP 8.5 is the extreme
case wherein the first 30 years the rise is more than 10C, but in the next 30 years, the rise will
be around 20C. For a few months, it may rise by 2. 20C also.
Minimum Temperature
Table 4.38 shows the increase in monthly minimum temperature for all the RCP scenarios. It is
evident that even if RCP 2.6 follows, the minimum temperature will rise by about 0.80C to 0.90C.
From 2020 to 2049, the change in temperature for RCP 4.5 and RCP 6.0 is around 10C which
will rise to 1.50C in 2050-2079. RCP 8.5 is the extreme case wherein the first 30 years the rise
is more than 10C, but in the next 30 years, the rise will be around 20C. The increase in
maximum temperature and minimum temperature is almost the same. Fig. 4.42 shows a
projection of monthly minimum temperature for all RCPs.
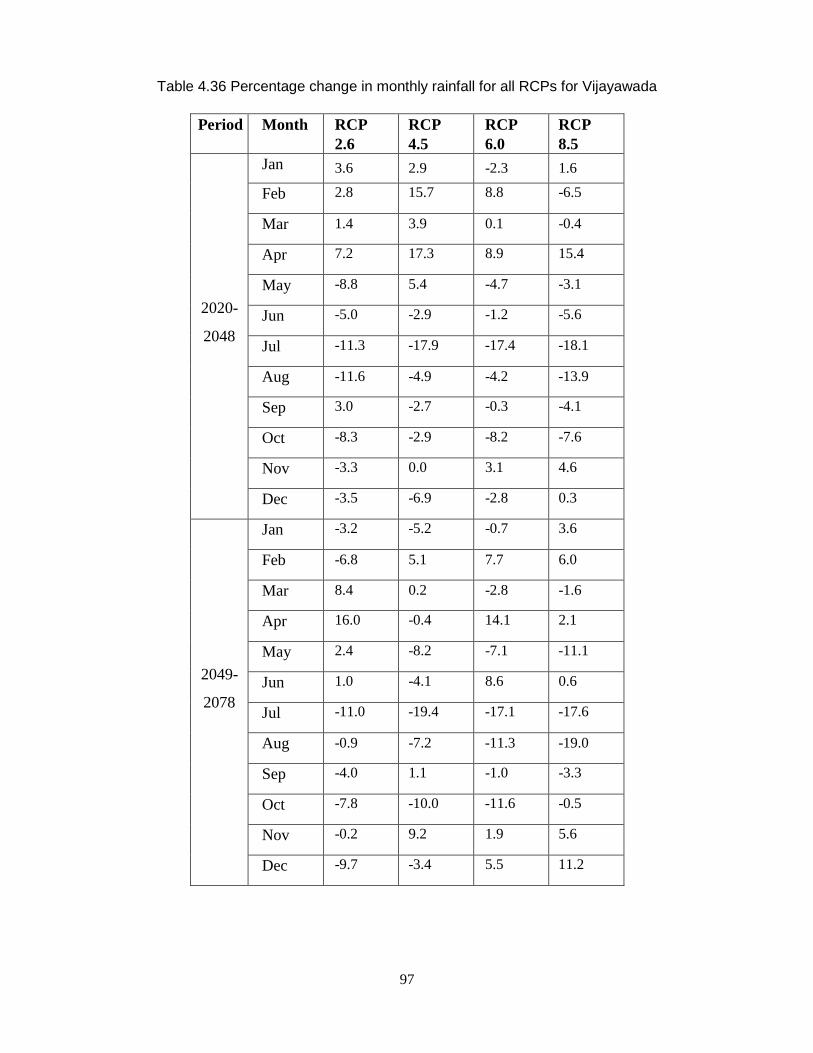
97
Table 4.36 Percentage change in monthly rainfall for all RCPs for Vijayawada
Period Month RCP
2.6
RCP
4.5
RCP
6.0
RCP
8.5
2020-
2048
Jan 3.6 2.9 -2.3 1.6
Feb 2.8 15.7 8.8 -6.5
Mar 1.4 3.9 0.1 -0.4
Apr 7.2 17.3 8.9 15.4
May -8.8 5.4 -4.7 -3.1
Jun -5.0 -2.9 -1.2 -5.6
Jul -11.3 -17.9 -17.4 -18.1
Aug -11.6 -4.9 -4.2 -13.9
Sep 3.0 -2.7 -0.3 -4.1
Oct -8.3 -2.9 -8.2 -7.6
Nov -3.3 0.0 3.1 4.6
Dec -3.5 -6.9 -2.8 0.3
2049-
2078
Jan -3.2 -5.2 -0.7 3.6
Feb -6.8 5.1 7.7 6.0
Mar 8.4 0.2 -2.8 -1.6
Apr 16.0 -0.4 14.1 2.1
May 2.4 -8.2 -7.1 -11.1
Jun 1.0 -4.1 8.6 0.6
Jul -11.0 -19.4 -17.1 -17.6
Aug -0.9 -7.2 -11.3 -19.0
Sep -4.0 1.1 -1.0 -3.3
Oct -7.8 -10.0 -11.6 -0.5
Nov -0.2 9.2 1.9 5.6
Dec -9.7 -3.4 5.5 11.2
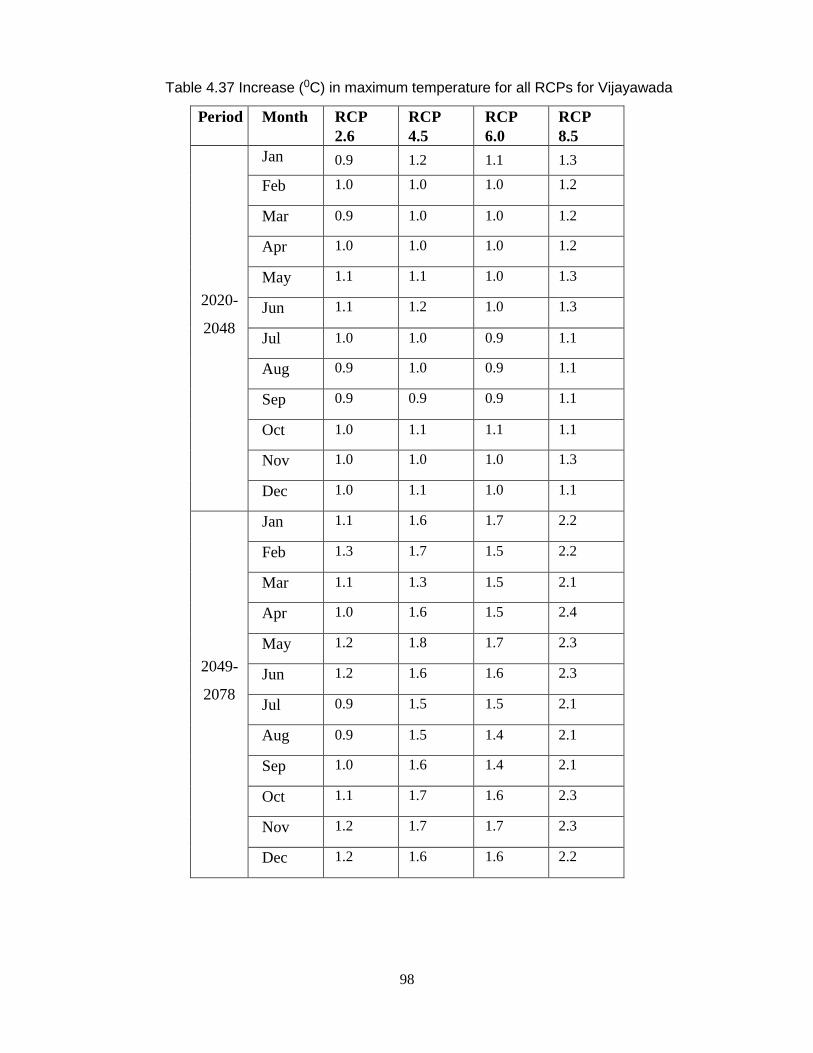
98
Table 4.37 Increase (0C) in maximum temperature for all RCPs for Vijayawada
Period Month RCP
2.6
RCP
4.5
RCP
6.0
RCP
8.5
2020-
2048
Jan 0.9 1.2 1.1 1.3
Feb 1.0 1.0 1.0 1.2
Mar 0.9 1.0 1.0 1.2
Apr 1.0 1.0 1.0 1.2
May 1.1 1.1 1.0 1.3
Jun 1.1 1.2 1.0 1.3
Jul 1.0 1.0 0.9 1.1
Aug 0.9 1.0 0.9 1.1
Sep 0.9 0.9 0.9 1.1
Oct 1.0 1.1 1.1 1.1
Nov 1.0 1.0 1.0 1.3
Dec 1.0 1.1 1.0 1.1
2049-
2078
Jan 1.1 1.6 1.7 2.2
Feb 1.3 1.7 1.5 2.2
Mar 1.1 1.3 1.5 2.1
Apr 1.0 1.6 1.5 2.4
May 1.2 1.8 1.7 2.3
Jun 1.2 1.6 1.6 2.3
Jul 0.9 1.5 1.5 2.1
Aug 0.9 1.5 1.4 2.1
Sep 1.0 1.6 1.4 2.1
Oct 1.1 1.7 1.6 2.3
Nov 1.2 1.7 1.7 2.3
Dec 1.2 1.6 1.6 2.2

99
Table 4.38 Increase (0C) in monthly minimum temperature for all RCPs for Vijayawada
Period Month RCP
2.6
RCP
4.5
RCP
6.0
RCP
8.5
2020-
2048
Jan 0.9 1.1 1.0 1.2
Feb 1.0 1.2 1.0 1.2
Mar 0.9 1.2 1.0 1.2
Apr 1.0 1.2 1.0 1.3
May 0.8 1.1 0.9 1.2
Jun 0.7 1.0 0.9 1.1
Jul 0.8 0.8 0.8 0.9
Aug 0.7 0.9 0.8 0.8
Sep 0.9 1.0 0.8 1.0
Oct 0.9 1.1 1.0 1.1
Nov 0.9 1.0 0.9 1.2
Dec 1.0 1.0 1.0 1.1
2049-
2078
Jan 1.0 1.6 1.6 2.3
Feb 1.1 1.7 1.6 2.3
Mar 1.1 1.4 1.5 2.2
Apr 1.1 1.5 1.5 2.4
May 1.1 1.5 1.5 2.2
Jun 1.1 1.5 1.5 2.2
Jul 0.9 1.2 1.3 1.9
Aug 0.9 1.2 1.3 2.0
Sep 1.0 1.5 1.4 2.0
Oct 1.1 1.6 1.5 2.2
Nov 1.0 1.6 1.6 2.3
Dec 1.0 1.5 1.6 2.3
100
Vijayawada
The annual average rainfall for Vijayawada city is around 900 mm. The monthly
rainfall variation shows a high variation of rainfall from June to September. An increasing
trend was observed for annual rainfall (+0.02 mm/month. It has witnessed a few moderate
droughts and a few flood events in the past.
RCP 2.6 scenario show some peak rainfalls of 1650 mm and a few dry years with annual
rainfall less than 550 mm but an overall decline in annual rainfall. Results show that the
rainfall during the non-monsoon season will increase by about 10%. The mean temperature
will rise by 10C.
RCP 4.5 also shows a decline in annual average rainfall by about 40 mm. The city has a
high risk of moderate to severe droughts. The maximum temperature may increase by 10C in
the first 29 years and later stabilizes at 1.50C.
As per RCP 6.0 scenario, the mean annual rainfall may rise to 850 mm in the next 58 with 3
to 4 very high peaks of about 1680 mm in the annual rainfall and several severe droughts.
The average increase in monthly temperature is around 10C in the first 28 years which
increases to 1.5-1.80C in next 29 years.
101
The projection of RCP 8.5 shows a decline in annual average rainfall by 70 mm. It also
indicates almost 20-25 number of moderate to severe droughts and extreme floods during
some years. Results show the temperature to rise by 1.20C in the first 29 years and may go
to 2.50C in the later years.
7.2 Hydrological Modelling The study area is delineated based on land use and land cover. Solapur city has a total area
of 672.18 km2, in that 43% is agricultural, Residential is 54% and the remaining 3% belongs
to another category. Vijayawada has a total area of 1280.32 km2 out of which about 23 % is
agricultural, 73% Residential and 4% comes under other categories. Comparison of these
two study area build up area is higher in Vijayawada city and Solapur is having less area.
Solapur has mostly loamy soil while Vijayawada has clayey loam.
HEC-HMS model is used for simulation of runoff for the Vijayawada basin for Krishna
watershed, which uses SCS-CN Method to calculate runoff generation from a catchment.
The mean annual runoff for Vijayawada city is found to be 1243.95 TMC with a standard
deviation of 10.08 TMC, against an annual average rainfall of 42.89 TMC. Thus on an
annual basic about 72% of rainfall is converted to runoff from the basin.
For Solapur city, the simulation of runoff for Krishna watershed, which uses SCS-CN Method
to calculate runoff generation from a catchment. The mean annual runoff for Solapur city is
found to be 696 TMC with a standard deviation of 5.87 TMC, against an annual average
rainfall of 19.89 TMC. Thus, the results show that on an annual basic about 67% of rainfall
goes as runoff from the basin.
Based on an analysis of 29 years of rainfall data in Vijayawada basin, it is found that sub
basin-3 contribute maximum runoff compare to another sub basin while sub-basin 12
contributes the least. A similar trend is observed for runoff depth. The runoff is maximum
during the monsoon season, i.e. between July-August months, while it is least during the
summer season of a year.
Based on an analysis of 35 years of rainfall data in Solapur basin, it is found that sub basin-7
contribute maximum runoff compare to another sub basin while sub-basin 5 contributes the
least. A similar trend is observed for runoff depth. The runoff is maximum during the

monsoon season, i.e. between July-August months, while it is least during the summer
season of a year.
7.3 Urban Heat Island Map
Solapur has 72% of residential land while 12% are water body and 16% with
vegetation. Based on the present temperature variation, 38% of the area shows a strong
heat island effect. Though the effect is very weak in about 51 % of the area.
Vijayawada has 61% of residential land, 29% water body and 10% with vegetation.
Presently, 46% of land has very strong heat island effect and almost 37 % of the land with
very weak heat island effect.