Viewing strategy of Cebus monkeys during free exploration of natural images
13
Research Report Viewing strategy of Cebus monkeys during free exploration of natural images Denise Berger a, b, ⁎ , 1 , Antonio Pazienti c , Francisco J. Flores d, 2 , Martin P. Nawrot a, b , Pedro E. Maldonado d , Sonja Grün e , f a Neuroinformatics, Institute of Biology, Freie Universität, Königin-Luise Str. 1-3, Berlin, Germany b Bernstein Center for Computational Neuroscience, Phillipstr. 13, Berlin, Germany c European Brain Research Institute, Via del fosso di Fiorano 64, Rome, Italy d Program of Physiology and Biophysics, Faculty of Medicine, Universidad de Chile, Av. Independencia 1027, Santiago, Chile e Institute of Neuroscience and Medicine (INM-6), Computational and Systems Neuroscience, Research Center Jülich, 52425 Jülich, Germany f Theoretical Systems Neurobiology, RWTH Aachen University, 52056 Aachen, Germany ARTICLE INFO ABSTRACT Article history: Accepted 7 October 2011 Available online 14 October 2011 Humans and other primates move their eyes several times per second to foveate at different locations of a visual scene. What features of a scene guide eye movements in natural vision? We recorded eye movements of three monkeys during free exploration of natural scenes and propose a simple model to explain their dynamics. We use the spatial clustering of fixation positions to define the monkeys' subjective regions-of-interest (ROI) in natural scenes. For most images the subjective ROIs match significantly the computed saliency of the natural scene, except when the image contains human or primate faces. We also investigated the temporal sequence of eye movements by computing the probabil- ity that a fixation will be made inside or outside of the ROI, given the current fixation posi- tion. We fitted a Markov chain model to the sequence of fixation positions, and find that fixations made inside a ROI are more likely to be followed by another fixation in the same ROI. This is true, independent of the image saliency in the area of the ROI. Our results show that certain regions in a natural scene are explored locally before directing the focus to another local region. This strategy could allow for quick integration of the visual features that constitute an object, and efficient segmentation of objects from other objects and the background during free viewing of natural scenes. © 2011 Elsevier B.V. All rights reserved. Keywords: Eye movement Scan path Fixation map Natural vision Monkey BRAIN RESEARCH 1434 (2012) 34 – 46 ⁎ Corresponding author at: Laboratory of Neuromotor Physiology, IRCCS Fondazione Santa Lucia, Via Ardeatina 306, 00179 Roma, Italy. Fax: +39 0651501482. E-mail addresses: [email protected] (D. Berger), [email protected] (A. Pazienti), [email protected] (F.J. Flores), [email protected] (M.P. Nawrot), [email protected] (P.E. Maldonado), [email protected] (S. Grün). 1 Present address: Laboratory of Neuromotor Physiology, IRCCS Fondazione Santa Lucia, Via Ardeatina 306, 00179 Roma, Italy. 2 Present address: Department of Anesthesia, Critical Care and Pain Medicine, Massachusetts General Hospital and Harvard Medical School, Boston, USA; and Department of Brain and Cognitive Sciences, Massachusetts Institute of Technology, Cambridge, USA. 0006-8993/$ – see front matter © 2011 Elsevier B.V. All rights reserved. doi:10.1016/j.brainres.2011.10.013 Available online at www.sciencedirect.com www.elsevier.com/locate/brainres
-
Upload
independent -
Category
Documents
-
view
2 -
download
0
Transcript of Viewing strategy of Cebus monkeys during free exploration of natural images

B R A I N R E S E A R C H 1 4 3 4 ( 2 0 1 2 ) 3 4 – 4 6
Ava i l ab l e on l i ne a t www.sc i enced i r ec t . com
www.e l sev i e r . com/ loca te /b ra i n res
Research Report
Viewing strategy of Cebus monkeys during free exploration ofnatural images
Denise Bergera, b,⁎, 1, Antonio Pazientic, Francisco J. Floresd, 2, Martin P. Nawrota, b,Pedro E. Maldonadod, Sonja Grüne, f
aNeuroinformatics, Institute of Biology, Freie Universität, Königin-Luise Str. 1-3, Berlin, GermanybBernstein Center for Computational Neuroscience, Phillipstr. 13, Berlin, GermanycEuropean Brain Research Institute, Via del fosso di Fiorano 64, Rome, ItalydProgram of Physiology and Biophysics, Faculty of Medicine, Universidad de Chile, Av. Independencia 1027, Santiago, ChileeInstitute of Neuroscience and Medicine (INM-6), Computational and Systems Neuroscience, Research Center Jülich, 52425 Jülich, GermanyfTheoretical Systems Neurobiology, RWTH Aachen University, 52056 Aachen, Germany
A R T I C L E I N F O
⁎ Corresponding author at: Laboratory of NeuFax: +39 0651501482.
E-mail addresses: [email protected] (D. [email protected] (M.P. Nawrot), p1 Present address: Laboratory of Neuromot2 Present address: Department of Anesthes
School, Boston, USA; and Department of Bra
0006-8993/$ – see front matter © 2011 Elseviedoi:10.1016/j.brainres.2011.10.013
A B S T R A C T
Article history:Accepted 7 October 2011Available online 14 October 2011
Humans and other primates move their eyes several times per second to foveate atdifferent locations of a visual scene. What features of a scene guide eye movements innatural vision? We recorded eye movements of three monkeys during free exploration ofnatural scenes and propose a simple model to explain their dynamics. We use the spatialclustering of fixation positions to define the monkeys' subjective regions-of-interest (ROI)in natural scenes. For most images the subjective ROIs match significantly the computedsaliency of the natural scene, except when the image contains human or primate faces.We also investigated the temporal sequence of eye movements by computing the probabil-ity that a fixation will be made inside or outside of the ROI, given the current fixation posi-tion. We fitted a Markov chain model to the sequence of fixation positions, and find thatfixations made inside a ROI are more likely to be followed by another fixation in the sameROI. This is true, independent of the image saliency in the area of the ROI. Our resultsshow that certain regions in a natural scene are explored locally before directing thefocus to another local region. This strategy could allow for quick integration of the visualfeatures that constitute an object, and efficient segmentation of objects from other objectsand the background during free viewing of natural scenes.
© 2011 Elsevier B.V. All rights reserved.
Keywords:Eye movementScan pathFixation mapNatural visionMonkey
romotor Physiology, IRCCS Fondazione Santa Lucia, Via Ardeatina 306, 00179 Roma, Italy.
erger), [email protected] (A. Pazienti), [email protected] (F.J. Flores),[email protected] (P.E. Maldonado), [email protected] (S. Grün).or Physiology, IRCCS Fondazione Santa Lucia, Via Ardeatina 306, 00179 Roma, Italy.ia, Critical Care and Pain Medicine, Massachusetts General Hospital and Harvard Medicalin and Cognitive Sciences, Massachusetts Institute of Technology, Cambridge, USA.
r B.V. All rights reserved.
35B R A I N R E S E A R C H 1 4 3 4 ( 2 0 1 2 ) 3 4 – 4 6
1. Introduction
Early studies by Stratton (1902, 1906) showed that free explora-tion of natural scenes is performed through a spatiotemporal se-quence of saccadic eye movements and ocular fixations. Thissequence indicates the focus of spatial attention (Biedermann,1987; Crick andKoch, 1998;NotonandStark, 1971a), and is guidedby bottom–up and top–down attentional factors. Bottom–upfactors are related to low-level features of the objects presentin the scene being explored (Itti and Koch, 1999, 2001; Koch andUllman, 1985; Treisman and Gelade, 1980) while top–downfactors depend on the task being executed during exploration ofa scene (Buswell, 1935; Just and Carpenter, 1967; Yarbus, 1967),the context in which those objects are located (Torralba, et al.,2006), and the behavioral meaning of the objects being observed(Guo et al., 2003; Guo et al., 2006). For example, traffic lights canattract attention and eye movements both by bottom–up andtop–down factors: they are very salient in virtue of their low-level, intrinsic properties (color and intensity), and also verymeaningful to the driver (behavior and context).
Several computationalmodels have been proposed to explainguidance of eye movements and attentional shifts during freeviewing of natural scenes (e.g., Itti et al., 1998; Milanse et al.,1995; Tsotsos et al., 1995;Wolfe, 1994). Themost common strate-gy includes the computation of saliencymaps to account for bot-tom–up factors and defines the regions-of-interest (ROIs) thatattract eye movements. The saliency maps are then fed into awinner-take-all algorithmtoaccount for the top–downattention-al contribution (Itti et al., 1998; Milanse et al., 1995). During the
.
image pause fix pau
FIXATION CUE
IMAGE
IMAGE
5 2-3 1 2-
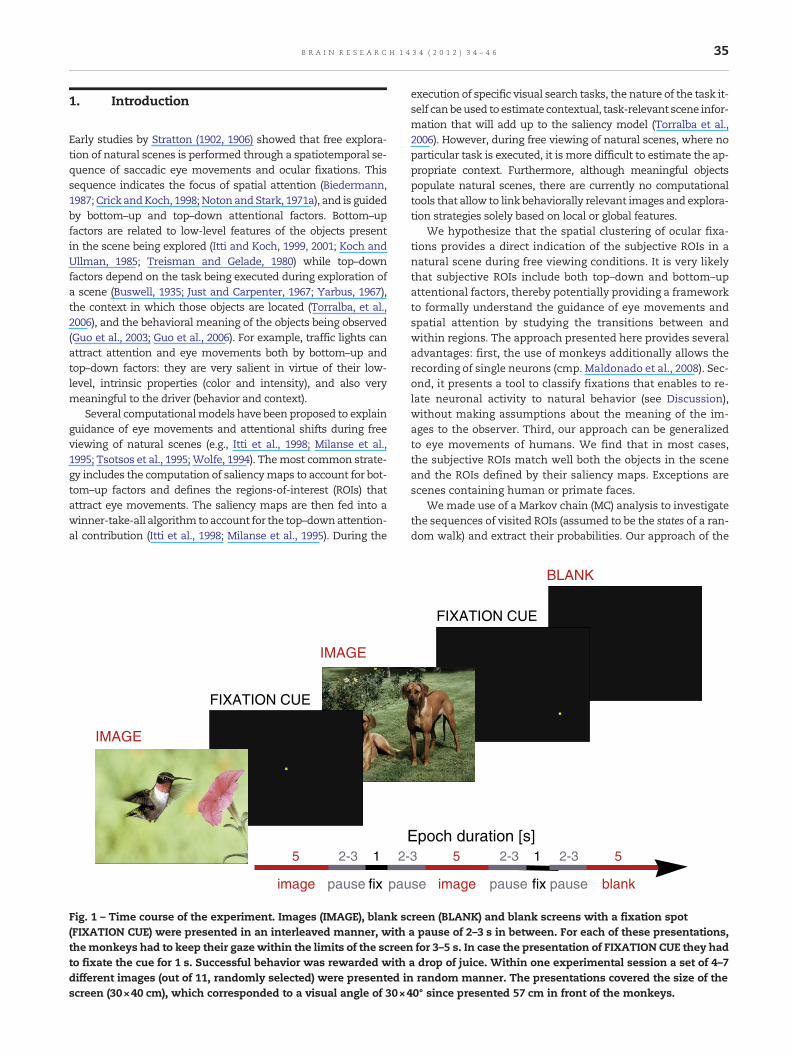
Fig. 1 – Time course of the experiment. Images (IMAGE), blank sc(FIXATION CUE) were presented in an interleaved manner, withthemonkeys had to keep their gaze within the limits of the screento fixate the cue for 1 s. Successful behavior was rewarded withdifferent images (out of 11, randomly selected) were presented inscreen (30×40 cm), which corresponded to a visual angle of 30×4
execution of specific visual search tasks, the nature of the task it-self canbeused toestimate contextual, task-relevant scene infor-mation that will add up to the saliency model (Torralba et al.,2006). However, during free viewing of natural scenes, where noparticular task is executed, it is more difficult to estimate the ap-propriate context. Furthermore, although meaningful objectspopulate natural scenes, there are currently no computationaltools that allow to link behaviorally relevant images and explora-tion strategies solely based on local or global features.
We hypothesize that the spatial clustering of ocular fixa-tions provides a direct indication of the subjective ROIs in anatural scene during free viewing conditions. It is very likelythat subjective ROIs include both top–down and bottom–upattentional factors, thereby potentially providing a frameworkto formally understand the guidance of eye movements andspatial attention by studying the transitions between andwithin regions. The approach presented here provides severaladvantages: first, the use of monkeys additionally allows therecording of single neurons (cmp. Maldonado et al., 2008). Sec-ond, it presents a tool to classify fixations that enables to re-late neuronal activity to natural behavior (see Discussion),without making assumptions about the meaning of the im-ages to the observer. Third, our approach can be generalizedto eye movements of humans. We find that in most cases,the subjective ROIs match well both the objects in the sceneand the ROIs defined by their saliency maps. Exceptions arescenes containing human or primate faces.
Wemade use of a Markov chain (MC) analysis to investigatethe sequences of visited ROIs (assumed to be the states of a ran-dom walk) and extract their probabilities. Our approach of the
.
fixse image pause pause blank
Epoch duration [s]
FIXATION CUE
BLANK
3 5 2-3 1 2-3 5
reen (BLANK) and blank screens with a fixation spota pause of 2–3 s in between. For each of these presentations,for 3–5 s. In case the presentation of FIXATION CUE they had
a drop of juice. Within one experimental session a set of 4–7random manner. The presentations covered the size of the0° since presented 57 cm in front of the monkeys.

36 B R A I N R E S E A R C H 1 4 3 4 ( 2 0 1 2 ) 3 4 – 4 6
scanpath analysis differs from Feng (2006) (reading task experi-ment), Van Der Lans et al. (2008) (search task), and Simola et al.(2008) (word search task) in that we feed theMC algorithmwiththe extracted ROIs. Such an investigation of fixation sequencesshows that during free viewing of natural scenes a fixation ismost likely to occurwithin the sameROIwhere theprevious fix-ation occurred, suggesting that local object exploration is exe-cuted before directing the focus to a new ROI.
2. Results
2.1. Fixations on natural images are spatially distributedin clusters and define subjective regions-of-interest
Three monkeys (D, M, and S) participated in an electro-physiological experiment over many sessions, in which theywere exposed to different natural images for 3–5 s, interleavedwith blank screens or blank screens with a fixation spot (seeFig. 1, and Section 4.1 for details). Their eye movements wererecorded with a scleral search coil, while the animals wereallowed to freely explore the monitor screen with self-initiatedeye movements (see Fig. 2A as an example of one image over-laid by an exemplary scanpath and the respective fixations).
An automatic algorithm extracted the fixations and sac-cades performed by the monkeys from the vertical and
0 500 10000
0.05
0.1
0.15
0.2
p.d.
f.
fixation duration [ms]
D
[degree]
[deg
ree] 2
3
4
56
7
0 10 20 30 40
0
10
20
30
A B
C
Fig. 2 – Statistics of the durations of fixations and saccades. A. Exa(white lines) during one single image presentation. The red dotssequence. B. Time course of the eye positions during the imageFixations are marked in red, saccades in green, and unclassifiabdurations (bin width: 25 ms) and D. saccade durations (bin widthfor each of the three monkeys.
horizontal eyemovements (Fig. 2B, see Section 4.2. for details),and derived the distributions of fixation and saccade dura-tions (Figs. 2C, D). The distributions of fixation durations de-rived from all sessions and for all images (Fig. 2C) ofmonkeys D andM have very similar shapes, themean fixationdurations being 310 ms and 240 ms, respectively. Thesevalues correspond well to average fixation durations reportedfor humans during exploration of natural scenes, found to bein the range between 260 and 330 ms (Castelhano and Hender-son, 2007; Ossandon et al., 2010). However, the distribution offixation durations of monkey S (Fig. 2C, red) differs from thedistributions of the two other monkeys: it is broader, lessskewed and has a heavy tail, and exhibits a much longermean fixation duration (420 ms). Interestingly, the distribu-tions of saccade durations of the threemonkeys (Fig. 2D) differonly little (mean saccade durations: 32.1 ms, 31.0 ms, and,33.8 ms for monkeys D, M, and S, respectively).
In a next step we investigated how the eye movements ofthe three monkeys were spatially distributed on the viewedimages, and if these also show differences between monkeysD and M, and S. The spatial distribution on one specificimage was derived from eye movements across all presenta-tions of the image. We observed that the spatial distributionsof fixations of monkeys D and M exhibit dense spatial clustersthat are related to conspicuous objects in the underlying im-ages (see examples for four different images in Fig. 3). The
saccade duration [ms]0 50 100
0
0.05
0.1
0.15
0.2
0.25
p.d.
f.
monkey Dmonkey Mmonkey S
0 1 2 30
10
20
30
40
time [s]
[deg
ree]
1 2 3 4 5 6 7
mple of one presented image (image no. 3) with the scanpathindicate the positions of fixations, the numbers indicate theirpresentation (upper trace: horizontal, lower trace: vertical).le events are colored in black. C. Distributions of fixation: 5 ms), pooled over all sessions and all image presentations,

37B R A I N R E S E A R C H 1 4 3 4 ( 2 0 1 2 ) 3 4 – 4 6
positions of the clusters are qualitatively similar for bothmonkeys for the same image, but are qualitatively differentfor each individual image (Fig. 3, columns 1, 2).
However, the spatial fixation distributions of monkey S areunique: more than 90% of his fixations are evenly distributedinside a large cluster in the lower left quadrant of the images.This pattern is conserved across different images, and seemsindependent of the content of the images (Fig. 3, column 3),indicating that the eye movements of this monkey were notrelated to the images. It is unlikely that the differences in fix-ation duration and of the exploration patterns of monkey Swere due to a physiological dysfunction of his oculomotorsystem, since his saccade durations were very much in agree-ment with the other monkeys (Fig. 2D), indicating an intactsaccade generation mechanism. Inspection of the fixationson images containing only a fixation spot, routinely presentedjust before each natural image to detect potential artifacts andeye calibration issues, shows that monkey S did fixate on thefixation spot within the required limits. Therefore we con-cluded that the monkey adopted an unusual strategy to getrewarded, deliberately gazing over the images without payingattention to the images contents. We include data from thisanimal both as a comparison to the other monkeys, and as apotential methodological issue for further studies.
Fig. 3 – Spatial distribution of fixations on four example images.only the fixation positions, and in the right the fixation positionspositions in each subfigure were collected from all presentationsBottom row: Merged fixation positions for each monkey on all p
For monkeys D and M, we assume that each of the spatialfixation clusters represents a subjective ROI. The position ofsubjective ROIs on an individual image is likely to depend onat least two factors: a bottom–up image feature driven compo-nent and a top–down attentional factor. To explore the contri-bution of the bottom–up component on the spatial positionsof the subjective ROIs, we compare in a next step the similar-ity of the map of the fixations with the saliency map of the re-spective image.
2.2. Fixation and saliency maps diverge for imagescontaining faces
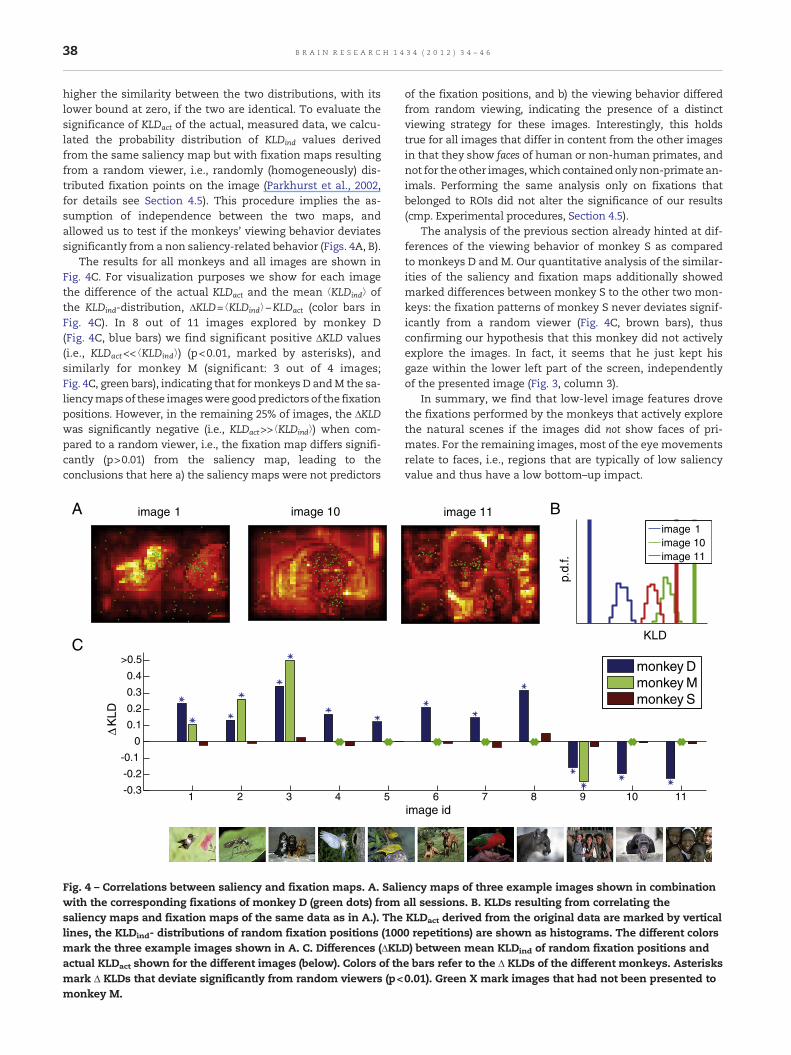
We computed the saliency maps of the images based on themodel described by Walther and Koch (2006) (see examplesin Fig. 4A). Simultaneously we computed the fixation mapsfor each image and monkey by down-sampling the original800×600 pixels-images to 30×40 pixels-images and normal-ized correspondingly the original fixation distribution (detailsin Section 4.4). The similarity of each fixation map and its cor-responding saliency map was derived by computing the sym-metrized Kullback–Leibler divergence (KLD) (Kullback andLeibler, 1951) between the two distributions (Rajashekaret al., 2004, details in Section 4.5). The smaller the KLD, the
For each monkey we show two columns, the left illustratesare overlaid onto the presented image. The displayed fixationof the respective image, over all experimental sessions.
resented images from all sessions.
38 B R A I N R E S E A R C H 1 4 3 4 ( 2 0 1 2 ) 3 4 – 4 6
higher the similarity between the two distributions, with itslower bound at zero, if the two are identical. To evaluate thesignificance of KLDact of the actual, measured data, we calcu-lated the probability distribution of KLDind values derivedfrom the same saliency map but with fixation maps resultingfrom a random viewer, i.e., randomly (homogeneously) dis-tributed fixation points on the image (Parkhurst et al., 2002,for details see Section 4.5). This procedure implies the as-sumption of independence between the two maps, andallowed us to test if the monkeys' viewing behavior deviatessignificantly from a non saliency-related behavior (Figs. 4A, B).
The results for all monkeys and all images are shown inFig. 4C. For visualization purposes we show for each imagethe difference of the actual KLDact and the mean ⟨KLDind⟩ ofthe KLDind-distribution, ΔKLD=⟨KLDind⟩−KLDact (color bars inFig. 4C). In 8 out of 11 images explored by monkey D(Fig. 4C, blue bars) we find significant positive ΔKLD values(i.e., KLDact<< ⟨KLDind⟩) (p<0.01, marked by asterisks), andsimilarly for monkey M (significant: 3 out of 4 images;Fig. 4C, green bars), indicating that formonkeys D andM the sa-liencymaps of these imageswere goodpredictors of the fixationpositions. However, in the remaining 25% of images, the ΔKLDwas significantly negative (i.e., KLDact>>⟨KLDind⟩) when com-pared to a random viewer, i.e., the fixation map differs signifi-cantly (p>0.01) from the saliency map, leading to theconclusions that here a) the saliency maps were not predictors
image 10image 1
-0.3
-0.2
-0.1
0
0.1
0.2
0.3
0.4
>0.5
KLD
A
C
1 2 3 4 5
Fig. 4 – Correlations between saliency and fixation maps. A. Saliwith the corresponding fixations of monkey D (green dots) fromsaliency maps and fixation maps of the same data as in A.). Thelines, the KLDind- distributions of random fixation positions (100mark the three example images shown in A. C. Differences (ΔKLactual KLDact shown for the different images (below). Colors of thmark Δ KLDs that deviate significantly from random viewers (p<monkey M.
of the fixation positions, and b) the viewing behavior differedfrom random viewing, indicating the presence of a distinctviewing strategy for these images. Interestingly, this holdstrue for all images that differ in content from the other imagesin that they show faces of human or non-human primates, andnot for the other images,which containedonlynon-primate an-imals. Performing the same analysis only on fixations thatbelonged to ROIs did not alter the significance of our results(cmp. Experimental procedures, Section 4.5).
The analysis of the previous section already hinted at dif-ferences of the viewing behavior of monkey S as comparedto monkeys D and M. Our quantitative analysis of the similar-ities of the saliency and fixation maps additionally showedmarked differences between monkey S to the other two mon-keys: the fixation patterns of monkey S never deviates signif-icantly from a random viewer (Fig. 4C, brown bars), thusconfirming our hypothesis that this monkey did not activelyexplore the images. In fact, it seems that he just kept hisgaze within the lower left part of the screen, independentlyof the presented image (Fig. 3, column 3).
In summary, we find that low-level image features drovethe fixations performed by the monkeys that actively explorethe natural scenes if the images did not show faces of pri-mates. For the remaining images, most of the eye movementsrelate to faces, i.e., regions that are typically of low saliencyvalue and thus have a low bottom–up impact.
image 11
image id
monkey Dmonkey Mmonkey S
B
10 116 7 8 9
KLD
p.d.
f.
image image 10image 11
1
ency maps of three example images shown in combinationall sessions. B. KLDs resulting from correlating theKLDact derived from the original data are marked by vertical0 repetitions) are shown as histograms. The different colorsD) between mean KLDind of random fixation positions ande bars refer to the Δ KLDs of the different monkeys. Asterisks0.01). Green X mark images that had not been presented to

39B R A I N R E S E A R C H 1 4 3 4 ( 2 0 1 2 ) 3 4 – 4 6
2.3. Consecutive fixations are likely to stay inside the samefixation cluster
Our analysis of the fixation positions (Section 2.1) revealed thatthese are not evenly distributed across the images, but rathertend to occur clustered in space (Fig. 3). Our interpretationwas that these clusters represent ROIs. Thus, our next aim is togain insight on the temporal sequences of visiting these ROIs.Therefore we explored the scanpaths of the image explorationsby applying a Markov chain (MC) analysis to the eye movementtrajectories (see details in Section 4.5). Thereby we assumeeach of the significantly identified fixation clusters on a particu-lar image as a Markov state, and estimate the probabilities forconsecutive fixations to either stay in the same cluster, to switchto a different cluster, or end up in the background. In this analy-sis the assumption of a MC enters in that the next state will bereached only depending on the current state, but does not de-pend on past states (see details in Section 4.5).
The cluster analysis of the fixation positions typicallyrevealed 3 to 5 significant clusters per image for monkeys Dand M, however, not a single significant cluster could beextracted for monkey S. Thus this monkey seems not to ex-press subjective ROIs, and we had to conclude that this mon-key is not actively exploring the images. Since the MC analysisis based on ROIs, monkey S had to be excluded from the sub-sequent analysis of the sequence of fixation positions.
Fig. 5A shows examples of eye movement sequences (4 outof 33) of monkey D during presentations of the same image.The fixation positions of monkey D on the image during allits presentations were grouped into three significant clusters(Fig. 5B, color coded). Fixation positions that do not belong toany identified cluster (small blue dots) are pooled togetherand assigned to the background cluster (see Sections 4.6 and4.7). The result of the MC analysis on these data is shown inFig. 5C as a transition graph. Each identified significant clus-ter, as well as the background cluster, represents a state ofthe model, whereas the transitions between the states(whose probabilities are indicated in black) are marked by di-rected arrows. The statistical significance was evaluated bycomparing the transition probabilities of the empirical datato uniform probabilities (Fig. 5C, numbers in gray; details seeSection 4.7). The probabilities (across all images) of stayingwithin the significant clusters are 87% (40/46) for monkey Dand 95% (19/20) for monkey M, thus significantly higher thanexpected by chance (Fig. 5D). In contrast, the probabilities ofmoving between significant clusters (Fig. 5E) are significantlylower than chance (in 62% of the transitions for monkey D(60/97) and in 62% for monkey M (83/134)). (Note, that for thelatter analyses the background state was discarded.) Thisalso holds true separately for monkeys D and M (Wilcoxontest, p<0.001).
As for saccade durations (Fig. 2D), the distributions of sac-cade lengths are skewed, thus showing a tendency for shorterwith respect to longer saccades. In order to avoid any bias dueto the skewness of the distribution, we performed a secondtest, which, instead of uniform probabilities, took into accountthe actual saccade amplitude distributions. The expected tran-sitionswereweighted by the actual probabilities of saccade am-plitudes (see Experimental procedures, Section 4.7 for details).The results confirmed the previous analysis, i.e., a significant
larger probability of staying within a cluster and a significantlower probability of switching between clusters than expected(Figs. 5D, E in green).
Overall, the Markov chain analysis revealed that the mon-keys preferentially move their eyes within the same ROI be-fore saccading out to another ROI or to the background.These results did not show any dependence on the contentsof the images, in particular with respect to primate faces.Thus, the viewing strategy of the monkeys seems to be com-posed of sequences of local explorations of regions-of-interest, but not of random eye movements between ROIs.
3. Discussion
The present work shows that during free viewing of naturalimages, Cebusmonkeys follow a strategy that involves periodsof local exploration, characterized by consecutive fixationsthat stay inside the same regions-of-interest. These periodsof local exploration are typically followed by longer saccadesinto a new ROI, where a new period of local exploration be-gins. ROIs were defined as areas containing clusters of fixa-tions performed by the monkeys over several presentationsof an image. For most of the images, the locations of the fixa-tion clusters correlate well with saliency maps, suggestinglow-level features as the driving force for the eye movements.Images containing faces are an exception, in that faces attractmost of the fixations despite their very low saliency. There-fore, as hypothesized, subjective ROIs reflect both bottom–upand top–down factors. Our approach based on subjectiveROIs is robust with respect to content and semantic meaningof the images, because it relies on the spontaneous sequencesof eye movements performed by the subject. Similar ap-proaches have been used in humans, showing conserved clus-ters of fixations in the same image for different subjects (Juddet al., 2009).
Our analysis of eyemovement sequences during free view-ing is based on the finding that fixations are not evenly dis-tributed on an image, but rather define clusters, on top ofconspicuous objects. This was the case for two out of threesubjects studied (monkeys D and M). However, the third mon-key (S) used a completely different viewing strategy. His fixa-tions were always restricted onto the lower left half of theimages and were evenly distributed therein. No significantclusters could be extracted from his fixations, and did notshow any significant correlation between fixation maps andsaliency maps, which corresponds to a random viewing be-havior. Given that the distributions of saccade durations ofthe three monkeys were undistinguishable (Fig. 2D), we con-cluded that it is unlikely that this monkey had any deficiencyin the oculomotor system. We rather assume that monkey Sdid not actively explore the images. Our experimental designcould not prevent this to happen, because the monkeys wereonly required to keep their gaze within the limits of the screento be rewarded. It is very likely, that this monkey did not onlylearn to keep his gaze within the limits of the screen, but ad-ditionally within a specific region therein while ignoring theimages. Our explanation relates to the process of training.During many weeks the monkeys needed to be trained to fix-ate on the central point. Initially the window to get a reward

40 B R A I N R E S E A R C H 1 4 3 4 ( 2 0 1 2 ) 3 4 – 4 6
was large and was progressively downsized. Monkey S mayhave learned that natural images were no different than fixa-tion images and that by trying to keep his gaze in some specif-ic area of the screen, he will get a reward (which he did). Thisstrategy enabled this animal to get rewarded only by trying to
0 0.2 0.4 0.60
0.05
0.1
0.15
0.2
0.25
prob. of staying within cluster
p.d.
f
BA
C
D
avoidmoving the eyes far away from a particular region of thescreen, hence the particular fixation distribution. Thereforewe restricted our analysis to the scanpaths of the monkeysthat explored the images, and we limit our discussion to theresults we derived from monkeys D and M.
0 0.2 0.4 0.60
0.05
0.1
0.15
0.2
0.25
prob. of changing cluster
p.d.
f
actualexpected (# fixations)expected (saccade amplitude)
E

41B R A I N R E S E A R C H 1 4 3 4 ( 2 0 1 2 ) 3 4 – 4 6
The visual fixations of monkeys D and M cluster on loca-tions of the images that appear to be relevant to the monkeys,and thuswe interpret these clusters as subjective ROIs. Similarviewing behavior has been found in humans that were freelyexploring natural images: most of the fixations were made inthe same regions of an image across observers. In fact, fixationlocations from one observer can be used to predict the loca-tions where other observers will fixate (Judd et al., 2009).Therefore, the images can be segmented into informativeand redundant regions both formonkeys and humans (Kriegeret al., 2000; Mackworth and Morandi, 1967; Yarbus, 1967). Acommon way to segment natural images is to apply saliencyanalyses. In our study we were interested in isolating the con-tribution of low-level features – such as orientation, color andintensity – and to relate it to the locations of the fixation clus-ters. In order to extract this relation we used the saliencymodel of Walther and Koch (2006). Saliency turned out to bea good predictor for the fixation positions. This suggests thatduring free viewing the eye movements are mainly driven bylow-level features. Images containing primate faces are an ex-ception (for monkeys and humans), in that the fixation posi-tions cluster in regions containing no salient features. Themismatch between saliency and positions of fixation clusterscan be attributed to the influence of top–down mechanisms,where attention to meaningful details of the objects deter-mines the location of gaze. This result fits well with data fromhuman studies where the choice of fixation positions has beenshown to be either driven by bottom–up (exogenous) or bytop–down (endogenous) factors (Cerf et al., 2008; Mackworthand Morandi, 1967). It has also been shown that the saliencymodel does not account for fixations that were directed to theeyes of humans (Birminghamet al., 2009). Thereby, faces appearto play a particular role, being probably the most important vi-sual stimuli in primate social communication (Bruce andYoung, 1998), as they can provide significant cues to intentionandmental state of other individuals (Anderson, 1998; Andrew,1963; Bruce andYoung, 1998; Emery, 2000). Similar observationswere found in non-human primates: monkeysmake longer fix-ations on faces (Guo et al., 2006), and respond appropriately tothe expressions of other individuals (Mendelson et al., 1982),andare able to recognize their faces (Rosenfeld andVanHoesen,1979).
Psychological studies have shown that the sequences of sac-cades and fixations are relevant for perception (Noton andStark, 1971b). In humans, during free viewing of still imagesfor long time periods (i.e., >10 s) saccade amplitudes decrease
Fig. 5 – Transition probabilities between clusters of fixations of mtrajectories during 4 different presentations of the same image (dextracted by the mean shift algorithm. The fixation points in theC. Transition graphs between the identified clusters, now interpFixations that do not fall into any of the identified clusters are cotransition probabilities are indicated in black, transition probabilrefers to eye movements exceeding the image presentation timecluster for experimental (black), random viewer (red), and predictfor the same data as shown in A.–C. E. Distributions of probabilitrandom viewer (red), and predicted on the basis of the saccade aA.–C.
exponentially (Antes, 1974; Unema et al., 2005). Pannasch et al.(2008) showed that fixation durations increase after the first2 s of exploration, revealing a global image exploration thatspans the first 2 s, followed by a local, feature explorationphase, evident after 4 s of exploration. The maximum explora-tion time in our study was 5 s, which could suggest that thehigher probability of staying inside a cluster is a consequenceof the late, local exploration phase. However, examination ofthe raw data (see for example Figs. 2A and B, and 5A) revealsthat someconsecutive fixations are separatedby short saccadeseven during the first seconds of exploration.
We find that the monkeys fixate preferably at certain re-stricted locations on the images (identified as clusters of fixa-tions), and that the eye movements between these clusters arenot random. TheMarkov chain analysis revealed that themon-keys primarilymake short saccadeswithin a cluster of fixations.These short saccades are likely to be followed by a larger sac-cade that directs the gaze to a new position inside a differentcluster. This finding is consistent with the hypothesis thatlarge saccades to new areas are followed by local, short sac-cades to nearby positions for refinement of the percept (Körneret al., 1999; Ullman, 1995). Further studies showed that applyinga Markov model to humans freely viewing advertisements hasrevealed similar local vs. global exploration modes (Wedelet al., 2008), and that humans and monkeys attend to relevantsocial stimuli when viewing short movies (Shepherd et al.,2010). Thus our results indicate that the monkeys use a similarstrategy for scanning natural images as humans do.
Experiments including active vision, i.e., without the re-quest that eyes fixate on a pre-defined position, are infre-quently included in studies that involve electro-physiologicalrecordings, as they do not contain repetitive, identical trialsand thus are harder to analyze. This study provides new ap-proaches to data from free viewing animals and thus opensnew routes for experiments that aim to relate neuronal activ-ities to natural behavior. The Markov chain model appears tobe a natural way to compress complex and variable data setssuch as eye movements made on natural images. Clusterscan be labeled and further grouped into different categoriesby saliency analysis or image segmentation methods, andthe eye movements can be represented as a Markov stategraph, which assigns probabilities to the transitions betweenstates (as shown in Fig. 5). Such a procedure offers the possi-bility of summarizing an otherwise very disparate data set.Neurophysiological data could be subsequently analyzed inthe context of the different categories of fixation clusters.
onkey D viewing image no. 2. A. Example of eye movementifferent colors). B. Spatial clusters (3) of fixation positionsrespective clusters are colored in blue, cyan, and magenta.
reted as the states of the MC model (same colors as in B.).llected into the background state (black box). Experimentalities assuming a random viewer are indicated in gray. STOP. D. Distributions of probabilities of staying within the sameed on the basis of the saccade amplitude distribution (green),ies to switch between clusters for experimental (black),mplitude distribution (green), for the same data as shown in

42 B R A I N R E S E A R C H 1 4 3 4 ( 2 0 1 2 ) 3 4 – 4 6
Electro-physiological studies that involve the presentationof natural stimuli, either during free viewing or fixed gaze, al-ready showed that the perspective of a simple stimulus–re-sponse relation explains only partially the neural activityobserved in natural vision (Yen et al., 2007). In these situations,neuronal activity appears much more complex, which cannotbe simply related to the stimulus features, where higher-orderbrain areas and attentional effects obviously play a crucialrole. Active vision includes self-initiated eye-movements andthus naturally involves a combination of internal and externaldriving forces. Active vision is fast: within the duration of a fix-ation (about 200 ms) visual input enters the system, visual in-formation is processed and the next new eye movement isinitiated. This requires fast processing and leaves to every indi-vidual stage of the nervous system only very limited time forcomputation (Thorpe et al., 1996). This limited time can be bet-ter used if some consecutive fixations are made close to eachother, serially grouping object features (Houtkamp and Roelf-sema, 2010).
Thus, electro-physiological studies of active vision need toinclude the dynamics of processing, as suggested by some ofthe models of the visual system (Körner et al., 1999; Van Rullenet al., 1998), which predict temporal coordination of neuronalactivities. Recently, we found that spike synchrony is involvedearly in the processing in the visual system (Maldonado et al.,2008) and that a signal activating large populations of neuronsof the visual system (local field potential) occurs locked to sac-cade onset, thereby providing an internal reference signal forthe coordination of neuronal activity induced by visual input(Ito et al., 2011). It is highly likely that this signal is modulatedalong the scanpath or has an attentional function thus provid-ing the ground for context-dependent neuronal processing.
4. Experimental procedures
4.1. Animals and surgery
All experiments followed the National Institutes of HealthGuide for the Care and Use of Laboratory Animals and were inaccordance with University of Chile guidelines. All surgicaland recording procedures are described in Maldonado et al.(2008). Three adult, male capuchin monkeys (Cebus apella)weighing 3–4 kg served as subjects for this study. Henceforth,these animals are referred to as monkeys D, M, and S. Understerile conditions, each animal was implanted with a scleralsearch coil for monitoring eye position (2 kHz sampling rate,DNI Instruments, Resolution: 1.2 min of arc; for details seeJudge et al., 1980), and a cranial post for head fixation. Duringthe experiment, the animals were seated in a chamber dimlylit at a low scotopic level (1–2 lx, LX-110 Lux Meter). They werepresentedwith a collection of 11 (monkeysD and S) and 4 (mon-keyM) pictures of different natural scenes (consisted of picturesof animals, faces and landscapes, 800×600 pixel resolution;taken from Corel® photo library). The pictures were displayedon a CRT computer monitor (frame rate: 60 Hz) located 57 cmin front of the animals, subtending 40°×30° of visual angle. Asa control, for every third stimulus presentation, a blank framewith black background was presented instead of a naturalimage. We refer to the trials with natural image stimuli as
image condition trials and those with the blank frame asblank condition trials. In order to maintain the alertness of theanimals, and to control eye coil precision, they were trained toperform a fixation task before every trial, in which a blackframe with a single fixation spot was presented and they hadto fixate it (1° window) for 1 s in order to be rewarded (referredto as fixation cue). Then, a natural image or the blank framewas presented for 3 or 5 s formonkeyD or S andM, respectively(free viewing trials) (Fig. 1). In the free viewing trial, the animalswere allowed to freely explore the monitor screen with self-initiated eye movements while the experimental protocol re-quired the animals to maintain their gaze within the limits ofthe monitor for the whole presentation period, to be rewardedwith a dropof juice. A sessionwas composedof image conditiontrials and blank condition trials alternating with fixation cues.Before each session we calibrated the coil with a series of fixa-tion cues, referred to as fixation epoch. If the monkeys werewilling to continue to work after a session we ran a further ses-sion starting with a fixation epoch, followed by a new set of im-ages. This process was repeated as long as the animals weremotivated to continue the task. Only the data collected duringthe presentation of fixation cues and natural images servedfor the following analyses and defined an experimental session.
4.2. Detection and statistics of eye movements and fixations
We developed an automatic algorithm to extract differenttypes of eye movements from the eye traces (Maldonado etal., 2008). Eye movements were categorized in two differentgroups (saccades and fixations) (cf. Figs. 2A, B), according tothe following criteria: Saccades were defined as eye move-ments with an angular velocity higher than 150°/s and lastingfor at least 5 ms, and exhibit aminimumacceleration of 170°/s2.Fixation periods were defined as gaze positions lasting at least100ms within 1° of the gaze location, following a saccade.Data that could not be assigned into one of the two categories(e.g., drifts) were not taken into account for further analysis.Only pairs of unambiguous saccade–fixation (S–F) sequenceswere considered for further analysis. Basic statistics of fixationand saccade durations pooled per monkey over all sessionsare shown in Figs. 2C, D.
4.3. Computation of saliency maps
In order to relate the visual foci of themonkeys as expressed bythe fixation positions to the features of the images, we comput-ed maps of fixation points (‘fixationmaps’; see Section 4.4) andseparately, maps of salient features of the images (‘saliencymaps’), and correlated the two (cf. Section 4.5). A saliency mapis a topographically arrangedmap that represents visual salien-cy of a corresponding visual scene. Koch and Ullman (1985) pro-posed to combine different visual features that contribute toattentive selection of a stimulus (e.g., color, orientation, move-ment, etc.) into one single topographically orientedmap (salien-cy map), which integrates the normalized information fromindividual featuremaps into one globalmeasure of conspicuity.We concentrated here on a saliencymapmodel byWalther andKoch (2006) that ignores the motion aspect, but uses color, in-tensity, and orientation (implementation freely available athttp://www.saliencytoolbox.net/). Thereby, the images were

43B R A I N R E S E A R C H 1 4 3 4 ( 2 0 1 2 ) 3 4 – 4 6
segregated into three separate feature maps: one for intensity,one for color, and one for orientation. In a second step, each fea-ture was re-organized into a center-surround arrangementcharacteristic of receptive field organization (Hubel andWiesel,1962), and highlights the parts of the scene that strongly differfrom their surroundings. This was achieved by computing thedifferences between fine and coarse scales applied to the fea-ture maps to extract locally enhanced intensities for each fea-ture type. In the last step these resulting conspicuity mapswere normalized to the total number of maps and added toyield the final saliency map s(x, y) (see examples in Fig. 4A).
4.4. Computation of fixation maps
Asameasure of the regions of the images that preferably attractthe interest of the monkeys we computed a fixation map foreach image and monkey. All fixations performed by a monkeyon a particular image were pooled across different sessionsand trials (see examples in Fig. 3A) to calculate a two-dimensional probability distribution of the fixations f(x, y).Such a distribution was derived by discretizing the images intotwo dimensional bins of 30×40 pixels (original resolution was600×800 pixel), counting the fixation positions in each of themand normalizing the counts to the total number of fixations onthat image to yield a probability distribution. This resolutioncorresponds to approximately 1° of viewing angle in x- and y-dimension (1° corresponds to 1 cmon the screenwhich is locat-ed 57 cm in front of themonkey), which was also chosen as thetolerance for the definition of a fixation.
4.5. Similarity of saliency and fixation maps
To quantify the similarity between the saliencymapof an imageand the respective fixationmap we calculated the symmetrizedKullback–Leibler divergence (KLD) (Kullback and Leibler, 1951)between the two (Rajashekar et al., 2004). The Kullback–Leiblerdivergence is an information theoretical measure of the differ-ence between two probability density functions (pdfs), in ourcase s(x, y) and f(x, y):
D s x; yð Þ; f x; yð Þð Þ :¼ D s;fð Þ ¼ ∑x∑ys x; yð Þ log s x; yð Þ
f x; yð Þ
D is always non-negative, and is zero, if and only if s(x, y)=f(x, y). The smaller D, the higher the similarity between thetwo pdfs, with its lower bound at zero, if the two pdfs areidentical. The so defined divergence happens to be asym-metric, that is D(s,f )≠D( f,s), for s≠ f. To circumvent an asym-metry of the measure for s≠ f, we chose the normalizationmethod proposed by Johnson and Sinanovic (2001):
KLD s x; yð Þ; f x; yð Þð Þ ¼ KLD s; fð Þ ¼ 11
D s;fð Þ þ 1D f ;sð Þ
The smaller the KLD, the higher the similarity between thetwo pdfs, with its lower bound at zero, if the two pdfs areidentical.
We defined KLDact as the divergence between the saliencymap and the fixations map. Under the experimental hypothe-sis this divergence should be small. To evaluate the
significance of the measured, actual KLDact we calculated theKLD-distributions under the assumption of independence ofthe two maps. One entry in this distribution was calculatedas the distance KLDind between the original saliency pdf s(x, y)and a fixation map f(x, y)ind derived from randomly (homoge-nously) distributed fixation points on the image (same numberas were present in the original viewing, Parkhurst et al., 2002).This procedure was repeated 1000 times to yield the KLDind-dis-tribution that served for testing whether the original viewingbehavior measured by the actual KLDact deviates significantlyfrom a viewing behavior that is not related to the saliencymap (Fig. 4B shows three examples).
For visualization purposes (Fig. 4C) we show for each imagethe difference of the actual KLDact value and the mean ⟨KLDind⟩of the ⟨KLDind⟩-distribution: ΔKLD=⟨KLDind⟩−KLDact. Positivevalues of ΔKLD (i.e., KLDact<⟨KLDind⟩) denote a higher similaritybetween the actual fixation and saliency map than expectedby a random viewer, indicating that the saliency map is agood predictor for the eye movements. On the contrary, nega-tive values of ΔKLD (i.e., KLDact>⟨KLDind⟩) signify that the dis-tance between the actual fixation map and the saliency mapis larger than assuming random viewing. Significant devia-tions from random viewing are marked by an asterisk.
In a further test, we repeated the whole above analysisconsidering fixations within ROIs only, and fed their numberto the generator of random fixations (random viewer). Theprevious results were confirmed, i.e., significantly smallerKLDact values for non-primate images, and significantly largerKLDact values for primate images than expected (not shown).
4.6. Spatial clustering of fixation positions
In order to investigate the existence of regions-of-interests(ROIs), defined as areas with high density of fixation positions,we identified spatial clusters of fixations by use of the meanshift algorithm (Comaniciu and Meer, 2002; Funkunaga andHosteler, 1975) adapted for eye movement data (Santella andDeCarlo, 2004). This is an automatic, entirely data-drivenmethod that derives the number and arrangement of clustersdeterministically.
The algorithm starts from the set of N fixation positions→vi;j ¼ xi;j
yi;j
� �, with i ∈ (1,…, N) being the index of the fixation po-
sitions, and j=1 the original fixation positions on the 2D screen.The clustering algorithm proceeds iteratively, while moving ateach iteration each of the points to its new position→v i; jþ1, in de-pendence on the weighted mean of proximity and density of
points around the reference point, →vi; jþ1 ¼∑iK Vij−Vk;j� �
Vk;j
∑i
Vij−Vk;j� �
with j≠k. The kernel K was defined as a 2D-Gaussian with
mean and variance of 0:K →v� �
¼ ex2þy2ð Þσ2 . σwas the only parame-
ter of the clustering algorithm and defined the attraction radiusof the points. We varied its value and found 2.5 to yield satisfy-ing results, i.e., the algorithm did not lead to over fitting or tocoarse clusters. We used this value to perform all of our ana-lyses. At each iteration the positions were moved into denserconfigurations, and the procedure was stopped after conver-gence. Thereby fixationswere assigned to a clusterwhose refer-ence points lay within a diameter of 1° apart, referred to asexperimental cluster. Robustness to extreme outliers was

44 B R A I N R E S E A R C H 1 4 3 4 ( 2 0 1 2 ) 3 4 – 4 6
achieved by limiting the support of points at large distances asdefined by the kernel K →v
� �.
In order to discard outlier clusters, we additionally applied asignificance test to disregard clusters containing only a verysmall fraction of the data that deviate from expectation of inde-pendence.As a significance test on the experimental clusters,weproceeded as follows: we assigned n random locations on thescreen by drawing n pairs of uniformly distributed numbers,with n being the total number of fixations on a specific image.This random fixationmapwas fed into themean shift clusteringalgorithm, leading to a set of simulated clusters. Repeating thisprocedure 100 times, we obtained two distributions: one of fixa-tion numbers per cluster and one of cluster point density. An ex-perimental cluster of fixation positions was identified assignificant when both its number of fixations and their densityexceeded the mean plus two standard deviations of the meancluster point number and density obtained from simulated clus-ters, respectively. All fixations that did not belong to a significantcluster were pooled into a special cluster, referred to as back-ground state. The background state was crucial for the correctcalculation of the transition probabilities to and from significantclusters, i.e., in order to account also for the transitions that areneither within a cluster, nor between two clusters. Further de-tails are described in the next section.
4.7. Transition probabilities between fixation clusters
The statistical properties of the scanpaths a monkey chose toexplore an image were analyzed by a Markov chain (MC) anal-ysis (Markov, 1913). A MC is a sequence of random variablesthat propagate through a chain of states in accordance withgiven transition probabilities. These were estimated fromthe data as normalized frequencies of transitions from a spe-cific state sj to any particular other state sk or to itself. The for-merly identified clusters (compare previous section) offixation points (including the background cluster) definedthe states sj. The transition probabilities from any one stateto any other state (including the same state) were representedin matrix form. The state of the system at step t with t=1,…,T−1, with T being the total number of fixations on an imagewasderived via P(St+1=s|St=si,…,S1=s1)=P(St+1=s|St=si) for all nstates si ∈ s1, …, sn, thereby assuming that the scanpaths ofthe monkeys satisfy the Markov property, i.e., the presentstate is independent of the past states.
For better intuition, we visualized the results of theMC anal-ysis by a transition graph (see example shown for monkey D inFig. 5), inwhich the vertices are the states, i.e., the identified fix-ation clusters. The graph is composed of oriented edges con-necting vertices, weighted with the transition probabilitiesbetween the respective states. In addition, each vertex also con-tains an edge to itself weighted by the probability of stayingwithin the same state in the subsequent step. In the followingtwo cases no edges were drawn between the two vertices:first, whenever the transition probability Pjk equals zero; sec-ond, for transitions originating in the background state. For bet-ter visualization we represented the transition probabilities bythe thickness of the edges (Fig. 5C) (thereby deviating in thegraphical display from conventional transition graphs).
In order to interpret the transition probabilities derived bythe MC analysis we compared them to the transition
probabilities obtained assuming homogeneous chance proba-bilities of the transitions between any two states sj and sk,P expected Stþ1 ¼ skð jSt ¼ sjÞ ¼ P expected Stþ1 ¼ skð Þ ¼ nk
T , with nk beingthe number of fixations in state sk and T the total number oftransition steps. As illustrated in Fig. 5C, we typically observedlarge differences in the transition probabilities in the viewingbehavior of the monkeys (numbers in black) as compared torandom transitions (numbers in gray). Themonkeys' behaviordisplays a larger probability to stay within a significant cluster(Fig. 5D), and a lower probability of moving to another signifi-cant cluster (Fig. 5E) than a ‘random viewer’. (Note, that thetransition probabilities within and from the background clus-ter do not enter in the latter analysis.) This result holds truefor both monkeys, and for images both containing and notcontaining faces.
In a second statistic we compared the transition probabili-ties obtained with the MC analysis with expected probabilitiesof staying within or switching between clusters weighted bythe actual saccade length probabilities. This was obtained bymultiplying the latter probabilities with the expected relativeprobability of transition (Fig. 5D, E shown in green).
The expected transition probability between state sj and skis: P expected Stþ1 ¼ skð jSt ¼ sjÞ ¼ ∑
dPact Stþ1 ¼ skð jSt ¼ sj;dÞ⋅ρj→k
d ,with
d being the saccade length and ρdj→k defined for cluster j as
ρj→kd ¼ Ptheor
d Stþ1 ¼ skð jSt ¼ sj;dÞ∑iPtheord Stþ1 ¼ sið jSt ¼ sj; dÞ
, ∑kρj→kd ¼ 1;∀ d; jð Þ. The above
probability that a saccade of length d leads to a state transi-tion sj → sk, Pdtheor(St+1=sk|St=sj ;d), was calculated from theobtained fixation clusters by numerically computing all possi-ble saccades of length d that stay within the same cluster sj orland into another cluster sk.
Acknowledgments
We thank Tilke Judd (CSAIL MIT), Marc-Oliver Gewaltig andUrsula Körner (both HRI Europe), for stimulating discussions.Partially supported by the Stifterverband für die DeutscheWissenschaft; Iniciativa Cientifica Milenio to PM and FJF;CONYCIT fellowship to FJF; the BMBF (grant 01GQ0413 toBCCN Berlin); HRI, Europe; and RIKEN BSI.
R E F E R E N C E S
Anderson, J.R., 1998. Social stimuli and social rewards in primatelearning and cognition. Behav. Process. 42, 159–175.
Andrew, R.J., 1963. Evolution of facial expression. Science 142,1034–1041.
Antes, J.R., 1974. The time course of picture viewing. J. Exp.Psychol. 103, 62–70.
Biedermann, I., 1987. Recognition-by-components: a theory ofhuman image understanding. Psychol. Rev. 94, 115–147.
Birmingham, E., Bischof, W.F., Kingstone, A., 2009. Saliency doesnot account for fixations to eyes within social scenes. Vis. Res.49, 2992–3000.
Bruce, V., Young, A., 1998. In the Eye of the Beholder: The Science ofFace Perception. Oxford University Press, England, New York.

45B R A I N R E S E A R C H 1 4 3 4 ( 2 0 1 2 ) 3 4 – 4 6
Buswell, G., 1935. How People Look at Pictures: A Study of thePsychology of Perception in Art. Univ. Chicago Press, Chicago.
Castelhano, M.S., Henderson, M.S., 2007. Initial scenerepresentations facilitate eye movement guidance in visualsearch. J. Exp. Psychol. Hum. Percept. Perform. 33, 753–763.
Cerf, M., Harel, J., Einhauser, W., Koch, C., 2008. Predicting humangaze using low-level saliency combined with face detection.Adv. Neural Inf. Process. Syst. 20, 241–248.
Comaniciu, D., Meer, P., 2002. Mean shift: a robust approachtoward feature space analysis. IEEE Trans. Pattern Anal. 24,603–619.
Crick, F., Koch, C., 1998. Constraints on cortical and thalamicprojections: the no-strong-loops hypothesis. Nature 391,245–250.
Emery, N.J., 2000. The eyes have it: the neuroethology, functionand evolution of social gaze. Neurosci. Biobehav. Rev. 24,581–604.
Feng, G., 2006. Eye movements as time-series random variables: astochastic model of eye movement control in reading. Cogn.Syst. Res. 7, 70–95.
Funkunaga, K., Hosteler, L., 1975. The estimation of the gradient ofa density function, with applications to pattern recognition.IEEE Trans. Inf. Theory 21, 32–40.
Guo, K., Robertson, R.G., Mahmoodi, S., Tadmor, Y., Young, M.P.,2003. How do monkeys view faces? — a study of eyemovements. Exp. Brain Res. 150, 363–374.
Guo, K., Mahmoodi, S., Robertson, R.G., Young, M.P., 2006. Longerfixation duration while viewing face images. Exp. Brain Res. 171,91–98.
Houtkamp, R., Roelfsema, P., 2010. Parallel and serial grouping ofimage elements in visual perception. J. Exp. Psychol. Hum.Percept. Perform. 36, 1443–1459.
Hubel, D.H., Wiesel, T.N., 1962. Receptive fields, binocularinteraction and functional architecture in the cat's visualcortex. J. Physiol. (Lond.) 160, 106–154.
Ito, J., Maldonado, P., Singer, W., Grün, S., 2011. Saccade-relatedmodulations of neuronal excitability support synchronyofvisually elicited spikes. Cereb Cortex 21 (11), 2482–2497.
Itti, L., Koch, C., 1999. A comparison of feature combinationstrategies for saliency-based visual attention systems. P. Soc.Photo-Opt. Ins. 3644, 473–482.
Itti, L., Koch, C., 2001. A model of saliency-based visual attentionfor rapid scene analysis. Nature 2, 194–203.
Itti, L., Koch, C., Niebur, E., 1998. A model of saliency-based visualattention for rapid scene analysis. IEEE Trans. Pattern Anal. 20,1254–1259.
Johnson, D., Sinanovic, S., 2001. Symmetrizing the KullbackLeibler distance. IEEE Trans. Inf. Theory 1, 1–10.
Judd, T., Durand, F., Torralba, A., 2009. Learning to predict wherehumans look. IEEE 12th I. Conf. Comp. Vis. , pp. 2106–2113.
Judge, S.J., Richmond, B.J., Chu, F.C., 1980. Implantation ofmagnetic search coils for measurement of eye position: animproved method. Vision Res. 20, 535–538.
Just, M.A., Carpenter, P.A., 1967. Eye fixations and cognitiveprocesses. Cogn. Psychol. 8, 441–480.
Koch, C., Ullman, S., 1985. Shifts in selective visual attention:towards the underlying neural circuitry. Hum. Neurobiol. 4,219–227.
Körner, E., Gewaltig, M.-O., Körner, U., Richter, A., Rodemann, T.,1999. A model of computation in neocortical architecture.Neural Netw. 12, 989–1005.
Krieger, G., Rentschler, I., Hauske, G., Schill, K., Zetzsche, C., 2000.Object and scene analysis by saccadic eye-movements: aninvestigation with higher-order statistics. Spat. Vis. 13,201–214.
Kullback, S., Leibler, R.A., 1951. On information and sufficiency.Ann. Math. Stat. 22, 79–86.
Mackworth, N.H., Morandi, A., 1967. The gaze selects informativedetails within pictures. Percept. Psychophys. 2, 547–552.
Maldonado, P., Babul, C., Singer, W., Rodriguez, E., Berger, D.,Grün, S., 2008. Synchronization of neuronal responses inprimary visual cortex of monkeys viewing natural images.J. Neurophysiol. 100, 1523–1532.
Markov, A., 1913. An example of statistical study on text of EugenyOnegin illustrating the linking of events to a chain. IzvestiyaAkademii Nauk. 6, 153–162.
Mendelson, M., Haith, M., Goldman-Rakic, P., 1982. Face scanningand responsiveness to social cues in infant rhesus monkeys.Dev. Psychol. 18, 222–228.
Milanse, R., Gil, S., Pun, T., 1995. Attentive mechanisms fordynamic and static scene analysis. Opt. Eng. 34, 2428–2434.
Noton, D., Stark, L., 1971a. Scanpaths in saccadic eye movementswhile viewing and recognizing patterns. Vision Res. 11, 929–942.
Noton, D., Stark, L., 1971b. Scanpaths in eye movements duringpattern perception. Science 171, 308–311.
Ossandon, J.P., Helo, A., Montefusco-Siegmund, R., Maldonado, P.E.,2010. Superposition model predicts EEG occipital activityduring free viewing of natural scenes. J. Neurosci. 30,4787–4795.
Pannasch, S., Helmert, J.R., Roth, K., Herbold, A.-K., Walter, H.,2008. Visual fixation durations and saccadic amplitudes:shifting relationship in a variety of conditions. J. Eye Mov. Res.2 (4), 1–19.
Parkhurst, D., Law, K., Niebur, E., 2002. Modeling the role ofsaliency in the allocation of overt visual attention. Vision Res.42, 107–123.
Rajashekar, U., Cormack, L.K., Bovik, A.C., 2004. Point of gazeanalysis reveals visual search strategies. In: Rogowitz, B.E.,Pappas, T.N. (Eds.), Proceedings of SPIE Human Vision andElectronic Imaging IX, vol. 5292. SPIE Press, Bellingham, WA,pp. 296–306.
Rosenfeld, S.A., Van Hoesen, G.W., 1979. Face recognition in therhesus monkey. Neuropsychologia 17, 503–509.
Santella, A., DeCarlo, D., 2004. Robust clustering of eye movementrecordings for quantification of visual interest. ETRAProceedings 2004. ACM, New York, pp. 27–34.
Shepherd, S.V., Steckenfinger, S.A., Hasson, U., Ghazanfar, A.A.,2010. Human–monkey gaze correlations reveal convergentand divergent patterns of movie viewing. Curr. Biol. 20, 649–656.
Simola, J., Salojärvi, J., Kojo, I., 2008. Using hidden Markov modelto uncover processing states from eye movements ininformation search tasks. Cogn. Syst. Res. 9, 237–251.
Stratton, G.M., 1902. Eye-movements and the aesthetics of visualform. Philosophische Studien 20, 336–359.
Stratton, G.M., 1906. Symmetry, linear illusions and themovements of the eye. Psychol. Rev. 13, 82–96.
Thorpe, S., Fize, D., Marlot, C., 1996. Speed of processing in thehuman visual system. Nature 381, 520–522.
Torralba, A., Oliva, A., Castelhano, M.S., Henderson, J.M., 2006.Contextual guidance of eye movements and attention inreal-world scenes: the role of global features in object search.Psychol. Rev. 113, 766–786.
Treisman, A.M., Gelade, G., 1980. A feature-integration theory ofattention. Cogn. Psychol. 12, 97–136.
Tsotsos, J.K., Culhane, S.M., Wai, W.Y.K., Lai, Y.H., Davis, N.,Nuflo, F., 1995. Modeling visual attention via selective tuning.Artiff. Intell. 78, 507–545.
Ullman, S., 1995. Sequence seeking and counter streams: acomputational model for bidirectional information flow in thevisual cortex. Cereb. Cortex 5, 1–11.
Unema, P.J.A., Pannasch, S., Joos, M., Velichkovsky, B.M., 2005.Time course of information processing during sceneperception: the relationship between saccade amplitude andfixation duration. Vis. Cogn. 12, 473–494.

46 B R A I N R E S E A R C H 1 4 3 4 ( 2 0 1 2 ) 3 4 – 4 6
Van Der Lans, R., Pieters, R., Wedel, M., 2008. Eye-movementanalysis of search effectiveness. J. Am. Stat. Assoc. 103,452–461.
Van Rullen, R., Gautrais, J., Delorme, A., Thorpe, S., 1998. Faceprocessing using one spike per neurone. Biosystems 48, 229–239.
Walther, D., Koch, C., 2006. Modeling attention to salientproto-objects. Neural Netw. 19, 1395–1407.
Wedel, M., Pieters, R., Liechty, J., 2008. Attention switching duringscene perception: how goals influence the time course of eye
movements across advertisements. J. Exp. Psychol. Appl. 14,129–138.
Wolfe, J.M., 1994. Guided search 2.0: a revised model of visualsearch. Psychon. Bull. Rev. 1, 202–238.
Yarbus, A.L., 1967. Eye Movements and Vision. Plenum Press,New York.
Yen, S.C., Baker, J., Gray, C.M., 2007. Heterogeneity in theresponses of adjacent neurons to natural stimuli in catstriate cortex. J. Neurophysiol. 97, 1326–1341.