Ab Initio Calculation of Elastic Constants of Ceramic Crystals
Upload
independentCategory
view
1download
0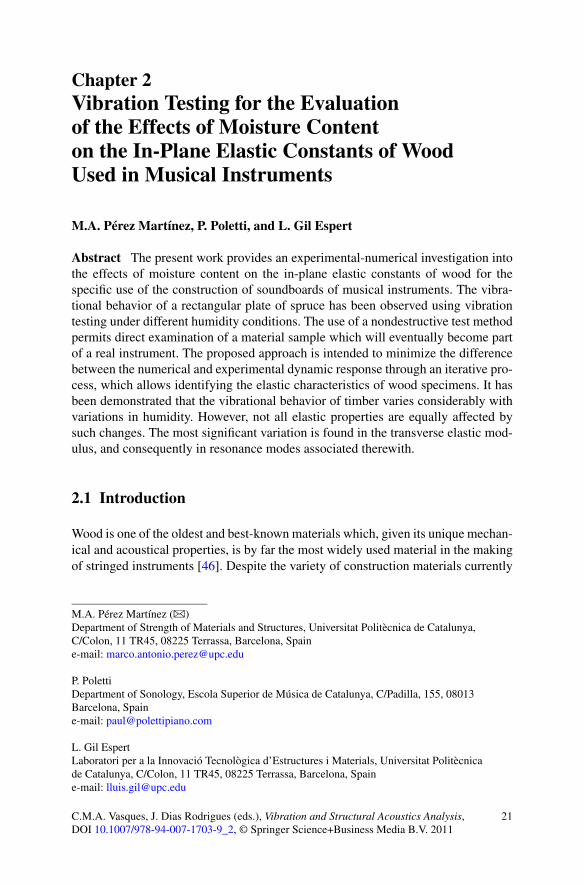
Chapter 2Vibration Testing for the Evaluationof the Effects of Moisture Contenton the In-Plane Elastic Constants of WoodUsed in Musical Instruments
M.A. Pérez Martínez, P. Poletti, and L. Gil Espert
Abstract The present work provides an experimental-numerical investigation intothe effects of moisture content on the in-plane elastic constants of wood for thespecific use of the construction of soundboards of musical instruments. The vibra-tional behavior of a rectangular plate of spruce has been observed using vibrationtesting under different humidity conditions. The use of a nondestructive test methodpermits direct examination of a material sample which will eventually become partof a real instrument. The proposed approach is intended to minimize the differencebetween the numerical and experimental dynamic response through an iterative pro-cess, which allows identifying the elastic characteristics of wood specimens. It hasbeen demonstrated that the vibrational behavior of timber varies considerably withvariations in humidity. However, not all elastic properties are equally affected bysuch changes. The most significant variation is found in the transverse elastic mod-ulus, and consequently in resonance modes associated therewith.
2.1 Introduction
Wood is one of the oldest and best-known materials which, given its unique mechan-ical and acoustical properties, is by far the most widely used material in the makingof stringed instruments [46]. Despite the variety of construction materials currently
M.A. Pérez Martínez ()Department of Strength of Materials and Structures, Universitat Politècnica de Catalunya,C/Colon, 11 TR45, 08225 Terrassa, Barcelona, Spaine-mail: [email protected]
P. PolettiDepartment of Sonology, Escola Superior de Música de Catalunya, C/Padilla, 155, 08013Barcelona, Spaine-mail: [email protected]
L. Gil EspertLaboratori per a la Innovació Tecnològica d’Estructures i Materials, Universitat Politècnicade Catalunya, C/Colon, 11 TR45, 08225 Terrassa, Barcelona, Spaine-mail: [email protected]
C.M.A. Vasques, J. Dias Rodrigues (eds.), Vibration and Structural Acoustics Analysis,DOI 10.1007/978-94-007-1703-9_2, © Springer Science+Business Media B.V. 2011
21
22 M.A. Pérez Martínez et al.
available, such as synthetic polymers and carbon fibre composites, luthiers have forthe large part continued using wood.
Wood has the capacity to react and adapt to environmental conditions, thus theeffects of changing moisture levels are important from a practical point of view andare often a decisive factor for the material’s mechanical performance. Generally,the speed of sound increases and the internal damping decrease with a reduction ofmoisture content and, as a consequence, the musical instrument often sounds no-ticeably brighter [22]. At the other end of the spectrum, under extremely moist con-ditions, the expansion experienced by the material due to its hygroscopicity can be-come large enough that permanent damage results. Other material properties whichare critical for the acoustical performance, such as elastic moduli or density, are alsoaffected [18, 44]. Therefore, one of the most important considerations in the processof the construction of a wooden musical instrument is to understand the alterationscaused by changes in humidity.
Independent of the basic nature of any material, its elastic properties play a fun-damental role in science and technology, permitting a description of the mechanicalbehavior of a material which is essential to design and experimental stress analysis.There are a wide number of methods to characterize the elasticity of materials. Sev-eral static methods have been codified due their simplicity despite the fact that theyintroduce serious difficulties, primarily their destructive nature, but also includingother problems, such as boundary effects, sample size dependencies, difficulties inobtaining homogeneous stress strain fields and localized data, the drawbacks whichmake these methods less attractive.
In the present work, an initial attempt was made to determine the elastic char-acteristics of the specimens using extensometric techniques. Aside from the dis-advantages of static tests enumerated, this method introduces a series of additionaldifficulties due to the fact that the reading returned by the sensor represents localizedconditions within the material. When examining a material which is not completelyhomogeneous, the location of the sensor is critical. In the case of wood, differentreadings are obtained when the sensor is placed over the earlywood or latewood,a problem which might be resolved by using large strain gauges such that the read-ing corresponds to the integration of the field deformation of the covered surface.Another problem is that the adhesive can interfere with the reading by producinga local increase in rigidity of the material. Finally, when the specimen is placedunder extreme conditions of temperature and humidity, it is difficult to guaranteethe perfect adherence of the gauge to the surface of the specimen. Due to all ofthese drawbacks, the technique of extensometry does not seem to be the best optionfor the determination of the elastic properties of wooden specimens under differentmoisture contents.
Given the problem of direct measurement of the elastic properties, an indirectmethod that allows the measurement of experimental related parameters is usefulto derive the unknown properties. A large number of techniques have been devel-oped for the experimental study in the elasticity of wood [46], among them beingresonance methods, which are attractive from both the experimental and numeri-cal point of view. These methods are based on a relationship between an analytical

2 Effects of Moisture Content on the In-Plane Elastic Constants of Wood 23
expression describing the vibration behavior of the specimens and experimental re-sults [28]. However, due to the complex nature of the material in combination withproblem of boundary conditions, the applicability of this technique is limited. Asdiscussed in the following sections, since no closed form analytical solution existsfor the partial differential equation governing the free transverse vibration of a rect-angular plate [30], the problem must be addressed by numerical approximations.Finally, the inverse problem of estimating the in-plane elastic constants is reducedto minimizing the difference between the numerical and the experimental responsethrough an iterative process.
The present work provides an experimental-numerical investigation on the ef-fects of moisture content on the in-plane elastic constants of wood for the specificuse of the construction of soundboards of musical instruments. This chapter hasbeen organized with the intent of giving the reader a structured and comprehensiveknowledge of the problem treated. After a brief overview of the state of the art,Sect. 2.3 discusses wood’s orthotropic nature and exposes the constitutive modelused in the study. Section 2.4 describes the effects of moisture content in wood andthe specimens used, as well as the procedures used to induce humidity changes in thesamples and the experimental results of the influence of such changes on the geome-try and mass parameters. In Sect. 2.5, the vibrational behavior of a rectangular plateof spruce has been examined using vibration testing under different moisture condi-tions. Section 2.6 is devoted to the description of the adopted numerical model. InSect. 2.7, the methodology which allows identifying the elastic characteristics fromvibration measurements through an iterative process is presented and discussed. Theresults of numerical simulations and the comparison with experimental results arethen discussed in Sect. 2.8. Finally, Sects. 2.9 and 2.10 contain concluding remarksand suggestions for further lines of inquiry.
2.2 Overview of the State of the Art
In 1680, the experimental philosopher R. Hooke unveiled for the very first timeto the eyes of the world the astonishing patterns of movement traced by a vibratingglass plate. In 1787, the scientist E.F.F. Chladni repeated the pioneering experimentsof Hooke, providing one of the major 18th century experimental stimuli to 19thcentury continuum mechanics [6], the results of which are commonly referred totoday by his name: Chladni Patterns [30]. Several centuries after this discovery,although the methods employed are rather more sophisticated than the bow and flourused by Hooke, the same phenomenon is still used today by both the instrumentmaker and the scientist to unravel the complex vibration behavior of plates.
Even though 18th century scientists such as J.B. Biot in 1816 [6] were alreadyusing dynamic experiments to calculate the elastic moduli of isotropic materials,new approaches continue to be developed today, and in the past decades, a largenumber of dynamic methodologies for the elastic characterization of rectangularplates have been presented in the literature.

24 M.A. Pérez Martínez et al.
In essence, the modern procedure is based on an optimization process that min-imizes the difference between the experimental and the numerical dynamic re-sponse. The material’s parameters in the numerical model are iteratively updateduntil the numerical response approximates as closely as possible the experimentalresponse [37]. The values which produce convergence in the response of the systemare the unknown elastic characteristics. In other words, the method is basically anoptimal curve fitting of vibration test data to equations expressing the dynamics ofthe test specimen [4].
These methods have in common the requirement of the measurement of a limitednumber of natural frequencies of the plate, usually with free boundary conditions;the problem is then to relate the mode shapes, natural frequencies and deflectionfields to the unknown parameters, since unfortunately there is no closed form ana-lytical solution for the eigenvalue problem in the case of a rectangular plate with freeboundary conditions, a difficulty already mentioned in Rayleigh’s classical bookTheory of Sound [39].
In the first approximation, classical analytical methods have been used to deter-mine exact analytical solutions of the governing differential equations for a rectan-gular plate simply supported or having two opposite edges simply supported withfree conditions at the other edges. However, for other combinations of boundaryconditions, the solutions are much more complex [23, 30]. In order to provide alter-native solutions, many researchers have resorted to approximate analytical methods.Rayleigh’s method [3, 12, 33], the Rayleigh-Ritz technique [9, 43] and numericalapproaches, e.g. Finite Element Method [1, 2, 15, 16, 25, 35], are the three principalmethods1 usually employed.
At the beginning of the 1980’s, Sol [43] developed a method for the identificationof the elastic moduli of thin orthotropic plates, based on the comparison of numer-ically calculated resonant frequencies of a thin plate specimen with correspondingexperimental data which allows for the simultaneous identification of the four in-dependent in-plane elastic constants. Deobald and Gibson [9] used a Rayleigh-Ritztechnique in order to model the vibrational behavior of an orthotropic rectangularplate with clamped and free boundary conditions. Starting from the natural frequen-cies of the plates so obtained, they determined the four in-plane elastic properties.Ayorinde and Gibson [3] developed a method using the classical lamination theoryand an optimized three-mode Rayleigh’s formulation to determine elastic coeffi-cients of orthotropic plates with free boundary conditions. McIntyre and Wood-house [33] presented a similar approach including the determination of both damp-ing and elastic constants. Similar results were obtained for the determination ofstiffness and damping properties of orthotropic composites plates by De Visscheret al. [10] using a numerical model of the specimen in combination with the modalstrain energy method. Mota Soares et al. [35] obtained elastic characteristics bysolving an optimization problem of an error functional expressing the difference
1In [24], the reader can find a comparative overview and a discussion of the advantages and disad-vantages of these principal methods for calculating the eigenfrequencies and eigenmodes based onthe classical thin plate theory.
2 Effects of Moisture Content on the In-Plane Elastic Constants of Wood 25
between measured higher frequencies of a plate specimen and the correspondingnumerical ones. Grédiac et al. [15, 16] proposed a method allowing the direct deter-mination of the flexural stiffness from natural frequencies which does not require aninitial estimate parameter, based on a set of relevant weighting functions associatedwith different natural modes of vibration. More recently, Lauwagie [29] has devel-oped a vibration-based identification technique to determine the elastic propertiesof the constituent layers of layered materials.
The majority of cited references focus on the study of samples of aluminium orcomposite materials, thereby extending the methodology to anisotropic materials.However, an extensive research regarding wood’s elastic characterization has alsobeen carried out.
From a perspective in which wood is treated as a structural material, other au-thors [28, 36] have offered previous solutions to the problem of the elastic char-acterization of wood by vibration testing. However they have primarily dealt withsamples of large physical dimensions under constant humidity, although moisturecontent has a significant influence on elastic properties, as shown in [20, 21].
From a musical instrument maker’s perspective, in which wood takes prece-dence over other materials due to its acoustic properties [46, 47], there have alsobeen several discussions of the orthotropic properties of wood, the possible waysto characterize them and their importance in instrument making [22, 34]. For in-stance, Rodgers [41] concluded, based solely on a finite elements analysis, that onlythree (longitudinal and radial Young’s Moduli and shear modulus) of nine elasticproperties were of the first order importance in violin wood selection and analysis.Haines [17] presented an extensive and complete characterization of the musicallyimportant properties of wood for instruments, concluding that the ratio betweenlongitudinal and radial Young’s Moduli strongly determines the vibrational modeshapes of plates. However, his tests were conducted under closely controlled tem-perature and constant humidity conditions. In the second part of his work [18], thechanges in density and stiffness due to the effects of moisture change were quan-tified, concluding that both elastic moduli are reduced while the density increaseswith increasing moisture content. However, the shear modulus was not measuredand only two moisture contents were tested. Thompson [44] measured the frequencyresponse of back and front violin plates under six different relative humidity levels,between 15% and 79%, concluding that changes in frequency are significant in away that decreases as the relative humidity increases; however, in this study, onlythe second and fifth modes were measured.
According to the authors’ knowledge, this topic has hitherto not been fully stud-ied. Advances in experimental techniques and the versatility and accessibility ofnumerical methods now makes it possible to perform further study.
2.3 Orthotropic Nature of Wood Properties
Wood is a complicated composite of hard-celled cellulose microfibrils (organic cellsknown as tracheids) embedded in a lignin and hemicellulose resin matrix. The sea-sonal variation in the cell wall density of a tree is evident when looking at the end

26 M.A. Pérez Martínez et al.
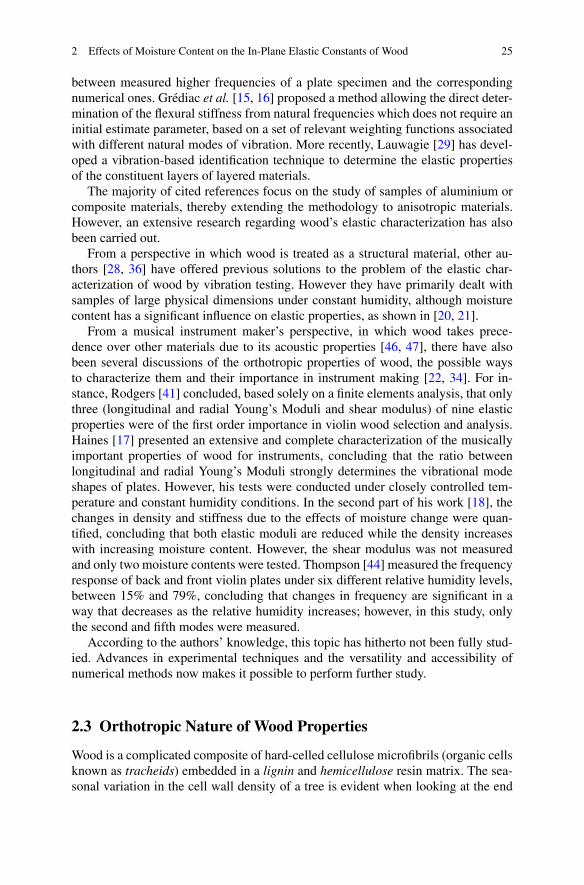
Fig. 2.1 The principal axesuseful for modelling wood asan orthotropic material. Thelongitudinal axis L is parallelto the cylindrical trunk andthe tangential axis T isperpendicular to the longgrain and tangential to theannual growth rings
of the cut trunk, where a concentric ring structure formed by the walls of the longslender tracheids can be observed. Commonly referred to as growth rings, this ar-chitecture composed of alternating layers of earlywood (formed in the spring andsummer) and latewood (formed at the end of the growing season) is responsible forwood’s high anisotropic and viscoelastic behavior [46].
Wood may be described as an orthotropic material because its mechanical prop-erties are independent and can be defined in three perpendicular axes (see Fig. 2.1).The longitudinal axis L is parallel to the cylindrical trunk of the tree and therefore tothe long axis of the wood fibres as well (parallel to the grain). The tangential axis T
is perpendicular to the long grain and tangential to the annual growth rings. Both thetangential and radial directions are referred to as being perpendicular to the grain.
Taking the tree trunk as a series of concentric cylindrical shells and cutting thinradial slices, the growth ring curvature is negligible and occurs in straight parallellines orthogonal to both the longitudinal and the tangential axis. In the case wherethe long axis is parallel to the grain fibre orientation and the width is in the radialdirection, the piece is said to be quarter-sawn. The wood used in soundboards isalmost always of quarter-sawn timber, which causes the speed of sound to be higherand the values of damping to be lower than for wood cut at an angle to the grain [22,46]. In general, the mechanical properties vary the most between the longitudinalgrain and the other two radial and tangential directions.
In spite of the fact that wood is a viscoelastic material, viscoelastic phenomenado not appear relevant in the present work because of the small strains and the natureof dynamic problem. Therefore, in the current study, linear elasticity can be assumedas an hypothesis. When linear elastic behavior is assumed, the generalized Hooke’slaw gives the stress-strain relation, which can be written in matrix form as
σ = [D]ε, (2.1)
or
ε = [S]σ , (2.2)
where [S] = [D]−1, σ are the stress components, [D] the elastic matrix, [S] thecompliances matrix, and ε the strain components [40]. Since σ and ε are ele-ments of R
6, there are 36 components in both the stiffness and compliance matrices,but these reduce to 21 because of the symmetry of the stresses and small strains ten-sor [26]. When three mutually orthogonal planes of material symmetry exist and
2 Effects of Moisture Content on the In-Plane Elastic Constants of Wood 27
the coordinate system employed is aligned with the principal material directions,the number of elastic coefficients is reduced to 9, and such material is called or-thotropic. Then, the stress-strain relation takes the form
⎧⎪⎪⎪⎪⎪⎪⎨
⎪⎪⎪⎪⎪⎪⎩
σ1σ2σ3τ23τ13τ12
⎫⎪⎪⎪⎪⎪⎪⎬
⎪⎪⎪⎪⎪⎪⎭
=
⎡
⎢⎢⎢⎢⎢⎢⎣
D11 D12 D13 0 0 0D12 D22 D23 0 0 0D13 D23 D33 0 0 0
0 0 0 D44 0 00 0 0 0 D55 00 0 0 0 0 D66
⎤
⎥⎥⎥⎥⎥⎥⎦
⎧⎪⎪⎪⎪⎪⎪⎨
⎪⎪⎪⎪⎪⎪⎩
ε1ε2ε3γ23γ13γ12
⎫⎪⎪⎪⎪⎪⎪⎬
⎪⎪⎪⎪⎪⎪⎭
. (2.3)
An important feature of orthotropic materials that can be observed in Eq. (2.3) isthe uncoupled behavior between the normal stresses and the shear strains, the shearstresses and normal strains, and the shear stresses and shear strains.
For plate-like structures a state of generalized plane stress can be considered,which implies that all three transverse stress components are negligible,
σ3 = 0, τ23 = 0, τ13 = 0. (2.4)
Furthermore the transverse normal strain, ε3, is small enough to be ignored.Therefore, for an orthotropic plate material with principal materials axes (x1, x2, x3)coinciding with the plate coordinates (x, y, z), i.e. the local and global axes coincide,the plane stress-strain reduced constitutive equations can be expressed as
⎧⎨
⎩
σx
σy
τxy
⎫⎬
⎭=
⎡
⎣Q11 Q12 0Q12 Q22 0
0 0 Q66
⎤
⎦
⎧⎨
⎩
εx
εy
γxy
⎫⎬
⎭, (2.5)
where Qij are the plane strain-reduced stiffnesses. Engineering constants, such asYoung’s, shear moduli and Poisson’s ratio, are used instead of the stiffness coef-ficients due to its direct and obvious physical meaning. Hence the stiffness coeffi-cients are related to the engineering constants as
Q11 = Ex
1 − νxyνyx
, Q12 = νxyEy
1 − νxyνyx
= νyxEx
1 − νxyνyx
,
Q22 = Ey
1 − νxyνyx
, Q66 = Gxy. (2.6)
The so-called thermodynamic constraints are based on the principle that the sumof the work done by all stresses must be positive in order to avoid the creationof energy. Formally, it can be proven that the matrices relating stresses to strainsmust be positive-definite [26], i.e., the diagonal elements must be positive. Thismathematical condition applied to Eq. (2.5) implies that
Q11, Q22, Q66 > 0, (2.7)
or in terms of the engineering constants,
Ex, Ey, Gxy > 0 (2.8)
whereupon from Eq. (2.6)
28 M.A. Pérez Martínez et al.
(1 − νxyνyx) > 0. (2.9)
Using the compliance symmetry condition
νxy
Ex
= νyx
Ey
, (2.10)
the inequality in Eq. (2.9) can be rewritten as
|νxy | <√
Ex
Ey
or |νyx | <√
Ey
Ex
. (2.11)
In the specific case of wood, the axes are given a special nomenclature, as hasbeen mentioned above, defining a longitudinal and radial direction in reference tothe manner in which the specimen has been cut from the original tree trunk. Inthis manner, the engineering constants are related to the stiffness coefficients in thefollowing way:
⎧⎨
⎩
σL
σR
τLR
⎫⎬
⎭=
⎡
⎢⎣
EL
1−νLRνRL
νLRER
1−νLRνRL0
νRLER
1−νLRνRL
ER
1−νLRνRL0
0 0 GLR
⎤
⎥⎦
⎧⎨
⎩
εL
εR
γLR
⎫⎬
⎭. (2.12)
As can be seen, the elastic behavior of an orthotropic plate-like structures canbe described by only four independent engineering constants, i.e. EL, ER , νLR andGLR .
2.4 Influence of Moisture Changes on Wood
Wood is a hygroscopic material which shows coupling between the moisture trans-fer phenomena and mechanical behavior at two levels. Moisture changes induceswelling or shrinkage in the material, the so-called hygroexpansive effect; after theinitial drying process or seasoning, wood continues to interact with the moisture inthe ambient atmosphere in order to reach a state of equilibrium, a process whichsignificantly alters the proportion of its total mass which consists of water [46].Its geometry and elastic characteristics are also altered by these changes in moisturecontent, and, as shall be demonstrated, its vibrational behavior as well. Furthermore,with a mechanical load acting under moist conditions, an additional deformation isinduced [21], known as mechano-sorptive creep.
Most constitutive models consider that the total strain, ε, is assumed to consistof additive strain terms,
ε = εe + εu + εve + εms, (2.13)
where ε is the total strain, εe the elastic, εu the hygroexpansion (swelling and shrink-age), εve the viscoelastic and εms the mechano-sorptive. The strain terms are treated
2 Effects of Moisture Content on the In-Plane Elastic Constants of Wood 29
by associating a separate differential equation to each one.2 Due to the applicationbeing studied in this work, the effects of the combined action of simultaneous mois-ture changes with mechanical loading has not been examined. Furthermore, as hasbeen mentioned above, strain rates are so low that the linear elastic hypothesis canbe taken as valid, and therefore the viscoelastic effects that occur in higher strainrates can be neglected.
The moisture content β is defined as the mass fraction of free water in the wood,3
β = m0 − mdry
mdry(2.14)
where m0 is the initial mass and mdry is the mass of the specimen with all free waterremoved.
While varnishes and other finishes may retard the movement of water vapour be-tween the atmosphere and the wood, they cannot stop it completely. In any event,the interior surfaces of musical instruments are almost never finished in any waywhatsoever, and the ubiquitous presence of acoustic venting holes in the resonatingcavity assures that a rapid equalization of internal and external atmospheric humid-ity is inevitable.
For the constructor of a musical instrument (or for that matter, any large complexwooden object), the more subtle variations of mass and elasticity are far outweighedby the dimensional variation in the radial and tangential directions (wood beingessentially stable longitudinally). The larger plate-like objects of many types of mu-sical instruments, including not only the soundboard but also the walls and bottomof resonating cavities, are almost inevitably attached to other structural elementswhose longitudinal grain orientation runs in a perpendicular or near-perpendicularorientation relative to the longitudinal grain of the plate itself, elements such asribbing or barring of soundboards and major structural supports of case walls andbottoms. The fact that the plate-like elements are constrained precisely in the ori-entation which is dimensionally variable is an inescapable reality which the builderignores at his own peril. In the best of cases, whenever the ambient humidity isother than that at which the instrument was assembled, the plate will be deformedby the dimensional differences between the restrained and free sides, the free sidebecoming convex under wet conditions and concave under dry conditions. In theworst scenarios, under extremes of humidity, the tension or pressure applied to thematerial can become large enough that permanent damage results, either by splittingthe wood apart or causing the cell structure to become permanently crushed, a phe-nomenon known as compression set. Wood which has suffered compression set willthereafter be even more susceptible to splitting under dry conditions, as its effectivedimension has already been reduced at a cellular level before any excessive dryingreduces it further.
2More background information on moisture induced eigen-stresses in timber can be found in,e.g., [20] and an informative and comprehensive review of constitutive models is presented byHanhijärvi [21].3Although there an explicit relation between relative humidity and moisture content [45], theseparameters should not be confused.

30 M.A. Pérez Martínez et al.
Fig. 2.2 Distortion causedby changes in humidity whena wooden plate is restrainedon one side only. Both piecesof spruce (Picea Abies) werecut sequentially from thesame plank. The width of thesamples is approximately14 cm
Figure 2.2 illustrates the distortion which can be caused by changes in humiditywhen a wooden plate is restrained on one side only. Both pieces of spruce (PiceaAbies) were cut sequentially from the same plank. The single rib was attached to theupper sample after it had reached saturation content using the methods describedin Sect. 2.5 below, and to the lower sample after it had been dried to 0% moisturecontent. The photo was taken after leaving the samples in a stable ambient humidityof 55% for several days.
A soundboard is usually considered to be the structural element which most criti-cally affects the acoustic behavior of the instrument as a whole. In the present work,the behavior of a rectangular plate of spruce (Picea Abies), which is the type ofwood most commonly used for the soundboards of guitars, violins, pianos, and otherstring instruments, has been addressed using modal analysis under different condi-tions of humidity. The wood specimens examined in this work are of quarter-sawntimber, and the dimensions in the growth ring plane are small enough (≤2 mm) sothat the properties are essentially orthotropic. The wooden specimens had a size of432 × 189 × 5.1 mm and a density of 470 kg/m3 under normal conditions.4
At this point it is important to justify why only two specimens have been used forthis study. No two pieces of wood are exactly identical, and while it is hypotheticallypossible that two soundboards made from different trees of the same species mightdemonstrate subtly-different mechanical/acoustical behaviors, the actual limits ofany such variations are greatly constrained by the traditional process of materialselection, dictated by a set of requirements which include not only the type of wood,the orientation of the cut and the general width of the annular rings, but also a certainraw acoustic characteristic which is empirically determined by tapping the plank andlistening to its response. Furthermore, the readily observable dimensional changescaused by moisture variations are quite consistent for a vast sampling of planks ofthe same species, as is demonstrated by the high degree of correlation between thevalues which can be found in tables of expansion/contraction rates presented in any
4As shown below, uncertainty in the thickness measurement may have major effects on the esti-mation of elastic properties. To measure the thickness across the whole surface, the authors rec-ommend the use of an accurate caliper thickness with resolution of 0.01 mm. Moreover, the lengthand width of the specimen should not be the same, in order to avoid the degeneration of the modes(2 0) and (0 2) into ring and x-modes [33], which would complicate the initial estimation of theelastic properties according to the methodology described below.
2 Effects of Moisture Content on the In-Plane Elastic Constants of Wood 31
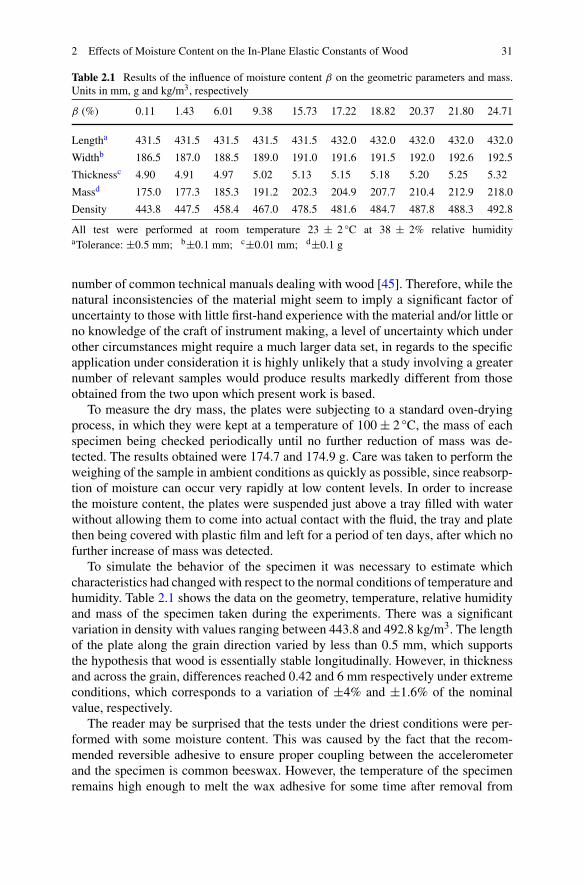
Table 2.1 Results of the influence of moisture content β on the geometric parameters and mass.Units in mm, g and kg/m3, respectively
β (%) 0.11 1.43 6.01 9.38 15.73 17.22 18.82 20.37 21.80 24.71
Lengtha 431.5 431.5 431.5 431.5 431.5 432.0 432.0 432.0 432.0 432.0
Widthb 186.5 187.0 188.5 189.0 191.0 191.6 191.5 192.0 192.6 192.5
Thicknessc 4.90 4.91 4.97 5.02 5.13 5.15 5.18 5.20 5.25 5.32
Massd 175.0 177.3 185.3 191.2 202.3 204.9 207.7 210.4 212.9 218.0
Density 443.8 447.5 458.4 467.0 478.5 481.6 484.7 487.8 488.3 492.8
All test were performed at room temperature 23 ± 2 °C at 38 ± 2% relative humidityaTolerance: ±0.5 mm; b±0.1 mm; c±0.01 mm; d±0.1 g
number of common technical manuals dealing with wood [45]. Therefore, while thenatural inconsistencies of the material might seem to imply a significant factor ofuncertainty to those with little first-hand experience with the material and/or little orno knowledge of the craft of instrument making, a level of uncertainty which underother circumstances might require a much larger data set, in regards to the specificapplication under consideration it is highly unlikely that a study involving a greaternumber of relevant samples would produce results markedly different from thoseobtained from the two upon which present work is based.
To measure the dry mass, the plates were subjecting to a standard oven-dryingprocess, in which they were kept at a temperature of 100 ± 2 °C, the mass of eachspecimen being checked periodically until no further reduction of mass was de-tected. The results obtained were 174.7 and 174.9 g. Care was taken to perform theweighing of the sample in ambient conditions as quickly as possible, since reabsorp-tion of moisture can occur very rapidly at low content levels. In order to increasethe moisture content, the plates were suspended just above a tray filled with waterwithout allowing them to come into actual contact with the fluid, the tray and platethen being covered with plastic film and left for a period of ten days, after which nofurther increase of mass was detected.
To simulate the behavior of the specimen it was necessary to estimate whichcharacteristics had changed with respect to the normal conditions of temperature andhumidity. Table 2.1 shows the data on the geometry, temperature, relative humidityand mass of the specimen taken during the experiments. There was a significantvariation in density with values ranging between 443.8 and 492.8 kg/m3. The lengthof the plate along the grain direction varied by less than 0.5 mm, which supportsthe hypothesis that wood is essentially stable longitudinally. However, in thicknessand across the grain, differences reached 0.42 and 6 mm respectively under extremeconditions, which corresponds to a variation of ±4% and ±1.6% of the nominalvalue, respectively.
The reader may be surprised that the tests under the driest conditions were per-formed with some moisture content. This was caused by the fact that the recom-mended reversible adhesive to ensure proper coupling between the accelerometerand the specimen is common beeswax. However, the temperature of the specimenremains high enough to melt the wax adhesive for some time after removal from
32 M.A. Pérez Martínez et al.
the drying oven, and therefore it is necessary to allow the specimen to cool for ashort period of time, during which some reabsorption of moisture is unavoidable.Alternative solutions might be the use of adhesives whose properties are maintainedat higher temperatures such as cyanoacrylate, but such adhesives are not reversible;perhaps the best solution would be to use a laser-based vibration transducer. Un-like traditional contact vibration transducers, laser vibrometers require no physicalcontact with the test object.
2.5 Experimental Modal Analysis of Wooden Specimens
Experimental modal analysis is the process of determining the modal parameters(frequency, damping and mode shapes) of a linear time-invariant system.5 It is gen-erally based upon a theoretical relationship between measured quantities, the so-called Frequency Response Function (FRF), and classical vibration theory repre-sented as matrix differential equations of motion [19].
A system can be described by its equation of motion, which general mathematicalrepresentation is expressed by
[M]x(t) + [C]x(t)
+ [K]x(t) =
f (t), (2.15)
where [M] is the mass matrix, [C] the damping matrix and [K] the stiffness matrix,describing the spatial properties of the system, x(t), x(t) and x(t) are vectorsof time-varying acceleration, velocity and displacement response, respectively, andf (t) is a vector of the time-varying external excitation forces.
By taking the Fourier transform, the differential equation of motion, Eq. (2.15),can be written as
[−[M]ω2 + j[C]ω + [K]]X(ω) =
F(ω), (2.16)
where ω is the frequency variable, j the imaginary j-operator, X(ω) the outputvibration vector, and F(ω) the input force vector. Grouping the terms on the left,one obtains
[B(ω)
]X(ω)
= F(ω)
, (2.17)
where [B(ω)] is the system response matrix. This equivalent representation has theadvantage of converting a differential equation to an algebraic equation in the fre-quency domain (magnitude and phase). The system transfer function [H(ω)], orFRF, is the inverse of the system response matrix. The FRF relates the Fourier trans-form of the system input to the Fourier transform of the system response. That is,
[B(ω)
]−1 = [H(ω)
] = X(ω)F(ω) . (2.18)
5The theory of experimental modal analysis is presented in a shortened, comprehensive form. Theinterested reader is referred to [11, 19, 32] where more details are given.
2 Effects of Moisture Content on the In-Plane Elastic Constants of Wood 33
The modal parameters such as frequency, damping and mode shapes are finallyextracted from measured input-output data [H(ω)], using numerical techniques, e.g.curve-fitting algorithms, which separate the contributions of individual modes ofvibration in measurements [11, 19, 32].
An important feature is that [B(ω)] and [H(ω)] are symmetric since [M], [C]and [K] are symmetric. This implies that Hpq = Hqp , which means that a forceapplied at degree of freedom (DoF) p cause a response at DoF q that is the same asthe response at DoF p caused by the same force applied at DoF q . Is said that thestructure obeys Maxwell’s reciprocity, one of the basic assumptions which underliesexperimental modal analysis [19], whose practical results are obvious.
The test environment involves several factors which must be taken into consid-eration, as well as the appropriate boundary conditions of the structure, especiallyif the vibration behavior is to be subsequently compared with numerical results.There are many options ranging from completely free to completely clamped edges,simply supported or combinations of them all. From an experimental point of view,arriving at a completely clamped boundary condition is extremely difficult. This de-tail was also stated in [1, 9], who concluded that it is better to perform the tests withfree boundary conditions. Another option is to perform the test with simple sup-ported boundaries. The problem found is that when the specimen is small, as forceis applied with the hammer, the specimen itself rebounds and thereby looses contactwith the supporting surfaces. To reproduce free boundary conditions in the labora-tory several options exist: either the plate can be situated on an undulated foam sur-face, or it can be suspended either horizontally or vertically. For the present work,the various situations were tested and the results indicated a minimal difference;therefore, a vertical suspension was ultimately employed.
Among different testing configurations, tests were performed with a single-reference testing employing a roving hammer test. To measure a FRF of a structurebasically two channels are needed: one channel is used to measure the excitationforce and the other one to measure acceleration response of the plate. A stationarymonoaxial accelerometer has been attached to a single DoF reference point whereasthe hammer roved around exciting the specimen at well distributed measurementDoFs.6
The experiments were conducted using a Brüel & Kjaer type 4518-003 uniax-ial accelerometer, whose mass is less than 1.5 g, along with a miniature transducerhammer Brüel & Kjaer model 8204 for the excitation of the system. Due to the ac-celerometer being attached to the test specimen, there is a certain amount of masswhich is added to the structure. It is important to assure that the mass of the trans-ducer is negligible when compared with the effective modal mass of a mode of vi-bration so as not to interfere with the vibrational behavior.7 To determine the massthreshold above which the presence of the transducer interferes with the vibration
6This is also called Single-Input Single-Output (SISO) testing.7It is generally accepted that a ratio of less than 1:10 is required [11], in this study the ratio wasapproximately 1:130.
34 M.A. Pérez Martínez et al.
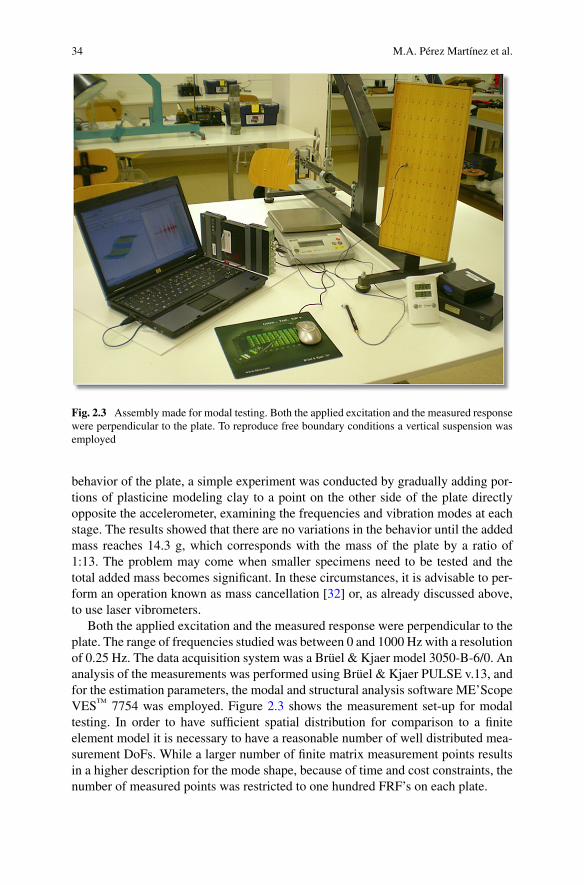
Fig. 2.3 Assembly made for modal testing. Both the applied excitation and the measured responsewere perpendicular to the plate. To reproduce free boundary conditions a vertical suspension wasemployed
behavior of the plate, a simple experiment was conducted by gradually adding por-tions of plasticine modeling clay to a point on the other side of the plate directlyopposite the accelerometer, examining the frequencies and vibration modes at eachstage. The results showed that there are no variations in the behavior until the addedmass reaches 14.3 g, which corresponds with the mass of the plate by a ratio of1:13. The problem may come when smaller specimens need to be tested and thetotal added mass becomes significant. In these circumstances, it is advisable to per-form an operation known as mass cancellation [32] or, as already discussed above,to use laser vibrometers.
Both the applied excitation and the measured response were perpendicular to theplate. The range of frequencies studied was between 0 and 1000 Hz with a resolutionof 0.25 Hz. The data acquisition system was a Brüel & Kjaer model 3050-B-6/0. Ananalysis of the measurements was performed using Brüel & Kjaer PULSE v.13, andfor the estimation parameters, the modal and structural analysis software ME’ScopeVES™ 7754 was employed. Figure 2.3 shows the measurement set-up for modaltesting. In order to have sufficient spatial distribution for comparison to a finiteelement model it is necessary to have a reasonable number of well distributed mea-surement DoFs. While a larger number of finite matrix measurement points resultsin a higher description for the mode shape, because of time and cost constraints, thenumber of measured points was restricted to one hundred FRF’s on each plate.

2 Effects of Moisture Content on the In-Plane Elastic Constants of Wood 35
Fig. 2.4 Experimental modes results with variations in moisture content. The maximum variationin moisture content which could be obtained was between 0% a 25%, the latter of which corre-sponds with saturation. The nomenclature (m,n) identifies the different mode types, where m andn refer to the number of nodal lines parallel to the y direction and x direction, respectively
The selection of the reference location is a critical step of performing an exper-imental modal test. If the accelerometer location is in a nodal position of a mode,FRF’s may not contain strong response for this mode and consequently would bepoorly represented or, in the worst case, completely absent. In regular geometries,as is the case of the specimens studied, it is possible to deduce that the nodal linesof the first vibration modes correspond to the symmetry axes or regular subdivisionsurface. However, with irregular geometry, this task is not trivial. Prior knowledgeobtained from pre-testing or a finite element model is very beneficial to accomplishthis.8
Figure 2.4 shows the evolution of the frequencies of the first ten modes. Bothgraphics illustrate the same data, though the right graphic uses the proportional unitof cents in order to better illustrate the musical significance of the variations,9 sinceluthiers often tune the resonances of plates to certain notes or musical intervals ac-cording to traditional precepts. Clearly the frequencies do not decrease linearly with
8If obtaining a large number of modes is desired, the option of taking the test in several stagesshould be considered, with the position of the accelerometer varied for each test. The final result isobtained by the superposition of all FRF curves.9The cent is a logarithmic unit of measure used for musical intervals which correspond to a one-hundredth of an equal-tempered semitone. The formula n = 1200 log2(f1/f2) returns the numberof cents measuring the frequency interval between f1 and f2.
36 M.A. Pérez Martínez et al.
increasing moisture content. This fact is empirically supported by luthiers who notethat the timbre of a completed instrument undergoes subtle changes with variationsof relative humidity, often sounding noticeably brighter with low percentages ofmoisture.
From a practical point of view, the behavior of wood is moisture-content de-pendent, and thus the measurements made at the two different times are inevitablyinconsistent, an unfortunately unavoidable violation of another of the basic assump-tions of time invariance which underlies experimental modal analysis [19]. Con-sidering the rapid reabsorption rate at such low content levels, it is very importantto assure that a constant moisture content is maintained during the tests. Given thenumber of discrete points used to describe the specimen, it is practically impossi-ble to realize the test in only one step without the moisture content changing. Onepossible solution would be to perform the test in chambers under controlled hu-midity conditions, which unfortunately would increase the costs prohibitively. Asan alternative solution, the test were performed in sequential steps; after drying thespecimen in an oven, its mass was determined and the procedure was begun of ac-quiring the data at the initial points of the mesh, controlling the mass at regularintervals. When variations of mass were detected, which often occurred within lessthan a minute, the specimen was returned to the oven to reduce the moisture contentyet again, a process which was repeated until data from all points of the mesh wasacquired. The authors’ experience has demonstrated that for the range of moisturecontent from completely dry to saturation, the order of the modal shapes did not ap-pear to vary10; therefore, the numerical and experimental modes can be comparedsequentially, the number of points can be reduced drastically and, as a consequence,the amount of time required for the test.
Unlike of the finite element approach, where adding additional nodes and ele-ments generally has a direct effect on the results, in a vibration test, a particularfrequency response measurement has no relationship to other measurements. How-ever this practice presents a clear drawback: the drastic reduction in the number ofDoFs results in poor spatial distribution and consequently the mode shapes wouldbe poorly represented. This fact makes it difficult to make a comparison between thenumerical and experimental mode shapes using correlation tools such as the ModalAssurance Criterion (MAC) [32]. Even so, MAC is only an indicator of the vectorcorrelation, i.e. mode shapes, and can indicate only consistency, not validity, butin this application the vector correlation may not be as critical and the frequencycorrelation is more important.
2.6 Numerical Model of Wooden Plate
Among the wide number of theories that govern the deformation of plates, the well-known classical plate theory (CPT), or Kirchhoff’s plate theory, has been chosen
10Except modes (3 1) and (0 3) which swap positions at a point close to saturation (see Fig. 2.4and Table 2.3). However this does not become a critical issue since these modes are not strictlyinvolved in the elastic properties estimation.

2 Effects of Moisture Content on the In-Plane Elastic Constants of Wood 37
since the wood specimens studied satisfy the thin plate condition11 in the sense thatthe thickness h is small compared to the characteristic lengths and thickness is eitheruniform or varies slowly so that three-dimensional stress effects are ignored [13];therefore, CPT is a more suitable, straightforward and useful model.
The partial differential equation governing the free transverse vibration of a rect-angular plate is given by
D∇4w + ρ∂2w
∂t2= 0, (2.19)
where w is transverse deflection, ∇4 = ∇2∇2 is the biharmonic differential operator,D the flexural rigidity which is a function of Young’s modulus, Poisson’s ratio andplate thickness, ρ is mass density per unit area and t represents time [30].
Although a closed form analytical solution exists for the eigenvalue problem ofpredicting the natural frequencies of a rectangular plate, this tend to be restrictedto regular geometries and simple boundary conditions such a simply supported,clamped edges or any combinations of them. Even the free edges can also betaken into account when the other pair of opposite edges is simply supported orclamped [30]. Unfortunately there is no closed form analytical solution for the caseof completely free edges. When the problems do not yield to analytical treatment analternative practice is needed, e.g. numerical simulation.12
2.6.1 The Finite Element Method
The Finite Element Method (FEM) is a procedure for the numerical solution to themathematical equations governing a problem, and recently has become the dominantdiscretization technique in structural mechanics.13 The basic concept in the physicalFEM is the subdivision of the mathematical model into non-overlapping domains ofsimple geometry termed finite elements. The response of the mathematical modelis then considered to be approximated by that of the discrete model obtained byconnecting or assembling the collection of all elements [13].
The matrix equations of motion, Eq. (2.15), describing both individual elementand general system models can be derived from the minimum principles, i.e. Hamil-ton’s principle, stated as
δ
∫ t1
t0
(T + W)dt = 0, (2.20)
11The CPT overpredicts frequencies of plates with side-to-thickness ratios of the order of 20 orless, i.e. thick plates [31, 40]. The side-to-thickness ratio for the specimens studied, as can be seenin Sect. 2.4, is about 40.12References [14, 27] may be helpful in order to implement a finite element model to solve theproblem of simulation of vibration of a plate. Also, most available FEM analysis packages, e.g.ANSYS, ABAQUS or NASTRAN, among others, are appropriate and useful.13The basic concepts, procedures and whole formulations can also be found in many existingtextbooks. The interested reader is referred to, e.g. [5, 13], where more details are given.

38 M.A. Pérez Martínez et al.
where T is the system kinetic energy, W the work done by internal and externalforces, δ the variational operator and [t0, t1] the interval of time. For a free un-damped14 vibration system, dissipative interior work is neglected and the work per-formed by externally applied forces is zero; thus Eq. (2.20) becomes
δ
∫ t1
t0
(T − U)dt = 0, (2.21)
where U is the conservative interior elastic potential energy, also called strain en-ergy.
Using an assumed displacement field u(x, y, z, t) written in terms of the nodalDoFs ue by means of the so-called element shape functions [N ], the kinetic andthe strain energy of each element can be expressed in the form of the element massand stiffness matrices.
The strain field ε within the element volume is related to the assumed displace-ment by
ε = ∂u(x, y, z, t) = ∂[N ]ue = [B]ue
, (2.22)
where [N ] is the shape function matrix of the element e, ue the vector of the nodalDoFs, ∂ the differential operator matrix and [B] the element strain matrix.
The stress field σ within the element volume is expressed as
σ = [D]ε = [D][B]ue, (2.23)
where [D] is the elastic matrix used in Eq. (2.1).Using the above expressions, the strain and kinetic energies in the element e are
given by15
Ue = 1
2
∫
V e
εTσ dV = 1
2
∫
V e
ue
T[B]T[D][B]uedV
= 1
2
ue
T[Ke
]ue
, (2.24)
and
T e = 1
2
∫
V e
ρuTudV = 1
2
∫
V e
ue
Tρ[N ]T[N ]ue
dV
= 1
2
ue
T[Me
]ue
, (2.25)
respectively, where V denotes volume, [Ke] is the element stiffness matrix, ρ thematerial density, ue the velocity, so that u(x, y, z, t) = [N ]ue, at a point in theelement e and [Me] the element mass matrix.
In order to obtain the complete finite element system model, an assembly pro-cess has to be carried out, which consists in the allocation of the individual element’s
14Since the numerical differences between undamped and damped natural frequencies are not sig-nificant, the damping is neglected as it causes problems in eigenvalue calculations.15The superscript T and [ ]T denotes the transpose of a vector and matrix, respectively.
2 Effects of Moisture Content on the In-Plane Elastic Constants of Wood 39
contribution to the system stiffness and mass matrices [5, 13, 14]. Substituting theexpressions for the complete system energies into Hamilton’s principle, and con-ducting the routine variation operation [40], results in
[M]x(t) + [K]x(t)
= 0, (2.26)
which is the system differential vibration equation from the finite element discretiza-tion, called free undamped equation of motion, where [K] is the global stiffness ma-trix, [M] the global mass matrix and x(t) and x(t) are vectors of time-varyingacceleration and displacement response, respectively [19].
Assuming a harmonic motion, the natural vibration frequencies and the associ-ated mode shapes of a homogeneous linear undamped system can be obtained bysolving the generalized matrix eigenvalue problem,16 defined as
[][M][ ] = [K][ ] ⇒ [[K] − [][M]][ ] = 0, (2.27)
where [K] and [M] are the global stiffness and mass matrices, respectively, [] isa diagonal matrix listing the corresponding eigenvalues (natural vibration frequen-cies) and [ ] is the eigenvector matrix (mode shapes).
2.6.2 Free Vibrations of Kirchhoff Plates
Kirchhoff’s plate theory provides a theoretical model of plate behavior by assumingthat normals to the undeformed midplane remains straight and perpendicular to thedeformed midplane (implying that the transverse shear strain is neglected), that onlythe transverse displacement w is considered and that transverse normal stress σz isnegligible.
The first and second hypothesis allow the definition of the displacement fieldthrough the thickness of the plate and the third hypothesis affects the stress-strainrelationship.
From the above assumptions, the displacement field for time-dependent defor-mations can be derived:
u(x, y, z, t) = −zθx(x, y, t) = −z∂w(x, y, t)
∂x,
v(x, y, z, t) = −zθy(x, y, t) = −z∂w(x, y, t)
∂y, (2.28)
w(x,y, z, t) = w(x,y, t),
16The eigenvalue problem usually requires a huge computational effort to be solved, especiallyif the number of elements and consequently the number of DoFs are high. When the number ofeigenvalues to be determined is around 30 (as in the present study where the number is limitedby the experimental results) there are numerous subroutines readily available based on a vectoriteration, i.e. subspace iteration method among others, which are well-documented in [5]. It is alsohighly recommended to use sparse matrices and diagonally lumped mass matrix, given its storageand computational advantages.
40 M.A. Pérez Martínez et al.
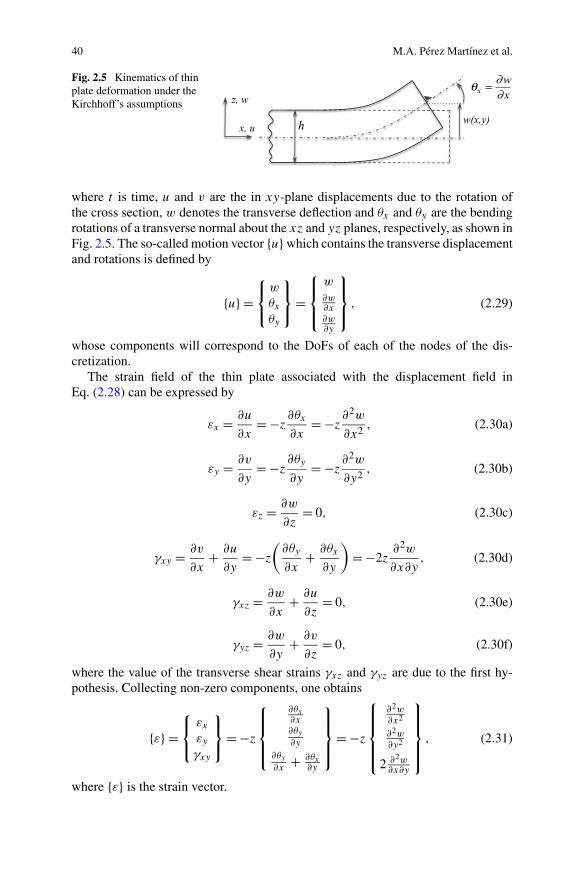
Fig. 2.5 Kinematics of thinplate deformation under theKirchhoff’s assumptions
where t is time, u and v are the in xy-plane displacements due to the rotation ofthe cross section, w denotes the transverse deflection and θx and θy are the bendingrotations of a transverse normal about the xz and yz planes, respectively, as shown inFig. 2.5. The so-called motion vector u which contains the transverse displacementand rotations is defined by
u =⎧⎨
⎩
w
θx
θy
⎫⎬
⎭=
⎧⎪⎨
⎪⎩
w
∂w∂x∂w∂y
⎫⎪⎬
⎪⎭, (2.29)
whose components will correspond to the DoFs of each of the nodes of the dis-cretization.
The strain field of the thin plate associated with the displacement field inEq. (2.28) can be expressed by
εx = ∂u
∂x= −z
∂θx
∂x= −z
∂2w
∂x2, (2.30a)
εy = ∂v
∂y= −z
∂θy
∂y= −z
∂2w
∂y2, (2.30b)
εz = ∂w
∂z= 0, (2.30c)
γxy = ∂v
∂x+ ∂u
∂y= −z
(∂θy
∂x+ ∂θx
∂y
)
= −2z∂2w
∂x∂y, (2.30d)
γxz = ∂w
∂x+ ∂u
∂z= 0, (2.30e)
γyz = ∂w
∂y+ ∂v
∂z= 0, (2.30f)
where the value of the transverse shear strains γxz and γyz are due to the first hy-pothesis. Collecting non-zero components, one obtains
ε =⎧⎨
⎩
εx
εy
γxy
⎫⎬
⎭= −z
⎧⎪⎪⎨
⎪⎪⎩
∂θx
∂x∂θy
∂y
∂θy
∂x+ ∂θx
∂y
⎫⎪⎪⎬
⎪⎪⎭
= −z
⎧⎪⎪⎪⎨
⎪⎪⎪⎩
∂2w
∂x2
∂2w
∂y2
2 ∂2w∂x∂y
⎫⎪⎪⎪⎬
⎪⎪⎪⎭
, (2.31)
where ε is the strain vector.
2 Effects of Moisture Content on the In-Plane Elastic Constants of Wood 41
The stresses in a linear and orthotropic plate are computed from Hooke’s law,17
⎧⎨
⎩
σx
σy
τxy
⎫⎬
⎭=
⎡
⎢⎢⎣
Ex
1−νxyνyx
νxyEy
1−νxyνyx0
νyxEy
1−νxyνyx
Ey
1−νxyνyx0
0 0 Gxy
⎤
⎥⎥⎦
⎧⎨
⎩
εx
εy
γxy
⎫⎬
⎭= [D]ε. (2.32)
As shown, this relation coincides with Eq. (2.12) for plane stress problems.18
This coincidence is due to the hypothesis of null normal stress (σz = 0) across thethickness, common to both problems.
The orthogonality hypothesis on which CPT is based only holds for thin platethickness. As the thickness of the plate increases, normals to the undeformed mid-plane remain straight and unstretched in length but not necessarily normal to thedeformed plane.19 This hypothesis amounts to including transverse shear strains inthe classical plate theory. In these cases, the Reissner-Mindlin theory is an improvedapproximation of the plate’s strain [31, 40]. However, since the components of thetransverse shear strains γxz and γyz are not zero, in the case of an orthotropic ma-terial, two more engineering constants appear on the stress-strain relation (Gxz andGyz shear moduli). The aim of the work is to analyze the influence of moisturecontent on the in-plane elastic constants, hence the determination of two transverseshear moduli is beyond the scope of this study, due to the fact that in the thin platecondition the effects of transverse shear do not become significant.
As mentioned above, the problem of determining the natural vibration frequen-cies and the associated mode shapes of a plate always leads to solving the eigenprob-lem of the linear undamped system. In order to obtain the complete finite elementmodel of the whole plate, it is first necessary to determine the expressions of strainand kinetic energy of each element and then to place them into Hamilton’s principle,resulting in the equation of motion.
The plate strain energy is computed by integrating the strain energy density overthe volume,
U = 1
2
∫
V
εTσ dV = 1
2
∫
V
εT[D]εdV, (2.33)
and the kinetic energy due to the three velocities is computed through integration ofthe kinetic energy of the volume element,
T = 1
2
∫
V
ρ(u2 + v2 + w2)dV = 1
2
∫ h2
− h2
∫
S
ρ(u2 + v2 + w2)dS dz, (2.34)
17The reader is reminded that the stress-strains relation is exposed in Sect. 2.3.18In Eq. (2.12), the axes are given in a wooden nomenclature, in which the subscripts L and R areequivalent to x and y, respectively.19In addition, if one tries to analyze thicker specimens, it should be taken into account that thegrowth ring curvature may not necessarily be negligible, and the effects of such assumptions maybecome significant.
42 M.A. Pérez Martínez et al.
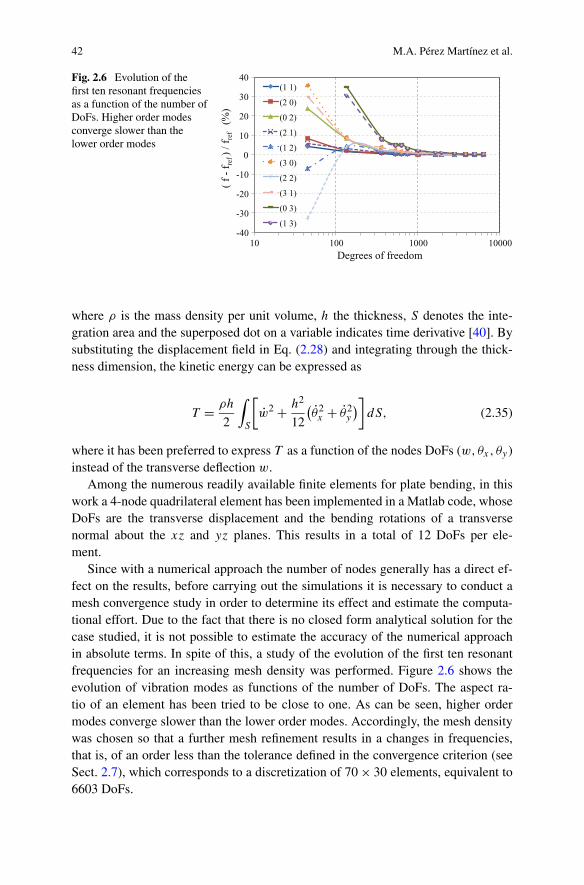
Fig. 2.6 Evolution of thefirst ten resonant frequenciesas a function of the number ofDoFs. Higher order modesconverge slower than thelower order modes
where ρ is the mass density per unit volume, h the thickness, S denotes the inte-gration area and the superposed dot on a variable indicates time derivative [40]. Bysubstituting the displacement field in Eq. (2.28) and integrating through the thick-ness dimension, the kinetic energy can be expressed as
T = ρh
2
∫
S
[
w2 + h2
12
(θ2x + θ2
y
)]
dS, (2.35)
where it has been preferred to express T as a function of the nodes DoFs (w,θx, θy )instead of the transverse deflection w.
Among the numerous readily available finite elements for plate bending, in thiswork a 4-node quadrilateral element has been implemented in a Matlab code, whoseDoFs are the transverse displacement and the bending rotations of a transversenormal about the xz and yz planes. This results in a total of 12 DoFs per ele-ment.
Since with a numerical approach the number of nodes generally has a direct ef-fect on the results, before carrying out the simulations it is necessary to conduct amesh convergence study in order to determine its effect and estimate the computa-tional effort. Due to the fact that there is no closed form analytical solution for thecase studied, it is not possible to estimate the accuracy of the numerical approachin absolute terms. In spite of this, a study of the evolution of the first ten resonantfrequencies for an increasing mesh density was performed. Figure 2.6 shows theevolution of vibration modes as functions of the number of DoFs. The aspect ra-tio of an element has been tried to be close to one. As can be seen, higher ordermodes converge slower than the lower order modes. Accordingly, the mesh densitywas chosen so that a further mesh refinement results in a changes in frequencies,that is, of an order less than the tolerance defined in the convergence criterion (seeSect. 2.7), which corresponds to a discretization of 70 × 30 elements, equivalent to6603 DoFs.
2 Effects of Moisture Content on the In-Plane Elastic Constants of Wood 43
2.6.3 Perturbation of the Equation of Motion
As discussed above, modal parameters (frequency and mode shapes) are character-istics of a structure’s mass and stiffness. Considering the effect of wood moisturecontent as a widespread damage across the whole volume whose influence on thestiffness and density of the material is established, it can be expected that such de-terioration affects the natural frequencies and associated mode shapes. Quantitativerelations between damage and the resulting changes in modal parameters can bedeveloped from a perturbation of the equation of motion in Eq. (2.26).
The eigenvalue problem for free undamped vibration of a structure is governedby the generalized matrix eigenvalue problem, previously defined as
[][M][ ] = [K][ ] ⇒ [[K] − [][M]][ ] = 0, (2.36)
where [K] and [M] are the global stiffness and mass matrices, respectively, [] isa diagonal matrix listing the corresponding eigenvalues (natural vibration frequen-cies) and [ ] is the eigenvector matrix (mode shapes).
For the perturbed system, Eq. (2.36) becomes
[[[K] + [K]] − [[] + []][[M] + [M]]][[ ] + [ ]] = 0, (2.37)
where [] and [ ] are the variation of the natural frequencies and mode shapes,respectively, induced by [K] and [M].
Given a non-zero eigenvector φ, from the generalized Rayleigh quotient, de-fined as
R([K], [M], φ) = φT[K]φ
φT[M]φ = ω2, (2.38)
where ω2 is the natural vibration frequency, the effect of [K] and [M] on aparticular mode can be determined [42]. Particularizing Eq. (2.38) for the ith naturalfrequency and associated ith mode shape, the generalized Rayleigh quotient can beexpressed as
ω2i + ω2
i = [φiT + φiT][[K] + [K]][φi + φi][φiT + φiT][[M] + [M]][φi + φi] . (2.39)
Because of the fact that R([K], [M], φ) reaches the stationary value when φis equal to the eigenvector φi [42], Eq. (2.39) can be simplified as
ω2i = φiT[[K] − [M]]φi, (2.40)
which indicates that an increase in mass induced by the increase in moisture contentcauses a decrease in natural frequencies and vice versa, as shown in Fig. 2.4 andrepresented in Sect. 2.5. On the other hand, a decrease in moisture content leads to arise in natural frequencies, and therefore intuitively an induced increase in stiffnesscan be expected, as shown in the following section.
44 M.A. Pérez Martínez et al.
2.7 Elastic Constants from Plate Vibration Measurements
The above experiments have shown that the vibration behavior of a wooden plateis heavily dependent on moisture content (see Fig. 2.4), a fact previously noted byseveral researchers and commonly observed by musicians and luthiers [18, 22, 44,46, 47]. In addition to density variations, significant changes in geometry have alsobeen observed (see Table 2.1).
When attempts were made to simulate modal behavior under different moisturecontents by employing the dimensional and density variations observed in the spec-imens, the results did not correspond with observed reality, proving that there mustbe other variables which intervene in the vibration problem. From Eq. (2.36), it canbe derived that the dynamic behavior is governed by the mass and stiffness matri-ces, hence a perturbation in these matrices will significantly influence the vibrationbehavior; thus, it is evident that elastic characteristics must also be affected by mois-ture content.
Given the problem of direct measurement of the elastic properties, an indirectmethod that allows the measurement of experimental related parameters is useful toderive the unknown properties. Resonance methods20 are based on a relationship be-tween an analytical expression, describing the vibration behavior of the specimens,and experimental results.
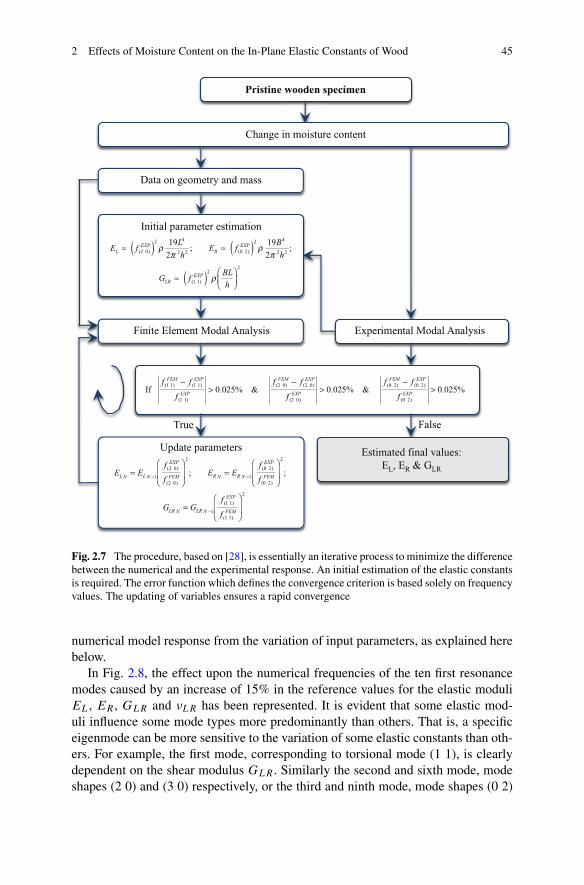
The inverse problem of estimating the in-plane elastic constants is reduced tominimizing the difference between the numerical and the experimental responsethrough an iterative process, in which the resonant frequencies obtained numeri-cally for the initially estimated parameters are compared to the experimental reso-nant frequencies, followed by an update of the parameters in order to minimize thedifference in the responses until convergence is achieved for a predefined error cri-teria. The flowchart of the procedure followed in this work is shown schematicallyin Fig. 2.7.
Prior to beginning the iterative process, it is necessary to introduce initial esti-mations of the in-plane elastic moduli to the numerical model. The success of theconvergence depends in part upon the correct choice of these initial constants. Thesevariables have been estimated using the simple methodology proposed in [28],which is based principally on the assumption that the resonance modes (2 0), (0 2)
and (1 1)21 are influenced principally by elastic constants EL, ER and GLR , respec-tively. This assumption may be demonstrated by conducting a sensitivity analysis of
20Nevertheless, the main drawback of the resonant technique applied to samples of wood is relatedto the type of cut and shape of the specimen. For solid wood, it is easy to obtain plates in quarter-sawn, i.e. the long axis is parallel to the grain fibre orientation and the width is in the radial direction(LR) (see Fig. 2.1), or plain-sawn, i.e. the long axis is parallel to the grain fibre orientation and thewidth is in the tangential direction (LT). However, it is very difficult in the radial tangential plane(RT), especially when it comes to thin slices, as well as maintain the integrity of samples andensure orthotropic behavior.21As mentioned above, the nomenclature (m,n) identifies the different mode types, where m andn refer to the number of nodal lines parallel to the y direction and x direction, respectively.
2 Effects of Moisture Content on the In-Plane Elastic Constants of Wood 45
Fig. 2.7 The procedure, based on [28], is essentially an iterative process to minimize the differencebetween the numerical and the experimental response. An initial estimation of the elastic constantsis required. The error function which defines the convergence criterion is based solely on frequencyvalues. The updating of variables ensures a rapid convergence
numerical model response from the variation of input parameters, as explained herebelow.
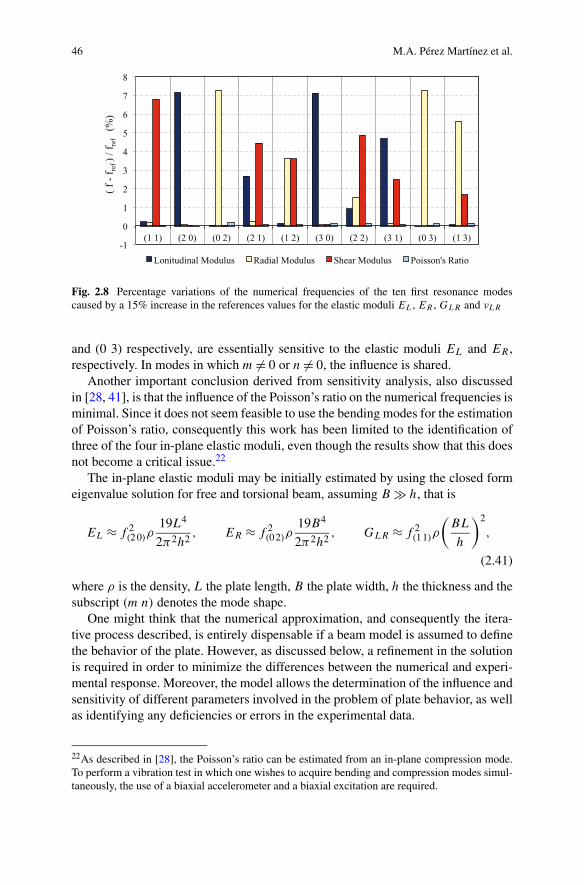
In Fig. 2.8, the effect upon the numerical frequencies of the ten first resonancemodes caused by an increase of 15% in the reference values for the elastic moduliEL, ER , GLR and νLR has been represented. It is evident that some elastic mod-uli influence some mode types more predominantly than others. That is, a specificeigenmode can be more sensitive to the variation of some elastic constants than oth-ers. For example, the first mode, corresponding to torsional mode (1 1), is clearlydependent on the shear modulus GLR . Similarly the second and sixth mode, modeshapes (2 0) and (3 0) respectively, or the third and ninth mode, mode shapes (0 2)
46 M.A. Pérez Martínez et al.
Fig. 2.8 Percentage variations of the numerical frequencies of the ten first resonance modescaused by a 15% increase in the references values for the elastic moduli EL, ER , GLR and νLR
and (0 3) respectively, are essentially sensitive to the elastic moduli EL and ER ,respectively. In modes in which m = 0 or n = 0, the influence is shared.
Another important conclusion derived from sensitivity analysis, also discussedin [28, 41], is that the influence of the Poisson’s ratio on the numerical frequencies isminimal. Since it does not seem feasible to use the bending modes for the estimationof Poisson’s ratio, consequently this work has been limited to the identification ofthree of the four in-plane elastic moduli, even though the results show that this doesnot become a critical issue.22
The in-plane elastic moduli may be initially estimated by using the closed formeigenvalue solution for free and torsional beam, assuming B h, that is
EL ≈ f 2(2 0)ρ
19L4
2π2h2, ER ≈ f 2
(0 2)ρ19B4
2π2h2, GLR ≈ f 2
(1 1)ρ
(BL
h
)2
,
(2.41)
where ρ is the density, L the plate length, B the plate width, h the thickness and thesubscript (m n) denotes the mode shape.
One might think that the numerical approximation, and consequently the itera-tive process described, is entirely dispensable if a beam model is assumed to definethe behavior of the plate. However, as discussed below, a refinement in the solutionis required in order to minimize the differences between the numerical and experi-mental response. Moreover, the model allows the determination of the influence andsensitivity of different parameters involved in the problem of plate behavior, as wellas identifying any deficiencies or errors in the experimental data.
22As described in [28], the Poisson’s ratio can be estimated from an in-plane compression mode.To perform a vibration test in which one wishes to acquire bending and compression modes simul-taneously, the use of a biaxial accelerometer and a biaxial excitation are required.
2 Effects of Moisture Content on the In-Plane Elastic Constants of Wood 47
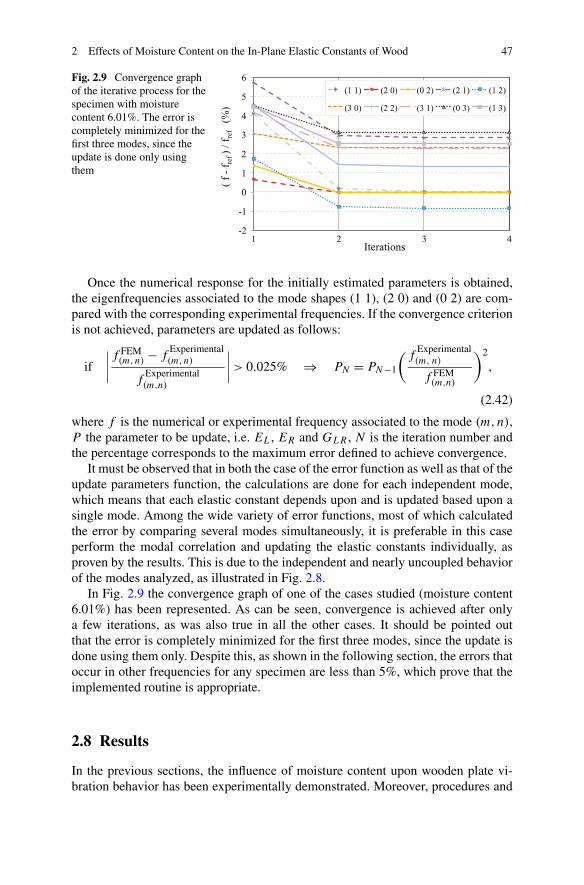
Fig. 2.9 Convergence graphof the iterative process for thespecimen with moisturecontent 6.01%. The error iscompletely minimized for thefirst three modes, since theupdate is done only usingthem
Once the numerical response for the initially estimated parameters is obtained,the eigenfrequencies associated to the mode shapes (1 1), (2 0) and (0 2) are com-pared with the corresponding experimental frequencies. If the convergence criterionis not achieved, parameters are updated as follows:
if
∣∣∣∣
f FEM(m,n) − f
Experimental(m,n)
fExperimental(m,n)
∣∣∣∣ > 0.025% ⇒ PN = PN−1
(f
Experimental(m, n)
f FEM(m,n)
)2
,
(2.42)
where f is the numerical or experimental frequency associated to the mode (m,n),P the parameter to be update, i.e. EL, ER and GLR , N is the iteration number andthe percentage corresponds to the maximum error defined to achieve convergence.
It must be observed that in both the case of the error function as well as that of theupdate parameters function, the calculations are done for each independent mode,which means that each elastic constant depends upon and is updated based upon asingle mode. Among the wide variety of error functions, most of which calculatedthe error by comparing several modes simultaneously, it is preferable in this caseperform the modal correlation and updating the elastic constants individually, asproven by the results. This is due to the independent and nearly uncoupled behaviorof the modes analyzed, as illustrated in Fig. 2.8.
In Fig. 2.9 the convergence graph of one of the cases studied (moisture content6.01%) has been represented. As can be seen, convergence is achieved after onlya few iterations, as was also true in all the other cases. It should be pointed outthat the error is completely minimized for the first three modes, since the update isdone using them only. Despite this, as shown in the following section, the errors thatoccur in other frequencies for any specimen are less than 5%, which prove that theimplemented routine is appropriate.
2.8 Results
In the previous sections, the influence of moisture content upon wooden plate vi-bration behavior has been experimentally demonstrated. Moreover, procedures and
48 M.A. Pérez Martínez et al.
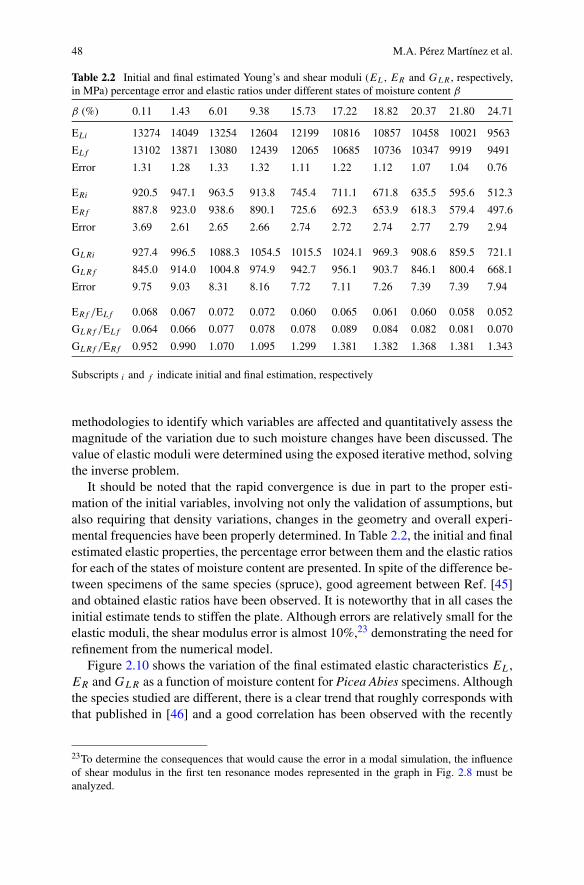
Table 2.2 Initial and final estimated Young’s and shear moduli (EL, ER and GLR , respectively,in MPa) percentage error and elastic ratios under different states of moisture content β
β (%) 0.11 1.43 6.01 9.38 15.73 17.22 18.82 20.37 21.80 24.71
ELi 13274 14049 13254 12604 12199 10816 10857 10458 10021 9563
ELf 13102 13871 13080 12439 12065 10685 10736 10347 9919 9491
Error 1.31 1.28 1.33 1.32 1.11 1.22 1.12 1.07 1.04 0.76
ERi 920.5 947.1 963.5 913.8 745.4 711.1 671.8 635.5 595.6 512.3
ERf 887.8 923.0 938.6 890.1 725.6 692.3 653.9 618.3 579.4 497.6
Error 3.69 2.61 2.65 2.66 2.74 2.72 2.74 2.77 2.79 2.94
GLRi 927.4 996.5 1088.3 1054.5 1015.5 1024.1 969.3 908.6 859.5 721.1
GLRf 845.0 914.0 1004.8 974.9 942.7 956.1 903.7 846.1 800.4 668.1
Error 9.75 9.03 8.31 8.16 7.72 7.11 7.26 7.39 7.39 7.94
ERf /ELf 0.068 0.067 0.072 0.072 0.060 0.065 0.061 0.060 0.058 0.052
GLRf /ELf 0.064 0.066 0.077 0.078 0.078 0.089 0.084 0.082 0.081 0.070
GLRf /ERf 0.952 0.990 1.070 1.095 1.299 1.381 1.382 1.368 1.381 1.343
Subscripts i and f indicate initial and final estimation, respectively
methodologies to identify which variables are affected and quantitatively assess themagnitude of the variation due to such moisture changes have been discussed. Thevalue of elastic moduli were determined using the exposed iterative method, solvingthe inverse problem.
It should be noted that the rapid convergence is due in part to the proper esti-mation of the initial variables, involving not only the validation of assumptions, butalso requiring that density variations, changes in the geometry and overall experi-mental frequencies have been properly determined. In Table 2.2, the initial and finalestimated elastic properties, the percentage error between them and the elastic ratiosfor each of the states of moisture content are presented. In spite of the difference be-tween specimens of the same species (spruce), good agreement between Ref. [45]and obtained elastic ratios have been observed. It is noteworthy that in all cases theinitial estimate tends to stiffen the plate. Although errors are relatively small for theelastic moduli, the shear modulus error is almost 10%,23 demonstrating the need forrefinement from the numerical model.
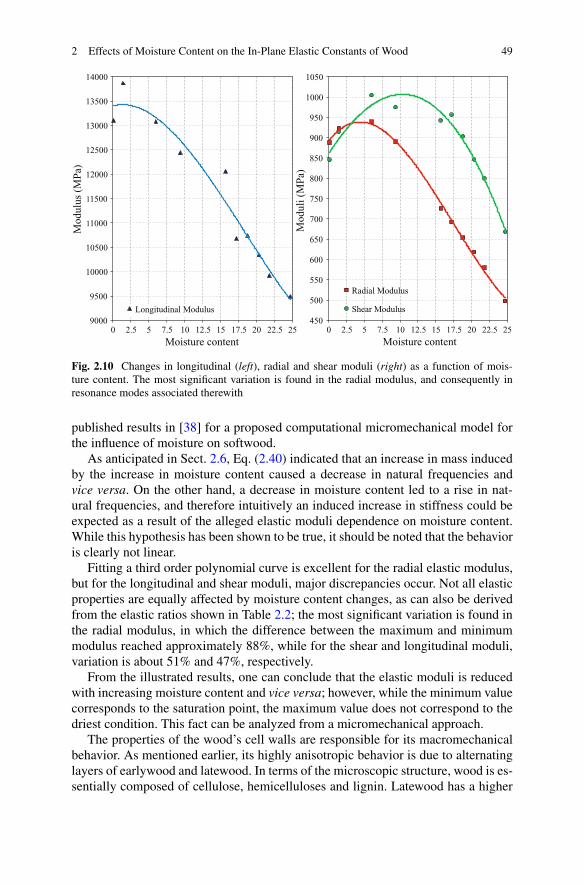
Figure 2.10 shows the variation of the final estimated elastic characteristics EL,ER and GLR as a function of moisture content for Picea Abies specimens. Althoughthe species studied are different, there is a clear trend that roughly corresponds withthat published in [46] and a good correlation has been observed with the recently
23To determine the consequences that would cause the error in a modal simulation, the influenceof shear modulus in the first ten resonance modes represented in the graph in Fig. 2.8 must beanalyzed.
2 Effects of Moisture Content on the In-Plane Elastic Constants of Wood 49
Fig. 2.10 Changes in longitudinal (left), radial and shear moduli (right) as a function of mois-ture content. The most significant variation is found in the radial modulus, and consequently inresonance modes associated therewith
published results in [38] for a proposed computational micromechanical model forthe influence of moisture on softwood.
As anticipated in Sect. 2.6, Eq. (2.40) indicated that an increase in mass inducedby the increase in moisture content caused a decrease in natural frequencies andvice versa. On the other hand, a decrease in moisture content led to a rise in nat-ural frequencies, and therefore intuitively an induced increase in stiffness could beexpected as a result of the alleged elastic moduli dependence on moisture content.While this hypothesis has been shown to be true, it should be noted that the behavioris clearly not linear.
Fitting a third order polynomial curve is excellent for the radial elastic modulus,but for the longitudinal and shear moduli, major discrepancies occur. Not all elasticproperties are equally affected by moisture content changes, as can also be derivedfrom the elastic ratios shown in Table 2.2; the most significant variation is found inthe radial modulus, in which the difference between the maximum and minimummodulus reached approximately 88%, while for the shear and longitudinal moduli,variation is about 51% and 47%, respectively.
From the illustrated results, one can conclude that the elastic moduli is reducedwith increasing moisture content and vice versa; however, while the minimum valuecorresponds to the saturation point, the maximum value does not correspond to thedriest condition. This fact can be analyzed from a micromechanical approach.
The properties of the wood’s cell walls are responsible for its macromechanicalbehavior. As mentioned earlier, its highly anisotropic behavior is due to alternatinglayers of earlywood and latewood. In terms of the microscopic structure, wood is es-sentially composed of cellulose, hemicelluloses and lignin. Latewood has a higher
50 M.A. Pérez Martínez et al.
cellulose content, which is the main contributor to the stiffness, and a lower lignincontent than earlywood. Unlike cellulose, hemicellulose is strongly influenced bymoisture changes, and along with lignin, it is the primary cause of moisture sorp-tion. At lower moisture content, the hard-celled cellulose microfibrils, known astracheids, are stiffer and conversely they become softer at higher moisture content.The dependence of stiffness constants of hemicellulose and lignin on moisture con-tent can be found in [7, 8, 38], in which it is observed the lignin stiffness has a cleartrend that roughly corresponds with the curves in Fig. 2.10.
The methodology results in numerical eigenfrequencies that fit closely with theexperimental frequencies. Based on the estimated elastic properties24 displayed inTable 2.2 and taking into account the geometric and mass variations experiencedby the specimen displayed in Table 2.1, wooden plate vibration behavior has beensimulated under different moisture conditions. Experimental and numerical modes,the corresponding mode shapes and the relative deviation between frequencies underdifferent moisture conditions have been presented in Table 2.3. Figure 2.11 showsa comparison between the numerical and experimental modal analysis under 6.01%moisture content conditions for the first ten mode shapes. As expected, the minimumerror corresponds to the first three modes. This fact is due to the independent use ofthe first three eigenfrequencies for the updating of the elastic characteristics at eachiteration; even so, the maximum error for the rest of the modes is below 5%.
The main source of error is due to the inevitable heterogeneity of wood’s prop-erties, such as a local dispersion and orientation of the grain, irregularities in thethickness, non-uniformity in the cross-grain direction and densities. Inaccuracies ingeometrical or mass measurements are other possible sources of error.
In order to quantify the influence of these inaccuracies in the eigenfrequenciesobtained in the numerical model, a sensitivity analysis has been carried out by in-creasing the nominal values of length, width, thickness and mass by 5%. Variationsin relation to a reference value of each of the resonance modes of the wooden plateanalyzed are illustrated in Fig. 2.12. A decoupled behavior has been observed be-tween the x-bending and y-bending modes with a strong relation to the length andwidth, respectively, as well as constant errors of 5% and −2.5% in all resonancemodes, corresponding to variations in thickness and mass, respectively. It must beemphasized that these increases would result with an error in the nominal measureof approximately 10 g, 21.6 mm, 9.6 mm and 0.26 mm, respectively, all of whichare well above tolerance levels (see Table 2.1).
Errors in the estimation of elastic properties as a result of inaccuracies in thegeometrical measurements and mass are also quantifiable. The percentage errorsin estimating the elastic properties for a 5% increase in length, width, thicknessand mass have been represented in Fig. 2.13. Although errors illustrated are muchhigher than tolerance, it is demonstrated that geometric variation is not necessarilynegligible and therefore should be taken into account in order to obtain results whichare as accurate as possible.
24Since the Poisson’s ratio does not have a significant effect on bending modes as shown in thegraph of sensitivity (see in Fig. 2.8), a reference value of 0.35 has taken to perform simulations [45].
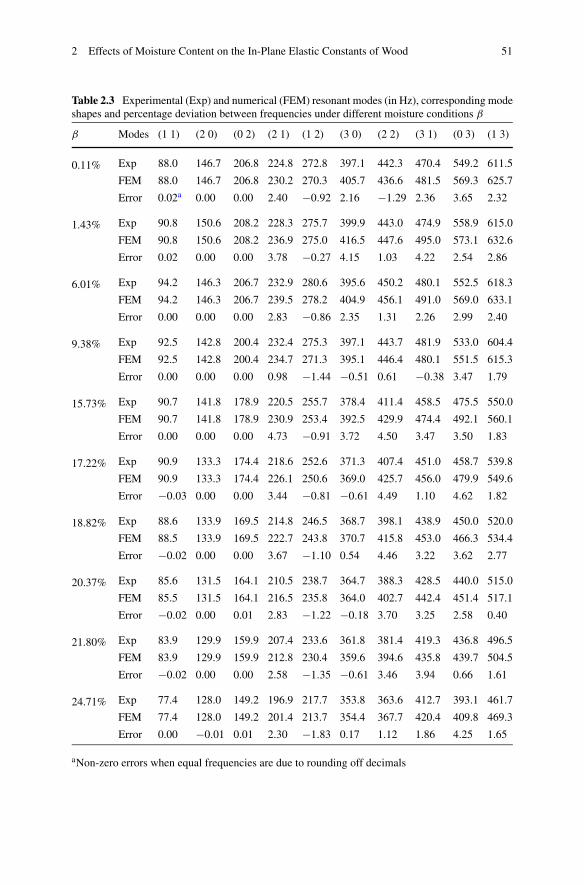
2 Effects of Moisture Content on the In-Plane Elastic Constants of Wood 51
Table 2.3 Experimental (Exp) and numerical (FEM) resonant modes (in Hz), corresponding modeshapes and percentage deviation between frequencies under different moisture conditions β
β Modes (1 1) (2 0) (0 2) (2 1) (1 2) (3 0) (2 2) (3 1) (0 3) (1 3)
0.11% Exp 88.0 146.7 206.8 224.8 272.8 397.1 442.3 470.4 549.2 611.5
FEM 88.0 146.7 206.8 230.2 270.3 405.7 436.6 481.5 569.3 625.7
Error 0.02a 0.00 0.00 2.40 −0.92 2.16 −1.29 2.36 3.65 2.32
1.43% Exp 90.8 150.6 208.2 228.3 275.7 399.9 443.0 474.9 558.9 615.0
FEM 90.8 150.6 208.2 236.9 275.0 416.5 447.6 495.0 573.1 632.6
Error 0.02 0.00 0.00 3.78 −0.27 4.15 1.03 4.22 2.54 2.86
6.01% Exp 94.2 146.3 206.7 232.9 280.6 395.6 450.2 480.1 552.5 618.3
FEM 94.2 146.3 206.7 239.5 278.2 404.9 456.1 491.0 569.0 633.1
Error 0.00 0.00 0.00 2.83 −0.86 2.35 1.31 2.26 2.99 2.40
9.38% Exp 92.5 142.8 200.4 232.4 275.3 397.1 443.7 481.9 533.0 604.4
FEM 92.5 142.8 200.4 234.7 271.3 395.1 446.4 480.1 551.5 615.3
Error 0.00 0.00 0.00 0.98 −1.44 −0.51 0.61 −0.38 3.47 1.79
15.73% Exp 90.7 141.8 178.9 220.5 255.7 378.4 411.4 458.5 475.5 550.0
FEM 90.7 141.8 178.9 230.9 253.4 392.5 429.9 474.4 492.1 560.1
Error 0.00 0.00 0.00 4.73 −0.91 3.72 4.50 3.47 3.50 1.83
17.22% Exp 90.9 133.3 174.4 218.6 252.6 371.3 407.4 451.0 458.7 539.8
FEM 90.9 133.3 174.4 226.1 250.6 369.0 425.7 456.0 479.9 549.6
Error −0.03 0.00 0.00 3.44 −0.81 −0.61 4.49 1.10 4.62 1.82
18.82% Exp 88.6 133.9 169.5 214.8 246.5 368.7 398.1 438.9 450.0 520.0
FEM 88.5 133.9 169.5 222.7 243.8 370.7 415.8 453.0 466.3 534.4
Error −0.02 0.00 0.00 3.67 −1.10 0.54 4.46 3.22 3.62 2.77
20.37% Exp 85.6 131.5 164.1 210.5 238.7 364.7 388.3 428.5 440.0 515.0
FEM 85.5 131.5 164.1 216.5 235.8 364.0 402.7 442.4 451.4 517.1
Error −0.02 0.00 0.01 2.83 −1.22 −0.18 3.70 3.25 2.58 0.40
21.80% Exp 83.9 129.9 159.9 207.4 233.6 361.8 381.4 419.3 436.8 496.5
FEM 83.9 129.9 159.9 212.8 230.4 359.6 394.6 435.8 439.7 504.5
Error −0.02 0.00 0.00 2.58 −1.35 −0.61 3.46 3.94 0.66 1.61
24.71% Exp 77.4 128.0 149.2 196.9 217.7 353.8 363.6 412.7 393.1 461.7
FEM 77.4 128.0 149.2 201.4 213.7 354.4 367.7 420.4 409.8 469.3
Error 0.00 −0.01 0.01 2.30 −1.83 0.17 1.12 1.86 4.25 1.65
aNon-zero errors when equal frequencies are due to rounding off decimals
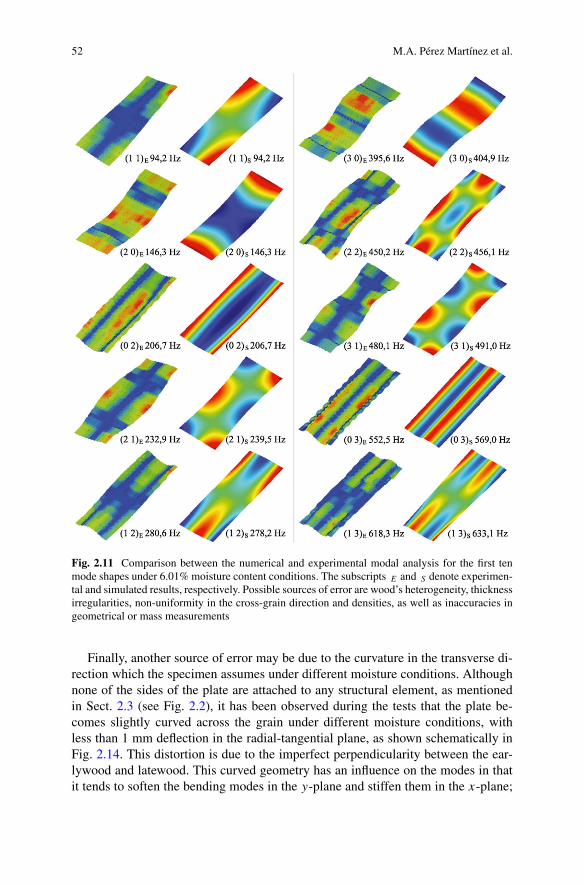
52 M.A. Pérez Martínez et al.
Fig. 2.11 Comparison between the numerical and experimental modal analysis for the first tenmode shapes under 6.01% moisture content conditions. The subscripts E and S denote experimen-tal and simulated results, respectively. Possible sources of error are wood’s heterogeneity, thicknessirregularities, non-uniformity in the cross-grain direction and densities, as well as inaccuracies ingeometrical or mass measurements
Finally, another source of error may be due to the curvature in the transverse di-rection which the specimen assumes under different moisture conditions. Althoughnone of the sides of the plate are attached to any structural element, as mentionedin Sect. 2.3 (see Fig. 2.2), it has been observed during the tests that the plate be-comes slightly curved across the grain under different moisture conditions, withless than 1 mm deflection in the radial-tangential plane, as shown schematically inFig. 2.14. This distortion is due to the imperfect perpendicularity between the ear-lywood and latewood. This curved geometry has an influence on the modes in thatit tends to soften the bending modes in the y-plane and stiffen them in the x-plane;
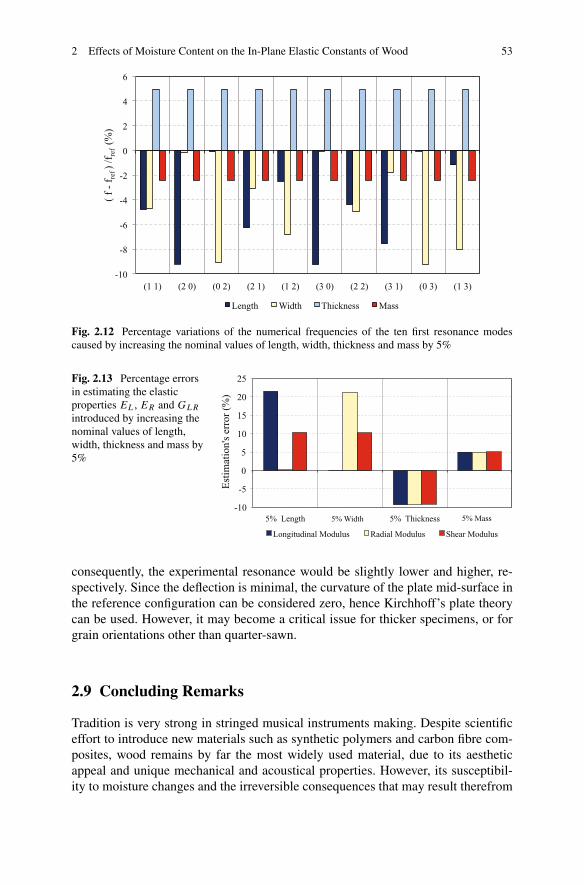
2 Effects of Moisture Content on the In-Plane Elastic Constants of Wood 53
Fig. 2.12 Percentage variations of the numerical frequencies of the ten first resonance modescaused by increasing the nominal values of length, width, thickness and mass by 5%
Fig. 2.13 Percentage errorsin estimating the elasticproperties EL, ER and GLR
introduced by increasing thenominal values of length,width, thickness and mass by5%
consequently, the experimental resonance would be slightly lower and higher, re-spectively. Since the deflection is minimal, the curvature of the plate mid-surface inthe reference configuration can be considered zero, hence Kirchhoff’s plate theorycan be used. However, it may become a critical issue for thicker specimens, or forgrain orientations other than quarter-sawn.
2.9 Concluding Remarks
Tradition is very strong in stringed musical instruments making. Despite scientificeffort to introduce new materials such as synthetic polymers and carbon fibre com-posites, wood remains by far the most widely used material, due to its aestheticappeal and unique mechanical and acoustical properties. However, its susceptibil-ity to moisture changes and the irreversible consequences that may result therefrom
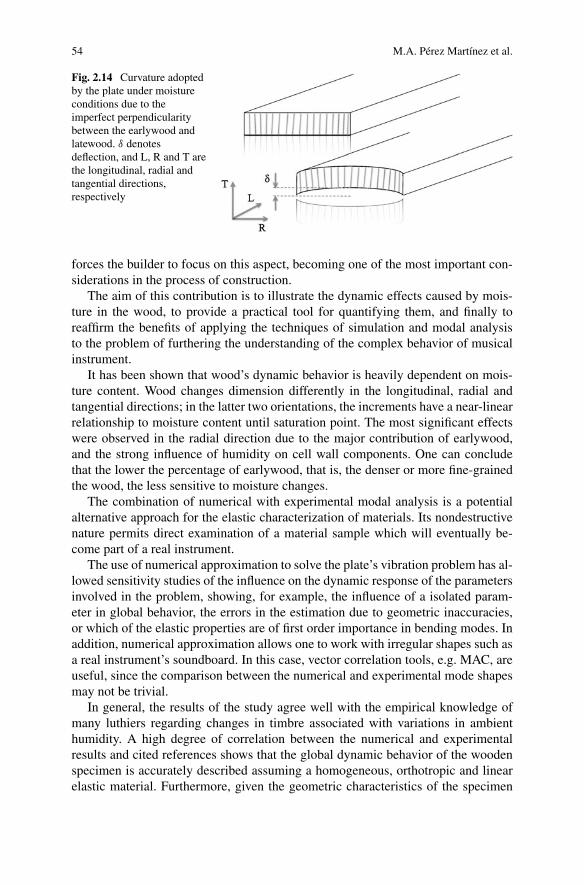
54 M.A. Pérez Martínez et al.
Fig. 2.14 Curvature adoptedby the plate under moistureconditions due to theimperfect perpendicularitybetween the earlywood andlatewood. δ denotesdeflection, and L, R and T arethe longitudinal, radial andtangential directions,respectively
forces the builder to focus on this aspect, becoming one of the most important con-siderations in the process of construction.
The aim of this contribution is to illustrate the dynamic effects caused by mois-ture in the wood, to provide a practical tool for quantifying them, and finally toreaffirm the benefits of applying the techniques of simulation and modal analysisto the problem of furthering the understanding of the complex behavior of musicalinstrument.
It has been shown that wood’s dynamic behavior is heavily dependent on mois-ture content. Wood changes dimension differently in the longitudinal, radial andtangential directions; in the latter two orientations, the increments have a near-linearrelationship to moisture content until saturation point. The most significant effectswere observed in the radial direction due to the major contribution of earlywood,and the strong influence of humidity on cell wall components. One can concludethat the lower the percentage of earlywood, that is, the denser or more fine-grainedthe wood, the less sensitive to moisture changes.
The combination of numerical with experimental modal analysis is a potentialalternative approach for the elastic characterization of materials. Its nondestructivenature permits direct examination of a material sample which will eventually be-come part of a real instrument.
The use of numerical approximation to solve the plate’s vibration problem has al-lowed sensitivity studies of the influence on the dynamic response of the parametersinvolved in the problem, showing, for example, the influence of a isolated param-eter in global behavior, the errors in the estimation due to geometric inaccuracies,or which of the elastic properties are of first order importance in bending modes. Inaddition, numerical approximation allows one to work with irregular shapes such asa real instrument’s soundboard. In this case, vector correlation tools, e.g. MAC, areuseful, since the comparison between the numerical and experimental mode shapesmay not be trivial.
In general, the results of the study agree well with the empirical knowledge ofmany luthiers regarding changes in timbre associated with variations in ambienthumidity. A high degree of correlation between the numerical and experimentalresults and cited references shows that the global dynamic behavior of the woodenspecimen is accurately described assuming a homogeneous, orthotropic and linearelastic material. Furthermore, given the geometric characteristics of the specimen

2 Effects of Moisture Content on the In-Plane Elastic Constants of Wood 55
and in accordance with the results, plate theory can properly be applied. It mustnonetheless be pointed that if one wishes to analyze specimens other than quarter-sawn, samples which are thicker or curved, or samples with varying thicknesses,these assumptions must be reconsidered.
2.10 Prospects for the Future
While the general lines to follow in the evaluation of the effects of moisture contenton the in-plane elastic constants of wooden specimens have been roughly sketchedout in the present work, it is certainly necessary to refine the numerical model byincluding other parameters such as Poisson’s ratio, the consideration of more modesfor the error functions and examining aspects other than just modal frequencies,incorporating a theory that provides a solution for thicker plates by using a sheardeformation theory, as well as dealing with plates which vary in thickness, in whichcase three-dimensional stress effects could not be neglected.
Future lines of enquiry might be to compare the results with the estimation ofelastic properties using ultrasonic inspection techniques, and the effects upon dy-namical behavior due to different types of glue or varnish used in the constructionof instruments.
Finally, since the most important aspect in the making and preservation of a mu-sical instrument is its sound quality, future lines of enquiry might include the preser-vation of samples of the wood used in the construction of soundboards of specificinstruments in order to allow the correlation of observed variations in the elasticcharacteristics or states of stress of the material with any acoustic alterations whichmight be detected in the instrument’s sound, a study which could be carried outwithout having to subject the instrument itself to the sort of testing needed to es-tablish mechanical characteristics of its component parts. In addition, further workis required on the influence of wood’s moisture content on the internal friction, i.e.damping, given its significance for the final musical result.
2.11 Summary
The present work illustrates the effects on the vibration behavior caused by mois-ture content in wood and provides a mixed experimental-numerical tool to quantifythese effects on the in-plane elastic constants. The vibrational behavior of a spec-imen of quarter-sawn spruce has been observed using vibration testing, from dryconditions to the saturation point. It has been shown that wood’s dynamic behavioris heavily dependent on moisture content, and a significant variations in geometryand mass measurements have been observed. The methodology results in numeri-cal eigenfrequencies that fit closely with the experimental frequencies. In general,the results show that an increase in moisture content causes a nonlinear decrease innatural frequencies and, consequently, in elastic moduli. Good agreement between

56 M.A. Pérez Martínez et al.
reference solutions and the results obtained have been observed, proving that theglobal dynamic behavior of the wooden specimen have been accurately describedunder the assumptions considered.
References
1. Alfano, M., Pagnotta, L.: Determining the elastic constants of isotropic materials by modal vi-bration testing of rectangular thin plates. J. Sound Vib. (2006). doi:10.1016/j.jsv.2005.10.021
2. Araújo, A.L., Mota Soares, C.M., Moreira de Freitas, M.J.: Characterization of material pa-rameters of composite plate specimens using optimization and experimental vibrational data.Compos. Part B Eng. (1996). doi:10.1016/1359-8368(95)00050-X
3. Ayorinde, E.O., Gibson, R.F.: Elastic constants of orthotropic composite materials using plateresonance frequencies, classical lamination theory and an optimized three-mode Rayleigh for-mulation. Compos. Eng. (1993). doi:10.1016/0961-9526(93)90077-W
4. Ayorinde, E.O., Yu, L.: On the elastic characterization of composite plates with vibration data.J. Sound Vib. (2005). doi:10.1016/j.jsv.2004.04.026
5. Bathe, K.J.: Finite Element Procedures. Prentice Hall, New York (1996)6. Bell, J.F.: Mechanics of Solids: Volume 1—The Experimental Foundations of Solid Mechan-
ics. Springer, Berlin (1973)7. Cousins, W.J.: Elastic modulus of lignin as related to moisture content. Wood Sci. Technol.
(1976). doi:10.1007/BF003763808. Cousins, W.J.: Young’s modulus of hemicellulose as related to moisture content. Wood Sci.
Technol. (1978). doi:10.1007/BF003728629. Deobald, R.L., Gibson, R.F.: Determination of elastic constants of orthotropic plates
by a modal analysis/Rayleigh-Ritz technique. J. Sound Vib. (1988). doi:10.1016/S0022-460X(88)80187-1
10. De Visscher, J., Sol, H., De Wilde, W.P., Vantomme, J.: Identification of the damping proper-ties of orthotropic composite materials using a mixed numerical experimental method. Appl.Compos. Mat. (1997). doi:10.1007/BF02481386
11. Ewins, D.J.: Modal Testing: Theory and Practice. Research Studies Press, Baldock (1986)12. Fällström, K.E., Jonsson, M.A.: Determining material properties in anisotropic plates using
Rayleigh’s method. Polym. Compos. (1991). doi:10.1002/pc.75012050313. Felippa, C.: Introduction to finite element methods. http://www.colorado.edu/engi-neering/
cas/courses.d/IFEM.d/ (2009). Cited Jun 201014. Ferreira, A.J.M.: MATLAB Codes for Finite Element Analysis. Springer, Berlin (2009).
doi:10.1007/978-1-4020-9200-815. Grédiac, M., Paris, P.A.: Direct identification of elastic constants of anisotropic plates
by modal analysis: theoretical and numerical aspects. J. Sound Vib. (1996). doi:10.1006/jsvi.1996.0434
16. Grédiac, M., Fournier, N., Paris, P.A., Surrel, Y.: Direct identification of elastic con-stants of anisotropic plates by modal analysis: experimental results. J. Sound Vib. (1998).doi:10.1006/jsvi.1997.1304
17. Haines, D.W.: On musical instrument wood, Part I. J. Catgut. Acoust. Soc. (1979). Publishedin [22], paper 88
18. Haines, D.W.: On musical instrument wood, Part II: surface finishes, plywood, light and waterexposure. J. Catgut. Acoust. Soc. (1980). Published in [22], paper 89
19. Harris, C.M., Piersol, A.G.: Harris’ Shock and Vibration Handbook. McGraw-Hill, New York(2002)
20. Häglund, M.: Parameter influence on moisture induced eigen-stresses in timber. Eur. J. WoodProd. (2009). doi:10.1007/s00107-009-0377-2
2 Effects of Moisture Content on the In-Plane Elastic Constants of Wood 57
21. Hanhijärvi, A.: Advances in the knowledge of the influence of moisture changeson the long-term mechanical performance of timber structures. Mater. Struct. (2000).doi:10.1007/BF02481695
22. Hutchins, C.M., Benade, V.: Research Papers in Violin Acoustics, 1973–1995. Acoust. Soc.Amer., USA (1996)
23. Hurlebaus, S., Gaul, L., Wang, J.T.S.: An exact series solution for calculating the eigen-frequencies of orthotropic plates with completely free boundary. J. Sound Vib. (2001).doi:10.1006/jsvi.2000.3541
24. Hurlebaus, S.: Calculation of eigenfrequencies for rectangular free orthotropic plates—anoverview. J. Appl. Math. Mech. (2007). doi:10.1002/zamm.200710349
25. Hwang, S.F., Chang, C.F.: Determination of elastic constants of materials by vibration testing.Compos. Struct. (2000). doi:10.1016/S0263-8223(99)00132-4
26. Jones, R.M.: Mechanics of Composite Materials. Taylor & Francis, London (1999)27. Kwon, Y.W., Bang, H.: The Finite Element Method Using MATLAB. CRC Press, Boca Raton
(1997)28. Larsson, D.: Using modal analysis for estimation of anisotropic material constants. J. Eng.
Mech. (1999). doi:10.1061/(ASCE)0733-9399(1997)123:3(222)29. Lauwagie, T.: Vibration-based methods for the identification of the elastic properties of lay-
ered materials. Ph.D. thesis, Katholieke Universiteit Leuven, Belgium (2005)30. Leissa, A.W.: Vibration of Plates. Acoust. Soc. Amer., USA (1993)31. Liew, K.M., Wang, C.M., Xiang, Y., Kitipornchai, S.: Vibration of Mindlin Plates: Program-
ming the p-Version Ritz Method. Elsevier, Amsterdam (1998)32. Maia, N.M.M., Silva, J.M.M.: Theoretical and Experimental Modal Analysis. Research Stud-
ies Press, Baldock (1997)33. McIntyre, M.E., Woodhouse, J.: On measuring the elastic and damping constants of or-
thotropic sheet materials. Acta Metall. (1988). doi:10.1016/0001-6160(88)90209-X34. Molin, N.E., Lindgren, L.E.: Parameters of violin plates and their influence on the plate modes.
J. Acoust. Soc. Am. (1988). doi:10.1121/1.39643035. Mota Soares, C.M., Moreira de Freitas, M., Araújo, A.L., Pedersen, P.: Identifica-
tion of material properties of composite plate specimens. Compos. Struct. (1993).doi:10.1016/0263-8223(93)90174-O
36. Ohlsson, S., Perstorper, M.: Elastic wood properties from dynamic tests and computer model-ing. J. Struct. Eng. (1992). doi:10.1061/(ASCE)0733-9445(1992)118:10(2677)
37. Pagnotta, L., Stigliano, G.: Elastic characterization of isotropic plates of any shape via dy-namic tests: theoretical aspects and numerical simulations. Mech. Res. Commun. (2008).doi:10.1016/j.mechrescom.2008.03.008
38. Qing, H., Mishnaevsky, L.: Moisture-related mechanical properties of softwood: 3D microme-chanical modeling. Comput. Mater. Sci. (2009). doi:10.1016/j.commatsci.2009.03.008
39. Rayleigh, J.W.S.: The Theory of Sound, vol. 1. Macmillan Co., New York (1877) (Reprintedby Dover Publications, New York (1945))
40. Reddy, J.N.: Theory and Analysis of Elastic Plates. Taylor & Francis, London (1999)41. Rodgers, O.E.: The effect of the elements of wood stiffness on violin plate vibration. J. Catgut.
Acoust. Soc. (1988). Published in [22], paper 4842. Silva, C.W.: Vibration and Shock Handbook. CRC Press, Boca Raton (2005)43. Sol, H.: Identification of anisotropic plate rigidities using free vibration data. Ph.D. thesis,
University of Brussels, Belgium (1986)44. Thompson, R.: The effect of variations in relative humidity on the frequency response of free
violin plates. J. Catgut. Acoust. Soc. (1979). Published in [22], paper 5345. United States Department of Agriculture: The Encyclopedia of Wood. Skyhorse Publishing,
New York (2007)46. Voichita, B.: Acoustics of Wood. CRC Press, Boca Raton (1995)47. Wegst, U.G.K.: Wood for sound. Am. J. Bot. 93(10), 1439–1448 (2006)

http://www.springer.com/978-94-007-1702-2
Copyright © 2022 FDOKUMEN