Very large release of mostly volcanic carbon during the ...
36
Very large release of mostly volcanic carbon during the Paleocene-Eocene Thermal Maximum Marcus Gutjahr 1,2,* , Andy Ridgwell 3,4 , Philip F. Sexton 5 , Eleni Anagnostou 1 , Paul N. Pearson 6 , Heiko Pälike 7 , Richard D. Norris 8 , Ellen Thomas 9,10 , and Gavin L. Foster 1 1 Ocean and Earth Science, National Oceanography Centre Southampton, University of Southampton, UK 2 GEOMAR Helmholtz Centre for Ocean Research Kiel, Germany 3 School of Geographical Sciences, Bristol University, Bristol, UK 4 Department of Earth Sciences, University of California-Riverside, Riverside, CA, USA 5 School of Environment, Earth & Ecosystem Sciences, The Open University, Milton Keynes, UK 6 School of Earth and Ocean Sciences, Cardiff University, Cardiff, UK 7 MARUM, Center for Marine Environmental Sciences, University of Bremen, Germany 8 Scripps Institution of Oceanography, University of California, San Diego, La Jolla, U.S.A. 9 Department of Geology and Geophysics, Yale University, New Haven CT, U.S.A. 10 Department of Earth and Environmental sciences, Wesleyan University, Middletown CT, USA Abstract Global warming during the Palaeocene-Eocene Thermal Maximum1,2 (PETM, ~56 Ma) is commonly interpreted as being primarily driven by the destabilization of carbon from surficial sedimentary reservoirs such as methane hydrates3. However, the source(s) of carbon remain controversial1,3–5. Resolving this is key to understanding the proximal cause, as well as quantifying the roles of triggers versus feedbacks in driving the event. Here we present new boron isotope data – a proxy for seawater pH – that demonstrate the occurrence of persistently Users may view, print, copy, and download text and data-mine the content in such documents, for the purposes of academic research, subject always to the full Conditions of use:http://www.nature.com/authors/editorial_policies/license.html#terms * corresponding author: [email protected]. Author contributions G.L.F., P.F.S. and P.N.P. developed the concept and designed the study. M.G. and E.A. carried out the chemical sample preparation as well as elemental and isotopic analyses. P.F.S. performed the foraminifer taxonomy and prepared foraminifer samples for the analyses. R.D.N. and E.T. supplied washed coarse fraction samples. P.F.S. developed the age model. A.R. devised and conducted the Earth system modelling and analysis. H.P. carried out the carbon and oxygen isotopic analyses. M.G., A.R., G.L.F. and P.F.S. led the writing of the manuscript. All authors contributed to the interpretation and writing of the final text. Competing financial interests The authors declare no competing financial interests. Data availability Foraminifera and bulk carbonate stable isotope results are published alongside this articles in Supplementary Tables S1 and S2 and can also be accessed on the UK National Geoscience Data Centre (NGDC) (http://www.bgs.ac.uk/services/ngdc/). All modeling related data is included as part of the cGENIE model code distribution (see above). Europe PMC Funders Group Author Manuscript Nature. Author manuscript; available in PMC 2018 February 28. Published in final edited form as: Nature. 2017 August 30; 548(7669): 573–577. doi:10.1038/nature23646. Europe PMC Funders Author Manuscripts Europe PMC Funders Author Manuscripts
-
Upload
khangminh22 -
Category
Documents
-
view
1 -
download
0
Transcript of Very large release of mostly volcanic carbon during the ...

Very large release of mostly volcanic carbon during the Paleocene-Eocene Thermal Maximum
Marcus Gutjahr1,2,*, Andy Ridgwell3,4, Philip F. Sexton5, Eleni Anagnostou1, Paul N. Pearson6, Heiko Pälike7, Richard D. Norris8, Ellen Thomas9,10, and Gavin L. Foster1
1Ocean and Earth Science, National Oceanography Centre Southampton, University of Southampton, UK
2GEOMAR Helmholtz Centre for Ocean Research Kiel, Germany
3School of Geographical Sciences, Bristol University, Bristol, UK
4Department of Earth Sciences, University of California-Riverside, Riverside, CA, USA
5School of Environment, Earth & Ecosystem Sciences, The Open University, Milton Keynes, UK
6School of Earth and Ocean Sciences, Cardiff University, Cardiff, UK
7MARUM, Center for Marine Environmental Sciences, University of Bremen, Germany
8Scripps Institution of Oceanography, University of California, San Diego, La Jolla, U.S.A.
9Department of Geology and Geophysics, Yale University, New Haven CT, U.S.A.
10Department of Earth and Environmental sciences, Wesleyan University, Middletown CT, USA
Abstract
Global warming during the Palaeocene-Eocene Thermal Maximum1,2 (PETM, ~56 Ma) is
commonly interpreted as being primarily driven by the destabilization of carbon from surficial
sedimentary reservoirs such as methane hydrates3. However, the source(s) of carbon remain
controversial1,3–5. Resolving this is key to understanding the proximal cause, as well as
quantifying the roles of triggers versus feedbacks in driving the event. Here we present new boron
isotope data – a proxy for seawater pH – that demonstrate the occurrence of persistently
Users may view, print, copy, and download text and data-mine the content in such documents, for the purposes of academic research, subject always to the full Conditions of use:http://www.nature.com/authors/editorial_policies/license.html#terms*corresponding author: [email protected].
Author contributionsG.L.F., P.F.S. and P.N.P. developed the concept and designed the study. M.G. and E.A. carried out the chemical sample preparation as well as elemental and isotopic analyses. P.F.S. performed the foraminifer taxonomy and prepared foraminifer samples for the analyses. R.D.N. and E.T. supplied washed coarse fraction samples. P.F.S. developed the age model. A.R. devised and conducted the Earth system modelling and analysis. H.P. carried out the carbon and oxygen isotopic analyses. M.G., A.R., G.L.F. and P.F.S. led the writing of the manuscript. All authors contributed to the interpretation and writing of the final text.
Competing financial interestsThe authors declare no competing financial interests.
Data availabilityForaminifera and bulk carbonate stable isotope results are published alongside this articles in Supplementary Tables S1 and S2 and can also be accessed on the UK National Geoscience Data Centre (NGDC) (http://www.bgs.ac.uk/services/ngdc/). All modeling related data is included as part of the cGENIE model code distribution (see above).
Europe PMC Funders GroupAuthor ManuscriptNature. Author manuscript; available in PMC 2018 February 28.
Published in final edited form as:Nature. 2017 August 30; 548(7669): 573–577. doi:10.1038/nature23646.
Europe PM
C Funders A
uthor Manuscripts
Europe PM
C Funders A
uthor Manuscripts

suppressed surface ocean pH across the PETM. Our pH data, alongside a paired carbon isotope
record, are assimilated in an Earth system model to reconstruct the unfolding carbon cycle
dynamics across the event6,7. We find strong evidence for a much larger (>10,000 PgC) and on
average isotopically heavier carbon source than considered previously8,9. This leads us to identify
volcanism associated with the North Atlantic Igneous Province, rather than carbon from a surficial
reservoir, as the main driver of the PETM10,11. We also find that, although amplifying organic
carbon feedbacks with climate likely played only a subordinate role in driving the event, enhanced
organic matter burial was important in ultimately sequestering the released carbon and
accelerating the recovery of the Earth system12.
Aside from climate13 and ecological sensitivities14, arguably the greatest uncertainties
surrounding the response of the Earth system to massive carbon release concern the role of
carbon-cycle feedbacks15. A past event with considerable potential to evaluate such
feedbacks is the Palaeocene-Eocene Thermal Maximum (PETM)1 – a 4-5°C transient
surface warming2 associated with ecological disruption occurring around 55.8 million years
ago16. Estimates of total carbon release vary from ~3,000 PgC to over 10,000 PgC7,8,
spanning the range of present-day fossil fuel reserves17 but equally reflecting considerable
uncertainty in current understanding. The source(s) of carbon is also highly uncertain, and
has been proposed to involve methane hydrates3, permafrost4 and marine sedimentary5
organic matter. To further complicate the matter, proposed triggers for the PETM include
orbital variations4 and an extraterrestrial impact18. Massive flood basalts and sill
emplacement occurring around the time of the PETM and associated with the North Atlantic
Igneous Province (NAIP)10,11,19, constitute an additional potential source of carbon, but
one not linked to a feedback with climate. If we are to fully understand the paleo-record, as
well as exploit it to improve our understanding of the longer-term consequences of
anthropogenic carbon emissions, we must resolve the balance of carbon source(s) that gave
rise to the PETM, and thereby deconvolve the role(s) of triggers versus feedbacks. To
provide new insight into the amount and source of carbon involved in PETM warming, we
present new, paired, surface ocean boron (a well-established proxy for ambient surface
seawater pH20,21) and carbon isotope data, and simultaneously use these to constrain the
time-varying sources and sinks of carbon across the PETM in a novel data assimilation
approach in an Earth System model (ESM).
We generated near-continuous boron, oxygen and carbon isotope records from NE Atlantic
DSDP Site 401, using the surface ocean mixed-layer dwelling foraminifer Morozovella subbotinae (Fig. 1). We sampled the sediment sequence over an interval corresponding to
~300 ka preceding the carbon isotope excursion (CIE) to ~500 ka afterwards, using a new
stratigraphy for Site 401 (Methods). To avoid alignment issues between proxies, we
measured boron, oxygen and carbon isotopic compositions on the same samples (Figs. 1a, c,
e and Extended Data Fig. 2).
Our measured CIE magnitude at Site 401 of -3.4‰ (Fig. 1a) is at the upper end of planktic
foraminiferal δ13C records (minimum CIE: -0.7, maximum -4.4, average -2.7, n=36)1,
suggesting that our sampling encompasses close to the full magnitude of the CIE (see
Methods). The CIE is accompanied by a decrease in δ11B of almost 1.7‰ (Fig. 1c). The
Gutjahr et al. Page 2
Nature. Author manuscript; available in PMC 2018 February 28.
Europe PM
C Funders A
uthor Manuscripts
Europe PM
C Funders A
uthor Manuscripts
lowest δ13C and δ11B values are both observed about ~25 ka after the onset of the CIE in
our preferred age model, giving an inferred duration of the onset phase of the CIE in good
agreement with an independently dated record from Spitsbergen16.
Because of uncertainties in early Cenozoic seawater boron isotopic composition (δ11BSW),
we tie our initial, pre-CIE boron isotope derived pH to mean ocean pH (7.75) as simulated
by the ‘GENIE’ Earth System Model (ESM)6 and following the approach of a previous
PETM model-data pH study20. Our δ11B measurements then dictate the timing and
magnitude of how ocean pH deviated from this value across the PETM. In our pH
reconstruction, we calculate an uncertainty envelope accounting for uncertainties in surface
ocean temperature and salinity plus δ11B measurement errors, and test two contrasting end-
member δ11B-pH calibrations for the extinct foraminifer M. subbotinae (see Methods). We
focus on the δ11Bforam = δ11Bborate calibration, giving an estimated δ11BSW (38.9 ± 0.4‰)
consistent with a recent reconstruction of Eocene δ11BSW based on δ11B21.
Evolution of ocean pH across the PETM is characterized by a negative excursion of 0.27
(range: 0.18-0.41) or 0.36 (0.21-0.56) pH units, depending on which δ11B-pH calibration is
used (Fig. 2 and Extended Data Fig. 3a), and in general agreement with a recently published
PETM δ11B record20 (Fig. 2). The wide geographic distribution, but close correspondence
in magnitude of all PETM δ11B-pH records (Pacific, S. Atlantic and N. Atlantic) gives us
confidence that a global surface pH excursion signal is captured at DSDP Site 401. The fact
that ocean surface pH responds relatively uniformly in models14 supports the evidence from
multiple δ11B records (Fig. 2) that a single open ocean site can be representative of the
global trend (see Methods).
To reconstruct PETM carbon release and its average isotopic composition, we devised a
novel data assimilation methodology. We build on previous work7 in which a single δ13C
record was assimilated (‘inverted’) to constrain the time-varying addition of carbon, but here
exploit a more direct indicator of carbon addition – ocean surface pH (Fig. 2). This allows
our δ13C record to simultaneously provide a second, independent constraint on the isotopic
composition of the carbon emissions in a transient, 500 kyr duration assimilation of both
records (see Methods). We explored a wide range of different model parameterizations and
proxy assumptions (Extended Data Table 1a) but focus here on the results of the data
assimilation of the smoothed record.
With our preferred age model (‘R07sm’, Extended Data Table 1a) we diagnose a cumulative
PETM carbon release reaching ~10,200 PgC with almost all emissions occurring in the first
50 kyr (Fig. 3d). This estimate is largely independent of the choice of age model (Extended
Data Table 1), which primarily affects the cumulative carbon emissions associated with the
onset interval itself (defined as: from the first trace of the δ13C decline in our records up to
peak CIE values) rather than with total emissions associated with the event as a whole. We
demonstrate this in idealized model experiments (Extended Data Fig. 5 and Extended Data
Table 1b) in which we find total carbon emissions over 50 kyr essentially independent of the
assumed duration of the onset interval, and varying by only ±20% at the 20 kyr horizon
(Extended Data Fig. 5 and Extended Data Table 1b). Thus, it is the extended duration of low
pH across the PETM as a whole and the existence of the so-called carbon isotope ‘plateau’2,
Gutjahr et al. Page 3
Nature. Author manuscript; available in PMC 2018 February 28.
Europe PM
C Funders A
uthor Manuscripts
Europe PM
C Funders A
uthor Manuscripts

rather than the duration of the onset interval alone, that lead to our diagnosis of total PETM
emissions on the order of 10,000 PgC. Uncertainty in the duration of low pH equates to
~100 PgC kyr-1 at the 50 kyr horizon (Extended Data Fig. 5), consistent with the ~12,000
PgC total emissions deduced for our alternative age model with an extended duration of low
pH (Extended Data Fig. 3c).
In response to carbon emissions, atmospheric pCO2 in the model increases from ~866 to a
peak PETM value of 2176 +1904/-669 μatm, consistent with independent atmospheric pCO2
constraints based on variable terrestrial and marine δ13C gradients over the PETM22. The
corresponding projected annual mean sea surface temperature (SST) increase is 3.6°C –
close to the observation-based global mean warming estimate of 4-5°C2. Also in response to
carbon emissions (and surface ocean pH suppression), there is a shoaling of the carbonate
compensation depth (CCD) in the model – the depth horizon below which calcium carbonate
(CaCO3) is not preserved23 (Extended Data Fig. 7). In previous global carbon cycle model
analyses of the PETM, the CCD has been used as a data constraint, with the conclusion that
carbon emissions on the order of 10,000 PgC are too high8. In contrast, here, the relatively
long (>50 kyr) duration of low ocean pH conditions (Fig. 3) in conjunction with weathering
feedbacks, leads to a partial decoupling of pH and ocean carbonate saturation24, hence a
relatively muted response of the CCD despite the large emissions (Extended Data Fig. 7 and
Methods).
Diagnosed carbon emission rates peak at 0.58 PgC yr-1 (Fig. 3c; Extended Data Table 1a),
although we assign rather less confidence to these, because their value is sensitive to the
duration of the onset of the PETM and hence the specific age model (Extended Data Table
1a). To put this in perspective, for carbon input rates to approach those of current fossil fuel
emissions (~10 PgC yr-1 17), the PETM onset would have to occur within 200-500 yr – a
duration not supported by any independent age model7,16,24,25. The much lower than
modern carbon emissions rate we diagnose here then implies reduced PETM ocean
acidification impacts (especially in carbonate saturation) compared to the future6,15.
However, we cannot rule out multiple, short-lived pulses of carbon release >0.58 PgC yr-1
having occurred throughout an extended (e.g. 20 kyr) onset24.
In addition to the emissions diagnosed by matching the pH decline, using the δ13C data as
an independent constraint leads us to deduce a flux-weighted mean δ13C of released carbon
of -11‰ (Fig. 3f, n). However, the smoothed δ13C record (-2.6‰ excursion) on which we
focus, very likely underestimates the isotopic magnitude of the event. For instance, if the
‘true’ PETM CIE was as large as -4.0‰7,24 and we simply proportionally scale δ13Cinput,
diagnosed on the basis of a -2.6‰ excursion, we obtain a more depleted mean source of
-17‰. Uncertainty in our ocean pH reconstruction also affects the diagnosed carbon source
composition. Our minimum pH decrease of 0.18 pH units requires only 5,700 PgC, with a
mean δ13Cinput of -19‰. However, the comparatively muted surface warming seen in this
‘minimal pH change’ model experiment (2.25°C, Extended Data Table 1a – experiment
‘R07am_HI’) is difficult to reconcile with an observed warming of 4-5°C2. Conversely, the
upper end of our measured pH increase would require emission of considerably more carbon
(19,960 PgC) with a correspondingly heavier carbon isotopic composition of -6.6‰
(Extended Data Table 1a).
Gutjahr et al. Page 4
Nature. Author manuscript; available in PMC 2018 February 28.
Europe PM
C Funders A
uthor Manuscripts
Europe PM
C Funders A
uthor Manuscripts

Our diagnosed carbon input over the event likely reflects a combination of carbon source(s)
– for instance, a mean of -11‰ could reflect a 75% contribution of mantle-derived carbon
(δ13Csource ~-6‰) plus 25% from permafrost (~-26‰), or 90% mantle-derived plus 10%
methane hydrates (~-60‰). In such scenarios, volcanism triggered the PETM, and thawing
permafrost in Antarctica4 or destabilization of methane hydrates provided amplifying
feedback. Assuming a -4‰ magnitude excursion and mean δ13Cinput of -17‰ still requires a
substantial CO2 contribution from volcanism10, but would allow for the possibility of a
greater role for organic carbon feedbacks – almost 60% for organic matter or ~20% for
methane hydrates.
To date, the PETM has predominantly been viewed as an event dominated by feedbacks
between climate and reservoirs of carbon3. Yet, there is abundant evidence of an intimate
link in time with the opening of the North Atlantic11, with volcanism and ash deposition
occurring from immediately prior to PETM onset, as also recorded by declining 187Os/188Os
in sediments19. Radiometric dating places the PETM coincident with a ~1 Myr interval of
massive flood basalt volcanism11 and the emplacement of magmatic sills26, both of which
represent large carbon sources. Degassing CO2 from magma yields an estimated 3,600-6,000
gC m-3 27 and combining this with the estimated volume of the NAIP as a whole (5×10⁶
km3 to 10×106 km3 11,27), equates to a potential carbon source of 18,000-60,000 PgC. The
interaction of magmatism with organic rich sediments could enhance carbon release via
thermogenic methane production10,11, which is estimated to range from 3,000-6,000 PgC28
to as high as 15,000 PgC10. Available carbon reservoirs are thus more than sufficient to
provide the 10,200-12,200 PgC required by our data assimilation and we further note that an
all-volcanic carbon driver scenario for the PETM is possible if thermogenic methane10,11
provided the isotopically lighter end-member. On the other hand, NAIP magmatic activity
took place over several million years10,11 and how carbon emissions were distributed with
time over this interval is currently unknown. Dating, biostratigraphy, and seismic constraints
do however: (1) place an interval of volcanism in East Greenland11 and sill emplacement in
the Vøring Basin (offshore Norway)26, both coeval with PETM onset, (2) identify 100s of
degassing structures consistent with thermogenic carbon release as forming close to the P-E
boundary10 and with one structure constrained to have been active during the body of the
PETM itself9. Release of a disproportionate amount of NAIP carbon associated with the
PETM is hence consistent with available geological evidence as well as our data-inferred
carbon source and total release. More work dating further specific volcanic episodes and
refining carbon reservoir estimates is however clearly needed.
Our paired δ11B-δ13C data also provide insights into climate system recovery from PETM
warming. Once carbon emissions ceased (ca. ~55 kyr after PETM initiation – Fig. 3c),
elevated global temperatures (Fig. 3a) and enhanced rates of silicate weathering (Fig. 3c) in
cGENIE (see Methods) drive a trend of increasing ocean surface pH that closely follows the
observed surface ocean pH recovery (Fig. 3b). However, we find a model-data misfit of up to
~1‰ in δ13C during the recovery phase (Fig. 3e). We therefore performed an additional set
of experiments in which, after peak CIE, organic carbon (Corg) is removed from the ocean
surface29 and assumed buried whenever modelled mean ocean surface δ13C registered lower
values than the observed trend (see Methods). These final experiments provide close
agreement with the recovery trend in the δ13C data (Fig. 3m), with cumulative Corg burial
Gutjahr et al. Page 5
Nature. Author manuscript; available in PMC 2018 February 28.
Europe PM
C Funders A
uthor Manuscripts
Europe PM
C Funders A
uthor Manuscripts

(Fig. 3l, blue bars) of 2,500 PgC (at an average modelled marine value of -30.5‰), in
agreement with other estimates (~2,000 PgC)12 of the role of enhanced organic matter
burial in PETM recovery29 as well as the ensuing reduction in deep-sea oxygenation30.
These findings collectively lead us to a view of the PETM as having been on the smaller end
of a spectrum of severe perturbations of climate and carbon cycling during the Cretaceous
and Jurassic (Ocean Anoxic Events – OAEs30,31), despite it having been by far the largest
end-member in a series of Paleocene-Eocene ‘hyperthermal’ events32. Our pH
reconstruction, in conjunction with the observed δ13C decline, constrains the dominant
carbon source during the PETM onset to have had a comparatively heavy carbon isotope
ratio, strongly implicating volcanism as having been dominant in triggering and driving the
event. Our inferred mean δ13C source of -11 to -17‰ is consistent with the isotopically
relatively heavy source (ca. -15‰33) inferred for the end-Permian event, suggesting
mechanistic similarities between the two events27. The implied important role for organic
carbon deposition in the recovery from peak warming12 represents another diagnostic
feature of OAEs31 (and end-Permian). Further quantifying and understanding the precise
role of feedbacks – both those amplifying initial CO2 release, and those aiding recovery
from global warming – is arguably where the PETM is of greatest value in helping reduce
uncertainties surrounding the response of the global carbon cycle and climate system to
perturbation.
Methods
Site and sample selection
The open northeast Atlantic DSDP Site 401 (47° 25.65’ N, 08° 48.62’ W, 2495 m) was
selected for this study. Its depth during the PETM was approximately 2000 m34. Around 2
mg of the 250-300 μm size fraction of mixed-layer dweller Morozovella subbotinae were
picked for the carbon, oxygen and boron isotopic analyses. Furthermore, over the studied
interval, very high-resolution δ18O and δ13C analyses of bulk carbonate were conducted to
establish a revised age model for Site 401. Planktic foraminifera are extremely well
preserved at Site 40135, free from infilling and, particularly from the onset of the CIE
upwards, are semi-glassy in appearance36.
Sample treatment
Using a binocular microscope, picked foraminifera were cracked open under glass plates, the
sample then homogenised, before splitting into a fraction for stable isotope (δ18O and δ13C)
analysis and another for the boron isotopic and elemental analyses (with a ratio of ca.
10:90). Purification and measurement of the boron fraction followed established
protocols37,38. Samples were thoroughly cleaned to remove any adhering clays and samples
were oxidatively cleaned using buffered peroxide in a warm water bath closely following39.
Boron isotopic and elemental analyses were carried out on a Thermo Scientific Neptune
MC-ICPMS and Element XR ICPMS, respectively, at the University of Southampton.
Sample purification and handling was done in low-boron clean labs at the University of
Southampton. The average boron total procedural blank was on the order of 30 to 50 pg
(n>10) and is hence negligible given our typical sample size (~5 to 15 ng of B). Boron
Gutjahr et al. Page 6
Nature. Author manuscript; available in PMC 2018 February 28.
Europe PM
C Funders A
uthor Manuscripts
Europe PM
C Funders A
uthor Manuscripts

isotopic uncertainties are reported at the 2 sigma level calculated using repeats of in-house
carbonate standards40. Boron isotopic and elemental aliquots were measured using
additional ammonia gas for better sample washout between samples and strictly monitored
during every analytical session37. Prior to analysis for boron isotopic composition, samples
were screened for chemical consistency by checking various elemental ratios (B/Ca, Mg/Ca,
Al/Ca etc.) (Extended Data Fig. 1). While few samples had elevated Al/Ca (up to ~ 3400
μmol/mol) this feature did not translate into altered δ11B (Extended Data Fig. 1).
Carbon and oxygen isotope aliquots were measured on a Thermo Finnigan MAT252 stable
isotope mass spectrometer at the GEOMAR Helmholtz Centre for Ocean Research Kiel,
Germany. Additionally, some foraminifera-based δ18O and δ13C analyses as well as all bulk
carbonate stable isotope measurements were carried out at the MARUM Bremen, Germany
on a Finnigan 251 gas isotope ratio mass spectrometer, coupled to a Kiel I automated
carbonate preparation device. All produced isotope records are shown in Extended Data Fig.
2 plotted against depth in core. The carbon isotope excursion seen in our record is 3.4‰,
significantly expanded relative to the benthic carbon isotope excursion presented by Nunes
and Norris41 that only reported an excursion on the order of 1.8‰. This discrepancy arises
from the lower resolution data this earlier study41 and the fact that samples were not taken
through the core interval of the CIE at Site 401 (202.55 to 202.41 mcd) in this earlier study.
We note that Bornemann et al.35 reproduced a very similar magnitude of change in δ13C to
us; their δ13C data obtained from the same species (Morozovella subbotina) registered a
shift from 4.87‰ at 202.58 mcd to 1.47‰ at 202.46 mcd (an identical excursion magnitude
of 3.4‰). The core containing the PETM (core 401-14) shows some rotary-drilling induced
core deformation across the CIE. Such deformation commonly occurs across abrupt changes
in lithology, but there is no obvious coring gap35.
Effect of δ11B-pH calibration used on resulting pH excursion
Using the appropriate δ11B-pH calibration in order to convert calcite δ11B into ambient
seawater pH is essential for any paleo-pH reconstruction. For late Neogene studies using
extant foraminifer species, the species used are typically calibrated for their δ11Bcalcite to pH
dependency using culture or field studies42,43 in order to assess the magnitude of δ11B-vital
effects that relate to foraminiferal physiology44–46. However, the species used here is
extinct, making such calibrations impossible.
In order to bracket the likely magnitude of vital effects, and following ref. 21, we present
two calibrations, one using the δ11B to pH relationship of aqueous borate47 and the other
using the T. sacculifer calibration43. While the aqueous borate calibration is used for pH
trends shown in Figs. 2 and 3, Extended Data Fig. 3a also present the alternative outcome.
As noted previously20,46, when pre-PETM pH is fixed (as is the case here), the choice of
δ11B-pH calibration has little impact on the reconstructed pH curve. We note that the
aqueous borate ion calibration is more conservative and is our preferred option. This is for
the following reasons: (i) not all modern species show a reduced sensitivity to pH relative to
aqueous borate48; (ii) previous studies have argued for a reduced magnitude of δ11B vital
effects in Eocene foraminifera.
Gutjahr et al. Page 7
Nature. Author manuscript; available in PMC 2018 February 28.
Europe PM
C Funders A
uthor Manuscripts
Europe PM
C Funders A
uthor Manuscripts

δ18O and Mg/Ca-based temperature reconstructions
M. subbotinae inhabited the surface ocean mixed layer and the temperatures used for
determining pK*B (see Extended Data Fig. 8) were determined using the δ18Ocalcite to
temperature relationship of inorganic carbonates49 and a local NW Atlantic seawater
δ18OSMOW of 0.014‰50. Mg/Ca based temperatures shown in Extended Data Fig. 8 were
calculated using deep time foraminiferal Mg/Ca paleothermometry51 using identical
parameters as Dunkley-Jones et al.2.
Determination of δ11Bsw
Boron in seawater has a residence time of between ~11 to 20 Ma52,53 and to date the
δ11Bsw is not well constrained for the PETM. In order to create a self-consistent model-data
setup we therefore used the output of GENIE ESM in the pre-CIE configuration which for
the open NE Atlantic provides a pH of 7.756. Using this pH information and employing the
generic borate ion calibration47 for the pH-dependent incorporation of boron into the
studied foraminifera Morozovella subbotinae resulted in a δ11Bsw of 38.94 ± 0.41‰. The
uncertainty in deriving this bulk seawater δ11B is based on 10,000 realizations of a borate
ion to pH conversion using the commonly used experimentally derived boron fractionation
factor47, varying the given δ11B randomly within its 2 sigma measurement uncertainty, and
also varying salinity by ±1.5 psu and temperature by ±1.5°C. Utilising the T. sacculifer δ11B-pH calibration43, but following the same approach, gives a δ11Bsw = 37.6 ± 0.5‰.
Chronology for Site 401
A new and detailed age model was established for Site 401 by aligning our new ultra-high
resolution (1 cm-spacing) bulk carbonate δ18O and δ13C records with equivalent bulk
carbonate isotope records from Site 690 using the ‘Analyseries’ software54. Most
stratigraphic correlation tie points (vertical lines in Extended Data Fig. 4) were made using
the δ18O records, which gave excellent agreement between the sites. The bulk δ18O record
from Site 401 shows high structural similarity to the δ18O of the mixed layer-dwelling
planktic foraminifer M. subbotinae from this same site (Extended Data Fig. 2), and also to
the δ18O of thermocline-dwelling S. patagonica35, suggesting that bulk sediment δ18O at
Site 401 provides a reliable record of the basic trends in upper ocean warming and cooling
across the PETM. A dominant control by temperature on the bulk δ18O signal makes sense,
given the scale of global surface ocean warming across the PETM2 (4-5°C). The fidelity of
the bulk δ13C record from Site 401 is supported by the fact that it shows high structural
similarity to the δ13C of mixed layer-dwelling M. subbotinae (Extended Data Fig. 2), and
also to the δ13C of thermocline-dwelling S. patagonica35. It is also consistent with bulk
δ13C from another nearby location (the Forada section in northern Italy) that also shows an
unusually early recovery to higher δ13C following the initial excursion to lowest δ13C at the
PETM’s onset55. The Forada section is considered to be complete, because the CIE interval
covers the maximum number of precession cycles25. Site 690 currently has two detailed age
models. By detailed correlations to Site 401, we were thus able to transpose both the
astronomically calibrated chronology25,56 and an extra-terrestrial He-based chronology57
onto Site 401. Extended Data Figs. 3b and c compares our pH record from Site 401 on both
chronologies. These uncertainties relating to choice of age model, and their impact on the
Gutjahr et al. Page 8
Nature. Author manuscript; available in PMC 2018 February 28.
Europe PM
C Funders A
uthor Manuscripts
Europe PM
C Funders A
uthor Manuscripts

calculated duration of the onset phase, have been evaluated via modelling sensitivity
experiments (Extended Data Fig. 5) and have no impact on our main findings as discussed in
the main text.
A very different timescale for PETM carbon release during the CIE was suggested in an
earlier study, arguing for an onset of the PETM CIE within only 13 years58. The proposal of
a CIE onset within such a short timescale has proven controversial59–63. In particular,
geochemical modelling constraints59 as well as drilling disturbance of the core creating the
impression of annual layering have together cast significant doubt on the suggested very
rapid (~13 year) CIE onset. Indeed, Further Earth system model based analysis of the carbon
and oxygen isotope records, leads to an estimate of 4 kyr or longer for PETM onset64.
Given previously presented age constraints for the duration of the PETM CIE based on
cyclostratigraphy25 and a 3He-based age model from ODP Site 69057 in addition to
absolute and cyclostratigraphic age constraints from Spitsbergen16, we regard an age model
that leads to a multi-millennia-scale CIE onset as more plausible. However, as analysed
(Extended Data Fig. 5) and discussed earlier, assumptions regarding the duration of PETM
onset interval itself are not critical to our conclusions.
Earth system modelling – configuration and data inversion methodology
(c)GENIE is an Earth system model of ‘intermediate complexity’65 comprising: a 3-D
dynamic ocean circulation model with simplified energy-moisture balance atmosphere66, a
representation of the biogeochemical cycling of a variety of elements and isotopes in the
ocean67 including 13C (see ref. 68 for a summary), plus representations of the preservation
and burial of biogenic carbonates in accumulating marine sediments of the open ocean68,
and terrestrial weathering69,70. We utilize the cGENIE Earth system model in the same
early Eocene configuration as recently employed24,64 but with terrestrial weathering
feedback enabled.
We introduce three separate model innovations here. The first builds on previous work7,71
‘inverting’ an observed δ13C record to recover the underlying time-history of carbon release.
In this, cGENIE adjusts mean atmospheric or surface ocean δ13C to match a (proxy data)
target at each model time-step (~1 week). If the current mean model value lies above the
data value (observed data is automatically linearly interpolated to the model time-step), a
pulse of carbon is released to the atmosphere (or ocean). If the model lies below the data
value, depending on the experimental setup, carbon is either removed from the atmosphere,
or nothing is done (cf. Fig. 3). The magnitude of the carbon pulse emitted at each time-step
is prescribed and chosen such that the fastest observed change in δ13C can be closely
tracked, but without creating excessive overshoots in modelled δ13C. Here, we allow a
maximum rate of carbon emissions to the atmosphere of 10 PgC yr-1 and hence a magnitude
of an individual pulse of ~0.21 PgC, corresponding to an instantaneous increase in
atmospheric pCO2 of about 0.1 ppm.
We diverge from an earlier approach7,71 in that rather than utilizing a record of δ13C as our
model target to assimilate, we instead employ our Site 401 reconstructed surface ocean pH
record. The methodology is inherently the same, but rather than comparing mean model and
observed δ13C each time-step, we contrast (model and data) pH, diagnosing the required
Gutjahr et al. Page 9
Nature. Author manuscript; available in PMC 2018 February 28.
Europe PM
C Funders A
uthor Manuscripts
Europe PM
C Funders A
uthor Manuscripts
carbon flux to the atmosphere in order that surface pH in the model tracks the data. The
model-data comparison is done on the basis of a mean global surface ocean pH value
calculated in cGENIE because utilizing a single (Site 401) surface ocean grid point in
cGENIE creates artefacts in the diagnosed carbon emissions because there is seasonality in
pH in the model but not in the data. We justify the assumption that proxy reconstructed
surface ocean pH at Site 401 can be representative of the global mean, firstly on the basis of
the relatively close degree of correspondence (visually) between the globally distributed pH
records available, as show in Fig. 2. Secondly, ocean surface pH, both today and during the
Paleocene–Eocene, is relatively uniform in the model (and supported by observations and
proxies, respectively), with maximum surface gradients between upwelling regions and sub-
polar regions of no more than 0.1 pH units for modern, and considerably less than this in the
late Paleogene (likely primarily due to the non-linear nature of the pH scale) (Extended Data
Fig. 6). Furthermore, these muted patterns are retained largely unaltered in response to CO2
emissions. For instance, when we calculate the annual mean surface ocean pH anomaly at
different times across the PETM (experiment ID ‘R07sm_Corg’) as compared to the pre-
PETM pattern, we find a generally uniform (to within ±0.02 pH units) pattern in pH change
(Extended Data Fig. 6). If we contrast the evolution of global and annual mean surface ocean
pH across the PETM (‘R07sm_Corg’) with the annual mean surface pH at the location of
Site 401 for the time points available (Extended Data Fig. 6, top), we also find Site 401 pH
is globally representative (and vice versa). All this goes to illustrate that there is unlikely to
be any substantive artefact in our assumption of treating our pH record at Site 401 as a
surrogate for the global mean in the model inversion experiment. Finally, and for
comparison, a similar analysis for the modern ocean under a future ocean acidification
scenario (here, chosen to follow RCP6.072) is shown in Extended Data Fig. 6 and
demonstrates a comparably spatially uniform pattern of pH change.
The second innovation involves the determination of the δ13C of the carbon emitted to the
atmosphere. Previously7,71, the δ13C of the carbon was treated as an unknown and a range
of different possible values (and hence carbon sources and reservoirs) tested in turn.
However, since observed pH constrains the magnitude of carbon emissions, we can now
simultaneously employ our observed δ13C record to determine the source of carbon. The
way in which the ‘double inversion’ methodology then works is that on each model time-
step, following the assessment of whether or not a pulse of carbon is emitted to the
atmosphere (based on the model-data pH difference), mean global model and observed Site
401 δ13C values are compared. If the current mean model surface ocean δ13C value lies
above the current data value, the carbon emitted is assigned a carbon isotopic value of
-100‰. If however, the mean model value lies below the data value, an isotopic value of 0‰
is assigned to the carbon values. By binning the emission fluxes in time and calculating a
flux-weighted average δ13C, as per in Fig. 3, intermediate (between -100 and 0‰) δ13C
values are achieved. We emphasize that we are not assuming a source that could be -100‰
per se – this choice of extremely depleted value simply gives the model greater flexibility in
tracking the trend in δ13C emissions – isotopically intermediate mean annual carbon
emissions arise by varying proportions of individual 0‰ and -100‰ carbon pulses. We
could have used any value just as long as it is as least as light as the lightest potential source
(e.g. -60‰).
Gutjahr et al. Page 10
Nature. Author manuscript; available in PMC 2018 February 28.
Europe PM
C Funders A
uthor Manuscripts
Europe PM
C Funders A
uthor Manuscripts

Finally, in the situation that the mean model surface ocean δ13C value becomes lower than
the observed Site 401 value, we also test the importance of marine organic carbon (Corg)
burial. This works identically to the negative emissions diagnosed in previous studies7,71
(when carbon is removed from the system to force δ13C more positive) but rather than
prescribing the δ13C value, we calculate it according to a simple phytoplankton organic
matter fractionation scheme67,73.
For all our experiments, we first spun up the model under late Paleocene boundary
conditions24,64, here choosing an open system run time of 200 kyr in order to fully bring
the long-term δ13C cycle into balance (and following on from an initially closed system
spin-up of 20 kyr used to established the basic climate and ocean circulation state). We then
carried out a range of experiments as summarized in Extended Data Table 1a. We tested
combinations (not all are reported here) of: (i) age model – orbital cyclostratigraphy (‘R07’)
vs. 3He-based age model (‘FE’), uncertainty in the pH reconstruction – mean vs. the 2.5%
and 97.5% confidence limits (‘LO’ and ‘HI’, respectively), whether or not the data is
smoothed (‘sm’) or raw (‘rw’), whether or not climate-dependent weathering feedback was
allowed, or weathering was fixed (‘noW’), and whether or not Corg burial was enabled to
recover δ13C to more positive (and data tracking) values (Corg when carbon burial was
enabled). These experiments were run for 500 kyr, with the exception of the carbon burial
Corg series of experiments (Extended Data Table 1a), which were run for an initial interval
of 72.6 kyr and up until the peak of the CIE with no organic carbon burial allowed, and then
a further 227.4 kyr with carbon burial allowed when needed (for a total of 300 kyr of
simulation). Model results are plotted relative to the observed data point defining PETM
onset.
Earth system modelling – additional sensitivity experiments and analysis
We also carried out a range of sensitivity experiments to explore the importance (or
otherwise) of the assumed duration of the CIE onset – in other words, whether there is a
strong age model dependence of diagnosed total carbon emissions. In this series of
experiments, the CIE onset phase was assumed to occur as a simultaneous linear decline in
both δ13C (by -3.5‰) and pH (by -0.3 pH units). We varied the duration of this decline from
100 to 20,000 yr. Once the minimum in δ13C and pH was reached, these values were held
constant up until the end of the experiment (a total of 50 kyr). The exact same double
inversion methodology was employed and starting from the same spin-up state as the main
experiments. The results of these sensitivity experiments are plotted in Extended Data Fig. 5
and summarised in Extended Data Table 1b.
Further details of the model and its paleo configuration, plus comprehensive discussion of
model uncertainties, can be found in the supplementary information file SI 1. Additional
assessments of the evolution of model-projected global mean as well as spatial patterns of
sedimentary wt% CaCO3 and sea-surface temperature are illustrated in Extended Data Figs.
7 and 8, respectively (and described in SI). Site-specific model-data comparisons are shown
in Extended Data Fig. 9 (and again discussed in full in SI 1).
Gutjahr et al. Page 11
Nature. Author manuscript; available in PMC 2018 February 28.
Europe PM
C Funders A
uthor Manuscripts
Europe PM
C Funders A
uthor Manuscripts

Earth system modelling – model code and supporting file availability
The source code of the cGENIE Earth system model used to generate the results presented in
this paper, together with specific experiment configuration, boundary conditions, and data-
forcing files, is available for download. A brief overview of and directions to: obtaining the
code and configuring the cGENIE Earth system model, basic usage of the cGENIE Earth
system model and required software, plus details of and how to execute and analyse the
published model experiments, is given here: http://www.seao2.info/cgenie/pubs/gutjahretal.
2017.txt Further specific details of e.g. using the provided plotting functions to process the
model results as per in the paper, configurations for the experiments presented in Extended
Data and/or described in the SI, or the raw model output, can be obtained directly from A.R.
Gutjahr et al. Page 12
Nature. Author manuscript; available in PMC 2018 February 28.
Europe PM
C Funders A
uthor Manuscripts
Europe PM
C Funders A
uthor Manuscripts

Extended Data
Extended Data Fig. 1. Elemental and stable isotope cross-plots for M. subbotinae measured in this study.
Gutjahr et al. Page 13
Nature. Author manuscript; available in PMC 2018 February 28.
Europe PM
C Funders A
uthor Manuscripts
Europe PM
C Funders A
uthor Manuscripts

Extended Data Fig. 2. Foraminifera- and bulk carbonate stable isotope data plotted against depth in core.Foraminifera-based stable isotope compositions were generated from identical samples after
splitting of δ13C / δ18O fraction from the δ11B fraction.
Gutjahr et al. Page 14
Nature. Author manuscript; available in PMC 2018 February 28.
Europe PM
C Funders A
uthor Manuscripts
Europe PM
C Funders A
uthor Manuscripts

Extended Data Fig. 3. Illustration of δ11B to pH conversion as well as age model differences.(a) Comparison of pH evolution at Site 401 over the PETM CIE using either the borate
ion47 (red) or alternatively the T. sacculifer43 (green) calibration. Age scale used is
following Röhl et al.25. (b) Direct comparison of our two age models, showing the
reconstructed pH evolution of Site 401 plotted using either the age model of Farley and
Eltgroth57 or our preferred age model of Röhl et al.25. (c) Expanded view of (b).
Gutjahr et al. Page 15
Nature. Author manuscript; available in PMC 2018 February 28.
Europe PM
C Funders A
uthor Manuscripts
Europe PM
C Funders A
uthor Manuscripts

Extended Data Fig. 4. Selection of age model tie points.Bulk carbonate δ13C and δ18O comparison between Site 401 and Site 690 presented in Röhl
et al.25. Vertical lines highlight age tie points used to derive the age model relative to the
PETM carbon isotope excursion (see methods for discussion).
Gutjahr et al. Page 16
Nature. Author manuscript; available in PMC 2018 February 28.
Europe PM
C Funders A
uthor Manuscripts
Europe PM
C Funders A
uthor Manuscripts

Extended Data Fig. 5. Key results of sensitivity experiments.Illustrating the influence of uncertainties in the CIE onset duration on diagnosed total carbon
release. In these idealized experiments, the CIE onset phase is assumed to occur linearly,
with a duration of the decline in δ13C (by 3.5‰) and pH (by 0.3 pH units) that varies from
100 to 20,000 yr, with the target pH and δ13C values thereafter held constant until the end of
the experiment (50,000 yr). The evolution with time of these target ocean surface variables is
shown in the uppermost panels (a), with pH on the left hand y-axis, and δ13C on the right
hand y-axis. The lower rows of panels show: (b) maximum emission rate per time interval,
Gutjahr et al. Page 17
Nature. Author manuscript; available in PMC 2018 February 28.
Europe PM
C Funders A
uthor Manuscripts
Europe PM
C Funders A
uthor Manuscripts

(c) cumulative carbon emission for respective onset phase in EgC (1 Eg = 1018 g) and (d)
average emitted δ13C per time interval.
Extended Data Fig. 6. Spatial and temporal evolution of mean annual surface ocean pH in cGENIE.Illustrated both across the PETM and for comparison, modern pH patterns projected from
preindustrial and into the future under RCP 6.072. Shown are: (a) Global and annual mean
surface ocean pH (black solid line) across the PETM from experiment ‘R07sm_Corg’ (our
central pH estimate, using the inorganic borate ion calibration and the RH07 age model, and
Gutjahr et al. Page 18
Nature. Author manuscript; available in PMC 2018 February 28.
Europe PM
C Funders A
uthor Manuscripts
Europe PM
C Funders A
uthor Manuscripts

including an assumption of organic carbon burial post peak PETM). Red circles represent
the annual mean pH values at the location of Site 401 in the model (see location in panel b)
taken at times in the model simulation that have a corresponding δ11B derived pH data
points (cf. Fig. 3b) (but note that we do not utilize all of the observed data points). (b) Model
projected spatial pattern of annual mean surface ocean pH at time zero (i.e. PETM onset).
(c-f) Model projected spatial pattern of the annual mean surface ocean pH anomaly
compared to time zero, for the highlighted time-points in (a) – 5.0, 31.6, 58.2, and 71.5 kyr
following onset. (g) Model projected spatial pattern of annual mean surface ocean pH in the
modern ocean under pre-industrial atmospheric CO2 (278 ppm). The model is configured as
per described in Cao et al.74 and driven with a CO2 emissions scenario calculated consistent
with RCP 6.0. (h-i) Model projected spatial pattern of the annual mean surface ocean pH
anomaly compared to 1765, at year 2010 and 2050. The scale is chosen to be the same as per
(c-f).
Gutjahr et al. Page 19
Nature. Author manuscript; available in PMC 2018 February 28.
Europe PM
C Funders A
uthor Manuscripts
Europe PM
C Funders A
uthor Manuscripts
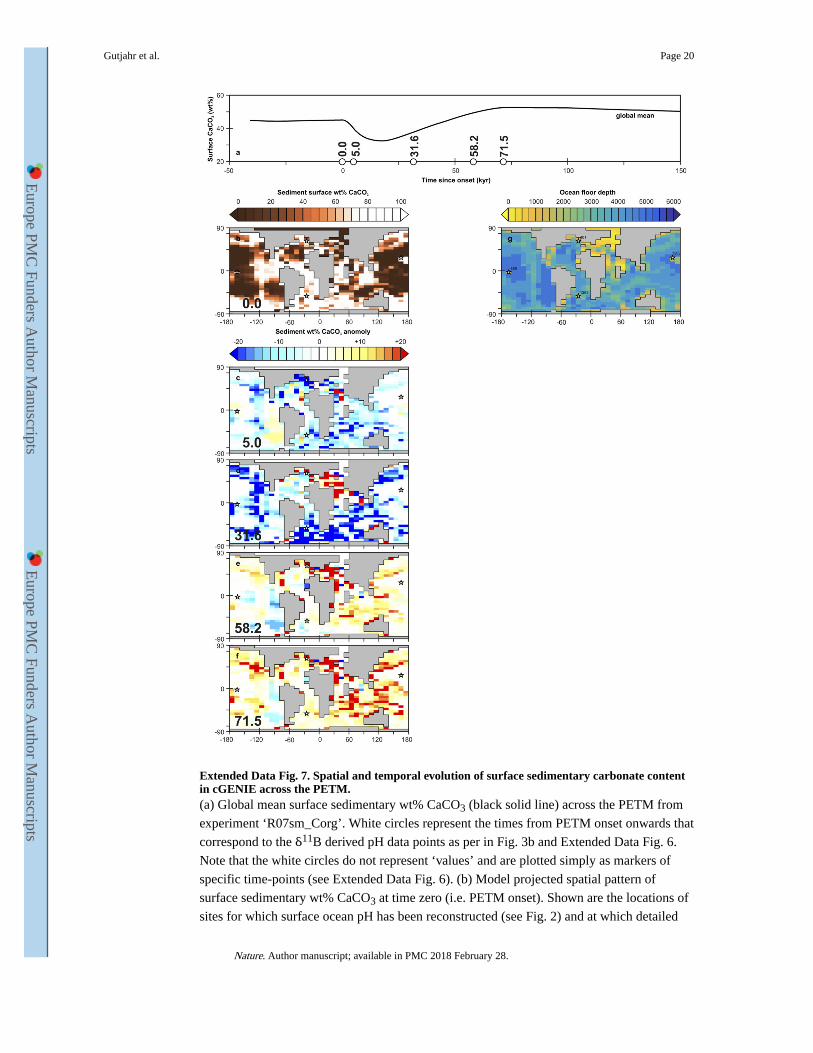
Extended Data Fig. 7. Spatial and temporal evolution of surface sedimentary carbonate content in cGENIE across the PETM.(a) Global mean surface sedimentary wt% CaCO3 (black solid line) across the PETM from
experiment ‘R07sm_Corg’. White circles represent the times from PETM onset onwards that
correspond to the δ11B derived pH data points as per in Fig. 3b and Extended Data Fig. 6.
Note that the white circles do not represent ‘values’ and are plotted simply as markers of
specific time-points (see Extended Data Fig. 6). (b) Model projected spatial pattern of
surface sedimentary wt% CaCO3 at time zero (i.e. PETM onset). Shown are the locations of
sites for which surface ocean pH has been reconstructed (see Fig. 2) and at which detailed
Gutjahr et al. Page 20
Nature. Author manuscript; available in PMC 2018 February 28.
Europe PM
C Funders A
uthor Manuscripts
Europe PM
C Funders A
uthor Manuscripts

down-core model-data comparison is carried out (Extended Data Fig. 9). (c-f) Model
projected spatial pattern of the surface sedimentary wt% CaCO3 anomaly compared to time
zero, for the highlighted time-points in (a) – 5.0, 31.6, 58.2, and 71.5 kyr following onset.
(g) For reference – the assumed seafloor bathymetry in the model (together with the
locations of the four data-rich sites focussed on in the SI analysis).
Extended Data Fig. 8. Spatial and temporal evolution of sea surface temperature in cGENIE across the PETM.
Gutjahr et al. Page 21
Nature. Author manuscript; available in PMC 2018 February 28.
Europe PM
C Funders A
uthor Manuscripts
Europe PM
C Funders A
uthor Manuscripts
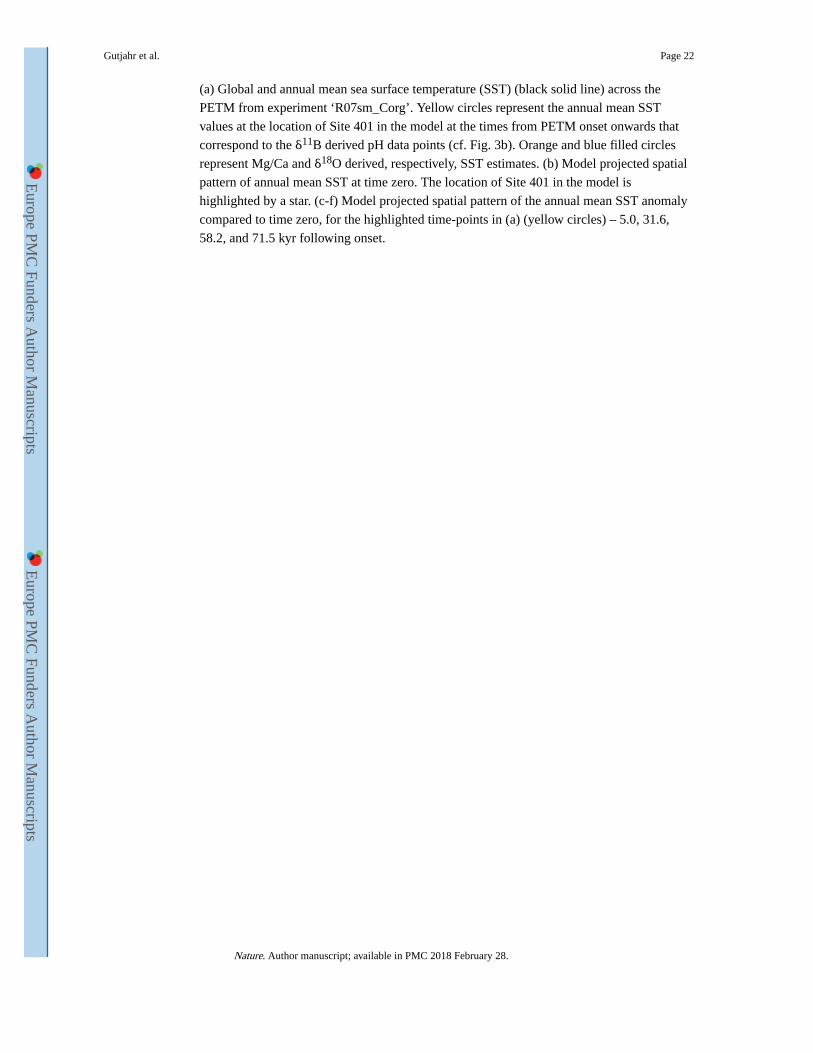
(a) Global and annual mean sea surface temperature (SST) (black solid line) across the
PETM from experiment ‘R07sm_Corg’. Yellow circles represent the annual mean SST
values at the location of Site 401 in the model at the times from PETM onset onwards that
correspond to the δ11B derived pH data points (cf. Fig. 3b). Orange and blue filled circles
represent Mg/Ca and δ18O derived, respectively, SST estimates. (b) Model projected spatial
pattern of annual mean SST at time zero. The location of Site 401 in the model is
highlighted by a star. (c-f) Model projected spatial pattern of the annual mean SST anomaly
compared to time zero, for the highlighted time-points in (a) (yellow circles) – 5.0, 31.6,
58.2, and 71.5 kyr following onset.
Gutjahr et al. Page 22
Nature. Author manuscript; available in PMC 2018 February 28.
Europe PM
C Funders A
uthor Manuscripts
Europe PM
C Funders A
uthor Manuscripts

Extended Data Fig. 9. Down-core model-data evaluation at four data-rich sites.Shown are comparisons for four ocean drilling sites for which surface ocean pH has been
reconstructed across the PETM (Fig. 2) – 401, 865, 1209, and 1263 (this study and ref. 20).
Their paleo locations in the cGENIE Earth system model are shown to the side (panel q).
Model-data comparisons are made for: (i) wt% CaCO3 (far LH panel for each site), (ii) δ13C
of bulk carbonate (second-from-left series of panels), and (iii) surface ocean pH (third-from-
left series of panels). To provide an orientation in time with regard to the evolution across
the PETM event, the farthest-right series of panels shows the projected evolution of
Gutjahr et al. Page 23
Nature. Author manuscript; available in PMC 2018 February 28.
Europe PM
C Funders A
uthor Manuscripts
Europe PM
C Funders A
uthor Manuscripts

atmospheric δ13C of CO2 in the model. For wt% CaCO3 and δ13C of bulk carbonate, model
points (resolved at 1 cm resolution) are plotted as filled yellow circles. Model-projected pH
(global and annual mean, as per shown in Fig. 3j and Extended Data Fig. 6a) and
atmospheric δ13C of CO2 are shown as continuous red lines. In all cases, observed data
values are shown as stars (*). The age models for Sites 865, 1209 and 1263 employing
original relative age model constraints20 used to convert from model-simulated sediment
depth (resolved at 1 cm intervals) at each location in the cGENIE Earth system model, are
calculated using a constant detrital flux accumulation rate. The observed data are plotting on
their respective site 690-derived age models25. Both model and data age scales are
synchronized to age zero at PETM onset (horizontal line). See SI for details.
Gutjahr et al. Page 24
Nature. Author manuscript; available in PMC 2018 February 28.
Europe PM
C Funders A
uthor Manuscripts
Europe PM
C Funders A
uthor Manuscripts

Ext
end
ed D
ata
Tab
le 1
Key
res
ults
fro
m in
divi
dual
mod
el r
uns.
(a)
Sum
mar
y of
the
mai
n do
uble
inve
rsio
n ex
peri
men
ts c
arri
ed o
ut. T
he te
rmin
olog
y “R
07”
refe
rs to
con
figu
ratio
ns ty
ing
the
Site
401
rec
ords
to th
e
chro
nost
ratig
raph
y of
ref
. 25,
the
nota
tion
“FE
” re
fers
to th
e 3 H
e-ba
sed
age
mod
el o
f re
f. 5
7). A
nnot
atio
n “s
m”
refe
rs to
inve
rsio
n of
ana
lytic
ally
smoo
thed
δ13
C a
nd p
H d
ata
sets
, “rw
” to
usa
ge o
f or
igin
al s
ampl
e da
ta f
or d
oubl
e in
vers
ions
. “H
I” a
nd “
LO
” re
pres
ent p
oten
tially
ext
rem
e co
nfig
urat
ions
taki
ng in
to a
ccou
nt th
e bo
ron
prox
y un
cert
aint
y at
95%
con
fide
nce
leve
l. “n
oW”
has
silic
ate
(and
car
bona
te)
wea
ther
ing
feed
back
s di
sabl
ed. “
Cor
g”
deno
te m
odel
con
figu
ratio
ns th
at a
llow
rem
oval
of
exce
ss o
rgan
ic c
arbo
n fr
om th
e su
rfac
e oc
ean.
Gre
y sh
adin
g hi
ghlig
hts
expe
rim
ents
foc
usse
d up
on in
the
mai
n te
xt a
nd p
lotte
d in
Fig
ure
3 (“
R07
sm”
in F
ig. 3
a-f
and
“R07
sm_C
org”
in 3
i-n.
). N
ote:
(1)
pea
k em
issi
ons
are
binn
ed a
t 2 k
yr r
esol
utio
n, (
2) b
oth
cum
ulat
ive
emis
sion
s an
d C
org
buri
al a
re m
easu
red
from
40
to 1
90 k
a m
odel
tim
e, a
nd (
3) p
eak
exce
ss w
eath
erin
g re
flec
ts c
arbo
n re
mov
al d
ue to
sili
cate
wea
ther
ing
abov
e pr
e-PE
TM
wea
ther
ing
rate
s. (
b) S
umm
ary
tabl
e pr
esen
ting
the
resu
lts o
f se
nsiti
vity
exp
erim
ents
(sh
own
in E
xten
ded
Dat
a Fi
g. 5
) to
quan
tify
the
impo
rtan
ce o
f un
cert
aint
ies
in th
e ag
e m
odel
for
the
CIE
ons
et. I
n th
ese
expe
rim
ents
, the
CIE
ons
et p
hase
is a
ssum
ed to
occ
ur li
near
ly, w
ith a
dura
tion
of th
e de
clin
e in
δ13
C a
nd p
H v
aryi
ng f
rom
100
to 2
0,00
0 yr
dur
atio
n. R
epor
ted
are:
(1)
dia
gnos
ed p
eak
carb
on e
mis
sion
s, (
2) c
umul
ativ
e ca
rbon
emis
sion
s oc
curr
ing
over
the
dura
tion
of th
e on
set,
and
mea
n (f
lux
wei
ghte
d) δ
13C
of
thes
e em
issi
ons,
(3)
cum
ulat
ive
carb
on e
mis
sion
s oc
curr
ing
at th
e
20 k
yr ti
me
hori
zon
– co
mpa
rabl
e to
the
onse
t dur
atio
n in
our
ass
umed
age
mod
el, p
lus
the
mea
n (f
lux
wei
ghte
d) δ
13C
of
thes
e em
issi
ons,
and
(4)
the
cum
ulat
ive
carb
on e
mis
sion
s oc
curr
ing
at th
e 20
kyr
hor
izon
, plu
s th
e m
ean
(flu
x w
eigh
ted)
δ13
C o
f th
ese
emis
sion
s. N
ote
that
in a
ll ex
peri
men
ts, o
nce
the
onse
t is
com
plet
e, th
e ta
rget
pH
and
δ13
C v
alue
s ar
e he
ld c
onst
ant (
and
low
) un
til th
e en
d of
the
expe
rim
ent (
50,0
00 y
r).
a Exp
erim
ent I
Dex
peri
men
tal a
ssum
ptio
nspe
ak e
mis
sion
scu
mul
ativ
e em
issi
ons
cum
ulat
ive
Cor
g bu
rial
ΔSS
Tpe
ak e
xces
s w
eath
erin
g
age
mod
elδ1
1 B e
nvel
ope
smoo
thed
dat
a?w
eath
erin
g?C
org
buri
al?
(PgC
yr-
1 )to
tal (
PgC
)m
ean δ1
3 C ‰
tota
l (P
gC)
mea
n δ1
3 C ‰
(°C
)(P
gC y
r-1 )
R07
sm_H
IR
07hi
ghY
ES
YE
SN
O0.
415,
688
-18.
9--
---
-2.
250.
030
R07
smR
07m
ean
YE
SY
ES
NO
0.58
10,2
13-1
1.1
---
---
3.64
0.05
3
R07
sm_L
OR
07lo
wY
ES
YE
SN
O1.
1619
,964
-6.6
---
---
5.99
0.10
5
FEsm
_HI
FEhi
ghY
ES
YE
SN
O0.
176,
502
-16.
5--
---
-2.
100.
038
FEsm
FEm
ean
YE
SY
ES
NO
0.36
12,0
20-9
.8--
---
-3.
090.
069
FEsm
_LO
FElo
wY
ES
YE
SN
O0.
6424
,124
-6.0
---
---
4.80
0.13
2
R07
rwR
07m
ean
NO
YE
SN
O0.
6110
,984
-12.
1--
---
-4.
070.
061
FErw
FEm
ean
NO
YE
SN
O0.
4512
,749
-10.
2--
---
-3.
140.
072
R07
sm_n
oWR
07m
ean
YE
SN
ON
O0.
526,
407
-16.
7--
---
-3.
34--
-
FEsm
_noW
FEm
ean
YE
SN
ON
O0.
306,
665
-16.
4--
---
-2.
72--
-
R07
sm_H
I_C
org
R07
high
YE
SY
ES
YE
S0.
417,
670
-18.
02,
607
-30.
02.
250.
030
R07
sm_C
org
R07
mea
nY
ES
YE
SY
ES
0.58
12,2
20-1
0.9
2,54
0-3
0.5
3.64
0.05
3
R07
sm_L
O_C
org
R07
low
YE
SY
ES
YE
S1.
1622
,593
-7.1
3,33
3-3
0.9
5.99
0.10
5
Gutjahr et al. Page 25
Nature. Author manuscript; available in PMC 2018 February 28.
Europe PM
C Funders A
uthor Manuscripts
Europe PM
C Funders A
uthor Manuscripts
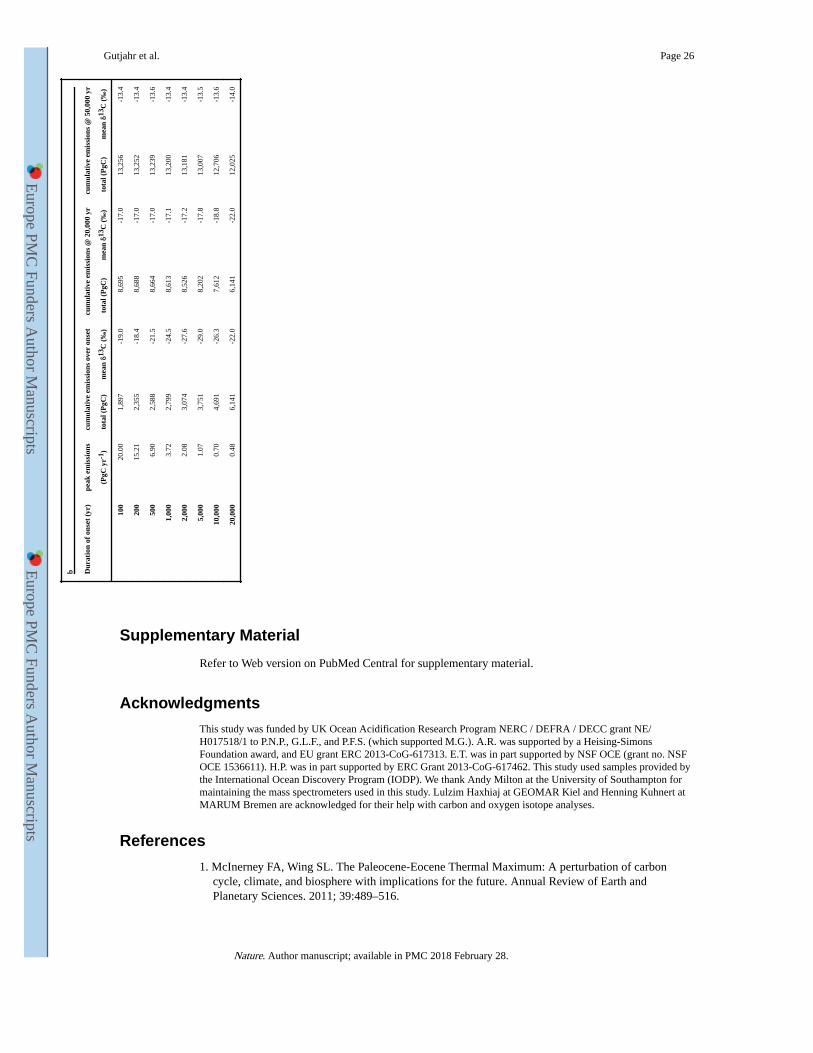
b Dur
atio
n of
ons
et (
yr)
peak
em
issi
ons
cum
ulat
ive
emis
sion
s ov
er o
nset
cum
ulat
ive
emis
sion
s @
20,
000
yrcu
mul
ativ
e em
issi
ons
@ 5
0,00
0 yr
(PgC
yr-
1 )to
tal (
PgC
)m
ean δ1
3 C (
‰)
tota
l (P
gC)
mea
n δ1
3 C (
‰)
tota
l (P
gC)
mea
n δ1
3 C (
‰)
100
20.0
01,
897
-19.
08,
695
-17.
013
,256
-13.
4
200
15.2
12,
355
-18.
48,
688
-17.
013
,252
-13.
4
500
6.90
2,58
8-2
1.5
8,66
4-1
7.0
13,2
39-1
3.6
1,00
03.
722,
799
-24.
58,
613
-17.
113
,200
-13.
4
2,00
02.
083,
074
-27.
68,
526
-17.
213
,181
-13.
4
5,00
01.
073,
751
-29.
08,
202
-17.
813
,007
-13.
5
10,0
000.
704,
691
-26.
37,
612
-18.
812
,706
-13.
6
20,0
000.
486,
141
-22.
06,
141
-22.
012
,025
-14.
0
Supplementary Material
Refer to Web version on PubMed Central for supplementary material.
Acknowledgments
This study was funded by UK Ocean Acidification Research Program NERC / DEFRA / DECC grant NE/H017518/1 to P.N.P., G.L.F., and P.F.S. (which supported M.G.). A.R. was supported by a Heising-Simons Foundation award, and EU grant ERC 2013-CoG-617313. E.T. was in part supported by NSF OCE (grant no. NSF OCE 1536611). H.P. was in part supported by ERC Grant 2013-CoG-617462. This study used samples provided by the International Ocean Discovery Program (IODP). We thank Andy Milton at the University of Southampton for maintaining the mass spectrometers used in this study. Lulzim Haxhiaj at GEOMAR Kiel and Henning Kuhnert at MARUM Bremen are acknowledged for their help with carbon and oxygen isotope analyses.
References
1. McInerney FA, Wing SL. The Paleocene-Eocene Thermal Maximum: A perturbation of carbon cycle, climate, and biosphere with implications for the future. Annual Review of Earth and Planetary Sciences. 2011; 39:489–516.
Gutjahr et al. Page 26
Nature. Author manuscript; available in PMC 2018 February 28.
Europe PM
C Funders A
uthor Manuscripts
Europe PM
C Funders A
uthor Manuscripts

2. Dunkley Jones T, et al. Climate model and proxy data constraints on ocean warming across the Paleocene-Eocene Thermal Maximum. Earth-Science Reviews. 2013; 125:123–145.
3. Dickens GR, O'Neil JR, Rea DK, Owen RM. Dissociation of oceanic methane hydrate as a cause of the carbon isotope excursion at the end of the Paleocene. Paleoceanography. 1995; 10:965–971.
4. DeConto RM, et al. Past extreme warming events linked to massive carbon release from thawing permafrost. Nature. 2012; 484:87–91. [PubMed: 22481362]
5. Higgins JA, Schrag DP. Beyond methane: Towards a theory for the Paleocene-Eocene Thermal Maximum. Earth and Planetary Science Letters. 2006; 245:523–537.
6. Ridgwell A, Schmidt DN. Past constraints on the vulnerability of marine calcifiers to massive carbon dioxide release. Nature Geoscience. 2010; 3:196–200.
7. Cui Y, et al. Slow release of fossil carbon during the Palaeocene-Eocene Thermal Maximum. Nature Geoscience. 2011; 4:481–485.
8. Zeebe RE, Zachos JC, Dickens GR. Carbon dioxide forcing alone insufficient to explain Palaeocene-Eocene Thermal Maximum warming. Nature Geoscience. 2009; 2:576–580.
9. Frieling J, et al. Thermogenic methane release as a cause for the long duration of the PETM. Proceedings of the National Academy of Sciences. 2016; 113:12059–12064.
10. Svensen H, et al. Release of methane from a volcanic basin as a mechanism for initial Eocene global warming. Nature. 2004; 429:542–545. [PubMed: 15175747]
11. Storey M, Duncan RA, Swisher CC. Paleocene-Eocene Thermal Maximum and the Opening of the Northeast Atlantic. Science. 2007; 316:587–589. [PubMed: 17463286]
12. Bowen GJ, Zachos JC. Rapid carbon sequestration at the termination of the Palaeocene-Eocene Thermal Maximum. Nature Geoscience. 2010; 3:866–869.
13. Rohling EJ, et al. Making sense of palaeoclimate sensitivity. Nature. 2012; 491:683–691. [PubMed: 23192145]
14. Gibbs SJ, et al. Ocean warming, not acidification, controlled coccolithophore response during past greenhouse climate change. Geology. 2016; 44:59–62.
15. Hönisch B, et al. The geological record of ocean acidification. Science. 2012; 335:1058–1063. [PubMed: 22383840]
16. Charles AJ, et al. Constraints on the numerical age of the Paleocene-Eocene boundary. Geochemistry Geophysics Geosystems. 2011; 12 Art. No. Q0AA17.
17. Le Quéré C, et al. Global Carbon Budget 2016. Earth Syst Sci Data. 2016; 8:605–649.
18. Schaller MF, Fung MK, Wright JD, Katz ME, Kent DV. Impact ejecta at the Paleocene-Eocene boundary. Science. 2016; 354:225. [PubMed: 27738171]
19. Wieczorek R, Fantle MS, Kump LR, Ravizza G. Geochemical evidence for volcanic activity prior to and enhanced terrestrial weathering during the Paleocene Eocene Thermal Maximum. Geochimica et Cosmochimica Acta. 2013; 119:391–410.
20. Penman DE, Hönisch B, Zeebe RE, Thomas E, Zachos JC. Rapid and sustained surface ocean acidification during the Paleocene-Eocene Thermal Maximum. Paleoceanography. 2014; 29:357–369.
21. Anagnostou E, et al. Changing atmospheric CO2 concentration was the primary driver of early Cenozoic climate. Nature. 2016; 533:380–384. [PubMed: 27111509]
22. Schubert BA, Jahren AH. Reconciliation of marine and terrestrial carbon isotope excursions based on changing atmospheric CO2 levels. Nature Communications. 2013; 4 Art. No. 1653.
23. Penman DE, et al. An abyssal carbonate compensation depth overshoot in the aftermath of the Palaeocene-Eocene Thermal Maximum. Nature Geoscience. 2016; 9:575–580.
24. Turner SK, Ridgwell A. Development of a novel empirical framework for interpreting geological carbon isotope excursions, with implications for the rate of carbon injection across the PETM. Earth and Planetary Science Letters. 2016; 435:1–13.
25. Röhl U, Westerhold T, Bralower TJ, Zachos JC. On the duration of the Paleocene-Eocene thermal maximum (PETM). Geochemistry Geophysics Geosystems. 2007; 8 Art. No. Q12002.
26. Svensen H, Planke S, Corfu F. Zircon dating ties NE Atlantic sill emplacement to initial Eocene global warming. Journal of the Geological Society. 2010; 167:433–436.
Gutjahr et al. Page 27
Nature. Author manuscript; available in PMC 2018 February 28.
Europe PM
C Funders A
uthor Manuscripts
Europe PM
C Funders A
uthor Manuscripts

27. Saunders AD. Two LIPs and two Earth-system crises: the impact of the North Atlantic Igneous Province and the Siberian Traps on the Earth-surface carbon cycle. Geological Magazine. 2016; 153:201–222.
28. Rampino MR. Peraluminous igneous rocks as an indicator of thermogenic methane release from the North Atlantic Volcanic Province at the time of the Paleocene–Eocene Thermal Maximum (PETM). Bulletin of Volcanology. 2013; 75:1–5.
29. Ma Z, et al. Carbon sequestration during the Palaeocene-Eocene Thermal Maximum by an efficient biological pump. Nature Geoscience. 2014; 7:382–388.
30. Dickson AJ, Cohen AS, Coe AL. Seawater oxygenation during the Paleocene-Eocene Thermal Maximum. Geology. 2012; 40:639–642.
31. Jenkyns HC. Cretaceous anoxic events - from continents to oceans. Journal of the Geological Society. 1980; 137:171–188.
32. Turner SK, Sexton PF, Charles CD, Norris RD. Persistence of carbon release events through the peak of early Eocene global warmth. Nature Geoscience. 2014; 7:748–751.
33. Payne JL, et al. Calcium isotope constraints on the end-Permian mass extinction. Proceedings of the National Academy of Sciences. 2010; 107:8543–8548.
34. Pardo A, Keller G, Molina E, Canudo JI. Planktic foraminiferal turnover across the Paleocene-Eocene transition at DSDP site 401, Bay of Biscay, North Atlantic. Marine Micropaleontology. 1997; 29:129–158.
35. Bornemann A, et al. Persistent environmental change after the Paleocene-Eocene Thermal Maximum in the eastern North Atlantic. Earth and Planetary Science Letters. 2014; 394:70–81.
36. Sexton PF, Wilson PA, Pearson PN. Microstructural and geochemical perspectives on planktic foraminiferal preservation: "Glassy" versus "Frosty". Geochemistry Geophysics Geosystems. 2006; 7 Art. No. Q12P19.
37. Foster GL. Seawater pH, pCO2 and [CO32-] variations in the Caribbean Sea over the last 130 kyr:
A boron isotope and B/Ca study of planktic forminifera. Earth and Planetary Science Letters. 2008; 271:254–266.
38. Foster GL, et al. Interlaboratory comparison of boron isotope analyses of boric acid, seawater and marine CaCO3 by MC-ICPMS and NTIMS. Chemical Geology. 2013; 358:1–14.
39. Barker S, Greaves M, Elderfield H. A study of cleaning procedures used for foraminiferal Mg/Ca paleothermometry. Geochemistry Geophysics Geosystems. 2003; 4 Art. No. 8407.
40. Henehan MJ, et al. Calibration of the boron isotope proxy in the planktonic foraminifera Globigerinoides ruber for use in palaeo-CO2 reconstruction. Earth and Planetary Science Letters. 2013; 364:111–122.
41. Nunes F, Norris RD. Abrupt reversal in ocean overturning during the Palaeocene/Eocene warm period. Nature. 2006; 439:60–63. [PubMed: 16397495]
42. Sanyal A, Bijma J, Spero H, Lea DW. Empirical relationship between pH and the boron isotopic composition of Globigerinoides sacculifer: Implications for the boron isotope paleo-pH proxy. Paleoceanography. 2001; 16:515–519.
43. Martinez-Boti MA, et al. Boron isotope evidence for oceanic carbon dioxide leakage during the last deglaciation. Nature. 2015; 518:219–222. [PubMed: 25673416]
44. Zeebe RE, Wolf-Gladrow DA, Bijma J, Hönisch B. Vital effects in foraminifera do not compromise the use of delta B-11 as a paleo-pH indicator: Evidence from modeling. Paleoceanography. 2003; 18 Art. No. 1043.
45. Hönisch B, et al. The influence of symbiont photosynthesis on the boron isotopic composition of foraminifera shells. Marine Micropaleontology. 2003; 49:87–96.
46. Foster GL, Rae JWB. Reconstructing ocean pH with boron isotopes in foraminifera. Annual Review of Earth and Planetary Sciences. 2016; 44:207–237.
47. Klochko K, Kaufman AJ, Yao WS, Byrne RH, Tossell JA. Experimental measurement of boron isotope fractionation in seawater. Earth and Planetary Science Letters. 2006; 248:276–285.
48. Henehan MJ, et al. A new boron isotope-pH calibration for Orbulina universa, with implications for understanding and accounting for ‘vital effects’. Earth and Planetary Science Letters. 2016; 454:282–292.
Gutjahr et al. Page 28
Nature. Author manuscript; available in PMC 2018 February 28.
Europe PM
C Funders A
uthor Manuscripts
Europe PM
C Funders A
uthor Manuscripts

49. Kim S-T, O'Neil JR. Equilibrium and nonequilibrium oxygen isotope effects in synthetic carbonates. Geochimica et Cosmochimica Acta. 1997; 61:3461–3475.
50. Tindall J, et al. Modelling the oxygen isotope distribution of ancient seawater using a coupled ocean-atmosphere GCM: Implications for reconstructing early Eocene climate. Earth and Planetary Science Letters. 2010; 292:265–273.
51. Evans D, Müller W. Deep time foraminifera Mg/Ca paleothermometry: Nonlinear correction for secular change in seawater Mg/Ca. Paleoceanography. 2012; 27 Art. No. PA4205.
52. Spivack AJ, Edmond JM. Boron isotope exchange between seawater and the oceanic crust. Geochimica et Cosmochimica Acta. 1987; 51:1033–1043.
53. Lemarchand D, Gaillardet J, Lewin E, Allegre CJ. Boron isotope systematics in large rivers: implications for the marine boron budget and paleo-pH reconstruction over the Cenozoic. Chemical Geology. 2002; 190:123–140.
54. Paillard D, Labeyrie L, Yiou P. Macintosh program performs time‐series analysis. Eos, Transactions American Geophysical Union. 1996; 77:379–379.
55. Giusberti L, et al. Mode and tempo of the Paleocene-Eocene thermal maximum in an expanded section from the Venetian pre-Alps. Geological Society of America Bulletin. 2007; 119:391–412.
56. Röhl U, Bralower TJ, Norris RD, Wefer G. New chronology for the late Paleocene thermal maximum and its environmental implications. Geology. 2000; 28:927–930.
57. Farley KA, Eltgroth SF. An alternative age model for the Paleocene-Eocene Thermal Maximum using extraterrestrial He-3. Earth and Planetary Science Letters. 2003; 208:135–148.
58. Wright JD, Schaller MF. Evidence for a rapid release of carbon at the Paleocene-Eocene thermal maximum. Proceedings of the National Academy of Sciences. 2013; 110:15908–15913.
59. Zeebe RE, Dickens GR, Ridgwell A, Sluijs A, Thomas E. Onset of carbon isotope excursion at the Paleocene-Eocene thermal maximum took millennia, not 13 years. Proceedings of the National Academy of Sciences. 2014; 111:E1062–E1063.
60. Pearson PN, Nicholas CJ. Layering in the Paleocene/Eocene boundary of the Millville core is drilling disturbance. Proceedings of the National Academy of Sciences. 2014; 111:E1064–E1065.
61. Stassen P, Speijer RP, Thomas E. Unsettled puzzle of the Marlboro clays. Proceedings of the National Academy of Sciences. 2014; 111:E1066–E1067.
62. Wright JD, Schaller MF. Reply to Pearson and Nicholas, Stassen et al., and Zeebe et al.: Teasing out the missing piece of the PETM puzzle. Proceedings of the National Academy of Sciences. 2014; 111:E1068–E1071.
63. Pearson PN, Thomas E. Drilling disturbance and constraints on the onset of the Paleocene–Eocene boundary carbon isotope excursion in New Jersey. Clim Past. 2015; 11:95–104.
64. Zeebe RE, Ridgwell A, Zachos JC. Anthropogenic carbon release rate unprecedented during the past 66 million years. Nature Geoscience. 2016; 9:325–329.
65. Brady PV. The effect of silicate weathering on global temperature and atmospheric CO2. Journal of Geophysical Research. 1991; 96:18101–18106.
66. Edwards NR, Marsh R. Uncertainties due to transport-parameter sensitivity in an efficient 3-D ocean-climate model. Clim Dyn. 2005; 24:415–433.
67. Ridgwell A, et al. Marine geochemical data assimilation in an efficient Earth System Model of global biogeochemical cycling. Biogeosciences. 2007; 4:87–104.
68. Ridgwell A, Hargreaves JC. Regulation of atmospheric CO2 by deep-sea sediments in an Earth system model. Glob Biogeochem Cycle. 2007; 21 Art. No. GB2008.
69. Colbourn G, Ridgwell A, Lenton TM. The time scale of the silicate weathering negative feedback on atmospheric CO2. Glob Biogeochem Cycle. 2015; 29:583–596.
70. Lord NS, Ridgwell A, Thorne MC, Lunt DJ. The ‘long tail’ of anthropogenic CO2 decline in the atmosphere and its consequences for post-closure performance assessments for disposal of radioactive wastes. Mineralogical Magazine. 2015; 79:1613–1623.
71. Cui Y, Kump LR. Global warming and the end-Permian extinction event: Proxy and modeling perspectives. Earth-Science Reviews. 2015; 149:5–22.
Gutjahr et al. Page 29
Nature. Author manuscript; available in PMC 2018 February 28.
Europe PM
C Funders A
uthor Manuscripts
Europe PM
C Funders A
uthor Manuscripts

72. Stocker, TF., et al., editors. IPCC. Climate Change 2013: The physical science basis. Contribution of working group I to the fifth assessment report of the intergovernmental panel on climate change. 2013. p. 1-1535.
73. Ridgwell, A. Glacial-interglacial perturbations in the global carbon cycle. PhD thesis; Univ. of East Anglia at Norwich, UK: 2001.
74. Cao L, et al. The role of ocean transport in the uptake of anthropogenic CO2. Biogeosciences. 2009; 6:375–390.
Gutjahr et al. Page 30
Nature. Author manuscript; available in PMC 2018 February 28.
Europe PM
C Funders A
uthor Manuscripts
Europe PM
C Funders A
uthor Manuscripts

Fig. 1. New DSDP Site 401 stable isotope data.Foraminifera (M. subbotinae) (a) and bulk carbonate δ13C (b), δ11B (c) and δ18O (d and e)
records plotted relative to the onset of the PETM carbon isotope excursion (CIE) from
DSDP Site 401 (47° 25.65’ N, 08° 48.62’ W, 2495 m) using our preferred age model (see
Methods).
Gutjahr et al. Page 31
Nature. Author manuscript; available in PMC 2018 February 28.
Europe PM
C Funders A
uthor Manuscripts
Europe PM
C Funders A
uthor Manuscripts
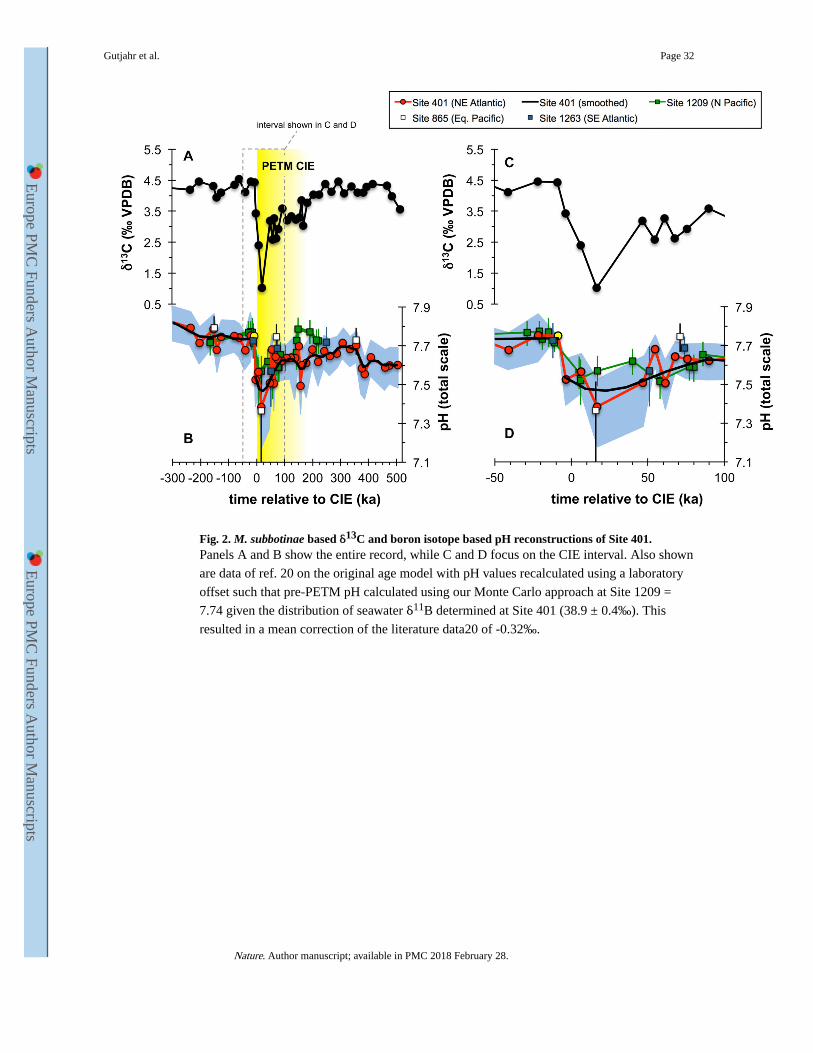
Fig. 2. M. subbotinae based δ13C and boron isotope based pH reconstructions of Site 401.Panels A and B show the entire record, while C and D focus on the CIE interval. Also shown
are data of ref. 20 on the original age model with pH values recalculated using a laboratory
offset such that pre-PETM pH calculated using our Monte Carlo approach at Site 1209 =
7.74 given the distribution of seawater δ11B determined at Site 401 (38.9 ± 0.4‰). This
resulted in a mean correction of the literature data20 of -0.32‰.
Gutjahr et al. Page 32
Nature. Author manuscript; available in PMC 2018 February 28.
Europe PM
C Funders A
uthor Manuscripts
Europe PM
C Funders A
uthor Manuscripts

Fig. 3. Results of Earth system model data assimilation.The right hand panels also account for organic carbon burial during PETM recovery. (a,i)
Atmospheric pCO2 (red, LH axis) and mean global SST (blue, RH axis). (b,j) Modelled
mean global ocean surface pH (observed smoothed surface ocean pH data as yellow
symbols). (c,k) Model diagnosed rates of CO2 release (red) and excess CO2 consumption
due to silicate weathering (green) from PETM onset onwards. (d,l) Cumulative CO2 release
(red) and organic carbon burial (blue). (e,m) Modelled mean global ocean surface δ13C
(observations as yellow symbols). (f,n) Model diagnosed δ13C of the CO2 release (red) and
Gutjahr et al. Page 33
Nature. Author manuscript; available in PMC 2018 February 28.
Europe PM
C Funders A
uthor Manuscripts
Europe PM
C Funders A
uthor Manuscripts

isotopic composition of buried carbon (blue). Shaded bands (a,b,e,i,j,m) and empty bars
(c,d,f,k,l,n) reflect 95% uncertainty limits. Bars reflect 2 kyr averaging (c,f,k,n) or
integration (d,l) bins. All model results and related data are plotted from -50 to +150 kyr
relative to the onset of the CIE, on our preferred orbital age model25.
Gutjahr et al. Page 34
Nature. Author manuscript; available in PMC 2018 February 28.
Europe PM
C Funders A
uthor Manuscripts
Europe PM
C Funders A
uthor Manuscripts

Europe PM
C Funders A
uthor Manuscripts
Europe PM
C Funders A
uthor Manuscripts
Gutjahr et al. Page 35
Ext
end
ed D
ata
Tab
le 1
Key
res
ults
fro
m in
divi
dual
mod
el r
uns.
(a)
Sum
mar
y of
the
mai
n do
uble
inve
rsio
n ex
peri
men
ts c
arri
ed o
ut. T
he te
rmin
olog
y “R
07”
refe
rs to
con
figu
ratio
ns ty
ing
the
Site
401
rec
ords
to th
e ch
rono
stra
tigra
phy
of r
ef. 2
5, th
e no
tatio
n “F
E”
refe
rs to
the
3 He-
base
d ag
e m
odel
of
ref.
57)
. Ann
otat
ion
“sm
” re
fers
to in
vers
ion
of a
naly
tical
ly s
moo
thed
δ13
C a
nd p
H d
ata
sets
, “rw
” to
usa
ge o
f or
igin
al s
ampl
e da
ta f
or d
oubl
e in
vers
ions
. “H
I” a
nd “
LO
” re
pres
ent
pote
ntia
lly e
xtre
me
conf
igur
atio
ns ta
king
into
acc
ount
the
boro
n pr
oxy
unce
rtai
nty
at 9
5% c
onfi
denc
e le
vel.
“noW
” ha
s si
licat
e (a
nd c
arbo
nate
) w
eath
erin
g fe
edba
cks
disa
bled
. “C
org”
den
ote
mod
el
conf
igur
atio
ns th
at a
llow
rem
oval
of
exce
ss o
rgan
ic c
arbo
n fr
om th
e su
rfac
e oc
ean.
Gre
y sh
adin
g hi
ghlig
hts
expe
rim
ents
foc
usse
d up
on in
the
mai
n te
xt a
nd p
lotte
d in
Fig
ure
3 (“
R07
sm”
in F
ig. 3
a-f
and
“R07
sm_C
org”
in 3
i-n.
). N
ote:
(1)
pea
k em
issi
ons
are
binn
ed a
t 2 k
yr r
esol
utio
n, (
2) b
oth
cum
ulat
ive
emis
sion
s an
d C
org
buri
al a
re m
easu
red
from
40
to 1
90 k
a m
odel
tim
e, a
nd (
3) p
eak
exce
ss w
eath
erin
g
refl
ects
car
bon
rem
oval
due
to s
ilica
te w
eath
erin
g ab
ove
pre-
PET
M w
eath
erin
g ra
tes.
(b)
Sum
mar
y ta
ble
pres
entin
g th
e re
sults
of
sens
itivi
ty e
xper
imen
ts (
show
n in
Ext
ende
d D
ata
Fig.
5)
to q
uant
ify
the
impo
rtan
ce o
f un
cert
aint
ies
in th
e ag
e m
odel
for
the
CIE
ons
et. I
n th
ese
expe
rim
ents
, the
CIE
ons
et p
hase
is a
ssum
ed to
occ
ur li
near
ly, w
ith a
dur
atio
n of
the
decl
ine
in δ
13C
and
pH
var
ying
fro
m 1
00 to
20,0
00 y
r du
ratio
n. R
epor
ted
are:
(1)
dia
gnos
ed p
eak
carb
on e
mis
sion
s, (
2) c
umul
ativ
e ca
rbon
em
issi
ons
occu
rrin
g ov
er th
e du
ratio
n of
the
onse
t, an
d m
ean
(flu
x w
eigh
ted)
δ13
C o
f th
ese
emis
sion
s, (
3)
cum
ulat
ive
carb
on e
mis
sion
s oc
curr
ing
at th
e 20
kyr
tim
e ho
rizo
n –
com
para
ble
to th
e on
set d
urat
ion
in o
ur a
ssum
ed a
ge m
odel
, plu
s th
e m
ean
(flu
x w
eigh
ted)
δ13
C o
f th
ese
emis
sion
s, a
nd (
4) th
e cu
mul
ativ
e
carb
on e
mis
sion
s oc
curr
ing
at th
e 20
kyr
hor
izon
, plu
s th
e m
ean
(flu
x w
eigh
ted)
δ13
C o
f th
ese
emis
sion
s. N
ote
that
in a
ll ex
peri
men
ts, o
nce
the
onse
t is
com
plet
e, th
e ta
rget
pH
and
δ13
C v
alue
s ar
e he
ld
cons
tant
(an
d lo
w)
until
the
end
of th
e ex
peri
men
t (50
,000
yr)
.
a Exp
erim
ent I
Dex
peri
men
tal a
ssum
ptio
nspe
ak e
mis
sion
scu
mul
ativ
e em
issi
ons
cum
ulat
ive
Cor
g bu
rial
ΔSS
Tpe
ak e
xces
s w
eath
erin
g
age
mod
elδ1
1 B e
nvel
ope
smoo
thed
dat
a?w
eath
erin
g?C
org
buri
al?
(PgC
yr-
1 )to
tal (
PgC
)m
ean δ1
3 C ‰
tota
l (P
gC)
mea
n δ1
3 C ‰
(°C
)(P
gC y
r-1 )
R07
sm_H
IR
07hi
ghY
ES
YE
SN
O0.
415,
688
-18.
9--
---
-2.
250.
030
R07
smR
07m
ean
YE
SY
ES
NO
0.58
10,2
13-1
1.1
---
---
3.64
0.05
3
R07
sm_L
OR
07lo
wY
ES
YE
SN
O1.
1619
,964
-6.6
---
---
5.99
0.10
5
FEsm
_HI
FEhi
ghY
ES
YE
SN
O0.
176,
502
-16.
5--
---
-2.
100.
038
FEsm
FEm
ean
YE
SY
ES
NO
0.36
12,0
20-9
.8--
---
-3.
090.
069
FEsm
_LO
FElo
wY
ES
YE
SN
O0.
6424
,124
-6.0
---
---
4.80
0.13
2
R07
rwR
07m
ean
NO
YE
SN
O0.
6110
,984
-12.
1--
---
-4.
070.
061
FErw
FEm
ean
NO
YE
SN
O0.
4512
,749
-10.
2--
---
-3.
140.
072
R07
sm_n
oWR
07m
ean
YE
SN
ON
O0.
526,
407
-16.
7--
---
-3.
34--
-
FEsm
_noW
FEm
ean
YE
SN
ON
O0.
306,
665
-16.
4--
---
-2.
72--
-
R07
sm_H
I_C
org
R07
high
YE
SY
ES
YE
S0.
417,
670
-18.
02,
607
-30.
02.
250.
030
R07
sm_C
org
R07
mea
nY
ES
YE
SY
ES
0.58
12,2
20-1
0.9
2,54
0-3
0.5
3.64
0.05
3
R07
sm_L
O_C
org
R07
low
YE
SY
ES
YE
S1.
1622
,593
-7.1
3,33
3-3
0.9
5.99
0.10
5
Nature. Author manuscript; available in PMC 2018 February 28.

Europe PM
C Funders A
uthor Manuscripts
Europe PM
C Funders A
uthor Manuscripts
Gutjahr et al. Page 36b D
urat
ion
of o
nset
(yr
)pe
ak e
mis
sion
scu
mul
ativ
e em
issi
ons
over
ons
etcu
mul
ativ
e em
issi
ons
@ 2
0,00
0 yr
cum
ulat
ive
emis
sion
s @
50,
000
yr
(PgC
yr-
1 )to
tal (
PgC
)m
ean δ1
3 C (
‰)
tota
l (P
gC)
mea
n δ1
3 C (
‰)
tota
l (P
gC)
mea
n δ1
3 C (
‰)
100
20.0
01,
897
-19.
08,
695
-17.
013
,256
-13.
4
200
15.2
12,
355
-18.
48,
688
-17.
013
,252
-13.
4
500
6.90
2,58
8-2
1.5
8,66
4-1
7.0
13,2
39-1
3.6
1,00
03.
722,
799
-24.
58,
613
-17.
113
,200
-13.
4
2,00
02.
083,
074
-27.
68,
526
-17.
213
,181
-13.
4
5,00
01.
073,
751
-29.
08,
202
-17.
813
,007
-13.
5
10,0
000.
704,
691
-26.
37,
612
-18.
812
,706
-13.
6
20,0
000.
486,
141
-22.
06,
141
-22.
012
,025
-14.
0
Nature. Author manuscript; available in PMC 2018 February 28.