Vertical Distribution of Heavy Metals in Coastal Sediment
12
Bulletin of the Marine Geology, Vol. 33, No. 1, June 2018, pp. 29 to 40 29 Vertical Distribution of Heavy Metals in Coastal Sediment: A Record of the Changing Input in the Estuarine of the Semarang Flood Canal Distribusi Vertikal Logam Berat dalam Sedimen Pesisir: Rekaman atas Perubahan Masukan di Estuari Banjir Kanal, Semarang Fitri Budiyanto, Lestari, Ricky Rositasari and Rachma Puspitasari Research Center for Oceanography-Indonesian Institute of Sciences, Jl. Pasir Putih 1 No 1, Ancol, Jakarta, 14430 Corresponding author: [email protected] (Received 02 Februari 2018; in revised form 14 Februari 2018 accepted 30 April 2018) ABSTRACT: Sediment plays an important role in archiving contaminant like heavy metals and could record metal contamination in sediment due to land-based input such as flood canals of Semarang. This study was to understand the changing record of heavy metals’ contamination in coastal sediment and to assess the sediment quality. Two core sediments, from two different sites, were collected up to 80 cm in depth and, subsequently, sectioned within a 5 cm interval. A digestion system followed by AAS measurement, was used to determine the metal concentrations, Enrichment Factor (EF) was applied to assess sediment quality. The sediment fraction and metals concentration revealed the changing of input and deposition process along sediment cores in East Flood Canal (EFC) and West Flood Canal (WFC). There was an alteration of sediment composition in which the proportion of sediment composition moved to finer size in EFC and a pulse of coarser-finer-coarser size of sediment composition was observed in WFC. In general, higher concentrations of Fe, Cd, Cu, Ni and Zn were observed differently with Pb concentration. Ni along both sediment cores was unenriched (EF<1), whereas Cd, Cu, Pb, and Zn were classified minor to moderate enrichment. Thus, the source and deposition processes of these Fe, Cd, Cu, Ni and Zn were different compared with those of Pb. Keyword: flood canal, Semarang, heavy metal, Enrichment Factor ABSTRAK: Sedimen memiliki peran sebagai tempat penyimpanan bahan pencemar seperti logam berat dan studi atas pencemaran logam berat dalam sedimen di banjir kanal kota Semarang belum banyak dilakukan. Sehingga tujuan dari penelitian ini adalah untuk mengetahui sejarah pencemaran dengan melihat distribusi vertikal kemudian menilai status logam berat dalam sedimen di muara banjir kanal barat dan banjir kanal timur kota Semarang. Untuk menjawab tujuan penelitian, telah dilakukan pengambilan 2 sampel sedimen inti hingga kedalaman 80 cm kemudian sedimen tersebut diambil tiap interval 5 cm. Metode peleburan yang diikuti pengukuran dengan AAS dilakukan untuk mengukur konsentrasi logam dan Enrichment Factor (EF) dihitung untuk menilai kualitas sedimen. Fraksi sedimen dan konsentrasi logam berat menunjukkan perubahan masukan dan proses deposisi di sepanjang sedimen inti yang dianalsis dari Banjir Kanal Timur (BKT) dan Banjir Kanal Barat (BKB). Tampak adanya perubahan komposisi sedimen dimana sedimen di EFC cenderung menjadi lebih halus sementara tampak adanya fluktuasi komposisi sedimen di WFC dari kasar-halus-kasar. Masing-masing logam menunjukkan pola yang berbeda walaupun konsentrasi Fe, Cd, Cu , Ni dan Zn tinggi tampak di periode energi yang lebih tinggi dan konsentrasi Pb tinggi teramati sema periode energi rendah. Ni di kedua sedimen inti masih berada pada konsentrasi alami (EF<1),tetapi Cd, Cu, Pb dan Zn telah mengalami pengayaan minor hingga moderat. Informasi tersebut dapat menunjukkan sumber dan proses deposisi Fe, Cd, Cu, Ni dan Zn berbeda dengan Pb. Kata kunci: Banjir kanal, Semarang, logam berat, Enrichment Factor. INTRODUCTION The rapid growth of human population in recent decades requires the environmental support, hence, the demand for natural resources inclines. However, the massive exploitation, without a proper management, can gradually cause their depletion (Bingöl et al., 2013; Raize et al., 2004; and Ribeiro et al., 2017). The second problem is that their utilization has also generated the waste (Thévenot et al., 2007; Wang et al., 2012). Heavy metals, contained waste discharge, are considered as persistent, toxic and bioaccumulative triggering a metabolism disturbance in certain dose (Pekey, 2006; Zhang et al., 2017).
-
Upload
khangminh22 -
Category
Documents
-
view
1 -
download
0
Transcript of Vertical Distribution of Heavy Metals in Coastal Sediment
Bulletin of the Marine Geology, Vol. 33, No. 1, June 2018, pp. 29 to 40
29
Vertical Distribution of Heavy Metals in Coastal Sediment: A Record of the Changing Input in the Estuarine of the Semarang Flood Canal
Distribusi Vertikal Logam Berat dalam Sedimen Pesisir: Rekaman atas Perubahan Masukan di Estuari Banjir Kanal, Semarang
Fitri Budiyanto, Lestari, Ricky Rositasari and Rachma Puspitasari
Research Center for Oceanography-Indonesian Institute of Sciences, Jl. Pasir Putih 1 No 1, Ancol, Jakarta, 14430
Corresponding author: [email protected]
(Received 02 Februari 2018; in revised form 14 Februari 2018 accepted 30 April 2018)
ABSTRACT: Sediment plays an important role in archiving contaminant like heavy metals and couldrecord metal contamination in sediment due to land-based input such as flood canals of Semarang. Thisstudy was to understand the changing record of heavy metals’ contamination in coastal sediment and toassess the sediment quality. Two core sediments, from two different sites, were collected up to 80 cm in depthand, subsequently, sectioned within a 5 cm interval. A digestion system followed by AAS measurement, wasused to determine the metal concentrations, Enrichment Factor (EF) was applied to assess sediment quality.The sediment fraction and metals concentration revealed the changing of input and deposition process alongsediment cores in East Flood Canal (EFC) and West Flood Canal (WFC). There was an alteration ofsediment composition in which the proportion of sediment composition moved to finer size in EFC and apulse of coarser-finer-coarser size of sediment composition was observed in WFC. In general, higherconcentrations of Fe, Cd, Cu, Ni and Zn were observed differently with Pb concentration. Ni along bothsediment cores was unenriched (EF<1), whereas Cd, Cu, Pb, and Zn were classified minor to moderateenrichment. Thus, the source and deposition processes of these Fe, Cd, Cu, Ni and Zn were differentcompared with those of Pb.
Keyword: flood canal, Semarang, heavy metal, Enrichment Factor
ABSTRAK : Sedimen memiliki peran sebagai tempat penyimpanan bahan pencemar seperti logam berat dan studiatas pencemaran logam berat dalam sedimen di banjir kanal kota Semarang belum banyak dilakukan. Sehinggatujuan dari penelitian ini adalah untuk mengetahui sejarah pencemaran dengan melihat distribusi vertikal kemudianmenilai status logam berat dalam sedimen di muara banjir kanal barat dan banjir kanal timur kota Semarang. Untukmenjawab tujuan penelitian, telah dilakukan pengambilan 2 sampel sedimen inti hingga kedalaman 80 cm kemudiansedimen tersebut diambil tiap interval 5 cm. Metode peleburan yang diikuti pengukuran dengan AAS dilakukanuntuk mengukur konsentrasi logam dan Enrichment Factor (EF) dihitung untuk menilai kualitas sedimen. Fraksisedimen dan konsentrasi logam berat menunjukkan perubahan masukan dan proses deposisi di sepanjang sedimen intiyang dianalsis dari Banjir Kanal Timur (BKT) dan Banjir Kanal Barat (BKB). Tampak adanya perubahankomposisi sedimen dimana sedimen di EFC cenderung menjadi lebih halus sementara tampak adanya fluktuasikomposisi sedimen di WFC dari kasar-halus-kasar. Masing-masing logam menunjukkan pola yang berbedawalaupun konsentrasi Fe, Cd, Cu , Ni dan Zn tinggi tampak di periode energi yang lebih tinggi dan konsentrasi Pbtinggi teramati sema periode energi rendah. Ni di kedua sedimen inti masih berada pada konsentrasi alami(EF<1),tetapi Cd, Cu, Pb dan Zn telah mengalami pengayaan minor hingga moderat. Informasi tersebut dapatmenunjukkan sumber dan proses deposisi Fe, Cd, Cu, Ni dan Zn berbeda dengan Pb.
Kata kunci: Banjir kanal, Semarang, logam berat, Enrichment Factor.
INTRODUCTIONThe rapid growth of human population in recent
decades requires the environmental support, hence, thedemand for natural resources inclines. However, themassive exploitation, without a proper management,can gradually cause their depletion (Bingöl et al., 2013;Raize et al., 2004; and Ribeiro et al., 2017). The second
problem is that their utilization has also generated thewaste (Thévenot et al., 2007; Wang et al., 2012). Heavymetals, contained waste discharge, are considered aspersistent, toxic and bioaccumulative triggering ametabolism disturbance in certain dose (Pekey, 2006;Zhang et al., 2017).

30 Fitri Budiyanto et al.
In the aquatic environment, heavy metal presentsin both dissolved and particulate phase (Sakellari et al.,2011). In an estuary, a region of the mixing of freshwater and sea water, those phases tend to change(Mukherjee, 2014). It is due to such complex processesinvolving adsorption-desorption, chemical reaction,and other physical processes prior to the metaldeposition towards the bottom sediment bed(Chakraborty et al., 2014). The metals continuously andstratigraphically deposit and will be preserved togenerate heavy metal archive in sediment. The analysisof vertical distribution of heavy metals in sedimentcores provides valuable information to describe thehistorical record of heavy metals deposition duringsome period of time ( Huang and Lin, 2003;Mukherjee, 2014; and Zorer et al., 2008).
Semarang, one of the Indonesian active port citiesand the capital city of Central Java province in thenorth-middle part of Java Island, it has progressivelydeveloped in population growth and industry. As regardto its location and topography, annual flood occurs, andtwo flood canals sandwiching the city have beendeveloped as the mitigation effort (Suyarso and Susana,2010). Like other rivers, flood canal transports not onlywater but also pollutant such as heavy metals. Thisstudy was to understand the historical records of heavymetalsÊ contamination based on their verticaldistribution and assessing the sediment quality based onthose metal concentrations.
MATERIAL AND METHODS
Sample collection
In order to collect sediment sample based on itsstratigraphy, sediment core method was employed.Core samples were collected in the geographicalposition of 110.39° E and 6.95° S for West Flood Canal(WFC) and 110.45° E and 6.93° S for East Flood Canal(EFC) in April 2016 (Figure 1). Those locations wereundisturbed points so the sediment was accumulatedwith minimum changes. The purpose of selecting thatkind of location was to collect representative sediment.The sample from WFC was collected right in the rivermouth however sediment from EFC was sampled sea-ward direction due to the topographic difficulties in thearea.
The sediment was collected using Poly VinylChloride (PVC) pipe, 4 cm in diameter and 2 m inlength. That PVC pipe was then pushed down intobottom bed sediment at aforementioned points. Thecollected core sediment was then subsampled within 5cm interval, 80 cm in total length of sediment core wascollected in WFC (B point) and 65 cm in total length ofsediment core was collected in EFC (T point). Thosesubsamples were then stored in PE box at 4°C intemperature following the sampling procedure ofLoring and Rantala (1992).
Figure 1. The location of sample collection in both East and West Flood Canal in Semarang.
Vertical Distribution of Heavy Metals in Coastal Sediment: A Record of the Changing Input in the Estuarine of the Semarang Flood Canal 31
Sediment texture analysis
The analysis of sediment size as one of thesediment characterization used in this study wasfollowing Wentworth scale (1922). Generally, themethod was applying separation and gravimetricprotocol. The sediment was sieving passing through aunit of separator and sediment was separated based onits size during this process. The calculation of theamount of each sediment size (as percentage) was thencarried out based on the comparison of the weight ofeach separated sediment to the weight of initialsediment used.
Heavy metal analysis
The collected sediment samples were thenanalyzed using acid digestion procedure followed bythe measurement using Flame Atomic AbsorptionSpectrophotometer in the Laboratory of heavy metals,Research Center for Oceanography-LIPI. The analysiswas based on a dry basis. A gram of dry sediment wasthen digestion using a sequence of HNO3, H2O2, andHCl under reflux system at 95μ2 °C for 6 hours(USEPA 3050b methods). The digested sample wasthen measured using Flame Atomic AbsorptionSpectrophotometer Varian AA 20 plus®. All acid usedin the analysis was pro-analytic grade manufactured byMerck, Germany. All glassware was pre-cleaned usingHNO3 1+1 for 24 hours before use.
Data Analysis
PCA analysis was computed to understand thecorrelation between sediment texture and metalconcentration. Hence, in order to assess the condition ofmetals in sediment, Enrichment Factor (EF) wascomputed. The computation of EF was carried out bynormalized the certain metal with backgroundconcentration. Fe concentration was used as a referenceand metal concentration in the average crust wasapplied for background data. The EF was formulated as(El-Said et al., 2014):
Ci and Cr represented the concentration ofspecific metal i and concentration of the reference metal(Fe) in either sample or background data. According toBrady et al. (2014), EF score >1 is triggered byanthropogenic influence and El-Said et al. (2014)describe the interpretation of EF score as Table 1.
RESULT
The vertical profile of sediment texture
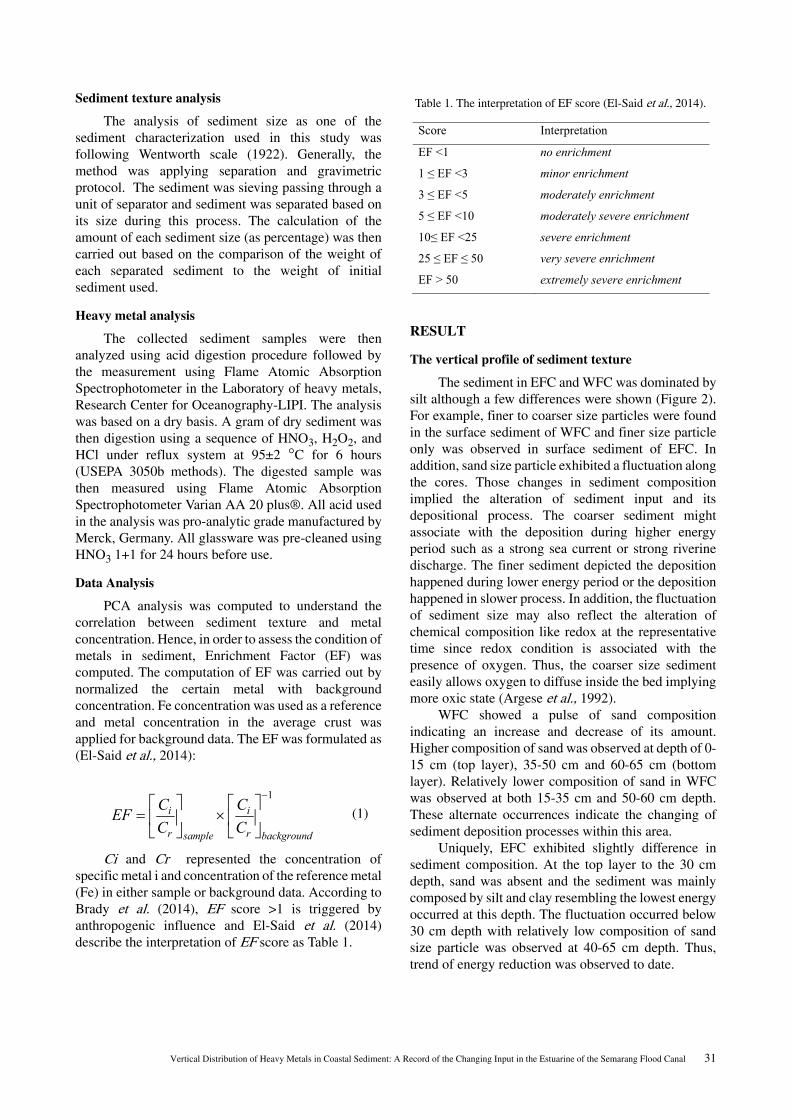
The sediment in EFC and WFC was dominated bysilt although a few differences were shown (Figure 2).For example, finer to coarser size particles were foundin the surface sediment of WFC and finer size particleonly was observed in surface sediment of EFC. Inaddition, sand size particle exhibited a fluctuation alongthe cores. Those changes in sediment compositionimplied the alteration of sediment input and itsdepositional process. The coarser sediment mightassociate with the deposition during higher energyperiod such as a strong sea current or strong riverinedischarge. The finer sediment depicted the depositionhappened during lower energy period or the depositionhappened in slower process. In addition, the fluctuationof sediment size may also reflect the alteration ofchemical composition like redox at the representativetime since redox condition is associated with thepresence of oxygen. Thus, the coarser size sedimenteasily allows oxygen to diffuse inside the bed implyingmore oxic state (Argese et al., 1992).
WFC showed a pulse of sand compositionindicating an increase and decrease of its amount.Higher composition of sand was observed at depth of 0-15 cm (top layer), 35-50 cm and 60-65 cm (bottomlayer). Relatively lower composition of sand in WFCwas observed at both 15-35 cm and 50-60 cm depth.These alternate occurrences indicate the changing ofsediment deposition processes within this area.
Uniquely, EFC exhibited slightly difference insediment composition. At the top layer to the 30 cmdepth, sand was absent and the sediment was mainlycomposed by silt and clay resembling the lowest energyoccurred at this depth. The fluctuation occurred below30 cm depth with relatively low composition of sandsize particle was observed at 40-65 cm depth. Thus,trend of energy reduction was observed to date.
1i i
r rsample background
C CEFC C
−⎡ ⎤ ⎡ ⎤
= ×⎢ ⎥ ⎢ ⎥⎣ ⎦ ⎣ ⎦
(1)
Score Interpretation
EF <1 no enrichment
1 � EF <3 minor enrichment
3 � EF <5 moderately enrichment
5 � EF <10 moderately severe enrichment
10� EF <25 severe enrichment
25 � EF � 50 very severe enrichment
EF > 50 extremely severe enrichment
Table 1. The interpretation of EF score (El-Said et al., 2014).
32 Fitri Budiyanto et al.
Vertical distribution of Fe
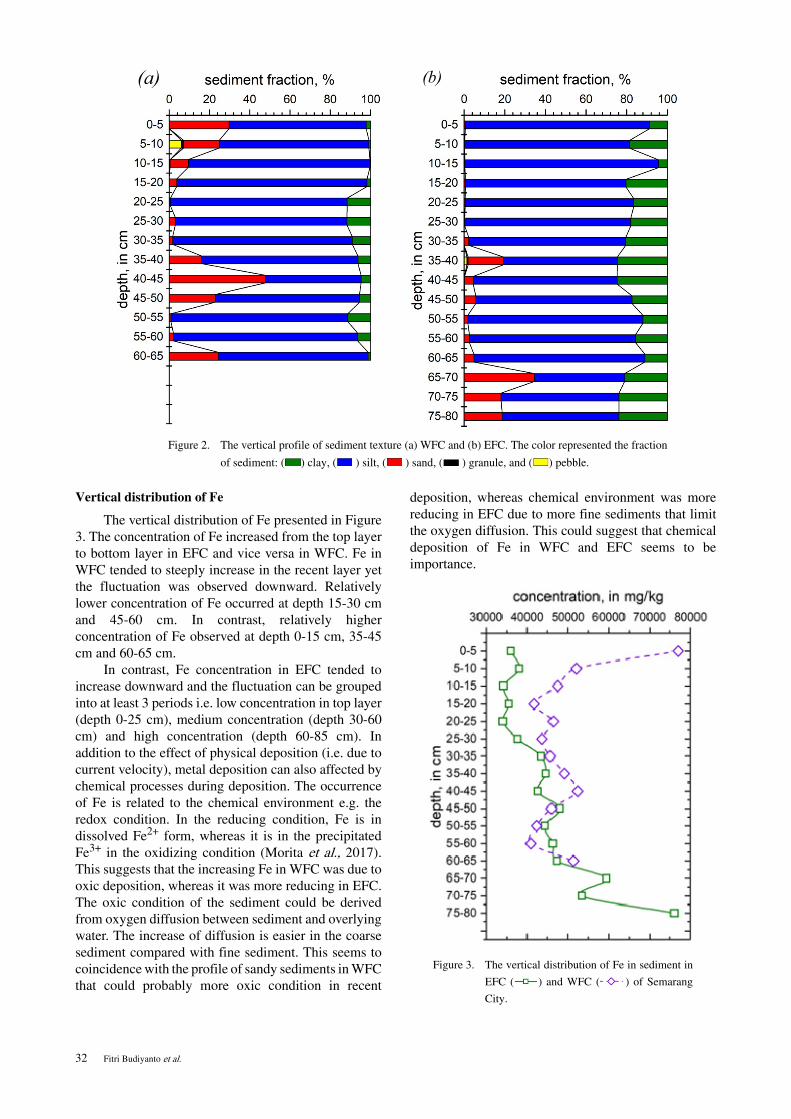
The vertical distribution of Fe presented in Figure3. The concentration of Fe increased from the top layerto bottom layer in EFC and vice versa in WFC. Fe inWFC tended to steeply increase in the recent layer yetthe fluctuation was observed downward. Relativelylower concentration of Fe occurred at depth 15-30 cmand 45-60 cm. In contrast, relatively higherconcentration of Fe observed at depth 0-15 cm, 35-45cm and 60-65 cm.
In contrast, Fe concentration in EFC tended toincrease downward and the fluctuation can be groupedinto at least 3 periods i.e. low concentration in top layer(depth 0-25 cm), medium concentration (depth 30-60cm) and high concentration (depth 60-85 cm). Inaddition to the effect of physical deposition (i.e. due tocurrent velocity), metal deposition can also affected bychemical processes during deposition. The occurrenceof Fe is related to the chemical environment e.g. theredox condition. In the reducing condition, Fe is indissolved Fe2+ form, whereas it is in the precipitatedFe3+ in the oxidizing condition (Morita et al., 2017).This suggests that the increasing Fe in WFC was due tooxic deposition, whereas it was more reducing in EFC.The oxic condition of the sediment could be derivedfrom oxygen diffusion between sediment and overlyingwater. The increase of diffusion is easier in the coarsesediment compared with fine sediment. This seems tocoincidence with the profile of sandy sediments in WFCthat could probably more oxic condition in recent
deposition, whereas chemical environment was morereducing in EFC due to more fine sediments that limitthe oxygen diffusion. This could suggest that chemicaldeposition of Fe in WFC and EFC seems to beimportance.
(a) (b)
Figure 2. The vertical profile of sediment texture (a) WFC and (b) EFC. The color represented the fraction
of sediment: ( ) clay, ( ) silt, ( ) sand, ( ) granule, and ( ) pebble.
Figure 3. The vertical distribution of Fe in sedime
City.
Figure 3. The vertical distribution of Fe in sediment in
EFC ( ) and WFC ( ) of Semarang
City.

Vertical Distribution of Heavy Metals in Coastal Sediment: A Record of the Changing Input in the Estuarine of the Semarang Flood Canal 33
Vertical distribution of Cd
As presented in Figure 4, the vertical distributionsof Cd in EFC and WFC were identical showing lowerCd concentration in the top layer. The lowconcentration of Cd both in EFC and WFC fell inalmost similar value, 0.14-0.15 mg/kg and theoccurrence of these low concentrations waspredominant in both cores. The high concentrations ofCd were observed at the depth of 20-25 cm, 35-40 cm,45-50 cm in WFC and at the depth of 15-20 cm, 35-40cm, 55-60 cm in EFC. These high concentrations of Cdin both stations indicated the additional Cd input at timeof their deposition and showed increasing in bothstations implying that amount of Cd discharge wasincreasing. Since fossil fuel is noticed to be one of mainCd source (Hutton, 1983), Cd was suspected to comefrom any activities that utilized fossil fuel like vehicle,harbour and shipping activities around the area. Theincreasing pulse of Cd reflected the increasing volumeof those activities.
The lower concentration of Cd in the top layerindicated the decrease of Cd deposition in the recenttime in which no enrichment (EF<1) was observed atthe top layer of WFC (0-10 cm), but minor enrichment(EF>1) at all top layers of EFC. Moving downward, asteep alteration of Cd input and the extremely highconcentrations were observed at the depth of 20-25 cmin WFC (0.4 mg/kg) lead to minor enrichment (EF<3)and at 15-20 cm in EFC (0.5 mg/kg) lead to moderatelyenrichment (EF<5). Another increment was appeared at35-40 cm depth in both EFC and WFC, and then
followed by the decline. Overall, the sediment wasconsidered at no enrichment to minor enrichment by Cdin EFC (EF score: 0.6-2.6). However, the sediment inWFC was moderately enriched by Cd (EF score: 0.5-4.3) at 20-25 cm in depth by Cd.
Vertical distribution of Cu
Figure 5 showed a variation of the verticaldistribution of Cu in sediment. Cu in WFC was slightlyvaried and no exceptional fluctuation was observed.Referring to the profile of grain size sediment (Figure2), the deposition of Cu in WFC and EFC was tend tocorrelated with fine sediment implying the fluctuationwas affected by adsorption. Interestingly, below thedepth 60 cm, Cu concentration increased during thehigher energy period implying variety of depositionprocesses.
The Cu profile in WFC tended to vary slightlyranging from 25.9-36.7 mg/Kg indicating no majorchanges in Cu input. The sediment in WFC wasunenriched by the fluctuation of Cu since EF score was0.4-0.9 means no pollution of Cu was recorded in WFC.In contrast, it showed increasing downward from thetop layer to the depth of 60-65 cm in EFC (25.6-59.5mg/kg) then decreasing to the bottom layer indicatingthe decrease of Cu input. The sediment core from EFCwas dominantly unenriched by Cu (EF<1). However, itwas observed that during the increase of Cu input inEFC (depth at 30-35 cm, 45-50 cm, 55-65 cm) gave aconsequence on minor enrichment (EF>1) so at thattime, the sediment was slightly polluted by Cu.
(a) (b)
Figure 4. The vertical distribution of Cd ( ) and EF score for Cd ( ):
(a) WFC and (b) EFC in Semarang City.

34 Fitri Budiyanto et al.
Vertical distribution of Ni
Ni in both EFC and WFC was also slightly variedand insignificant trend (Figure 6). The uniquefluctuation of Ni in WFC occurred at depth 10-50 cmand outside that range the value was around 28-29 mg/Kg. Interestingly, the highest value of Ni happened atdepth 40-45 cm co-occurred within the coarsersediment composition) and the lowest Ni was observedduring finer sediment composition. In addition, thenoticeable value of Ni in EFC was observed only at twodepth i.e. highest value at depth 25-30 cm (occurredwith increasing coarser sediment composition) and thelowest value at depth 60-65 cm (at decreasing coarsersediment composition).
Uniquely, even it showed an inclination at somedepths, sediment was unenriched by Ni as EF score =0.3-0.7 mg/kg. In contrast, there was two points in EFCas a noticed that Ni input was slightly changes i.e.increased at 25-30 cm (35.2 mg/kg) and decreased at60-65 cm (24.5 mg/kg). However, that fluctuation hasunpolluted the sediment since the no enrichment of Niwas observed (EF score: 0.3-0.5).
Vertical distribution of Pb
Figure 7 showed that vertical distribution of Pb inWFC (5.8-13.4 mg/Kg) was slightly fluctuatedcompared with Pb in EFC (7.7-22.0 mg/kg). Pb in WFCwas slightly varied from top layer to the depth of 40-45cm then drastically decreased before it was slightlyfluctuated again after the depth of 45-50 cm. On the
other hand, the drastic fluctuation of Pb in EFC wasobserved at depth 45 cm downward and the highest Pbwas observed at depth 45-50 cm and 60-65 cm.Interestingly, the occurrence of those highest Pboccurred with decreasing coarser sediment compositionand vice versa for the lowest Pb in both stations.
In general, the sediment was unenriched by Pbexcept for in the incline period (depth at 30-40 cm) withEF score= 0.5-1.3. Opposite, Pb in EFC was slightlyfluctuated before the depth of 40-45 cm (ranging from7.95-15.1 mg/kg) then reached its maximumconcentration (22.0 mg/kg) before decreaseddownwards. The upper layer (depth 0-45 cm) impliedno significant changes of Pb input and the extremeincrease observed after that depth (at depth 45-50 cm).Uniquely, almost all of layers was minor enriched by Pbexcept during the decline (at depth 10-20 cm, 35-45 cm,65-70 cm) with EF score = 0.7-2.1.
Vertical distribution of Zn
Figure 8 presented vertical distribution of Zn inboth Canal Floods. Slight fluctuation occurred in WFC(74-114 mg/kg) indicated insignificant changes on Zninput. The relatively higher concentration was showedonly at the top layer (114 mg/kg) and the depth of 45-50cm (107 mg/kg). Those highest concentrations of Zn inWFC occurred with increasing coarser sedimentcomposition. In contrast, Zn in EFC was observed atdepth 25-30 cm and 45-50 cm matching with thedecreasing coarser sediment composition. Thus, the
(a) (b)
Figure 5. The vertical distribution of Cu ( ) and EF score for Cu ( ):
(a) WFC and (b) EFC in Semarang City.

Vertical Distribution of Heavy Metals in Coastal Sediment: A Record of the Changing Input in the Estuarine of the Semarang Flood Canal 35
(a) (b)
Figure 6. The vertical distribution of Ni ( ) and EF Score for Ni ( ):
(a) WFC and (b) EFC in Semarang City.
(a) (b)
Figure 7. The vertical distribution Pb ( ) and EF Score for Pb ( ):
(a) WFC and (b) EFC in Semarang City.

36 Fitri Budiyanto et al.
deposition of Zn in EFC occurred in a slow process.Like Pb, Zn in EFC was probably experienced awashing process since it became lower during highenergy period.
Uniquely, all layers was minor enriched by Znwith EF score 1.1-1.5 in WFC. In contrast, It wasnoticed an extreme incline of Zn concentration in EFC.Zn in EFC was slightly fluctuating before the depth of20-25 cm and no enrichment of Zn occurred (EF<1). Znreached to its maximum value at the depth of 25-30 cmlead to moderately enrichment then decreaseddownwards to minor enrichment.
DISCUSSIONIt has been shown previously those vertical
profiles of the metals in WFC and EFC showeddifferently, and no consistent correlation betweenmetals and grain size. Commonly, the metal profiles insediment are related to the environmental depositionand input of metals (Buccolieri et al., 2006; Duquesneet al., 2006 and Sinolungan et al., 2008). This anomalywas very likely stimulated by the difference betweentwo sampling locations in which EFC was locatedseawards direction making this location to be moreexposed to seawater than WFC. Thus, sediment in EFCwas more influenced by sea water characteristic and thedynamics within meanwhile WFC was dominantly
influenced by freshwater characteristic and riverinedischarge.
Generally, each metal investigated in this studyillustrated different trend since some of these metalscome from different origin. Fe comes from thecorrosion of any domestic garbage, steel pipe, steelconstruction, and fossil fuel (Chatterjee et al., 2007).Even Cd, Cu, Ni, Pb and Zn come from the utilization offossil fuel, each of them has unique source which maysignificantly contribute to the high release of this metalsin environment. Cd was released by agriculturalactivities like the use of phosphorous fertilizer (Yu etal., 2013; Helali et al., 2016). The anthropogenicactivities releasing Cu comes from fertilizer, thermalpower plant, paints and antifouling industries (Suyarsoand Susana, 2010; Yu et al., 2013) and untreated wastedisposal (Wang et al., 2011). Zn in common pollutantreleased by human activities such as painting industry,mining and urban life (Yu et al., 2013). In addition, eachmetal shows different characteristics in sea water andthey exhibit different binding capability in sedimentlike Cd is more stable in dissolved form compared withother metals thus the concentration of this metals insediment is lower. Therefore, the physicochemicalproperties like pH, redox potential, and salinity willdetermine each metal depositional process in sediment(Nemati et al., 2011 and Qiao et al., 2013).
(a) (b)
Figure 8. The vertical distribution of Zn ( ) and EF Score for Zn ( ):
(a) WFC and (b) EFC in Semarang City.
Vertical Distribution of Heavy Metals in Coastal Sediment: A Record of the Changing Input in the Estuarine of the Semarang Flood Canal 37
The fluctuation of each metal within these twosediment cores reflected the alteration of their input andtheir depositional processes. The physical alterationlike seasonal monsoon is highly likely affected theprocesses, for example, in the rainy season morefreshwater is discharging for carrying more heavymetals. Thus, by observing the shifting of energy (bythe changing of sediment composition), it can benoticed that the higher deposition of Fe, Cd, Cu and Niin EFC and WFC occurred during higher energy period.That high energy period in both locations arepredominantly contributed by high volume of riverinedischarge since the location is in the front of rivermouth. In addition, anthropogenic activities withinSemarang city were also fluctuated. Though, thepopulation was growing in linear rate at a value of 1.8%a year, Suyarso and Susana (2011) reported afluctuation of industrial growth in both Semarang Cityand its regency. Their study discovered a stagnant or aslightly decrease of industrial growth at the end of 1998till beginning of 2005 influencing the metals input to itscoastal area. However, the determined data on industrialsector in Semarang city and its regency were notclassified each type of industry. That undetailed dataproduced a difficulty on describing which type ofindustries and the period of industrial developmentcontributing on environmental degradation along bothcanals (Suyarso and Susana, 2011).
Interestingly, Cu, Ni, Pb and Zn in both cores werein their natural condition to minor enrichment howeverCd in WFC was in moderately enrichment. Though theenrichment was observed, all metals were comparableto other location with noticeable anthropogenicactivities. Fe concentration in this study wascomparable with Fe from Chilean coastal waters(27230-39860 mg/kg) (Chandía and Salamanca, 2012)and Fe in average earth crust (56300 mg/kg) (Taylor,1964). Cd in both flood canals in Semarang wasrelatively higher compared with Changhua RiverEstuary, Hainan Island (Hu et al., 2013). Cuconcentration in both sediment cores was comparablewith Cu in sediment from Deception Island, Antarctica(42-65 mg/kg) (Brady et al., 2014) and in Santou Bay,China (48.52 mg/kg) (Qiao et al., 2013). Theconcentration of Ni along the sediment cores fromSemarang Flood Canal was lower than sediment fromIzmir Bay, Turkey (73.7 mg/kg) (Kontas, 2007). Pbconcentration in both cores was relatively lower thansediment from Shandong Peninsula (Yellow Sea) (19-42.2 mg/kg) (Li et al., 2013). The maximumconcentration of Zn observed in this study was highercompared with sediment from Izmir Bay, Turkey (76.7mg/kg) (Kontas, 2007).
CONCLUSIONMetals in WFC were slightly varied compared
with EFC. Generally, the higher Fe, Cd, Cu, Ni, and Znwere observed in coarser-dominated sedimentcomposition yet Pb was co-occurred with finer-dominated sediment composition. Fe concentration inboth cores was higher than average metal concentrationin continental crust means a massive input in therespective time. Ni in both cores and Cu in WFC wereremaining uncontaminated while the rest of studiedmetals (Cd, Cu in EFC, Pb, and Zn) were fluctuatedfrom unenriched to moderately enriched condition. Thefluctuation of metalÊs concentration along sedimentcores reflected the alteration of their input which iscould be from the seasonal monsoon/climatic change orindustrial development in Semarang city and regency.
ACKNOWLEDGEMENTThe research was funded by DIPA TEMATIK of
Research Center for Oceanography-LIPI year of 2016.The authors are also conveying our sincere gratitude forall laboratory assistants i.e. Mr. Abdul Rozak, Mr.Taufik Kaisupy and Mr. Singgih Prasetyo Adi Wibowofor the precious assistance in the laboratory.
REFERENCESArgese, E., Cogoni, G., Zaggia, L., Zonta, R., and Pini,
R., 1992. Study on Redox State and Grain Sizeof Sediments in a Mud Flat of the VeniceLagoon. Environmental Geology and WaterSciences, 20 (1): 35-42. doi:10.1007/BF01736108.
Bingöl, D., Ay, Ü., Bozbas, S.K. and Uzgören, N.2013. Chemometric evaluation of the heavymetals distribution in waters from the Dilovasregion in Kocaeli, Turkey. Marine pollutionbulletin, 68 (1-2): 134-139.
Brady, J.P, Ayoko, G,, Martens, W.N., andGoonetilleke, A., 2014. Enrichment,Distribution and Sources of Heavy Metals in theSediments of Deception Bay, Queensland,Australia. Marine Pollution Bulletin, 81 (1):248–255. doi:10.1016/j.marpolbul.2014.01.031.
Buccolieri, A., Buccolieri, G., Cardellicchio, N.,Antonella, A.D., Leo, D., and Maci, A., 2006.Heavy Metals in Marine Sediments of TarantoGulf (Ionian Sea, Southern Italy). MarineChemistry, 99 (1–4): 227–235. doi:10.1016/j.marchem.2005.09.009.
Chakraborty, P., Ramteke, D., Chakraborty, S., andNath, B.N., 2014. Changes in MetalContamination Levels in Estuarine Sedimentsaround India--an Assessment. Marine Pollution
38 Fitri Budiyanto et al.
Bulletin, 78 (1–2): 15–25. doi:10.1016/j.marpolbul.2013.09.044.
Chandía, C., and Salamanca, M., 2012. Long-TermMonitoring of Heavy Metals in Chilean CoastalSediments in the Eastern South Pacific Ocean.Marine Pollution Bulletin, 64 (10): 2254–2260.doi:10.1016/j.marpolbul.2012.06.030.
Chatterjee, M., Silva Filho, E. V., Sarkar, S. K., Sella,S. M., Bhattacharya, A., Satpathy, K. K.,Prasad, M. V. R., Chakraborty, S., andBhattacharya, B. D., 2007. Distribution andPossible Source of Trace Elements in theSediment Cores of a Tropical MacrotidalEstuary and Their EcotoxicologicalSignificance. Environment International, 33 (3):346–356. doi:10.1016/j.envint.2006.11.013.
Duquesne, S., Lyn, C. N., Lorenzo, G., Susan, B. M.,Stärk, H.-J., and David, J. B., 2006. Evidencefor Declining Levels of Heavy-Metals in theSevern Estuary and Bristol Channel, U.K. andTheir Spatial Distribution in Sediments.Environmental Pollution, 143 (2): 187–196.doi:10.1016/j.envpol.2005.12.002.
El-Said, G.F., Draz, S.E.O., El-Sadaawy, M.M., andMoneer, A.A., 2014. Sedimentology,geochemistry, pollution status and ecologicalrisk assessment of some heavy metals insurficial sediments of an Egyptian lagoonconnecting to the Mediterranean Sea. Journal ofEnvironmental Science and Health, 49:1029-1044.
Helali, M.A., Oueslati, W., Zaaboub, N., Added, A.,and Aleya, L., 2016. Chemical Speciation of Fe, Mn , Pb , Zn , Cd , Cu , Co , Ni and Cr in theSuspended Particulate Matter off the MejerdaRiver Delta ( Gulf of Tunis, Tunisia). Journal ofAfrican Earth Sciences, 118: 35–44.doi:10.1016/j.jafrearsci.2016.02.013.
Hu, B., Cui, R., Li, J., Wei, H., Zhao, J., Bai, F., Song,W., and Ding, X., 2013. Occurrence andDistribution of Heavy Metals in SurfaceSediments of the Changhua River Estuary andAdjacent Shelf (Hainan Island). MarinePollution Bulletin, 76 (1–2): 400–405.doi:10.1016/j.marpolbul.2013.08.020.
Huang, K-M, and Lin, S., 2003. Consequences andImplication of Heavy Metal Spatial Variationsin Sediments of the Keelung River DrainageBasin, Taiwan. Chemosphere, 53 (9):1113–1121. doi:10.1016/S0045-6535(03)00592-7.
Hutton, M., 1983. Sources of Cadmium in theEnvironment. Ecology and EnvironmentalSafety, 7(1): 9-24. doi:10.1016/0147-6513(83)90044-1.
Kontas, A., 2007. Trace Metals (Cu, Mn, Ni, Zn, Fe)Contamination in Marine Sediment andZooplankton Samples from Izmir Bay. (AegeanSea, Turkey). Water, Air, and Soil Pollution,188 (1–4): 323–333. doi:10.1007/s11270-007-9547-1.
Li, G., Hu, B., Bi, J., Leng, Q., Xiao, C., and Yang, Z.,2013. Heavy Metals Distribution andContamination in Surface Sediments of theCoastal Shandong Peninsula (Yellow Sea).Marine Pollution Bulletin, 76 (1-2): 420-426.doi:10.1016/j.marpolbul.2013.08.032.
Loring, D.H., and Rantala, R.T.T., 1992. Manual forthe Geochemical Analyses of Marine Sedimentsand Suspended Particulate Matter. Earth-Science Reviews, 32 (4): 235–283. doi:10.1016/0012-8252(92)90001-A.
Morita, Y., Yamagata, K., Oota, A., Ooki, A., Isoda, Y.,and Kuma, K., 2017. Subarctic WintertimeDissolved Iron Speciation Driven by ThermalConstrain on Fe(II) Oxidation, DissolvedOrganic Matter and Stream Reach. Geochimicaet Cosmochimica Acta, 215: 33-50.doi:10.1016/j.gca.2017.07.009.
Mukherjee, D P. 2014. Dynamics of Metal Ions inSuspended Sediments in Hugli Estuary, Indiaand Its Importance towards SustainableMonitoring Program. Journal of Hydrology, 517(0): 762–776. doi:http://dx.doi.org/10.1016/j.jhydrol.2014.05.069.
Nemati, K., Bakar, N.K.A., Abas, M.R., andSobhanzadeh, E., 2011. Speciation of HeavyMetals by Modified BCR Sequential ExtractionProcedure in Different Depths of Sedimentsfrom Sungai Buloh, Selangor, Malaysia. Journalof Hazardous Materials, 192 (1): 402–410.doi:10.1016/j.jhazmat.2011.05.039.
Pekey, H., 2006. The Distribution and Sources ofHeavy Metals in Izmit Bay Surface SedimentsAffected by a Polluted Stream. MarinePollution Bulletin, 52 (10): 1197–1208.doi:10.1016/j.marpolbul.2006.02.012.
Qiao, Y., Yang Y., Gu, J., and Zhao. J., 2013.Distribution and Geochemical Speciation ofHeavy Metals in Sediments from Coastal AreaSuffered Rapid Urbanization, a Case Study ofShantou Bay, China. Marine Pollution Bulletin,

Vertical Distribution of Heavy Metals in Coastal Sediment: A Record of the Changing Input in the Estuarine of the Semarang Flood Canal 39
68 (1–2): 140–146. doi:10.1016/j.marpolbul.2012.12.003.
Raize, O., Argaman, Y., and Yannai, S.. 2004.Mechanisms of Biosorption of Different HeavyMetals by Brown Marine Macroalgae.Biotechnology and Bioengineering, 87 (4):451–458. doi:10.1002/bit.20136.
Ribeiro, J. Sabadini-Santos, E., Carvalho, C., Annes,K.,César, R., and Bidone, E.D., 2017.Bioaccumulation of Heavy Metals by Shrimp(Litopenaeus Schmitti ): A Dose – ResponseApproach for Coastal Resources Management.Marine Pollution Bulletin, 114 (2): 1007–1013.doi:10.1016/j.marpolbul.2016.11.013.
Sakellari, A., Plavšić, M., Karavoltsos, S., Dassenakis,M., and Scoullos, M., 2011. Assessment ofCopper, Cadmium and Zinc Remobilization inMediterranean Marine Coastal Sediments.Estuarine, Coastal and Shelf Science, 91 (1):1–12. doi:10.1016/j.ecss.2010.09.008.
Sinolungan, M., T. M., Soeroto, B., Kondo, F., andKoumoto, T., 2008. The GeochemicalCharacteristics of Sediment in Tondano Lake,Indonesia: Heavy Metals and Organic MatterContents, and Grain Size Distribution. Paddyand Water Environment, 6 (3): 341–348.doi:10.1007/s10333-008-0132-z.
Suyarso and Susana, T., 2010. Preliminary study onevolution of metals contaminant recorded in thecoastal sediments of Semarang watres. Journalof Coastal Development, 13 (3): 185-194.
Taylor, S.R. 1964. Abundance of Chemical Elementsin the Continental Crust?: A New Table.Geochimica et Cosmochimica Acta, 28:1273–1285.
Thévenot, D.R, Moilleron, R., Lestel, L., Gromaire,M., Rocher, V., Cambier, P., Bonté, P., Colin, J-L., de Pontevès, C., and Meybeck. M., 2007.Critical Budget of Metal Sources and Pathwaysin the Seine River Basin (1994-2003) for Cd,
Cr, Cu, Hg, Ni, Pb and Zn. The Science of theTotal Environment, 375 (1–3): 180–203.doi:10.1016/j.scitotenv.2006.12.008.
Wang, M., Bai, Y., Chen, W., Markert, B., Peng, C.,and Ouyang, Z., 2012. A GIS TechnologyBased Potential Eco-Risk Assessment of Metalsin Urban Soils in Beijing, China. EnvironmentalPollution, 161 235–242. doi:10.1016/j.envpol.2011.09.030.
Wang, Y., Yang, Z., Shen, Z., Tang, Z., Niu, J., andGao, F., 2011. Assessment of Heavy Metals inSediments from a Typical Catchment of theYangtze River, China. EnvironmentalMonitoring and Assessment, 172 (1–4):407–417. doi:10.1007/s10661-010-1343-5.
Wentworth, C.K., 1922. A scale of grade and classterms for clastic. The Journal of Geology, 30:377-392.
Yu, Y., Song, J., Li, X.,Yuan, H., and Li. N., 2013.Fractionation, Sources and Budgets of PotentialHarmful Elements in Surface Sediments of theEast China Sea. Marine Pollution Bulletin, 68(1–2): 157–167. doi:10.1016/j.marpolbul.2012.11.043.
Zhang, P. Hu, R., Zhu, L., Wang, P.,Yin, D., andZhang, L. 2017. Distributions andContamination Assessment of Heavy Metals inthe Surface Sediments of Western LaizhouBay?: Implications for the Sources and in FlUencing Factors. Marine Pollution Bulletin, 119(1): 429–438. doi:10.1016/j.marpolbul.2017.03.046.
Zorer, Ö. S., Ceylan, H., and Doğru, M., 2008.Determination of Heavy Metals andComparison to Gross RadioactivityConcentration in Soil and Sediment Samples ofthe Bendimahi River Basin (Van, Turkey).Water, Air, and Soil Pollution, 196 (1–4):75–87. doi:10.1007/s11270-008-9758-0.

40 Fitri Budiyanto et al.