Vertical Distribution of Corn Stover Dry Mass Grown at Several US Locations
11
Vertical Distribution of Corn Stover Dry Mass Grown at Several US Locations Wally W. Wilhelm & Jane M. F. Johnson & Dave T. Lightle & Douglas L. Karlen & Jeff M. Novak & Nancy W. Barbour & David A. Laird & John Baker & Tyson E. Ochsner & Ardell D. Halvorson & David W. Archer & Francisco Arriaga Published online: 29 June 2010 # US Government 2010 Abstract Corn (Zea mays L.) stover was identified as a renewable non-food agricultural feedstock for production of liquid fuels, biopower, and other bioproducts, but it is also needed for erosion control, carbon sequestration, and nutrient cycling. To help balance these multiple demands, our objectives were to (1) determine height distribution of corn stover biomass, (2) quantify the percentage of stover that is corn cob, and (3) develop a general relationship The author Wally W. Wilhelm is deceased. The US Department of Agriculture offers its programs to all eligible persons regardless of race, color, age, sex, or national origin, and is an equal-opportunity employer. The use of trade, firm, or corporation names in this publication is for the information and convenience of the reader. Such use does not constitute an official endorsement or approval by the United States Department of Agriculture or the Agricultural Research Service of any product or service to the exclusion of others that may be suitable. W. W. Wilhelm Agroecosystems Management Research Unit, USDA-Agricultural Research Service, 117 Keim Hall, Lincoln, NE 68583, USA J. M. F. Johnson (*) : N. W. Barbour North Central Soil Conservation Research Laboratory, USDA-Agricultural Research Service, 803 Iowa Ave, Morris, MN 56267, USA e-mail: [email protected] N. W. Barbour e-mail: [email protected] D. T. Lightle USDA-NRCS National Soil Survey Center, 100 Centennial Mall N. Rm 152, Lincoln, NE 68508-3866, USA e-mail: [email protected] D. L. Karlen : D. A. Laird National Laboratory for Agriculture and the Environment, USDA-Agricultural Research Service, 2110 University Boulevard, Ames, IA 50011, USA D. L. Karlen e-mail: [email protected] D. A. Laird e-mail: [email protected] J. M. Novak Coastal Plains Research Center, USDA-Agricultural Research Service, 2611 W. Lucas St, Florence, SC 29501, USA e-mail: [email protected] J. Baker : T. E. Ochsner Soil and Water Management Research Unit, USDA-Agricultural Research Service, 439 Borlaug Hall 1991 Upper Buford Circle, St. Paul, MN 55108, USA J. Baker e-mail: [email protected] T. E. Ochsner e-mail: [email protected] Bioenerg. Res. (2011) 4:11–21 DOI 10.1007/s12155-010-9097-z
-
Upload
independent -
Category
Documents
-
view
3 -
download
0
Transcript of Vertical Distribution of Corn Stover Dry Mass Grown at Several US Locations
Vertical Distribution of Corn Stover Dry Mass Grownat Several US Locations
Wally W. Wilhelm & Jane M. F. Johnson & Dave T. Lightle & Douglas L. Karlen &
Jeff M. Novak & Nancy W. Barbour & David A. Laird & John Baker &
Tyson E. Ochsner & Ardell D. Halvorson & David W. Archer & Francisco Arriaga
Published online: 29 June 2010# US Government 2010
Abstract Corn (Zea mays L.) stover was identified as arenewable non-food agricultural feedstock for production ofliquid fuels, biopower, and other bioproducts, but it is alsoneeded for erosion control, carbon sequestration, and
nutrient cycling. To help balance these multiple demands,our objectives were to (1) determine height distribution ofcorn stover biomass, (2) quantify the percentage of stoverthat is corn cob, and (3) develop a general relationship
The author Wally W. Wilhelm is deceased.
The US Department of Agriculture offers its programs to all eligiblepersons regardless of race, color, age, sex, or national origin, and is anequal-opportunity employer.
The use of trade, firm, or corporation names in this publication is forthe information and convenience of the reader. Such use does notconstitute an official endorsement or approval by the United StatesDepartment of Agriculture or the Agricultural Research Service of anyproduct or service to the exclusion of others that may be suitable.
W. W. WilhelmAgroecosystems Management Research Unit,USDA-Agricultural Research Service,117 Keim Hall,Lincoln, NE 68583, USA
J. M. F. Johnson (*) :N. W. BarbourNorth Central Soil Conservation Research Laboratory,USDA-Agricultural Research Service,803 Iowa Ave,Morris, MN 56267, USAe-mail: [email protected]
N. W. Barboure-mail: [email protected]
D. T. LightleUSDA-NRCS National Soil Survey Center,100 Centennial Mall N. Rm 152,Lincoln, NE 68508-3866, USAe-mail: [email protected]
D. L. Karlen :D. A. LairdNational Laboratory for Agriculture and the Environment,USDA-Agricultural Research Service,2110 University Boulevard,Ames, IA 50011, USA
D. L. Karlene-mail: [email protected]
D. A. Lairde-mail: [email protected]
J. M. NovakCoastal Plains Research Center,USDA-Agricultural Research Service,2611 W. Lucas St,Florence, SC 29501, USAe-mail: [email protected]
J. Baker : T. E. OchsnerSoil and Water Management Research Unit,USDA-Agricultural Research Service,439 Borlaug Hall 1991 Upper Buford Circle,St. Paul, MN 55108, USA
J. Bakere-mail: [email protected]
T. E. Ochsnere-mail: [email protected]
Bioenerg. Res. (2011) 4:11–21DOI 10.1007/s12155-010-9097-z

between plant harvest height and stover remaining in thefield for a broad range of growing conditions, soil types,and hybrids in different regions. Plant height, dry grain,stover, and cob yield data were collected at eight USlocations. Overall, stover yield increased about 0.85 Mg ha-1 and cob yield increased about 0.10 Mg ha-1 for each1.0 Mg ha-1 increase in dry grain yield. At grain harvest, thestover-to-grain ratio ranged from 0.64 to 0.96 and cob-to-grain ratio ranged from 0.11 to 0.19. A strong nearly 1:1linear (r2=0.93) relationship between the relative cuttingheight and relative biomass remaining in the field wasobserved across all sites. These data were requested by theUS Department of Agriculture-Natural Resource Conserva-tion Service to help improve version 2 of the RevisedUniversal Soil Loss Equation (RUSLE2) and Wind ErosionPrediction System and better estimate corn stover harvestrates based on cutting height or selective organ harvest (e.g.,grain and cob only). This information will improve thecapacity of RUSLE2 and similar models to predict theerosion risk associated with harvesting corn residues.
Keywords Cobs . Crop residues . Corn stover .
Harvest index RUSLE2 . Soil erosion . Soil organic matter
Abbreviations(GLM) General linear model(HI) Harvest index(RUSLE2) Revised Universal Soil Loss Equation version 2(SOM) Soil organic matter(USDA-ARS)
US Department of Agriculture-AgricultureResearch Service
(USDA- USDepartment of Agriculture-Natural Resource
NRCS) Conservation Service(WEPS) Wind Erosion Prediction System
Introduction
Corn stover is anticipated to be a second-generation (non-food) agricultural feedstock for bioenergy, which will helpreduce reliance on imported fossil fuel, increase revenue forfarmers and rural communities, and reduce greenhouse gasemissions. Non-grain biomass (e.g., straw and stover)commonly called residue is viewed by some as aninexpensive, “unused” feedstock for enzymatic ethanoland other biofuel production or biopower through thermo-chemical processes (e.g., gasification or pyrolysis). Currentprojections to meet the 2022 target of ∼76 billion liters peryear of second-generation ethanol and other renewablefuels will require upwards of 218 million Mg of dryfeedstock, which is equivalent to about 50% of theagricultural residue produced from the eight states leadingin US crop production [4]. Furthermore, the amount ofagricultural residue that can be harvested in a sustainablemanner is still being determined since a portion of theresidue needs to remain in the field to control erosion,maintain soil organic matter (SOM), and cycle nutrients[10, 32].
Typically in the USA, unless corn stover is harvested foranimal feed or bedding it remains in the field. Crop residueretained in the field replenishes SOM, recycles nutrients (e.g.,N, P, K, etc.) and when kept on the soil surface can reducerunoff and minimize soil erosion [15, 16, 19, 31]. While theamount of biomass needed to sustain SOM can exceed theamount needed to control water and soil erosion [32], it isstill critical to understand the relationship between residueharvest and soil erosion.
Mechanical harvesting-systems are being developed andtested that collect corn grain and stover, or grain and cobsin one-pass [12, 26]. The amount of stover that remains inthe field will vary depending upon the cutting height [12]and/or if the cobs are collected during harvest [11]. Shinnerand Binversie [24] reported that 56% of the stover dry masswas in stalk, 15% in cob, 8% in husk, and 21% in leaves.This is similar to data presented by Pordesimo et al. [22].Both studies segregated biomass by organ, however, duringa one-pass harvest operation, the harvested stover would becomprised of multiple organs, and the relative proportionsof stalk, cobs, husks, and leaves will vary with cuttingheight. As the cutting height is lowered, the amount ofstover remaining on the soil surface to prevent erosion andto maintain SOM decreases. In addition to the mass ofstover, diameter of the remaining stalks likely will changedepending on the cutting height. Stalk diameter in
A. D. HalvorsonUSDA-Agricultural Research Service,2150 Centre Ave. Bldg. D. Suite 100,Fort Collins, CO 80526, USAe-mail: [email protected]
D. W. ArcherNorthern Great Plains Research Laboratory, USDA-AgriculturalResearch Service,PO Box 459, Mandan, ND 58554, USAe-mail: [email protected]
F. ArriagaNational Soil Dynamics Research Laboratory, USDA-AgriculturalResearch Service,411 S. Donahue Dr,Auburn, AL 36832, USAe-mail: [email protected]
Present Address:T. E. OchsnerDepartment of Plant and Soil Sciences, Oklahoma StateUniversity,Stillwater, OK 74078, USA
12 Bioenerg. Res. (2011) 4:11–21
conjunction with orientation (i.e., flat or standing) willdetermine soil coverage and the amount of protection. Aftera low-cut, one-pass harvest, fields with vertical corn stubble(∼10 cm) without tillage can still be vulnerable to watererosion [12].
It is likely that one-pass harvest operations wouldoccur at grain harvest. However, harvest index (HI) wasdefined as the ratio of grain yield to total abovegroundbiomass at physiological maturity [8]. Sampling at bothphysiological maturity and grain harvest allows compar-ison of HI. If apparent HI decreases between thephysiological maturity and grain harvest, it indicates adecrease in the harvestable stover. Loss of harvestablestover could be caused by leaf drop or loss of tassels andstalk above the ear. Ensiling corn stover is also beingconsidered as a strategy to improve harvest timeliness andreduce harvest losses [25], but does not necessarilyprovide an economic advantage compared with drystorage methods (e.g., bales) [2] and can limit marketflexibility because the grain and stover remain combinedwhen harvested for silage. However, ensiling couldaccommodate earlier harvest of stover at higher watercontent. Currently, the RUSLE2 and Wind ErosionPrediction System (WEPS) models are being modifiedby US Department of Agriculture-Natural ResourceConservation Service (USDA-NRCS) to accommodatefractional harvest of stover at the time of grain harvest.However, modification of these models is limited by thelack of data describing the distribution of corn stover massor stem diameter with plant height [13]. To expand theRUSLE2 domain and improve its handling of stoverremoval practices, data are needed from a broad range oflocations with different hybrids, soil fertility, soil types,and climate to describe dry stover mass distribution withplant height. The objectives of the study were to (1)
determine the height distribution of corn stover mass; (2)determine the percentage of stover mass that is corn cob;and (3) develop a general relationship between plantharvest height and the mass of stover remaining in thefield.
Materials and Methods
Experimental Sites
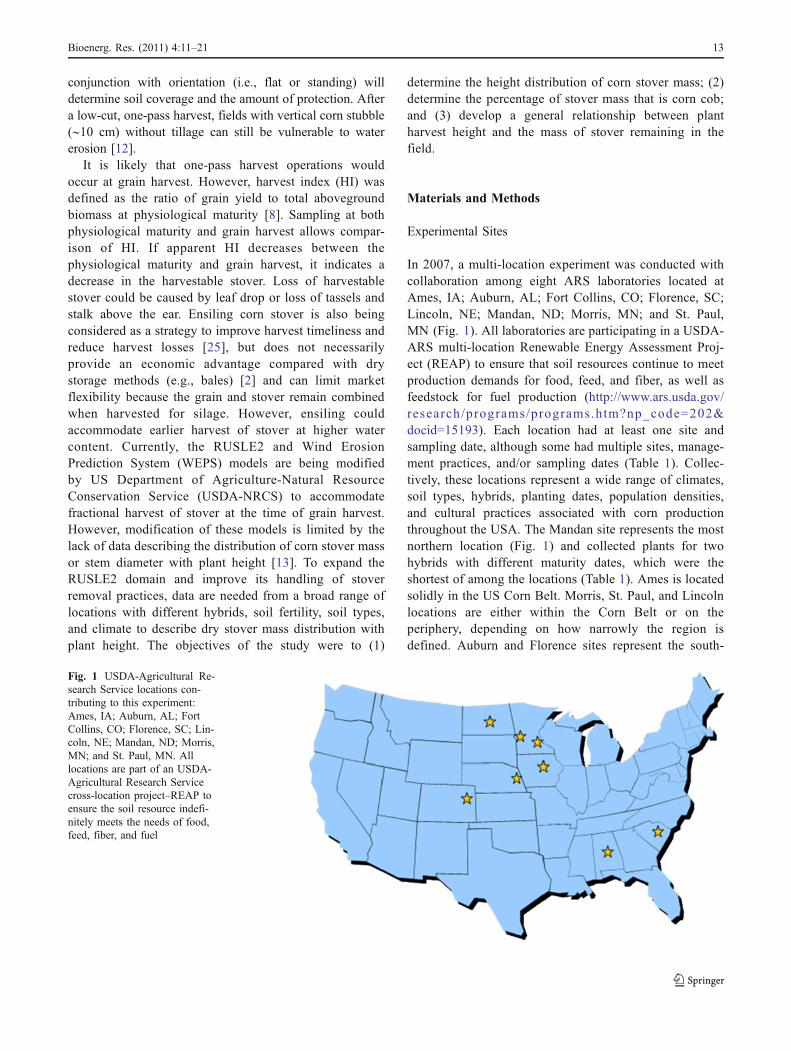
In 2007, a multi-location experiment was conducted withcollaboration among eight ARS laboratories located atAmes, IA; Auburn, AL; Fort Collins, CO; Florence, SC;Lincoln, NE; Mandan, ND; Morris, MN; and St. Paul,MN (Fig. 1). All laboratories are participating in a USDA-ARS multi-location Renewable Energy Assessment Proj-ect (REAP) to ensure that soil resources continue to meetproduction demands for food, feed, and fiber, as well asfeedstock for fuel production (http://www.ars.usda.gov/research/programs/programs.htm?np_code=202&docid=15193). Each location had at least one site andsampling date, although some had multiple sites, manage-ment practices, and/or sampling dates (Table 1). Collec-tively, these locations represent a wide range of climates,soil types, hybrids, planting dates, population densities,and cultural practices associated with corn productionthroughout the USA. The Mandan site represents the mostnorthern location (Fig. 1) and collected plants for twohybrids with different maturity dates, which were theshortest of among the locations (Table 1). Ames is locatedsolidly in the US Corn Belt. Morris, St. Paul, and Lincolnlocations are either within the Corn Belt or on theperiphery, depending on how narrowly the region isdefined. Auburn and Florence sites represent the south-
Fig. 1 USDA-Agricultural Re-search Service locations con-tributing to this experiment:Ames, IA; Auburn, AL; FortCollins, CO; Florence, SC; Lin-coln, NE; Mandan, ND; Morris,MN; and St. Paul, MN. Alllocations are part of an USDA-Agricultural Research Servicecross-location project–REAP toensure the soil resource indefi-nitely meets the needs of food,feed, fiber, and fuel
Bioenerg. Res. (2011) 4:11–21 13
Tab
le1
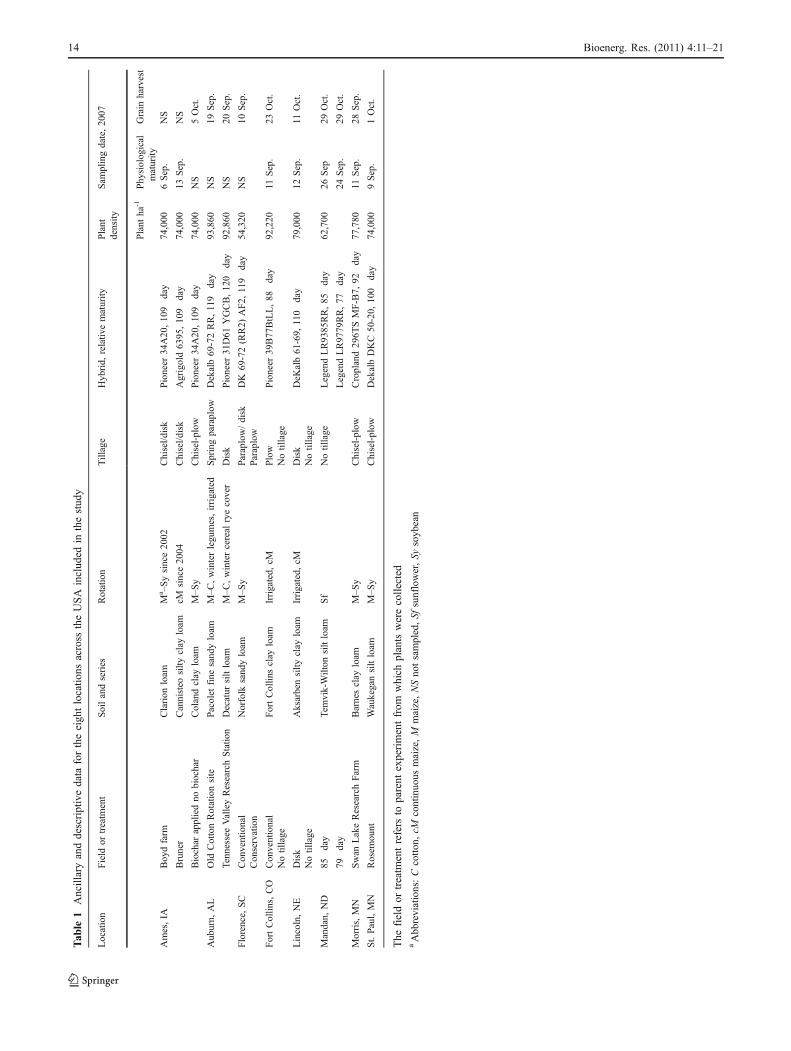
Ancillaryanddescriptivedata
fortheeigh
tlocatio
nsacross
theUSA
includ
edin
thestud
y
Location
Field
ortreatm
ent
Soilandseries
Rotation
Tillage
Hybrid,
relativ
ematurity
Plant
density
Sam
plingdate,2007
Plant
ha-1
Physiological
maturity
Grain
harvest
Ames,IA
Boydfarm
Clarion
loam
Ma –Sysince2002
Chisel/d
isk
Pioneer
34A20,109
day
74,000
6Sep.
NS
Bruner
Cannisteo
silty
clay
loam
cMsince2004
Chisel/d
isk
Agrigold6395,109
day
74,000
13Sep.
NS
Biochar
appliedno
biochar
Colandclay
loam
M–S
yChisel-plow
Pioneer
34A20,109
day
74,000
NS
5Oct.
Auburn,
AL
Old
CottonRotationsite
Pacolet
fine
sandyloam
M–C
,winterlegumes,irrigated
Springparaplow
Dekalb69-72RR,119
day
93,860
NS
19Sep.
TennesseeValleyResearchStatio
nDecatur
siltloam
M–C
,wintercereal
ryecover
Disk
Pioneer
31D61
YGCB,120
day
92,860
NS
20Sep.
Florence,
SC
Conventional
Norfolk
sandyloam
M–S
yParaplow/disk
DK
69-72(RR2)
AF2,
119
day
54,320
NS
10Sep.
Conservation
Paraplow
FortCollin
s,CO
Conventional
FortCollin
sclay
loam
Irrigated,
cMPlow
Pioneer
39B77BtLL,88
day
92,220
11Sep.
23Oct.
Notillage
Notillage
Lincoln,NE
Disk
Aksarbensilty
clay
loam
Irrigated,
cMDisk
DeK
alb61-69,
110
day
79,000
12Sep.
11Oct.
Notillage
Notillage
Mandan,
ND
85day
Tem
vik-Wilton
siltloam
Sf
Notillage
LegendLR9385RR,85
day
62,700
26Sep
29Oct.
79day
LegendLR9779RR,77
day
24Sep.
29Oct.
Morris,MN
Swan
LakeResearchFarm
Barnesclay
loam
M–S
yChisel-plow
Cropland296T
SMF-B7,
92day
77,780
11Sep.
28Sep.
St.Paul,MN
Rosem
ount
Waukegansiltloam
M–S
yChisel-plow
DekalbDKC50-20,
100
day
74,000
9Sep.
1Oct.
The
fieldor
treatm
entrefers
toparent
experimentfrom
which
plantswerecollected
aAbbreviations:Ccotto
n,cM
continuous
maize,M
maize,NSno
tsampled,Sf
sunflower,Sy
soyb
ean
14 Bioenerg. Res. (2011) 4:11–21
ernmost locations, using the longest maturity hybrids. FortCollins site was the western-most location of the study.Florence, Fort Collins, and Lincoln sites collected plantsfrom contrasting tillage management systems. At grainharvest, the Ames site collected plants from a studyevaluating effects of amending soil with a by-product fromthermochemical energy production. The Lincoln site, FortCollins site, and one field at the Auburn site wereirrigated, while all other sites were rainfed.
Sample Method
Plants were sampled destructively from a 1.0 m2 area atphysiological maturity and/or at grain harvest. The numberof plants included in the 1.0 m2 ranged from five to tendepending on planting population (Table 1). The cornplants were cut as close to the soil surface as possible. Earswere removed from the husk and dried separately. Theheight to the base of the grain-containing ear (ear height),height to the node at which the ear shank was attached tothe stalk (shank height), and plant height were recorded tothe nearest centimeter for each plant. Corn stalks weremarked at 10-cm intervals starting at ground-level andcontinuing upward with the top segment being one 10-cminterval above the base of the primary grain-containing ear.All plant material above the top interval was pooled into asingle above-ear sample. All plant parts (cob, above-ear,and 10-cm increment samples) were oven-dried at 60°C toa constant weight. Grain was removed from cob prior todetermining dry cob weight.
Barren plants were excluded from the stover-to-grainratios or HI due to the small sample size. Including barrenplants skewed the stover-to-grain ratio to extremely high(>4) values. The Mandan and Lincoln locations were theonly sites that reported barren plants within the sampledarea.
Statistical Analysis
The study used a multi-location approach to ascertaingeneral relationships among plant yield parameters. Thiswas not designed nor intended to be used for examiningdifferences associated with location, soil resource,management practices, and/or hybrid selection. Descrip-tive statistics (mean and standard error) were calculatedusing Proc mean within SAS 9.1 software (SAS InstituteInc., Cary, NC) to provide information on the range andvariation of the data used in the regression analyses.Linear regression functions within the SigmaPlot soft-ware for Windows version 10.0 (Systat Software, Inc.,Chicago, IL) were used to assess linearity. Using dataonly from locations (Table 1) that sampled the same fieldsat both physiological maturity and grain harvest, a general
linear model using SAS software, version 9.1, [23] wasused to determine if there were statistically significantdifferences due to sample date. Variability due to locationand location-specific factors (e.g., management practice,hybrid, etc.) was included in the error term.
Results
Height
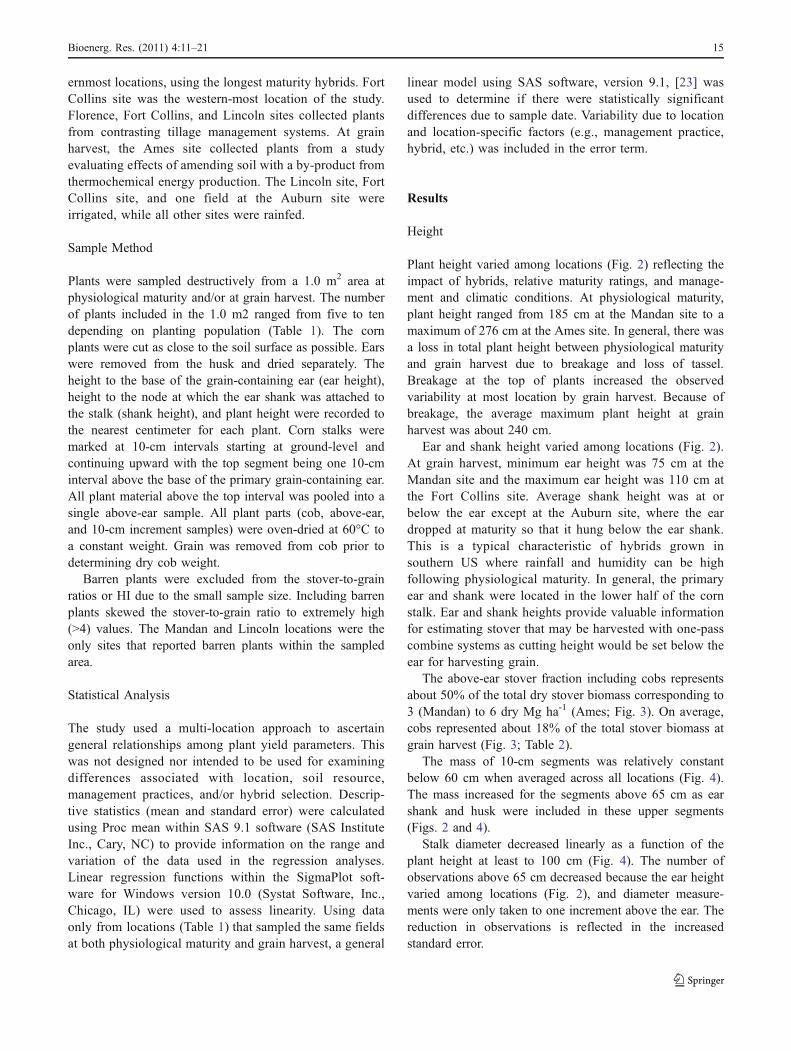
Plant height varied among locations (Fig. 2) reflecting theimpact of hybrids, relative maturity ratings, and manage-ment and climatic conditions. At physiological maturity,plant height ranged from 185 cm at the Mandan site to amaximum of 276 cm at the Ames site. In general, there wasa loss in total plant height between physiological maturityand grain harvest due to breakage and loss of tassel.Breakage at the top of plants increased the observedvariability at most location by grain harvest. Because ofbreakage, the average maximum plant height at grainharvest was about 240 cm.
Ear and shank height varied among locations (Fig. 2).At grain harvest, minimum ear height was 75 cm at theMandan site and the maximum ear height was 110 cm atthe Fort Collins site. Average shank height was at orbelow the ear except at the Auburn site, where the eardropped at maturity so that it hung below the ear shank.This is a typical characteristic of hybrids grown insouthern US where rainfall and humidity can be highfollowing physiological maturity. In general, the primaryear and shank were located in the lower half of the cornstalk. Ear and shank heights provide valuable informationfor estimating stover that may be harvested with one-passcombine systems as cutting height would be set below theear for harvesting grain.
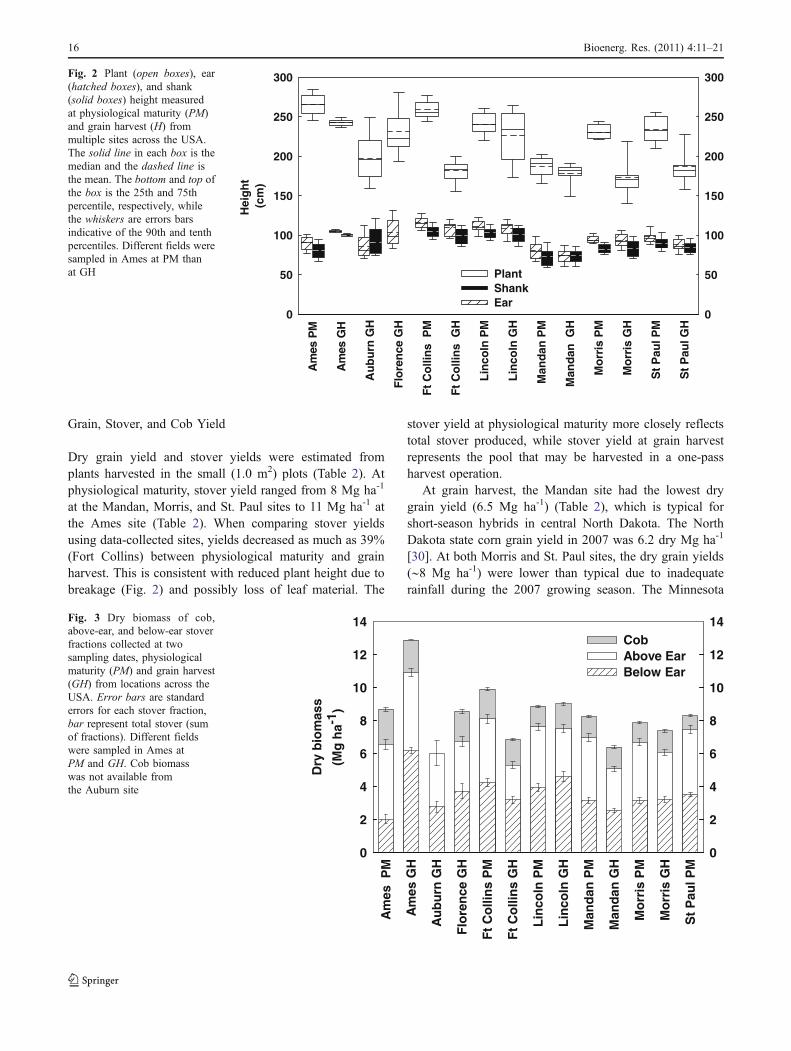
The above-ear stover fraction including cobs representsabout 50% of the total dry stover biomass corresponding to3 (Mandan) to 6 dry Mg ha-1 (Ames; Fig. 3). On average,cobs represented about 18% of the total stover biomass atgrain harvest (Fig. 3; Table 2).
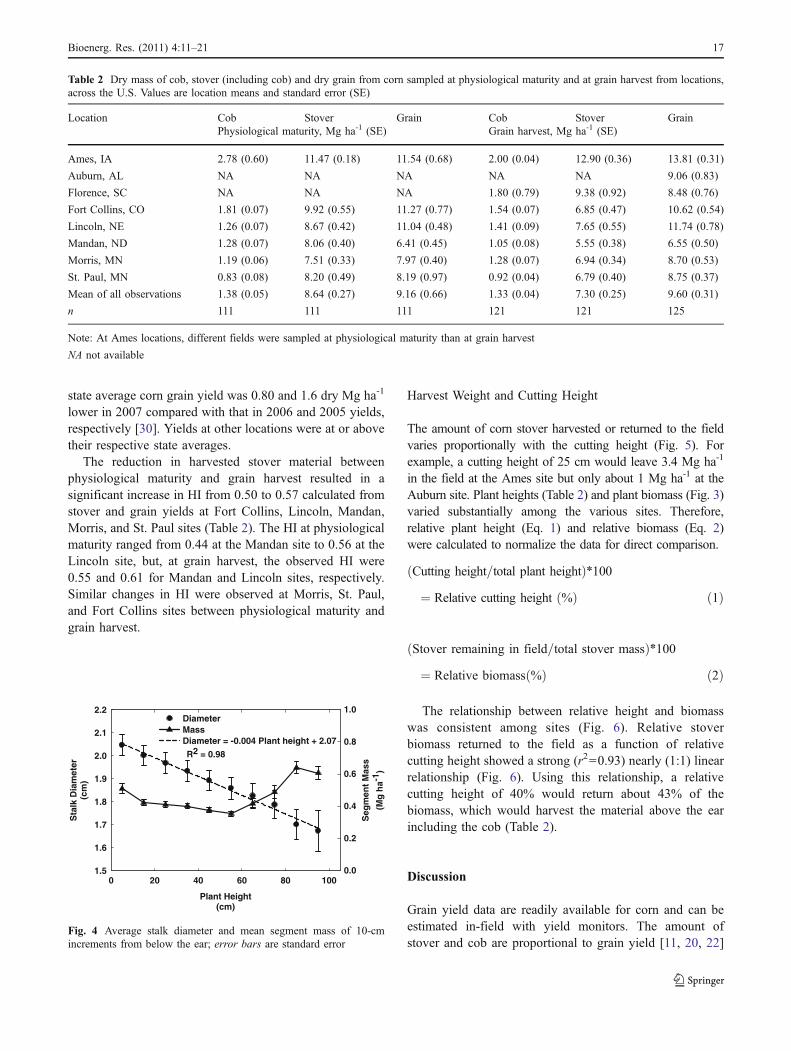
The mass of 10-cm segments was relatively constantbelow 60 cm when averaged across all locations (Fig. 4).The mass increased for the segments above 65 cm as earshank and husk were included in these upper segments(Figs. 2 and 4).
Stalk diameter decreased linearly as a function of theplant height at least to 100 cm (Fig. 4). The number ofobservations above 65 cm decreased because the ear heightvaried among locations (Fig. 2), and diameter measure-ments were only taken to one increment above the ear. Thereduction in observations is reflected in the increasedstandard error.
Bioenerg. Res. (2011) 4:11–21 15
Grain, Stover, and Cob Yield
Dry grain yield and stover yields were estimated fromplants harvested in the small (1.0 m2) plots (Table 2). Atphysiological maturity, stover yield ranged from 8 Mg ha-1
at the Mandan, Morris, and St. Paul sites to 11 Mg ha-1 atthe Ames site (Table 2). When comparing stover yieldsusing data-collected sites, yields decreased as much as 39%(Fort Collins) between physiological maturity and grainharvest. This is consistent with reduced plant height due tobreakage (Fig. 2) and possibly loss of leaf material. The
stover yield at physiological maturity more closely reflectstotal stover produced, while stover yield at grain harvestrepresents the pool that may be harvested in a one-passharvest operation.
At grain harvest, the Mandan site had the lowest drygrain yield (6.5 Mg ha-1) (Table 2), which is typical forshort-season hybrids in central North Dakota. The NorthDakota state corn grain yield in 2007 was 6.2 dry Mg ha-1
[30]. At both Morris and St. Paul sites, the dry grain yields(∼8 Mg ha-1) were lower than typical due to inadequaterainfall during the 2007 growing season. The Minnesota
Am
es P
M
Am
es G
H
Au
bu
rn G
H
Flo
ren
ce G
H
Ft
Co
llin
s P
M
Ft
Co
llin
s G
H
Lin
coln
PM
Lin
coln
GH
Man
dan
PM
Man
dan
GH
Mo
rris
PM
Mo
rris
GH
St
Pau
l PM
St
Pau
l GH
Hei
gh
t (c
m)
0
50
100
150
200
250
300
0
50
100
150
200
250
300
Plant Shank Ear
Fig. 2 Plant (open boxes), ear(hatched boxes), and shank(solid boxes) height measuredat physiological maturity (PM)and grain harvest (H) frommultiple sites across the USA.The solid line in each box is themedian and the dashed line isthe mean. The bottom and top ofthe box is the 25th and 75thpercentile, respectively, whilethe whiskers are errors barsindicative of the 90th and tenthpercentiles. Different fields weresampled in Ames at PM thanat GH
Am
es P
M
Am
es G
H
Au
bu
rn G
H
Flo
ren
ce G
H
Ft
Co
llin
s P
M
Ft
Co
llin
s G
H
Lin
coln
PM
Lin
coln
GH
Man
dan
PM
Man
dan
GH
Mo
rris
PM
Mo
rris
GH
St
Pau
l PM
Dry
bio
mas
s
(Mg
ha-1
)
0
2
4
6
8
10
12
14
0
2
4
6
8
10
12
14CobAbove EarBelow Ear
Fig. 3 Dry biomass of cob,above-ear, and below-ear stoverfractions collected at twosampling dates, physiologicalmaturity (PM) and grain harvest(GH) from locations across theUSA. Error bars are standarderrors for each stover fraction,bar represent total stover (sumof fractions). Different fieldswere sampled in Ames atPM and GH. Cob biomasswas not available fromthe Auburn site
16 Bioenerg. Res. (2011) 4:11–21
state average corn grain yield was 0.80 and 1.6 dry Mg ha-1
lower in 2007 compared with that in 2006 and 2005 yields,respectively [30]. Yields at other locations were at or abovetheir respective state averages.
The reduction in harvested stover material betweenphysiological maturity and grain harvest resulted in asignificant increase in HI from 0.50 to 0.57 calculated fromstover and grain yields at Fort Collins, Lincoln, Mandan,Morris, and St. Paul sites (Table 2). The HI at physiologicalmaturity ranged from 0.44 at the Mandan site to 0.56 at theLincoln site, but, at grain harvest, the observed HI were0.55 and 0.61 for Mandan and Lincoln sites, respectively.Similar changes in HI were observed at Morris, St. Paul,and Fort Collins sites between physiological maturity andgrain harvest.
Harvest Weight and Cutting Height
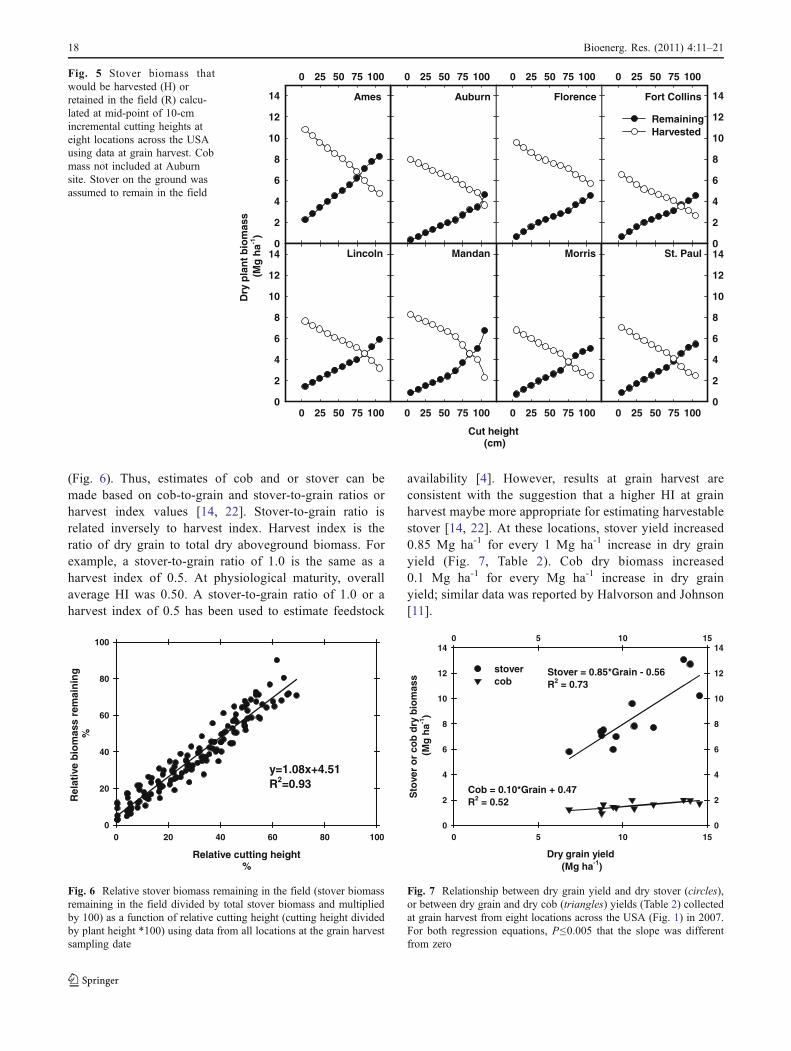
The amount of corn stover harvested or returned to the fieldvaries proportionally with the cutting height (Fig. 5). Forexample, a cutting height of 25 cm would leave 3.4 Mg ha-1
in the field at the Ames site but only about 1 Mg ha-1 at theAuburn site. Plant heights (Table 2) and plant biomass (Fig. 3)varied substantially among the various sites. Therefore,relative plant height (Eq. 1) and relative biomass (Eq. 2)were calculated to normalize the data for direct comparison.
Cutting height=total plant heightð Þ»100¼ Relative cutting height %ð Þ ð1Þ
Stover remaining in field=total stover massð Þ»100¼ Relative biomass %ð Þ ð2Þ
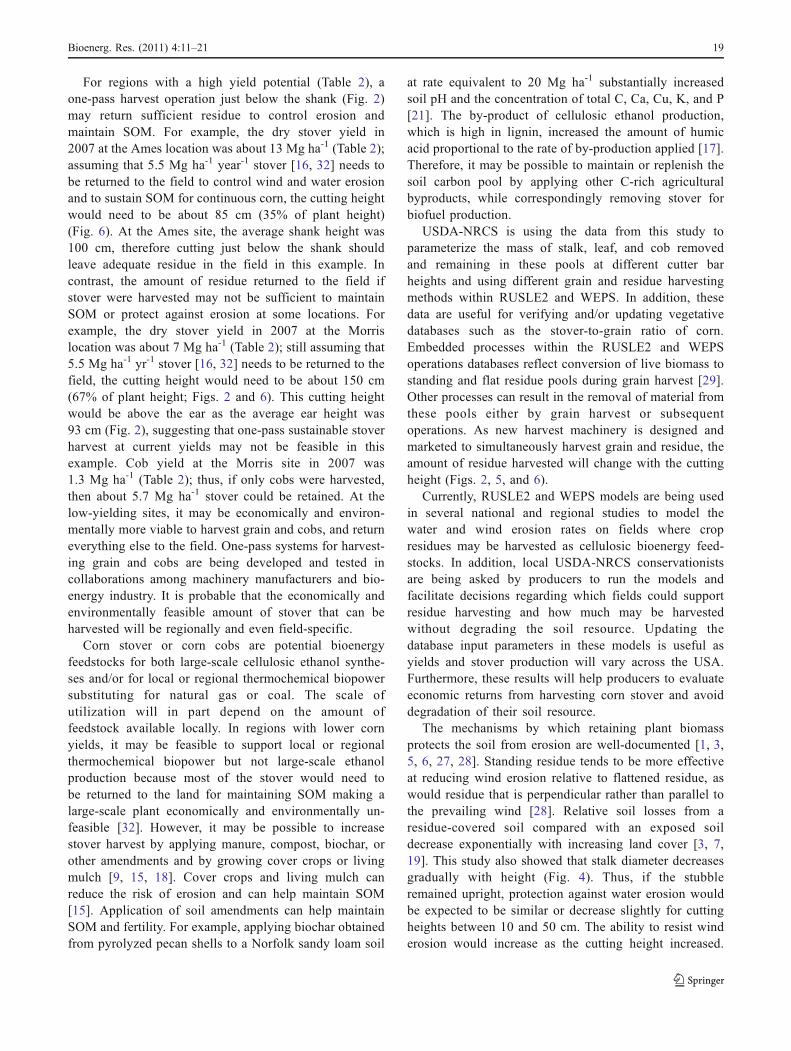
The relationship between relative height and biomasswas consistent among sites (Fig. 6). Relative stoverbiomass returned to the field as a function of relativecutting height showed a strong (r2=0.93) nearly (1:1) linearrelationship (Fig. 6). Using this relationship, a relativecutting height of 40% would return about 43% of thebiomass, which would harvest the material above the earincluding the cob (Table 2).
Discussion
Grain yield data are readily available for corn and can beestimated in-field with yield monitors. The amount ofstover and cob are proportional to grain yield [11, 20, 22]
Plant Height(cm)
0 20 40 60 80 100
Sta
lk D
iam
eter
(cm
)
1.5
1.6
1.7
1.8
1.9
2.0
2.1
2.2
Seg
men
t M
ass
(Mg
ha-1
)
0.0
0.2
0.4
0.6
0.8
1.0DiameterMassDiameter = -0.004 Plant height + 2.07
R2 = 0.98
Fig. 4 Average stalk diameter and mean segment mass of 10-cmincrements from below the ear; error bars are standard error
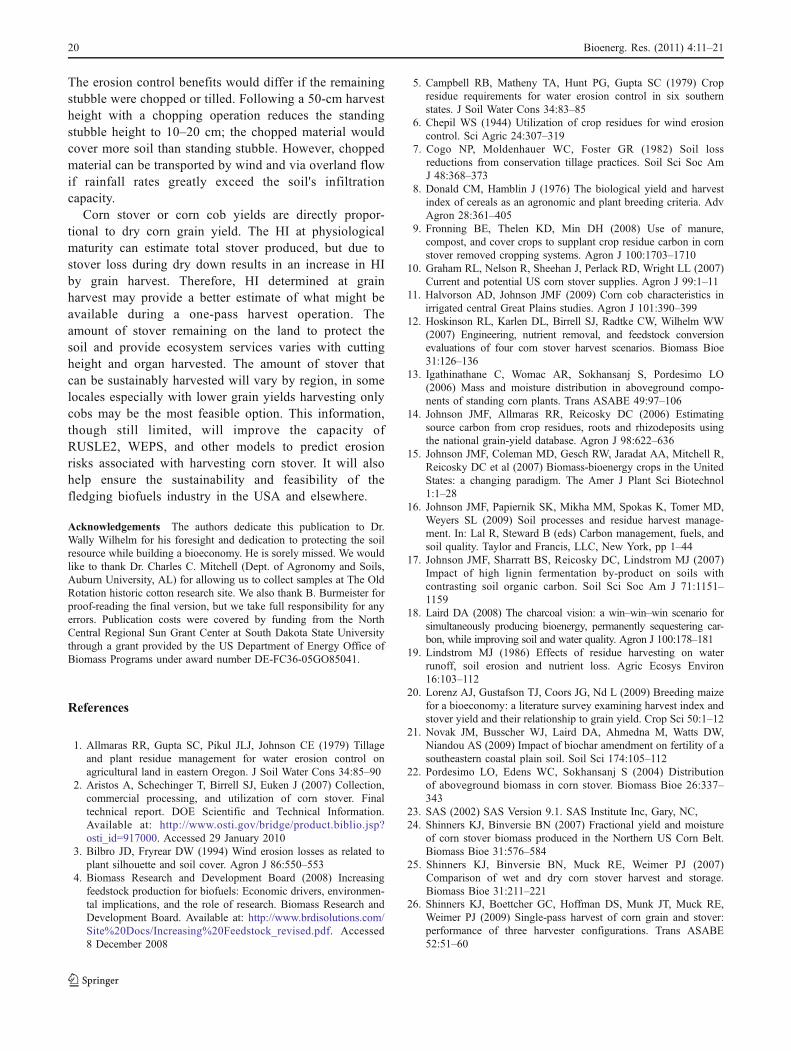
Table 2 Dry mass of cob, stover (including cob) and dry grain from corn sampled at physiological maturity and at grain harvest from locations,across the U.S. Values are location means and standard error (SE)
Location Cob Stover Grain Cob Stover GrainPhysiological maturity, Mg ha-1 (SE) Grain harvest, Mg ha-1 (SE)
Ames, IA 2.78 (0.60) 11.47 (0.18) 11.54 (0.68) 2.00 (0.04) 12.90 (0.36) 13.81 (0.31)
Auburn, AL NA NA NA NA NA 9.06 (0.83)
Florence, SC NA NA NA 1.80 (0.79) 9.38 (0.92) 8.48 (0.76)
Fort Collins, CO 1.81 (0.07) 9.92 (0.55) 11.27 (0.77) 1.54 (0.07) 6.85 (0.47) 10.62 (0.54)
Lincoln, NE 1.26 (0.07) 8.67 (0.42) 11.04 (0.48) 1.41 (0.09) 7.65 (0.55) 11.74 (0.78)
Mandan, ND 1.28 (0.07) 8.06 (0.40) 6.41 (0.45) 1.05 (0.08) 5.55 (0.38) 6.55 (0.50)
Morris, MN 1.19 (0.06) 7.51 (0.33) 7.97 (0.40) 1.28 (0.07) 6.94 (0.34) 8.70 (0.53)
St. Paul, MN 0.83 (0.08) 8.20 (0.49) 8.19 (0.97) 0.92 (0.04) 6.79 (0.40) 8.75 (0.37)
Mean of all observations 1.38 (0.05) 8.64 (0.27) 9.16 (0.66) 1.33 (0.04) 7.30 (0.25) 9.60 (0.31)
n 111 111 111 121 121 125
Note: At Ames locations, different fields were sampled at physiological maturity than at grain harvest
NA not available
Bioenerg. Res. (2011) 4:11–21 17
(Fig. 6). Thus, estimates of cob and or stover can bemade based on cob-to-grain and stover-to-grain ratios orharvest index values [14, 22]. Stover-to-grain ratio isrelated inversely to harvest index. Harvest index is theratio of dry grain to total dry aboveground biomass. Forexample, a stover-to-grain ratio of 1.0 is the same as aharvest index of 0.5. At physiological maturity, overallaverage HI was 0.50. A stover-to-grain ratio of 1.0 or aharvest index of 0.5 has been used to estimate feedstock
availability [4]. However, results at grain harvest areconsistent with the suggestion that a higher HI at grainharvest maybe more appropriate for estimating harvestablestover [14, 22]. At these locations, stover yield increased0.85 Mg ha-1 for every 1 Mg ha-1 increase in dry grainyield (Fig. 7, Table 2). Cob dry biomass increased0.1 Mg ha-1 for every Mg ha-1 increase in dry grainyield; similar data was reported by Halvorson and Johnson[11].
Relative cutting height%
0 20 40 60 80 100
Rel
ativ
e b
iom
ass
rem
ain
ing
%
0
20
40
60
80
100
y=1.08x+4.51R2=0.93
Fig. 6 Relative stover biomass remaining in the field (stover biomassremaining in the field divided by total stover biomass and multipliedby 100) as a function of relative cutting height (cutting height dividedby plant height *100) using data from all locations at the grain harvestsampling date
Fort Collins
0 25 50 75 100
0
2
4
6
8
10
12
14Auburn
0 25 50 75 100
Ames
0 25 50 75 100
Dry
pla
nt
bio
mas
s (M
g h
a-1)
0
2
4
6
8
10
12
14
RemainingHarvested
Mandan
Cut height (cm)
0 25 50 75 100
Lincoln
0 25 50 75 1000
2
4
6
8
10
12
14
Florence
0 25 50 75 100
Morris
0 25 50 75 100
St. Paul
0 25 50 75 1000
2
4
6
8
10
12
14
Fig. 5 Stover biomass thatwould be harvested (H) orretained in the field (R) calcu-lated at mid-point of 10-cmincremental cutting heights ateight locations across the USAusing data at grain harvest. Cobmass not included at Auburnsite. Stover on the ground wasassumed to remain in the field
Dry grain yield (Mg ha-1)
0 5 10 15
0 5 10 15
Sto
ver
or
cob
dry
bio
mas
s (
Mg
ha-1
)
0
2
4
6
8
10
12
14
0
2
4
6
8
10
12
14
stovercob
Stover = 0.85*Grain - 0.56R2 = 0.73
Cob = 0.10*Grain + 0.47R2 = 0.52
Fig. 7 Relationship between dry grain yield and dry stover (circles),or between dry grain and dry cob (triangles) yields (Table 2) collectedat grain harvest from eight locations across the USA (Fig. 1) in 2007.For both regression equations, P≤0.005 that the slope was differentfrom zero
18 Bioenerg. Res. (2011) 4:11–21
For regions with a high yield potential (Table 2), aone-pass harvest operation just below the shank (Fig. 2)may return sufficient residue to control erosion andmaintain SOM. For example, the dry stover yield in2007 at the Ames location was about 13 Mg ha-1 (Table 2);assuming that 5.5 Mg ha-1 year-1 stover [16, 32] needs tobe returned to the field to control wind and water erosionand to sustain SOM for continuous corn, the cutting heightwould need to be about 85 cm (35% of plant height)(Fig. 6). At the Ames site, the average shank height was100 cm, therefore cutting just below the shank shouldleave adequate residue in the field in this example. Incontrast, the amount of residue returned to the field ifstover were harvested may not be sufficient to maintainSOM or protect against erosion at some locations. Forexample, the dry stover yield in 2007 at the Morrislocation was about 7 Mg ha-1 (Table 2); still assuming that5.5 Mg ha-1 yr-1 stover [16, 32] needs to be returned to thefield, the cutting height would need to be about 150 cm(67% of plant height; Figs. 2 and 6). This cutting heightwould be above the ear as the average ear height was93 cm (Fig. 2), suggesting that one-pass sustainable stoverharvest at current yields may not be feasible in thisexample. Cob yield at the Morris site in 2007 was1.3 Mg ha-1 (Table 2); thus, if only cobs were harvested,then about 5.7 Mg ha-1 stover could be retained. At thelow-yielding sites, it may be economically and environ-mentally more viable to harvest grain and cobs, and returneverything else to the field. One-pass systems for harvest-ing grain and cobs are being developed and tested incollaborations among machinery manufacturers and bio-energy industry. It is probable that the economically andenvironmentally feasible amount of stover that can beharvested will be regionally and even field-specific.
Corn stover or corn cobs are potential bioenergyfeedstocks for both large-scale cellulosic ethanol synthe-ses and/or for local or regional thermochemical biopowersubstituting for natural gas or coal. The scale ofutilization will in part depend on the amount offeedstock available locally. In regions with lower cornyields, it may be feasible to support local or regionalthermochemical biopower but not large-scale ethanolproduction because most of the stover would need tobe returned to the land for maintaining SOM making alarge-scale plant economically and environmentally un-feasible [32]. However, it may be possible to increasestover harvest by applying manure, compost, biochar, orother amendments and by growing cover crops or livingmulch [9, 15, 18]. Cover crops and living mulch canreduce the risk of erosion and can help maintain SOM[15]. Application of soil amendments can help maintainSOM and fertility. For example, applying biochar obtainedfrom pyrolyzed pecan shells to a Norfolk sandy loam soil
at rate equivalent to 20 Mg ha-1 substantially increasedsoil pH and the concentration of total C, Ca, Cu, K, and P[21]. The by-product of cellulosic ethanol production,which is high in lignin, increased the amount of humicacid proportional to the rate of by-production applied [17].Therefore, it may be possible to maintain or replenish thesoil carbon pool by applying other C-rich agriculturalbyproducts, while correspondingly removing stover forbiofuel production.
USDA-NRCS is using the data from this study toparameterize the mass of stalk, leaf, and cob removedand remaining in these pools at different cutter barheights and using different grain and residue harvestingmethods within RUSLE2 and WEPS. In addition, thesedata are useful for verifying and/or updating vegetativedatabases such as the stover-to-grain ratio of corn.Embedded processes within the RUSLE2 and WEPSoperations databases reflect conversion of live biomass tostanding and flat residue pools during grain harvest [29].Other processes can result in the removal of material fromthese pools either by grain harvest or subsequentoperations. As new harvest machinery is designed andmarketed to simultaneously harvest grain and residue, theamount of residue harvested will change with the cuttingheight (Figs. 2, 5, and 6).
Currently, RUSLE2 and WEPS models are being usedin several national and regional studies to model thewater and wind erosion rates on fields where cropresidues may be harvested as cellulosic bioenergy feed-stocks. In addition, local USDA-NRCS conservationistsare being asked by producers to run the models andfacilitate decisions regarding which fields could supportresidue harvesting and how much may be harvestedwithout degrading the soil resource. Updating thedatabase input parameters in these models is useful asyields and stover production will vary across the USA.Furthermore, these results will help producers to evaluateeconomic returns from harvesting corn stover and avoiddegradation of their soil resource.
The mechanisms by which retaining plant biomassprotects the soil from erosion are well-documented [1, 3,5, 6, 27, 28]. Standing residue tends to be more effectiveat reducing wind erosion relative to flattened residue, aswould residue that is perpendicular rather than parallel tothe prevailing wind [28]. Relative soil losses from aresidue-covered soil compared with an exposed soildecrease exponentially with increasing land cover [3, 7,19]. This study also showed that stalk diameter decreasesgradually with height (Fig. 4). Thus, if the stubbleremained upright, protection against water erosion wouldbe expected to be similar or decrease slightly for cuttingheights between 10 and 50 cm. The ability to resist winderosion would increase as the cutting height increased.
Bioenerg. Res. (2011) 4:11–21 19
The erosion control benefits would differ if the remainingstubble were chopped or tilled. Following a 50-cm harvestheight with a chopping operation reduces the standingstubble height to 10–20 cm; the chopped material wouldcover more soil than standing stubble. However, choppedmaterial can be transported by wind and via overland flowif rainfall rates greatly exceed the soil's infiltrationcapacity.
Corn stover or corn cob yields are directly propor-tional to dry corn grain yield. The HI at physiologicalmaturity can estimate total stover produced, but due tostover loss during dry down results in an increase in HIby grain harvest. Therefore, HI determined at grainharvest may provide a better estimate of what might beavailable during a one-pass harvest operation. Theamount of stover remaining on the land to protect thesoil and provide ecosystem services varies with cuttingheight and organ harvested. The amount of stover thatcan be sustainably harvested will vary by region, in somelocales especially with lower grain yields harvesting onlycobs may be the most feasible option. This information,though still limited, will improve the capacity ofRUSLE2, WEPS, and other models to predict erosionrisks associated with harvesting corn stover. It will alsohelp ensure the sustainability and feasibility of thefledging biofuels industry in the USA and elsewhere.
Acknowledgements The authors dedicate this publication to Dr.Wally Wilhelm for his foresight and dedication to protecting the soilresource while building a bioeconomy. He is sorely missed. We wouldlike to thank Dr. Charles C. Mitchell (Dept. of Agronomy and Soils,Auburn University, AL) for allowing us to collect samples at The OldRotation historic cotton research site. We also thank B. Burmeister forproof-reading the final version, but we take full responsibility for anyerrors. Publication costs were covered by funding from the NorthCentral Regional Sun Grant Center at South Dakota State Universitythrough a grant provided by the US Department of Energy Office ofBiomass Programs under award number DE-FC36-05GO85041.
References
1. Allmaras RR, Gupta SC, Pikul JLJ, Johnson CE (1979) Tillageand plant residue management for water erosion control onagricultural land in eastern Oregon. J Soil Water Cons 34:85–90
2. Aristos A, Schechinger T, Birrell SJ, Euken J (2007) Collection,commercial processing, and utilization of corn stover. Finaltechnical report. DOE Scientific and Technical Information.Available at: http://www.osti.gov/bridge/product.biblio.jsp?osti_id=917000. Accessed 29 January 2010
3. Bilbro JD, Fryrear DW (1994) Wind erosion losses as related toplant silhouette and soil cover. Agron J 86:550–553
4. Biomass Research and Development Board (2008) Increasingfeedstock production for biofuels: Economic drivers, environmen-tal implications, and the role of research. Biomass Research andDevelopment Board. Available at: http://www.brdisolutions.com/Site%20Docs/Increasing%20Feedstock_revised.pdf. Accessed8 December 2008
5. Campbell RB, Matheny TA, Hunt PG, Gupta SC (1979) Cropresidue requirements for water erosion control in six southernstates. J Soil Water Cons 34:83–85
6. Chepil WS (1944) Utilization of crop residues for wind erosioncontrol. Sci Agric 24:307–319
7. Cogo NP, Moldenhauer WC, Foster GR (1982) Soil lossreductions from conservation tillage practices. Soil Sci Soc AmJ 48:368–373
8. Donald CM, Hamblin J (1976) The biological yield and harvestindex of cereals as an agronomic and plant breeding criteria. AdvAgron 28:361–405
9. Fronning BE, Thelen KD, Min DH (2008) Use of manure,compost, and cover crops to supplant crop residue carbon in cornstover removed cropping systems. Agron J 100:1703–1710
10. Graham RL, Nelson R, Sheehan J, Perlack RD, Wright LL (2007)Current and potential US corn stover supplies. Agron J 99:1–11
11. Halvorson AD, Johnson JMF (2009) Corn cob characteristics inirrigated central Great Plains studies. Agron J 101:390–399
12. Hoskinson RL, Karlen DL, Birrell SJ, Radtke CW, Wilhelm WW(2007) Engineering, nutrient removal, and feedstock conversionevaluations of four corn stover harvest scenarios. Biomass Bioe31:126–136
13. Igathinathane C, Womac AR, Sokhansanj S, Pordesimo LO(2006) Mass and moisture distribution in aboveground compo-nents of standing corn plants. Trans ASABE 49:97–106
14. Johnson JMF, Allmaras RR, Reicosky DC (2006) Estimatingsource carbon from crop residues, roots and rhizodeposits usingthe national grain-yield database. Agron J 98:622–636
15. Johnson JMF, Coleman MD, Gesch RW, Jaradat AA, Mitchell R,Reicosky DC et al (2007) Biomass-bioenergy crops in the UnitedStates: a changing paradigm. The Amer J Plant Sci Biotechnol1:1–28
16. Johnson JMF, Papiernik SK, Mikha MM, Spokas K, Tomer MD,Weyers SL (2009) Soil processes and residue harvest manage-ment. In: Lal R, Steward B (eds) Carbon management, fuels, andsoil quality. Taylor and Francis, LLC, New York, pp 1–44
17. Johnson JMF, Sharratt BS, Reicosky DC, Lindstrom MJ (2007)Impact of high lignin fermentation by-product on soils withcontrasting soil organic carbon. Soil Sci Soc Am J 71:1151–1159
18. Laird DA (2008) The charcoal vision: a win–win–win scenario forsimultaneously producing bioenergy, permanently sequestering car-bon, while improving soil and water quality. Agron J 100:178–181
19. Lindstrom MJ (1986) Effects of residue harvesting on waterrunoff, soil erosion and nutrient loss. Agric Ecosys Environ16:103–112
20. Lorenz AJ, Gustafson TJ, Coors JG, Nd L (2009) Breeding maizefor a bioeconomy: a literature survey examining harvest index andstover yield and their relationship to grain yield. Crop Sci 50:1–12
21. Novak JM, Busscher WJ, Laird DA, Ahmedna M, Watts DW,Niandou AS (2009) Impact of biochar amendment on fertility of asoutheastern coastal plain soil. Soil Sci 174:105–112
22. Pordesimo LO, Edens WC, Sokhansanj S (2004) Distributionof aboveground biomass in corn stover. Biomass Bioe 26:337–343
23. SAS (2002) SAS Version 9.1. SAS Institute Inc, Gary, NC,24. Shinners KJ, Binversie BN (2007) Fractional yield and moisture
of corn stover biomass produced in the Northern US Corn Belt.Biomass Bioe 31:576–584
25. Shinners KJ, Binversie BN, Muck RE, Weimer PJ (2007)Comparison of wet and dry corn stover harvest and storage.Biomass Bioe 31:211–221
26. Shinners KJ, Boettcher GC, Hoffman DS, Munk JT, Muck RE,Weimer PJ (2009) Single-pass harvest of corn grain and stover:performance of three harvester configurations. Trans ASABE52:51–60
20 Bioenerg. Res. (2011) 4:11–21

27. Siemens JC, Oschwald WR (1978) Corn-soybean tillage systems:erosion control, effects on crop production, costs. Trans ASAE21:293–302
28. Skidmore EL (1988) Wind erosion. In: Lal R (ed) Soil erosionresearch methods. Soil Water Conserv Soc, Ankeny, pp 203–233
29. USDA-ARS (2008) Revised Universal Soil Loss EquationVersion 2 (RUSLE2). DRAFT. In Washington, DC. Available at:http://www.ars.usda.gov/sp2UserFiles/Place/64080510/RUSLE/RUSLE64080512_Science_Doc.pdf. Accessed 21 July 2009
30. USDA National Agricultural Statistic Service (2006) Quick statsdata base. Available at: http://www.nass.usda.gov. Accessed 9 June2010
31. Wilhelm WW, Johnson JMF, Hatfield JL, Voorhees WB, LindenDR (2004) Crop and soil productivity response to corn residueremoval: a literature review. Agron J 96:1–17
32. Wilhelm WW, Johnson JMF, Karlen DL, Lightle DT (2007) Cornstover to sustain soil organic carbon further constrains biomasssupply. Agron J 99:1665–1667
Bioenerg. Res. (2011) 4:11–21 21