Venting of a separate CO2-rich gas phase from submarine arc volcanoes: Examples from the Mariana and...
21
Venting of a separate CO 2 -rich gas phase from submarine arc volcanoes: Examples from the Mariana and Tonga-Kermadec arcs John Lupton, 1 Marvin Lilley, 2 David Butterfield, 3 Leigh Evans, 4 Robert Embley, 1 Gary Massoth, 5,6 Bruce Christenson, 5 Ko-ichi Nakamura, 7 and Mark Schmidt 8 Received 26 October 2007; revised 24 January 2008; accepted 1 April 2008; published 15 July 2008. [1] Submersible dives on 22 active submarine volcanoes on the Mariana and Tonga-Kermadec arcs have discovered systems on six of these volcanoes that, in addition to discharging hot vent fluid, are also venting a separate CO 2 -rich phase either in the form of gas bubbles or liquid CO 2 droplets. One of the most impressive is the Champagne vent site on NW Eifuku in the northern Mariana Arc, which is discharging cold droplets of liquid CO 2 at an estimated rate of 23 mol CO 2 /s, about 0.1% of the global mid-ocean ridge (MOR) carbon flux. Three other Mariana Arc submarine volcanoes (NW Rota-1, Nikko, and Daikoku), and two volcanoes on the Tonga- Kermadec Arc (Giggenbach and Volcano-1) also have vent fields discharging CO 2 -rich gas bubbles. The vent fluids at these volcanoes have very high CO 2 concentrations and elevated C/ 3 He and d 13 C (CO 2 ) ratios compared to MOR systems, indicating a contribution to the carbon flux from subducted marine carbonates and organic material. Analysis of the CO 2 concentrations shows that most of the fluids are undersaturated with CO 2 . This deviation from equilibrium would not be expected for pressure release degassing of an ascending fluid saturated with CO 2 . Mechanisms to produce a separate CO 2 -rich gas phase at the seafloor require direct injection of magmatic CO 2 -rich gas. The ascending CO 2 -rich gas could then partially dissolve into seawater circulating within the volcano edifice without reaching equilibrium. Alternatively, an ascending high- temperature, CO 2 -rich aqueous fluid could boil to produce a CO 2 -rich gas phase and a CO 2 -depleted liquid. These findings indicate that carbon fluxes from submarine arcs may be higher than previously estimated, and that experiments to estimate carbon fluxes at submarine arc volcanoes are merited. Hydrothermal sites such as these with a separate gas phase are valuable natural laboratories for studying the effects of high CO 2 concentrations on marine ecosystems. Citation: Lupton, J., M. Lilley, D. Butterfield, L. Evans, R. Embley, G. Massoth, B. Christenson, K. Nakamura, and M. Schmidt (2008), Venting of a separate CO 2 -rich gas phase from submarine arc volcanoes: Examples from the Mariana and Tonga-Kermadec arcs, J. Geophys. Res., 113, B08S12, doi:10.1029/2007JB005467. 1. Introduction [2] Because magmas produced from melting of the man- tle are typically CO 2 -saturated at depths of at least several kilometers below the ocean floor, rising magma will inev- itably lead to degassing [Dixon et al., 1991; Dixon, 1997; Wallace, 2005]. Magmatic volatiles (H 2 O, CO 2 , SO 2 ,H 2 S, H 2 , He) that escape from rising magma are transported by hydrothermal fluids that may be sampled at seafloor vents. When the gas content of these vents is relatively low, the transfer of gas from magma to hydrothermal fluid may be considered as integrated with hydrothermal alteration in the reaction zone, i.e., that gases are extracted from whole rock. However, in many cases, the gas content of fluids exceeds what can be extracted from rock at physically reasonable water/rock ratios, and this requires that magmatic gas be injected into circulating hydrothermal fluids. It is absolutely clear that there is a large imprint of magmatic degassing in mid-ocean ridge systems such as Axial Volcano on the Juan de Fuca Ridge [Butterfield et al., 1990], the East Pacific Rise at 9°50 0 N[Lilley et al., 1992; Von Damm et al., 1995; Von Damm, 1995], and the superfast spreading southern East Pacific Rise near 32°S[Lupton et al., 1999]. Axial Volcano and the East Pacific Rise (EPR) 9°N sites are characterized by active magma chambers and recent JOURNAL OF GEOPHYSICAL RESEARCH, VOL. 113, B08S12, doi:10.1029/2007JB005467, 2008 Click Here for Full Articl e 1 Pacific Marine Environmental Laboratory, NOAA, Newport, Oregon, USA. 2 School of Oceanography, University of Washington, Seattle, Washington, USA. 3 JISAO, University of Washington, Seattle, Washington, USA. 4 CIMRS, Oregon State University, Newport, Oregon, USA. 5 Institute of Geological and Nuclear Sciences, Lower Hutt, New Zealand. 6 Now at Mass-Ex3 Consulting LLC, Renton, Washington, USA. 7 National Institute of Advanced Science and Technology, Tsukuba, Japan. 8 Institute of Geosciences, University of Kiel, Kiel, Germany. Copyright 2008 by the American Geophysical Union. 0148-0227/08/2007JB005467$09.00 B08S12 1 of 21
Transcript of Venting of a separate CO2-rich gas phase from submarine arc volcanoes: Examples from the Mariana and...
Venting of a separate CO2-rich gas phase from submarine arc
volcanoes: Examples from the Mariana and Tonga-Kermadec arcs
John Lupton,1 Marvin Lilley,2 David Butterfield,3 Leigh Evans,4 Robert Embley,1
Gary Massoth,5,6 Bruce Christenson,5 Ko-ichi Nakamura,7 and Mark Schmidt8
Received 26 October 2007; revised 24 January 2008; accepted 1 April 2008; published 15 July 2008.
[1] Submersible dives on 22 active submarine volcanoes on the Mariana andTonga-Kermadec arcs have discovered systems on six of these volcanoes that, in additionto discharging hot vent fluid, are also venting a separate CO2-rich phase either in theform of gas bubbles or liquid CO2 droplets. One of the most impressive is theChampagne vent site on NW Eifuku in the northern Mariana Arc, which is dischargingcold droplets of liquid CO2 at an estimated rate of 23 mol CO2/s, about 0.1% of theglobal mid-ocean ridge (MOR) carbon flux. Three other Mariana Arc submarinevolcanoes (NW Rota-1, Nikko, and Daikoku), and two volcanoes on the Tonga-Kermadec Arc (Giggenbach and Volcano-1) also have vent fields discharging CO2-richgas bubbles. The vent fluids at these volcanoes have very high CO2 concentrationsand elevated C/3He and d13C (CO2) ratios compared to MOR systems, indicating acontribution to the carbon flux from subducted marine carbonates and organic material.Analysis of the CO2 concentrations shows that most of the fluids are undersaturated withCO2. This deviation from equilibrium would not be expected for pressure releasedegassing of an ascending fluid saturated with CO2. Mechanisms to produce a separateCO2-rich gas phase at the seafloor require direct injection of magmatic CO2-rich gas.The ascending CO2-rich gas could then partially dissolve into seawater circulating withinthe volcano edifice without reaching equilibrium. Alternatively, an ascending high-temperature, CO2-rich aqueous fluid could boil to produce a CO2-rich gas phase and aCO2-depleted liquid. These findings indicate that carbon fluxes from submarine arcs maybe higher than previously estimated, and that experiments to estimate carbon fluxes atsubmarine arc volcanoes are merited. Hydrothermal sites such as these with a separategas phase are valuable natural laboratories for studying the effects of high CO2
concentrations on marine ecosystems.
Citation: Lupton, J., M. Lilley, D. Butterfield, L. Evans, R. Embley, G. Massoth, B. Christenson, K. Nakamura, and M. Schmidt
(2008), Venting of a separate CO2-rich gas phase from submarine arc volcanoes: Examples from the Mariana and Tonga-Kermadec
arcs, J. Geophys. Res., 113, B08S12, doi:10.1029/2007JB005467.
1. Introduction
[2] Because magmas produced from melting of the man-tle are typically CO2-saturated at depths of at least severalkilometers below the ocean floor, rising magma will inev-itably lead to degassing [Dixon et al., 1991; Dixon, 1997;
Wallace, 2005]. Magmatic volatiles (H2O, CO2, SO2, H2S,H2, He) that escape from rising magma are transported byhydrothermal fluids that may be sampled at seafloor vents.When the gas content of these vents is relatively low, thetransfer of gas from magma to hydrothermal fluid may beconsidered as integrated with hydrothermal alteration inthe reaction zone, i.e., that gases are extracted from wholerock. However, in many cases, the gas content of fluidsexceeds what can be extracted from rock at physicallyreasonable water/rock ratios, and this requires that magmaticgas be injected into circulating hydrothermal fluids. It isabsolutely clear that there is a large imprint of magmaticdegassing in mid-ocean ridge systems such as Axial Volcanoon the Juan de Fuca Ridge [Butterfield et al., 1990], theEast Pacific Rise at 9�500N [Lilley et al., 1992; Von Damm etal., 1995; Von Damm, 1995], and the superfast spreadingsouthern East Pacific Rise near 32�S [Lupton et al., 1999].Axial Volcano and the East Pacific Rise (EPR) 9�N sitesare characterized by active magma chambers and recent
JOURNAL OF GEOPHYSICAL RESEARCH, VOL. 113, B08S12, doi:10.1029/2007JB005467, 2008ClickHere
for
FullArticle
1Pacific Marine Environmental Laboratory, NOAA, Newport, Oregon,USA.
2School of Oceanography, University of Washington, Seattle,Washington, USA.
3JISAO, University of Washington, Seattle, Washington, USA.4CIMRS, Oregon State University, Newport, Oregon, USA.5Institute of Geological and Nuclear Sciences, Lower Hutt, New
Zealand.6Now at Mass-Ex3 Consulting LLC, Renton, Washington, USA.7National Institute of Advanced Science and Technology, Tsukuba,
Japan.8Institute of Geosciences, University of Kiel, Kiel, Germany.
Copyright 2008 by the American Geophysical Union.0148-0227/08/2007JB005467$09.00
B08S12 1 of 21
eruptions. The pathways taken by exsolved magmatic vola-tiles may be complicated. By examining themanifestations ofhigh gas content in hydrothermal systems, inferences can bemade about the processes of degassing and gas transport tohydrothermal vents.[3] Among the dozens of mid-ocean ridge (MOR) hydro-
thermal systems that have been studied over the past fewdecades, a significant discharge of gas bubbles has beenfound at only one site: the Magic Mountain vent field on theExplorer Ridge, northeast Pacific (D. Butterfield, privatecommunication, 2007). In contrast to MOR systems, recentstudies of submarine volcanoes on volcanic arcs have foundseveral sites that, in addition to discharging hot vent fluid,are also venting a separate CO2-rich phase either in the formof gas bubbles or liquid CO2 droplets. These findings raiseimportant questions as to the genesis of this separate gasphase and the relative contribution of degassing alongvolcanic arcs to the global carbon flux.[4] In this paper we examine the hydrothermal systems
on six submarine arc volcanoes that are venting a separategas phase, with particular emphasis on the magmatic gases3He and CO2. For each of these volcanoes the separate gas
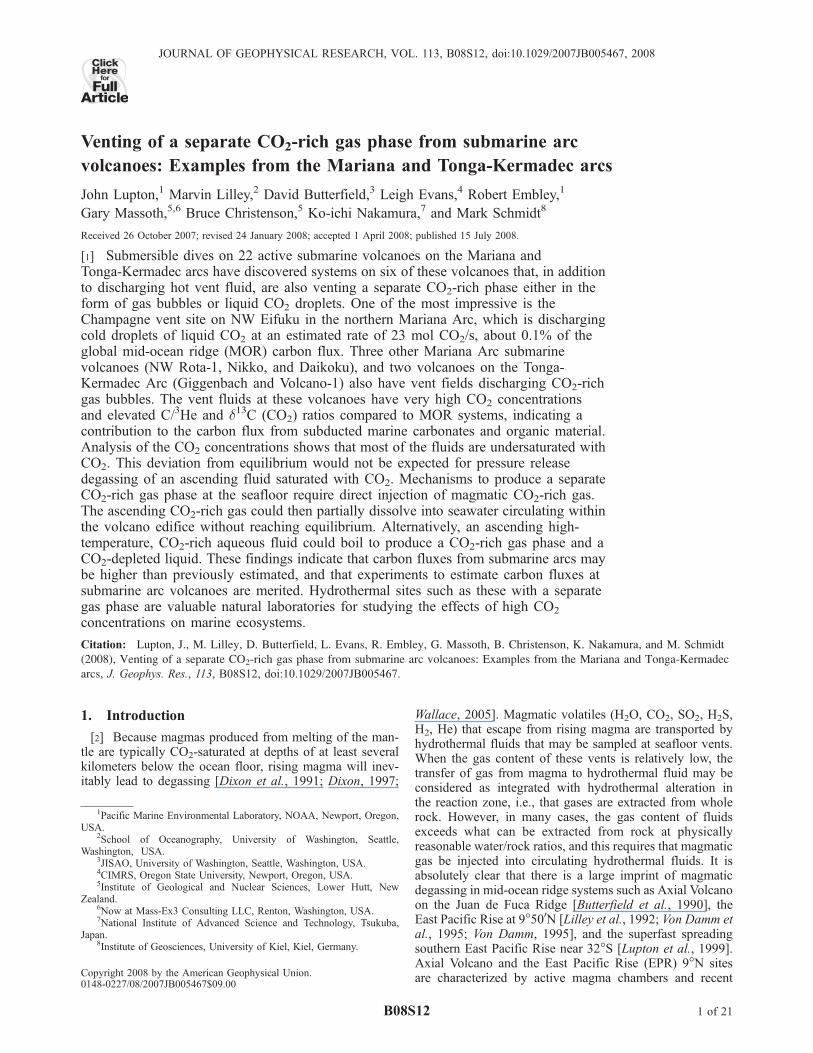
phase is composed of >90% CO2. Four of these volcanoesare on the Mariana Arc: NW Eifuku, NW Rota-1, Nikko,and Daikoku (Figure 1a). In addition, we will discuss twoother submarine volcanoes on the Tonga-Kermadec Arc,Giggenbach and Volcano-1, which are also venting CO2-rich gas bubbles (Figure 1b).
2. Seagoing Expeditions
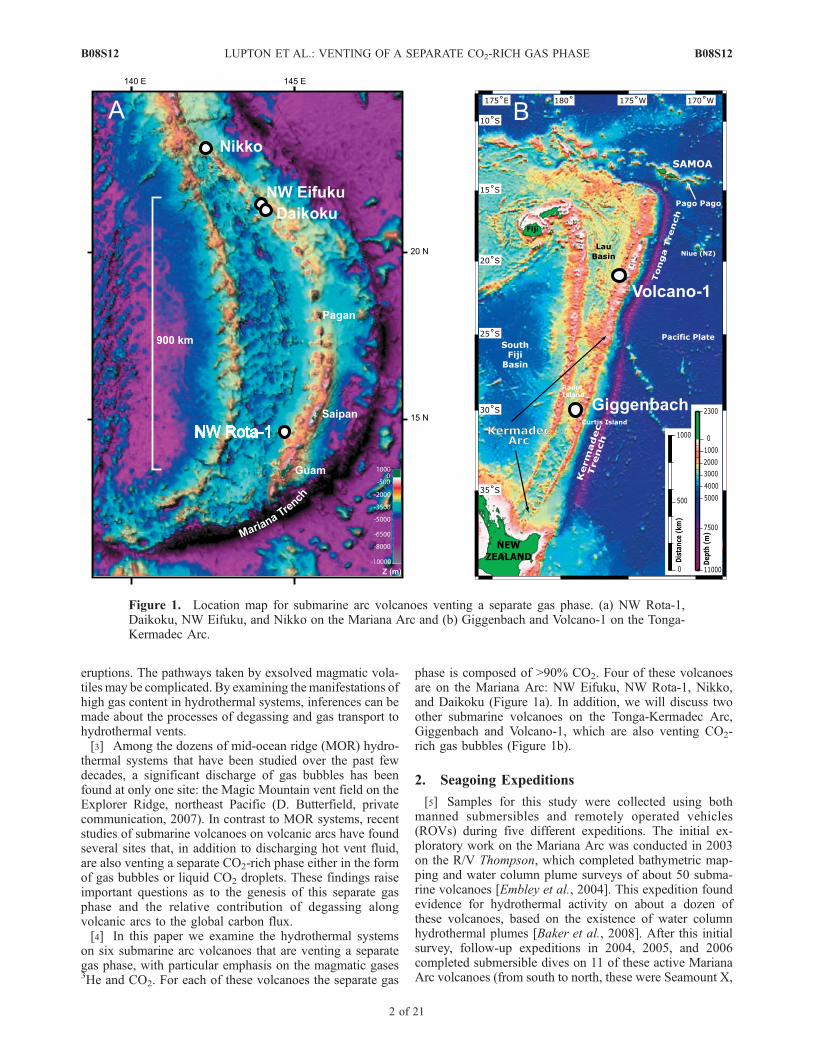
[5] Samples for this study were collected using bothmanned submersibles and remotely operated vehicles(ROVs) during five different expeditions. The initial ex-ploratory work on the Mariana Arc was conducted in 2003on the R/V Thompson, which completed bathymetric map-ping and water column plume surveys of about 50 subma-rine volcanoes [Embley et al., 2004]. This expedition foundevidence for hydrothermal activity on about a dozen ofthese volcanoes, based on the existence of water columnhydrothermal plumes [Baker et al., 2008]. After this initialsurvey, follow-up expeditions in 2004, 2005, and 2006completed submersible dives on 11 of these active MarianaArc volcanoes (from south to north, these were Seamount X,
Figure 1. Location map for submarine arc volcanoes venting a separate gas phase. (a) NW Rota-1,Daikoku, NW Eifuku, and Nikko on the Mariana Arc and (b) Giggenbach and Volcano-1 on the Tonga-Kermadec Arc.
B08S12 LUPTON ET AL.: VENTING OF A SEPARATE CO2-RICH GAS PHASE
2 of 21
B08S12
Forecast, NW Rota-1, Esmeralda, Ruby, East Diamante,Maug, Daikoku, NW Eifuku, Kasuga-2, and Nikko). Withthe exception of Esmeralda, the three expeditions were ableto photograph and sample active vent sites on each of theseMariana Arc volcanoes. Surprisingly, of the 11 activevolcanoes surveyed, four (NW Rota-1, Daikoku, NWEifuku, and Nikko) (Figure 1a) were found to be ventinga distinct gas phase either in the form of CO2-rich gasbubbles or liquid CO2 droplets. Specifically, samples werecollected with the ROV ROPOS during Cruise TN167 ofthe R/V Thompson in March–April 2004, with the ROVHyper-Dolphin during Cruise NT05–18 aboard the Japa-nese ship R/V Natsushima in October–November 2005,and with the ROV Jason 2 during Cruise MGLN02MV ofthe R/V Melville in April–May 2006 [Merle et al., 2004,2006; Nakamura, 2005]. The R/V Thompson and R/VMelville expeditions were part of the Submarine Ring ofFire (SRoF) project funded by NOAA’s Office of OceanExploration.[6] For the submarine volcanoes of the Tonga-Kermadec
Arc, much of the water column exploratory work wasconducted in a series of expeditions involving collaborationbetween New Zealand, Australian, and U.S. scientists [deRonde et al., 2001, 2007; Massoth et al., 2003, 2007]. Onthe basis of these findings, in April–May 2005 the NewZealand–American Submarine Ring of Fire Project, sup-ported by the New Zealand government and by NOAA’soffice of Ocean Exploration, conducted a series of Piscessubmersible dives from the support ship R/V Ka’imikai-o-Kanaloa (KOK) [Merle et al., 2005]. This work focused oneight submarine volcanoes thought to be hydrothermallyactive (from south to north these were Clark, Rumble V,Healy, Brothers, Volcano-W, Macauley, Giggenbach, andMonowai). As an extension of this project, in June of 2005the German Submersible Investigations of the Tonga-Kermadec Arc using Pisces (SITKAP) expedition conductedadditional Pisces dives on three volcanoes located farthernorth: Volcano-19, Volcano-18s, and Volcano-1 [Stoffers etal., 2005]. Out of the total of 11 active volcanoes surveyedalong the Tonga-Kermadec Arc, two (Giggenbach andVolcano-1) were found to be venting CO2-rich gas bubbles(Figure 1b).
3. Methods
[7] Vent fluid samples were collected using specialtitanium alloy gas-tight bottles having an internal volumeof �150 cm3. Each bottle was pumped to a high-vacuumprior to each submersible dive. In most cases the gas-tightbottles were fitted with a short piece of Peek2 tubingconnecting to a Ti sampling snout which was inserted intothe vent orifice. The Peek2 tubing as well as the internaldead volume of the gas-tight bottle itself was filled withdeep seawater prior to the dive to displace air and othergases. After the sampling snout was inserted into the ventorifice, the submersible triggered the bottle by depressingthe rod on the trigger cylinder. This opened the inlet valveto the gas-tight bottle, and the hydraulic pressure at depthforced the sample into the evacuated volume, usually withina fraction of a second. After the sampling was completed,the trigger cylinder was released, sealing the sample in thebottle.
[8] After each dive the samples were processed on aseagoing high vacuum line. The gas-tight bottle, containingthe sample consisting of a mixture of fluid and gas, wasconnected to the vacuum line and all connecting lines wereevacuated using a combination of a mechanical pump andan oil diffusion pump. After sufficient vacuum wasachieved, the line was placed in static condition, and thesample consisting of a mixture of fluid and gas was droppedinto an evacuated flask. Sulfamic acid powder was added tothe flask previous to the extraction in order to acidify thesample and aid in the release of dissolved CO2. The water inthe flask was then agitated with an ultrasonic cleaner, and asthe gases were released a metal bellows pump was used topump the gases through a chilled U-trap (�60�C) into acalibrated volume. The U-trap removed the water vapor sothat only dry gas reached the calibrated volume. After about10 min, over 90% of the dissolved gases were released, andthen the pressure in the calibrated volume was measured at aknown temperature with a precision capacitance manome-ter. Multiple splits of the extracted gases were then sealedinto glass ampoules. For general gas analysis Pyrexampoules were used, while samples for helium and raregas analysis were sealed into ampoules constructed ofalumino-silicate glass with low helium permeability. Withthis method there was no need to poison the samples sincethe gas was dry and no microbes were in contact with theextracted gases. At the end of the extraction, the waterfrozen in the U-trap was melted and then combined with thewater remaining in the extraction flask. The water was thenweighed to determine the total sample weight and thensaved in Nalgene bottles for subsequent analysis of Mg andother fluid properties.[9] In contrast to the sampling of vent fluids, the collec-
tion of gas bubbles and liquid CO2 droplets presented aspecial challenge. As described previously [Lupton et al.,2006], sampling the liquid CO2 at NW Eifuku was partic-ularly difficult because the liquid CO2 expanded by a factorof �1000 when converted to CO2 gas at 1 atm pressure.Furthermore, the liquid droplets tended to stick together likeclusters of grapes rather than coalescing into a single largedroplet. Therefore, at NW Eifuku, a special ‘‘dropletcatcher’’ was used in combination with a small volume(�10 cm3) Ti gas-tight bottle [Lupton et al., 2006](Figure 2a). After the coil spring of the droplet catcherwas filled with CO2 droplets, the spring was compressedthereby expelling most of the water while retaining thedroplets. This resulted in a much higher concentration ofthe droplets being drawn into the gas-tight bottle. For thecollection of gas bubbles at Giggenbach and Volcano-1with the Pisces submersible, a plastic cylinder normallyused for sediment sampling was modified by attaching arelief valve (Figure 2b). The submersible then completelyfilled the cylinder with the gas bubbles and closed the largeball valve integral to the cylinder. As the submersibleascended and hydrostatic pressure was released, the excessgas was allowed to escape through the relief valve.Because there is no water in the sample, minimal fraction-ation is expected during this gas loss. At the end of thedive, the gas sample was transferred from the plasticcylinder into a stopcock flask constructed of alumino-silicate glass or drawn into one of the Ti gas-tight bottles.The gas samples from the Mariana Arc volcanoes were
B08S12 LUPTON ET AL.: VENTING OF A SEPARATE CO2-RICH GAS PHASE
3 of 21
B08S12
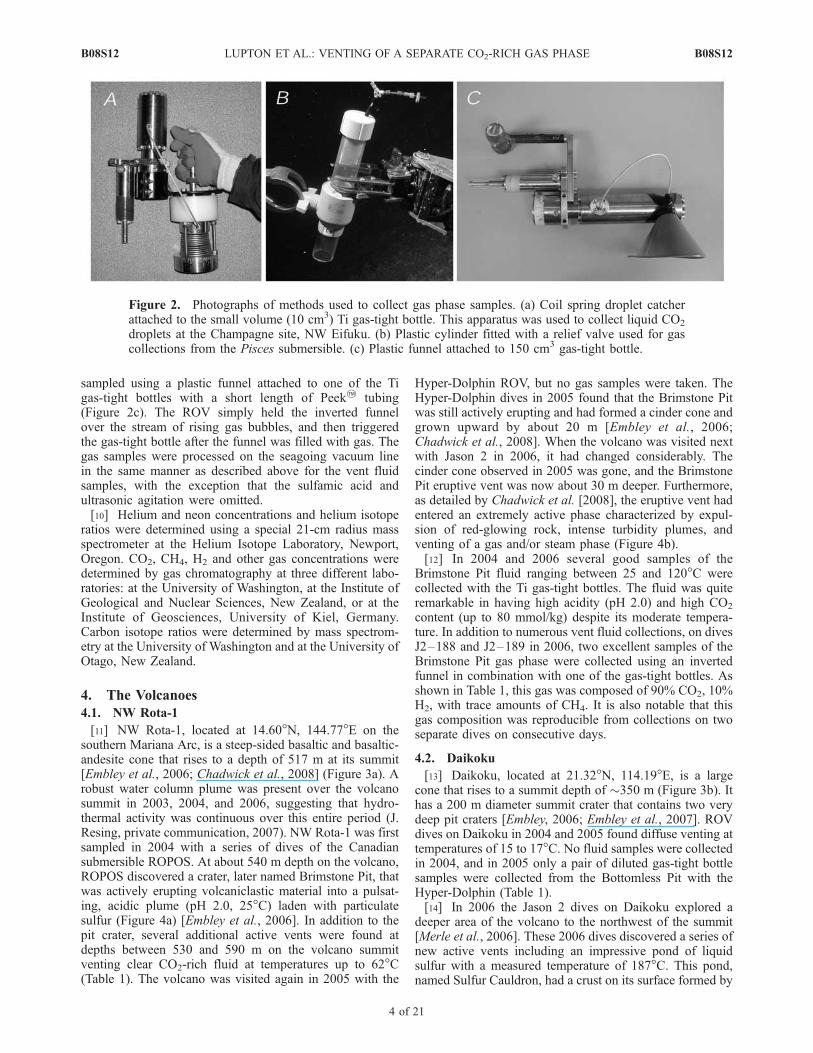
sampled using a plastic funnel attached to one of the Tigas-tight bottles with a short length of Peek2 tubing(Figure 2c). The ROV simply held the inverted funnelover the stream of rising gas bubbles, and then triggeredthe gas-tight bottle after the funnel was filled with gas. Thegas samples were processed on the seagoing vacuum linein the same manner as described above for the vent fluidsamples, with the exception that the sulfamic acid andultrasonic agitation were omitted.[10] Helium and neon concentrations and helium isotope
ratios were determined using a special 21-cm radius massspectrometer at the Helium Isotope Laboratory, Newport,Oregon. CO2, CH4, H2 and other gas concentrations weredetermined by gas chromatography at three different labo-ratories: at the University of Washington, at the Institute ofGeological and Nuclear Sciences, New Zealand, or at theInstitute of Geosciences, University of Kiel, Germany.Carbon isotope ratios were determined by mass spectrom-etry at the University of Washington and at the University ofOtago, New Zealand.
4. The Volcanoes
4.1. NW Rota-1
[11] NW Rota-1, located at 14.60�N, 144.77�E on thesouthern Mariana Arc, is a steep-sided basaltic and basaltic-andesite cone that rises to a depth of 517 m at its summit[Embley et al., 2006; Chadwick et al., 2008] (Figure 3a). Arobust water column plume was present over the volcanosummit in 2003, 2004, and 2006, suggesting that hydro-thermal activity was continuous over this entire period (J.Resing, private communication, 2007). NW Rota-1 was firstsampled in 2004 with a series of dives of the Canadiansubmersible ROPOS. At about 540 m depth on the volcano,ROPOS discovered a crater, later named Brimstone Pit, thatwas actively erupting volcaniclastic material into a pulsat-ing, acidic plume (pH 2.0, 25�C) laden with particulatesulfur (Figure 4a) [Embley et al., 2006]. In addition to thepit crater, several additional active vents were found atdepths between 530 and 590 m on the volcano summitventing clear CO2-rich fluid at temperatures up to 62�C(Table 1). The volcano was visited again in 2005 with the
Hyper-Dolphin ROV, but no gas samples were taken. TheHyper-Dolphin dives in 2005 found that the Brimstone Pitwas still actively erupting and had formed a cinder cone andgrown upward by about 20 m [Embley et al., 2006;Chadwick et al., 2008]. When the volcano was visited nextwith Jason 2 in 2006, it had changed considerably. Thecinder cone observed in 2005 was gone, and the BrimstonePit eruptive vent was now about 30 m deeper. Furthermore,as detailed by Chadwick et al. [2008], the eruptive vent hadentered an extremely active phase characterized by expul-sion of red-glowing rock, intense turbidity plumes, andventing of a gas and/or steam phase (Figure 4b).[12] In 2004 and 2006 several good samples of the
Brimstone Pit fluid ranging between 25 and 120�C werecollected with the Ti gas-tight bottles. The fluid was quiteremarkable in having high acidity (pH 2.0) and high CO2
content (up to 80 mmol/kg) despite its moderate tempera-ture. In addition to numerous vent fluid collections, on divesJ2–188 and J2–189 in 2006, two excellent samples of theBrimstone Pit gas phase were collected using an invertedfunnel in combination with one of the gas-tight bottles. Asshown in Table 1, this gas was composed of 90% CO2, 10%H2, with trace amounts of CH4. It is also notable that thisgas composition was reproducible from collections on twoseparate dives on consecutive days.
4.2. Daikoku
[13] Daikoku, located at 21.32�N, 114.19�E, is a largecone that rises to a summit depth of �350 m (Figure 3b). Ithas a 200 m diameter summit crater that contains two verydeep pit craters [Embley, 2006; Embley et al., 2007]. ROVdives on Daikoku in 2004 and 2005 found diffuse venting attemperatures of 15 to 17�C. No fluid samples were collectedin 2004, and in 2005 only a pair of diluted gas-tight bottlesamples were collected from the Bottomless Pit with theHyper-Dolphin (Table 1).[14] In 2006 the Jason 2 dives on Daikoku explored a
deeper area of the volcano to the northwest of the summit[Merle et al., 2006]. These 2006 dives discovered a series ofnew active vents including an impressive pond of liquidsulfur with a measured temperature of 187�C. This pond,named Sulfur Cauldron, had a crust on its surface formed by
Figure 2. Photographs of methods used to collect gas phase samples. (a) Coil spring droplet catcherattached to the small volume (10 cm3) Ti gas-tight bottle. This apparatus was used to collect liquid CO2
droplets at the Champagne site, NW Eifuku. (b) Plastic cylinder fitted with a relief valve used for gascollections from the Pisces submersible. (c) Plastic funnel attached to 150 cm3 gas-tight bottle.
B08S12 LUPTON ET AL.: VENTING OF A SEPARATE CO2-RICH GAS PHASE
4 of 21
B08S12
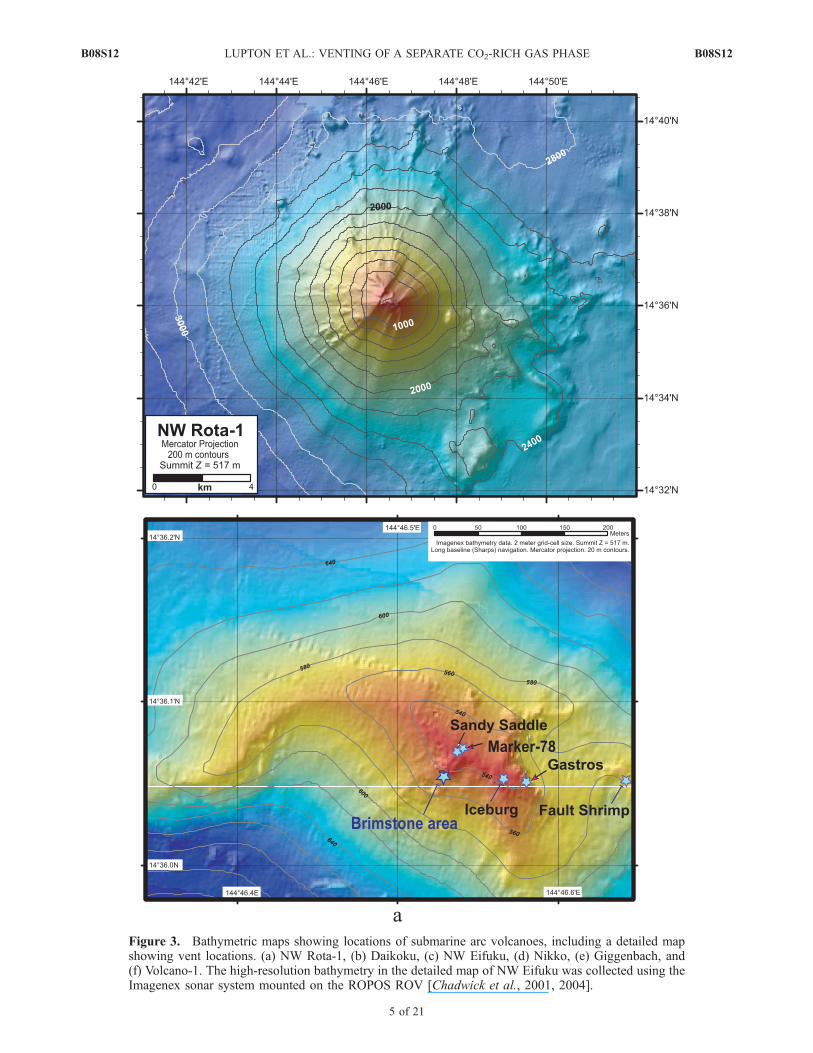
Figure 3. Bathymetric maps showing locations of submarine arc volcanoes, including a detailed mapshowing vent locations. (a) NW Rota-1, (b) Daikoku, (c) NW Eifuku, (d) Nikko, (e) Giggenbach, and(f) Volcano-1. The high-resolution bathymetry in the detailed map of NW Eifuku was collected using theImagenex sonar system mounted on the ROPOS ROV [Chadwick et al., 2001, 2004].
B08S12 LUPTON ET AL.: VENTING OF A SEPARATE CO2-RICH GAS PHASE
5 of 21
B08S12
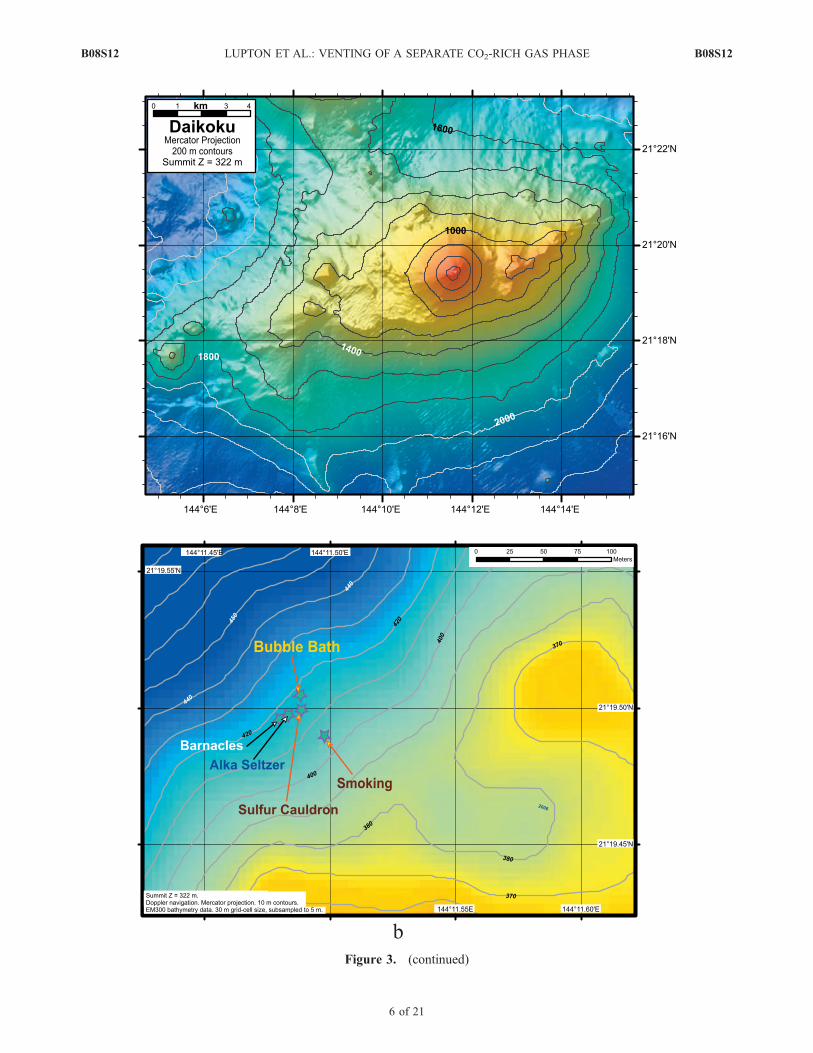
Figure 3. (continued)
B08S12 LUPTON ET AL.: VENTING OF A SEPARATE CO2-RICH GAS PHASE
6 of 21
B08S12
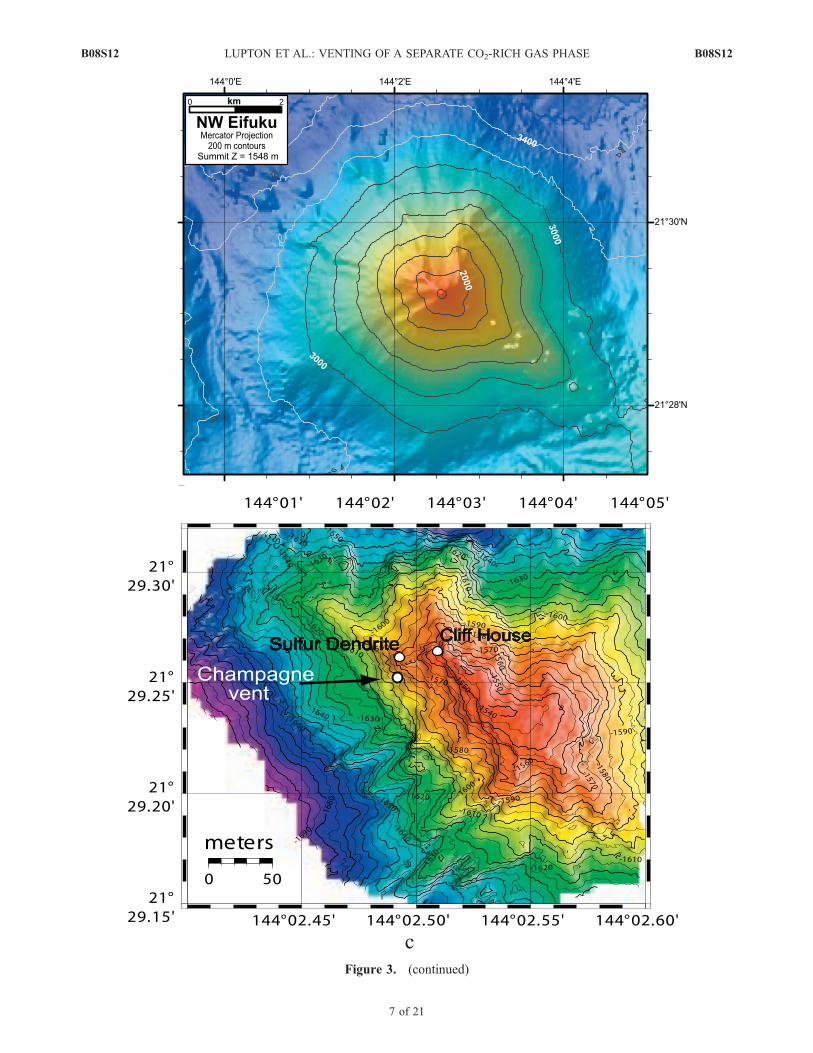
Figure 3. (continued)
B08S12 LUPTON ET AL.: VENTING OF A SEPARATE CO2-RICH GAS PHASE
7 of 21
B08S12

seawater quenching, and was sloshing vigorously as itdegassed [Embley, 2006; Embley et al., 2007]. Our Daikokusamples came from a pit (Bubble Bath) containing fluid at52�C that was also vigorously venting gas bubbles(Figure 4c). Jason 2 was able to collect several good fluidsamples from Bubble Bath as well as one excellent gassample using the inverted funnel in combination with oursmall volume gas-tight bottle. As shown in Table 1, theBubble Bath gas was composed of �94% CO2 with onlytrace amounts of CH4 and H2. We did not analyze for sulfurgases, but considering the prevalence of sulfur deposits andliquid sulfur pools in the area, it is likely that the remaining6% of the gas at Bubble Bath is a combination of H2S andSO2.
4.3. NW Eifuku
[15] NW Eifuku, a small volcanic cone located at21.49�N, 144.04�E on the northern Mariana Arc, rises toa depth of �1555 m below sea level (Figure 3c). ROPOSdives in 2004 discovered the impressive Champagne ventsite at 1604 m depth venting streams of liquid CO2 dropletsas well as �100�C hydrothermal fluid (Figure 4d). Theventing on NW Eifuku has been described in some detail[Lupton et al., 2006], but it is included here because it isperhaps the best example of a submarine arc volcanoventing a separate CO2 phase. The CO2 at NW Eifukutakes the form of liquid droplets rather than gas bubbles dueto the greater depth of the Champagne site. (Under oceanicconditions, CO2 liquifies at a pressure of about 50 bars or�500 m depth). Among other things, because the arealextent of the Champagne site is so small, it was possible toestimate the carbon flux at 23 mol CO2/s by carefullyexamining the ROV video [Lupton et al., 2006]. Thisapproximately equals the CO2 flux from all of the EndeavorRidge vent fields on the Juan de Fuca Ridge, or about 0.1%of the global MOR carbon flux. In contrast, the CO2 flux
from the 100�C Champagne vent fluids is estimated at�0.5 mol/s, only 2% of the total flux. It was also foundthat the flux of liquid droplets increased dramaticallywhenever the seafloor around the Champagne site wasdisturbed by the ROV. This is consistent with the presenceof a layer of liquid CO2 beneath the surface capped by animpeding layer of CO2 hydrate. These observations aresimilar to those reported at the Okinawa Trough back-arcbasin, another site of liquid CO2 venting [Sakai et al.,1990a, 1990b].[16] ROV dives were completed on NW Eifuku in 2004,
2005, and 2006, although the 2006 results are not includedhere. We were able to collect samples of the liquid CO2 in2004, but our seagoing vacuum line was overwhelmed bythe quantity of gas contained in a gas-tight bottle filled withliquid CO2. For this reason our best samples were collectedin 2005. In preparation for the 2005 dives on NW Eifuku,we constructed two special small volume (�10 cm3) ver-sions of our gas-tight bottles for sampling the CO2 liquid.By using these small volume bottles in conjunction with aspecial droplet catcher (Figure 2a), we were able to collectseveral excellent samples of the Champagne droplets. Asshown in Table 1, the droplets are essentially pure CO2
(98–100%). The Champagne vent fluid is also impressive,with many samples from both 2004 and 2005 containing�600 mmol CO2/kg, and two samples from 2004 con-taining 2.3–2.7 mol CO2/kg. Since this is almost twicethe CO2 solubility of �1 mol/kg in seawater at 100�Cand 160 bars pressure, Lupton et al. [2006] attributedthese high dissolved CO2 values to the entrainment ofsmall amounts of CO2 hydrate or CO2 liquid into thestream of rising vent fluid.
4.4. Nikko
[17] Nikko, located at 23.08�N, 142.33�E, is the north-ernmost of the Mariana Arc volcanoes studied during the
Figure 3. (continued)
B08S12 LUPTON ET AL.: VENTING OF A SEPARATE CO2-RICH GAS PHASE
8 of 21
B08S12
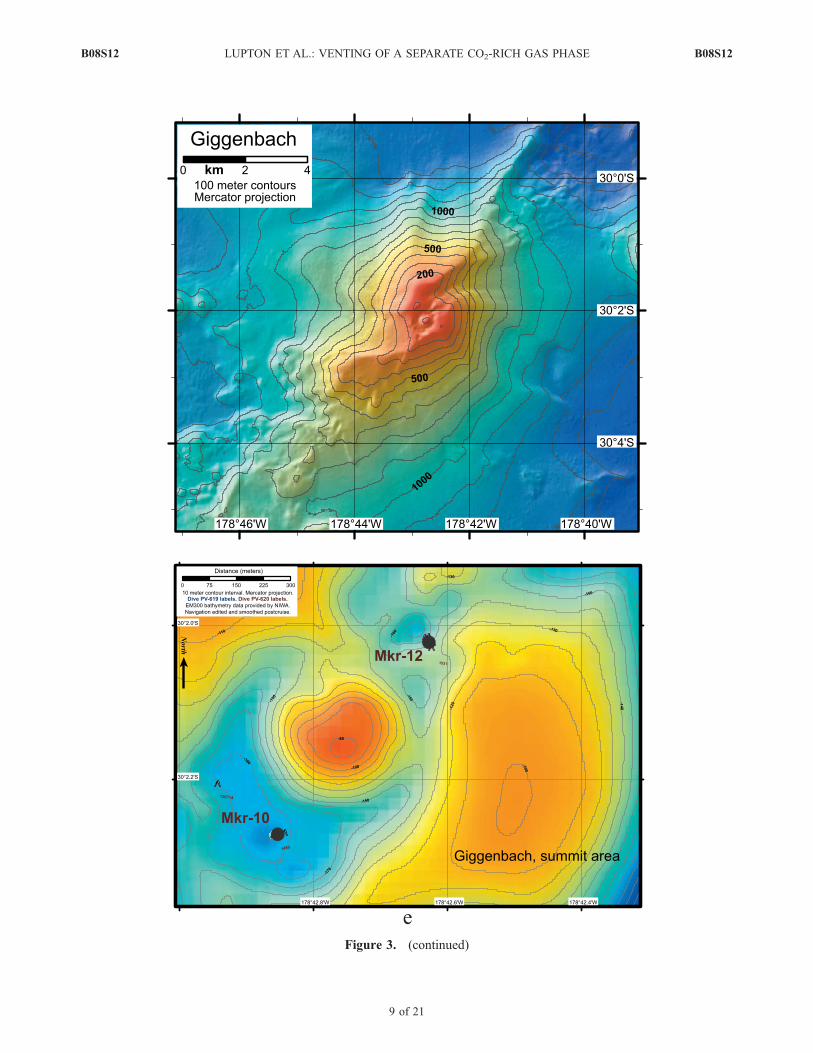
Figure 3. (continued)
B08S12 LUPTON ET AL.: VENTING OF A SEPARATE CO2-RICH GAS PHASE
9 of 21
B08S12
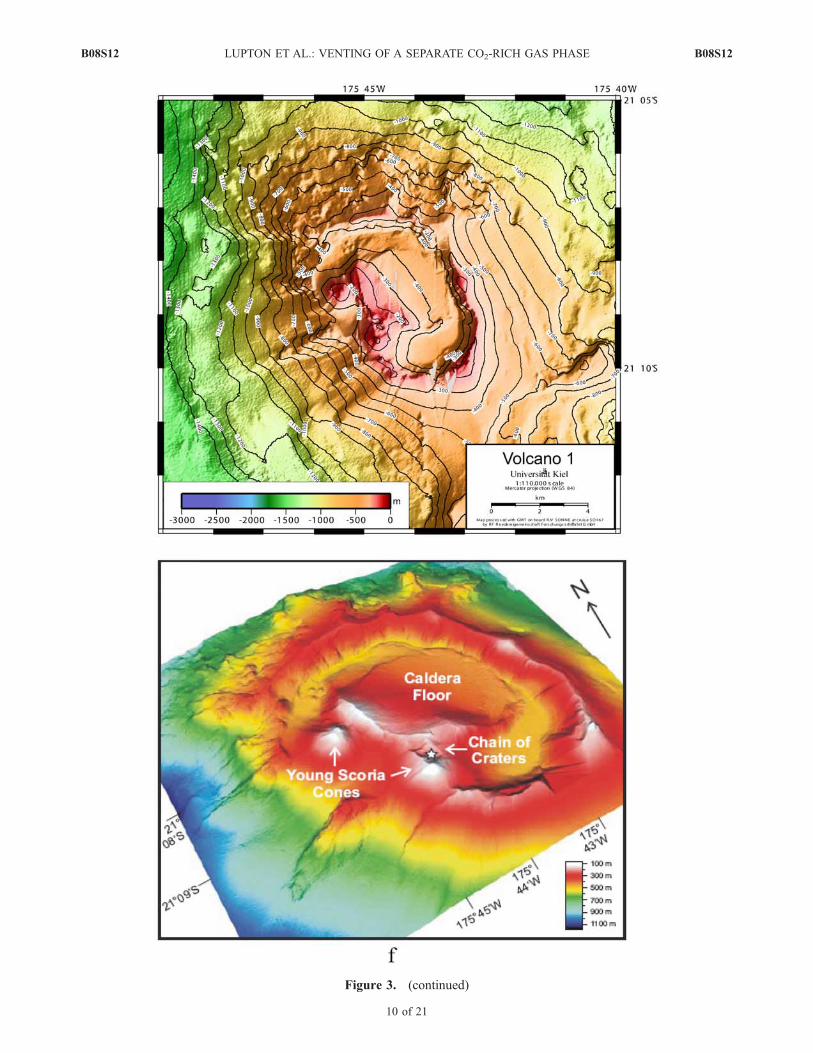
Figure 3. (continued)
B08S12 LUPTON ET AL.: VENTING OF A SEPARATE CO2-RICH GAS PHASE
10 of 21
B08S12
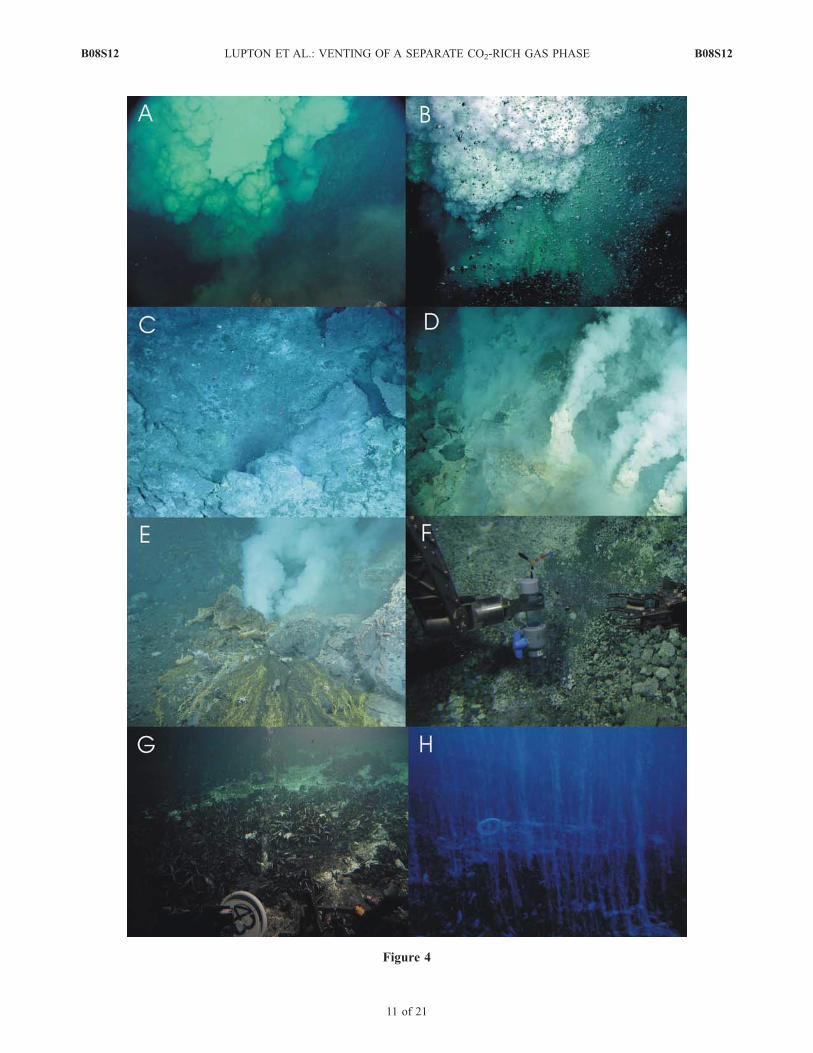
Figure 4
B08S12 LUPTON ET AL.: VENTING OF A SEPARATE CO2-RICH GAS PHASE
11 of 21
B08S12
SRoF project. Nikko rises to a depth of about 365 m belowsea level with a well-defined caldera at its summit (Figure3d). The caldera floor is about 470 m below sea level. ThreeHyper-Dolphin dives were completed on Nikko in 2005,followed by two Jason 2 dives in 2006. The very first diveson Nikko found the caldera densely populated with crabsand filled with white clouds of hydrothermal effluent.Several sites of hydrothermal venting were present, butperhaps most impressive were the pools of molten sulfurdiscovered by the Hyper-Dolphin [Nakamura, 2005]. Atone site, hydrothermal fluid venting was present combinedwith CO2 gas bubbling up through a pond of molten sulfur(Figure 4e). Hydrothermal fluid samples were collected at avariety of vents ranging from 60 to 215�C. One gas samplewas collected in 2005 using the gas-tight bottle/invertedfunnel technique (Figure 2c), yielding a composition of96% CO2 (Table 1). The low N2 concentration in thissample indicates very little air contamination, and suggeststhat this method is perhaps the best approach for collectinghigh-quality samples of a separate gas phase.
4.5. Giggenbach
[18] Giggenbach volcano, named for the late New Zea-land geochemist Werner Giggenbach, is located at 30.04�S,178.71�E on the Tonga-Kermadec Arc. The volcano rises toa summit depth of about 80 m below sea level (Figure 3e).The three Pisces V dives devoted to exploring Giggenbachin 2005 found hydrothermal venting at two distinct sites atdepths of about 160–190 m in pits on opposite sides of thesummit cone [Merle et al., 2005]. The Marker 10 site SWofthe summit was venting fluid at 99–164�C that included aseparate gas phase. Our best samples came from the Marker12 site NWof the summit cone which was venting a mixtureof fluid and gas bubbles at 204�C, right at the boiling pointfor this depth (176 m) (Figure 4f). We concluded that thefluid was boiling right at the Marker 12 vent orifice,promoting the formation of a separate gas phase. Wecollected two good samples of the gas bubbles at Marker12 on successive dives (Table 1). While it was possible toobtain uncontaminated samples of the gas phase using theplastic cylinder, sampling the fluid was much more difficult,due to contamination with gas bubbles located in the fluidstream. After correction for air addition on the basis of theN2 and Ar concentrations, the gas bubbles at Giggenbachwere composed of 94–98% CO2 with only trace amounts ofH2 and CH4 (Table 1).
4.6. Volcano-1
[19] Volcano-1, located at 21.15�S 175.75�E, was one ofthree volcanoes on the Tonga-Kermadec Arc sampledduring the German SITKAP expedition in June 2005[Stoffers et al., 2005, 2006]. Additional samples werecollected in May 2007 with the ROV ROPOS from the
R/V Sonne. As reported by Stoffers et al. [2006], Volcano-1rises to within 65 m of the sea surface, and has a largecaldera and several small cones at its summit (Figure 3f).During the five dives devoted to exploring the volcano,Pisces IV discovered widespread areas of diffuse venting(50–150�C) within the caldera at depths of 160–210 m.Continuous streams of gas bubbles were observed inseveral areas (Figures 4g and 4h), and large areas of thecaldera floor were covered with fields of mussels. Weobtained several vent fluid samples with the gas-tightbottles at temperatures ranging from 50 to 150�C, andtwo excellent samples of gas bubbles collected with theplastic cylinder scoop. The composition of the gas phasewas essentially 100% CO2 (Table 1).
5. Helium-Carbon Relationships
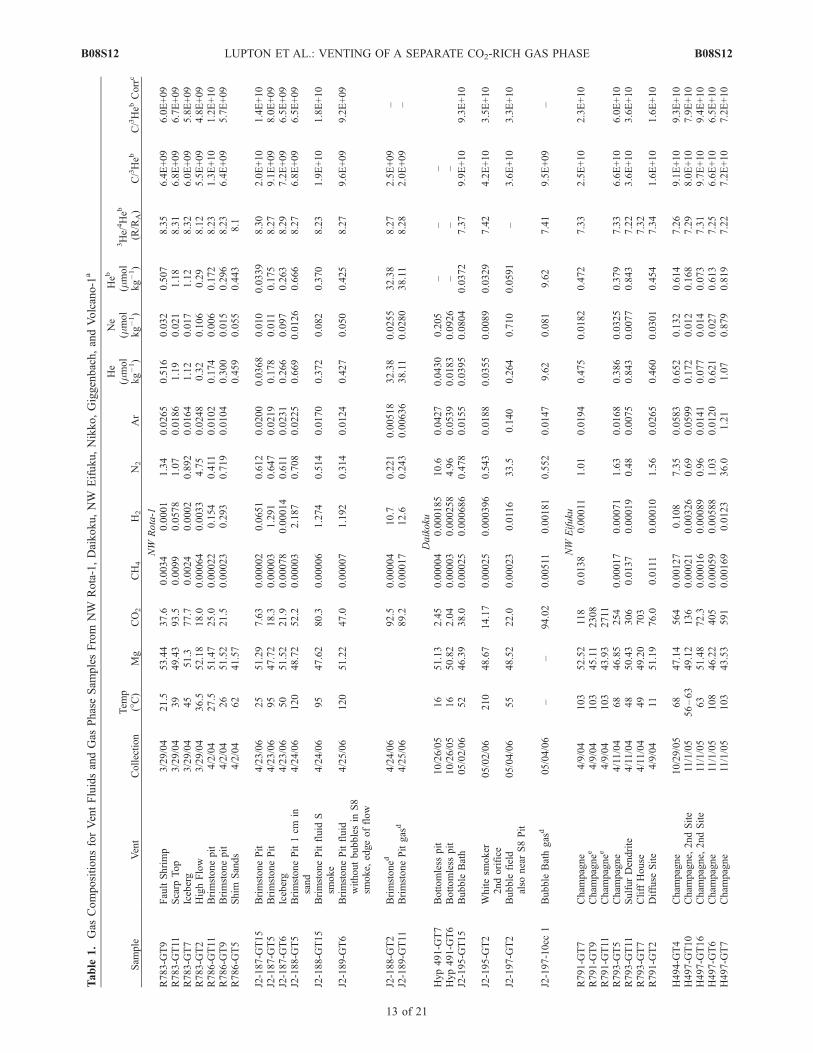
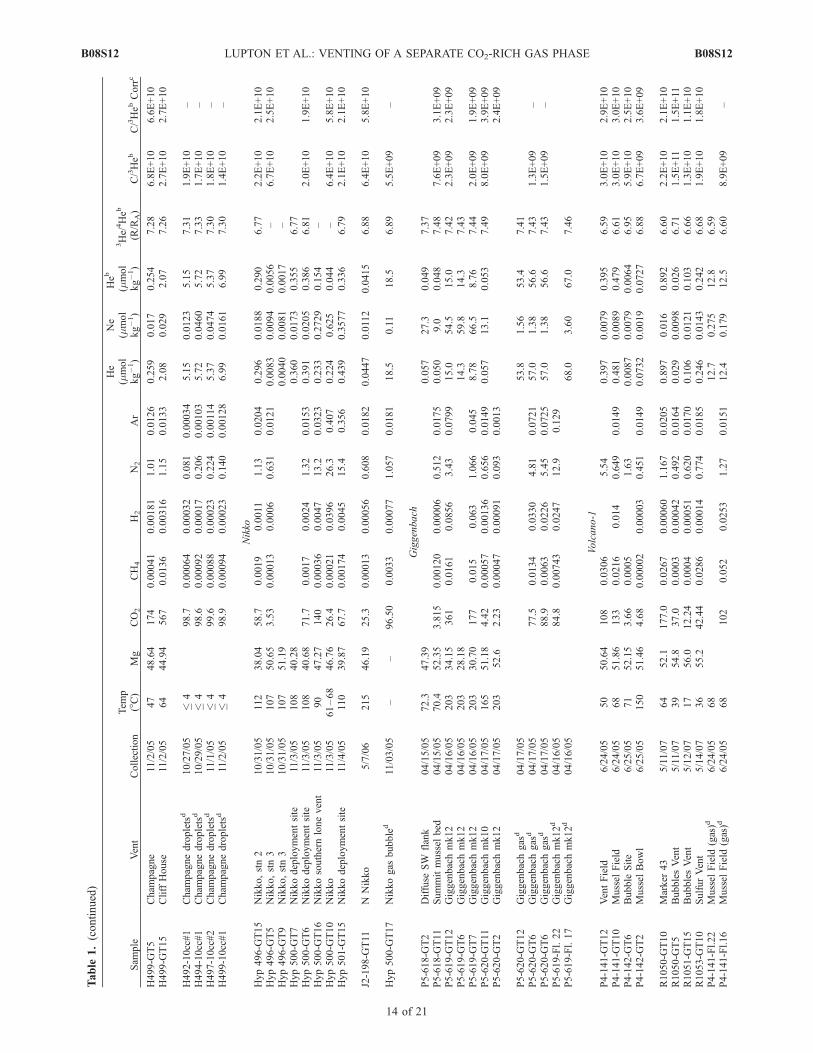
[20] Some insight into the origin of the gases and gas-richfluids emanating from submarine volcanoes can be gainedby focusing on the magmatic gases CO2 and 3He. 3He iscompletely inert and derived from magma, while CO2 isvery unreactive and derived almost entirely from a mag-matic source. These two species are distinct from othergases such as H2, CH4, H2S, and SO2 which may be partlyderived from magmatic gas, but are also highly reactive andtherefore not diagnostic of gas sources.[21] The histograms in Figure 5 compare the CO2 con-
centrations for the six arc volcanoes discussed here withCO2 in typical MOR systems. In addition, Figure 5 (bottom)shows total gas concentrations for those volcanoes from theMariana and Tonga-Kermadec arcs that are not venting aseparate gas phase. It should be noted that the values plottedfor MOR systems are estimated end-member concentrationsbased on extrapolation to zero Mg, while those for the arcvolcanoes have not been corrected and are thus lower limits.Furthermore, the MOR systems that are shown in thehistogram are either from fast spreading ridges or ridgesthat have been affected by recent magmatic input and thushave higher than average CO2 concentrations. Althoughthere is a large variation in the concentration values bothamong the various volcanoes and within each volcano, thiscomparison makes it clear that the CO2 concentrations atthese submarine arc volcanoes are much higher than thosefound on mid-ocean ridges. For example, the maximumvent fluid CO2 concentrations at NW Rota-1, Daikoku, NWEifuku, Nikko, Giggenbach, and Volcano-1 are 93, 38,2700, 68, 366, and 133 mmol/kg, respectively (Table 1).These concentrations are much higher than the typicalvalues found at MOR hydrothermal systems, which rangebetween 3 and 200 mmol/kg, with most of the MOR ventfluid samples having [CO2] less than 30 mmol/kg (Figure 5).Furthermore, comparison with Figure 5 (bottom) shows thatthe arc volcanoes venting a separate CO2-rich gas phase
Figure 4. Photographs of submarine arc volcanoes. (a) Eruptive activity at Brimstone Pit, NW Rota-1 in 2004.(b) Brimstone Pit, NW Rota-1 in 2006, showing gas bubbles and red erupting lava. (c) Bubble Bath vent on Daikoku, 2006.(d) Champagne Vent, NW Eifuku, showing 100�C fluid venting from small white chimneys and cold liquid CO2 dropletsrising from the seafloor. (e) A sulfur pool vent on Nikko showing sulfur flows, hot fluid venting, and CO2-rich gas bubbles.(f) The Pisces submersible collecting a gas sample at Giggenbach Marker 12 using the plastic cylinder. At this vent the gasbubbles and vent fluid were commingled in a single stream. (g) Stream of gas bubbles rising from a bed of mussels atVolcano-1. (h) Multiple streams of CO2-rich gas bubbles rising from the seafloor on Volcano-1.
B08S12 LUPTON ET AL.: VENTING OF A SEPARATE CO2-RICH GAS PHASE
12 of 21
B08S12
Table
1.Gas
CompositionsforVentFluidsandGas
PhaseSam
plesFrom
NW
Rota-1,Daikoku,NW
Eifuku,Nikko,Giggenbach,andVolcano-1
a
Sam
ple
Vent
Collection
Tem
p(�C)
Mg
CO2
CH4
H2
N2
Ar
He
(mmol
kg�1)
Ne
(mmol
kg�1)
Heb
(mmol
kg�1)
3He/4Heb
(R/R
A)
C/3Heb
C/3Heb
Corrc
NW
Rota-1
R783-G
T9
FaultShrimp
3/29/04
21.5
53.44
37.6
0.0034
0.0001
1.34
0.0265
0.516
0.032
0.507
8.35
6.4E+09
6.0E+09
R783-G
T11
Scarp
Top
3/29/04
39
49.43
93.5
0.0099
0.0578
1.07
0.0186
1.19
0.021
1.18
8.31
6.8E+09
6.7E+09
R783-G
T7
Iceberg
3/29/04
45
51.3
77.7
0.0024
0.0002
0.892
0.0164
1.12
0.017
1.12
8.32
6.0E+09
5.8E+09
R783-G
T2
HighFlow
3/29/04
36.5
52.18
18.0
0.00064
0.0033
4.75
0.0248
0.32
0.106
0.29
8.12
5.5E+09
4.8E+09
R786-G
T11
Brimstonepit
4/2/04
27.5
51.47
25.0
0.00022
0.154
0.411
0.0102
0.174
0.006
0.172
8.23
1.3E+10
1.2E+10
R786-G
T9
Brimstonepit
4/2/04
26
51.52
21.5
0.00023
0.293
0.719
0.0104
0.300
0.015
0.296
8.23
6.4E+09
5.7E+09
R786-G
T5
Shim
Sands
4/2/04
62
41.57
0.459
0.055
0.443
8.1
J2-187-G
T15
BrimstonePit
4/23/06
25
51.29
7.63
0.00002
0.0651
0.612
0.0200
0.0368
0.010
0.0339
8.30
2.0E+10
1.4E+10
J2-187-G
T5
BrimstonePit
4/23/06
95
47.72
18.3
0.00003
1.291
0.647
0.0219
0.178
0.011
0.175
8.27
9.1E+09
8.0E+09
J2-187-G
T6
Iceberg
4/23/06
50
51.52
21.9
0.00078
0.00014
0.611
0.0231
0.266
0.097
0.263
8.29
7.2E+09
6.5E+09
J2-188-G
T5
BrimstonePit1cm
insand
4/24/06
120
48.72
52.2
0.00003
2.187
0.708
0.0225
0.669
0.0126
0.666
8.27
6.8E+09
6.5E+09
J2-188-G
T15
BrimstonePitfluid
Ssm
oke
4/24/06
95
47.62
80.3
0.00006
1.274
0.514
0.0170
0.372
0.082
0.370
8.23
1.9E+10
1.8E+10
J2-189-G
T6
BrimstonePitfluid
withoutbubblesin
S8
smoke,
edgeofflow
4/25/06
120
51.22
47.0
0.00007
1.192
0.314
0.0124
0.427
0.050
0.425
8.27
9.6E+09
9.2E+09
J2-188-G
T2
Brimstoned
4/24/06
92.5
0.00004
10.7
0.221
0.00518
32.38
0.0255
32.38
8.27
2.5E+09
–J2-189-G
T11
BrimstonePitgas
d4/25/06
89.2
0.00017
12.6
0.243
0.00636
38.11
0.0280
38.11
8.28
2.0E+09
–
Daikoku
Hyp491-G
T7
Bottomless
pit
10/26/05
16
51.13
2.45
0.00004
0.000185
10.6
0.0427
0.0430
0.205
––
–Hyp491-G
T6
Bottomless
pit
10/26/05
16
50.82
2.04
0.00003
0.000258
4.96
0.0539
0.0183
0.0926
––
–J2-195-G
T15
Bubble
Bath
05/02/06
52
46.39
38.0
0.00025
0.000686
0.478
0.0155
0.0395
0.0804
0.0372
7.37
9.9E+10
9.3E+10
J2-195-G
T2
Whitesm
oker
2ndorifice
05/02/06
210
48.67
14.17
0.00025
0.000396
0.543
0.0188
0.0355
0.0089
0.0329
7.42
4.2E+10
3.5E+10
J2-197-G
T2
Bubble
field
also
nearS8Pit
05/04/06
55
48.52
22.0
0.00023
0.0116
33.5
0.140
0.264
0.710
0.0591
–3.6E+10
3.3E+10
J2-197-10cc
1Bubble
Bathgas
d05/04/06
––
94.02
0.00511
0.00181
0.552
0.0147
9.62
0.081
9.62
7.41
9.5E+09
–
NW
Eifuku
R791-G
T7
Cham
pagne
4/9/04
103
52.52
118
0.0138
0.00011
1.01
0.0194
0.475
0.0182
0.472
7.33
2.5E+10
2.3E+10
R791-G
T9
Cham
pagnee
4/9/04
103
45.11
2308
R791-G
T11
Cham
pagnee
4/9/04
103
43.93
2711
R793-G
T5
Cham
pagne
4/11/04
68
46.85
254
0.00017
0.00071
1.63
0.0168
0.386
0.0325
0.379
7.33
6.6E+10
6.0E+10
R793-G
T11
SulfurDendrite
4/11/04
48
50.43
306
0.0137
0.00019
0.48
0.0075
0.843
0.0077
0.843
7.22
3.6E+10
3.6E+10
R793-G
T7
CliffHouse
4/11/04
49
49.20
703
7.32
R791-G
T2
Diffuse
Site
4/9/04
11
51.19
76.0
0.0111
0.00010
1.56
0.0265
0.460
0.0301
0.454
7.34
1.6E+10
1.6E+10
H494-G
T4
Cham
pagne
10/29/05
68
47.14
564
0.00127
0.108
7.35
0.0583
0.652
0.132
0.614
7.26
9.1E+10
9.3E+10
H497-G
T10
Cham
pagne,
2ndSite
11/1/05
56–63
49.12
136
0.00021
0.00326
0.69
0.0599
0.172
0.012
0.168
7.29
8.0E+10
7.9E+10
H497-G
T16
Cham
pagne,
2ndSite
11/1/05
63
51.48
72.3
0.00016
0.00089
0.96
0.0141
0.077
0.014
0.073
7.31
9.7E+10
9.4E+10
H497-G
T6
Cham
pagne
11/1/05
108
46.22
405
0.00059
0.00588
1.03
0.0120
0.621
0.027
0.613
7.25
6.6E+10
6.5E+10
H497-G
T7
Cham
pagne
11/1/05
103
43.53
591
0.00169
0.0123
36.0
1.21
1.07
0.879
0.819
7.22
7.2E+10
7.2E+10
B08S12 LUPTON ET AL.: VENTING OF A SEPARATE CO2-RICH GAS PHASE
13 of 21
B08S12
Sam
ple
Vent
Collection
Tem
p(�C)
Mg
CO2
CH4
H2
N2
Ar
He
(mmol
kg�1)
Ne
(mmol
kg�1)
Heb
(mmol
kg�1)
3He/4Heb
(R/R
A)
C/3Heb
C/3Heb
Corrc
H499-G
T5
Cham
pagne
11/2/05
47
48.64
174
0.00041
0.00181
1.01
0.0126
0.259
0.017
0.254
7.28
6.8E+10
6.6E+10
H499-G
T15
CliffHouse
11/2/05
64
44.94
567
0.0136
0.00316
1.15
0.0133
2.08
0.029
2.07
7.26
2.7E+10
2.7E+10
H492-10cc#1
Cham
pagnedropletsd
10/27/05
�4
98.7
0.00064
0.00032
0.081
0.00034
5.15
0.0123
5.15
7.31
1.9E+10
–H494-10cc#1
Cham
pagnedropletsd
10/29/05
�4
98.6
0.00092
0.00017
0.206
0.00103
5.72
0.0460
5.72
7.33
1.7E+10
–H497-10cc#2
Cham
pagnedropletsd
11/1/05
�4
99.6
0.00088
0.00023
0.224
0.00114
5.37
0.0474
5.37
7.30
1.8E+10
–H499-10cc#1
Cham
pagnedropletsd
11/2/05
�4
98.9
0.00094
0.00023
0.140
0.00128
6.99
0.0161
6.99
7.30
1.4E+10
–
Nikko
Hyp496-G
T15
Nikko,stn2
10/31/05
112
38.04
58.7
0.0019
0.0011
1.13
0.0204
0.296
0.0188
0.290
6.77
2.2E+10
2.1E+10
Hyp496-G
T5
Nikko,stn3
10/31/05
107
50.65
3.53
0.00013
0.0006
0.631
0.0121
0.0083
0.0094
0.0056
–6.7E+10
2.5E+10
Hyp496-G
T9
Nikko,stn3
10/31/05
107
51.19
0.0040
0.0081
0.0017
–Hyp500-G
T7
Nikkodeploymentsite
11/3/05
108
40.28
0.360
0.0173
0.355
6.77
Hyp500-G
T6
Nikkodeploymentsite
11/3/05
108
40.68
71.7
0.0017
0.0024
1.32
0.0153
0.391
0.0205
0.386
6.81
2.0E+10
1.9E+10
Hyp500-G
T16
Nikkosouthernlonevent
11/3/05
90
47.27
140
0.00036
0.0047
13.2
0.0323
0.233
0.2729
0.154
–Hyp500-G
T10
Nikko
11/3/05
61–68
46.76
26.4
0.00021
0.0396
26.3
0.407
0.224
0.625
0.044
–6.4E+10
5.8E+10
Hyp501-G
T15
Nikkodeploymentsite
11/4/05
110
39.87
67.7
0.00174
0.0045
15.4
0.356
0.439
0.3577
0.336
6.79
2.1E+10
2.1E+10
J2-198-G
T11
NNikko
5/7/06
215
46.19
25.3
0.00013
0.00056
0.608
0.0182
0.0447
0.0112
0.0415
6.88
6.4E+10
5.8E+10
Hyp500-G
T17
Nikkogas
bubbled
11/03/05
––
96.50
0.0033
0.00077
1.057
0.0181
18.5
0.11
18.5
6.89
5.5E+09
–
Giggenbach
P5-618-G
T2
Diffuse
SW
flank
04/15/05
72.3
47.39
0.057
27.3
0.049
7.37
P5-618-G
T11
Summitmussel
bed
04/15/05
70.4
52.35
3.815
0.00120
0.00006
0.512
0.0175
0.050
9.0
0.048
7.48
7.6E+09
3.1E+09
P5-619-G
T12
Giggenbachmk12
04/16/05
203
34.15
361
0.0161
0.0856
3.43
0.0799
15.0
54.5
15.0
7.42
2.3E+09
2.3E+09
P5-619-G
T6
Giggenbachmk12
04/16/05
203
28.18
14.3
59.8
14.3
7.43
P5-619-G
T7
Giggenbachmk12
04/16/05
203
30.70
177
0.015
0.063
1.066
0.045
8.78
66.5
8.76
7.44
2.0E+09
1.9E+09
P5-620-G
T11
Giggenbachmk10
04/17/05
165
51.18
4.42
0.00057
0.00136
0.656
0.0149
0.057
13.1
0.053
7.49
8.0E+09
3.9E+09
P5-620-G
T2
Giggenbachmk12
04/17/05
203
52.6
2.23
0.00047
0.00091
0.093
0.0013
2.4E+09
P5-620-G
T12
Giggenbachgas
d04/17/05
53.8
1.56
53.4
7.41
P5-620-G
T6
Giggenbachgas
d04/17/05
77.5
0.0134
0.0330
4.81
0.0721
57.0
1.38
56.6
7.43
1.3E+09
–P5-620-G
T6
Giggenbachgas
d04/17/05
88.9
0.0063
0.0226
5.45
0.0725
57.0
1.38
56.6
7.43
1.5E+09
–P5-619-Fl.22
Giggenbachmk12d
04/16/05
84.8
0.00743
0.0247
12.9
0.129
P5-619-Fl.17
Giggenbachmk12d
04/16/05
68.0
3.60
67.0
7.46
Volcano-1
P4-141-G
T12
VentField
6/24/05
50
50.64
108
0.0306
5.54
0.397
0.0079
0.395
6.59
3.0E+10
2.9E+10
P4-141-G
T10
Mussel
Field
6/24/05
68
51.86
133
0.0216
0.014
0.649
0.0149
0.481
0.0089
0.479
6.61
3.0E+10
3.0E+10
P4-142-G
T6
Bubble
Site
6/25/05
71
52.15
3.66
0.0005
1.63
0.0087
0.0079
0.0064
6.95
5.9E+10
2.5E+10
P4-142-G
T2
Mussel
Bowl
6/25/05
150
51.46
4.68
0.00002
0.00003
0.451
0.0149
0.0732
0.0019
0.0727
6.88
6.7E+09
3.6E+09
R1050-G
T10
Marker
43
5/11/07
64
52.1
177.0
0.0267
0.00060
1.167
0.0205
0.897
0.016
0.892
6.60
2.2E+10
2.1E+10
R1050-G
T5
BubblesVent
5/11/07
39
54.8
37.0
0.0003
0.00042
0.492
0.0164
0.029
0.0098
0.026
6.71
1.5E+11
1.5E+11
R1051-G
T15
BubblesVent
5/12/07
17
56.0
12.24
0.0004
0.00051
0.620
0.0170
0.106
0.0121
0.103
6.66
1.3E+10
1.1E+10
R1053-G
T10
SulfurVent
5/14/07
36
55.2
42.44
0.0286
0.00014
0.774
0.0185
0.246
0.0143
0.242
6.68
1.9E+10
1.8E+10
P4-141-Fl.22
Mussel
Field
(gas)d
6/24/05
68
12.7
0.275
12.8
6.59
P4-141-Fl.16
Mussel
Field
(gas)d
6/24/05
68
102
0.052
0.0253
1.27
0.0151
12.4
0.179
12.5
6.60
8.9E+09
–
Table
1.(continued)
B08S12 LUPTON ET AL.: VENTING OF A SEPARATE CO2-RICH GAS PHASE
14 of 21
B08S12
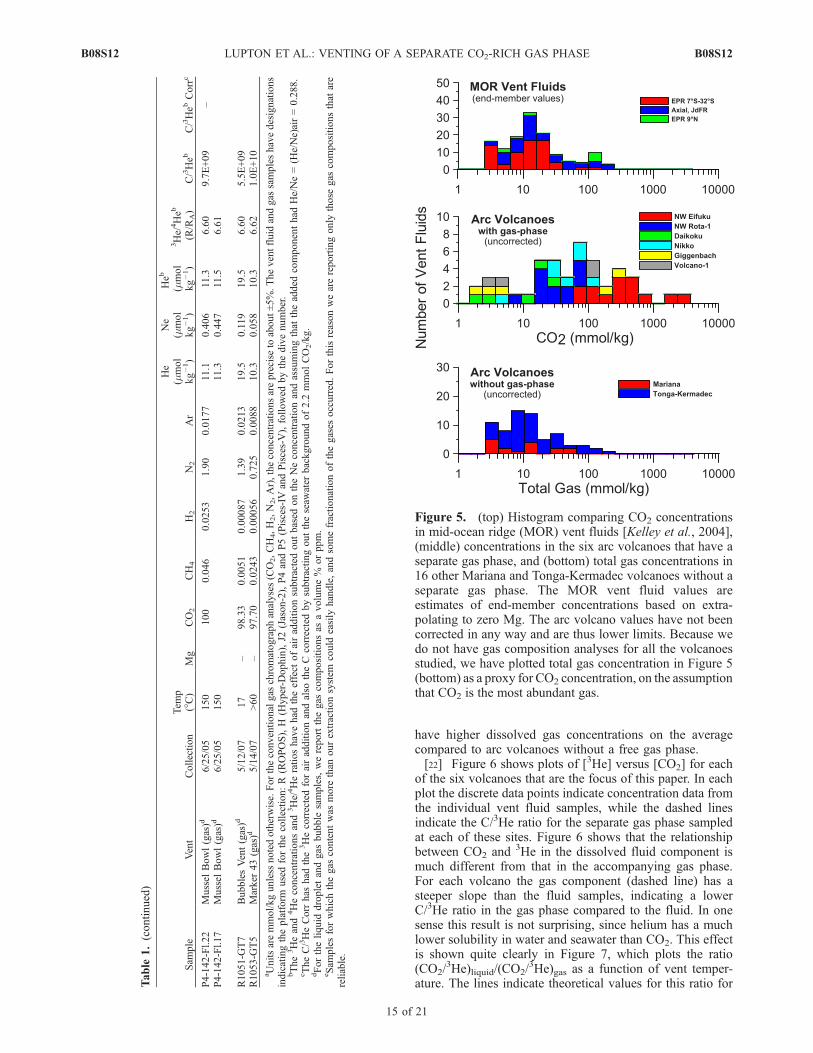
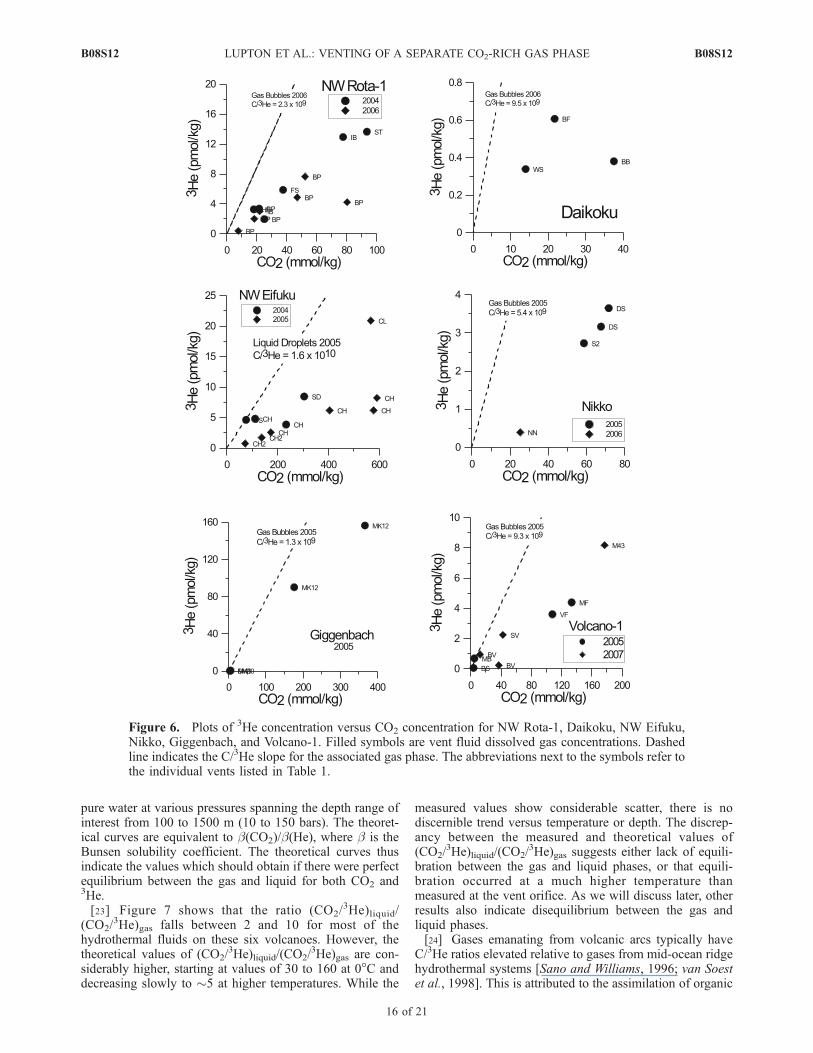
have higher dissolved gas concentrations on the averagecompared to arc volcanoes without a free gas phase.[22] Figure 6 shows plots of [3He] versus [CO2] for each
of the six volcanoes that are the focus of this paper. In eachplot the discrete data points indicate concentration data fromthe individual vent fluid samples, while the dashed linesindicate the C/3He ratio for the separate gas phase sampledat each of these sites. Figure 6 shows that the relationshipbetween CO2 and 3He in the dissolved fluid component ismuch different from that in the accompanying gas phase.For each volcano the gas component (dashed line) has asteeper slope than the fluid samples, indicating a lowerC/3He ratio in the gas phase compared to the fluid. In onesense this result is not surprising, since helium has a muchlower solubility in water and seawater than CO2. This effectis shown quite clearly in Figure 7, which plots the ratio(CO2/
3He)liquid/(CO2/3He)gas as a function of vent temper-
ature. The lines indicate theoretical values for this ratio for
Figure 5. (top) Histogram comparing CO2 concentrationsin mid-ocean ridge (MOR) vent fluids [Kelley et al., 2004],(middle) concentrations in the six arc volcanoes that have aseparate gas phase, and (bottom) total gas concentrations in16 other Mariana and Tonga-Kermadec volcanoes without aseparate gas phase. The MOR vent fluid values areestimates of end-member concentrations based on extra-polating to zero Mg. The arc volcano values have not beencorrected in any way and are thus lower limits. Because wedo not have gas composition analyses for all the volcanoesstudied, we have plotted total gas concentration in Figure 5(bottom) as a proxy for CO2 concentration, on the assumptionthat CO2 is the most abundant gas.
Sam
ple
Vent
Collection
Tem
p(�C)
Mg
CO2
CH4
H2
N2
Ar
He
(mmol
kg�1)
Ne
(mmol
kg�1)
Heb
(mmol
kg�1)
3He/4Heb
(R/R
A)
C/3Heb
C/3Heb
Corrc
P4-142-Fl.22
Mussel
Bowl(gas)d
6/25/05
150
100
0.046
0.0253
1.90
0.0177
11.1
0.406
11.3
6.60
9.7E+09
–P4-142-Fl.17
Mussel
Bowl(gas)d
6/25/05
150
11.3
0.447
11.5
6.61
R1051-G
T7
BubblesVent(gas)d
5/12/07
17
–98.33
0.0051
0.00087
1.39
0.0213
19.5
0.119
19.5
6.60
5.5E+09
R1053-G
T5
Marker
43(gas)d
5/14/07
>60
–97.70
0.0243
0.00056
0.725
0.0088
10.3
0.058
10.3
6.62
1.0E+10
aUnitsaremmol/kgunless
notedotherwise.Fortheconventionalgas
chromatographanalyses(CO2,CH4,H2,N2,Ar),theconcentrationsareprecise
toabout±5%.Theventfluid
andgas
sampleshavedesignations
indicatingtheplatform
usedforthecollection:R(ROPOS),H
(Hyper-D
ophin),J2
(Jason-2),P4andP5(Pisces-IV
andPisces-V),followed
bythedivenumber.
bThe
3Heand
4Heconcentrationsand
3He/4Heratioshavehad
theeffect
ofairadditionsubtractedoutbased
ontheNeconcentrationandassumingthat
theadded
componenthad
He/Ne=(H
e/Ne)air=0.288.
cTheC/3HeCorrhas
had
the
3Hecorrectedforairadditionandalso
theCcorrectedbysubtractingouttheseaw
ater
backgroundof2.2
mmolCO2/kg.
dFortheliquid
dropletandgas
bubble
samples,wereportthegas
compositionsas
avolume%
orppm.
eSam
plesforwhichthegas
contentwas
more
than
ourextractionsystem
could
easily
handle,andsomefractionationofthegases
occurred.Forthisreasonwearereportingonly
those
gas
compositionsthat
are
reliable.
Table
1.(continued)
B08S12 LUPTON ET AL.: VENTING OF A SEPARATE CO2-RICH GAS PHASE
15 of 21
B08S12
pure water at various pressures spanning the depth range ofinterest from 100 to 1500 m (10 to 150 bars). The theoret-ical curves are equivalent to b(CO2)/b(He), where b is theBunsen solubility coefficient. The theoretical curves thusindicate the values which should obtain if there were perfectequilibrium between the gas and liquid for both CO2 and3He.[23] Figure 7 shows that the ratio (CO2/
3He)liquid/(CO2/
3He)gas falls between 2 and 10 for most of thehydrothermal fluids on these six volcanoes. However, thetheoretical values of (CO2/
3He)liquid/(CO2/3He)gas are con-
siderably higher, starting at values of 30 to 160 at 0�C anddecreasing slowly to �5 at higher temperatures. While the
measured values show considerable scatter, there is nodiscernible trend versus temperature or depth. The discrep-ancy between the measured and theoretical values of(CO2/
3He)liquid/(CO2/3He)gas suggests either lack of equili-
bration between the gas and liquid phases, or that equili-bration occurred at a much higher temperature thanmeasured at the vent orifice. As we will discuss later, otherresults also indicate disequilibrium between the gas andliquid phases.[24] Gases emanating from volcanic arcs typically have
C/3He ratios elevated relative to gases from mid-ocean ridgehydrothermal systems [Sano and Williams, 1996; van Soestet al., 1998]. This is attributed to the assimilation of organic
Figure 6. Plots of 3He concentration versus CO2 concentration for NW Rota-1, Daikoku, NW Eifuku,Nikko, Giggenbach, and Volcano-1. Filled symbols are vent fluid dissolved gas concentrations. Dashedline indicates the C/3He slope for the associated gas phase. The abbreviations next to the symbols refer tothe individual vents listed in Table 1.
B08S12 LUPTON ET AL.: VENTING OF A SEPARATE CO2-RICH GAS PHASE
16 of 21
B08S12
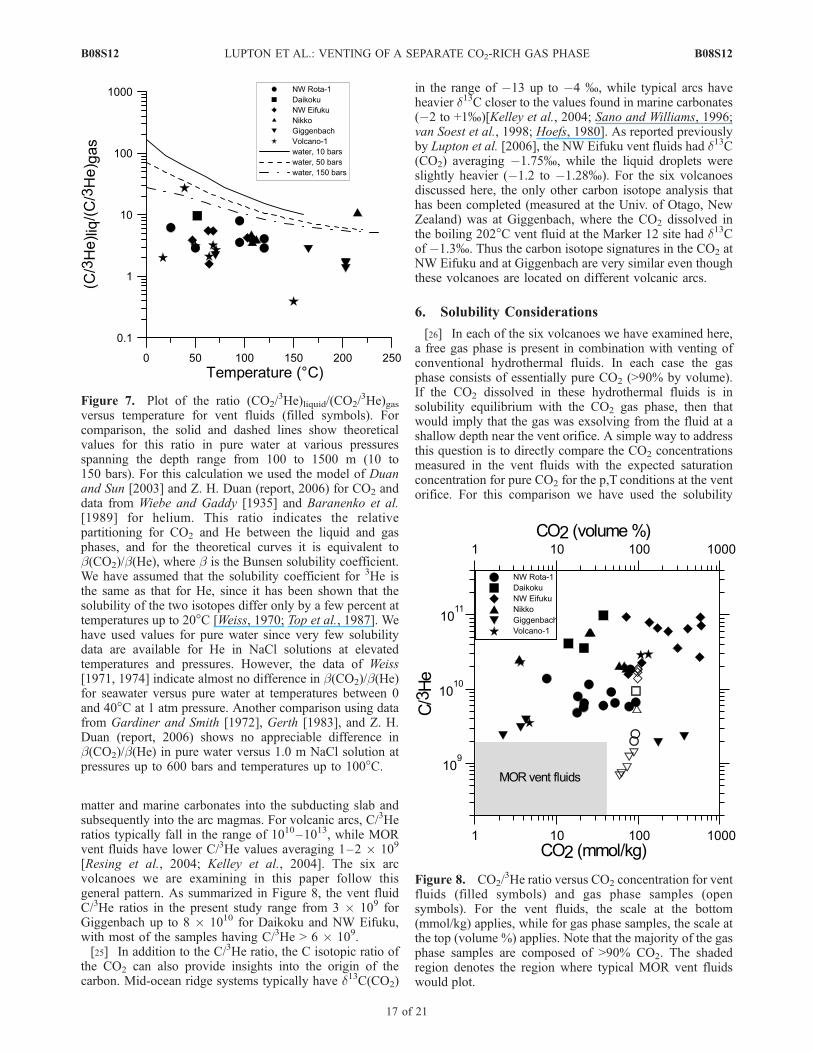
matter and marine carbonates into the subducting slab andsubsequently into the arc magmas. For volcanic arcs, C/3Heratios typically fall in the range of 1010–1013, while MORvent fluids have lower C/3He values averaging 1–2 � 109
[Resing et al., 2004; Kelley et al., 2004]. The six arcvolcanoes we are examining in this paper follow thisgeneral pattern. As summarized in Figure 8, the vent fluidC/3He ratios in the present study range from 3 � 109 forGiggenbach up to 8 � 1010 for Daikoku and NW Eifuku,with most of the samples having C/3He > 6 � 109.[25] In addition to the C/3He ratio, the C isotopic ratio of
the CO2 can also provide insights into the origin of thecarbon. Mid-ocean ridge systems typically have d13C(CO2)
in the range of �13 up to �4 %, while typical arcs haveheavier d13C closer to the values found in marine carbonates(�2 to +1%)[Kelley et al., 2004; Sano and Williams, 1996;van Soest et al., 1998; Hoefs, 1980]. As reported previouslyby Lupton et al. [2006], the NW Eifuku vent fluids had d13C(CO2) averaging �1.75%, while the liquid droplets wereslightly heavier (�1.2 to �1.28%). For the six volcanoesdiscussed here, the only other carbon isotope analysis thathas been completed (measured at the Univ. of Otago, NewZealand) was at Giggenbach, where the CO2 dissolved inthe boiling 202�C vent fluid at the Marker 12 site had d13Cof �1.3%. Thus the carbon isotope signatures in the CO2 atNW Eifuku and at Giggenbach are very similar even thoughthese volcanoes are located on different volcanic arcs.
6. Solubility Considerations
[26] In each of the six volcanoes we have examined here,a free gas phase is present in combination with venting ofconventional hydrothermal fluids. In each case the gasphase consists of essentially pure CO2 (>90% by volume).If the CO2 dissolved in these hydrothermal fluids is insolubility equilibrium with the CO2 gas phase, then thatwould imply that the gas was exsolving from the fluid at ashallow depth near the vent orifice. A simple way to addressthis question is to directly compare the CO2 concentrationsmeasured in the vent fluids with the expected saturationconcentration for pure CO2 for the p,T conditions at the ventorifice. For this comparison we have used the solubility
Figure 7. Plot of the ratio (CO2/3He)liquid/(CO2/
3He)gasversus temperature for vent fluids (filled symbols). Forcomparison, the solid and dashed lines show theoreticalvalues for this ratio in pure water at various pressuresspanning the depth range from 100 to 1500 m (10 to150 bars). For this calculation we used the model of Duanand Sun [2003] and Z. H. Duan (report, 2006) for CO2 anddata from Wiebe and Gaddy [1935] and Baranenko et al.[1989] for helium. This ratio indicates the relativepartitioning for CO2 and He between the liquid and gasphases, and for the theoretical curves it is equivalent tob(CO2)/b(He), where b is the Bunsen solubility coefficient.We have assumed that the solubility coefficient for 3He isthe same as that for He, since it has been shown that thesolubility of the two isotopes differ only by a few percent attemperatures up to 20�C [Weiss, 1970; Top et al., 1987]. Wehave used values for pure water since very few solubilitydata are available for He in NaCl solutions at elevatedtemperatures and pressures. However, the data of Weiss[1971, 1974] indicate almost no difference in b(CO2)/b(He)for seawater versus pure water at temperatures between 0and 40�C at 1 atm pressure. Another comparison using datafrom Gardiner and Smith [1972], Gerth [1983], and Z. H.Duan (report, 2006) shows no appreciable difference inb(CO2)/b(He) in pure water versus 1.0 m NaCl solution atpressures up to 600 bars and temperatures up to 100�C.
Figure 8. CO2/3He ratio versus CO2 concentration for vent
fluids (filled symbols) and gas phase samples (opensymbols). For the vent fluids, the scale at the bottom(mmol/kg) applies, while for gas phase samples, the scale atthe top (volume %) applies. Note that the majority of the gasphase samples are composed of >90% CO2. The shadedregion denotes the region where typical MOR vent fluidswould plot.
B08S12 LUPTON ET AL.: VENTING OF A SEPARATE CO2-RICH GAS PHASE
17 of 21
B08S12
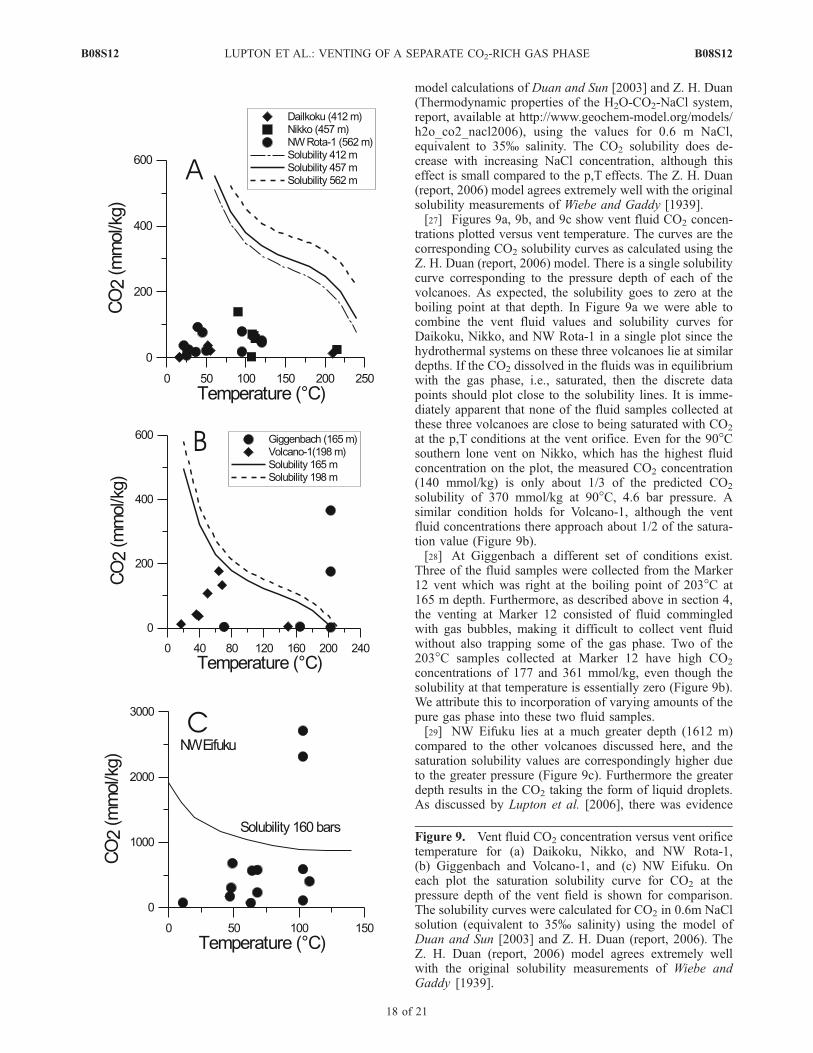
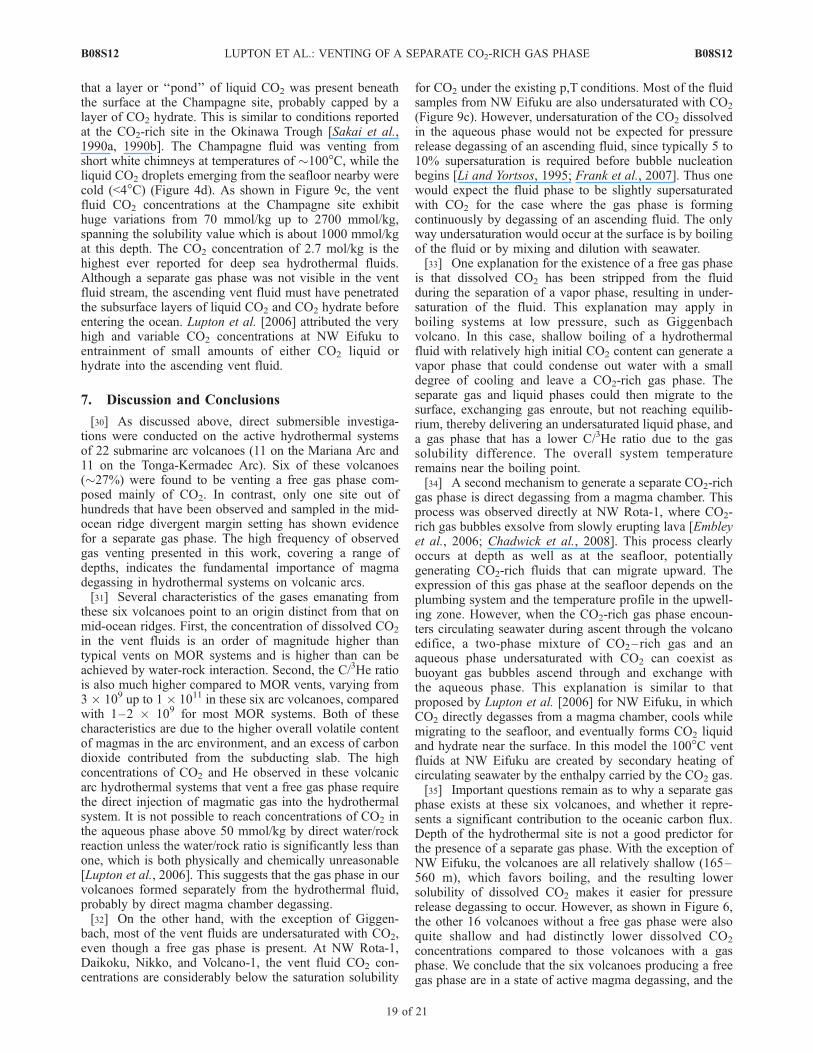
model calculations of Duan and Sun [2003] and Z. H. Duan(Thermodynamic properties of the H2O-CO2-NaCl system,report, available at http://www.geochem-model.org/models/h2o_co2_nacl2006), using the values for 0.6 m NaCl,equivalent to 35% salinity. The CO2 solubility does de-crease with increasing NaCl concentration, although thiseffect is small compared to the p,T effects. The Z. H. Duan(report, 2006) model agrees extremely well with the originalsolubility measurements of Wiebe and Gaddy [1939].[27] Figures 9a, 9b, and 9c show vent fluid CO2 concen-
trations plotted versus vent temperature. The curves are thecorresponding CO2 solubility curves as calculated using theZ. H. Duan (report, 2006) model. There is a single solubilitycurve corresponding to the pressure depth of each of thevolcanoes. As expected, the solubility goes to zero at theboiling point at that depth. In Figure 9a we were able tocombine the vent fluid values and solubility curves forDaikoku, Nikko, and NW Rota-1 in a single plot since thehydrothermal systems on these three volcanoes lie at similardepths. If the CO2 dissolved in the fluids was in equilibriumwith the gas phase, i.e., saturated, then the discrete datapoints should plot close to the solubility lines. It is imme-diately apparent that none of the fluid samples collected atthese three volcanoes are close to being saturated with CO2
at the p,T conditions at the vent orifice. Even for the 90�Csouthern lone vent on Nikko, which has the highest fluidconcentration on the plot, the measured CO2 concentration(140 mmol/kg) is only about 1/3 of the predicted CO2
solubility of 370 mmol/kg at 90�C, 4.6 bar pressure. Asimilar condition holds for Volcano-1, although the ventfluid concentrations there approach about 1/2 of the satura-tion value (Figure 9b).[28] At Giggenbach a different set of conditions exist.
Three of the fluid samples were collected from the Marker12 vent which was right at the boiling point of 203�C at165 m depth. Furthermore, as described above in section 4,the venting at Marker 12 consisted of fluid commingledwith gas bubbles, making it difficult to collect vent fluidwithout also trapping some of the gas phase. Two of the203�C samples collected at Marker 12 have high CO2
concentrations of 177 and 361 mmol/kg, even though thesolubility at that temperature is essentially zero (Figure 9b).We attribute this to incorporation of varying amounts of thepure gas phase into these two fluid samples.[29] NW Eifuku lies at a much greater depth (1612 m)
compared to the other volcanoes discussed here, and thesaturation solubility values are correspondingly higher dueto the greater pressure (Figure 9c). Furthermore the greaterdepth results in the CO2 taking the form of liquid droplets.As discussed by Lupton et al. [2006], there was evidence
Figure 9. Vent fluid CO2 concentration versus vent orificetemperature for (a) Daikoku, Nikko, and NW Rota-1,(b) Giggenbach and Volcano-1, and (c) NW Eifuku. Oneach plot the saturation solubility curve for CO2 at thepressure depth of the vent field is shown for comparison.The solubility curves were calculated for CO2 in 0.6m NaClsolution (equivalent to 35% salinity) using the model ofDuan and Sun [2003] and Z. H. Duan (report, 2006). TheZ. H. Duan (report, 2006) model agrees extremely wellwith the original solubility measurements of Wiebe andGaddy [1939].
B08S12 LUPTON ET AL.: VENTING OF A SEPARATE CO2-RICH GAS PHASE
18 of 21
B08S12
that a layer or ‘‘pond’’ of liquid CO2 was present beneaththe surface at the Champagne site, probably capped by alayer of CO2 hydrate. This is similar to conditions reportedat the CO2-rich site in the Okinawa Trough [Sakai et al.,1990a, 1990b]. The Champagne fluid was venting fromshort white chimneys at temperatures of �100�C, while theliquid CO2 droplets emerging from the seafloor nearby werecold (<4�C) (Figure 4d). As shown in Figure 9c, the ventfluid CO2 concentrations at the Champagne site exhibithuge variations from 70 mmol/kg up to 2700 mmol/kg,spanning the solubility value which is about 1000 mmol/kgat this depth. The CO2 concentration of 2.7 mol/kg is thehighest ever reported for deep sea hydrothermal fluids.Although a separate gas phase was not visible in the ventfluid stream, the ascending vent fluid must have penetratedthe subsurface layers of liquid CO2 and CO2 hydrate beforeentering the ocean. Lupton et al. [2006] attributed the veryhigh and variable CO2 concentrations at NW Eifuku toentrainment of small amounts of either CO2 liquid orhydrate into the ascending vent fluid.
7. Discussion and Conclusions
[30] As discussed above, direct submersible investiga-tions were conducted on the active hydrothermal systemsof 22 submarine arc volcanoes (11 on the Mariana Arc and11 on the Tonga-Kermadec Arc). Six of these volcanoes(�27%) were found to be venting a free gas phase com-posed mainly of CO2. In contrast, only one site out ofhundreds that have been observed and sampled in the mid-ocean ridge divergent margin setting has shown evidencefor a separate gas phase. The high frequency of observedgas venting presented in this work, covering a range ofdepths, indicates the fundamental importance of magmadegassing in hydrothermal systems on volcanic arcs.[31] Several characteristics of the gases emanating from
these six volcanoes point to an origin distinct from that onmid-ocean ridges. First, the concentration of dissolved CO2
in the vent fluids is an order of magnitude higher thantypical vents on MOR systems and is higher than can beachieved by water-rock interaction. Second, the C/3He ratiois also much higher compared to MOR vents, varying from3 � 109 up to 1 � 1011 in these six arc volcanoes, comparedwith 1–2 � 109 for most MOR systems. Both of thesecharacteristics are due to the higher overall volatile contentof magmas in the arc environment, and an excess of carbondioxide contributed from the subducting slab. The highconcentrations of CO2 and He observed in these volcanicarc hydrothermal systems that vent a free gas phase requirethe direct injection of magmatic gas into the hydrothermalsystem. It is not possible to reach concentrations of CO2 inthe aqueous phase above 50 mmol/kg by direct water/rockreaction unless the water/rock ratio is significantly less thanone, which is both physically and chemically unreasonable[Lupton et al., 2006]. This suggests that the gas phase in ourvolcanoes formed separately from the hydrothermal fluid,probably by direct magma chamber degassing.[32] On the other hand, with the exception of Giggen-
bach, most of the vent fluids are undersaturated with CO2,even though a free gas phase is present. At NW Rota-1,Daikoku, Nikko, and Volcano-1, the vent fluid CO2 con-centrations are considerably below the saturation solubility
for CO2 under the existing p,T conditions. Most of the fluidsamples from NW Eifuku are also undersaturated with CO2
(Figure 9c). However, undersaturation of the CO2 dissolvedin the aqueous phase would not be expected for pressurerelease degassing of an ascending fluid, since typically 5 to10% supersaturation is required before bubble nucleationbegins [Li and Yortsos, 1995; Frank et al., 2007]. Thus onewould expect the fluid phase to be slightly supersaturatedwith CO2 for the case where the gas phase is formingcontinuously by degassing of an ascending fluid. The onlyway undersaturation would occur at the surface is by boilingof the fluid or by mixing and dilution with seawater.[33] One explanation for the existence of a free gas phase
is that dissolved CO2 has been stripped from the fluidduring the separation of a vapor phase, resulting in under-saturation of the fluid. This explanation may apply inboiling systems at low pressure, such as Giggenbachvolcano. In this case, shallow boiling of a hydrothermalfluid with relatively high initial CO2 content can generate avapor phase that could condense out water with a smalldegree of cooling and leave a CO2-rich gas phase. Theseparate gas and liquid phases could then migrate to thesurface, exchanging gas enroute, but not reaching equilib-rium, thereby delivering an undersaturated liquid phase, anda gas phase that has a lower C/3He ratio due to the gassolubility difference. The overall system temperatureremains near the boiling point.[34] A second mechanism to generate a separate CO2-rich
gas phase is direct degassing from a magma chamber. Thisprocess was observed directly at NW Rota-1, where CO2-rich gas bubbles exsolve from slowly erupting lava [Embleyet al., 2006; Chadwick et al., 2008]. This process clearlyoccurs at depth as well as at the seafloor, potentiallygenerating CO2-rich fluids that can migrate upward. Theexpression of this gas phase at the seafloor depends on theplumbing system and the temperature profile in the upwell-ing zone. However, when the CO2-rich gas phase encoun-ters circulating seawater during ascent through the volcanoedifice, a two-phase mixture of CO2–rich gas and anaqueous phase undersaturated with CO2 can coexist asbuoyant gas bubbles ascend through and exchange withthe aqueous phase. This explanation is similar to thatproposed by Lupton et al. [2006] for NW Eifuku, in whichCO2 directly degasses from a magma chamber, cools whilemigrating to the seafloor, and eventually forms CO2 liquidand hydrate near the surface. In this model the 100�C ventfluids at NW Eifuku are created by secondary heating ofcirculating seawater by the enthalpy carried by the CO2 gas.[35] Important questions remain as to why a separate gas
phase exists at these six volcanoes, and whether it repre-sents a significant contribution to the oceanic carbon flux.Depth of the hydrothermal site is not a good predictor forthe presence of a separate gas phase. With the exception ofNW Eifuku, the volcanoes are all relatively shallow (165–560 m), which favors boiling, and the resulting lowersolubility of dissolved CO2 makes it easier for pressurerelease degassing to occur. However, as shown in Figure 6,the other 16 volcanoes without a free gas phase were alsoquite shallow and had distinctly lower dissolved CO2
concentrations compared to those volcanoes with a gasphase. We conclude that the six volcanoes producing a freegas phase are in a state of active magma degassing, and the
B08S12 LUPTON ET AL.: VENTING OF A SEPARATE CO2-RICH GAS PHASE
19 of 21
B08S12
remaining 16 hydrothermally active volcanoes are in adifferent volcanic stage that produces less magmatic gas.[36] We know very little about the CO2 flux from these
volcanoes. For the Champagne site on NW Eifuku, Luptonet al. [2006] estimated the carbon flux at 8 � 108 mol CO2/a, which is about 0.1% of the global MOR carbon flux. Thisis remarkable considering that NW Eifuku is a relativelysmall, young volcano and that the Champagne site itself isquite small in areal extent. Furthermore, at NW Eifuku mostof the carbon flux (�98%) was carried by the liquid CO2
droplets, with the vent fluid making only a minor contribu-tion. Although liquid CO2 droplets have a higher carbonconcentration than gas bubbles, it still seems likely thatmost of the carbon flux would be carried by the separate gasphase when it is present as gas bubbles. The presence of aseparate gas phase, taken together with the very highconcentrations of dissolved CO2 in the associated ventfluids, suggests that carbon fluxes from the other fivevolcanoes (NW Rota-1, Daikoku, Nikko, Giggenbach, andVolcano-1) may be equally significant. However, it shouldbe noted that Hilton et al. [2002] estimated the carbon fluxfrom an average subaerial arc volcano at 2 � 1010 mol/a,about 25 times higher than the carbon flux from NWEifuku. Thus the carbon flux at NW Eifuku may besignificant in the ocean realm, but not necessarily for theglobal subaerial carbon flux. The next step should be toconduct detailed experiments to estimate the flux at one ormore of these volcanoes in order to assess their contributionto the oceanic carbon inventory.[37] It is also apparent that all six of these volcanoes may
represent valuable natural laboratories for studying theeffects of high CO2 concentrations on marine ecosystems.For example, the effect of CO2-induced acidity on marineorganisms with calcareous shells is already being studied atNW Eifuku, where large mussel beds are in close proximityto the Champagne vent site [Tunnicliffe et al., 2008].Another site of interest is Volcano-1, where CO2 gas bubblesare rising directly through a bed of mussels (Figures 4gand 4h). Studies of this type are particularly relevant consid-ering the recent interest in oceanic disposal of fossil fuel CO2
as a method to alleviate the increase in atmospheric CO2.
[38] Acknowledgments. We thank K. Shepard, K. Tamburri, and theother members of the Canadian ROPOS team and the captain and crew ofthe R/V Thompson for support during the 2004 SRoF expedition, K. Chibaand the other members of the Hyper-Dolphin team and the captain and crewof the R/V Natsushima for their support during the 2005 NT05-18expedition, T. Kerby and the other members of the Pisces team and thecaptain and crew of the R/V Ka’imikai-o-Kanaloa for their support duringthe 2005 SRoF expedition, and W. Sellers and the other members of theJason 2 team and the captain and crew of the R/V Melville for supportduring the 2006 SRoF expedition. E. Olson and R. Greene providedvaluable support with sample collection and analysis. S. Merle providedexcellent help with the figures, and C. Young provided engineering supportwith the gas sampling equipment. P. Stoffers, T. Worthington, U. Schwarz-Schampera, and M. Hannington helped with the investigation of Volcano-1during the SITKAP expedition. This publication is partially funded by theJoint Institute for the Study of the Atmosphere and Ocean (JISAO) underNOAA Cooperative Agreement NA17RJ1232, contribution 1481. Thiswork was supported by the NOAA Ocean Exploration Program and bythe NOAAVENTS Program. This is PMEL contribution 3148.
ReferencesBaker, E. T., R. Embley, S. L. Walker, J. A. Resing, J. Lupton, K. Nakamura,C. E. J. de Ronde, and G. Massoth (2008), Hydrothermal activityand volcano distribution along the Mariana arc, J. Geophys. Res.,113, B08S09, doi:10.1029/2007JB005423.
Baranenko, V. E., L. N. Fal’kovskii, V. S. Kirov, Y. V. Filimonov, Y. E.Lebedev, A. N. Musienko, and A. I. Piontkovskii (1989), Solubility ofhelium in water, Atomnaya Energiya, 66(5), 354–355.
Butterfield, D. A., G. J. Massoth, R. E. McDuff, J. E. Lupton, and M. D.Lilley (1990), Geochemistry of hydrothermal fluids from Axial SeamountHydrothermal Emissions Study Vent Field, Juan de Fuca Ridge: Subsea-floor boiling and subsequent fluid-rock interaction, J. Geophys. Res.,95(B8), 12,895–12,921, doi:10.1029/JB095iB08p12895.
Chadwick, W. W., Jr., D. S. Scheirer, R. W. Embley, and H. P. Johnson(2001), High-resolution bathymetric surveys using scanning sonars: Lavaflow morphology, hydrothermal vents and geologic structure at recenteruption sites on the Juan de Fuca Ridge, J. Geophys. Res., 106(B8),16,075–16,100, doi:10.1029/2001JB000297.
Chadwick, W. W., Jr., R. W. Embley, C. E. J. De Ronde, R. J. Stern, J. Hein,S. G. Merle, and S. Ristau (2004), The geologic setting of hydrothermalvents at Mariana Arc submarine volcanoes: High-resolution bathymetryand ROV observations, Eos Trans. AGU, 85(47), Fall Meet. Suppl.,Abstract V43F-06.
Chadwick, W., K. V. Cashman, R. Embley, H. Matsumoto, R. P. Dziak,C. E. J. de Ronde, T. A. Lau, N. D. Deardorff, and S. G. Merle (2008),Direct video and hydrophone observations of submarine explosive erup-tions at NW Rota-1 volcano, Mariana arc, J. Geophys. Res., 113, B08S10,doi:10.1029/2007JB005215.
de Ronde, C. E. J., E. T. Baker, G. J. Massoth, J. E. Lupton, I. C. Wright,R. A. Feely, and R. R. Greene (2001), Intra-oceanic subduction-relatedhydrothermal venting, Kermadec forearc, New Zealand, Earth Planet.Sci. Lett., 193, 359–369, doi:10.1016/S0012-821X(01)00534-9.
de Ronde, C. E. J., et al. (2007), Submarine hydrothermal activity alongthe mid-Kermadec Arc, New Zealand: Large-scale effects on venting,Geochem. Geophys. Geosyst., 8, Q07007, doi:10.1029/2006GC001495.
Dixon, J. E. (1997), Degassing of alkalic basalts, Am. Mineral., 82,368–378.
Dixon, J. E., D. A. Clague, and E. M. Stolper (1991), Degassing history ofwater, sulfur, and carbon in submarine lavas from Kilauea volcano,Hawaii, J. Geol., 99, 371–394.
Duan, Z. H., and R. Sun (2003), An improved model calculating CO2
solubility in pure water and aqueous NaCl solutions from 273 to 533 Kand from 0 to 2000 bar, Chem. Geol., 193(3–4), 257–271, doi:10.1016/S0009-2541(02)00263-2.
Embley, R. W. (2006), Geological framework for Mariana hydrother-mal systems, Eos Trans. AGU, 87(52), Fall Meet. Suppl., AbstractOS34A-01.
Embley, R. W., E. T. Baker, W. W. Chadwick Jr., J. E. Lupton, J. A. Resing,G. J. Massoth, and K. Nakamura (2004), Explorations of Mariana Arcvolcanoes reveal new hydrothermal systems, Eos Trans. AGU, 85,37–40, doi:10.1029/2004EO040001.
Embley, R. W., et al. (2006), Long-term eruptive activity at a submarine arcvolcano, Nature, 441, 494–497, doi:10.1038/nature04762.
Embley, R. W., et al. (2007), Exploring the submarine ring of fire–MarianaArc–western Pacific, Oceanography, 20(4), 68–79.
Frank, X., N. Dietrich, J. Wu, R. Barraud, and H. Z. Li (2007), Bubblenucleation and growth in fluids, Chem. Eng. Sci., 62, 7090–7097,doi:10.1016/j.ces.2007.08.030.
Gardiner, G. E., and N. O. Smith (1972), Solubility and partial molarproperties of helium in water and aqueous sodium chloride from 25 to100� and 100 to 600 atmospheres, J. Phys. Chem., 76(8), 1195–1202,doi:10.1021/j100652a019.
Gerth, W. A. (1983), Effects of dissolved electrolytes on the solubility andpartial molar volume of helium in water from 50 to 400 atmospheres at25�C, J. Sol. Chem., 12(9), 655–669, doi:10.1007/BF00648669.
Hilton, D. R., T. P. Fischer, and B. Marty (2002), Noble gases and volatilerecycling at subduction zones, in Noble Gases in Geochemistry andCosmochemistry, Rev. Mineral. Geochem., vol. 47, edited by D. Porcelli,C. J. Ballentine, and R. Wieler, pp. 319–370, Mineral. Soc. of Am.,Washington, D. C.
Hoefs, J. (1980), Stable Isotope Geochemistry, 208 pp., Springer, Berlin.Kelley, D. S., M. D. Lilley, and G. L. Fruh-Green (2004), Volatiles insubmarine environments: Food for life, in The Subseafloor Biosphereat Mid-Ocean Ridges, Geophys. Monogr. Ser., vol. 144, edited byW. Wilcock et al., pp. 167–190, AGU, Washington, D. C.
Li, X., and Y. C. Yortsos (1995), Theory of multiple bubble growth inporous media by solute diffusion, Chem. Eng. Sci., 50(8), 1247–1271,doi:10.1016/0009-2509(95)98839-7.
Lilley, M. D., E. J. Olson, J. E. Lupton, and K. L. Von Damm (1992),Volatiles in the 9�N hydrothermal system: A comparison of 1991 and1992 data, Eos Trans. AGU, 73(43), Fall Meet. Suppl., 524.
Lupton, J., D. Butterfield, M. Lilley, J. Ishibashi, D. Hey, and L. Evans(1999), Gas chemistry of hydrothermal fluids along the East Pacific Rise,5�S to 32�S (abstract), Eos Trans. AGU, 80(46), Fall Meet., Suppl.,F1099.
B08S12 LUPTON ET AL.: VENTING OF A SEPARATE CO2-RICH GAS PHASE
20 of 21
B08S12
Lupton, J., et al. (2006), Submarine venting of liquid carbon dioxide on aMariana Arc volcano, Geochem. Geophys. Geosyst., 7, Q08007,doi:10.1029/2005GC001152.
Massoth, G., C. de Ronde, J. Lupton, R. Feely, E. Baker, G. Lebon, andS. Maenner (2003), Chemically rich and diverse submarine hydrothermalplumes of the southern Kermadec volcanic arc (New Zealand), in Intra-Oceanic Subduction Systems: Tectonic and Magmatic Processes, editedby R. D. Larter and P. T. Leat, Geol. Soc. Spec. Publ., 219, 119–139.
Massoth, G., et al. (2007), Multiple hydrothermal sources along the southTonga arc and Valu Fa Ridge, Geochem. Geophys. Geosyst., 8, Q11008,doi:10.1029/2007GC001675.
Merle, S., S. Ristau, R. Embley, and W. Chadwick (2004), Submarine Ringof Fire 2004—Mariana Arc, 275 pp., NOAA, Silver Spring, Md.(Available at http://oceanexplorer.noaa.gov/explorations/04fire/logs/summary/media/marianas2004cruisereport.pdf)
Merle, S., R. Embley, G. Massoth, and A. Malahoff (2005), Cruise Reportfor New Zealand American SRoF 2005—Kermadec Arc SubmarineVolcanoes, 275 pp., NOAA, Silver Spring, Md. (Available at http://oceanexplorer.noaa.gov/explorations/05fire/logs/leg2_summary/media/srof05_cruisereport_final.pdf)
Merle, S., R. Embley, and W. Chadwick (2006), Cruise Report for SRoF2006–Mariana Arc Submarine Volcanoes, 242 pp., NOAA, SilverSpring, Md. (Available at http://oceanexplorer.noaa.gov/explorations/06fire/logs/summary/media/srof06_cruisereport_final.pdf)
Nakamura, K. (2005), R/V Natsushima NT05–18 Cruise Report, 53 pp.,Natl. Inst. of Adv. Ind. Sci. and Technol., Tsukuba, Japan, Nov.
Resing, J. A., J. E. Lupton, R. A. Feely, and M. D. Lilley (2004), CO2 and3He in hydrothermal plumes: Implications for mid-ocean ridge CO2 flux,Earth Planet. Sci. Lett., 226, 449–464, doi:10.1016/j.epsl.2004.07.028.
Sakai, H., T. Gamo, E.-S. Kim, K. Shitashima, F. Yanagisawa, and M.Tsutsumi (1990a), Unique chemistry of the hydrothermal solution inthe Mid-Okinawa Trough backarc basin, Geophys. Res. Lett., 17,2133–2136, doi:10.1029/GL017i012p02133.
Sakai, H., T. Gamo, E.-S. Kim, M. Tsutsumi, T. Tanaka, J. Ishibashi, H.Wakita, M. Yamano, and T. Oomori (1990b), Venting of carbon dioxide-rich fluid and hydrate formation in Mid-Okinawa Trough backarc basin,Science, 248, 1093–1096, doi:10.1126/science.248.4959.1093.
Sano, Y., and S. N. Williams (1996), Fluxes of mantle and subductedcarbon along convergent plate boundaries, Geophys. Res. Lett., 23,2749–2752, doi:10.1029/96GL02260.
Stoffers, P., T. Worthington, U. Schwarz-Schampera, L. Evans, M.Hannington, R. Hekinian, L. Lundsten, G. Massoth, M. Schmidt, andR. Vaiomo’unga (2005), Cruise Report for SITKAP, 112 pp., Inst. furGeowis. Univ. Kiel, Kiel, Germany, June.
Stoffers, P., et al. (2006), Submarine volcanoes and high-temperature hy-drothermal venting on the Tonga arc, southwest Pacific, Geology, 34,453–456, doi:10.1130/G22227.1.
Top, Z., W. C. Eismont, and W. B. Clarke (1987), Helium isotope effect andsolubility of helium and neon in distilled water and seawater, Deep SeaRes., 34(7), 1139–1148, doi:10.1016/0198-0149(87)90068-9.
Tunnicliffe, V., K. T. Davies, D. A. Butterfield, R. W. Embley, and C.Rideout (2008), Calcification of mussel shells in a setting of high carbon
dioxide release on a seamount in the Mariana volcanic arc: Biotic re-sponses to a low pH ocean, paper presented at ASLO Ocean SciencesMeeting, Am. Soc. of Limnol. and Oceanogr., Orlando, Fla., March.
van Soest, M. C., D. R. Hilton, and R. Kreulen (1998), Tracing crustal andslab contributions to arc magmatism in the Lesser Antilles island arcusing helium and carbon relationships in geothermal fluids, Geochim.Cosmochim. Acta, 62, 3323–3335, doi:10.1016/S0016-7037(98)00241-5.
Von Damm, K. L. (1995), Controls on the chemistry and temporal varia-bility of seafloor hydrothermal fluids, in Seafloor Hydrothermal Systems:Physical, Chemical, Biological, and Geological Interactions, Geophys.Monogr. Ser., vol. 91, edited by S. E. Humphris et al., pp. 222–247,AGU, Washington, D. C.
Von Damm, K. L., et al. (1995), Evolution of East Pacific Rise hydrother-mal vent fluids following a volcanic eruption, Nature, 375, 47–50,doi:10.1038/375047a0.
Wallace, P. J. (2005), Volatiles in subduction zone magmas: Concentrationsand fluxes based on melt inclusion and volcanic gas data, J. Volcanol.Geotherm. Res., 140, 217–240, doi:10.1016/j.jvolgeores.2004.07.023.
Weiss, R. F. (1970), Helium isotope effect in solution in water and seawater,Science, 168, 247–248, doi:10.1126/science.168.3928.247.
Weiss, R. F. (1971), The solubility of helium and neon in water and sea-water, J. Chem. Eng. Data, 16, 235–241, doi:10.1021/je60049a019.
Weiss, R. F. (1974), Carbon dioxide in water and seawater: The solubility ofa non-ideal gas, Mar. Chem., 2, 203 – 215, doi:10.1016/0304-4203(74)90015-2.
Wiebe, R., and V. L. Gaddy (1935), The solubility of helium in water at 0,25, 50, and 75� and at pressures to 1000 atmosphere, J. Am. Chem. Soc.,57, 847–851, doi:10.1021/ja01308a017.
Wiebe, R., and V. L. Gaddy (1939), The solubility in water of carbondioxide at 50, 75, and 100�, at pressures to 700 atmospheres, J. Am.Chem. Soc., 61, 315–318, doi:10.1021/ja01871a025.
�����������������������D. Butterfield, JISAO, University of Washington, 7600 Sand Point Way
NE, Seattle, WA 98115-6349, USA.B. Christenson, Institute of Geological and Nuclear Sciences, P.O. Box
31, Lower Hutt 31-312, New Zealand.R. Embley and J. Lupton, Pacific Marine Environmental Laboratory,
NOAA, 2115 SE OSU Drive, Newport, OR 97365-5258, USA.([email protected])L. Evans, CIMRS, Oregon State University, 2030 Marine Science Drive,
Newport, OR 97365-5258, USA.M. Lilley, School of Oceanography, University of Washington, Seattle,
WA 98195, USA.G. Massoth, Mass-Ex3 Consulting LLC, 2100 Lake Washington
Boulevard N, N101, Renton, WA 98056, USA.K. Nakamura, National Institute of Advanced Science and Technology,
Ibaraki, Tsukuba 305-8567, Japan.M. Schmidt, Institute of Geosciences, University of Kiel, D-24118 Kiel,
Germany.
B08S12 LUPTON ET AL.: VENTING OF A SEPARATE CO2-RICH GAS PHASE
21 of 21
B08S12


![[1990] Tonga LR 99 - Crown Law Tonga](https://static.fdokumen.com/doc/165x107/63221e49887d24588e0416ae/1990-tonga-lr-99-crown-law-tonga.jpg)