Variety is the Spice of Life - and Boardrooms - Henley ...
25
Discussion Paper Number: ICM-2014-11 Discussion Paper Variety is the Spice of Life – and Boardrooms October 2014 Carol Padgett ICMA Centre, Henley Business School, University of Reading
-
Upload
khangminh22 -
Category
Documents
-
view
0 -
download
0
Transcript of Variety is the Spice of Life - and Boardrooms - Henley ...

Discussion Paper Number:
ICM-2014-11
Discussion Paper
Variety is the Spice of Life – and Boardrooms
October 2014
Carol Padgett ICMA Centre, Henley Business School, University of Reading

ii © Padgett, October 2014
The aim of this discussion paper series is to
disseminate new research of academic
distinction. Papers are preliminary drafts,
circulated to stimulate discussion and critical
comment. Henley Business School is triple
accredited and home to over 100 academic
faculty, who undertake research in a wide range
of fields from ethics and finance to international
business and marketing.
www.icmacentre.ac.uk
© Padgett, October 2014

Henley Discussion Paper Series
© Padgett,October 2014 1
Variety is the Spice of Life – and Boardrooms
Abstract We examine the impact of board diversity on both the corporate value and equity risk of
British companies since the financial crisis. We find that the inclusion of overseas directors
on boards improves market value and reduces equity risk. When the number of female
directors included on the board reaches a critical mass this also increases corporate value
but has no effect on risk. These findings do not change when we allow for the presence of
board members who are qualified accountants or who hold MBAs. Diversity in and of itself
has a significant effect on corporate performance.
Keywords corporate value, risk, board diversity, gender, nationality
JEL Classifications G34, J15, J16
Contact [email protected]
ICMA Centre
2 © Padgett, October 2014
Introduction
Corporate governance regulation in the UK (Financial Reporting Council, 2012) stresses the
need for boards to be balanced in terms of independence, skills, experience and knowledge.
Much empirical research in corporate governance has focussed on the relationship between
board independence and corporate performance, but in some cases the hypothesised positive
relationship has not been observed (see for example Agrawal and Knoeber, 1996 and Vafeas and
Theodorou, 1998). Over the years researchers have started to explore other areas of board
diversity, and have found that corporate performance, measured in a variety of ways, is better
when boards are diverse in terms of the gender (Carter et al., 2010, Erhardt et al., 2003 and
Campbell and Minguez-Vera, 2007), ethnicity (Miller and Triana, 2009) and nationality (Masulis
et al., 2012, Oxelheim and Randøy, 2003 and Rose et al., 2013) of directors. These findings may
be related to balance in terms of educational and professional background and experience.
Ruigrok et al. (2007) find that there are significant differences in the educational background of
the women and men, and in the experience of foreign and domestic directors on Swiss boards.
In the UK there is a lot of interest in gender diversity on boards and increasing regulatory
pressure to appoint more female directors. In 2009 the 30% Club was formed with the aim of
achieving female board representation of 30% by 2015. 30% was chosen because it represents a
critical mass at which “minority” groups are able to function without being seen simply as
representatives of their minority. In 2011 the EU Justice Commissioner announced the same
goal for companies in the EU, with a further increase to 40% by 2020. The Norwegian
government had already gone further than this. In 2003 it passed a law introducing a 40% quota
which became mandatory in 2008. In the UK the latest version of the UK Corporate Governance
Code (Financial Reporting Council, 2012) includes recommendations on diversity, and the
updated Davies Report (Davies, 2013) suggests a target of 25% female representation on the
boards of FTSE 100 companies by 2015 and urges the chairs of FTSE 350 companies to lay down
their own aspirational goals.
There are two distinct arguments in favour of diversity. The first rests on the logic of fairness in
the representation of particular groups in decision-making bodies. As Lord Davies puts it (Davies,
2013), it does not make sense for a group that makes up more than half of the general
population and nearly half of the working population, to play a relatively small role in decision-
making in the highest echelons of the business world. The second argument is based on the idea
that companies are missing out on a large talent pool that could contribute to improved
performance. This argument could be extended to foreign directors who may have expertise in

Henley Discussion Paper Series
© Padgett,October 2014 3
relation to overseas markets, regulation and institutions, which could be valuable to companies
operating in those markets.
While there is an extensive literature on the relationship between board composition and
corporate performance measured in both accounting and market terms, there is relatively little
evidence on the effects of board composition on corporate risk-taking. We do know however
that in general terms women are more risk-averse than men (Charness and Gneezy, 2012) and
that women make fewer trades in experimental markets (Fellner and Maciejovsky, 2007). Some
authors (Huang and Kisgen, 2013, and Levi et al., 2013) have found that boards with more
female members make fewer takeover bids, which could indicate greater risk aversion, although
Ahern and Dittmar (2012) find the opposite in the case of Norway, where as we have already
seen, a quota system ensures that 40% of board members are women.
The novelty of this paper is that we examine the relationships between both corporate value and
risk and gender and national diversity in British boards since the financial crisis that started in
2007/8. In our balanced panel of FTSE350 firms we see that female board representation has
increased significantly since 2007 while the proportion of overseas directors has been stable but
remains higher than the proportion of women on boards. We find that no matter how we
measure national diversity, it has a positive impact on value and a negative effect on risk. These
findings are robust to the addition of variables that account for the educational and professional
background of board members. Our findings on gender indicate that the inclusion of women on
boards has an impact on value only when at least three women are present. This is in line with
the idea that minority groups can only have an impact when they reach a critical mass. Again the
inclusion of additional variables does not change this result. The critical mass of women on
boards has no effect on risk.
The paper continues as follows, the next section reviews relevant literature and introduces the
hypotheses that are tested later. We then describe the model and the data used in estimation,
before presenting our empirical results and offering conclusions.
Literature review and hypothesis development
Gender and corporate performance
Previous research on the boards of British companies has shown that female representation
depends not just on the size of the company but on the characteristics of its board and industry.
For example Brammer et al. (2007) note that women tend to be found on larger boards and on

ICMA Centre
4 © Padgett, October 2014
those which have more non-executive members. Retailers, banks, media and utility companies
have more diverse boards. This may reflect a greater stakeholder- or more specifically consumer-
orientation in these businesses. Female board members can provide valuable insights in markets
where women make purchasing decisions.
This observation implies that, at least in some industries, the presence of women on boards
could influence corporate performance. This is borne out by studies of American companies that
find a positive relationship between profitability and the proportion of women on the board
(Carter et al. 2010, and Erhardt et al., 2003). While Carter et al. (2010) do not find a similar
relationship between gender diversity and market value, Miller and Triana (2009) find that such
a relationship is mediated through innovativeness which is positively associated with diversity.
Campbell and Minguez-Vera (2007) use a variety of measures of board diversity on their Spanish
dataset. They find that, for most measures the relationship between market value and female
board representation is positive. The exception to this comes when they use a simple dummy
variable indicating the presence of one or more women on the board. This suggests that simply
having a lone woman on the board is not enough; women can only make a difference when they
reach a critical mass.
Kanter (1977) argues that when only one member of a group is female (or comes from any other
“minority”) the rest of the group and indeed the woman herself become fixated on the fact that
she is a woman and therefore representative of women in general, rather than seeing her as an
individual. This inhibits normal working relationships. It is only when a critical mass of women is
present in the group that they cease to be seen as women and become simply group members.
Recent research suggests that the critical mass is 30% which in most countries translates to three
directors. Torchia et al. (2011) find that innovation in Norwegian companies is improved by the
presence of three women and Joecks et al. (2013) report that German companies experience an
increase in return on equity when the board includes at least three women.
Ahern and Dittmar (2012) provide an exception to the generally rosy picture of board diversity.
They look at Norway in the wake of legislation mandating that 40% of the board be female. It is
interesting to note that this quota exceeds the critical mass identified in the literature. Following
implementation of the law Tobin’s Q fell significantly. A closer look at the data reveals that the
new female directors appointed were significantly younger than their male counterparts and
had less experience as CEOs. It is likely that these other characteristics drive the results. This
finding indicates the danger of imposing quotas rather than allowing companies to appoint
female directors on the basis of talent and experience alone.
Henley Discussion Paper Series
© Padgett,October 2014 5
Given that the UK has only recently introduced targets we believe that those women who sit on
corporate boards are there on merit rather than is response to regulatory pressure, and that
thanks to their different experience, background or attitude they bring additional value to their
companies. This leads to:
Hypothesis 1(a): there is a positive relationship between corporate value and female
board representation.
In addition to their work on value creation, Ahern and Dittmar (2012) also look at other aspects
of corporate behaviour to see if the quota system has had an effect. They find that companies
became more levered and undertook more mergers. This finding is interesting given that
researchers who have examined risk-taking by men and women find that women are more risk-
averse (Charness and Gneezy, 2012) and make fewer trades in experimental markets (Fellner
and Maciejovsky, 2007). The Norwegian findings also contradict those of Huang and Kisgen
(2013) and Levi et al. (2013) who observe that boards with more female members make fewer
takeover bids, potentially because women are less over-confident than men. However, Sila et al.
(2014) find that the relationship between risk and gender depends on the functional form of the
model being tested.
The balance of existing evidence on various aspects of risk-taking by women leads to:
Hypothesis 2 (a): there is a negative relationship between corporate risk and female
board representation.
Nationality and corporate performance
Given that existing evidence from a variety of markets shows that gender diversity has positive
impacts on corporate performance it makes sense that other forms of diversity should also be
beneficial. Overseas directors may have very different educational and cultural backgrounds,
giving them different attitudes to problem-solving as well as valuable knowledge of other
markets. Masulis et al. (2012) find that overseas directors create value in terms of higher CARs
around acquisition announcements in companies that make acquisitions in the home regions of
their foreign directors. Oxelheim and Randøy (2003) find that the market value of Norwegian
and Swedish companies increases when they have British or American directors on their boards.
They suggest that this is because these directors bring with them Anglo-Saxon governance
norms. In a similar vein, Rose et al. (2013) examine the influence of overseas directors on the
performance of Nordic and German companies. They find that directors from common law
countries have a positive impact on performance. Anderson et al. (2011) do not look specifically
ICMA Centre
6 © Padgett, October 2014
at nationality, but find that board diversity measured by an index that includes age, gender,
ethnicity, education, profession and board experience, is valuable in relatively complex
organisations.
This leads us to hypothesise that overseas directors will have the same impact on performance
and risk as women directors.
Hypothesis 1(b): there is a positive relationship between corporate value and overseas
board representation.
Hypothesis 2(b): there is a negative relationship between corporate risk and overseas
board representation.
The model and data
In order to investigate whether or not corporate performance and risk are affected by board
diversity we estimate a variety of models taking the general form:
performance , ∑ β control , ∑ β governance , β genderdiversity ,
β nationaldiversity , ε , (1)
risk ,
∑ β control , ∑ β governance , β genderdiversity , β nationaldiversity ,
ε , (2)
where 1 and 2 are vectors of coefficients, control is a vector of accounting and financial data,
governance is a vector of board characteristics other than gender or nationality, the subscript i
refers to a company i and t to time. The control variables are measured contemporaneously with
performance but the governance and diversity variables are measured with a lag. We do this
because these two sets of variables are concerned with board characteristics. Given the strategic
nature of the decisions made by the board, changes in its composition are unlikely to have an
immediate effect on decision-making and therefore on value or risk. In addition the used of
lagged variables means that board composition cannot be endogenous to the model. Appendix
1 provides a detailed description of the data sources used for each variable. Briefly, the board
characteristics were hand collected from annual reports and, where necessary, were checked
using Amadeus or Osiris. The accounting data are from Fame and the market data from
Bloomberg.
Our value measure is the Chung and Pruitt (1994) approximation of Tobin’s Q, measured at the
end of each company’s financial year. Return on capital employed (ROCE) is the ratio of pre-tax
Henley Discussion Paper Series
© Padgett,October 2014 7
profit to total assets minus current liabilities. Size is measured as the natural logarithm of total
assets (LOGTA) as in Carter et al. (2010), gearing (LOGGEAR) is defined as the sum of short-term
overdrafts and loans, long-term loans and liabilities divided by shareholders’ funds and again is
measured in logs, innovation (INNOV) is defined as research and development spending divided
by turnover as in Miller and Triana (2009). We anticipate a positive relationship between ROCE
and Q because we expect the market to react positively to improvements in accounting
performance. We expect size to be negatively related to performance on the grounds that
smaller companies usually offer a premium to investors and during a period of uncertainty like
the one examined here, surviving small firms are able to adapt rather quicker to changing
circumstances that their larger competitors. This would be consistent with results obtained by
Carter et al. (2010). Innovation should have a positive impact on performance, as in Miller and
Triana (2009). The relationship between gearing and value could be positive or negative
depending on whether the companies in the sample are moving towards an optimum capital
structure and creating valuable tax shields, or have exceeded the optimum and are starting to
incur financial distress costs.
Board size (LOGBOARD) is the natural log of the total number of directors, board age (LOGAGE)
is the natural log of the average age of the board and the proportion of non-executives
(PROPNED) is simply the number of non-executives divided by board size. We hypothesise that
better governance leads to improved performance. This translates into the expectation that the
coefficient on board size will be negative (Guest, 2009) and on the percentage of non-executives
will be positive (Choi et al., 2007). Assuming that age and experience are positively correlated,
age should have a positive effect on performance.
We include four different measures of diversity for both gender and nationality. The simplest is
the proportion of female (PROPF) and overseas (PROPOSEAS) board members; this includes
both executives and non-executives. As an alternative to the simple proportion we also use the
Blau index. The Blau index (Blau, 1977) is calculated as:1 ∑ where Pi is the percentage of
board members in each category. The index (BLAUN for nationality and BLAUG for gender) varies
between 0 indicating no diversity to 0.5 when there are equal numbers of both categories. These
two measures are used by Miller and Triana (2009). We also use dummy variables taking the
value 1 when a woman or overseas directors is present (FAL1 and OAL1 respectively) or zero
otherwise. Finally in the spirit of the critical mass literature we include a dummy variable that
takes the value 1 if there are at least three women or overseas directors (FAL3 and OAL3
respectively) serving on the board, as in Torchia et al. (2011). Given the results described in the
previous section we expect the diversity variables to have a positive effect on value.
ICMA Centre
8 © Padgett, October 2014
When estimating (2) risk is measured as the standard deviation of weekly stock returns. In
addition to the variables already described, we add the average annual weekly return on the
company’s stock. Our expectation, based on portfolio theory is that risk and return will be
positively related. We also expect that risk will increase with higher gearing and, more
innovation and risk will be negatively affected by size. It is harder to reach clear cut expectations
about the relationship between risk and good governance. If we take the view that self-seeking
boards are more risk-averse than the shareholders they serve, we would expect to see a positive
coefficient on the proportion of non-executives. On the other hand, if we take the view that
shareholder protection is about reducing risk, which is especially pertinent during the time
period under consideration here, we would expect to see the reverse. Large boards are
associated with slower decision-making and with less extreme decisions leading to lower risk
(Nakano and Nguyen, 2012) so we expect a negative relationship between risk and board size.
Bertrand and Schoar (2003) find that older CEOs are less aggressive than their younger
counterparts, so we assume that older boards will have the same characteristic, leading us to
expect a negative relationship between RISK and LOGAGE. Given the discussion of the literature
on the relative risk aversion of women, we expect the female diversity variables to have a
negative impact of risk. Overseas directors may be more relatively cautious when working with
foreign firms, and keen to establish a good reputation, making them also relatively risk-averse.
For this reason we also expect the overseas diversity variables to have a negative effect on risk.
The primary aim of the paper is to understand how, if at all, board diversity contributes to
corporate success. A secondary objective is to see how diversity has changed since the onset of
the recent financial crisis. In order to achieve these aims we decided to work with a balanced
panel of companies that were in the FTSE350 index in July 2012, collecting data from their most
recent annual report and the four previous reports. We fully acknowledge that this introduces
survivorship bias, but it allows us to get a better perspective of how boards change over time.
We exclude banks, investment companies and utilities as well as companies for which there was
missing data in any of the five years. This leaves us a total of 158 companies giving us 790 firm-
year observations.
Table 1 shows how the characteristics of our sample boards have changed over time. Panel A
includes general board characteristics, panel B focuses on diversity and panel C looks at business
education which is introduced as a robustness test later in the paper. Panel A shows that average
board size has fluctuated around nine members. One possible response to the financial crisis
would have been to change board size, either increasing it so as to gain access to more expertise
or reducing it to allow decisions to be made more quickly. Given that neither of these things
Henley Discussion Paper Series
© Padgett,October 2014 9
happened we can infer that nine is the optimal board size. The average board age increased
slowly each year. These annual changes are not sufficiently large to suggest that companies
sought out more experienced directors to help them through the crisis period. The increase in
the proportion of non-executives over the time period appears more striking, but with an
average board size of nine, it does not indicate a major change in board composition. In short,
the size, age and independence of boards did not change much during this period.
Panel B of table 1 shows that boards are becoming more diverse over time but that national
diversity is more noticeable than gender diversity. The proportion of overseas directors increases
slowly each year from 19.87 in 2007 to 21.32 in 2011. Overseas directors play equally important
roles as both executives and non-executives as both percentages vary over time between 19.50
and 21.87 for executives and between 19.60 and 21.49 for non-executives. The percentage of
boards with a critical mass of at least three overseas directors varies over time but is always
greater than 25%. The picture with respect to female directors is rather different. The proportion
of female board members also climbs over the period, but it starts from a much lower base of
7.20 in 2007, reaching 10.60 in 2011. Turning to the split between executives and non-
executives we see women playing a much more important role as non-executives than as
executives. The percentage of female executives ranges from a low of 2.85 in 2009 to a high of
4.15 in 2010, while the percentage of non-executives increases steadily from 9.44 in 2007 to
13.66 in 2011. These figures suggest that the executive pipeline challenge discussed by Davies
(2013) continues to be an issue.
[Insert table 1 around here]
While diversity is the main issue addressed here, later in the paper we use data on directors’
business education as a robustness check on our findings regarding diversity. The two measures
used are the proportion of directors with an MBA and the proportion with a professional
accounting qualification. Panel C shows that accountants are often found on corporate boards.
Between 2007 and 2011 they made up more than 25% of board members. This is not surprising
given that most boards include the finance director who is usually a qualified accountant, and
that companies are encouraged to appoint people with a finance or accounting background to
their audit committees. A rather smaller proportion of directors hold MBAs, but this rises
steadily over the period from 5% to 6.43%.
Table 2 shows the descriptive statistics for the sample. We can see that there is considerable
variation in the observations on most variables. The presence of some huge and some very
successful companies is shown by the fact that the mean is larger than the median for measures
ICMA Centre
10 © Padgett, October 2014
such as Q and total assets. Gearing is also skewed thanks to the presence of some very highly
leveraged companies, although others do not borrow at all. The board data confirms what we
have already seen on an annual basis in table 1, but also shows that there is far greater variability
in the representation of overseas directors than female directors. While there are companies
with neither overseas nor female directors the highest overseas representation is nearly 90%,
while the corresponding figure for women is 50%.
[Insert table 2 around here]
Table 3 shows the correlations between the explanatory variables in (1) and (2). This gives us
further insights into board composition. We can see that larger firms are associated with bigger,
older and more diverse boards, consistent with Brammer et al. (2007). The proportion of non-
executives is positively correlated with measures of diversity, but this is significant only for
national diversity, not for gender diversity. In contrast to Miller and Triana (2009) we find a
negative association between innovativeness and female board representation. We do see a
positive association between gearing and the proportion of women on boards as in Ahern and
Dittmar (2012), but here the relationship is insignificant.
[Insert table 3 around here]
Empirical results
The results of estimating (1) using the four different diversity measures are shown in table 4. In
1(a) diversity is measured very simply as the proportion of overseas or female directors which
could vary between 0 and 1; in 1(b) we use the Blau index which varies between 0 for a company
whose board is entirely British or single-sex and 0.5 for a board which is evenly split between
British and overseas or male and female directors. 1(a) uses a simply dummy variable taking the
value 1 if an overseas or female board member is present and 1(d) uses a dummy variable taking
the value 1 if there are at least three overseas or female members. We include industry and year
fixed effects in each specification.
As table 4 indicates, the only control variables that have a significant impact on Q are ROCE and
LOGTA. Q increases with increasing return on capital employed and falls as company size
increases. Q increases with board size and the proportion of non-executives on the board, and
decreases with board age, although none of these effects is significant. The national diversity of
board members has a significantly positive effect on performance, no matter how diversity is
measured. Although the setting is rather different because our companies are British and we do

Henley Discussion Paper Series
© Padgett,October 2014 11
not examine specific director nationalities, our findings are similar to those of Oxelheim and
Randøy (2003). Turning to gender diversity we find that female directors have a positive impact
on Q, but the effect is significant only when the number of women reaches a critical mass as
measured by FAL3 in 1(d) which is statistically significant at the 5% level. Joecks et al. (2013)
report similar findings for their sample of German companies, but they use a measure of
accounting, rather than market performance. To summarise, our results indicate that greater
board diversity leads to higher market value in British companies.
[Insert table 4 around here]
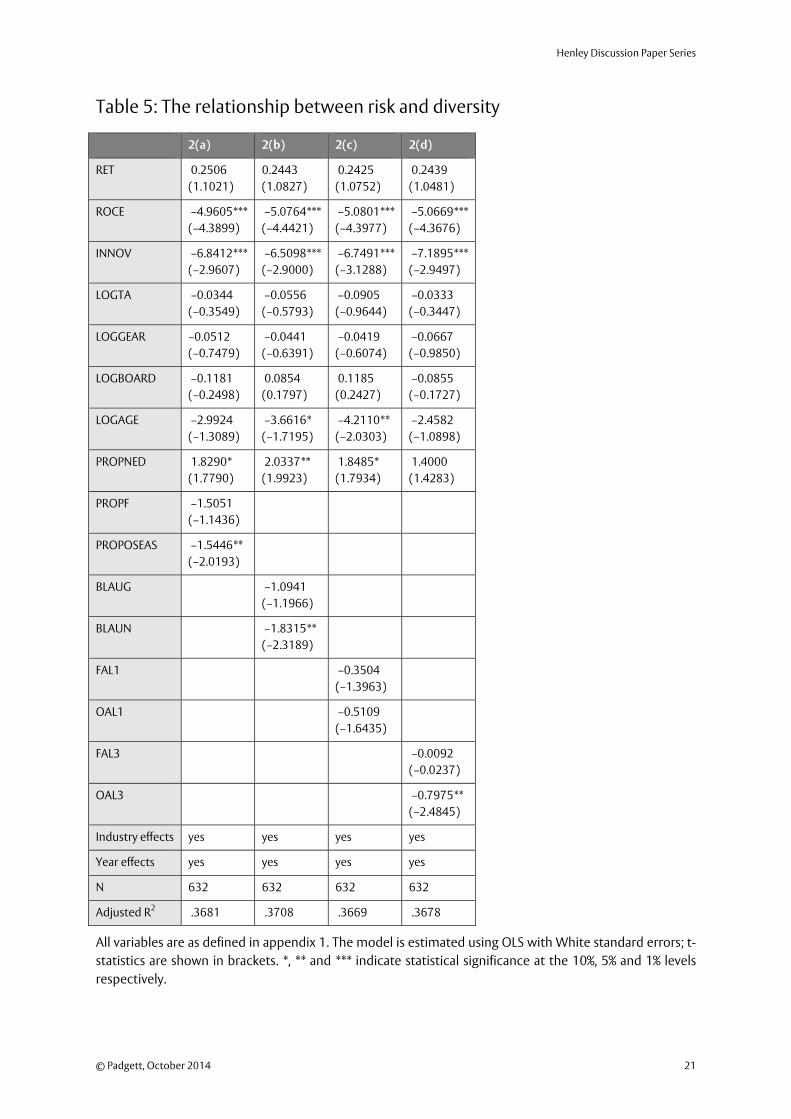
Table 5 shows the results of estimating (2) using our four measures of diversity. We see that
market risk and return are positively related, although the relationship is not statistically
significant. The relationships between RISK and ROCE and INNOVATION are significantly
negative, indicating that more profitable and more innovative companies are less risky. There are
indications that older boards make their companies less risky, but the board age variable is
statistically significant in just two of the specifications. The proportion of non-executives has a
positive effect on risk, and is statistically significant in three specifications. Both national and
gender diversity have a negative effect on risk, but none of the gender diversity measures has a
statistically significant impact. The effect of national diversity is stronger, but it is clear that
simply having an overseas director on the board is not enough, because the coefficient on OAL1
is not significantly different from zero, but the other measures are, showing that you need a
group of overseas directors to make a real difference. In interpreting the effect of board
composition on risk it is necessary to take a view on the risk attitudes of managers and
shareholders. It is usual to assume that all economic agents are risk averse but some are more
risk averse than others. Shareholders with diversified portfolios are likely to be less risk averse
than the managers of individual companies whose portfolios are less well-diversified. This
implies that good governance, which protects shareholders’ interests, should increase risk.
According to this interpretation the nonexecutives are doing a good job while the overseas
directors are harming shareholders. However, during the financial crisis period under
investigation here it is plausible to believe that shareholders sought safer investments, in which
case they were supported by overseas directors but not by the nonexecutives.
[Insert table 5 around here]
Our results so far show that the presence of overseas directors improves corporate performance
and reduces market risk. This may be because they have knowledge of specific foreign markets
into which their companies export, or because they are more cautious when making decisions in
ICMA Centre
12 © Padgett, October 2014
markets with which they are not familiar. Alternatively, they may come from a different
educational background than their British counterparts. There is certainly evidence that overseas
directors have more business education than female directors (Ruigrok et al., 2007). The impact
of female directors on performance is weaker than that of their overseas counterparts. This is not
surprising given that as table 1 shows, there are far fewer female directors than overseas board
members. Women have a significant impact only when they reach a critical mass on the board.
Their impact on market risk is negligible, despite what we know about their general risk attitudes
and their impact on specific business decisions. As we saw in table 1, women are better
represented among non-executives than among executive directors. The suggests that either
female executives are busy in the sense that they sit as non-executives on multiple boards, or
that non-executives are not also executives, in other words they hold less senior roles in the
corporate sector, or come from outside the sector, possibly from the professions. In order to test
the robustness of our results we now go on to consider the effect of educational and
professional background on performance and risk. We include two additional explanatory
variables, one is the proportion of board members with an MBA (PROPMBA), the other is the
proportion of directors who are members of a professional accounting body (PROPAC). Existing
research indicates that MBA holders make different decisions to those with other educational
backgrounds. Betrand and Schoar (2003) find that CEOs with MBAs are more “aggressive” that
others in that they investment and borrow more and pay lower dividends. This leads to better
accounting performance for their companies. Chevalier and Ellison (1999) find that fund
managers with MBAs hold portfolios with higher systematic risk than their peers’ finds. We
therefore hypothesise that the PROPMBA will be positively related to both market value and risk.
Given that regulation requires companies to appoint non-executives with financial or
accounting experience to sit on the audit committee; this suggests that they should be able to
protect shareholders from too much risk-taking. For this reason we expect the presence of
accountants to reduce risk. While the inclusion of accountants on the board should improve
financial control this may not be reflected in market performance, so we do not anticipate a
significant relationship with Q.
Table 6 shows the results of adding the two additional variables to equation (1). PROPMBA has a
negative effect on Q, contrary to our expectations, while PROPAC has a positive impact; however
neither has a coefficient that is statistically different from zero, indicating that educational and
professional backgrounds have no impact on market value. The significance of the national
diversity measures is reduced, but each measure with the exception of OAL3 retains some
significance. FAL3 remains statistically significant but again the significance level reduces. This
suggests that even if overseas and female directors have different educational or professional
Henley Discussion Paper Series
© Padgett,October 2014 13
backgrounds from their British male colleagues, this difference does not explain their impact on
performance. Corporate value is still positively affected by national diversity and by the presence
of a critical mass of women on the board.
[Insert table 6 around here]
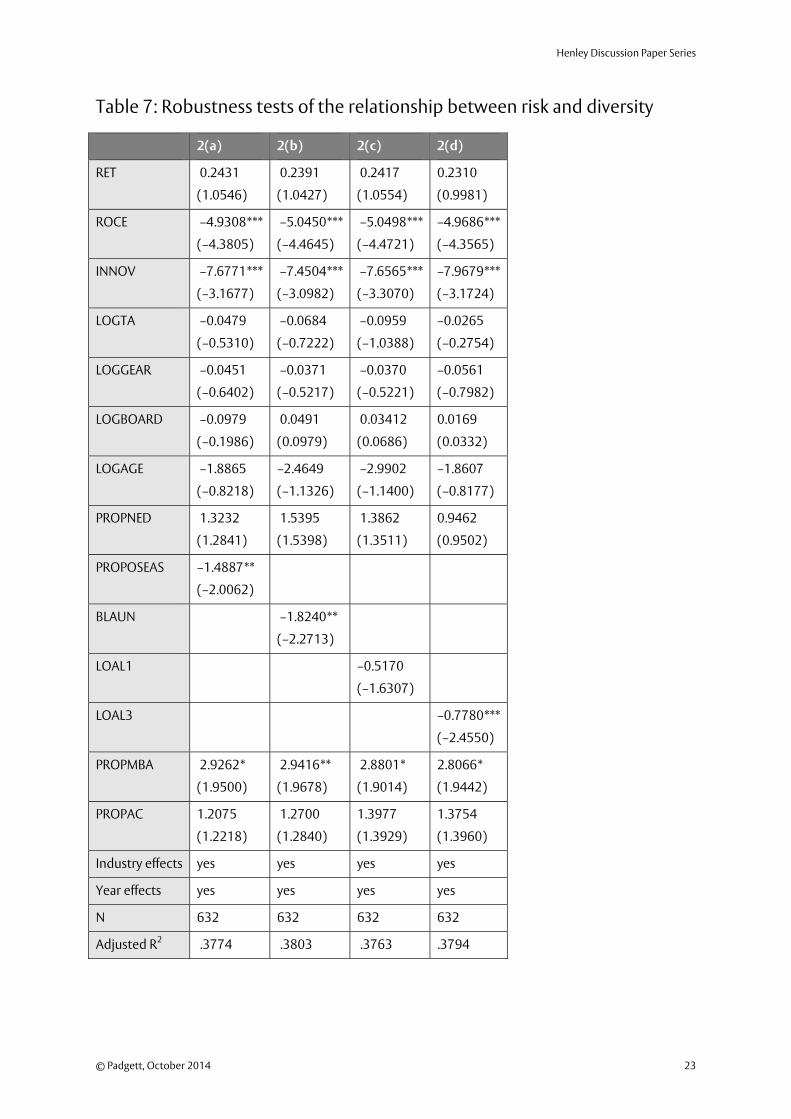
Turning to the impact of educational and professional background on risk, a rather different
picture emerges in table 7. Here we exclude gender diversity since its effects were statistically
insignificant in previous models. We see that the control and board variables have the same
impact they did in the previous specifications but that PROPNED no longer exerts a significant
impact on risk. As hypothesised, PROPMBA has a positive and significant impact on risk in all
specifications. Unexpectedly, PROPAC also has a positive effect, but it is statistically insignificant.
National diversity still exerts a negative effect on risk; the only difference between these results
and those in table 5 is that in table 7 OAL1 loses its significance. Allowing for educational
background, the presence of a single overseas director is not enough to affect risk, but as more
overseas directors are added to the board, risk falls.
[Insert table 7 around here]
Conclusions
Our aim here is to discover what impact, if any, board diversity has had on the performance of
British companies in the wake of the recent financial crisis. While most existing literature focuses
on the impact of governance on value, we also consider its impact on risk. Our findings show
that both national and gender diversity on boards lead to higher market valuation of companies.
The key difference between the reactions of value to the two forms of diversity is that overseas
directors have an impact no matter how their presence is measured. Women have an impact
only when they form a critical mass, defined here as the presence of three women on the board.
Female directors do not affect corporate risk, but overseas directors lead to a reduction in risk.
These findings do not change when we incorporate additional variables allowing for the
educational and professional characteristics of the directors. In other words, overseas and
female directors bring something special to the boardroom.

ICMA Centre
14 © Padgett, October 2014
References
Agrawal, A. and Knoeber, C.R. (1996) Firm Performance and Mechanisms to Control Agency
Problems Between Managers and Shareholders Journal of Financial and Quantitative Analysis
31, 377-397
Ahern, K.R. and Dittmar, A. (2012) The Changing of the Boards: The Impact on Firm Valuation of
Mandated Female Board Representation Quarterly Journal of Economics 127, 137-197
Anderson, R.C., Reeb, D.M., Upadhyay, A. and Zhao, W. (2011) The Economics of Director
Heterogeneity Financial Management 40, 3-38
Bertrand, M. and Schoar, A. (2003) Managing With Style: The Effect of Managers on Firm Policies
Quarterly Journal of Economics 118, 1169-12-7
Blau, P.M. (1977) Inequality and Heterogeneity Free Press
Brammer, S., Millington, A, and Pavelin, S. (2007) Board Diversity in the United Kingdom: An
Empirical Analysis Corporate Governance: An International Review 15, 393-403
Campbell, K. and Minguez-Vera, A. (2007) Gender Diversity in the Boardroom and Firm Financial
Performance Journal of Business Ethics 83, 435-451
Carter, D.A. D’Souza, F. Simkins, B.J and Simpson, W.G. (2010) The Gender and Ethnic Diversity of
US Boards and Board Committees and Firm Financial Performance Corporate Governance: An International Review 18 (5) 396-414
Charness, G. and Gneezy, U. (2012) Strong Evidence for Gender Differences in Risk Taking Journal of Economic Behavior and Organization 83, 50-58
Chung, K.H. and Pruitt, S.W. (1994) A Simple Approximation of Tobin’s Q Financial Management
23, 70-74
Davies, E.M. (2013) Women on Boards 2013
Erhardt, N.L., Werbel, J.D. and Shrader, C.B. (2003) Board of Director Diversity and Firm Financial
Performance Corporate Governance: An International Review 11, 102-111
Fellner, G. and Maciejovsky, B. (2007) Risk Attitude and Market Behaviour: Evidence from
Experimental Asset Markets Journal of Economic Psychology 28, 338-350
Financial Reporting Council (2012) UK Code of Corporate Governance FRC
Guest, P. (2009) The Impact of Board Size on Firm Performance: Evidence from the UK European Journal of Finance 15, 385-404
Huang, J. and Kisgen, D. (2013) Gender and Corporate Finance: Are Male Executives
Overconfident Relative to Female Executives? Journal of Financial Economics 108, 822-839
Joecks, J., Pull, K. and Vetter, K. (2013) Gender Diversity in the Boardroom and Firm Performance:
What Exactly Constitutes a “Critical Mass”? Journal of Business Ethics 118, 61-72

Henley Discussion Paper Series
© Padgett,October 2014 15
Kanter, R.M. (1977) Some Effects of Proportions on Group Life American Journal of Sociology 82,
965-990
Levi, M., Li, K. and Zhang, F. (2013) Men are from Mars, Women are from Venus: Director Gender
and Mergers and Acquisitions http://ssrn.com/abstract=2054709
Masulis, R.W., Wang, C. and Xie, F. (2012) Globalizing the Boardroom – The Effects of Foreign
Directors on Corporate Governance and Firm Performance Journal of Accounting and Economics 53, 527-554
Miller, T. and Triana, M. C. (2009) Demographic Diversity in the Boardroom: Mediators of The
Board Diversity-Firm Performance Relationship Journal of Management Studies 46, 755-786
Nakano, M. and Nguyen, P. (2012) Board Size and Corporate Risk-taking: Further Evidence from
Japan Corporate Governance: An International Review 20, 369-387
Oxelheim, L. and Randøy, T. (2003) The Impact of Foreign Board Membership on Firm Value
Journal of Banking and Finance 27, 2369-2392
Rose, C., Munch-Madsen, P. and Funch, M. (2013) Does Board Diversity Really Matter? Gender
Does Not, But Citizenship Does International Journal of Business Science and Applied Management 8 16-27
Ruigrok, W., Peck, S. and Tacheva, S. (2007) Nationality and Gender Diversity on Swiss Boards
Corporate Governance: An International Review 15 546-557
Sila, V., Gonzalez, A. and Hagendorff, J. (2014) Women on Board: Does Boardroom Gender
Diversity Really Affect Risk? Available at http://ssrn.com/abstract=2379025
Torchia, M., Calabrò, A. and Huse, M. (2011) Women Directors on Corporate Boards: From
Tokenism to Critical Mass Journal of Business Ethics 102, 299-317
Vafeas, N. and Theodorou, E. (1998) The Relationship Between Board Structure and Firm
Performance in the UK British Accounting Review 30, 383-407

ICMA Centre
16 © Padgett, October 2014
Appendix 1: Data sources
Variable Measurement Data source
Q market capitalisation+book value of preferred stock and debt
book value of total assets
Fame
ROCE profit before tax
total assets – current liabilities
Fame
RISK Standard deviation of daily stock returns over the financial year Bloomberg
LOGTA Natural logarithm of total assets Fame
INNOV research and development spending
turnover
Fame
LOGGEAR Natural logarithm of
short-term overdrafts and loans+long-term loans and liabilities
shareholders'funds
Fame
RET Average daily stock returns over the financial year Bloomberg
LOGBOARD Natural logarithm of the number of board members Annual reports
PROPNED number of non-executive directors
board size
Annual reports
PROPOSEAS number of directors from outside the UK
board size
Annual reports supplemented
by Amadeus or Osiris
PROPF Percentage of board members who are female Annual reports
BLAUN 1 minus the product of the proportions of British and overseas
directors
Annual reports supplemented
by Amadeus or Osiris
BLAUG 1 minus the product of the proportions of men and women on the
board
Annual reports
OAL1 A dummy variable taking the value 1 if there is at least one overseas
director on the board, zero otherwise
Annual reports supplemented
by Amadeus or Osiris
OAL3 A dummy variable taking the value 1 if there are at least three
overseas directors on the board and zero otherwise
Annual reports supplemented
by Amadeus or Osiris
FAL1 A dummy variable taking the value 1 if there is at least one woman
on the board and zero otherwise
Annual reports
FAL3 A dummy variable taking the value 1 if there are at least 3 women
on the board, zero otherwise
Annual reports
PROPMBA number of directors with an MBA
board size
Annual reports supplemented
by Amadeus or OSIRIS
PROPAC number of directors holding a professional accounting qualification
board size
Annual reports supplemented
by Amadeus or OSIRIS
Henley Discussion Paper Series
© Padgett,October 2014 17
Tables
Table 1: Board characteristics
Panel A: general characteristics
2007 2008 2009 2010 2011
Board size 9.29 9.23 9.09 8.96 9.11
Board age 55.65 56.00 56.42 56.64 56.74
Percentage of non-executives 61.98 63.32 64.77 64.89 66.73
The figures reported here are the means of the relevant figures for the 158 companies in the sample.
Board age is itself an average of the ages of all board members.
Panel B: diversity
2007 2008 2009 2010 2011
Overseas directors
Percentage of board members 19.87 20.56 20.57 20.59 21.32
Percentage of executives 21.87 19.73 19.38 19.50 21.55
Percentage of non-executives 19.60 20.85 20.98 21.08 21.49
Percentage of boards with critical mass 30.40 29.75 25.32 28.48 31.01
Female directors
Percentage of board members 7.20 7.66 8.31 9.05 10.60
Percentage of executives 3.15 3.50 2.85 4.15 4.03
Percentage of non-executives 9.44 9.78 11.14 11.86 13.66
Percentage of boards with critical mass 3.80 5.70 7.60 8.23 8.23
Percentage of board members is the mean of the percentage of board members in each company who are
from overseas or who are female. The percentage of executives is the mean of the percentage of executive
directors in each company who come from overseas or are women. The percentage of non-executives is
the mean of the percentage of non-executive directors who come from overseas or are women.
Percentage of boards with critical mass is measured by the percentage of companies which have at least 3
overseas or female directors on their boards.
ICMA Centre
18 © Padgett, October 2014
Panel C: business education
2007 2008 2009 2010 2011
Percentage of directors with an MBA 5.00 5.70 5.95 6.34 6.43
Percentage of directors who are accountants 26.90 27.27 28.57 28.57 26.14
Percentage of directors with an MBA is the mean of the percentage of board members in each company
who hold an MBA. Percentage of directors who are accountants is the average of the parentage of board
members in each company who hold an accounting qualification from any professional association.
Table 2: Descriptive Statistics
Mean Median Maximum Minimum Standard Deviation
Q 1.3889 1.0811 16.0515 0.0346 1.2023
RISK 5.3174 4.6340 23.2573 0.1037 2.6428
ROCE 0.1481 0.1295 1.3583 –1.2936 0.1598
RET 0.2523 0.2422 3.9518 –4.4480 0.8701
INNOV 0.0116 0 0.4525 0 0.0407
Total assets 12457.49 1493.00 37,000,000 27.252 41846.025
Gearing 113.3696 73.8850 949.2600 0 133.4521
Board size 9.1367 9 20 3 2.5347
Board age 56.29 56.5 65.33 46 3.11
PROPNED 0.6434 0.6667 0.9286 0.2857 0.1196
PROPOSEAS 0.2058 0.1429 0.9167 0 0.2204
BLAUO 0.2299 0.2188 0.5 0 0.1854
PROPF 0.0855 0.0833 0.5 0 0.0939
BLAUF 0.1391 0.1528 .5 0 0.1405
PROPMBA 0.0588 0 0.8333 0 0.0942
PROPAC 0.2713 0.2727 0.8571 0 0.1524
In this table total assets are shown in £m, board size is the number of directors and board age is shown in
years. Gearing is the ratio of short-term overdrafts and loans together with long-term loans and liabilities
to shareholders’ funds. All other variables are measured as described in appendix 1.

Henley Discussion Paper Series
© Padgett, October 2014 19
Table 3: Correlations between explanatory variables
ROCE RET Innov Logta Loggear Logboard Logage Propned Proposeas Blauo Propf Blauf Propmba Propac
ROCE 1.0000 .1039 –.0488 –.1698* –.1149 –.0002 –.0600 .0163 .0653 .0182 –.0016 .0044 .0528 –.1061
RET .1039 1.0000 –.0123 –.0673 –.0619 –.0466 .0522 .0102 .0284 .0064 –.0605 –.0656 .0178 0.0128
INNOV –.0488 –.0123 1.0000 –.1043 –.0988 –.0229 .0700 –.0235 .0423 .0801 –.0325 –.0250 .0435 .0195
LOGTA –.1698* –.0673 –.1043 1.0000 .2468** .5785*** .2445 .4081*** .4655*** .4018*** .3030*** .3171*** .1282 –.2403**
LOGGEAR –.1149 –.0619 –.0988 .2468** 1.0000 .0675 .0644 .0781 .1333 .1194 .0547 .0537 .0317 –.0478
LOGBOARD –.0002 –.0466 –.0229 .5784*** .0675 1.0000 .0676 –1383 .3524*** .3896*** .2768*** .3095*** .0589 –.3127***
LOGAGE –.0600 .0522 .0700 .245** .0644 .0676 1.0000 .1927* .3981*** .2718*** –.1865* –.1795* .0309 –.1101
PROPNED .0163 .0102 –.0235 .4081*** .0781 .1383 .1927* 1.0000 .4292*** .3816*** .1564 .1537 .1877* –.1282
PROPOSEAS .0653 .0284 .0423 .4655*** .1333 .3524*** .3981*** .4292*** 1.0000 .7873*** .0717 .0689 .1946* –.3919***
BLAUO .0182 .0064 .0801 .4018*** .1194 .3896*** .2718*** .3816*** .7873*** 1.0000 .1020 .1012 ..1582 –.2905***
PROPF –.0016 –.0605 –.0325 .3030*** .0547 .2768*** –.1865* .1564 .0717 .1020 1.0000 .9835*** .0420 –.1517
BLAUF .0004 –.0656 –.0250 .3171*** .0537 .3095*** –.1795* .1596 .0689 .1013 .9836*** 1.0000 .0526 –.1469
PROPMBA .0528 .0178 .0435 .1282 .0317 .0589 .0309 .1877* .1946* .1582 .0420 .0526 1.0000 .0441
PROPAC –.1061 .0128 .0195 –.2403** –.0478 –.3127*** –.1101 –.1282 –.3919*** –.2905*** –.1517 –.1469 .0441 1.0000
All variables are as described in appendix 1. *,** and *** indicate significance at the 1%, 5% and 10% levels respectively.
ICMA Centre
20 © Padgett,October 2014
Table 4: The relationship between Q and diversity
1(a) 1(b) 1(c) 1(d)
ROCE 2.1698***
(4.5765)
2.2338***
(4.7805)
2.2395***
(4.7465)
2.2652***
(4.8604)
INNOV –1.1183
(–0.7102)
–0.3187
(–.8417)
–1.1754
(–0.7804)
–0.9597
(–0.6003)
LOGTA –0.3522***
(–4.0129)
–0.3397***
(–4.1025)
–0.3180***
(–3.9478)
–0.3549***
(–4.0472)
LOGGEAR –0.0071
(–0.1691
–0.0113
(–0.2782)
–0.0125
(–0.3148)
–0.0002
(–0.0055
LOGBOARD 0.3253
(1.0742)
0.2292
(0.7260)
0.1921
(0.5767)
0.3679
(1.2357)
LOGAGE –0.7107
(–0.4793)
–0.4401
(–0.3183)
–0.1603
(–0.1173)
–0.5942
(–0.4022)
PROPNED 0.4629
(0.7366)
0.3229
(0.5187)
0.4193
(0.6757)
0.7205
(1.0981)
PROPF 1.0342
(1.6323)
PROPOSEAS 0.8483**
(2.3972)
BLAUG 0.6290
(1.4236)
BLAUN 1.0897***
(3.0342)
FAL1 0.1766
(1.3719)
OAL1 0.3175**
(2.0679)
FAL3 0.4182**
(1.9719)
OAL3 0.2647*
(1.7255)
Industry effects
Year effects
Yes
yes
Yes
yes
Yes
yes
Yes
yes
N 632 632 632 632
Adjusted R2 .2793 .2848 .2774 .2746
All variables are as defined in appendix 1. The model is estimated using OLS with White standard errors; t-
statistics are shown in brackets. *, ** and *** indicate statistical significance at the 10%, 5% and 1% levels
respectively.
Henley Discussion Paper Series
© Padgett, October 2014 21
Table 5: The relationship between risk and diversity
2(a) 2(b) 2(c) 2(d)
RET 0.2506
(1.1021)
0.2443
(1.0827)
0.2425
(1.0752)
0.2439
(1.0481)
ROCE –4.9605***
(–4.3899)
–5.0764***
(–4.4421)
–5.0801***
(–4.3977)
–5.0669***
(–4.3676)
INNOV –6.8412***
(–2.9607)
–6.5098***
(–2.9000)
–6.7491***
(–3.1288)
–7.1895***
(–2.9497)
LOGTA –0.0344
(–0.3549)
–0.0556
(–0.5793)
–0.0905
(–0.9644)
–0.0333
(–0.3447)
LOGGEAR –0.0512
(–0.7479)
–0.0441
(–0.6391)
–0.0419
(–0.6074)
–0.0667
(–0.9850)
LOGBOARD –0.1181
(–0.2498)
0.0854
(0.1797)
0.1185
(0.2427)
–0.0855
(–0.1727)
LOGAGE –2.9924
(–1.3089)
–3.6616*
(–1.7195)
–4.2110**
(–2.0303)
–2.4582
(–1.0898)
PROPNED 1.8290*
(1.7790)
2.0337**
(1.9923)
1.8485*
(1.7934)
1.4000
(1.4283)
PROPF –1.5051
(–1.1436)
PROPOSEAS –1.5446**
(–2.0193)
BLAUG –1.0941
(–1.1966)
BLAUN –1.8315**
(–2.3189)
FAL1 –0.3504
(–1.3963)
OAL1 –0.5109
(–1.6435)
FAL3 –0.0092
(–0.0237)
OAL3 –0.7975**
(–2.4845)
Industry effects yes yes yes yes
Year effects yes yes yes yes
N 632 632 632 632
Adjusted R2 .3681 .3708 .3669 .3678
All variables are as defined in appendix 1. The model is estimated using OLS with White standard errors; t-
statistics are shown in brackets. *, ** and *** indicate statistical significance at the 10%, 5% and 1% levels
respectively.

ICMA Centre
22 © Padgett,October 2014
Table 6: Robustness tests of the relationship between value and diversity
1(a) 1(b) 1(c) 1(d)
ROCE 2.1962***
(4.6832)
2.2603***
(4.8255)
2.2543***
(4.8062)
2.2688***
(4.9047)
INNOV –1.0721
(–0.6827)
–1.2640
(–0.8077)
–1.1071
(–0.7360)
–0.9214
(–0.5764)
LOGTA –0.3523***
(–4.0521)
–0.3392***
(–4.2110)
–0.3176***
(–4.0901)
–0.3548***
(–4.1047)
LOGGEAR –0.0063
(–.1434)
–0.0109
(–0.2558)
–0.0127
(–0.3038)
0.0001
(0.0023)
LOGBOARD 0.3396
(1.0809)
0.2389
(0.7410)
0.1928
(0.5757)
0.3679
(1.1850)
LOGAGE –0.7696
(–0.5065)
–0.4813
(–0.3490)
–0.2048
(–0.1516)
–0.6258
(–0.4210)
PROPNED 0.4905
(0.7708)
0.3576
(0.5664)
0.4600
(0.7311)
0.7448
(1.1110)
PROPF 1.0466
(1.5988)
PROPOSEAS 0.8969*
(1.9565)
BLAUG 0.6358
(1.4001)
BLAUN 1.1247***
(2.6842)
LFAL1 0.1791
(1.3494)
LOAL1 0.3270*
(1.9238)
LFAL3 0.4126*
(1.9557)
LOAL3 0.2668
(1.5209)
PROPMBA –0.3780
(–0.5810)
–0.3991
(–0.6564)
–0.3839
(–0.6093)
–0.1758
(–0.2796)
PROPAC 0.1455
(0.2055)
0.1020
(0.1547)
0.0207
(0.0319)
0.0168
(–0.0249)
Industry effects
Year effects
Yes
yes
Yes
yes
Yes
yes
Yes
yes
N 632 632 632 632
Adjusted R2 .2777 .2833 .2757 .2724
All variables are as defined in appendix 1. The model is estimated using OLS with White standard errors; t-
statistics are shown in brackets. *, ** and *** indicate statistical significance at the 10%, 5% and 1% levels
respectively.
Henley Discussion Paper Series
© Padgett, October 2014 23
Table 7: Robustness tests of the relationship between risk and diversity
2(a) 2(b) 2(c) 2(d)
RET 0.2431
(1.0546)
0.2391
(1.0427)
0.2417
(1.0554)
0.2310
(0.9981)
ROCE –4.9308***
(–4.3805)
–5.0450***
(–4.4645)
–5.0498***
(–4.4721)
–4.9686***
(–4.3565)
INNOV –7.6771***
(–3.1677)
–7.4504***
(–3.0982)
–7.6565***
(–3.3070)
–7.9679***
(–3.1724)
LOGTA –0.0479
(–0.5310)
–0.0684
(–0.7222)
–0.0959
(–1.0388)
–0.0265
(–0.2754)
LOGGEAR –0.0451
(–0.6402)
–0.0371
(–0.5217)
–0.0370
(–0.5221)
–0.0561
(–0.7982)
LOGBOARD –0.0979
(–0.1986)
0.0491
(0.0979)
0.03412
(0.0686)
0.0169
(0.0332)
LOGAGE –1.8865
(–0.8218)
–2.4649
(–1.1326)
–2.9902
(–1.1400)
–1.8607
(–0.8177)
PROPNED 1.3232
(1.2841)
1.5395
(1.5398)
1.3862
(1.3511)
0.9462
(0.9502)
PROPOSEAS –1.4887**
(–2.0062)
BLAUN –1.8240**
(–2.2713)
LOAL1 –0.5170
(–1.6307)
LOAL3 –0.7780***
(–2.4550)
PROPMBA 2.9262*
(1.9500)
2.9416**
(1.9678)
2.8801*
(1.9014)
2.8066*
(1.9442)
PROPAC 1.2075
(1.2218)
1.2700
(1.2840)
1.3977
(1.3929)
1.3754
(1.3960)
Industry effects yes yes yes yes
Year effects yes yes yes yes
N 632 632 632 632
Adjusted R2 .3774 .3803 .3763 .3794