
Global Concerns in Compulsory Purchase and Compensation Processes
Upload
independentCategory
view
3download
0
HEALTH SERVICES AND DELIVERY RESEARCHVOLUME 2 ISSUE 49 DECEMBER 2014
ISSN 2050-4349
DOI 10.3310/hsdr02490
Variation in compulsory psychiatric inpatient admission in England: a cross-sectional, multilevel analysis
Scott Weich, Orla McBride, Liz Twigg, Patrick Keown, Eva Cyhlarova, David Crepaz-Keay, Helen Parsons, Jan Scott and Kamaldeep Bhui


Variation in compulsory psychiatricinpatient admission in England:a cross-sectional, multilevel analysis
Scott Weich,1* Orla McBride,2 Liz Twigg,3
Patrick Keown,4 Eva Cyhlarova,5 David Crepaz-Keay,5
Helen Parsons,1 Jan Scott4 and Kamaldeep Bhui6
1Warwick Medical School, University of Warwick, Coventry, UK2School of Psychology, University of Ulster, Londonderry, UK3Department of Geography, University of Portsmouth, Portsmouth, UK4Academic Psychiatry, Newcastle University, Newcastle upon Tyne, UK5Mental Health Foundation, London, UK6Centre for Psychiatry, Barts and The London School of Medicine and Dentistry,Queen Mary University of London, London, UK
*Corresponding author
Declared competing interests of authors: none
Published December 2014DOI: 10.3310/hsdr02490
This report should be referenced as follows:
Weich S, McBride O, Twigg L, Keown P, Cyhlarova E, Crepaz-Keay D, et al. Variation in
compulsory psychiatric inpatient admission in England: a cross-sectional, multilevel analysis. HealthServ Deliv Res 2014;2(49).


Health Services and Delivery Research
ISSN 2050-4349 (Print)
ISSN 2050-4357 (Online)
This journal is a member of and subscribes to the principles of the Committee on Publication Ethics (COPE) (www.publicationethics.org/).
Editorial contact: [email protected]
The full HS&DR archive is freely available to view online at www.journalslibrary.nihr.ac.uk/hsdr. Print-on-demand copies can be purchased fromthe report pages of the NIHR Journals Library website: www.journalslibrary.nihr.ac.uk
Criteria for inclusion in the Health Services and Delivery Research journalReports are published in Health Services and Delivery Research (HS&DR) if (1) they have resulted from work for the HS&DR programmeor programmes which preceded the HS&DR programme, and (2) they are of a sufficiently high scientific quality as assessed by thereviewers and editors.
HS&DR programmeThe Health Services and Delivery Research (HS&DR) programme, part of the National Institute for Health Research (NIHR), was established tofund a broad range of research. It combines the strengths and contributions of two previous NIHR research programmes: the Health ServicesResearch (HSR) programme and the Service Delivery and Organisation (SDO) programme, which were merged in January 2012.
The HS&DR programme aims to produce rigorous and relevant evidence on the quality, access and organisation of health services includingcosts and outcomes, as well as research on implementation. The programme will enhance the strategic focus on research that matters to theNHS and is keen to support ambitious evaluative research to improve health services.
For more information about the HS&DR programme please visit the website: http://www.nets.nihr.ac.uk/programmes/hsdr
This reportThe research reported in this issue of the journal was funded by the HS&DR programme or one of its proceeding programmes as projectnumber 10/1011/70. The contractual start date was in March 2012. The final report began editorial review in September 2013 and wasaccepted for publication in July 2014. The authors have been wholly responsible for all data collection, analysis and interpretation, and forwriting up their work. The HS&DR editors and production house have tried to ensure the accuracy of the authors’ report and would like tothank the reviewers for their constructive comments on the final report document. However, they do not accept liability for damages or lossesarising from material published in this report.
This report presents independent research funded by the National Institute for Health Research (NIHR). The views and opinions expressed byauthors in this publication are those of the authors and do not necessarily reflect those of the NHS, the NIHR, NETSCC, the HS&DRprogramme or the Department of Health. If there are verbatim quotations included in this publication the views and opinions expressed by theinterviewees are those of the interviewees and do not necessarily reflect those of the authors, those of the NHS, the NIHR, NETSCC, theHS&DR programme or the Department of Health.
© Queen’s Printer and Controller of HMSO 2014. This work was produced by Weich et al. under the terms of a commissioningcontract issued by the Secretary of State for Health. This issue may be freely reproduced for the purposes of private research andstudy and extracts (or indeed, the full report) may be included in professional journals provided that suitable acknowledgementis made and the reproduction is not associated with any form of advertising. Applications for commercial reproduction should beaddressed to: NIHR Journals Library, National Institute for Health Research, Evaluation, Trials and Studies Coordinating Centre,Alpha House, University of Southampton Science Park, Southampton SO16 7NS, UK.
Published by the NIHR Journals Library (www.journalslibrary.nihr.ac.uk), produced by Prepress Projects Ltd, Perth, Scotland(www.prepress-projects.co.uk).

Health Services and Delivery Research Editor-in-Chief
Professor Ray Fitzpatrick Professor of Public Health and Primary Care, University of Oxford, UK
NIHR Journals Library Editor-in-Chief
Professor Tom Walley Director, NIHR Evaluation, Trials and Studies and Director of the HTA Programme, UK
NIHR Journals Library Editors
Professor Ken Stein Chair of HTA Editorial Board and Professor of Public Health, University of Exeter Medical School, UK
Professor Andree Le May Chair of NIHR Journals Library Editorial Group (EME, HS&DR, PGfAR, PHR journals)
Dr Martin Ashton-Key Consultant in Public Health Medicine/Consultant Advisor, NETSCC, UK
Professor Matthias Beck Chair in Public Sector Management and Subject Leader (Management Group), Queen’s University Management School, Queen’s University Belfast, UK
Professor Aileen Clarke Professor of Public Health and Health Services Research, Warwick Medical School, University of Warwick, UK
Dr Tessa Crilly Director, Crystal Blue Consulting Ltd, UK
Dr Peter Davidson Director of NETSCC, HTA, UK
Ms Tara Lamont Scientific Advisor, NETSCC, UK
Professor Elaine McColl Director, Newcastle Clinical Trials Unit, Institute of Health and Society, Newcastle University, UK
Professor William McGuire Professor of Child Health, Hull York Medical School, University of York, UK
Professor Geoffrey Meads Professor of Health Sciences Research, Faculty of Education, University of Winchester, UK
Professor Jane Norman Professor of Maternal and Fetal Health, University of Edinburgh, UK
Professor John Powell Consultant Clinical Adviser, National Institute for Health and Care Excellence (NICE), UK
Professor James Raftery Professor of Health Technology Assessment, Wessex Institute, Faculty of Medicine, University of Southampton, UK
Dr Rob Riemsma Reviews Manager, Kleijnen Systematic Reviews Ltd, UK
Professor Helen Roberts Professor of Child Health Research, UCL Institute of Child Health, UK
Professor Helen Snooks Professor of Health Services Research, Institute of Life Science, College of Medicine, Swansea University, UK
Please visit the website for a list of members of the NIHR Journals Library Board: www.journalslibrary.nihr.ac.uk/about/editors
Editorial contact: [email protected]
NIHR Journals Library www.journalslibrary.nihr.ac.uk

Abstract
Variation in compulsory psychiatric inpatient admissionin England: a cross-sectional, multilevel analysis
Scott Weich,1* Orla McBride,2 Liz Twigg,3 Patrick Keown,4
Eva Cyhlarova,5 David Crepaz-Keay,5 Helen Parsons,1
Jan Scott4 and Kamaldeep Bhui6
1Warwick Medical School, University of Warwick, Coventry, UK2School of Psychology, University of Ulster, Londonderry, UK3Department of Geography, University of Portsmouth, Portsmouth, UK4Academic Psychiatry, Newcastle University, Newcastle upon Tyne, UK5Mental Health Foundation, London, UK6Centre for Psychiatry, Barts and The London School of Medicine and Dentistry,Queen Mary University of London, London, UK
*Corresponding author
Background: Rates of compulsory admission have increased in England in recent decades, and this trendis accelerating. Studying variation in rates between people and places can help identify modifiable causes.
Objectives: To quantify and model variances in the rate of compulsory admission in England at differentspatial levels and to assess the extent to which this was explained by characteristics of people and places.
Design: Cross-sectional analysis using multilevel statistical modelling.
Setting: England, including 98% of Census lower layer super output areas (LSOAs), 95% of primary caretrusts (PCTs), 93% of general practices and all 69 NHS providers of specialist mental health services.
Participants: 1,287,730 patients.
Main outcome measure: The study outcome was compulsory admission, defined as time spent in aninpatient mental illness bed subject to the Mental Health Act (2007) in 2010/11. We excluded patientsdetained under sections applying to emergency assessment only (including those in places of safety),guardianship or supervision of community treatment. The control group comprised all other users ofspecialist mental health services during the same period.
Data sources: The Mental Health Minimum Data Set (MHMDS). Data on explanatory variables,characterising each of the spatial levels in the data set, were obtained from a wide range of sources,and were linked using MHMDS identifiers.
Results: A total of 3.5% of patients had at least one compulsory admission in 2010/11. Of (unexplained)variance in the null model, 84.5% occurred between individuals. Statistically significant variance occurredbetween LSOAs [6.7%, 95% confidence interval (CI) 6.2% to 7.2%] and provider trusts (6.9%, 95% CI4.3% to 9.5%). Variances at these higher levels remained statistically significant even after adjusting for alarge number of explanatory variables, which together explained only 10.2% of variance in the studyoutcome. The number of provider trusts whose observed rate of compulsory admission differed from themodel average to a statistically significant extent fell from 45 in the null model to 20 in the fully adjustedmodel. We found statistically significant associations between compulsory admission and age, gender,
DOI: 10.3310/hsdr02490 HEALTH SERVICES AND DELIVERY RESEARCH 2014 VOL. 2 NO. 49
© Queen’s Printer and Controller of HMSO 2014. This work was produced by Weich et al. under the terms of a commissioning contract issued by the Secretary of State forHealth. This issue may be freely reproduced for the purposes of private research and study and extracts (or indeed, the full report) may be included in professional journalsprovided that suitable acknowledgement is made and the reproduction is not associated with any form of advertising. Applications for commercial reproduction should beaddressed to: NIHR Journals Library, National Institute for Health Research, Evaluation, Trials and Studies Coordinating Centre, Alpha House, University of Southampton SciencePark, Southampton SO16 7NS, UK.
v

ethnicity, local area deprivation and ethnic density. There was a small but statistically significant associationbetween (higher) bed occupancy and compulsory admission, but this was subsequently confounded byother covariates. Adjusting for PCT investment in mental health services did not improve model fit in thefully adjusted models.
Conclusions: This was the largest study of compulsory admissions in England. While 85% of the variancein this outcome occurred between individuals, statistically significant variance (around 7% each)occurred between places (LSOAs) and provider trusts. This higher-level variance in compulsory admissionremained largely unchanged even after adjusting for a large number of explanatory variables. We wereconstrained by data available to us, and therefore our results must be interpreted with caution.We were also unable to consider many hypotheses suggested by the service users, carers and professionalswho we consulted. There is an imperative to develop and evaluate interventions to reduce compulsoryadmission rates. This requires further research to extend our understanding of the reasons why these ratesremain so high.
Funding: The National Institute for Health Research Health Services and Delivery Research programme.
ABSTRACT
NIHR Journals Library www.journalslibrary.nihr.ac.uk
vi

Contents
List of tables ix
List of figures xi
List of abbreviations xiii
Plain English summary xv
Scientific summary xvii
Chapter 1 Background 1Introduction 1Research aims and objectives 2
Research aim 1 2Research objective 1 2Research aim 2 2Research objective 2 3
Chapter 2 Methods 5Study overview and design 5
Ethics 5The Mental Health Minimum Data Set 5
Brief overview of the Mental Health Minimum Data Set 5Defining the study outcome 6
Defining compulsory admission 6Treatment in the community 7Admission to hospital 7Specifying the reference group 8
Legal status and nature of admission to hospital 8Legal Status Classification 8Legal Status Restrictiveness 8Identifying patients who were admitted compulsorily in 2010/11 9
Geographical and spatial identifiers 10Patient 10Lower layer super output area 10General practice 10Primary care trust (commissioner) 10Provider trust 10Strategic Health Authority 11
Data quality 11Explanatory variables and data linkage 11
Individual level variables 11Linkage at lower layer super output area level 12Linkage at primary care trust level 13Linkage at provider trust level 13
DOI: 10.3310/hsdr02490 HEALTH SERVICES AND DELIVERY RESEARCH 2014 VOL. 2 NO. 49
© Queen’s Printer and Controller of HMSO 2014. This work was produced by Weich et al. under the terms of a commissioning contract issued by the Secretary of State forHealth. This issue may be freely reproduced for the purposes of private research and study and extracts (or indeed, the full report) may be included in professional journalsprovided that suitable acknowledgement is made and the reproduction is not associated with any form of advertising. Applications for commercial reproduction should beaddressed to: NIHR Journals Library, National Institute for Health Research, Evaluation, Trials and Studies Coordinating Centre, Alpha House, University of Southampton SciencePark, Southampton SO16 7NS, UK.
vii

Strategies for analysis 16Multilevel models 16Null models 17Modelling and mapping residuals 18Modelling explanatory variables 19
Handling missing data 19
Chapter 3 Results 21Description of the study sample 21Null models (research aim 1) 22
Spatial clustering of primary care trusts and provider trusts 23Comparing model fit using deviance information criterion statistic 24Estimating the effect of including Strategic Health Authority as a fifth level in thenull model 25
Examining model residuals at provider trust level 25Modelling explanatory variables (research aim 2) 27Associations between explanatory variables and compulsory admission 29Residuals at provider trust level in the fully adjusted model 31Association between primary care trust investment and compulsory admission 33
Chapter 4 User involvement 35Service user and carer involvement 35
Mental Health Foundation 35Background 35Aims 35Methods 35Results 37
Service user and carer involvement summary 42Mental Health Network (NHS Confederation) 43
Underlying trends 43Professionals’ views about reasons for increased rates of detention 43Useful and desirable outcomes of the research 46
Chapter 5 Discussion and conclusions 47Summary of main findings 47
Patterns of variance in the null model 47Examining and mapping null model residuals 47
Strengths of the study 49Limitations 49User involvement 51Clinical implications 52Conclusions 53Recommendations for future research 54
Acknowledgements 55
References 57
Appendix 1 Original study protocol 63
Appendix 2 Final study protocol 73
CONTENTS
NIHR Journals Library www.journalslibrary.nihr.ac.uk
viii

List of tables
TABLE 1 Care status categories for all patients in the 2010/11 MHMDS 8
TABLE 2 Characteristics of the study sample by admission and treatment status 21
TABLE 3 Four-level null multilevel models, showing sample sizes after excludingcases with missing data 23
TABLE 4 Results of four-level cross-classified null models for compulsoryadmission, showing estimates of variance (standard error) and proportion (%) ofunexplained variance with (95% CIs) at each level, based on full sample andshowing DIC statistics for complete cases only 24
TABLE 5 Variance, percentage of unexplained variance at the individual, LSOAand provider trust levels in the risk of compulsory admission in the null model,and percentage of variance explained on including explanatory variables at eachspatial level 28
TABLE 6 Adjusted ORs for the associations with explanatory variables in model 8 30
TABLE 7 Results of three-level cross-classified models assessing the associationbetween investment in adult mental health services and compulsory admission,showing estimates of variance (standard error) and proportion of unexplainedvariance (95% CIs), proportion of variance explained (versus null model) afterinclusion of explanatory variable and DIC statistics 34
TABLE 8 Demographic profile of PPI services users (n= 17) 36
TABLE 9 Data sets to be used 65
TABLE 10 Data sets to be used 79
DOI: 10.3310/hsdr02490 HEALTH SERVICES AND DELIVERY RESEARCH 2014 VOL. 2 NO. 49
© Queen’s Printer and Controller of HMSO 2014. This work was produced by Weich et al. under the terms of a commissioning contract issued by the Secretary of State forHealth. This issue may be freely reproduced for the purposes of private research and study and extracts (or indeed, the full report) may be included in professional journalsprovided that suitable acknowledgement is made and the reproduction is not associated with any form of advertising. Applications for commercial reproduction should beaddressed to: NIHR Journals Library, National Institute for Health Research, Evaluation, Trials and Studies Coordinating Centre, Alpha House, University of Southampton SciencePark, Southampton SO16 7NS, UK.
ix


List of figures
FIGURE 1 An example of a cross-classified data structure 17
FIGURE 2 Residual plots (with 95% CI error bars) for provider trust level variance(four-level cross-classified model of individuals within LSOAs within GP practiceswithin provider trusts, MCMC estimation adjusting for age and sex) 25
FIGURE 3 Provider trust standardised residual values (adjusted for patient ageand sex) mapped geographically 26
FIGURE 4 Residual plots (with 95% CI error bars) for provider trust-level variance(three-level cross-classified model of individuals within LSOAs within providertrusts, MCMC estimation adjusting for explanatory variables in model 8) 31
FIGURE 5 Provider trust residual values (adjusted for all explanatory variables inmodel 8) mapped geographically 32
DOI: 10.3310/hsdr02490 HEALTH SERVICES AND DELIVERY RESEARCH 2014 VOL. 2 NO. 49
© Queen’s Printer and Controller of HMSO 2014. This work was produced by Weich et al. under the terms of a commissioning contract issued by the Secretary of State forHealth. This issue may be freely reproduced for the purposes of private research and study and extracts (or indeed, the full report) may be included in professional journalsprovided that suitable acknowledgement is made and the reproduction is not associated with any form of advertising. Applications for commercial reproduction should beaddressed to: NIHR Journals Library, National Institute for Health Research, Evaluation, Trials and Studies Coordinating Centre, Alpha House, University of Southampton SciencePark, Southampton SO16 7NS, UK.
xi


List of abbreviations
A&E accident and emergency
BME black and minority ethnic
BOO beds open overnight
CI confidence interval
CQC Care Quality Commission
CRHT Crisis Resolution Home Treatment
CTO Community Treatment Order
DIC deviance information criterion
ENSCA English National Study ofCompulsory Admissions
GP general practitioner
HES Hospital Episode Statistics
HoNOS Health of the NationOutcome Scale
HSCIC Health and Social CareInformation Centre
LD learning disability
LOS length of stay
LSC Legal Status Classification
LSOA lower layer super output area
LSR Most Restrictive Legal StatusClassification Code
MCMC Markov chain Monte Carlo
MHA Mental Health Act
MHF Mental Health Foundation
MHMDS Mental Health Minimum Data Set
MLM multilevel model
NHSIC National Health ServiceInformation Centre
NSUN National Survivor User Network
ONS Office for National Statistics
OR odds ratio
PCT primary care trust
PEAT Patient Environment andAction Team
PPI patient and public involvement
SHA strategic health authority
DOI: 10.3310/hsdr02490 HEALTH SERVICES AND DELIVERY RESEARCH 2014 VOL. 2 NO. 49
© Queen’s Printer and Controller of HMSO 2014. This work was produced by Weich et al. under the terms of a commissioning contract issued by the Secretary of State forHealth. This issue may be freely reproduced for the purposes of private research and study and extracts (or indeed, the full report) may be included in professional journalsprovided that suitable acknowledgement is made and the reproduction is not associated with any form of advertising. Applications for commercial reproduction should beaddressed to: NIHR Journals Library, National Institute for Health Research, Evaluation, Trials and Studies Coordinating Centre, Alpha House, University of Southampton SciencePark, Southampton SO16 7NS, UK.
xiii


Plain English summary
Rates of compulsory mental health admission in England have been rising for decades, and haveaccelerated recently despite investment in community services. Studying differences in rates of
compulsory admission between people and places can identify targets for interventions to bringrates down.
We analysed the Mental Health Minimum Data Set, the mandatory return from providers of NHS-fundedmental health care in England. We studied anonymised records of over 1.2 million people for 2010/11and linked this to information about local areas (Census data), primary care trusts (investment data) andprovider trusts. Compulsory admission was defined as time spent in a mental illness bed under the MentalHealth Act (2007).
This was the largest analysis of compulsory admissions in England. While 85% of the variance in thisoutcome occurred between individuals, statistically significant variance (around 7% each) occurredbetween places (Census areas) and provider trusts. This higher-level variance in compulsory admissionremained largely unchanged (and therefore unexplained) even after adjusting for a large number ofexplanatory variables.
The characteristics of people and places explained only about 10% of the difference in the risk of beingadmitted to hospital compulsorily. Black patients were almost three times more likely to be admittedcompulsorily than white patients. Compulsory admission was also greater in more socioeconomicallydeprived areas and in areas with more non-white residents. The amount of money spent on mental healthservices was not associated with compulsory admission.
We consulted service users, carers and professionals, who helped interpret the results and suggestedavenues for further research.
DOI: 10.3310/hsdr02490 HEALTH SERVICES AND DELIVERY RESEARCH 2014 VOL. 2 NO. 49
© Queen’s Printer and Controller of HMSO 2014. This work was produced by Weich et al. under the terms of a commissioning contract issued by the Secretary of State forHealth. This issue may be freely reproduced for the purposes of private research and study and extracts (or indeed, the full report) may be included in professional journalsprovided that suitable acknowledgement is made and the reproduction is not associated with any form of advertising. Applications for commercial reproduction should beaddressed to: NIHR Journals Library, National Institute for Health Research, Evaluation, Trials and Studies Coordinating Centre, Alpha House, University of Southampton SciencePark, Southampton SO16 7NS, UK.
xv


Scientific summary
Background
Rates of compulsory admission to psychiatric inpatient beds remain high in many Western Europeancountries despite well-resourced, specialist community-based services. Rates have risen steadily for overtwo decades in England and now appear to be accelerating. The numbers of people subject to the MentalHealth Act (MHA) have risen dramatically since 2008, and increased by more than 5% in each of 2010/11and 2011/12.
The reasons are unclear, but possible explanations include secular increases in drug and alcohol use,changes in social support networks and bed shortages. Increases in compulsory admission in England havecoincided with an equally dramatic reduction in the number of mental illness beds: the number of NHSinvoluntary admissions increased by over 80% between 1988 and 2008, while the number of mentalillness beds fell by around 60% during the same period. Fewer beds means delays in admission,increased illness severity thresholds for admission, inpatient units that are more disturbed and frightening,and early discharge resulting in relapse and readmission.
Clues to understanding increasing compulsory admission rates may lie in variation in use of the MHAbetween people and places, including understanding differences in local service organisation. People fromblack and minority ethnic groups have different experiences of mental health services from the restof the population in the UK. These groups experience significantly greater rates of admission, includingcompulsory detention. Black mental health service users experience pathways to acute psychiatric care thatare more coercive and more likely to involve referral for MHA assessment and the police and criminaljustice system. These inequalities have persisted despite major policy initiatives, additional investment,workforce developments and general improvements in the coverage and quality of mental health servicesover the last decade. There are also significant geographical differences in use of the MHA. This mayreflect the threefold variation in investment in mental health services by commissioners. Gains associatedwith improved community services may not be experienced equally, and compulsory admission rates maybe increasing disproportionately in more deprived, highly urban and/or very remote places.
Objectives
We had two main aims: (1) to establish if and to what extent compulsory admission rates vary betweenpeople and places, including providers and commissioners of mental health care in England; and (2) toexplore and quantify the extent to which variance in the rate of compulsory admission can be explained bythe characteristics of people using mental health services, local area socioeconomic and sociodemographicfactors, and features of the commissioning and delivery of local mental health services.
The first objective was to use multilevel statistical models to measure and compare variance in the rate ofcompulsory admission across England at each of these levels. Since there were likely to be many factorsthat influence the risk of compulsorily admission, we undertook linkages to routine (secondary) datasources to create models that incorporate information about people, places and health-care organisations.Our second objective was to use multilevel statistical models to examine the effect of specific risk factorsat each spatial level within the Mental Health Minimum Data Set (MHMDS) for England in 2010/11,simultaneously, on variance in the rate of compulsory admission across England.
DOI: 10.3310/hsdr02490 HEALTH SERVICES AND DELIVERY RESEARCH 2014 VOL. 2 NO. 49
© Queen’s Printer and Controller of HMSO 2014. This work was produced by Weich et al. under the terms of a commissioning contract issued by the Secretary of State forHealth. This issue may be freely reproduced for the purposes of private research and study and extracts (or indeed, the full report) may be included in professional journalsprovided that suitable acknowledgement is made and the reproduction is not associated with any form of advertising. Applications for commercial reproduction should beaddressed to: NIHR Journals Library, National Institute for Health Research, Evaluation, Trials and Studies Coordinating Centre, Alpha House, University of Southampton SciencePark, Southampton SO16 7NS, UK.
xvii

Methods
Design, setting and data sourceThis was an observational, secondary study based on cross-sectional analysis of the 2010/11 MHMDS,the mandatory data return for all providers of NHS-funded specialist mental health services in England.The study setting was England, and the data set included 1,238,188 patients who received mental healthcare in 2010/11.
We identified six spatial levels in the MHMDS: individual, Census lower layer super output area (LSOA),general practitioner (GP) practice, primary care trust (PCT, service commissioner at the time), provider trustand strategic health authority. We made use of the facility that this data structure offered for linking toexternal data sets. Data coverage included 98.1% of LSOAs, 93.0% of general practices, 95.4% ofcommissioning PCTs and all 69 NHS providers of secondary care mental health services in England.
The study outcome was compulsory admission, defined as time spent in an inpatient mental illness bedsubject to the MHA (2007) during the 2010/11 reporting period. We did not include patients who weredetained only under sections of the MHA (2007) that apply only to conveyance to, and assessment in,a place of safety (S135 and S136), or for the purposes of assessment only [e.g. Sections 4 and 5(2)] wheredetention for longer than 72 hours does not occur. Likewise (because it does not relate to inpatientadmission per se) we did not include sections of the Act relating only to Guardianship or the supervision ofcommunity treatment. The control group comprised people who either were admitted voluntarily orreceived only community-based mental health care during the same period.
Data on explanatory variables, characterising each of the spatial levels in the data set, were obtained froma wide range of publicly available sources, and were linked using MHMDS identifiers.
Multilevel modelling (MLM) was used to estimate variances (and standard errors) occurring at differentspatial levels. The structure of the MHMDS is complex and overlapping (referred to as cross-classified),as the different spatial groupings did not nest or cluster neatly within each other. Markov chain Monte Carlomethods were used to estimate the variance in the study outcome across the different spatial levels. Binarylogistic MLMs with random effects were estimated to model the risk of being compulsorily admitted duringthe 2010/11 reporting period versus all other care.
We began our analyses with null models, in which total variance in compulsory admission in the studysample is estimated without the inclusion of any explanatory or potentially confounding variables.Given the size and complexity of the data set, models with more than four spatial levels proved unstable.We therefore ran all permutations of four-level null models to identify consistent cross-model patterns andcompare goodness of fit using the Bayesian deviance information criterion goodness-of-fit statistic. Afterselecting the optimal four-level null model we controlled for basic demographic characteristics of thepatient population served by the provider trust (i.e. individual age and sex) and examined the providertrust-level residual using ‘caterpillar’ plots and by mapping the normal score of the residual. This exercisewas repeated for the fully adjusted, final model. Mapping was done for exploratory purposes: if negativeresiduals are clustered together and positive residuals clustered together (i.e. model residuals are positivelyspatially auto-correlated) this would suggest a missing spatially clustered explanatory variable. The absenceof auto-correlation would direct us away from a search for a ‘missing’ explanatory spatial variable.
We extended null MLM to include explanatory variables at different spatial levels in order to quantify theproportion of variance in the study outcome that could be explained. This involved modelling the predictedvalue of the (assumed) underlying continuous latent variable by using an equation with both fixed(intercept plus regression coefficients for explanatory variables) and random parts.
SCIENTIFIC SUMMARY
NIHR Journals Library www.journalslibrary.nihr.ac.uk
xviii
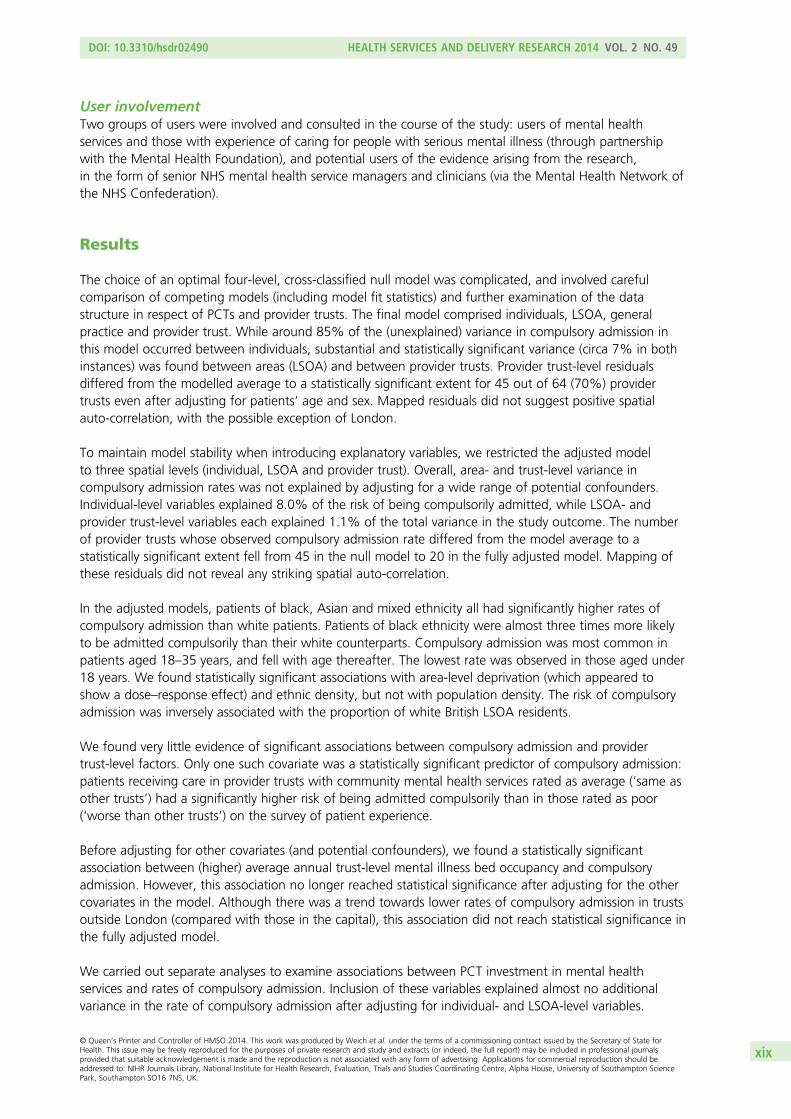
User involvementTwo groups of users were involved and consulted in the course of the study: users of mental healthservices and those with experience of caring for people with serious mental illness (through partnershipwith the Mental Health Foundation), and potential users of the evidence arising from the research,in the form of senior NHS mental health service managers and clinicians (via the Mental Health Network ofthe NHS Confederation).
Results
The choice of an optimal four-level, cross-classified null model was complicated, and involved carefulcomparison of competing models (including model fit statistics) and further examination of the datastructure in respect of PCTs and provider trusts. The final model comprised individuals, LSOA, generalpractice and provider trust. While around 85% of the (unexplained) variance in compulsory admission inthis model occurred between individuals, substantial and statistically significant variance (circa 7% in bothinstances) was found between areas (LSOA) and between provider trusts. Provider trust-level residualsdiffered from the modelled average to a statistically significant extent for 45 out of 64 (70%) providertrusts even after adjusting for patients’ age and sex. Mapped residuals did not suggest positive spatialauto-correlation, with the possible exception of London.
To maintain model stability when introducing explanatory variables, we restricted the adjusted modelto three spatial levels (individual, LSOA and provider trust). Overall, area- and trust-level variance incompulsory admission rates was not explained by adjusting for a wide range of potential confounders.Individual-level variables explained 8.0% of the risk of being compulsorily admitted, while LSOA- andprovider trust-level variables each explained 1.1% of the total variance in the study outcome. The numberof provider trusts whose observed compulsory admission rate differed from the model average to astatistically significant extent fell from 45 in the null model to 20 in the fully adjusted model. Mapping ofthese residuals did not reveal any striking spatial auto-correlation.
In the adjusted models, patients of black, Asian and mixed ethnicity all had significantly higher rates ofcompulsory admission than white patients. Patients of black ethnicity were almost three times more likelyto be admitted compulsorily than their white counterparts. Compulsory admission was most common inpatients aged 18–35 years, and fell with age thereafter. The lowest rate was observed in those aged under18 years. We found statistically significant associations with area-level deprivation (which appeared toshow a dose–response effect) and ethnic density, but not with population density. The risk of compulsoryadmission was inversely associated with the proportion of white British LSOA residents.
We found very little evidence of significant associations between compulsory admission and providertrust-level factors. Only one such covariate was a statistically significant predictor of compulsory admission:patients receiving care in provider trusts with community mental health services rated as average (‘same asother trusts’) had a significantly higher risk of being admitted compulsorily than in those rated as poor(‘worse than other trusts’) on the survey of patient experience.
Before adjusting for other covariates (and potential confounders), we found a statistically significantassociation between (higher) average annual trust-level mental illness bed occupancy and compulsoryadmission. However, this association no longer reached statistical significance after adjusting for the othercovariates in the model. Although there was a trend towards lower rates of compulsory admission in trustsoutside London (compared with those in the capital), this association did not reach statistical significance inthe fully adjusted model.
We carried out separate analyses to examine associations between PCT investment in mental healthservices and rates of compulsory admission. Inclusion of these variables explained almost no additionalvariance in the rate of compulsory admission after adjusting for individual- and LSOA-level variables.
DOI: 10.3310/hsdr02490 HEALTH SERVICES AND DELIVERY RESEARCH 2014 VOL. 2 NO. 49
© Queen’s Printer and Controller of HMSO 2014. This work was produced by Weich et al. under the terms of a commissioning contract issued by the Secretary of State forHealth. This issue may be freely reproduced for the purposes of private research and study and extracts (or indeed, the full report) may be included in professional journalsprovided that suitable acknowledgement is made and the reproduction is not associated with any form of advertising. Applications for commercial reproduction should beaddressed to: NIHR Journals Library, National Institute for Health Research, Evaluation, Trials and Studies Coordinating Centre, Alpha House, University of Southampton SciencePark, Southampton SO16 7NS, UK.
xix

No statistically significant association was found between total investment in mental health services andcompulsory admission in adjusted models. A small but statistically significant association was, however,found for investment in community mental health teams, but not with investment in assertive outreach orcrisis resolution teams.
Conclusions
Of people using specialist secondary care mental health services, 3.5% experienced at least onecompulsory admission in 2010/11, defined as time spent in an inpatient mental illness bed under theMHA (2007). Cross-classified multilevel statistical models revealed that 84.5% of the variance incompulsory admission rates occurred between individuals, 6.7% between local areas (LSOAs), 2.7%between GP practices and 6.9% between provider trusts. All of these estimates of variance werestatistically significant.
Although we adjusted for a large number of individual-, area- and trust-level variables (including individualage, sex and ethnicity, area-level deprivation and mental illness bed occupancy), these explained onlyaround 10% of the total variance in the study outcome. People of black ethnicity experienced compulsoryadmission rates almost three times greater than those of white patients, and compulsory admission ratesincreased with area-level deprivation and the proportion of non-white residents in local areas. There was asmall but statistically significant association between (higher) bed occupancy and compulsory admission,but this was confounded by adjusting for other study covariates. Levels of PCT (commissioner) investmentin mental health services (whether in total or by specific community) did not add to the model fit afteradjusting for individual- and area-level characteristics.
This was the largest and most complete study of its kind, and the representativeness of the data set was amajor strength. However, as it was a secondary and cross-sectional study, we were constrained by thenature, quality and completeness of the (routine) data available to us. We were unable to consider manyof the very salient hypotheses suggested to us by the service users and mental health professionals weconsulted as part of the project, which have influenced our research recommendations.
The MHMDS is complex and had some data quality issues. However, this remains an unrivalled resourcefor studying compulsory admission, particularly since data quality is improving rapidly. Usable longitudinalMHMDS data should be available shortly, enabling research to be undertaken on chronological trends inuse of the MHA.
It is imperative to develop and evaluate interventions to reduce compulsory admission rates, but this willdepend in part on further observational studies, designed to further our understanding of the reasons whythese rates remain so high.
Recommendations for future research
Future research will require a mixed-methods approach to (1) undertake longitudinal analysis and(2) generate and test hypotheses about the causes of observed variance in compulsory admission rates.There is a need for in-depth qualitative research to explore factors that underlie local variation incompulsory admission, for which there are no existing data. There is also an imperative to move towardsdeveloping and evaluating interventions to reduce compulsory admission rates.
SCIENTIFIC SUMMARY
NIHR Journals Library www.journalslibrary.nihr.ac.uk
xx

Key questions include:
1. What are the rates and chronological patterns of repeat compulsory admission, and what proportionof these are accounted for by the same individuals?
2. What effect do the characteristics of individual patients, especially diagnosis, previous treatmentexperiences, length of illness, engagement with care and socioeconomic status, have on the likelihoodof compulsory admission?
3. Given that most of the variance in compulsory admission rates remains unexplained, what effect doother service characteristics, including the physical, social and therapeutic environments on inpatientunits, and continuity of care, have on compulsory admission rates?
4. To what extent do longitudinal trends in compulsory admission rates vary between places? Are thereareas and health-care providers where the rates of increase has been halted or reversed, and are thereplaces where rates are accelerating? Can these differences be explained?
5. What effect do Community Treatment Orders have on compulsory admission rates, over the long term,and can longitudinal analysis reveal any evidence that these result in fewer patients being readmittedunder the MHA (2007)?
6. Around 15% of the variance in compulsory admission occurs between places, mental health-careproviders, GP practices and commissioners. In addition, some of the individual-level variance may reflectpersonal experience of local services. Is it feasible to develop and deliver interventions at the level oflocal health-care systems that could reduce compulsory admissions, and would this prove effective?
Funding
Funding for this study was provided by the Health Services and Delivery Research programme of theNational Institute for Health Research.
DOI: 10.3310/hsdr02490 HEALTH SERVICES AND DELIVERY RESEARCH 2014 VOL. 2 NO. 49
© Queen’s Printer and Controller of HMSO 2014. This work was produced by Weich et al. under the terms of a commissioning contract issued by the Secretary of State forHealth. This issue may be freely reproduced for the purposes of private research and study and extracts (or indeed, the full report) may be included in professional journalsprovided that suitable acknowledgement is made and the reproduction is not associated with any form of advertising. Applications for commercial reproduction should beaddressed to: NIHR Journals Library, National Institute for Health Research, Evaluation, Trials and Studies Coordinating Centre, Alpha House, University of Southampton SciencePark, Southampton SO16 7NS, UK.
xxi


Chapter 1 Background
Introduction
Rates of compulsory admissions to psychiatric inpatient beds have been rising in recent decades in manyWestern European countries,1,2 including England.3–5 This trend appears to have accelerated since theintroduction of the Mental Health Act (2007) (MHA):1,5–8 compulsory admissions to hospital in Englandincreased by 14% in the first five years after the introduction of the MHA (2007).9 Taking into account thewidespread use of Community Treatment Orders (CTOs),10 introduced in 2008, the numbers of peoplesubject to the MHA since 2007/8 has increased by about 5% per annum.9 The total number of detentionsin England exceeded 50,000 for the first time ever in 2012/1311 (not counting short-term assessmentorders), and this is now a matter of significant public, government and regulatory concern in England.12–14
The reasons for this remain unclear, particularly since this trend has continued despite the developmentof a range of community-based services such as Community Mental Health Teams, Assertive Outreach,Crisis Resolution Home Treatment (CRHT) and Early Intervention services.15
Different explanations for increasing compulsory admissions have been proposed, including secularchanges in social support networks,16,17 bed shortages18 and ‘local system failures in facilitation of timelyand appropriate access to care’,13 including difficulties accessing effective crisis care in the community,accident and emergency (A&E) departments and appropriate Place of Safety settings,14 and bedshortages.13,18 Recent evidence that rates of detention are also increasing among patients initially admittedvoluntarily suggests that consent to treatment is now being withdrawn more often after patients havebeen exposed to inpatient environments.13 Although illicit drugs and alcohol use is often considered to bea cause of mental disorder, suicide and violence,3 recent evidence of falling rates of misuse argue againstthis as a primary cause of rising compulsory admission rates.19 Increases in compulsory admission rates inEngland have coincided with an equally dramatic reduction in the number of mental illness beds.20
Fewer beds may lead to higher occupancy levels, delays in admission,21 increased illness severity thresholdsfor admission, inpatient units that are more disturbed and frightening,22–24 and early discharge resulting inrelapse and readmission.3 Analysis for England shows that the number of NHS compulsory admissionsincreased by over 80% between 1988 and 2008, while the number of mental illness beds fell by around60% during the same period.5,20 While closure of mental illness beds has been part of deinstitutionalisationof care for the mentally ill in high-income countries,25 the UK has taken this further than most otherdeveloped economies,26 despite having higher levels of funding for mental health services overall.27
Clues to understanding increasing compulsory admission rates may lie in variation in use of the MHAbetween different types of individual, and between different places and health-care providers. People fromblack and minority ethnic (BME) groups have very different experiences of mental health services from therest of population in the UK.28–33 These groups experience significantly greater rates of admission,including compulsory detention.31,34 Black mental health service users experience pathways to acute psychiatriccare that are more coercive and more likely to involve referral for MHA assessment35 and the police andcriminal justice system.36,37 These inequalities have persisted despite major policy initiatives,38–40 additionalinvestment, workforce developments and the general improvements in the coverage and quality of mentalhealth services over the last decade.39,41 There are also significant geographical differences in use of the MHA;a twofold difference in the rate of compulsory admission between strategic health authorities (SHAs) wasnoted in 2011/12.9 This may reflect variation in investment in mental health services by commissioners.In 2007, per-adult mental health spend by primary care trusts (PCTs) in England varied by a factor of threeafter adjusting for age, population need and overall PCT spending.42 The gains associated with improvedcommunity services may not be experienced equally, and compulsory admission rates may be increasingdisproportionately in places where social networks are weakest, demands on services are greatest andcommunity services are hardest to deliver, particularly urban areas as well as remote rural communities.
DOI: 10.3310/hsdr02490 HEALTH SERVICES AND DELIVERY RESEARCH 2014 VOL. 2 NO. 49
© Queen’s Printer and Controller of HMSO 2014. This work was produced by Weich et al. under the terms of a commissioning contract issued by the Secretary of State forHealth. This issue may be freely reproduced for the purposes of private research and study and extracts (or indeed, the full report) may be included in professional journalsprovided that suitable acknowledgement is made and the reproduction is not associated with any form of advertising. Applications for commercial reproduction should beaddressed to: NIHR Journals Library, National Institute for Health Research, Evaluation, Trials and Studies Coordinating Centre, Alpha House, University of Southampton SciencePark, Southampton SO16 7NS, UK.
1

Increasing compulsory admission rates are unpopular with service users and carers (even when viewed inretrospect as necessary)43,44 and sit uneasily with professionals, who have spent decades attemptingto improve engagement with care and reduce fear and stigma.22–24,31,45 Observational studies show thatpeople who were admitted compulsorily had worse social functioning and higher suicide rates [but notmore (re)admissions or greater lengths of stay] than those admitted voluntarily, although the former alsoexpressed lower levels of satisfaction with treatment.46 Despite services being increasingly patient- andcarer-centred, responsive to need, recovery-focused, timely and popular,22,47 recent developments incommunity mental health services have not reduced involuntary admissions.15,48–51 Despite early promise,52
subsequent rigorous, high-quality randomised controlled trials of individual-level interventions,most notably joint crisis plans,2 advance directives53 and CTOs10 have all failed to demonstrate significantreductions in compulsory admissions. Although it is possible that enhanced, intensive interventionsfor those most at risk of compulsory admission may prove more effective,8 indications to date arenot promising.
This is also a source of concern to commissioners and service providers, given the high costs of inpatientcare. The increasing rate of involuntary treatment represents a major financial obstacle to investmentin community services and preventative and public health initiatives, particularly at times of austerity.Understanding the determinants of this trend is imperative if it is to be arrested or reversed.15
Research aims and objectives
This study seeks to identify factors that contribute to the increasing rate of compulsory admission inEngland. This will be achieved by means of the following aims and objectives.
Research aim 1To establish if, and to what extent, compulsory admission rates vary across different places and betweenproviders and commissioners of (mental) health care in England, and, if so, where this variance occurs.
Research objective 1The geography of mental health care is complex and comprises overlapping, partially nested spatial clustersthat include individuals, general practices, commissioners (previously PCTs), providers (NHS trusts orindependent providers) and regional health authorities (SHAs). We will use multilevel statistical models tomeasure and compare variance in the rate of compulsory admission across England at each of these levels.
Research aim 2To explore and quantify the extent to which variance in the rate of compulsory admission can beexplained by:
l the individual characteristics of people using services (e.g. age, sex and ethnicity)l the local area (i.e. contextual) socioeconomic and sociodemographic factors (e.g. small area
socioeconomic deprivation, urbanicity and ethnic density)l the features of local mental health services [e.g. bed availability, number of admissions, length of stay
(LOS) in hospital and investment in mental health services].
BACKGROUND
NIHR Journals Library www.journalslibrary.nihr.ac.uk
2

Research objective 2There are many factors that may influence (i.e. increase or decrease) the risk of a patient beingcompulsorily admitted to hospital. We will undertake substantial data linkage using multiple routine(secondary) data sources in order to create models that incorporate information about people, places andhealth-care organisations. We will use multilevel statistical models to examine the impact of specific riskfactors at both the individual (patient) level and at each of the spatial levels in the Mental Health MinimumData Set (MHMDS) for England in 2010/11, simultaneously, on variance in the rate of compulsoryadmission across England.
Finally, we estimated associations between risk factors operating at different spatial levels and compulsoryadmission, after adjusting for other model covariates.
These research aims were addressed through secondary analyses of routinely collected national mentalhealth-care data, described in detail in the next chapter.
DOI: 10.3310/hsdr02490 HEALTH SERVICES AND DELIVERY RESEARCH 2014 VOL. 2 NO. 49
© Queen’s Printer and Controller of HMSO 2014. This work was produced by Weich et al. under the terms of a commissioning contract issued by the Secretary of State forHealth. This issue may be freely reproduced for the purposes of private research and study and extracts (or indeed, the full report) may be included in professional journalsprovided that suitable acknowledgement is made and the reproduction is not associated with any form of advertising. Applications for commercial reproduction should beaddressed to: NIHR Journals Library, National Institute for Health Research, Evaluation, Trials and Studies Coordinating Centre, Alpha House, University of Southampton SciencePark, Southampton SO16 7NS, UK.
3


Chapter 2 Methods
Study overview and design
This study is a cross-sectional, multilevel secondary analysis of annual, routinely collected data,from providers of secondary mental health-care services in England during 2010/11, augmented by linkageto external data sets across a range of different spatial levels.
Our initial intention was to estimate longitudinal changes in the variance of compulsory admission ratesat different spatial levels (see Appendix 1). Data quality (and completeness) problems in MHMDS databefore 2010/11, combined with far richer data linkages than expected, caused us to change our studydesign at the outset of the project. This was reported to the funders in both of our interim progressreports, and was documented in an approved amendment to the study protocol (see Appendix 2).
EthicsEthical approval for this study was obtained from Warwick Medical School Biomedical Research EthicsCommittee on 12 January 2012 (REF 166-01-2012).
The Mental Health Minimum Data Set
The primary data source for this study is the 2010/11 MHMDS.54 The MHMDS is a national, person-based,individual-level data set describing mental health service users and the care they receive. MHMDS includesdata on all adults aged 18 years or older (with no upper age limit) who have received specialist adultmental health-care services in a secondary care setting. A small number of individuals younger than18 years of age who are receiving treatment within a specialist secondary adult mental health service arealso included in the provider trust returns.55 In 2011 (at the time this project began), the MHMDS wascollated and analysed by the NHS Information Centre (NHSIC). In 2013, the NHSIC was re-organised to bethe NHS Health and Social Care Information Centre, or the HSCIC (www.hscic.gov.uk). For consistency,this report will refer to the HSCIC throughout. The MHMDS contains confidential patient-level data andour research team were granted access to the anonymised data for this project by the NHS Data Accessand Advisory Group.
Brief overview of the Mental Health Minimum Data SetThe MHMDS was initially developed to support monitoring of the mental health element of the thengovernment’s ‘Health of the Nation’ strategy (1992–7).56 Since 2003 the MHMDS has become amandatory quarterly data return for all providers of NHS-funded specialist mental health services for adults,and for some independent sector providers since 2011.54,57 The MHMDS provides data on a wide range ofmental health services, including those provided in hospital, in outpatient clinics and in the community(where the majority of people in contact with these services are treated).54 The MHMDS is an approvedNHS Information Standard that aims to deliver robust, comprehensive, nationally consistent andcomparable person-based information on patients in contact with specialist secondary mental healthservices. It captures key information from the mental health-care pathway.58 The MHMDS supports avariety of secondary use functions such as commissioning, clinical audit, research, service planning,inspection and regulation, monitoring key government policies and legislation including the NationalService Framework for Mental Health and MHA, performance management and benchmarking at bothlocal and national levels, and national reporting and analysis.58
DOI: 10.3310/hsdr02490 HEALTH SERVICES AND DELIVERY RESEARCH 2014 VOL. 2 NO. 49
© Queen’s Printer and Controller of HMSO 2014. This work was produced by Weich et al. under the terms of a commissioning contract issued by the Secretary of State forHealth. This issue may be freely reproduced for the purposes of private research and study and extracts (or indeed, the full report) may be included in professional journalsprovided that suitable acknowledgement is made and the reproduction is not associated with any form of advertising. Applications for commercial reproduction should beaddressed to: NIHR Journals Library, National Institute for Health Research, Evaluation, Trials and Studies Coordinating Centre, Alpha House, University of Southampton SciencePark, Southampton SO16 7NS, UK.
5

Systems for MHMDS data collection, collation and curatorship have improved dramatically since the dataset was first created, and this is reflected in increasing reliance on MHMDS for the national governanceof NHS mental health services. Nevertheless, significant data quality issues have been a constant feature,and pose challenges to its use. It became clear in the course of our research that, while the 2010/11MHMDS was of sufficient completeness to support the cross-sectional examination of variance incompulsory admission rates, the data from previous years were much less reliable and of farinferior quality.
The 2010/11 MHMDS was designed to support the legal requirement of the NHS to administer and applythe 2007 MHA.55 Providers make quarterly data returns which are then assembled to create an annualdatabase, covering a reporting period from 1 April 2010 to 31 March 2011. During this 2010/11 reportingperiod, a total of 72 providers of mental health services submitted data to the MHMDS: three wereindependent sector providers, 10 were also NHS commissioners and 59 were (solely) NHS mentalhealth providers.
The MHMDS is a large and complex data set. In 2010/11, a total of 1,287,730 individuals had contactwith specialist mental health services in England. Each record in the MHMDS represents the complete,continuous spell of care for an individual, from initial referral to final discharge (referred to as a mentalhealth-care spell – or care spell for short). This could cover any type of treatment from a short communityor outpatient episode to an extended care spell over many years and covering all aspects of mental healthservices.59 The care spell is assembled from separate records of care episodes, patient activity and contactswith mental health professionals. The vast majority of patients (89%) have only one care spell andtherefore one record in the 2010/11 MHMDS; the remaining patients have more than one care spell andmore than one record. Although multiple records are likely to arise for a variety of reasons (e.g. transferof care from one mental health provider to another), the data set does not include this level of detail.This means that there are more records in the 2010/11 MHMDS (n= 1,443,858) than there are patients(n= 1,287,730). For the purposes of this study, each patient was counted once only using specificselection rules, which are outlined in detail later in this report. This is common practice in national analysesof the same data by the HSCIC.54
Defining the study outcome
Defining compulsory admissionThe main study outcome is compulsory admission, and this terminology will be used throughout thereport. Those who were admitted but not subject to the MHA (2007) are referred to as voluntaryinpatients. We have not used the terms ‘informal’ and ‘formal’ (or ‘involuntary’) in relation toinpatient admissions, although these are sometimes used to denote voluntary and compulsoryadmissions, respectively.
Compulsory admission was defined as time spent in an inpatient mental illness bed subject to the MHA(2007) during the 2010/11 reporting period. We did not include patients who were detained only undersections of the MHA (2007) that apply only to conveyance to, and assessment in, a Place of Safety(S135 and S136), or for the purposes of assessment only [e.g. Sections 4 and 5(2)] where detention forlonger than 72 hours does not occur. Likewise (because it does not relate to inpatient admission per se)we did not include sections of the Act relating only to guardianship or the supervision of communitytreatment. Patients who were detained under these short-term assessment sections and subsequentlyadmitted under Sections 2 or 3 were included as cases of compulsory admission; those discharged fromSections 135 or 5(2), or admitted to hospital voluntarily, were not. The data did not allow us to distinguishbetween patients who were detained under the MHA (2007) at the time of admission and those admittedvoluntarily and subsequently detained.
METHODS
NIHR Journals Library www.journalslibrary.nihr.ac.uk
6

No single variable in the MHMDS data set described the study outcome. It was therefore necessaryto derive this outcome using a number of other variables, starting with those concerned withinpatient admission.
The MHMDS contains several treatment and care variables which indicate if the patient was admitted tohospital during the reporting period, including number of days spent as an inpatient, number ofadmissions to hospital and number of discharges from hospital. There are also a number of variablesrelating to the nature of the admission to hospital (e.g. whether or not the patient was subject to theMHA), some of which apply to the reporting period (a year) and others to the entire course of the carespell (no definitive time period). These variables will be described in detail in the next sections.
Treatment in the communityMost patients in the MHMDS received all of their mental health care in the community, and were notadmitted to hospital (either voluntarily or compulsorily). MHMDS collects information relating to what typeof treatment the patient received in the community, for example the number of contacts a patient hadwith a community psychiatric nurse or the number of times a patient attended outpatient appointments.Combining these data with information from the number of days spent in hospital (bed-days) and numberof admissions/discharges enabled us to identify patients who received only community care during thestudy year, with a high degree of accuracy.
Admission to hospitalA number of variables in the MHMDS provide information on admissions to hospital. The variable‘bed-days’ is the number of days a patient spent as a mental health inpatient, including any days spent ina secure mental health unit. The number of admissions and discharges occurring during the reportingperiod are also recorded. However, the HSCIC discovered that there were inconsistencies and missing data,such that information on bed-days and on admissions/discharges does not concur for every patient.This is noted in the MHMDS Data Quality and Methodology Manual:
A very small number of trusts are failing to record consistent information about Inpatient spells in theHospital Provider Spell (IPEP) and Ward Stay within Hospital Provider Spell (WARDSTAYS) tablesin the input data and this affects the accuracy of the trust level results for these organisations . . .discrepancies in the source data result in discrepancies between the reported admissions,occupied bed days and patients categorised as ’admitted’. It also means that some trusts that certainlyhave beds have no patients in the ‘admitted’ category.
p. 959
However, IPEP and WARDSTAYS variables are generated by the HSCIC data assembler when the providertrust makes a submission but are not available to external users of the MHMDS. We were therefore unableto conduct any missing data analysis on these variables and had to conduct our own exploratory analysesto ascertain if a patient spent time as an inpatient subject to the MHA during the 2010/11 reportingperiod. We were not able to distinguish the type of mental health service providing inpatient treatment,and therefore these data will include people receiving specialist treatment in old age, learning disability(LD) and forensic mental health services.
Information from all relevant variables was used to optimise certainty about whether or not a patient spenttime as an inpatient during the reporting period. Patients were therefore classified as follows:
l ‘admitted’ if there was any evidence that the individual spent time in hospital as an inpatient during2010/11
l ‘only non-admitted care’ if there was evidence that the individual received treatment in the communitybut there is no evidence that the individual spent time as an inpatient during 2010/11
l ‘no care’ if there was no information about care provided during 2010/11.
DOI: 10.3310/hsdr02490 HEALTH SERVICES AND DELIVERY RESEARCH 2014 VOL. 2 NO. 49
© Queen’s Printer and Controller of HMSO 2014. This work was produced by Weich et al. under the terms of a commissioning contract issued by the Secretary of State forHealth. This issue may be freely reproduced for the purposes of private research and study and extracts (or indeed, the full report) may be included in professional journalsprovided that suitable acknowledgement is made and the reproduction is not associated with any form of advertising. Applications for commercial reproduction should beaddressed to: NIHR Journals Library, National Institute for Health Research, Evaluation, Trials and Studies Coordinating Centre, Alpha House, University of Southampton SciencePark, Southampton SO16 7NS, UK.
7

A small proportion of patients (6.7%) had no care information in their 2010/11 record. This group mayinclude patients recently referred to mental health services but not yet seen. It is more likely, however,that data-uploading errors were responsible. We assumed that these patients received some care in thecommunity but no hospital admissions.
Table 1 provides a breakdown of the number of patients in each of the defined care status categories forthe 2010/11 reporting period.
These estimates match those reported in the annual MHMDS Bulletin,59 providing evidence of the validityof our methodology.
In Table 1, the ‘admitted’ category includes all patients who were admitted to hospital during 2010/11,regardless of whether they were subject to the MHA or not. This ‘admitted’ category required furtherclassification according to legal status (voluntary versus compulsory admission) using additional informationrelating to the patient’s MHA legal status classification.
Specifying the reference groupThe reference group for this study comprised all patients receiving any type of care other than compulsoryadmission to hospital under the MHA (including informal admission and community care only). Patientswere only counted once; for patients with more than one care spell during the 2010/11 reporting period,the care spell with the most restrictive level of care was then selected.
Legal status and nature of admission to hospital
Legal Status ClassificationThe MHMDS contains a number of variables which provide information on the patient’s legal statusunder the MHA (2007) during 2010/11. Legal Status Classification (LSC) specifies whether or not, on thelast day of the reporting period (i.e. 31 March 2011), the patient was subject to any section of the MHA,including sections which allow for assessment or the removal of a person to a place of safety. If a patientwas not formally detained, the LSC provides information on whether or not the patient was being treatedin hospital on a voluntary basis (i.e. informally admitted). If the patient was not an inpatient on a voluntaryor compulsory basis on the last day of the reporting period, LSC is not applicable.
Legal Status RestrictivenessThe original stated intention of the MHMDS was to collect information on the most restrictive legal status(referred to as LSR) during the reporting period.55 In a major data incident, the HSCIC discovered thatdata-uploading instructions contained an error that resulted in all provider trusts recoding the mostrestrictive legal status at any point during the care spell rather than during the reporting period.59
This meant that the LSR code could refer to any point during the care spell (which has no definitive timeperiod), rather than in the annual period of interest (1 April 2010 to 31 March 2011). This posed a majorand unexpected challenge to the study.
TABLE 1 Care status categories for all patients in the 2010/11 MHMDS
Care status category Description (for 2010/11)Number of patients(n= 1,287,730)
Admitted Evidence of time in hospital as an inpatient 106,719
Only non-admitted care Evidence that patient received treatment in the community only but noevidence of specific record of being an inpatient in 2010/11 admission
1,094,138
No care No evidence of direct care being provided in 2010/11 86,873
METHODS
NIHR Journals Library www.journalslibrary.nihr.ac.uk
8

The HSCIC estimated that ‘around 11% (4,650) of patients categorised as being formally detained(in 2010/11) probably experienced detention in an early reporting period’ (p. 13).59 This estimate wasobtained using linked data (at patient level) from the 2009/10 and 2010/11 MHMDS. Although there is adetailed description (and syntax) provided in the MHMDS Data Quality and Methodology Manual,59
key variables that are necessary to replicate this estimation are not routinely provided to general externalusers of the MHMDS. Our request for access to these data was declined. Of the 55,852 patients who hada LSR of Section 2 or Section 3 in their current care spell, 19,631 (35%) had no recorded inpatientbed-days during the study year.
We therefore had to establish a means of ascertaining which inpatients in 2010/11 had been compulsoryinpatients during this time.
Identifying patients who were admitted compulsorily in 2010/11Further to establishing if patients had received treatment as an inpatient in 2010/11 reporting period,we had to ascertain if this was subject to the MHA (2007).
Providers are required to specify start and end dates for each care spell. The mental health-care spell beganduring the 2010/11 reporting period for around one-half of patients (54%) in the 2010/11 MHMDS.This means that the LSR referred to the reporting period under investigation (i.e. 1 April 2010 to31 March 2011).
We accessed data from the 2009/10 MHMDS to assist in ascertaining LSR in 2010/11 for patients whosecare spells began before this reporting period. We used unique MHMDS identification numbers to link carespell records from 2009/10 and 2010/11. We used all variables relating to admission and detention,including LSR and LSC (as described above) discharge, bed-days, revocation of CTOs, Section 17 leave andthe start and end dates for care spells to determine whether or not patients were admitted compulsorily inthe 2010/11 reporting period. Two main complications were evident: (1) there was often inconsistencybetween the 2009/10 and 2010/11 MHMDS databases in terms of information relating to care spell startand end dates; and (2) missing data in one or both of the reporting periods made it difficult to get a clearpicture of the patient’s admission history.
Information relating to the patient’s ‘care status’ during 2010/11 (see Table 1) was used together with thecorresponding LSR and LSC codes to ascertain which inpatients spent time in hospital during 2010/11compulsorily, i.e. subject to the MHA (2007). The main classification rules were as follows:
l Anyone with a qualifying 2009/10 LCS code (i.e. for a compulsory admission other than for anassessment section or guardianship) on 31 March 2010 was assumed to have still been compulsorilyadmitted on 1 April 2010 (i.e. the first day of the 2010/11 reporting period).
l Anyone who was an inpatient during 2010/11 and had a qualifying LSR code in the 2010/11 MHMDSwas coded as having had a compulsory admission during 2010/11.
l Anyone who was an inpatient during 2010/11 and had a LSR code of a compulsory admission tohospital in the 2010/11 MHMDS, but only for an assessment section or guardianship, was coded as avoluntary admission in 2010/11.
l Anyone who was an inpatient during 2010/11 but who was not subject to the MHA on the last day ofthe 2009/10 or 2010/11, and whose LSR for 2010/11 was the same as the LSR for 2009/10, was codedas a voluntary admission in 2010/11. This decision was based on the assumption that the 2010/11 LSRcode relates to a time before the 2010/11 reporting period.
This exercise was critically important for the main aims of this study but it also served as a qualityassurance task for the project. As will be discussed in greater detail in Chapter 3, Results and discussion,the number of patients deemed to be compulsorily admitted to hospital during the 2010/11 reportingperiod (n= 44,442) was consistent with the HSCIC estimates54 for compulsory admissions during the samereporting period (n= 43,941).
DOI: 10.3310/hsdr02490 HEALTH SERVICES AND DELIVERY RESEARCH 2014 VOL. 2 NO. 49
© Queen’s Printer and Controller of HMSO 2014. This work was produced by Weich et al. under the terms of a commissioning contract issued by the Secretary of State forHealth. This issue may be freely reproduced for the purposes of private research and study and extracts (or indeed, the full report) may be included in professional journalsprovided that suitable acknowledgement is made and the reproduction is not associated with any form of advertising. Applications for commercial reproduction should beaddressed to: NIHR Journals Library, National Institute for Health Research, Evaluation, Trials and Studies Coordinating Centre, Alpha House, University of Southampton SciencePark, Southampton SO16 7NS, UK.
9

Geographical and spatial identifiers
The MHMDS records include information about where patients live, the identity of their generalpractitioner (GP) practice and where they received mental health care. There are several geographical orspatial levels in the MHMDS at which variance in rates of compulsory admissions might occur, and whichcan be used as points of linkage to other data sets. These are detailed in the following sections.
PatientEach patient record (n= 1,287,730) in the MHMDS contains information about their contact with mentalhealth services during the care spell. This clinical record also includes fields for diagnosis and Health of theNation Outcome Scale (HoNOS), a global clinician-rated measure of clinical status. The MHMDS recordincludes fields for a number of demographic variables including patient age, sex, ethnicity, marital status,housing and employment status.
Lower layer super output areaLower layer super output areas (LSOAs) are a set of stable geographical areas developed to facilitateestimation and dissemination of neighbourhood statistics and are also used for the reporting of Censusdata. On average, LSOAs typically include 672 households and 1614 residents. In 2001, there were 34,378LSOAs across England (n= 32,482) and Wales (n= 1896) (www.ons.gov.uk/ons/guide-method/geography/beginner-s-guide/census/super-output-areas–soas-/index.html). The 2010/11 MHMDS used the 2001 LSOAboundaries. LSOA data were missing for 12,557 patients (1.0% of the sample). Almost all (98.1%) of theLSOAs in England were represented in the study sample. A small number of patients (n= 1014) (0.08%of the sample) received treatment from an English provider trust but had a LSOA in Wales; these patientswere retained in the analysis. The mean number of patients per LSOA (i.e. in contact with an Englishmental health-care provider) was much higher (39.2) in England than in Wales (1.8).
General practiceA total of 9492 of 10,203 GP practices in England in 2011 (93.0%) were represented in the data set.
Primary care trust (commissioner)In 2010/11, there were 152 PCTs in England; 146 (95.4%) of these were represented in the MHMDS.At the time the data were collected, PCTs were responsible for commissioning health care, includingspecialist mental health services but not forensic services. Several variables were present in the MHMDSregarding PCTs: Code of Commissioner, Code of PCT of GP practice and Code of PCT of residence wereavailable and in agreement for ∼1.1 million records (86% of patients). Code of GP practice, an indirectPCT identifier, was also available for these patients. The Code of Commissioner was therefore used tospecify PCT for these patients. Where one or more of these variables were missing or not in agreementwith the others, we prioritised Code of Commissioner and Code of PCT of GP practice over Code of PCT ofresidence, since we were primarily interested in the effects of investment in mental health services andjudged that these were more likely to indicate the organisations that commissioned care. Data on all PCTvariables (including Code of GP practice) were missing for just 3128 patients (0.2% of the sample). Noother information in the MHMDS could be used to identify PCTs for these patients and therefore thesepatient care spells were excluded from the analysis when PCT was included in multilevel models.
Provider trustThe Code of provider trust variable was present for all patients, since it is automatically derived at the timeof annual data submission. This meant that there was 100% certainty about where the patient receivedtheir mental health care during the care spell. Patients receive mental health care from providers,mainly NHS trusts but also a small number of independent sector providers. In total, there are 72 mentalhealth service providers (both NHS and independent sector) in the 2010/11 MHMDS. Independent sectorproviders are units registered with the Healthcare Commission to accept patients detained under the MHA198360 (as amended by the MHA 2007), as specified under Section 2(3)(b) of the Care Standards Act2000.61 These independent hospitals that are registered to receive detained patients are considered to be
METHODS
NIHR Journals Library www.journalslibrary.nihr.ac.uk
10

hospitals for the purposes of the MHA (2007). In contrast to NHS provider trusts, these independent sectorproviders were coded by the service provider company in the MHMDS and not by individual units oraccording to geographical location.
Strategic Health AuthorityThe SHA was derived from Code of provider trust, and was likewise present for all patients. There were10 SHAs in England in 2010/11. SHAs were responsible for improving health services in their local area andensuring these were of a high quality and performing well.
Data quality
Following preliminary data exploration, data from eight provider trusts were removed from subsequentanalysis. The three independent sector provider groups were excluded, since these were coded onlyby their corporate name and not by location, and because some of these units provided only secure,specialist inpatient treatment on transfer from other providers (i.e. the decision to admit the patientcompulsorily was made elsewhere and could not have been influenced by factors operating locally).Tavistock and Portman NHS Foundation Trust was excluded because it had neither inpatient beds norcompulsory admissions. Four additional providers (South West Yorkshire Partnership Trust, GatesheadHealth NHS Foundation Trust, Derbyshire County PCT and Oxford Health NHS Foundation Trust) wereexcluded because they had been discovered by HSCIC to have failed to return any data on patients’ legalstatus.59 Excluding these providers resulted in a 3.8% reduction in the size of the study from 1,287,730to 1,238,188.
In addition to missing and inconsistent PCT data, a number of other spatial identifiers were also subject todata-coding errors and missing data. LSOA was missing (i.e. not recorded by the provider when makingthe submission) for 11,479 patients in the study sample and Code of GP practice was missing for22,334 patients.
Given different levels of missing data across the spatial levels, the study sample size changed slightlydepending on the combination of spatial levels used for each statistical model. Specific details of thesample size and model used to address each research question will be outlined in Chapter 3.
Explanatory variables and data linkage
Individual level variablesThe MHMDS contained reasonably complete data on a limited number of (individual-level) patientcharacteristics, namely age, sex and ethnicity. Levels of missing data across these variables variedconsiderably, however: age was missing for 84 patients (< 0.01%); sex was missing for 454 patients(0.03%); and ethnicity was missing for 119,392 patients (9.6%).
Several other individual-level variables were not included in our analyses because there were high levels ofmissing data. For example, marital status was missing for almost 15% of patients and psychiatric diagnosiswas missing for around 81% of patients.59 Accommodation status was missing for 920,288 (64%) andemployment status was missing for 1,099,311 (75%) of all care spells. Recent clinical status (as measuredby the HoNOS) was recorded for only 25% of all patient care spells. Other information of potentialsalience to our research questions included medication history (e.g. use of antipsychotics), drug andalcohol use, family and household composition (including if a patient lives alone, or has children) and socialsupport were not recorded in the 2010/11 MHMDS. Although we were able to ascertain reliably whetheror not a patient had been admitted during the reporting period, we did not have information about thenumber of admissions per patient. The same consideration applied to ascertaining the number of
DOI: 10.3310/hsdr02490 HEALTH SERVICES AND DELIVERY RESEARCH 2014 VOL. 2 NO. 49
© Queen’s Printer and Controller of HMSO 2014. This work was produced by Weich et al. under the terms of a commissioning contract issued by the Secretary of State forHealth. This issue may be freely reproduced for the purposes of private research and study and extracts (or indeed, the full report) may be included in professional journalsprovided that suitable acknowledgement is made and the reproduction is not associated with any form of advertising. Applications for commercial reproduction should beaddressed to: NIHR Journals Library, National Institute for Health Research, Evaluation, Trials and Studies Coordinating Centre, Alpha House, University of Southampton SciencePark, Southampton SO16 7NS, UK.
11

compulsory admissions during the reporting period, or if a person was admitted to hospital voluntarily andsubsequently detained under the MHA.
The following section describes the external data sources that were linked to the MHMDS at differentspatial levels to facilitate the study of factors that influence variation in compulsory admissionacross England.
Linkage at lower layer super output area level
Population densityWe used Office for National Statistics (ONS) mid-2010 population estimates (derived from 2001 Censusdata) for linkage at LSOA level for two reasons: first, because MHMDS LSOA identifiers were based on the2001 Census classification; and, second, because the study began before the release of 2011 Census data,and relevant linkages and modelling had been completed by this time. To assess if this was likely to haveaffected our findings, we plotted mid-2010 population estimates against 2011 Census results (for all agesand ethnic groups) for 33,519 LSOAs and found a correlation of 0.898 (results available from authors).Population density data were set as missing for the 11,479 patients for whom LSOA information wasmissing (0.9% of study sample). Population density estimates for LSOAs were converted into categoriesbased on quintiles, with the lowest-density quintile serving as the reference category, as follows, innumber of people per hectare: 0.0–6.8, 6.9–24.0, 24.1–41.2, 41.3–61.4 and ≥ 61.5.
UrbanicityUrbanicity was defined using the ONS classification (www.ons.gov.uk/ons/guide-method/geography/products/area-classifications/rural-urban-definition-and-la/rural-urban-definition–england-and-wales-/index.html), based on LSOA of patient’s residence.
Area-level deprivationThe English Indices of Deprivation 201062 are 38 separate indicators recorded at LSOA level and used tocalculate the Index of Multiple Deprivation (IMD). These indicators reflect seven domains of deprivation,namely health and disability; living environment; income; employment; crime; education, skills and training;and barriers to housing and services. Only the overall summary IMD score was used. Those patients inthe study sample with missing data on their LSOA or those living in a LSOA in Wales (n= 12,437; 1.0%of study sample) were assigned a missing value for the IMD total score. A categorical variable for the IMDscore for each LSOA was then created by dividing the score into quintiles, with the least deprived quintileserving as the reference category.
Ethnic densityWe took the decision to delay the study analyses slightly to wait for 2011 Census ethnic populationestimates, given the large shift in the demographic composition of England between 2001 and 2011.63
Whereas mid-year estimates of LSOA (total) population sizes were highly correlated with the actualLSOA population sizes in the 2011 Census, there were no reliable mid-year estimates of LSOA ethniccomposition. The 2011 Census contains estimates for the ethnic composition of each LSOA in England andWales under several broad ethnic groups: white, black, Asian, mixed and other (www.ons.gov.uk/ons/guide-method/census/2011/index.html). There are minor differences between the LSOAs used in the 2001Census (and used in the MHMDS to identify the patient’s area of residence) and the 2011 Census.64 Theoverall number of LSOAs in England and Wales increased from 34,378 in 2001 (32,482 in England and1896 in Wales) to 34,753 in 2011 (32,844 in England and 1909 in Wales). This meant that linkage ofethnic density data from the 2011 Census to the MHMDS resulted in some missing data because ofchanges in boundaries and sizes of the LSOAs. In total, ethnic density was missing for 50,938 individuals(4.0% of the sample). For remaining individuals, a single continuous variable representing the proportionof adults reporting white ethnicity at the LSOA level served as the ethnic density indicator. This variablewas chosen in the light of evidence that white groups have the lowest risk of being compulsorily admittedto hospital.28–30 These data were negatively skewed (with some extreme outliers); overall, the majority of
METHODS
NIHR Journals Library www.journalslibrary.nihr.ac.uk
12

LSOAs across the country had a high proportion of residents who classified themselves as white British[mean percentage of white British residents across LSOAs was 79.26% (standard deviation 22.9%), range1–100%]. These data were therefore subsequently transformed into a five-category variable to representthe distribution of the data (representing LSOAs with very low to very high percentages of residents ofwhite British origin).
Linkage at primary care trust level
Investment in mental health servicesThe Department of Health sponsored the annual National Survey of Investment in Adult Mental HealthServices, an annual finance mapping exercise regarding spending on mental health services inEngland (www.gov.uk/government/publications/2010-11-working-age-adult-and-older-adult-national-survey-of-investment-in-mental-health-services). Data from 2010 provided details of investment in mentalhealth services for working age adults (aged 18–64 years) in England, by PCT (commissioner).
Using data on the population density of PCTs in conjunction with the investment survey data, wecalculated the level of investment (spend in pounds) per working member of the adult PCT populationaged 16–64 years, including spending on:
l all mental health servicesl accommodation servicesl continuing care servicesl personality disorder servicesl psychological therapies services [both Improving Access to Psychological Therapies (IAPT) and non-IAPT]l secure and high-dependency provisionl assertive outreach teaml community mental health teaml CRHT teaml early intervention in psychosis services.
Full investment survey data were available for the all PCTs in the MHMDS; however, as previously outlined,PCT of residence was missing for 63,402 patients (and was therefore also missing for the investmentsurvey data).
Linkage at provider trust level
Mental illness bed availability and occupancyThe numbers of available and occupied NHS mental illness and LD beds are available from the Department ofHealth [beds open overnight (BOO)], and are derived from aggregated quarterly KH03 returns (a quarterlycollection from all NHS organisations that operate beds; www.england.nhs.uk/statistics/statistical-work-areas/bed-availability-and-occupancy). This return includes beds in units managed by the provider, not bedscommissioned from other providers. In 2010, provider trusts submitted quarterly bed data returns(http://transparency.dh.gov.uk/2012/07/05/bed-availability-and-occupancy-overnight/) and these werecombined and averaged to derive annual estimates of:
l total number of available mental illness and LD bedsl total number of occupied mental illness and LD beds.
For the purposes of our analyses, we disaggregated data for mental illness and LD beds, since it waspossible that well-publicised pressures on mental illness beds18 might be offset by reduced LDbed occupancy.
It is important to note how the occupancy of mental illness beds is recorded in BOO.
DOI: 10.3310/hsdr02490 HEALTH SERVICES AND DELIVERY RESEARCH 2014 VOL. 2 NO. 49
© Queen’s Printer and Controller of HMSO 2014. This work was produced by Weich et al. under the terms of a commissioning contract issued by the Secretary of State forHealth. This issue may be freely reproduced for the purposes of private research and study and extracts (or indeed, the full report) may be included in professional journalsprovided that suitable acknowledgement is made and the reproduction is not associated with any form of advertising. Applications for commercial reproduction should beaddressed to: NIHR Journals Library, National Institute for Health Research, Evaluation, Trials and Studies Coordinating Centre, Alpha House, University of Southampton SciencePark, Southampton SO16 7NS, UK.
13

An occupied bed is defined as one which is occupied at midnight on a given day. A bed allocated to apatient on home leave is recorded as unavailable and therefore not occupied. If this same bed issubsequently made available for another patient, it will be then be recorded as available and occupied(once another patient occupies it). In this way, the official bed occupancy in BOO never exceeds 100%,65
despite reports that true occupancy (including beds occupied by those technically on leave) is often higherthan this.
Unlike other spatial levels (e.g. LSOA, PCT), there are no publicly available population density estimates forprovider trusts (HSCIC, March 2013, personal communication). Since it was not possible to determine thesize of the adult population that each provider trust served, we were unable to estimate the provision ofmental illness and LD beds relative to the local population size. Instead, we estimated bed occupancy asthe annual average percentage of available mental illness and LD beds which were occupied. Preliminarydescriptive analysis of these data revealed that the annual mean mental illness (but not LD) bed occupancyat provider trust level was 86.1% (standard deviation 6.1%), range 69.3–97.3%. This means that, basedon official bed data (and the method of counting occupancy), all of the provider trusts included in oursample were operating below full capacity. Complete BOO data at trust level were available (i.e. linkageresulted in no missing data).
Hospital Episode StatisticsHospital Episode Statistics (HES) is a data warehouse containing details of all admissions (includingcompulsory admissions), outpatient appointments and A&E attendances in England. It is a records-basedsystem that covers all NHS trusts in England, including acute hospitals, PCTs and mental health trusts.HES data are collected monthly and managed by the HSCIC. We obtained a subset of 2010/11 HES dataat provider trust level, namely:
l number of admission episodes by mental illness and LD specialities, specifically LD (700), adult mentalillness (710), child and adolescent psychiatry (711), forensic psychiatry (712), psychotherapy (713)and old age psychiatry (715)
l LOS in hospital.
Full HES data at trust level were available (i.e. linkage resulted in no missing data).
Patient Environment and Action Team dataThe Patient Environment and Action Team (PEAT) is an annual self-assessment of all inpatient health-caresites in England with more than 10 beds. Assessments are conducted by trusts and they are free to choosewhich staff members conduct the assessment. The National Patient Safety Agency (NPSA) recommendsinvolving patients as well as staff from estates and facilities, domestic, catering, nursing and dieteticdepartments. Some trusts also involve patient forum representatives. Results are fed back to the NPSA andshared with the NHS, Care Quality Commission (CQC), Monitor and the Department of Health. PEATassesses non-clinical aspects of patient care including environment, food, privacy and dignity. Scoresdemonstrate how well individual health-care providers believe they are performing in key areas includingfood, cleanliness, infection control and patient environment (including bathroom areas, décor, lighting,floors and patient areas). Scores range from 0 to 5, with higher scores indicating better performance foreach trust in that domain. Data are managed by the HSCIC and were available for 2010 (www.nrls.npsa.nhs.uk/patient-safety-data/peat/). PEAT scores were not available for one trust, resulting in missing data for3146 patients (0.3% of sample total).
Inpatient Service Users SurveyThe Mental Health Acute Inpatient Service Users Survey (2009) was conducted by the HealthcareCommission.66 This postal survey sought to find out about the inpatient experiences of people treated at64 NHS trusts providing mental health inpatient services.
METHODS
NIHR Journals Library www.journalslibrary.nihr.ac.uk
14

Patients were eligible to participate in the survey if they were aged 16–65 years, had stayed on anacute ward or a psychiatric intensive care unit for at least 48 hours between 1 July 2008 and31 December 2008 and were not current inpatients at the time of the survey. Trusts with fewer than1000 discharges in this period sampled all patients. Trusts with more than 1000 patients took aconsecutive sample of the 1000 most recently discharged service users within the sampling period1 July 2008 to 31 December 2008. Fieldwork took place between April and June 2009. A total of7527 people took part in the survey, amounting to a 28% response rate. There were 47 questionscovering 7 areas and 12 domains:
l introduction to the ward (one domain)l about the ward (one domain)l hospital staff (two domains)l your care and treatment (five domains)l your rights (one domain)l leaving hospital (one domain)l overall rating of inpatient experience (one domain).
Individual patient responses were combined at trust level on a scale of 0–100 (where 100 represents thebest possible response) and standardised for the age and sex of respondents, to ensure comparabilityacross trusts. These benchmarked data allowed trusts to be compared on each of the above domains, forwhich they were rated as better, worse or about the same as other trusts.67 In the absence of specifichypotheses about associations between individual domain scores and compulsory admission, we used the‘Overall’ domain as an indicator of trust performance in our multilevel models. Data were unavailable forfive trusts, resulting in missing data for 37,327 patients (2.9% of the sample).
Community Mental Health SurveyThe NHS Community Mental Health Service User Survey 2011 was conducted by the CQC.68 The surveyinvolved 65 NHS trusts in England (including combined mental health and social care trusts, foundationtrusts and PCTs that provide mental health services). The survey aimed to find out about the experiencesof people using mental health services in the community. Service users aged 16 years and over wereeligible if they were receiving specialist care for a mental health condition and had been seen by the trustbetween 1 July 2010 and 30 September 2010. Each trust compiled a list of all patients who attended theservice as community patients during this time period. A simple random sample of 900 patients wasselected from this list and the questionnaire was posted to these patients. Over 17,000 service usersresponded to the survey, a response rate of 33%.69 The questionnaire contained 45 questions coveringnine domains:
l health and social care workersl medicationsl talking therapiesl care co-ordinatorl care planl your care reviewl crisis carel day-to-day livingl overall rating of care in the last 12 months.
Individual patient responses were combined at trust level on a scale of 0–100 (where 100 represents thebest possible response) and standardised for the age and sex of respondents, to ensure comparabilityacross trusts. These benchmarked data allowed trusts to be compared on each of the above domains, andrated as better, worse or about the same as other trusts.50 In the absence of specific hypotheses aboutassociations between individual domain scores and compulsory admission, we used the ‘Overall’ domain as
DOI: 10.3310/hsdr02490 HEALTH SERVICES AND DELIVERY RESEARCH 2014 VOL. 2 NO. 49
© Queen’s Printer and Controller of HMSO 2014. This work was produced by Weich et al. under the terms of a commissioning contract issued by the Secretary of State forHealth. This issue may be freely reproduced for the purposes of private research and study and extracts (or indeed, the full report) may be included in professional journalsprovided that suitable acknowledgement is made and the reproduction is not associated with any form of advertising. Applications for commercial reproduction should beaddressed to: NIHR Journals Library, National Institute for Health Research, Evaluation, Trials and Studies Coordinating Centre, Alpha House, University of Southampton SciencePark, Southampton SO16 7NS, UK.
15

an indicator of trust performance in our multilevel models. Data were not available for three trusts in total,resulting in missing data for 18,736 patients (1.5% of the study sample).
Trust locationUsing information from NHS organisational look-up tables, all provider trusts were categorised accordingto whether their location was in London or outside London. We chose to include this variable on thegrounds that London is different from all other areas of England in terms of scale, extremes of affluenceand deprivation, and ethnic composition.
NHS staff surveyThe 2010 NHS staff survey is the eighth annual survey of NHS staff (www.cqc.org.uk/content/2010-nhs-staff-survey). The results of this survey help trusts to review and improve the experiences of theirstaff, enabling them to provide better care to patients. The survey covers a wide range of work relateddomains including workload, staff health and well-being, staff satisfaction with job, job performanceand communication among staff within the NHS. The staff survey response rates across providertrusts varied from 44–70%; at a summary level, however, full data were available for each trust.Given the very large number of survey items, the items in the list below were chosen a priori as salientto the research questions:
l per cent of staff feeling satisfied with the quality of work and patient care they deliverl per cent of staff agreeing that their role makes a difference to patientsl per cent of staff suffering work-related stress in last 12 monthsl per cent of staff experiencing physical violence from patients/relatives/members of the public in
last 12 monthsl per cent of staff reporting good communication between senior management and staffl per cent of staff able to contribute towards improvements at workl staff job satisfaction (score)l staff intention to leave jobs (score).
Strategies for analysis
The overarching aim of the project was to estimate variance in the prevalence of compulsory admissionin England at different spatial levels and to evaluate the extent to which this is explained by thecharacteristics of people (e.g. age, gender or ethnicity), places (e.g. deprivation) and health-careorganisations (e.g. mental illness bed numbers and occupancy).
An important objective of this project, however, was to undertake linkage to external data sources toprovide additional contextual information for each of the spatial levels in the MHMDS. For example, theMHMDS provides information on the LSOA (geographical area) in which the patient lives. This informationcan be used to determine what region of the country that person lives in but no additional informationabout that geographical area is contained in the MHMDS. The ONS, however, collects and records a widevariety of information for each LSOA including population size (from which population density can bederived) and ethnic composition (and, by derivation, ethnic density). By linking this type of information tothe MHMDS, we aimed to establish the conditions for estimating the effect of area-level characteristics(for example) on the risk of being involuntarily admitted to hospital. As explained in detail earlier,we undertook linkage to several external data sources.
Multilevel modelsAs outlined earlier, there are six discrete and identifiable spatial levels in the MHMDS at which variance inrates of involuntary admissions might occur. Multilevel modelling is a widely used method for analysingnested (or clustered) data because it mirrors the structure of the data to be analysed and allowsexplanation to be correctly assigned to the various ‘levels’ within the data set (e.g. individual, LSOA,
METHODS
NIHR Journals Library www.journalslibrary.nihr.ac.uk
16

provider trust). The structure of the MHMDS is complex, and the various spatial levels do not nest orcluster neatly within each other. For example, approximately two-thirds of LSOAs were not nestedcompletely within (i.e. served exclusively by) a single provider trust. This is known as a cross-classified datastructure and is illustrated schematically in Figure 1. This illustrates a three-level model with patients(level 1) nested within LSOA (level 2) and a non-nesting hierarchy between LSOA and provider trust(level 3). ‘Non-nesting’ is because LSOAs straddled provider trust boundaries and therefore more thanone provider trust delivered care to people living in some LSOAs. These level 2 and 3 units can beconceptualised as ‘classifications’: combinations of particular LSOAs and provider trusts. This classificationstructure is recorded for each individual within the data set. Ignoring cross-classification complexity wouldresult in incorrect estimates of area-level variance and biased estimations of statistical validity. We referto individuals, and the geographical or health-care areas with which they are associated, as ‘levels’ butit is important to acknowledge that variation across these levels takes into account this non-nested,cross-classified data structure. A fuller description of cross-classified models can be found elsewhere.70
The specification of multilevel models (MLMs) depends on the research question or hypothesis beingtested; details of these models are provided in Chapter 3, Results.
Despite the pre-eminence of MLwiN (MLwiN 2.27, Centre for Multilevel Modelling, Bristol, UK) as amultilevel modelling program, it has finite limitations in computational power (when the sample size isvery large) and model stability (when estimating more than three levels). Given the size of the database(∼1.2 million patients), we were aware that estimating cross-classified models with more than three spatiallevels would be difficult because of these program limitations.
Null modelsThe most basic MLM is the null model, which estimates the total variance in compulsory admission in thestudy sample, without the inclusion of any explanatory or potentially confounding variables. This varianceis equal to the sum of the variances at the different spatial levels. Further models can then be developedwhich attempt to reduce and explain this initial geographical variability in the rates of involuntaryadmission by including explanatory variables relating to the characteristics of individuals or the higher-levelgeographies (e.g. LSOA, provider trust).
We ran all permutations of four-level models (using combinations of individuals, LSOAs, GP practices,provider trusts and PCTs) to identify consistent cross-model patterns and compare goodness of fit.However, where model stability allowed, we included a fifth level (i.e. SHA) to ensure that we had derivedthe most parsimonious model for the data set. This stage provided an estimate of the variance incompulsory admission to hospital at these various different spatial levels, before characteristics of the givenlevels were taken into account. It also provided a clear rationale for building more complicated four-levelmodels with explanatory variables, ensuring that only spatial levels with significant proportions of variancewere considered for inclusion.
LSOA LSOA LSOA
Providertrust
Patients
Providertrust
Providertrust
FIGURE 1 An example of a cross-classified data structure.
DOI: 10.3310/hsdr02490 HEALTH SERVICES AND DELIVERY RESEARCH 2014 VOL. 2 NO. 49
© Queen’s Printer and Controller of HMSO 2014. This work was produced by Weich et al. under the terms of a commissioning contract issued by the Secretary of State forHealth. This issue may be freely reproduced for the purposes of private research and study and extracts (or indeed, the full report) may be included in professional journalsprovided that suitable acknowledgement is made and the reproduction is not associated with any form of advertising. Applications for commercial reproduction should beaddressed to: NIHR Journals Library, National Institute for Health Research, Evaluation, Trials and Studies Coordinating Centre, Alpha House, University of Southampton SciencePark, Southampton SO16 7NS, UK.
17

Markov chain Monte Carlo (MCMC) estimation methods were used to estimate the variance of ouroutcome variable across these geographic classifications (i.e. LSOA, provider trust, PCT, etc.). Analyses ofthe cross-classified multilevel data structure were undertaken using a logit link function to model thebinary response of compulsory admission (denoted by a ‘1’) or not (denoted by a ‘0’).71 Furthermore, weassumed that our binary observations were derived from an underlying continuous latent variable so that(in this case) compulsory admission to hospital under the MHA during 2010/11 (denoted by ‘1’) is assumedto occur after a certain threshold has been exceeded in the severity of illness. Level 1 variance on thislatent variable was the standardised logistic variance of π2/3= 3.29.71
The number of iterations used for each model depended on the number and arrangement of levels in thenull model, but this ranged from 500 to 100,000 iterations and was checked using the Raftery–Lewisdiagnostic.72 The mean variance estimate was recorded for each higher level along with the 95% credibleinterval. The total variation in each model was calculated by adding up the estimated variance at eachlevel, and the relative percentages occurring at the various spatial levels were calculated. A commonlyused statistic to compare the fit of alternative MLMs is the Bayesian deviance information criterion (DIC)goodness-of-fit statistic.73 The DIC compares alternative models based on a trade-off between the fitof the data to the model and the corresponding complexity of the model.74 It is considered analogous tothe Bayesian information criterion (BIC)75 or the Akaike information criterion (AIC)76 fit statistics for modelsestimated using MCMC. Models with lower DIC values are preferred to those with larger values and, as ageneral rule of thumb, a difference of 10 or more is considered to be substantial. The main limitation isthat the DIC value is comparable only across models with exactly the same observed data (nesting ofmodels, however, is not required).77 DIC statistics were therefore estimated using only cases that hadcomplete data for all of the model variables, to ensure identical samples.
Modelling and mapping residualsAfter selecting the optimal four-level null model (research aim 1), we controlled for basic demographiccharacteristics of the patient population served by the provider trust (i.e. individual age and sex) andexamined the provider trust-level residuals produced by the model. A residual at provider trust level isthe difference between the actual (observed) risk of compulsory admission and the risk predicted by the(age- and sex-adjusted) model. Positive residuals indicate that the model is underpredicting the risk ofadmission and negative residuals indicate that the model is overpredicting risk (compared with the actualrisk). Residual results were reported graphically in two ways: using ‘caterpillar’ plots [showing the rawresidual for each trust in rank order, as a point estimate with 95% confidence interval (CI) error bars] andby mapping the normal score of the residual (i.e. the normal deviates of each residual). Upper and lowerCIs were obtained by multiplying the standard error of each residual by 1.96 and adding and subtractingthis value from each estimate, respectively. Normal scores were used to allow comparison of residual sizeacross different models. To produce a digital map of the residual normal scores, we derived the postcodeof the provider trust headquarters and, using standard lookup tables available from The UK Data Service,62
we derived the associated National Grid co-ordinate for the postcode centroid. The normalised residualvalue and its associated co-ordinate were then ‘attached’ to a digital boundary of England and Wales(available from Edina Digimap Ordnance Survey Service) and mapped using ArcMap version 10.1(Redlands, CA, USA).63 This exercise was repeated for the fully adjusted, final model (research aim 2)as described next.
This was essentially an exploratory diagnostic tool designed to help us identify ‘missing’ explanatoryvariables, i.e. hypothetical variables whose existence might be posited to explain observed variance in thestudy outcome. If negative residuals are clustered together and positive residuals clustered together(i.e. model residuals are positively spatially auto-correlated), this would suggest a missing spatially clusteredexplanatory variable. If residuals are not spatially auto-correlated, then we would expect to find a randomarrangement of positive residuals and negative residuals and there will be no clustering. Such a findingwould direct us away from a search for a ‘missing’ explanatory spatial variable.
METHODS
NIHR Journals Library www.journalslibrary.nihr.ac.uk
18

Modelling explanatory variablesWe extended null MLM to include explanatory variables at different spatial levels. Our aim was to estimatethe effect of doing so on the variance in compulsory admission rates identified in our null models(including the residuals at provider trust level).
Extending the MLM in this way increased the complexity of the model and placed additional demandson the computing capacity of the statistical software MLwiN. Given the sample size and the potentialnumber of linked variables (from external data sources), multivariate models with more than three(cross-classified) levels proved unstable. For this reason, we had to choose the most important spatial levelsfor inclusion in these more complex models, and we did so this on the basis of our null model results.
Adding explanatory variables across one or more spatial levels allowed us to quantify the proportion ofvariance explained by these risk factors for compulsory admission. This involved modelling the predictedvalue of the (assumed) underlying continuous latent variable by using an equation with both fixed[intercept plus regression coefficient(s) for explanatory variable(s)] and random parts.78 The proportion ofvariance explained at, for example, level 1 was estimated as the proportion of total variance attributable tothe fixed part of a model that included individual-level explanatory variables, divided by the total variancein the underlying latent variable. The total variance is equal to the sum of the variances of the fixed partof the model and the (unexplained) variances at each of the higher levels. Variance terms were derivedfrom the MLwiN output.
Handling missing data
The issue of missing data in statistical modelling is both complex and important. This is because missingdata can be missing for a variety of reasons – often difficult to establish – which may or may not affectinferences drawn from the model. There are three main types of missing data: missing completely atrandom (MCAR), missing at random (MAR) and missing not at random (MNAR).79 MCAR data are thesimplest to understand, as missingness occurs by chance alone. MAR data occur when data are missingbecause of a particular factor, but not because of the missing value itself. If the missingness is dependenton the value of the missing value itself (such as a missing patient outcome due to the patient being too illto attend the clinic), the mechanism is MNAR. Principled methods to account for missing values exist butare dependent on the mechanism driving the missingness, and unfortunately no statistical tests exist todetermine the mechanism of missingness.
Levels of missing data varied substantially between variables in the study. At the individual level, forexample, patient age and sex data were almost fully complete, with less than 0.0004% missing data,whereas patient ethnicity data was missing for 9.6% of patients. It was unclear from the MHMDSspecification documents why there was such a high level of missing data for patient ethnicity (although,as previously outlined, even higher levels of missing data were common among many importantpatient-level variables such as diagnosis).
Among higher-level spatial identifiers, there were considerably lower levels of missing data at LSOA level(mainly because of missing data on the patient’s LSOA identifier in the MHMDS, rather than missingdata in the external data sources) and largely complete data at provider trust level. The patient surveyswere a notable exception: five provider trusts had no data for the 2009 Inpatient Service Users Survey andthree provider trusts had no data for the 2011 Community Mental Health Survey.
We considered two approaches to missing data: (1) restricting analyses to cases (patients) with completedata and (2) modelling the missing data as a separate category of exposure. A listwise deletion approachto missing data involves dropping any patient who has missing data on either the spatial-level identifiers(e.g. LSOA, GP practice, PCT or provider trust) or any explanatory variable (patient ethnicity, etc.), toremove the case from the analysis. This approach, known as complete case analysis, ensures that only
DOI: 10.3310/hsdr02490 HEALTH SERVICES AND DELIVERY RESEARCH 2014 VOL. 2 NO. 49
© Queen’s Printer and Controller of HMSO 2014. This work was produced by Weich et al. under the terms of a commissioning contract issued by the Secretary of State forHealth. This issue may be freely reproduced for the purposes of private research and study and extracts (or indeed, the full report) may be included in professional journalsprovided that suitable acknowledgement is made and the reproduction is not associated with any form of advertising. Applications for commercial reproduction should beaddressed to: NIHR Journals Library, National Institute for Health Research, Evaluation, Trials and Studies Coordinating Centre, Alpha House, University of Southampton SciencePark, Southampton SO16 7NS, UK.
19
those patients with complete and full data across all variables to be included in the MLM analyses areincluded in the model. This is a simple approach and is best used when the mechanism for missing data isMCAR. However, our data were not likely to be suitable for complete case analysis, as some variables maybe MNAR or MAR. Ethnicity is a good example. Although it is possible that patients from particular ethnicgroups (e.g. those of non-white ethnicity) did not declare their ethnicity (for example) because theybelieved that it would affect their treatment (MNAR), a more likely explanation is that trusts with littleethnic diversity among its patient population are less rigorous in identifying and recording this variable,since almost everyone is white (MAR).
Our approach involved retaining all cases and modelling missing data for each variable as a separatecategory. This is a commonly used practice in social science research when we suspect that themissing cases are not occurring in a random fashion (MNAR).80 This allowed us to determine how themissing group are behaving, but we are also able to use the non-missing characteristics of thoseobservations elsewhere in our model, optimising statistical power. The risk is that this approach mayresult in biased estimates of the model parameters.
Given the size of the data set, a simple sensitivity analysis was undertaken for ethnicity data byincorporating missing values into each of the other categories in turn (results available from authors). Thisallowed us to investigate whether or not the model was robust to the most extreme perturbations possibleby seeing what happened when we assumed that those with missing values belonged to one ethnic group(by pooling the missing data with each of these groups in turn). The odds ratios (ORs) for compulsoryadmission (compared with the reference group) were reduced across all model permutations. While the ORfor the white group had the smallest change overall, this was not unexpected, as it was also the largestgroup (over 80% of the sample). The OR for compulsory admission for the missing group was very small(0.2), i.e. indicating a rate of compulsory admission in this group that was five times lower than that of thewhite reference group. This further implies that these patients have different experiences from the otherethnic groups. Hence, these results reinforced the need to retain these cases in our models rather thanexclude them.
METHODS
NIHR Journals Library www.journalslibrary.nihr.ac.uk
20

Chapter 3 Results
Description of the study sample
As outlined in Chapter 2, Methods, the main outcome variable was compulsory admission to hospitalunder the MHA during the 2010/11 reporting period, compared with all other types of care (includinginformal hospital admission and community-only care). Table 2 shows the demographic characteristics forthe study sample by admission and treatment status.
TABLE 2 Characteristics of the study sample by admission and treatment status
Characteristic
Treatment and admission status in 2010/11 (n= 1,238,188)
Community care only1,133,541 (91.5%)
Voluntary admission only61,655 (5.0%)
Compulsory admission42,915 (3.5%)
Sex
Male 495,945 (43.7%) 31,739 (51.4%) 22,920 (53.4%)
Female 637,177 (56.2%) 29,972 (48.6%) 19,983 (46.6%)
Missing 419 (< 0.01%) 21 (< 0.01%) 12 (< 0.01%)
Age
< 18 years 20,861 (1.8%) 620 (1.0%) 402 (0.9%)
18–35 years 296,268 (26.1%) 16,219 (27.5%) 13,874 (32.3%)
36–64 years 455,252 (40.2%) 26,401 (42.7%) 20,006 (46.6%)
≥ 65 years 361,078 (31.9%) 17,733 (28.8%) 8633 (20.2%)
Missing 82 (< 0.01%) 759 (0.01%) 0
Ethnicity
White 911,292 (80.4%) 53,747 (87.1%) 32,130 (74.9%)
Mixed 11,965 (1.1%) 789 (1.3%) 1027 (2.4%)
Asian 41,780 (3.7%) 1993 (3.2%) 2771 (6.5%)
Black 32,116 (2.8%) 2168 (3.5%) 4965 (11.6%)
Other 19,992 (1.8%) 1009 (1.6%) 1052 (2.5%)
Missing 116,396 (10.2%) 2026 (3.3%) 970 (2.1%)
Marital status
Single 415,022 (36.6%) 26,579 (43.1%) 23,811 (55.5%)
Married 325,675 (28.7%) 16,219 (26.3%) 8541 (19.9%)
Divorced 66,619 (5.9%) 5024 (8.1%) 3529 (8.2%)
Widowed 122,866 (10.8%) 6102 (9.9%) 2984 (7.0%)
Separated 27,949 (2.5%) 2201 (3.6%) 1322 (3.1%)
Missing 175,410 (15.5%) 5607 (9.0%) 2728 (6.3%)
continued
DOI: 10.3310/hsdr02490 HEALTH SERVICES AND DELIVERY RESEARCH 2014 VOL. 2 NO. 49
© Queen’s Printer and Controller of HMSO 2014. This work was produced by Weich et al. under the terms of a commissioning contract issued by the Secretary of State forHealth. This issue may be freely reproduced for the purposes of private research and study and extracts (or indeed, the full report) may be included in professional journalsprovided that suitable acknowledgement is made and the reproduction is not associated with any form of advertising. Applications for commercial reproduction should beaddressed to: NIHR Journals Library, National Institute for Health Research, Evaluation, Trials and Studies Coordinating Centre, Alpha House, University of Southampton SciencePark, Southampton SO16 7NS, UK.
21

Approximately 3.5% of all patients in the MHMDS spent time in hospital during 2010/11 as compulsoryinpatients. A further 5.0% of patients spent time in hospital on a voluntary basis, that is they did not meetthe study criteria for compulsory admission. The vast majority of patients were treated in a communitysetting and did not require hospitalisation.
Null models (research aim 1)
The first research aim was to estimate and compare variance in the rate of compulsory admission acrossEngland during 2010/11 between people, places and health-care organisations. As described previously,cross-classified models with more than four levels proved unstable, and we therefore sought to explore allpermutations of four-level models. SHA was omitted from these models, as exploratory analyses suggestedlimited variance at this level that failed to reach statistical significance (details available from authors).
Table 3 shows permutations and sample sizes (excluding missing data) for the remaining four-levelcross-classified null models that included individual (patient) as the first level.
Table 4 shows the estimates of the variances for the risk of compulsory admission for individuals alongsidethe variance estimates for different permutations of four-level null models.
TABLE 2 Characteristics of the study sample by admission and treatment status (continued )
Characteristic
Treatment and admission status in 2010/11 (n= 1,238,188)
Community care only1,133,541 (91.5%)
Voluntary admission only61,655 (5.0%)
Compulsory admission42,915 (3.5%)
Regiona
North East 71,703 (6.4%) 3915 (6.5%) 2681 (6.4%)
North West 163,738 (14.6%) 9408 (15.6%) 6343 (15.2%)
Yorks and Humber 101,946 (9.1%) 5026 (8.3%) 3391 (8.1%)
East Midlands 107,096 (9.5%) 5183 (8.6%) 3296 (7.9%)
West Midlands 128,463 (11.4%) 6366 (10.6%) 3974 (9.5%)
East of England 107,533 (9.6%) 7757 (12.9%) 3439 (8.2%)
London 177,293 (15.8%) 9445 (15.7%) 11,264 (27.0%)
South East 157,329 (14.0%) 7715 (12.8%) 3948 (9.5%)
South West 108,921 (9.7%) 5343 (8.9%) 3235 (7.8%)
Wales 694 (< 0.01%) 148 (< 0.01%) 116 (< 0.01%)
Missing 8825 (< 0.01%) 1349 (2.2%) 1228 (2.9%)
Urbanicitya
Urban (> 10,000) 958,282 (85.2%) 52,165 (86.5%) 37,600 (90.2%)
Town and fringe 91,800 (8.2%) 4608 (7.6%) 2204 (5.3%)
Village and hamlet 74,634 (6.6%) 3533 (5.9%) 1883 (4.5%)
Missing 8825 (0.01%) 1426 (2.2%) 1228 (2.9%)
a Based on patient’s area of residence.
RESULTS
NIHR Journals Library www.journalslibrary.nihr.ac.uk
22

Overall, between 75.1% and 84.5% of the unexplained variance in this outcome was observed betweenindividuals; variance at LSOA level was estimated to be between 6.4% and 6.7%; unexplained varianceat PCT level ranged from 5.6% to 7.2%; GP-level variance was between 1.9% and 2.7% of the total;and the unexplained variance between provider trusts was estimated to be between 6.9% and 12.3%.The variance at each level was statistically significant (< 0.001). The biggest differences in these estimateswere observed between models 1 and 2, on the one hand, and models 3 and 4, on the other. When bothPCT and provider trust were included, there appeared to be a reduction in individual-level variance and anincrease in variance between provider trusts from about 7% to about 12%.
Spatial clustering of primary care trusts and provider trustsReasons for the differences in variance estimates when PCT and provider trust levels were both includedwere unclear. To investigate this further, we explored the distribution of PCTs and provider trusts.Although most provider trusts were associated with three or four local PCTs (commissioners) at most, someappeared to be treating (a few) patients from many different PCTs around the country. This was probablybecause of specialised tertiary care services, as well as movement of patients around the country forpersonal reasons.
In one-third of provider trusts, over 80% patients originated from a single PCT. Indeed, examination of thedata matrix mapping patient counts for all provider trusts against all PCTs revealed that about one-quarterof the cells had counts of 0 or 1. This could account for the decrease of variance at the individual level inmodels 3 and 4, as there may be possible conflation between individual and higher-level variances when
TABLE 3 Four-level null multilevel models, showing sample sizes after excluding cases with missing data
Models Sample size (n)
Model 1
Level 1 Individual 1,149,541
Level 2 LSOA
Level 3 GP practice
Level 4 PCT
Model 2
Level 1 Individual 1,207,916
Level 2 LSOA
Level 3 GP practice
Level 4 Provider trust
Model 3
Level 1 Individual 1,167,316
Level 2 LSOA
Level 3 PCT
Level 4 Provider trust
Model 4
Level 1 Individual 1,157,010
Level 2 GP practice
Level 3 PCT
Level 4 Provider trust
DOI: 10.3310/hsdr02490 HEALTH SERVICES AND DELIVERY RESEARCH 2014 VOL. 2 NO. 49
© Queen’s Printer and Controller of HMSO 2014. This work was produced by Weich et al. under the terms of a commissioning contract issued by the Secretary of State forHealth. This issue may be freely reproduced for the purposes of private research and study and extracts (or indeed, the full report) may be included in professional journalsprovided that suitable acknowledgement is made and the reproduction is not associated with any form of advertising. Applications for commercial reproduction should beaddressed to: NIHR Journals Library, National Institute for Health Research, Evaluation, Trials and Studies Coordinating Centre, Alpha House, University of Southampton SciencePark, Southampton SO16 7NS, UK.
23

the cell counts contain just one observation – a problem that is also exacerbated by the cross-classificationoccurring in the data structure.81,82 We therefore considered the estimates of higher-level variance inmodels 1 and 2 to be more reliable than those of models 3 and 4.
Comparing model fit using deviance information criterion statisticAs noted in Chapter 2, Methods, DIC statistics can be compared only when the sample used in eachmodel is exactly the same. The four null models were therefore re-estimated using complete cases only(i.e. by including only patient records that had complete data across LSOA, GP practice, PCT and providertrust; n= 1,149,541). This reduced the sample size but ensured that the DIC statistic could be used tocompare model fit (see Table 3). Results in Table 4 revealed that models 2 and 3 were superior to models1 and 4, with model 3 having a slightly better fit than model 2.
Given the greater reliability of estimates of higher level variances in models 1 and 2 (i.e. those models thatcontained either PCT or provider trust but not both together), we selected model 2 as the preferredfour-level model. This choice was strengthened by the a priori importance of provider trusts to the study ofcompulsory admission rates. Provider trusts deliver mental health care and are ultimately the locus at whichdecisions about whether or not an individual patient should be admitted to hospital compulsorily aremade. In the same vein, future interventions to reduce compulsory admission rates will almost certainlyhave to involve provider trusts.
TABLE 4 Results of four-level cross-classified null models for compulsory admission, showing estimates of variance(standard error) and proportion (%) of unexplained variance with (95% CIs) at each level, based on full sample andshowing DIC statistics for complete cases only
Model and levels Variance (standard error) p-value % unexplained variance (95% CI) DIC statistica
Model 1
Individual 3.29 84.5 322,505.7
LSOA 0.248 (0.008) < 0.001 6.4 (6.0 to 6.8)
GP 0.075 (0.004) < 0.001 1.9 (1.7 to 2.1)
PCT 0.280 (0.036) < 0.001 7.2 (5.5 to 8.9)
Model 2
Individual 3.29 83.7 321,749.2
LSOA 0.264 (0.010) < 0.001 6.7 (6.2 to 7.2)
GP 0.106 (0.005) < 0.001 2.7 (2.4 to 2.9)
Provider trust 0.271 (0.053) < 0.001 6.9 (4.3 to 9.5)
Model 3
Individual 3.29 75.1 321,392.94
LSOA 0.280 (0.008) < 0.001 6.4 (6.1 to 6.7)
PCT 0.271 (0.037) < 0.001 6.2 (4.5 to 7.8)
Provider trust 0.539 (0.104) < 0.001 12.3 (7.7 to 17.0)
Model 4
Individual 3.29 79.8 324,247.78
GP 0.108(0.004) < 0.001 2.6 (2.4 to 2.8)
PCT 0.230 (0.032) < 0.001 5.6 (4.1 to 7.1)
Provider trust 0.496 (0.096) < 0.001 12.0 (7.5 to 16.6)
a DIC statistic estimated using complete cases only (n= 1,149,541).
RESULTS
NIHR Journals Library www.journalslibrary.nihr.ac.uk
24

Estimating the effect of including Strategic Health Authority as a fifth levelin the null modelWe re-estimated the four-level model of choice (model 2) by including SHA as a fifth spatial level(model 2a) to test whether or not this improved model fit using data from the same number of patients.This meant that it was appropriate to use the DIC statistic to compare the fit of the models and tostatistically test whether or not including SHA as a spatial level enhances the model fit. The DIC statisticfor model 2 (336,537.7) was smaller than that of model 2a (336,538.2). The proportion of unexplainedvariance at SHA level was not statistically significant (2.4%, 95% CI 0.0% to 5.9%; χ2= 2.04; p= 0.15).SHA was therefore not considered for inclusion in further models.
Examining model residuals at provider trust level
We examined the model residuals at provider trust level using model 2 and adjusting (at the level ofindividuals) for patients’ age and sex. A residual (at provider trust level) is the difference between theactual risk of compulsory admission and the risk predicted by the model given the age and sexcomposition of each trust. Positive residuals indicate that the model is underpredicting the risk ofcompulsory admission, and negative residuals indicate that the model is over-predicting risk(compared with the actual risk).
Model residuals are portrayed graphically using a caterpillar plot (Figure 2), which shows the provider trustresiduals in rank order (with error bars representing 95% CIs). The horizontal line represents the averagerisk of compulsory admission across all provider trusts in England during 2010/11. Residuals are regardedas not differing from the average to a statistically significant extent if the error bar crosses zero(represented by the horizontal line). We can see from Figure 2 that 21 (out of 64) trusts had ratessignificantly higher than expected and 24 had rates significantly lower than the average, after accountingfor the age and sex profiles of patients attending the provider trusts. Overall, therefore, the observed rateof compulsory admission differed significantly from that predicted by the null model for 45 (70.3%) trusts,reflecting the limitation of a model that did not include any explanatory variables at higher spatial levels(i.e. adjusting only for age and sex at the individual level).
1.2
0.8
0.4
0.0
Co
ns
–0.4
–0.8
–1.2
–1.6
16 32Rank
48 64
FIGURE 2 Residual plots (with 95% CI error bars) for provider trust level variance (four-level cross-classified modelof individuals within LSOAs within GP practices within provider trusts, MCMC estimation adjusting for age and sex).Provider trust residuals are shown in rank order.
DOI: 10.3310/hsdr02490 HEALTH SERVICES AND DELIVERY RESEARCH 2014 VOL. 2 NO. 49
© Queen’s Printer and Controller of HMSO 2014. This work was produced by Weich et al. under the terms of a commissioning contract issued by the Secretary of State forHealth. This issue may be freely reproduced for the purposes of private research and study and extracts (or indeed, the full report) may be included in professional journalsprovided that suitable acknowledgement is made and the reproduction is not associated with any form of advertising. Applications for commercial reproduction should beaddressed to: NIHR Journals Library, National Institute for Health Research, Evaluation, Trials and Studies Coordinating Centre, Alpha House, University of Southampton SciencePark, Southampton SO16 7NS, UK.
25

Figure 2 shows the full distribution of rates of compulsory admission at provider trust level, and thedifference between each of these values and the overall model average. Model residuals at provider trustlevel were also plotted on a map of England to try to ascertain if there was spatial clustering of negative orpositive residual values (Figure 3). The circles on this map represent provider trust-level residuals; the size ofthe circle reflects the size of the residual and the colour indicates whether the provider trust is located inan area that has a risk of admitting patients to hospital under the MHA similar to the national average(black), statistically significantly lower than the national average (blue shades) or statistically significantlyhigher than the national average (green shades).
The map in Figure 3 suggests that, in general, there is no strong spatial auto-correlation across theresiduals (i.e. clustering of same sign residuals). For example, there is certainly no evidence of anorth–south divide in model residuals or a strong suggestion of an urban–rural divide. There is, however,a tendency for larger positive residuals to be found across London and parts of the North West
1.00 to 2.42Newcastle upon Tyne
Darlington
Harrogate
HullLeedsBradfordPreston
Doncaster
SheffieldOldhamManchester
LiverpoolWarrington
ChesterStoke-on-Trent
Derby Nottingham
Leicester
Northampton
Cambridge
Norwich
IpswichMilton Keynes
LondonSwindon
Gloucester
Reading
Hereford
Worcester
Dudley
Southampton
PortsmouthBournemouth
Plymouth
ExeterBrighton
Southend
0.60 to 1.00
0.40 to 0.60
– 0.30 to 0.40
– 0.60 to – 0.30
– 1.00 to – 0.60
– 2.42 to – 1.00
Adjusted residual
Birmingham
FIGURE 3 Provider trust standardised residual values (adjusted for patient age and sex) mapped geographically.
RESULTS
NIHR Journals Library www.journalslibrary.nihr.ac.uk
26

(e.g. Chester and Manchester). This indicates that trusts in these areas have rates of compulsory admissionwhich are significantly higher than the national average (given their age and sex composition). Largerresiduals are also present around the urban areas of the West Midlands but the residuals here are bothpositive and negative, suggesting that the urban penalty is not consistently evidenced in this region.A similar pattern is shown around the urban areas of the South West, where Southampton appears tohave rates lower than expected whereas rates are higher than expected around Portsmouth. Furthermore,urban areas are not always associated with significantly larger residuals; rates around Newcastle and Leeds,for example, are similar to the overall national average rate of compulsory admission.
Modelling explanatory variables (research aim 2)
The second research question advances upon the first by exploring the extent to which variance in rates ofcompulsory detention rates are explained by:
l the individual characteristics of people using services (e.g. age, sex and ethnicity)l the local area (i.e. contextual) socioeconomic and sociodemographic factors (e.g. small area
socioeconomic deprivation, urbanicity and ethnic density)l the features of local mental health services (e.g. bed availability, number of admissions, LOS
in hospital).
As noted previously, multivariate models with more than three spatial (cross-classified) levels provedunstable. We therefore selected the most important spatial levels for inclusion in these more complexmodels. We did this on the basis of our null models, and following the a priori view that individual andprovider trust were essential to any model: the former because this was the level at which most varianceoccurred, and the latter because it represented the (most distal) locus at which compulsory admissionsdecisions were made. We opted to include LSOA because this offered the greatest scope for modelling theeffects of area-level effects, including population and ethnic density as well as socioeconomic deprivation.These levels had the further advantage of having a large amount of externally linked data. Details ofthe explanatory variables included at each spatial level are provided next. The choice of explanatoryvariables was constrained by model stability and the need to include a reasonable number and breadth ofvariables at each level.
Individual-level variables:
l patient sex – binary coded with women as reference groupl current age, in four-categories – under 18 years (reference group), 18–35 years, 36–64 years and
65 years or olderl ethnicity – white (reference group), black, Asian, mixed, other.
Lower layer super output area-level variables:
l population densityl ethnic densityl area deprivation.
Provider trust-level variables:
l mental illness bed occupancyl number of finished consultant admission episodesl overall performance of community mental health servicesl overall performance of inpatient mental health servicesl percentage of staff feeling satisfied with the quality of work and the patient care that they are able to deliver
DOI: 10.3310/hsdr02490 HEALTH SERVICES AND DELIVERY RESEARCH 2014 VOL. 2 NO. 49
© Queen’s Printer and Controller of HMSO 2014. This work was produced by Weich et al. under the terms of a commissioning contract issued by the Secretary of State forHealth. This issue may be freely reproduced for the purposes of private research and study and extracts (or indeed, the full report) may be included in professional journalsprovided that suitable acknowledgement is made and the reproduction is not associated with any form of advertising. Applications for commercial reproduction should beaddressed to: NIHR Journals Library, National Institute for Health Research, Evaluation, Trials and Studies Coordinating Centre, Alpha House, University of Southampton SciencePark, Southampton SO16 7NS, UK.
27

l PEAT privacy and dignity scorel median LOS in hospital (days) across consultant specialities (700–715)l trust location (in London or outside London).
We began by estimating the main three-level null model comprising individuals, LSOAs and provider trusts(model 5). The model was then extended by including:
l individual-level patient characteristics (model 6)l individual- and LSOA-level characteristics (model 7)l individual-, LSOA- and provider trust-level characteristics (model 8).
The null model (Table 5) results indicate that 8.3% of the variance in compulsory detentions occurred at theLSOA level and 7.0% occurred at provider trust level; the remaining variance occurred at the individual level(model 5). In building the fully adjusted models, we estimated that the individual-level risk factors includedin this study explained 8.0% of the risk of being compulsorily admitted, whereas LSOA- and providertrust-level variables each explained 1.1% of the total variance in the compulsory admission rate. Our resultsalso indicate that adjusting for explanatory variables at these three spatial levels had little impact on therelative distribution of unexplained variance. Overall, the inclusion of explanatory variables increasedthe proportion of unexplained variance occurring at the individual level (from 84.7% in the null model to87.6% in the fully adjusted model), with a commensurate reduction in unexplained variance at the providertrust level (from 7.0% to 5.2%). The unexplained variance at LSOA level fell slightly, from 8.3% to 7.5%.
TABLE 5 Variance, percentage of unexplained variance at the individual, LSOA and provider trust levels in the riskof compulsory admission in the null model, and percentage of variance explained on including explanatoryvariables at each spatial level
Model and levelsVariance(standard error) p-value
% unexplainedvariance (95% CI) % variance explained
Sample size(% study sample)
Model 5 (null)
Individual 3.29 84.7 N/A 1,226,709 (99.1)
LSOA 0.323 (0.009) < 0.001 8.3 (7.9 to 8.8)
Trust 0.271 (0.051) < 0.001 7.0 (4.4 to 9.6)
Model 6 (+ individual-level variables)
Individuala 3.29 86.9 8.0 1,226,252 (99.0)
LSOA 0.284 (0.007) < 0.001 7.5 (7.1 to 7.9)
Trust 0.213 (0.039) < 0.001 5.6 (3.6 to 7.6)
Model 7 (+ individual- and LSOA-level variables)
Individuala 3.29 87.2 9.1 1,185,912 (95.8)
LSOAb 0.280 (0.009) < 0.001 7.4 (7.0 to 7.9)
Trust 203 (0.039) < 0.001 5.2 (3.3 to 6.9)
Model 8 (+ individual-, LSOA- and provider trust-level variables)
Individuala 3.29 87.6 10.2 1,182,847 (95.5)
LSOAb 0.283 (0.008) < 0.001 7.5 (7.1 to 7.9)
Trustc 0.195 (0.045) < 0.001 5.2 (2.8 to 7.5)
N/A, not applicable.a Age, sex, ethnicity.b Deprivation, population density, ethnic density.c Bed capacity, median LOS in hospital, performance community mental health services, performance inpatient mental
health services, number of admissions, PEAT dignity score, % staff feeling satisfied with the quality of work andpatient care they deliver, trust location.
RESULTS
NIHR Journals Library www.journalslibrary.nihr.ac.uk
28

Associations between explanatory variables andcompulsory admission
We extended our analyses by estimating associations between the explanatory variables used in ouradjusted models and the risk of compulsory admission. Since running each model required severalthousand iterations, these were computationally demanding and often took several hours to run. It wasnot possible, therefore, to estimate unadjusted associations for each of the study variable. We did just this,however, for two variables – the number of mental illness beds in each provider trust, and mental illnessbed occupancy – given previous evidence of, and concerns about, the association between the availabilityof mental illness beds and rates of compulsory admission.5 We estimated associations with compulsoryadmission by re-estimating the three-level model, controlling just for patient age and sex and for eachof these trust-level variables in turn. We found statistically significant associations with each of thesevariables, although that for mental illness beds (OR 1.0009, 95% CI 1.0006 to 1.0012; p< 0.001) wassmaller than that found between bed occupancy and compulsory admission (OR 1.03, 95% CI 1.02 to1.04; p< 0.0001). We therefore used only the latter in our fully adjusted models.
Table 6 shows the odds ratios for the fully adjusted associations between each of the explanatory variablesand compulsory admission in the fully adjusted three-level cross-classified model (model 8). These findingsshow that men have a higher probability of being compulsorily admitted to hospital than women(OR 1.29, 95% CI 1.27 to 1.31). Patients who were 18 years old or younger were the least likely to beadmitted compulsorily; compared with this group, the risk of compulsory admission was greatest amongthose aged 18–35 years (OR 1.92, 95% CI 1.82 to 2.02) and fell with age, but remained statisticallysignificant even in the oldest age group (65 years and older) (OR 1.12, 95% CI 1.02 to 1.22). Adult blackpatients had the highest rate of compulsory admission (OR 2.94, 95% CI 2.90 to 2.98). Patients of Asianand mixed ethnicity were significantly more likely to have been admitted compulsorily than the whitereference group. Compared with white patients, adults whose ethnicity data were not available in theMHMDS (i.e. coded as ‘missing’) had a significantly lower probability – around four times lower – of beingadmitted compulsorily.
After adjusting for all of the other variables in Table 6, compulsory admission was associated witharea-level deprivation in a manner which strongly suggested a dose–response effect. ORs for compulsoryadmission rose steadily, with deprivation score quintiles from 1.14 (95% CI 1.09 to 1.18) for those living inareas in the second-lowest quintile, to 1.22 (95% CI 1.18 to 1.27) for those in areas with deprivationscores in the top quintile (most deprived). We did not find a statistically significant association betweencompulsory admission and population density. However, the association between compulsory admissionand ethnic density was statistically significant and appeared to show a dose–response effect, with patientsliving in LSOAs composed of higher proportions of white British residents having lower risks of beingadmitted compulsorily.
After adjusting for the other study variables, no statistically significant associations were found betweencompulsory admission and bed capacity (average bed occupancy), median LOS, annual number ofadmissions or PEAT privacy and dignity scores. Similarly, there was no statistically significant difference inthe rate of compulsory admission in London trusts from those located outside the capital. Only oneof the provider trust-level covariates included in the model was a statistically significant predictor ofcompulsory admission after adjusting for all of the study variables. Patients receiving care from a providertrust whose community mental health services were rated as ‘same as other trusts’ in the national surveyof community mental health services were almost twice as likely to be admitted compulsorily as patientsreceiving care from providers rated as ‘worse than other trusts’ (OR 1.93, 95% CI 1.39 to 2.48).
DOI: 10.3310/hsdr02490 HEALTH SERVICES AND DELIVERY RESEARCH 2014 VOL. 2 NO. 49
© Queen’s Printer and Controller of HMSO 2014. This work was produced by Weich et al. under the terms of a commissioning contract issued by the Secretary of State forHealth. This issue may be freely reproduced for the purposes of private research and study and extracts (or indeed, the full report) may be included in professional journalsprovided that suitable acknowledgement is made and the reproduction is not associated with any form of advertising. Applications for commercial reproduction should beaddressed to: NIHR Journals Library, National Institute for Health Research, Evaluation, Trials and Studies Coordinating Centre, Alpha House, University of Southampton SciencePark, Southampton SO16 7NS, UK.
29

TABLE 6 Adjusted ORs for the associations with explanatory variables in model 8
Level Explanatory variables OR (95% CI) p-value
Level 1 (individual) Sex Male 1.29 (1.27 to 1.31) < 0.0001
Age (vs. ≤ 18 years) 18–35 years 1.92 (1.82 to 2.02) < 0.0001
36–64 years 1.79 (1.68 to 1.89) < 0.0001
65 years and older 1.12 (1.02 to 1.22) 0.03
Ethnicity (vs. white) Missing 0.25 (0.18 to 0.32) < 0.0001
Mixed 1.81 (1.74 to 1.88) < 0.0001
Asian 1.41 (1.37 to 1.46) < 0.0001
Black 2.94 (2.90 to 2.98) < 0.0001
Other 1.00 (0.93 to 1.07) 0.96
Level 2 (LSOA) Deprivation First quintile (least deprived) 1.00
Second quintile 1.14 (1.09 to 1.18) < 0.0001
Third quintile 1.20 (1.16 to 1.24) < 0.0001
Fourth quintile 1.21 (1.17 to 1.26) < 0.0001
Fifth quintile (most deprived) 1.22 (1.18 to 1.27) < 0.0001
Population density(people/hectare)
First quintile (0–6.8) 1.00
Second quintile (6.9–24.0) 1.02 (0.97 to 1.07) 0.52
Third quintile (24.1–41.2) 1.04 (0.99 to 1.09) 0.11
Fourth quintile (41.3–61.4) 1.01 (0.96 to 1.06) 0.78
Fifth quintile (≥ 61.5) 1.01 (0.95 to 1.07) 0.76
Ethnic density (% white British) 95–100 1.00
81–94 1.14 (1.10 to 1.18) < 0.0001
68–80 1.28 (1.23 to 1.34) < 0.0001
22–67 1.40 (1.34 to 1.46) < 0.0001
1–21 1.51 (1.43 to 1.59) < 0.0001
Level 3(provider trust)
Bed occupancy % of occupied mentalillness beds
1.01 (0.99 to 1.03) 0.14
LOS Median LOS (days) 0.99 (0.98 to 1.01) 0.13
Community mental healthservices survey
Worse than other trusts 1.00
Same as/better thanother trusts
1.93 (1.39 to 2.48) 0.02
Missing 1.12 (0.21 to 2.03) 0.34
Inpatient survey Worse than other trusts 1.00
Same as/better thanother trusts
1.01 (0.56 to 1.45) 0.97
Missing 1.45 (0.66 to 2.24) 0.35
PEAT survey Privacy and dignity score 1.18 (0.67 to 1.69) 0.53
Staff survey % satisfied with qualityof care
0.99 (0.97 to 1.02) 0.50
Admissions Hospital admissions(cat 700–715)
1.00 (1.00 to 1.00) 0.65
Trust location In London 1.00
Outside London 0.74 (0.32 to 1.17) 0.17
RESULTS
NIHR Journals Library www.journalslibrary.nihr.ac.uk
30

Residuals at provider trust level in the fully adjusted model
The final stage in our analyses involved examining provider trust residuals for the fully adjusted three-levelmodel (model 8). One provider trust was excluded from model 8 because its data on the PEAT privacy anddignity score were completely missing. The residual plot therefore compared 63 provider trusts in terms oftheir rate of compulsory admission compared with the national average. When controlled for all of theexplanatory variables in this model, 10 provider trusts had rates of compulsory admission to hospital thatwere lower than the national average to a statistically significant extent, and 10 provider trusts had ratesthat were significantly higher (Figure 4). This compares with 24 provider trusts that had statisticallysignificantly lower detention rates than the mean detention and 21 that had significantly higher rates,when only patient age and sex were accounted for (see Figure 2).
Fully adjusted, standardised model residuals were mapped to explore spatial clustering of negative orpositive values (Figure 5), and to compare this with the map based on the null model (see Figure 3). Againthere appeared to be no evidence of spatial auto-correlation amongst the residuals derived from the fullyadjusted model. As before, there was no strong suggestion of an urban effect. Large positive and negativeresiduals were found in the urban cores, and some urban areas had non-significant residuals.
1.2
0.8
0.4
0.0
Res
idu
al
–0.4
–0.8
–1.2
–1.6
160 32Rank
48 64
FIGURE 4 Residual plots (with 95% CI error bars) for provider trust-level variance (three-level cross-classified modelof individuals within LSOAs within provider trusts, MCMC estimation adjusting for explanatory variables inmodel 8). Provider trust residuals are shown in rank order.
DOI: 10.3310/hsdr02490 HEALTH SERVICES AND DELIVERY RESEARCH 2014 VOL. 2 NO. 49
© Queen’s Printer and Controller of HMSO 2014. This work was produced by Weich et al. under the terms of a commissioning contract issued by the Secretary of State forHealth. This issue may be freely reproduced for the purposes of private research and study and extracts (or indeed, the full report) may be included in professional journalsprovided that suitable acknowledgement is made and the reproduction is not associated with any form of advertising. Applications for commercial reproduction should beaddressed to: NIHR Journals Library, National Institute for Health Research, Evaluation, Trials and Studies Coordinating Centre, Alpha House, University of Southampton SciencePark, Southampton SO16 7NS, UK.
31

Newcastle upon Tyne
Darlington
Harrogate
HullLeedsBradford
Preston
DoncasterSheffield
ManchesterLiverpool
Chester Stoke-on-Trent
Derby
Nottingham
Leicester
NorthamptonCambridge
Norwich
Ipswich
Milton Keynes
London
Swindon
Gloucester
Coventry
Reading
Hereford
WorcesterBirmingham
Plymouth
Dorchester
Southampton
ExeterBrighton
Southend
1.00 to 2.42
0.60 to 1.00
0.40 to 0.60
– 0.30 to 0.40
– 0.60 to – 0.30
– 1.00 to – 0.60
– 2.42 to – 1.00
Normal scoreof residual
BournemouthPortsmouth
FIGURE 5 Provider trust residual values (adjusted for all explanatory variables in model 8) mapped geographically.
RESULTS
NIHR Journals Library www.journalslibrary.nihr.ac.uk
32

Association between primary care trust investment andcompulsory admission
As previously outlined in Chapter 3, the four-level cross-classified null model results showed that asignificant percentage of the variance in compulsory admission, of the order of 7%, occurred at PCT level.As noted previously, model results and further examination of the data structure suggested that modelsthat included both PCT and provider trust may have been prone to conflation of individual and higher-levelvariances, and that the latter may not have been reliable. However, we felt that it was desirable to assessthe association between investment in mental health services by commissioners (PCTs) and the rate ofcompulsory admission. As outlined in Chapter 2, Methods, we established linkage to data on investment inadult mental health services by PCTs in England in 2010. We selected the following variables, as spend inpounds per adult of working age (16–65 years):
l total reported investment in all mental health servicesl total spend on assertive outreach teamsl total spend on community mental health teamsl total spend on CRHTs.
Since investment in specific services (e.g. CRHT) was included in the overall total reported investment in allmental health services, it was necessary to estimate two separate models, one with the overall adjustedspend on all mental health services and the other with the three specialised services of interest (CRHT,community teams and assertive outreach). These services were chosen on the grounds that they targetpatients at high risk of admission, and might therefore be viewed as providing alternatives to admission.
Given the potential instability of multivariate models with more than three spatial levels, we reverted to athree-level model. For the purposes of these analyses we retained individual and LSOA levels, and specifiedPCT as the highest spatial level. The explanatory variables of interest at individual level and LSOA levelwere the same as those specified previously, namely patient sex, age and ethnicity (at individual level) andpopulation density, deprivation and ethnic density (at LSOA level). PCT explanatory variables were asspecified above (Table 7).
In the three-level (individual, LSOA and PCT) null model (model 9), 7.3% of the (unexplained) variancein compulsory admission occurred at LSOA level and 6.9% occurred at PCT level. The percentage ofvariance explained in the rate of compulsory admission to hospital by these models was around 9.0%,and nearly all of this was the result of including individual- and LSOA-level explanatory variables. Almostno additional variance was explained when PCT investment variables were included in the model. DICstatistics (based on identical samples) indicate that there were no substantial differences between the fitof models 10, 11 and 12. These results confirm that, compared with model 10, the inclusion of PCTinvestment variables (models 11 and 12) did not increase model fit. We note that there was a smalldifference between models 11 and 12 (DIC value difference 12.2), although neither represented animprovement on model 10.
We found only limited evidence of statistically significant associations between PCT investment in mentalhealth services and compulsory admission. In model 11, total investment in mental health services wasnot significantly associated with compulsory admission (OR 1.0009, 95% CI 0.999 to 1.0025; p= 0.32).In model 12, the association with investment in community mental health teams reached statisticalsignificance, although the effect size was small (OR 1.01, 95% CI 1.00 to 1.02; p= 0.03). Investments inassertive outreach teams (OR 0.97, 95% CI 0.93 to 1.02; p= 0.39) and CRHTs (OR 0.99, 95% CI 0.97to 1.01; p= 0.55) were not statistically significant.
DOI: 10.3310/hsdr02490 HEALTH SERVICES AND DELIVERY RESEARCH 2014 VOL. 2 NO. 49
© Queen’s Printer and Controller of HMSO 2014. This work was produced by Weich et al. under the terms of a commissioning contract issued by the Secretary of State forHealth. This issue may be freely reproduced for the purposes of private research and study and extracts (or indeed, the full report) may be included in professional journalsprovided that suitable acknowledgement is made and the reproduction is not associated with any form of advertising. Applications for commercial reproduction should beaddressed to: NIHR Journals Library, National Institute for Health Research, Evaluation, Trials and Studies Coordinating Centre, Alpha House, University of Southampton SciencePark, Southampton SO16 7NS, UK.
33

TABLE 7 Results of three-level cross-classified models assessing the association between investment in adult mentalhealth services and compulsory admission, showing estimates of variance (standard error) and proportion ofunexplained variance (95% CIs), proportion of variance explained (versus null model) after inclusion of explanatoryvariable and DIC statistics
Model and levelsVariance(standard error) p-value
% unexplainedvariance (95% CI)
% variance explained(vs. model 9) DIC statistic
Model 9 (null model, no explanatory variables)
Individual 3.29 N/A
LSOA 0.287 (0.008) < 0.001 7.3 (6.8 to 7.7)
PCT 0.288 (0.036) < 0.001 6.9 (5.0 to 8.7)
Model 10 (individual + LSOA variables)
Individual 3.29 9.2 311,504.3
LSOA 0.256 (0.008) < 0.001 6.8 (6.4 to 7.2)
PCT 0.211 (0.028) < 0.001 5.9 (4.4 to 7.2)
Model 11 (individual + LSOA variables + total PCT investment)
Individual 3.29 9.3 311,513.1
LSOA 0.258 (0.008) < 0.001 6.9 (6.4 to 7.3)
PCT 0.212 (0.027) < 0.001 5.6 (4.2 to 7.0)
Model 12 (individual + LSOA variables + PCT investment by service)
Individual 3.29 9.3 311,500.9
LSOA 0.259 (0.007) < 0.001 6.7 (6.4 to 7.1)
PCT 0.211 (0.028) < 0.001 5.9 (4.2 to 7.6)
N/A, not applicable.
RESULTS
NIHR Journals Library www.journalslibrary.nihr.ac.uk
34

Chapter 4 User involvement
Two groups of users were involved and consulted in the course of the study: users of mental healthservices and those with experience of caring for people with serious mental illness (through partnership
with the Mental Health Foundation); and potential users of the evidence arising from the research,in the form of senior NHS mental health service managers and clinicians (via the Mental Health Networkof the NHS Confederation).
Service user and carer involvement
Service user and carer involvement was undertaken in partnership with the Mental Health Foundation,and was led by DC-K.
Mental Health FoundationThe Mental Health Foundation (MHF) (www.mentalhealth.org.uk) is the UK’s leading mental healthresearch, policy and service improvement charity. Service user involvement was coordinated by DC-K, Headof Empowerment and Social Inclusion at the MHF (and co-applicant on this project). The main aim of thispartnership was to ensure meaningful patient and public involvement (PPI) such that the service userperspective shaped the research questions, influenced analysis and interpretation, and assisted indisseminating the findings.
BackgroundThis aspect of the project comprised three meetings with people with direct personal experience ofcompulsory admission, or of caring for someone who had been admitted compulsorily. These meetingswere held at key points during the research process and focused on relevant issues at each stage ofthe project.
AimsThe aim of the first meeting was to seek service user input into the analysis by encouraging service users tosuggest reasons for different rates of compulsory admission. The intention was to use the content of thesediscussions to guide the researchers, particularly in selecting explanatory variables through data linkage.
The second meeting was used to reflect on interim findings and help guide their interpretation byexploring experiences of compulsory admission, including those that occur before, during and after theinpatient spell, upon discharge. At the third meeting, people examined how the study findings might beused to reduce rates and variability of compulsory admission, and improve service user experiencesin future.
Methods
RecruitmentThe aim was to recruit an expert group of at least five or six people who had personal experience ofcompulsory admission and/or of caring for someone who had been detained. The study was advertisedthough the MHF mental health policy network and the National Survivor User Network (NSUN). Beingmindful of the importance of the issue of ethnic variation in compulsory admissions, it was a priority toensure the PPI groups were ethnically diverse. We were also very determined to ensure heterogeneity interms of geography, gender and age. A number of recruitment strategies were therefore employed,and these evolved in the light of the experience of the first two groups.
DOI: 10.3310/hsdr02490 HEALTH SERVICES AND DELIVERY RESEARCH 2014 VOL. 2 NO. 49
© Queen’s Printer and Controller of HMSO 2014. This work was produced by Weich et al. under the terms of a commissioning contract issued by the Secretary of State forHealth. This issue may be freely reproduced for the purposes of private research and study and extracts (or indeed, the full report) may be included in professional journalsprovided that suitable acknowledgement is made and the reproduction is not associated with any form of advertising. Applications for commercial reproduction should beaddressed to: NIHR Journals Library, National Institute for Health Research, Evaluation, Trials and Studies Coordinating Centre, Alpha House, University of Southampton SciencePark, Southampton SO16 7NS, UK.
35

The first meeting focused particularly on recruiting people from BME groups by targeting specialist BMEgroups. This meeting was held in London in August 2012. Given the preponderance of participants fromLondon and the South East at the first meeting, we sought greater geographical and demographicdiversity at the second meeting. We recruited via national networks and held the meeting at WarwickUniversity (near Coventry) in March 2013. The third meeting consisted of participants from the first andsecond meetings and was also held at Warwick University in July 2013.
ParticipantsTwenty people were recruited and participated in one or more meetings: 17 participants had been admittedcompulsorily under the MHA (two of whom also had experiences of caring for someone who had beenadmitted compulsorily) and one person had carer experience only. Most participants were women (Table 8).There was a reasonable spread of ages and participants derived from a diverse ethnic and geographicalbackground. Participants had experience of being detained under various sections of the MHA.
TABLE 8 Demographic profile of PPI services users (n= 17)
Demographic characteristic n
Sex Male 5
Female 10
Not disclosed 5
Age group (years) 26–35 5
36–45 4
46–55 5
56–65 1
66–75 2
Not disclosed 3
Ethnicity White 10
Mixed 1
Asian 2
Black 3
Not specified 4
Geographical location London 10
Yorkshire 2
Cheshire 1
Manchester 1
Birmingham 2
Cambridgeshire 1
Oxfordshire 1
Hampshire 2
Detention related to sectionof MHA
Section 2 4
Section 3 2
Section 4 1
Section 17 2
Section 52 1
Section 136 3
Not disclosed 4
USER INVOLVEMENT
NIHR Journals Library www.journalslibrary.nihr.ac.uk
36

Results
Meeting 1: exploring factors that might affect rates of detentionAt the start of the research process, the priority for PPI was helping to guide the research team inidentifying factors that may explain different rates of detention. Questions such as ‘Are some people morelikely to be detained than others?’ and ‘What factors should the researchers explore in this project?’ aidedthe discussion.
The following personal characteristics were suggested by the groups as issues that may have an impact onrates of compulsory admission:
l ethnicityl agel sexl being unemployedl povertyl being homelessl drug and alcohol misusel culturel previous detention.
When asked why ‘rates of detention might be different in different areas’, participants suggested that itwas important to consider the following factors in the research project, if possible:
l local police attitudes and experiencel urban settings – may be more stressfull the accessibility of crisis services or alternatives to detentionl people living on their own – more bedsits?l drug/drink culturel poorer estates.
Service users were also asked their opinions and experiences of what events might be important in leadingup to (precipitating) compulsory admission. The following circumstances or events were suggested as beingassociated with detention:
l family breakdownl bereavementl loss of children (custody)l domestic violencel bullyingl drug abusel loss of jobl court proceedings.
Discussions were wide ranging and participants expressed great interest in the study. It was noted that notall of the suggested lines of enquiry could be examined by means of analysis of the MHMDS and externallylinked data sources, since they specified variables that were not available to the researchers; however,participants thought that there may be a number of proxies that would enable investigation. It was alsothought useful to log questions that could not currently be explored as an avenue for future research.
DOI: 10.3310/hsdr02490 HEALTH SERVICES AND DELIVERY RESEARCH 2014 VOL. 2 NO. 49
© Queen’s Printer and Controller of HMSO 2014. This work was produced by Weich et al. under the terms of a commissioning contract issued by the Secretary of State forHealth. This issue may be freely reproduced for the purposes of private research and study and extracts (or indeed, the full report) may be included in professional journalsprovided that suitable acknowledgement is made and the reproduction is not associated with any form of advertising. Applications for commercial reproduction should beaddressed to: NIHR Journals Library, National Institute for Health Research, Evaluation, Trials and Studies Coordinating Centre, Alpha House, University of Southampton SciencePark, Southampton SO16 7NS, UK.
37

A number of people highlighted the importance of discrimination, stigma and public attitudes as acontributory factor in compulsory admission. Although this clearly falls outside the remit of the EnglishNational Study of Compulsory Admissions (ENSCA) project, it remains an issue worth noting.
Meeting 2: experiences around detentionThe PPI priority for this stage of the research was to understand the experience of compulsory admissionand subsequent detention. Much of the second meeting was spent in exploring people’s stories (whichwere often highly moving) of the causes, process and impact of compulsory detention, and, in so doing,thinking about modifiable factors on the causal pathway.
Experience leading to detention
Seeking helpA number of people spoke of actively seeking help before compulsory detention, either from primary careor from their existing community teams. In some cases this request was not, in their view, taken seriously.A number of people felt that compulsory admission could have been avoided if their requests for help,including in one case a voluntary admission, had been met. People felt that they had a great deal ofexperience and insight into when they needed help, what triggered deterioration and what the key signswere. They felt that this should be given greater weight by professionals.
Avoiding helpConversely, some people spoke of actively avoiding help when their mental health deteriorated. Twodistinct explanations were offered for this and they would require different approaches to reduce theirimpact on compulsory admission. The first explanation was prior experience of services. Some participantstalked about their reluctance to seek help based on previous bad experiences, for example having had arequest for help declined in the past. To address this, people needed acknowledgement from services thatthings had gone wrong in the past and ways of making improvements needed to be identified.
The second explanation was that their distress prevented them from seeking help. Some participantsrecalled experiences when they did not recognise that they needed help, or when the distress they wereexperiencing at that time made seeking help very difficult. Some people were very aware that theysometimes lose the ability to assess their own state of mental health and that they are not always awarewhen they need help. However, often in these cases they have people around them who are moreaware (e.g. family, friends or peers from support groups). There appear to be times when the views offamily and friends need to be taken into account. This clearly raises ethical issues, particularly if there isdirect disagreement or conflict between the needs and/or wishes of someone in distress and those of theirfamily or friends; however, participants felt that it would be possible to address at least some of theseissues through advanced directives, crisis planning or a trusted advocate.
Where people recognised the need for help but were unable to seek it, two different difficulties emerged:being able to articulate the need for help; and actually getting in contact with the appropriate service.This was considered to be an issue of access. Services might be able to address this issue by having longeropening hours, named contacts, fast access telephone numbers for people identified as likely to need rapidsupport, self-referral for those who have used a service previously and quicker routes from primary tosecondary care.
Life eventsPeople also identified a number of life events that had preceded their detention, including:
l moving away from a familiar areal loss of employmentl change of family situation (e.g. bereavement or separation)l other family difficulties and financial problems.
USER INVOLVEMENT
NIHR Journals Library www.journalslibrary.nihr.ac.uk
38

While events are not avoidable or even always predictable, they are known to significantly increase the riskof deteriorating mental health and therefore could be identified as potential triggers as well as flags formore rapid access to support.
Experience of compulsory admissionDetention itself was distressing. Although it is an intrinsically disempowering process, people felt that itcould, even when it is necessary, be done in a more empowering way. Some people raised concerns aboutthe involvement of police or highly visible professionals involved in the compulsory admission process, andabout the effect of this on how they were viewed within their communities. This was seen as frustratingand sometimes humiliating, particularly by those who had sought help and not received it. It was alsoassociated by some with a sense of failure and significantly reduced people’s self-confidence.
Some agreed that detention was necessary (and, in at least one case, life-saving). However, even theseindividuals expressed concern that neither the expected outcomes of detention nor the proposedtreatments were adequately explained at the time. These people felt that they would have been moreinclined to accept being in hospital if they had understood that there was a good reason fortheir admission.
The feeling was expressed that there was a strong focus on treatment and risk avoidance but little or noconsideration given to understanding the trigger events that may have caused the distress in thefirst place.
One participant noted:
I sometimes wonder whether senior managers or clinician don’t section someone, merely to avoid thepossibility of something happening out there in the community and therefore bad press, law suits andall the rest.
Most people took the view that the deterioration in their mental health before admission had some causebeyond a simple ‘chemical imbalance’. These were sometimes social or practical problems that had pushedpeople beyond their ability to cope (as previously mentioned). Many participants felt that little was doneduring their admission to address these problems and so people still had to deal with them upon dischargeas well as adjusting to life outside the hospital. These stressors were seen as potentially leading to furthertime in hospital.
Participants subsequently tended to speak about their experiences of admission and subsequent discharge,rather than the process of compulsory admission itself.
Some people felt that the detention had damaged their relationships in the community. This includedfamily relationships, social relationships and even relationships with community-based mental health staff.It was, however, also possible for detention to have a positive effect on family relationships where thehospital admission provided a break in an unhealthy or strained relationship.
The problems caused to relationships with community professionals took two forms: a breakdown in trustwhere the professional had been part of the compulsory admission process (though this was sometimesreversible if people felt, in retrospect, that the detention was appropriate); and a breakdown in thetherapeutic relationship where clinical responsibility switched to a different team, or where the communityteam did not have regular contact with the patient when they were in hospital. This was felt to beparticularly important in the weeks before discharge from hospital.
DOI: 10.3310/hsdr02490 HEALTH SERVICES AND DELIVERY RESEARCH 2014 VOL. 2 NO. 49
© Queen’s Printer and Controller of HMSO 2014. This work was produced by Weich et al. under the terms of a commissioning contract issued by the Secretary of State forHealth. This issue may be freely reproduced for the purposes of private research and study and extracts (or indeed, the full report) may be included in professional journalsprovided that suitable acknowledgement is made and the reproduction is not associated with any form of advertising. Applications for commercial reproduction should beaddressed to: NIHR Journals Library, National Institute for Health Research, Evaluation, Trials and Studies Coordinating Centre, Alpha House, University of Southampton SciencePark, Southampton SO16 7NS, UK.
39

Experiences of dischargeIn addition to re-establishing community relationships, there were two further issues highlighted about thetime just before leaving hospital: little preparation for leaving hospital; and issues that were causingdistress not addressed during admission.
The experience as a detained patient was described as controlled and people were not expected (or able)to do much for themselves. This meant that, when they came to leave hospital, they did not feel preparedto cope effectively. This experience was worse for those people who experienced longer LOS. Thoughtsabout how to address this included more use of extended leave and better contact with community teamsbefore discharge.
Most people described some difficulties adjusting to life after (compulsory) admission. As well as having todeal with the consequences of being away from their homes, family and friends, sometimes for extendedperiods, some people had suffered interruptions to employment or education and training. This increasedthe risk of isolation and the feelings of failure and inadequacy that people expressed as part of thedetention experience. Some people thought that this might increase the risk of subsequent mental healthproblems and reduce the likelihood that they would seek help in future. These potential consequenceshighlighted a need for hospitals to help people maintain links with employers or colleges/universities andfor services to help people to return to work or education as quickly as was reasonably possible.
One participant commented:
It’s just about integrating all the different services to deliver around the care plan or lifestyle plan ofthe individual.
The final frustration that a number of people spoke of at the end of any particular spell in hospital wasthe absence of a process that helped everyone involved to learn from the experience. Some people hadclearly built up a great deal of experience from admissions over the years but were unable either to escapefrom particular cycles of behaviour or to articulate ways that others could help to do so. They felt thatan opportunity to talk through the whole experience and constructively consider how everyone involvedshould respond, were similar circumstances to arise in future, could achieve a number of useful ends;it would allow people to take something positive from an otherwise almost wholly negative experience,increase the chances of avoiding detention in future and allow people to positively contribute to theirfuture care and treatment even if they become unable to articulate their needs.
This final point reinforces both people’s desire to be more actively involved in their care and treatmentbefore, during and immediately after a crisis of the severity that warrants admission, and that servicesremain poor at finding mechanisms to allow this to happen.
Meeting 3: what could be done to reduce rates of detentionThe third and final meeting was used to reflect on the main study findings, and to discuss how thesemight be applied to improve the experience of service users and carers to reduce rates of compulsorydetention in the future. This discussion began with a brief outline of the headline findings by SW.
Getting the environment rightTwo problems were identified with conventional psychiatric settings: the stigma attached to mentalill-health extended to psychiatric institutions and people did not want to be seen in a psychiatricenvironment; and mental health services maintained a focus on psychiatric treatment and compliancerather than understanding the broader problems people faced in their daily lives.
The issue of stigma clearly reduces people’s desire to seek help when their mental health is deteriorating.In addition, because crises were often precipitated by life events, people felt that these events needed
USER INVOLVEMENT
NIHR Journals Library www.journalslibrary.nihr.ac.uk
40

addressing as part of the service response. If these issues were not addressed, then people thoughtreadmission was more likely.
Cultures and conditions within mental health services were also thought to have an impact on how likelypeople would be to seek help in future. The following characteristics were identified as important:
l ward designl staff behaviour and attitudesl cultural sensitivityl good-quality information about treatments, their side effects and alternativesl choice of services and staffl ability to see the same staff over time, to build rapport and reduce repetitive questioningl continuity of care and staff between community and hospitall therapeutic environmentl decision-making and intelligent risk-taking encouraged.
One participant noted:
My experience is that ward staff huddle in the nursing station and patients are on the ward andthere’s no interaction or association between them.
Another commented:
Being given a choice about medication, so for example, I said no I don’t want this and it was listenedto and heard.
One service user offered:
She had kids and the one (psychiatric drug) that made her sleepy made her lose her kids and her kidsgot taken off her because she couldn’t stay awake enough to care for them, so she as a service userher response was she needed to be able to make that choice of which medication to have.
Learning from experienceWhere people had experienced repeated admissions, they felt there was an opportunity to learn from thismore constructively by identifying triggers and early warning signs, paying more attention to carers’understanding and use of advocates and tools such as crisis cards to help people articulate their needs attimes when mental ill-health made it difficult for people to do this for themselves.
Some people thought that you could learn positive lessons from recovering from crisis that could makefuture recovery quicker and less distressing. People identified a clear role for self-management, peersupport and advanced planning for crises.
Crisis preventionPeople thought more effort was needed in terms of avoiding crises as opposed to responding to them.In particular, the following approaches were offered as having the potential to reduce the needfor admission:
l more attention paid to social, economic and physical health issues, especially housing and employmentl easier and quicker access to servicesl people being given self-management skills.
DOI: 10.3310/hsdr02490 HEALTH SERVICES AND DELIVERY RESEARCH 2014 VOL. 2 NO. 49
© Queen’s Printer and Controller of HMSO 2014. This work was produced by Weich et al. under the terms of a commissioning contract issued by the Secretary of State forHealth. This issue may be freely reproduced for the purposes of private research and study and extracts (or indeed, the full report) may be included in professional journalsprovided that suitable acknowledgement is made and the reproduction is not associated with any form of advertising. Applications for commercial reproduction should beaddressed to: NIHR Journals Library, National Institute for Health Research, Evaluation, Trials and Studies Coordinating Centre, Alpha House, University of Southampton SciencePark, Southampton SO16 7NS, UK.
41

Alternatives to admissionA theme that ran through many of the discussions that took place was the absence or disappearance of aviable alternative to hospital admission.
One participant said:
Therapeutic communities, crisis houses, having alternatives, for me it would have been aboutunderstanding the spiritual nature of my situation.
A number of people mentioned having previously received good support from services that have sinceclosed. Several people had received good support from voluntary sector services but others reportedfinding it difficult to find services, particularly at short notice or outside normal working hours or atweekends. Self-help or peer support was thought to be useful both before crisis and after leaving hospital,but not necessarily appropriate for periods of crisis.
One of the reported advantages of self-help or peer support was that people felt they were contributingtowards supporting others as well as being supported. This was one of the few approaches that seemed tohelp increase people’s self-confidence.
Service user and carer involvement summary
The service user and carer involvement component of this study brought members of the research teamtogether with people who had direct personal or caring experience of compulsory admission, significantlyadding to the diversity of experience available to the research team. During the early part of the study,this partnership provided an opportunity for the research team to explore lines of enquiry relevant to thelives of the people most directly affected by compulsory detention. The service users and carers drew ontheir own experience to ask a range of questions that they thought could be answered by the study.
As the study developed, the service user and carer perspective offered a qualitative perspective to sitalongside the quantitative analysis. In particular, descriptions of events and service use before admission,the experience of admission itself, and the care received during detention and following discharge helpedto indicate potential explanations for variations in compulsory admission rates across different serviceproviders. Towards the end of the study the service user and carer involvement was used to highlight someof the practical applications of the emerging findings.
Service user and carer involvement in the dissemination of the findings will ensure a much wider reach andconsequent impact than could otherwise have been achieved. Compulsory admissions have always beena very important issue to service users and carers, as deprivation of liberty is one of the most seriousinterventions that our law allows. Involvement in the study has led to a high level of interest amongst theservice users and carers and their broader networks.
The MHF plans to produce a briefing about the context and findings of the study and publicise it via MHFnetworks, which include an e-newsletter (reaching 45,000 people), local and national groups, service usersand carers, as well as contacts within large number of service providers and commissioners. We shall alsopublicise the findings at a service user event organised in collaboration with the NSUN.
USER INVOLVEMENT
NIHR Journals Library www.journalslibrary.nihr.ac.uk
42

Mental Health Network (NHS Confederation)
The NHS Confederation represents more than 90% of the organisations that make up the NHS. Itsmembers include the majority of NHS acute trusts, ambulance trusts, foundation trusts, mental healthtrusts, PCTs, special health authorities and SHAs in England; provider trusts and local health boards inWales; and health and social service trusts and boards in Northern Ireland. We aimed to recruit senior NHSmental health service managers to participate in a consultation event regarding the project’s main researchaims and findings.
The consultation event was convened by members of the ENSCA project team in December 2012.Participants were provided with a background to the study, including the main aims and objectives and abrief overview of the main headline findings at that stage in the project.
The group confirmed that the headline estimates of the proportions of patients detained under the MHA,those admitted voluntarily and those treated in the community only were correct. There was also aconsensus that the research was important, and that the current levels of compulsory detention wereworryingly high. The ensuing discussion was wide-ranging but has been captured under a series ofheadings for the sake of providing an accurate summary of the different views expressed.
Underlying trendsThe participants concurred with the report of historic trends (1988–2008), and felt certain that rates ofdetention were likely to have increased in the meantime; one participant noted that these rates hadincreased by 6% in the last year alone. It was also noted, and agreed generally, that the majority ofinpatients across the country are now detained patients.
Professionals’ views about reasons for increased rates of detentionThis was one of the major areas of discussion, and produced a comprehensive view of possible factors tobe investigated.
Risk aversion (and fear) among mental health professionalsThis was a trend that many identified, with roots in the serious untoward events and negative publicity ofthe 1990s and subsequent proposals for the proactive detention of people with so-called Dangerous andSevere Personality Disorders. The overall effect had been political and societal pressures to detain morepeople with serious mental illness. The last 20 years were judged to have seen greater emphasis on riskassessment and risk management in the delivery of mental health care. The decision to admit a patient tohospital is made on the grounds not of accessing treatment or therapy, but of avoiding untowardoutcomes outside hospital.
Introduction of crisis resolution and home treatment servicesCrisis resolution and home treatment teams have had great success in providing alternatives to admission(through home treatment) for many people in crisis. The downside is that admission is not alwaysavoidable, and some people may be kept out of hospital and admitted only when severely unwell. A viewwas expressed that those who could be kept out of hospital were being kept out, but that there was acore of patients who were too ill to benefit from this kind of care. These individuals would never besuitable for home treatment during acute episodes of illness. Since the introduction of CRHTs, the averageLOS in hospital has fallen to around 35 days (figure suggested by participants). Shorter LOS was seen as apossible factor in (early) readmission. The benefits of CRHTs are not realised uniformly or universally. Ruralareas were discussed, and it was noted that it is almost impossible to deliver crisis resolution services inremote places. Rural poverty and social isolation are causes of mental illness, and access to firearmsheightens risk. People who are unwell can stand out in small communities. Lack of public transport andother services often means that admission is necessary.
DOI: 10.3310/hsdr02490 HEALTH SERVICES AND DELIVERY RESEARCH 2014 VOL. 2 NO. 49
© Queen’s Printer and Controller of HMSO 2014. This work was produced by Weich et al. under the terms of a commissioning contract issued by the Secretary of State forHealth. This issue may be freely reproduced for the purposes of private research and study and extracts (or indeed, the full report) may be included in professional journalsprovided that suitable acknowledgement is made and the reproduction is not associated with any form of advertising. Applications for commercial reproduction should beaddressed to: NIHR Journals Library, National Institute for Health Research, Evaluation, Trials and Studies Coordinating Centre, Alpha House, University of Southampton SciencePark, Southampton SO16 7NS, UK.
43

Increasing use of Section 136 by the policeThis was being addressed currently through the opening of place of safety suites in mental health providerunits, and the move away from looking after people who are detained in public places in police stations.It was noted that there had been a 36% increase in Section 136 detentions in the past year.
Introduction of electronic patient recordsAlthough electronic patient records should allow more accurate management decisions to be made out ofhours, the reality is often that even they are incomplete or unavailable. It was also suggested that thisinformation might include more information about risk and therefore a greater chance of detention,particularly where assessment was undertaken by professionals without prior knowledge of the patient.
Greater preparedness to manage challenging behaviours assertivelyThis was seen as including out-of-area placement in independent-sector units. This has also seen theexpansion of NHS low-security forensic beds, and reflects a general tendency towards the assertivemanagement of risk through admission.
The demise of psychiatric rehabilitation as a specialtyPsychiatric rehabilitation was a specialty that previously cared for patients most at risk of admission.This change in service delivery went with the reduction in long-stay beds.
Lack of effective and acceptable interventions to reduce cyclesof readmissionThis was highlighted in a consultation event involving users of mental health services, where socialinterventions were valued in particular. ‘Lack of purposeful life opportunities’ was mentioned in thisrespect. This was echoed later in a discussion about the lack of alternatives to admission (other thanCRHTs) in many parts of the country, and even the ‘best’ CRHTs can visit only two or three times per dayat most.
Poverty and benefits cuts (including housing benefits exclusions)One factor leading to great pressure on inpatient service was the greater geographical mobility as patientsare displaced to areas with cheaper housing costs. Employment and social care may be less available, andthose affected are likely to experience greater isolation and more difficulty accessing services. This willresult in weaker therapeutic relationships, and the likelihood that professionals will encounter a patient forthe first time when in crisis.
Discontinuities in careThis was a major theme, and was seen as arising from a widely adopted ‘functional’ model involving highlyspecialised clinical teams and numerous boundaries and care interfaces. Clinicians who know a patientwell may be less likely to detain them in a crisis, and perhaps more likely to negotiate a voluntaryadmission. As one participant put it ‘stories don’t move with patients any more’. Electronic records are noreplacement for relationships. The view was expressed that care is becoming depersonalised as a resultof functionalisation.
Loss of ‘specialist’ status and skills among inpatient servicesInpatient services are often viewed as the hardest, least desirable and least prestigious places to work forprofessionals, and where patients go when other treatments have failed. High levels of staff turnover,absenteeism and use of bank and agency staff were identified as major problems, and factors associatedwith higher rates of compulsory admission. Permanent staff tend to be relatively inexperienced, andtherefore perhaps more likely to detain patients than more experienced clinicians.
USER INVOLVEMENT
NIHR Journals Library www.journalslibrary.nihr.ac.uk
44

The view was expressed that pressures on inpatient services to minimise LOS mean that less time is spenton assessment at the time of admission. Lack of knowledge and understanding of the causes andconsequences of illness probably increased the risk that patients would be undertreated and remediablerisk factors for relapse overlooked. Longer-term care planning (including help to reduce relapses) was lesslikely to be undertaken now than in the past, and was thought to be directly related to shorter LOS andbusier, more disturbed wards.
As wards become more disturbed they also become more frightening and aversive, and less therapeutic.This was a vicious cycle, and it was not unknown in some places for patients to agree to a voluntaryadmission but refuse to stay when they saw the ward. This was considered a cause of avoidable detention.
Influence of reduced budgets and greater pressure on servicesDemoralisation and destabilisation of services at a time of austerity and service cuts were seen ascontributing to increased bed pressures, and greater rates of compulsory admission. Cutbacks and use oflocum staff result in fewer professionals with previous knowledge of patients who present in crisis. It wassuggested that this might affect compulsory admission rates by reduced investment in staff training anddevelopment. There was also support for the notion that reduced bed numbers could contribute toincreased rates of detention. It was noted that in some parts of the country being placed on a sectionof the MHA is necessary to gain access to a bed, but can involve waiting for up to two weeks after asuccessful application (after which the application expires and the patient has to be reassessed, which itselfis not unknown). Bed occupancy was typically at or above 100% in most places, according to participants.This places greater pressure on teams to discharge patients, at the expense of time spent on relapseprevention. It is no longer possible for patients to be admitted to hospital for short periods of respite,to prevent imminent crises. The relationship between LOS in hospital and detention rates is likely tobe important.
Greater attention to the care of people with personality disordersThe National Institute for Health and Care Excellence guidelines make it clear that mental health serviceshave a duty of care, and such patients often present in crisis and expressing ideas of self-harm. Suchpatients can be difficult to keep out of hospital, and are often difficult to engage in therapeuticrelationships. A significant proportion of the current pressure on beds is thought to reflect the increasingprevalence of personality disorders among inpatient populations.
Changing role of mental health social workersThe role of mental health social workers has altered dramatically in the past 10–15 years, and this groupof professionals has gone from multidisciplinary mental health team members to Approved Mental HealthProfessionals concentrating mainly on MHA assessments. Reduction in social care budgets (as part of localauthority financial challenges) is fast resulting in the breakdown of joint working across health andsocial care.
Increasing prevalence of substance misuse and therefore dual diagnosesIt was suggested that in some units, especially in London, almost 100% of inpatients meet criteria fordual diagnosis.
Introduction of Community Treatment OrdersCommunity Treatment Orders were introduced to optimise adherence to treatment in those at highest riskof relapse, and this may be happening. However, they are probably not reducing admissions, since theyrequire greater supervision of patients and therefore more awareness of discontinuation of treatment andrelapse. They are very good for some patients (especially those on depot medication), but probably notfor everyone.
DOI: 10.3310/hsdr02490 HEALTH SERVICES AND DELIVERY RESEARCH 2014 VOL. 2 NO. 49
© Queen’s Printer and Controller of HMSO 2014. This work was produced by Weich et al. under the terms of a commissioning contract issued by the Secretary of State forHealth. This issue may be freely reproduced for the purposes of private research and study and extracts (or indeed, the full report) may be included in professional journalsprovided that suitable acknowledgement is made and the reproduction is not associated with any form of advertising. Applications for commercial reproduction should beaddressed to: NIHR Journals Library, National Institute for Health Research, Evaluation, Trials and Studies Coordinating Centre, Alpha House, University of Southampton SciencePark, Southampton SO16 7NS, UK.
45

Useful and desirable outcomes of the researchFollowing this lengthy discussion, the participants were aware of the main aims and objectives of theENSCA project. They were then asked to give their opinions about what specific evidence they would liketo see being derived from the project; in other words, how they felt the evidence from this research studymight be useful for professionals. The following points were raised:
l What is the association between LOS in hospital and the compulsory admission rate?l What implication does the increasing compulsory admission rate have on the availability of resources in
other areas of care (e.g. services to help prevent relapse)?l What evidence is there to support the ‘reinvention’ of inpatient services and ‘upskilling’ of ward staff in
an attempt to reduce the compulsory admission rate?l What impact does the commissioning of CRHT services have on the rate of compulsory admission
to hospital?
As outlined in the MHF PPI section, it was not be feasible within the current project (given the limitationsof the MHMDS and external data sources) to address all of these proposed avenues for analyses raised inthis consultation event. The content of the discussion, however, did inform the selection of explanatoryvariables as described in Chapter 2, Methods. These recommendations were also considered asopportunities for future research studies, as covered in Chapter 5, Discussion and conclusions.
USER INVOLVEMENT
NIHR Journals Library www.journalslibrary.nihr.ac.uk
46

Chapter 5 Discussion and conclusions
The study had two main aims: to estimate variance in rates of compulsory admission between people,places and healthcare organisations (research aim 1); and to evaluate the extent to which this variance
could be explained by characteristics of these different spatial levels (research aim 2). A subsidiary aim wasto evaluate associations between compulsory admission and specific risk factors (explanatory variables) thatwere derived from data linkages across all spatial levels within the study data, including bed occupancyand investment in mental health services.
We set out to achieve these aims through (secondary) multilevel statistical analysis of the MHMDS, whichcomprises the routine data returns on all specialist mental health treatment activity in England. Weencountered significant MHMDS data quality issues; these were offset by richer than expected datalinkages but meant that we were able to undertake cross-sectional analysis of only one year of MHMDSdata (2010/11). Our outcome was compulsory admission, defined as inpatient treatment in a mental illnessbed while subject to section(s) of the MHA (2007) other than those concerned only with conveyance to aplace of safety and/or short-term (maximum 72-hour) detention for the purposes of assessmentor guardianship.
We identified six spatial levels in the MHMDS, namely individual, LSOA (the primary census unit of localgeography), GP practice, PCT (as commissioner of services), provider trust and SHA. We made full use ofthe facility that this data structure offered for linking to external data sets, and these were the sourceof most explanatory variables used in our analyses.
Summary of main findings
The first aim of the study was to model and assess variance in rates of compulsory admission in Englandacross a comprehensive range of spatial levels. We set out to identify the most parsimonious four-level,cross-classified model, and to model the residuals across provider trusts after adjusting for age and sex.
Patterns of variance in the null modelThe choice of an optimal four-level, cross-classified null model was complicated, and involved carefulcomparison of competing models (including model fit statistics) and further examination of the datastructure in respect of PCTs and provider trusts. We began with the a priori assumptions that individual(patient) and provider trust should remain in all models, since the former is the level at which outcome isclassified (and where most variance occurred) and the latter represents the locus at which decisions aboutadmission and detention are made, and therefore represents an important target and/or location forfuture interventions.
The relatively small number of PCTs (commissioners) per provider trust meant that higher-level varianceswere likely to be unreliable in models that included both PCT and provider trust. We therefore selected thefour-level cross-classified null model comprising individuals, LSOA (based on Census area geography),GP practice and provider trust. Although around 84% of the (unexplained) variance in compulsoryadmission in this model reflected differences between individuals, substantial and statistically significantvariance (∼7% in both instances) was found between areas (LSOA) and between provider trusts. Thevariance at GP level was smaller (2.7%) but statistically significant. The model fit was not improved byincluding SHA, and there was no evidence of statistically significant variance at this (higher) level.
Examining and mapping null model residualsThe limitations of even the best-fitting null model were evidenced by examining the provider trust-levelresiduals. These differed from the modelled average to a statistically significant degree for 45 out of 64(70%) provider trusts included in the study sample even after adjusting for patients’ age and sex.
DOI: 10.3310/hsdr02490 HEALTH SERVICES AND DELIVERY RESEARCH 2014 VOL. 2 NO. 49
© Queen’s Printer and Controller of HMSO 2014. This work was produced by Weich et al. under the terms of a commissioning contract issued by the Secretary of State forHealth. This issue may be freely reproduced for the purposes of private research and study and extracts (or indeed, the full report) may be included in professional journalsprovided that suitable acknowledgement is made and the reproduction is not associated with any form of advertising. Applications for commercial reproduction should beaddressed to: NIHR Journals Library, National Institute for Health Research, Evaluation, Trials and Studies Coordinating Centre, Alpha House, University of Southampton SciencePark, Southampton SO16 7NS, UK.
47
We mapped these residuals to explore their geographical distribution, and particularly the spatialdistribution of positive and negative values. This was an exploratory diagnostic tool designed to helpidentify potentially ‘missing’ explanatory variables. Missing variables would be considered more likely ifnegative residuals were clustered together and positive residuals clustered (i.e. if there were evidence ofspatial auto-correlation among residuals). Although there are no formal statistical tests with which toassess this, inspection of the map based on null model residuals did not suggest clustering of this type,with the possible exception of London, where (notwithstanding the limitations of the map itself) thereappeared to be a cluster of large positive model residuals.
The next stage (research aim 2) involved attempting to explain this variance by introducing variablesthat characterised the different spatial levels within the data set. To maintain model stability whileaccommodating explanatory variables, we were forced to reduce the model from four to three spatiallevels, and retained individual, LSOA and provider trust. The distribution of variance in this three-levelnull model was broadly in keeping with that of the null four-level model described above. In the fullyadjusted model we estimated that individual-level risk factors explained 8.0% of the risk of beingcompulsorily admitted, while LSOA- and provider trust-level variables each explained 1.1% of the totalvariance in the study outcome.
On examining the fully adjusted model residuals we found that the number of provider trusts whoseobserved compulsory admission rate differed from the model average to a statistically significant extenthad fallen from 45, in the null model, to 20. Mapping of these residuals did not reveal any strikingevidence of spatial auto-correlation.
In our adjusted models, we found significantly higher rates of compulsory admission for men, and forpatients of black, Asian and mixed ethnicity (compared with white patients). The finding that patients ofblack ethnicity were almost three times more likely to be admitted compulsorily than white patients isconsistent with evidence from elsewhere.28–30 The rate of compulsory admission was highest in patientsaged 18–35 years, and fell with age thereafter. The lowest rate was observed in those aged under18 years.
We found statistically significant associations with area-level deprivation (which appeared to show adose–response effect) and ethnic density, but not with population density. The risk of compulsoryadmission was inversely associated with the proportion of white British LSOA residents. This findinghighlights, and raises further questions about, ethnic inequalities in the experience of mental health care.
We found very little evidence of significant associations between compulsory admission and providertrust-level factors. Only one such covariate was a statistically significant predictor of compulsory admission:patients receiving care in provider trusts with community mental health services rated as average (‘same asother trusts’) had a significantly higher risk of being admitted compulsorily than in those rated as poor(‘worse than other trusts’) on the survey of patient experience.
One important finding concerns bed occupancy and rates of compulsory admission. Before adjusting forother covariates (and potential confounders), we found a statistically significant association between(higher) average annual trust-level mental illness bed occupancy and compulsory admission. However, thisassociation no longer reached statistical significance after adjusting for the other covariates in the model.Although there was a trend towards lower rates of compulsory admission in trusts outside than in London,this association did not reach statistical significance in the fully adjusted model.
For the reasons described we did not include PCT (commissioner) in our null or adjusted models. Insteadwe carried out separate analyses in which we examined associations between PCT investment in mentalhealth services and rates of compulsory admission. Our results indicated that inclusion of these variablesexplained almost no additional variance in the rate of compulsory admission after adjusting forindividual- and LSOA-level variables. No statistically significant association was found between total
DISCUSSION AND CONCLUSIONS
NIHR Journals Library www.journalslibrary.nihr.ac.uk
48

investment in mental health services and compulsory admission in adjusted models. A small but statisticallysignificant association was, however, found for investment in community mental health teams, but notwith investment in assertive outreach or crisis resolution teams.
Strengths of the study
There are no directly comparable studies, and none with similar geographical and spatial coverage,or statistical power. The size and representativeness of the sample used in this study were unprecedented.The MHMDS includes the treatment records on every person – over 1.2 million individuals – who receivedsecondary care mental health services in England in 2010/11. The sample size ensured a high degree ofprecision in our estimates of variances and residuals. The complexity of the data set, which reflects the realworld settings in which mental health services are commissioned, delivered and received, means that ourresults are highly generalisable to England as a whole. Arguably the most important of these complexitieswas the cross-classified nature of the data themselves, with multiple overlapping and intersectinggeographies which defied simple description or representation.
Our first aim was to model and assess variance in rates of compulsory admission in England across acomprehensive range of spatial levels. We set out to identify the most parsimonious four-level,cross-classified model, and to model the residuals across provider trusts. This was done as a precursor toidentifying factors that might account for this variance, and to model potential impacts of futureinterventions. Ours was the first study to model these variances simultaneously.
The use of multilevel statistical modelling (and MLwiN software) was a particular strength, since this wascapable of handling cross-classified data and therefore of estimating variances across a highly complexgeography of places and health-care commissioners and providers. This was the first study of which we areaware that modelled variances in compulsory admission rates across several spatial levels simultaneously.
One important strength of the study data set was its large number of spatial identifiers, which enabledthe many data linkages employed in our efforts to address research aim 2. In fact the search for dataand variables that characterised the different spatial levels in our data set proved highly productive,and exceeded expectations. The number and quality of these linked variables contributed significantly toour ability to achieve the study aims.
Limitations
There were a number of study limitations that need to be taken into account when interpreting thefindings. The first of these was the secondary nature of the study design, based on use of routine,retrospective data. Secondary analysis is always reliant on variables that have been collected for otherpurposes and on the quality and completeness of the data. Such research is always limited by an inabilityto specify variables of primary interest (including the study outcome itself).
The data quality issues (which we have highlighted throughout this report) prevented us from pursuingall of the research questions in our original protocol, most notably the longitudinal analysis of trends incompulsory admission over time. It is important to note that we were the first researchers ever toundertake this type of analysis of the MHMDS, and the HSCIC had little or no experience of supportinguse of the data for research purposes. We were therefore forging a path for others to follow. Unbeknownto us, the data for years before 2010/11 were simply too incomplete to enable longitudinal analysis ormodelling, and after careful reflection we decided to concentrate on undertaking a high-qualitycross-sectional study of the 2010/11 data. This decision was supported by the discovery of farricher (cross-sectional) data linkages than expected.
DOI: 10.3310/hsdr02490 HEALTH SERVICES AND DELIVERY RESEARCH 2014 VOL. 2 NO. 49
© Queen’s Printer and Controller of HMSO 2014. This work was produced by Weich et al. under the terms of a commissioning contract issued by the Secretary of State forHealth. This issue may be freely reproduced for the purposes of private research and study and extracts (or indeed, the full report) may be included in professional journalsprovided that suitable acknowledgement is made and the reproduction is not associated with any form of advertising. Applications for commercial reproduction should beaddressed to: NIHR Journals Library, National Institute for Health Research, Evaluation, Trials and Studies Coordinating Centre, Alpha House, University of Southampton SciencePark, Southampton SO16 7NS, UK.
49

The use of secondary analysis also constrained the questions we could address and the hypotheses wecould test. This was highlighted by the many salient suggestions of potential explanatory factors proposedby participants in both of our user groups. For instance, we were unable to study factors such as ‘continuityof care’, ‘inpatient environment’ or ‘carer involvement’. Through a combination of data specification andcompletion difficulties, we were unable to accurately establish the number of admissions, LOS (bed-days) ornumber of discrete compulsory admissions for individual patients in the data set. This had one majorconsequence: we were unable to study patterns of admission and readmission. As a result we cannotcomment on the extent to which compulsory admission rates are influenced by the ‘revolving door’ effectwhereby a small number of patients account for a large number of (compulsory) admissions. Likewise, thedata did not allow us to distinguish between patients who were detained under the MHA (2007) at thetime of admission to hospital and those admitted voluntarily and subsequently detained.
We were unable to distinguish between the type of inpatient units and mental illness beds involved, andthose admitted compulsorily will have included those treated in specialist old age, LD and forensic mentalhealth services. However, the numbers treated in each of these services is very small in relation to generaladult services.20
We were also constrained by the way in which certain variables were specified. The best example of thiswas bed occupancy: according to the coding rules of BOO, beds allocated to patients on home leave arerecorded as unavailable and therefore not occupied. Consequently, official bed occupancy can neverexceed 100%, despite reports that true occupancy is often higher than this.
As described in this report, the data set itself is large, complex and beset by data quality and codingchallenges, as well as high levels of missing data on many potential variables of interest, particularly at theindividual level (such as diagnosis or other clinical outcome measures). While our null models would nothave been affected, it is likely that we underestimated the proportion of variance that would have beenexplained had we been able to control for diagnosis, previous treatment experiences, length of illness,engagement with care and socioeconomic status in particular. Data on variables that are likely todetermine thresholds for admission (e.g. suicidality, agitation/aggression, substance use and homelessness)would arguably have led to significant insights into variation in rates of compulsory admission.Furthermore, this unmeasured confounding could have resulted in overestimates of the associationbetween compulsory admission and individual- (e.g. ethnicity) and LSOA-level factors such as deprivationand ethnic density. Likewise, we had no information about alternatives to inpatient treatment, such ascrisis houses or respite facilities.83 Although previous research has suggested that such facilities are lesssuitable for those who are severely unwell,84 their presence may reduce the need for compulsory admissionin some cases.
Perhaps the single greatest obstacle that we encountered was the MHMDS specification oversight whichresulted in admission and legal status data being recorded for the care spell rather than the reportingperiod. We succeeded in overcoming this problem, and many others, through painstaking workarounds.We have described in detail some of the unforeseen difficulties that we encountered, many of which wereconcerned with data quality. It should be acknowledged that the HSCIC is primarily resourced to supportthe reporting of data for healthcare decision-making, rather than research. While it is very assiduous in thecuratorship of data, it was rarely able to offer solutions to problems that it had only belatedly becomeaware of. The HSCIC was particularly reluctant to share the primary data used to derive complex care spelland reporting period variables, and we were compelled to find alternative ways of deriving studyoutcomes. By linking a small number of data from the 2009/10 MHMDS data set, we were able toestablish (and validate) a method for ascertaining if patients had been admitted to inpatient mental healthbeds and subject to compulsory detention under the MHA (2007) during the study year. This delayed theproject somewhat but resulted in estimates of compulsory admission for 2010/11 that were very close tothose produced by the HSCIC itself.
DISCUSSION AND CONCLUSIONS
NIHR Journals Library www.journalslibrary.nihr.ac.uk
50
Despite the evident strengths of multilevel modelling and MLwiN software, the complexity and size of themodels meant that these often took several hours to run, and many proved unstable. We therefore had tobe selective and focused in our analysis strategy and we were forced to make a priori judgements aboutwhich of the (very large number of) explanatory variables to include at each level. Similarly we were notable, for instance, to undertake univariate tests of association with each of the variables included inthe study.
The cross-sectional nature of the study was a further limitation. Although a significant advance on previousecological research,5 this design makes it difficult to distinguish between reverse causality, (residual)confounding and causation as explanations for the observed associations. Nevertheless, we were able tomodel variance in the proportion of patients known to mental health services who experienced at leastone compulsory admission in 2010/11 using patient-level data, and to estimate associations between thisoutcome and explanatory variables operating at a range of spatial levels. After linking two annual MHMDSdatabases (to access important information in relation to a patient’s mental health-care spell in the2009/10 and 2010/11 reporting periods), we noted important reporting inconsistencies across theseperiods. We came to the conclusion that the quality of the MHMDS data before 2010/11 was insufficientto permit longitudinal analyses, although this had been part of our original project plan. However, thecross-sectional analyses that we were able to undertake were richer and more complex than expected,by virtue of more extensive data linkage than was originally planned. This enabled us to obtain a clearunderstanding of the factors influencing the rates of involuntary admissions at different spatial levels.
We did not study use of Section 136 (place of safety) orders or CTOs. Ours was a study of compulsoryadmission, defined as time spent in an inpatient mental illness bed subject to the MHA (2007). We did notinclude patients who were detained only under sections of the MHA (2007) that apply only to conveyanceto, and assessment in, a place of safety (Sections 135 and 136), or for the purposes of assessment only[e.g. Sections 4 and 5(2)] where detention for longer than 72 hours does not occur. We did not includesections of the Act relating only to guardianship or orders relating to supervision in the community.The reasons for this were twofold: first, because we were interested in compulsory admission and itsrelationship to aspects of service provision (such as mental illness beds) rather than use of the MHA (2007)per se; and, second, because the MHMDS for 2010/11 would not permit this. The method of recordingand classifying compulsory assessment and treatment comprised noting the most restrictive legal status forthe reporting period and/or care spell. For this reason, the only people for whom this would be coded asSection 136 (for example) are those seen for assessment and either discharged or admitted voluntarily.There was no way to identify those brought to a place of safety under Section 136 and subsequentlyadmitted under the MHA, since the later section (e.g. Section 2) would have been recorded against LSCand LSR. Although MHMDS did include data on CTOs and their revocation, we did not judge these data tobe sufficiently complete or accurate to enable analysis, which was in any event outside the scope of ourstudy aims.
User involvement
User involvement in this project, and especially the contribution of service users and carers through theMHF, was a significant success. This took the form of consultation events rather than qualitative interviewsor focus groups, and provided not only great encouragement to the research team but also a context toour work. The very thoughtful comments of both sets of users (potential users of the evidence and users ofservices) provided nuanced and insightful reflections on wider contextual factors that might explain risingrates of compulsory admission in England. While most of these comments focused on individual- andservice-level factors, the (unprompted) reflections of service users on local and contextual (area-level)factors resonated with our finding that a large and significant amount of variance in compulsory admissionrates occurs between LSOAs.
DOI: 10.3310/hsdr02490 HEALTH SERVICES AND DELIVERY RESEARCH 2014 VOL. 2 NO. 49
© Queen’s Printer and Controller of HMSO 2014. This work was produced by Weich et al. under the terms of a commissioning contract issued by the Secretary of State forHealth. This issue may be freely reproduced for the purposes of private research and study and extracts (or indeed, the full report) may be included in professional journalsprovided that suitable acknowledgement is made and the reproduction is not associated with any form of advertising. Applications for commercial reproduction should beaddressed to: NIHR Journals Library, National Institute for Health Research, Evaluation, Trials and Studies Coordinating Centre, Alpha House, University of Southampton SciencePark, Southampton SO16 7NS, UK.
51

The user consultation meetings highlighted a number of themes for further investigation, specificallythe effects of what some perceived to be a declining inpatient ‘culture’ (including not just the physicalenvironment but also the difficulty of seeing these as therapeutic spaces in which the object was todischarge patients as soon as possible, leading to higher staff turnover and greater levels of disturbance).Similarly, several professional participants spoke of the primacy of avoiding risk to the decision to admit(and detain), rather than the prospect of effective treatment. Many people (both professional and serviceusers) felt that this made it more likely that someone would be admitted compulsorily, a risk that wasfurther increased by the lack of continuity of care. Most participants agreed that it was very common(and possibly the norm) for MHA assessments to be undertaken by professionals who had never met thepatient before. These meetings also highlighted the complexity of the experience of compulsory admission;while few had relished the experience or wanted to experience it again, a number of participants notedthat it had been an important (and even life-saving) intervention. The overwhelming feeling, however, wasthat compulsory admission might not have been necessary had help been provided sooner and/or in adifferent way. Participants also spoke of avoiding treatment on occasion, often as a result of stigma andsometimes because of earlier adverse experiences of services.
In considering the finding that services with ‘better’ community mental health teams have higher rates ofcompulsory admission than those where services are rated as poor (‘worse than others’), it is possiblethat the alternative to high rates of compulsory admission (in some places) is undertreatment, greaterindividual risk and even more adverse outcomes.
Clinical implications
The increasing (and accelerating) number of compulsory admissions is a major concern. The recent annualreview of use of the MHA by the CQC highlighted nationally occurring difficulties in accessing care duringa mental health crisis,13 including difficulties accessing effective crisis care in the community, A&Edepartments and appropriate place of safety settings,14 and bed shortages.13,18 Fewer beds means delays inadmission21 and increased illness severity thresholds for admission.13 Increasing detention among patientsinitially admitted voluntarily is worrying, as it suggests that consent is being withdrawn after exposure toinpatient environments.13
Our findings suggest that bed numbers are not the whole explanation. Although most of the variation incompulsory admission occurred between individuals, we report significant variance (of the order of12–14% of total variance) between places – including between local areas and between service providers(NHS trusts).85,86 Relatively little of the variance in rates of compulsory admission were explained bydifferences in local (commissioner) investment in mental health services.42 One interpretation of thesefindings is that gains arising from the development of community mental health services may not beexperienced equally. In other words, it is possible that compulsory admission rates may be occurringdisproportionately in places where it is more difficult to deliver community treatments, including moredeprived, highly urban and/or very remote places.35
Understanding the effects of local contexts on mental health-care outcomes may be the key to explainingwhy, despite being increasingly patient-centred, responsive to need, recovery-focused, timely andpopular,22,47 transformative developments in community mental health services over the past decade(and longer) have not succeeded in reducing national involuntary admission rates.10,48–51 It may alsoaccount, in part, for persistent ethnic inequalities in the experience of mental health services, and explainwhy people from BME groups (who tend to reside in socioeconomically deprived urban areas) continue toexperience more coercive care pathways, including higher rates of compulsory admission.13,30,36,37,39,87 Thesephenomena are mirrored in the results of clinical trials of interventions targeted at individual patients,including joint crisis plans,2,88,89 advance directives53 and CTOs,10,90 which failed to demonstrate significantreductions in compulsory admissions (or indeed time spent in hospital in the case of the OxfordCommunity Treatment Order Evaluation Trial, OCTET)10,90 despite very promising pilot trial results in one
DISCUSSION AND CONCLUSIONS
NIHR Journals Library www.journalslibrary.nihr.ac.uk
52

locality.91 Increasing involuntary treatment has significant cost implications for service providers andcommissioners and has been highlighted by the CQC as unacceptable from a regulatory and carestandards point of view.13
Finding ways to reverse this trend is imperative. As well as noting the role of recovery-based care inreducing relapse and crises, the recent Mental Health Crisis Care Concordat highlighted local variationin access to timely crisis resolution services.14 That report stressed the importance of interagency working,and directed a number of ways in which commissioners (NHS England and clinical commissioning groups),local authorities, police, mental health trusts and voluntary sector agencies should work together toimprove outcomes for people with mental health crises. In keeping with this systems-level approach, wesuggest that reducing compulsory admissions may be achieved best (and perhaps only) through localpartnerships in which those responsible for commissioning and delivering services come together toprioritise and then implement interventions by tailoring these to local circumstances.
Conclusions
Using complete data for England, we found that 3.5% of people using specialist secondary care mentalhealth services experienced at least one compulsory admission in 2010/11, defined as time spent in aninpatient mental illness bed under the MHA (2007). Cross-classified multilevel statistical models revealedthat 84.5% of the variance in compulsory admission rates occurred between individuals, 6.7% betweenlocal areas (LSOAs), 2.7% between GP practices and 6.9% between provider trusts. All of these estimatesof variance were statistically significant.
Although we adjusted for a large number of individual-, area- and provider-level variables (includingindividual age, sex and ethnicity, area-level deprivation and mental illness bed occupancy), these explainedonly around 10% of the total variance in the study outcome. People of black ethnicity experiencedcompulsory admission rates almost three times greater than white patients, and compulsory admissionrates increased with area-level deprivation and the proportion of non-white residents in local areas. Therewas a small but statistically significant association between (higher) bed occupancy and compulsoryadmission, but this was confounded by adjusting for other study covariates. Despite evidence of a smallbut significant association between compulsory admission and (greater) investment in community mentalhealth teams, levels of PCT (commissioner) investment in mental health services (whether in total or byspecific community) did not add to the overall model fit after adjusting for individual- and area-levelcharacteristics. Thus, although we were able to determine where variance was occurring (mostly betweenindividuals but also between places and service providers), the exact causes of differences in rates ofcompulsory admission remain largely unexplained.
This was the largest and most complete study of its kind, and the representativeness of the data set was amajor strength. Despite the enormous value of the MHMDS as a research resource, there were inevitablylimitations in the nature, quality and completeness of the (routine) data that were available to us.Data coding practices made it difficult to establish when periods of admission began and ended, and sowe were unable to identify readmissions or to study LOS. The dearth of data regarding the characteristicsof individual patients (including diagnosis, ethnicity and socioeconomic status) meant that we were unableto exclude the confounding some of the associations we identified (e.g. with ethnicity and LSOA-levelethnic density). Although these data limitations could not have altered the results of our null models (orestimates of the variance in compulsory admission at the different levels within our analyses), they mayexplain why we were unable to account for more of this variance in our adjusted models. Finally, we wereunable to consider many of the very salient hypotheses suggested to us by the service users and mental healthprofessionals we consulted as part of the project, which have influenced our research recommendations.
DOI: 10.3310/hsdr02490 HEALTH SERVICES AND DELIVERY RESEARCH 2014 VOL. 2 NO. 49
© Queen’s Printer and Controller of HMSO 2014. This work was produced by Weich et al. under the terms of a commissioning contract issued by the Secretary of State forHealth. This issue may be freely reproduced for the purposes of private research and study and extracts (or indeed, the full report) may be included in professional journalsprovided that suitable acknowledgement is made and the reproduction is not associated with any form of advertising. Applications for commercial reproduction should beaddressed to: NIHR Journals Library, National Institute for Health Research, Evaluation, Trials and Studies Coordinating Centre, Alpha House, University of Southampton SciencePark, Southampton SO16 7NS, UK.
53

Recommendations for future research
We have demonstrated that there is statistically significant (and largely unexplained) variance in compulsoryadmission between places (areas) and mental health provider trusts. Extending these findings requiresmixed methods approaches to (1) undertake longitudinal analysis and (2) generate and test hypothesesabout the causes of the observed variance. There is therefore a need for in-depth qualitative researchto explore factors that might explain local variation in compulsory admission, for which there are noexisting data.
We have confirmed – for the first time – that the MHMDS can be used to address critical researchquestions about the outcomes of mental health care in England. The development of this data set overthe past 18 months (while this study was under way) is likely to have resulted in this excellent resourcebecoming more user- and researcher-friendly in the meantime. There is cause to believe that withinthe next 12 months usable longitudinal MHMDS data may be available for the first time, enabling researchto be undertaken on chronological trends in use of the MHA. Better and more detailed recording ofactivity should also help to overcome the problems we faced in identifying distinct treatment episodes(including the number of admissions and compulsory treatment episodes in any given reporting period).This will be undoubtedly be matched by greater complexity of data management, and this will need to beconsidered when commissioning and resourcing further studies. Nevertheless, MHMDS remains a uniqueand greatly valued research resource, with huge potential to support future studies.
Specific research questions which should be addressed, using a range of methodologies, include:
1. What are the rates and chronological patterns of repeat compulsory admission, and what proportion ofthese are accounted for by the same individuals?
2. How do the characteristics of individual patients, especially diagnosis, previous treatment experiences,length of illness, engagement with care and socioeconomic status affect the likelihood ofcompulsory admission?
3. Given that most of the variance in compulsory admission rates remains unexplained, what effect doother local service characteristics, including the physical, social and therapeutic environments oninpatient units, and continuity of care, have on compulsory admission rates?
4. To what extent do longitudinal trends in compulsory admission rates vary between places? Are thereareas and health-care providers where the rates of increase has been halted or reversed, and are thereplaces where rates are accelerating? Can these differences be explained?
5. What effect do CTOs have on compulsory admission rates over the long term, and can longitudinalanalysis reveal any evidence that these result in fewer patients being readmitted under theMHA (2007)?
6. Around 15% of the variance in compulsory admission occurs between places, mental health-careproviders, GP practices and commissioners. In addition, some of the individual-level variance may reflectpersonal experience of local services. Is it feasible to develop and deliver interventions at the level oflocal health-care systems that could reduce compulsory admissions, and would this prove effective?
There is also an imperative to move towards developing and evaluating interventions to reduce compulsoryadmission rates, but this will depend in part on further mixed-methods research designed to further ourunderstanding of the reasons why these rates remain so high.
DISCUSSION AND CONCLUSIONS
NIHR Journals Library www.journalslibrary.nihr.ac.uk
54

Acknowledgements
This report presents independent research commissioned by the National Institute for Health Research(NIHR). The views and opinions expressed by authors in this publication are those of the authors
and do not necessarily reflect those of the NHS, NIHR, NIHR Evaluation, Trials and Studies CoordinatingCentre (NETSCC), Health Services and Delivery Research (HS&DR) programme or Department of Health.The views and opinions expressed by the PPI participants in this publication are those of the intervieweesand do not necessarily reflect those of the authors or those of the NHS, NIHR, NETSCC, HS&DR programme orDepartment of Health. This project was funded by the NIHR HS&DR programme (project number 10/1011/70).We are grateful to Paddy Cooney from the Mental Health Network (NHS Confederation) for organising andcofacilitating the professionals’ consultation meeting.
Contribution of authors
Scott Weich was the Chief Investigator and guarantor of the research. He had overall responsibility for thedesign, delivery and interpretation of the study findings, as well as research governance and data security.He chaired project team meetings and attended (and co-led) user consultation events. He was responsiblefor the final version of this report.
Orla McBride undertook all of the study analyses, drafted interim and final study reports and contributedfully to the interpretation of the study findings and their reporting.
Liz Twigg provided health geography and multilevel statistical modelling expertise, and advised OM ondata linkages and analyses. She contributed to the management of the study, interpretation and analysisof results, and the drafting of the study reports.
Patrick Keown, Kamaldeep Bhui and Jan Scott contributed to the design of the study, attended projectteam meetings, commented on and contributed to the interpretation of results throughout the project,and commented in detail on study reports.
Helen Parsons was the study statistician and advised on data analysis. She attended project meetings andthe service user consultation meetings, and contributed to interpretation and reporting of study findings.
David Crepaz-Keay was responsible for coordinating and leading the mental health service userconsultation throughout the project. Together with Eva Cyhlarova he attended all project team meetings,drafted the report of the service user involvement work and contributed to the interpretation and reportingof the study findings.
DOI: 10.3310/hsdr02490 HEALTH SERVICES AND DELIVERY RESEARCH 2014 VOL. 2 NO. 49
© Queen’s Printer and Controller of HMSO 2014. This work was produced by Weich et al. under the terms of a commissioning contract issued by the Secretary of State forHealth. This issue may be freely reproduced for the purposes of private research and study and extracts (or indeed, the full report) may be included in professional journalsprovided that suitable acknowledgement is made and the reproduction is not associated with any form of advertising. Applications for commercial reproduction should beaddressed to: NIHR Journals Library, National Institute for Health Research, Evaluation, Trials and Studies Coordinating Centre, Alpha House, University of Southampton SciencePark, Southampton SO16 7NS, UK.
55


References
1. Priebe S, Badesconyi A, Fioritti A, Hansson L, Kilian R, Torrez-Gonzales F, et al.Reinstitutionalisation in mental health care: comparison of data on service provision from sixEuropean countries. BMJ 2005;330:123–6. http://dx.doi.org/10.1136/bmj.38296.611215.AE
2. Thornicroft G, Farrelly S, Szmukler G, Birchwood M, Waheed W, Flach C, et al. Clinical outcomesof Joint Crisis Plans to reduce compulsory treatment for people with psychosis: a randomisedcontrolled trial. Lancet 2013;381:1634–41. http://dx.doi.org/10.1016/S0140-6736(13)60105-1
3. Wall S, Hotopf M, Wessely S, Churchill R. Trends in the use of the Mental Health Act: England,1984–96. BMJ 1999;318:1520–1. http://dx.doi.org/10.1136/bmj.318.7197.1520
4. Hotopf M, Wall S, Buchanan A, Wessely S, Churchill R. Changing patterns in the use of the MentalHealth Act 1983 in England, 1984–1996. Br J Psychiatry 2000;176:479–84. http://dx.doi.org/10.1192/bjp.176.5.479
5. Keown P, Weich S, Bhui KS, Scott J. Association between provision of mental illness beds and rate ofinvoluntary admissions in the NHS in England 1988–2008: ecological study. BMJ 2011;343:d3736.http://dx.doi.org/10.1136/bmj.d3736
6. Salize JH, Dressing H. Epidemiology of involuntary placement of mentally ill people across theEuropean Union. Br J Psychiatry 2004;184:163–8. http://dx.doi.org/10.1192/bjp.184.2.163
7. Lay B, Salize H, Dressing H, Rusch N, Schonenberger T, Buhlmann M, et al. Preventing compulsoryadmission to psychiatric inpatient care through psycho-education and crisis focused monitoring.BMC Psychiatry 2012;12:136. http://dx.doi.org/10.1186/1471-244X-12-136
8. Great Britain. Mental Health Act 2007. London: The Stationery Office; 2007.
9. NHS Information Centre Community and Mental Health Team. In-Patients Formally Detained inHospitals under the Mental Health Act 1983 and Patients Subject to Supervised Community Treatment,Annual Figures, England 2009/10. Leeds: Health and Social Care Information Centre; 2010.
10. Burns T, Rugkåsa J, Molodynski A, Dawson J, Yeeles K, Vazquez-Montes M, et al. Communitytreatment orders for patients with psychosis (OCTET): a randomised controlled trial. Lancet2013;381:1627–33. http://dx.doi.org/10.1016/S0140-6736(13)60107-5
11. Health and Social Care Information Centre, Community and Mental Health Team. InpatientsFormally Detained in Hospitals under the Mental Health Act 1983, and Patients Subject toSupervised Community Treatment: Annual Report, England, 2013. London: Government StatisticalService; 2013.
12. House of Commons Health Committee. Post-Legislative Scrutiny of the Mental Health Act 2007:First Report of Session 2013–14. London: House of Commons; 2013.
13. Care Quality Commission. Monitoring the Mental Health Act in 2012/13. Newcastle upon Tyne:Care Quality Commission; 2014.
14. Department of Health and Concordat signatories. Mental Health Crisis Care Concordat. ImprovingOutcomes for People Experiencing Mental Health Crisis. London: HM Government; 2014.
15. Johnson S. Can we reverse the rising tide of compulsory admissions? Lancet 2013;381:1603–4.http://dx.doi.org/10.1016/S0140-6736(13)60442-0
16. van der Post LFM, Peen J, Dekker JJM. A prediction model for the incidence of civil detention forcrisis patients with psychiatric illnesses; the Amsterdam study of acute psychiatry VII. Soc PsychiatryPsychiatr Epidemiol 2013;49:283–90.
DOI: 10.3310/hsdr02490 HEALTH SERVICES AND DELIVERY RESEARCH 2014 VOL. 2 NO. 49
© Queen’s Printer and Controller of HMSO 2014. This work was produced by Weich et al. under the terms of a commissioning contract issued by the Secretary of State forHealth. This issue may be freely reproduced for the purposes of private research and study and extracts (or indeed, the full report) may be included in professional journalsprovided that suitable acknowledgement is made and the reproduction is not associated with any form of advertising. Applications for commercial reproduction should beaddressed to: NIHR Journals Library, National Institute for Health Research, Evaluation, Trials and Studies Coordinating Centre, Alpha House, University of Southampton SciencePark, Southampton SO16 7NS, UK.
57

17. van der Post LFM, Cornelis L, Mulder CL, Peen J, Visch I, Dekker J, et al. Social support and risk ofcompulsory admission: part IV of the Amsterdam Study of Acute Psychiatry. Psychiatr Serv2012;63:577–83. http://dx.doi.org/10.1176/appi.ps.201100080
18. Davidge M, Elias S, Jayes B, Wood K, Yates J. Survey of English Mental Illness Hospitals.Birmingham: Health Service Management Centre; 1993.
19. National Treatment Agency for Substance Misuse. Falling Drug Use: The Impact of Treatment.London: National Health Service; 2013.
20. Keown P, Mercer G, Scott J. A retrospective analysis of hospital episode statistics, involuntaryadmissions under the Mental Health Act 1983, and the number of psychiatric beds in England1996–2006. BMJ 2008;337:a1837.
21. Bindman J, Tighe J, Thornicroft G, Leese M. Poverty, poor services, and compulsory psychiatricadmission in England. Soc Psychiatry Psychiatr Epidemiol 2002;37:341–5. http://dx.doi.org/10.1007/s00127-002-0558-3
22. Weich S, Griffith L, Commander M, Bradby H, Sashidharan SP, Pemberton S, et al. Experiences ofacute mental health care in an ethnically diverse inner city: qualitative interview study. SocPsychiatry Psychiatr Epidemiol 2012;47:119–28. http://dx.doi.org/10.1007/s00127-010-0314-z
23. Commission for Healthcare Audit and Inspection. The Pathway to Recovery: A Review of NHSAcute Inpatient Mental Health Services. London: Healthcare Commission; 2008.
24. Rethink. Future Perfect? Outlining an Alternative to the Pain of Psychiatric In-Patient Care. Kingstonupon Thames: Rethink Severe Mental Illness; 2005.
25. Saxena S, Thornicroft G, Knapp M, Whiteford H. Resources for mental health: scarcity, inequity,and inefficiency. Lancet 2007;370:878–89. http://dx.doi.org/10.1016/S0140-6736(07)61239-2
26. World Health Organization (WHO). Mental Health Atlas. Geneva: WHO; 2005.
27. Mental Health Strategies. 2009/10 National Survey of Investment in Adult Mental Health Services.London: Department of Health; 2010. URL: www.gov.uk/government/uploads/system/uploads/attachment_data/file/216595/dh_117695.pdf (accessed 28 October 2014).
28. Mental Health Act Commission. Count Me In: Results of a National Census of Inpatients in MentalHealth Hospitals and Facilities in England and Wales. London: Commission for Healthcare Auditand Inspection; 2005.
29. Mental Health Act Commission. Count Me In 2007: Results of the 2007 National Census ofInpatients in Mental Health and Learning Disability Services in England and Wales. London:Commission for Healthcare Audit and Inspection; 2007.
30. Mental Health Act Commission. Count Me In 2008: Results of the 2008 National Census ofInpatients in Mental Health and Learning Disability Services in England and Wales. London:Commission for Healthcare Audit and Inspection; 2008.
31. Bhui K, Stansfeld S, Hull S, Priebe S, Mole F, Feder G. Ethnic variations in pathways to anduse of specialist mental health services in the UK. Br J Psychiatry 2003;182:105–16.http://dx.doi.org/10.1192/bjp.182.2.105
32. Sainsbury Centre for Mental Health. Breaking the Circles of Fear: A Review of the Relationshipbetween Mental Health Services and the African and Caribbean Communities. London:SCMH; 2002.
33. Morgan C, Mallett R, Hutchinson G, Leff J. Negative pathways to psychiatric care and ethnicity: thebridge between social science and psychiatry. Soc Sci Med 2004;58:739–52.http://dx.doi.org/10.1016/S0277-9536(03)00233-8
REFERENCES
NIHR Journals Library www.journalslibrary.nihr.ac.uk
58

34. Commander MJ, Sashidharan SP, Odell SM, Surtees PG. Access to mental health services inan inner city health district. II: associations with demographic factors. Br J Psychiatry1997;170:317–20. http://dx.doi.org/10.1192/bjp.170.4.317
35. Singh SP, Burns T, Tyrer P, Islam Z, Parsons H, Crawford MJ. Ethnicity as a predictor of detentionunder the Mental Health Act. Psychol Med 2014;44:997–1004. http://dx.doi.org/10.1017/S003329171300086X
36. Morgan C, Mallet R, Hutchinson G, Bagalkote H, Morgan K, Fearon P, et al. Pathways to care andethnicity. I: sample characteristics and compulsory admission. Br J Psychiatry 2005;186:281–9.http://dx.doi.org/10.1192/bjp.186.4.281
37. Commander MJ, Cochrane R, Sashidharan SP, Akilu F, Wildsmith E. Mental health care for Asian,black and white patients with non-affective psychoses: pathways to psychiatric hospital, in-patientand aftercare. Soc Psychiatry Psychiatr Epidemiol 1999;34:484–91. http://dx.doi.org/10.1007/s001270050224
38. Department of Health. Delivering Race Equality in Mental Health Services: An Action Plan forReform Inside and Outside Services. London: Department of Health; 2005.
39. Appleby L. Services for ethnic minorities: a question of trust. Psychiatr Bull 2008;32:401–2.http://dx.doi.org/10.1192/pb.bp.107.018895
40. NIMHE. Inside Outside: Improving Mental Health Services for Black and Minority Ethnic Groups inEngland. Leeds: Department of Health; 2003.
41. Appleby L. The National Service Framework for Mental Health: Five Years On. London: Departmentof Health; 2004.
42. Appleby J, Gregory S. NHS Spending. Local Variations in Priorities: An Update. London: The King’sFund; 2008.
43. Katsakou C, Rose D, Amos T, Bowers L, McCabe R, Oliver D, et al. Psychiatric patients’ views onwhy their involuntary hospitalisation was right or wrong: a qualitative study. Soc PsychiatryPsychiatr Epidemiol 2012;47:1169–79. http://dx.doi.org/10.1007/s00127-011-0427-z
44. Jankovic J, Yeeles K, Katsakou C, Amos T, Morriss R, Rose D, et al. Family caregivers’ experiencesof involuntary psychiatric hospital admissions of their relatives: a qualitative study. PLOS ONE2011;6:e25425. http://dx.doi.org/10.1371/journal.pone.0025425
45. Weich S. Availability of inpatient beds for psychiatric admissions in the NHS. BMJ 2008;337:970–1.http://dx.doi.org/10.1136/bmj.a1561
46. Kallert TW, Glockner M, Schutzwohl M. Involuntary vs. voluntary hospital admission: a systematicliterature review on outcome diversity. Eur Arch Psychiatry Clin Neurosci 2008;258:195–209.http://dx.doi.org/10.1007/s00406-007-0777-4
47. Holloway F. ‘Gentlemen, we have no money therefore we must think’: mental health services inhard times. Psychiatrist 2011;35:81–3. http://dx.doi.org/10.1192/pb.bp.110.030627
48. Dean C, Phillips J, Gadd E, Joseph M, England S. Comparison of a community based service with ahospital based service for people with acute, severe psychiatric illness. BMJ 1993;307:642–6.http://dx.doi.org/10.1136/bmj.307.6902.473
49. Glover G, Arts G, Babu KS. Crisis resolution/home treatment teams and psychiatric admission ratesin England. Br J Psychiatry 2006;189:441–5. http://dx.doi.org/10.1192/bjp.bp.105.020362
50. Craig TKJ, Garety P, Power P, Rahaman N, Colbert S, Fornells-Ambrojo M, et al. The Lambeth EarlyOnset (LEO) Team: randomised controlled trial of the effectiveness of specialised care for earlypsychosis. BMJ 2004;329:1067–71. http://dx.doi.org/10.1136/bmj.38246.594873.7C
DOI: 10.3310/hsdr02490 HEALTH SERVICES AND DELIVERY RESEARCH 2014 VOL. 2 NO. 49
© Queen’s Printer and Controller of HMSO 2014. This work was produced by Weich et al. under the terms of a commissioning contract issued by the Secretary of State forHealth. This issue may be freely reproduced for the purposes of private research and study and extracts (or indeed, the full report) may be included in professional journalsprovided that suitable acknowledgement is made and the reproduction is not associated with any form of advertising. Applications for commercial reproduction should beaddressed to: NIHR Journals Library, National Institute for Health Research, Evaluation, Trials and Studies Coordinating Centre, Alpha House, University of Southampton SciencePark, Southampton SO16 7NS, UK.
59

51. Johnson S, Nolan F, Pilling S, Sandor A, Hoult J, McKenzie N, et al. Randomised controlled trial ofacute mental health care by a crisis resolution team: the north Islington crisis study. BMJ2005;331:586–90. http://dx.doi.org/10.1136/bmj.38519.678148.8F
52. Flood C, Byford S, Henderson C, Leese M, Thornicroft G, Sutherby K, et al. Joint crisis plans forpeople with psychosis: economic evaluation of a randomised controlled trial. BMJ 2006;333:729.http://dx.doi.org/10.1136/bmj.38929.653704.55
53. Campbell LA, Kisely SR. Advance treatment directives for people with severe mental illness.Cochrane Database Syst Rev 2009;1:CD005963. http://dx.doi.org/10.1002/14651858.CD005963.pub2
54. NHS Information Centre Mental Health and Community Team. Mental Health Bulletin: Fifth Reportfrom Mental Health Minimum Dataset (MHMDS) Annual Returns, 2011. Leeds: Health and SocialCare Information Centre; 2011.
55. NHS Information Centre. National Dataset Services: Draft Mental Health Minimum Dataset(MHMDS) (MHMDS) v3.0 Specification and Guidance. Leeds: NHS Information Centre for Healthand Social Care; 2008.
56. Department of Health. The Health of the Nation: A Strategy for Health in England. London:HMSO; 1992.
57. Glover G. Adult mental health care in England. Eur Arch Psychiatry Clin Neurosci 2007;257:71–82.http://dx.doi.org/10.1007/s00406-006-0694-y
58. Information Standards Board for Health and Social Care. The Mental Health Minimum Datasetv4.1. Leeds: Information Standards Board for Health and Social Care; 2012.
59. NHS Information Centre Mental Health and Community Team. MHMDS Statistics: Data Quality andMethodology. Leeds: Health and Social Care Information Centre; 2011.
60. Great Britain. Mental Health Act 1983. London: The Stationery Office; 1983.
61. Great Britain. Care Standard Act 2000. London: The Stationery Office; 2000.
62. Department for Communities and Local Government. The English Indices of Deprivation 2010:Neighbourhoods, Statistical Release. London: Department for Communities and LocalGovernment; 2011.
63. Office for National Statistics. 2011 Census: Population and Household Estimates for Englandand Wales, March 2011. Statistical Bulletin. 2012. URL: www.ons.gov.uk/ons/rel/census/2011-census/population-and-household-estimates-for-england-and-wales/stb-e-w.html(accessed 28 October 2014).
64. Office for National Statistics. Super Output Areas 2011. URL: www.ons.gov.uk/ons/guide-method/geography/beginner-s-guide/census/super-output-areas–soas-/index.html(accessed 28 October 2014).
65. Department of Health. KH03 Quarterly Bed Availability and Occupancy UNIFY2 Non-DCT ProviderCollection: Data Definitions. 2010. URL: www.england.nhs.uk/statistics/wp-content/uploads/.../dh_124212-5.doc (accessed 28 October 2014).
66. Healthcare Commission and National Centre for Social Research. Mental Health Acute InpatientService Users Survey, 2009. Colchester: UK Data Archive; 2010.
67. Care Quality Commission. 2009 Mental Health Inpatient Survey: ‘Experience of Patients’Performance Indicator Calculation 2009. URL: www.nhssurveys.org/surveys/520(accessed 28 October 2014).
REFERENCES
NIHR Journals Library www.journalslibrary.nihr.ac.uk
60

68. Care Quality Commission. Mental Health Trusts: Community Mental Health Service User Survey,2010. Colchester: UK Data Archive; 2010.
69. Care Quality Commission. Mental Health Trusts: Community Mental Health Service User Survey,2010: NHS National Patient Survey Programme: Data Weighting Issues 2011.URL: www.nhssurveys.org/surveys/606 (accessed 28 October 2014).
70. Fielding A, Goldstein H. Cross-Classified and Multiple Membership Structures in Models: AnIntroduction and Review. Research Report RR791 for DfES. London: Department for Education andSkills; 2006.
71. Goldstein H, Rasbash J. Improved approximations for multilevel models with binary responses.J R Stat Soc Ser A 1996;159:505–13. http://dx.doi.org/10.2307/2983328
72. Raftery AE, Lewis SM. One long run with diagnostics: implementation strategies for Markov chainMonte Carlo. Stat Sci 1992;7:493–7. http://dx.doi.org/10.1214/ss/1177011143
73. Spiegelhalter D, Best N, Carlin B, van der Linde A. Bayesian measures of model complexity and fit.J R Stat Soc Ser B 2002;64:583–639. http://dx.doi.org/10.1111/1467-9868.00353
74. Centre for Multilevel Modelling. An Introduction to MCMC Methods and Bayesian Statistics.Bristol: University of Bristol; 2012.
75. Schwartz G. Estimating the dimension of a model. Ann Stat 1978;6:461–4. http://dx.doi.org/10.1214/aos/1176344136
76. Akaike H. Factor analysis and the AIC. Psychometrika 1987;52:317–32. http://dx.doi.org/10.1007/BF02294359
77. Software BUGS. Advanced Use of BUGS Language 2009. URL: www://openbugs.net/w/FrontPage(accessed 28 October 2014).
78. Snijders TA, Bosker RJ. Introduction to Multilevel Analysis. London: Sage; 1999.
79. Little RJA, Rubin DB. Statistical Analysis with Missing Data. New York, NY: Wiley; 1987.
80. Cohen J, Cohen P. Applied Multiple Regression and Correlation Analysis for the BehavioralSciences. 2nd edn. Hillsdale, NJ: Erlbaum; 1985.
81. Clarke P. When can group level clustering be ignored? Multilevel models versus single-level modelswith sparse data. J Epidemiol Community Health 2008;62:752–8. http://dx.doi.org/10.1136/jech.2007.060798
82. Rasbash J, Steele F, Browne WJ, Goldstein H. A User’s Guide to MLwiN, v2.26. Centre forMultilevel Modelling: University of Bristol; 2012.
83. Johnson S, Gilburt H, Lloyd-Evans B, Osborn DPJ, Boardman J, Leese M, et al. In-patient andresidential alternatives to standard acute psychiatric wards in England. Br J Psychiatry2009;194:456–63. http://dx.doi.org/10.1192/bjp.bp.108.051698
84. Morant N, Lloyd-Evans B, Gilburt H, Slade M, Osborn D, Johnson S. Implementing successfulresidential alternatives to acute in-patient psychiatric services: lessons from a multi-centre study ofalternatives in England. Epidemiol Psychiatr Sci 2012;21:175–85. http://dx.doi.org/10.1017/S204579601100076X
85. Wierdsma AI, Mulder CL. Does mental health service integration affect compulsory admissions?Int J Integr Care 2009;9:e90.
86. NHS Information Centre, Community and Mental Health Team. In-Patients Formally Detained inHospitals under the Mental Health Act, 1983, and Patients Subject to Supervised CommunityTreatment, Annual Figures, England 2010/11. Leeds: Health and Social Care InformationCentre; 2011.
DOI: 10.3310/hsdr02490 HEALTH SERVICES AND DELIVERY RESEARCH 2014 VOL. 2 NO. 49
© Queen’s Printer and Controller of HMSO 2014. This work was produced by Weich et al. under the terms of a commissioning contract issued by the Secretary of State forHealth. This issue may be freely reproduced for the purposes of private research and study and extracts (or indeed, the full report) may be included in professional journalsprovided that suitable acknowledgement is made and the reproduction is not associated with any form of advertising. Applications for commercial reproduction should beaddressed to: NIHR Journals Library, National Institute for Health Research, Evaluation, Trials and Studies Coordinating Centre, Alpha House, University of Southampton SciencePark, Southampton SO16 7NS, UK.
61

87. Raleigh VS, Irons R, Hawe E, Scobie S, Cook A, Reeves R, et al. Ethnic variations in the experienceof mental health service users in England. Br J Psychiatry 2007;191:304–12. http://dx.doi.org/10.1192/bjp.bp.106.032417
88. Thornicroft G, Farrelly S, Birchwood M, Marshall M, Szmukler G, Waheed W, et al. CRIMSON[CRisis plan IMpact: Subjective and Objective coercion and eNgagement] protocol: a randomisedcontrolled trial of joint crisis plans to reduce compulsory treatment of people with psychosis.Trials 2010;11:102. http://dx.doi.org/10.1186/1745-6215-11-102
89. Barrett B, Waheed W, Farrelly S, Birchwood M, Dunn G, Flach C, et al. Randomised controlled trialof joint crisis plans to reduce compulsory treatment for people with psychosis: economic outcomes.PLOS ONE 2013;8:e74210. http://dx.doi.org/10.1371/journal.pone.0074210
90. Burns T, Molodynski A. Community treatment orders: background and implications of the OCTETtrial. Psychiatrist 2014;38:3–5. http://dx.doi.org/10.1192/pb.bp.113.044628
91. Sutherby K, Szmukler GI, Halpern A, Alexander M, Thornicroft G, Johnson C, et al. A study of‘crisis cards’ in a community psychiatric service. Acta Psychiatr Scand 1999;100:56–61.http://dx.doi.org/10.1111/j.1600-0447.1999.tb10914.x
92. Dyer C. Psychiatrists are concerned by rise in patients subject to compulsory mental healthtreatment. BMJ 2010;341:c5596. http://dx.doi.org/10.1136/bmj.c5596
93. Gould M. Mental health patients complain of ‘zombification’. The Guardian, 16 March 2011;Sect. Society.
94. Snijders TAB, Bosker RJ. Multilevel Analysis: an Introduction to Basic and Advanced MultilevelModeling. London: Sage; 1999.
95. NHS Information Centre, Mental Health and Community Team. Mental Health Bulletin. FourthReport from Mental Health Minimum Dataset (MHMDS) Annual Returns, 2010. London: Healthand Social Care Information Centre; 2011.
96. Goldstein H. Multilevel Statistical Models. London: Edward Arnold; 1995.
97. Browne WJ. MCMC Estimation in MLwiN v2.1. Centre for Multilevel Modelling: University ofBristol; 2009.
REFERENCES
NIHR Journals Library www.journalslibrary.nihr.ac.uk
62

Appendix 1 Original study protocol
Full title of project
Understanding the Increasing Rate of Involuntary Admissions in NHS Mental Health Care.
Aims and objectives
Involuntary admissions under the Mental Health Act in England have increased dramatically in the last20 years, and this coincides with an equally stark reduction in mental health bed numbers. It is alsorecognised that people from black and minority ethnic communities are consistently over-representedamong those detained in psychiatric hospitals and in secure settings. Bed reductions may disproportionatelyaffect their detention rates as well as the detention rates of other groups that share the same mediatingcharacteristics, for example residing in urban and/or deprived areas.
Our aims will be to explore variation between places in England in rates of involuntary admission and toidentify factors that might explain this, including socio-economic context (e.g. area deprivation), featuresof local services (including level of investment by commissioners), and characteristics of service users(especially socio-economic status and ethnicity). Interpretation of the study findings and their translationinto actionable conclusions for the NHS will be aided by consultation with mental health service users andsenior NHS managers.
Research questions
1. How variable are rates of involuntary admission across different places, namely Strategic HealthAuthorities (SHAs), NHS Trusts and independent sector hospitals, and Primary Care Trusts (PCTs)in England?
2. To what extent is this variance explained by local factors, such as small area socio-economic deprivation,urbanicity, ethnic density, PCT investment in mental health services, and by characteristics of localmental health services including the availability and occupancy of NHS mental illness beds?
3. To what extent is variance in rates of involuntary admission explained by local factors, such as smallarea socio-economic deprivation, urbanicity, ethnic density, PCT investment in mental health services,and by features of local mental health services and the experiences of those who use them?
4. To what extent is variance in rates of involuntary admission explained by the characteristics of peopleusing services, including socio-economic status and ethnicity?
5. Is there evidence of geographical variation in the use of Community Treatment Orders (CTOs),and if so, how is this associated with bed numbers and occupancy, length of stay, area-level factors(like deprivation and PCT investment), experience and quality of local services, and rates ofinvoluntary admission?
6. Using the model of best fit based on local services and settings and including historical data on trendsin bed numbers, can we predict the future need for involuntary treatment with sufficient accuracy tosupport commissioners and NHS managers in determining optimal local bed numbers?
DOI: 10.3310/hsdr02490 HEALTH SERVICES AND DELIVERY RESEARCH 2014 VOL. 2 NO. 49
© Queen’s Printer and Controller of HMSO 2014. This work was produced by Weich et al. under the terms of a commissioning contract issued by the Secretary of State forHealth. This issue may be freely reproduced for the purposes of private research and study and extracts (or indeed, the full report) may be included in professional journalsprovided that suitable acknowledgement is made and the reproduction is not associated with any form of advertising. Applications for commercial reproduction should beaddressed to: NIHR Journals Library, National Institute for Health Research, Evaluation, Trials and Studies Coordinating Centre, Alpha House, University of Southampton SciencePark, Southampton SO16 7NS, UK.
63

Background
See Final Study Protocol.
How the proposed research will add to the body of knowledge withreference to current NHS policy and practiceSee Final Study Protocol.
Importance of the proposed researchSee Final Study Protocol.
Research methods
DesignSecondary analysis of routinely collected data. Data will be organised to permit analysis as cross-sectionalsurvey, cohort and (nested) case control studies.
Data sourcesMost of the data for the proposed study will be obtained from the NHS Information Centre(http://www.ic.nhs.uk), which is responsible for collecting and collating national health and socialcare data in the UK. The Information Centre also provides support and advice to end users through itsSecondary Uses Service (SUS) and Medical Research Information Service (http://www.connectingforhealth.nhs.uk/systemsandservices/sus and http://www.ic.nhs.uk/services/medical-research-information-service),in partnership with NHS Connecting for Health. The NHS Information Centre ensures appropriategovernance checks for the use of these data, to protect the confidentiality of those on whom data iscollected, through the National information Governance Board for Health and Social Care (NIGB).The NHS Information Centre also collates geographical data, including deprivation and otherneighbourhood statistics, and provides support in ensuring appropriate linkage to other data sets(http://www.ic.nhs.uk/services/population-geography-information/geographical-information).
The data archive at the NHS Information Centre includes historic information on geographic boundaries andorganisation changes in the NHS, which will enable us to track this over time and to make adjustments forchanges over time in the configuration of boundaries relating to the regulation, commissioning and deliveryof NHS services. One example of this is the PCT mapping tool (http://www.ic.nhs.uk/statistics-and-data-collections/population-and-geography/pct-mapping-tool), which enables older service use data to becorrectly mapped onto current PCT boundaries (http://www.statistics.gov.uk/geography/england_health.asp).
The significant investment on the part of the NHS in software resources and staffing to support secondaryusers through the NHS Information Centre represents a major strength of the proposed research. Althoughthe proposed data linkages will be methodologically challenging, we are confident that the study aimsare achievable.
The data sets which we propose to access and link are set out below in Table 9, followed by more detaileddescriptions about each of these. Outcomes will be ascertained using the first two of these data sets(Mental Health Minimum Dataset and Hospital Episode Statistics); the remainder will be used to provideexposure (risk factor) information via data linkage. The data on In-Patients Formally Detained in Hospitalwill be used to validate data on involuntary admissions in MHMDS and HES, and to generate studyweights if necessary.
APPENDIX 1
NIHR Journals Library www.journalslibrary.nihr.ac.uk
64

1. Mental Health Minimum Dataset (MHMDS)The Mental Health Minimum Dataset will be our primary data source for the main cross-sectional analysesin this study, by virtue of the detail recorded at the individual patient level. Although (limited) MHMDS dataare available from 2003, comprehensive data on service use are available from 2007/8 to present. Thisincludes anonymised record-level (i.e. individual patient-level) data about adults and older people usingsecondary mental health services. The Mental Health Minimum Data Set describes Adult Mental HealthCare Spells, and is based on quarterly returns from NHS Trusts. MHMDS includes records of voluntary andinvoluntary in-patient admission, out-patient attendances, day treatment and all other episodes of care.The MHMDS data is reported quarterly and describes complete spells of care for an individual, from initialreferral to final discharge.
Rather than counting uses of the Mental Health Act, MHMDS counts people subject to the Act andprovides opportunity for analysis by age and ethnic group. Such information is not part of the collectionthat provides the source data for the National Statistics (known as KP90), which is reported in In-PatientsFormally Detained in Hospital, IPFDH (see below). Involuntary admissions are denoted by recording legalstatus at end of reporting period, coded using the most restrictive legal status (i.e. whether detained ortreated informally) that applied during the (quarterly) reporting period. Community Treatment Orders andtheir revocation and recall to hospital are also recorded in MHMDS, and we will validate this data againstIPFDH. A unique patient identifier (the MHMDS ID) is attached to each record making it possible to linkmultiple spells of care for an individual patient across different reporting periods and different providers.
TABLE 9 Data sets to be used (sources of outcome variables in bold)
Dataset Key variables Smallest data levelLevel of proposedlinkage
Availablefrom
Mental HealthMinimum Dataset(MHMDS)
Patients admitted involuntarily;patient characteristics inc ethnicityand SES; HoNOS scores
Individual PCT 2007/8
Hospital EpisodeStatistics (HES)
All admissions, inc involuntaryadmissions; diagnosis, length ofstay; patient characteristics incethnicity and SES
Individual PCT 1998/99
In-PatientsFormally Detainedin Hospital (IPFDH)
All in-patient episodes involvingMHA; type of section; whetheradmitted voluntarily then detained;CTOs (from 2008/9). To be used tovalidate outcomes from MHMDSand HES
Provider (Trust orindependent hospital)
Provider 1998/99
Beds OpenOvernight (BOO)previously HospitalActivity Statistics
Bed numbers inc availabilityand occupancy
Provider (Trust orindependent hospital)
Provider 2000/1
CommunityMental HealthActivities(CMHA)
Contacts with community services,esp. crisis teams, assertive outreachand early intervention services
NHS Trust Provider (NHS Trust) 2003/4
National PatientSurvey (NPS)
Patient experiences of andsatisfaction with care; patient choice
Provider (NHS Trust) Provider (NHS Trust) 2004/5
Investment inMental HealthServices (IMHS)
Spend per person on mental healthcare for adults of working age
PCT PCT 2003/4
Census & othergeographical data
Area-level features (e.g. urbanicity,socio-economic deprivation) andpopulation composition
Census output area,electoral ward, localauthority districtor PCT
PCT 2001(inc. mid-yearestimates)
DOI: 10.3310/hsdr02490 HEALTH SERVICES AND DELIVERY RESEARCH 2014 VOL. 2 NO. 49
© Queen’s Printer and Controller of HMSO 2014. This work was produced by Weich et al. under the terms of a commissioning contract issued by the Secretary of State forHealth. This issue may be freely reproduced for the purposes of private research and study and extracts (or indeed, the full report) may be included in professional journalsprovided that suitable acknowledgement is made and the reproduction is not associated with any form of advertising. Applications for commercial reproduction should beaddressed to: NIHR Journals Library, National Institute for Health Research, Evaluation, Trials and Studies Coordinating Centre, Alpha House, University of Southampton SciencePark, Southampton SO16 7NS, UK.
65
This process will also ensure that an involuntary admission spanning two or more reporting periods is notdouble counted when data are aggregated for the whole year. MHMDS also includes geographicidentifiers (Trust or hospital, PCT and electoral ward of residence) and patient-level data on socio-economicstatus (employment, accommodation status), ethnicity, diagnosis and Health of the National OutcomeScale (HoNOS) ratings (a validated measure of clinical status).
We will use MHMDS data for 4 years (2007/8 through 2010/11). We will seek NHS Research Ethics approvalfor our research, and will apply to the NHS Information Centre through its Security and ConfidentialityAdvisory Group for access to anonymised patient-level MHMDS data. Data from independent sector providerswill be available for the first time with the 2010/11 MHMDS release in January 2012. The advantage ofMHMDS over other data sets, and especially Hospital Episode Statistics (HES), is that it comprises all episodesof mental health treatment regardless of setting. HES is restricted to in-patient admissions and hospitalout-patient attendances but does not include use of community mental health services.
2. Hospital Episode Statistics (HES)HES contains details of all admissions (including those under the Mental Health Act) to NHS hospitals andindependent hospitals in England funded by the NHS. HES also contains details of all NHS outpatientappointments in England and is available from 1998 to the present.
HES comprises patient-level records and contains data on diagnosis, length of stay, age, gender andethnicity. It also includes information about where treatment was delivered and place of residence. We willseek NHS Research Ethics approval for our research, and will apply to the NHS Information Centre throughits Security and Confidentiality Advisory Group for access to anonymised, patient-level HES data. We shallalso seek access to hospital admission data aggregated at the level of Census Outputs Areas as well asPCTs. This will enable linkage to other data sources, particularly the Mental Health Minimum Dataset(MHMDS). One major advantage of HES data is the length of time over which these have been collected.This will enable us to model trajectories of admissions and detentions by place over time, and to explorethe extent to which these patterns are explained by individual- and area-level characteristics.
3. In-Patients Formally Detained in Hospital (IPFDH)This data set includes information about all admissions to hospital under the Mental Health Act (MHA) anddetentions after admission. This includes admission to in-patient units managed by NHS Trusts (includingmedium secure forensic units), the three high security ‘special’ psychiatric hospitals (Broadmoor, Ramptonand Ashworth), and independent hospitals as defined by the Care Standards Act 2000. IPFDH is basedon KP90 returns from providers and includes data on Supervised Community Treatment Orders (CTOs), whichwere introduced in November 2008 following changes to the Mental Health Act in 2007. Data is available bytype of section, reason for detention (mental illness versus mental impairment) and by change of status(i.e. informal admission followed by detention). Data in IPFDH (e.g. total number of detentions per annum) areaggregated at the level of mental health service provider: http://www.ic.nhs.uk/pubs/inpatientdetmha0910.
Since they are based on official returns from all providers, these data are probably the most accurate in therecording of involuntary admissions. They will therefore be used to validate the data found in HES andMHMDS. The latter may prove the least accurate, since legal status is recorded only once for each reportingperiod, possibly resulting in an under-estimate of the total number of involuntary admissions. We willexplore using findings from IPFDH to weight data obtained from HES and MHMDS, should differences inreported rates of involuntary admission be identified between these data sets.
4. Beds Open Overnight (BOO)The number of available and occupied NHS mental illness and learning disability beds are available via theDepartment of Health, and comprise aggregated quarterly KH03 returns by each provider. These data areavailable from 2000, and were previously known as Hospital Activity Statistics: http://www.dh.gov.uk/en/Publicationsandstatistics/Statistics/Performancedataandstatistics/Beds/index.htm.
APPENDIX 1
NIHR Journals Library www.journalslibrary.nihr.ac.uk
66
5. Community Mental Health Activities (CMHA)In 2003 the Department of Health began collecting information regarding community mental health teamsvia UNIFY2. The scope of this data set was later altered (in 2009) to concentrate on the activity of specialistcommunity mental health services, specifically Crisis Resolution Home Treatment, Early Intervention andAssertive Outreach teams. The quarterly CMHA data set also includes information about follow-up ofpatients admitted to hospital under the Care Programme Approach (CPA). These data are aggregated atprovider level but also include information about patient sex and ethnicity. This data set will provide aninvaluable barometer of the activity of those community services that are viewed as critical to the acutecare pathway in adult mental health services: http://www.ic.nhs.uk/services/omnibus-survey/using-the-service/data-collections/community-mental-health-activities.
6. National Patient Survey (NPS)The NHS Patient Surveys are coordinated by Picker Institute Europe on behalf of the Care Quality Commission(http://www.nhssurveys.org) and the data are available via the UK Data Archive (http://www.data-archive.ac.uk).Surveys of community mental health service users were undertaken from 2004 to 2008, and again in 2010 and2011. A survey of users of in-patient mental health services was undertaken in 2009. Data were collected byquestionnaire from between 17,000 and 27,000 users of community mental health services at each survey,and from around 7,500 users of in-patient services. The latter highlighted service users’ concerns about alack of safety on some wards. Both community and in-patient surveys include data on experiences of care,involvement in decision-making, perceived quality of relationships with professionals, treatments offered andsatisfaction with care. Recent surveys have collected data on service users’ ethnicity. These data are aggregatedat provider level, enabling linkage with other data sets.
7. Investment in Mental Health Services (IMHS)The Department of Health sponsors the annual National Survey of Investment in Adult Mental HealthServices, an annual finance mapping exercise regarding spending on mental health services in England.Data are available for each year since 2003, and provide details of investment in mental health servicesfor working age adults (aged 18-64) in England, by PCT (commissioner). Previous years’ investment havebeen adjusted by the GDP Deflator Figures for 31 March 2010 published by HM Treasury to reflectpast investment at today’s prices: http://www.dh.gov.uk/en/Publicationsandstatistics/Publications/PublicationsPolicyAndGuidance/DH_117488.
8. Census and other geographical dataWe will use area-level deprivation indices to characterise the places in which services are delivered. Wewill use population statistics (mostly derived from the UK census) to estimate ethnic composition) andpopulation density for different areas, and across different spatial levels as determined by the other datasets to which we will establish linkages. The Office for National Statistics provides details on urbanicity viathe England and Wales Rural/Urban definition (http://www.ons.gov.uk/about-statistics/geography/products/area-classifications/rural-urban-definition-and-la-classification/rural-urban-definition/index.html).
ParticipantsSee Final Study Protocol.
SettingSee Final Study Protocol.
Primary outcomeSee Final Study Protocol.
DOI: 10.3310/hsdr02490 HEALTH SERVICES AND DELIVERY RESEARCH 2014 VOL. 2 NO. 49
© Queen’s Printer and Controller of HMSO 2014. This work was produced by Weich et al. under the terms of a commissioning contract issued by the Secretary of State forHealth. This issue may be freely reproduced for the purposes of private research and study and extracts (or indeed, the full report) may be included in professional journalsprovided that suitable acknowledgement is made and the reproduction is not associated with any form of advertising. Applications for commercial reproduction should beaddressed to: NIHR Journals Library, National Institute for Health Research, Evaluation, Trials and Studies Coordinating Centre, Alpha House, University of Southampton SciencePark, Southampton SO16 7NS, UK.
67

Data analysis
We will undertake both cross-sectional and longitudinal analyses, and both will require significant datalinkage between multiple data sets. This linkage will take place at the smallest possible spatial scale:as indicated above, in our description of the data sets to be used, the most common linkages will be byprovider Trust and (commissioning) PCT. The primary statistical technique employed will be multilevelmodelling, which mirrors the structure of the data to be analysed and allows explanation to be correctlyassigned to the various ‘levels’ within the data set (i.e. individual or area) and is therefore a widely usedmethod for analysing nested (or clustered) data.
Strategy of analysis1. Cross-sectional multilevel analysis using patient-level data at the lowest level. MHMDS will be used forthis (rather than Hospital Episode Statistics) since the data comprise information about all those usingmental health services rather than just those admitted to hospital. The reference group will therefore bethose receiving mental health care but not admitted to hospital involuntarily. This will have the advantageof adjusting for the overall prevalence of mental illness in particular areas, and for the accessibility ofmental health services generally (36). This is not the case for HES data, where the reference populationwould be those using hospital services (in-patients admitted voluntarily and those seen in hospitalout-patient clinics) but not including those accessing community mental health services. We will explorethe possibility of pooling two years’ worth of MHMDS data to optimise the sample size.
Data from other sources will be linked at the appropriate level, e.g. by PCT and/or Trust. This will enable us(for example) to explore the effects of age, sex, ethnicity (at the individual level), bed numbers (and typesof available beds), overall bed occupancy rates, average length of in-patient stay (at Trust level), investmentin services (at PCT level) and socio-economic deprivation, urbanicity and ethnic composition (at area level)on the likelihood that a user of mental health services will be admitted to hospital involuntarily. As well asassessing the main effects of these risk factors, we will explore variance at different spatial scales and testfor cross-level interactions, ie the extent to which associations vary between places.
2. Cross-sectional multi-level analysis using aggregated involuntary admissions by PCT. The data set ofchoice for this analysis will be Hospital Episode Statistics (HES) for 2009/10, validated against data for thesame year from In-Patients Formally Detained in Hospital (IPFDH) (and weighted if necessary). IPFDH dataare obtained from providers in statutory returns. HES is preferred to IPFDH for these analyses becausedata can be aggregated at PCT (and even Census Output Area) level rather than provider (Trust); and HESis preferred to MHMDS because of its more detailed recording of involuntary in-patient spells, and becauseit contains information about numbers of in-patient episodes and length of stay. Unlike MHMDS, HESdistinguishes between admissions under the Mental Health Act (from the outset) and those whereadmission was initially voluntary and where the person was later detained. Both HES and IPFDH includedata on admissions to independent sector facilities that are funded by the NHS; these data are not yetavailable in MHMDS. We will explore variance at different spatial scales, assess the extent to which this isaccounted for by a range of explanatory variables and test for cross-level interactions, i.e. the extent towhich associations vary between places.
3. Longitudinal analyses. The primary aim of this research is to understand the determinants of changingrates of involuntary admission. Therefore the preferred data set for our longitudinal analyses will HospitalEpisode Statistics (HES), which are available from 1998 to the present. As for our cross-sectional analyses,we will undertake a validation exercise comparing HES with data from IFDH, and where necessary we willderive appropriate weights.
Longitudinal analysis of HES data will explore and assess the extent to which increases in rates ofinvoluntary admission over time vary between PCTs and between different areas of England (includingcomparing urban versus other types of area), or whether these increases are similar across the country.We will also test hypotheses about changes in rates of involuntary admission and prior (time lagged)
APPENDIX 1
NIHR Journals Library www.journalslibrary.nihr.ac.uk
68

changes in bed numbers, bed occupancy, and/or in the experiences of, and investment in, mental healthservices. Data linkage and the number of years for which data are available will enable us to explore andmodel the effects of variables at different spatial levels, and over different intervals. These analyses will alsoallow us to explore the effects of changes to the Mental Health Act in 2007, and the introduction ofCommunity Treatment Orders in 2008. We will also model the growth in involuntary admissions in bothsecure (forensic) units and the independent sector, to estimate their contribution to overall increases in theuse of detention and to see if changes in these rates differ from those pertaining to adult mental illnessbeds in NHS general psychiatric settings.
4. Predictive modelling. Finally, we will use longitudinal models to predict future rates of involuntaryadmission based on multivariate, multilevel models. In particular, we will model the effects of reducing bednumbers, increasing bed occupancy and rising numbers of Community Treatment Orders to predict futurechanges in involuntary admissions. We will do so using multilevel synthetic estimation, a methodologydeveloped by one of the applicants (37,38) and validated independently by the Department of Health (39).
Multilevel modellingDatasets will be described using standard statistical methods including frequency tables and chi-squaredtests. Further analysis, and testing of the study hypotheses, will be undertaken using multilevel modelling(MLM) (40). MLM enables variances at different spatial levels to be modelled simultaneously andaccurately, and in a way that reflects the structure of the data (i.e. ensuring that standard errors areadjusted to reflect spatial clustering within the hierarchical data). We will estimate how much of theobserved variation is explained by individual and/or ‘compositional’ factors (such as the age, gender andethnic composition of the local population), and how much is due to area characteristics, otherwise knownas ‘contextual’ factors such as area deprivation or service investment. Multilevel approaches will alsoallow us to test for independent cross-level interactions, ie the extent to which individual level associationswith involuntary admission vary between types of places (i.e. in terms of service investment, quality,socio-economic deprivation etc.).
Multilevel models will be developed using MLwiN software (41). In each instance a null, random effectsmodel will be derived that estimates variance at each level: for example, individuals nested in hospitals(and/or Trusts), with Trusts nested in PCTs and PCTs nested in SHAs (or regions). These null models willserve to indicate the degree to which variance in rates of involuntary admission vary within and betweenthese different levels, before the introduction of any (potential) explanatory variables. Subsequentmodelling will be used to explore the extent to which this variance is explained by factors that includeindividual characteristics (like age, sex, diagnosis and ethnicity, where these are available) and area-levelexposures such as urbanicity, socio-economic deprivation and the size of minority ethnic populations.Each of these variables will be allocated (and introduced to the model) at the appropriate level. Likewise,modelling will explore associations between rates of involuntary admission and the availability(and occupancy) of different types of inpatient beds (at provider level). A major advantage of multi-levelmodelling is the opportunity to measure cross-level interactions (e.g. between bed numbers and PCTmental health spend, for instance).
Our primary outcome (involuntary admission) will be analysed in two ways: (i) as an individual-leveloutcome, coded as the number of involuntary admissions per year; and (ii) as the rate of involuntaryadmission by PCT (for example). The latter can be treated as a continuous outcome across PCTs andanalysed using a normal iterative generalised least squares hierarchical regression. The former outcome ismeasured at an individual level, whereby the individual risk or likelihood of being detained over a givenyear is treated as a dichotomous variable (i.e. detained or not). This type of outcome will lend itself tomultilevel logistic regression where analyses will be undertaken using a logit link function and assumednon-constant, between-individual variance based on a Bernoulli distribution (42). In such models, theconstant term will be the logit (loge of the odds) of a person in the base (reference) category experiencingan involuntary admission in a given year. The proportion of each involuntary admission will therefore beestimated from the constant term in the null model, which is equal to ln(p/1+p). Although unlikely,
DOI: 10.3310/hsdr02490 HEALTH SERVICES AND DELIVERY RESEARCH 2014 VOL. 2 NO. 49
© Queen’s Printer and Controller of HMSO 2014. This work was produced by Weich et al. under the terms of a commissioning contract issued by the Secretary of State forHealth. This issue may be freely reproduced for the purposes of private research and study and extracts (or indeed, the full report) may be included in professional journalsprovided that suitable acknowledgement is made and the reproduction is not associated with any form of advertising. Applications for commercial reproduction should beaddressed to: NIHR Journals Library, National Institute for Health Research, Evaluation, Trials and Studies Coordinating Centre, Alpha House, University of Southampton SciencePark, Southampton SO16 7NS, UK.
69

it is possible that some people may be detained more than once in a year and if this is found to besufficiently common to model, then it is possible to develop multinomial multilevel models (i.e. modellingthe risk of being detained once, twice, three times etc.).
Sample sizeIt is not possible to derive precise sample size estimates for our analyses, and nor are these needed in thedesign of our research since no new data are to be collected. The data sets at our disposal are extremelylarge, and are arguably the most comprehensive population-based sources of data on the use of mentalhealth services anywhere in the world. This reflects both the nature of nationalised health care provision inthe UK, and high levels of investment in the collection and collation of routine activity data.
Our analyses will cover all of England, and will include information from NHS and independent sectorproviders of in-patient mental health care. In 2009/10 this comprised 10 Strategic Health Authorities(signifying region), 151 Primary Care Trusts (as commissioners), 58 NHS Mental Health Trusts (includingCare Trusts and Mental Health Foundation Trusts) and 211 registered independent mental hospitals. In2009/10 more than 1.25m people accessed mental health services in England (2.7% of the population).(36) In the same year, 107,765 people were in-patients during the year and 42,479 were detained inhospital under the MHA (39.4% of all admissions). Of these, 2717 (4.8% of all detentions) were inindependent mental hospitals and 760 (1.8% of all detentions) were under court or prison disposal orders.
Whilst sample size is unlikely to be a problem for the multilevel rates analyses, the individual logisticanalyses may have relatively few observations nested within small areas. To overcome this problem,parameters will be estimated using second-order Taylor expansion with predictive quasi likelihood (PQL).This estimation procedure is considered superior to first or second order marginal quasi-likelihood (MQL)when observations within clusters, such as individuals within small areas are small (42). Markov chainMonte Carlo (MCMC) methods will further improve the accuracy of such estimates (43).
Dissemination and projected outputs
See Final Study Protocol.
Plan of investigation Timetable
See Final Study Protocol.
Project management
See Final Study Protocol.
Approval by ethics committees
See Final Study Protocol.
Service users/public involvement
See Final Study Protocol.
APPENDIX 1
NIHR Journals Library www.journalslibrary.nihr.ac.uk
70

Expertise and justification of support required
See Final Study Protocol.
Justification of support requestedSee Final Study Protocol.
References
See Final Study Protocol.
DOI: 10.3310/hsdr02490 HEALTH SERVICES AND DELIVERY RESEARCH 2014 VOL. 2 NO. 49
© Queen’s Printer and Controller of HMSO 2014. This work was produced by Weich et al. under the terms of a commissioning contract issued by the Secretary of State forHealth. This issue may be freely reproduced for the purposes of private research and study and extracts (or indeed, the full report) may be included in professional journalsprovided that suitable acknowledgement is made and the reproduction is not associated with any form of advertising. Applications for commercial reproduction should beaddressed to: NIHR Journals Library, National Institute for Health Research, Evaluation, Trials and Studies Coordinating Centre, Alpha House, University of Southampton SciencePark, Southampton SO16 7NS, UK.
71


Appendix 2 Final study protocol
Full title of project
Understanding the Increasing Rate of Involuntary Admissions in NHS Mental Health Care.
Aims and objectives
Involuntary admissions under the Mental Health Act in England have increased dramatically in the last20 years, and coincide with an equally stark reduction in mental health bed numbers. It is also recognisedthat people from black and minority ethnic communities are consistently over-represented among thosedetained in psychiatric hospitals and in secure settings. Bed reductions may disproportionately affect theirdetention rates as well as the detention rates of other groups that share the same mediatingcharacteristics, for example residing in urban and/or deprived areas.
Our aims will be to explore variation between places in England in rates of involuntary admission and toidentify factors that might explain this, including socio-economic context (e.g. area deprivation), featuresof local services (including level of investment by commissioners), and characteristics of service users(especially socio-economic status and ethnicity). Interpretation of the study findings and their translationinto actionable conclusions for the NHS will be aided by consultation with mental health service users andsenior NHS managers.
Research questions
1. To what extent are national rates of involuntary admission applicable to lower level healthadministrative areas? In other words, how variable are rates of involuntary admission across differentplaces, namely Strategic Health Authorities (SHAs), NHS Trusts and independent sector hospitals,and Primary Care Trusts (PCTs) in England?
2. What proportion of the total variance in rates of involuntary admissions occurs between SHAs,trusts/hospitals and PCTs, respectively?
3. To what extent is variance in rates of involuntary admission explained by local factors, such as smallarea socio-economic deprivation, urbanicity, ethnic density, PCT investment in mental health services,and by features of local mental health services and the experiences of those who use them?
4. To what extent is variance in rates of involuntary admission explained by the characteristics of peopleusing services, including socio-economic status and ethnicity?
5. After taking into account characteristics of areas, services, commissioner (PCT) investment and individualservice users, to what extent can the variance in involuntary admissions be attributed to the availabilityand occupancy of NHS mental illness beds?
Our original proposal included two additional research questions:
6. Is there evidence of geographical variation in the use of Community Treatment Orders (CTOs),and if so, how is this associated with bed numbers and occupancy, length of stay, area-level factors(like deprivation and PCT investment), experience and quality of local services, and rates ofinvoluntary admission?
7. Using the model of best fit based on local services and settings and including historical data on trendsin bed numbers, can we predict the future need for involuntary treatment with sufficient accuracy tosupport commissioners and NHS managers in determining optimal local bed numbers?
DOI: 10.3310/hsdr02490 HEALTH SERVICES AND DELIVERY RESEARCH 2014 VOL. 2 NO. 49
© Queen’s Printer and Controller of HMSO 2014. This work was produced by Weich et al. under the terms of a commissioning contract issued by the Secretary of State forHealth. This issue may be freely reproduced for the purposes of private research and study and extracts (or indeed, the full report) may be included in professional journalsprovided that suitable acknowledgement is made and the reproduction is not associated with any form of advertising. Applications for commercial reproduction should beaddressed to: NIHR Journals Library, National Institute for Health Research, Evaluation, Trials and Studies Coordinating Centre, Alpha House, University of Southampton SciencePark, Southampton SO16 7NS, UK.
73

Given our knowledge and experience with the MHMDS at this stage in the project, it is not feasible toexplore these two research questions due to data quality issues. The complexities of the MHMDS structureand issues with data quality will be outlined throughout this revised protocol and have already beenprovided in detail in our interim progress reports submitted in September 2012 and February 2013.
Background
Increasing rates of involuntary psychiatric in-patient admission and fallingbed numbersRates of involuntary admission to psychiatric in-patient beds have been rising in many Western Europeancountries,1 including in England since the introduction of the Mental Health Act (MHA) in 1983.3,4 Thereasons for this remain unclear, particularly since this trend has continued despite the development of arange of community-based services such as Community Mental Health Teams, Assertive Outreach, CrisisResolution Home Treatment and Early Intervention service. Despite being patient- and carer-centred,responsive to need, recovery-focused, timely and popular,22,47 none of the developments in communitymental health services has been shown to reliably reduce involuntary admissions.48–51
The upward trend in rates of detention appears to have accelerated since the introduction of the MentalHealth Act (2007). Formal admissions alone (i.e. patients admitted to hospital under the Act as opposed tothose detained after removal to a place of safety, or subsequent to informal admission) increased by 7.3%from 2008/9 to 2009/10, the largest increase in three years.92 This increase was due solely to increasedrates of formal admission to NHS facilities and concealed a decline in numbers of formal admissions toprivate sector units.86 Formal admissions to NHS facilities under Section 2 of the Act (the most commonlyused section, which allows for assessment rather than treatment) increased by almost 15% in 2009/10.By comparison, this number fell by 10% in the private sector over the same period.
The increasing rate of compulsory admission in England has coincided with an equally dramatic reductionin the number of mental illness beds.20 Analysis for England shows that the number of NHS involuntaryadmissions increased by over 80% between 1988 and 2008, while the number of mental illness beds fellby around 60% during the same period (Keown et al., personal communication based on submittedmanuscript).5 While closure of mental illness beds has been part of the deinstitutionalisation of care for thementally ill for decades in high income countries,25 the United Kingdom has taken this further than itsneighbours and most other developed economies. There are substantially fewer psychiatric in-patient bedsin the UK (5.8 per 10,000 population in 2005) than the median for Europe (8.0 per 10,000 population)or high income countries as a whole (7.5 per 10,000 population).26 These figures should be seen inthe context of high overall levels of funding for mental health services in the UK, which currentlyaccount for 10% of the total health budget.27 The United Kingdom has greater numbers of psychiatrists(11 per 100,000 population) and psychiatric nurses (104 per 100,000 population) than the medians forEurope (9.8 and 24.8, respectively) and high income countries as a whole (10.5 and 33.0, respectively).
People from black and minority ethnic groups experience poorer mental health services compared to therest of population in the UK.28–32,34,36,87 Disparities in rates of admission, including compulsory detention31,34
and more coercive pathways to acute psychiatric care, involving the police and criminal justice systemdisadvantage black service users in particular.30,36,37 These inequalities have persisted despite major policyinitiatives,38–40 additional investment, workforce developments and the general improvements in thecoverage and quality of mental health services over the last decade.30,39,41
Supervised Community Treatment (SCT) in the form of Community Treatment Orders (CTOs) wasintroduced as part of the new Mental Act in 2007. Since November 2008 it has been possible for patientsdetained under Section 3 of the Act to be discharged from hospital by means of a CTO, subject to thepossibility of recall to hospital if necessary. This order requires the patient to adhere to specific conditions,most often including taking their medication. In the first full year of operation, 4103 such orders were
APPENDIX 2
NIHR Journals Library www.journalslibrary.nihr.ac.uk
74

made – significantly greater numbers than anticipated – while only 1789 were revoked, suggestingthat some people are being kept on these orders for long periods of time.86 SCT remains controversial,and its effect on and associations with bed numbers, occupancy, detention rates and therapeuticoutcomes remain unknown. It has been suggested that SCT is both a means to ensure early dischargewhere beds are scarce (particularly where therapeutic to medication are restricted or unavailable), and adefensive and alienating response to managing risk.93
The increase in the use of compulsory detention sits uneasily with most professionals, who have spenttwo decades attempting to improve engagement with care and to reduce the fear and stigma associatedwith mental health services.22–24,31,45 It is also a source of concern to commissioners and service providers,given the high costs of in-patient care. The increasing rate of involuntary treatment represents a majorfinancial obstacle to investment in community services, particularly at times of austerity. The acute carepathway in adult mental health services (the most expensive of all service areas) is particularly vulnerable tobudgetary pressures. The growing strain on these services may explain recent acceleration detention rates.Understanding the determinants of this trend – and how to identify and therefore prevent potentiallycatastrophic disinvestment – is therefore imperative.
Different explanations for the increase in involuntary admissions have been proposed, including secularincreases in the use of illicit drugs and alcohol.3 But empirical evidence is extremely limited. An alternativehypothesis is that the rise in involuntary admissions is due to bed shortages arising from reductions inmental health bed numbers (and especially long stay or ‘rehabilitation’ beds) dating back to the 1950sin England.18 It has been suggested that fewer beds results in greater pressure to discharge patients fromhospital, leading to relapse and readmission.3
An ecological study across eight hospital trusts in England provided some support for this view, findingthat the rate of involuntary admission was associated with delays in accessing in-patient beds (as well aswith socio-economic deprivation and the size of minority ethnic populations).21 More recently, our ownresearch based on time-series analysis of national data on mental illness beds and detentions for Englandbetween 1988 and 2008 found the strongest association between these variables was observed when atime lag of one year was introduced, with bed reductions preceding increases in involuntary admissions.This association increased in magnitude when analyses were restricted to civil (non-forensic) involuntaryadmissions and non-secure beds. Our findings support the view that that the annual reduction in mentalillness bed numbers is directly associated with the number of involuntary admissions over the short tomedium term. We have estimated that for every two mental illness beds that are closed there will be oneadditional involuntary admission in the following year (Keown et al., personal communication based onsubmitted manuscript).5 This research has also highlighted differential rates of bed closure by type of bed:while long stay bed numbers have fallen dramatically, there has been a small but steady increase in securebeds (i.e. beds in specialist forensic mental health units, sometimes referred to as ‘medium secure units’).
Despite these important findings, there are limitations to this type of ecological analysis based onnational-level data. Not only can this overlook informative local variations occurring over smaller areas,but correlation at a national level may be confounded by controlling for other associations at the level ofregion, trust or even hospital. The most obvious potential confounder is (area-level) socio-economicdeprivation. This has never been fully explored.
Studying the geography of involuntary admissionThere is an urgent need to understand the determinants of the persistent and seemingly irrevocable trendtowards ever higher rates of involuntary psychiatric admission in the UK. This is even more imperative inthe light of evidence that this trend may have accelerated following changes to the Mental Health Act in2007.86,92 Studying the geography of involuntary admission offers the opportunity to explore variationsin this trend at local level and therefore to identify factors associated with higher and lower rates ofinvoluntary admission. It therefore represents the logical next step towards achieving the aim ofunderstanding the causes of the upward national trend.
DOI: 10.3310/hsdr02490 HEALTH SERVICES AND DELIVERY RESEARCH 2014 VOL. 2 NO. 49
© Queen’s Printer and Controller of HMSO 2014. This work was produced by Weich et al. under the terms of a commissioning contract issued by the Secretary of State forHealth. This issue may be freely reproduced for the purposes of private research and study and extracts (or indeed, the full report) may be included in professional journalsprovided that suitable acknowledgement is made and the reproduction is not associated with any form of advertising. Applications for commercial reproduction should beaddressed to: NIHR Journals Library, National Institute for Health Research, Evaluation, Trials and Studies Coordinating Centre, Alpha House, University of Southampton SciencePark, Southampton SO16 7NS, UK.
75

Preliminary investigation reveals marked variation in rates of involuntary admission between regions ofEngland. In 2009/10, there was a two-fold difference between regions with the highest (London SHA,146 detentions per 100,000 population) and lowest (South Central SHA, 70 per 100,000) rates of formaldetention, after excluding Place of Safety orders.86
There is substantial variation in investment by PCTs on mental health services per head of population.It was estimated that the crude ratio between the PCTs with the highest and lowest mental health spendwas 4.6 in 2007, falling slightly to 2.9 after weighting for age, population need and overall PCT spendingallocations.42 It is not yet known whether and how this variation is associated with differences in mentalhealth bed numbers, occupancy, length of stay, detention rates, and access to services or patientexperiences of care.
We suggest that urbanicity (i.e. population density and settlement size), ethnic density, socio-economicdeprivation and the availability (or otherwise) of in-patient beds are likely to be the most important localfactors that contribute to needs for involuntary treatment. While there is now limited evidence of a directassociation with (fewer) mental health beds, we propose to test the hypothesis that detention under theMental Health Act is also related to the availability and quality of community mental health services, aswell as the lack of barriers to using these (as indicated by area-level deprivation). One key hypothesis isthat the gains associated with improved community services have not been enjoyed equally by all, and thatrates of involuntary admission may be growing fastest in those places where social networks are weakestand community services are the hardest to deliver, namely the deprived inner cities with large minorityethnic populations.
We will also explore the extent to which urbanicity and ethnic composition interact (as opposed to actingindependently of one another) in their associations with rates of involuntary admission. The rate ofinvoluntary admission may be higher in areas with diverse minority populations than in places with greaterethnic density (i.e. concentrations of people of the same ethnicity), where social networks might bestronger. By establishing linkages to Census data, we will assess the independent and interactive effects ofethnic diversity and density, and urbanicity on rates of involuntary admission.
How the proposed research will add to the body of knowledgewith reference to current NHS policy and practice
In the present economic climate, further closure of in-patient beds appears the most likely strategy forfunding improvements in community-based mental health services. While this is in keeping with providingcare in the least restrictive setting and near to home, there is little evidence to guide the relative andabsolute provision of short stay, long stay and secure (forensic) mental illness beds in the NHS. The currentimperative for efficiency savings is also leading commissioners and service providers to consider disinvestingin a number of specialist community-based services. This could have a counter-productive effect byincreasing the pressure on beds and the cost base on which services are delivered, particularly as there isevidence that fewer beds (and greater occupancy) delays admission and makes involuntary admission morelikely. In this scenario there will be ever-diminishing scope for new investment in community-basedservices, with consequences for the quality and experience of care. The recent addition of CommunityTreatment Orders (CTOs), driven by a desire to reduce risk albeit at the risk of increased coercion, mayrepresent a recipe for accelerating involuntary admission rates.
This project will add to knowledge in this area and help in future decisions about the provision andbalance of inpatient and community psychiatric services in England. An important aim of this research willbe to derive comprehensive and sophisticated, multivariate predictive models (based on a validatedmethodology pioneered by one of the applicants) that will allow individual NHS Trusts (and theircommissioners) to estimate the numbers of involuntary admissions they might expect over time, and whatimpact further bed closures would have on this number.
APPENDIX 2
NIHR Journals Library www.journalslibrary.nihr.ac.uk
76

Importance of the proposed research
Patients are clear about their dislike for in-patient treatment, which is frightening and undermining ofautonomy and choice.22–24 Involuntary admission to hospital is even more distressing for patients and theircarers, and typically results in longer lengths of stay in hospital. Involuntary admissions are more commonin some groups (especially among black and minority ethnic groups), and in some places. Though oftennecessary to prevent immediate harm, involuntary admission impairs longer term therapeutic relationships,increases stigma and reduces confidence in and subsequent engagement with services.
Despite a decade or more of investment in more patient-centred, community-based treatments the rate ofinvoluntary admission continues to rise and have coincided with reductions in mental illness bed numbers.There is also evidence that this may have increased further since the introduction of Supervised CommunityTreatment in 2008. But other, as yet unstudied factors may also be important, including ethnicity,urbanicity, and socio-economic status and diagnosis (patients with psychosis are more likely to bedetained). Although it was an original aim of the project to look at the association between diagnosis andinvoluntary admission rates, the MHMDS only has reliable diagnostic information for ∼19% of all patients.This level of missing data is extremely high and was unexpected; we are not able to include psychiatricdiagnosis in our analytical plan for this project. The rate of involuntary admission is of interest to manygroups and is likely to remain highly relevant for a number of reasons (clinical effectiveness, ethical, andhealth economic reasons).
At a time of austerity, tough decisions are being made about the shape of mental health care for thenext decade. One important decision concerns the optimal balance between inpatient and communityservices. Understanding the relationship between bed numbers and involuntary admission is an importantpart of this. But including measures of the configuration, quality and experience of community serviceat the same time as analysing the association between bed numbers (and occupancy) and involuntaryadmission means that the proposed research will result in usable evidence about how to improve acutecare pathways in all settings across England. Identifying and quantifying the wider societal and service-leveldeterminants of the rise in involuntary admission, and modelling the impact of further bed closures are allvitally important for the commissioning and delivery of services.
By working with service users (through the mental Health Foundation) and senior NHS managers (with thesupport of the NHS Confederation), we will ensure that our scientifically robust findings are translated intoactionable conclusions for the NHS. These will allow NHS Trusts to anticipate the impact of bed closureson the rate of involuntary admissions to those beds and the consequent impact on psychiatric admissionwards. The results of this study will have a major bearing on the commissioning of mental health services,which in the current economic climate are highly dependent on the release of resource from (very costly)in-patient services to support further development of community-based treatments.
Research methods
DesignSecondary analysis of routinely collected data. Data will be organised to permit analysis as cross-sectionalsurvey, cohort and (nested) case control studies.
Data sourcesAs the time this protocol was submitted, the main data sources were to be obtained from theNHS Information Centre. In 2013, the NHSIC was re-organised to be the NHS Health and Social CareInformation Centre, or the HSCIC (http://www.hscic.gov.uk/). As a result, many of the services(and corresponding webpage links) we outlined in our original protocol are no longer available and wehave updated this section of the protocol accordingly.
DOI: 10.3310/hsdr02490 HEALTH SERVICES AND DELIVERY RESEARCH 2014 VOL. 2 NO. 49
© Queen’s Printer and Controller of HMSO 2014. This work was produced by Weich et al. under the terms of a commissioning contract issued by the Secretary of State forHealth. This issue may be freely reproduced for the purposes of private research and study and extracts (or indeed, the full report) may be included in professional journalsprovided that suitable acknowledgement is made and the reproduction is not associated with any form of advertising. Applications for commercial reproduction should beaddressed to: NIHR Journals Library, National Institute for Health Research, Evaluation, Trials and Studies Coordinating Centre, Alpha House, University of Southampton SciencePark, Southampton SO16 7NS, UK.
77

The HSCIC is responsible for collecting and collating national health and social care data in the UK. TheHSCIC ensures appropriate governance checks for the use of these data, to protect the confidentiality ofthose on whom data is collected, through the National information Governance Board for Health andSocial Care (NIGB). It also collates geographical data, including deprivation and other neighbourhoodstatistics, and provides support in ensuring appropriate linkage to other data sets. The significantinvestment on the part of the NHS in software resources and staffing to support secondary users throughthe HSCIC represents a major strength of the proposed research. Although the proposed data linkages willbe methodologically challenging, we are confident that the study aims are achievable.
The data sets which we propose to access and link are set out below in Table 10, followed by moredetailed descriptions about each of these. Since the original protocol was submitted, our research teamhas become very familiar with the structure, content, and capabilities of the data sets we proposed toanalyse to achieve the aims of this project. In light of this, a number of amendments and additions havebeen made to the data sources we aim to work with in this project. Specifically, we will focus on theMental Health Minimum Dataset (MHMDS) as our main data source to derive the outcome variable for thestudy, and link in information from the Hospital Episode Statistics (HES) data as well as other data sourcesto provide additional contextual information relevant to the study of psychiatric admission rates. Table 10below, which was included in the original protocol, has been modified to reflect these changes. Asoutlined previously (and in our interim reports submitted in September 2012 and February 2013), thequality and reliability of the MHMDS is of a relatively high quality from 2010/11 onwards but poor from2007–2009. Given that the project will focus on comprehensive cross-sectional analyses of the mostcomprehensive data available, additional data sources relevant to this recent annual period (2010/11) andto the study of psychiatric admissions have been sourced for linkage to the MHMDS (Table 10).
1. Mental Health Minimum Dataset (MHMDS)As previously mentioned, the Mental Health Minimum Dataset will be our primary data source for theanalyses in this study, by virtue of the detail recorded at the individual patient level. The MHMDScomprises anonymised record-level (i.e. individual patient-level) data about adults and older people usingsecondary mental health services. Each record in the MHMDS represents the complete, continuous spell ofcare for an individual, from initial referral to final discharge (referred to as a mental health care spell – or‘care spell’ for short). Each care spell contains information relating to voluntary and involuntary in-patientadmissions, out-patient attendances, day treatment and all other episodes of care. The MHMDS data isreported quarterly and describes complete spells of care for an individual, from initial referral to finaldischarge. Quarterly data are aggregated into an annual database which is released by the NHS Healthand Social Care Information centre to registered users of the data.
Although (limited) MHMDS data are available from 2003, the data quality has been quite poor (i.e. highlevels of missing data and inconsistent recording of patient care by Provider Trusts) until very recently.Our project team have gained access to data from 2007/08 and are confident that the mostcomprehensive data on service use are available from 2010/11. Details of these data exploration tasks havebeen documented in detail in our interim reports (submitted September 2012 and February 2013). Thismeans that only data from the 2010/11 annual reporting period will be used to investigate this study’sresearch questions. Whilst longitudinal analysis will be feasible as time progress (i.e. from 2010/11onwards), earlier years of MHMDS are simply too poor to be able to confidently link patient records acrossyears for the purposes of longitudinal analyses. No other more recent data (i.e. 2011/12) is availableat the present time. Thus, we will focus on the most recent and comprehensive data available to use(i.e. 2010/11 MHMDS) but we also make use of 2009/10 MHMDS database for quality assurancepurposes. We will seek NHS Research Ethics approval for our research, and will apply to the NHS
APPENDIX 2
NIHR Journals Library www.journalslibrary.nihr.ac.uk
78

TABLE 10 Data sets to be used (sources of outcome variables in bold)
Data set Key variablesSmallestdata level
Level of proposedlinkage Time frame
1 Mental Health MinimumDataset (MHMDS)
Patients admitted involuntarily;patient characteristics incethnicity, age, and gender. In ouroriginal protocol, we had hopedto include other individual-levelcharacteristics such SES, HoNOS,and diagnosis; due to high levelsof missing data and inconsistenciesin recording data by the Providerssubmitting to the MHMDS, this isnot now possible
Individual PCT 2010–11
2 Hospital EpisodeStatistics (HES)
All admissions, inc involuntaryadmissions; diagnosis, length ofstay; patient characteristics incethnicity and SES
Individual PCT 2010/11
3 Census & othergeographical data
Area-level features(e.g. urbanicity, socio-economicdeprivation) andpopulation composition
Lower-layersuper outputarea level
Lower-layersuper outputarea; PCT
2009–2011(inc mid-yearestimates)
4 Beds Open Overnight(BOO) – previouslyHospital Activity Statistics
Bed numbers inc availabilityand occupancy
Provider(Trust orindependenthospital)
Provider 2010/11
5 Patient Environment andAction Team (PEAT)
Summary scores for performancein patient safety in the followingareas: environment, food, anddignity and respect
Provider Provider 2011
6 Community MentalHealth Services Survey
Provider performance on avariety of domains includinghealth and social care workers,medication, helpfulness oftalking therapies, care planmanagement, crisis care, andday-to-day living
Provider Provider 2011
7 Inpatient ServiceUser Survey
Provider performance on avariety of domains includingward accommodation, staffcommunication, medications andtreatment, and patient rights
Provider Provider 2009
8 NHS Staff Survey Workplace related indicatorsincluding workloads, training,staff communication, health andwellbeing etc.
Provider Provider 2010/11
9 Investment in AdultMental HealthServices (IMHS)
Spend per person on mentalhealth care for adults ofworking age
PCT PCT 2010/11
DOI: 10.3310/hsdr02490 HEALTH SERVICES AND DELIVERY RESEARCH 2014 VOL. 2 NO. 49
© Queen’s Printer and Controller of HMSO 2014. This work was produced by Weich et al. under the terms of a commissioning contract issued by the Secretary of State forHealth. This issue may be freely reproduced for the purposes of private research and study and extracts (or indeed, the full report) may be included in professional journalsprovided that suitable acknowledgement is made and the reproduction is not associated with any form of advertising. Applications for commercial reproduction should beaddressed to: NIHR Journals Library, National Institute for Health Research, Evaluation, Trials and Studies Coordinating Centre, Alpha House, University of Southampton SciencePark, Southampton SO16 7NS, UK.
79

Information Centre through its Security and Confidentiality Advisory Group for access to anonymised,patient-level MHMDS data. Data from independent sector providers will be available for the first time withthe 2010/11 MHMDS release in January 2012. The advantage of MHMDS over other data sets, andespecially Hospital Episode Statistics (HES), is that it comprises all episodes of mental health treatmentregardless of setting. By contrast, HES is restricted to in-patient admissions. Therefore the reference groupfor analyses based on these data are people using local mental health services but who have not beenadmitted to hospital involuntarily in a specified period. The findings will therefore be generalizable topeople who use mental health services.
Rather than counting uses of the Mental Health Act, MHMDS counts people subject to the Act and providesopportunity for analysis by age and ethnic group. Involuntary admissions are denoted by recording legalstatus at end of reporting period, coded using the most restrictive legal status (i.e. whether detained ortreated informally) that applied during the mental health care spell. Community Treatment Orders (CTOs)and their revocation and recall to hospital are also recorded in MHMDS. As mentioned earlier in this revisedprotocol, however, the CTOs data are not currently sufficient to permit a thorough exploration of these datain our current study. After much interrogation of the MHMDS over the course of this project, our team nowhas a clear understanding of what is capable in terms of determining the number of patients who wereadmitted to hospital under the MHA during the time frame under study (2010/11). This has not beenwithout difficulties, and we have documented these stages in our interim progress reports. Nevertheless,we have been successful in navigating the MHMDS to derive the outcome variable for the study and ourestimates of the number of patients detained are very consistent with those published by the HSCIC.
Having derived our outcome variable for the study, the next task involved understanding the differentlevels within the MHMDS that could be used to explore what regions of the country have different rates ofpsychiatric detentions and what factors contribute to this variation. In addition to recording detailedinformation on the patient’s medical history, the MHMDS records contain information about where thepatient lives, where their GP is located, and where they receive their mental health care. This type ofinformation is very useful for trying to build a picture of the type of environment in which patients live,which may give clues as to the reasons for variation in involuntary admission rates in different areas acrossEngland. There are numerous discrete and identifiable spatial levels in the MHMDS at which variance inrates of involuntary admissions might occur:
i. Patient-level: each patient record (n= 1,287,730) in the MHMDS contains detailed information aboutthe patient’s contact with mental health services.
ii. Lower layer super output area-level (LSOA): The LSOA is a geographical area comprising of aminimum of 1000 people. There are approximately 33,000 LSOAs in England. Knowing the LSOA inwhich a person lives can provide a lot of information about the type of area they inhabit (e.g.population density, ethnic density, and socio-economic deprivation). Importantly, it allows us to link inother pertinent data sets such as the UK Census and the Index of Multiple Deprivation.
iii. GP Practice-level: GP Practices, of which there are approximately 8000 in England, deliver primary careservices. This will include delivering some mental health services, but also covering referrals to morespecialist secondary care mental health services.
iv. Primary Care Trust-level (PCTs): PCTs were in charge of primary care and had a major role aroundcommissioning secondary care, providing community care services.
v. Provider Trust-level: Patients receive mental health care from Providers, mainly NHS Trusts but alsosome Independent sector Providers. There are 58 specialist NHS Mental Health Trusts in England. TheseTrusts deliver specialist mental health care services. In total, there are 72 Providers (both NHS andIndependent sector) in the 2010/11 MHMDS.
vi. Strategic Health Authority-level (SHA): There are currently 10 SHAs in England. SHAs areresponsible for, amongst other things, improving health services in their local area and ensuring localhealth services are of a high quality and are performing well.
APPENDIX 2
NIHR Journals Library www.journalslibrary.nihr.ac.uk
80

2. Hospital Episode Statistics (HES)HES contains details of all admissions (including those under the Mental Health Act) to NHS hospitals andindependent hospitals in England funded by the NHS. HES also contains details of all NHS outpatientappointments in England and is available from 1998 to the present. HES comprises patient-level recordsand contains data on diagnosis, length of stay, age, gender and ethnicity. It also includes informationabout where treatment was delivered and place of residence. We will seek NHS Research Ethics approvalfor our research, and will apply to the HSCIC through its Security and Confidentiality Advisory Group foraccess to hospital admission data for linkage to the MHMDS. We are particularly interested in accessingadmission-related data from HES at Provider Trust and PCT level, for example length of hospital stay andnumber of finished consultant episodes, to create a more comprehensive picture of the Trusts who aredelivering mental health services (and PCTs who are commissioning these services) to patients inthe MHMDS.
3. Census and other geographical dataWe will use area-level deprivation indices to characterise the places in which services are delivered. In theoriginal protocol, we envisaged that it would be necessary to make do with area-level population estimatesfrom the 2001 Census data, supplemented with more recent mid-year estimates, due to lack of availabilityof more recent data. We are pleased to report that we have been able to access the 2011 Censuspopulation statistics to determine ethnic composition and population density for different areas, and acrossdifferent spatial levels (supplemented by mid-2009/2010 estimates where necessary when this is the mostrecent available data). We will also obtain details on urbanicity classification for England and Wales fromthe Office for National Statistics (http://www.ons.gov.uk/ons/guide-method/geography/products/area-classifications/rural-urban-definition-and-la/index.html).
4. Beds Open Overnight (BOO) – previously Hospital Activity StatisticsThe number of available and occupied NHS mental illness and learning disability beds are available via theDepartment of Health, and comprise aggregated quarterly KH03 returns by each provider. Data areavailable for 2010 (http://transparency.dh.gov.uk/2012/07/05/bed-availability-and-occupancy-overnight/).We aim to source detailed information on the average annual number of available and occupied beds foreach consultant speciality treatment patients with mental illness.
5. Patient Environment and Action Team (PEAT)PEAT is an annual assessment of inpatient healthcare sites in England that have more than 10 beds. It is abenchmarking tool to ensure improvements are made in the non-clinical aspects of patient care includingenvironment, food, privacy and dignity. The scores demonstrate how well individual healthcare providersbelieve they are performing in key areas including food, cleanliness, infection control and patientenvironment (including bathroom areas, décor, lighting, floors and patient areas). Data are managed bythe NHS Health and Social Care Information Centre and are available for 2010 (http://www.nrls.npsa.nhs.uk/patient-safety-data/peat/).
6. Community Mental Health Services SurveyThe Community Mental Health Services Survey is conducted by the Care Quality Commission(http://www.nhssurveys.org/surveys/515). The 2010 survey comprises a sample of service users aged 16and over who had been in contact with NHS mental health services in the three month period 1 July 2009to 30 September 2009 and who were receiving specialist-help for a mental health condition. The surveyaimed to find out about the experiences of people using mental health services in the community. Theseservices provide care and treatment to people who have been referred to a psychiatric outpatient clinic,local community mental health team, or other community-based mental health services. The surveycompares the performance of Trusts on a variety of issues, including care plan reviews, use of carecoordinators, medications, talking therapies, etc. Data will be linked to the MHMDS at Trust level.
DOI: 10.3310/hsdr02490 HEALTH SERVICES AND DELIVERY RESEARCH 2014 VOL. 2 NO. 49
© Queen’s Printer and Controller of HMSO 2014. This work was produced by Weich et al. under the terms of a commissioning contract issued by the Secretary of State forHealth. This issue may be freely reproduced for the purposes of private research and study and extracts (or indeed, the full report) may be included in professional journalsprovided that suitable acknowledgement is made and the reproduction is not associated with any form of advertising. Applications for commercial reproduction should beaddressed to: NIHR Journals Library, National Institute for Health Research, Evaluation, Trials and Studies Coordinating Centre, Alpha House, University of Southampton SciencePark, Southampton SO16 7NS, UK.
81

7. Inpatient Service User SurveyThe Inpatient Service User Survey is conducted by the Care Quality Commission (http://www.nhssurveys.org/survey/1016). Over 69,000 adult patients from 162 acute and specialist NHS trusts in Englandresponded to the survey, a response rate of 52%. The survey was carried out between September 2009and January 2010 and gathered the views of patients who were discharged from hospital before the endof August 2009. The survey aimed to find out about the experiences of people using inpatient mentalhealth services and covered a wide range of topics including, ward accommodation, medication, staffcommunication etc.
8. NHS Staff SurveyThe 2010 NHS Staff Survey is the eighth annual survey of NHS staff. The results of this survey help Truststo review and improve the experiences of their staff, enabling them to provide better care to patients.The survey covers a wide range of work related domains including work load, staff health and wellbeing,staff satisfaction with job, job performance and communication among staff within the NHS. Data will belinked at Trust level.
9. Investment in Mental Health Services (IMHS)The Department of health sponsors the annual National Survey of Investment in Adult Mental HealthServices, an annual finance mapping exercise regarding spending on mental health services in England(https://www.gov.uk/government/publications/2010-11-working-age-adult-and-older-adult-national-survey-of-investment-in-mental-health-services). Data from 2010 are relevant to this project’s timeframe andprovide details of investment in mental health services for working age adults (aged 18–64) in England,by PCT (commissioner).
ParticipantsAlthough there will be no primary data collection (field work), our subjects will be people who have usedNHS and independent sector mental health services in England, about whom data is collected routinelyduring episodes of care. Other analyses will be undertaken at the level of service provider (NHS Trusts andindependent sector providers) and commissioning Primary Care Trusts (PCTs).
SettingThe proposed research will be conducted in England, and will include analysis of data covering all StrategicHealth Authorities (SHAs), Primary Care Trusts (PCTs) and all NHS and independent sector providers ofin-patient mental health care.
‘Independent sector providers’ are those units that are registered with the Healthcare Commission toaccept patients detained under the Mental Health Act 1983 (as amended by the Mental Health Act 2007),as specified under S. 2(3) (b) of the Care Standards Act 2000. These independent Hospitals that areregistered to receive detained patients are considered to be ‘hospitals’ for the purposes of the MentalHealth Act.
Data preparation
Primary outcomeAs previously described, a great deal of time and effort has been spent on deriving the main outcome forthe study, that is, categorising patients in terms of their admission to hospital under the Mental Health Act2007 (MHA) during the 2010/11 reporting period. Details of this process have been documented in ourinterim progress reports. Briefly, the outcome variable will be dichotomous: patients who were admitted tohospital under the MHA during 2010/11 versus all other patients who received any other type of care(including voluntary admission to hospital, community treatment only, or no care). This categorisation willalso permit us to determine the rate of involuntary compulsory admissions to hospital at, for example,Provider Trust and PCT level (as outlined in our original protocol).
APPENDIX 2
NIHR Journals Library www.journalslibrary.nihr.ac.uk
82

Data linkageThe next main task will be to link the MHMDS to a wide variety of relevant external data sources. Thepurpose of data linkage is to create a data set that will specify multiple distinct levels at which variance indetention rates might be quantified and explained, including geography (e.g. physical environment anddemographic composition), service provider (most commonly NHS Trust), commissioner (PCT) and GeneralPractice. Creating such linkages is complex and involves finding suitable data sources and appropriatemethods for linkage to the MHMDS. This linkage will take place at the smallest possible spatial scale: asindicated above in Table 10, the most common linkages will be by provider Trust and (commissioning) PCT.
Data analysis
The primary statistical technique employed will be multilevel modelling, which mirrors the structureof the data to be analysed and allows explanation to be correctly assigned to the various ‘levels’ withinthe data set (i.e. individual or area) and is therefore a widely used method for analysing nested(or clustered) data.
Strategy of analysisThis section was included in the original protocol but has been redrafted to provide greater clarity and todescribe the refocused emphasis on conducting details and robust cross-sectional analysis of the best datasources available to our team: the 2010/11 MHMDS linked to contextually-rich external data sources.Linking the MHMDS to external data sources will enable us (for example) to explore the effects of age, sex,ethnicity (at the individual level), bed numbers (and types of available beds), overall bed occupancy rates,average length of in-patient stay (at Trust level), investment in services (at PCT level) and socio-economicdeprivation, urbanicity and ethnic composition (at area level) on the likelihood that a user of mental healthservices will be admitted to hospital involuntarily. As well as assessing the main effects of these risk factors,we will explore variance at different spatial scales and test for cross-level interactions, i.e. the extent towhich associations vary between places.
Multilevel modelling (MLM)Testing of the study hypotheses will be undertaken using multilevel modelling (MLM).94 Multilevel modelswill be developed using MLwiN software. MLM enables variances at different spatial levels to be modelledsimultaneously and accurately, and in a way that reflects the structure of the data (i.e. ensuring thatstandard errors are adjusted to reflect spatial clustering within the hierarchical data). We will estimate howmuch of the observed variation is explained by individual and/or ‘compositional’ factors (such as the age,gender and ethnic composition of the local population), and how much is due to area characteristics,otherwise known as ‘contextual’ factors such as area deprivation or service investment. Multilevelapproaches will also allow us to test for independent cross-level interactions, i.e. the extent to whichindividual level associations with involuntary admission vary between types of places (i.e. in terms of serviceinvestment, quality, socio-economic deprivation etc.).
In a multilevel model, it is important to structure the data correctly. In a classic MLM, the various spatial levelsnest neatly within one another and, in this sense, we can create a nested hierarchy – i.e. individuals (level 1)nested within LSOAs (level 2) within Provider Trusts (level 3). The structure of the MHMDS is quite complexand the data are not nested neatly. If we were to run a MLM that assumed the data were nested neatly thenthe resultant estimates of variance across the different geographies would not be correct. Therefore, ratherthan regard the geographical areas as ‘levels’ within a hierarchy, they are instead regarded as ‘classifications’and for each individual within the data set, the classification structure is recorded, allowing for a non-nested,cross-classified data structure. Markov chain Monte Carlo (MCMC) estimation methods are available inMLwiN to estimate the variance of our outcome variable across these geographic classifications (i.e. LSOA,Commissioner, Provider Trust etc.), within these types of multilevel models.
DOI: 10.3310/hsdr02490 HEALTH SERVICES AND DELIVERY RESEARCH 2014 VOL. 2 NO. 49
© Queen’s Printer and Controller of HMSO 2014. This work was produced by Weich et al. under the terms of a commissioning contract issued by the Secretary of State forHealth. This issue may be freely reproduced for the purposes of private research and study and extracts (or indeed, the full report) may be included in professional journalsprovided that suitable acknowledgement is made and the reproduction is not associated with any form of advertising. Applications for commercial reproduction should beaddressed to: NIHR Journals Library, National Institute for Health Research, Evaluation, Trials and Studies Coordinating Centre, Alpha House, University of Southampton SciencePark, Southampton SO16 7NS, UK.
83

Our first aim was is to estimate how much of the observed variation in involuntary admission rates acrossEngland is explained by individual factors such as gender and age and how much is due to factorsoperating at these different spatial levels. The most basic MLM is the null model, which estimates thetotal unexplained variance in involuntary detentions in the study sample (this is equal to the sum of theunexplained variances at the different spatial levels).
Given the size of the database (∼1.2 million patients), estimating models with more than three spatiallevels would be difficult due to problems with model stability and computing power. A series of three-levelmodels will be estimated, varying the structure of the spatial levels in an attempt to identify where thelargest variance in involuntary admissions might be occurring, and in order to guide us in populating moredefinitive models. Subsequent modelling will be used to explore the extent to which this variance isexplained by factors such that include individual characteristics (like age, sex, and ethnicity, where theseare available) and area-level exposures such as urbanicity, socio-economic deprivation and the size ofminority ethnic populations. Each of these variables will be allocated (and introduced to the model) at theappropriate level. Likewise, modelling will explore associations between rates of involuntary admission andthe availability (and occupancy) of different types of inpatient beds (at provider level). A major advantageof multi-level modelling is the opportunity to measure cross-level interactions (e.g. between bed numbersand PCT mental health spend, for instance).
Sample sizeIt is not possible to derive precise sample size estimates for our analyses, and nor are these needed in thedesign of our research since no new data are to be collected. The data sets at our disposal are extremelylarge, and are arguably the most comprehensive population-based sources of data on the use of mentalhealth services anywhere in the world. This reflects both the nature of nationalised health care provision inthe UK, and high levels of investment in the collection and collation of routine activity data.
Our analyses will cover all of England, and will include information from NHS and independent sectorproviders of in-patient mental health care (as previously, these independent sector providers are codedby the service provider (company) and not by individual units or according to geographical location).In 2009/10 this comprised 10 Strategic Health Authorities (signifying region), 151 Primary Care Trusts (ascommissioners), 58 NHS Mental Health Trusts (including Care Trusts and Mental Health Foundation Trusts)and 211 registered independent mental hospitals. In 2009/10 more than 1.25M people accessed mentalhealth services in England (2.7% of the population).95 In the same year, 107,765 people were in-patientsduring the year and 42,479 were detained in hospital under the MHA (39.4% of all admissions). Of these,2717 (4.8% of all detentions) were in independent mental hospitals and 760 (1.8% of all detentions)were under court or prison disposal orders.
Whilst sample size is unlikely to be a problem for the multilevel rates analyses, the individual logisticanalyses may have relatively few observations nested within small areas. To overcome this problem,parameters will be estimated using second-order Taylor expansion with predictive quasi likelihood (PQL).This estimation procedure is considered superior to first or second order marginal quasi-likelihood (MQL)when observations within clusters, such as individuals within small areas, are small.96 Markov chain MonteCarlo (MCMC) methods will further improve the accuracy of such estimates.97
Dissemination and projected outputs
Our strategy for dissemination is built around two key partnerships. In undertaking this project, we shall beworking closely with the Mental Health Foundation and the Mental Health Network (which is part of theNHS Confederation) from the outset. These partnerships will help ensure that our analyses focus onthe outcomes and associations of greatest importance to service users, NHS managers and commissioners,and that the findings are translated into actionable conclusions. Both partners have well established andeffective communications strategies which we shall utilise so that our results reach the widest possible
APPENDIX 2
NIHR Journals Library www.journalslibrary.nihr.ac.uk
84

audience. This will involve Briefing Papers (available on line and in hard copy), hyperlinks to our reports viaMHF and NHS Confederation web pages and press releases. We will explore opportunities for otherdissemination events, including hosting stakeholder workshops.
We will also pursue more traditional modes of academic dissemination by submitting our findings to highimpact journals, and by presenting these at national and international scientific conferences. Finally, wealso propose to hold workshop for key stakeholders in each of the three regions from which the clinicalacademic applicants are drawn: London, the Midlands and the North East.
Plan of investigation
TimetableThis project was granted a no-cost time extension to extend the project end date from 31/05/2013 to31/08/2013. The reasons for this extension were outlined in our interim reports (September 2012 andFebruary 2013) and were largely due to administrative delays in hiring the Research Fellow to the projecton a full-time basis. This section has been amended accordingly to reflect this extension.
Months –3 to 0: Applications for (a) research ethics and NIGB approval and (b) permission for access toanonymised patient-level data from the NHS Information Centre’s Security and Confidentiality AdvisoryGroup; further data and software acquisition. Research Fellow will begin on-line training in multilevelmodelling through the Centre for Multilevel Modelling (University of Bristol). First meeting of fullstudy team.
Months 1 to 3: Induction of Research Fellow and completion of on-line multilevel modelling training;secure NIGB and NRES permissions and finalise acquisition of all study data; liaison with NHS InformationCentre Secondary Uses Service to support data linkage. Plan & execute data management. Further meetingof the full study team.
Months 4 to 15: Data analysis. Regular study team meetings; regular supervision of Research Fellow(Warwick and Portsmouth). Initial meetings with service users (via Mental Health Foundation, MHF), andwith NHS mental health service clinicians and managers (via Mental Health Network, MHN).
Months 16 to 18: Interpretation of findings, final meetings of full study team. Further consultation eventwith service users (facilitated by Mental Health Foundation) NHS mental health service Chief Executives(facilitated by Mental Health Network); report writing and dissemination (including formal briefing reportsto be published by MHF and the NHS Confederation (governing body of the MHN).
Project managementManagement of the project is of the utmost importance, given that the research team will be spread outacross five sites within the UK. As we describe below, this project has arisen from strong researchpartnerships and collaborations that span the past decade. We have an established track record of workingtogether very productively, and this is further evidenced by the significant research outputs that haveaccrued between the time of the outline submission and the present. We have published numerous paperstogether in high impact scientific journals, including several notable publications in the last year alone.We are a tried and tested collaborative of like-minded and committed academics who know one anothervery well, and we have established an effective modus operandi over many years.
SW, who is based at the University of Warwick, will be the Chief Investigator and Project Manager, andwill have day to day responsibility for all aspects of the project. His time is budgeted at 10%. SW hasconsiderable management experience, and is also Clinical Director of West Midlands (South) CLRN, wherehe is responsible for an annual budget of £6.7m. He is also chair of the Psychological and CommunityTherapies Panel at the NIHR Health Technology Assessment programme.
DOI: 10.3310/hsdr02490 HEALTH SERVICES AND DELIVERY RESEARCH 2014 VOL. 2 NO. 49
© Queen’s Printer and Controller of HMSO 2014. This work was produced by Weich et al. under the terms of a commissioning contract issued by the Secretary of State forHealth. This issue may be freely reproduced for the purposes of private research and study and extracts (or indeed, the full report) may be included in professional journalsprovided that suitable acknowledgement is made and the reproduction is not associated with any form of advertising. Applications for commercial reproduction should beaddressed to: NIHR Journals Library, National Institute for Health Research, Evaluation, Trials and Studies Coordinating Centre, Alpha House, University of Southampton SciencePark, Southampton SO16 7NS, UK.
85

PK (in Newcastle) will be Deputy Project Manager, and his time has also been costed at 10%. He has awealth of experience of using a number of the study data sets, and of liaising with the NHSInformation Centre.
There will frequent communication between members of the research team, and we have scheduledregular face-to-face meetings every two months at rotating venues. We will hold a teleconference (assistedwhere appropriate by Skype) between these meetings, to ensure that the full study team discuss progressat least once a month. These meetings will be minuted and will be used to monitor progress and toidentify any necessary action points.
The proposed Research Fellow, Dr McBride, has a proven record of academic achievement and awell-deserved reputation for being able to work independently. Her CV (which we attach) testifies to herdrive and ambition, as well as her expertise. She has undertaken very productive visiting fellowshipsoverseas, where she has increased her knowledge and learning but has also produced significant researchoutputs. She has worked and published previously with SW, and the physical separation is unlikely to be ahindrance. We have budgeted for her to travel regularly to England where she will be supervised both bySW but also by Dr Twigg in Portsmouth, by Liz Twigg. Dr Twigg has worked extensively with SW and hasbeen recruited to the project for her experience as a senior health geographer and her considerableexpertise in multilevel statistical modelling.
We have also set out our proposals for working with our two partners, the Mental Health Foundation andthe Mental Health Network below. The former will be enhanced by the David Crepaz-Keay’s membershipof the project steering group.
Approval by ethics committees
Although this is secondary research and we will not be collecting any new data, we will require researchethics approval for specific aspects of the proposed research.
We will seek NHS Research Ethics approval for our research, and will apply to the NHS Information Centrethrough its Security and Confidentiality Advisory Group for access to anonymised, patient-level HES data.The Information Centre and its associated Secondary Uses Service and Medical Research InformationService have been very helpful to date in signposting processes for securing the necessary permissions andapprovals, and we will follow their direction in these matters.
Most of the other data that we will be using will be aggregated at the PCT or Trust level, and is in thepublic domain. Nevertheless, our research ethics application will address the issue of data linkage, since intheory it might be possible to identify someone by triangulated the multiple area-level indicators in a linkeddata set.
Service users/public involvementWe propose to engage two sets of ‘users’: users of mental health services, and senior NHS mental healthservice managers and clinicians.
We will involve mental health service users through our partnership with the Mental Health Foundation(MHF) (http://www.mentalhealth.org.uk), the UK’s leading mental health research, policy and serviceimprovement charity. Service user involvement will be coordinated by David Crepaz-Keay, Head ofEmpowerment and Social Inclusion at the MHF and a co-application on this proposal. The main aim ofthis partnership is to ensure that the service user perspective shapes the research questions, influencesanalysis and interpretation and assists in disseminating the findings.
APPENDIX 2
NIHR Journals Library www.journalslibrary.nihr.ac.uk
86

Working through and with the MHF, we propose to circulate a summary of the study aims and methods toa network of mental health service users for comment. We will also seek feedback from service users onour preliminary findings.
We have also established a partnership with representatives of another key ‘user’ group, namely seniorNHS mental health service managers. We will work with the Mental Health Network (part of the NHSConfederation) to recruit participants to two consultation events. The NHS Confederation represents morethan 90% of the organisations that make up the NHS. Its members include the majority of NHS acutetrusts, ambulance trusts, foundation trusts, mental health trusts, primary care trusts, special healthauthorities and strategic health authorities in England; trusts and local health boards in Wales; andhealth and social service trusts and boards in Northern Ireland.
Both mental health service users and NHS mental health managers (and chief executives) will be askedto comment on our research aims, hypotheses at the start of the project, and their views on how best tointerpret our findings will be solicited at the end, but before formal dissemination. This will ensure that theresearch questions are framed to address key concerns of those responsible for delivering mental healthcare in the UK as well as those on the receiving end. Feedback from both sets of consultations will enableus to present our findings in the form of actionable conclusions.
Expertise and justification of support required
Project teamThe project team is based at Warwick, Newcastle, London and Portsmouth. All members of the group haveworked together on several prior studies over 10 years (SW and LT), demonstrating effective collaborationand numerous research outputs. SW, PK, JS and KB are all Consultant Psychiatrists with long experience ofdeveloping, leading and delivering adult mental health services in the UK. SW and PK will assumeresponsibility for delivering the project, and together with LT will supervise the Research Fellow. LT willprovide specialist statistical expertise. All applicants will contribute to the formulation of study aims,monitoring progress, interpreting findings and supporting dissemination.
Scott Weich is a psychiatric epidemiologist with extensive experience of secondary analysis usingcomplex data sets in the study of social, geographical, ethnic and gender inequalities in rates ofmental disorder. He has published widely on these, including work with Liz Twigg using multilevelmodelling (MLM). He and Kam Bhui have worked together on studies of ethnic inequality in theexperience of mental health care. He has also worked with Orla McBride (Research Fellow) on two recentpublications. He will have overall responsibility for project management.
Patrick Keown has detailed knowledge of the relevant data sets and has experience in evaluating theimpact of service innovations at a local level as well as changes across England. He was the lead author onthe 2008 BMJ paper documenting increased detention rates, and is first author on the time series analysis(using HES data) that is being considered by the BMJ.
Jan Scott has a track record in clinical service developments (e.g. Longbenton community service, cited asan example of good practice in the Key Areas Handbook) and was previously an Honorary SMO at theDepartment of Health working on mental health policy. She has expertise in the analysis of large andcomplex data sets such as process and outcome research in psychotherapy. She chaired a workshop on theEuropean Mental Health Programme at the EU in Brussels in 2009 and with John Bowis (EuroMP) led asimilar initiative in 2009 at the European Health Conference in Gastein. These meetings comparedcross-national resource utilisation and voluntary and involuntary admissions rates. She is currently involvedin a multi-national project on barriers to service use and engagement in young adults with severe mentaldisorders, including how stigma delays help-seeking.
DOI: 10.3310/hsdr02490 HEALTH SERVICES AND DELIVERY RESEARCH 2014 VOL. 2 NO. 49
© Queen’s Printer and Controller of HMSO 2014. This work was produced by Weich et al. under the terms of a commissioning contract issued by the Secretary of State forHealth. This issue may be freely reproduced for the purposes of private research and study and extracts (or indeed, the full report) may be included in professional journalsprovided that suitable acknowledgement is made and the reproduction is not associated with any form of advertising. Applications for commercial reproduction should beaddressed to: NIHR Journals Library, National Institute for Health Research, Evaluation, Trials and Studies Coordinating Centre, Alpha House, University of Southampton SciencePark, Southampton SO16 7NS, UK.
87

Kam Bhui is an epidemiologist and cultural psychiatrist and has experience of working with large data sets toassess inequalities. He has worked extensively on different aspects of the national race equality programmeusing complex qualitative and quantitative data. Together with Scott Weich, he undertook a nationalevaluation of the Focused Implementation Site programme, the flagship for Delivering Race Equality.
Liz Twigg is a senior health geographer who specialises in the analysis of large and complex spatiallyreferenced data sets using multilevel modelling methods. She has used MLM techniques to look atgeographical variation in a number of health outcomes (including common mental disorders) and healthrelated behaviours and has much experience of using the results of such models to produce small areaestimates of health outcomes.
David Crepaz-Keay is Head of Empowerment and Social Inclusion at the Mental Health Foundation. He hasover 20 years’ experience in service user involvement, and was previously chief executive of Mental HealthMedia, former board member and vice-chair for the Commission for Patient and Public Involvement inHealth, founding member of National Survivor User Network (NSUN), and former chair and treasurer ofSurvivors Speak Out. I am also a member of the All Wales Mental Health Promotion Board and an advisorto World Health Organisation (WHO) Europe on empowerment. He has personal experience of usingmental health services and of involuntary admission.
Justification of support requestedWe note that the project budget has increased since the outline submissions. The main reasons for thiswere to (i) ensure appointment of a Research Fellow capable of undertaking the work; (ii) include expertisein health geography and multilevel modelling; (iii) increase the time commitment of the applicants toensure successful delivery of the study; (iv) secure effective patient and public involvement; and (v) ensurethat the study findings are translated into actionable conclusions for NHS managers and commissioners.
We are seeking support for a 15-month project. The main challenge of this project will be collating,merging and managing a complex data set, and therefore it is imperative that the project researcher iscapable of undertaking this. Past experience shows that recruiting someone with the necessary skill set,and who is also a capable statistical analyst, is difficult. At the behest of the Reviewers we have budgetedfor a Research Fellow rather than a Research Associate. The largest cost associated with this project is thesalary of an experienced Research Fellow (Dr Orla McBride, CV attached). Dr McBride is shortly to take upa post at the University of Ulster, from where (if our application is successful) we shall second her to thisproject. She has collaborated previously with the Chief Investigator, and has extensive experience ofanalysing complex data sets used a range of advanced statistical methods. She has a background inpsychology and clinical experience in mental health settings. An honorary contract will also be sought forDr McBride at Warwick University (for which there are no cost implications). We are seeking a limitedtraining budget to support Dr McBride in developing her skills in multi-level modelling. We note that thecentre for Multilevel Modelling at Bristol University, the leading centre of its kind in the UK, now deliversits renowned training on-line: http://www.bristol.ac.uk/cmm/learning/course.html.
In response to the Reviewers’ comments, we have expanded the project team in three ways: (i) to ensurerobust PPI involvement; (ii) to engage another key set of ‘users’, namely senior NHS managers; and finally(iii) to secure expertise in health geography multilevel statistical modelling (Dr Liz Twigg). We are delightedto report that both the Mental Health Foundation (MHF) and the Mental Health Network of the NHSConfederation have agreed to join us as partners, and to help us facilitate consultation events with serviceusers and NHS managers and clinicians, respectively. David Crepaz-Keay, the Head of Empowerment andSocial Inclusion at the MHF, has agreed to become an applicant on this proposal. We have also notedthe Reviewers’ concerns about the collective time to be spent by the applicants on the project and haveincreased this so that the project lead (SW), deputy lead (PK) and LT will all spend 10% of their time onthis, and JS and KB 5% each. We have requested support for the involvement of DC-K (2 days per monthfor the duration of the project) and a small amount of time for the MHF’s Director of Research,Dr Eva Cyhlarova.
APPENDIX 2
NIHR Journals Library www.journalslibrary.nihr.ac.uk
88

The budget includes requests to support consultation events (two each) hosted by the Mental HealthFoundation (mental health service users) and the Mental Health Network (senior NHS managers andclinicians). Each of these meetings will comprise 8–10 participants plus members of the research team.
We have applied for travel funds to enable regular meetings of the project team, and for Dr McBride totravel to England (Portsmouth and Warwick) for supervision. We have allowed a modest amount in thebudget for software, data acquisition, consumables and dissemination.
DOI: 10.3310/hsdr02490 HEALTH SERVICES AND DELIVERY RESEARCH 2014 VOL. 2 NO. 49
© Queen’s Printer and Controller of HMSO 2014. This work was produced by Weich et al. under the terms of a commissioning contract issued by the Secretary of State forHealth. This issue may be freely reproduced for the purposes of private research and study and extracts (or indeed, the full report) may be included in professional journalsprovided that suitable acknowledgement is made and the reproduction is not associated with any form of advertising. Applications for commercial reproduction should beaddressed to: NIHR Journals Library, National Institute for Health Research, Evaluation, Trials and Studies Coordinating Centre, Alpha House, University of Southampton SciencePark, Southampton SO16 7NS, UK.
89


Part of the NIHR Journals Library www.journalslibrary.nihr.ac.uk
Published by the NIHR Journals Library
This report presents independent research funded by the National Institute for Health Research (NIHR). The views expressed are those of the author(s) and not necessarily those of the NHS, the NIHR or the Department of Health
EMEHS&DRHTAPGfARPHR
Copyright © 2022 FDOKUMEN