Variability of organic material in surface horizons of the hyper-arid Mars-like soils of the Atacama...
9
Variability of organic material in surface horizons of the hyper-arid Mars-like soils of the Atacama Desert Lauren E. Fletcher a,b,⇑ , Julio E. Valdivia-Silva b,c , Saul Perez-Montan ˜o d,b , Renee M. Condori-Apaza e , Catharine A. Conley f , Christopher P. McKay b a Atmospheric, Oceanic, and Planetary Physics, University of Oxford, Oxford, UK b Space Sciences Division, NASA Ames Research Center, Moffett Field, CA, USA c Laboratorio de Quı ´mica de Plasmas y Estudios Planetarios, Instituto de Ciencias Nucleares, Universidad Nacional Auto ´ noma de Me ´xico, Mexico d San Jose State University, Dept. of Chemistry, San Jose, CA, USA e Universidad Nacional de San Agustı ´n, Arequipa, Peru f Planetary Sciences Division, Science Mission Directorate, NASA Headquarters, Washington, DC, USA Received 15 March 2011; received in revised form 3 June 2011; accepted 2 October 2011 Available online 8 October 2011 Abstract The objective of this work was to investigate the variability of surface organic carbon within the hyper-arid Yungay region of the Atacama Desert. The fraction of Labile Organic Carbon (LOC) in these samples varied from 2 to 73 lg per gram of soil with a bi-modal distribution with average content of 17 ± 9 lg LOC and 69 ± 3 lg LOC for “low” and “high” samples, respectively. Interestingly, there was no relation between organic levels and geomorphologic shapes. While organics are deposited and distributed in these soils via eolic processes, it is suggested that fog is the dynamic mechanism that is responsible for the variability and peaks in organic carbon throughout the area, where a “high” LOC content sample could be indicative of a biological process. It was determined that there was no significant difference between topological feature or geographical position within the hyper-arid samples and LOC. This very curious result has implications for the investigation of run-off gullies on the planet Mars as our work suggests a need for careful consideration of the expec- tation of increases in concentrations of organic materials associated with following aqueous altered topology. Ó 2011 Published by Elsevier Ltd. on behalf of COSPAR. Keywords: Soil organic carbon; Organic-variability; Atacama Desert; Extreme environments; Hyper-arid; Mars analog 1. Introduction Hyper-arid environments represent some of the most challenging habitats on Earth, often limiting ecosystems in these locations to little more than microbial life. The Atacama Desert on the western coast of South America is one of the world’s driest deserts and exhibits desert con- ditions extending from 10°S to 30°S, crossing from Peru ´ into Chile (Figs. 1 and 2). The values of mean annual pre- cipitation reported for northern Chile are the lowest of any long-term record in the world (Dillon and Hoffmann, 1997), and precipitation averages less than 1 mm/year in the central regions between about 15°S and 25°S(McKay et al., 2003; Valdivia-Silva et al., 2011b). The combined effects of a high pressure system located on the western Pacific Ocean, the drying caused by the cold, north-flowing Humboldt Current, and the rain shadow of the Cordillera de Los Andes intercepting precipitation from the Inter- tropical Convergence, causes this hyper-arid climate (Arroyo et al., 1988; Houston and Hartley, 2003). This wide spread hyper-aridity does not support mac- roscopic primary producers, nor does it appear to support abundant microbial photosynthetic communities (Warren- Rhodes et al., 2006) beyond specialized niche communities 0273-1177/$36.00 Ó 2011 Published by Elsevier Ltd. on behalf of COSPAR. doi:10.1016/j.asr.2011.10.001 ⇑ Corresponding author at: University of Oxford, AOPP, Clarendon Laboratory, Parks Road, Oxford OX1 3PU, UK. Tel.: +44 0 1865 272933; fax: +44 0 1865 272923. E-mail address: [email protected] (L.E. Fletcher). www.elsevier.com/locate/asr Available online at www.sciencedirect.com Advances in Space Research 49 (2012) 271–279
Transcript of Variability of organic material in surface horizons of the hyper-arid Mars-like soils of the Atacama...

Available online at www.sciencedirect.com
www.elsevier.com/locate/asr
Advances in Space Research 49 (2012) 271–279
Variability of organic material in surface horizons of thehyper-arid Mars-like soils of the Atacama Desert
Lauren E. Fletcher a,b,⇑, Julio E. Valdivia-Silva b,c, Saul Perez-Montano d,b,Renee M. Condori-Apaza e, Catharine A. Conley f, Christopher P. McKay b
a Atmospheric, Oceanic, and Planetary Physics, University of Oxford, Oxford, UKb Space Sciences Division, NASA Ames Research Center, Moffett Field, CA, USA
c Laboratorio de Quımica de Plasmas y Estudios Planetarios, Instituto de Ciencias Nucleares, Universidad Nacional Autonoma de Mexico, Mexicod San Jose State University, Dept. of Chemistry, San Jose, CA, USA
e Universidad Nacional de San Agustın, Arequipa, Peruf Planetary Sciences Division, Science Mission Directorate, NASA Headquarters, Washington, DC, USA
Received 15 March 2011; received in revised form 3 June 2011; accepted 2 October 2011Available online 8 October 2011
Abstract
The objective of this work was to investigate the variability of surface organic carbon within the hyper-arid Yungay region of theAtacama Desert. The fraction of Labile Organic Carbon (LOC) in these samples varied from 2 to 73 lg per gram of soil with a bi-modaldistribution with average content of 17 ± 9 lg LOC and 69 ± 3 lg LOC for “low” and “high” samples, respectively. Interestingly, therewas no relation between organic levels and geomorphologic shapes. While organics are deposited and distributed in these soils via eolicprocesses, it is suggested that fog is the dynamic mechanism that is responsible for the variability and peaks in organic carbon throughoutthe area, where a “high” LOC content sample could be indicative of a biological process. It was determined that there was no significantdifference between topological feature or geographical position within the hyper-arid samples and LOC. This very curious result hasimplications for the investigation of run-off gullies on the planet Mars as our work suggests a need for careful consideration of the expec-tation of increases in concentrations of organic materials associated with following aqueous altered topology.� 2011 Published by Elsevier Ltd. on behalf of COSPAR.
Keywords: Soil organic carbon; Organic-variability; Atacama Desert; Extreme environments; Hyper-arid; Mars analog
1. Introduction
Hyper-arid environments represent some of the mostchallenging habitats on Earth, often limiting ecosystemsin these locations to little more than microbial life. TheAtacama Desert on the western coast of South Americais one of the world’s driest deserts and exhibits desert con-ditions extending from 10�S to 30�S, crossing from Peruinto Chile (Figs. 1 and 2). The values of mean annual pre-
0273-1177/$36.00 � 2011 Published by Elsevier Ltd. on behalf of COSPAR.
doi:10.1016/j.asr.2011.10.001
⇑ Corresponding author at: University of Oxford, AOPP, ClarendonLaboratory, Parks Road, Oxford OX1 3PU, UK. Tel.: +44 0 1865 272933;fax: +44 0 1865 272923.
E-mail address: [email protected] (L.E. Fletcher).
cipitation reported for northern Chile are the lowest of anylong-term record in the world (Dillon and Hoffmann,1997), and precipitation averages less than 1 mm/year inthe central regions between about 15�S and 25�S (McKayet al., 2003; Valdivia-Silva et al., 2011b). The combinedeffects of a high pressure system located on the westernPacific Ocean, the drying caused by the cold, north-flowingHumboldt Current, and the rain shadow of the Cordillerade Los Andes intercepting precipitation from the Inter-tropical Convergence, causes this hyper-arid climate(Arroyo et al., 1988; Houston and Hartley, 2003).
This wide spread hyper-aridity does not support mac-roscopic primary producers, nor does it appear to supportabundant microbial photosynthetic communities (Warren-Rhodes et al., 2006) beyond specialized niche communities

Fig. 1. Shows the distribution of sites surveyed in Chile where high soil LOC content sites are in black and low soil LOC content sites are in white. Highvalue samples are shown clearly within the same community of low value samples. Map developed with GeoMapApp version 1.4.2 by Marine GeoscienceData System (http://www.marine-geo.org).
Fig. 2. Detailed location of sites surveyed in Peru where high soil LOC content sites are shown in black and low soil LOC content sites are shown in white.Map developed with GeoMapApp version 1.4.2 by Marine Geoscience Data System (http://www.marine-geo.org).
272 L.E. Fletcher et al. / Advances in Space Research 49 (2012) 271–279
such as endolithic cyanobacteria hidden in halite salt out-croppings (Wierzchos et al., 2006) and sub-surface bacte-rial communities (Drees et al., 2006; Fletcher et al., 2006,2011; Maier et al., 2004). The core hyper-arid region ofthe Atacama is located in the central depression between
24�S and 25�S at an elevation of about 1000 m. At theselatitudes the high crestline of the coastal mountainsblocks the marine layer fog from penetrating to the driestpart of the Atacama Desert (Navarro-Gonzalez et al.,2003).

L.E. Fletcher et al. / Advances in Space Research 49 (2012) 271–279 273
Hyper-arid soils from this region are characterized by(1) extremely low levels of microorganisms (Connonet al., 2007; Drees et al., 2006; Fletcher et al., 2011; Lesteret al., 2007; Maier et al., 2004; Navarro-Gonzalez et al.,2003), (2) low levels of organic material (Bagaley, 2006;Connon et al., 2007; Drees et al., 2006; Ewing et al.,2006; Fletcher et al., submitted for publication-b; Lesteret al., 2007; Navarro-Gonzalez et al., 2003; Valdivia-Silvaet al., 2009, 2011b) with only refractory organics present(Ewing et al., 2006), and (3) the presence of an oxidant inthe soil that is not chirally specific (Navarro-Gonzalezet al., 2003; Quinn et al., 2007).
Despite these previous studies which have reportedresults for organic carbon in the hyper-arid core, most haveonly analyzed a few samples due to expensive analyticaltechniques; however, a deeper understanding of the limitsin organic carbon availability limited by extreme ariditywill help geochemists to understand carbon cycling, biolo-gists to evaluate the distribution of micro-organisms, andastrobiologists and planetologists to interpret data fromMars because of its previous qualification as a Mars analogdue to the properties listed above (Navarro-Gonzalez et al.,2003; Valdivia-Silva et al., 2011b).
In this paper, we report on the distribution of organicmaterial in the hyper-arid core of the Atacama Desert fora large number of samples collected in 2004 and 2006across a variety of morphological/topological featuresusing a rapid, low-cost method reported previously(Fletcher et al., submitted for publication-b; Navarro-Gonzalez et al., 2006). In addition, we compared the resultsof Yungay, Chile, (1) to the hyper-arid region of La Joya,Peru, (2) to the arid region of Mosopuquio, Peru, and (3)to a river bed near Yungay we term the “Oasis.”
2. Materials and methods
2.1. Site selection and sampling methodology
A total of 100 samples were collected in 2004 and 2006in the vicinity of Yungay in the Chilean part of the Ata-cama Desert (Fig. 1). Hyper-arid samples from the Yungaybasin were generally collected from the Rock Garden area.Additionally, four hills and three gullies were selected inthe Yungay basin and samples were collected from thetop, middle, and toe-slope of each hill or gulley. In the caseof the gullies, samples were collected inside and outside ofthe flow channel at the top, middle, and toe-slope.
Also included in these 100 samples were those samplescollected from an “Oasis” just outside the Yungay basinwhere there is a high density of plants and bushes. Theplants in the Oasis are supplied with water from an aque-duct which was made for an ore processing plant thathas been defunct for at least 80 years.
As a point of comparison to another hyper-arid envi-ronment, an additional 11 samples were collected fromthe hyper-arid La Joya region located approximately65 km southwest of Arequipa, Peru (Fig. 2), which was
previously described by Valdivia-Silva et al. (2011b).For comparison to an arid environment, several sampleswere collected from an area just to the east of Arequipanear the sierra town of Mosopuquio in the foot-hills ofthe Pichu Pichu volcano, which has low-levels of rainand visible plant growth (also described by Valdivia-Silvaet al. (2011b)).
Hyperarid zones were derived from an Aridity Index(AI) which is calculated as the ratio P/PET (evapotranspi-ration/precipitation) < 0.05 (Houston and Hartley, 2003;McKay et al., 2003; Middleton and Thomas, 1997; Thorn-thwaite, 1948; Valdivia-Silva et al., 2011a).
2.2. Sample handling and storage
All samples in this study were collected using a randomstratification sampling plan in which a 1 m2 area was mea-sured at each sampling point. Each individual sample wasrandomly collected from within this area. Three individualsamples were collected and stored separately for each of thesampling points. These were processed independently butthe average value is reported.
The samples were simple, unmixed and consistently col-lected from 0 to 4 cm depth (typical due to the type of col-lection spoons utilized which did not penetrate too deeply,but with 5 cm as the maximum estimated depth). Sampleswere collected with sterile gloves and plastic spoons andtransferred into sterile zip-lock bags or whirl-pak bagsfor storage and transport. The size of the samples rangedfrom 114 to 442 g with the average sample size collectedas 313 g per bag.
2.3. Laboratory setup
Samples were processed in three locations: The YungayDesert Research Station of the University of Antofagasta,Chile; Laboratories in the Faculty of Medicine in theNational University of San Agustin located in Arequipa,Peru; and laboratories of the company, Wright S.A.C., alsolocated in Arequipa.
2.4. Determination of Labile Organic Carbon
Determination of Labile Organic Carbon (LOC) con-centration was per previous published methods (Fletcheret al., submitted for publication-b; Navarro-Gonzalezet al., 2006; Valdivia-Silva et al., 2009, 2011b). This methodwhich allows rapid, in-field deployment and analysis, byacid hydrolysis of the sample and then back titrated withpotassium permanganate to determine the light fractionof soil organic carbon (Labile Organic Carbon). Briefly(per Fletcher et al., submitted for publication-b), 1 g ofsample was weighed into a 15 ml Teflon centrifuge tube,10 ml of 30% sulfuric acid was added to the tube and thensonicated for 5 min at ambient temperature. The tubeswere centrifuged for 15 min at 3500 rpm, afterwardsdecanting the solution into an Erlenmeyer flask which

274 L.E. Fletcher et al. / Advances in Space Research 49 (2012) 271–279
was then heated over a magnetic stirrer at approximately80 �C for 3–5 min, and then titrated with potassium per-manganate (KMnO4; 0.01 N) using a 25 ml burette(0.05 ml accuracy) until the liberated organic materialwas consumed. Each repetition of a sample was analyzedin triplicate with as many as three repetitions of each sam-ple. The volume of permanganate solution consumed wasconverted into mmols of KMnO4 which was then con-verted to LOC by a calibration curve against an oxalic acidstandard.
3. Results
Baseline levels of organic carbon were assessed by ana-lyzing all data points as a single data set (not including foursamples from the Oasis or samples from Peru). The rangewas from 2 to 73 lg LOC. A histogram of the frequencyof distribution is shown Fig. 3 where the x-axis representsthe number of micrograms of LOC and the y-axis repre-sents the number of times a point fell within that rangeof values of LOC. As can be seen in the histogram, 56 ofthe 96 samples (about 58% of the points) fell below themean of 20 ± 16 lg LOC, with the rest of the samplesspreading out up to a separation between two groups ofpoints which occurs between 39 and 66 lg LOC. A Shap-iro-Wilks W-test resulted in a W = 0.778274 withP < 0.0001 and confirmed the validity of the bi-modal dis-tribution with points divided into low and high LOCcontent.
Following the single group analysis, the data wasgrouped using 40 lg as the point of separation. The “low”
organics group (or less than 40 lg) contained 89 samples,while the “high” organics group (or 40 lg and above) con-tained seven samples. The average of the low group is17 ± 9 lg LOC and the average of the high group is69 ± 3 lg LOC. An analysis of the variance of the meansby Student’s T-test of the two groups resulted inT = �15.7 with P < 0.0001, and confirmed that the twogroups are significantly different. A plot of the means is
Fig. 3. Frequency Distribution of LOC. Shown are all points sampled in the hdistribution is shown with a separation between samples with a high and low Lsamples are not included in this distribution.
shown in Fig. 4 with each of the different populationstested. These include the single data set for all Chile points(less the Oasis points), Chile Low, High, and Oasis, andPeru Low, High, and Arid groupings. Chile and PeruLow and aligned with similar values while Chile Highand Peru High and Arid points aligned with similar values.
An investigation of the effect of geographical features onthe concentrations of organic materials was performed bysampling at the top, middle, and toe-slope of 4 hills and3 gullies. An ANOVA of the difference between high andlow values of LOC for the hills at the top, middle, andtoe-slope, resulted in P = 0.63, assuming the null hypothe-sis, determining that there is no difference in LOC as afunction of hill slope position. A similar analysis if the gul-lies resulted in P = 0.33, determining that there is no differ-ence in LOC as a function of gully slope position. A fullcomparison of slope position in hills and gullies resultedin an ANOVA of P = 23, eliminating any differencebetween any of the positions and LOC concentrations. Aplot of the means for each of these populations is presentedin Fig. 5.
Finally, a comparison of Chile points (with Hills, Gul-lies, and Oasis points removed) was run against the pooledHills and Gullies points. An ANOVA resulted in aP = 0.33 showing that there is no difference in LOC con-centrations as a function of location in the Hyper-aridYungay Basin. A plot of the means for General Area Chile,Hills, and Gullies is presented in Fig. 6.
4. Discussion
The objective of this work was the investigation of thevariability in organic content of hyper-arid soils from theAtacama Desert. An analysis of the full data set demon-strated a bi-modal distribution of LOC with about 7% fall-ing into the high group (Fig. 3). The distribution of highpoints did not correlate with any recognized featuresthroughout the region (Figs. 5 and 6). A comparison to ahyper-arid zone in Peru resulted in similar high and low
yper-arid zone of the Atacama Desert in 2004 and 2006. A clear bi-modalOC from 40 to 60 lg, where the curve assumes normal distribution. Oasis

Fig. 4. Plot of the means of the various statistical tests. Measurements arein lg LOC/g soil. “Chile All Points” represents the mean of all pointssampled in Chile (not counting the points in the Oasis). “Chile LowPoints” represents all the points in Chile with organic carbon content lessthan 40 lg and “Chile High Points” represents all the points in Chile withorganic carbon content greater than 40 lg. These confirm the bimodaldistribution of organic carbon in the Yungay Basin of the AtacamaDesert. “Chile Oasis Points” represents the points sampled within theOasis and demonstrates that these points are statistically different than allother points sampled in the Yungay Basin. “Peru Low Points” representsthe three low points sampled in Peru which are similar to low levelssampled in the Yungay Region. “Peru High Points” represents the threehigh points sampled in Peru which are similar to high levels sampled in theYungay Region. Standard error is large for these two groups due to thelow sample set size. “Peru Arid Points” represents those points sampled inan arid region in Peru and demonstrates that the Oasis points in theYungay Basin are nearly reaching levels associated with an aridenvironment. Error bars represent 1 sigma deviation. Plot created byonline software at: http://www.physics.csbsju.edu/stats.
Fig. 5. Plot of the group means of 4 Yungay Basin hills and 3 gullies.Measurements are in lg LOC/g soil. Groups A–C are the hills data andD–F are the gullies. Groups A and D are at the summit, groups B and Eare at the mid-slopes, and groups C and F are at the toe-slopes. With a95% confidence interval, it was determined that there was no significantdifference between slope-position and LOC content for the general areasequences sampled.
Fig. 6. Plot of the group means of General Yungay Area points (A), Hills(B), and Gullies (C). Measurements are in lg LOC/g soil. With a 95%confidence interval, it was determined that there was no significantdifference between topological or geographical position and LOC.
L.E. Fletcher et al. / Advances in Space Research 49 (2012) 271–279 275
values of LOC, which demonstrated wide ranging hyper-arid conditions throughout the Atacama Desert (Fig. 4).
These general results were compared to other studies.The low values of LOC determined by our method are con-sistent with values reported in a variety of other studies inthe hyper-arid Atacama Yungay Basin. The range of TOCreported in previous studies in the Yungay Basin was 10–19 lg TOC (Ewing et al., 2004, 2006; Navarro-Gonzalezet al., 2003; Valdivia-Silva et al., submitted for publica-tion-b; Warren-Rhodes et al., 2006). Two studies reportvalues that do not correlate with our data. Connon et al.(2007) reported 220–660 lg TOC and Lester et al. (2007)reported 690 lg TOC for their samples from the YungayBasin; however, both these values were below the quantifi-cation capability of the element analyzer method used intheir analyses (1000 lg minimum), as was noted by theauthors within these two publications. Comparison to thehyper-arid La Joya Desert in Peru resulted in similar levelsof both high and low LOC. This shows that these values forthe hyper-arid Atacama Desert extend beyond the YungayBasin.
Ewing et al. (2006) surmised from the various studiesthat P CO2
is very nearly that of atmospheric CO2, suggest-ing that organic carbon levels, at least in the surface soils,are for the most part in equilibrium with the atmosphere.

276 L.E. Fletcher et al. / Advances in Space Research 49 (2012) 271–279
The source of these salt inputs was in fact directly influ-enced by marine inputs from the nearby Pacific Ocean(Ewing et al., 2006). Measurements of the radiocarbonage indicate that the soil organic material is not relict frompre-desert conditions (Ewing et al., 2006; Warren-Rhodeset al., 2006).
In other harsh environments, microsite-scale heteroge-neity correlates with soil organic matter where sites sup-porting plants display higher levels of organic matterthan the bare inter-spaces, and plants appear to have thelargest effect on fast-turnover pools of organic matter(Burke et al., 1999; Hook et al., 1991; Vinton and Burke,1995). This could be tested as well in the hyper-arid coreof the desert in the dry river bed called the Oasis, less than5 km from the Yungay Rock Garden area, which wasinvestigated due to its unusual quantity of visible plant-life.Plants that can be found throughout the Atacama Desertare relegated to areas where more water is present, suchas green belts created by rivers cutting across the desertfrom the Andes to the Pacific coast, high-alpine lake sys-tems that are frequently highly alkaline, the fog-fed oasescalled ‘lomas’ (Gutierrez et al., 1998), and long-distancetransportation systems built for irrigation or industrialapplications. Beyond the hyper-arid core (not includingthe green-zones), marine layer fogs, termed “gar�as” inPeru and “camanchacas” in Chile (Dillon and Hoffmann,1997), appear to provide sufficient water to support a sur-prising extent of biodiversity that includes hypolithic cya-nobacteria (Warren-Rhodes et al., 2006), non-lichenizedfungi (Conley et al., 2006), lichens (Rundel, 1978), and evencacti (Rundel et al., 1991). Testing of samples from the cen-ter of the Oasis yielded high values of LOC. From ourdata, it appears that even within the hyper-arid core, ifenough water is provided, organics will accumulate in rela-tion to the plants that will grow there.
But what about where there are no visible primary pro-ducers, yet which have signs of alteration of the localtopography due to fluvial processes indicating an increasedaccess to water? Run-off gullies are evident featuresthroughout this region, and typically form starting atabout two-thirds of the way up the hills (apparently inde-pendent of hill height) and drain into the valley floors(Fig. 7, Gully 2 in Yungay region from visual inspection,the gullies more often than not terminate as soon as theyreach the valley floors, with any remaining flow soakinginto the sub-surface soils and/or evaporating.
Data from a number of studies of this area have demon-strated that rain is rare and that other sources of waterfrom fog are not sufficient to accumulate and alter thetopography (Davis et al., 2010; Ewing et al., 2006; McKayet al., 2003; Warren-Rhodes et al., 2006; Wierzchos et al.,2006). Mckay et al. (2003) showed 1 rain event of 2.3 mmin four years of observations including an El Nino yearand that soil RH peaked in the night time hours at <30%typical. Data from Ewing et al. (2006) showed no morethan 2 mm/year from aqueous chemical alteration of thesoil surface horizons with 1 mm/year attributed to multiple
small events of fog condensation. Because of this, the valleydrainage systems nor anywhere else in the hyper-aridregion, do not accumulate water for any significant period.More importantly, the soil moisture levels were shown byDavis et al. (2010) to not be affected by anything but rain,and even then the period of increased moisture levels werea few days at most.
Previous studies in less arid sites, such as the NorthAmerican grassland (Aguilar and Heil, 1988; Burke et al.,1999; Schimel et al., 1985a; Schimel et al., 1985b; Yonkeret al., 1988), showed that the concentrations of organicmaterials increased from summit to toe-slope. Even thehyper-arid Taylor Valley in Antarctica demonstratedstrong spatial variability at landscape scales, induced bytopographic variation likely associated with both geomor-phic and fluvial processes (Burkins et al., 2000, 2001). It islikely that these results can be explained by the “catena”
premise (Gerrard, 1981), which postulates that the down-hill movement of material due to gravity and water move-ment results in a predictable sequence of soil characteristicsfrom summits to toe-slopes.
Curiously, this is not what was discovered in the hyper-arid Yungay Basin in which there was homogeneity in LOCthroughout the region with occasional peaks and indepen-dent of geographical or topological feature. Ewing et al.(2006) showed that organic marine salts in the soils weredue to eolic deposition On the other hand, atmosphericconditions leading to increased soil moisture levels havebeen confirmed by meteorology studies of the region Daviset al., 2010; McKay et al., 2003) where relative humidity(RH) is only affected by rain and not fog as was notedby Mckay et al. (2003). Because of this we suggest thatthe deposition and distribution of organics in these soilsare controlled by eolic processes while the variability andpeaks are both controlled by fog.
The fog, which is throughout the area, generally distrib-utes across the desert uniformly with little localized varia-tion. An interesting and plausible hypothesis of thedynamic mechanism of fog over the homogeneity of theorganic content is closely related to its capacity as a sourceof water. Because chemical reactions in soil depend on thepresence of water, it could be that the fog increases themoisture in the soils and, along with soil minerals, increasesthe oxidation activity of the soils which in turn eliminatesany organic material to trace levels (Peeters et al., 2008;Valdivia-Silva et al., 2009). On the other hand, the peakscould also be explained by the fog, but in this case it maybe that fog induced moisture in specific niche microhabitatssuch as minerals, salts, or rocks in the soil, is sufficient tosupport soil biological communities which produce organicmaterial as a by-product of their own biological processes.As is found in studies of macroscopic communities, whereorganic material is greater under a plant than in an inter-space (Burke et al., 1995, 1999), it maybe that the hyper-arid Atacama is similar in that organic peaks are an indica-tion of a biological process in the microscopic microbialcommunities.
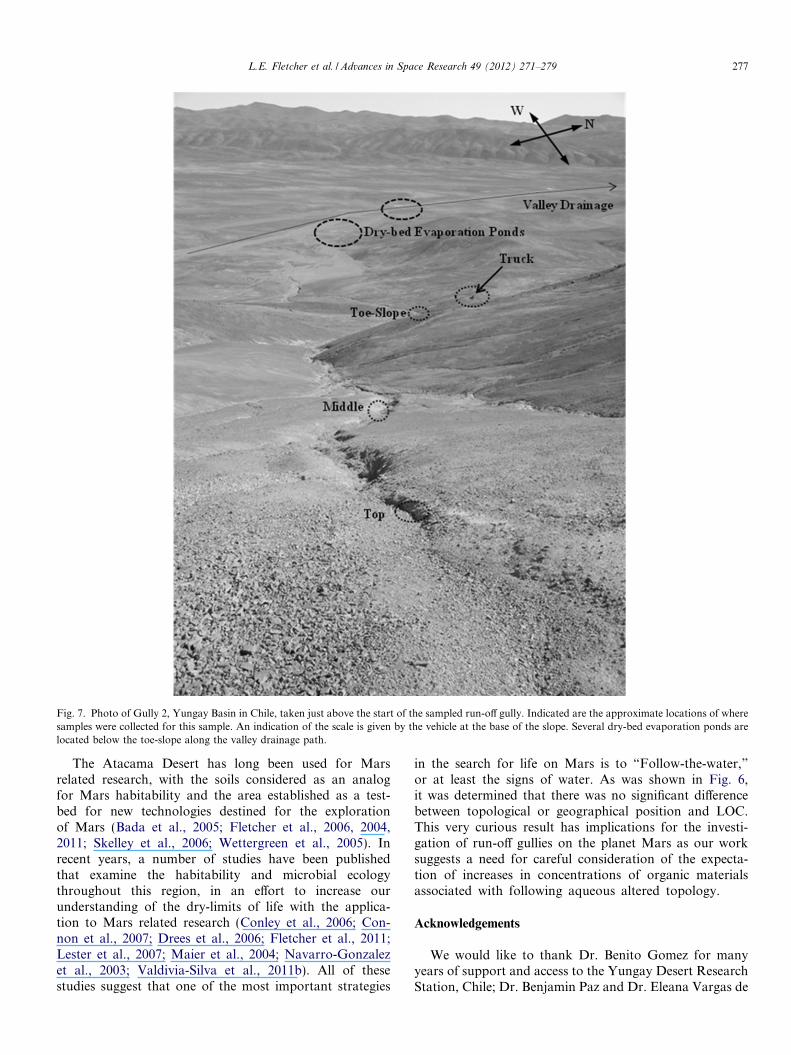
Fig. 7. Photo of Gully 2, Yungay Basin in Chile, taken just above the start of the sampled run-off gully. Indicated are the approximate locations of wheresamples were collected for this sample. An indication of the scale is given by the vehicle at the base of the slope. Several dry-bed evaporation ponds arelocated below the toe-slope along the valley drainage path.
L.E. Fletcher et al. / Advances in Space Research 49 (2012) 271–279 277
The Atacama Desert has long been used for Marsrelated research, with the soils considered as an analogfor Mars habitability and the area established as a test-bed for new technologies destined for the explorationof Mars (Bada et al., 2005; Fletcher et al., 2006, 2004,2011; Skelley et al., 2006; Wettergreen et al., 2005). Inrecent years, a number of studies have been publishedthat examine the habitability and microbial ecologythroughout this region, in an effort to increase ourunderstanding of the dry-limits of life with the applica-tion to Mars related research (Conley et al., 2006; Con-non et al., 2007; Drees et al., 2006; Fletcher et al., 2011;Lester et al., 2007; Maier et al., 2004; Navarro-Gonzalezet al., 2003; Valdivia-Silva et al., 2011b). All of thesestudies suggest that one of the most important strategies
in the search for life on Mars is to “Follow-the-water,”or at least the signs of water. As was shown in Fig. 6,it was determined that there was no significant differencebetween topological or geographical position and LOC.This very curious result has implications for the investi-gation of run-off gullies on the planet Mars as our worksuggests a need for careful consideration of the expecta-tion of increases in concentrations of organic materialsassociated with following aqueous altered topology.
Acknowledgements
We would like to thank Dr. Benito Gomez for manyyears of support and access to the Yungay Desert ResearchStation, Chile; Dr. Benjamin Paz and Dr. Eleana Vargas de

278 L.E. Fletcher et al. / Advances in Space Research 49 (2012) 271–279
Nieto for providing laboratory research space and supportat the Universidad Nacional de San Agustın (Arequipa,Peru); and to Antonio Ballon and Nicanor their help inthe collection of samples. Acknowledgement is given tothe ASTEP grant for providing partial funds in supportof this research work.
References
Aguilar, R., Heil, R.D. Soil organic-carbon, nitrogen, and phosphorusquantities in Northern Great Plains Rangeland. Soil Sci. Soc. Am. J.52, 1076–1081, 1988.
Arroyo, M.T.K., Squeo, F.A., Armesto, J.J., Villagran, C. Effects ofaridity on plant diversity in the Northern Chilean Andes – results of anatural experiment. Ann. Mo. Bot. Gard. 75, 55–78, 1988.
Bada, J.L., Sephton, M.A., Ehrenfreund, P., et al. New strategies to detectlife on Mars. Astron. Geophys. 46, 26–27, 2005.
Bagaley, D.R. Uncovering Bacterial Diversity on and Below the Surfaceof a Hyper-Arid Environment, the Atacama Desert, Chile. Depart-ment of Biological Sciences, Louisiana State University, Baton Rouge,pp. 173, 2006.
Burke, I.C., Lauenroth, W.K., Coffin, D.P. Soil organic-matter recoveryin semiarid grasslands – implications for the conservation reserveprogram. Ecol. Appl. 5, 793–801, 1995.
Burke, I.C., Lauenroth, W.K., Riggle, R., Brannen, P., Madigan, B.,Beard, S. Spatial variability of soil properties in the shortgrass steppe:the relative importance of topography, grazing, microsite, and plantspecies in controlling spatial patterns. Ecosystems 2, 422–438, 1999.
Burkins, M.B., Virginia, R.A., Chamberlain, C.P., Wall, D.H. Origin anddistribution of soil organic matter in Taylor Valley, Antarctica.Ecology 81, 2377–2391, 2000.
Burkins, M.B., Virginia, R.A., Wall, D.H. Organic carbon cycling inTaylor Valley, Antarctica: quantifying soil reservoirs and soil respira-tion. Glob. Change Biol. 7, 113–125, 2001.
Conley, C.A., Ishkhanova, G., Mckay, C.P., Cullings, K. A preliminarysurvey of non-lichenized fungi cultured from the hyperarid AtacamaDesert of Chile. Astrobiology 6, 521–526, 2006.
Connon, S.A., Lester, E.D., Shafaat, H.S., Obenhuber, D.C., Ponce, A.Bacterial diversity in hyperarid Atacama Desert soils. J. Geophys. Res-Biogeo., 112, 2007.
Davis, W.L., de Pater, I., McKay, C.P. Rain infiltration and crustformation in the extreme arid zone of the Atacama Desert, Chile.Planet Space Sci. 58, 616–622, 2010.
Dillon, M.O., Hoffmann, J.A.E. Lomas formations of the AtacamaDesert, Northern Chile, CPD report site SA43, in: Davis, S.D.,Heywood, V.H., Herrera-MacBryde, O., Villa-Lobos, J., Hamilton, A.(Eds.), Centres of Plant Diversity: A Guide and Strategy for TheirConservation, vol. 562. IUCN Publications Unit, Cambridge, 1997.
Drees, K.P., Neilson, J.W., Betancourt, J.L., et al. Bacterial communitystructure in the hyperarid core of the Atacama Desert, Chile. Appl.Environ. Microb. 72, 7902–7908, 2006.
Ewing, S.A., Navarro-Gonzalez, R., Amundson, R., Wu, J., McKay, C.P.A soil carbon cycle without life? The content and residence times oforganic carbon in the Atacama Desert of Chile. Int. J. Astrobiol. 3,120, 2004.
Ewing, S.A., Sutter, B., Owen, J., et al. A threshold in soil formation atEarth’s arid-hyperarid transition. Geochim. Cosmochim. Acta 70,5293–5322, 2006.
Fletcher, L.E., Kovacs, G.T.A., Ching, J., McKay, C.P. Field testing as afirst step toward an automated soil DNA extraction instrument for usewith PCR on Mars-like soils. Int. J. Astrobiol. 3, 120, 2004.
Fletcher, L.E., Conley, C., Ishkhanova, G., et al. Bacterial compositionand quantitation in the Yungay region of the Atacama Desert, Chile.Astrobiology 6, 1, 2006.
Fletcher, L.E., Conley, C.A., Valdivia-Silva, J.E., et al. Determination oflow bacterial concentrations in hyper-arid Atacama soils: comparison
of biochemical and microscopy methods with real-time quantitative-PCR. Can. J. Microbiol., 57, 2011.
Fletcher, L.E., Perez-Montano, S., Valdivia-Silva, J.E., et al. Field methodfor quantification of labile organic carbon in hyper-arid desert soilsvalidated by two thermal methods. Geoderma.
Gerrard, J. Soils and Landforms: An Integration of Geomorphology andPedology. George Allen & Unwin, London and Boston, 1981.
Gutierrez, J.R., Lopez-Cortes, F., Marquet, P.A. Vegetation in analtitudinal gradient along the Rio Loa in the Atacama Desert ofnorthern Chile. J. Arid Environ. 40, 383–399, 1998.
Hook, P.B., Burke, I.C., Lauenroth, W.K. Heterogeneity of soil and plantN and C associated with individual plants and openings in North-American shortgrass steppe. Plant Soil 138, 247–256, 1991.
Houston, J., Hartley, A.J. The central andean west-slope rainshadow andits potential contribution to the origin of HYPER-ARIDITY in theAtacama desert. Int. J. Climatol. 23, 1453–1464, 2003.
Lester, E.D., Satomi, M., Ponce, A. Microflora of extreme arid AtacamaDesert soils. Soil Biol. Biochem. 39, 704–708, 2007.
Maier, R.M., Drees, K.P., Neilson, J.W., Henderson, D.A., Quade, J.,Betancourt, J.L. Microbial life in the Atacama Desert. Science 306,1289, 2004.
McKay, C.P., Friedmann, E.I., Gomez-Silva, B., Caceres-Villanueva, L.,Andersen, D.T., Landheim, R. Temperature and moisture conditionsfor life in the extreme arid region of the Atacama Desert: four years ofobservations including the El Nino of 1997–1998. Astrobiology 3, 393–406, 2003.
Middleton, N., Thomas, D. Programme, U.N.E. World Atlas of Desert-ification, second ed Hodder Arnold, 1997.
Navarro-Gonzalez, R., Navarro, K.F., de la Rosa, J., et al. Thelimitations on organic detection in Mars-like soils by thermalvolatilization-gas chromatography-MS and their implications for theviking results. P Natl. Acad. Sci. USA 103, 16089–16094, 2006.
Navarro-Gonzalez, R., Rainey, F.A., Molina, P., et al. Mars-like soils inthe Atacama Desert, Chile, and the dry limit of microbial life. Science302, 1018–10121, 2003.
Peeters, Z., Quinn, R., Martins, Z., et al. Mars regolith analogues –interactions between mineralogical and organic compounds, in: 39thLunar and Planetary Science Conference, (Lunar and PlanetaryScience XXXIX). Lunar and Planetary Institute (LPI), League City,Texas, pp. 1742, 2008.
Quinn, R.C., Ehrenfreund, P., Grunthaner, F.J., Taylor, C.L., Zent, A.P.Decomposition of aqueous organic compounds in the Atacama Desertand in martian soils. J. Geophys. Res., 112, 2007.
Rundel, P.W. Ecological relationships of desert fog zone lichens.Bryologist 81, 277–293, 1978.
Rundel, P.W., Dillon, M.O., Palma, B., Mooney, H.A., Gulmon, S.L.,Ehleringer, J.R. The phytogeography and ecology of the coastalAtacama and peruvian deserts. Aliso 13, 48, 1991.
Schimel, D., Stillwell, M.A., Woodmansee, R.G. Biogeochemistry of C, N,and P in a soil Catena of the shortgrass steppe. Ecology 66, 276–282,1985a.
Schimel, D.S., Coleman, D.C., Horton, K.A. Soil organic-matter dynam-ics in paired rangeland and cropland toposequences in North-Dakota.Geoderma 36, 201–214, 1985b.
Skelley, A.M., Cleaves, H.J., Jayarajah, C.N., Bada, J.L., Mathies, R.A.Application of the mars organic analyzer to nucleobase and aminebiomarker detection. Astrobiology 6, 824–837, 2006.
Thornthwaite, C.W. An approach toward a rational classification ofclimate. Geographical Review 38, 55–94, 1948.
Valdivia-Silva, J.E., Navarro-Gonzalez, R., Fletcher, L.E., et al. Surfaceand subsurface soil carbon in the Atacama Desert: a model for carbondeposits in hyperarid soils Earth and Planetary Science Letters.
Valdivia-Silva, J.E., Navarro-Gonzalez, R., McKay, C. Thermally evolvedgas analysis (TEGA) of hyperarid soils doped with microorganismsfrom the Atacama Desert in southern Peru: implications for thephoenix mission. Adv. Space Res. 44, 254–266, 2009.
Valdivia-Silva, J.E., Navarro-gonzalez, R., Fletcher, L.E., et al. Climato-logical characteristics in the extreme hyper-arid region from the

L.E. Fletcher et al. / Advances in Space Research 49 (2012) 271–279 279
Pampas de La Joya, Atacama Desert southern Peru. Astrobiologicalapproach in four years of observation, 2004–2008. Int. J. Astrobiol.2011a. doi:10.1017/s1473550411000292.
Valdivia-Silva, J.E., Navarro-Gonzalez, R., Ortega-Gutierrez, F., et al.Multidisciplinary approach of the hyperarid desert of Pampas de LaJoya in southern Peru as a new Mars-like soil analog. Geochim.Cosmochim. Acta 75, 17, 2011b.
Vinton, M.A., Burke, I.C. Interactions between individual plant-speciesand soil nutrient status in shortgrass steppe. Ecology 76, 1116–1133,1995.
Warren-Rhodes, K.A., Rhodes, K.L., Pointing, S.B., et al. Hypolithiccyanobacteria, dry limit of photosynthesis, and microbial ecology inthe hyperarid Atacama Desert. Microb. Ecol. 52, 389–398, 2006.
Wettergreen, D., Cabrol., N., Baskaran, V., et al. Second experiments inthe robotic investigation of life in teh Atcama Desert of Chile, in:Battrick, B., (Ed.), Eighth International Symposium on ArtificialIntelligence, Robotics, and Automation in Space. European SpaceAgency Publications Division, Munich, Germany, 2005.
Wierzchos, J., Ascaso, C., McKay, C.P. Endolithic cyanobacteria in haliterocks from the hyperarid core of the Atacama Desert. Astrobiology 6,415–422, 2006.
Yonker, C.M., Schimel, D.S., Paroussis, E., Heil, R.D. Patterns oforganic-carbon accumulation in a semiarid shortgrass steppe, Colo-rado. Soil Sci. Soc. Am. J. 52, 478–483, 1988.