VALUE THROUGH MARKET LEADERSHIP AND INNOVATION
90
2014 ANNUAL REPORT VALUE THROUGH MARKET LEADERSHIP AND INNOVATION
-
Upload
khangminh22 -
Category
Documents
-
view
1 -
download
0
Transcript of VALUE THROUGH MARKET LEADERSHIP AND INNOVATION

2014 ANNUAL REPORT
LIND
SAY
CO
RPO
RA
TION
2014 AN
NU
AL R
EPO
RT
VALUE THROUGH MARKET LEADERSHIP AND INNOVATION

(In thousands, except per share amounts) 2014 2013 % Change
Income Statement Data(for the fiscal years ended August 31)
Operating revenues $ 617,933 $ 690,848 -11%
Gross profit $ 170,995 $ 194,834 -12%
Operating expenses $ 92,637 $ 87,773 6%
Operating income $ 78,358 $ 107,061 -27%
Net earnings $ 51,512 $ 70,570 -27%
Diluted net earnings per share $ 4.00 $ 5.47 -27%
Average diluted shares outstanding 12,882 12,901 0%
Balance Sheet Data(at August 31)
Cash and cash equivalents $ 171,842 $ 151,927 13%
Current assets $ 374,058 $ 368,791 1%
Fixed assets, net $ 72,457 $ 65,064 11%
Total assets $ 526,551 $ 512,296 3%
Current liabilities $ 116,367 $ 102,092 14%
Current and long-term debt $ – $ – 0%
Shareholder’s equity $ 382,647 $ 380,638 1%
Shares outstanding at year end 12,440 12,873 -3%
Cash Flow Data(for the fiscal years ended August 31)
Cash flows provided by operating activities $ 91,798 $ 57,505 60%
Cash flows used in investing activities $ 18,476 $ 41,081 -55%
Cash flows used in financing activities $ 53,595 $ 7,995 570%
Capital expenditures $ 17,715 $ 11,136 59%
Share repurchases $ 41,059 $ – NA
Cash dividends declared per share $ 0.920 $ 0.475 94%
Performance RatiosAnnual revenue growth -10.6% 25.3% NA
Operating margin 12.7% 15.5% NA
Return on net assets 12.6% 19.0% NA
LINDSAY CORPOR ATION
2014 ANNUAL REPORT
FINANCIAL AND OPERATING HIGHLIGHTS
Revenue ($ in millions)
750
500
250
0
We experienced declines in both the U.S. and international irrigation equipment revenues, driven largely by declining crop prices.
Return on Net Assets (RONA) (percentage)
18
12
6
0
Fiscal 2014 return on net assets decreased primarily due to lower operating revenues and associated profits.
Operating Margin (percentage)
Our operating margins in fiscal 2014 declined slightly, primarily impacted by the effects of a cyclical downturn in U.S. irrigation.
18
12
6
0
05 06 07 08 09 10 11 12 13 14
05 06 07 08 09 10 11 12 13 14
05 06 07 08 09 10 11 12 13 14

1
With fixed quantities of land and water, the only way to
feed an increasing population is to achieve higher
crop yields through the innovative and
efficient use of resources.
3 Pasco, Washington Zimmatic and FieldNET user

In the history of Lindsay Corporation, the Company has performed well through both the peaks and valleys that characterize the agriculture industry. After several years of record performance, we anticipated that some slowdown would occur in our fiscal year 2014. Despite the expected decrease in revenue, Lindsay was able to maintain strong margins, achieve significant improvement in our infrastructure segment, and solidify our position as the market technology leader in the irrigation industry. We continued to deliver solutions that offer exceptional value in the marketplace as we create value for shareholders.
FINANCIAL PERFORMANCE
For the fiscal year ended August 31, 2014, Company revenues were $617. 9 million, an 11 percent decrease from the record $690.8 million of fiscal 2013.
Irrigation equipment revenues decreased 14 percent from the prior year to $539.9 million. U.S. irrigation revenues of $331.5 million represented a 14 percent decline, driven largely by declining crop prices and the lessening of drought conditions in the corn belt. International irrigation revenues declined 13 percent to $208.4 million primarily due to Iraq contract revenues that were included in fiscal year 2013.
Infrastructure segment revenues increased 20 percent to $78.0 million from $64.9 million in fiscal 2013 due to significantly increased sales of road safety products and rail products. With the higher sales volume, infrastructure operating income was $3.5 million compared to a $0.8 million loss the prior year.
For fiscal 2014, Company operating income was $78.4 million, a 27 percent decrease from 2013. Net earnings were $51.5 million, or $4.00 per diluted share, compared with $70.6 million, or $5.47 per diluted share, in the prior year. Operating expenses were $92.6 million, or 15.0 percent of sales, compared to $87.8 million, or 12.7 percent of sales, for fiscal 2013. Gross margin for fiscal 2014 declined slightly to 27.7 percent compared to 28.2 percent in 2013. Operating margin decreased to 12.7 percent from 15.5 percent.
While we experienced the effects of a cyclical downturn in the agricultural segment in 2014, we were able to strengthen our balance sheet with solid net earnings and improvements in our working capital position. At August 31, 2014, cash and cash equivalents were $172 million, $20 million higher than the prior year. Our cash position grew even as we invested nearly $18 million in capital expenditures primarily for capacity expansion, and by doubling our quarterly dividend and repurchasing $41 million of our outstanding common stock. The Company has no long-term debt.
TO OUR SHAREHOLDERS
In 2014, Lindsay solidified its position as market technology leader in the irrigation industry and further defined its cash allocation plan to improve return to shareholders.
2
FINANCIAL OVERVIEW

Richard W. Parod,
President and Chief
Executive Officer
3

Lindsay Corporation is one of the world’s leading providers of irrigation and water management systems. Our product lines include center pivot and lateral move irrigation systems, hose reel travelers, integrated water-pumping stations, irrigation scheduling and controls, chemical injection systems, water filtration systems, and remote monitoring and control systems. Lindsay’s irrigation products are sold through more than 200 dealers in the U.S. and more than 140 dealers in international markets. Our products and systems help growers around the world conserve precious water, increase crop production, and reduce costs such as fuel and labor.
Lindsay’s irrigation segment generates revenue from three primary sources: 1) conversion of dry land to irrigation; 2) conversion from less efficient irrigation methods to mechanized systems; and 3) sales of replacement systems and parts.
IRRIGATION SEGMENT PERFORMANCE
The irrigation segment provided 87 percent of Lindsay’s revenue in fiscal 2014 compared to 91 percent the prior year. Irrigation equipment sales in the U.S. accounted for approximately 61 percent of segment revenue, with international sales comprising approximately 39 percent.
Operating margin for the irrigation segment was 17 percent in fiscal 2014 compared to 20 percent the prior year, primarily due to cost deleverage on lower sales.
IRRIGATION MARKET CONDITIONS
In fiscal 2014, lower agricultural commodity prices continued to exert downward pressure on irrigation equipment demand in the U.S. In addition, in August the USDA forecasted 2014 net farm income to be 14 percent below 2013 levels, although still remaining above the 10-year average. Finally, enhanced Section 179 depreciation tax benefits expired on December 31, 2013. These factors contributed to farmer sentiment being less inclined to make capital purchases.
However, the decrease in irrigation equipment sales was mitigated somewhat by revenue contributions from LAKOS filtration products, a business acquired at the end of fiscal 2013, along with higher than normal replacement sales due to severe spring and summer storms across the Midwest. With the superb responsiveness of our Nebraska factory and entire irrigation team, we were able to quickly meet the urgent needs of our dealers and their customers and provide the replacement equipment needed in the peak of the growing season.
International markets remain important in Lindsay’s growth strategy. In fiscal 2014, international sales accounted for 39 percent of
4
Lindsay experienced solid performance in key markets throughout the U.S. and around the world.
LAKOS Filtration Products was acquired in August 2013.
IRRIGATION SEGMENT REVIEW

5
NFTRAX
The NFTrax airless
wheel assembly is one
of Lindsay’s newest
award-winning products.

6
irrigation revenue compared to 38 percent the prior year. Solid performance in key markets such as South America, Europe, Australia, New Zealand, and Sudan tempered market uncertainty in politically sensitive areas such as Russia, Ukraine and Iraq. Our international footprint is solid although we experience regional volatility due to timing of large project opportunities, the competitive environment, government influences on subsidy programs and the effect of commodity pricing in certain areas.
NEW IRRIGATION PRODUCTS
In fiscal 2014, Lindsay continued to develop and introduce products that provide exceptional value and unique benefits to growers while enhancing our competitive position as a market leader.
We further expanded the capability of our industry-leading FieldNET® wireless irrigation management system, adding a next-generation 3G remote telemetry unit (RTU) as well as drip-controller technology that enables FieldNET connectivity to operate drip- and micro-irrigation systems along with the larger center pivot and lateral move systems. The award-winning FieldNET technology provides growers the industry’s most comprehensive options to remotely control their entire irrigation systems throughout the crop life cycle.
We also introduced the revolutionary NFTrax airless wheel assembly that eliminates the potential for flat tires on center pivots. The patent-pending product reduces downtime and labor required to perform repairs in the field. This is another example of our development process that addresses key customer concerns
with innovative solutions, and it has received very positive response in the marketplace.
THE COMPETITIVE ADVANTAGE OF INTEGRATED SOLUTIONS
Lindsay offers an unmatched breadth of products and value-added services. Beyond just selling center pivot irrigation equipment, we provide comprehensive solutions including pump stations and filtration, field layout and total system design, weather and field monitoring services, and the design and installation of in-field broadband communication
infrastructure. The synergistic acquisitions the Company has made in recent years further expand our product and service offerings.
Integrated solutions differentiate us from competitors in the marketplace. We lead the industry in customer-valued technological innovations, quality products and reliable service. We have observed, for example, that growers who use FieldNET to more effectively manage their crop growing processes become dedicated, loyal customers, depending on Lindsay products to help them increase irrigation efficiency, improve crop productivity, and reduce costs such as fuel and labor. Dealers in our network have expressed encouraging assessments of market share growth during the past few years, as well as recognized the benefits of a strong, differentiated competitive offering of products and services.
IRRIGATION MARKET OUTLOOK
In the near term, we expect that irrigation sales will continue to be impacted by lower crop prices and projected reductions in farm income as well as political instability in various regions of the world. The extent and the duration of the current cyclical downturn are difficult to predict.
However, our team is confident that the Company’s investment in competitively advantaged products and services will continue to position us well now and as agricultural market conditions improve.
In addition, our initiatives to manage costs have been effective. Lean manufacturing practices in the Nebraska irrigation facility have proven very valuable. Along with productivity enhancements, we
Since its market introduction in early 2014, Growsmart® by Lindsay’s MULTI-CONTROL for drip and micro-irrigation has received significant industry recognition:
• Top Ten New Product - World Ag Expo 2014
• One of the Year’s Most Innovative Designs in Engineering Products - The American Society of Agricultural and Biological Engineers AE50
• 2014 Best New Product, Agriculture - Irrigation Association’s Irrigation Show & Education Conference
IRRIGATION SEGMENT REVIEW (CONT.)

have demonstrated the ability to ramp production levels up and down in response to extensive market demand changes and to minimize the deleverage effect when volume decreases.
The production of liquid biofuels plays a part in our sales mix as irrigated corn, sugar cane and soybean crops are used to produce ethanol and biodiesel. The U.S. Energy Information Administration projects ethanol production to remain essentially unchanged from 2014 to 2015 while biodiesel production is forecast to increase by 3.6 percent.
Despite potential disruptions in Russia and Ukraine and continued political instability in the Middle East, we continue to generate revenue in those regions and see opportunities for future growth. We see potential for continuing growth in other international irrigation markets, as well. To further solidify our global supply capability we began construction on a new plant in Turkey, which is expected to be
operational in February 2015. In addition, we acquired our previously-leased facility in Brazil, with the intent to continue expansion of our international footprint and global, vertical integration of manufacturing processes.
For the long term, the macro drivers of demand for our products will remain positive. Global population growth and the need for food, the conservation and efficient use of water, protection of the environment and the adoption of biofuels will all continue to be issues of global importance.
In particular, population growth is the fundamental driver for the global agricultural market. The United Nations projects that the world’s population will grow from 7.2 billion in 2014 to approximately 9.6 billion by 2050. To adequately feed that increased population, the U.N. Food and Agriculture Organization (FAO) projects that food production will have to increase by 60 percent. With fixed quantities of land and water, the
only way this can be accomplished is to achieve higher crop yields and more efficient use of water.
Worldwide, only 20 percent of cultivated land is irrigated, yet irrigated land produces 40 percent of the world’s food supply. By far, the world’s most common irrigation method is flood or gravity irrigation that consumes twice as much water as an efficient mechanical system. Converting to an efficient pivot irrigation system or retrofitting a high pressure system to low pressure can conserve precious water, boost agricultural production, and reduce energy used in pump systems. Outside of North America, mechanized irrigation still has very low market penetration, creating excellent long-term opportunities.
Lindsay’s irrigation business is engaged in meeting a basic human need. By continuing to expand our capabilities, our efficiency, our global footprint and our capacity in the international markets, we will remain at the forefront of this essential industry.
7
THE LINDSAY ADVANTAGE
Lindsay’s rugged equipment,
integrated technologies, and
plug-and-play add-ons form the
best line of irrigation solutions
from a single, reliable source.
FILTRATION
Technology that Thinks Like You
®
CUSTOM PUMPING SOLUTIONS
PIVOTS & LATERALS
PLUG-AND-PLAY ADD-ONS
WIRELESS IRRIGATION MANAGEMENT

Infrastructure segment revenues increased 20% due to significantly increased sales of road safety and rail products.
Lindsay’s infrastructure segment is an international group of companies producing a wide range of products that aid in roadway maintenance and transportation safety. We manufacture moveable road barriers and barrier transfer machines, energy-absorbing crash cushions, specialty barriers for work areas or construction zones, road marking materials, railroad signaling structures, and other safety-related products. Lindsay’s roadway infrastructure products are sold through 35 dealers in the U.S. and 35 international dealers, while railroad products are sold directly to the major railroad companies in the U.S.
Lindsay’s patented QuickChange Moveable Barrier (QMB®), commonly known as The Road Zipper System™, is one of the few ways to effectively and safely manage congestion at a lesser investment than that required to build new roads. The QMB system provides a way to divert traffic around construction areas or work zones, increasing safety for work crews and motorists alike. On a permanent basis, the QMB is used to vary the number of lanes available to accommodate rush-hour (tidal) traffic flow, thus permitting more efficient use of available roadway. More than 200 Road Zipper Systems are in use in the U.S. and internationally.
INFRASTRUCTURE SEGMENT PERFORMANCE
The infrastructure segment provided 13 percent of Lindsay’s revenue in fiscal 2014 compared to 9 percent in fiscal 2013. Operating income was $3.5 million compared to a loss of $0.8 million the prior year, driven
by higher sales volume. Operating margins increased to a 4.5 percent profit in fiscal 2014 from a 1.3 percent loss in fiscal 2013 due to higher sales and a mix shift to higher margin products.
AGGRESSIVE FOCUS ON RESULTS
The Company made significant progress in infrastructure profitability in fiscal 2014 through both revenue increases and expense management. The infrastructure sales team was expanded and executed a more aggressive, structured sales process leading to expanded market share in road safety and railroad products. For road safety products, each state has its own qualification requirements for vendors and products. We were able to expand our geographic footprint and make inroads in getting key products qualified in many more states during the year.
8
The innovative TAU Tube crash cushion was designed for use in tunnels.
INFRASTRUCTURE SEGMENT REVIEW

Before The Road Zipper System
was installed on the Pesio
bridge in Italy, traffic queues
were six miles (10 km) long.
During reconstruction, The
Road Zipper System eliminated
traffic queues, provided positive
protection for motorists and
didn’t require any closures.
9

INFRASTRUCTURE PRODUCT DEVELOPMENT
In fiscal 2014 we launched an innovative crash cushion called the TAU Tube. It addresses a pressing market need for a crash cushion to be used in tunnels, where many competitive crash cushions release toxic fumes during fires, presenting significant risk to motorists and first responders. The construction of the TAU Tube substantially limits toxic fume off-gassing and meets stringent European requirements for this application.
INFRASTRUCTURE MARKET OUTLOOK
In the near term, we expect to build on the success of fiscal 2014 with further improvement including $12.7 million of revenue from installation of The Road Zipper System on the Golden Gate Bridge, culminating from an order received during fiscal 2014.
A federal highway bill signed in August of 2014 only provided $10.8 billion in temporary funding for a 10-month period, creating future funding uncertainty for road safety product revenues. In spite of this uncertainty, we believe we can continue to capitalize on recent progress with plans for market share increases in key product categories, margin improvements through manufacturing efficiencies, and expense management.
For the long term, population growth and essential transportation needs will continue to fuel expansion in demand for our infrastructure products.
10
Today, more than half of
the world’s infrastructure
investment is being made
in emerging nations with
a rapidly growing number
of vehicles and under-
developed infrastructure.
INFRASTRUCTURE SEGMENT REVIEW (CONT.)

11
Today, more than half of the world’s infrastructure investment is being made in emerging nations that have a rapidly growing number of vehicles and under-developed roadway infrastructure. On a global basis, there is continuing emphasis on reducing traffic mortality rates through investment in highway safety products. Lindsay’s infrastructure segment is working with agencies throughout the world to make their roadways safer with the use of lane barriers, energy-absorbing crash
cushions, and clear markings.
In more developed nations, there will be ongoing needs for infrastructure expansion and renovation. In addition, traffic congestion is much more than a mere inconvenience. The direct and indirect costs of roadway congestion drain approximately $121 billion from the U.S. economy annually, in the form of 5.5 billion hours lost in traffic and 2.9 billion gallons of fuel wasted (Source: Texas Transportation Institute – 2012 Urban Mobility
Report). Traffic and congestion also have a strong negative impact on the environment. In many situations, Lindsay’s Road Zipper System will be the most cost-effective solution available.
As the world’s population grows and mobility increases, Lindsay’s infrastructure solutions will demonstrate increasing value in terms of financial savings, environmental benefits and quality of life.
GOLDEN GATE BRIDGE, CA
Lindsay is building on the success of fiscal 2014,
which included a $12.7 million Road Zipper
System order from the Golden Gate Bridge
Highway & Transportation District.
A Lindsay Railroad Products offers
an extensive product line of
reliable structures and signals
from one source.
B Truck and trailer mounted
attenuators provide outstanding
performance.
C The Road Zipper System improves
traffic flow, and safeguards work
crews and motorists.
D Road Safety Products consistently
develops solutions for road hazards.
A
C
B
D
In more developed nations, there will be ongoing needs for infrastructure expansion and renovation. In addition, traffic congestion is much more than a mere inconvenience. The direct and indirect costs of roadway congestion drain approximately $121 billion from the U.S. economy annually, in the form of 5.5 billion hours lost in traffic and 2.9 billion gallons of fuel wasted (Source: Texas Transportation Institute – 2012 Urban Mobility
cushions, and clear markings.

Lindsay remains confident in its enduring ability to generate lasting value by developing solutions that enhance the quality of life for people around the world.
A YEAR OF DECISIVE ACTION AND FORWARD THINKING
Backed by a strong balance sheet, we made strategic investments for future growth and also returned value to shareholders, executing against a carefully articulated capital allocation plan that was introduced in January 2014. The Company’s prioritization for cash use:
Investment in organic growth, including capital expenditures, primarily for increasing capacity, manufacturing productivity and product development. The capital allocation plan called for capital expenditures of $20 million to $25 million annually for the next three years. In addition to investments made in 2014, we plan to continue to increase capacity, improve productivity and add vertical integration. Our irrigation and infrastructure businesses both introduced important new products in 2014 and continue to work on product ideas that will advance our competitive position.
Annual increases in dividends to shareholders. In January 2014, the Board of Directors doubled the quarterly dividend from $0.13 per share to $0.26 per share. This marked our twelfth consecutive year of dividend increases. We increased our quarterly dividend again near the end of the year to $0.27 per share.
Synergistic water-related acquisitions that offer attractive returns to shareholders. We expect to spend $100 million to $150 million over the next few years, funded through cash and debt. While there were not acquisitions completed in 2014, we are
optimistic in our ability to execute on potential opportunities to expand our product offerings and strengthen our integrated irrigation solutions.
Invest excess cash in opportunistic share repurchases, taking into account cyclical and seasonal fluctuations. The Company expects to opportunistically invest approximately $100 million to $150 million in share repurchases. In fiscal 2014, the Company spent $41.1 million on share repurchases.
LONG-TERM CONFIDENCE
As we continue to operate against a market headwind, we remain confident in the enduring ability of our Company to generate lasting value by developing solutions that provide distinct competitive advantages, enable more efficient use of resources, increase agricultural production, improve road safety, promote environmental responsibility, and enhance the quality of life for people around the world.
In conclusion, I extend my thanks and appreciation to our employees, channel partners, suppliers, customers, shareholders and Board of Directors. Your confidence and support are invaluable to all of us at Lindsay Corporation.
Sincerely,
Richard W. Parod President and Chief Executive Officer
12
2015 AND BEYOND

LONG-TERM GOALS AND PERFORMANCE
Lindsay’s goals of providing solid financial performance
have not changed.
GOAL FY14 FY13 5-Year Average
Generate revenue growth of 10 to 15 percent annually -11% 25% 14%
Realize operating margins of 9 to 14 percent 13% 15% 13%
Produce a return on net assets of 9 to 15 percent 13% 19% 14%
These figures exclude acquired companies in the year of acquisition.
13

Population growth is the fundamental driver
for the global agricultural market. Lindsay has the
ability to manage for short-term performance
with a long-term perspective.
14

1
UNITED STATES SECURITIES AND EXCHANGE COMMISSION
Washington, D.C. 20549
FORM 10-K (MARK ONE)
ANNUAL REPORT PURSUANT TO SECTION 13 OR 15(d) OF THE SECURITIES EXCHANGE ACT OF 1934
For the fiscal year ended August 31, 2014 or
TRANSITION REPORT PURSUANT TO SECTION 13 OR 15(d) OF THE SECURITIES EXCHANGE ACT OF 1934
Commission File Number 1-13419 Lindsay Corporation
(Exact name of registrant as specified in its charter) Delaware 47-0554096 (State or other jurisdiction of (I.R.S. Employer incorporation or organization) Identification No.) 2222 North 111th Street, Omaha, Nebraska 68164 (Address of principal executive offices) (Zip Code) 402-829-6800 Registrant's telephone number, including area code Securities registered pursuant to Section 12(b) of the Act: Title of each class Name of each exchange on which registered Common Stock, $1.00 par value New York Stock Exchange, Inc. (Symbol LNN) Indicate by check mark if the registrant is a well-known seasoned issuer, (as defined in Rule 405 of the Securities Act). Yes No Indicate by check mark if the registrant is not required to file reports pursuant to Section 13 or Section 15(d) of the Exchange Act. Yes No Indicate by check mark whether the registrant (1) has filed all reports required to be filed by Section 13 or 15(d) of the Securities Exchange Act of 1934 during the preceding 12 months (or for such shorter period that the registrant was required to file such reports), and (2) has been subject to such filing requirements for the past 90 days. Yes No Indicate by check mark whether the registrant has submitted electronically and posted on its corporate Web site, if any, every Interactive Data File required to be submitted and posted pursuant to Rule 405 of Regulation S-T (§232.405 of this chapter) during the preceding 12 months (or for such shorter period that the registrant was required to submit and post such files). Yes No Indicate by check mark if disclosure of delinquent filers pursuant to Item 405 of Regulation S-K is not contained herein, and will not be contained, to the best of registrant's knowledge, in definitive proxy or information statements incorporated by reference in Part III of this Form 10-K or any amendment to this Form 10-K Indicate by check mark whether the registrant is a large accelerated filer, an accelerated filer, a non-accelerated filer, or a smaller reporting company. See the definitions of “large accelerated filer,” “accelerated filer” and “smaller reporting company” in Rule 12b-2 of the Exchange Act. Large accelerated filer Accelerated filer Non-accelerated filer Smaller reporting company (Do not check if a smaller reporting company) Indicate by check mark whether the registrant is a shell company (as defined in Rule 12b-2 of the Exchange Act). Yes No The aggregate market value of Common Stock of the registrant, all of which is voting, held by non-affiliates based on the closing sales price on the New York Stock Exchange, Inc. on February 28, 2014 was $1,064,498,096. As of October 10, 2014, 12,200,857 shares of the registrant’s Common Stock were outstanding.
DOCUMENTS INCORPORATED BY REFERENCE
Portions of the Proxy Statement pertaining to the Registrant’s 2015 annual stockholders' meeting are incorporated herein by reference into Part III.

2
TABLE OF CONTENTS
Page(s)
Part I Item 1. Business 3-9 Item 1A. Risk Factors 10-11 Item 1B. Unresolved Staff Comments 11 Item 2. Properties 12 Item 3. Legal Proceedings 13 Item 4. Mine Safety Disclosures 13 Part II Item 5. Market for Registrant’s Common Equity, Related Stockholder Matters and Issuer
Purchases of Equity Securities 13-14 Item 6. Selected Financial Data 15 Item 7. Management’s Discussion and Analysis of Financial Condition and Results of
Operations 15-27 Item 7A. Quantitative and Qualitative Disclosures about Market Risk 28 Item 8. Financial Statements and Supplementary Data 29-58 Item 9. Changes in and Disagreements with Accountants on Accounting and Financial
Disclosure 59 Item 9A. Controls and Procedures 59-60 Item 9B. Other Information 60 Part III Item 10. Directors, Executive Officers and Corporate Governance 61-62 Item 11. Executive Compensation 63 Item 12. Security Ownership of Certain Beneficial Owners and Management and Related
Stockholder Matters 63 Item 13. Certain Relationships and Related Transactions, and Director Independence 63 Item 14. Principal Accounting Fees and Services 63 Part IV Item 15. Exhibits, Financial Statement Schedules 64-65 SIGNATURES 66

3
PART I
ITEM 1 – Business INTRODUCTION Lindsay Corporation, along with its subsidiaries (collectively called "Lindsay" or the "Company"), is a global leader in providing a variety of proprietary water management and road infrastructure products and services. The Company has been involved in the manufacture and distribution of agricultural equipment since 1955 and has grown from a regional company to an international agribusiness and highway infrastructure firm with worldwide sales and distribution. Lindsay, a Delaware corporation, maintains its corporate offices in Omaha, Nebraska. The Company has operations which are categorized into two major reporting segments. Industry segment information about Lindsay is included in Note Q to the consolidated financial statements. Irrigation Segment – The Company’s irrigation segment includes the manufacture and marketing of center pivot, lateral move, and hose reel irrigation systems which are used principally in the agricultural industry to increase or stabilize crop production while conserving water, energy and labor. The irrigation segment also manufactures and markets repair and replacement parts for its irrigation systems and controls. In addition, the irrigation segment also designs and manufactures water pumping stations and controls for the agriculture, golf, landscape and municipal markets and filtration solutions for groundwater, agriculture, industrial and heat transfer markets. The Company continues to strengthen irrigation product offerings through innovative technology such as GPS positioning and guidance, variable rate irrigation, wireless irrigation management, and smartphone applications. The Company’s principal irrigation manufacturing facilities are located in Lindsay, Nebraska, Hartland, Wisconsin, and Fresno, California. Internationally, the Company has production operations in Brazil, France, China, and South Africa as well as distribution and sales operations in the Netherlands, Australia and New Zealand. The Company also exports equipment from the U.S. to other international markets. Infrastructure Segment – The Company’s infrastructure segment includes the manufacture and marketing of moveable barriers, specialty barriers, crash cushions and end terminals, road marking and road safety equipment, large diameter steel tubing, and railroad signals and structures. The infrastructure segment also provides outsourced manufacturing and production services. The principal infrastructure manufacturing facilities are located in Rio Vista, California, Milan, Italy, and Omaha, Nebraska. PRODUCTS BY SEGMENT IRRIGATION SEGMENT Products - The Company manufactures and markets its center pivot and lateral move irrigation systems in the U.S. and internationally under its Zimmatic® brand. The Company also manufactures and markets separate lines of center pivot and lateral move irrigation equipment for use on smaller fields under its Greenfield® brand, and hose reel travelers under the Perrot™ and Greenfield® brands in Europe and South Africa. The Company also produces or markets irrigation controls, chemical injection systems and remote monitoring and control systems which it sells under its GrowSmart® brand. In addition to whole systems, the Company manufactures and markets repair and replacement parts for its irrigation systems and controls. The Company also designs and manufactures water pumping stations and controls for the agriculture, golf, landscape and municipal markets and filtration solutions for groundwater, agriculture, industrial and heat transfer markets, worldwide, under its LAKOS® brand. The Company's irrigation systems are primarily of the standard sized center pivot type, with a small portion of its products consisting of the lateral move type. Both are automatic move systems consisting of sprinklers mounted on a water carrying pipeline which is supported approximately 11 feet off the ground by a truss system suspended between moving towers. A typical center pivot in the U.S. is approximately 1,300 feet long and is designed to circle within a quarter-section of land, which comprises 160 acres, wherein it irrigates approximately 125 to 130 acres. A center pivot or lateral move system can also be custom designed and can irrigate from 25 to 600+ acres.

4
A center pivot system represents a significant investment to a farmer. In a dry land conversion to center pivot irrigation, approximately one-half of the investment is for the pivot itself, and the remainder is attributable to installation of additional equipment such as wells, pumps, underground water pipes, electrical supply and a concrete pad upon which the pivot is anchored. The Company’s center pivot and lateral move irrigation systems can be enhanced with a family of integrated proprietary products such as water pumping station controls. The Company also manufactures and distributes hose reel travelers. Hose reel travelers are typically deployed in smaller or irregular fields and usually are easy to operate, easy to move from field to field, and a lower investment than a typical standard center pivot. The Company also markets remote monitoring and automation technology for pivot and drip irrigation systems that is sold on a subscription basis under the FieldNET® product name. FieldNET® technology allows growers to remotely monitor and operate irrigation equipment, saving time and reducing water and energy consumption. The technology uses cellular or radio frequency communication systems to remotely acquire data relating to various conditions in an irrigated field, including operational status of the irrigation system, position of the irrigation system, water flow rates, weather and soil conditions and similar data. The system can remotely control the irrigation system, including changing position, varying water flow rates, and controlling pump station and diesel generator operation. Data management and control is achieved using applications running on either a personal computer-based internet browser or various mobile devices connected to the internet. Other Types of Irrigation – Center pivot and lateral move irrigation systems compete with three other types of irrigation: flood, drip, and other mechanical devices such as hose reel travelers and solid set sprinklers. The bulk of the worldwide irrigation is accomplished by the traditional method of flood irrigation. Flood irrigation is accomplished by either flooding an entire field, or by providing a water source (ditches or a pipe) along the side of a field, which is planed and slopes slightly away from the water source. The water is released to the crop rows through gates in the ditch or pipe, or through siphon tubes arching over the ditch wall into some of the crop rows. It runs down through the crop row until it reaches the far end of the row, at which time the water source is moved and another set of rows are flooded. A significant disadvantage or limitation of flood irrigation is that it cannot be used to irrigate uneven, hilly, or rolling terrain or fields. In "drip" or "low flow" irrigation, perforated plastic pipe or tape is installed on the ground or buried underground at the root level. Several other types of mechanical devices, such as hose reel travelers, irrigate the remaining irrigated acres. Center pivot, lateral move, and hose reel traveler irrigation offers significant advantages when compared with other types of irrigation. It requires less labor and monitoring; can be used on sandy ground, which, due to poor water retention ability, must have water applied frequently; can be used on uneven ground, thereby allowing previously unsuitable land to be brought into production; can also be used for the application of fertilizers, insecticides, herbicides, or other chemicals (termed "fertigation" or "chemigation"); and conserves water and chemicals through precise control of the amount and timing of the application. Markets - Water is an essential and critical requirement for crop production, and the extent, regularity, and frequency of water application can be a critical factor in crop quality and yield. The fundamental factors which govern the demand for center pivot and lateral move systems are essentially the same in both the U.S. and international markets. Demand for center pivot and lateral move systems is determined by whether the value of the increased crop production and cost savings attributable to center pivot or lateral move irrigation exceeds any increased costs associated with purchasing, installing, and operating the equipment. Thus, the decision to purchase a center pivot or lateral move system, in part, reflects the profitability of agricultural production, which is determined primarily by the prices of agricultural commodities and other farming inputs.

5
The current demand for center pivot systems has three sources: conversion to center pivot systems from less water efficient, more labor intensive types of irrigation; replacement of older center pivot systems, which are beyond their useful lives or are technologically obsolete; and conversion of dry land farming to irrigated farming. Demand for center pivots and lateral move irrigation equipment also depends upon the need for the particular operational characteristics and advantages of such systems in relation to alternative types of irrigation, primarily flood. More efficient use of the basic natural resources of land, water, and energy helps drive demand for center pivot and lateral move irrigation equipment. Increasing global population not only increases demand for agricultural output, but also places additional and competing demands on land, water, and energy. The Company expects demand for center pivots and lateral move systems to continue to increase relative to other irrigation methods because center pivot and lateral move systems are preferred where the soil is sandy, the terrain is not flat, the land area to be irrigated is sizeable; there is a shortage of reliable labor; water supply is restricted and conservation is preferred or critical; and/or fertigation or chemigation will be utilized. United States Market – In the United States, the Company sells its branded irrigation systems, including Zimmatic®, to over 200 independent dealer locations, who resell to their customer, the farmer. Dealers assess their customer’s requirements, assemble and erect the system in the field, and provide additional system components, primarily relating to water supply (wells, pumps, pipes) and electrical supply (on-site generation or hook-up to power lines). Lindsay dealers generally are established local agribusinesses, many of which also deal in related products, such as well drilling and water pump equipment, farm implements, grain handling and storage systems, and farm structures. International Market – The Company sells center pivot and lateral move irrigation systems throughout the world. International sales accounted for approximately 39 percent and 38 percent of the Company’s total irrigation segment revenues in fiscal 2014 and 2013, respectively. The Company has production and sales operations in Brazil, France, China, and South Africa as well as distribution and sales operations in the Netherlands, Australia and New Zealand serving the key South American, European, Chinese, African, Russian/Ukrainian, Australian, and New Zealand markets. The Company also exports irrigation equipment from the U.S. to international markets. The Company’s manufacturing operation in Turkey is planned to be operational early in calendar 2015 and is expected to accommodate long-term growth plans for several international markets. The Company’s international markets differ with respect to the need for irrigation, the ability to pay, demand, customer type, government support of agriculture, marketing and sales methods, equipment requirements, and the difficulty of on-site erection. The Company’s industry position is such that it believes that it will likely be considered as a potential supplier for most major international agricultural development projects utilizing center pivot or lateral move irrigation systems. Competition – Four primary manufacturers control a substantial majority of the U.S. center pivot irrigation system industry. The international irrigation market includes participation and competition by the leading U.S. manufacturers as well as various regional manufacturers. The Company competes in certain product lines with several manufacturers, some of whom may have greater financial resources than the Company. The Company competes by continuously improving its products through ongoing research and development activities. The Company continues to strengthen irrigation product offerings through innovative technology such as GPS positioning and guidance, variable rate irrigation, wireless irrigation management, and smartphone applications as well as through acquisition of products and services that allow the Company to provide a more comprehensive solution to growers’ needs. The Company’s engineering and research expenses related to irrigation totaled approximately $7.8 million, $8.1 million, and $6.0 million for fiscal years 2014, 2013, and 2012, respectively. Competition also occurs in areas of price and seasonal programs, product quality, durability, controls, product characteristics, retention and reputation of local dealers, customer service, and, at certain times of the year, the availability of systems and their delivery time. The Company believes it competes favorably with respect to all of these factors.

6
INFRASTRUCTURE SEGMENT
Products – Quickchange® Moveable Barrier™ The Company’s Quickchange® Moveable Barrier™ system, commonly known as the Road Zipper System™, is composed of three parts: 1) T-shaped concrete barriers that are connected to form a continuous wall, 2) a Barrier Transfer Machine™ (“BTM™”) capable of moving the barrier laterally across the pavement, and 3) the variable length barriers necessary for accommodating curves. A barrier element is approximately 32 inches high, 13-24 inches wide, 3 feet long and weighs 1,500 pounds. The barrier elements are interconnected by very heavy duty steel hinges to form a continuous barrier. The BTM™ employs an inverted S-shaped conveyor mechanism that lifts the barrier, moving it laterally before setting it back on the roadway surface. In permanent applications, the Road Zipper System™ increases capacity and reduces congestion by varying the number of traffic lanes to match the traffic demand, and promotes safety by maintaining the physical separation of opposing lanes of traffic. Roadways with fixed medians have a set number of lanes in each direction and cannot adjust to traffic demands that may change over the course of a day, or to capacity reductions caused by traffic incidents or road repair and maintenance. Applications include high volume highways where expansion may not be feasible due to lack of additional right-of-way, environmental concerns, or insufficient funding. The Road Zipper System™ is particularly useful in busy commuter corridors and at choke points such as bridges and tunnels. Road Zipper Systems™ can also be deployed at roadway or roadside construction sites to accelerate construction, improve traffic flow and safeguard work crews and motorists by positively separating the work area and traffic. Examples of types of work completed with the help of a Road Zipper System™ include highway reconstruction, paving and resurfacing, road widening, median and shoulder construction, and repairs to tunnels and bridges. The Company offers a variety of equipment lease options for Road Zipper Systems™ and BTM™ equipment used in construction applications. The leases extend for periods of three months or more for equipment already existing in the Company’s lease fleet. Longer lease periods may be required for specialty equipment that must be built for specific projects. These systems have been in use since 1987. Typical sales for a highway safety or road improvement project range from $2.0 - $20.0 million, making them significant capital investments. Crash Cushions and End Terminals – The Company offers a complete line of redirective and non-redirective crash cushions which are used to enhance highway safety at locations such as toll booths, freeway off-ramps, medians and roadside barrier ends, bridge supports, utility poles and other fixed roadway hazards. The Company’s primary crash cushion products cover a full range of lengths, widths, speed capacities and application accessories and include the following brand names: TAU®, Universal TAU-II®, TAU-II-R™, TAU-B_NR™, ABSORB 350® and Walt™. In addition to these products the Company also offers guardrail end terminal products such as the X-Tension™ and TESI®
systems. The crash cushions and end terminal products compete with other vendors in the world market. These systems are generally sold through a distribution channel that is domiciled in particular geographic areas. Specialty Barriers – The Company also offers specialty barrier products such as the SAB™, ArmorGuard™, PaveGuard™ and DR46™ portable barrier and/or barrier gate systems. These products offer portability and flexibility in setting up and modifying barriers in work areas and provide quick opening, high containment gates for use in median or roadside barriers. The gates are generally used to create openings in barrier walls of various types for both construction and incident management purposes. The DR46™ is an energy absorbing barrier to shield motorcyclists from impacting guardrail posts which is an area of focus by departments of transportation and government regulators for reducing the amount and severity of injuries. Road Marking and Road Safety Equipment – The Company also offers preformed tape and a line of road safety accessory products. The preformed tape is used primarily in temporary applications such as markings for work zones, street crossings, and road center lines or boundaries. The road safety equipment consists of mostly plastic and rubber products used for delineation, slowing traffic, and signaling. The Company also manages an ISO 17025 certified testing laboratory that performs full-scale impact testing of highway safety products in accordance with the National Cooperative Highway Research Program (“NCHRP”) Report 350, the Manual for Assessing Safety Hardware (“MASH”), and the European Norms (“EN1317 Norms”) for these types of products. The NCHRP Report 350 and MASH guidelines are procedures required by the U.S. Department of Transportation Federal Highway Administration for the safety performance evaluation of highway features. The EN1317 Norms are being used to qualify roadway safety products for the European markets.

7
Other Products – The Company’s Diversified Manufacturing and Tubing business unit manufactures and markets large diameter steel tubing and railroad signals and structures, and provides outsourced manufacturing and production services for other companies. The Company continues to develop new relationships for infrastructure manufacturing in industries outside of agriculture and irrigation. The Company’s customer base includes certain large industrial companies and railroads. Each customer benefits from the Company’s design and engineering capabilities as well as the Company’s ability to provide a wide spectrum of manufacturing services, including welding, machining, painting, forming, galvanizing and assembling hydraulic, electrical, and mechanical components. Markets – The Company’s primary infrastructure market includes moveable concrete barriers, delineation systems, crash cushions and similar protective equipment. The U.S. roadway infrastructure market includes projects such as new roadway construction, bridges, tunnels, maintenance and resurfacing, the purchase of rights-of-way for roadway expansion and development of technologies for relief of roadway congestion. Much of the U.S. highway infrastructure market is driven by government (state and federal) spending programs. For example, the U.S. government funds highway and road improvements through the Federal Highway Trust Fund Program. This program provides funding to improve the nation’s roadway system. Matching funding from the various states may be required as a condition of federal funding. In the long term, the Company believes that the federal program provides a solid platform for growth in the U.S. market, as it is generally acknowledged that additional funding will be required for infrastructure development and maintenance in the future. The global market for the Company’s infrastructure products continues to be driven by population growth and the need for improved road safety. International sales accounted for approximately 41 percent and 33 percent of the Company’s total infrastructure segment revenues in fiscal 2014 and 2013, respectively. The international market is presently very different from country to country. The standardization in performance requirements and acceptance criteria for highway safety devices adopted by the European Committee for Standardization is expected to lead to greater uniformity and a larger installation program. Prevention programs put in place in various countries to lower highway traffic fatalities may also lead to greater demand. The Company has recently started distributing infrastructure products in South America, the Middle East and Asia. The Company expects to continue expanding in international markets as populations grow and markets become more established. Competition – The Company competes in certain product lines with several manufacturers, some of whom may have greater financial resources than the Company. The Company competes by continuously improving its products through ongoing research and development activities. The Company’s engineering and research expenses related to infrastructure products totaled approximately $3.3 million, $3.3 million and $3.5 million for fiscal years 2014, 2013 and 2012, respectively. The Company competes with certain products and companies in its crash cushion business, but has limited competition in its moveable barrier line, as there is not another moveable barrier product today comparable to the Road Zipper System™. However, the Company’s barrier product does compete with traditional “safety shaped” concrete barriers and other safety barriers. Distribution methods and channels – The Company has production and sales operations in the United States and Italy. Sales efforts consist of both direct sales and sales programs managed by its network of distributors and third-party representatives. The sales teams have responsibility for new business development and assisting distributors and dealers in soliciting large projects and new customers. The distributor and dealer networks have exclusive territories and are responsible for developing sales and providing service, including product maintenance, repair and installation. The typical dealer sells an array of safety supplies, road signs, crash cushions, delineation equipment and other highway products. Customers include Departments of Transportation, municipal transportation road agencies, roadway contractors, subcontractors, distributors and dealers. Due to the project nature of the roadway construction and congestion management markets, the Company’s customer base changes from year-to-year. Due to the limited life of projects, it is rare that a single customer will account for a significant amount of revenues in consecutive years. The customer base also varies depending on the type of product sold. The Company’s moveable barrier products are typically sold to transportation agencies or the contractors or suppliers serving those agencies. In contrast, distributors account for a majority of crash cushion sales since those products have lower price points and tend to have shorter lead times. GENERAL Certain information generally applicable to both of the Company’s reportable segments is set forth below.

8
The following table describes the Company’s total revenues for the past three fiscal years. United States export revenue is included in International based on the region of destination.
For the years ended August 31, $ in millions 2014 2013 2012 % of Total % of Total % of Total Revenues Revenues Revenues Revenues Revenues Revenues United States $ 377.7 61 $ 428.9 62 $ 354.6 64International $ 240.3 39 $ 261.9 38 $ 196.7 36Total Revenues $ 617.9 100 $ 690.8 100 $ 551.3 100
SEASONALITY Irrigation equipment sales are seasonal by nature. Farmers generally order systems to be delivered and installed before the growing season. Shipments to customers located in Northern Hemisphere countries usually peak during the Company's second and third fiscal quarters for the spring planting period. Sales of infrastructure products are traditionally higher during prime road construction seasons and lower in the winter. The primary construction season for Northern Hemisphere countries is from March until late September which corresponds to the Company’s third and fourth fiscal quarters. CUSTOMERS The Company is not dependent for a material part of either segment’s business upon a single customer or upon a limited number of customers. The loss of any one customer would not have a material adverse effect on the Company’s financial condition, results of operations or cash flow. ORDER BACKLOG As of August 31, 2014, the Company had an order backlog of $79.6 million compared with $66.5 million at August 31, 2013. The increase in backlog at August 31, 2014 included a $12.7 million Road Zipper System™ order from the Golden Gate Bridge Highway & Transportation District. The Company’s backlog can fluctuate from period to period due to the seasonality, cyclicality, timing and execution of contracts. Backlog typically represents long-term projects as well as short lead-time orders and therefore, is generally not a good indication of the next quarter’s revenues. RAW MATERIALS AND COMPONENTS Raw materials used by the Company include coil steel, angle steel, plate steel, zinc, tires, gearboxes, concrete, rebar, fasteners, and electrical and hydraulic components (motors, switches, cable, valves, hose and stators). The Company has, on occasion, faced shortages of certain such materials. The Company believes it currently has ready access from assorted domestic and foreign suppliers to adequate supplies of raw materials and components. CAPITAL EXPENDITURES Capital expenditures for fiscal 2014, 2013, and 2012 were $17.7 million, $11.1 million and $9.9 million, respectively. Capital expenditures for fiscal 2015 are estimated to be approximately $20.0 million to $25.0 million largely focused on manufacturing capacity expansion and productivity improvements. The Company’s capital expenditure plan includes investments in a manufacturing operation in Turkey, which is planned to be operational early in calendar 2015 and is expected to accommodate long-term growth plans for several international markets. The Company’s management does maintain flexibility to modify the amount and timing of some of the planned expenditures in response to economic conditions. PATENTS, TRADEMARKS, AND LICENSES Lindsay’s Zimmatic®, Greenfield®, GrowSmart®, Perrot™, Road Zipper System™, Quickchange® Moveable Barrier™, ABSORB 350®, FieldNET®, TAU®, Universal TAU-II®, TAU-II-R™, TAU-B_NR™, X-Tension™, CableGuard™, TESI™, SAB™, ArmourGuard™, PaveGuard™, DR46™, U-MAD™, LAKOS® and other trademarks are registered or applied for in the major markets in which the Company sells its products. Lindsay follows a policy of applying for patents on all significant patentable inventions in markets deemed appropriate. Although the Company believes it is important to follow a patent protection policy, Lindsay's business is not dependent, to any material extent, on any single patent or group of patents.

9
EMPLOYEES The number of persons employed by the Company and its wholly-owned subsidiaries at fiscal year ends 2014, 2013, and 2012 were 1,202, 1,262 and 1,082, respectively. None of the Company's U.S. employees are represented by a union. Certain of the Company’s non-U.S. employees are unionized due to local governmental regulations. ENVIRONMENTAL AND HEALTH AND SAFETY MATTERS Like other manufacturing concerns, the Company is subject to numerous laws and regulations that govern environmental and occupational health and safety matters. The Company believes that its operations are substantially in compliance with all such applicable laws and regulations and that it holds all necessary permits in each jurisdiction in which its facilities are located. Environmental and health and safety regulations are subject to change and interpretation. In some cases, compliance with applicable regulations or standards may require the Company to make additional capital and operational expenditures. The Company, however, is not currently aware of any material capital expenditures required to comply with such regulations, other than as described in Note N, Commitments and Contingencies, to the Company’s consolidated financial statements and does not believe that these matters, individually or in the aggregate, are likely to have a material adverse effect on the Company’s consolidated financial condition. FINANCIAL INFORMATION ABOUT FOREIGN AND U.S. OPERATIONS The Company's primary production facilities are located in the United States. The Company has smaller production and sales operations in Brazil, France, Italy, China, and South Africa as well as distribution and sales operations in the Netherlands, Australia and New Zealand. Where the Company exports products from the United States to international markets, the Company generally ships against prepayment, an irrevocable letter of credit confirmed by a U.S. bank or another secured means of payment. Most of the Company’s financial transactions are in U.S. dollars, although some export sales and sales from the Company's foreign subsidiaries are conducted in other currencies. Approximately 23 percent and 19 percent of total consolidated Company sales were conducted in currencies other than the U.S. dollar in fiscal 2014 and 2013, respectively. To reduce the uncertainty of foreign currency exchange rate movements on these sales and purchase commitments conducted in local currencies, the Company monitors its risk of foreign currency fluctuations and, at times, may enter into forward exchange or option contracts for transactions denominated in a currency other U.S. dollars. In addition to the transactional foreign currency exposures mentioned above, the Company also has translation exposure resulting from translating the financial statements of its international subsidiaries into U.S. dollars. In order to reduce this translation exposure, the Company, at times, utilizes foreign currency forward contracts to hedge its net investment exposure in its foreign operations. For information on the Company’s foreign currency risks, see Item 7A of Part II of this report.
INFORMATION AVAILABLE ON THE LINDSAY WEBSITE The Company makes available free of charge on its website homepage, under the tab “Investor Relations – SEC Filings”, its Annual Report on Form 10-K, Quarterly Reports on Form 10-Q, Current Reports on Form 8-K, Proxy Statements, and amendments to those reports filed or furnished pursuant to Section 13(a) or 15(d) of the Securities Exchange Act of 1934, as amended, as soon as reasonably practicable after the Company electronically files such material with, or furnishes it to, the SEC. The Company’s internet address is http://www.lindsay.com; however, information posted on its website is not part of this Annual Report on Form 10-K. The following documents are also posted on the Company’s website homepage, under the tabs “Investor Relations – Governance – Committees” and “Investor Relations – Governance – Ethics”: Audit Committee Charter Compensation Committee Charter Corporate Governance and Nominating Committee Charter Code of Business Conduct and Ethics Corporate Governance Principles Code of Ethical Conduct Employee Complaint Procedures for Accounting and Auditing Matters Special Toll-Free Hotline Number and E-mail Address for Making Confidential or Anonymous Complaints These documents are also available in print to any stockholder upon request, by sending a letter addressed to the Secretary of the Company.

10
ITEM 1A - Risk Factors
The following are certain of the more significant risks that may affect the Company’s business, financial condition and results of operations. The Company’s irrigation revenues are highly dependent on the agricultural industry and weather conditions. The Company’s irrigation revenues are cyclical and highly dependent upon the need for irrigated agricultural crop production which, in turn, depends upon many factors, including total worldwide crop production, the profitability of agricultural crop production, agricultural commodity prices, net farm income, availability of financing for farmers, governmental policies regarding the agricultural sector, water and energy conservation policies, the regularity of rainfall, regional climate change, and foreign currency exchange rates. As farm income decreases, farmers may postpone capital expenditures or seek less expensive irrigation alternatives. Weather conditions, particularly during the planting and early growing season, can significantly affect the purchasing decisions of purchasers of irrigation equipment. Natural calamities such as regional floods, hurricanes or other storms, and droughts can have significant effects on seasonal irrigation demand. Drought conditions, which generally impact irrigation equipment demand positively over the long term, can adversely affect demand if water sources become unavailable or if governments impose water restriction policies to reduce overall water availability. The Company’s infrastructure revenues are highly dependent on government funding of transportation projects. The demand for the Company’s infrastructure products depends to a large degree on the amount of government spending authorized to improve road and highway systems. For example, the U.S. government funds highway and road improvements through the Federal Highway Trust Fund Program and matching funding from states may be required as a condition of federal funding. If highway funding is reduced or delayed, it may reduce demand for the Company’s infrastructure products. The Company’s profitability may be negatively affected by increases in the cost of raw materials, as well as in the cost of energy. Certain of the Company’s input costs, such as the cost of steel, zinc, and other raw materials, may increase rapidly from time to time. Because there is a level of price competition in the market for irrigation equipment and certain infrastructure products, the Company may not be able to recoup increases in these costs through price increases for its products, which would result in reduced profitability. Whether increased operating costs can be passed through to the customer depends on a number of factors, including farm income and the price of competing products. The cost of raw materials can be volatile and is dependent on a number of factors, including availability, demand, and freight costs. The Company’s profitability may be negatively affected by the disruption or termination of the supply of parts, materials, and components from third-party suppliers. The Company uses a limited number of suppliers for certain parts, materials, and components in the manufacturing process. Disruptions or delays in supply or significant price increases from these suppliers could adversely affect the Company’s operations and profitability. Such disruptions, terminations or cost increases could result in cost inefficiencies, delayed sales or reduced sales. The Company’s international equipment sales are highly dependent on foreign market conditions and are subject to additional risk and restrictions. For the fiscal year ended August 31, 2014, approximately 39 percent of the Company’s consolidated revenues were generated from international sales and United States export revenue to international regions. Specifically, international revenues are primarily generated from Australia, New Zealand, Canada, Central and Western Europe, Mexico, the Middle East, Africa, China, Russia/Ukraine, and Central and South America. In addition to risks relating to general economic and political stability in these countries, the Company’s international sales are affected by international trade barriers, including governmental policies on tariffs, taxes, import or export licensing requirements, trade sanctions, and foreign currency exchange rates. In addition, the collectability of receivables can be difficult to estimate, particularly in areas of political instability or with governments with which the Company has limited experience or where there is a lack of transparency as to the current credit condition. The Company does business in a number of countries that are particularly susceptible to disruption from changing social economic conditions as well as terrorism, political hostilities, sanctions, war and similar incidents.

11
Compliance with applicable environmental and health and safety regulations or standards may require additional capital and operational expenditures. Like other manufacturing concerns, the Company is subject to numerous laws and regulations which govern environmental and occupational health and safety matters. The Company believes that its operations are substantially in compliance with all such applicable laws and regulations and that it holds all necessary permits in each jurisdiction in which its facilities are located. Environmental and health and safety regulations are subject to change and interpretation. Compliance with applicable regulations or standards may require the Company to make additional capital and operational expenditures. The Company’s Lindsay, Nebraska site was added to the list of priority superfund sites of the U.S. Environmental Protection Agency (the “EPA”) in 1989. The Company and its environmental consultants have developed a remedial action work plan, under which the Company continues to work with the EPA to define and implement steps to better contain and remediate the remaining contamination. Although the Company has accrued all reasonably estimable costs associated with remediation of the site, it is expected that additional testing and environmental monitoring and remediation could be required in the future as part of the Company’s ongoing discussions with the EPA regarding the development and implementation of the remedial action plans. In addition, the current investigation has not yet been completed and does not include all potentially affected areas on the site. Due to the current stage of discussions with the EPA and the uncertainty of the remediation actions that may be required with respect to these affected areas, the Company believes that meaningful estimates of costs or range of costs cannot currently be made and accordingly have not been accrued. The Company’s ongoing remediation activities at its Lindsay, Nebraska facility are described in Note N, Commitments and Contingencies, to the Company’s consolidated financial statements. The Company’s consolidated financial results are reported in U.S. dollars while certain assets and other reported items are denominated in the currencies of other countries, creating currency translation risk. The reporting currency for the Company’s consolidated financial statements is the U.S. dollar. Certain of the Company’s assets, liabilities, expenses and revenues are denominated in other countries’ currencies. Those assets, liabilities, expenses and revenues are translated into U.S. dollars at the applicable exchange rates to prepare the Company’s consolidated financial statements. Therefore, increases or decreases in exchange rates between the U.S. dollar and those other currencies affect the value of those items as reflected in the Company’s consolidated financial statements. Substantial fluctuations in the value of the U.S. dollar compared to those other currencies could have a significant impact on the Company’s results. Expansion of the Company’s business may result in unanticipated adverse consequences. The Company routinely considers possible expansions of the business, both domestically and in foreign locations. Acquisitions, partnerships, joint ventures or other similar major investments require significant managerial resources, which may be diverted from the Company’s other business activities. The risks of any expansion of the business through investments, acquisitions, partnerships or joint ventures are increased due to the significant capital and other resources that the Company may have to commit to any such expansion, which may not be recoverable if the expansion initiative to which they were devoted is not fully implemented or is ultimately unsuccessful. As a result of these risks and other factors, including general economic risk, the Company may not be able to realize projected returns from any recent or future acquisitions, partnerships, joint ventures or other investments. ITEM 1B – Unresolved Staff Comments None.

12
ITEM 2 - Properties The Company’s facilities are well maintained, in good operating condition and are suitable for present purposes. These facilities, together with both short-term and long-term planned capital expenditures, are expected to meet the Company’s manufacturing needs in the foreseeable future. The Company’s capital expenditure plan includes investments in a manufacturing operation in Turkey, which is planned to be operational early in calendar 2015 and is expected to accommodate long-term growth plans for several international markets. The Company does not anticipate any difficulty in retaining occupancy of any leased facilities, either by renewing leases prior to expiration or by replacing them with equivalent leased facilities. The following are the Company’s significant properties.
Segment Geographic Location (s)
Own/ Lease
Lease Expiration
Square Feet Property Description
Corporate Omaha, Nebraska Lease 2019 30,000 Corporate headquarters
Irrigation Lindsay, Nebraska Own N/A 300,000 Principal U.S. manufacturing plant consists of eight separate buildings located on 122 acres
Irrigation Corlu, Turkey Lease 2024 274,147 Manufacturing plant to be operational early in calendar 2015 and is expected to accommodate several international markets
Irrigation Fresno, California Own N/A 94,000 Manufacturing plant consists of three separate buildings for filtration products
Infrastructure Omaha, Nebraska Own N/A 83,000 Manufacturing plant for infrastructure products located on six acres
Irrigation Hartland, Wisconsin Own N/A 73,000
Two commercial buildings on five acres for the design and manufacture of water pumping stations and controls for the agriculture, golf, landscape and municipal markets
Irrigation La Chapelle, France Own N/A 72,000 Manufacturing plant for irrigation products for the European markets, consists of three separate buildings situated on 3.5 acres
Irrigation Mogi Mirim, Sao Paulo, Brazil Own N/A 67,000
Manufacturing plant for irrigation products for the Brazilian market, consists of two buildings
Irrigation Tianjin, China and Beijing, China Lease 2015 58,400
Manufacturing plant and office facilities for irrigation products for the Chinese market
Infrastructure Milan, Italy Own N/A 45,000 Manufacturing plant for infrastructure products
Infrastructure Rio Vista, California Own N/A 30,000 Manufacturing plant for infrastructure products located on seven acres
Irrigation
Pasco, Grandview, and Othello, Washington; Hermiston, Oregon Lease
2016 - 2022 28,900 Retail irrigation operations in four leased buildings
Irrigation Kraaifontein, South Africa Lease 2016 23,900 Manufacturing and warehouse facility for the sub-Saharan Africa markets
Irrigation
Pasco, Washington; Hermiston, Oregon; Portland, Oregon Lease
2016 - 2018 22,500 Office and warehouse locations related to IRZ Consulting, LLC
Irrigation Amarillo, Texas Lease 2017 22,000 Warehouse facility for irrigation products Irrigation Tifton, Georgia Lease 2016 15,500 Warehouse facility for irrigation products
Irrigation Milford, Nebraska; Sioux Falls South Dakota Lease 2015 17,400
Manufacturing, engineering, and office locations related to Digitec, Inc.
Irrigation Paul, Idaho Lease 2017 11,400 Warehouse facility for irrigation products
Irrigation
Toowoomba, Queensland, Australia; Feilding, New Zealand Lease 2017 8,000 Warehouse facilities for the Australian and New Zealand markets

13
ITEM 3 - Legal Proceedings In the ordinary course of its business operations, the Company is involved, from time to time, in commercial litigation, employment disputes, administrative proceedings, and other legal proceedings. No such current proceedings, individually or in the aggregate, are expected to have a material effect on the business or financial condition of the Company. ITEM 4 – Mine Safety Disclosures Not applicable
PART II ITEM 5 - Market for the Registrant's Common Equity, Related Stockholder Matters and Issuer Purchases of Equity Securities. Holders Lindsay Common Stock trades on the New York Stock Exchange, Inc. (NYSE) under the ticker symbol LNN. As of October 10, 2014, there were approximately 165 stockholders of record. Price Range of Common Stock The following table sets forth for the periods indicated the range of the high and low stock prices and dividends paid per share:
Fiscal 2014 Stock Price Fiscal 2013 Stock Price
High Low Dividends High Low Dividends First Quarter $ 90.00 $ 71.13 $ 0.130 $ 80.48 $ 64.52 $ 0.115Second Quarter $ 92.93 $ 75.76 $ 0.260 $ 94.90 $ 73.86 $ 0.115Third Quarter $ 91.60 $ 77.50 $ 0.260 $ 94.50 $ 73.43 $ 0.115Fourth Quarter $ 89.82 $ 76.02 $ 0.270 $ 82.23 $ 72.54 $ 0.130Year $ 92.93 $ 71.13 $ 0.920 $ 94.90 $ 64.52 $ 0.475
Purchases of Equity Securities by the Issuer and Affiliated Purchases The table below sets forth information with respect to purchases of the Company’s common stock made by or on behalf of the Company during the three months ended August 31, 2014:
ISSUER PURCHASES OF EQUITY SECURITIES
Period
Total Number of Shares
Purchased
Average Price Paid Per Share
Total Number of Shares Purchased as Part of Publicly Announced Plans
or Programs
Approximate Dollar Value of Shares
That May Yet Be Purchased Under
the Plans or Programs (1)
($ in thousands)June 1, 2014 to June 30, 2014 - $ - - $ 132,247July 1, 2014 to July 31, 2014 98,224 $ 83.69 98,224 $ 124,027August 1, 2014 to August 31, 2014 192,051 $ 78.55 192,051 $ 108,940Total 290,275 $ 80.29 290,275 $ 108,940 (1) On January 3, 2014, the Company announced that its Board of Directors terminated its existing share repurchaseauthorization to purchase up to a maximum of 881,139 shares of its common stock, effective as of January 2, 2014,and replaced it with an increased authorization to repurchase up to $150.0 million of common stock through January2, 2016. Under the new program, shares may be repurchased in privately negotiated and/or open market transactions. On July 25, 2014, the Company adopted a written trading plan in connection with its share repurchaseprogram for repurchasing its common stock in accordance with the guidelines specified under Rule 10b5-1 of the Securities Exchange Act of 1934, as amended.

14
Dividends The Company paid a total of $11.7 million and $6.1 million in dividends during fiscal 2014 and fiscal 2013, respectively. The Company currently expects that cash dividends comparable to those paid historically will continue to be paid in the future, although there can be no assurance as to future dividends as they depend on future earnings, capital requirements and financial condition. Company Stock Performance The following graph compares the cumulative 5-year total return attained by stockholders on the Company’s Common Stock relative to the cumulative total returns of the S&P Small Cap 600 Index and the S&P Small Cap 600 Construction, Farm Machinery and Heavy Truck index for the five-year period ended August 31, 2014. An investment of $100 (with the reinvestment of all dividends) is assumed to have been made in the Company’s Common Stock and in each of the indexes on August 31, 2009 and the graph shows its relative performance through August 31, 2014.
8/09 8/10 8/11 8/12 8/13 8/14
Lindsay Corporation 100.00 89.63 152.04 160.73 188.06 194.55 S&P Smallcap 600 100.00 107.81 134.16 156.83 198.69 235.84 S&P SmallCap 600 Construction, Farm Machinery and Heavy Truck Index 100.00 91.91 114.09 105.22 156.71 194.25
The stock price performance included in this graph is not necessarily indicative of future stock price performance.
$0
$50
$100
$150
$200
$250
8/09 8/10 8/11 8/12 8/13 8/14
COMPARISON OF 5 YEAR CUMULATIVE TOTAL RETURN*
Among Lindsay Corporation, the S&P Smallcap 600 Index,and S&P SmallCap 600 Construction, Farm Machinery and Heavy Truck Index
Lindsay Corporation
S&P Smallcap 600
S&P SmallCap 600 Construction, Farm Machinery and Heavy Truck Index
*$100 invested on 8/31/09 in stock or index, including reinvestment of dividends.Fiscal year ending August 31.
Copyright© 2014 S&P, a division of The McGraw -Hill Companies Inc. All rights reserved.

15
ITEM 6 – Selected Financial Data
For the Years Ended August 31, $ in millions, except per share amounts 2014(1) 2013 2012(2) 2011(3) 2010 Operating revenues $ 617.9 $ 690.8 $ 551.3 $ 478.9 $ 358.4 Gross profit $ 171.0 $ 194.8 $ 148.5 $ 129.8 $ 98.9 Gross margin 27.7% 28.2% 26.9% 27.1% 27.6% Operating expenses $ 92.6 $ 87.8 $ 83.0 $ 73.2 $ 61.1 Operating income $ 78.4 $ 107.1 $ 65.5 $ 56.6 $ 37.8 Operating margin 12.7% 15.5% 11.9% 11.8% 10.6% Net earnings $ 51.5 $ 70.6 $ 43.3 $ 36.8 $ 24.9 Net margin 8.3% 10.2% 7.9% 7.7% 6.9% Diluted net earnings per share $ 4.00 $ 5.47 $ 3.38 $ 2.90 $ 1.98 Cash dividends per share $ 0.920 $ 0.475 $ 0.385 $ 0.345 $ 0.325 Property, plant and equipment, net $ 72.5 $ 65.1 $ 56.2 $ 58.5 $ 57.6 Total assets $ 526.6 $ 512.3 $ 415.5 $ 381.1 $ 325.5 Long-term obligations $ - $ - $ - $ 4.3 $ 8.6 Return on beginning assets (4) 10.1% 17.0% 11.4% 11.3% 8.1% Diluted weighted average shares 12,882 12,901 12,810 12,692 12,585 (1) Fiscal 2014 includes operating results of Claude Laval Corporation acquired in fourth quarter of fiscal 2013. (2) Fiscal 2012 includes the operating results of IRZ Consulting, LLC acquired in the fourth quarter of fiscal 2011. (3) Fiscal 2011 includes the operating results of Digitec, Inc. acquired in fourth quarter of fiscal 2010 and WMC Technology Limited acquired in first quarter of fiscal 2011. (4) Defined as net earnings divided by beginning of period total assets. ITEM 7 - Management's Discussion and Analysis of Financial Condition and Results of Operations Concerning Forward-Looking Statements - This Annual Report on Form 10-K, including Management’s Discussion and Analysis of Financial Condition and Results of Operations, contains not only historical information, but also forward-looking statements within the meaning of Section 27A of the Securities Act of 1933 and Section 21E of the Securities Exchange Act of 1934. Statements that are not historical are forward-looking and reflect expectations for future Company performance. In addition, forward-looking statements may be made orally or in press releases, conferences, reports, on the Company's worldwide web site, or otherwise, in the future by or on behalf of the Company. When used by or on behalf of the Company, the words "expect," "anticipate," "estimate," "believe," "intend" and similar expressions generally identify forward-looking statements. The entire section entitled “Market Conditions and Outlook” should be considered forward-looking statements. For these statements, the Company claims the protection of the safe harbor for forward-looking statements contained in the Private Securities Litigation Reform Act of 1995. Forward-looking statements involve a number of risks and uncertainties, including but not limited to those discussed in the “Risk Factors” section contained in Item 1A. Readers should not place undue reliance on any forward-looking statement and should recognize that the statements are predictions of future results which may not occur as anticipated. Actual results could differ materially from those anticipated in the forward-looking statements and from historical results, due to the risks and uncertainties described herein, as well as others not now anticipated. The risks and uncertainties described herein are not exclusive and further information concerning the Company and its businesses, including factors that potentially could materially affect the Company's financial results, may emerge from time to time. Except as required by law, the Company assumes no obligation to update forward-looking statements to reflect actual results or changes in factors or assumptions affecting such forward-looking statements.

16
Overview The Company manufactures and markets Zimmatic®, Greenfield® and Perrot™ center pivot, lateral move, and hose reel irrigation systems. The Company also produces and markets irrigation controls, chemical injection systems and remote monitoring and control systems which it sells under its GrowSmart® brand. These products are used by farmers to increase or stabilize crop production while conserving water, energy, and labor. Through its acquisitions, the Company has been able to enhance its capabilities in providing innovative, turn-key solutions to customers through the integration of its proprietary pump stations, controls and designs. The Company sells its irrigation products primarily to a world-wide independent dealer network, who resell to their customers, the farmers. The Company's primary production facilities are located in the United States. The Company has smaller production and sales operations in Brazil, France, China, and South Africa as well as distribution and sales operations in the Netherlands, Australia and New Zealand. The Company also manufactures and markets various infrastructure products, including moveable barriers for traffic lane management, crash cushions, preformed reflective pavement tapes and other road safety devices, through its production facilities in the United States and Italy and has produced road safety products in irrigation manufacturing facilities in China and Brazil. In addition, the Company’s infrastructure segment produces large diameter steel tubing and railroad signals and structures, and provides outsourced manufacturing and production services for other companies. For the business overall, the global, long-term drivers of water conservation, population growth, increasing importance of biofuels, and the need for safer, more efficient transportation solutions remain positive. Key factors which impact demand for the Company’s irrigation products include agricultural commodity prices, net farm income, worldwide agricultural crop production, the profitability of agricultural crop production, availability of financing, governmental policies regarding the agricultural sector, water and energy conservation policies, the regularity of rainfall, regional climate change, and foreign currency exchange rates. A key factor which impacts demand for the Company’s infrastructure products is the amount of spending authorized by governments to improve road and highway systems. Much of the U.S. highway infrastructure market is driven by government spending programs. For example, the U.S. government funds highway and road improvements through the Federal Highway Trust Fund Program. This program provides funding to improve the nation’s roadway system. Matching funding from the various states may be required as a condition of federal funding. The Company continues to have an ongoing, structured, acquisition process that it expects to generate additional growth opportunities throughout the world in irrigation/water management. Lindsay is committed to achieving earnings growth by global market expansion, improvements in margins, and strategic acquisitions. Since 2001, the Company has utilized acquisitions and greenfield efforts to expand its product lines and add to its operations in Europe, South America, South Africa, the Netherlands, Australia, New Zealand and China. The addition of those operations has allowed the Company to strengthen its market position in those regions, yet they remain relatively small in scale. As a result, none of the international operations has achieved the operating margin of the United States based irrigation operations.

17
New Accounting Standards Issued But Not Yet Adopted See Note B, New Accounting Pronouncements, to the Company’s consolidated financial statements for information regarding recently issued accounting pronouncements. Critical Accounting Policies and Estimates In preparing the consolidated financial statements in conformity with U.S. generally accepted accounting principles (“GAAP”), management must make a variety of decisions which impact the reported amounts and the related disclosures. Such decisions include the selection of the appropriate accounting principles to be applied and the assumptions on which to base accounting estimates. In reaching such decisions, management applies judgment based on its understanding and analysis of the relevant facts and circumstances. Certain of the Company’s accounting policies are critical, as these policies are most important to the presentation of the Company’s consolidated results of operations and financial condition. They require the greatest use of judgments and estimates by management based on the Company’s historical experience and management’s knowledge and understanding of current facts and circumstances. Management periodically re-evaluates and adjusts the estimates that are used as circumstances change. Following are the accounting policies management considers critical to the Company’s consolidated results of operations and financial condition: Revenue Recognition The Company’s revenue recognition accounting policy is critical because it can significantly impact the Company’s consolidated results of operations and financial condition. The Company’s basic criteria necessary for revenue recognition are: 1) evidence of a sales arrangement exists, 2) delivery of goods has occurred, 3) the sales price to the buyer is fixed or determinable, and 4) collectability is reasonably assured. The Company recognizes revenue when these criteria have been met and when title and risk of loss transfers to the customer. The Company generally has no post-delivery obligations to its independent dealers other than standard warranties. Revenues and gross profits on intercompany sales are eliminated in consolidation. Revenues from the sale of the Company’s products are recognized based on the delivery terms in the sales contract. If an arrangement involves multiple deliverables, revenues from the arrangement are allocated to the separate units of accounting based on their relative selling price. The Company offers a subscription-based service for wireless management and recognizes subscription revenue on a straight-line basis over the contract term. The Company leases certain infrastructure property held for lease to customers such as moveable concrete barriers and Road Zipper SystemsTM. Revenues for the lease of infrastructure property held for lease are recognized on a straight-line basis over the lease term. The costs related to revenues are recognized in the same period in which the specific revenues are recorded. Shipping and handling fees billed to customers are reported in revenue. Shipping and handling costs incurred by the Company are included in cost of sales. Customer rebates, cash discounts and other sales incentives are recorded as a reduction of revenues at the time of the original sale. Estimates used in the recognition of operating revenues and cost of operating revenues include, but are not limited to, estimates for product warranties, product rebates, cash discounts and fair value of separate units of accounting on multiple deliverables. Inventories The Company’s accounting policy on inventories is critical because the valuation and costing of inventory is essential to the presentation of the Company’s consolidated results of operations and financial condition. Inventories are stated at the lower of cost or market. Cost is determined by the last-in, first-out (LIFO) method for the Company’s Lindsay, Nebraska inventory and three warehouses in Idaho, Georgia and Texas. Cost is determined by the first-in, first-out (FIFO) method for inventory at operating locations in Nebraska, California, Wisconsin, China and Australia. Cost is determined by the weighted average cost method for inventory at the Company’s other operating locations in Washington, Brazil, France, Italy and South Africa. At all locations, the Company reserves for obsolete, slow moving, and excess inventory by estimating the net realizable value based on the potential future use of such inventory.

18
Environmental Remediation Liabilities The Company’s accounting policy on environmental remediation is critical because it requires significant judgments and estimates by management, involves changing regulations and approaches to remediation plans, and any revisions could be material to the operating results of any fiscal quarter or fiscal year. The Company is subject to an array of environmental laws and regulations relating to the protection of the environment. In particular, the Company committed to remediate environmental contamination of the groundwater at and land adjacent to its Lindsay, Nebraska facility (the “site”) with the EPA. The Company and its environmental consultants have developed a remedial action work plan, under which the Company continues to work with the EPA to define and implement steps to better contain and remediate the remaining contamination. Environmental remediation liabilities include costs directly associated with site investigation and clean up, such as materials, external contractor costs and incremental internal costs directly related to the remedy. Estimates used to record environmental remediation liabilities are based on the Company’s best estimate of probable future costs based on site-specific facts and circumstances. Estimates of the cost for the likely remedy are developed using internal resources or by third-party environmental engineers or other service providers. The Company records the undiscounted environmental remediation liabilities that represent the points in the range of estimates that are most probable or the minimum amount when no amount within the range is a better estimate than any other amount. In fiscal 2013, the Company and the EPA conducted a periodic five-year review of the status of the remediation of the contamination of the site. The Company intends to complete additional investigation of the soil and groundwater on the site during the second half of calendar 2014. Based on this investigation, the Company will then assess revisions to its remediation plan and expects to meet with the EPA in the first half of fiscal 2015 to determine how to proceed. Any revisions could be material to the operating results of any fiscal quarter or fiscal year. The Company does not expect such additional expenses would have a material adverse effect on its liquidity or financial condition. The Company accrues the anticipated cost of environmental remediation when the obligation is probable and can be reasonably estimated. Although the Company has accrued all reasonably estimable costs associated with remediation of the site, it is expected that additional testing and environmental monitoring and remediation could be required in the future as part of the Company’s ongoing discussions with the EPA regarding the development and implementation of the remedial action plans. In addition, the current investigation has not yet been completed and does not include all potentially affected areas on the site. Due to the current stage of discussions with the EPA and the uncertainty of the remediation actions that may be required with respect to these affected areas, the Company believes that meaningful estimates of costs or range of costs cannot currently be made and accordingly have not been accrued. Trade Receivables and Allowances Trade receivables are reported on the balance sheet net of any doubtful accounts. Losses are recognized when it is probable that an asset has been impaired and the amount of the loss can be reasonably estimated. In estimating probable losses, the Company reviews specific accounts that are significant and past due, in bankruptcy or otherwise identified at risk for potential credit loss. Collectability of these specific accounts are assessed based on facts and circumstances of that customer, and an allowance for credit losses is established based on the probability of default. In assessing the likelihood of collection of receivable, the Company considers, for example, the Company’s history of collections, the current status of discussions and repayment plans, collateral received, and other evidence and information regarding collection or default risk that is available in the market place. The allowance for credit losses attributable to the remaining accounts is established using probabilities of default and an estimate of associated losses based upon the aging of receivable balances, collection experience, economic condition and credit risk quality.
19
As the Company’s international business has grown, the exposure to potential losses in international markets has also increased. These exposures can be difficult to estimate, particularly in areas of political instability or with governments with which the Company has limited experience or where there is a lack of transparency as to the current credit condition of governmental units. As of August 31, 2014 the Company had $8.0 million in delinquent accounts receivable with Chinese governmental entities, and $2.5 million of accounts receivable and $1.9 million in performance bonds related to its contract in Iraq. The Company’s allowance for all doubtful accounts related to both current and long-term receivables increased to $4.8 million at August 31, 2014 from $2.9 million at August 31, 2013. Receivables that are not reasonably expected to be realized in cash within the next twelve months are classified as long-term receivables within noncurrent assets. The Company’s evaluation of the adequacy of the allowance for credit losses is based on facts and circumstances available to the Company at the date of the consolidated financial statements and considers any significant changes in circumstances occurring through the date that the financial statements are issued. Valuation of Goodwill and Identifiable Intangible Assets The Company’s accounting policy on valuation of goodwill and identifiable intangible assets is critical because it requires significant judgments and estimates by management and can significantly affect the Company’s consolidated results of operations and financial condition. Goodwill represents the excess of the purchase price over the fair value of net assets acquired in a business combination. Acquired intangible assets are recognized separately from goodwill. Goodwill and intangible assets with indefinite useful lives are tested for impairment at least annually at August 31 and whenever triggering events or changes in circumstances indicate its carrying value may not be recoverable. Assessment of the potential impairment of goodwill and identifiable intangible assets is an integral part of the Company's normal ongoing review of operations. Testing for potential impairment of these assets is significantly dependent on numerous assumptions and reflects management's best estimates at a particular point in time. The dynamic economic environments in which the Company's businesses operate and key economic and business assumptions related to projected selling prices, market growth, inflation rates and operating expense ratios, can significantly affect the outcome of impairment tests. Estimates based on these assumptions may differ significantly from actual results. Changes in factors and assumptions used in assessing potential impairments can have a significant impact on the existence and magnitude of impairments, as well as the time in which such impairments are recognized. In testing goodwill for impairment, the Company has the option to first assess qualitative factors to determine whether the existence of events or circumstances leads to a determination that it is more likely than not (more than 50 percent) that the estimated fair value of a reporting unit is less than its carrying amount. A significant amount of judgment is involved in determining if an indicator of impairment has occurred. Such indicators include deterioration in general economic conditions, adverse changes in the markets in which an entity operates, increases in input costs that have negative effects on earnings and cash flows, or a trend of negative or declining cash flows over multiple periods, among others. If the Company elects to perform a qualitative assessment and determine that an impairment is more likely than not, the Company is then required to perform a quantitative impairment test, otherwise no further analysis is required. The Company also may elect not to perform the qualitative assessment and, instead, proceed directly to the quantitative impairment test. In fiscal 2014, in conjunction with the Company’s annual review for impairment, the Company performed a qualitative analysis of goodwill for each of the Company’s reporting units, which are the same as its operating segments, and did not identify any potential impairment. In assessing other intangible assets not subject to amortization for impairment, the Company has the option to perform a qualitative assessment to determine whether the existence of events or circumstances leads to a determination that it is more likely than not that the fair value of such an intangible asset is less than its carrying amount. If the Company determines that it is not more likely than not that the fair value of such an intangible asset is less than its carrying amount, then the Company is not required to perform any additional tests for assessing intangible assets for impairment. However, if the Company concludes otherwise or elects not to perform the qualitative assessment, the Company is then required to perform a quantitative impairment test that involves a comparison of the estimated fair value of the intangible asset with its carrying value. If the carrying value of the intangible asset exceeds its fair value, an impairment loss is recognized in an amount equal to that excess. In fiscal 2014, the Company performed a qualitative analysis of other intangible assets not subject to amortization and concluded there were no indicators of impairment.

20
Executive Overview and Outlook Net earnings for fiscal 2014 were $51.5 million or $4.00 per diluted share compared with $70.6 million or $5.47 per diluted share in the prior year. The decrease in earnings was primarily attributable to lower revenues, which declined 11 percent to $617.9 million from $690.8 million. The primary driver of lower revenue was the irrigation segment, where sales decreased 14 percent to $539.9 million. Infrastructure revenues increased 20 percent to $78.0 million, partially offsetting the decline in irrigation revenue. Gross margins declined by 0.5 percentage points and operating expenses increased by $4.9 million. Operating margin for fiscal 2014 declined to 12.7 percent as compared to 15.5 percent for fiscal 2013 primarily due to deleverage of fixed costs on lower sales and from higher operating expenses due to the acquisition of the LAKOS® separators and filtration solution business in August 2013. The Company’s irrigation revenues are highly dependent upon the need for irrigated agricultural crop production, which, in turn, depends upon many factors, including the following primary drivers:
Agricultural commodity prices - As of August 2014, corn and soybean prices have decreased approximately 25 percent compared to the same time last year.
Net farm income - As of August 2014, the U.S. Department of Agriculture (USDA) estimated U.S. 2014 net
farm income to be $113.2 billion, down 14 percent from USDA’s estimate of U.S. 2013 net farm income of $131.3 billion. The U.S. 2014 net farm income forecast would be the lowest since 2010, but would remain above the 10-year average.
Weather conditions – Optimal growing conditions for 2014 have led to projections of record harvests and contributed to lower crop prices. During the third and fourth quarters of fiscal 2014, storms across the Midwest created additional demand for replacement units. Drought conditions drove higher equipment purchases in prior years.
Governmental policies - A number of government laws and regulations can impact the Company’s business, including:
The Agricultural Act of 2014 provides certainty to growers by adopting a five-year farm bill. This law continues many of its existing programs, including funding for the Environmental Quality Incentives Program (EQIP), which provides financial assistance to farmers to implement conservation practices and is frequently used to assist in the purchase of center pivot irrigation systems.
Certain tax incentives (such as the Section 179 income tax deduction and bonus depreciation) that encourage equipment purchases were significantly reduced in 2014.
The U.S. government has imposed trade sanctions that could impact irrigation equipment sales to Russia and the Ukraine.
The ethanol mandate that increases corn demand was reduced. Recent legislative discussions involve possible elimination of the Export-Import Bank of the United
States (EXIM). The Company has put measures in place in an effort to mitigate the potential impact of the loss of credit insurance provided by EXIM.
At this point, the U.S. irrigation market has slowed significantly in recent quarters as compared to the same periods last year. U.S. irrigation revenues have contracted due to the significant reduction in commodity prices, the reduction in the Central Plains drought conditions, and the reduction in accelerated tax benefits, partially offset by demand caused by incremental sales from storm damage. International markets remain active, but with some projects delayed due to lower commodity prices or by regional conflict. The current political environment in Russia, the Ukraine and Iraq may have a negative effect on international irrigation equipment revenues. As a result of the above factors, the Company anticipates lower irrigation segment revenues in fiscal 2015. The infrastructure business has improved its profit profile and generated growth in an environment of constrained government spending. In August 2014, the U.S. government enacted a $10.8 billion temporary highway-funding bill to fund highway and bridge projects, the latest in a series of short term funding bills over the last several years. Until and unless a long-term U.S. Highway Bill is passed, uncertainties and limitations on infrastructure growth will continue. In spite of government spending uncertainty, opportunities exist for market share gains in each of the infrastructure

21
product lines. Demand for the Company’s transportation safety products continues to be driven by population growth and the need for improved road safety. As of August 31, 2014, the Company has an order backlog of $79.6 million compared with $66.5 million at August 31, 2013. The increase in backlog at August 31, 2014 included a $12.7 million Road Zipper System™ order from the Golden Gate Bridge Highway & Transportation District. The Company’s backlog can fluctuate from period to period due to the seasonality, cyclicality, timing and execution of contracts. Backlog typically represents long-term projects as well as short lead-time orders and therefore, is generally not a good indication of the next quarter’s revenues. The global drivers for the Company’s markets of population growth, expanded food production and efficient water use and infrastructure expansion support the Company’s long-term growth goals. The most significant opportunities for growth over the next several years are in international markets, where irrigation use is significantly less developed and demand is driven primarily by food security, water scarcity and population growth. Results of Operations The following “Fiscal 2014 Compared to Fiscal 2013” and the “Fiscal 2013 Compared to Fiscal 2012” sections present an analysis of the Company’s consolidated operating results displayed in the Consolidated Statements of Operations and should be read together with the information in Note Q, Industry Segment Information, to the consolidated financial statements. Fiscal 2014 Compared to Fiscal 2013 The following table provides highlights for fiscal 2014 compared with fiscal 2013:
For the Years Ended Percent August 31, Increase $ in thousands 2014 2013 (Decrease) Consolidated Operating revenues $ 617,933 $ 690,848 (11%) Cost of operating revenues $ 446,938 $ 496,014 (10%) Gross profit $ 170,995 $ 194,834 (12%) Gross margin 27.7% 28.2% Operating expenses (1) $ 92,637 $ 87,773 6% Operating income $ 78,358 $ 107,061 (27%) Operating margin 12.7% 15.5% Other income, net $ 297 $ 246 21% Income tax expense $ 27,143 $ 36,737 (26%) Effective income tax rate 34.5% 34.2% Net earnings $ 51,512 $ 70,570 (27%)Irrigation Equipment Segment (See Note Q) Operating revenues $ 539,943 $ 625,996 (14%) Operating income (2) $ 91,697 $ 125,395 (27%) Operating margin (2) 17.0% 20.0% Infrastructure Products Segment (See Note Q) Operating revenues $ 77,990 $ 64,852 20% Operating income (loss) (2) $ 3,511 $ (811) 533% Operating margin (2) 4.5% (1.3%) (1) Includes $16.9 million and $17.5 million of unallocated general and administrative expenses for fiscal 2014 and fiscal 2013, respectively. (2) Excludes unallocated corporate general and administrative expenses.

22
Revenues Operating revenues in fiscal 2014 decreased by 11 percent to $617.9 million compared with $690.8 million in fiscal 2013. The decrease is attributable to an $86.1 million decrease in irrigation revenues offset in part by a $13.1 million increase in infrastructure revenues. The irrigation segment provided 87 percent of Company revenue in fiscal 2014 as compared to 91 percent of the same prior year period. U.S. irrigation revenues in fiscal 2014 of $331.5 million decreased $54.2 million or 14 percent from $385.7 million in fiscal 2013. The decrease in U.S. irrigation revenues is primarily due to a decline in the number of irrigation systems sold as compared to the prior year. Lower agricultural commodity prices contributed to lower demand for U.S. irrigation equipment. An incremental increase in sales resulting from storms in the U.S. irrigation market contributed an estimated $27.0 million of revenues partially offsetting the market decline. The revenues of $20.8 million generated from the LAKOS® separators and filtration solution business that was acquired in August 2013 partially offset the decrease in sales of irrigation systems as well. International irrigation revenues in fiscal 2014 of $208.4 million decreased $31.9 million or 13 percent from $240.3 million in fiscal 2013. The decrease in international irrigation revenues is primarily due to a decline in the number of irrigation systems sold as compared to the prior year. Operating revenues decreased most significantly in the Middle East due to the near completion of the Iraq contract in fiscal 2013. Revenues from the Iraq contract during fiscal 2014 were $2.4 million compared to $33.4 million during fiscal 2013. In other international markets, revenue declined in Russia/Ukraine, Canada and China partially offset by increases in Australia and water filtration system export sales of $7.2 million from the LAKOS® business. Infrastructure products segment revenues in fiscal 2014 of $78.0 million increased by $13.1 million or 20 percent from $64.9 million in fiscal 2013. The increase in sales is primarily due to increases in road safety products and railroad signals and structures. Gross Margin Gross profit was $171.0 million for fiscal 2014, a decrease of $23.8 million compared to fiscal 2013. The decrease in gross profit was primarily due to the decline in sales and a decrease in gross margin to 27.7 percent for fiscal 2014 from 28.2 percent for fiscal 2013. Gross margins in irrigation declined by less than one percentage point due primarily to fixed cost deleverage on lower sales volume. Infrastructure gross margins improved by approximately two percentage points primarily due to a combination of mix shift to higher margin products and fixed cost leverage on higher sales volume. Operating Expenses The Company’s operating expenses of $92.6 million for fiscal 2014 increased $4.9 million compared to fiscal 2013 operating expenses of $87.8 million. Excluding the acquired LAKOS® business, operating expenses decreased $3.6 million primarily due to a reduction of $1.7 million in personnel related expenses including incentive compensation, $1.0 million decrease in research and development expenses and $0.9 million in lower advertising expenses. Operating expenses were 15.0 percent of sales for fiscal 2014 compared to 12.7 percent of sales for fiscal 2013 Operating margin was 12.7 percent for fiscal 2014 as compared to 15.5 percent for fiscal 2013. Income Taxes The Company recorded income tax expense of $27.1 million and $36.7 million for fiscal 2014 and fiscal 2013, respectively. The effective income tax rate increased to 34.5 percent in fiscal 2014 compared to 34.2 percent in fiscal 2013. The increase in the annual effective income tax rate primarily relates to the earnings mix among jurisdictions. Net Earnings Net earnings for fiscal 2014 were $51.5 million or $4.00 per diluted share compared to $70.6 million, or $5.47 per diluted share for the prior fiscal year. The Company’s operating income decreased to $78.4 million in fiscal 2014 compared to $107.1 million during the prior fiscal year primarily due to a decrease in revenues.

23
Fiscal 2013 Compared to Fiscal 2012 The following table provides highlights for fiscal 2013 compared with fiscal 2012:
For the Years Ended Percent August 31, Increase $ in thousands 2013 2012 (Decrease) Consolidated Operating revenues $ 690,848 $ 551,255 25% Cost of operating revenues $ 496,014 $ 402,737 23% Gross profit $ 194,834 $ 148,518 31% Gross margin 28.2% 26.9% Operating expenses (1) $ 87,773 $ 83,008 6% Operating income $ 107,061 $ 65,510 63% Operating margin 15.5% 11.9% Other (expense) income, net $ 246 $ (402) 161% Income tax expense $ 36,737 $ 21,831 68% Effective income tax rate 34.2% 33.5% Net earnings $ 70,570 $ 43,277 63%Irrigation Equipment Segment (See Note Q) Operating revenues $ 625,996 $ 475,299 32% Operating income (2) $ 125,395 $ 80,259 56% Operating margin (2) 20.0% 16.9% Infrastructure Products Segment (See Note Q) Operating revenues $ 64,852 $ 75,956 (15%) Operating loss (2) $ (811) $ (11) (7273%) Operating margin (2) (1.3%) (0.0%) (1) Includes $17.5 million and $14.7 million of unallocated general and administrative expenses for fiscal 2013 and fiscal 2012, respectively. (2) Excludes unallocated corporate general and administrative expenses. Revenues Operating revenues in fiscal 2013 increased by 25 percent to $690.8 million compared with $551.3 million in fiscal 2012. The increase is attributable to a $150.6 million increase in irrigation revenues offset in part by an $11.1 million decrease in infrastructure revenues. The irrigation segment provided 91 percent of Company revenue in fiscal 2013 as compared to 86 percent of the same prior year period, due to growth in irrigation equipment revenues and the decline in infrastructure revenues. U.S. irrigation revenues of $385.7 million increased $80.3 million or 26 percent compared to fiscal 2012. The increase in U.S. irrigation equipment revenues is primarily due to an increase in the number of irrigation systems sold compared to the prior fiscal year, with the largest increases in the U.S. Corn Belt. Favorable economic conditions in U.S. agriculture markets continued to drive strong demand for irrigation equipment. International irrigation revenues of $240.3 million increased $70.3 million or 41 percent compared to fiscal 2012. The increase in international irrigation revenues is primarily due to an increase in the number of irrigation systems sold compared to the prior year. Operating revenues increased in nearly all markets and most significantly in the Middle East and South America. In fiscal 2013, the Company recognized revenues of $33.4 million on the Iraq contract consisting of irrigation machines and ancillary related equipment. In South America, irrigation equipment revenues in Brazil doubled over the prior year, fueled by proven success from mechanized irrigation and attractive interest rates offered by the Brazilian government for agricultural equipment.

24
Infrastructure products segment revenues of $64.8 million decreased by $11.1 million or 15 percent compared to the prior fiscal year. The decrease in infrastructure revenues was primarily due to lower sales across all product lines. Infrastructure demand, including for Road Zipper SystemTM projects, has proven to be challenging due to constricted government funding and project delays. Gross Margin Gross profit was $194.8 million for fiscal 2013, an increase of $46.3 million compared to fiscal 2012. The increase in gross profit was primarily attributable to a $37.6 million increase on higher sales volume and an $8.7 million gross profit increase from improvement in gross margin. Gross margin was 28.2 percent for fiscal 2013 compared to 26.9 percent for the prior fiscal year as higher gross margins were realized in the irrigation segment, while infrastructure gross margins were relatively flat year over year. Irrigation segment gross margins increased by approximately 1.0 percentage point primarily due to a strong pricing environment combined with increased manufacturing productivity and fixed cost leverage from increased volume. Operating Expenses The Company’s operating expenses of $87.8 million for fiscal 2013 increased $4.8 million compared to fiscal 2012 operating expenses of $83.0 million. The increase in operating expenses is primarily related to an increase of $5.8 million in personnel-related expenses, driven by higher incentive compensation and headcount to support growth, increases in selling expenses of $3.0 million associated with growth, increases in research and development expenses of $1.9 million, and increases in accounts receivable reserves of $1.2 million. These increases were partially offset by the $7.2 million decrease in environmental remediation expense. Operating expenses were 12.7 percent of sales for fiscal 2013 compared to 15.1 percent of sales for fiscal 2012 due to leverage of expenses on higher sales. Operating margin was 15.5 percent for fiscal 2013 as compared to 11.9 percent for fiscal 2012. Income Taxes The Company recorded income tax expense of $36.7 million and $21.8 million for fiscal 2013 and fiscal 2012, respectively. The effective income tax rate increased to 34.2 percent in fiscal 2013 compared to 33.5 percent in fiscal 2012. The increase in the annual effective income tax rate primarily relates to earnings mix among jurisdictions less certain tax credits reinstated in fiscal 2013. Net Earnings Net earnings for fiscal 2013 were $70.6 million or $5.47 per diluted share compared to $43.3 million, or $3.38 per diluted share for the prior fiscal year. The Company’s operating income increased to $107.1 million in fiscal 2013 compared to $65.5 million during the prior fiscal year primarily due to an increase in revenues partially offset by higher operating expenses. Liquidity and Capital Resources The Company's cash and cash equivalents totaled $171.8 million at August 31, 2014 compared with $151.9 million at August 31, 2013. The Company requires cash for financing its receivables and inventories, paying operating expenses and capital expenditures, and for dividends and share repurchases. The Company meets its liquidity needs and finances its capital expenditures from its available cash and funds provided by operations along with borrowings under two credit arrangements that are described below. The Company believes its current cash resources, projected operating cash flow, and remaining capacity under its continuing bank lines of credit are sufficient to cover all of its expected working capital needs, planned capital expenditures and dividends. The Company’s Capital Allocation Plan outlined below could require the Company to incur debt depending on the size and timing of share repurchases and potential acquisitions. The Company’s total cash and cash equivalents held by foreign subsidiaries, in which earnings are considered indefinitely reinvested, was approximately $33.1 million and $26.2 million as of August 31, 2014 and 2013, respectively. The Company considers these funds to be permanently reinvested, and would need to accrue and pay taxes if these funds were repatriated. The Company does not intend to repatriate the funds, and does not expect these funds to have a significant impact on the Company’s overall liquidity.

25
Net working capital was $258.2 million at August 31, 2014, as compared with $266.7 million at August 31, 2013. Cash flows provided by operations totaled $91.8 million during the year ended August 31, 2014 compared to $57.5 million provided by operations during the same prior year period. Cash provided by operations increased by $34.3 million compared to the prior year period primarily as a result of positive cash flow changes in receivables and inventories. As the Company’s international business has grown, the exposure to potential losses in international markets has also increased. These exposures can be difficult to estimate, particularly in areas of political instability or with governments with which the Company has limited experience or where there is a lack of transparency as to the current credit condition of governmental units. As of August 31, 2014 the Company had $8.0 million in delinquent accounts receivable with Chinese governmental entities, and $2.5 million of accounts receivable and $1.9 million in performance bonds related to its contract in Iraq. The Company’s allowance for all doubtful accounts increased to $4.8 million at August 31, 2014 from $2.9 million at August 31, 2013. The amount and timing of collection of outstanding amounts could impact working capital needs. Cash flows used in investing activities totaled $18.5 million during the year ended August 31, 2014 compared to $41.1 million during the same prior year period. Net cash used in investing activities was lower in fiscal 2014 primarily due to the $29.0 million acquisition of Claude Laval Corporation and its LAKOS® brand of filtration products that occurred in the prior year. Capital spending of $17.7 million in fiscal 2014 increased compared to the prior year capital spending of $11.1 million, primarily due to increased capital expenditures for productivity improvements and manufacturing capacity expansion. Cash flows used in financing activities totaled $53.6 million during the year ended August 31, 2014 compared to $8.0 million during the same prior year period. The $45.6 million increase in cash used in financing activities was primarily due to an increase in share repurchases of $41.1 million and an increase in the amount of dividends paid of $4.9 million. The Company had no outstanding long-term debt as of August 31, 2014 and 2013. Capital Allocation Plan The Company’s capital allocation plan is to continue investing in revenue and earnings growth, combined with a defined process for enhancing returns to stockholders. Under the Company’s announced capital allocation plan in January 2014, the priorities for uses of cash include:
Investment in organic growth including capital expenditures and expansion of international markets, Dividends to stockholders, along with expectations to increase dividends on an annual basis, Synergistic water related acquisitions that provide attractive returns to stockholders, and Opportunistic share repurchases taking into account cyclical and seasonal fluctuations.
Capital Expenditures and Expansion of International Markets In fiscal 2015, the Company expects capital expenditures of approximately $20.0 million to $25.0 million, largely focused on manufacturing capacity expansion and productivity improvements. The Company’s capital expenditure plan includes investments in a manufacturing operation in Turkey, which is planned to be operational early in calendar 2015 and is expected to accommodate long-term growth plans for several international markets. The Company’s management does maintain flexibility to modify the amount and timing of some of the planned expenditures in response to economic conditions. Dividends In fiscal 2014, the Company paid cash dividends of $0.92 per common share or $11.7 million to stockholders as compared to $0.475 per common share or $6.1 million in fiscal 2013.

26
Share Repurchases On January 3, 2014, the Company announced that its Board of Directors replaced its existing share repurchase authorization with an increased authorization to repurchase up to $150.0 million of common stock with the authorization effective through January 2, 2016. On July 25, 2014, the Company adopted a written trading plan in connection with its share repurchase program for repurchasing its common stock in accordance with the guidelines specified under Rule 10b5-1 of the Securities Exchange Act of 1934, as amended. During the twelve months ended August 31, 2014, the Company repurchased 497,899 shares of common stock for an aggregate purchase price of $41.1 million. During the twelve months ended August 31, 2013, the Company did not repurchase shares of common stock. The remaining amount available under the repurchase program was $108.9 million as of August 31, 2014. Credit Facility Agreement The Company’s wholly-owned subsidiary, Lindsay International Holdings B.V., has an unsecured $5.0 million Credit Facility Agreement with Coöperatieve Centrale Raiffeisen-Boerenleenbank B.A. (“Rabobank”), which was entered into on August 22, 2014 (the “Credit Facility Agreement”). The borrowings from the Credit Facility Agreement may primarily be used for working capital purposes and funding acquisitions. There were no borrowings outstanding on the Credit Facility Agreement at August 31, 2014. Borrowings under the Credit Facility Agreement bear interest at a rate equal to LIBOR plus 115 basis points (1.31 percent at August 31, 2014). The Company also pays an annual commitment fee of 0.25 percent on the unused portion of the Credit Facility Agreement. Unpaid principal and interest is due by August 21, 2015.
Revolving Credit Agreement The Company has an unsecured $30.0 million Revolving Credit Note and Credit Agreement with Wells Fargo Bank, N.A., which was amended on January 22, 2014 to revise letter of credit expiry dates and cash collateralization procedures (the “Revolving Credit Agreement”). The borrowings from the Revolving Credit Agreement may primarily be used for working capital purposes and funding acquisitions. At August 31, 2014 and 2013, the Company had no outstanding borrowings on the Revolving Credit Agreement. The amount of borrowings available at any time under the Revolving Credit Agreement is reduced by the amount of standby letters of credit then outstanding. At August 31, 2014, the Company had the ability to borrow $24.5 million under this facility, after consideration of standby letters of credit of $5.5 million. Borrowings under the Revolving Credit Agreement bear interest at a rate equal to LIBOR plus 90 basis points (1.06 percent at August 31, 2014), subject to adjustment as set forth in the Revolving Credit Agreement. Interest is paid on a monthly to quarterly basis depending on loan type. The Company also pays an annual commitment fee of 0.25 percent on the unused portion of the Revolving Credit Agreement. Unpaid principal and interest is due by February 13, 2016. Each of the Credit Facility Agreement and the Revolving Credit Agreement contains certain covenants relating to the Company’s financial condition. Upon the occurrence of any event of default of these covenants, including a change in control of the Company, all amounts due thereunder may be declared to be immediately due and payable. At August 31, 2014 and 2013, the Company was in compliance with all loan covenants.
Inflation The Company is subject to the effects of changing prices. During fiscal 2014, the Company realized pricing volatility for purchases of certain commodities, in particular steel and zinc products, used in the production of its products. While the cost outlook for commodities used in the production of the Company’s products is not certain, management believes it can manage these inflationary pressures by introducing appropriate sales price adjustments and by actively pursuing internal cost reduction efforts, while further refining the Company’s inventory and raw materials risk management system. However, competitive market pressures may affect the Company’s ability to pass price adjustments along to its customers.

27
Contractual Obligations, Commercial Commitments and Off-Balance Sheet Arrangements In the normal course of business, the Company enters into contracts and commitments which obligate the Company to make future payments. The Company uses off-balance sheet arrangements, such as leases accounted for as operating leases, standby letters of credit and performance bonds, where sound business principles warrant their use. The table below sets forth the Company’s significant future obligations by time period.
More $ in thousands Less than 2-3 4-5 than 5 Contractual Obligations (1) Total 1 Year Years Years Years Operating lease obligations $ 17,027 $ 3,156 $ 4,463 $ 3,283 $ 6,125Pension benefit obligations 7,157 557 1,072 1,042 4,486Total $ 24,184 $ 3,713 $ 5,535 $ 4,325 $ 10,611 (1) Total liabilities for unrecognized tax benefits as of August 31, 2014 were $3.6 million and are excluded from the table above. Unrecognized tax benefits are classified on the Company's consolidated balance sheets within other current liabilities ($2.6 million) and within other noncurrent liabilities ($1.0 million).
In fiscal 2013, the Company entered into a $39 million contract with the government of Iraq for the delivery and installation of irrigation equipment, of which $35.8 million has been fulfilled. The June 2014 escalation of political instability within Iraq has resulted in increased difficulties for the Company to complete installation as required, and may make it impossible to do so. The Company has suspended installation services indefinitely until the political environment improves in Iraq. The Company has a $1.9 million performance bond securing its obligations under the contract. No amounts have been accrued for potential losses in the consolidated financial statements as of August 31, 2014 as the Company continues to evaluate its exposure to claims for uncompleted services. The Company does not have any additional off-balance sheet arrangements that have or are reasonably likely to have a material current or future effect on the Company’s financial condition, changes in financial condition, revenues or expenses, results of operations, liquidity, capital expenditures or capital resources.

28
ITEM 7A – Quantitative and Qualitative Disclosures About Market Risk The Company uses certain financial derivatives to mitigate its exposure to volatility in interest rates and foreign currency exchange rates. The Company uses these derivative instruments to hedge exposures in the ordinary course of business and does not invest in derivative instruments for speculative purposes. The credit risk under these interest rate and foreign currency agreements is not considered to be significant. The Company attempts to manage market and credit risks associated with its derivative instruments by establishing and monitoring limits as to the types and degree of risk that may be undertaken, and by entering into transactions with counterparties that have investment grade credit ratings. As of August 31, 2014, the Company’s derivative counterparty had investment grade credit ratings. The Company has manufacturing operations in the United States, Brazil, France, Italy, South Africa and China. The Company has sold products throughout the world and purchases certain of its components from third-party international suppliers. Export sales made from the United States are principally U.S. dollar denominated. At times, export sales may be denominated in a currency other than the U.S. dollar. A majority of the Company’s revenue generated from operations outside the United States is denominated in local currency. Accordingly, these sales are not typically subject to significant foreign currency transaction risk. The Company’s most significant transactional foreign currency exposures are the Euro, the Brazilian real, the South African rand and the Chinese renminbi in relation to the U.S. dollar. Fluctuations in the value of foreign currencies create exposures, which can adversely affect the Company’s results of operations. Based on the consolidated statement of operations for the year ended August 31, 2014, the Company estimates the potential decrease in operating income from a 10 percent adverse change in the underlying exchange rates, in U.S. dollar terms, would be less than $1.0 million. In order to reduce exposures related to changes in foreign currency exchange rates, the Company, at times, may enter into forward exchange or option contracts for transactions denominated in a currency other than the functional currency for certain of its operations. This activity primarily relates to economically hedging against foreign currency risk in purchasing inventory, sales of finished goods, intercompany transactions and future settlement of foreign denominated assets and liabilities. The Company had $4.9 million of U.S. dollar equivalent cash flow forward exchange contracts and option contracts outstanding as of August 31, 2014. In order to reduce translation exposure resulting from translating the financial statements of its international subsidiaries into U.S. dollars, the Company, at times, utilizes Euro foreign currency forward contracts to hedge a portion of its Euro net investment exposure in its foreign operations. At August 31, 2014, the Company had outstanding Euro foreign currency forward contracts to sell 28.9 million Euro at fixed prices expected to settle during the first quarter of fiscal 2015. At August 31, 2014, the Company also had an outstanding foreign currency forward contract to sell 43.0 million South African Rand at fixed prices to settle during the first quarter of fiscal 2015. Based on the net investments contracts outstanding at August 31, 2014, the Company estimates the potential decrease in fair value from a 10 percent adverse change in the underlying exchange rates would be approximately $2.9 million. This decrease in fair value would be reflected as a reduction to other comprehensive income offsetting the translation exposure or adjustment of the international subsidiaries.

29
ITEM 8 – Financial Statements and Supplementary Data
Report of Independent Registered Public Accounting Firm The Board of Directors and Shareholders Lindsay Corporation:
We have audited the accompanying consolidated balance sheets of Lindsay Corporation and subsidiaries (the Company) as of August 31, 2014 and 2013, and the related consolidated statements of operations, comprehensive income, shareholders’ equity, and cash flows for each of the years in the three-year period ended August 31, 2014. In connection with our audits of the consolidated financial statements, we also have audited the financial statement schedule listed in Item 15(a)(2) of this Form 10-K. These consolidated financial statements and financial statement schedule are the responsibility of the Company’s management. Our responsibility is to express an opinion on these consolidated financial statements and financial statement schedule based on our audits.
We conducted our audits in accordance with the standards of the Public Company Accounting Oversight Board (United States). Those standards require that we plan and perform the audit to obtain reasonable assurance about whether the financial statements are free of material misstatement. An audit includes examining, on a test basis, evidence supporting the amounts and disclosures in the financial statements. An audit also includes assessing the accounting principles used and significant estimates made by management, as well as evaluating the overall financial statement presentation. We believe that our audits provide a reasonable basis for our opinion.
In our opinion, the consolidated financial statements referred to above present fairly, in all material respects, the financial position of Lindsay Corporation and subsidiaries as of August 31, 2014 and 2013, and the results of their operations and their cash flows for each of the years in the three-year period ended August 31, 2014, in conformity with U.S. generally accepted accounting principles. Also in our opinion, the related financial statement schedule, when considered in relation to the basic consolidated financial statements taken as a whole, presents fairly, in all material respects, the information set forth therein.
We also have audited, in accordance with the standards of the Public Company Accounting Oversight Board (United States), the Company’s internal control over financial reporting as of August 31, 2014, based on criteria established in Internal Control – Integrated Framework (1992) issued by the Committee of Sponsoring Organizations of the Treadway Commission (COSO), and our report dated October 15, 2014 expressed an unqualified opinion on the effectiveness of the Company’s internal control over financial reporting.
/s/ KPMG LLP
Omaha, Nebraska October 15, 2014

30
Lindsay Corporation and Subsidiaries CONSOLIDATED STATEMENTS OF OPERATIONS
Years ended August 31,
(in thousands, except per share amounts) 2014 2013 2012 Operating revenues $ 617,933 $ 690,848 $ 551,255 Cost of operating revenues 446,938 496,014 402,737 Gross profit 170,995 194,834 148,518 Operating expenses: Selling expense 38,284 32,937 28,104 General and administrative expense 43,228 43,441 45,423 Engineering and research expense 11,125 11,395 9,481 Total operating expenses 92,637 87,773 83,008 Operating income 78,358 107,061 65,510 Interest expense (187) (304) (492)Interest income 729 496 504 Other income (expense), net (245) 54 (414) Earnings before income taxes 78,655 107,307 65,108 Income tax expense 27,143 36,737 21,831 Net earnings $ 51,512 $ 70,570 $ 43,277 Earnings per share: Basic $ 4.01 $ 5.50 $ 3.41 Diluted $ 4.00 $ 5.47 $ 3.38 Shares used in computing earnings per share: Basic 12,832 12,830 12,704 Diluted 12,882 12,901 12,810 Cash dividends declared per share $ 0.920 $ 0.475 $ 0.385 See accompanying notes to consolidated financial statements.

31
Lindsay Corporation and Subsidiaries CONSOLIDATED STATEMENTS OF COMPREHENSIVE INCOME
Years ended August 31, ($ in thousands) 2014 2013 2012 Net earnings $ 51,512 $ 70,570 $ 43,277 Other comprehensive income (loss): Defined benefit pension plan adjustment, net of tax (210) 260 (408) Unrealized gain on cash flow hedges, net of tax - 53 200 Foreign currency translation adjustment, net of hedging activities and tax 325 (1,752) (7,131)Total other comprehensive (loss) income, net of tax (benefit) expense of ($27), ($330) and $394 115 (1,439) (7,339)
Total comprehensive income $ 51,627 $ 69,131 $ 35,938 See accompanying notes to consolidated financial statements.

32
Lindsay Corporation and Subsidiaries CONSOLIDATED BALANCE SHEETS
August 31, August 31, ($ and shares in thousands, except par values) 2014 2013 ASSETS Current assets: Cash and cash equivalents $ 171,842 $ 151,927 Receivables, net of allowance of $2,857 and $2,853, respectively 94,135 120,291 Inventories, net 71,696 68,607 Deferred income taxes 17,714 12,705 Other current assets 18,671 15,261 Total current assets 374,058 368,791 Property, plant and equipment, net 72,457 65,064 Intangible assets, net 31,980 36,007 Goodwill 37,021 37,414 Other noncurrent assets, net of allowance of $2,000 and $0, respectively 11,035 5,020 Total assets $ 526,551 $ 512,296 LIABILITIES AND SHAREHOLDERS' EQUITY Current liabilities: Accounts payable $ 42,424 $ 42,276 Other current liabilities 73,943 59,816 Total current liabilities 116,367 102,092 Pension benefits liabilities 6,600 6,324 Deferred income taxes 12,992 15,415 Other noncurrent liabilities 7,945 7,827 Total liabilities 143,904 131,658 Shareholders' equity: Preferred stock of $1 par value - authorized 2,000 shares; no shares issued and outstanding - - Common stock at $1 par value - authorized 25,000 shares; 18,636 and 18,571 shares issued at August 31, 2014 and 2013, respectively 18,636 18,571 Capital in excess of stated value 52,866 49,764 Retained earnings 445,366 405,580 Less treasury stock - at cost, 6,196 and 5,698 shares at August 31, 2014 and 2013, respectively (132,020) (90,961) Accumulated other comprehensive loss, net (2,201) (2,316)Total shareholders' equity 382,647 380,638 Total liabilities and shareholders' equity $ 526,551 $ 512,296 See accompanying notes to consolidated financial statements.

33
Lindsay Corporation and Subsidiaries CONSOLIDATED STATEMENTS OF SHAREHOLDERS’ EQUITY
(in thousands, except per share amounts)
Shares of Common
stock
Shares of Treasury
stock Common
stock
Capital in excess of
stated value
Retained earnings
Treasury stock
Accumulated other
comprehensive (loss) income,
net
Total Shareholders’
equity
Balance at August 31, 2011 18,374 5,698 $ 18,374 $ 39,058 $ 302,732 $ (90,961) $ 6,462 $ 275,665 Comprehensive income: Net earnings 43,277 43,277 Other comprehensive loss (7,339) (7,339)Total comprehensive income 35,938 Cash dividends ($0.385) per share (4,894) (4,894)
Issuance of common shares under share compensation plans 47 47 (57) (10)
Excess tax benefits from share-based compensation 374 374 Share-based compensation expense 3,765 3,765
Balance at August 31, 2012 18,421 5,698 $ 18,421 $ 43,140 $ 341,115 $ (90,961) $ (877) $ 310,838 Comprehensive income: Net earnings 70,570 70,570 Other comprehensive loss (1,439) (1,439)Total comprehensive income 69,131 Cash dividends ($0.475) per share (6,105) (6,105)
Issuance of common shares under share compensation plans 150 150 (555) (405)
Excess tax benefits from share-based compensation 2,800 2,800 Share-based compensation expense 4,379 4,379
Balance at August 31, 2013 18,571 5,698 $ 18,571 $ 49,764 $ 405,580 $ (90,961) $ (2,316) $ 380,638 Comprehensive income: Net earnings 51,512 51,512 Other comprehensive income 115 115 Total comprehensive income 51,627 Cash dividends ($0.920) per share (11,726) (11,726)Repurchase of common stock 498 (41,059) (41,059)
Issuance of common shares under share compensation plans 65 65 (1,639) (1,574)
Excess tax benefits from share-based compensation 722 722 Share-based compensation expense 4,019 4,019
Balance at August 31, 2014 18,636 6,196 $ 18,636 $ 52,866 $ 445,366 $
(132,020) $ (2,201) $ 382,647 See accompanying notes to consolidated financial statements.

34
Lindsay Corporation and Subsidiaries CONSOLIDATED STATEMENTS OF CASH FLOWS
($ in thousands) Years Ended August 31, 2014 2013 2012 CASH FLOWS FROM OPERATING ACTIVITIES: Net earnings $ 51,512 $ 70,570 $ 43,277 Adjustments to reconcile net earnings to net cash provided by operating activities: Depreciation and amortization 14,793 12,600 12,468 Provision for uncollectible accounts receivable 2,225 1,543 379 Deferred income taxes (8,195) (3,237) (3,868) Share-based compensation expense 4,207 4,573 3,939 Other, net (465) (1,014) 959 Changes in assets and liabilities: Receivables 24,751 (36,557) (7,570) Inventories (2,724) (10,020) (5,609) Other current assets (3,092) (4,054) (641) Accounts payable (623) 9,188 723 Other current liabilities 8,954 14,578 (1,602) Current taxes payable 5,706 (892) 5,408 Other noncurrent assets and liabilities (5,251) 227 4,576 Net cash provided by operating activities 91,798 57,505 52,439 CASH FLOWS FROM INVESTING ACTIVITIES: Purchases of property, plant and equipment (17,715) (11,136) (9,890) Proceeds from sale of property, plant and equipment 34 22 116 Acquisitions of business, net of cash acquired - (29,007) - Proceeds from settlement of net investment hedges 1,245 1,944 3,378 Payments for settlement of net investment hedges (2,040) (2,904) (453) Net cash used in investing activities (18,476) (41,081) (6,849) CASH FLOWS FROM FINANCING ACTIVITIES: Proceeds from exercise of stock options 455 2,036 567 Common stock withheld for payroll tax withholdings (2,027) (2,441) (577) Principal payments on long-term debt - (4,285) (4,286) Excess tax benefits from share-based compensation 762 2,800 387 Repurchase of common shares (41,059) - - Dividends paid (11,726) (6,105) (4,894) Net cash used in financing activities (53,595) (7,995) (8,803) Effect of exchange rate changes on cash and cash equivalents 188 54 (1,510) Net change in cash and cash equivalents 19,915 8,483 35,277 Cash and cash equivalents, beginning of period 151,927 143,444 108,167 Cash and cash equivalents, end of period $ 171,842 $ 151,927 $ 143,444 SUPPLEMENTAL CASH FLOW INFORMATION Income taxes paid $ 26,261 $ 38,328 $ 19,667 Interest paid $ 234 $ 369 $ 561 See accompanying notes to consolidated financial statements.

35
Lindsay Corporation and Subsidiaries
NOTES TO CONSOLIDATED FINANCIAL STATEMENTS A. DESCRIPTION OF BUSINESS AND SIGNIFICANT ACCOUNTING POLICIES Lindsay Corporation, along with its subsidiaries (collectively called "Lindsay" or the "Company"), is a global leader in providing a variety of proprietary water management and road infrastructure products and services. The Company has been involved in the manufacture and distribution of agricultural equipment since 1955 and has grown from a regional company to an international agribusiness and highway infrastructure firm with worldwide sales and distribution. Lindsay, a Delaware corporation, maintains its corporate offices in Omaha, Nebraska. The Company has operations which are categorized into two major reporting segments. Irrigation Segment – The Company’s irrigation segment includes the manufacture and marketing of center pivot, lateral move, and hose reel irrigation systems which are used principally in the agricultural industry to increase or stabilize crop production while conserving water, energy and labor. The irrigation segment also manufactures and markets repair and replacement parts for its irrigation systems and controls. In addition, the irrigation segment also designs and manufactures water pumping stations and controls for the agriculture, golf, landscape and municipal markets and filtration solutions for groundwater, agriculture, industrial and heat transfer markets. The Company continues to strengthen irrigation product offerings through innovative technology such as GPS positioning and guidance, variable rate irrigation, wireless irrigation management, and smartphone applications. The Company’s principal irrigation manufacturing facilities are located in Lindsay, Nebraska, Hartland, Wisconsin, and Fresno, California. Internationally, the Company has production operations in Brazil, France, China, and South Africa as well as distribution and sales operations in the Netherlands, Australia and New Zealand. The Company also exports equipment from the U.S. to other international markets. Infrastructure Segment – The Company’s infrastructure segment includes the manufacture and marketing of moveable barriers, specialty barriers, crash cushions and end terminals, road marking and road safety equipment, large diameter steel tubing, and railroad signals and structures. The infrastructure also provides outsourced manufacturing and production services. The principal infrastructure manufacturing facilities are located in Rio Vista, California, Milan, Italy, and Omaha, Nebraska. Notes to the consolidated financial statements describe various elements of the financial statements and the accounting policies, estimates, and assumptions applied by management. While actual results could differ from those estimated at the time of preparation of the consolidated financial statements, management believes that the accounting policies, assumptions, and estimates applied promote the representational faithfulness, verifiability, neutrality, and transparency of the accounting information included in the consolidated financial statements. The significant accounting policies of the Company are as follows: (1) Principles of Consolidation The consolidated financial statements include the accounts of the Company and its subsidiaries. All intercompany balances and transactions are eliminated in consolidation. (2) Reclassifications Certain reclassifications have been made to prior financial statements to conform to the current-year presentation. (3) Use of Estimates The preparation of financial statements in conformity with U.S. generally accepted accounting principles requires management to make estimates and assumptions that affect the reported amounts of assets and liabilities and disclosure of contingent assets and liabilities at the date of the financial statements and the reported amounts of revenues and expenses during the reporting period. Actual results could differ from those estimates.

36
(4) Revenue Recognition The Company’s basic criteria necessary for revenue recognition are: 1) evidence of a sales arrangement exists, 2) delivery of goods has occurred, 3) the sales price to the buyer is fixed or determinable, and 4) collectability is reasonably assured. The Company recognizes revenue when these criteria have been met and when title and risk of loss transfers to the customer. The Company generally has no post-delivery obligations to its independent dealers other than standard warranties. Revenues and gross profits on intercompany sales are eliminated in consolidation. Revenues from the sale of the Company’s products are recognized based on the delivery terms in the sales contract. If an arrangement involves multiple deliverables, revenues from the arrangement are allocated to the separate units of accounting based on their relative selling price. The Company offers a subscription-based service for wireless management and recognizes subscription revenue on a straight-line basis over the contract term. The Company leases certain infrastructure property held for lease to customers such as moveable concrete barriers and Road Zipper SystemsTM. Revenues for the lease of infrastructure property held for lease are recognized on a straight-line basis over the lease term. The costs related to revenues are recognized in the same period in which the specific revenues are recorded. Shipping and handling fees billed to customers are reported in revenue. Shipping and handling costs incurred by the Company are included in cost of sales. Customer rebates, cash discounts and other sales incentives are recorded as a reduction of revenues at the time of the original sale. Estimates used in the recognition of operating revenues and cost of operating revenues include, but are not limited to, estimates for product warranties, product rebates, cash discounts and fair value of separate units of accounting on multiple deliverables. (5) Stock Based Compensation The Company recognizes compensation expense for all share-based payment awards made to employees and directors based on estimated fair values on the date of grant. The Company uses the straight-line amortization method over the vesting period of the awards. The Company has historically issued shares upon exercise of stock options or vesting of restricted stock units or performance stock units from new stock issuances. The value of the portion of the award that is ultimately expected to vest is recognized as expense in the Company’s Consolidated Statement of Operations over the periods during which the employee or director is required to perform a service in exchange for the award. The Company uses the Black-Scholes option-pricing model (“Black-Scholes model”) as its valuation method for stock option awards. Under the Black-Scholes model, the fair value of stock option awards on the date of grant is estimated using an option-pricing model that is affected by the Company’s stock price as well as assumptions regarding a number of highly complex and subjective variables. These variables include, but are not limited to the Company’s expected stock price volatility over the term of the awards and actual and projected employee stock option exercise behaviors. Restricted stock, restricted stock units, performance shares and performance stock units issued under the 2010 Long-Term Incentive Plan will have a grant date fair value equal to the fair market value of the underlying stock on the grant date less present value of expected dividends. (6) Warranty Costs The Company's provision for product warranty reflects management's best estimate of probable liability under its product warranties. At the time a sale is recognized, the company records the estimated future warranty costs. The Company generally determines its total future warranty liability by applying historical claims rate experience to the amount of equipment that has been sold and is still within the warranty period. In addition, the Company records provisions for known warranty claims. This provision is periodically adjusted to reflect actual experience. (7) Cash and Cash Equivalents Cash equivalents consist of highly liquid investments with original maturities of three months or less.

37
(8) Receivables and Allowances Trade receivables are reported on the balance sheet net of any doubtful accounts. Losses are recognized when it is probable that an asset has been impaired and the amount of the loss can be reasonably estimated. In estimating probable losses, the Company reviews specific accounts that are significant and past due, in bankruptcy or otherwise identified at risk for potential credit loss. Collectability of these specific accounts are assessed based on facts and circumstances of that customer, and an allowance for credit losses is established based on the probability of default. In assessing the likelihood of collection of receivable, the Company considers (for example) the Company’s history of collections, the current status of discussions and repayment plans, collateral received, and other evidence and information regarding collection or default risk that is available in the market place. The allowance for credit losses attributable to the remaining accounts is established using probabilities of default and an estimate of associated losses based upon the aging of receivable balances, collection experience, economic condition and credit risk quality. As the Company’s international business has grown, the exposure to potential losses in international markets has also increased. These exposures can be difficult to estimate, particularly in areas of political instability or with governments with which the Company has limited experience or where there is a lack of transparency as to the current credit condition of governmental units. As of August 31, 2014 the Company had $8.0 million in delinquent accounts receivable with Chinese governmental entities, and $2.5 million of accounts receivable and $1.9 million in performance bonds related to its contract in Iraq. The Company’s allowance for all doubtful accounts related to both current and long-term receivables increased to $4.8 million at August 31, 2014 from $2.9 million at August 31, 2013. Receivables that are not reasonably expected to be realized in cash within the next twelve months are classified as long-term receivables within noncurrent assets. The Company’s evaluation of the adequacy of the allowance for credit losses is based on facts and circumstances available to the Company at the date of the consolidated financial statements and considers any significant changes in circumstances occurring through the date that the financial statements are issued. (9) Inventories Inventories are stated at the lower of cost or market. Cost is determined by the last-in, first-out (LIFO) method for the Company’s Lindsay, Nebraska inventory and three warehouses in Idaho, Georgia and Texas. Cost is determined by the first-in, first-out (FIFO) method for inventory at operating locations in Nebraska, California, Wisconsin, China and Australia. Cost is determined by the weighted average cost method for inventory at the Company’s other operating locations in Washington, Brazil, France, Italy and South Africa. At all locations, the Company reserves for obsolete, slow moving, and excess inventory by estimating the net realizable value based on the potential future use of such inventory. (10) Property, Plant and Equipment Property, plant, equipment, and capitalized assets held for lease are stated at cost. The Company capitalizes major expenditures and charges to operating expenses the cost of current maintenance and repairs. Provisions for depreciation and amortization have been computed principally on the straight-line method for buildings and equipment. Rates used for depreciation are based principally on the following expected lives: buildings -- 15 to 30 years; equipment -- 3 to 7 years; leased barrier transfer machines -- 8 to 10 years; leased barriers -- 12 years; other -- 2 to 20 years and leasehold improvements – shorter of the economic life or term of the lease. All of the Company's long-lived asset groups are reviewed for impairment whenever events or changes in circumstances indicate that the carrying amount may not be recoverable. If the sum of the expected future cash flows is less than the carrying amount of the asset group, an impairment loss is recognized based upon the difference between the fair value of the asset and its carrying value. No impairments were recorded during the fiscal years ended August 31, 2014, 2013, and 2012. The cost and accumulated depreciation relating to assets retired or otherwise disposed of are eliminated from the respective accounts at the time of disposition. The resulting gain or loss is included in operating income in the consolidated statements of operations.

38
(11) Valuation of Goodwill and Identifiable Intangible Assets Goodwill represents the excess of the purchase price over the fair value of net assets acquired in a business combination. Acquired intangible assets are recognized separately from goodwill. Goodwill and intangible assets with indefinite useful lives are tested for impairment at least annually at August 31 and whenever triggering events or changes in circumstances indicate its carrying value may not be recoverable. Assessment of the potential impairment of goodwill and identifiable intangible assets is an integral part of the Company's normal ongoing review of operations. Testing for potential impairment of these assets is significantly dependent on numerous assumptions and reflects management's best estimates at a particular point in time. The dynamic economic environments in which the Company's businesses operate and key economic and business assumptions related to projected selling prices, market growth, inflation rates and operating expense ratios, can significantly affect the outcome of impairment tests. Estimates based on these assumptions may differ significantly from actual results. Changes in factors and assumptions used in assessing potential impairments can have a significant impact on the existence and magnitude of impairments, as well as the time in which such impairments are recognized. In testing goodwill for impairment, the Company has the option to first assess qualitative factors to determine whether the existence of events or circumstances leads to a determination that it is more likely than not (more than 50 percent) that the estimated fair value of a reporting unit is less than its carrying amount. A significant amount of judgment is involved in determining if an indicator of impairment has occurred. Such indicators include deterioration in general economic conditions, adverse changes in the markets in which an entity operates, increases in input costs that have negative effects on earnings and cash flows, or a trend of negative or declining cash flows over multiple periods, among others. If the Company elects to perform a qualitative assessment and determine that an impairment is more likely than not, the Company is then required to perform a quantitative impairment test, otherwise no further analysis is required. The Company also may elect not to perform the qualitative assessment and, instead, proceed directly to the quantitative impairment test. In fiscal 2014, in conjunction with the Company’s annual review for impairment, the Company performed a qualitative analysis of goodwill for each of the Company’s reporting units, which are the same as its operating segments, and did not identify any potential impairment. In assessing other intangible assets not subject to amortization for impairment, the Company has the option to perform a qualitative assessment to determine whether the existence of events or circumstances leads to a determination that it is more likely than not that the fair value of such an intangible asset is less than its carrying amount. If the Company determines that it is not more likely than not that the fair value of such an intangible asset is less than its carrying amount, then the Company is not required to perform any additional tests for assessing intangible assets for impairment. However, if the Company concludes otherwise or elects not to perform the qualitative assessment, the Company is then required to perform a quantitative impairment test that involves a comparison of the estimated fair value of the intangible asset with its carrying value. If the carrying value of the intangible asset exceeds its fair value, an impairment loss is recognized in an amount equal to that excess. In fiscal 2014, the Company performed a qualitative analysis of other intangible assets not subject to amortization and concluded there were no indicators of impairment. (12) Income Taxes Income taxes are accounted for utilizing the asset and liability method. Deferred tax assets and liabilities are recognized for the estimated future tax consequences attributable to differences between the financial statement carrying value of existing assets and liabilities and their respective tax bases. These expected future tax consequences are measured based on currently enacted tax rates. The effect of tax rate changes on deferred tax assets and liabilities is recognized in income during the period that includes the enactment date.

39
(13) Net Earnings per Share Basic net earnings per share is computed using the weighted-average number of common shares outstanding during the period. Diluted net earnings per share is computed using the weighted-average number of common shares outstanding plus dilutive potential common shares outstanding during the period. Employee stock options, nonvested shares and similar equity instruments granted by the Company are treated as potential common share equivalents outstanding in computing diluted net earnings per share. The Company’s diluted common shares outstanding reported in each period includes the dilutive effect of restricted stock units, in-the-money options, and performance stock units for which threshold performance conditions have been satisfied and is calculated based on the average share price for each fiscal period using the treasury stock method. Under the treasury stock method, the amount the employee must pay for exercising stock options, the amount of compensation cost for future service that the Company has not yet recognized, and the amount of excess tax benefits that would be recorded in additional paid-in-capital when exercised are assumed to be used to repurchase shares. (14) Derivative Instruments and Hedging Activities The Company uses certain financial derivatives to mitigate its exposure to volatility in interest rates and foreign currency exchange rates. All derivative instruments are recorded on the balance sheet at their respective fair values. The Company uses these derivative instruments only to hedge exposures in the ordinary course of business and does not invest in derivative instruments for speculative purposes. On the date a derivative contract is entered into, the Company may elect to designate the derivative as a fair value hedge, a cash flow hedge, or the hedge of a net investment in a foreign operation. The Company also formally assesses, both at the hedge’s inception and on an ongoing basis, whether the derivative that is used in the hedging transaction is effective. For those instruments that are designated as a cash flow hedge and meet certain documentary and analytical requirements to qualify for hedge accounting treatment, changes in the fair value for the effective portion are reported in other comprehensive income (“OCI”), net of related income tax effects, and are reclassified to the income statement when the effects of the item being hedged are recognized in the income statement. Changes in fair value of derivative instruments that qualify as hedges of a net investment in foreign operations are recorded as a component of accumulated currency translation adjustment in accumulated other comprehensive income (“AOCI”), net of related income tax effects. Changes in the fair value of undesignated hedges are recognized currently in earnings. All changes in derivative fair values due to ineffectiveness are recognized currently in income. The Company discontinues hedge accounting prospectively when it is determined that the derivative is no longer effective in offsetting changes in the cash flows of the hedged item, the derivative expires or is sold, terminated, or exercised, or management determines that designation of the derivative as a hedging instrument is no longer appropriate. In situations in which the Company does not elect hedge accounting or hedge accounting is discontinued and the derivative is retained, the Company carries or continues to carry the derivative at its fair value on the balance sheet and recognizes any subsequent changes in its fair value through earnings. The Company manages market and credit risks associated with its derivative instruments by establishing and monitoring limits as to the types and degree of risk that may be undertaken, and by entering into transactions with high-quality counterparties. As of August 31, 2014, the Company’s derivative counterparty had investment grade credit ratings. (15) Fair Value Measurements The Company’s disclosure of the fair value of assets and liabilities is based on a three-level hierarchy for fair value measurements based upon the transparency of inputs to the valuation of an asset or liability as of the measurement date. Inputs refers broadly to the assumptions that market participants would use in pricing the asset or liability, including assumptions about risk. The categorization within the valuation hierarchy is based upon the lowest level of input that is significant to the fair value measurement. Financial assets and liabilities carried at fair value will be classified and disclosed in one of the following three categories:
Level 1 – inputs to valuation techniques are quoted prices in active markets for identical assets or liabilities
Level 2 – inputs to the valuation techniques are other than quoted prices but are observable for the assets or liabilities, either directly or indirectly
Level 3 – inputs to the valuation techniques are unobservable for the assets or liabilities
40
(16) Treasury Stock When the Company repurchases its outstanding stock, it records the repurchased shares at cost as a reduction to shareholders’ equity. The weighted average cost method is utilized for share re-issuances. The difference between the cost and the re-issuance price is charged or credited to a “capital in excess of stated value – treasury stock” account to the extent that there is a sufficient balance to absorb the charge. If the treasury stock is sold for an amount less than its cost and there is not a sufficient balance in the capital in excess of stated value – treasury stock account, the excess is charged to retained earnings. (17) Contingencies The Company’s accounting for contingencies covers a variety of business activities including contingencies for legal exposures and environmental exposures. The Company accrues these contingencies when its assessments indicate that it is probable that a liability has been incurred and an amount can be reasonably estimated. The Company’s estimates are based on currently available facts and its estimates of the ultimate outcome or resolution. Actual results may differ from the Company’s estimates resulting in an impact, positive or negative, on earnings. (18) Environmental Remediation Liabilities Environmental remediation liabilities include costs directly associated with site investigation and clean up, such as materials, external contractor costs and incremental internal costs directly related to the remedy. The Company accrues the anticipated cost of environmental remediation when the obligation is probable and can be reasonably estimated. Estimates used to record environmental remediation liabilities are based on the Company’s best estimate of probable future costs based on site-specific facts and circumstances. Estimates of the cost for the likely remedy are developed using internal resources or by third-party environmental engineers or other service providers. The Company records the undiscounted environmental remediation liabilities that represent the points in the range of estimates that are most probable or the minimum amount when no amount within the range is a better estimate than any other amount. (19) Translation of Foreign Currency The Company’s portion of the assets and liabilities related to foreign investments are translated into U.S. dollars at the exchange rates in effect at the balance sheet date. Revenue and expenses are translated at the average rates of exchange prevailing during the year. Unrealized gains or losses are reflected within common shareholders’ equity as accumulated other comprehensive income or loss. B. NEW ACCOUNTING PRONOUNCEMENTS In May 2014, the FASB issued ASU No. 2014-09, Revenue from Contracts with Customers. The standard provides a single model for revenue arising from contracts with customers and supersedes current revenue recognition guidance. The ASU requires an entity to recognize the amount of revenue to which it expects to be entitled for the transfer of goods or services. The ASU will replace existing revenue recognition guidance in U.S. GAAP when it becomes effective. The effective date for ASU No. 2014-09 will be the first quarter of fiscal year 2018. Early adoption is not permitted. The guidance permits companies to either apply the requirements retrospectively to all prior periods presented, or apply the requirements in the year of adoption, through a cumulative adjustment. The Company is currently evaluating the impact the adoption will have on its consolidated financial statements and related disclosures. The Company has not yet selected a transition method, nor has it determined the effect of the standard on its ongoing financial reporting.

41
C. ACQUISITIONS In connection with business acquisitions, the Company records the estimated fair value of the identifiable assets acquired, liabilities assumed, goodwill, and any noncontrolling interest in the acquire, all determined as of the date of acquisition. In addition, the Company expenses all acquisition-related costs in the period in which the costs are incurred and the services received. Claude Laval Corporation On August 16, 2013, the Company acquired 100 percent of the outstanding common shares of Claude Laval Corporation (“CLC”), a California corporation that manufactures and distributes LAKOS® separators and filtration solutions for groundwater, agriculture, industrial and heat transfer markets, worldwide. Total consideration paid was $29.0 million which was financed with cash on hand. The allocation of purchase price for CLC was finalized in the first quarter of fiscal 2014. The allocation of purchase price for CLC below changed from the allocation of purchase price disclosed in the Company’s Annual Report on Form 10-K for the Company’s fiscal year ended August 31, 2013 because the closing balance sheet under the terms of the purchase agreement and the valuation of the identifiable assets acquired and liabilities assumed was finalized in November 2013. The Company determined the changes to be immaterial. The following table summarizes the consideration paid for CLC and the amounts of fair value of the assets acquired and liabilities assumed at the acquisition date.
$ in thousands Amount Identifiable assets acquired and liabilities assumed: Current assets $ 8,656 Property and equipment 7,867 Intangible assets 13,600 Other long-term assets 738 Current liabilities (1,808) Long-term debt (1,400) Other long-term liabilities (5,500) Total identifiable net assets acquired 22,153Goodwill 6,854 Total $ 29,007
The acquired intangible assets include amortizable intangible assets of $7.1 million and indefinite-lived intangible assets of $6.5 million related to tradenames. The amortizable intangible assets have a weighted-average useful life of approximately 8 years. The following table summarizes the identifiable intangible assets at fair value.
$ in thousands Weighted Average Useful
Life in Years Fair Value of Identifiable
Asset Intangible assets: Tradenames N/A $ 6,500 Patents 10.0 4,600 Customer relationships 5.0 1,600 Non-compete agreements 5.0 500 Other 1.3 400 Total intangible assets $ 13,600 Goodwill related to the acquisition of CLC primarily relates to intangible assets that do not qualify for separate recognition, including the experience and knowledge of CLC management, its assembled workforce, and its intellectual capital and specialization within the filtration solutions industry. Goodwill recorded in connection with this acquisition is non-deductible for income tax purposes. Pro forma information related to this acquisition was not included because the impact on the Company’s consolidated financial statements was not considered to be material.

42
D. NET EARNINGS PER SHARE The following table shows the computation of basic and diluted net earnings per share for the years ended August 31, 2014, 2013 and 2012:
For the years ended August 31, ($ and shares in thousands, except per share amounts) 2014 2013 2012 Numerator: Net earnings $ 51,512 $ 70,570 $ 43,277 Denominator: Weighted average shares outstanding 12,832 12,830 12,704 Diluted effect of stock equivalents 50 71 106 Weighted average shares outstanding assuming dilution 12,882 12,901 12,810 Basic net earnings per share $ 4.01 $ 5.50 $ 3.41Diluted net earnings per share $ 4.00 $ 5.47 $ 3.38 Certain stock options and restricted stock units were excluded from the computation of diluted net earnings per share because their effect would have been anti-dilutive. Performance stock units are excluded from the calculation of dilutive potential common shares until the threshold performance conditions have been satisfied. The following table shows the securities excluded from the computation of earnings per share because their effect would have been anti-dilutive:
For the years ended August 31, Units and options in thousands 2014 2013 2012 Restricted stock units 3 3 3Stock options 44 29 29
E. ACCUMULATED OTHER COMPREHENSIVE LOSS Accumulated other comprehensive loss is included in the accompanying Consolidated Balance Sheets in the shareholders’ equity section, and consists of the following components:
August 31, $ in thousands 2014 2013 Accumulated other comprehensive loss: Defined benefit pension plan, net of tax of $1,524 and $1,396 $ (2,497) $ (2,287) Foreign currency translation, net of hedging activities, net of tax of $1,688 and $1,588 296 (29)Total accumulated other comprehensive loss $ (2,201) $ (2,316)
The following is a rollfoward of the balances in accumulated other comprehensive income (loss), net of tax.
Defined benefit Unrealized Foreign currency Accumulated other pension plan gain (loss) on translation comprehensive $ in thousands adjustment cash flow hedges adjustment loss Balance at August 31, 2012 $ (2,547) (53) 1,723 (877)Current-period change 260 53 (1,752) (1,439)Balance at August 31, 2013 (2,287) - (29) (2,316)Current-period change (210) - 325 115 Balance at August 31, 2014 $ (2,497) $ - $ 296 $ (2,201)

43
F. INCOME TAXES For financial reporting purposes earnings before income taxes include the following components:
For the years ended August 31, $ in thousands 2014 2013 2012 United States $ 70,066 $ 99,781 $ 57,884 Foreign 8,589 7,526 7,224 $ 78,655 $ 107,307 $ 65,108
Significant components of the income tax provision are as follows:
For the years ended August 31, $ in thousands 2014 2013 2012 Current: Federal $ 29,015 $ 33,498 $ 21,694 State 2,176 2,303 1,026 Foreign 4,147 4,173 2,979Total current 35,338 39,974 25,699Deferred: Federal (6,936) (1,554) (3,829) State (346) (178) 614 Foreign (913) (1,505) (653)Total deferred (8,195) (3,237) (3,868) Total income tax provision $ 27,143 $ 36,737 $ 21,831 Total income tax provision resulted in effective tax rates differing from that of the statutory United States Federal income tax rates. The reasons for these differences are:
For the years ended August 31, $ in thousands 2014 2013 2012 Amount % Amount % Amount % U.S. statutory rate $ 27,529 35.0 $ 37,558 35.0 $ 22,788 35.0 State and local taxes, net of federal tax benefit 1,067 1.4 1,365 1.3 1,337 2.0 Foreign tax rate differences (116) (0.1) (103) (0.1) (338) (0.5)Domestic production activities deduction (2,170) (2.8) (2,638) (2.5) (1,900) (2.9)Research and development and fuel tax credits (89) (0.1) (289) (0.3) (105) (0.2)Other 922 1.1 844 0.8 49 0.1 Effective rate $ 27,143 34.5 $ 36,737 34.2 $ 21,831 33.5

44
Deferred income taxes reflect the net tax effects of temporary differences between the carrying amounts of assets and liabilities for financial reporting purposes and the amounts used for income tax purposes. Significant components of the Company's deferred tax assets and liabilities are as follows:
August 31, $ in thousands 2014 2013 Deferred tax assets: Deferred rental revenue $ 2,812 $ 835 Employee benefits liability 1,256 1,191 Net operating loss carry forwards 433 21 Defined benefit pension plan 1,524 1,396 Share-based compensation 2,106 2,299 State tax credits 87 98 Inventory 1,396 909 Warranty 3,354 2,449 Vacation 191 182 Accrued expenses and allowances 10,955 8,043Total deferred tax assets $ 24,114 $ 17,423 Deferred tax liabilities: Intangible assets (10,247) (11,160) Property, plant and equipment (6,919) (8,493) Inventory (121) (89) Other (980) (229)Total deferred tax liabilities (18,267) (19,971) Net deferred tax assets (liabilities) $ 5,847 $ (2,548) In assessing the ability to realize deferred tax assets, management considers whether it is more likely than not that some portion or all of the deferred tax assets will not be realized. The ultimate realization of deferred tax assets is dependent upon the generation of future taxable income during the periods in which those temporary differences become deductible. Management considers the scheduled reversal of deferred tax liabilities, projected future taxable income, and tax planning strategies in making this assessment. Based upon the level of historical taxable income and projections for future taxable income over the periods in which the deferred tax assets are deductible, management believes it is more likely than not that the Company will realize the benefits of these deductible differences. Accordingly, a valuation allowance for deferred tax assets at August 31, 2014 and 2013 has not been established.
The Company does not intend to repatriate earnings of its foreign subsidiaries and accordingly, has not provided a U.S. deferred income tax liability on these undistributed earnings that are indefinitely reinvested. The Company would recognize a deferred income tax liability if the Company were to determine that such earnings are no longer indefinitely reinvested. At August 31, 2014, undistributed earnings of the Company’s foreign subsidiaries amounted to approximately $21.7 million. Determination of the estimated amount of unrecognized deferred tax liability on these undistributed earnings is not practicable.
The Company recognizes tax benefits only for tax positions that are more likely than not to be sustained upon examination by tax authorities. The amount recognized is measured as the largest amount of benefit that is greater than 50 percent likely to be realized upon settlement. Unrecognized tax benefits are tax benefits claimed in the Company’s tax returns that do not meet these recognition and measurement standards.

45
A reconciliation of changes in pre-tax unrecognized tax benefits is as follows:
August 31, $ in thousands 2014 2013 Unrecognized Tax Benefits at September 1 $ 902 $ 871
Increases for positions taken in current year 50 57Increases for positions taken in prior years 2,721 239Settlements with taxing authorities - (6)Reduction resulting from lapse of applicable statute of limitations (62) (269)Other increases (decreases) - 10
Unrecognized Tax Benefits at August 31 $ 3,611 $ 902 The net amount of unrecognized tax benefits at August 31, 2014 and 2013 that, if recognized, would impact the Company’s effective tax rate was $1.0 million and $0.9 million, respectively. Recognition of these tax benefits would have a favorable impact on the Company’s effective tax rate. The Company recognizes accrued interest and penalties related to unrecognized tax benefits in income tax expense. Total accrued pre-tax liabilities for interest and penalties included in the unrecognized tax benefits liability were $0.9 million and $0.5 million for the years ended August 31, 2014 and 2013, respectively. The Company files income tax returns in the United States and in state, local, and foreign jurisdictions. The Company is no longer subject to examination by tax authorities in most jurisdictions for years prior to 2011. The U.S. Internal Revenue Service (IRS) began an income tax audit for the year 2011 in 2014. At August 31, 2014, the Company does not believe the outcome of the IRS examination is likely to be material to our consolidated financial statements. While it is expected that the amount of unrecognized tax benefits will change in the next twelve months as a result of the expiration of statutes of limitations, the Company does not expect this change to have a significant impact on its results of operations or financial position. G. INVENTORIES
August 31, ($ in thousands) 2014 2013 Raw materials and supplies $ 19,953 $ 19,369Work in process 9,990 5,665Finished goods and purchased parts 48,300 50,038Total inventory value before LIFO adjustment 78,243 75,072Less adjustment to LIFO value (6,547) (6,465)Inventories, net $ 71,696 $ 68,607

46
H. PROPERTY, PLANT AND EQUIPMENT
August, 31 $ in thousands 2014 2013 Operating property, plant and equipment: Land $ 3,315 $ 3,342 Buildings 38,573 34,066 Equipment 91,254 85,689 Other 14,946 9,037Total operating property, plant and equipment 148,088 132,134Accumulated depreciation (83,674) (76,508)Total operating property, plant and equipment, net $ 64,414 $ 55,626
Property held for lease: Machines 4,395 3,965 Barriers 17,213 17,323Total property held for lease $ 21,608 $ 21,288Accumulated depreciation (13,565) (11,850)Total property held for lease, net $ 8,043 $ 9,438
Property, plant and equipment, net $ 72,457 $ 65,064
Depreciation expense was $10.8 million, $9.8 million and $9.6 million for the years ended August 31, 2014, 2013, and 2012, respectively.
I. GOODWILL AND OTHER INTANGIBLE ASSETS The carrying amount of goodwill by reportable segment for the year ended August 31, 2014 and 2013 is as follows:
$ in thousands Irrigation Infrastructure Total Balance as of August 31, 2012 $ 13,476 16,485 29,961 Acquisition of CLC 7,257 - 7,257 Foreign currency translation (66) 262 196Balance as of August 31, 2013 20,667 $ 16,747 $ 37,414 Finalization of CLC acquisition (403) - (403) Foreign currency translation 29 (19) 10Balance as of August 31, 2014 $ 20,293 $ 16,728 $ 37,021
The components of the Company’s identifiable intangible assets at August 31, 2014 and 2013 are included in the table below.
August 31, 2014 2013 Weighted Gross Weighted Gross Average Carrying Accumulated Average Carrying Accumulated $ in thousands Years Amount Amortization Years Amount AmortizationAmortizable intangible assets: Patents 13.0 $ 30,282 $ (14,687) 12.8 $ 30,266 $ (12,364) Customer relationships 7.4 7,932 (5,304) 7.4 8,034 (4,238) Non-compete agreements 5.6 1,336 (852) 5.6 1,331 (611) Other 1.6 517 (366) 1.7 517 (54)Unamortizable intangible assets: Tradenames N/A 13,122 - N/A 13,126 -Total 10.0 $ 53,189 $ (21,209) 10.0 $ 53,274 $ (17,267)

47
Amortization expense for amortizable intangible assets was $4.0 million, $2.8 million and $2.9 million for 2014, 2013, and 2012, respectively. Future estimated amortization of intangible assets for the next five years is as follows:
Fiscal Years $ in thousands 2015 $ 3,414
2016 3,003 2017 2,865 2018 2,674 2019 2,036 Thereafter 4,866 $ 18,858
The Company updated its impairment evaluation of goodwill and intangible assets with indefinite useful lives at August 31, 2014. No impairment losses were indicated as a result of the annual impairment testing for fiscal years 2014, 2013 and 2012. The Company does not include a roll forward of impairment losses because the Company has not had an impairment loss. J. OTHER CURRENT LIABILITIES
August 31, $ in thousands 2014 2013 Other current liabilities: Compensation and benefits $ 16,622 $ 18,471 Warranty 9,331 6,695 Deferred revenues 8,979 4,790 Income tax liabilities 8,922 3,550 Customer deposits 7,366 4,580 Dealer related liabilities 7,103 7,134 Other 15,620 14,596Total other current liabilities $ 73,943 $ 59,816
K. CREDIT ARRANGEMENTS The Company has no outstanding long-term debt as of August 31, 2014 and 2013. The Company’s credit arrangements consisted of the following: Credit Facility Agreement The Company’s wholly-owned subsidiary, Lindsay International Holdings B.V., has an unsecured $5.0 million Credit Facility Agreement with Coöperatieve Centrale Raiffeisen-Boerenleenbank B.A. (“Rabobank”), which was entered into on August 22, 2014 (the “Credit Facility Agreement”). The borrowings from the Credit Facility Agreement may primarily be used for working capital purposes and funding acquisitions. There were no borrowings outstanding on the Credit Facility Agreement at August 31, 2014. Borrowings under the Credit Facility Agreement bear interest at a rate equal to LIBOR plus 115 basis points (1.31 percent at August 31, 2014). The Company also pays an annual commitment fee of 0.25 percent on the unused portion of the Credit Facility Agreement. Unpaid principal and interest is due by August 21, 2015.

48
Revolving Credit Agreement The Company has an unsecured $30.0 million Revolving Credit Note and Credit Agreement with Wells Fargo Bank, N.A., which was amended on January 22, 2014 to revise letter of credit expiry dates and cash collateralization procedures (the “Revolving Credit Agreement”). The borrowings from the Revolving Credit Agreement may primarily be used for working capital purposes and funding acquisitions. At August 31, 2014 and 2013, the Company had no outstanding borrowings on the Revolving Credit Agreement. The amount of borrowings available at any time under the Revolving Credit Agreement is reduced by the amount of standby letters of credit then outstanding. At August 31, 2014, the Company had the ability to borrow $24.5 million under this facility, after consideration of standby letters of credit of $5.5 million. Borrowings under the Revolving Credit Agreement bear interest at a rate equal to LIBOR plus 90 basis points (1.06 percent at August 31, 2014), subject to adjustment as set forth in the Revolving Credit Agreement. Interest is paid on a monthly to quarterly basis depending on loan type. The Company also pays an annual commitment fee of 0.25 percent on the unused portion of the Revolving Credit Agreement. Unpaid principal and interest is due by February 13, 2016. The credit agreements contain certain covenants relating to the Company’s financial condition. Upon the occurrence of any event of default of these covenants, including a change in control of the Company, all amounts due thereunder may be declared to be immediately due and payable. At August 31, 2014 and 2013, the Company was in compliance with all loan covenants.
L. FINANCIAL DERIVATIVES
Fair Values of Derivative Instruments Asset (Liability) August 31, August 31, $ in thousands Balance Sheet Location 2014 2013 Derivatives designated as hedging instruments: Foreign currency forward contracts Other current assets $ 900 $ 151 Foreign currency forward contracts Other current liabilities (240) (258)Total derivatives designated as hedging instruments $ 660 $ (107)
Derivatives not designated as hedging instruments: Foreign currency forward contracts Other current assets - 78 Foreign currency forward contracts Other current liabilities (160) (33)Total derivatives not designated as hedging $ (160) $ 45
In addition, accumulated other comprehensive income (“AOCI”) included realized and unrealized after-tax gains of $2.0 million and $2.0 million at August 31, 2014 and 2013, respectively, related to derivative contracts designated as hedging instruments. Net Investment Hedging Relationships
Amount of Gain/(Loss) Recognized
in OCI on Derivatives For the years ended August 31, $ in thousands 2014 2013 2012 Foreign currency forward contracts, net of tax expense (benefit) of $16, ($286), and $1,023 $ (53) $ (357) $ 1,677

49
During fiscal 2014, 2013 and 2012, the Company settled Euro foreign currency forward contracts resulting in after-tax net (losses) gains of ($0.5 million), ($0.6 million) and $1.8 million, respectively, which were included in OCI as part of a currency translation adjustment. There were no amounts recorded in the consolidated statement of operations related to ineffectiveness of Euro foreign currency forward contracts for the years ended August 31, 2014, 2013 and 2012. Accumulated currency translation adjustment in AOCI at August 31, 2014, 2013 and 2012 reflected realized and unrealized after-tax gains of $2.0 million, $2.0 million and $2.4 million, respectively. At August 31, 2014 and 2013, the Company had outstanding Euro foreign currency forward contracts to sell 28.9 million Euro and 29.2 million Euro, respectively, at fixed prices to settle during the next fiscal quarter. At August 31, 2014 and 2013, the Company also had an outstanding foreign currency forward contract to sell 43.0 million South African Rand at fixed prices to settle during the next fiscal quarter. The Company’s foreign currency forward contracts qualify as hedges of a net investment in foreign operations. Derivatives Not Designated as Hedging Instruments
In order to reduce exposures related to changes in foreign currency exchange rates, the Company, at times, may enter into forward exchange or option contracts for transactions denominated in a currency other than the functional currency for certain of the Company’s operations. This activity primarily relates to economically hedging against foreign currency risk in purchasing inventory, sales of finished goods, and future settlement of foreign denominated assets and liabilities. The Company may choose whether or not to designate these contracts as hedges. For those contracts not designated, changes in fair value are recognized currently in the income statement. At August 31, 2014 and 2013, the Company had $4.9 million and $4.0 million, respectively, of U.S. dollar equivalent of foreign currency forward contracts outstanding. M. FAIR VALUE MEASUREMENTS The following table presents the Company’s financial assets and liabilities measured at fair value based upon the level within the fair value hierarchy in which the fair value measurements fall, as of August 31, 2014 and 2013, respectively:
August 31, 2014 $ in thousands Level 1 Level 2 Level 3 Total Cash and cash equivalents $ 171,842 $ - $ - $ 171,842Derivative assets $ - $ 900 $ - $ 900Derivative liabilities $ - $ (400) $ - $ (400) August 31, 2013 $ in thousands Level 1 Level 2 Level 3 Total Cash and cash equivalents $ 151,927 $ - $ - $ 151,927Derivative assets $ - $ 229 $ - $ 229Derivative liabilities $ - $ (291) $ - $ (291) The Company has no outstanding long-term debt as of August 31, 2014 and 2013. There were no required fair value adjustments for goodwill, intangible assets and other long-lived assets for the years ended August 31, 2014 and 2013. No impairment losses were indicated as a result of the annual impairment testing for fiscal years 2014, 2013, and 2012.

50
N. COMMITMENTS AND CONTINGENCIES In the ordinary course of its business operations, the Company is involved, from time to time, in commercial litigation, employment disputes, administrative proceedings and other legal proceedings. The Company has established accruals for certain proceedings based on an assessment of probability of loss. The Company believes that any potential loss in excess of the amounts accrued would not have a material effect on the business or its consolidated financial statements. Such proceedings are exclusive of environmental remediation matters which are discussed separately below. Environmental Remediation In 1992, the Company entered into a consent decree with the U.S. Environmental Protection Agency (the “EPA”) in which the Company committed to remediate environmental contamination of the groundwater that was discovered in 1982 through 1990 at and adjacent to its Lindsay, Nebraska facility (the “site”). The site was added to the EPA’s list of priority superfund sites in 1989. Between 1993 and 1995, remediation plans for the site were approved by the EPA and fully implemented by the Company. Since 1998, the primary remaining contamination at the site has been the presence of volatile organic compounds in the soil and groundwater. To date, the remediation process has consisted primarily of drilling wells into the aquifer and pumping water to the surface to allow these contaminants to be removed by aeration. In fiscal 2012, the Company undertook an investigation to assess further potential site remediation and containment actions. In connection with the receipt of preliminary results of this investigation and other evaluations, the Company estimated that it would incur $7.2 million in remediation of source area contamination and operating costs and accrued that undiscounted amount. The expense was included within general and administrative expense in the consolidated statements of operations. The EPA has not approved the Company’s remediation plan. In addition to the source area noted above, the Company has determined that volatile organic compounds also exist under one of the manufacturing buildings on the site. Due to the location, the Company has not yet determined the extent of these compounds or whether they are contributing, if at all, to groundwater contamination. Based on the current stage of discussions with the EPA and the uncertainty of the remediation actions that may be required with respect to this affected area, if any, the Company believes that meaningful estimates of costs or range of costs cannot currently be made and accordingly have not been accrued. In fiscal 2013, the Company and the EPA conducted a periodic five-year review of the status of the remediation of the contamination of the site. The Company intends to complete additional investigation of the soil and groundwater on the site during the second half of calendar 2014. Based on this investigation, the Company will then assess revisions to its remediation plan and expects to meet with the EPA in the first half of fiscal 2015 to determine how to proceed. During fiscal 2014, the Company did not accrue any additional incremental costs related to environmental remediation liabilities. The Company accrues the anticipated cost of investigation and remediation when the obligation is probable and can be reasonably estimated. Although the Company has accrued all reasonably estimable costs associated with the site, it anticipates there could be revisions to the current remediation plan as well as additional testing and environmental monitoring as part of the Company’s ongoing discussions with the EPA regarding the development and implementation of the remedial action plans. Any revisions could be material to the operating results of any fiscal quarter or fiscal year. The Company does not expect such additional expenses would have a material adverse effect on its liquidity or financial condition. The following table summarizes the undiscounted environmental remediation liability classifications included in the balance sheet as of August 31, 2014 and 2013:
Environmental Remediation Liabilities $ in thousands August 31, August 31, Balance Sheet Location 2014 2013
Other current liabilities $ 1,370 $ 1,740Other noncurrent liabilities 5,025 5,200Total environmental remediation liabilities $ 6,395 $ 6,940
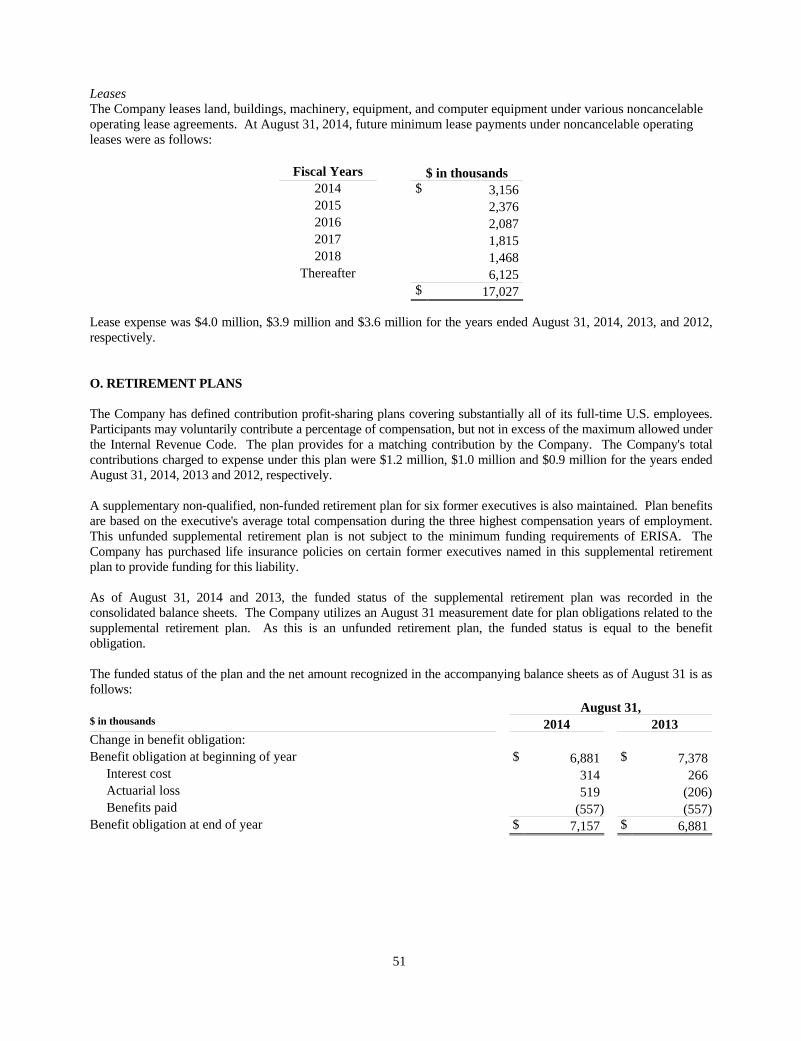
51
Leases The Company leases land, buildings, machinery, equipment, and computer equipment under various noncancelable operating lease agreements. At August 31, 2014, future minimum lease payments under noncancelable operating leases were as follows:
Fiscal Years $ in thousands 2014 $ 3,156 2015 2,376 2016 2,087 2017 1,815 2018 1,468 Thereafter 6,125 $ 17,027
Lease expense was $4.0 million, $3.9 million and $3.6 million for the years ended August 31, 2014, 2013, and 2012, respectively. O. RETIREMENT PLANS The Company has defined contribution profit-sharing plans covering substantially all of its full-time U.S. employees. Participants may voluntarily contribute a percentage of compensation, but not in excess of the maximum allowed under the Internal Revenue Code. The plan provides for a matching contribution by the Company. The Company's total contributions charged to expense under this plan were $1.2 million, $1.0 million and $0.9 million for the years ended August 31, 2014, 2013 and 2012, respectively. A supplementary non-qualified, non-funded retirement plan for six former executives is also maintained. Plan benefits are based on the executive's average total compensation during the three highest compensation years of employment. This unfunded supplemental retirement plan is not subject to the minimum funding requirements of ERISA. The Company has purchased life insurance policies on certain former executives named in this supplemental retirement plan to provide funding for this liability. As of August 31, 2014 and 2013, the funded status of the supplemental retirement plan was recorded in the consolidated balance sheets. The Company utilizes an August 31 measurement date for plan obligations related to the supplemental retirement plan. As this is an unfunded retirement plan, the funded status is equal to the benefit obligation. The funded status of the plan and the net amount recognized in the accompanying balance sheets as of August 31 is as follows:
August 31, $ in thousands 2014 2013 Change in benefit obligation: Benefit obligation at beginning of year $ 6,881 $ 7,378 Interest cost 314 266 Actuarial loss 519 (206) Benefits paid (557) (557)Benefit obligation at end of year $ 7,157 $ 6,881

52
Amounts recognized in the statement of financial position consist of:
August 31, $ in thousands 2014 2013 Other current liabilities $ 557 $ 557Pension benefit liabilities 6,600 6,324Net amount recognized $ 7,157 $ 6,881
The before-tax amounts recognized in accumulated other comprehensive loss consists of:
August 31, $ in thousands 2014 2013 Net actuarial loss $ (4,021) $ (3,683)
For the years ended August 31, 2014 and 2013, the Company assumed a discount rate of 4.00 percent and 4.75 percent, respectively, for the determination of the liability. The assumptions used to determine benefit obligations and costs are selected based on current and expected market conditions. The discount rate is based on a hypothetical portfolio of long-term corporate bonds with cash flows approximating the timing of expected benefit payments. For the years ended August 31, 2014, 2013 and 2012, the Company assumed a discount rate of 4.75 percent, 3.75 percent and 5.00 percent, respectively, for the determination of the net periodic benefit cost. The components of the net periodic benefit cost for the supplemental retirement plan are as follows:
For the years ended August 31, $ in thousands 2014 2013 2012 Interest cost $ 314 $ 266 $ 325Net amortization and deferral 181 212 166Total $ 495 $ 478 $ 491 The estimated actuarial loss for the supplemental retirement plan that will be amortized, on a pre-tax basis, from accumulated other comprehensive loss into net periodic benefit cost during fiscal 2015 will be $0.2 million.
The Company’s future annual contributions to the supplemental retirement plan will be equal to expected net benefit payments since the plan is unfunded. The following net benefit payments are expected to be paid:
Fiscal Years $ in thousands 2015 $ 557 2016 540 2017 532 2018 525 2019 517 Thereafter 4,486 $ 7,157

53
P. WARRANTIES Product Warranties The Company generally warrants its products against certain manufacturing and other defects. These product warranties are provided for specific periods and/or usage of the product. The accrued product warranty costs are for a combination of specifically identified items and other incurred, but not identified, items based primarily on historical experience of actual warranty claims. This reserve is classified within other current liabilities. The following tables provide the changes in the Company’s product warranties:
For the years ended August 31, $ in thousands 2014 2013 Warranties: Product warranty accrual balance, beginning of period $ 6,695 $ 4,848 Liabilities accrued for warranties during the period 6,428 6,938 Warranty claims paid during the period (3,792) (5,091)Product warranty accrual balance, end of period $ 9,331 $ 6,695
Warranty costs were $6.4 million, $6.9 million, and $4.9 million for the fiscal years ended August 31, 2014, 2013 and 2012, respectively. Q. INDUSTRY SEGMENT INFORMATION The Company manages its business activities in two reportable segments: Irrigation and Infrastructure. The accounting policies of the two reportable segments are the same as those described in Note A, Description of Business and Significant Accounting Policies. The Company evaluates the performance of its reportable segments based on segment sales, gross profit, and operating income, with operating income for segment purposes excluding unallocated corporate general and administrative expenses, interest income, interest expense, other income and expenses, and income taxes. Operating income for segment purposes does include general and administrative expenses, selling expenses, engineering and research expenses and other overhead charges directly attributable to the segment. There are no inter-segment sales.
Irrigation This reporting segment includes the manufacture and marketing of center pivot, lateral move, and hose reel irrigation systems as well as various water pumping stations, controls, and filtration solutions. The irrigation reporting segment consists of four operating segments that have similar economic characteristics and meet the aggregation criteria, including similar products, production processes, type or class of customer and methods for distribution.
Infrastructure This reporting segment includes the manufacture and marketing of moveable barriers, specialty barriers, crash cushions and end terminals, and road marking and road safety equipment; the manufacturing and selling of large diameter steel tubing and railroad signals and structures; and providing outsourced manufacturing and production services. The infrastructure reporting segment consists of one operating segment. The Company has no single major customer representing 10 percent or more of its total revenues during fiscal 2014, 2013, or 2012.

54
Summarized financial information concerning the Company’s reportable segments is shown in the following tables:
$ in thousands 2014 2013 2012 Operating revenues: Irrigation $ 539,943 $ 625,996 $ 475,299 Infrastructure 77,990 64,852 75,956Total operating revenues $ 617,933 $ 690,848 $ 551,255 Operating income: Irrigation $ 91,697 $ 125,395 $ 80,259 Infrastructure 3,511 (811) (11)Segment operating income $ 95,208 $ 124,584 $ 80,248Unallocated general and administrative expenses (16,850) (17,523) (14,738)Interest and other income (expense), net 297 246 (402)Earnings before income taxes $ 78,655 $ 107,307 $ 65,108 Total Capital Expenditures: Irrigation $ 15,534 $ 10,687 $ 7,942 Infrastructure 2,181 449 1,948 $ 17,715 $ 11,136 $ 9,890Total Depreciation and Amortization: Irrigation $ 9,494 $ 7,147 $ 6,959 Infrastructure 5,299 5,453 5,509 $ 14,793 $ 12,600 $ 12,468
Total Assets: Irrigation $ 407,447 $ 391,527 $ 303,741 Infrastructure 119,104 120,769 111,790 $ 526,551 $ 512,296 $ 415,531
Summarized financial information concerning the Company’s geographical areas is shown in the following tables.
For the years ended August 31, $ in thousands 2014 2013 2012 Revenues % of Total Revenues % of Total Revenues % of TotalUnited States $ 377,652 61 $ 428,929 62 $ 354,649 64International 240,281 39 261,919 38 196,606 36Total Revenues $ 617,933 100 $ 690,848 100 $ 551,255 100
For the years ended August 31, $ in thousands 2014 2013 2012
Long-Lived Tangible Assets
% of Total
Long-Lived Tangible Assets
% of Total
Long-Lived Tangible Assets
% of TotalUnited States $ 55,378 76 $ 53,894 83 $ 45,100 80International 17,079 24 11,170 17 11,080 20Total Long-Lived Assets $ 72,457 100 $ 65,064 100 $ 56,180 100

55
R. SHARE BASED COMPENSATION
Share Based Compensation Program Share based compensation is designed to reward employees for their long-term contributions to the Company and provide incentives for them to remain with the Company. The number and frequency of share grants are based on competitive practices, operating results of the Company, and individual performance. As of August 31, 2014, the Company’s share-based compensation plan was the 2010 Long-Term Incentive Plan (the “2010 Plan”). The 2010 Plan was approved by the shareholders of the Company, and became effective on January 25, 2010, and replaced the Company’s 2006 Long Term Incentive Plan. At August 31, 2014 the Company had share based awards outstanding under its 2001, 2006 and 2010 Long-Term Incentive Plans. The 2010 Plan provides for awards of stock options, restricted shares, restricted stock units, stock appreciation rights, performance shares and performance stock units to employees and non-employee directors of the Company. The maximum number of shares as to which stock awards may be granted under the 2010 Plan is 435,000 shares, exclusive of any forfeitures from the 2001 and 2006 Long Term Incentive Plans. At August 31, 2014, 153,929 shares of common stock (including forfeitures from prior plans) remained available for issuance under the 2010 Plan. All stock awards will be counted against the 2010 Plan in a 1 to 1 ratio. If options, restricted stock units or performance stock units awarded under the 2006 Plan or the 2001 Plan terminate without being fully vested or exercised, those shares will be available again for grant under the 2010 Plan. The 2010 Plan also limits the total awards that may be made to any individual. Share Based Compensation Information The following table summarizes share-based compensation expense for the fiscal years ended August 31, 2014, 2013 and 2012:
For the years ended August 31, $ in thousands 2014 2013 2012 Share-based compensation expense included in cost of operating revenues $ 205 $ 214 $ 225 Research and development 135 233 189Sales and marketing 570 547 524General and administrative 3,297 3,579 3,001Share-based compensation expense included in operating expenses 4,002 4,359 3,714Total share-based compensation expense 4,207 4,573 3,939Tax benefit (1,594) (1,733) (1,493)Share-based compensation expense, net of tax $ 2,613 $ 2,840 $ 2,446
As of August 31, 2014, there was $5.1 million pre-tax of total unrecognized compensation cost related to nonvested share-based compensation arrangements which is expected to be recognized over a weighted-average period of 1.7 years.
Stock Options – Stock option awards granted under the 2010 Plan have an exercise price equal to the closing price on the date of grant, expire no later than ten years from the date of grant and vest over a four-year period at 25 percent per year. The fair value of stock option awards is estimated using the Black-Scholes option pricing model. The table below shows the annual weighted-average assumptions used for valuation purposes.
Grant Year Weighted-Average Assumptions Fiscal 2014 Fiscal 2013 Risk-free interest rate 1.9% 1.2%Dividend yield 0.7% 0.6%Expected life (years) 7 7Volatility 55.2% 56.3%Weighted-average grant-date fair value of options granted $ 40.40 $ 40.09

56
The risk-free rate is based on the U.S. Treasury yield curve in effect at the time of grant; the dividend yield is calculated as the ratio of dividends paid per share of common stock to the stock price on the date of grant; the expected life is based on historical and expected exercise behavior; and volatility is based on the historical volatility of the Company’s stock price over the expected life of the option.
The following table summarizes information about stock options outstanding as of and for the years ended August 31, 2014, 2013 and 2012:
Number of stock options
Average Exercise
Price
Average Remaining
Contractual Term (years)
Aggregate Intrinsic
Value ('000s)Stock options outstanding at August 31, 2012 146,298 $ 30.97 3.9 $ 5,031 Granted 24,684 $ 75.68 Exercised (89,390) $ 22.77 $ 4,960 Forfeitures (2,454) $ 67.03 Stock options outstanding at August 31, 2013 79,138 $ 53.06 6.4 $ 1,817 Granted 25,394 $ 76.39 Exercised (15,590) $ 29.21 $ 853 Forfeitures (2,319) $ 67.55 Stock options outstanding at August 31, 2014 86,623 $ 63.80 7.3 $ 1,211
Exercisable at August 31, 2012 112,987 $ 22.97 2.4 $ 4,789Exercisable at August 31, 2013 31,927 $ 32.70 3.0 $ 1,383Exercisable at August 31, 2014 30,130 $ 49.55 5.3 $ 851 There were 13,793 and 8,330 outstanding stock options that vested during the fiscal years ended August 31, 2014 and 2013, respectively. There were no outstanding stock options that vested during the fiscal year ended August 31, 2012. Additional information regarding stock option exercises is summarized in the table below.
For the years ended August 31, $ in thousands 2014 2013 2012 Intrinsic value of stock options exercised $ 853 $ 4,960 $ 971Cash received from stock option exercises $ 455 $ 2,036 $ 567Tax benefit realized from stock option exercises $ 317 $ 1,817 $ 368Aggregate grant-date fair value of stock options vested $ 34.89 $ 31.04 $ N/A Restricted stock units - The restricted stock units granted to employees and directors under the 2010 Plan have a grant date fair value equal to the fair market value of the underlying stock on the grant date less present value of expected dividends. The restricted stock units granted to employees vest over a three-year period at approximately 33 percent per year. The restricted stock units granted to non-employee directors generally vest over a nine-month period.

57
The following table summarizes information about restricted stock units as of and for the years ended August 31, 2014, 2013 and 2012:
Number of restricted stock units
Weighted-Average Grant-Date Fair Value
Restricted stock units outstanding at August 31, 2012 67,535 $ 54.35 Granted 30,551 77.46 Vested (37,534) 51.82 Forfeited (3,121) 65.52Restricted stock units outstanding at August 31, 2013 57,431 $ 68.06 Granted 35,450 76.46 Vested (31,204) 67.49 Forfeited (2,524) 70.07Restricted stock units outstanding at August 31, 2014 59,153 $ 73.40
Restricted stock units are generally settled with the issuance of shares with the exception of certain restricted stock units awarded to internationally-based employees that are settled in cash. At August 31, 2014, 2013 and 2012, outstanding restricted stock units included 5,289, 4,496 and 4,873 units, respectively, that will be settled in cash. The vesting date fair value of restricted stock units that vested was $2.1 and $1.9 million for each of the years ended August 31, 2014 and 2013, respectively.
Performance stock units - The performance stock units granted to employees under the 2010 Plan have a grant date fair value equal to the fair market value of the underlying stock on the grant date less present value of expected dividends. The performance stock units granted to employees cliff vest after a three-year period and a specified number of shares of common stock will be awarded under the terms of the performance stock units, if performance measures relating to revenue growth and a return on net assets are achieved. The table below summarizes the status of the Company’s performance stock units as of and for the year ended August 31, 2014, 2013 and 2012:
Number of performance stock units
Weighted-Average Grant-Date Fair Value
Performance stock units outstanding at August 31, 2012 79,024 $ 45.32 Granted 13,072 74.31 Vested (36,634) 32.81 Forfeited (2,663) 60.65Performance stock units outstanding at August 31, 2013 52,799 $ 60.41 Granted 13,434 74.84 Vested (23,454) 55.45 Forfeited (2,027) 64.57Performance stock units outstanding at August 31, 2014 40,752 $ 67.81
In connection with the performance stock units, the performance goals are based upon revenue growth and a return on net assets during the performance period. The awards actually earned will range from zero to two hundred percent of the targeted number of performance stock units and will be paid in shares of common stock. Shares earned will be distributed upon vesting on the first day of November following the end of the three-year performance period. The Company is accruing compensation expense based on the estimated number of shares expected to be issued utilizing the most current information available to the Company at the date of the financial statements. If defined performance goals are not met, no compensation cost will be recognized and any previously recognized compensation expense will be reversed. In fiscal 2014 and fiscal 2013, performance stock units that vested represented 46,908 and 56,944, respectively, of actual shares of common stock issued. No shares vested in fiscal 2012 as performance measures were not met. The vesting date fair value of performance stock units that vested was $2.6 million and $1.9 million for the year ended August 31, 2014 and 2013, respectively.

58
S. SHARE REPURCHASES On January 3, 2014, the Company announced that its Board of Directors replaced its existing share repurchase authorization with an increased authorization to repurchase up to $150.0 million of common stock with the authorization effective through January 2, 2016. On July 25, 2014, the Company adopted a written trading plan in connection with its share repurchase program for repurchasing its common stock in accordance with the guidelines specified under Rule 10b5-1 of the Securities Exchange Act of 1934, as amended. During the twelve months ended August 31, 2014, the Company repurchased 497,899 shares of common stock for an aggregate purchase price of $41.1 million. During the twelve months ended August 31, 2013, the Company did not repurchase shares of common stock. The remaining amount available under the repurchase program was $108.9 million as of August 31, 2014. T. QUARTERLY RESULTS OF OPERATIONS (UNAUDITED)
First Second Third Fourth $ in thousands, except per share amounts Quarter Quarter Quarter Quarter Year ended August 31, 2014 Operating revenues $ 147,671 $ 152,804 $ 169,936 $ 147,522 Cost of operating revenues $ 107,520 $ 110,132 $ 121,687 $ 107,599 Earnings before income taxes $ 15,817 $ 20,789 $ 25,500 $ 16,549 Net earnings $ 10,234 $ 13,450 $ 16,499 $ 11,329 Diluted net earnings per share $ 0.79 $ 1.04 $ 1.28 $ 0.89 Year ended August 31, 2013 Operating revenues $ 147,370 $ 175,539 $ 219,542 $ 148,397 Cost of operating revenues $ 104,513 $ 125,175 $ 156,506 $ 109,820 Earnings before income taxes $ 22,383 $ 29,488 $ 39,750 $ 15,686 Net earnings $ 14,728 $ 19,351 $ 26,063 $ 10,428 Diluted net earnings per share $ 1.15 $ 1.50 $ 2.01 $ 0.81

59
ITEM 9 - Changes in and Disagreements with Accountants on Accounting and Financial Disclosure Not applicable. ITEM 9A – Controls and Procedures Evaluation of Disclosure Controls and Procedures As of the end of the period covered by this report, the Company carried out an evaluation, under the supervision and with the participation of the Company’s management, including the Company’s Chief Executive Officer and Chief Financial Officer, of the effectiveness of the design and operation of the Company’s disclosure controls and procedures, as defined in Exchange Act Rules 13a-15(e) and 15d-15(e) and internal control over financial reporting, as defined in Exchange Act Rules 13a-15(f) and 15d-15(f). Based upon that evaluation, the Company’s Chief Executive Officer and Chief Financial Officer concluded that the Company’s disclosure controls and procedures are effective in enabling the Company to record, process, summarize and report information required to be included in the Company’s periodic SEC filings within the required time period. Management’s Report on Internal Control over Financial Reporting Management is responsible for establishing and maintaining adequate internal control over financial reporting for the Company. The Company’s internal control system was designed to provide reasonable assurance to the Company’s management and board of directors regarding the preparation and fair presentation of published financial statements. Management has assessed the effectiveness of the Company’s internal control over financial reporting as of August 31, 2014, based on the criteria for effective internal control described in Internal Control – Integrated Framework (1992) issued by the Committee of Sponsoring Organizations of the Treadway Commission. Based on its assessment, management concluded that the Company’s internal control over financial reporting was effective as of August 31, 2014. The Audit Committee has engaged KPMG LLP, the independent registered public accounting firm that audited the consolidated financial statements included in this Annual Report on Form 10-K, to attest to and report on management’s evaluation of the Company’s internal control over financial reporting. The report of KPMG LLP is included herein.
Report of Independent Registered Public Accounting Firm The Board of Directors and Shareholders Lindsay Corporation:
We have audited Lindsay Corporation’s internal control over financial reporting as of August 31, 2014, based on criteria established in Internal Control – Integrated Framework (1992) issued by the Committee of Sponsoring Organizations of the Treadway Commission (COSO). Lindsay Corporation’s management is responsible for maintaining effective internal control over financial reporting and for its assessment of the effectiveness of internal control over financial reporting, included in the accompanying management’s report on internal control over financial reporting. Our responsibility is to express an opinion on the Company’s internal control over financial reporting based on our audit.
We conducted our audit in accordance with the standards of the Public Company Accounting Oversight Board (United States). Those standards require that we plan and perform the audit to obtain reasonable assurance about whether effective internal control over financial reporting was maintained in all material respects. Our audit included obtaining an understanding of internal control over financial reporting, assessing the risk that a material weakness exists, and testing and evaluating the design and operating effectiveness of internal control based on the assessed risk. Our audit also included performing such other procedures as we considered necessary in the circumstances. We believe that our audit provides a reasonable basis for our opinion.

60
A company’s internal control over financial reporting is a process designed to provide reasonable assurance regarding the reliability of financial reporting and the preparation of financial statements for external purposes in accordance with generally accepted accounting principles. A company’s internal control over financial reporting includes those policies and procedures that (1) pertain to the maintenance of records that, in reasonable detail, accurately and fairly reflect the transactions and dispositions of the assets of the company; (2) provide reasonable assurance that transactions are recorded as necessary to permit preparation of financial statements in accordance with generally accepted accounting principles, and that receipts and expenditures of the company are being made only in accordance with authorizations of management and directors of the company; and (3) provide reasonable assurance regarding prevention or timely detection of unauthorized acquisition, use, or disposition of the company’s assets that could have a material effect on the financial statements.
Because of its inherent limitations, internal control over financial reporting may not prevent or detect misstatements. Also, projections of any evaluation of effectiveness to future periods are subject to the risk that controls may become inadequate because of changes in conditions, or that the degree of compliance with the policies or procedures may deteriorate.
In our opinion, Lindsay Corporation maintained, in all material respects, effective internal control over financial reporting as of August 31, 2014, based on criteria established in Internal Control – Integrated Framework (1992) issued by the Committee of Sponsoring Organizations of the Treadway Commission (COSO).
We also have audited, in accordance with the standards of the Public Company Accounting Oversight Board (United States), the consolidated balance sheets of Lindsay Corporation and subsidiaries as of August 31, 2014 and 2013, and the related consolidated statements of operations, comprehensive income, shareholders’ equity, and cash flows for each of the years in the three-year period ended August 31, 2014, and our report dated October 15, 2014 expressed an unqualified opinion on those consolidated financial statements.
/s/ KPMG LLP
Omaha, Nebraska October 15, 2014
Changes in Internal Control over Financial Reporting There were no changes in the Company’s internal controls over financial reporting that occurred during the year ended August 31, 2014, that have materially affected, or are reasonably likely to materially affect, the Company’s internal control over financial reporting. ITEM 9B – Other Information None.

61
PART III
ITEM 10 – Directors, Executive Officers and Corporate Governance The Company will file with the Securities and Exchange Commission a definitive Proxy Statement for its 2015 Annual Meeting of Stockholders (the “Proxy Statement”) not later than 120 days after the close of its fiscal year ended August 31, 2014. Information about the Board of Directors required by Items 401 and 407 of Regulation S-K is incorporated by reference to the discussion responsive thereto under the captions “Board of Directors and Committees” and “Corporate Governance” in the Proxy Statement. The executive officers and significant employees of the Company, their ages, positions and business experience are set forth below. All executive officers of the Company are appointed by the Board of Directors annually and have employment agreements. There are no family relationships between any director or executive officer. There are no arrangements or understandings between any executive officer and any other person pursuant to which they were selected as an officer. Age Position Richard W. Parod 61 President and Chief Executive Officer Eric R. Arneson* 40 Vice President, General Counsel and Secretary David B. Downing 59 President – Agricultural Irrigation Division C. Mike Harris* 48 President – Technology Business James C. Raabe 54 Vice President and Chief Financial Officer Mark A. Roth* 39 Vice President – Corporate Development and Treasurer Barry A. Ruffalo 44 President – Infrastructure Division Reuben P. Srinivasan* 51 Vice President – Human Resources Lori L. Zarkowski* 39 Chief Accounting Officer
* The employee is not an executive officer of the Registrant. Mr. Richard W. Parod is President and Chief Executive Officer (“CEO”) of the Company, and has held such positions since April 2000. Prior to that time and since 1997, Mr. Parod was Vice President and General Manager of the Irrigation Division of The Toro Company. Mr. Parod was employed by James Hardie Irrigation from 1993 through 1997, becoming President in 1994. Mr. Parod has been a Director since April 2000, when he began his employment with the Company. Mr. Eric R. Arneson is Vice President, General Counsel and Secretary of the Company and has held such positions since April 2008, when he joined the Company. Prior to that time and since January 1999, Mr. Arneson practiced law with the law firm of Kutak Rock LLP, and was most recently a partner of the firm. Mr. David B. Downing is President – Agricultural Irrigation Division of the Company and has held such position since October 2013. Between March 2008 and October 2013, Mr. Downing served as President – International operations of the Company. Between March 2009 and June 2011, Mr. Downing served as both Chief Financial Officer and President – International Operations of the Company. Previously he was Senior Vice President-Finance, Chief Financial Officer, Treasurer and Secretary of the Company and held such positions from August 2004, when he joined the Company, to March 2008. Prior to August 2004, Mr. Downing served as the President of FPM L.L.C., a heat-treating company based in Elk Grove Village, Illinois, after joining that company in January 2001 as Vice President and Chief Financial Officer. Previously, Mr. Downing served as Vice President and Controller for Thermo-King, which manufactured transport refrigeration equipment.

62
Mr. C. Mike Harris is President – Technology Business of the Company and has held such position since November 2013. Prior to joining Lindsay and since February 2013, he served as Vice President of Sales and Field Operation at Johnson Controls, Inc., a global diversified technology and industrial company. From May 2010 to February 2013, Mr. Harris served as Vice President and Managing Director of Asia Pacific at Johnson Controls, Inc. From February 2005 to April 2010, Mr. Harris served as Vice President and General Manager of Energy Services for Johnson Controls, Inc. Prior to 2005 and since 2002, Mr. Harris served in several Vice President positions at Johnson Controls, Inc. Prior to joining Johnson Controls, Inc., Mr. Harris held various leadership positions in the energy services, commodity trading and utility industries. Mr. James C. Raabe is Vice President and Chief Financial Officer of the Company, and has held such positions since June 2011. Prior to joining Lindsay and since April 1999, he served as Senior Vice President and Chief Financial Officer of Select Comfort Corporation. From September 1997 to April 1999, Mr. Raabe served as the Controller for Select Comfort Corporation. From May 1992 to September 1997, he served as Vice President – Finance of ValueRx, Inc., a pharmacy benefit management provider. Mr. Raabe held various positions with KPMG LLP from August 1982 to May 1992. Mr. Mark A. Roth is Vice President – Corporate Development and Treasurer of the Company. Mr. Roth joined Lindsay in 2004, as Director of Corporate Development and was promoted to Vice President – Corporate Development in March 2007, adding Treasurer to his role in April 2008. From March 2001 through 2004 when he joined the Company, Mr. Roth was an Associate with McCarthy Group, Inc., a Midwest-based investment bank and private equity fund. From January 1998 through February 2001, Mr. Roth was a Senior Credit Analyst at US Bancorp. Mr. Barry A. Ruffalo is President – Infrastructure Division of the Company and has held such position since October 2013. Between March 2007 and October 2013, Mr. Ruffalo served as President – Irrigation Business of the Company. Prior to joining Lindsay and since February 2007, Mr. Ruffalo was most recently a Director of North American Operations for Joy Global Inc. Prior to that time and since 1996, Mr. Ruffalo held various positions of increasing responsibility with Case New Holland; the last five years were spent in Operations Management within the Tractor and the Hay and Forage divisions for both the Case IH and New Holland brands. Mr. Reuben P. Srinivasan is Vice President – Human Resources and joined the Company in January 2013. Mr. Srinivasan was formerly Director (Global), Human Resources at Trimble Navigation Limited, a provider of advanced location-based solutions based in Sunnyvale, California, from 2006 to 2013. Prior to that time and since 1997, Mr. Srinivasan held positions of increasing responsibility with Volkswagen Group of America, the last six years of which were as Manager of Human Resources with the Audi brand. Ms. Lori L. Zarkowski is Chief Accounting Officer of the Company, and has held such position since August 2011. Ms. Zarkowski joined Lindsay in June 2007 as Corporate Reporting Manager and was promoted to Corporate Controller in April 2008. Prior to joining the Company and since 1997, Ms. Zarkowski was most recently an Audit Senior Manager with Deloitte & Touche LLP. Section 16(a) Beneficial Ownership Reporting Compliance - Item 405 of Regulation S-K calls for disclosure of any known late filing or failure by an insider to file a report required by Section 16 of the Securities Exchange Act. The information required by Item 405 is incorporated by reference to the discussion responsive thereto under the caption “Section 16(a) Beneficial Ownership Reporting Compliance” in the Proxy Statement. Code of Ethics – Item 406 of Regulation S-K calls for disclosure of whether the Company has adopted a code of ethics applicable to the principal executive officer, principal financial officer, principal accounting officer or controller, or persons performing similar functions. The Company has adopted a code of ethics applicable to the Company’s principal executive officer and senior financial officers known as the Code of Ethical Conduct (Principal Executive Officer and Senior Financial Officers). The Code of Ethical Conduct (Principal Executive Officer and Senior Financial Officers) is available on the Company’s website. In the event that the Company amends or waives any of the provisions of the Code of Ethical Conduct applicable to the principal executive officer and senior financial officers, the Company intends to disclose the same on the Company’s website at www.lindsay.com. No waivers were provided for the fiscal year ended August 31, 2014.

63
ITEM 11 - Executive Compensation The information required by this Item is incorporated by reference to the discussion responsive thereto under the captions “Executive Compensation”, “Compensation Discussion and Analysis”, “Pension Benefits”, “Nonqualified Deferred Compensation”, “Report of the Compensation Committee on Executive Compensation”, “Compensation of Directors” and “Compensation Committee Interlocks and Insider Participation” in the Proxy Statement. ITEM 12 - Security Ownership of Certain Beneficial Owners and Management and Related Stockholder Matters The information required by this Item relating to security ownership of certain beneficial owners and management is incorporated by reference to the discussion responsive thereto under the caption “Voting Securities and Beneficial Ownership Thereof by Principal Stockholders, Directors and Officers” in the Proxy Statement. Equity Compensation Plan Information - The following equity compensation plan information summarizes plans and securities approved by security holders as of August 31, 2014 (there were no equity compensation plans not approved by security holders as of August 31, 2014):
(a) (b) (c)
Plan category Number of securities to be
issued upon exercise of outstanding options, warrants, and rights
Weighted-average exercise price of
outstanding options, warrants, and rights
Number of securities remaining available for future issuance under equity
compensation plans (excluding securities reflected in column (a))
Equity compensation plans approved by security holders (1) (2)
181,239 $ 63.80 153,929
Total
181,239 $ 63.80 153,929
(1) Plans approved by stockholders include the Company’s 2001, 2006 and 2010 Long-Term Incentive Plans. While certain share based awards remain outstanding under the Company’s 2001 and 2006 Long-Term Incentive Plans, no future equity compensation awards may be granted under such plans. (2) Column (a) includes (i) 40,752 shares that could be issued under performance stock units (“PSU”) outstanding at August 31, 2014, and (ii) 53,864 shares that could be issued under restricted stock units (“RSU”) outstanding at August 31, 2014. The PSUs are earned and Common Stock issued if certain predetermined performance criteria are met. Actual shares issued may be equal to, less than or greater than (but not more than 200 percent of) the number of outstanding PSUs included in column (a), depending on actual performance. The RSUs vest and are payable in Common Stock after the expiration of the time periods set forth in the related agreements. Column (b) does not take these PSU and RSU awards into account because they do not have an exercise price. ITEM 13 - Certain Relationships and Related Transactions, and Director Independence The information required by this Item is incorporated by reference to the discussion responsive thereto under the captions “Corporate Governance” and “Corporate Governance – Related Party Transactions” in the Proxy Statement. ITEM 14 – Principal Accounting Fees and Services The information required by this Item is incorporated by reference to the discussion responsive thereto under the caption “Ratification of Appointment of Independent Registered Public Accounting Firm” in the Proxy Statement.

64
PART IV ITEM 15 – Exhibits, Financial Statement Schedules a(1) Financial Statements The following financial statements of Lindsay Corporation and Subsidiaries are included in Part II Item 8. Page Report of Independent Registered Public Accounting Firm .................................................................................... 29 Consolidated Statements of Operations for the years ended August 31, 2014, 2013, and 2012 .......................................................................................................... 30 Consolidated Statements of Comprehensive Income for the years ended August 31, 2014, 2013, and 2012 .......................................................................................................... 31 Consolidated Balance Sheets as of August 31, 2014 and 2013 ................................................................................................................................ 32 Consolidated Statements of Shareholders' Equity for the years ended August 31, 2014, 2013, and 2012 .................................................................................... 33 Consolidated Statements of Cash Flows for the years ended August 31, 2014, 2013, and 2012 .......................................................................................................... 34 Notes to Consolidated Financial Statements ............................................................................................................ 35-58 Valuation and Qualifying Accounts - Years ended August 31, 2014, 2013, and 2012 .................................................................................................. 65 Financial statements and schedules other than those listed are omitted for the reason that they are not required, are not applicable or that equivalent information has been included in the financial statements or notes thereto.

65
a(2) Exhibit Lindsay Corporation and Subsidiaries
VALUATION AND QUALIFYING ACCOUNTS Years ended August 31, 2014, 2013 and 2012
Additions
(in thousands)
Balance at beginning of
period
Charges to costs and expenses
Charged to other
accounts Deductions
Balance at end of period
Year ended August 31, 2014: Deducted in the balance sheet from the assets to which they apply: Allowance for doubtful accounts (a) $ 2,853 $ 2,225 $ - $ 221 $ 4,857 Allowance for inventory obsolescence (b) $ 3,089 $ 698 $ 11 $ 941 $ 2,858 Year ended August 31, 2013: Deducted in the balance sheet from the assets to which they apply: Allowance for doubtful accounts (a) $ 1,717 $ 1,543 $ - $ 407 $ 2,853 Allowance for inventory obsolescence (b) $ 1,648 $ 2,632 $ 71 $ 1,262 $ 3,089 Year ended August 31, 2012: Deducted in the balance sheet from the assets to which they apply: Allowance for doubtful accounts (a) $ 2,340 $ 379 $ - $ 1,002 $ 1,717 Allowance for inventory obsolescence (b) $ 2,167 $ 1,114 $ (126) $ 1,507 $ 1,648
(a) Deductions consist of uncollectible items (b) Deductions consist of obsolete items sold
a(3) Exhibits. The list of the Exhibits in the Exhibit Index is incorporated into this item by reference.

66
SIGNATURES Pursuant to the requirements of Section 13 or 15(d) of the Securities Exchange Act of 1934, the registrant has duly caused this report to be signed on its behalf by the undersigned, thereunto duly authorized on this 15th day of October, 2014. LINDSAY CORPORATION By: /s/ JAMES C. RAABE Name: James C. Raabe Title: Vice President and Chief Financial Officer Pursuant to the requirements of the Securities Exchange Act of 1934, this report has been signed below by the following persons on behalf of the registrant and in the capacities indicated on this 15th day of October, 2014. /s/ RICHARD W. PAROD Director, President and Chief Executive Officer Richard W. Parod (Principal Executive Officer) /s/ JAMES C. RAABE Vice President and Chief Financial Officer James C. Raabe (Principal Financial Officer and Principal Accounting Officer) /s/ MICHAEL N. CHRISTODOLOU (1) Chairman of the Board of Directors Michael N. Christodolou /s/ ROBERT E. BRUNNER (1) Director Robert E. Brunner /s/ HOWARD G. BUFFETT (1) Director Howard G. Buffett /s/ W. THOMAS JAGODINSKI (1) Director W. Thomas Jagodinski /s/ MICHAEL C. NAHL (1) Director Michael C. Nahl /s/ MICHAEL D.WALTER (1) Director Michael D. Walter /s/ WILLIAM F. WELSH II (1) Director William F. Welsh II (1) By: /s/ RICHARD W. PAROD Richard W. Parod, Attorney-In-Fact
67
a(3) EXHIBIT INDEX Exhibit Number Description 3.1 Restated Certificate of Incorporation of the Company, incorporated by reference to Exhibit 3.1 to the Company’s
Current Report on Form 8-K filed on December 14, 2006. 3.2 Amended and Restated By-Laws of the Company, incorporated by reference to Exhibit 3.1 to the Company’s Current
Report on Form 8-K filed on May 5, 2014. 4.1 Specimen Form of Common Stock Certificate incorporated by reference to Exhibit 4(a) to the Company's Quarterly
Report on Form 10-Q for the fiscal quarter ended November 30, 2006. 10.1 Lindsay Corporation 2010 Long-Term Incentive Plan and forms of award agreements, incorporated by reference to
Exhibit 10.2 to the Company’s Quarterly Report on Form 10-Q for the fiscal quarter ended November 30, 2011.† 10.2 Lindsay Manufacturing Co. 2006 Long-Term Incentive Plan and forms of award agreements, incorporated by
reference to Exhibit 10(a) to the Company’s Annual Report on Form 10-K for the fiscal year ended August 31, 2007.†
10.3 Lindsay Manufacturing Co. 2001 Amended and Restated Long-Term Incentive Plan, incorporated by reference to
Exhibit 10(i) of the Company's Annual Report on Form 10-K for the fiscal year ended August 31, 2001.† 10.4 Amendment to Lindsay Manufacturing Co. 2001 Amended and Restated Long-Term Incentive Plan, incorporated by
reference to Exhibit 10(k) to the Company’s Annual Report on Form 10-K for the fiscal year ended August 31, 2005.†
10.5 Lindsay Corporation Management Incentive Umbrella Plan, incorporated by reference to Exhibit 10.2 to the
Company’s Quarterly Report on Form 10-Q for the fiscal quarter ended February 28, 2014.† 10.6** Lindsay Corporation Management Incentive Plan (MIP), 2014 Plan Year, incorporated by reference to Exhibit
10.1 to the Company’s Quarterly Report on Form 10-Q for the fiscal quarter ended November 30, 2013.† 10.7 Form of Indemnification Agreement between the Company and its Officers and Directors, incorporated by reference
to Exhibit 10.2 to the Company’s Quarterly Report on Form 10-Q for the fiscal quarter ended November 30, 2008.† 10.8 Employment Agreement between the Company and Richard W. Parod effective March 8, 2000, incorporated by
reference to Exhibit 10(a) to the Company's Report on Form 10-Q for the fiscal quarter ended May 31, 2000.† 10.9 First Amendment to Employment Agreement, dated May 2, 2003, between the Company and Richard W. Parod,
incorporated by reference to Exhibit 10 (a) of Amendment No. 1 to the Company’s Report on Form 10-Q for the fiscal quarter ended May 31, 2003.†
10.10 Second Amendment to Employment Agreement, dated December 22, 2004, between the Company and Richard
W. Parod, incorporated by reference to Exhibit 10(a) to the Company’s Current Report on Form 8-K filed on December 27, 2004.†
10.11 Third Amendment to Employment Agreement, dated March 20, 2007, between the Company and Richard W.
Parod, incorporated by reference to Exhibit 10.1 to the Company’s Current Report on Form 8-K filed on March 22, 2007.†
10.12 Fourth Amendment to Employment Agreement, dated December 22, 2008, between the Company and Richard W.
Parod, incorporated by reference to Exhibit 10.2 of the Company’s Current Report on Form 8-K filed on January 30, 2009.†
10.13 Fifth Amendment to Employment Agreement, dated January 26, 2009, between the Company and Richard W.
Parod, incorporated by reference to Exhibit 10.1 of the Company’s Current Report on Form 8-K filed on January 30, 2009.†

68
10.14 Restated Sixth Amendment, effective February 25, 2010, by and between the Company and Richard W. Parod, incorporated by reference to Exhibit 10.2 of the Company’s Quarterly Report on Form 10-Q for the fiscal quarter ended February 28, 2010.†
10.15 Seventh Amendment to Employment Agreement, dated January 31, 2011, between the Company and Richard W.
Parod, incorporated by reference to Exhibit 10.1 of the Company’s Current Report on Form 8-K filed on February 3, 2011.†
10.16 Eighth Amendment to Employment Agreement, dated November 29, 2012, between the Company and Richard W.
Parod, incorporated by reference to Exhibit 10.1 of the Company’s Current Report on Form 8-K filed on December 4, 2012. †
10.17 Employment Agreement, dated May 5, 2011, between the Company and James Raabe, incorporated by reference
to Exhibit 10.1 of the Company’s Current Report on Form 8-K filed on May 10, 2011.† 10.18 Employment Agreement dated February 19, 2009, by and between the Company and David B. Downing,
incorporated by reference to Exhibit 10.1 of the Company’s Current Report on Form 8-K filed on February 25, 2009.†
10.19 Employment Agreement, dated February 19, 2009, by and between the Company and Barry A. Ruffalo,
incorporated by reference to Exhibit 10.2 of the Company’s Current Report on Form 8-K filed on February 25, 2009.†
10.20 Revolving Credit Note, dated January 24, 2008, by and between the Company and Wells Fargo Bank, National
Association, incorporated by reference to Exhibit 10.1 to the Company’s Current Report on Form 8-K filed on January 30, 2008.
10.21 Revolving Credit Agreement, dated January 24, 2008, by and between the Company and Wells Fargo Bank,
National Association, incorporated by reference to Exhibit 10.2 to the Company’s Current Report on Form 8-K filed on January 30, 2008.
10.22 First Amendment to Revolving Credit Agreement, dated January 23, 2010, by and between the Company and
Wells Fargo Bank, National Association, incorporated by reference to Exhibit 10.1 of the Company’s Current Report on Form 8-K filed on January 26, 2010.
10.23 Second Amendment to Credit Agreement, dated January 23, 2011, by and between the Company and Wells Fargo
Bank, National Association, incorporated by reference to Exhibit 10.1 of the Company’s Current Report on Form 8-K filed on January 26, 2011.
10.24 Third Amendment to Credit Agreement, dated February 13, 2013, by and between the Company and Wells Fargo
Bank, National Association, incorporated by reference to Exhibit 10.1 of the Company’s Current Report on Form 8-K filed on February 19, 2013.
10.25 Fourth Amendment to Credit Agreement, dated January 22, 2014, by and between the Company and Wells Fargo
Bank, National Association, incorporated by reference to Exhibit 10.1 of the Company’s Quarterly Report on Form 10-Q for the fiscal quarter ended February 28, 2014.
10.26 Lindsay Corporation Policy on Payment of Directors Fees and Expenses, incorporated by reference to Exhibit 10.2
to the Company's Quarterly Report on Form 10-Q for the fiscal quarter ended November 30, 2013.

69
21* Subsidiaries of the Company 23* Consent of KPMG LLP 24* The Power of Attorney authorizing Richard W. Parod to sign the Annual Report on Form 10-K for fiscal 2014 on
behalf of non-management directors. 31.1* Certification of Chief Executive Officer pursuant to Section 302 of the Sarbanes-Oxley Act of 2002 18 U.S.C.
Section 1350. 31.2* Certification of Chief Financial Officer pursuant to Section 302 of the Sarbanes-Oxley Act of 2002 18 U.S.C. Section
1350. 32* Certification of Chief Executive Officer and Chief Financial Officer pursuant to Section 906 of the Sarbanes-Oxley
Act of 2002 18 U.S.C. Section 1350. 101*** Interactive Data Files. † Management contract or compensatory plan or arrangement required to be filed as an exhibit hereto pursuant to Item 15(b) of Form 10-K. * Filed herein. ** Certain confidential portions of this Exhibit were omitted by means of redacting a portion of the text. This Exhibit has been filed separately with the Secretary of the Commission with the redacted text pursuant to the Company’s application requesting confidential treatment under Rule 24b-2 of the Securities and Exchange Act of 1934. *** Furnished herewith. Pursuant to Rule 406T of Regulation S-T, these interactive data files are deemed not filed or part of a registration statement or prospectus for purposes of Sections 11 or 12 of the Securities Act of 1933, are deemed not filed for purposes of Section 18 of the Securities Exchange Act of 1934 and otherwise are not subject to liability under these Sections.


L INDSAY CORPOR ATION
DIRECTORS AND ELECTED OFFICERS
Concerning Forward-Looking StatementsThis Annual Report and Form 10-K, including the President’s letter, Management’s Discussion and Analysis, and other sections, contains forward-looking statements that are subject to risks and uncertainties and which reflect management’s current beliefs and estimates of future economic circumstances, industry conditions, company performance and financial results. You can find a discussion of many of these risks and uncertainties in the annual, quarterly, and current reports we file with the Securities and Exchange Commission. Forward-looking statements include the information concerning possible or assumed future results of operations of the Company and those statements preceded by, followed by, or including the words “anticipate,” “estimate,” “believe,” “intend,” “expectation,” “outlook,” “could,” “may,” “should,” “will,” “future,” “position,” or similar expressions. For these statements, the Company claims the protection of the safe harbor for forward-looking statements contained in the Private Securities Litigation Reform Act of 1995. You should understand that the following important factors, in addition to those discussed elsewhere in the document, could affect the future results of the Company and could cause those results to differ materially from those expressed in our forward-looking statements: availability of and price of raw materials, product pricing, competitive environment and related domestic and international market conditions, operating efficiencies and actions of domestic and foreign governments. Any changes in such factors could result in significantly different results. The Company undertakes no obligation to update any forward-looking information contained in this Annual Report.
Lean, Clean and Green. Lindsay Corporation is committed to developing environmental awareness and implementing sustainable practices to reduce the use of and protect energy, water, and all other resources.
DIRECTORS OFFICERS
Annual Meeting All shareholders are invited to attend our annual meeting, which will be held on January 26, 2015, at 8:30 a.m. at our corporate office located at 2222 North 111th Street, Omaha, Nebraska. We look forward to meeting shareholders and answering questions at the meeting. Any shareholder who will be unable to attend is encouraged to send questions and comments in writing to Eric Arneson, Secretary, at Lindsay’s corporate office.
Quarterly Calendar The Company operates on a fiscal year ending August 31. Fiscal 2015 quarter-end dates are November 30, 2014, February 28, 2015, May 31, 2015 and August 31, 2015. Quarterly earnings are announced approximately four weeks after the end of each quarter and audited results are announced approximately six weeks after year end. Quarterly earnings releases are posted to Lindsay’s Web site at www.lindsay.com.
Transfer Agent and Registrar Wells Fargo Shareowner Services Post Office Box 64874 St. Paul, Minnesota 55164-0874 Phone: (800) 468-9716 FAX: (866) 729-7680
Research Coverage Provided By BB&T CapitalGabelli & Company Janney Montgomery Scott LLC Monness, Crespi, Hardt & Co., Inc. Piper Jaffray
Stock Market Information Lindsay’s common stock is traded on the New York Stock Exchange, Inc. (NYSE) under the ticker symbol LNN.
Certifications The Company has filed certifications under Section 302 and Section 906 of the Sarbanes-Oxley Act of 2002 as exhibits to its Form 10-K for fiscal year 2014. These exhibits are signed by the Principal Executive Officer and the Principal Financial Officer, respectively. Additionally, on February 25, 2014, the Company’s Chief Executive Officer provided his annual certification regarding the Company’s compliance with the New York Stock Exchange corporate governance listing standards.
Independent Auditors KPMG LLP Omaha, Nebraska
For Further Information Shareholders and prospective investors are welcome to call or write Lindsay Corporation with questions or requests for additional information. Please direct inquiries to:
James C. Raabe Chief Financial Officer 2222 North 111th Street Omaha, Nebraska 68164 (402) 827-6579
Web Site www.lindsay.com
Michael N. Christodolou Director since 1999 Chairman of the Board since 2003 Founder and Manager, Inwood Capital Management, LLC
Robert E. Brunner Director since 2013 Retired Executive Vice President, Illinois Tool Works, Inc. Director: Laggett & Platt, Inc. and NN, Inc.
Howard G. Buffett Director since 1995 President, Buffett Farms & Howard G. Buffett Foundation Director: Berkshire Hathaway, Inc. and the Coca-Cola Company
W. Thomas Jagodinski Director since 2008 Retired President, Chief Executive Officer of Delta and Pine Land Company Director: Centrus Energy Corp.
Michael C. Nahl Director since 2003 Retired Executive Vice President and Chief Financial Officer, Albany International Corp. Director: Trans World Entertainment Corporation
David B. Rayburn Director since 2014 Retired President, Chief Executive Officer, Modine Manufacturing Director: Twin Disc, Inc.
Michael D. Walter Director since 2009 President of Mike Walter & Associates Director: Agro Tech Foods and Richardson International
William F. Welsh II Director since 2001 Retired Chairman of Election Systems & Software Director: Ballantyne Strong, Inc.
Richard W. Parod Director since 2000 President and Chief Executive Officer Joined Lindsay in 2000
Eric R. Arneson Vice President – General Counsel and Secretary Joined Lindsay in 2008
David B. Downing President – Agricultural Irrigation Division Joined Lindsay in 2004
C. Mike Harris President – Technology Business Joined Lindsay in 2013
James C. Raabe Chief Financial Officer Joined Lindsay in 2011
Mark A. Roth Vice President – Corporate Development and Treasurer Joined Lindsay in 2004
Barry A. Ruffalo President – Infrastructure Division Joined Lindsay in 2007
Reuben P. Srinivasan Vice President – Human Resources Joined Lindsay in 2013
Lori L. Zarkowski Corporate Controller and Chief Accounting Officer Joined Lindsay in 2007
Sidoti & CompanySterne AgeeStifel NicolausWedbush Securities, Inc. William Blair & Co., LLC

Lindsay CorporationCorporate Headquarters2222 North 111th Street Omaha, Nebraska 68164 U.S.A.Ph: 1-402-829-6800Toll-free: 1-866-404-5049www.lindsay.com
Lindsay Transportation Solutions, Inc.180 River RoadRio Vista, California 94571 U.S.A.Ph: 1-707-374-6800Toll-free: 1-888-800-3691www.lindsaytransportationsolutions.com
LIND
SAY
CO
RPO
RA
TION
2014 AN
NU
AL R
EPO
RT
Lindsay Europe SAS72300 La Chapelle D’Aligne, FrancePh: 33-2-4348-0202www.lindsayeurope.com
Lindsay Africa Pty. Ltd.6 Talana CloseSacs CircleBellville SouthSouth AfricaPh: +27 (21) 986 8900www.lindsayafrica.com
Lindsay América Do Sul, Ltda.Rodovia Adhemar Pereira de BarrosSP 340 – KM 153.5CEP 13804-830 Mogi-Mirim Sao Paulo BrazilPh: 55-19-3814-1100www.lindsaybrazil.com
Lindsay Sulama (Turkey)Karamehmet Mahallesi Avrupa Serbest Bölgesi AdnanArısoy Bulvarı NO : 11 / Z13 ERGENE / TEKİRDAĞ Adres No : 3402119204Turkey
L INDSAY INTERNATIONAL
Snoline S.P.A. Via F. Baracca 19/2320056 Trezzo sull’AddaMilan, ItalyPh: 39 02 909961www.snoline.com
Lindsay (Tianjin) Industry Co., Ltd.2nd Floor, Office Building10 Huanghai 2nd St.Tianjin Economic-Technological Development Area (TEDA)Tianjin 300457ChinaPh: +86 22 2532 1262www.lindsaychina.com
Lindsay International B.V. Weena 278Tower B, 7th Floor3012 NJ RotterdamThe NetherlandsPh: +31 (10) 870-1340
Lindsay International (ANZ) Pty Ltd. 19 Spencer StreetToowoombaQueensland 4350AustraliaPh: +61 (7) 4613 5000
Watertronics LLC.525 East Industrial DriveHartland, Wisconsin 53029 U.S.A.Ph: 1-262-367-5000Toll-free: 1-800-356-6686www.watertronics.com
Claude Laval Corporation1365 North Clovis AvenueFresno, California 93727 U.S.A.Ph: 1-559-255-1601www.lakos.com
IRZ Consulting, LLC500 North First Street Hermiston, Oregon 97838 U.S.A.Ph: 1-541-567-0252www.irzconsulting.com
LINDSAY USA
Separators and Filtration Solutions
Separators and Filtration Solutions
Separators and Filtration Solutions
Separators and Filtration Solutions
Separators and Filtration Solutions
EZ WIRELESSBY LINDSAY
VALUE THROUGH MARKET LEADERSHIP AND INNOVATION