Prometheus (on the) Rebound? Freedom and the Danish Steering System (with Sue Wright)
Upload
khangminh22Category
view
0download
0
1 18 maj 2015 1 18 maj 2015
Value Based steering and support systems for Danish health care Feasibility study – Full version Copenhagen May 2015

2 18 maj 2015
Content
• Background of feasibility study and case examples from Sweden
• Denmark starCng point (organisaConal readiness and data landscape)
• High level assessment of potenCal for ten selected paCent groups in Denmark
• Suggested roadmap for Denmark
• Appendix

3 18 maj 2015
Content
• Background of feasibility study and case examples from Sweden
– StarCng point; Health care challenges and trends
– Value based steering and support; case examples from Sweden
– ObjecCves of this feasibility study
• Denmark starCng point (organisaConal readiness and data landscape)
• High level assessment of potenCal for ten selected paCent groups in Denmark
• Suggested roadmap for Denmark
• Appendix

4 18 maj 2015
Content
• Background of feasibility study and case examples from Sweden
– Star?ng point; Health care challenges and trends
– Value based steering and support; case examples from Sweden
– ObjecCves of this feasibility study
• Denmark starCng point (organisaConal readiness and data landscape)
• High level assessment of potenCal for ten selected paCent groups in Denmark
• Suggested roadmap for Denmark
• Appendix

5 18 maj 2015 5 18 maj 2015
Star?ng point: The Danish health cares system is performing relaCvely well according to the OECD
• Life expectancy in line with OECD average (DK: 80.1 y. / Ø : 80.2 y.)
• RelaCvely low mortality rates from cardiovascular diseases (Top quarCle in OECD)
• RelaCvely high mortality rates from cancer diseases (BoWom quarCle in OECD)
• Successful specialisaCon and producCvity increase of hospitals
”Denmark is rightly seen as a pioneer in health care quality iniCaCves among OECD countries. Yet, like all other countries, it faces a number of challenges over the coming years”
Source: OECD Health StaCsCcs 2014 -‐ How does Denmark compare? (Data primarily from 2012)
EXAMPLES – NOT EXHAUSTIVE
6 18 maj 2015 6 18 maj 2015
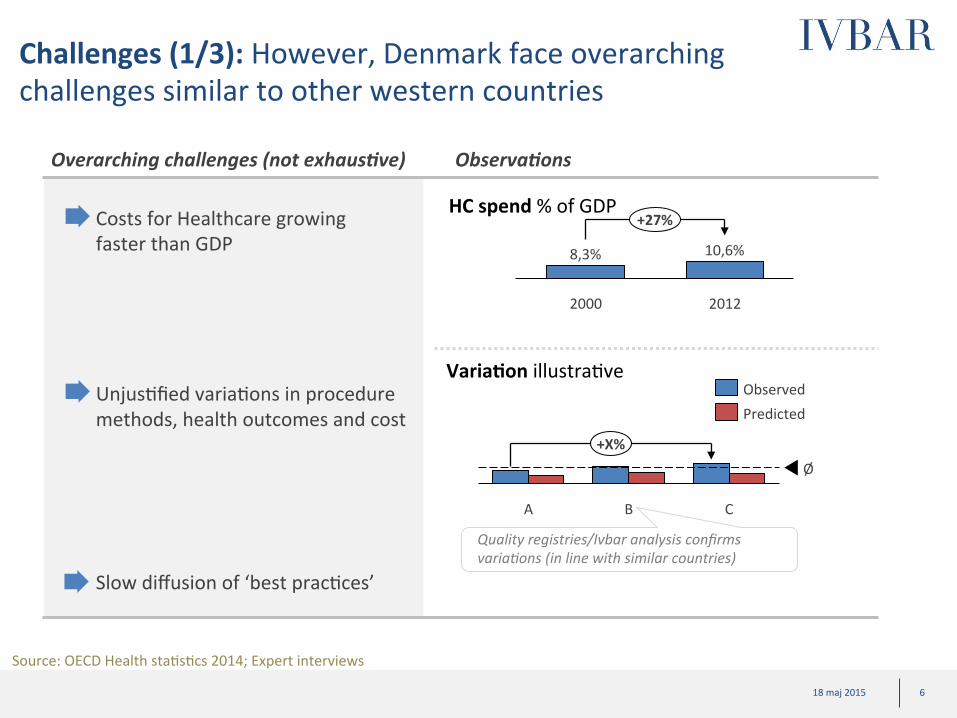
Challenges (1/3): However, Denmark face overarching challenges similar to other western countries
Costs for Healthcare growing faster than GDP
Overarching challenges (not exhaus3ve)
Source: OECD Health staCsCcs 2014; Expert interviews
+X%
C B A
Ø
Predicted Observed
Varia?on illustraCve UnjusCfied variaCons in procedure methods, health outcomes and cost
Slow diffusion of ‘best pracCces’
Quality registries/Ivbar analysis confirms varia>ons (in line with similar countries)
Observa3ons
8,3%
+27%
2012
10,6%
2000
HC spend % of GDP
7 18 maj 2015 7 18 maj 2015
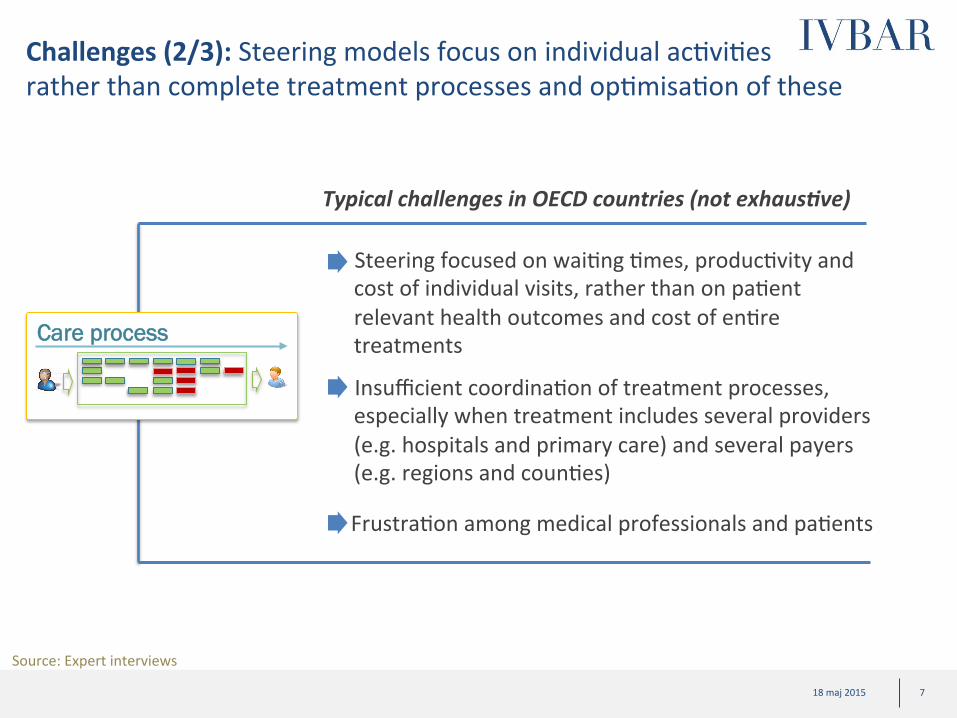
• Insufficient coordinaCon of treatment processes, especially when treatment includes several providers (e.g. hospitals and primary care) and several payers (e.g. regions and counCes)
• Steering focused on waiCng Cmes, producCvity and cost of individual visits, rather than on paCent relevant health outcomes and cost of enCre treatments
Typical challenges in OECD countries (not exhaus3ve)
• FrustraCon among medical professionals and paCents
Care process
Challenges (2/3): Steering models focus on individual acCviCes rather than complete treatment processes and opCmisaCon of these
Source: Expert interviews

8 18 maj 2015 8 18 maj 2015
Challenges (3/3): Healthcare goals not clearly defined making steering and support to providers very complicated
Typical Goals (non-‐exhaus3ve)
• Access to care /waiCng Cmes • Quality • Cost containment • BeWer IntegraCon • PaCent safety • PaCent saCsfacCon • Etc.
• Lack of clarity? • Conflic>ng goals? • Difficult to unite around?

9 18 maj 2015 9 18 maj 2015
Addressing the overarching problem: The framework “Value Based Health Care” has been developed in response of todays challenges defining the common goal of health care as “Value for the paCent”
Value= Health outcomes Resource usage/cost
PaCent relevant health outcomes, examples: • Survival • Quality of life • Pain level and funcConal ability • Depression • InconCnence/impotence (not HBa1c level)
All costs associated with achieving those health outcomes (cost for provider, not reimbursement)
What is new with “value” as a goal? • Combines all other
goals • PaCent relevant focus -‐
easy to unite around • Calculates cost of
treatment instead of cost of organizaConal unit
• Works at all levels (provider, region, municipality, state)

10 18 maj 2015 10 18 maj 2015
• Monitoring, target serng focused on wai?ng ?mes, cost and produc?vity
From produc?vity ..to pa?ent value
• Healthcare organized around medical disciplines
• Monitoring and target serng focused on wai?ng ?mes, health outcomes and efficiency
• Healthcare organized around paCents groups with similar needs
Strategic implica?ons: To work “value based”, health care organizaCon and steering need to be developed which requires new tools
Necessary transi3on Examples of engaged organisa3ons
• Reimbursement based on acCviCes
Requires new steering tools
• Reimbursement designed to support efficiency and innovaCon
11 18 maj 2015
Content
• Background of feasibility study and case examples from Sweden
– StarCng point; Health care challenges and trends
– Value based steering and support; case examples from Sweden
– ObjecCves of this feasibility study
• Denmark starCng point (organisaConal readiness and data landscape)
• High level assessment of potenCal for ten selected paCent groups in Denmark
• Suggested roadmap for Denmark
• Appendix
12 18 maj 2015 12 18 maj 2015
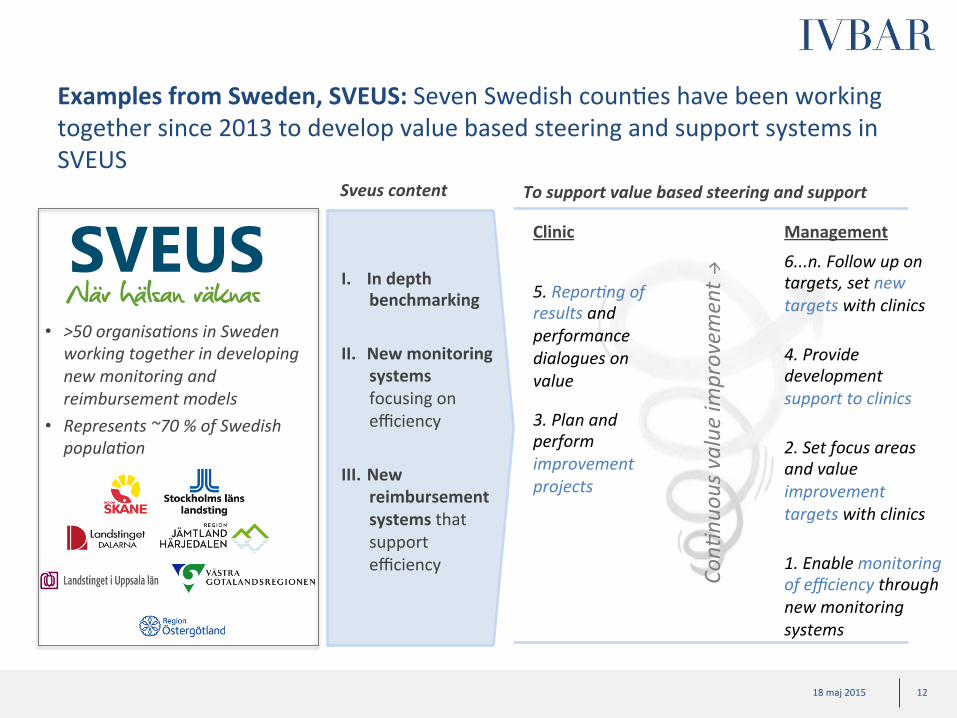
Examples from Sweden, SVEUS: Seven Swedish counCes have been working together since 2013 to develop value based steering and support systems in SVEUS
• >50 organisa>ons in Sweden working together in developing new monitoring and reimbursement models
• Represents ~70 % of Swedish popula>on
To support value based steering and support
1. Enable monitoring of efficiency through new monitoring systems
3. Plan and perform improvement projects
5. Repor>ng of results and performance dialogues on value
6...n. Follow up on targets, set new targets with clinics
Sveus content
I. In depth benchmarking
II. New monitoring systems focusing on efficiency
III. New reimbursement systems that support efficiency
Clinic Management
2. Set focus areas and value improvement targets with clinics
4. Provide development support to clinics
Con>
nuou
s value im
provem
ent à

13 18 maj 2015 13 18 maj 2015
Examples from Sweden, SVEUS: Sveus is organised in 12 projects with a naConal steering group – combining regional autonomy with the advantages of naConal collaboraCon
Lokala landsCngsprojektgrupper
1-‐ Expertgrupp Höt/knä (SLL)
Styrgrupp – naConell samverkan • Socialdepartementet • Senior representant från respekCve deltagande landsCng och SKL • Representant från Karolinska InsCtutet • Representant från IVBAR
9-‐ DritsäWning
Övrig fo
rskning
3-‐ Expertgrupp Förlossning (SLL)
5-‐ Expertgrupp Stroke (Skåne)
7-‐ Expertgrupp Osteoporos (Östergötland)
2-‐ Expertgrupp Rygg (SLL)
4-‐ Expertgrupp Fetmakirurgi (VGR)
6-‐ Expertgrupp Diabetes (Jämtland, Dalarna)
8-‐ Expertgrupp Bröstcancer (Uppsala)
Programkontor
10-‐ Sociodem. / Sjuskrivning
11-‐ Övergång i förvaltning
12-‐ Vårdområdesanalys
FunkConella landsCngsöverskridande expertgrupper
Juridik & InformaCons-‐
säkerhet KommunikaCon VårdinformaCk ErsäWningssystem

14 18 maj 2015 14 18 maj 2015
Examples from Sweden, SVEUS: What is unique with Sveus monitoring systems 1. Developed in broad collabora?on of health care stakeholders
– More than 50 organisaCons engaged including NaConal Medical Specialist associaCons, quality registers, paCent organisaCons, regions/counCes, universiCes, Social Insurance Fund, Ministry of Health and Social affairs…
2. Monitoring system presents efficiency, including both pa?ent relevant outcomes and cost of treatment – Focuses on those health outcomes that are most relevant to the paCent – Includes as much as possible from the care process with data from many sources – Monitoring of performance of different paCent groups presented in the same
format
3. Designed to enable ‘intelligent’ benchmarking – Results adjusted based on treated paCents characterisCcs (case-‐mix) – Standardised informaCon model complying with internaConal standards
4. Con?nuously updated data with online feedback to providers and regions – Gives conCnuously and easily accessible feedback to support conCnuous improvement and
idenCficaCon of deviaCons
Could facilitate future detailed benchmarking
between Sweden and Denmark1
1) Requires established collabora>on Between Danish Regions and Sveus coun>es/regions

15 18 maj 2015 15 18 maj 2015
Examples from Sweden, payment models: ImplementaCon of bundle payment for THR/TKR in Stockholm county resulted in lower cost and reduced complicaCons
Total cost SEK million
0
350
300 2 K
6 K
0
4 K
Total Cost Volume
Volume # of paCents
• Average cost per paCent as well as total cost dropped
• In addiCon – ~20-‐40 % reduced
complicaCon risks – Providers changed
how they worked (e.g., new manuals and checklists, cerCficaCon of personnel)
0
50
100
2009 2008 2007 2010
Cost per pa?ent SEK thousand
Cost per paCent
Context
Before 2009 – THR & TKR
• WaiCng up to two years for surgery
• No systemaCc quality control from county
2009 – IntroducCon of bundle payment
• AccreditaCon of providers and “paCent free choice” of provider
• “Package price” for episode of care up to five years post surgery (Including “complicaCon warranty”)
Info on scope (so far): • All providers • ASA 1-‐2 paCents SVEUS develops next generaCon of bundle payment for THR/TKR
Experienced benefits
16 18 maj 2015 16 18 maj 2015
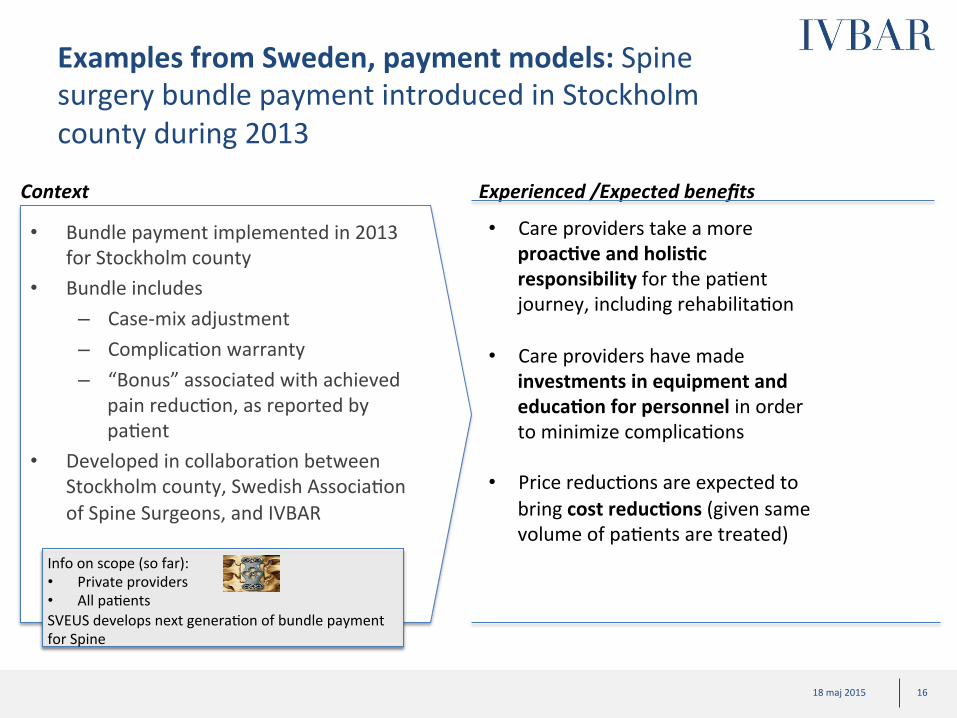
Examples from Sweden, payment models: Spine surgery bundle payment introduced in Stockholm county during 2013
• Care providers take a more proac?ve and holis?c responsibility for the paCent journey, including rehabilitaCon
• Care providers have made investments in equipment and educa?on for personnel in order to minimize complicaCons
• Price reducCons are expected to bring cost reduc?ons (given same volume of paCents are treated)
Context Experienced /Expected benefits
• Bundle payment implemented in 2013 for Stockholm county
• Bundle includes – Case-‐mix adjustment – ComplicaCon warranty – “Bonus” associated with achieved
pain reducCon, as reported by paCent
• Developed in collaboraCon between Stockholm county, Swedish AssociaCon of Spine Surgeons, and IVBAR
Info on scope (so far): • Private providers • All paCents SVEUS develops next generaCon of bundle payment for Spine
17 18 maj 2015
Content
• Background of feasibility study and case examples from Sweden
– StarCng point; Health care challenges and trends
– Value based steering and support; case examples from Sweden
– Objec?ves of this feasibility study
• Denmark starCng point (organisaConal readiness and data landscape)
• High level assessment of potenCal for ten selected paCent groups in Denmark
• Suggested roadmap for Denmark
• Appendix
18 18 maj 2015 18 18 maj 2015
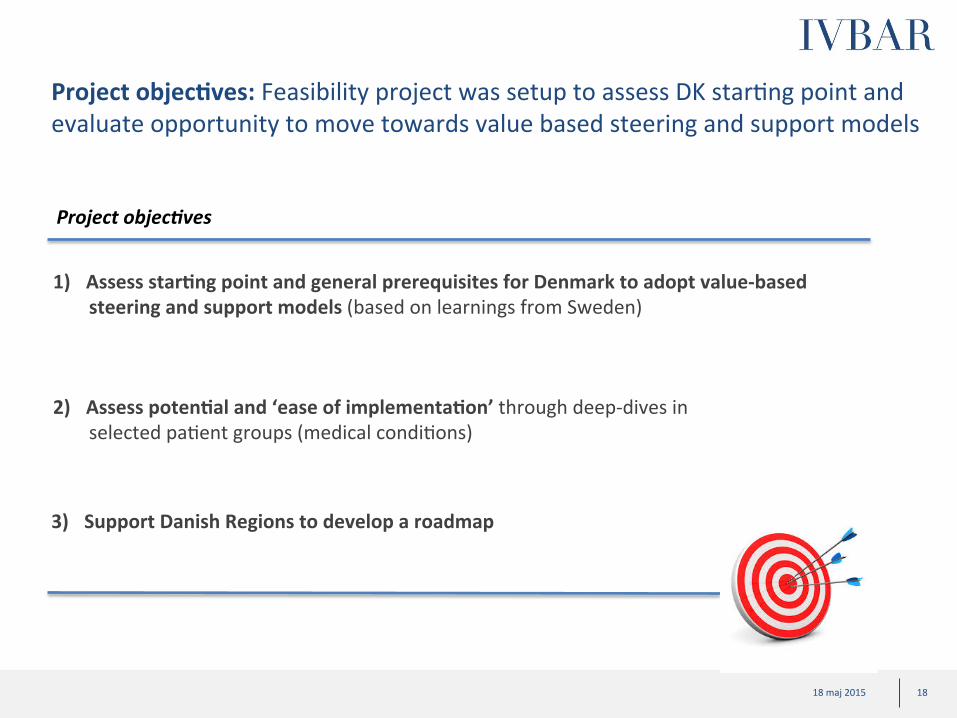
Project objec?ves: Feasibility project was setup to assess DK starCng point and evaluate opportunity to move towards value based steering and support models
1) Assess star?ng point and general prerequisites for Denmark to adopt value-‐based steering and support models (based on learnings from Sweden)
3) Support Danish Regions to develop a roadmap
2) Assess poten?al and ‘ease of implementa?on’ through deep-‐dives in selected paCent groups (medical condiCons)
Project objec3ves

19 18 maj 2015
Content
• Background of feasibility study and case examples from Sweden
• Denmark star?ng point (organisa?onal readiness and data landscape)
• High level assessment of potenCal for ten selected paCent groups in Denmark
• Suggested roadmap for Denmark
• Appendix

20 18 maj 2015
Assessment of Denmark starCng point has been based on qualitaCve and quanCtaCve informaCon
Sources of analysis
Key stakeholder interviews
Data landscape
Ø Interviews to understand general prerequisites to adopt value-‐based steering and support models
Ø Mapping of informaCon need vs available data sources Ø High level legal analysis

21 18 maj 2015
Key stakeholder interviews (1/3): ~40 key leaders and experts have been interviewed to evaluate DK starCng point and future vision
• Regional representaCves (primarily administraCve leaders)
• Governmental insCtuCons/ministries
• Danish Regions (key leaders and experts)
• PaCent organisaCons
• Medical organisaCons
• Other key opinion leaders
Interviewees include:
22 18 maj 2015 22 18 maj 2015
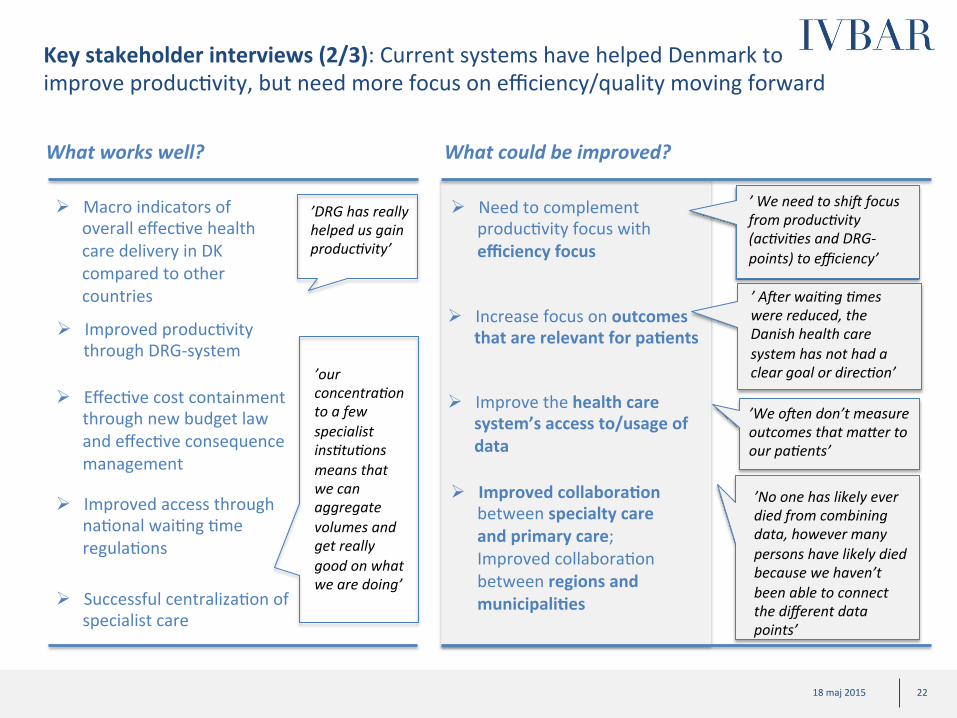
Key stakeholder interviews (2/3): Current systems have helped Denmark to improve producCvity, but need more focus on efficiency/quality moving forward
What works well? What could be improved?
Ø Macro indicators of overall effecCve health care delivery in DK compared to other countries
Ø Successful centralizaCon of specialist care
Ø EffecCve cost containment through new budget law and effecCve consequence management
Ø Improved producCvity through DRG-‐system
’DRG has really helped us gain produc>vity’
’our concentra>on to a few specialist ins>tu>ons means that we can aggregate volumes and get really good on what we are doing’
Ø Improved access through naConal waiCng Cme regulaCons
Ø Need to complement producCvity focus with efficiency focus
Ø Improved collabora?on between specialty care and primary care; Improved collaboraCon between regions and municipali?es
Ø Increase focus on outcomes that are relevant for pa?ents
’We o^en don’t measure outcomes that ma_er to our pa>ents’
’No one has likely ever died from combining data, however many persons have likely died because we haven’t been able to connect the different data points’
Ø Improve the health care system’s access to/usage of data
’ We need to shi^ focus from produc>vity (ac>vi>es and DRG-‐points) to efficiency’
’ A^er wai>ng >mes were reduced, the Danish health care system has not had a clear goal or direc>on’

23 18 maj 2015 23 18 maj 2015
Key stakeholder interviews (3/3): Overall posiCve momentum to complement current steering models, but changes need to happen at a controlled pace
Emerging perspec3ve on way forward (synthesis) Posi3ve momentum/ ini3ated ini3a3ves
Several planned and ongoing iniCaCves with elements of paCent value, e.g., ü ”Vaerdi for borgaren” -‐
Sjaelland ü ”Ny styring i eW
paCentperspekCv”-‐ MidtJylland
ü PublicaCon of results/ benchmarking -‐ Rigshospitalet
• Focus first on improving monitoring of pa?ent value (efficiency): IniCal focus should be to establish monitoring systems and performance dialogues focused on value
• Limited (and “budget-‐neutral”) changes to reimbursement in first step
• Firstly secure that you remove hinders from current systems
• Be careful with purng financial incenCves to single KPIs • Maintain current budget control mechanisms
• Establishment of proof-‐of-‐concept through pilots: Development of new steering and support models should be done through pilots rather than big-‐bang changes
• Focus iniCally on areas with high potenCal • Focus iniCally on ”easily implementable” paCent groups
(and potenCally some more complicated with radically different pre-‐requisites)
Evolu?onary rather than big-‐bang development

24 18 maj 2015 24 18 maj 2015
Data landscape and legal aspects: In-‐depth analysis of DK health care data landscape as well as legal aspects of using data for value based steering and support models show that DK has a good starCng point
Diagnose of data landscape Summary of findings
ü Overall excellent data assets (in many areas, beWer prerequisites than Sweden); PaCent reported outcomes lacking in many areas
ü Value based monitoring systems could be setup on regional level under current legislaCon*
ü Adjustments to reimbursement logic can be done under current
legislaCng (e.g., bundled payments or capitaCon with performance targets on aggregated level) but with some restricCons in usage of data. Changes in legislaCon could be considered for the future*
Detailed analysis of data availability/accessibility on naConal, regional, and municipal and hospital level
* Note: Details available in appendix and legal PM. Only high level legal assessment performed. Final conclusions subject to further analysis and in-‐depth legal review.
25 18 maj 2015
Content
• Background of feasibility study and case examples from Sweden
• Denmark starCng point (organisaConal readiness and data landscape)
• High level assessment of poten?al for ten selected pa?ent groups in Denmark
• Suggested roadmap for Denmark
• Appendix
26 18 maj 2015 26 18 maj 2015
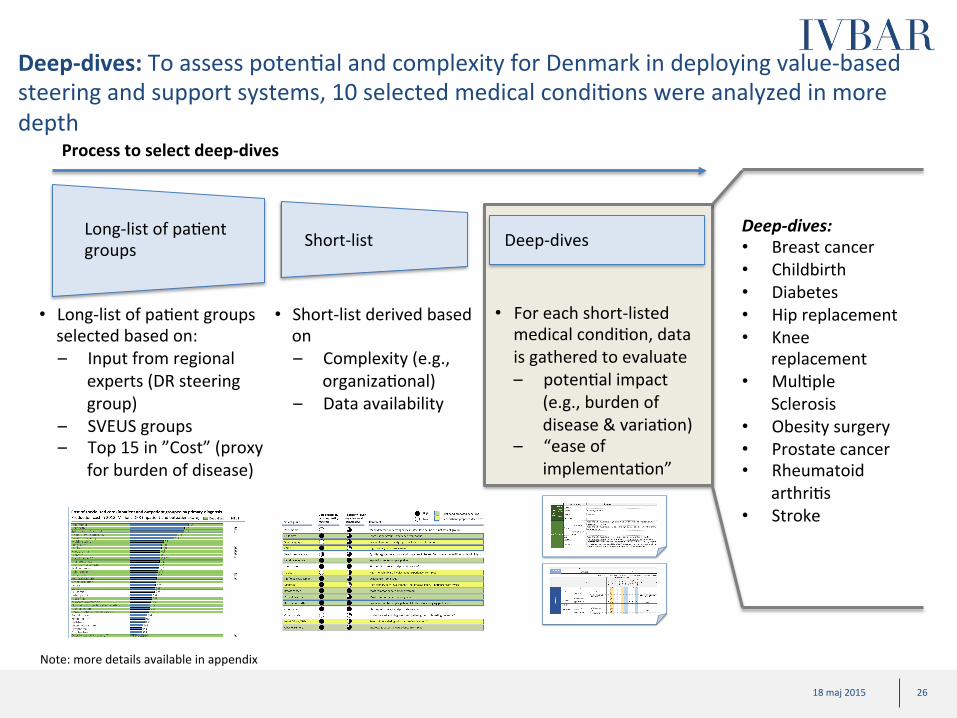
Deep-‐dives: To assess potenCal and complexity for Denmark in deploying value-‐based steering and support systems, 10 selected medical condiCons were analyzed in more depth
Long-‐list of paCent groups Short-‐list Deep-‐dives
• Long-‐list of paCent groups selected based on: – Input from regional
experts (DR steering group)
– SVEUS groups – Top 15 in ”Cost” (proxy
for burden of disease)
• Short-‐list derived based on – Complexity (e.g.,
organizaConal) – Data availability
• For each short-‐listed medical condiCon, data is gathered to evaluate – potenCal impact
(e.g., burden of disease & variaCon)
– “ease of implementaCon”
Process to select deep-‐dives
Deep-‐dives: • Breast cancer • Childbirth • Diabetes • Hip replacement • Knee
replacement • MulCple
Sclerosis • Obesity surgery • Prostate cancer • Rheumatoid
arthriCs • Stroke
Note: more details available in appendix
27 18 maj 2015 27 18 maj 2015
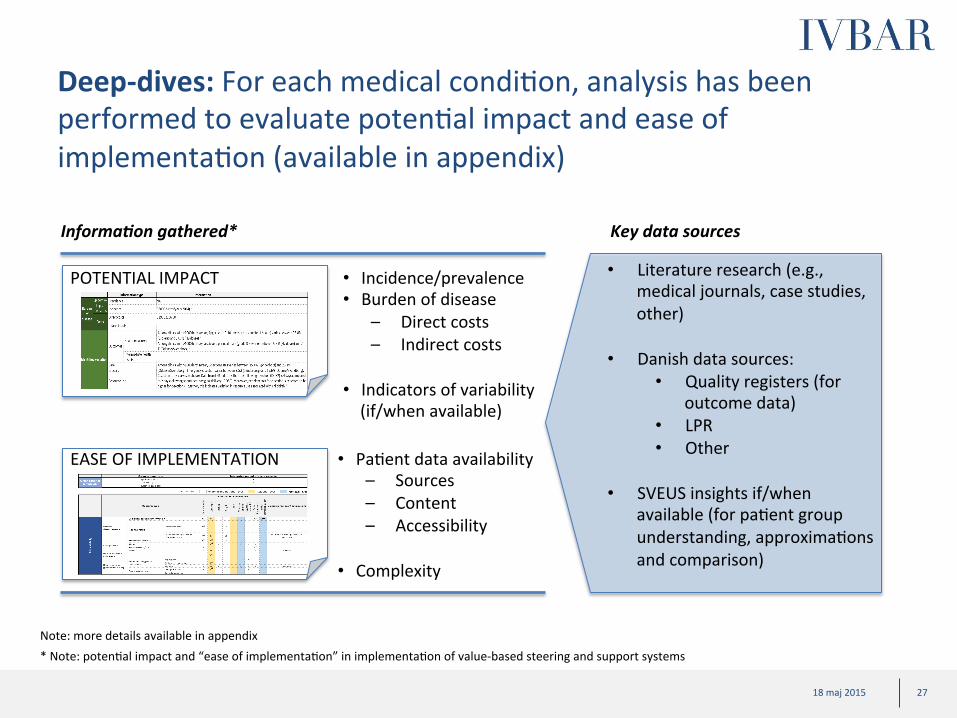
Deep-‐dives: For each medical condiCon, analysis has been performed to evaluate potenCal impact and ease of implementaCon (available in appendix)
Informa3on gathered*
• Literature research (e.g., medical journals, case studies, other)
• Danish data sources: • Quality registers (for
outcome data) • LPR • Other
• SVEUS insights if/when available (for paCent group understanding, approximaCons and comparison)
Key data sources
• Incidence/prevalence • Burden of disease
– Direct costs – Indirect costs
• Indicators of variability (if/when available)
• PaCent data availability – Sources – Content – Accessibility
• Complexity
POTENTIAL IMPACT
EASE OF IMPLEMENTATION
* Note: potenCal impact and “ease of implementaCon” in implementaCon of value-‐based steering and support systems Note: more details available in appendix
28 18 maj 2015 28 18 maj 2015
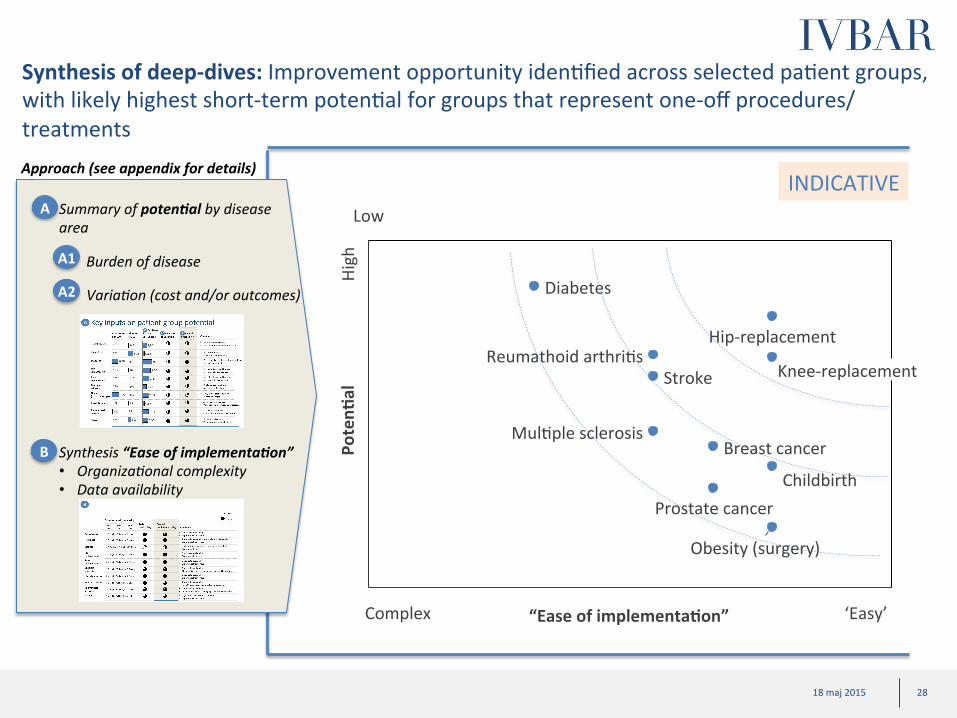
Synthesis of deep-‐dives: Improvement opportunity idenCfied across selected paCent groups, with likely highest short-‐term potenCal for groups that represent one-‐off procedures/ treatments
Poten?
al
“Ease of implementa?on”
Reumathoid arthriCs Stroke
Childbirth
Diabetes
Breast cancer
Prostate cancer
MulCple sclerosis
Obesity (surgery)
Knee-‐replacement
Hip-‐replacement
Approach (see appendix for details)
Summary of poten3al by disease area
A1
A2
A
B
Burden of disease
Varia>on (cost and/or outcomes)
Synthesis “Ease of implementa3on” • Organiza>onal complexity • Data availability
INDICATIVE
Complex ‘Easy’
High
Low
29 18 maj 2015 29 18 maj 2015
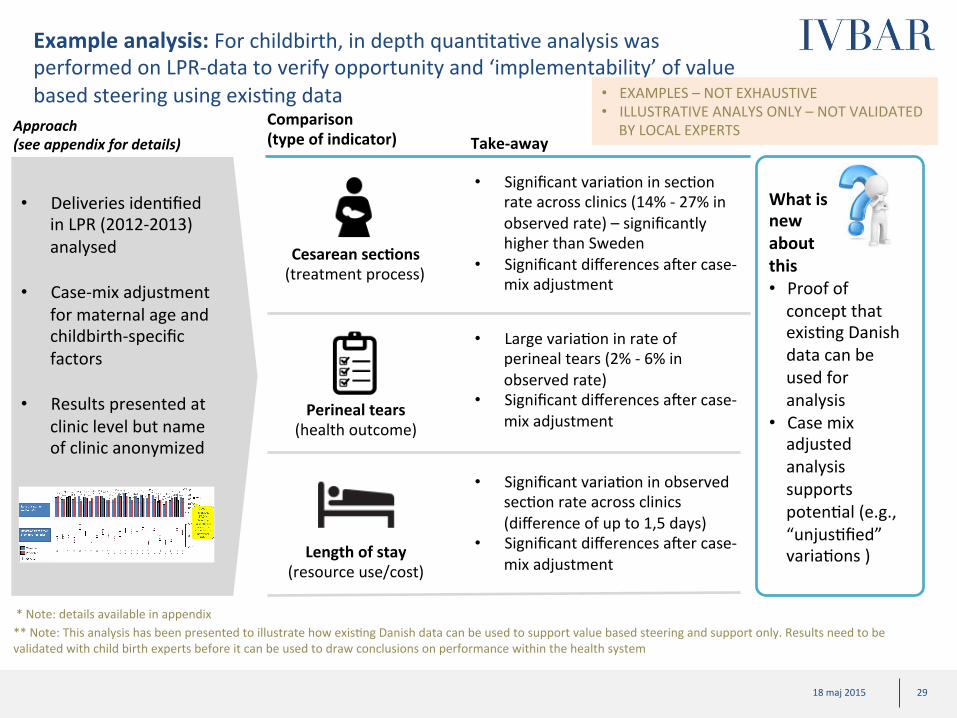
Example analysis: For childbirth, in depth quanCtaCve analysis was performed on LPR-‐data to verify opportunity and ‘implementability’ of value based steering using exisCng data
Comparison (type of indicator) Take-‐away
Cesarean sec?ons (treatment process)
Perineal tears (health outcome)
Length of stay (resource use/cost)
• Significant variaCon in secCon rate across clinics (14% -‐ 27% in observed rate) – significantly higher than Sweden
• Significant differences ater case-‐mix adjustment
• Large variaCon in rate of perineal tears (2% -‐ 6% in observed rate)
• Significant differences ater case-‐mix adjustment
• Significant variaCon in observed secCon rate across clinics (difference of up to 1,5 days)
• Significant differences ater case-‐mix adjustment
** Note: This analysis has been presented to illustrate how exisCng Danish data can be used to support value based steering and support only. Results need to be validated with child birth experts before it can be used to draw conclusions on performance within the health system
• Deliveries idenCfied in LPR (2012-‐2013) analysed
• Case-‐mix adjustment for maternal age and childbirth-‐specific factors
• Results presented at
clinic level but name of clinic anonymized
* Note: details available in appendix
• EXAMPLES – NOT EXHAUSTIVE • ILLUSTRATIVE ANALYS ONLY – NOT VALIDATED
BY LOCAL EXPERTS
What is new about this • Proof of concept that exisCng Danish data can be used for analysis
• Case mix adjusted analysis supports potenCal (e.g., “unjusCfied” variaCons )
Approach (see appendix for details)

30 18 maj 2015 30 18 maj 2015
Rough esCmate on burden of disease for deep-‐dive paCent groups
Diabetes
Stroke
RA
Child birth
Prostate cancer
10
3
Obesity
Knee replacement
Total
3
1
3
2
2
4
2
1*
Hip replacement
Breast cancer
MS
~30-‐35
Indirect Direct
* Excluding indirect costs, and costs of maternity care and neonatal care Source: Desk research; team analysis Note: details available in appendix
Burden of disease DKK Billions Pa?ent group

31 18 maj 2015
Content
• Background of feasibility study and case examples from Sweden
• Denmark starCng point (organisaConal readiness and data landscape)
• High level assessment of potenCal for ten selected paCent groups in Denmark
• Suggested roadmap for Denmark
• Appendix

32 18 maj 2015 32 18 maj 2015
Roadmap: Thought starter on high level roadmap for Denmark -‐ Simplified
Step 1 : Pilots – “Get started with new steering and support models”
Step 3: Further roll-‐out
• Conduct coordinated development (R&D) projects for 10 selected paCent groups1: – Create team with naConal experts – Develop value based monitoring and
reimbursement systems – Install value based monitoring systems
for conCnuous monitoring and feedback of efficiency
– IniCate benchmarking with Sweden2 • Establish jointly coordinated con?nuous
improvement programs for each of the paCent groups and focus governance on efficiency
• Try reimbursement pilots locally: Implement changes to reimbursement system for a selecCon of paCent groups or providers as test (to remove potenCal hinders from efficiency development)
Step 2 : Short term evalua3on and prepara3on for broader roll-‐out
• ConCnued implementaCon acCviCes: – AddiConal paCent groups – AddiConal adjustment of
reimbursement logic to support and sCmulate efficiency development
Sub-‐sequent steps/pilot based on strategy
of each region
1) Does not need to be deep-‐dive groups from this report 2) Requires established collabora>on Between Danish Regions and Sveus coun>es/regions
FOR DISCUSSION
• TBD
General idea
Region 1
Region 2
Region 3
Region 4
Region 5
Pa>ent groups
1 2 3 4 5
lead
lead
lead
lead
lead
par>cipate par>cipate par>cipate par>cipate
par>cipate par>cipate par>cipate
par>cipate par>cipate
par>cipate
par>cipate
par>cipate par>cipate
par>cipate par>cipate
par>cipate par>cipate par>cipate par>cipate
par>cipate
Step 0 : Set up ini3al systems
• Set up first version of value based monitoring systems using exisCng Danish data, based on learnings from Sweden to create momentum and excitement
33 18 maj 2015 33 18 maj 2015
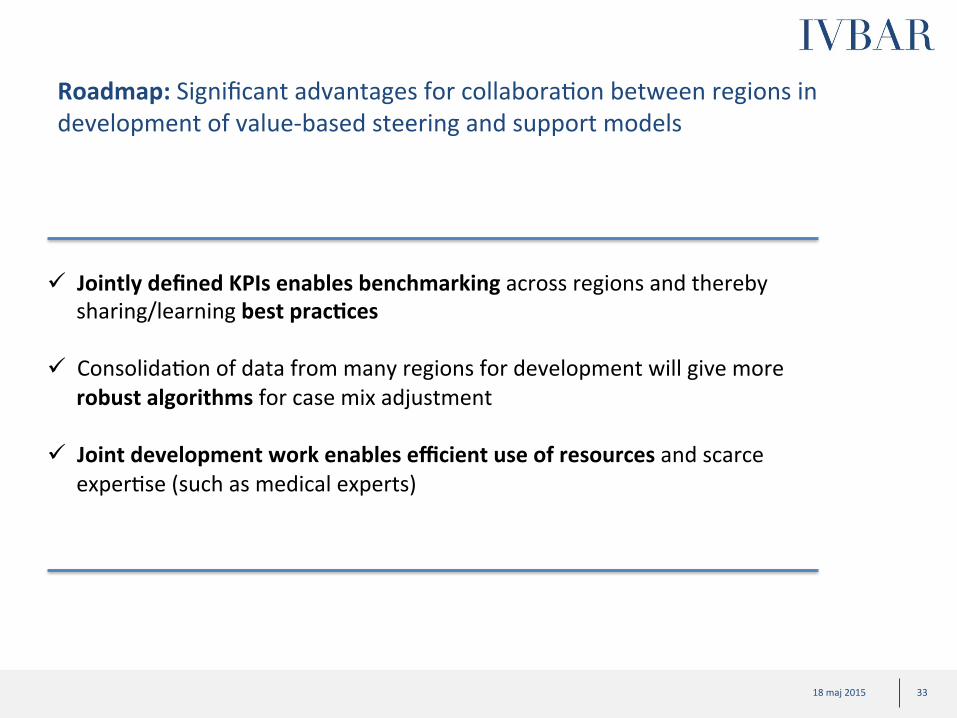
Roadmap: Significant advantages for collaboraCon between regions in development of value-‐based steering and support models
ü Jointly defined KPIs enables benchmarking across regions and thereby sharing/learning best prac?ces
ü ConsolidaCon of data from many regions for development will give more robust algorithms for case mix adjustment
ü Joint development work enables efficient use of resources and scarce
experCse (such as medical experts)

34 18 maj 2015
Key elements for a successful start UClize developed
systems from Sweden to get a running start and enable benchmarking
Combine regional autonomy with the
advantage of naConal collaboraCon
Engage all concerned stakeholders early
Show quick results
• Experience from Sweden shows that stakeholders tend to get more excited and involved when real data analysis is presented early
• Using Swedish systems as a starCng point will enable benchmarking between Sweden and Denmark at levels never performed before
• Each region lead at least one area/paCent group • All regions contribute with medical experCse and data to all paCent groups • Sharing of other experCse within other fields such as resources to make IT/
legal roadmap etc • Propose organisa?on similar to Sveus
• Perform iniCal stake-‐holder analysis and engage all relevant stakeholders in development program early
• E.g. Medical community, administraCve personnel, at clinic, region, municipal and naConal levels
• Plan program to enable selected few pilots to show quick results as proof of concept and to keep engagement high from program par?cipants as well as poli?cians

35 18 maj 2015
Content
• Background of feasibility study and case examples from Sweden
• Denmark starCng point (organisaConal readiness and data landscape)
• High level assessment of potenCal for ten selected paCent groups in Denmark
• Suggested roadmap for Denmark
• Appendix
– Feasibility project governance
– Synthesis of key stakeholder interviews
– Danish healthcare data prerequisites for adopCng value based steering and support models
– Deep-‐dives: Assessment of potenCal and “ease of implementaCon” of new steering models for ten selected paCent groups
– Example analysis on Childbirth based on Danish data

36 18 maj 2015
• Background of feasibility study and case examples from Sweden
• Denmark starCng point (organisaConal readiness and data landscape)
• High level assessment of potenCal for ten selected paCent groups in Denmark
• Suggested roadmap for Denmark
• Appendix
– Feasibility project governance
– Synthesis of key stakeholder interviews
– Danish healthcare data prerequisites for adopCng value based steering and support models
– Deep-‐dives: Assessment of potenCal and “ease of implementaCon” of new steering models for ten selected paCent groups
– Example analysis on Childbirth based on Danish data
Content
37 18 maj 2015 37 18 maj 2015
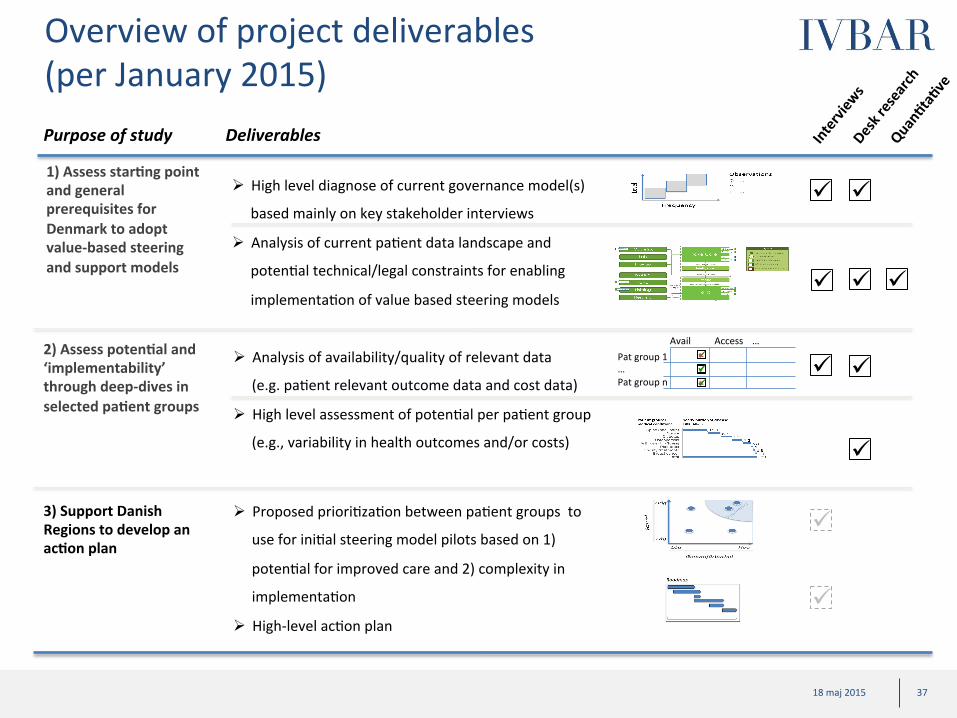
Overview of project deliverables (per January 2015) Purpose of study Deliverables
ü ü û ü ü
ü ü ü
û Pat group 1 … Pat group n
Avail Access …
ü
ü ü
ü
ü
ü ü ü
1) Assess star?ng point and general prerequisites for Denmark to adopt value-‐based steering and support models
3) Support Danish Regions to develop an ac?on plan
2) Assess poten?al and ‘implementability’ through deep-‐dives in selected pa?ent groups
ü
ü
Ø Analysis of availability/quality of relevant data (e.g. paCent relevant outcome data and cost data)
Ø High level assessment of potenCal per paCent group
(e.g., variability in health outcomes and/or costs)
Ø Proposed prioriCzaCon between paCent groups to use for iniCal steering model pilots based on 1)
potenCal for improved care and 2) complexity in
implementaCon
Ø High-‐level acCon plan
Ø High level diagnose of current governance model(s)
based mainly on key stakeholder interviews
Ø Analysis of current paCent data landscape and potenCal technical/legal constraints for enabling
implementaCon of value based steering models

38 18 maj 2015 38 18 maj 2015
Approach (per January 2015)
• Interview stakeholders centrally to understand starCng point e.g., – Data availability – Governance structures – Understand tech. systems
readiness – Outline legal consideraCons/ issues
• Collect complementary data
Phase 1: Conduct interviews and ini?ate data collec?on Phase 2: Perform analysis Phase 3: Conclude on
recommenda?ons
• Make overview on data availabiliCes • Make drat map of systems landscape
(e.g. paCent administraCve systems, naConal databases)
• Outline potenCal legal issues • Summarize high level observaCons of
current governance structures
• Set up project governance (e.g., steering group)
Project Prepara?on
• Make drat ranking of selected paCent groups based on: – PotenCal impact on paCent value
(health/cost) through introducing new steering models
– “Addressable share of potenCal” (i.e., ease of implementaCon, availability/accessibility of data)
~4-‐6 weeks ~ 2-‐3 weeks ~ 6-‐8 weeks
• Compile aggregated data for selected paCent groups with high healthcare spend; collect e.g., – “Burden of disease” (including
drivers e.g., incidence/ prevalence) – IndicaCon of variability in treatment
method/ results/ cost – Level of complexity
• Summarize benchmark (e.g., cost, health outcomes/frequency of complicaCons) from other countries
• Conclude on acCon plan based on idenCfied issues (based on analysis in phase 2)
• Summarize roadmap • Anchor with key decision makers (e.g.,
clinical professionals and poliCcians) -‐ on needs basis
• Propose how to address each analysed paCent group (e.g., monitoring and/or reimbursement system pilots)
Report/ Workshop (s)
• Support interviews/workshops – on needs basis
1) Assess star?ng point and general prerequisites for Denmark to adopt value-‐based steering and support models
3) Support Danish Regions to develop an ac?on plan
2) Assess poten?al and ‘ease of implementa?on’ through deep-‐dives in selected pa?ent groups
39 18 maj 2015 39 18 maj 2015
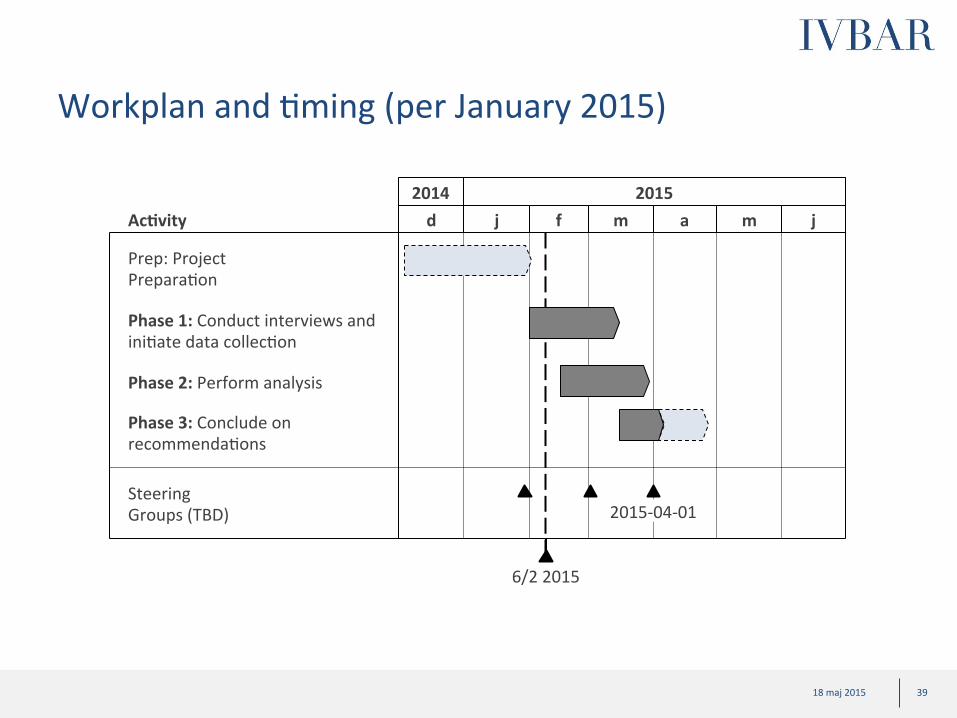
Workplan and Cming (per January 2015)
2014 2015 d j f m a m j
Phase 2: Perform analysis
Phase 3: Conclude on recommendaCons
Steering Groups (TBD) 2015-‐04-‐01
Ac?vity
6/2 2015
Phase 1: Conduct interviews and iniCate data collecCon
Prep: Project PreparaCon
40 18 maj 2015 40 18 maj 2015
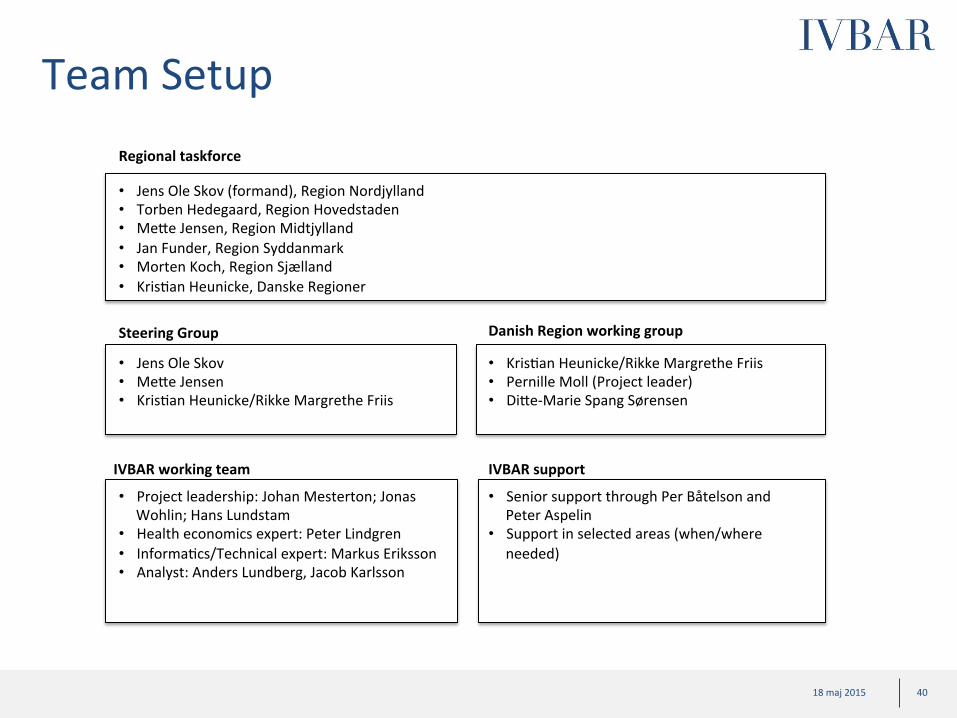
Team Setup
Steering Group
• Project leadership: Johan Mesterton; Jonas Wohlin; Hans Lundstam
• Health economics expert: Peter Lindgren • InformaCcs/Technical expert: Markus Eriksson • Analyst: Anders Lundberg, Jacob Karlsson
IVBAR working team
• Senior support through Per Båtelson and Peter Aspelin
• Support in selected areas (when/where needed)
IVBAR support
Regional taskforce
• Jens Ole Skov (formand), Region Nordjylland • Torben Hedegaard, Region Hovedstaden • MeWe Jensen, Region Midtjylland • Jan Funder, Region Syddanmark • Morten Koch, Region Sjælland • KrisCan Heunicke, Danske Regioner
Danish Region working group
• Jens Ole Skov • MeWe Jensen • KrisCan Heunicke/Rikke Margrethe Friis
• KrisCan Heunicke/Rikke Margrethe Friis • Pernille Moll (Project leader) • DiWe-‐Marie Spang Sørensen

41 18 maj 2015
• Background of feasibility study and case examples from Sweden
• Denmark starCng point (organisaConal readiness and data landscape)
• High level assessment of potenCal for ten selected paCent groups in Denmark
• Suggested roadmap for Denmark
• Appendix
– Feasibility project governance
– Synthesis of key stakeholder interviews
– Danish healthcare data prerequisites for adopCng value based steering and support models
– Deep-‐dives: Assessment of potenCal and “ease of implementaCon” of new steering models for ten selected paCent groups
– Example analysis on Childbirth based on Danish data
Content

42 18 maj 2015 42 18 maj 2015
Key stakeholder interviews: ~40 key leaders and experts have been interviewed to evaluate DK starCng point and future vision
Name Organisa3on/Region Kristian Heunicke Danske RegionerRikke Margrethe Friis Danske RegionerDitte S. Sørensen Danske RegionerCasper H. Mikkelsen Danske RegionerNiels Würgler Hansen FinansministerietSøren Varder FinansministerietPaul Bartels RKKPMads Hansen Ministeriet for Sundhed og ForebyggelseCharlotte Houggard Ministeriet for Sundhed og ForebyggelseSvend Særkjær Ministeriet for Sundhed og Forebyggelse Jens Ole Skov NordjyllandJan Funder SyddanmarkTorben Hedegaard Jensen/ Søren Helsted HovedstadenPoul Erik Hansen Statens SeruminstitutOle Thomsen/Mette Jensen MidtjyllandCarsten Lind MidtjyllandPoul Carstensen MidtjyllandMorten Koch/Lene Jørndrup SjællandHenrik Villadsen & Teis Andersen Roskilde & Køge SygehusKirsten Wisborg Aarhus UniversitetshospitalTue Jensen RigshospitaletKasper Axel Nielsen Foreningen af speciallægerMorten Freil og Annette Wandel Danske PatienterJes Søgaard Kræftens BekæmpelseJakob Kjellberg Sundhedsøkonom, KORAKatja Kayser København KommunePer Stenberg Christensen/Eva Bartels Region HovedstadenHelene Hedensted NordjyllandMarie Bussey Rask Danske RegionerAnn Vilhelmsen Danske RegionerCamilla Dürke Tybring Danske Regioner

43 18 maj 2015 43 18 maj 2015
Emerging perspecCve on starCng point in DK (1/2) -‐ What works well
Macro indicators of overall effec?ve health care delivery in DK compared to other countries
Successful centraliza?on of specialist care
Effec?ve cost containment through new budget law and effec?ve consequence management
Improved produc?vity through DRG-‐system
’A^er all, we are one of the healthiest countries in the world’
’Highly skilled and mo>vated healthcare professionals’
’In recent years, our increased focused on ac>vi>es have enabled us to improve produc>vity’
’DRG has really helped us gain produc>vity’
’Essen>ally, you can never get more than your budget, although you could get less if you don’t achieve your targets’
’People are generally very good at keeping their budgets…if you can’t keep your budget, your are typically fired ’
’our concentra>on to a few specialist ins>tu>ons means that we can aggregate volumes and get really good on what we are doing’
Quotes Hypothesis/early perspec3ve
Improved access through na?onal wai?ng ?me regula?ons
’Wai>ng >mes for select medical condi>ons are regulated by law’
’Na>onal regula>ons have been introduced in cancer and heart disease’

44 18 maj 2015 44 18 maj 2015
Emerging perspecCve on starCng point in DK (2/2) -‐ What could be improved
Need to ship focus in steering models from produc?vity to efficiency
Improved collabora?on between speciality care and primary care; Improved collabora?on between regions and municipali?es
Increase focus on outcomes that are relevant for pa?ents
’Pa>ent reported outcome measures are rarely measured and almost never used for organisa>on development or steering’
’We o^en don’t measure outcomes that ma_er to our pa>ents’
’half of all Danes visit the hospital every year which is too much”
’None in our system takes real responsibility for preven>on’
Quotes Hypothesis/early perspec3ve
’It is difficult for us to find ways of working with the municipali>es as it quickly becomes a ques>on of who should carry the cost’
’’No one has ever died from combining data, however many persons has likely died because we haven’t been able to connect the different data points’
’Wee have so much valuable data but its very fragmented and not used to its full poten>al’
’Much of the quality data is mainly used for research and not for quality improvement’
Improve the health care systems access to data
’ We need to shi^ focus from produc>vity (ac>vi>es and DRG-‐points) to efficiency’
’Some regions have started ini>a>ves to con>nuously monitor health outcomes, but we see limited ini>a>ves across regions’
45 18 maj 2015
Content
• Background of feasibility study and case examples from Sweden
• Denmark starCng point (organisaConal readiness and data landscape)
• High level assessment of potenCal for ten selected paCent groups in Denmark
• Suggested roadmap for Denmark
• Appendix
– Feasibility project governance
– Synthesis of key stakeholder interviews
– Danish healthcare data prerequisites for adop?ng value based steering and support models
– Deep-‐dives: Assessment of potenCal and “ease of implementaCon” of new steering models for ten selected paCent groups
– Example analysis on Childbirth based on Danish data

46 18 maj 2015 46 18 maj 2015
Broad overview of data landscape
Adm health care data
Health care data
Cost data
Linking possibiliCes via CPR
Quality data
Sociodemo-‐ graphic data
Social insurance data
Drugs data
Mortality data
Other data
Municipal care data
Diagnos?c data

47 18 maj 2015 47 18 maj 2015
Emerging perspecCve on data landscape with focus on regional level
Pa?ent characteris?cs Care process Resource use/costs Health outcomes
Relevance for value-‐based steering
Type of informa?on
Na3onal
Regional
Municipal
Hospital
Regional data availability: • AdministraCve data coupled with quality registers provides an excellent foundaCon for value-‐based steering
and support models • Certain, albeit not complete, informaCon around cost per paCent and usage of drugs is available • DiagnosCc data, as well as informaCon around social insurance and date of death are also available • Lack of certain details in primary care data and lack of municipal care data is a limiCng factor
Level Hospitals have
extensive data on their own paCents
Limited data availability at municipal level
Very comprehensive data at naConal level, but quality register-‐data is
lacking
48 18 maj 2015 48 18 maj 2015
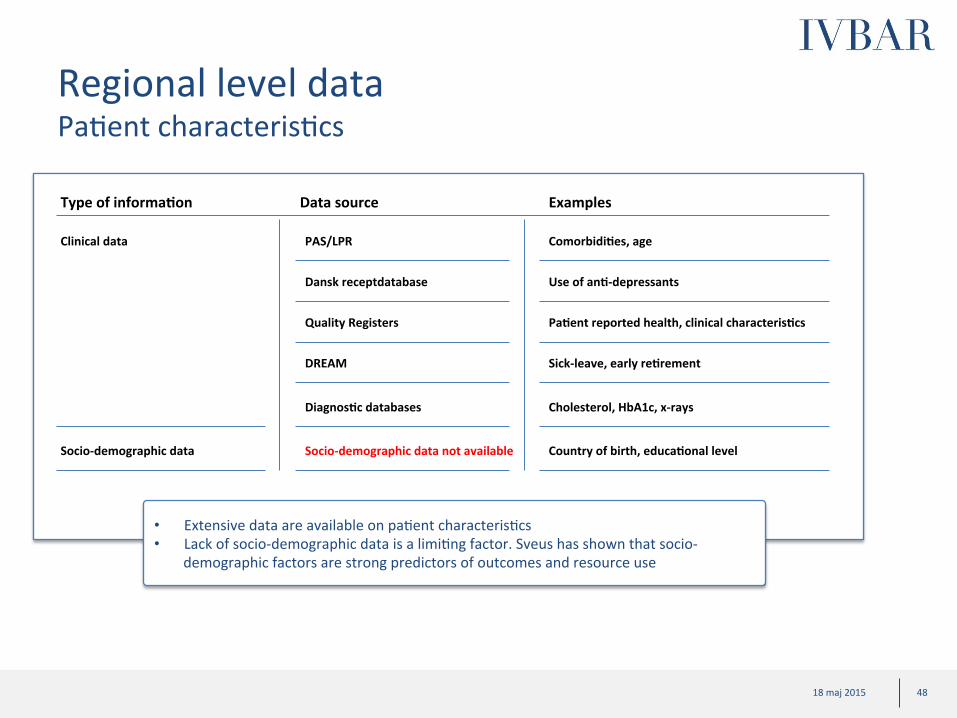
Regional level data PaCent characterisCcs
Clinical data
Type of informa?on Data source Examples
PAS/LPR Comorbidi?es, age
Dansk receptdatabase Use of an?-‐depressants
Quality Registers Pa?ent reported health, clinical characteris?cs
DREAM Sick-‐leave, early re?rement
Diagnos?c databases Cholesterol, HbA1c, x-‐rays
• Extensive data are available on paCent characterisCcs • Lack of socio-‐demographic data is a limiCng factor. Sveus has shown that socio-‐
demographic factors are strong predictors of outcomes and resource use
Socio-‐demographic data Socio-‐demographic data not available
Country of birth, educa?onal level
49 18 maj 2015 49 18 maj 2015
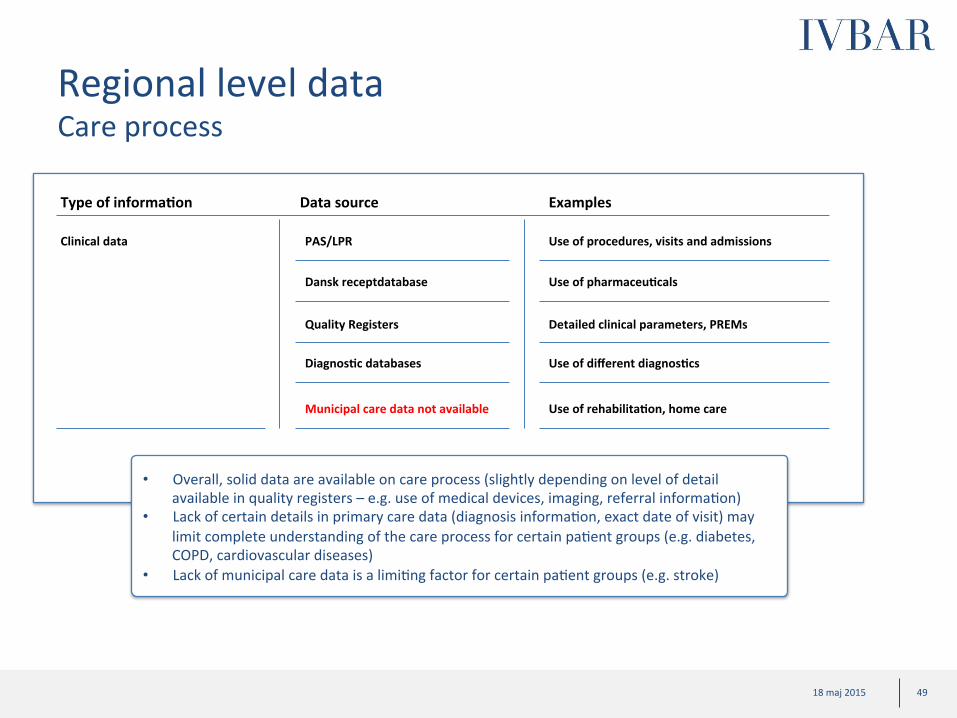
Regional level data Care process
Clinical data
Type of informa?on Data source Examples
PAS/LPR Use of procedures, visits and admissions
Dansk receptdatabase Use of pharmaceu?cals
Diagnos?c databases Use of different diagnos?cs
Quality Registers Detailed clinical parameters, PREMs
• Overall, solid data are available on care process (slightly depending on level of detail available in quality registers – e.g. use of medical devices, imaging, referral informaCon)
• Lack of certain details in primary care data (diagnosis informaCon, exact date of visit) may limit complete understanding of the care process for certain paCent groups (e.g. diabetes, COPD, cardiovascular diseases)
• Lack of municipal care data is a limiCng factor for certain paCent groups (e.g. stroke)
Municipal care data not available Use of rehabilita?on, home care
50 18 maj 2015 50 18 maj 2015
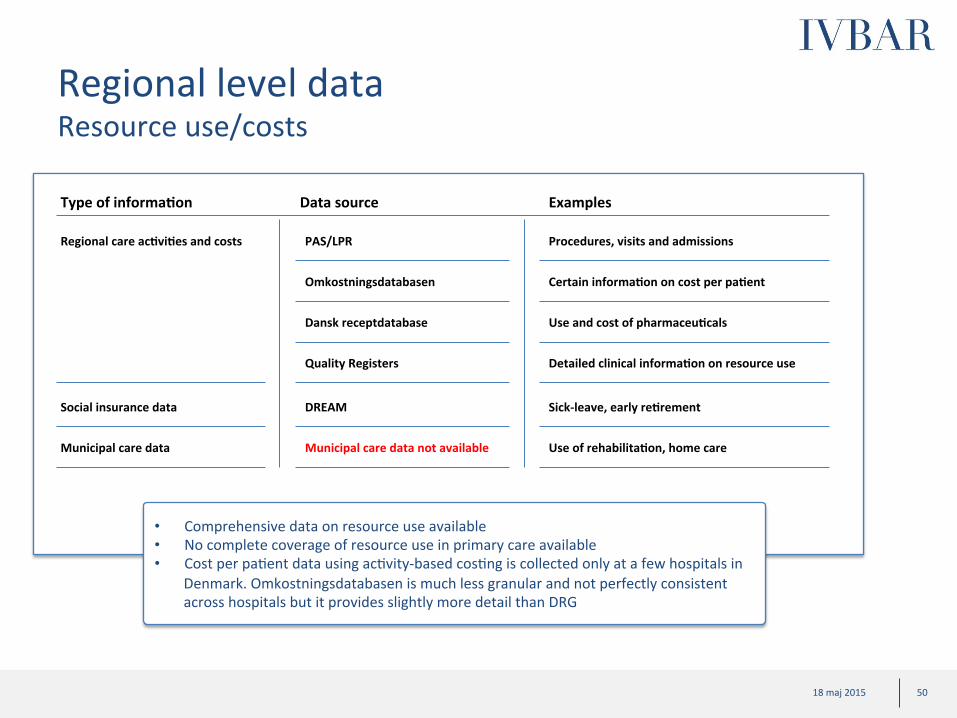
Regional level data Resource use/costs
Regional care ac?vi?es and costs
Type of informa?on Data source Examples
PAS/LPR Procedures, visits and admissions
Omkostningsdatabasen Certain informa?on on cost per pa?ent
Dansk receptdatabase Use and cost of pharmaceu?cals
Quality Registers Detailed clinical informa?on on resource use
Social insurance data DREAM Sick-‐leave, early re?rement
• Comprehensive data on resource use available • No complete coverage of resource use in primary care available • Cost per paCent data using acCvity-‐based cosCng is collected only at a few hospitals in
Denmark. Omkostningsdatabasen is much less granular and not perfectly consistent across hospitals but it provides slightly more detail than DRG
Municipal care data Municipal care data not available Use of rehabilita?on, home care

51 18 maj 2015 51 18 maj 2015
Regional level data Health outcomes
Mortality
Type of informa?on Data source Examples
Date of death
Date of death
Morbidity PAS/LPR Complica?ons
DREAM Return to work
Quality Registers PROMs, detailed clinical outcomes
Dansk receptdatabase Use of an?depressants, an?bio?cs
• InformaCon about mortality is captured, but not informaCon on cause of death • Data on complicaCons give informaCon about health outcomes achieved • PharmaceuCcal use, diagnosCcs and also return to work provide informaCon can all be used
as indicators of health outcomes. • Moreover, more detailed clinical outcomes are available in several quality registers • PaCent reported outcomes are collected only in a few quality registers
Diagnos?c databases Change in cholesterol, blood pressure, HbA1c
PAS/LPR Diagnosis codes for inpa?ent death
Municipal care data not available Need for rehabilita?on, home care

52 18 maj 2015 52 18 maj 2015
NaConal level data PaCent characterisCcs
Clinical data
Type of informa?on Data source Examples
LPR Comorbidi?es, age
Lægemiddelsta?s?kregisteret Use of an?-‐depressants
Quality Registers not available* Clinical characteris?cs, comorbidi?es
DREAM Sick-‐leave, early re?rement
Socio-‐demographic data Sta?s?cs Denmark’s databases Country of birth, educa?onal level
• Extensive data are available on paCent characterisCcs, including socio-‐demographic data
• Certain clinical characterisCcs may be lacking in the absence of quality register data
Diagnos?c databases Cholesterol, HbA1c, x-‐rays
* A limited number of quality databases are based on informaCon from naConal databases and these are available at naConal level
53 18 maj 2015 53 18 maj 2015
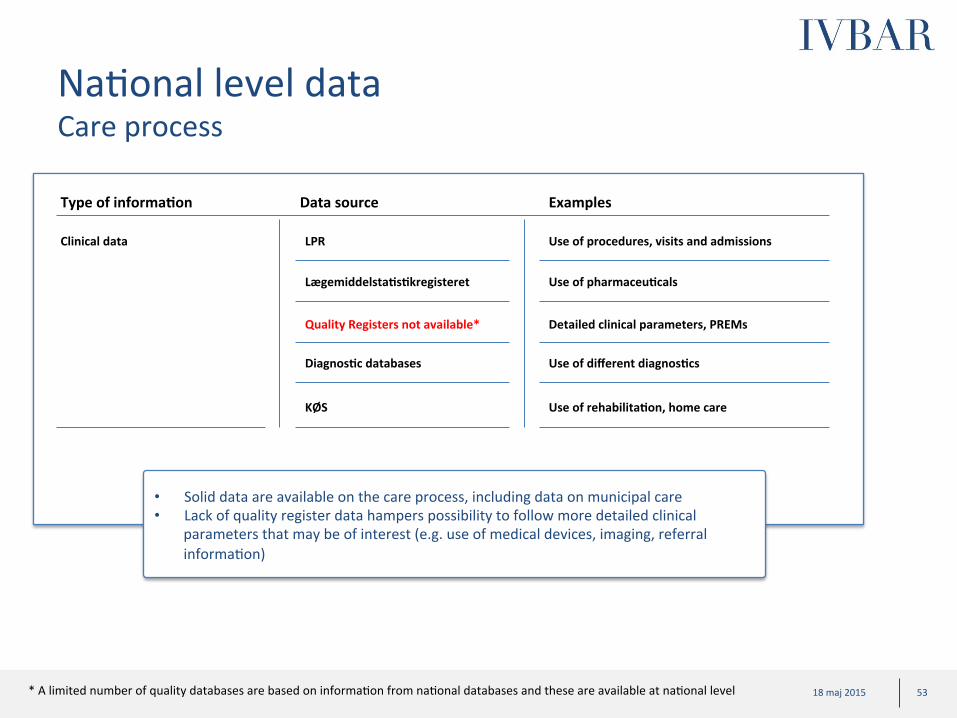
NaConal level data Care process
Clinical data
Type of informa?on Data source Examples
LPR Use of procedures, visits and admissions
Lægemiddelsta?s?kregisteret Use of pharmaceu?cals
Diagnos?c databases Use of different diagnos?cs
Quality Registers not available* Detailed clinical parameters, PREMs
• Solid data are available on the care process, including data on municipal care • Lack of quality register data hampers possibility to follow more detailed clinical
parameters that may be of interest (e.g. use of medical devices, imaging, referral informaCon)
KØS Use of rehabilita?on, home care
* A limited number of quality databases are based on informaCon from naConal databases and these are available at naConal level

54 18 maj 2015 54 18 maj 2015
NaConal level data Resource use/costs
Regional care ac?vi?es and costs
Type of informa?on Data source Examples
LPR Procedures, visits and admissions
Omkostningsdatabasen Es?mated cost per pa?ent
Lægemiddelsta?s?kregisteret Use and cost of pharmaceu?cals
Quality Registers not available* Detailed clinical informa?on on resource use
Social insurance data DREAM Sick-‐leave, early re?rement
• Comprehensive data on resource use available • No complete coverage of resource use in primary care available • Cost per paCent data using acCvity-‐based cosCng is collected only at a few hospitals in
Denmark. Omkostningsdatabasen is slightly less granular but provides more detail than DRG
Municipal care data KØS Use of rehabilita?on, home care
* A limited number of quality databases are based on informaCon from naConal databases and these are available at naConal level
55 18 maj 2015 55 18 maj 2015
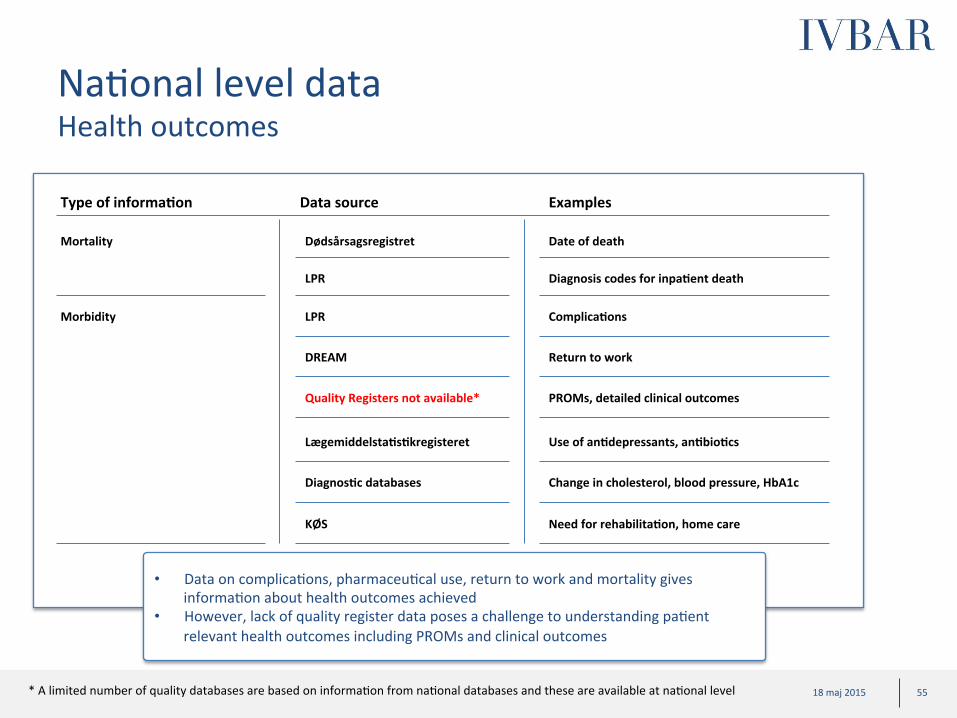
NaConal level data Health outcomes
Mortality
Type of informa?on Data source Examples
Dødsårsagsregistret Date of death
Morbidity LPR Complica?ons
DREAM Return to work
Quality Registers not available* PROMs, detailed clinical outcomes
Lægemiddelsta?s?kregisteret Use of an?depressants, an?bio?cs
• Data on complicaCons, pharmaceuCcal use, return to work and mortality gives informaCon about health outcomes achieved
• However, lack of quality register data poses a challenge to understanding paCent relevant health outcomes including PROMs and clinical outcomes
Diagnos?c databases Change in cholesterol, blood pressure, HbA1c
LPR Diagnosis codes for inpa?ent death
KØS Need for rehabilita?on, home care
* A limited number of quality databases are based on informaCon from naConal databases and these are available at naConal level

56 18 maj 2015 56 18 maj 2015
High level legal analysis (1/2) -‐ Legal quesCons and data sources/databases
• PaCent AdministraCve Systems (paCentadministraCve systemer)
• Danish NaConal PaCent Registry (LandspaCentregisteret)
• Cost Database (PaCentrelateret Omkostningsdatabase)
• The Danish NaConal Database of Reimbursed PrescripCons (Dansk Receptdatabase)
• Clinical Quality Databases (kliniske kvalitetsdatabaser)
• Danish Register for EvaluataCon of MarginalisaCon (Dansk Register for Evaluering af Marginalisering (DREAM))
• DiagnosCcs Databases (diagnose databaser)
Legal ques3ons Databases
The Danish Regions wish to use data for two purposes related to governance: 1. Using data for monitoring/analysis of
health outcomes, resource use and other indicators -‐ Data from different providers and data sources will be linked on paCent-‐level using CPR number and will be reported back to regions/hospitals/clinics on a aggregated level (without possibility to idenCfy individual paCents)
2. Using data for changes to reimbursement logic -‐ Data from different providers and data sources will be linked on paCent-‐level using CPR number to determine reimbursement
57 18 maj 2015 57 18 maj 2015
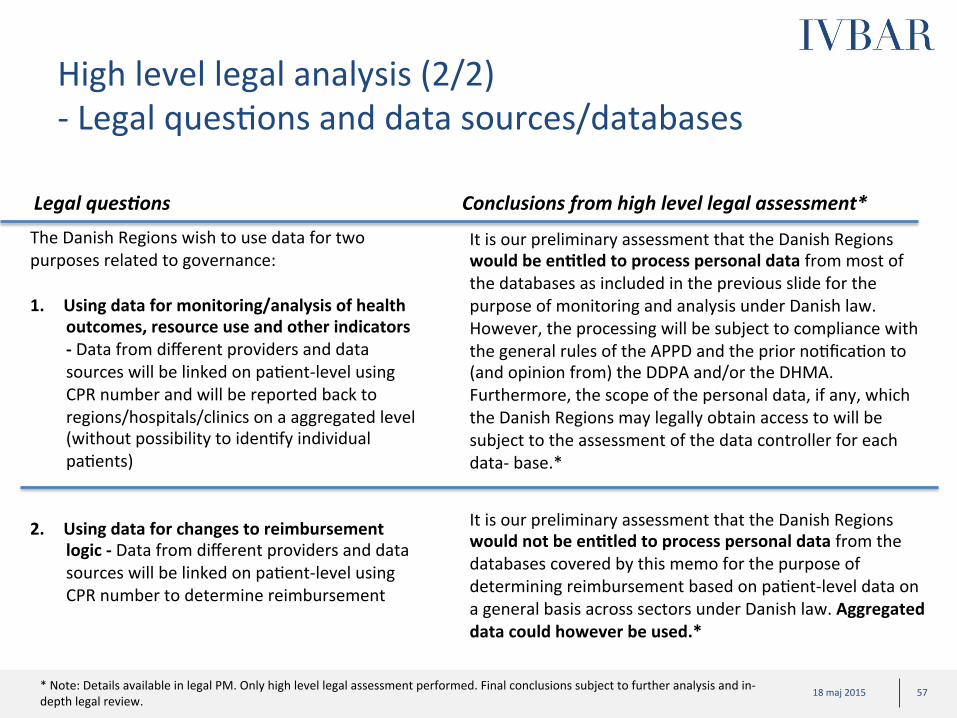
High level legal analysis (2/2) -‐ Legal quesCons and data sources/databases
Legal ques3ons
It is our preliminary assessment that the Danish Regions would be en?tled to process personal data from most of the databases as included in the previous slide for the purpose of monitoring and analysis under Danish law. However, the processing will be subject to compliance with the general rules of the APPD and the prior noCficaCon to (and opinion from) the DDPA and/or the DHMA. Furthermore, the scope of the personal data, if any, which the Danish Regions may legally obtain access to will be subject to the assessment of the data controller for each data-‐ base.*
It is our preliminary assessment that the Danish Regions would not be en?tled to process personal data from the databases covered by this memo for the purpose of determining reimbursement based on paCent-‐level data on a general basis across sectors under Danish law. Aggregated data could however be used.*
Conclusions from high level legal assessment* The Danish Regions wish to use data for two purposes related to governance: 1. Using data for monitoring/analysis of health
outcomes, resource use and other indicators -‐ Data from different providers and data sources will be linked on paCent-‐level using CPR number and will be reported back to regions/hospitals/clinics on a aggregated level (without possibility to idenCfy individual paCents)
2. Using data for changes to reimbursement
logic -‐ Data from different providers and data sources will be linked on paCent-‐level using CPR number to determine reimbursement
* Note: Details available in legal PM. Only high level legal assessment performed. Final conclusions subject to further analysis and in-‐depth legal review.

58 18 maj 2015
• Background of feasibility study and case examples from Sweden
• Denmark starCng point (organisaConal readiness and data landscape)
• High level assessment of potenCal for ten selected paCent groups in Denmark
• Suggested roadmap for Denmark
• Appendix
– Feasibility project governance
– Synthesis of key stakeholder interviews
– Danish healthcare data prerequisites for adopCng value based steering and support models
– Deep-‐dives: Assessment of poten?al and “ease of implementa?on” of new steering models for ten selected pa?ent groups
– Example analysis on Childbirth based on Danish data
Content

59 18 maj 2015 59 18 maj 2015
Process to select deep-‐dives
Long-‐list of paCent groups Short-‐list Deep-‐dives
• Long-‐list of paCent groups selected based on: – Input from regional
experts (DR steering group)
– SVEUS groups – Top 15 in ”Cost” (proxy
for burden of disease)
• Short-‐list derived based on – Complexity (e.g.,
organizaConal) – Data availability
• For each short-‐listed medical condiCon, data is gathered to evaluate – potenCal impact
(e.g., burden of disease & variaCon)
– “ease of implementaCon”
Note: more details available in appendix

60 18 maj 2015 60 18 maj 2015
ü
Long-‐list of paCent groups for deep-‐dives
0,30,30,30,40,40,40,50,50,50,50,60,60,60,60,70,70,70,70,70,70,70,8
0,80,80,80,80,9
1,11,2
1,41,4
1,5
TBD
Chronic ischaemic heart disease
NonrheumaCc aorCc valve disorders
Obesity (bariatric surgery)** Arm fracture
Lower leg fracture Lymphoma
Gallstone Neonatal care Rectal cancer
Angina pectoris
COPD Leukemia
Rheumatoid arthriCs
Heart failure
Atrial fibrillaCon
Myocardial infarcCon
ReCnopathy
Colon cancer Malign tumour
Femoral fracture Hip arthriCs
Sepsis
Knee arthriCs
Prostate cancer
Lung cancer
Breast cancer**
Stroke
MulCple sclerosis
Childbirth
0,8**
Respiratory insufficiency Spine disease/back pain
Pneumonia
Renal insufficiency
Diabetes
Cost of specialized care (inpa?ent and outpa?ent grouped by primary diagnosis ProducCon cost in 2013, Millions DKR (inpaCent and outpaCent care)
Note: Diagnoses groups may not correspond to relevant paCent groups for the value based framework (to be determined) *: PaCents with one or more specialized care contact with a matching primary diagnosis during 2013 ** Rough esCmate/ExtrapolaCon based on Swedish numbers Source: LPR 2013. Cost calculaCon based on Totpris_genop (inpaCent care) and Pris (outpaCent care)
SVEUS
ü
ü ü
ü
ü
ü
ü
ROUGH ESTIMATES
ü
Selected long list based on criteria: • SVEUS paCent
groups • Expert opinion • Top 15 in
”Cost” (proxy for burden of disease)
Deep-‐dives
Long-‐list

61 18 maj 2015 61 18 maj 2015
Synthesis of deep-‐dives Deep-‐dives
Poten?
al
Approach
Summary of poten3al by disease area
A1
A2
A
B
Burden of disease
Varia>on (cost and/or outcomes)
Synthesis “Ease of implementa3on” • Organiza>onal complexity • Data availability
INDICATIVE
Complex ‘Easy’
High
“Ease of implementa?on”
Reumathoid arthriCs Stroke
Childbirth
Diabetes
Breast cancer
Prostate cancer
MulCple sclerosis
Obesity (surgery)
Knee-‐replacement
Hip-‐replacement Low

62 18 maj 2015 62 18 maj 2015
Key inputs on paCent group potenCal
Prevalence Per 100’
Incidence Per 100’
Burden of disease DKK billion
N/A
N/A
7 200
750
N/A
220
N/A
N/A
N/A
6 700
8
612
1 033
143
160
118
138
31
17**
424
2,9
2,5
1,9
0,8
10,3
3,5
1,8
0,8*
2,4
2,6
Comments
• High incidence • Variability in recurrence observed
Overall poten?al***
Breast cancer
Childbirth
Diabetes
Hip replacement
Knee replacement
Mul?ple sclerosis
Obesity (bariatric surgery)
Prostate cancer
Rheumatoid arthri?s
Stroke
Indica?on of Varia?on
* Excluding indirect cost and costs of maternity care and neonatal care ** Number of bariatric surgeries per 100 000 inhabitants
• High volumes • Impact on neonatal care
• High and increasing prevalence • Very large disease burden
• High incidence and burden • Large variability observed
• High incidence and burden • Large variability observed
• Large variaCon observed in both outcomes and care process
• Only minor part of obesity burden assessed by surgery
• Variability in complicaCons and care process observed
• Large disease burden • Costly pharmaceuCcal treatments
• High indirect costs • Very large variaCon observed
in Danish registry
A A1
A2 A
Low High
*** Based 75% on burden of disease and 25 % on variability
Deep-‐dives

63 18 maj 2015 63 18 maj 2015
Exemplary indicators on variaCon in outcomes/costs
Breast cancer
Childbirth
Diabetes
Hip replacement
Knee replacement
Mul?ple sclerosis
Obesity surgery
Prostate cancer
Rheumatoid arthri?s
Stroke • 30 day mortality varies between 6 % (Amager) and 55 % (HE Midt); equivalent figures in Sweden span 5 % to 17 % • Share of paCents being readmiWed in 30 days varies between 0 % (Dronninglund) and 22 % (Amager); readmiWance
rates in Sweden vary between 36 % and 57 %
Indica?on of varia?on
• Share of paCents, treated with biological drugs, with improved or staConary level of funcConality varies between 64 % (Holbæk) and 100 % (Frederica)
• Share of paCents, treated with biological drugs, with improved or staConary level of pain varies between 87 % (Rigshospitalet) and 100 % (Frederica)
• Share of paCents with urethral stricture complicaCons within 1 year varies between 1 % (Aalborg) and 7 % (Hosp. Vest) • Share of paCents recieving nerve preserving surgical procedures varies between 82 % (Rigshospitalet) and 46 %
(Aalborg)
• Excess body mass index loss more than 50 % in 1 year varies between 85 % (Sydvestjysk) and 96 % (Aalborg) • Improvements (yes or no) in HRQoL (Moorehead) varies between 84 % (Sydvestjysk) and 100 % (Aalborg, OUH Svendborg) • Readmission frequency in 30 days varies between 2 % (Privathospitalen) and 14 % (Viborg)
Examples of indicator varia?on (not exhaus?ve)*
• C-‐secCon rate varies between 15.4% (Sønderborg) and 26.1% (Odense/Svendborg). • Apgar score 9-‐10 (measure of good fetal health) varies between 93.8% (Esbjerg) and 97.7% (Hvidovre).
• Share of paCents under treatment and with a starCng EDSS score of 4 or less, reaching a EDSS score of 4 or more (endpoint) ater 5 years of follow-‐up varies between 47 % (Roskilde) and 94 % (Hillerød)
• Share of paCents working full Cme when starCng treatment not doing so at 5 year follow-‐up varies between 20 % (Rigshospitalet) and 90 % (Herlev)
• Implant revision in 2 years (primary arthrosis), Hospital: 0.0 % (Thy-‐Mors Thisted) -‐ 6.9 % (Holbæk) • Implant survival 5 years (primary arthrosis), Hospital: 91.0 % (Sydvestjysk Grindsted) ) -‐ 100 % (Several)
• Share of paCents progressing to severe diabeCc reCnopathy varies between 0 % (Hillerød) and 38 % (Roskilde) • Median HbA1c for T2DM paCents in specialized care varies between 50 mmol/mol (Gentote) and 66 (Bornholm)
• Share of paCents with recurring cancer in 5 years following breast preserving treatments varies between 0.7 % (Aalborg) and 2.0 % (HJØRRING)
• Share of paCents without surgery related complicaCons in 30 days varies between 91 % (Esbjerg) and 100% (Ringsted)
Pa?ent groups
• Regional level variaCon: 5-‐year arthroplasty revision rate, 3.2 % -‐ 9.2 % • Length of hospital stay for TKA, 2.6 (Privathospitaler) -‐ 4.0 (Nordjylland). Average 3.3 days
A2
* Note: VariaCons in indicators are not adjusted for possible differences in casemix
Low High
Deep-‐dives

64 18 maj 2015 64 18 maj 2015
Key inputs on “ease of implementaCon”
Breast cancer
Data availability
Overall implementability* Comment
Organiza?onal complexity
• Excellent data availability • Experience from Sveus
Childbirth • Excellent data availability and well defined episode • Experience from Sveus
Diabetes • High primary care involvement adds complexity • Experience from Sveus
Hip replacement
• Excellent data availability and well defined episode • Experience from Sveus
Knee replacement
• Excellent data availability and well defined episode • Experience from Sveus
Mul?ple sclerosis
• Good data availability • Certain primary care and municipal care involvement
Obesity surgery • Excellent data availability • Experience from Sveus
Prostate cancer • Excellent data availability • ICHOM has proposed indicator standard sets
Rheumatoid arthri?s
• Excellent data availability • Certain primary care and municipal care involvement
Stroke • High municipal care involvement • Experience from Sveus
Spec. Care
Prim. Care
Mun. Care
* Based 50% on complexity and 50% on data availability
B
High Low Low
High Low -‐
Medium High -‐
High Low -‐
High Low -‐
High Low Medium
High Low -‐
High Low Low
High Low Medium
High Low High
Low High
Deep-‐dives

65 18 maj 2015 65 18 maj 2015
Assessment of potenCal impact in Childbirth
Substan?al poten?al in terms of bewer resource use and quality improvements • High volumes and high health care costs, especially when including costs of maternity care and neonatal care
• RelaCvely large variaCon among clinics in mode of delivery, which is linked to health outcomes and resource use
• VariaCon among clinics in the rate of foetal and maternal complicaCons Sources: 1 Dansk Kvalitetsdatabase for Fødsler, Årsrapport 2013 2 Team analysis based on Bellanger et al. What can we learn from a cross-‐country comparison of the costs of child delivery? Health Econ. 17: S47–S57 (2008); Socialstyrelsen Öppna jämförelser 2013 Hälso-‐ och sjukvård. Excludes indirect cost and costs of maternity care and neonatal care 3 LandspaCentregistret
Informa?on type Informa?on
Burden of disease
Epidemiological measures
Prevalence NA
Incidence 1 033 per 100 0001
Costs Direct costs 830 million DKK2
Indirect costs
Iden?fied varia?on
Outcomes
Among clinics with >1000 births/year, Apgar score 9-‐10 (measure of good foetal health) varies between 93.8% (Esbjerg) and 97.7% (Hvidovre) 1 Among clinics with >1000 births/year, Severe perineal tears (grade 3-‐4) varies between 5.5 % (Hvidovre) and 7.0 % (Odense/Svendborg) 1
Resource use
C-‐secCon rates vary (see below). Data from LPR indicates that LoS following c-‐secCon (DO82) is 4 days compared to 2 days following spontaneous vaginal delivery (DO80). Moreover, per diem cost for c-‐secCon is expected to be higher for c-‐secCons. Together, this indicates variaCon in resource use associated with childbirth.3
Care process Among clinics with >1000 births/year, C-‐secCon rates varies between 15.4% (Sønderborg) and 26.1% (Odense/Svendborg). Emergency c-‐secCon varies between 9.5% (Sønderborg) and 15.6% (Odense/Svendborg). 1
* Note: more details available in appendix
Deep-‐dives

66 18 maj 2015 66 18 maj 2015
Assessment of Ease of implementaCon in Childbirth
Limited organiza-‐ ?onal complexity
Sa?sfactory data availability to get started with improved monitoring PROMs and PREMs need to be complemented longer term
Organiza?onal level Integrated part of the care episode
Organiza?onal complexity
Specialized care X Primary care (X) Municipal care -‐
Informa?on sources: 1 PAS/LandspaCentregistret (LPR) 2 Dansk Kvalitetsdatabase for Fødsler and Dansk Føtalmedicinsk Database. 3 Omkostningsdatabasen 4 Dansk receptdatabase or LægemiddelstaCsCkregisteret 5 KØS 6 Dødsårsagsregistret (only date of death at regional level) 7 DREAM 8 Various databases at StaCsCcs Denmark
Examples of exis?ng poten?ally relevant variables 9 Age 10 History of sick leave 11 EducaConal level, civil status, country of birth 12 Gynaecological disorders, Diabetes 13 Foetal posiCon, premature delivery 13 Length of stay at delivery, readmissons, number of visits in outpaCent specialized care 14 Time to epidural/spinal anesthesia, presence of midwife or doctor at maternity ward, Cme to very emergent c-‐secCon 16 Time to emergent c-‐secCon, Time to very emergent c-‐secCon 17 Sick-‐leave ater birth 18 Mother and child skin-‐on-‐skin, Child APGAR score 19 Uncomplicated births under normal condiCons, C-‐secCon despite normal condiCons 20 Births with severe hypoxia in the new-‐born, major bleeding, severe ruptures in the perineum
NaConal level
Regional level
Regional and naConal level M=Missing
Measures type
Informa?on source types
Example of relevant data missing
Adm
. Care db
1
Qual. reg
2
Cost d
b 3
Drug db
4
DiagnosCc db
Mun
icipal
care db
5 Causes o
f death db
6 Social
insurance db
7 Socio-‐
dem
ograph
ic db
8
Data availability
PaCent characterisCcs
Sociodemographic informaCon X9 X9 -‐ -‐ -‐ -‐ -‐ X10 X11
Health profile ComorbidiCes X12 -‐ -‐ X -‐ -‐ -‐ -‐ -‐ Other clinically relevant characterisCcs X13 M -‐ X -‐ -‐ -‐ -‐ -‐ Previous births, previous c-‐
secCons
Care process
Treatment process X14 X15 -‐ X X -‐ -‐ -‐ -‐
Time X16 -‐ -‐ -‐ -‐ -‐ -‐ -‐
Resource use/costs X -‐ X X -‐ -‐ -‐ X17 -‐
PREMs -‐ M -‐ -‐ X -‐ -‐ -‐ -‐ PREMs
Health outcome indicators -‐ X18 -‐ -‐ -‐ -‐ -‐ -‐ -‐
Health outcomes (paCent relevant)
Short and long term outcomes
Mortality -‐ -‐ -‐ -‐ -‐ X -‐ -‐
ObjecCve outcomes -‐ X19 -‐ -‐ -‐ -‐ -‐ -‐ -‐
PROMs -‐ M -‐ -‐ -‐ -‐ -‐ -‐ -‐ PROMs
Process of recovery ComplicaCons X X20 -‐ X -‐ -‐ X -‐ -‐
Time to recovery -‐ -‐ -‐ -‐ -‐ -‐ -‐ -‐ -‐
* Note: more details available in appendix
Deep-‐dives
67 18 maj 2015 67 18 maj 2015
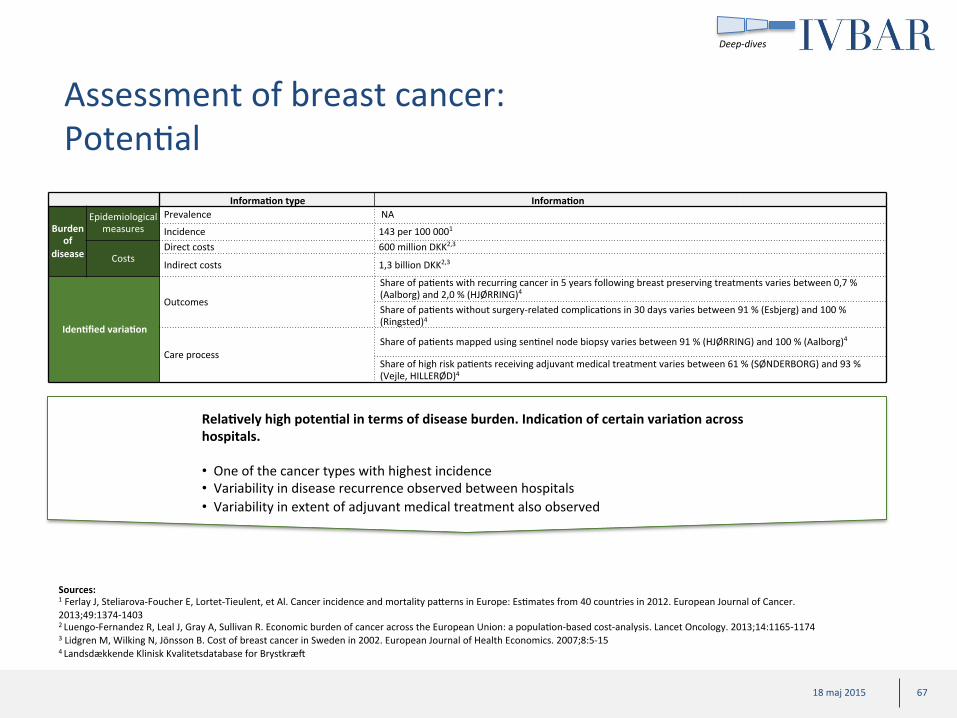
Assessment of breast cancer: PotenCal
Sources: 1 Ferlay J, Steliarova-‐Foucher E, Lortet-‐Tieulent, et Al. Cancer incidence and mortality paWerns in Europe: EsCmates from 40 countries in 2012. European Journal of Cancer. 2013;49:1374-‐1403 2 Luengo-‐Fernandez R, Leal J, Gray A, Sullivan R. Economic burden of cancer across the European Union: a populaCon-‐based cost-‐analysis. Lancet Oncology. 2013;14:1165-‐1174 3 Lidgren M, Wilking N, Jönsson B. Cost of breast cancer in Sweden in 2002. European Journal of Health Economics. 2007;8:5-‐15 4 Landsdækkende Klinisk Kvalitetsdatabase for Brystkræt
Informa?on type Informa?on
Burden of
disease
Epidemiological measures
Prevalence NA
Incidence 143 per 100 0001
Costs Direct costs 600 million DKK2,3
Indirect costs 1,3 billion DKK2,3
Iden?fied varia?on
Outcomes
Share of paCents with recurring cancer in 5 years following breast preserving treatments varies between 0,7 % (Aalborg) and 2,0 % (HJØRRING)4 Share of paCents without surgery-‐related complicaCons in 30 days varies between 91 % (Esbjerg) and 100 % (Ringsted)4
Care process Share of paCents mapped using senCnel node biopsy varies between 91 % (HJØRRING) and 100 % (Aalborg)4
Share of high risk paCents receiving adjuvant medical treatment varies between 61 % (SØNDERBORG) and 93 % (Vejle, HILLERØD)4
Rela?vely high poten?al in terms of disease burden. Indica?on of certain varia?on across hospitals. • One of the cancer types with highest incidence • Variability in disease recurrence observed between hospitals • Variability in extent of adjuvant medical treatment also observed
Deep-‐dives

68 18 maj 2015 68 18 maj 2015
Assessment of breast cancer: Complexity in implementaCon
Organiza?onal level Integrated part of the care episode
Organiza?onal complexity
Specialized care X Primary care (X) Municipal care (X)
Medium organiza-‐ ?onal complexity
Excellent data availability • Available data
covers many aspects of value based steering
• Lack of municipal data at regional level a slight limitaCon
• PROMs missing
NaConal level
Regional level
Regional and naConal level M=Missing
Measures type
Informa?on source types
Example of relevant data missing
Adm
. Care db
1
Qual. reg
2
Cost d
b 3
Drug db
4
DiagnosCc db
Mun
icipal
care db
5 Causes o
f death db
6 Social
insurance db
7 Socio-‐
dem
ograph
ic db
8
Data availability
PaCent characterisCcs
Sociodemographic informaCon X9 -‐ -‐ -‐ -‐ -‐ -‐ X10 X11
Health profile ComorbidiCes X12 -‐ -‐ X13 -‐ -‐ -‐ -‐ -‐ Other clinically relevant characterisCcs X14 M -‐ -‐ X15 -‐ -‐ -‐ -‐ Tumor type/prognosis
Care process
Treatment process X16 X17 -‐ X19 X X -‐ -‐ -‐ Time X -‐ -‐ -‐ -‐ -‐ -‐ -‐ Resource use/costs X18 X19 X18 X19 X X -‐ X20 -‐ PREMs -‐ M -‐ -‐ -‐ -‐ -‐ -‐ -‐ PREMs
Health outcome indicators -‐ -‐ -‐ -‐ X -‐ -‐ -‐ -‐
Health outcomes (paCent relevant)
Short and long term outcomes
Mortality -‐ -‐ -‐ -‐ -‐ X -‐ -‐ ObjecCve outcomes -‐ X21 -‐ -‐ X -‐ -‐ -‐ -‐ PROMs -‐ M -‐ -‐ -‐ -‐ -‐ -‐ -‐ PROMs
Process of recovery ComplicaCons X22 X23 -‐ X -‐ -‐ X -‐ -‐ Time to recovery -‐ -‐ -‐ -‐ -‐ -‐ -‐ -‐ -‐
Examples of exis?ng poten?ally relevant variables 9 Age 10 History of sick leave 11 EducaConal level, civil status, country of birth 12 Elixahauser Comorbidity Index, Charlson Comorbidity Index 13Drug use reflecCng comorbidiCes 14 MetastaCc disease 15 Possibility to extract data on prognosCc factors 16 Number of visits in specialised outpaCent care 17Type of surgery, Removal of axillary lymph nodes, Adjuvant medical treatment for high risk paCents, Adjuvant radiotherapy, PreoperaCve diagnose using needle biopsy, Malign:benign surgery raCo, ParCcipaCon in 5 year follow-‐up 18 Related mainly to treatment process and complicaCons 19 Use of adjuvant drugs 20 Sick leave ater surgery 21 Local recurring tumors for breast preserving technique, Absence of lymph node metastasis, Late senCnel node metastasis 22 ER-‐visits due to drug-‐induced infecCons 23 Absence of surgical complicaCons
Informa?on sources: 1 PAS/LandspaCentregistret (LPR) 2 Landsdækkende Klinisk Kvalitetsdatabase for Brystkræt 3 Omkostningsdatabasen 4 Dansk receptdatabase or LægemiddelstaCsCkregisteret 5 KØS 6 Dødsårsagsregistret (only date of death at regional level) 7 DREAM 8 Various databases at StaCsCcs Denmark
Deep-‐dives

69 18 maj 2015 69 18 maj 2015
Assessment of diabetes: PotenCal
Sources: 1 Carstensen B, Kristensen J, OWosen P, Borch-‐Johnsen K. The Danish NaConal Diabetes Register: trends in incidence, prevalence and mortality. Diabetologia. 2008;51: 2187-‐2196 2 Team analysis of Carstensen 2008 and Bolin K, Gip C, Mörk A, Lindgren B. Diabetes, healthcare cost and loss of producCvity in Sweden 1987 and 2005—a register-‐based approach. DiabeCc Medicine. 2009;26:928-‐934 3 Dansk Diabetes Database 4 SSI: PaCenter med type-‐2 diabetes’ kontak�orbrug i det regionale sundhedsvæsen
Informa?on type Informa?on
Burden of
disease
Epidemiological measures
Prevalence 6 700 per 100 0001
Incidence 424 per 100 0001
Costs Direct costs 3.8 billion DKK1,2 Indirect costs 6.4 billion DKK1,2
Iden?fied varia?on
Outcomes
Share of paCents in specialized care progressing to severe diabeCc reCnopathy varies between 0 % (Hillerød) and 38 % (Roskilde)3 Share of paCents with no signs of reCnopathy varies between 17 % (Roskilde) and 75 % (Slagelse)3 Median HbA1c for diabetes type 2 paCents in specialized care varies between 50 mmol/mol (Gentote) and 66 (Bornholm)3 Share of diabetes type 1 paCents in specialized care with strict glycemic control HbA1c < 53 mmol/mol varies between 31 % (Amager) and 14 % (Glostrup, Vendsyssel)3
Resource use In T2DM, Mean annual number of primary care contacts varies between 14.4 (Region Hovedstaden) and 16.4 (Region Syddanmark). Mean annual number of contacts with specialist physician varies between 1.1 (Region Syddanmark) and 2.3 (Region Hovedstaden)4
Very large poten?al in terms of epidemiology and disease burden • High, and increasing, disease prevalence • Societal burden of diabetes amounts to around 10 billion DKK annually • Certain variaCon in outcomes and resource us observed
Deep-‐dives

70 18 maj 2015 70 18 maj 2015
Assessment of diabetes: Complexity in implementaCon
Organiza?onal level Integrated part of the care episode
Organiza?onal complexity
Specialized care X Primary care X Municipal care -‐
Medium organiza-‐ ?onal complexity
Limited data availability • Available data
covers many aspects of value based steering
• DAMD close-‐down limits access to certain relevant data
• PROMs are missing
NaConal level
Regional level
Regional and naConal level M=Missing
Measures type
Informa?on source types
Example of relevant data missing
Adm
. Care db
1
Qual. reg
2
Cost d
b 3
Drug db
4
DiagnosCc db
Mun
icipal
care db
5 Causes o
f death db
6 Social
insurance db
7 Socio-‐
dem
ograph
ic db
8
Data availability
PaCent characterisCcs
Sociodemographic informaCon X9 X9 -‐ -‐ -‐ -‐ X10 X11
Health profile ComorbidiCes X12 -‐ -‐ -‐ -‐ -‐ -‐ -‐ Other clinically relevant characterisCcs -‐ X13 -‐ -‐ X14 -‐ -‐ -‐ -‐ Physical acCvity
Care process
Treatment process X15 X16 -‐ X17 X -‐ -‐ -‐ -‐ Time -‐ -‐ -‐ -‐ -‐ -‐ -‐ Resource use/costs X15 -‐ X X17 X -‐ -‐ X18 -‐ PREMs -‐ -‐ -‐ -‐ -‐ -‐ -‐ -‐ PREMs
Health outcome indicators -‐ X19 -‐ -‐ X -‐ -‐ -‐ -‐
Health outcomes (paCent relevant)
Short and long term outcomes
Mortality -‐ -‐ -‐ -‐ X -‐ -‐ ObjecCve outcomes -‐ X20 -‐ -‐ X -‐ -‐ -‐ -‐ PROMs -‐ M -‐ -‐ -‐ -‐ -‐ -‐ PROMs
Process of recovery ComplicaCons X21 X22 -‐ X -‐ X -‐ -‐ Time to recovery -‐ -‐ -‐ -‐ -‐ -‐ -‐ -‐
Examples of exis?ng poten?ally relevant variables 9 Age 10 History of sick leave 11 EducaConal level, civil status, country of birth 12 Comorbidity index (Elixhasuser, Charlson) 13 Body mass index (BMI), Smoking, DuraCon of diabetes condiCon, Primary diagnosis (type of diabetes) 14 LDL cholesterol, microalbuminuria 15 Number of outpaCent visits to different health care professionals 16 Share of paCents annually assessed for glycemic control (HbA1c), blood pressure, albumin in the urine, reCnal status and feet status. Share of paCents with diabetes and hypertension not offered anChypertensive treatment , share of paCents with type 2 diabetes, over 30 years of age, elevated LDL-‐cholesterol and not on staCn medicaCon, share of paCents with albuminuria not under ACE/ATII-‐treatment 17 Me�ormin (biguanides), sulphonylureas, gliCnider, alpha-‐glucosidase inhibitors, glitazones 18 Sick leave 19 Share of paCents with adequate glycemic control (HbA1c <53 mmol/mol), Systolic and diastolic pressure, Cholesterol levels 20 Prevalence and status of complicaCons 21 Prevalence of complicaCons (neurologic, feet, eye, cardio-‐ or cerebrovascular events) 22 ReCnopathies and maculopathies, prevalence of blindness
Informa?on sources: 1 PAS/LandspaCentregistret (LPR) 2 Dansk Diabetes Database (not complete coverage in primary care) 3 Omkostningsdatabasen 4 Dansk receptdatabase or LægemiddelstaCsCkregisteret 5 KØS 6 Dødsårsagsregistret (only date of death at regional level) 7 DREAM 8 Various databases at StaCsCcs Denmark
Deep-‐dives
71 18 maj 2015 71 18 maj 2015
Assessment of hip replacement: PotenCal
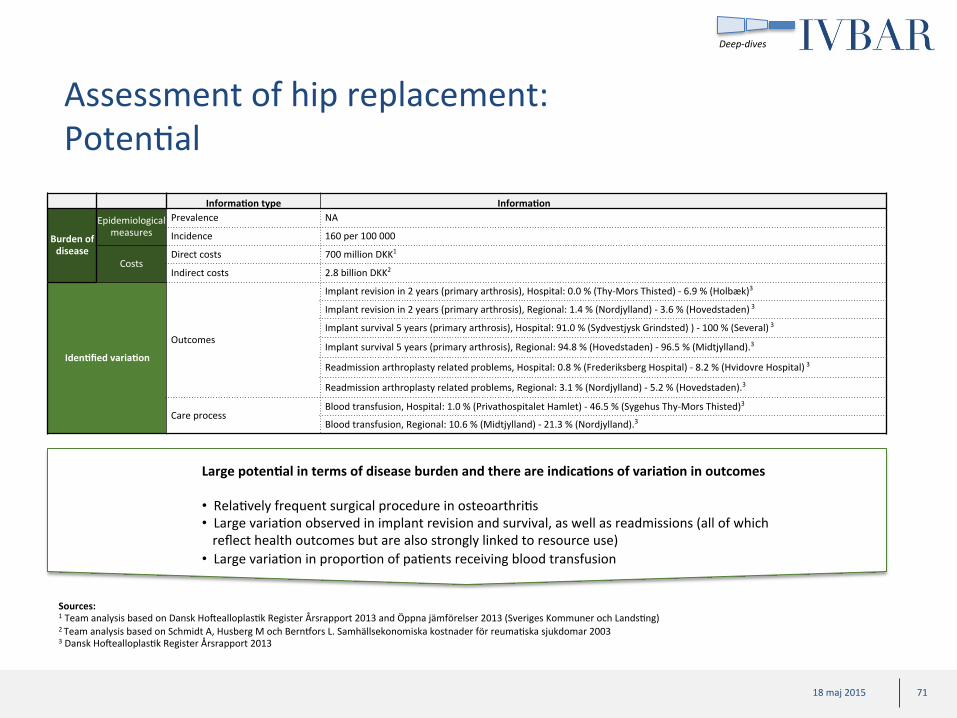
Large poten?al in terms of disease burden and there are indica?ons of varia?on in outcomes • RelaCvely frequent surgical procedure in osteoarthriCs • Large variaCon observed in implant revision and survival, as well as readmissions (all of which reflect health outcomes but are also strongly linked to resource use)
• Large variaCon in proporCon of paCents receiving blood transfusion
Informa?on type Informa?on
Burden of disease
Epidemiological measures
Prevalence NA
Incidence 160 per 100 000
Costs Direct costs 700 million DKK1
Indirect costs 2.8 billion DKK2
Iden?fied varia?on
Outcomes
Implant revision in 2 years (primary arthrosis), Hospital: 0.0 % (Thy-‐Mors Thisted) -‐ 6.9 % (Holbæk)3
Implant revision in 2 years (primary arthrosis), Regional: 1.4 % (Nordjylland) -‐ 3.6 % (Hovedstaden) 3
Implant survival 5 years (primary arthrosis), Hospital: 91.0 % (Sydvestjysk Grindsted) ) -‐ 100 % (Several) 3
Implant survival 5 years (primary arthrosis), Regional: 94.8 % (Hovedstaden) -‐ 96.5 % (Midtjylland).3
Readmission arthroplasty related problems, Hospital: 0.8 % (Frederiksberg Hospital) -‐ 8.2 % (Hvidovre Hospital) 3
Readmission arthroplasty related problems, Regional: 3.1 % (Nordjylland) -‐ 5.2 % (Hovedstaden).3
Care process Blood transfusion, Hospital: 1.0 % (Privathospitalet Hamlet) -‐ 46.5 % (Sygehus Thy-‐Mors Thisted)3
Blood transfusion, Regional: 10.6 % (Midtjylland) -‐ 21.3 % (Nordjylland).3
Sources: 1 Team analysis based on Dansk HotealloplasCk Register Årsrapport 2013 and Öppna jämförelser 2013 (Sveriges Kommuner och LandsCng) 2 Team analysis based on Schmidt A, Husberg M och Bern�ors L. Samhällsekonomiska kostnader för reumaCska sjukdomar 2003 3 Dansk HotealloplasCk Register Årsrapport 2013
Deep-‐dives

72 18 maj 2015 72 18 maj 2015
Assessment of hip replacement: Complexity in implementaCon
Organiza?onal level Integrated part of the care episode
Organiza?onal complexity
Specialized care X Primary care (X) Municipal care -‐
Low organiza-‐ ?onal complexity
Excellent data availability • Available data
is suitable for value based steering
• PROMs are missing and should be considered to be collected
NaConal level
Regional level
Regional and naConal level M=Missing
Informa?on sources: 1 PAS/LandspaCentregistret (LPR) 2 Dansk Fedmekirurgiregister, Årsrapport 2013 3 Omkostningsdatabasen 4 Dansk receptdatabase or LægemiddelstaCsCkregisteret 5 KØS 6 Dødsårsagsregistret (only date of death at regional level) 7 DREAM 8 Various databases at StaCsCcs Denmark
Measures type
Informa?on source types
Example of relevant data missing
Adm
. Care db
1
Qual. reg
2
Cost d
b 3
Drug db
4
DiagnosCc db
Mun
icipal
care db
5 Causes o
f death db
6 Social
insurance db
7 Socio-‐
dem
ograph
ic db
8
Data availability
PaCent characterisCcs
Sociodemographic informaCon X9 -‐ -‐ -‐ -‐ -‐ -‐ X10 X11
Health profile ComorbidiCes X12 X13 -‐ X14 -‐ -‐ -‐ -‐ -‐
Other clinically relevant characterisCcs X15 X16 -‐ -‐ -‐ -‐ -‐ -‐ -‐
Care process
Treatment process -‐ X17 -‐ X X -‐ -‐ -‐ -‐ Time -‐ M -‐ -‐ -‐ -‐ -‐ -‐ Time from decision to operaCon Resource use/costs X18 -‐ X18 X X -‐ -‐ X19 -‐ PREMs -‐ M -‐ -‐ -‐ -‐ -‐ -‐ PREMs
Health outcome indicators -‐ -‐ -‐ -‐ -‐ -‐ -‐ -‐ -‐
Health outcomes (paCent relevant)
Short and long term outcomes
Mortality -‐ -‐ -‐ -‐ -‐ X -‐ -‐ ObjecCve outcomes -‐ X20 -‐ -‐ -‐ -‐ -‐ -‐ -‐ PROMs -‐ M -‐ -‐ -‐ -‐ -‐ -‐ -‐ PROMs
Process of recovery ComplicaCons X21 X22 -‐ X23 -‐ -‐ X -‐ -‐
Time to recovery -‐ -‐ -‐ -‐ -‐ -‐ -‐ -‐ -‐
Examples of exis?ng poten?ally relevant variables 9 Age, sex 10 Sick-‐leave before and ater operaCon 11 EducaConal level, civil status, country of birth 12 Comorbidity index (Elixhauser, Charlson) 13 AddiConal comorbidiCes 14 AnC-‐depressants 15 Bilateral operaCon 16 Charnley category, weight, length, BMI, ASA etc 17 OperaCon method, procedure specifics etc 18 Resources and costs related to iniCal hospital stay, readmissions and revisits 19 Return to employment 20 Implant survival, implant revisions, readmissions for different causes 21 Orthopedic and non-‐orthopedic complicaCons 22 Blood transfusions 23 AnCbioCcs
Deep-‐dives

73 18 maj 2015 73 18 maj 2015
Assessment of knee replacement: PotenCal
Large poten?al in terms of disease burden and there are indica?ons of varia?on in outcomes • RelaCvely frequent surgical procedure in osteoarthriCs • Large variaCon observed in implant revision and readmissions (both of which reflect health outcomes but are also strongly linked to resource use)
• RelaCvely large variaCon in length of stay
Informa?on type Informa?on
Burden of disease
Epidemiological measures
Prevalence NA
Incidence 118 per 100 000
Costs Direct costs 570 million DKK1
Indirect costs 2.3 billion DKK2
Iden?fied varia?on Outcomes
Regional level variaCon: Readmission 30 days, 6.1 % -‐ 10.4 %. Average 8.2 %3
Regional level variaCon: Mortality rate 90 days, 0.2 % -‐ 0.7 %. Average 0,4 %3
Regional level variaCon: 1-‐year arthroplasty revision rate, 1.5 % -‐ 8.2 %. Average 2.9 %3
Regional level variaCon: 2-‐year arthroplasty revision rate, 2.3 % -‐ 6.6 %. Average 3.8 %3
Regional level variaCon: 5-‐year arthroplasty revision rate, 3.2 % -‐ 9.2 %. Average 5.2 %3
Resource use Length of hospital stay for TKA, 2.6 (Privathospitaler) -‐ 4.0 (Nordjylland). Average 3.3 days4
Sources: 1 Team analysis based on Dansk Kvalitetsdatabase KnæalloplasCkregister, årsrapport 2014 and Öppna jämförelser 2013 (Sveriges Kommuner och LandsCng) 2 Team analysis based on Schmidt A, Husberg M och Bern�ors L. Samhällsekonomiska kostnader för reumaCska sjukdomar 2003 3 Dansk Kvalitetsdatabase KnæalloplasCkregister, årsrapport 2014 4 Team analysis based on LPR
Deep-‐dives
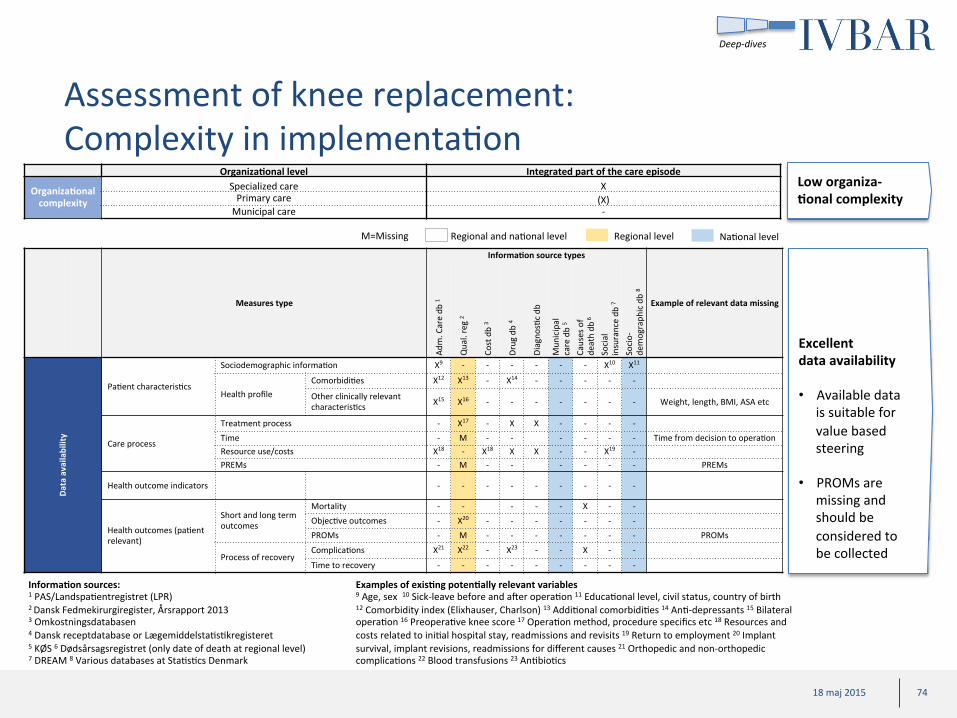
74 18 maj 2015 74 18 maj 2015
Assessment of knee replacement: Complexity in implementaCon
Organiza?onal level Integrated part of the care episode
Organiza?onal complexity
Specialized care X Primary care (X) Municipal care -‐
Low organiza-‐ ?onal complexity
Excellent data availability • Available data
is suitable for value based steering
• PROMs are missing and should be considered to be collected
NaConal level
Regional level
Regional and naConal level M=Missing
Informa?on sources: 1 PAS/LandspaCentregistret (LPR) 2 Dansk Fedmekirurgiregister, Årsrapport 2013 3 Omkostningsdatabasen 4 Dansk receptdatabase or LægemiddelstaCsCkregisteret 5 KØS 6 Dødsårsagsregistret (only date of death at regional level) 7 DREAM 8 Various databases at StaCsCcs Denmark
Measures type
Informa?on source types
Example of relevant data missing
Adm
. Care db
1
Qual. reg
2
Cost d
b 3
Drug db
4
DiagnosCc db
Mun
icipal
care db
5 Causes o
f death db
6 Social
insurance db
7 Socio-‐
dem
ograph
ic db
8
Data availability
PaCent characterisCcs
Sociodemographic informaCon X9 -‐ -‐ -‐ -‐ -‐ -‐ X10 X11
Health profile ComorbidiCes X12 X13 -‐ X14 -‐ -‐ -‐ -‐ -‐
Other clinically relevant characterisCcs X15 X16 -‐ -‐ -‐ -‐ -‐ -‐ -‐ Weight, length, BMI, ASA etc
Care process
Treatment process -‐ X17 -‐ X X -‐ -‐ -‐ -‐ Time -‐ M -‐ -‐ -‐ -‐ -‐ -‐ Time from decision to operaCon Resource use/costs X18 -‐ X18 X X -‐ -‐ X19 -‐ PREMs -‐ M -‐ -‐ -‐ -‐ -‐ -‐ PREMs
Health outcome indicators -‐ -‐ -‐ -‐ -‐ -‐ -‐ -‐ -‐
Health outcomes (paCent relevant)
Short and long term outcomes
Mortality -‐ -‐ -‐ -‐ -‐ X -‐ -‐ ObjecCve outcomes -‐ X20 -‐ -‐ -‐ -‐ -‐ -‐ -‐ PROMs -‐ M -‐ -‐ -‐ -‐ -‐ -‐ -‐ PROMs
Process of recovery ComplicaCons X21 X22 -‐ X23 -‐ -‐ X -‐ -‐
Time to recovery -‐ -‐ -‐ -‐ -‐ -‐ -‐ -‐ -‐
Examples of exis?ng poten?ally relevant variables 9 Age, sex 10 Sick-‐leave before and ater operaCon 11 EducaConal level, civil status, country of birth 12 Comorbidity index (Elixhauser, Charlson) 13 AddiConal comorbidiCes 14 AnC-‐depressants 15 Bilateral operaCon 16 PreoperaCve knee score 17 OperaCon method, procedure specifics etc 18 Resources and costs related to iniCal hospital stay, readmissions and revisits 19 Return to employment 20 Implant survival, implant revisions, readmissions for different causes 21 Orthopedic and non-‐orthopedic complicaCons 22 Blood transfusions 23 AnCbioCcs
Deep-‐dives

75 18 maj 2015 75 18 maj 2015
Assessment of mulCple sclerosis: PotenCal
Large poten?al in terms of disease burden and there are indica?ons of varia?on in outcomes • High direct costs of care, where pharmaceuCcal costs consCtute a relaCvely large proporCon
• Large variaCon observed in terms of both outcomes and care process
Sources: 1 Sclerosebehandlingsregistret 2 Sobocki P, Pugliar M, Lauer K, Kobelt G. EsCmaCon of the cost of MS in Europe: ExtrapolaCons from a mulCnaConal cost study. MulCple Sclerosis J. 2007;13:1054-‐1064
Informa?on type Informa?on
Burden of disease
Epidemiological measures
Prevalence 220 per 100 0001
Incidence 8 per 100 0001
Costs Direct costs 1.4 billion DKK2
Indirect costs 400 million DKK2
Iden?fied varia?on
Outcomes
Share of paCents under treatment and with a starCng EDSS-‐score of 4 or less, reacing an EDSS-‐score of 4 or more (endpoint) ater 5 years of follow-‐up varies between 47 % (Roskilde) and 94 % (Hillerød)1 Share of paCents under first-‐line treatment and working full Cme at start of treatment, that are no longer working full Cme at the end of treatment or at the end of 5-‐year follow-‐up varies betwewen 20 % (Rigshospitalet) and 90 % (Herlev)1 Share of paCents, treated with biological drugs, with improved or staConary level of pain varies between 87 % (Rigshospitalet) and 100 % (Frederica)1 Share of paCents, treated with biological drugs, with improved or staConary level of faCgue varies between 67 % (Fredericia) and 93 % (Svendborg)1
Care process
Average control frequency of JC virus anCbodies in immunosuppressed paCents varies between 1.2 (Odense) and 2.7 (Sønderborg)1
Share of paCents that received annual MRI scan while in treatment varies between 25 % (Roskilde) and 93 % (Sønderborg)1 Share of paCents assessed for anC-‐medicaCon anCbodies ater 3, 6 and 12 months of treatment varies between 17 % (Odense) and 89 % (Holstebro)1 Share of paCents assessed using EDSS score while in treatment varies between 51 % (Odense) and 99 % (Sønderborg)1
Deep-‐dives

76 18 maj 2015 76 18 maj 2015
Assessment of mulCple sclerosis: Complexity in implementaCon
Organiza?onal level Integrated part of the care episode
Organiza?onal complexity
Specialized care X Primary care (X) Municipal care (X)
Medium organiza-‐ ?onal complexity
Good data availability • Available data
covers many aspects of value based steering
• Lack of municipal data at regional level a slight limitaCon
• PROMs missing
NaConal level
Regional level
Regional and naConal level M=Missing
Measures type
Informa?on source types
Example of relevant data missing
Adm
. Care db
1
Qual. reg
2
Cost d
b 3
Drug db
4
DiagnosCc db
Mun
icipal
care db
5
Causes o
f death db
6
Social
insurance db
7
Socio-‐
dem
ograph
ic db
8
Data availability
Sociodemographic informaCon X9 -‐ -‐ -‐ -‐ -‐ -‐ X10 X11
PaCent characterisCcs Health profile ComorbidiCes X12 -‐ -‐ X13 -‐ -‐ -‐ -‐ -‐
Other clinically relevant characterisCcs (X)14 M -‐ -‐ -‐ -‐ -‐ -‐ -‐ Disease duraCon
Care process
Treatment process X15 X16 -‐ X17 X X -‐ -‐ -‐
Time M -‐ -‐ -‐ -‐ -‐ -‐ -‐ Time to diagnosis and
treatment Resource use/costs X18 X17 X18 X17 -‐ X -‐ X10 -‐ PREMs -‐ M -‐ -‐ X -‐ -‐ -‐ -‐ PREMs
Health outcome indicators -‐ -‐ -‐ -‐ -‐ -‐ -‐ -‐ -‐
Health outcomes (paCent relevant)
Short and long term outcomes
Mortality -‐ -‐ -‐ -‐ -‐ X -‐ -‐
ObjecCve outcomes -‐ X19 -‐ -‐ -‐ -‐ -‐ -‐ -‐ PROMs -‐ M -‐ -‐ -‐ -‐ -‐ -‐ -‐ PROMs
Process of recovery ComplicaCons X20 -‐ -‐ X -‐ -‐ X -‐ -‐ Time to recovery -‐ -‐ -‐ -‐ -‐ -‐ -‐ -‐ -‐
Examples of exis?ng poten?ally relevant variables 9 Age 10 History of sick leave 11 EducaConal level, civil status, country of birth 12 Elixahauser Comorbidity Index, Charlson Comorbidity Index 13Drug use reflecCng comorbidiCes 14 Proxy for disease duraCon 15Number of visits in specialised outpaCent care 16, Frequency of assessment for JC-‐virus in immunosupressed paCents, frequency of assessment for anC-‐medicaCon anCbodies, yearly MRI assessment, frequency of EDSS score in immunomodulated paCents, MRI scanning before start of treatment, blood test workup before startup of treatment 17 Use of disease-‐modifying drugs 18 Resource-‐use and costs mainly Ced to the MS disease and related complicaCons 19 Change in EDSS-‐score over Cme, fracCon of paCents working full Cme despite disease 20 InpaCent and outpaCent care related to relevant complicaCons (diagnoses and procedures)
Informa?on sources: 1 PAS/LandspaCentregistret (LPR) 2 Sclerosebehandlingsregistret 3 Omkostningsdatabasen 4 Dansk receptdatabase or LægemiddelstaCsCkregisteret 5 KØS 6 Dødsårsagsregistret (only date of death at regional level) 7 DREAM 8 Various databases at StaCsCcs Denmark
Deep-‐dives

77 18 maj 2015 77 18 maj 2015
Assessment of obesity (bariatric surgery): PotenCal
Small poten?al in terms of number pa?ents/procedures but varia?on in outcomes and resource indicate large poten?al for quality improvements • Obesity is associated with a very large disease burden, but surgery may only impact the burden in a small subpopulaCon
• Large variaCon in outcomes (weight-‐loss and HRQoL) • Large variaCon in complicaCons and related costs
Sources: 1 Due P, Heitmann B, Sørensen T. Prevalence of obesity in Denmark. Obesity Reviews. 2007;8:187-‐189 2 Borg S, Persson U, Ödegaard K et. Al. Obesity, Survival, and Hospital Costs -‐ Findings from a Screening Project in Sweden. Value In Health.2005;8(5):562-‐571 3 Dansk Fedmekirurgiregister, Årsrapport 2013
Informa?on type Informa?on
Burden of
disease
Epidemiological measures
Prevalence 7200 per 100 000 (BMI >30)1
Incidence 17 bariatric procedures per 100 000 3
Costs Direct costs 1.1 billion DKK (BMI>30) 2
Indirect costs 1.4 billion DKK (BMI>30) 2
Iden?fied varia?on Outcomes
Improvements (yes or no) in HRQoL (Moorehead) varies between 84 % (Sydvestjysk) and 100 % (Aalborg, OUH Svendborg) 3
Excess body mass index loss more than 50 % in 1 year varies between 85 % (Sydvestjysk) and 96 % (Aalborg) 3
Readmission frequency in 30 days varies between 2 % (Privathospitalen) and 14 % (Viborg) 3
Early revision surgery (within 30 days) varies between 0 % (Privathospital Hamlet) and 8 % (Aalborg) 3
Late revision surgery (30 -‐ 365 days) varies between 7 % Aalborg) and 22 % (Sydvestjysk) 3
Deep-‐dives

78 18 maj 2015 78 18 maj 2015
Assessment of obesity (bariatric surgery): Complexity in implementaCon
Organiza?onal level Integrated part of the care episode
Organiza?onal complexity
Specialized care X Primary care (X) Municipal care -‐
Low organiza-‐ ?onal complexity
Excellent data availability • Available data
is suitable for value based steering
• PREMs missing
NaConal level
Regional level
Regional and naConal level M=Missing
Examples of exis?ng poten?ally relevant variables 9 Age 10 History of sick leave 11 EducaConal level, civil status, country of birth 12 Comorbidity index (Elixhauser, Charlson) 13 Sleep apnea, gastroesophageal reflux, 14 AnCdiabeCcs 15 Previous related surgery 17 HbA1c 18 Length of stay at surgery, readmissons, number of visits in outpaCent specialized care 19 Type of procedure, knife Cme, 20 Related mainly to treatment process and complicaCons 21 Sick leave ater surgery 22 Weight reducCon, resoluCon of some comorbidiCes (joint pains, diabetes) 23 ResoluCon of some comorbidiCes (CVD, diabetes) 23 Sick-‐leave ater birth 24 HRQoL (Moorehead) 25 InpaCent and outpaCent care related to relevant complicaCons (diagnoses and procedures) 26 ComplicaCons requiring intervenCon, revision surgery within 30 days of and 30 -‐ 365 days ater primary surgery 27 Sick leave ater surgery
Informa?on sources: 1 PAS/LandspaCentregistret (LPR) 2 Dansk Fedmekirurgiregister, Årsrapport 2013 3 Omkostningsdatabasen 4 Dansk receptdatabase or LægemiddelstaCsCkregisteret 5 KØS 6 Dødsårsagsregistret (only date of death at regional level) 7 DREAM 8 Various databases at StaCsCcs Denmark
Measures type
Informa?on source types
Example of relevant data missing
Adm
. Care db
1
Qual. reg
2
Cost d
b 3
Drug db
4
DiagnosCc db
Mun
icipal
care db
5
Causes o
f death db
6
Social
insurance db
7
Socio-‐
dem
ograph
ic db
8
Data availability
PaCent characterisCcs
Sociodemographic informaCon X9 -‐ -‐ -‐ -‐ -‐ -‐ X10 X11
Health profile ComorbidiCes X12 X13 -‐ X14 -‐ -‐ -‐ -‐ -‐ Other clinically relevant characterisCcs X15 X16 -‐ -‐ X17 -‐ -‐ -‐ -‐
Care process
Treatment process X18 X19 -‐ X X -‐ -‐ -‐ -‐
Time -‐ M -‐ -‐ -‐ -‐ -‐ -‐ -‐ Time to first visit, Cme to decision/surgery
Resource use/costs X20 -‐ X20 X X -‐ -‐ X21 -‐ PREMs -‐ M -‐ -‐ -‐ -‐ -‐ -‐ -‐ PREMs
Health outcome indicators -‐ -‐ -‐ -‐ -‐ -‐ -‐ -‐ -‐
Health outcomes (paCent relevant)
Short and long term outcomes
Mortality -‐ -‐ -‐ -‐ -‐ X -‐ -‐ ObjecCve outcomes -‐ X22 -‐ X23 -‐ -‐ -‐ -‐ -‐ PROMs -‐ X24 -‐ -‐ -‐ -‐ -‐ -‐ -‐
Process of recovery ComplicaCons X25 X26 -‐ X27 -‐ -‐ X -‐ -‐ Time to recovery -‐ -‐ -‐ -‐ -‐ -‐ -‐ X28 -‐
Deep-‐dives

79 18 maj 2015 79 18 maj 2015
Assessment of prostate cancer: PotenCal
Rela?vely high poten?al in terms of disease burden. Indica?on of certain varia?on across hospitals. • The most common cancer type in men • Variability between providers observed for both outcomes and care process
Sources: 1 Ferlay J, Steliarova-‐Foucher E, Lortet-‐Tieulent, et Al. Cancer incidence and mortality paWerns in Europe: EsCmates from 40 countries in 2012. European Journal of Cancer. 2013;49:1374-‐1403 2 Luengo-‐Fernandez R, Leal J, Gray A, Sullivan R. Economic burden of cancer across the European Union: a populaCon-‐based cost-‐analysis. Lancet Oncology. 2013;14:1165-‐1174 3 Dansk Prostata Cancer Database
Informa?on type Informa?on
Burden of disease
Epidemiological measures
Prevalence
Incidence 138 per 100 0001
Costs Direct costs 500 million DKK2
Indirect costs 300 million DKK2
Iden?fied varia?on
Outcomes
Share of procedures with posiCve surgical margin (potenCal non-‐curaCve surgery with residual tumor Cssue) for pT2 staged tumors varies between 0 % (Hospitalsenheden Vest) and 19 % (Aalborg) and for pT3 staged tumors, variaCon spans from 0 % (Hospitalsenheden Vest) and 77 % (Aarhus)3 Share of paCents with urethral stricture complicaCons within 1 year varies between 1 % (Aalborg) and 7 % (Hospitalsenheden Vest)3
Care process Share of paCents receiving blood transfusion within 30 days varies between 2 % (Herley) and 7 % (Aalborg)3 Share of paCents receiving nerve preserving surgical procedures varies between 82 % (Rigshospitalet) and 46 % (Aalborg)3
Deep-‐dives

80 18 maj 2015 80 18 maj 2015
Assessment of prostate cancer: Complexity in implementaCon
Organiza?onal level Integrated part of the care episode
Organiza?onal complexity
Specialized care X Primary care (X) Municipal care (X)
Medium organiza-‐ ?onal complexity
NaConal level
Regional level
Regional and naConal level M=Missing
Measures type
Informa?on source types
Example of relevant data missing
Adm
. Care db
1
Qual. reg
2
Cost d
b 3
Drug db
4
DiagnosCcs d
b
Mun
icipal
care db
5 Causes o
f death db
6 Social
insurance db
7 Socio-‐
dem
ograph
ic db
8
Data availability
PaCent characterisCcs
Sociodemographic informaCon X9 -‐ -‐ -‐ -‐ -‐ -‐ X10 X11
Health profile ComorbidiCes X12 -‐ -‐ X13 -‐ -‐ -‐ -‐ -‐ Other clinically relevant characterisCcs X14 X15 -‐ -‐ X -‐ -‐ -‐ -‐
Care process
Treatment process X16 X17 -‐ X18 X X -‐ -‐ -‐ Time -‐ -‐ -‐ -‐ -‐ -‐ -‐ -‐ Resource use/costs X24 -‐ X24 X X -‐ -‐ -‐ -‐ PREMs -‐ M -‐ -‐ -‐ -‐ -‐ -‐ -‐ PREMs
Health outcome indicators -‐ X19 -‐ -‐ X -‐ -‐ -‐ -‐
Health outcomes (paCent relevant)
Short and long term outcomes
Mortality -‐ X20 -‐ -‐ -‐ X -‐ -‐
ObjecCve outcomes -‐ X21 -‐ -‐ -‐ -‐ -‐ -‐ -‐ ICHOM indicators: symptomaCc
skeletal events, castraCon resistant disease
PROMs -‐ M -‐ -‐ -‐ -‐ -‐ -‐ -‐ Pain, sexual dysfuncConing,
physical funcConing
Process of recovery ComplicaCons X22 X23 -‐ -‐ -‐ -‐ X -‐ -‐ Time to recovery -‐ -‐ -‐ -‐ -‐ -‐ -‐ -‐ -‐
Examples of exis?ng poten?ally relevant variables 9 Age 10 History of sick leave 11 EducaConal level, civil status, country of birth 12 Elixahauser Comorbidity Index, Charlson Comorbidity Index 13Drug usage reflecCng comorbidiCes 14 Skeletal metastases 15PSA, TNM, prostate volume 16Number of visits in specialised outpaCent care, surgical acCviCes 17 Share of paCents receiving adjuvant endocrine therapy, Share of total prostatectomies using nerve preserving technique 18Use of relevant drugs such as endocrine treatment, bisphosphonates and chemotherapy. 19Share of paCents with radical excision 20 30-‐day mortality 21 Share of paCents without recurring cancer in 5 years 22 ER-‐visits related to disease 23Frequency of blood transfusions, Share of paCents with urethral stricture 1 year ater surgery 24 Related mainly to treatment process and complicaCons
Informa?on sources: 1 PAS/LandspaCentregistret (LPR) 2 Dansk Prostata Cancer Database 3 Omkostningsdatabasen 4 Dansk receptdatabase or LægemiddelstaCsCkregisteret 5 KØS 6 Dødsårsagsregistret (only date of death at regional level) 7 DREAM 8 Various databases at StaCsCcs Denmark
Excellent data availability • Available data
covers many aspects of value based steering
• Lack of municipal data at regional level a slight limitaCon
• PROMs missing
Deep-‐dives
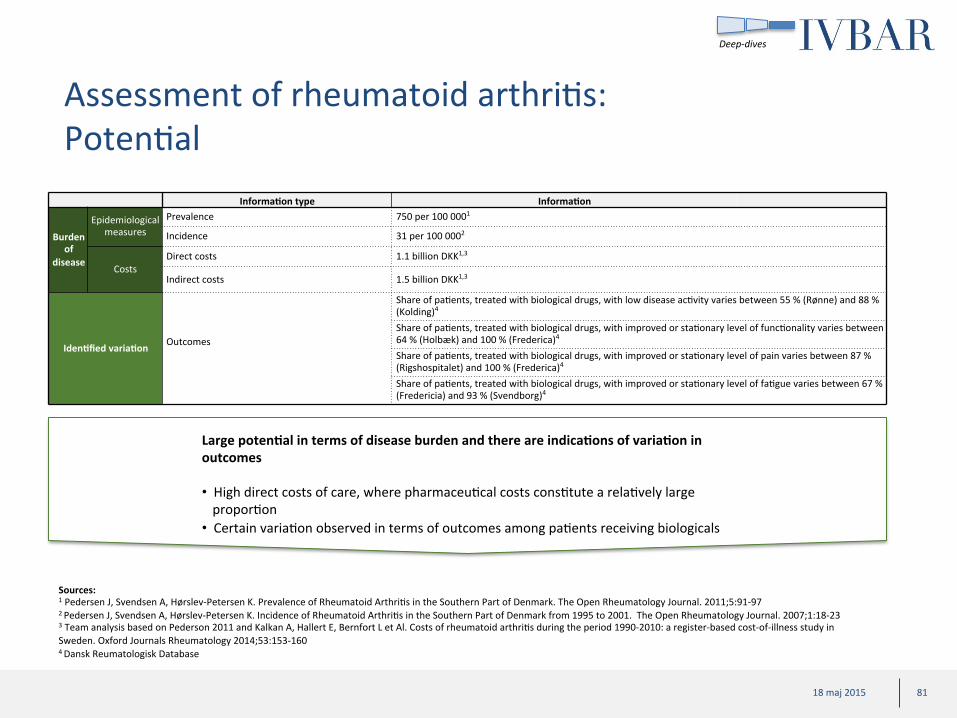
81 18 maj 2015 81 18 maj 2015
Assessment of rheumatoid arthriCs: PotenCal
Large poten?al in terms of disease burden and there are indica?ons of varia?on in outcomes • High direct costs of care, where pharmaceuCcal costs consCtute a relaCvely large proporCon
• Certain variaCon observed in terms of outcomes among paCents receiving biologicals
Sources: 1 Pedersen J, Svendsen A, Hørslev-‐Petersen K. Prevalence of Rheumatoid ArthriCs in the Southern Part of Denmark. The Open Rheumatology Journal. 2011;5:91-‐97 2 Pedersen J, Svendsen A, Hørslev-‐Petersen K. Incidence of Rheumatoid ArthriCs in the Southern Part of Denmark from 1995 to 2001. The Open Rheumatology Journal. 2007;1:18-‐23 3 Team analysis based on Pederson 2011 and Kalkan A, Hallert E, Bernfort L et Al. Costs of rheumatoid arthriCs during the period 1990-‐2010: a register-‐based cost-‐of-‐illness study in Sweden. Oxford Journals Rheumatology 2014;53:153-‐160 4 Dansk Reumatologisk Database
Informa?on type Informa?on
Burden of
disease
Epidemiological measures
Prevalence 750 per 100 0001
Incidence 31 per 100 0002
Costs Direct costs 1.1 billion DKK1,3
Indirect costs 1.5 billion DKK1,3
Iden?fied varia?on Outcomes
Share of paCents, treated with biological drugs, with low disease acCvity varies between 55 % (Rønne) and 88 % (Kolding)4 Share of paCents, treated with biological drugs, with improved or staConary level of funcConality varies between 64 % (Holbæk) and 100 % (Frederica)4 Share of paCents, treated with biological drugs, with improved or staConary level of pain varies between 87 % (Rigshospitalet) and 100 % (Frederica)4 Share of paCents, treated with biological drugs, with improved or staConary level of faCgue varies between 67 % (Fredericia) and 93 % (Svendborg)4
Deep-‐dives

82 18 maj 2015 82 18 maj 2015
Assessment of rheumatoid arthriCs: Complexity in implementaCon
Organiza?onal level Integrated part of the care episode
Organiza?onal complexity
Specialized care X Primary care (X) Municipal care (X)
Medium organiza-‐ ?onal complexity
Excellent data availability • Available data
covers many aspects of value based steering
• Lack of municipal data at regional level a certain limitaCon
NaConal level
Regional level
Regional and naConal level M=Missing
Measures type
Informa?on source types
Example of relevant data missing
Adm
. Care db
1
Qual. reg
2
Cost d
b 3
Drug db
4
DiagnosCc db
Mun
icipal
care db
5 Causes o
f death db
6 Social
insurance db
7 Socio-‐
dem
ograph
ic db
8
Data availability
PaCent characterisCcs
Sociodemographic informaCon X9 -‐ -‐ -‐ -‐ -‐ -‐ X10 X11
Health profile ComorbidiCes X12 -‐ -‐ X13 -‐ -‐ -‐ -‐ -‐ Other clinically relevant characterisCcs X14 M -‐ -‐ -‐ -‐ -‐ -‐ -‐ Disease duraCon
Care process
Treatment process X15 X16 -‐ X16 X X -‐ -‐ -‐
Time M -‐ -‐ -‐ -‐ -‐ -‐ -‐ Time to treatment Resource use/costs X17 -‐ X17 X16 X X -‐ X10 -‐ PREMs -‐ M -‐ -‐ -‐ -‐ -‐ -‐ -‐ PREMs
Health outcome indicators -‐ -‐ -‐ -‐ -‐ -‐ -‐ -‐ -‐
Health outcomes (paCent relevant)
Short and long term outcomes Mortality -‐ -‐ -‐ -‐ -‐ X -‐ -‐ ObjecCve outcomes -‐ X19 -‐ -‐ -‐ -‐ -‐ -‐ -‐ PROMs -‐ X18 -‐ -‐ -‐ -‐ -‐ -‐ -‐
Process of recovery ComplicaCons X20 -‐ -‐ -‐ -‐ -‐ X -‐ -‐ Time to recovery -‐ M -‐ -‐ -‐ -‐ -‐ -‐ -‐ Time in remission (DAS <2.6)
Examples of exis?ng poten?ally relevant variables 9 Age 10 History of sick leave 11 EducaConal level, civil status, country of birth 12 Diabetes, Elixahauser Comorbidity Index, Charlson Comorbidity Index 13 AnCdiabeCcs 14 Proxy for disease duraCon 15 Specialised healthcare contacts 16,Types of drugs used: biological DMARDs: anC-‐TNFs (infliximab, etanercept, adalimumab etc) or other, non-‐biological DMARDs (Methotrexate) 17 Resource-‐use and costs mainly Ced to the RA disease 18Share of paCents with low disease acCvity (DAS28 score), Share of paCents with improved or staConary level of funcCon (HAQ score), Share of paCents with improved or staConary quality of life (VAS global scale), Share of paCents with decreased or staConary levels of pain (VAS pain), Share of paCents with decreased or staConary faCgue (VAS faCgue) 19 CRP-‐component of DAS-‐28 20ER-‐visits de to drug-‐induced infecCons
Informa?on sources: 1 PAS/LandspaCentregistret (LPR) 2 Dansk Reumatologisk Database 3 Omkostningsdatabasen 4 Dansk receptdatabase or LægemiddelstaCsCkregisteret 5 KØS 6 Dødsårsagsregistret (only date of death at regional level) 7 DREAM 8 Various databases at StaCsCcs Denmark
Deep-‐dives

83 18 maj 2015 83 18 maj 2015
Assessment of stroke: PotenCal
Large disease burden and variability in mortality indicate large poten?al impact from improved health care delivery. • Notable differences in 30 day mortality across providers • ReadmiWance rates and care process indicators also differed between providers
Sources: 1 Truelsen T, Piechowski-‐Jóźwiak B, Bonita R. et al. Stroke incidence and prevalence in Europe: a review of available data. European Journal of Neurology. 2006;13:581-‐598 2 Team analysis based on Olesen J, Sobocki P, Truelsen T, et al. Cost of disorders of the brain in Denmark. Nord J Psychiatry. 2008;62:114 3 Dansk Apopleksiregister
Informa?on type Informa?on
Burden of
disease
Epidemiological measures
Prevalence NA Incidence 612 per 1000001
Costs Direct costs 1.8 billion DKK2 Indirect costs 560 million DKK2
Iden?fied varia?on
Outcomes 30 day mortality varies between 6 % (Amager) and 55 % (HE Midt) Resource use Share of paCents being readmiWed in 30 days varies between 0 % (Dronninglund) and 22 % (Amager)
Care process
Share of paCents receiving thrombolysis in 1 hour varies between 50 % (Aalborg, Bornholm) and 100 % (Roskilde) 3
Share of paCents with CVL offered caroCd endarterectomy in 14 days varies between 27 % (Holstebro) and 100 % (Vejle, Nordsjælland) 3
Share of paCents with atrial fluWer and CVL, offered anCcoagulants varies between 67 % (Sydestjysk) and 100 % (Vejle)
Deep-‐dives
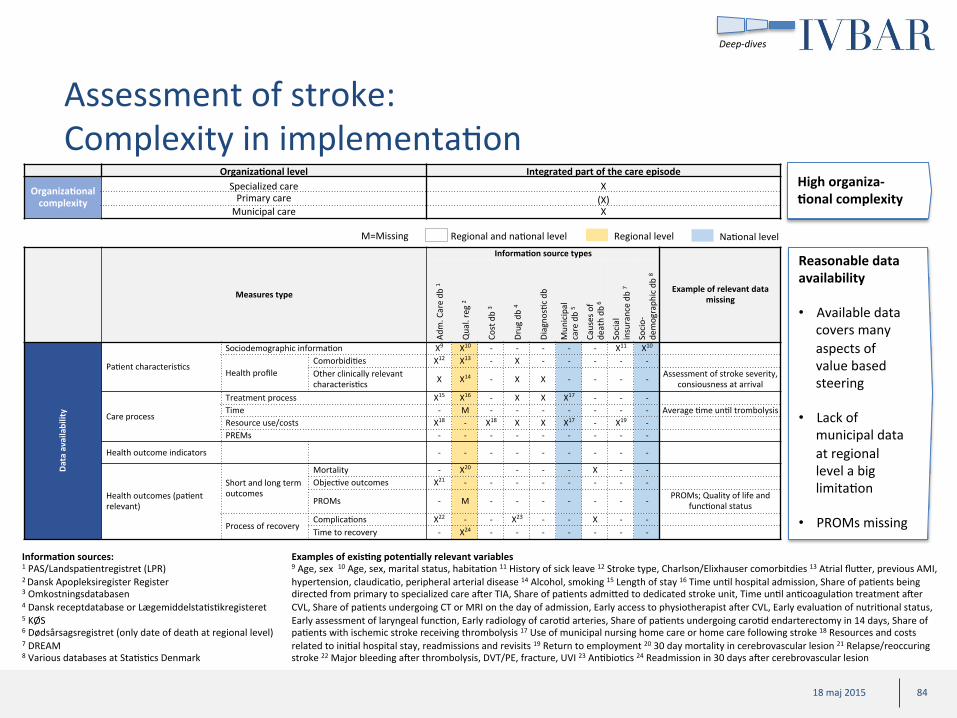
84 18 maj 2015 84 18 maj 2015
Assessment of stroke: Complexity in implementaCon
Organiza?onal level Integrated part of the care episode
Organiza?onal complexity
Specialized care X Primary care (X) Municipal care X
High organiza-‐ ?onal complexity
Reasonable data availability • Available data
covers many aspects of value based steering
• Lack of municipal data at regional level a big limitaCon
• PROMs missing
NaConal level
Regional level
Regional and naConal level M=Missing
Measures type
Informa?on source types
Example of relevant data missing
Adm
. Care db
1
Qual. reg
2
Cost d
b 3
Drug db
4
DiagnosCc db
Mun
icipal
care db
5
Causes o
f death db
6
Social
insurance db
7
Socio-‐
dem
ograph
ic db
8
Data availability
PaCent characterisCcs
Sociodemographic informaCon X9 X10 -‐ -‐ -‐ -‐ -‐ X11 X10
Health profile ComorbidiCes X12 X13 -‐ X -‐ -‐ -‐ -‐ -‐ Other clinically relevant characterisCcs X X14 -‐ X X -‐ -‐ -‐ -‐ Assessment of stroke severity,
consiousness at arrival
Care process
Treatment process X15 X16 -‐ X X X17 -‐ -‐ -‐ Time -‐ M -‐ -‐ -‐ -‐ -‐ -‐ -‐ Average Cme unCl trombolysis Resource use/costs X18 -‐ X18 X X X17 -‐ X19 -‐ PREMs -‐ -‐ -‐ -‐ -‐ -‐ -‐ -‐ -‐
Health outcome indicators -‐ -‐ -‐ -‐ -‐ -‐ -‐ -‐ -‐
Health outcomes (paCent relevant)
Short and long term outcomes
Mortality -‐ X20 -‐ -‐ -‐ X -‐ -‐ ObjecCve outcomes X21 -‐ -‐ -‐ -‐ -‐ -‐ -‐ -‐
PROMs -‐ M -‐ -‐ -‐ -‐ -‐ -‐ -‐ PROMs; Quality of life and funcConal status
Process of recovery ComplicaCons X22 -‐ -‐ X23 -‐ -‐ X -‐ -‐ Time to recovery -‐ X24 -‐ -‐ -‐ -‐ -‐ -‐ -‐
Examples of exis?ng poten?ally relevant variables 9 Age, sex 10 Age, sex, marital status, habitaCon 11 History of sick leave 12 Stroke type, Charlson/Elixhauser comorbitdies 13 Atrial fluWer, previous AMI, hypertension, claudicaCo, peripheral arterial disease 14 Alcohol, smoking 15 Length of stay 16 Time unCl hospital admission, Share of paCents being directed from primary to specialized care ater TIA, Share of paCents admiWed to dedicated stroke unit, Time unCl anCcoagulaCon treatment ater CVL, Share of paCents undergoing CT or MRI on the day of admission, Early access to physiotherapist ater CVL, Early evaluaCon of nutriConal status, Early assessment of laryngeal funcCon, Early radiology of caroCd arteries, Share of paCents undergoing caroCd endarterectomy in 14 days, Share of paCents with ischemic stroke receiving thrombolysis 17 Use of municipal nursing home care or home care following stroke 18 Resources and costs related to iniCal hospital stay, readmissions and revisits 19 Return to employment 20 30 day mortality in cerebrovascular lesion 21 Relapse/reoccuring stroke 22 Major bleeding ater thrombolysis, DVT/PE, fracture, UVI 23 AnCbioCcs 24 Readmission in 30 days ater cerebrovascular lesion
Informa?on sources: 1 PAS/LandspaCentregistret (LPR) 2 Dansk Apopleksiregister Register 3 Omkostningsdatabasen 4 Dansk receptdatabase or LægemiddelstaCsCkregisteret 5 KØS 6 Dødsårsagsregistret (only date of death at regional level) 7 DREAM 8 Various databases at StaCsCcs Denmark
Deep-‐dives

85 18 maj 2015 85 18 maj 2015
Overview of Sveus and ICHOM ”standard sets” for the 10 selected paCent groups
** Finalized or ongoing 2015
Breast cancer
Available standard sets – deep-‐dives
Childbirth
Diabetes
Hip replacement Knee replacement
Mul?ple sclerosis
Obesity surgery
Prostate cancer
Rheumatoid arthri?s
Stroke
Sveus ICHOM
ü
ü
ü
ü
ü
ü
û
û
û
ü**
ü**
ü
ü
ü
ü
û
û
û
û
Other available standard sets*
Spine surgery
Coronary artery disease
Clep lip and palate
Cataracts
Depression and anxiety
Macular degenera?on
Lung cancer
Demen?a
Heart failure
Brain tumours
Cranofacial microsomia
Colon cancer Inflammatory bowel disease Frail elderly
Other planned standard sets**
* Developed in ICHOM or Sveus
Deep-‐dives
û
86 18 maj 2015
Content • Background of feasibility study and case examples from Sweden
• Denmark starCng point (organisaConal readiness and data landscape)
• High level assessment of potenCal for ten selected paCent groups in Denmark
• Suggested roadmap for Denmark
• Appendix
– Feasibility project governance
– Synthesis of key stakeholder interviews
– Danish healthcare data prerequisites for adopCng value based steering and support models
– Deep-‐dives: Assessment of potenCal and “ease of implementaCon” of new steering models for ten selected paCent groups
– Example analysis on Childbirth based on Danish data
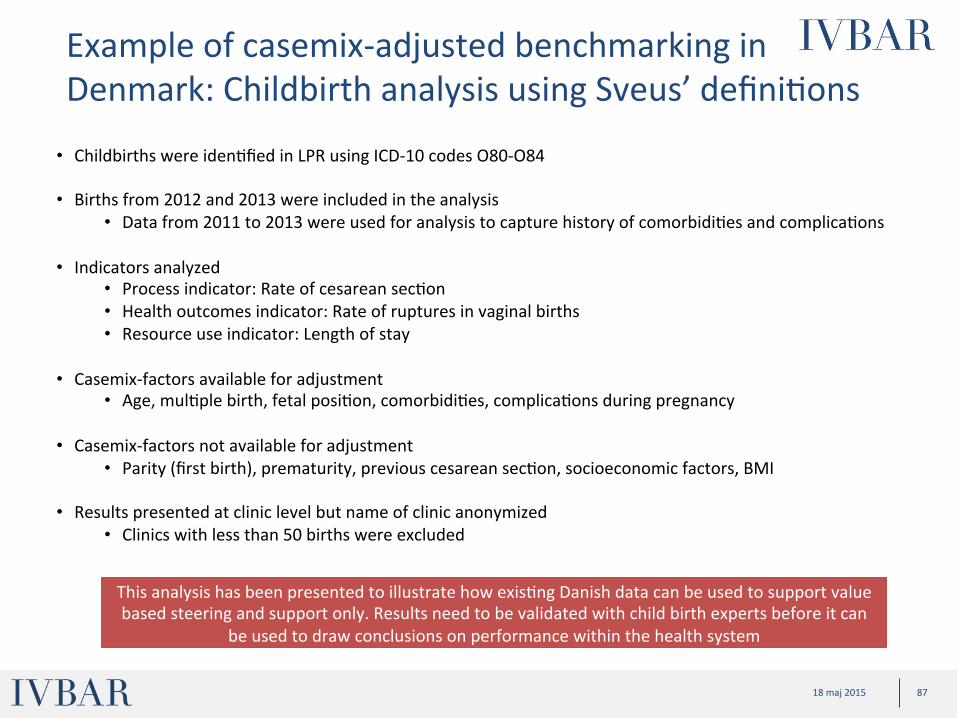
87 18 maj 2015
Example of casemix-‐adjusted benchmarking in Denmark: Childbirth analysis using Sveus’ definiCons
• Childbirths were idenCfied in LPR using ICD-‐10 codes O80-‐O84
• Births from 2012 and 2013 were included in the analysis • Data from 2011 to 2013 were used for analysis to capture history of comorbidiCes and complicaCons
• Indicators analyzed • Process indicator: Rate of cesarean secCon • Health outcomes indicator: Rate of ruptures in vaginal births • Resource use indicator: Length of stay
• Casemix-‐factors available for adjustment • Age, mulCple birth, fetal posiCon, comorbidiCes, complicaCons during pregnancy
• Casemix-‐factors not available for adjustment • Parity (first birth), prematurity, previous cesarean secCon, socioeconomic factors, BMI
• Results presented at clinic level but name of clinic anonymized • Clinics with less than 50 births were excluded
This analysis has been presented to illustrate how exisCng Danish data can be used to support value based steering and support only. Results need to be validated with child birth experts before it can
be used to draw conclusions on performance within the health system
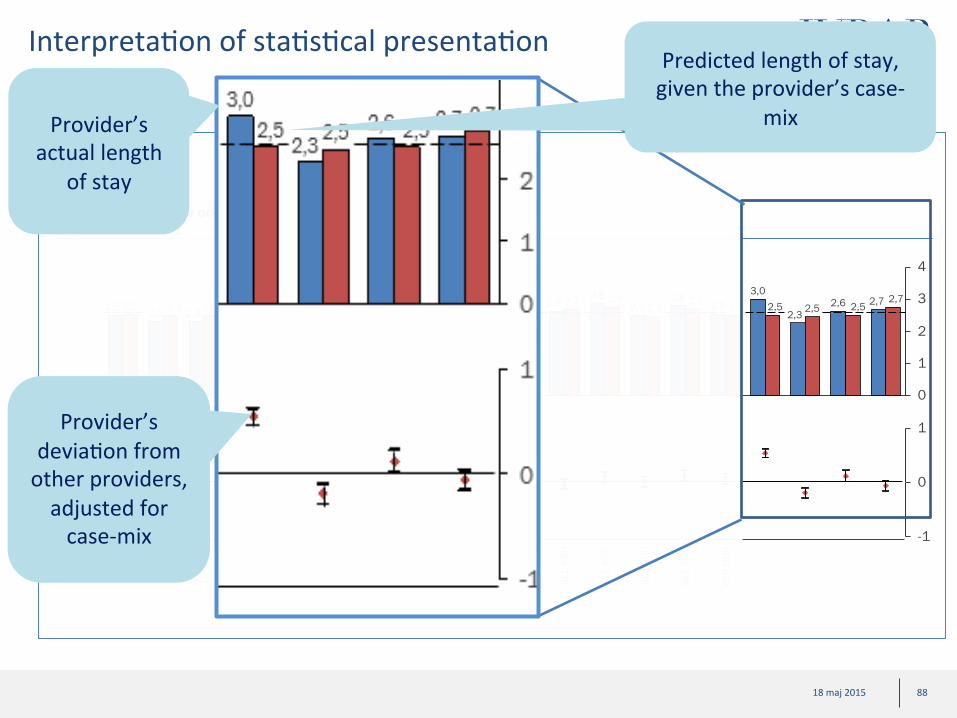
88 18 maj 2015
InterpretaCon of staCsCcal presentaCon
0
1
2
3
4
2,3 2,8
2,5 2,5 2,7 2,8 2,9
2,5
3,0 2,7 2,5
2,8 2,3 2,5 2,5 2,5
2,9
2,3 2,7 2,5 2,5 2,6 2,7 2,7
2,2 2,8 2,6 2,5 2,6 2,5 2,6 2,6 2,5 2,5
2,2 2,5 2,6 2,6 2,5 2,6
-1
0
1
SLL
BBS
SLL
KSH
SLL
SÖS
VGR
SMÖL
SLL
KSS
VGR
BOR
VGR
SKA
VGR
NÄL
SLL
SÖD
VGR
SÖST
RS Y
ST
LTD
FAL
LIO
NOR
LIO
LIN
LUL
AKA
RS S
US
RS K
RI
JLL
ÖST
RS H
EL
SLL
DAN
Vård?d per vårdgivare och avvikelse från övriga vårdgivare Dygn, 2011 och 2012
Predicted length of stay, given the provider’s case-‐
mix
Provider’s
deviaCon from other providers, adjusted for case-‐mix
Provider’s actual length
of stay

89 18 maj 2015
Rate of cesarean sec?ons (%)
Example of process measure: Significant variaCons in cesarean secCons
5 0
10 15
30 25 20
24,0 24,7
21,3 14,0
17,8 18,9 18,4
22,8 20,5 19,4
19,7
25,4 20,5
17,4 21,3 20,9
23,4 22,8 18,9
21,7
26,9 22,9 21,1 23,7
25,1
19,1
21,1 19,4
21,5 23,1
17,7 23,7 23,4 19,7
23,7
22,4
22,2 23,4 22,9
21,7 21,7
17,6
20,2 21,2
19,8
19,3 20,7
-0.5
0.0
0.5
c10 c8
c6
c5
c16 c3
c1
c4
c18 c7
c14
c13 c9
c2
c17
c15
c12
c11
c23
c22
c20
c21
c19
Devia?on from other providers (log-‐odds ra?o)
Predicted Observed
Note: Clinics with <50 births were excluded. Caesarian secCon idenCfied using a combinaCon of diagnosis codes (O82, O842) and procedure codes (MCA00, MCA10, MCA20, MCA30, MCA33, MCA96). Analysis adjusted for age, mulCple birth, fetal posiCon, comorbidiCes, complicaCons during pregnancy; 1) This analysis has been presented to illustrate how exisCng Danish data can be used to support value based steering and support only. Results need to be validated with child birth experts before it can be used to draw conclusions on performance of the health system; Source: LPR
95% C.I.
• Significant variaCon in observed secCon rate across clinics, between 14% and 27% in observed rate • Differences in predicted rates highlight differences in paCent populaCons • When controlling for case-‐mix, staCsCcally significant differences between clinics remain
Clinic c17 has an observed CS rate at average but actually
performs fewer CS than predicted, given their
case-‐mix.
Clinic c19 has an observed CS rate below average but also has an easier
case-‐mix
Clinic c5 performs significantly more CS than the other clinics
Total n=110 874
ILLUSTRATIVE ANALYSIS ONLY1

90 18 maj 2015
Rate of perineal tears (%)
Example of an health outcome measure: Significant variaCon in perineal tears (degree 3 and 4) in vaginal deliveries
2
6
0 1
3 4 5
3,1 3,4
3,9 3,2
4,0 4,6
3,9 3,9 4,4
4,0 3,8 4,7
5,9
3,9 3,4
3,8 4,0 3,8 3,9 3,7 4,0 3,9
4,9
2,1
3,9 3,7 3,5 4,0 4,0
4,3
3,2
4,0 4,0 3,5
4,2 4,9
4,0
5,0
3,7 3,9 3,3 3,2 3,9
4,0
3,1 3,9 4,0
0.5
-1.0
0.0
-0.5
c16
c11
c12
c10 c7
c22
c14 c6
c23
c20
c21
c19
c17
c13 c5
c3
c15
c18 c2
c8
c4
c1
c9
Devia?on from other providers (log-‐odds ra?o)
Predicted Observed
Note: Clinics with <50 births were excluded. Degree 3 and 4 perineal ruptures were idenCfied using diagnosis codes (O702, O703). Analysis adjusted for age, mulCple birth, fetal posiCon, comorbidiCes, complicaCons during pregnancy; 1) This analysis has been presented to illustrate how exisCng Danish data can be used to support value based steering and support only. Results need to be validated with child birth experts before it can be used to draw conclusions on performance of the health system; Source: LPR
95% C.I.
• Large variaCon in rupture rate across clinics • Between 2,1% and 5,9% in observed rate
• Ater controlling for casemix, staCsCcally significant differences between clinics remain • Important case-‐mix factors for ruptures such as first-‐birth and BMI are missing
Clinic c5 has a tear rate above expected (significant difference)
Clinic c19 has a tear rate below expected (significant difference)
Total n=86 399
ILLUSTRATIVE ANALYSIS ONLY1
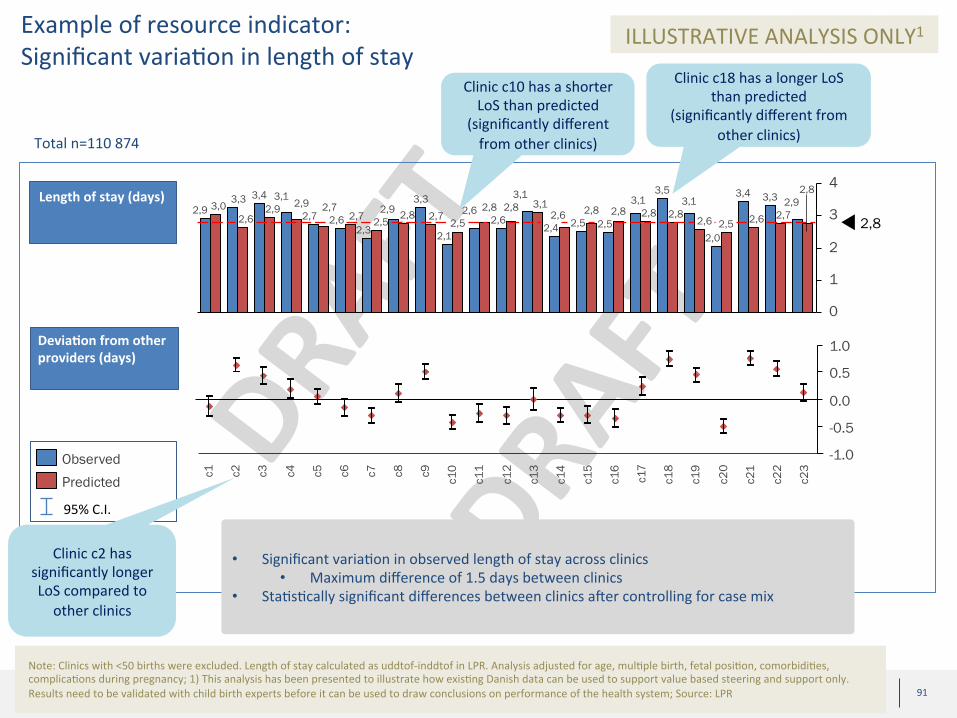
91 18 maj 2015
Length of stay (days)
Example of resource indicator: Significant variaCon in length of stay
0
1
2
3
43,4
3,0 3,3
2,9 2,6
2,0
3,1 3,5
3,3
2,6 2,7 2,8 2,8 2,9
2,6
3,4 3,3
2,5
3,1 2,8 2,6 2,8
2,4 2,5
3,1
2,6 2,8 3,1 2,8
2,6 2,8
2,8
2,7 2,5
2,9
2,5
3,1 2,9
2,7 2,5
2,1
2,8 2,9
2,3 2,6
2,7 2,7
0.5
1.0
-0.5
-1.0
0.0
c16
c19
c17
c14
c13
c10 c5
c21
c15 c1
c20
c11 c2
c18 c7
c6
c3
c8
c12 c4
c9
c22
c23
Devia?on from other providers (days)
Predicted Observed
Note: Clinics with <50 births were excluded. Length of stay calculated as uddtof-‐inddtof in LPR. Analysis adjusted for age, mulCple birth, fetal posiCon, comorbidiCes, complicaCons during pregnancy; 1) This analysis has been presented to illustrate how exisCng Danish data can be used to support value based steering and support only. Results need to be validated with child birth experts before it can be used to draw conclusions on performance of the health system; Source: LPR
95% C.I.
• Significant variaCon in observed length of stay across clinics • Maximum difference of 1.5 days between clinics
• StaCsCcally significant differences between clinics ater controlling for case mix
Clinic c2 has significantly longer LoS compared to other clinics
Clinic c18 has a longer LoS than predicted
(significantly different from other clinics)
Clinic c10 has a shorter LoS than predicted
(significantly different from other clinics) Total n=110 874
ILLUSTRATIVE ANALYSIS ONLY1

92 18 maj 2015
Possibly significant potenCal for improved outcomes and reduced costs
• Large variaCon observed in Danish childbirth care in indicators related to process measures, health outcomes and resource use
• Discussions with Danish obstetricians and midwives needed to validate findings and discuss potenCal underlying causes for differences
• Significant room for improved analyses by linking to addiConal data • AddiConal indicators (health outcomes and process measures from quality register) that are important from a value-‐based perspecCve
• Enhancement of case mix-‐adjustment by adding important risk factors not available in LPR
This analysis has been presented to illustrate how exisCng Danish data can be used to support value based steering and support only. Results need to be validated with child birth experts before it can
be used to draw conclusions on performance of the health system
Copyright © 2022 FDOKUMEN