Collina-Girard, J. (2007).-"Geology and Myth in the Gibraltar Strait".
Upload
independentCategory
view
1download
0
CDI Vol 28 No 2 2004 127
Vaccine preventable diseases and vaccination coverage of Indigenous people
Vaccine preventable diseases and vaccination
coverage in Aboriginal and Torres Strait
Islanders people, Australia, 1999 to 2002
Robert Menzies, Peter McIntyre, Frank BeardNational Centre for Immunisation Research and Surveillance of Vaccine Preventable Diseases
AbstractThis report complements the Vaccine Preventable Diseases and Vaccination Coverage reports produced biannually since 2000 by the National Centre for Immunisation Research and Surveillance of Vaccine Preventable Diseases in association with the Australian Institute of Health and Welfare. It integrates the available sources of routinely collected data relevant to the current status of vaccine preventable diseases and vaccine coverage in Aboriginal and Torres Strait Islander people in Australia. It aims to better inform Indigenous communities, Indigenous health care providers and planners of immunisation services of the current status and future needs for vaccine prevention in Indigenous people. The data presented here demonstrate that vaccination programs have had a signifi cant impact on the health of Aboriginal and Torres Strait Islander people. Several areas are highlighted for further development of vaccination policy recommendations, in particular high rates of preventable hepatitis A and B, infl uenza and pneumococcal disease. Areas where more research is needed include means to more accurately monitor vaccination status, the applicability of meningococcal serogroup B vaccines when available, and effective ways of increasing vaccination coverage and timeliness of vaccination. Such issues need to be considered and implemented in full cooperation with Aboriginal and Torres Strait Islander people. Commun Dis Intell 2004;28:127–159.
Keywords: Aboriginal, indigenous people, Torres Strait Islander, vaccination coverage, vaccine preventable disease
Corresponding author: Mr Robert Menzies, Senior Research Offi cer, National Centre for Immunisation Research and Surveillance, The Children’s Hospital at Westmead, Locked Bag 4001, Westmead NSW 2145. Telephone: +61 2 9845 3065. Facsimile: +61 2 9845 3095. Email: [email protected]
This report is also available separately as Commun Dis Intell 2004:28 Suppl 1 and as AIHW Cat. No. IHW 13.
Introduction
Rationale
Aboriginal and Torres Strait Islander people experi-ence a greater burden of both communicable and non-communicable diseases compared to the non-Indigenous population.1 Specifi c information on vaccination coverage and vaccine preventable dis-eases (VPDs) in Aboriginal and Torres Strait Islander people has been limited, with most published data coming from studies in certain regions or occasional jurisdictional reports. While national data on other Aboriginal and Torres Strait Islander health issues have been published utilising existing administrative data collections,1 this report is the fi rst comprehen-sive descriptive analysis of vaccination coverage and vaccine preventable diseases in Aboriginal and Torres Strait Islander people at the national level.
The report and its rationale have the support of the National Aboriginal Community Controlled Health Organisation (NACCHO).
Social and economic context
The relationship between socioeconomic status and health is well documented. A gradient is observable with lower rates of death and most illnesses as socioeconomic position improves.2 Aboriginal and Torres Strait Islander people are disadvantaged in terms of most socioeconomic indices (income, education, employment, housing) compared to other Australians.1 In particular, the disproportionate exposure to overcrowded living conditions and inad-equate essential infrastructure which Aboriginal and Torres Strait Islander people experience is known to facilitate the spread of many infectious diseases.1

128 CDI Vol 28 No 2 2004
Vaccine preventable diseases and vaccination coverage of Indigenous people
Demographic context
The Aboriginal and Torres Strait Islander popula-tion has a signifi cantly younger age profi le than the Australian population as a whole. Comparisons between Indigenous and other populations must take age into consideration, either through age standardisation or stratifi cation by age group.1
Approach
This report presents data on notifi cations of VPDs and on hospitalisations and deaths coded as being related to VPDs for the years 1999 to 2002. The completeness of identifi cation of Aboriginal and Torres Strait Islander people varies between Australian jurisdictions. In accordance with previous practice,3 the data for notifi cations, hospitalisations and deaths are presented in different combinations of states and territories, as outlined below in the methods section.
Methods
Vaccine preventable diseases data
Three sources of routinely collected data were used for this report. Notifi cation data were obtained from the National Notifi able Diseases Surveillance System (NNDSS), hospitalisation data from the Australian Institute of Health and Welfare (AIHW) National Hospital Morbidity Database, and mortality data from the AIHW Mortality Database.
Notifi cations
The NNDSS database includes information about cases of VPDs reported by laboratories and health workers to state and territory authorities under public health legislation. State and territory notifi ca-tion criteria were based on the National Health and Medical Research Council (NHMRC) surveillance case defi nitions4 in most jurisdictions. The case defi nitions presented for each disease in the results section are those of the NHMRC4 with the excep-tion of pneumococcal disease, which is taken from Roche, et al.5 New standard national surveillance case defi nitions have recently been developed and were adopted in some jurisdictions during the period covered by this report. However, any changes in case defi nitions are unlikely to have a signifi cant impact on the notifi cation rates presented.
Notifi cations with an onset between 1 January 2000 and 31 December 2002 were analysed for this report. The variables extracted for analysis were: disease, date of disease onset, age at onset, Indig enous sta-tus and state or territory where the noti fi cation origi-nated. Following an assess ment of completeness of the Indigenous status fi eld (see below), notifi cations were included from New South Wales, the Northern Territory, South Australia and Western Australia. Detailed data are presented for Haemophilus infl uenzae type b (Hib) disease, hepatitis A, acute hep-atitis B, measles, meningo coccal disease, pertussis, and pneumococcal disease. Notifi cation data are not presented for VPDs with few or no notifi cations in the period (diphtheria, mumps, polio, rubella, tetanus), or for varicella, for which a vaccine was not widely used during this period. Summary data for these are provided in the Appendix. Data are not provided for infl uenza notifi cations due to the low level of com-pleteness of the Indigenous status fi eld.
Hospitalisations
The AIHW National Hospital Morbidity Database receives administrative, demographic and clinical inform ation about patients admitted to public and private hospitals in Australia. Data are received by fi nancial year of hospital separation. The three most recent years for which data were available (1999/00, 2000/01 and 2001/02) were examined. Data for 2001/02 are provisional because, at the time of publication, New South Wales data were under revi-sion. The variables extracted for analysis were: date of separation, age at admission, state or territory of hospitalisation, Indigenous status and diagnoses. Diagnoses included principal and other with up to 31 diagnoses for each admission, coded using the International Statistical Classifi cation of Diseases and Related Health Problems, 10th Revision, Australian Modifi cation, 1st Edition (ICD–10–AM). Eligible sepa-rations were those with the code of interest listed in any diagnosis fi eld except for hepatitis B, where only principal diagnoses were included. Detailed data are presented for hepatitis A, acute hepatitis B, infl uenza and pneumonia, measles, meningococcal disease, pertussis, and pneumococcal disease. Separation data are not presented in the results section for those VPDs with few or no separations during the period (diphtheria, mumps, polio, rubella, tetanus), with no specifi c ICD10 code (Hib disease), or for which a vac-cine was not widely used during this period (varicella). Summary data for these diseases are provided in the Appendix.

CDI Vol 28 No 2 2004 129
Vaccine preventable diseases and vaccination coverage of Indigenous people
Deaths
Death data were obtained from the AIHW Mortality Database. These data are supplied annually to the AIHW by the Australian Bureau of Statistics (ABS). Analysis was by year of registration for the three most recent years for which data were available (2000 to 2002). The variables extracted were: age, state or territory of registration, Indigenous status, and underlying cause of death, coded using the International Classifi cation of Disease, 10th Revision (ICD–10). Deaths where the disease of interest was recorded as the underlying cause are used in this report. Following previous practice,1 mortality data for those jurisdictions considered to have the most complete coverage of Aboriginal and Torres Strait Islander deaths (Queensland, South Australia, Western Australia and the Northern Territory) were combined. For diseases included in the results sec-tion, numbers of deaths are presented by age group where appropriate, and as summary data. For those VPDs not included in the results section (diphtheria, mumps, polio, rubella, tetanus and varicella), sum-mary data are provided in the Appendix.
Calculations
Incidence rates in Aboriginal and Torres Strait Islander people were calculated using ABS esti-mates of Indigenous populations as at mid-2001.6 Incidence rates for other (presumed non-Indigenous) persons were calculated using as the denominator the total ABS estimated resident population as at mid-2001, minus the relevant Indigenous popula-tion. Rates for all ages combined were age stand-ardised to the ABS Australian population estimates for 2001,6 for both those categorised as Indigenous and other. Rate ratios for Indigenous versus other persons were calculated for each disease, with age-specifi c rate ratios where appropriate. All rates are presented as average annual rates per 100,000 total population or population by age group, as appropriate.
Report structure for individual diseases
For each disease, data are presented in the follow-ing format:
• description of salient clinical and epidemiological features;
• case defi nitions (NHMRC 1994 unless otherwise specifi ed);
• distribution by Indigenous status (and age where appropriate); and
• comment on the data presented.
Vaccination coverage data
Data on coverage for various vaccines at the nat-ional level were provided by the Health Insurance Commission (from the Australian Childhood Immun-isation Register [ACIR]) and the Australian Bureau of Statistics (from the 2001 National Health Survey).
The ACIR is administered by the Health Insurance Commission (HIC) for the Australian Government Department of Health and Ageing, and records the vaccination service details of children aged less than seven years from data supplied by vaccine provid-ers. Vaccination coverage estimates derived from ACIR data have been reported in Communicable Diseases Intelligence since early 1998. A complete description of the method for calculating coverage estimates by age cohorts is given elsewhere.7 National data on coverage in children recorded as Aboriginal and Torres Strait Islander have not been published previously.
The 2001 National Health Survey included a supple-mentary survey of 3,198 Aboriginal and Torres Strait Islander adults and children in order to improve the precision of estimates of Indigenous people. The sample covered all areas of Australia, including sparsely settled areas. When combined with the main survey, the total Indigenous sample size was 3,681.8 This survey provided national data on the immunisation status of Aboriginal and Torres Strait Islander people for the fi rst time in Australia. This report includes more detailed tabulations not previ-ously published. Immunisation status was collected by face-to-face interview for both adults and children. Respondents were asked to consult written records if available. Vaccinations were regarded as given if at least a date of vaccination was supplied. Children were regarded as vaccinated appropriately for age if the vaccine was administered up to one month after the recommended age. Thus, data from the National Health Survey are not directly comparable with the ACIR due to differences in both the methods of data collection and calculation of vaccination status.
Data quality and notes on interpreting data
As a consequence of differences in data quality and availability, the time periods and states and territories included in this report differ between data collections. Comparing data from the different collections is therefore problematic and should take account of the various factors outlined below.

130 CDI Vol 28 No 2 2004
Vaccine preventable diseases and vaccination coverage of Indigenous people
Indigenous identifi cation
The quality of Indigenous health statistics depends on both the accuracy of Indigenous population esti-mates and the level of completeness and accuracy of reporting achieved in the collection of Indigenous status for the condition of interest.1 Considerable work has been done in recent years on assessing and improving the quality of Indigenous statistics in national and state and territory administrative data collections.1 More work is needed to improve the quality of the data, as large variations in quality exist between data collections, between States, and over time. For this report, data and analyses chosen for inclusion are in most instances similar to previous publications on those data collections.1 This is not the case where there have been changes in data quality since the last publication, or no previous assessment has been carried out, as specifi ed below.
Notifi cation data
Indigenous identifi cation
The proportion of notifi cations lacking identifi cation of Indigenous status were analysed by state, year and disease. Adequate levels of completeness of Indigenous status identifi cation between 2000 and 2002 were defi ned as at least 60 per cent for a substantial majority of the diseases analysed. This level of completeness was achieved for New South Wales, South Australia, Western Australia and the Northern Territory. After fi rst establishing that the notifi cation incidence estimates were not dominated by any one of these four States for all diseases of interest (data not shown), estimates are presented for the four jurisdictions combined. Although a previous presentation of notifi cations for the period 1998–20003 excluded New South Wales, data completeness for this State between 2000 and 2002 was found to be comparable to that of South Australia and Western Australia. As a high propor-tion of infl uenza notifi cations lacked identifi cation of Indigenous status in all states and territories, other than the Northern Territory, infl uenza was excluded from further analysis.
Overall, estimated Indigenous notifi cation rates can be considered underestimates, due to the incom-plete recording of Indigenous status.
Other issues
A major consideration in interpreting notifi cation data is that they represent only a proportion of the total cases occurring in the community. This proportion is usually unknown and may vary between diseases, with infections diagnosed by a laboratory test more likely to be notifi ed. Data accuracy may also vary between states and territories, due to the use of different case defi nitions for surveillance and vary-ing reporting requirements by medical practitioners, laboratories and hospitals. In addition, data accuracy may change over time as new diagnostic tests are introduced or surveillance practices change.
Hospitalisation data
Indigenous identifi cation
Although the overall proportion of hospitalisations lacking identifi cation of Indigenous status was low (less than 5%) from 1999/00 to 2001/02, variability in completeness and in accuracy of identifi cation have been previously documented.3,9 The proportion of Aboriginal and Torres Strait Islander people correctly identifi ed in hospital records has varied between 44 per cent and 100 per cent in studies conducted in various jurisdictions since 1997.9 Following previous practice,1 hospital separations are presented for all jurisdictions combined. Indigenous hospitalisation rates can also be considered underestimates due to the incomplete identifi cation of Aboriginal and Torres Strait Islander people.
Other issues
There are limitations associated with the use of ICD–10–AM codes to identify cases. Hospital cod-ing errors have been reported to occur more com-monly for diseases that the coder was less familiar with and for admissions with multiple diagnoses.10 Assignation of codes is based on information in medi-cal records, as recorded by clinicians, without strict case defi nitions. This is in contrast with the more stringent case defi nitions used for notifi cation data. Indigenous hospitalisations where the code of inter-est was in any diagnosis fi eld were included, and the relative importance of these cannot be gauged. For acute hepatitis B, cases were only included where the code of interest was the principal diagnosis, as previous studies have found a substantially lower proportion of principal diagnoses compared to other diseases.11,12

CDI Vol 28 No 2 2004 131
Vaccine preventable diseases and vaccination coverage of Indigenous people
It should also be noted that the hospitalisation database contains a record for each admission, which means that there are separate records for each readmission or inter-hospital transfer. This is unlikely to have a major impact on the numbers reported for most diseases reviewed, as they are acute illnesses, but may infl ate the numbers of hospitalisations where inter-hospital transfer is more frequent, either because of remote residence or the severity of the illness.
Death data
Indigenous identifi cation
The accuracy of reporting Indigenous status on deaths has been previously evaluated by comparing the reported number with an expected, or predicted, number of Indigenous deaths.1 Reporting was found to be acceptable for deaths in 1997–1999 in Queens land, South Australia, Western Australia and the North ern Territory. Following previous practice,1 reported deaths from these four States only have been pre sented in this report. These combined rates may still underestimate Indigenous death rates due to under-reporting.
Other issues
Mortality data were analysed by year of registra-tion rather than by year of death. Approximately six per cent of deaths in a particular calendar year are registered in the subsequent year, mostly deaths in the previous December. Issues associated with the accuracy of the ICD codes used for hospital separa-tions may also apply to mortality data.
Vaccination coverage data
Indigenous identifi cation
The completeness of reporting of Indigenous status on the ACIR was analysed by comparing the number of children recorded as Aboriginal or Torres Strait Islander on the ACIR with ABS 2001 Census data. Indigenous status is currently either not routinely reported or not transferred to the ACIR from the Australian Capital Territory, Queensland and Tasmania, so these jurisdictions were not included in this report. For New South Wales, the Northern Territory, South Australia, Victoria and Western Australia, 61 per cent of the estimated cohort of Aboriginal or Torres Strait Islander children aged 12–18 months and 65 per cent of the estimated cohort aged 24–30 months were recorded as Aboriginal or Torres Strait Islander on the ACIR. The accuracy of the information recorded in the Indigenous status fi eld was assessed by com-parison of Hib vaccines received, adapting a method developed by Hull, et al.13 Until May 2000, different Hib vaccines were recommended for Indigenous (Hib
vaccine conjugated to outer membrane protein of Neisseria meningitidis, Pedvax) and non-Indigenous (Hib vaccine conjugated to a mutant diphtheria toxin, HibTiter) children. Children born between 1 January and 30 April 2000 and recorded on the ACIR as receiv-ing a Hib vaccine and being Aboriginal or Torres Strait Islander were 27 times more likely to have received a dose of Pedvax. Children recorded as receiving a dose of Pedvax were nine times more likely to be recorded as Aboriginal or Torres Strait Islander than children who received other Hib vaccines. These data suggest an acceptable level of correlation between the recording of Indigenous status and the receipt of a vaccine recommended only for Aboriginal and Torres Strait Islander children.
Other issues
General limitations of data available from the ACIR must be considered when used to estimate vaccina-tion coverage. A study conducted in 2001 found that the ACIR underestimated overall Australian immu-nisation coverage by 2.7 per cent at 12 months of age and fi ve per cent at 24 months.14 However, for Aboriginal and Torres Strait Islander children these estimates may not be valid, as there is the issue of both under-reporting of vaccinations given to the ACIR and incomplete identifi cation of Indigenous children. This means that ACIR coverage estimates could overestimate or underestimate coverage, depending on whether those children not identifi ed as Aboriginal and Torres Strait Islander have higher or lower than average vaccination coverage. The ACIR holds records only for children up to seven years of age. Coverage is calculated only for children registered on Medicare; however, current data show that by the age of 12 months practically all Australian children have been registered with Medicare (personal communication, Kathi Williams, Health Insurance Commission, April 2004).
Indigenous population estimates
Estimation of the size and age composition of the Aboriginal and Torres Strait Islander population is diffi cult. Increases in census counts of Aboriginal and Torres Strait Islander people between 1966 and 1996 are far greater than can be explained by simple demographic factors (births minus deaths).15 Other factors thought to be important include changes in: the propensity to identify as Indigenous in the Census; the proportion of children with only one Aboriginal and Torres Strait Islander parent identifi ed as Indigenous; and Census enumeration procedures.3,15
In this report, Australian Bureau of Statistics estimates of Aboriginal and Torres Strait Islander population fi gures, based on 2001 Census data,6 are used.

132 CDI Vol 28 No 2 2004
Vaccine preventable diseases and vaccination coverage of Indigenous people
Results
Table 1 summarises the main fi ndings, showing the reported incidence per 100,000 total population in Indigenous and other (presumed non-Indigenous) people and the ratio of incidence in Indigenous to other (presumed non-Indigenous) people. The estimates of incidence in Indigenous people are based on incomplete ascertainment of Indigenous status and can be considered as minimum estimates. Table 1 illustrates the large burden (incidence) and relative burden (rate ratio) of almost all VPDs in Indigenous people. When measured across all age groups in the Indigenous population, pertussis, infl u-enza and pneumococcal disease have the highest incidence, though the differential burden, as meas-ured by the rate ratio, is highest for Haemophilus infl uenzae type b (Hib) disease and hepatitis A. It is important to note that the Indigenous population is signifi cantly younger than the non-Indigenous population and that both the absolute and relative burdens are greatest in the youngest age groups for most VPDs.
Table 1. Summary of notifi cation or hospitalisation rates of vaccine preventable diseases in
Australia, 2000 to 2002*
Disease Notifi cation or hospitalisation rates — all ages† Indigenous age group with peak
incidence
Indigenous Other‡ Incidence rate
ratio
Age group Notifi cation or
hospitalisation rate
Invasive Hib disease 1.2 0.1 9.7 0–4 10.0
Hepatitis A 9.1 3.1 2.9 0–4 37.1
Hepatitis B 7.2 1.6 4.4 15–24 14.1
Infl uenza§ 49.3 17.1 2.9 0–4 127.3
Measles 0.2 0.4 0.6 – –
Meningococcal disease 7.2 3.4 2.1 0–4 50.7
Pertussis 41.8 46.9 0.9 0–4 89.7
Pneumococcal disease 44.7 9.9 4.5 0–4 87.0
* Notifi cations (New South Wales, Northern Territory, South Australia and Western Australia only) where the date of onset was between 1 January 2000 and 31 December 2002, except for pneumococcal disease, which is from 1 January 2001 to 31 December 2002.
† Notifi cations per 100,000 population (unless otherwise specifi ed), age standardised to the Australian Bureau of Statistics Australian estimated population 2001.6
‡ Includes records where Indigenous status was not stated.
§ Infl uenza data are hospitalisations (all states and territories) where the month of separation was between 1 July 1999 and 30 June 2002.
Haemophilus infl uenzae type b disease
Haemophilus infl uenzae is a fastidious Gram-neg-ative bacterium, which occurs in both encaps ulated and unencapsulated forms. Before Hib vaccines became available, one encapsulated sero type, type b (Hib), caused at least 95 per cent of invasive infec-tions due to H. infl uenzae (those associated with isolation of the organism from a normally sterile site) in children.16,17 The most common manifestation of invasive Hib disease was meningitis, with children aged less than 18 months most at risk.17–19 Aboriginal children had a particularly high risk of Hib meningi-tis, with a recorded incidence among children living in Central Australia among the highest in the world and an earlier age of onset than non-Indigenous children.20 Survivors of Hib meningitis commonly had neurological sequelae such as deafness and intellectual impairment. Epiglottitis, a potentially fatal infl ammation of the epiglottis obstructing breathing, was the other major category of infection, but was rare in Aboriginal and Torres Strait Islander chil-dren.20 Less common manifestations of invasive Hib disease include a range of focal infections (cellulitis, septic arthritis, pneumonia, pericarditis, osteomyeli-tis) and septicaemia without focus.

CDI Vol 28 No 2 2004 133
Vaccine preventable diseases and vaccination coverage of Indigenous people
Distribution by age and Indigenous status
In 2000–2002, there were a total of 47 notifi ca-tions of invasive Hib disease in the jurisdictions with adequate data, 24 in children 0–4 years, of whom 11 (46%) were identifi ed as Aboriginal and Torres Strait Islander (Table 2). The notifi cation rate of 10 per 100,000 in Aboriginal and Torres Strait Islander children under fi ve years of age gave a rate ratio of 15 for this age group, compared to four in persons fi ve years and over. Cases in Aboriginal and Torres Strait Islander children were not wholly or predominantly reported from any one jurisdiction.
A similar number of notifi cations were received for persons 0–4 years and fi ve years of age and over. Among 0–4 year olds, there was a striking difference in the annual notifi cation rates for Aboriginal and Torres Strait Islander (10 per 100,000) and other children (0.7 per 100,000).
Comment
The Hib immunisation program in Australia com-menced in April 1993, with catch-up immunisation for children up to fi ve years of age from July 1993. Until June 2000, Aboriginal and Torres Strait Islander chil-dren were scheduled to receive a different Hib vac-cine (conjugated to the outer membrane of Neiss eria meningitidis type C, PRP–OMP) than other children who received a vaccine conjugated to a mutant diph-theria toxin (CRM197). Since June 2000, all Australian children have received PRP–OMP vaccine.
Following the introduction of Hib vaccination in 1993, children aged up to 15 years and children born since the introduction of the program up to 10 years of age by July 2003 were eligible to receive it. Indigenous status was poorly reported in the National Notifi able Diseases Surveillance System until the late 1990s, but an enhanced surveillance scheme for inva-sive Hib disease, established in 1993, included Indigenous status.21 Vaccination has had a striking impact on the incidence of Hib disease in the age groups targeted by immunisation programs, among both Indigenous and non-Indigenous children.21 Compared to an incidence of 35–40 per 100,000 in the general population and up to 280 per 100,000 in Aboriginal and Torres Strait Islander children living in the Northern Territory,22 notifi cation rates presented in this report (0.7 and 10.0 respectively in 2000–2002) represent a reduction of almost 98 per cent since vaccination was introduced.
Haemophilus infl uenzae type b
Case defi nitions
Notifi cations
(a) A clinically compatible illness (meningitis, epiglottitis, cellulitis, septic arthritis, osteomyelitis, pneumonia, pericarditis or septicaemia) and either:
isolation of Haemophilus infl uenzae type b from blood or
detection of Hib antigen (in a clinically compatible case) or
detection of Gram-negative bacteria of characteristic appearance where the organism fails to grow in a clinical case
or
b) A confi dent diagnosis of epiglottitis by direct vision, laryngoscopy or X-ray.
Hospitalisations and deaths
Hospitalisations and deaths were not analysed as there are no ICD–10–AM/ICD–10 codes which specify Hib as a causative organism, as opposed to Haemophilus infl uenzae (type unspecifi ed).
Table 2. Haemophilus infl uenzae type b
notifi cations, selected Australian States,* 2000 to
2002, by Indigenous status
Age group
(years)
Indigenous
statusNotifi cations(2000–2002)
n Rate† Rate
ratio
0–4 Indigenous 11 10.0 14.7
Other 13 0.7
5 and over Indigenous 2 0.3 3.6
Other 21 0.1
All ages‡Indigenous 13 1.2 9.7
Other 34 0.1
* New South Wales, Northern Territory, South Australia and Western Australia only, where the date of onset was between 1 January 2000 and 31 December 2002.
† Average annual age-specifi c rate per 100,000 population.
‡ Rates for all ages combined are age standardised to the Australian Bureau of Statistics Australian population estimates for 2001.6

134 CDI Vol 28 No 2 2004
Vaccine preventable diseases and vaccination coverage of Indigenous people
number of cases higher than in other children (Table 3) and rate ratios of 57 and 22 respectively. This excess morbidity falls sharply with age, with smaller but sub-stantial Indigenous versus other rate ratios among children 5–14 years of age (8 for notifi cations, 7 for hospitalisations), decreasing to two or less from the age of 15 years. Figures 1 and 2 illustrate the striking difference between young children and others when comparing both notifi cations and hospitalisations for Indigenous and other people.
Although the number of cases has decreased mark-edly, the proportion of total Hib disease cases occur-ring in Aboriginal and Torres Strait Islander people has increased from around seven per cent before 1993 to 15 per cent in 2000.21 This report shows a further increase in the differential between Aboriginal and Torres Strait Islander people and others to a rate ratio of 10 overall and 15 among children under fi ve years of age. However, the point estimate for incidence in Aboriginal and Torres Strait Islander children under fi ve years of 10.0 per 100,000 com-pares favourably with that among American Indian children in 1998–2000.21 A similar pattern of increas-ing disparity in Hib disease rates has also been observed between Maori-Pacifi c Islander children and other children in New Zealand.23 The available data indicate that Hib immunisation rates are accept-able in Aboriginal and Torres Strait Islander children in some geographic areas.22 However, the role of regional variations in immunisation coverage should be examined as a likely reason for this increasing disparity. Crowded living conditions may also be a factor, being associated with high levels of Hib colonisation in the nasopharynx. In the meantime, the experience of similar Indigenous populations in Alaska24 suggests that continued use of a Hib vaccine which is immunogenic after the fi rst dose is appropriate in Aboriginal and Torres Strait Islander children.
Hepatitis A
Infection with the hepatitis A virus (HAV), a picorna virus, produces symptoms with a wide range from subclinical hepatitis to acute hepatitis with jaundice and, in the most severe cases, fulminant hepatitis leading to death. The single most important factor in determining the outcome of HAV infection is age. In symptomatic adult cases, onset of clinical symptoms is usually abrupt with fever, anorexia, malaise, nau-sea and abdominal discomfort followed by jaundice. In contrast, over 90 per cent of infections acquired before the age of fi ve years are clinically silent. In adults, the proportion of infected individuals showing symptoms is thought to be around 90 per cent.25,26
Distribution by Indigenous status and age
Of the total of 1,012 notifi cations of hepatitis A recorded in the relevant jurisdictions, 113 (11%) were identifi ed as occurring in Aboriginal and Torres Strait Islander people, as were 82 (6%) of the 1,309 hospitalisations recorded nationally. The overall rate ratio of cases identifi ed as Indigenous to those presumed to be non-Indigenous was three for notifi cations and two for hospitalisations. Both hospitalisation (16 per 100,000) and notifi cation (37 per 100,000) rates were highest among children 0–4 years identifi ed as Indigenous, with the absolute
Figure 1. Hepatitis A notifi cation rate, selected
Australian States,* 2000 to 2002,† by age group
and Indigenous status
0
5
10
15
20
25
30
35
40
0-4 5-14 15-24 25-49 50+
Age group (years)
Not
ifica
tions
per
100,
000
popu
latio
n
IndigenousOther
* New South Wales, South Australia, Western Australia and the Northern Territory.
† Notifi cations where the date of onset was between 1 January 2000 and 31 December 2002.
Hepatitis A
Case defi nitions
Notifi cations
a) Detection of anti-hepatitis A virus IgM antibody, in the absence of recent vaccination
or
b) A clinical case of hepatitis (jaundice ± elevated aminotransferase levels, without a non-infectious cause) and an epidemiological link to a serologically confi rmed case.
Hospitalisations and deaths
The ICD–10–AM/ICD–10 codes B15 (hepatitis A) were used to identify hospitalisations and deaths.

CDI Vol 28 No 2 2004 135
Vaccine preventable diseases and vaccination coverage of Indigenous people
Comment
The data in this report show a high burden of hepatitis A among Aboriginal and Torres Strait Islander children, with a progressive decrease in incidence with increasing age. The high rate ratio for hospitalisations due to hepatitis A in children under the age of fi ve years is particularly noteworthy, indi-cating that higher rates of disease are refl ected in signifi cantly higher levels of morbidity in Aboriginal and Torres Strait Islander children. One death was coded as due to hepatitis A in an Aboriginal and Torres Strait Islander child in the reporting period, and other such deaths have been reported recently in North Queensland.27
The pattern of acquisition of hepatitis A is known to vary substantially according to living standards. More advantaged communities have delayed or no expo-sure to hepatitis A, with the majority seronegative even in middle age, while communities living in crowded and/or less hygienic circumstances acquire infection and immunity to hepatitis A at an early age. In the Northern Territory in 1994, a serosurvey in rural Aboriginal populations found hepatitis A to be hyperendemic, with acquisition of the virus predomi-nantly in the fi rst fi ve years of life,28 as is characteris-tic of disadvantaged living conditions. It was argued that, in such circumstances, immunisation is of little
Table 3. Hepatitis A notifi cations, hospitalisations and deaths, Australia, 1999 to 2002,* by age
group and Indigenous status
Age
group
(years)
Indigenous
status
Notifi cations
(2000–2002)
Hospitalisations
(July 1999–June 2002)
Deaths
(2000–2002)
0–4 Indigenous 41 37.1 22.2 28 15.5 56.8 1
Non-Indigenous 32 1.7 10 0.3 0
5–14 Indigenous 44 20.2 7.7 16 4.5 7.1 0
Other 105 2.6 49 0.6 0
15–24 Indigenous 13 8.4 2.0 10 4.0 1.9 0
Other 163 4.1 161 2.1 0
25–49 Indigenous 13 4.7 1.1 28 6.3 2.3 0
Other 479 4.3 585 2.8 0
50+ Indigenous 2 2.3 1.6 0 0.0 0.0 0
Other 120 1.4 422 2.5 2
All ages‡ Indigenous 113 9.1 2.9 82 4.5 2.1 1
Other 899 3.1 1,227 2.1 2
* Notifi cations (New South Wales, Northern Territory, South Australia and Western Australia only) where the date of onset was between 1 January 2000 and 31 December 2002; hospitalisations (all States) where the date of separation was between 1 July 1999 and 30 June 2002; deaths (Queensland, Northern Territory, South Australia, Western Australia) where the date of death was recorded between 1 January 2000 and 31 December 2002.
† Average annual age-specifi c rate per 100,000 population.
‡ Includes cases with unknown ages. Rates for all ages combined are age standardised to the Australian Bureau of Statistics Australian population estimates for 2001.6
Figure 2. Hepatitis A hospitalisation rate,
Australia, 1999 to 2002,* by age group and
Indigenous status
0
2
4
6
8
10
12
14
16
18
0-4 5-14 15-24 25-49 50+
Age group (years)
Hos
pita
lisat
ions
per
100,
000
popu
latio
n
IndigenousOther
* Hospitalisations where the date of separation was between 1 July 1999 and 30 June 2002.

136 CDI Vol 28 No 2 2004
Vaccine preventable diseases and vaccination coverage of Indigenous people
benefi t and may produce a cohort whose immunity could subsequently wane.28 Although case-fatality and hospitalisation rates are low in children, with a high rate of infection some serious outcomes can be expected. In comparable Indigenous populations in the United States of America (USA), with similar high infection rates and age distribution, community-wide hepatitis A immunisation was recommended29 and has resulted in dramatic reductions in the inci-dence of hepatitis A.30 The recommendations have been expanded more recently to include the routine vaccination of children in areas where the rate of hepatitis A exceeds 20 per 100,000 population.29
In Australia, an immunisation program for hepatitis A was commenced among children from 18 months of age in North Queensland in 1999, in response to two deaths in Far North Queensland Aboriginal and Torres Strait Islander children from fulminant hepa-titis A.27 Early results from this program indicate that despite targeting only Aboriginal and Torres Strait Islander children, substantial reductions in hepati-tis A across all sectors of the population groups have occurred.31 Currently, no funded hepatitis A immuni-sation program exists in Australia outside of north Queensland. The favourable experience with hepa-titis A immunisation programs in north Queensland, and in high incidence areas of the United States of America, is in accord with experience in other highly endemic areas.32 The Australian Technical Advisory Group on Immunisation will examine the use of hepatitis A vaccination for children, particularly in relation to Indigenous children, in 2004.
Hepatitis B (acute)
Acute infection with hepatitis B virus (HBV), a hepad-navirus, may produce a range of conditions from subclinical hepatitis to acute hepatitis with jaundice and, rarely, fulminant hepatitis. Only a small propor-tion of HBV infections are clinically recognised, with less than 10 per cent of children and 30–50 per cent of adults experiencing clinical symptoms.33 Onset of illness, when it occurs, is usually insidious with anorexia, vague abdominal discomfort, nausea and vomiting and sometimes arthralgia and rash, often progressing to jaundice. The principal cause of mor-bidity and mortality from hepatitis B is chronic infec-tion, which may occur irrespective of symptoms. Chronic infection can lead to cirrhosis of the liver and hepatocellular carcinoma, usually over a prolonged period.34 The risk of chronic infection is greatest in those infected as infants, particularly if infected in the perinatal period. Accordingly, preventive efforts have been focussed, in both the Indigenous and non-Indigenous community in Australia, on prevent-ing maternal-infant transmission.
Distribution by Indigenous status and age
Of the total of 526 notifi cations of acute hepatitis B recorded in the relevant jurisdictions, 57 (11%) were identifi ed as occurring in Aboriginal and Torres Strait Islander people, as were 30 (6%) of the 463 hospitalisations recorded nationally. The overall rate ratio for cases identifi ed as Indigenous compared to those presumed to be non-Indigenous was four for both notifi cations and hospitalisations (Table 4). In contrast to hepatitis A, no notifi ed or hospitalised cases of hepatitis B were recorded as Indigenous among children 0–4 years. Notifi cation rates for acute hepatitis B then increased progressively among Aboriginal and Torres Strait Islander people, reach-ing a peak among 15–24 year olds and continuing to show a higher incidence in absolute and relative terms compared with other groups at all ages, maximal in those over 50 years (Figure 3). This was also refl ected in hospitalisations (Figure 4). The highest notifi cation rates per 100,000 were seen in both Indigenous and other populations in the 15–24 years (14 versus 4) and
Hepatitis B (acute)
Case defi nitions
Notifi cations
People who have a positive hepatitis B surface antigen (HBsAg) and one of the following:
hepatitis B core antibody (Anti-HBc) IgM
or
demonstration of a clinical illness consistent with acute viral hepatitis (jaundice, elevated aminotransferase levels).
Hospitalisations
ICD–10–AM code B16 (acute hepatitis B) was used to identify hospitalisations.
As in previous reports,12 hospitalisations were included only where the relevant ICD code was the principal diagnosis (which was in 30% of all hospitalisations which included acute hepatitis B). This is a much lower proportion than for the other diseases but similar to previous analyses of hepatitis B hospitalisations.33
Deaths
ICD–10 code B16 (acute hepatitis B) was used to select deaths from acute hepatitis B.

CDI Vol 28 No 2 2004 137
Vaccine preventable diseases and vaccination coverage of Indigenous people
Table 4. Acute hepatitis B notifi cations, hospitalisations and deaths, Australia, 1999 to 2002,* by
age group and Indigenous status
Age
group
(years)
Indigenous
status
Notifi cations
(2000–2002)
Hospitalisations
(July 1999–June 2002)
Deaths
(2000–2002)
0–4Indigenous 0 0.0
0.00 0.0
0.00
Other 3 0.2 1 0.0 0
5–14 Indigenous 3 1.4 5.5 1 0.3 3.1 0
Other 10 0.2 7 0.1 0
15–24 Indigenous 22 14.1 3.5 3 1.2 1.0 0
Other 162 4.1 98 1.3 2
25–49 Indigenous 29 10.4 4.6 22 4.9 4.2 2
Other 249 2.3 250 1.2 1
50+ Indigenous 3 3.4 6.8 4 2.8 6.0 0
Other 43 0.5 77 0.5 5
All ages‡ Indigenous 57 7.2 4.4 30 2.8 3.7 2
Other 469 1.6 433 0.8 8
* Notifi cations (New South Wales, Northern Territory, South Australia and Western Australia only) where the date of onset was between 1 January 2000 and 31 December 2002; hospitalisations (all States) where the date of separation was between 1 July 1999 and 30 June 2002; deaths (Northern Territory, South Australia, Queensland, Western Australia) where the date of death was recorded between 1 January 2000 and 31 December 2002.
† Average annual age-specifi c rate per 100,000 population.
‡ Includes cases with unknown ages. Rates for all ages combined are age standardised to the Australian Bureau of Statistics
Australian population estimates for 2001.6
Figure 3. Acute hepatitis B notifi cation rate,
selected Australian States,* 2000 to 2002,† by
age group and Indigenous status
0
2
4
6
8
10
12
14
16
0-4 5-14 15-24 25-49 50+
Age group (years)
Not
ifica
tions
per
100,
000
popu
latio
n IndigenousOther
* New South Wales, South Australia, Western Australia and the Northern Territory.
† Notifi cations where the date of onset was between 1 January 2000 and 31 December 2002.
Figure 4. Acute hepatitis B hospitalisation
rate, Australia, 1999 to 2002,* by age group and
Indigenous status
0
2
4
6
0-4 5-14 15-24 25-49 50+
Age group (years)
Hos
pita
lisat
ions
per
100,
000
popu
latio
n
IndigenousOther
* Hospitalisations where the date of separation was between 1 July 1999 and 30 June 2002.
25–49 years (10 versus 2) age groups. The highest hospitalisation rates per 100,000 were seen in cases aged 25–49 years cases identifi ed as Indigenous (5 per 100,000) with a rate ratio of four. Of the 10 deaths recorded, two were in persons identifi ed as Indigenous, both aged 25–49 years.

138 CDI Vol 28 No 2 2004
Vaccine preventable diseases and vaccination coverage of Indigenous people
Comment
The mortality and morbidity from hepatitis B among Aboriginal and Torres Strait Islander people has been recognised for at least two decades and led to childhood hepatitis B vaccination programs being introduced in the Northern Territory in the 1980s.33 Aboriginal and Torres Strait Islander newborns were also targeted for risk-based hepatitis B immunisation programs, along with children born to hepatitis B surface antigen positive mothers or parents born in countries with a high incidence of hepatitis B from this time. In contrast to hepatitis A, the greatest differential morbidity from hepatitis B is in the age groups over 15 and particularly over 25 years. This is consistent with some impact from immunisation programs, as the oldest cohorts of children targeted for immunisation would now be around 15 years of age.
The highest incidence of acute hepatitis B and the greatest differential between Indigenous and other hepatitis B incidence has always been in adoles-cents and young adults,33 and remains so in these data. Hepatitis B immunisation could be considered for adolescents and young adults, including prison populations, until birth cohorts eligible for hepatitis B vaccine reach adulthood. While providing information on acute disease, these data do not refl ect the sig-nifi cant chronic disease burden from hepatitis B for Aboriginal and Torres Strait Islander people, includ-ing liver cancer.
Infl uenza and pneumonia
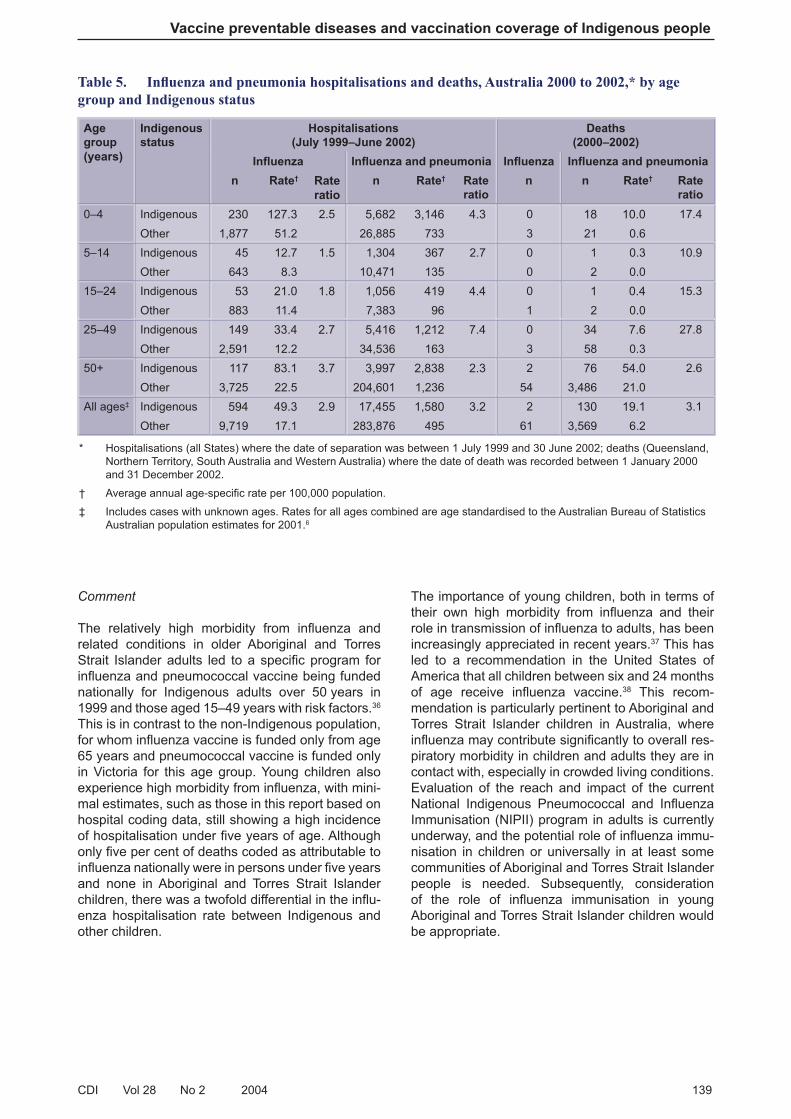
Infl uenza is an acute respiratory illness caused by infl uenza type A or B viruses. Onset of clinical symp-toms is typically abrupt with fever, cough, myalgia and prostration. Outbreaks of variable severity occur almost every winter in Australia and are associated with signifi cant morbidity and mortality, particularly in the elderly and chronically ill. The most common complication of infl uenza is pneumonia. It is generally believed that hospitalisations and deaths coded as infl uenza signifi cantly underestimate disease burden, with excess all-cause pneumonia and infl uenza com-bined, during the infl uenza season, being a better indicator of true disease burden.35
Distribution by Indigenous status and age
Rates of hospitalisation were higher in all Indigenous age groups for both infl uenza and infl uenza and pneu monia combined, with the highest rate ratio (7) for infl uenza and pneumonia combined in the 25-49 years age group (Table 5). While rates of infl uenza and pneumonia combined are substan-tially higher than for infl uenza alone, the pattern of distribution by age group is very similar (Figures 5 and 6, allowing for different scales). The rate ratio for deaths was highest in those aged 25–49 (28), 15–24 (15) and 0–4 years (17).
Infl uenza and pneumonia
Case defi nitions
Hospitalisations and deaths
The ICD–10–AM/ICD–10 codes J10 and J11 (infl uenza) were used to identify hospitalisations and deaths from infl uenza. The ICD–10–AM/ICD10 codes J10 to J18 were used to identify hospitalisations and deaths from infl uenza and all-cause pneumonia combined.
Figure 5. Hospitalisation rate for infl uenza,
Australia, 1999 to 2002,* by age group and
Indigenous status
0
20
40
60
80
100
120
140
0-4 5-14 15-24 25-49 50+
Age group (years)
Hos
pita
lisat
ions
per
100,
000
popu
latio
n
IndigenousOther
* Hospitalisations where the date of separation was between 1 July 1999 and 30 June 2002.
Figure 6. Hospitalisation rate for infl uenza
and all pneumonia combined, Australia, 1999 to
2002,* by age group and Indigenous status
0
500
1000
1500
2000
2500
3000
3500
0-4 5-14 15-24 25-49 50+
Age group (years)
Hos
pita
lisat
ions
per
100,
000
popu
latio
n
IndigenousOther
* Hospitalisations where the date of separation was between 1 July 1999 and 30 June 2002.
CDI Vol 28 No 2 2004 139
Vaccine preventable diseases and vaccination coverage of Indigenous people
Table 5. Infl uenza and pneumonia hospitalisations and deaths, Australia 2000 to 2002,* by age
group and Indigenous status
Age
group
(years)
Indigenous
status
Hospitalisations
(July 1999–June 2002)
Deaths
(2000–2002)
Infl uenza Infl uenza and pneumonia Infl uenza Infl uenza and pneumonia
n Rate† Rate
ratio
n Rate† Rate
ratio
n n Rate† Rate
ratio
0–4 Indigenous 230 127.3 2.5 5,682 3,146 4.3 0 18 10.0 17.4
Other 1,877 51.2 26,885 733 3 21 0.6
5–14 Indigenous 45 12.7 1.5 1,304 367 2.7 0 1 0.3 10.9
Other 643 8.3 10,471 135 0 2 0.0
15–24 Indigenous 53 21.0 1.8 1,056 419 4.4 0 1 0.4 15.3
Other 883 11.4 7,383 96 1 2 0.0
25–49 Indigenous 149 33.4 2.7 5,416 1,212 7.4 0 34 7.6 27.8
Other 2,591 12.2 34,536 163 3 58 0.3
50+ Indigenous 117 83.1 3.7 3,997 2,838 2.3 2 76 54.0 2.6
Other 3,725 22.5 204,601 1,236 54 3,486 21.0
All ages‡ Indigenous 594 49.3 2.9 17,455 1,580 3.2 2 130 19.1 3.1
Other 9,719 17.1 283,876 495 61 3,569 6.2
* Hospitalisations (all States) where the date of separation was between 1 July 1999 and 30 June 2002; deaths (Queensland, Northern Territory, South Australia and Western Australia) where the date of death was recorded between 1 January 2000 and 31 December 2002.
† Average annual age-specifi c rate per 100,000 population.
‡ Includes cases with unknown ages. Rates for all ages combined are age standardised to the Australian Bureau of Statistics Australian population estimates for 2001.6
Comment
The relatively high morbidity from infl uenza and related conditions in older Aboriginal and Torres Strait Islander adults led to a specifi c program for infl uenza and pneumococcal vaccine being funded nationally for Indigenous adults over 50 years in 1999 and those aged 15–49 years with risk factors.36 This is in contrast to the non-Indigenous population, for whom infl uenza vaccine is funded only from age 65 years and pneumococcal vaccine is funded only in Victoria for this age group. Young children also experience high morbidity from infl uenza, with mini-mal estimates, such as those in this report based on hospital coding data, still showing a high incidence of hospitalisation under fi ve years of age. Although only fi ve per cent of deaths coded as attributable to infl uenza nationally were in persons under fi ve years and none in Aboriginal and Torres Strait Islander children, there was a twofold differential in the infl u-enza hospitalisation rate between Indigenous and other children.
The importance of young children, both in terms of their own high morbidity from infl uenza and their role in transmission of infl uenza to adults, has been increasingly appreciated in recent years.37 This has led to a recommendation in the United States of America that all children between six and 24 months of age receive infl uenza vaccine.38 This recom-mendation is particularly pertinent to Aboriginal and Torres Strait Islander children in Australia, where infl uenza may contribute signifi cantly to overall res-piratory morbidity in children and adults they are in contact with, especially in crowded living conditions. Evaluation of the reach and impact of the current National Indigenous Pneumococcal and Infl uenza Immunisation (NIPII) program in adults is currently underway, and the potential role of infl uenza immu-nisation in children or universally in at least some communities of Aboriginal and Torres Strait Islander people is needed. Subsequently, consideration of the role of infl uenza immunisation in young Aboriginal and Torres Strait Islander children would be appropriate.

140 CDI Vol 28 No 2 2004
Vaccine preventable diseases and vaccination coverage of Indigenous people
Measles
Measles is an acute and highly communicable dis-ease caused by a morbillivirus. The clinical picture includes a prodromal fever, rash, conjunctivitis, coryza, cough and Koplik spots on the buccal mucosa. Complications include otitis media, pneumonia and encephalitis. Subacute sclerosing panencephalitis occurs very rarely as a late sequel.35
Distribution by Indigenous status
Only 113 notifi cations and 172 hospitalisations recorded as being associated with measles were seen in the relevant jurisdictions or Australia respectively during the reporting period examined. Of these, only 3 (2.6%) notifi cations and 2 (1.1%) hospitalisations were recorded as Indigenous, with equivalent incidence in Indigenous and other persons (Table 6). No deaths were recorded in the reporting period.
Comment
Two signifi cant milestones in measles control occurred in Australia in 1998; the Measles Control Campaign (MCC), involving catch-up immunisation of 1.3 million children aged 5–12 years, and the moving of the second dose of measles-mumps-rubella (MMR) vaccine from 12 to four years.39 This reporting period follows the MCC and is in a period when transmission of measles in Australia is believed to have been largely limited to intro-duction of virus from overseas, with limited local transmission among age-groups with high levels of immunity from immunisation (under 15 years) or past infection (over 35 years).40 Measles outbreaks have been almost entirely confi ned to children who were unimmunised, either because of young age or refusal to vaccinate, and to young adults aged 18–30 years.41
Measles
Case defi nitions
Notifi cations
An illness characterised by all the following features:
a generalised maculopapular rash lasting three or more days, and
a fever (at least 38º C if measured), and
cough or coryza or conjunctivitis or Koplik spots
or
Demonstration of measles specifi c IgM antibody
or
A fourfold or greater rise in measles antibody titre between acute and convalescent phase sera obtained at least two weeks apart, with tests preferably conducted at the same laboratory
or
Isolation of measles virus from a clinical specimen
or
A clinically compatible case epidemiologically related to another case.
Hospitalisations and deaths
The ICD–10–AM/ICD–10 code B05 (measles) was used to identify hospitalisations and deaths. Subacute sclerosing panencephalitis was not included in these analyses.
Table 6. Measles notifi cations, hospitalisations and deaths, Australia, 1999 to 2002,* by age group
and Indigenous status
Age
group
(years)
Indigenous
status
Notifi cations
(2000–2002)
Hospitalisations
(July 1999–June 2002)
Deaths
(2000–2002)
All ages‡ Indigenous 3 0.2 0.6 2 0.1 0.4 0
Other 110 0.4 170 0.3 0
* Notifi cations (New South Wales, Northern Territory, South Australia and Western Australia only) where the date of onset was between 1 January 2000 and 31 December 2002; hospitalisations (all States) where the date of separation was between 1 July 1999 and 30 June 2002; deaths (Queensland, Northern Territory, South Australia and Western Australia) where the date of death was recorded between 1 January 2000 and 31 December 2002.
† Average annual rate per 100,000 population.
‡ Includes cases with unknown ages. Rates are age standardised to the Australian Bureau of Statistics Australian population estimates for 2001.6

CDI Vol 28 No 2 2004 141
Vaccine preventable diseases and vaccination coverage of Indigenous people
Measles was associated with high levels of morbid-ity among Aboriginal and Torres Strait Islander chil-dren in the past, prompting the Northern Territory to introduce immunisation at nine months of age, with a subsequent booster, for Aboriginal children.42 This program ended in the Northern Territory in 199843 and no excess morbidity from measles is evident in this or other Australian jurisdictions. The successful control of measles in Aboriginal and Torres Strait Islander people is a refl ection of the almost total success of immunisation in preventing measles transmission, in contrast to other VPDs such as pertussis or Hib disease. It illustrates the impor-tance of universal programs, across all relevant age groups in the population, in disease prevention in both Indigenous and non-Indigenous people.
Meningococcal disease
Clinical manifestations of meningococcal disease in clude meningitis, meningococcaemia without men-in gitis (which varies in presentation from ful minant to chronic) and septic arthritis.
Distribution by Indigenous status and age
Notifi cation and hospitalisation rates (per 100,000 population) showed a progressive decrease with increasing age in both Indigenous and other persons (Table 7). The notifi cation rate fell from a peak of 51 in the 0–4 age group for Indigenous and 15 in other children, to eight and four respectively in 5–14 year olds, with the lowest rates in 25–49 year olds in both groups (Figure 7). Overall, the rate ratio for notifi ca-tions comparing Indigenous versus others was two, but was close to unity among 15–49 year olds, dif-fering only at the extremes of age. The pattern for hospitalisations was similar, with again the lowest hospitalisation rates among Aboriginal and Torres Strait Islander people aged 15–49 years, although one of the fi ve Indigenous deaths recorded occurred in this age band (Figure 8).
Serogroup distribution by Indigenous status and age
Serogroup data were not available for hospitalisations and were missing for 63 per cent of Indigenous and 45 per cent of other notifi cations, so conclusions about serogroup distribution are subject to signifi cant limita-tions. In notifi cations where serogroup was known, a higher proportion of cases identifi ed as Indigenous were serogroup B (73% compared to 59% in other cases) with a lower proportion due to serogroup C (27% compared to 38%).
Meningococcal disease
Case defi nitions
Notifi cations
Isolation of Neisseria meningitidis from a normally sterile site
or
Detection of meningococcal antigen in joints, blood or cerebrospinal fl uid
or
Detection of Gram-negative intracellular diplococci in blood or cerebrospinal fl uid.
Hospitalisations and deaths
The ICD–10–AM/ICD–10 code A39 (meningococcal infection) was used to identify hospitalisations and deaths.
Figure 7. Meningococcal disease notifi cation
rate, selected Australian States*, 2000 to 2002,†
by age group and Indigenous status
0
10
20
30
40
50
60
0-4 5-14 15-24 25-49 50+
Age group (years)
Not
ifica
tions
per
100,
000
popu
latio
n
IndigenousOther
* New South Wales, South Australia, Western Australia and the Northern Territory.
† Notifi cations where the date of onset was between 1 January 2000 and 31 December 2002.

142 CDI Vol 28 No 2 2004
Vaccine preventable diseases and vaccination coverage of Indigenous people
Comment
The available data on meningococcal disease were limited by lack of serogroup information, which is important given the introduction of conjugate menin-g ococcal C vaccine into the Australian Standard Vaccination Schedule (ASVS) for all children 1–19 years in 2002. The overall pattern of invasive meningococcal disease shown here indicates a secondary peak in notifi cations and hospitalisations among 15–24 year olds presumed non-Indigenous persons not evident in Indigenous people. In both groups, the age-specifi c incidence is highest among 0–4 year olds, being about tenfold higher in Indigenous 0–4 year olds (51) than in 15–24 year olds (5) and twofold higher in the comparable (pre-sumed) non-Indigenous age groups. In keeping with this, the greatest differential disease burden was in 0–4 year olds, with a rate ratio of Indigenous to other notifi cations of 3.5. Indigenous deaths accounted for 13 per cent of the total, similar to the proportion of notifi cations (9%), but four of fi ve these deaths (80%) occurred in 0–4 year olds compared with 12 (36%) of other deaths.
Table 7. Meningococcal disease notifi cations, hospitalisations and deaths, Australia, 1999 to 2002,*
by age group and Indigenous status
Age group
(years)Indigenous
status
Notifi cations
(2000–2002)
Hospitalisations
(July 1999–June 2002)
Deaths
(2000–2002)
n Rate† Rate ratio n Rate† Rate ratio n
0–4 Indigenous 56 50.7 3.5 76 42.1 2.1 4
Other 280 14.6 731 20.4 12
5–14 Indigenous 18 8.3 2.1 29 8.2 1.7 0
Other 158 3.9 364 4.8 3
15–24 Indigenous 8 5.1 0.7 7 2.8 0.3 1
Other 273 6.9 756 9.5 5
25–49 Indigenous 4 1.4 1.0 5 1.1 0.7 0
Other 162 1.5 349 1.6 8
50+ Indigenous 4 4.5 4.3 4 2.8 1.9 0
Other 91 1.1 240 1.5 5
All ages‡ Indigenous 92 7.2 2.1 121 5.5 1.3 5
Other 975 3.4 2,440 4.3 33
* Notifi cations (New South Wales, Northern Territory, South Australia and Western Australia only) where the date of onset was between 1 January 2000 and 31 December 2002; hospitalisations (all States) where the date of separation was between 1 July 1999 and 30 June 2002; deaths (Queensland, Northern Territory, South Australia and Western Australia) where the date of death was recorded between 1 January 2000 and 31 December 2002.
† Average annual age-specifi c rate per 100,000 population.
‡ Includes cases with unknown ages. Rates for all ages combined are age standardised to the Australian Bureau of Statistics Australian population estimates for 2001.6
Figure 8. Meningococcal disease hospital-
isation rate, Australia, 1999 to 2002,* by age
group and Indigenous status
0
5
10
15
20
25
30
35
40
45
0-4 5-14 15-24 25-49 50+
Age group (years)
Hos
pita
lisat
ions
per
100,
000
popu
latio
n
IndigenousOther
* Hospitalisations where the date of separation was between 1 July 1999 and 30 June 2002.

CDI Vol 28 No 2 2004 143
Vaccine preventable diseases and vaccination coverage of Indigenous people
Historically, the incidence of meningococcal dis-ease has been disproportionately higher among Aborig inal and Torres Strait Islander Australians, with well-recorded outbreaks in Central Australia44 and north-west Queensland due to type A and type C disease.45 The current pattern appears, from the limited data available, to be more one of serogroup B disease in the youngest children, simi-lar to that seen in Maori and Pacifi c Islander children in New Zealand,46 in whom living conditions have been shown to be an important disease risk factor.47 Vaccines protecting against serogroup B disease will be an important consideration for Aboriginal and Torres Strait Islander children in the future, but will need to be effective against a wider range of serogroup B subtypes than the vaccine currently being evaluated in New Zealand.48
Pertussis
Pertussis (whooping cough) is an acute illness, caused by the Bordetella pertussis bacterium, involv-ing the respiratory tract. The typical illness begins with an irritating cough that gradually becomes paroxysmal and lasts for 1–2 months or longer. Paroxysms are characterised by repeated violent coughs, followed by a characteristic crowing or high-pitched inspiratory whoop. Infants less than six months old, adolescents and adults often have fewer classical symptoms without paroxysms or whoop.49
Distribution by Indigenous status and age
The age-specifi c pattern of notifi cations among Indigenous and other people differed substantially, even though the overall notifi cation rates were almost identical at 42 and 47 respectively per 100,000. For Aboriginal and Torres Strait Islander people, there was an almost twofold higher notifi -cation rate among 0–4 year olds and over 50 year olds, with relatively lower notifi cation rates in those aged 5–49 years (Figure 9). In contrast, there was a relative excess of hospitalisations for Aboriginal and Torres Strait Islander people in all age groups, except 25–49 year olds, with an overall rate ratio of two (Figure 10). Hospitalisations were predomi-nantly in those aged 0–4 years, (130/150, 87%) of those recorded as Indigenous and (957/1478, 62%) of other children.
In view of the large differential in rates for 0–4 year olds and relatively large case numbers, incidence in the under one year age group was also examined. The notifi cation rate (per 100,000 population) was substantially higher in Indigenous (308) compared to other infants (120), with a rate ratio twice that seen in the 0–4 years age group. However, while hospitalisation rates under 12 months were more than threefold higher than the overall 0–4 years age group at 196 per 100,000 Indigenous and 89 per 100,000 other, there was no difference between the rate ratios at 0–11 months and 12–59 months of age. Seven deaths were recorded as due to pertussis during the reporting period, fi ve in presumed non-Indigenous children under 12 months of age and two in presumed non-Indigenous adults over 50 years.
Pertussis
Case defi nitions
Notifi cations
Isolation of Bordetella pertussis from a clinical specimen
or
Elevated B. pertussis-specifi c IgA in serum or the detection of B. pertussis antigen in a nasopharyngeal specimen using immunofl uorescence with history of a clinically compatible illness
or
An illness lasting two weeks or more with one of the following:
paroxysms of coughing, or
inspiratory whoop without other apparent causes, or
post-tussive vomiting.
or
An illness characterised by a cough lasting at least two weeks in a patient who is epidemiologically linked to a laboratory confi rmed case.
Hospitalisations and deaths
The ICD–10–AM/ICD–10 code A37 (whooping cough) was used to identify hospitalisations and deaths.

144 CDI Vol 28 No 2 2004
Vaccine preventable diseases and vaccination coverage of Indigenous people
Table 8. Pertussis notifi cations, hospitalisations and deaths, Australia, 1999 to 2002,* by age group
and Indigenous status
Age group
(years)
Indigenous
status
Notifi cations
(2000–2002)
Hospitalisations
(July 1999–June 2002)
Deaths
(2000–2002)
n Rate† Rate ratio n Rate† Rate ratio n
0–4 Indigenous 99 89.7 1.7 130 72.0 2.8 0
Other 1,038 54.3 957 26.1 5
5–14 Indigenous 133 61.1 0.6 10 2.8 1.3 0
Other 4,372 108.6 167 2.2 0
15–24 Indigenous 58 37.3 0.8 4 1.6 3.1 0
Other 1,798 44.9 40 0.5 0
25–49 Indigenous 73 26.3 0.7 3 0.7 0.9 0
Other 4,130 37.3 150 0.7 0
50+ Indigenous 35 39.6 1.6 3 2.1 2.2 0
Other 2,083 24.1 164 1.0 2
All ages‡ Indigenous 408 41.8 0.9 150 6.2 2.4 0
Other 13,528 46.9 1,478 2.6 7
* Notifi cations (New South Wales, Northern Territory, South Australia and Western Australia only) where the date of onset was between 1 January 2000 and 31 December 2002; hospitalisations (all States) where the date of separation was between 1 July 1999 and 30 June 2002; deaths (Queensland, Northern Territory, South Australia and Western Australia) where the date of death was recorded between 1 January 2000 and 31 December 2002.
† Average annual age-specifi c rate per 100,000 population.
‡ Includes cases with unknown ages. Rates for all ages combined are age standardised to the Australian Bureau of Statistics Australian population estimates for 2001.6
Figure 9. Pertussis notifi cation rate, selected
Australian States,* 2000 to 2002,† by age group
and Indigenous status
0
20
40
60
80
100
120
0-4 5-14 15-24 25-49 50+
Age group (years)
Not
ifica
tions
per
100,
000
popu
latio
n
IndigenousOther
* New South Wales, South Australia, Western Australia and the Northern Territory.
† Notifi cations where the date of onset was between 1 January 2000 and 31 December 2002.
Figure 10. Pertussis hospitalisation rate,
Australia, 1999 to 2002,* by age group and
Indigenous status
0
10
20
30
40
50
60
70
80
0-4 5-14 15-24 25-49 50+
Age group (years)
Hos
pita
lisat
ions
per
100,
000
popu
latio
n
IndigenousOther
* Hospitalisations where the date of separation was between 1 July 1999 and 30 June 2002.

CDI Vol 28 No 2 2004 145
Vaccine preventable diseases and vaccination coverage of Indigenous people
Comment
Pertussis is the disease least well controlled of all the diseases with long-standing, well-established vaccination programs. It has the highest notifi cation rate for all ages for the total Australian population12 and, with the exception of infl uenza, meningococcal and pneumococcal diseases and varicella, the high-est hospitalisation rates. The data in this report are the fi rst to examine this in relation to Indigenous status nationally, although data have been reported previously from the Northern Territory.50 Interpret-ation of the data is complex, because of the marked differences between age groups in immunisation history and disease severity as measured by hos-pitalisation and deaths. Despite this, the relat ively large number of cases compared with other VPDs among Aboriginal and Torres Strait Islander people allows some interesting conclusions.
First, the greatest relative excess of pertussis is in 0–4 year olds, most marked in infants under 12 months of age and in hospitalisations. Second, the relatively lower notifi cation rates and rate ratios seen between fi ve and 49 years of age are not refl ected in hospitalisation data. This could be artefactual, due to diagnostic practice or lack of access to laboratory facilities in more remote areas, or a real phenomenon, perhaps related to greater exposure to pertussis and more long-last-ing immunity in Aboriginal and Torres Strait Islander adults and older children. Even in presumed non-Indigenous children, the age group 5–14 years is a diverse one in relation to vaccination history, as an additional dose of pertussis vaccine was included in the ASVS from 1994. More detailed analysis shows a progressive cohort effect among this age group, shown by high rates in the oldest members of the cohort and low rates among the younger ones, similar that of 1–4 year olds.51 From the beginning of 2004, an additional dose of a pertussis-containing vaccine will replace diphtheria-tetanus vaccine for all Australian 15–17 year olds.52 It will be important to monitor trends following this change according to Indigenous status to fully examine its impact.
Pneumococcal disease
Pneumococcal disease is caused by the bacterium Streptococcus pneumoniae (pneumococcus). Pneum o cocci are frequently isolated from the upper respir atory tract and can spread directly from the naso pharynx to cause infection in other parts of the respir atory tract (otitis media, sinusitis, pneu monia) or enter the bloodstream. Manifestations include menin gitis, pneumonia and infection at a number of less common sites, as well as septicaemia without focal infection. Invasive pneumococcal disease (IPD) is defi ned as a sterile site isolate of Streptococcus pneumoniae, usually from blood. In the absence of a sterile site isolate, a presumptive diagnosis of pneumococcal pneumonia may be based on a sputum isolate of Streptococcus pneumoniae and/or clinical features such as the chest X-ray appear-ance and prompt response to antibiotic therapy. Invasive pneumococcal disease has been notifi able in Queensland and the Northern Territory since 1997. From January 2001, invasive pneumococcal disease became notifi able Australia-wide.
Pneumococcal disease
Case defi nitionsNotifi cations
Isolation from, or detection in, blood, cerebrospinal fl uid or other sterile site, of Streptococcus pneumoniae
Hospitalisations
The ICD–10–AM codes used to identify hospitalisations were: G00.1, pneumococcal meningitis; A40.3, pneumococcal septicaemia (together considered to be a proxy for invasive pneumococcal disease); and J13, pneumococcal pneumonia.
Deaths
ICD–10 codes G00.1 and A40.3 were used (together considered to be a proxy for invasive pneumococcal disease) to select deaths from IPD.

146 CDI Vol 28 No 2 2004
Vaccine preventable diseases and vaccination coverage of Indigenous people
Distribution by Indigenous status and age
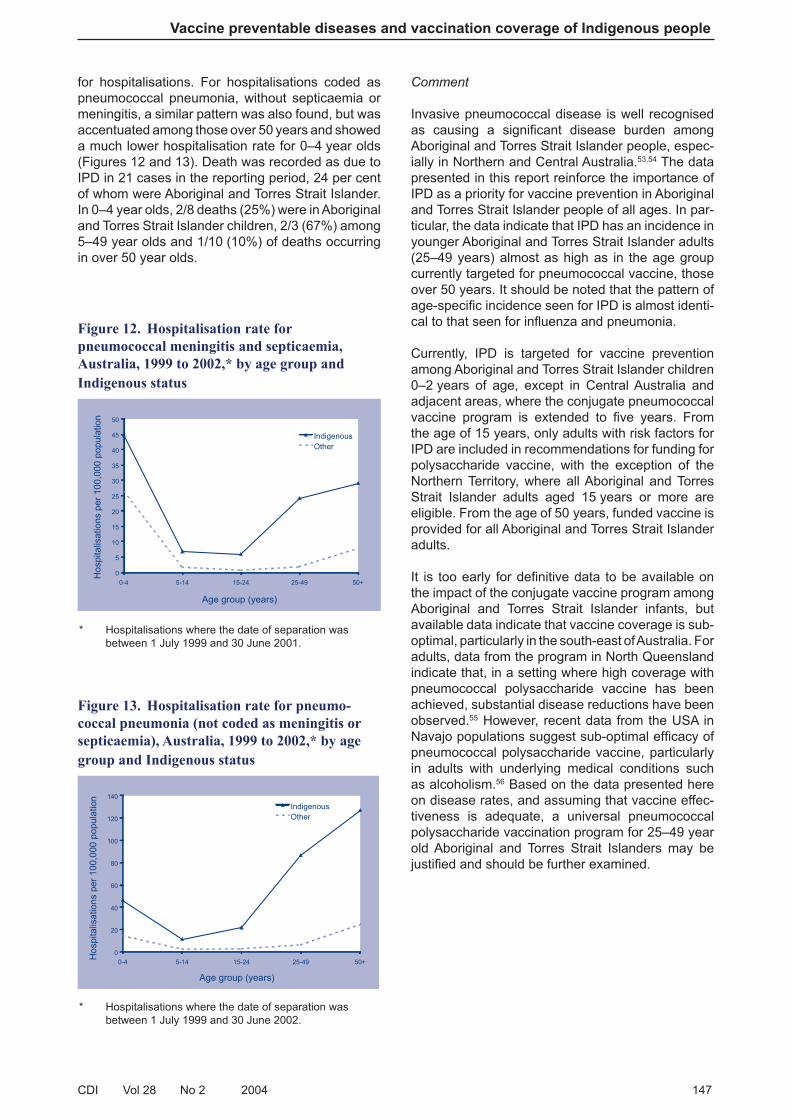
Notifi cation and hospitalisation rates for invasive pneumococcal disease were higher for all Indigenous age groups with an overall Indigenous: other rate ratio of fi ve for notifi cations and hospitalisations (Table 9). Rates per 100,000 population were high-est in both Indigenous and other populations for the 0–4 years age group (notifi cations 87 versus 49; hospitalisations 45 versus 26) and 50+ years age group (notifi cations 59 versus 14; hospitalisations 29 versus 8). Importantly, the incidence of IPD began to increase signifi cantly in the 25–49 years Indigenous age group to an incidence of 48 per 100,000 compared with four per 100,000 in other persons. The incidence rate ratios remained sig-nifi cantly higher at approximately three even for the lowest incidence age group of 5–24 years, with the notifi cation rate among Aboriginal and Torres Strait Islander young people remaining 10 per 100,000, equivalent to that seen among other people over 50 years of age (Figure 11). The age distribution was similar for notifi cations of IPD and
Table 9. Invasive pneumococcal disease notifi cations, hospitalisations and deaths, Australia, 1999 to
2002*, by age group and Indigenous status
Age group
(years)
Indigenous
status
Notifi cations†
(2001–2002)
Hospitalisations‡
(July 1999–June 2002)
Deaths
(2000–2002)
n Rate§ Rate ratio n Rate§ Rate ratio n
0–4 Indigenous 64 87.0 1.8 81 44.8 1.7 2
Other 620 48.6 944 25.7 6
5–14 Indigenous 15 10.3 2.7 24 6.8 4.0 0
Other 102 3.8 130 1.7 1
15–24 Indigenous 10 9.6 3.7 15 6.0 8.2 1
Other 70 2.6 58 0.8 0
25–49 Indigenous 89 48.1 11.9 108 24.2 13.4 1
Other 297 4.0 384 1.8 0
50+ Indigenous 35 59.4 4.3 41 29.1 3.7 1
Other 800 13.9 1,290 7.8 9
All ages|| Indigenous 214 44.7 4.5 269 22.0 4.5 5
Other 1,926 9.9 2,806 4.9 16
* Notifi cations (New South Wales, Northern Territory, South Australia and Western Australia only) where the date of onset was between 1 January 2001 and 31 December 2002; hospitalisations (all States) where the month of separation was between 1 July 1999 and 30 June 2002; deaths (Queensland, Northern Territory, South Australia and Western Australia) where the date of death was recorded between 1 January 2000 and 31 December 2002.
† Notifi cations are presented for two years only as invasive pneumococcal disease became nationally notifi able in January 2001. Completeness of the Indigenous status data fi eld was suboptimal for New South Wales data in 2001.
‡ Using hospitalisations for pneumococcal meningitis and pneumococcal septicaemia as a proxy for invasive pneumococcal disease
§ Average annual age-specifi c rate per 100,000 population.
|| Includes cases with unknown ages. Rates for all ages combined are age standardised to the Australian Bureau of Statistics Australian population estimates for 2001.6
Figure 11. Invasive pneumococcal disease
notifi cation rate, selected Australian States,*
2001 to 2002,† by age group and Indigenous
status
0
10
20
30
40
50
60
70
80
90
100
0-4 5-14 15-24 25-49 50+
Age group (years)
Not
ifica
tions
per
100,
000
popu
latio
n
IndigenousOther
* New South Wales, South Australia, Western Australia and the Northern Territory.
† Notifi cations where the date of onset was between 1 January 2001 and 31 December 2002.
CDI Vol 28 No 2 2004 147
Vaccine preventable diseases and vaccination coverage of Indigenous people
for hospitalisations. For hospitalisations coded as pneumococcal pneumonia, without septicaemia or meningitis, a similar pattern was also found, but was accentuated among those over 50 years and showed a much lower hospitalisation rate for 0–4 year olds (Figures 12 and 13). Death was recorded as due to IPD in 21 cases in the reporting period, 24 per cent of whom were Aboriginal and Torres Strait Islander. In 0–4 year olds, 2/8 deaths (25%) were in Aborig inal and Torres Strait Islander children, 2/3 (67%) among 5–49 year olds and 1/10 (10%) of deaths occurr ing in over 50 year olds.
Comment
Invasive pneumococcal disease is well recognised as causing a signifi cant disease burden among Aboriginal and Torres Strait Islander people, espec-ially in Northern and Central Australia.53,54 The data presented in this report reinforce the importance of IPD as a priority for vaccine prevention in Aboriginal and Torres Strait Islander people of all ages. In par-ticular, the data indicate that IPD has an incidence in younger Aboriginal and Torres Strait Islander adults (25–49 years) almost as high as in the age group currently targeted for pneumococcal vaccine, those over 50 years. It should be noted that the pattern of age-specifi c incidence seen for IPD is almost identi-cal to that seen for infl uenza and pneumonia.
Currently, IPD is targeted for vaccine prevention among Aboriginal and Torres Strait Islander children 0–2 years of age, except in Central Australia and adjacent areas, where the conjugate pneumococcal vaccine program is extended to fi ve years. From the age of 15 years, only adults with risk factors for IPD are included in recommendations for funding for polysaccharide vaccine, with the exception of the North ern Territory, where all Aboriginal and Torres Strait Islander adults aged 15 years or more are eligible. From the age of 50 years, funded vaccine is provided for all Aboriginal and Torres Strait Islander adults.
It is too early for defi nitive data to be available on the impact of the conjugate vaccine program among Aboriginal and Torres Strait Islander infants, but available data indicate that vaccine coverage is sub-optimal, particularly in the south-east of Australia. For adults, data from the program in North Queensland indicate that, in a setting where high coverage with pneumococcal polysaccharide vaccine has been achieved, substantial disease reductions have been observed.55 However, recent data from the USA in Navajo populations suggest sub-optimal effi cacy of pneumococcal polysaccharide vaccine, particularly in adults with underlying medical conditions such as alcoholism.56 Based on the data presented here on disease rates, and assuming that vaccine effec-tiveness is adequate, a universal pneumococcal polysaccharide vaccination program for 25–49 year old Aboriginal and Torres Strait Islanders may be justifi ed and should be further examined.
Figure 12. Hospitalisation rate for
pneumococcal meningitis and septicaemia,
Australia, 1999 to 2002,* by age group and
Indigenous status
0
5
10
15
20
25
30
35
40
45
50
0-4 5-14 15-24 25-49 50+
Age group (years)
Hos
pita
lisat
ions
per
100,
000
popu
latio
n
IndigenousOther
* Hospitalisations where the date of separation was between 1 July 1999 and 30 June 2001.
Figure 13. Hospitalisation rate for pneumo-
coccal pneumonia (not coded as meningitis or
septicaemia), Australia, 1999 to 2002,* by age
group and Indigenous status
0
20
40
60
80
100
120
140
0-4 5-14 15-24 25-49 50+
Age group (years)
Hos
pita
lisat
ions
per
100,
000
popu
latio
n
IndigenousOther
* Hospitalisations where the date of separation was between 1 July 1999 and 30 June 2002.

148 CDI Vol 28 No 2 2004
Vaccine preventable diseases and vaccination coverage of Indigenous people
Vaccination coverage
Australian Standard Vaccination Schedule 1998
to 2003
The Australian Standard Vaccination Schedule for children aged 0–6 years changed in the second half of 1998, in mid 2000 and in January and September 2003. In 1998, the second dose of measles-mumps-rubella vaccine (previously given at 12–13 years) was moved to four years. For children born after May 2000, full vaccination at 12 months of age required immunisation against hepatitis B as well as three doses of diphtheria-tetanus-pertussis vac-cine (DTP) and oral poliomyelitis (OPV) vaccines. Full immunisation against Haemophilus infl uenzae type b disease at 12 months required, from 2000, two doses of PRP–OMP (Haemophilus infl uenzae type b polysaccharide conjugated to the outer mem-brane protein of Neisseria meningitidis) vaccine for all children. The neonatal dose of hepatitis B vaccine (scheduled for all newborns since May 2000) is not accounted for in ACIR coverage esti-mates. In the second year of life, a dose of MMR vaccine is scheduled at 12 months of age as well as booster doses of DTP (at 18 months) and Hib vaccine (at 12 months); the 18 month dose of (DTP) was removed in September 2003. The 7-valent pneumococcal conjugate vaccine (7vPCV) was introduced for children at high risk of invasive pneumococcal disease (including all Aboriginal and Torres Strait Islander children) in June 2001. The meningococcal C conjugate vaccine (MenCCV) was introduced for all children in January 2003. The current ASVS is shown in Table 10.
Specifi c recommendations for Aboriginal or
Torres Strait Islander people
There are several differences between the vaccines recommended for Indigenous and non-Indigenous Australians, mainly due to differences in disease incidence. The Australian Standard Vaccination Schedule contains recommendations specifi cally for Aboriginal and Torres Strait Islander people for infl uenza, pneumococcal disease and Hib disease. There are also additional recommendations for Aboriginal and Torres Strait Islander people for tuberculosis and hepatitis A vaccines, which are limited to some geographical regions.
The 23-valent pneumococcal polysaccharide vac-cine is recommended for all Aboriginal and Torres Strait Islander people aged 50 years and over, and for those aged 15–49 years who have high-risk under-lying conditions. In the Northern Territory, vaccin-ation is recommended for all Aboriginal and Torres Strait Islanders aged 15 years or more. A single
re-vaccination is generally recommended fi ve years later (see the Australian Immunisation Handbook 8th edition for more details).57 Annual infl uenza vaccina-tion is also recommended for Abo riginal and Torres Strait Islander adults aged 50 years and over, and for those aged 15 to 49 years with high-risk underly-ing conditions. These vaccines are funded under the National Indigenous Pneumococcal and Infl uenza Immunisation Pro gram. The recommendations for non-Indigenous adults differ in that vaccination for these two diseases is recommended from 65 years of age instead of 50. Infl uenza vaccine is provided for non-Indigenous adults aged 65 or more years under the National Immunisation Program. Pneumococcal vaccine is not publicly funded for non-Indigenous adults except in Victoria, although it is subsidised on the Pharmaceutical Benefi ts Scheme.
The 7-valent pneumococcal conjugate vaccine is recommended for all children at two, four and six months of age. It is provided free under the National Immunisation Program for all Aboriginal and Torres Strait Islander children and for non-Indigenous chil-dren with high risk conditions. Aboriginal and Torres Strait Islander children living in high incidence areas (Northern Territory, South Australia, Western Australia, Queensland) should also receive a dose of 23-valent vaccine at 18–24 months. Catch up vac-cination is recommended for unvaccinated children up to fi ve years of age in Central Australia and up to two years of age in other areas.
PRP-OMP (purifi ed polysaccharide conjugated to an outer membrane protein carrier) Hib vaccine is immunogenic at an earlier age and therefore requires fewer doses than other Hib vaccines. For PRP-OMP vaccine, doses are recommended at two, four and 12 months of age, while other Hib vaccines require an extra dose at six months. Since Hib vaccine was fi rst introduced onto the ASVS in 1993, PRP–OMP has been recommended for Aboriginal and Torres Strait Islander children, due to their higher risk of disease under six months of age. Other Hib vaccines were recommended for non-Indigenous children until May 2000. Since then, either PRP–OMP or PRP–T/HbOC vaccines are recommended for non-Indigenous children.
Since 1999, hepatitis A vaccine has been provided for all Aboriginal and Torres Strait Islander children in North Queensland at 18 and 24 months of age. Catch-up vaccination is provided to children up to six years of age.
Vaccination with BCG (Bacille Calmette-Guérin) vaccine for tuberculosis is recommended for all Aboriginal and Torres Strait Islander neonates in high incidence areas.

CDI Vol 28 No 2 2004 149
Vaccine preventable diseases and vaccination coverage of Indigenous people
Table 10. The Australian Standard Vaccination Schedule57
Age Vaccine
Birth Hepatitis B*
2 months Hepatitis B* DTPa Hib‡ IPV║ 7vPCV**
4 months Hepatitis B* DTPa Hib‡ IPV║ 7vPCV**
6 months Hepatitis B* DTPa Hib§ IPV║ 7vPCV**
12 months Hepatitis B* Hib‡ MMR MenCCV
18 months VZV¶ 23vPPV††
2 years
4 years DTPa IPV║ MMR
10–13 years Hepatitis B† VZV¶
15–17 years dTpa
50 years and over dT 23vPPV‡‡ Infl uenza (annual) ‡‡
65 years and over 23vPPV Infl uenza (annual)
Note: Vaccines currently funded under the National Immunisation Program are shaded in Table 10 above. Vaccines lightly shaded are funded for targeted, at-risk populations only.
* Four doses of hepatitis B vaccine recommended for each child, the timing of doses varies according to the vaccine formula-tion used.
† Two or three catch up doses recommended for children not previously immunised.
‡ Three doses of PRP–OMP recommended for all children.
§ A 4-dose schedule of PRP–T or HbOC may be given to non-Indigenous children as an alternative.
║ IPV is recommended but not funded by the National Immunisation Program; OPV is funded as an alternative.
¶ Only for children with a negative history of disease or vaccination.
** Recommended for all children, provided free only to: all Aboriginal and Torres Strait Islander children aged up to two years, Indigenous children in Central Australia aged up to fi ve years, non-Indigenous children in Central Australia aged up to two years, and all children under fi ve years with medical risk factors that predispose them to high rates or high severity of pneumococcal infection.
†† Aboriginal and Torres Strait Islander children only.
‡‡ Aboriginal and Torres Strait Islander adults only, vaccines provided under the National Indigenous Pneumococcal and Infl uenza Immunisation Program.
Vaccine keyHepatitis B Hepatitis B vaccine
DTPa Diphtheria-tetanus-acellular pertussis infant/child formulation
dTpa Adult diphtheria-tetanus-pertussis vaccine
Hib Haemophilus infl uenzae type b (Hib) vaccine (PRP–OMP, as monovalent or in combination)
IPV Inactivated poliomyelitis vaccine (in combination)
OPV Oral poliomyelitis vaccine
MMR Measles-mumps-rubella vaccine
VZV Varicella-zoster vaccine
7vPCV 7-valent pneumococcal conjugate vaccine
23vPPV 23-valent pneumococcal polysaccharide vaccine
MenCCV Meningococcal C conjugate vaccine
Infl uenza Infl uenza vaccine

150 CDI Vol 28 No 2 2004
Vaccine preventable diseases and vaccination coverage of Indigenous people
Vaccination for Japanese encephalitis virus is rec-ommended for all residents of the outer Islands of the Torres Strait aged over one year of age, and non-residents staying at least 30 days during the wet season.
Calculating vaccination coverage estimates
from the ACIR
The methodology for calculating cohort-based vac-cination coverage from the ACIR was described by O’Brien et al.7 Using this method, a cohort of chil-dren is defi ned by date of birth in 3-month groups; the fi rst cohort was born between 1 January 1996 and 31 March 1996. To minimise duplicate records, the cohort includes only children enrolled with Medi care. The vaccination status of each cohort is assessed at the two key milestones of 12 months and 24 months of age. Coverage is measured several months after the due date for completion of each milestone, to allow for delayed notifi cation to the ACIR. It is assumed that notifi cation of receipt of a later vaccine dose implies receipt of earlier doses, even if no earlier vaccination is recorded (‘third dose assumption’).58
A child is now defi ned as 'fully vaccinated' at 12 months of age if he or she has received a third dose of DTPa and poliomyelitis vaccine (oral or inac-tivated), a second dose of Hib vaccine (PRP–OMP), and either a second or a third dose of hepatitis B vaccine. At 24 months of age a child is defi ned as fully vaccinated if he or she has received the third dose of DTPa, OPV and Hib, either a third or fourth dose of hepatitis B and a fi rst dose of MMR. ACIR coverage estimates have been reported in Communicable Diseases Intelligence since 1998.7
Coverage estimates for Aboriginal and Torres Strait Islander children are not published separately except in those jurisdictions where agreement has been reached with the relevant jurisdictional organisation(s).
The completeness of data on Indigenous status was assessed by State and Territory. As a result, data were included only for New South Wales, Northern Territory, South Australia, Victoria and Western Australia. See Methods for more information.
Vaccination coverage estimates from the ACIR
for Indigenous versus other children
Coverage estimates from the ACIR for Aboriginal and Torres Strait Islander children and children not identifi ed as Indigenous aged one and two years are shown in Table 11. For Aboriginal and Torres Strait Islander children, 82.2 per cent of one year olds and 90.1 per cent of two year olds were fully immunised. The proportion fully immunised at 12 months of age was considerably higher for children not identifi ed as Indigenous (9% higher than Indigenous children) and less so at two years of age (1% higher).
Table 11. Coverage estimates from the
Australian Childhood Immunisation Register
for Indigenous and other children ‘fully
vaccinated’ at age 1 and 2 years*
Vaccine Indigenous status 1 year 2 years
Hepatitis B Indigenous 94.0 97.9
Other 94.8 95.5
DTP Indigenous 84.8 96.7
Other 92.7 95.7
OPV Indigenous 84.1 95.2
Other 92.6 94.5
Hib Indigenous 93.0 92.9
Other 94.4 92.9
MMR Indigenous N/A† 94.2
Other N/A† 93.1
All vaccines Indigenous 82.2 90.9
Other 91.2 91.3
Source: Australian Childhood Immunisation Register, Health Insurance Commission.
* 3-month cohorts, age at 30 September 2003, calculated at 31 December 2003. Coverage assessment date was 12 or 24 months after the last birth date of each cohort. Includes data from New South Wales, Northern Territory, South Australia, Victoria, Western Australia only.
† Not included in coverage estimates for that age group.

CDI Vol 28 No 2 2004 151
Vaccine preventable diseases and vaccination coverage of Indigenous people
Coverage at 12 months of age was lower for Abor-iginal and Torres Strait Islander children for each single vaccine. However, at two years of age, the dif-ferences in coverage for individual vaccines between Indigenous and other children were less marked. Coverage was higher in Aboriginal and Torres Strait Islander two year olds for hepatitis B (Indigenous 97.9%, other 95.5%), DTP (Indigenous 96.7%, other 95.7%), OPV (Indigenous 95.3%, other 94.5%) and MMR (Indigenous 94.2%, other 93.1%).
It should be noted, however, that coverage estimates for Aboriginal and Torres Strait Islander children include only those who are registered on the ACIR and identifi ed on it as Indigenous. Children so ident-ifi ed may not be representative of all Aboriginal and Torres Strait Islander children, and so estimates based on these could either overestimate or under estimate coverage among young Indigenous children.
Calculating vaccination coverage estimates
from the National Health Survey
The methodology for calculating vaccination cover-age estimates in the National Health Survey (NHS) has been published.8 In contrast to ACIR estimates, NHS estimates for children are combined for different ages, in this case 2–6 years of age. The NHS was conducted in 2001, so for this age group, three dif-ferent schedules have applied—those of 1996, 1998 and 2000. Some of the schedule changes applied only to children born after that date, while others applied to all children below a certain age, depending on the vaccine and dose concerned. The vaccination status for each child was calculated according to the number of doses received, compared to the number recommended under the schedule applying to a child in that age group. An allowance of one month was made for late vaccinations, so that at the time of interview, if a child was due for a vaccination in the previous month and had not received it, that dose was not included in the calculation of vaccination sta-tus. Adult respondents were asked whether they had been vaccinated for infl uenza in the last 12 months, and for pneumococcal disease in the last fi ve years.
Vaccination coverage estimates from the
National Health Survey for Indigenous versus
non-Indigenous children
Coverage estimates from the National Health Sur-vey for Indigenous and non-Indigenous children were provided by the ABS and are presented here for children aged 2–6 years in Table 12. Estimated coverage in this group was considerably lower for both Indigenous and non-Indigenous children than recorded on the ACIR for one and two year olds.
For Aboriginal and Torres Strait Islander children in non-remote areas, estimated coverage ranged from 85 per cent for one or more doses of MMR to 50 per cent for three or more doses of Hib. Coverage for non-Indigenous children was statistically signifi -cantly higher for DTP, OPV and Hib, and almost so for MMR. Coverage for non-Indigenous children ranged from 94 per cent for one or more doses of MMR to 67 per cent for four or more doses of Hib. The vaccine with the largest difference in coverage between Indigenous and non-Indigenous children was Hib (17%), while the smallest difference was for MMR (9%). Parents of Indigenous children were less likely to have referred to immunisation cards or records (56%, 95% CI 43–69%) than parents of non-Indigenous children (80%, CI 77–83%). The proportion of parents of Aboriginal and Torres Strait Islander children who reported they either did not know whether their child was vaccinated, or did not know how many doses they had received, ranged from six per cent for MMR to 23 per cent for Hib. For parents of non-Indigenous children, the proportions ranged from six per cent for OPV to nine per cent for Hib.
Table 12. Coverage estimates (with 95%
confi dence intervals) from the National Health
Survey for Indigenous and non-Indigenous
children ‘fully immunised’, aged 2–6 years*
Vaccine Indigenous status Coverage
(%)
DTP† Indigenous 70 (62–78)
Non-Indigenous 82 (79–85)
OPV‡ Indigenous 76 (70–82)
Non-Indigenous 87 (84–90)
Hib§ Indigenous 50 (41–59)
Non-Indigenous 67 (64–70)
MMR║ Indigenous 85 (78–92)
Non-Indigenous 94 (92–96)
Source: Unpublished data from the National Health Survey, provided by the Australian Bureau of Statistics.
* Children living in non-remote areas only.
† Four or more doses.
‡ Three or more doses.
§ Indigenous children three or more doses, non-Indigenous children four or more doses.
║ One or more doses.

152 CDI Vol 28 No 2 2004
Vaccine preventable diseases and vaccination coverage of Indigenous people
Vaccination coverage estimates from the National Health Survey for Indigenous versus non-Indigenous adults
Coverage estimates for infl uenza and pneumo-coccal vaccines in age groups relevant for the fully funded vaccine programs among Indigenous and non-Indigenous adults are shown in Table 13. Pneu-mococcal vaccine coverage was signifi cantly higher in Aboriginal and Torres Strait Islander adults at 50–64 years (Indigenous 20%, non-Indigenous 3%) and 65 years and over (Indigenous 47%, non-Indig enous 28%). Infl uenza vaccine coverage was sig nifi cantly higher in Aboriginal and Torres Strait Islander adults at 50–64 years (Indigenous 47%, non-Indigenous 26%) but not when those aged 65 years and over were added (50+ years; Indigenous 51%, non-Indigenous 47%).
Data on remoteness were available for Aboriginal and Torres Strait Islander people only. For those aged 50 years and over, coverage was substan-tially higher in remote areas than in non-remote areas for both infl uenza vaccine (75% vs 45%) and pneumococcal vaccine (48% vs 19%).59
Other data
Previously published national data on immunisation coverage in Aboriginal and Torres Strait Islander peo-ple are largely limited to the 1996 ‘Wronski Report’.60 This report estimated levels of immun isation cover-age in Aboriginal and Torres Strait Islander children by surveying community con trolled Aboriginal and Torres Strait Islander Health Services and regional health bodies. Of 25 services providing data, esti-mated coverage in two years old and fi ve years old
children varied from 14 per cent to 100 per cent, with generally higher coverage in non-urban areas com-pared to urban areas.60 A more recent study13 has estimated national immunisation coverage using Australian Childhood Immunisation Register records with receipt of PedvaxHIB immunisation as a proxy for Aboriginal and Torres Strait Islander status. Using this method, coverage in Aboriginal and Torres Strait Islanders at 12 months (72%–76%) and 24 months (64%–73%) was considerably lower than in others (90%–94% and 81%–88% respectively). As in the National Health Survey, coverage was signifi cantly lower in children residing in ‘accessible’ compared to ‘remote’ areas.13
Other data on immunisation coverage in Aboriginal and Torres Strait Islander children have come largely from specifi c areas in particular States. Surveys of immunisation providers’ records have reported rates from 36 per cent fully vaccinated for children up to 11 years of age on the North Coast of New South Wales in 199261 to 73 per cent by two years of age in Central Australia in 1985.62 In Far North Queensland in 1996, coverage was estimated to be less than 42 per cent by two years of age.63 Studies examining computerised immunisation registers in the Northern Territory have reported uptake rates of above 95 per cent for most vaccines at two years of age in remote communities in 1993.64 Overall coverage, measured as fully immunised at six years of age, was estimated as 77 per cent for the whole Northern Territory in 1996.65 Studies have consist-ently reported signifi cantly higher coverage rates in remote communities compared to urban areas in Northern Australia63,65,66 but the reverse was found in Northern New South Wales.61
Table 13. Vaccination coverage estimates from the National Health Survey for Indigenous and non-
Indigenous adults, by age
Vaccine Indigenous status 50–64 years 65+ years Total
50+ years
Infl uenza* Indigenous 47 (38–56) 71 (50–92) 51 (43–59)
Non-Indigenous 26 (24–28) 75 (74–76) 47 (46–48)
Pneumococcal† Indigenous 20 (15–25) 47 (29–65) 25 (19–31)
Non-Indigenous 3 (2–4) 28 (26–30) 14 (13–15)
Source: Unpublished data from the National Health Survey, provided by Australian Bureau of Statistics.
* Vaccinated in the last 12 months.
† Vaccinated in the last fi ve years.

CDI Vol 28 No 2 2004 153
Vaccine preventable diseases and vaccination coverage of Indigenous people
Comment
Immunisation coverage from the National Health Survey is generally lower than that from the ACIR and the NHS fi gures show a larger discrepancy between rates in Indigenous and non-Indigenous children. There are several possible reasons for this. First, the NHS coverage estimates only include chil-dren whose vaccination status could be determined. The data above also show that parents of Aboriginal and Torres Strait Islander children were less likely to have written records to refer to. They were there-fore more likely to report that they did not know the status of their child and therefore not be recorded as vaccinated. Under-reporting of vaccination to the ACIR also occurs, but it has been estimated at 2.5 per cent for the general population,14 consider-ably lower than the 6–9 per cent of non-Indigenous children with unknown vaccination status in the NHS, and 8–23 per cent for Indigenous children. NHS estimates did not include children from remote areas. Given that coverage has frequently been shown to be higher in Indigenous populations in remote compared to urban areas,59,66 this may also have contributed to underestimating Indigenous coverage.
For those children who are recorded as Indigenous on the ACIR, coverage is similar to that in the general population by two years of age. Coverage for DTP and OPV were lower than in the general population at 12 months of age, but there was little difference by two years. As there are no doses of DTP or OPV recommended between one and two years of age, this indicates that the main reason for lower cover-age at 12 months for those recorded as Indigenous on the ACIR is delayed receipt of the vaccines due at 0–6 months.
Approximately 65 per cent of the estimated number of Aboriginal and Torres Strait Islander children born between June 2001 and December 2002 are recorded as Indigenous on the ACIR. To the extent that data completeness is an indicator of access to health care then these children may be more likely to be vaccinated than those whose status has not been recorded. It is likely, therefore, that the ACIR and NHS respectively provide an upper and lower limit of the coverage in Aboriginal and Torres Strait Islander children and the difference between Indigenous and non-Indigenous children. Improved reporting of Indigenous status on the ACIR in future may enable the monitoring of trends over time and geographical differences. Ideally, any future NHS examining immu-nisation status in an enhanced sample of Aboriginal and Torres Strait Islander children should seek to map this to the ACIR, for identifi cation of both Indigenous and immunisation status.
In adults, coverage was higher for Aboriginal and Torres Strait Islanders for pneumococcal vaccine in those aged 50 years and over and for infl uenza vaccine at 50–64 years. This higher coverage is probably attributable to the provision of free vaccine through the National Indigenous Pneumococcal and Infl uenza Immunisation program. There was no sig-nifi cant difference in infl uenza vaccine coverage at 65 years and over, where vaccine is recommended and provided free to the general population.
Discussion
This report gives, for the fi rst time, detailed data on VPDs and vaccine coverage in Aboriginal and Torres Strait Islander people and compares these data with those for the population not recorded as Indigenous. These data add to the more general data on com-municable disease and health in the report(s) of the Australian Institute of Health and Welfare and the Australian Bureau of Statistics.1 They have direct implications for prevention, both in considering new or expanded vaccine programs and in improving the population coverage of existing programs.
With the exception of hepatitis A, all VPDs con sid-ered in detail in the report are currently tar geted by population-wide programs. Each VPD high lights differ ent issues for consideration. For child hood pro-grams, Hib disease, pertussis and measles provide inter esting contrasts. In the case of Hib disease, great progress has been made in preventing this life-threatening infection across the population, but the residual disease burden, though much dimin-ished, is falling disproportionately on Aboriginal and Torres Strait Islander people. More information is needed on the reasons for this, as vaccination coverage data from the NHS and ACIR do not show a consistent picture. In contrast, ACIR data show little difference in younger children aged one and two years. For pertussis, although there is little dif-ference in incidence rates across all ages, this is not the case in the youngest children. Both Hib disease and pertussis can affect very young infants below six months of age and the data suggesting delayed immunisation in Aboriginal and Torres Strait Islander children may be particularly relevant here. In the case of measles, where early receipt of vaccine is not so critical and a recent nationwide campaign was delivered in schools, good control of equivalent degree is evident for Indigenous and non-Indigenous people.

154 CDI Vol 28 No 2 2004
Vaccine preventable diseases and vaccination coverage of Indigenous people
Different issues are highlighted by examination of the data on disease incidence and vaccine coverage for hepatitis B, meningococcal disease, infl uenza and pneumococcal disease, all with established programs targeting a wider age group. In the case of hepatitis B, Aboriginal and Torres Strait Islander infants have been included in targeted programs since the late 1980s and the oldest will now be more than 15 years of age. In the Northern Territory, where the program was uni-versal rather than targeted, high coverage may have been more successful than in regions with targeted programs. Certainly the data showing high incidence and signifi cant differential incidence in the 5–14 years old age group suggest that there may have been sub-optimal coverage. Indeed, relatively high rates of hepatitis B notifi cation for Aboriginal and Torres Strait Islander young people suggest that a program target-ing this age group should be considered. A national program of meningococcal C conjugate vaccination has been in place since early 2003. Available notifi ca-tion data indicate that the signifi cantly higher rates of invasive meningococcal disease in Aboriginal and Torres Strait Islander people are primarily in children under two years and are mostly type B, for which no licensed vaccine is available. It will be important to have more complete serogroup-specifi c data avail-able for Aboriginal and Torres Strait Islander cases in the future.
High morbidity from infl uenza and pneumococcal disease in Aboriginal and Torres Strait Islander people has been targeted by a funded vaccine pro-gram for adults over 50 years since 1999. Children under two years of age have been targeted for a funded program of conjugate pneumococcal vac-cine since 2001. The data presented here show that the incidence of these diseases remains high and, in the adult program, there is signifi cant scope for increasing vaccine coverage. This is particularly the case in adults aged 50–64 years where cover age, although higher than in non-Indigenous adults for whom there is no funded program, remains low. There is also a high disease burden from infl uenza and pneumococcal disease in 25–49 years old Abor-iginal and Torres Strait Islander adults, potent ially justifying expansion of the program to all Abor iginal and Torres Strait Islander adults in this age group. However, it will be important to fi rst identify means of achieving higher coverage in the young adult population.
In the last category is hepatitis A, where no national vaccine program exists for any population group. In north Queensland, hepatitis A has been targeted by a vaccination program for Aboriginal and Torres Strait Islander children under fi ve years of age with dramatic falls in disease incidence extending to other age groups and the non-Indigenous popula-tion.31 This experience, and similar experiences with hepatitis A programs in Indigenous communities in the USA, suggest that hepatitis A should also be strongly considered for a national program, at least in high incidence areas, as is done in the USA.
In summary, the data in this report reveal some important areas where increased attention is justi-fi ed and consideration of expanded programs and mechanisms of enhancing existing programs should be expedited. Limitations of the available data relate both to VPD and vaccine coverage data, though the issues in each differ. For VPD data, incomplete iden-tifi cation of Aboriginal and Torres Strait Islander sta-tus is a problem, tending to underestimate disease burden. However, even the available data indicate a substantially higher burden from VPDs in almost all instances, with the limitation that information about Aboriginal and Torres Strait Islander people living in the southern parts of the country and in urban areas is less complete. For vaccine coverage, there is the possibility of overestimating completeness of cover-age through the ACIR, depending on the character-istics of children identifi ed as Indigenous in it. On the other hand, the range of years and small sample sizes for individual years signifi cantly limit the inter-pretation of data from the National Health Survey, as does lack of availability of records. Expansion of the ACIR to include other age groups, should this occur in the future, may be able to address this problem.
Acknowledgements
We thank the members of the National Indigenous Immunisation Reference Group for their assistance in reviewing drafts and consulting with the organisa-tions they represent.
Australian Bureau of Statistics: Mr Dan Black, Ms Katrina Poyser
Australian Government Department of Health and Ageing, Public Health Division: Ms Jeanette Baird, Dr Paul Roche, Dr Jenean Spencer, Ms Sharon Tuffi n
Offi ce for Aboriginal and Torres Strait Islander Health: Mr Gerard De Ruyter, Ms Sue Green, Dr Ana Herceg, Mr Bernard Pearce, Ms Joy Savage
Australian Divisions of General Practice: Dr Diana Terry
Australian Institute of Health and Welfare: Dr Fadwa Al-Yaman
Cooperative Research Centre on Aboriginal Health: Dr Sue Vlack
National Aboriginal Community Controlled Health Organisation: Ms Rachel Atkinson, Dr Sophie Couzos
CDI Vol 28 No 2 2004 155
Vaccine preventable diseases and vaccination coverage of Indigenous people
National Advisory Group on Aboriginal and Torres Strait Islander Health Information and Data: Mr Craig Ritchie
National Immunisation Committee: Dr Christine Selvey, Ms Dallas Young
We wish to acknowledge the following organisa-tions for provision of data for this report.
The Surveillance and Epidemiology Section, Population Health Division, Australian Government Department of Health and Ageing, for data from the National Notifi able Diseases Surveillance System.
The Australian Institute of Health and Welfare, Hospitals and Mental Health Services Unit and Population Health Unit, for data from the National Hospital Morbidity and Mortality databases.
The Australian Bureau of Statistics, for vaccination coverage data from the National Health Survey (special thanks to Mr Danny Cook).
The Health Insurance Commission, for vaccina-tion coverage data from the Australian Childhood Immunisation Register.
The National Centre for Immunisation Research and Surveillance of Vaccine Preventable Diseases is a collaborating unit of the Australian Institute of Health and Welfare and receives funding from the Australian Government Department of Health and Ageing.
References
1. Australian Bureau of Statistics, Australian Institute of Health and Welfare. The Health and Welfare of Australia's Aboriginal and Torres Strait Islander Peoples: 2003. Canberra: Australian Bureau of Statistics; 2003.
2. Berkman LF, Kawachi I, editors. Social Epidemiology. New York: Oxford University Press; 2000.
3. Australian Bureau of Statistics, Australian Institute of Health and Welfare. The Health and Welfare of Aust-ralia's Aboriginal and Torres Strait Islander Peoples: 2001. Canberra: Australian Bureau of Statistics; 2001.
4. National Health and Medical Research Council. Surveill ance Case Defi nitions. Canberra: Australian Government Publishing Service; 1994.
5. Roche P, Krause V. Invasive pneumococcal disease in Australia, 2001. Commun Dis Intell 2002;26:505–519.
6. Australian Bureau of Statistics. Australian Demo-graphic Statistics. Canberra: Australian Bureau of Statistics; 2003.
7. O'Brien ED, Sam GA, Mead C. Methodology for measuring Australia's childhood immunisation cover-age. Commun Dis Intell 1998;22:36–37.
8. Australian Bureau of Statistics. National Health Survey, Australia, 2001: Users' Guide. Canberra: Australian Bureau of Statistics; 2003.
9. Australian Bureau of Statistics. Occasional Paper: Hosp ital Statistics, Aboriginal and Torres Strait Islander Australians, 1999–2000. Canberra: Australian Bureau of Statistics; 2002.
10. MacIntyre CR, Ackland MJ, Chandraraj EJ, Pilla JE. Accuracy of ICD–9–CM codes in hospital morbidity data, Victoria: implications for public health research. Aust N Z J Public Health 1997;21:477–482.
11. McIntyre P, Amin J, Gidding H, Hull B, Torvaldsen S, Tucker A, et al. Vaccine preventable diseases and vac-cination coverage in Australia, 1993–1998. Commun Dis Intell 2000;24 Suppl:1–83.
12. McIntyre P, Gidding H, Gilmour R, Lawrence G, Hull B, Horby P, et al. Vaccine preventable diseases and vaccination coverage in Australia, 1999 to 2000. Commun Dis Intell 2002;26 Suppl:1–111.
13. Hull BP, McIntyre PB, Couzos S. Evaluation of immun isation coverage for Aboriginal and Torres Strait Islander children using the Australian Childhood Immun isation Register. Aust N Z J Public Health 2004;28:47–52.
14. Hull B, Lawrence G, MacIntyre CR, McIntyre P. Immun isation Coverage: Australia 2001. Canberra: Commonwealth Department of Health and Ageing; 2002.
15. Ross K. Occasional paper: Population issues, Indig-enous Australian, 1996. Canberra: Australian Bureau of Statistics; 1999.
16. Koo W, Oley C, Munro R, Tomlinson P. Systemic Haemo philus infl uenzae infection in childhood. Med J Aust 1982;2:77–80.
17. McIntyre PB, Leeder SR, Irwig LM. Invasive Haemo-philus infl uenzae type b disease in Sydney children 1985–1987: a population-based study. Med J Aust 1991;154:832–837.
18. Gilbert GL, Clements DA, Broughton SJ. Haemophilus infl uenzae type b infections in Victoria, Australia, 1985 to 1987. Pediatr Infect Dis J 1990;9:252–257.

156 CDI Vol 28 No 2 2004
Vaccine preventable diseases and vaccination coverage of Indigenous people
19. McGregor AR, Bell JM, Abdool IM, Collignon PJ. Invasive Haemophilus infl uenzae infection in the Australian Capital Territory region. Med J Aust 1992;156:569–572.
20. Hanna J. The epidemiology and prevention of Haemo-philus infl uenzae infections in Australian aborig inal children. J Paediatr Child Health 1992;28:354–361.
21. Horby P, Gilmour R, Wang H, McIntyre P. Progress towards eliminating Hib in Australia: an evaluation of Haemophilus infl uenzae type b prevention in Australia, 1 July 1993 to 30 June 2000. Commun Dis Intell 2003;27:324–341.
22. Markey P, Krause V, Boslego JW, Coplan PM, Dargan JM, Kaplan KM. The effectiveness of Haemo-philus infl uenzae type b conjugate vaccines in a high risk population measured using immunization register data. Epidemiol Infect 2001;126:31–36.
23. Wilson N, Wenger J, Mansoor O, Baker M, Martin D. The benefi cial impact of Hib vaccine on disease rates in New Zealand children. N Z Med J 2002;115:U122.
24. Galil K, Singleton R, Levine OS, Fitzgerald MA, Bulkow L, Getty M, et al. Reemergence of invasive Haemophilus infl uenzae type b disease in a well-vaccinated population in remote Alaska. J Infect Dis 1999;179:101–106.
25. Plotkin SA, Orenstein WA. Vaccines. 3rd edition. Philadelphia: WB Saunders; 1999.
26. Chin J, editor. Control of communicable diseases manual. 17th edition. Washington DC: American Public Health Association; 2000.
27. Hanna JN, Warnock TH, Shepherd RW, Selvey LA. Fulminant hepatitis A in indigenous children in north Queensland. Med J Aust 2000;172:19–21.
28. Bowden FJ, Currie BJ, Miller NC, Locarnini SA, Krause VL. Should aboriginals in the 'top end' of the Northern Territory be vaccinated against hepatitis A? Med J Aust 1994;161:372–373.
29. Prevention of hepatitis A through active or passive immunization: Recommendations of the Advisory Committee on Immunization Practices (ACIP). MMWR Recomm Rep 1999;48:1–37.
30. Pecoraro CA, Wasley A. Changing trends in hepatitis A in the era of childhood vaccination. Atlanta: Centers for Disease Control and Prevention; 2003.
31. Hanna JN, Hills SL, Humphreys JL. The impact of hepatitis A vaccination of Indigenous children on the incidence of hepatitis A in North Queensland. Communicable Diseases Control Conference; 31 March–1 April 2003; Canberra.
32. MacIntyre CR, Burgess MA, Hull B, McIntyre PB. Hepatitis A vaccination options for Australia. J Paediatr Child Health 2003;39:83–87.
33. Kaldor JM, Plant AJ, Thompson SC, Longbottom H, Rowbottom J. The incidence of hepatitis B infection in Australia: an epidemiological review. Med J Aust 1996;165:322–326.
34. Ryder SD, Beckingham IJ. ABC of diseases of liver, pancreas, and biliary system: Chronic viral hepatitis. BMJ 2001;322:219–221.
35. Mandell GL, Bennett JE, Dolin R, editors. In: Mandell, Douglas, and Bennett's Principles and Practice of Infectious Diseases. 5th edition. Philadelphia: Churchill Livingstone; 2000.
36. National Health and Medical Research Council. The Australian Immunisation Handbook, 7th edition. Canberra: Australian Government Publishing Service; 1999.
37. Izurieta HS, Thompson WW, Kramarz P, Shay DK, Davis RL, DeStefano F, et al. Infl uenza and the rates of hospitalization for respiratory disease among infants and young children. N Engl J Med 2000;342:232–239.
38. Recommended childhood and adolescent immuniz-ation schedule–United States, January–June 2004. MMWR Morb Mortal Wkly Rep 2004;53:Q1–Q4.
39. Turnbull FM, Burgess MA, McIntyre PB, Lambert SB, Gilbert GL, Gidding HF, et al. The Australian Measles Control Campaign, 1998. Bull World Health Organ 2001;79:882–888.
40. Hanna JN, Symons DJ, Lyon MJ. A measles outbreak in the Whitsundays, Queensland: the shape of things to come? Commun Dis Intell 2002;26:589–592.
41. Gidding HF, Gilbert GL. Measles immunity in young Australian adults. Commun Dis Intell 2001;25:133–136.
42. Patel M, Lush D. Measles vaccine effectiveness in Central Australian aboriginal children vaccinated at or after eight months of age. Aust N Z J Public Health 1998;22:729–730.
43. Miller N. Changes to the Northern Territory childhood vaccination schedule—MMR. The Northern Territory Disease Control Bulletin 1998;5(3):1–2.
44. Patel MS, Merianos A, Hanna JN, Vartto K, Tait P, Morey F, et al. Epidemic meningococcal menin-gitis in Central Australia, 1987–1991. Med J Aust 1993;158:336–340.

CDI Vol 28 No 2 2004 157
Vaccine preventable diseases and vaccination coverage of Indigenous people
45. Pearce MC, Sheridan JW, Jones DM, Lawrence GW, Murphy DM, Masutti B, et al. Control of group C meningococcal disease in Australian aboriginal child-ren by mass rifampicin chemoprophylaxis and vaccin-ation. Lancet 1995;346:20–23.
46. Baker MG, Martin DR, Kieft CE, Lennon D. A 10-year serogroup B meningococcal disease epidemic in New Zealand: descriptive epidemiology, 1991–2000. J Paediatr Child Health 2001;37:S13–S19.
47. Baker M, McNicholas A, Garrett N, Jones N, Stewart J, Koberstein V, et al. Household crowding a major risk factor for epidemic meningococcal disease in Auckland children. Pediatr Infect Dis J 2000;19:983–990.
48. Holst J, Aaberge IS, Oster P, Lennon D, Martin D, O'Hallahan J, et al. A 'tailor made' vaccine trialled as part of public health response to group B meningo-coccal epidemic in New Zealand. Eurosurveillance Weekly 2003; 7. Available from: http://www.euro-surveill ance.org/ew/2003/030724.asp#5 Accessed March 2004.
49. Cherry JD. Pertussis in the preantibiotic and pre-vaccine era, with emphasis on adult pertussis. Clin Infect Dis 1999;28 Suppl 2:S107–S111.
50. Condon J, Warman G, Arnold L. The health and wel-fare of Territorians. Darwin: Epidemiology Branch, Territory Health Services; 2001.
51. Torvaldsen S, McIntyre PB. Effect of the preschool pertussis booster on national notifi cations of disease in Australia. Pediatr Infect Dis J 2003;22:956–959.
52. National Health and Medical Research Council. NHMRC approves new immunisation handbook [press release]. 19 September, 2003. Available from: http://www.nhmrc.gov.au/media/rel2003/imhand.htm#top Accessed March 2004.
53. Hanna JN, Gratten M, Tiley SM, Brookes DL, Bapty G. Pneumococcal vaccination: an important strategy to prevent pneumonia in Aboriginal and Torres Strait Island adults. Aust N Z J Public Health 1997;21:281–285.
54. Plant AJ, Condon JR, Durling G. Northern Territory health outcomes, morbidity and mortality, 1979–1991. Darwin: Northern Territory Department of Health and Community Services; 1995.
55. Hanna JN, Young DM, Brookes DL, Dostie BG, Murphy DM. The initial coverage and impact of the pneumococcal and infl uenza vaccination program for at-risk indigenous adults in Far North Queensland. Aust N Z J Public Health 2001;25:543–546.
56. Benin AL, O'Brien KL, Watt JP, Reid R, Zell ER, Katz S, et al. Effectiveness of the 23-valent polysaccharide vaccine against invasive pneumococcal disease in Navajo adults. J Infect Dis 2003;188:81–89.
57. National Health and Medical Research Council. The Australian Immunisation Handbook, 8th edition. Canberra: Australian Government Publishing Service; 2003.
58. Hull BP, McIntyre PB. Immunisation coverage report-ing through the Australian Childhood Immunisation Register–an evaluation of the third-dose assumption. Aust N Z J Public Health 2000;24:17–21.
59. Australian Bureau of Statistics. National Health Survey: Aboriginal and Torres Strait Islander Results, Australia, 2001. Canberra: Australian Bureau of Statistics; 2002.
60. Wronski I, Grant M, Stronach P, May J, Elston J, Buttner P, et al. Improving Aboriginal and Torres Strait Islander childhood immunisation: Report to the Commonwealth Department of Health and Family Services. Townsville: Department of Public Health and Tropical Medicine, James Cook University; 1996.
61. Young MJ, Taylor LK, Beard JR, Randall A, Coldwell S. The vaccination status of aboriginal children in the North Coast Health Region of New South Wales. Med J Aust 1994;161:301–305.
62. Hanna JN, Kass RB. Immunization status of aboriginal children in Central Australia. Med J Aust 1985;143:S56–S57.
63. Hanna JN, Malcolm RL, Vlack SA, Andrews DE. The vaccination status of aboriginal and Torres Strait Island children in Far North Queensland. Aust N Z J Public Health 1998;22:664–668.
64. Guthridge S, Patel M. High immunisation uptake for two year olds in the remote Northern Territory. Commun Dis Intell 1993;17:566–567.
65. Merianos A. Childhood immunisation uptake in the Northern Territory: Part 1—the Top End. Northern Territory Communicable Diseases Bulletin 1997;4(1):1–5.
66. Kelly H. Childhood immunisation in rural Western Australia: Aboriginal children do better in the more remote areas. Commun Dis Intell 1993;17:30–32.

158 CDI Vol 28 No 2 2004
Vaccine preventable diseases and vaccination coverage of Indigenous people
Appendix
Summary of notifi cations, hospitalisations and deaths for vaccine preventable diseases, Australia,
1999 to 2002,* by Indigenous status
Disease† Indigenous
status
Notifi cations
(2000–2002)
Hospitalisations
(July 1999–June 2002)
Deaths
(2000–2002)
n Rate‡
Rate
ratio n Rate‡
Rate
ratio n Rate‡
Rate
ratio
Diphtheria§ Indigenous 0 – – 0 – – 0 – –
Other 1 – 2 – 0 –
Hib disease (invasive)║
Indigenous 13 1.2 9.7 – – – – – –
Other 34 0.1 – – – –
Hepatitis A Indigenous 113 9.1 2.9 82 4.5 2.1 1 – –
Other 899 3.1 1,227 2.1 2 –
Hepatitis B (acute)
Indigenous 57 7.2 4.4 30 2.8 3.7 2 – –
Other 469 1.6 433 0.8 8 –
Infl uenza¶Indigenous – – – 594 49.3 2.9 2 – –
Other – – 9,719 17.1 61 –
MeaslesIndigenous 3 0.2 0.6 2 0.1 0.4 0 – –
Other 110 0.4 170 0.3 0 –
Meningococcal disease
Indigenous 92 7.2 2.1 121 5.5 1.3 5 – –
Other 975 3.4 2,440 4.3 33 –
Mumps**Indigenous 5 0.3 0.4 9 0.4 1.8 0 – –
Other 270 0.9 129 0.2 1 –
PertussisIndigenous 408 41.8 0.9 150 6.2 2.4 0 – –
Other 13,528 46.9 1,478 2.6 7 –
PneumoniaIndigenous NN NN – 17,455 1,580 3.2 130 19.1 3.1
Other NN NN 283,876 495 3,569 6.2
Pneumococcal disease
Indigenous 214 44.7 4.5 269 22.0 4.5 5 – –
Other 1,926 9.9 2,806 4.9 16 –
Poliomyelitis††Indigenous 0 – – 2 0.3 2.8 0 – –
Other 0 – 54 0.1 0 –
Rubella‡‡Indigenous 5 0.5 0.4 1 0.1 0.6 0 – –
Other 310 1.1 81 0.1 0 –
Tetanus§§Indigenous 1 0.3 16.2 0 – – 0 – –
Other 6 0.0 80 0.1 1 –
Varicella║║Indigenous NN NN – 197 8.9 1.2 0 – –
Other NN NN 4,285 7.6 10 –
* Notifi cations (New South Wales, Northern Territory, South Australia and Western Australia only) where the date of onset was between 1 January 2000 and 31 December 2002; hospitalisations (all states) where the month of separation was between 1 July 1999 and 30 June 2002; deaths (Queensland, Northern Territory, South Australia and Western Australia) where the date of death was recorded between 1 January 2000 and 31 December 2002.
† See results section for case defi nitions. For diseases not included in Section 3, case defi nitions are listed below.
‡ Average annual rate per 100,000 population, age standardised to the Australian Bureau of Statistics Australian population estimates for 2001.6
§ Notifi cations: isolation of toxigenic Corynebacterium diphtheriae, plus either pharyngitis or laryngitis, and toxic symptoms. Hospitalisations: ICD–10 codes A36.0, A36.1, A36.2 or (A36.8 + I41.0). Deaths: A36. One notifi cation of a cutaneous infection acquired overseas.
║ Hospitalisations and deaths not included because there is no ICD–10 code specifi c to Haemophilus infl uenzae type b.
¶ Notifi cations not included due to low completeness of Indigenous status fi eld.
** Notifi cations: Isolation of mumps virus, rise in mumps antibody, or clinically compatible illness. Hospitalisations and deaths: ICD–10 code B26.

CDI Vol 28 No 2 2004 159
Notice to readers
†† Notifi cations: Acute fl accid paralysis without apparent cause. Hospitalisations and deaths: ICD–10 code A80. Hospitalisations include vaccine-associated polio and imported cases.
‡‡ Notifi cations: generalised macropapular rash, fever, epidemiological link to a confi rmed case, plus arthralgia/arthritis, lymphadenopathy or conjunctivitis. Hospitalisations and deaths: ICD–10 code B06.
§§ Notifi cations: a clinically compatible illness without other apparent cause. Hospitalisations and deaths: ISD–10 code A35.
║║ Hospitalisations and deaths: ICD–10 code B01.
NN Not notifi able.
Infection control guidelines for the
prevention of transmission of infectious
diseases in the health care setting
The January 2004 edition of the Infection Control Guide lines for the Prevention of Transmission of Infectious Diseases in the Health Care Setting (ICG), was recently endorsed by the Australian Health Minister’s Advisory Council.
The electronic version of this document can be down-loaded from http://www.icg.health.gov.au. A limited number of hard copy folders of the document will be distributed nationally to public and private hospitals, aged care facilities, peak health organisations, key staff in state and territory health departments, health libraries and universities, in mid to late June 2004.
The Australian Government Department of Health and Ageing has prepared these guidelines under the auspices of the Communicable Diseases Net-work Australia, which is a subcommittee of the National Public Health Partnership. The National Health and Medical Research Council’s Special Expert Committee on Transmissible Spongiform Encephalopathies has also endorsed the Creutz-feldt-Jakob disease (CJD) component of the ICG.
This document replaces the Infection control in the health care setting—guidelines for the prevention of transmission of infectious diseases,1 and incorp-orates guidelines on patient management and infection control relating to CJD and other human transmissible spongiform encephalopathies (thus replacing Creutzfeldt-Jakob Disease and Other Human Trans missible Spongiform Encephalo-pathies: Guide lines on Patient Management and Infection Control.2
These guidelines are a reference document provid-ing current ‘best practice’ national guidelines for infection control procedures in Australian health care settings, and should be considered in asso-ciation with state and territory legislative require-ments that affect work practices of the health care establishment and/or health care worker. (Note: if the recommendations in this document confl ict with state or territory guidelines, the statutory require-ments of the state or territory take precedence.
References
1. National Health and Medical Research Council. Infection control in the health care setting—guide-lines for the prevention of transmission of infectious diseases. National Health and Medical Research Council, Canberra; 1996.
2. National Health and Medical Research Council. Creutzfeldt-Jakob Disease and Other Human Trans-missible Spongiform Encephalopathies: Guidelines on Patient Management and Infection Control National Health and Medical Research Council, Canberra; 1995.
Copyright © 2022 FDOKUMEN