
V20 Revision Date: 24 September, 2021 Page 1 - The ...
278
Document Number: FINAL Revision: V20 Revision Date: 24 September, 2021 Page 1
-
Upload
khangminh22 -
Category
Documents
-
view
0 -
download
0
Transcript of V20 Revision Date: 24 September, 2021 Page 1 - The ...

Document Number: FINAL
Revision: V20
Revision Date: 24 September, 2021
Page 1

Document Number: FINAL
Revision: V20
Revision Date: 24 September, 2021
Page xiv
TABLE OF CONTENTS
EXECUTIVE SUMMARY ............................................................................... III
Introduction ..................................................................................................................................... iii Approach ........................................................................................................................................ iii Current Environmental Status ......................................................................................................... iii Selection of Collector Test Area & Test Field ..................................................................................iv Collector Test Components .............................................................................................................iv Collector Test Program ................................................................................................................... v Physicochemical Environment ........................................................................................................ v Biological Environment ...................................................................................................................vi Impact Assessment....................................................................................................................... viii Major Hazards, Mitigations & Emergency Response Plans ............................................................. x Risk Prioritisation ............................................................................................................................ x Cumulative Impacts ........................................................................................................................ x Environmental Monitoring & Reporting ............................................................................................xi Limitations, Assumptions & Uncertainty ..........................................................................................xi Consultation & Review ................................................................................................................... xii Conclusion & Recommendation .................................................................................................... xiii
1 INTRODUCTION ................................................................................... 1-1
1.1 Background ........................................................................................................................ 1-1 1.2 The Collector Test .............................................................................................................. 1-1 1.3 Objectives .......................................................................................................................... 1-3 1.4 Project Proponent ............................................................................................................... 1-3 1.5 Offshore Campaigns........................................................................................................... 1-4
1.5.1 Completed ............................................................................................................. 1-4 1.5.2 Upcoming ............................................................................................................... 1-5
1.6 Collector Test EIS .............................................................................................................. 1-5 1.7 Operational ESIA................................................................................................................ 1-5 1.8 This Report......................................................................................................................... 1-6
1.8.1 Objective ................................................................................................................ 1-6 1.8.2 Report Structure ..................................................................................................... 1-6
2 LEGAL & REGULATORY FRAMEWORK, POLICY, STANDARDS & GUIDELINES ......................................................................................... 2-1
2.1 Introduction ........................................................................................................................ 2-1 2.2 1982 United Nations Convention of the Law of the Sea ...................................................... 2-1 2.3 The ISA Mining Code ......................................................................................................... 2-2
2.3.1 Recommendations ................................................................................................. 2-2 2.3.2 Regulations ............................................................................................................ 2-3
2.4 Nauru Legislation ............................................................................................................... 2-4 2.5 Other International Conventions, Standards & Guidelines .................................................. 2-6

Document Number: FINAL
Revision: V20
Revision Date: 24 September, 2021
Page xv
3 PROJECT DESCRIPTION ...................................................................... 3-1
3.1 Context............................................................................................................................... 3-1 3.2 Objectives .......................................................................................................................... 3-1 3.3 Site Location ...................................................................................................................... 3-1
3.3.1 Collector Test Area ................................................................................................ 3-2 3.3.2 Test Field ............................................................................................................... 3-2 3.3.3 Impact Reference Zone .......................................................................................... 3-3 3.3.4 Preservation Reference Zone ................................................................................. 3-6
3.4 Collector Test Components ................................................................................................ 3-8
3.4.1 Surface Support Vessel........................................................................................ 3-10 3.4.2 Prototype Collector Vehicle .................................................................................. 3-10 3.4.3 Nodule Collection System .................................................................................... 3-12
3.5 Collector Test ................................................................................................................... 3-21
3.5.1 Transit to Collector Test Area ............................................................................... 3-22 3.5.2 Offshore Inspection & Preparation ........................................................................ 3-22 3.5.3 PCV Deployment ................................................................................................. 3-22 3.5.4 Jumper & Riser Deployment ................................................................................. 3-24 3.5.5 Riser Commissioning ........................................................................................... 3-25 3.5.6 Subsea Connection of Jumper on PCV ................................................................ 3-26 3.5.7 Collector test operations ....................................................................................... 3-27 3.5.8 Emergency Shutdown Testing .............................................................................. 3-30 3.5.9 Riser & PCV Recovery ......................................................................................... 3-30 3.5.10 Transit From Test Site .......................................................................................... 3-30
3.6 Workforce ......................................................................................................................... 3-30 3.7 Project Duration................................................................................................................ 3-32
4 IMPACT ASSESSMENT METHODS ....................................................... 4-1
4.1 Introduction ........................................................................................................................ 4-1 4.2 Significant Impacts ............................................................................................................. 4-1 4.3 Project Related Activities .................................................................................................... 4-1 4.4 Valued Ecosystem Components ......................................................................................... 4-2 4.5 Environmental Effects......................................................................................................... 4-3
4.5.1 Significant Impact Assessment ............................................................................... 4-9
4.6 Cumulative Impacts .......................................................................................................... 4-10 4.7 Major Hazards .................................................................................................................. 4-11
4.7.1 Risk Assessment ................................................................................................. 4-11
5 PHYSICOCHEMICAL ENVIRONMENT .................................................. 5-1
5.1 General Setting .................................................................................................................. 5-1 5.2 NORI-D .............................................................................................................................. 5-1 5.3 Climate & Meteorology ....................................................................................................... 5-1 5.4 Ambient Air Quality ............................................................................................................. 5-3

Document Number: FINAL
Revision: V20
Revision Date: 24 September, 2021
Page xvi
5.5 Noise & Light ...................................................................................................................... 5-3
5.5.1 Anthropogenic Noise .............................................................................................. 5-3 5.5.2 Anthropogenic Light ............................................................................................... 5-5
5.6 Physical Oceanography ...................................................................................................... 5-5
5.6.1 Waves .................................................................................................................... 5-5 5.6.2 Tides ...................................................................................................................... 5-6 5.6.3 Currents ................................................................................................................. 5-6 5.6.4 Metocean Data ....................................................................................................... 5-8
5.7 Water Quality ................................................................................................................... 5-10
5.7.1 Nutrients .............................................................................................................. 5-11 5.7.2 Carbon ................................................................................................................. 5-12 5.7.3 Total Suspended Solids, Alkalinity & Major Constituents ...................................... 5-13 5.7.4 Metals & Metalloids .............................................................................................. 5-14 5.7.5 Physicochemical Parameters ............................................................................... 5-18
5.8 Sediment Characteristics .................................................................................................. 5-31
5.8.1 Sediment Particle Size ......................................................................................... 5-31 5.8.2 Metals .................................................................................................................. 5-33 5.8.3 Carbon ................................................................................................................. 5-37 5.8.4 Nutrients and Chlorophyll-a .................................................................................. 5-38 5.8.5 Comparison of CTA & PRZ .................................................................................. 5-39
5.9 Bathymetry ....................................................................................................................... 5-42 5.10 Seafloor Characteristics ................................................................................................... 5-44 5.11 Nodules ............................................................................................................................ 5-45 5.12 Benthic Geoforms ............................................................................................................. 5-50
5.12.1 Classification ........................................................................................................ 5-50
6 BIOLOGICAL ENVIRONMENT .............................................................. 6-1
6.1 General Setting .................................................................................................................. 6-1 6.2 Baseline Studies................................................................................................................. 6-1 6.3 Benthic Baseline................................................................................................................. 6-4
6.3.1 Megafauna ............................................................................................................. 6-4 6.3.2 Macrofauna .......................................................................................................... 6-10 6.3.3 Meiofauna ............................................................................................................ 6-16 6.3.4 Foraminiferal Meiofauna ....................................................................................... 6-19 6.3.5 eDNA-based Bioassessment of Eukaryotes ......................................................... 6-19 6.3.6 Microbial Prokaryotes ........................................................................................... 6-23 6.3.7 Metazoan & Microbial Metabolic Activity ............................................................... 6-23 6.3.8 Trace Metals & Potential Toxic Elements ............................................................. 6-23 6.3.9 Bioturbation .......................................................................................................... 6-24
6.4 Pelagic Baseline ............................................................................................................... 6-25
6.4.1 Baseline Investigations......................................................................................... 6-25

Document Number: FINAL
Revision: V20
Revision Date: 24 September, 2021
Page xvii
6.5 Marine Mammals, Birds, Turtles, Bony Fish & Sharks....................................................... 6-28
6.5.1 Baseline Investigations......................................................................................... 6-28
7 PHYSICOCHEMICAL ENVIRONMENTAL IMPACTS .............................. 7-1
7.1 Overview ............................................................................................................................ 7-1 7.2 Environmental Effects......................................................................................................... 7-2 7.3 Surface Vessel Operations ................................................................................................. 7-3
7.3.1 Air Quality & GHG Emissions ................................................................................. 7-3 7.3.2 Noise & Vibration ................................................................................................... 7-3 7.3.3 Light ....................................................................................................................... 7-3 7.3.4 Water Quality ......................................................................................................... 7-4
7.4 Collector System Testing .................................................................................................... 7-4
7.4.1 Noise & Vibration ................................................................................................... 7-4 7.4.2 Light ....................................................................................................................... 7-4 7.4.3 Water Quality ......................................................................................................... 7-5 7.4.4 Sediment Geochemistry & Micro-topography ....................................................... 7-43
7.5 Impact Management ......................................................................................................... 7-44
7.5.1 Impact Minimisation Through Planning ................................................................. 7-44 7.5.2 Risk Assessment ................................................................................................. 7-45 7.5.3 Residual Impacts ................................................................................................. 7-45
8 BIOLOGICAL ENVIRONMENTAL IMPACTS .......................................... 8-1
8.1 Overview ............................................................................................................................ 8-1 8.2 Environmental Effects......................................................................................................... 8-2
8.2.1 Surface Support Vessel Operations ....................................................................... 8-3 8.2.2 Collector System Testing ....................................................................................... 8-3
8.3 Impact Management ........................................................................................................... 8-8
8.3.1 Impact Minimisation Through Planning ................................................................... 8-8 8.3.2 Risk Assessment ................................................................................................... 8-8 8.3.3 Residual Impacts ................................................................................................... 8-8
9 HAZARDS, MITIGATION & EMERGENCY RESPONSE PLAN ................ 9-1
9.1 Introduction ........................................................................................................................ 9-1 9.2 Potential Hazards ............................................................................................................... 9-1
9.2.1 Chemical Leakage or Spillage ................................................................................ 9-2 9.2.2 Fire and Explosion ................................................................................................. 9-3 9.2.3 Vessel Collisions .................................................................................................... 9-3 9.2.4 Detachment of PCV from Umbilical ........................................................................ 9-4 9.2.5 Detachment of Riser Pipe from PCV ...................................................................... 9-4
9.3 Emergency Response Planning .......................................................................................... 9-4 9.4 Hazard Identification Risk Assessment (HIRA) ................................................................... 9-5

Document Number: FINAL
Revision: V20
Revision Date: 24 September, 2021
Page xviii
9.4.1 Summary of Residual Risk ..................................................................................... 9-6
10 RISK PRIORITISATION ...................................................................... 10-1
11 CUMULATIVE IMPACTS ..................................................................... 11-1
12 ENVIRONMENTAL MONITORING, MANAGEMENT & REPORTING .... 12-2
12.1 Introduction ...................................................................................................................... 12-2 12.2 Environmental Monitoring ................................................................................................. 12-3
12.2.1 Collector System Performance ............................................................................. 12-3
12.3 Long-Term Environmental Studies ................................................................................. 12-11
12.3.1 Experimental Design .......................................................................................... 12-11 12.3.2 Benthic Studies .................................................................................................. 12-12 12.3.3 Pelagic Studies .................................................................................................. 12-20 12.3.4 Surface Observations ......................................................................................... 12-25 12.3.5 Data Management.............................................................................................. 12-26
12.4 Environmental Management ........................................................................................... 12-27 12.5 Reporting ....................................................................................................................... 12-27
12.5.1 Internal Reporting............................................................................................... 12-27 12.5.2 External Reporting ............................................................................................. 12-28 12.5.3 Incident Reporting .............................................................................................. 12-28 12.5.4 Corrective Actions .............................................................................................. 12-28
13 LIMITATIONS, ASSUMPTIONS & UNCERTIANTY ............................. 13-1
13.1 Limitations ........................................................................................................................ 13-1 13.2 Assumptions..................................................................................................................... 13-1 13.3 Uncertainty ....................................................................................................................... 13-1
14 CONSULTATION & REVIEW ............................................................... 14-3
14.1 Introduction ...................................................................................................................... 14-3 14.2 NORI Global Stakeholder Workshop ................................................................................ 14-3 14.3 Sponsoring State Stakeholder Consultation ...................................................................... 14-4 14.4 Expert Review .................................................................................................................. 14-6
15 CONCLUSION & RECOMMENDATION ................................................ 15-1
15.1 Conclusion ....................................................................................................................... 15-1 15.2 Recommendation ............................................................................................................. 15-1
16 GLOSSARY, ABBREVIATIONS & ACRONYMS ................................... 16-2
16.1 Glossary ........................................................................................................................... 16-2 16.2 Abbreviations & Acronyms................................................................................................ 16-2

Document Number: FINAL
Revision: V20
Revision Date: 24 September, 2021
Page xix
17 STUDY TEAM ..................................................................................... 17-1
18 REFERENCES ..................................................................................... 18-1
19 APPENDICES ...................................................................................... 19-1
Appendix 1 – Technical Memorandum Mid-water Discharge and the Mesopelagic Zone ............ 19-1 Appendix 2 – NORI-D Pilot Collector Test Sediment Plume Modelling (DHI, 2021) .................... 19-1 Appendix 3 – Characterization of sediment plumes behind mining vehicles in the NORI area .... 19-1 Appendix 4 – Initial Modelling Cut-offs for Suspended Sediment and Sediment Deposition ........ 19-2 Appendix 5 - Global Stakeholder Workshop Details ................................................................... 19-1
List of Tables Table 2-1. Relevant conventions, protocols and codes ................................................................ 2-6 Table 4-1. Approach used by Canadian Environmental Agency (1992) to determine if
environmental impacts are adverse, significant, and likely........................................... 4-1 Table 4-2. Leopold Matrix ............................................................................................................ 4-4 Table 4-3. Environmental effects per zone ................................................................................... 4-5 Table 4-4. Environmental effects per project related activity......................................................... 4-5 Table 4-5. Activities, valued ecosystem components, and impact pathways ................................ 4-5 Table 4-6. Descriptions of impact magnitude ............................................................................... 4-9 Table 4-7. Descriptions of VEC sensitivity .................................................................................. 4-10 Table 4-8. Significance criteria ................................................................................................... 4-10 Table 4-9. Qualitative criteria for likelihood ................................................................................ 4-12 Table 4-10 Qualitative criteria for consequence .......................................................................... 4-12 Table 4-11. Qualitative risk assessment matrix ............................................................................ 4-13 Table 5-1. Mooring depths and equipment ................................................................................... 5-9 Table 5-2. Water sampling sites ................................................................................................. 5-10 Table 5-3. Seawater nutrient concentrations in NORI-D, October 2019 ...................................... 5-12 Table 5-4. Carbon concentrations in NORI-D, October 2019 ...................................................... 5-13 Table 5-5. TSS, alkalinity and major constituent concentrations in NORI-D, October 2019 ........ 5-13 Table 5-6. Metal and metalloid (µg/L) concentrations NORI-D, October 2019 ............................ 5-15 Table 5-7. Chemical composition of polymetallic nodules .......................................................... 5-45 Table 5-8. Nodule facies types................................................................................................... 5-47 Table 6-1. Contractors, institutions, principal investigators and areas of study ............................. 6-1 Table 6-2. Baseline campaign and reporting schedule for NORI-D* ............................................. 6-2 Table 6-3. Summary of ROV transects conducted on Ocean Infinity campaign ............................ 6-5 Table 6-4. Summary of photo duration and bait condition for reference mooring #1 and #2 ......... 6-9 Table 6-5. Number of specimens per phylum found in box-core and multi core samples†. ......... 6-14 Table 7-1. Summary of environmental effects for the physicochemical environment .................... 7-1 Table 7-2. Benthic plume discharge characteristics ................................................................... 7-11 Table 7-3. Mid-water plume discharge characteristics ................................................................ 7-12

Document Number: FINAL
Revision: V20
Revision Date: 24 September, 2021
Page xx
Table 7-4. Track centreline offsets for cumulative sedimentation sensitivity testing .................... 7-38 Table 7-5. Worst case scenario cumulative sedimentation metrics ............................................. 7-38 Table 7-6. TSS concentrations at depth at NORI-D .................................................................... 7-42 Table 7-7. Impact significance and risk assessment - physicochemical VECs ............................ 7-46 Table 8-1. Summary of environmental effects for biological VECs ............................................... 8-1 Table 8-2 Impact significance & risk assessment - Biological VECs ............................................ 8-9 Table 9-1. Major hazards residual risk assessment ...................................................................... 9-7 Table 12-1. Monitoring parameters for Impact Zone 1 .................................................................. 12-4 Table 12-2. Monitoring parameters for Impact Zone 2 .................................................................. 12-6 Table 12-3. Monitoring parameters for Impact Zone 3 .................................................................. 12-8 Table 14-1. Expert panel review members ................................................................................... 14-6 Table 17-1. Study team & section contributors ............................................................................. 17-1
List of Figures Figure 1-1. CCZ location showing exploration areas. .................................................................... 1-2 Figure 1-2. NORI exploration areas .............................................................................................. 1-3 Figure 1-3. Overview of environmental studies being conducted as part of the operational ESIA .. 1-7 Figure 3-1. CTA selection constraints analysis .............................................................................. 3-4 Figure 3-2. Test Field bathymetry (27cm grid) ............................................................................... 3-5 Figure 3-3. Bathymetric map of NORI-D showing relative locations of the CTA and PRZ .............. 3-6 Figure 3-4. Nodule Collection System ........................................................................................... 3-9 Figure 3-5 Mining Vessel Hidden Gem ....................................................................................... 3-10 Figure 3-6. Rendering of Prototype Collector Vehicle .................................................................. 3-11 Figure 3-7 Main components of the Prototype Collector Vehicle................................................. 3-12 Figure 3-8. Coandă Nozzle ......................................................................................................... 3-12 Figure 3-9. Clearance Arms ........................................................................................................ 3-13 Figure 3-10. General layout of nodule processing system ............................................................. 3-14 Figure 3-11. Air lift system ............................................................................................................ 3-15 Figure 3-12. Proposed discharge depth for integrated system tests. ............................................. 3-16 Figure 3-13. Modelled return water temperature and ambient seawater temperature (°C) at depth (m)
................................................................................................................................. 3-17 Figure 3-14. PCV track system (A); 2 m wide, 6m apart (B); 6 m long at the base (C) ................... 3-18 Figure 3-15. Thruster unit (A) and position on the PCV (B - dotted red circles) .............................. 3-18 Figure 3-16. PCV surface control van setup .................................................................................. 3-19 Figure 3-17. PCV navigation system ............................................................................................. 3-20 Figure 3-18. Snubber configuration ............................................................................................... 3-21 Figure 3-19. PCV deployment and recovery sequence ................................................................. 3-23 Figure 3-20. Design to provide wave shielding during lowering through the splash zone ............... 3-23 Figure 3-21. Riser joints ................................................................................................................ 3-25 Figure 3-22. Connection configuration .......................................................................................... 3-26 Figure 3-23. Test runs .................................................................................................................. 3-28

Document Number: FINAL
Revision: V20
Revision Date: 24 September, 2021
Page xxi
Figure 3-24. Approximate impact footprint from collector test operations in relation to (A) the wider NORI-D contract area and (B) collector test area (CTA) and Test Field (TF). ............ 3-31
Figure 3-25. Sequencing and duration of collector test tasks ........................................................ 3-33 Figure 5-1. Location of the Clarion-Clipperton Zone ...................................................................... 5-2 Figure 5-2. Shipping routes around the CCZ and NORI-D ............................................................. 5-3 Figure 5-3. NORI-D oceanographic mooring deployment and water quality sampling locations ..... 5-4 Figure 5-4. Spectrograms from 538 m showing traces for sounds produced by passing vessels (A);
geological exploration (B) and weather (C).................................................................. 5-5 Figure 5-5. Average monthly wave heights in the CCZ .................................................................. 5-6 Figure 5-6. Drift tracks of the SOFAR spotters deployed during Campaign 4A (October 2019) and
Campaign 4D (June 2020) in NORI-D ......................................................................... 5-7 Figure 5-7. Current roses at 498 m (A), 1,232 m (B) and 4,321 m (C) ......................................... 5-11 Figure 5-8. Average (± standard deviation) metal and metalloid concentrations by depth ............ 5-17 Figure 5-9. In-situ temperature profiles in NORI-D, October 2019 ............................................... 5-19 Figure 5-10. Temperature time series in NORI-D .......................................................................... 5-20 Figure 5-11. Salinity profiles in NORI-D October, 2019 ................................................................. 5-21 Figure 5-12. Salinity time series in NORI-D ................................................................................... 5-22 Figure 5-13. Dissolved oxygen profiles in the NORI-D, October 2019 ........................................... 5-23 Figure 5-14. Dissolved oxygen time series in NORI-D ................................................................... 5-24 Figure 5-15. pH profiles in NORI-D, October 2019 ........................................................................ 5-25 Figure 5-16. Turbidity profiles in NORI-D, October 2019 ............................................................... 5-26 Figure 5-17. Turbidity time series in NORI-D, June 2020 .............................................................. 5-27 Figure 5-18. Static transmissivity profiles in NORI-D (June 2020) ................................................. 5-28 Figure 5-19. Seasonal transmissivity profiles in NORI-D, (Oct, 2019 – Jun, 2020) ........................ 5-29 Figure 5-20. Fluorescence profile in NORI-D, October 2019 ......................................................... 5-30 Figure 5-21. NORI-D seafloor sediment sampling locations .......................................................... 5-32 Figure 5-22. Nickel concentrations in sediment ............................................................................. 5-35 Figure 5-23. Cadmium concentrations in sediment ....................................................................... 5-35 Figure 5-24. Zinc concentrations in sediment ................................................................................ 5-36 Figure 5-25. Copper concentrations in sediment ........................................................................... 5-36 Figure 5-26. Relative variability of selected metal concentrations across NORI-D ......................... 5-38 Figure 5-27. Campaign 5A ex-situ oxygen results†‡ ...................................................................... 5-39 Figure 5-28. Campaign 5A alkalinity results† ................................................................................. 5-40 Figure 5-29. Campaign 5A nutrient results .................................................................................... 5-41 Figure 5-30. Bathymetric overview of the CCZ .............................................................................. 5-42 Figure 5-31. Bathymetry of NORI-D .............................................................................................. 5-43 Figure 5-32. NORI-D geological domains ...................................................................................... 5-43 Figure 5-33. Sediment cores from NORI-D showing sediment colour changes and mottling. ......... 5-44 Figure 5-34. NORI-D nodule collection showing ranges of sizes. .................................................. 5-46 Figure 5-35. Nodule classification in NORI-D ................................................................................ 5-48 Figure 5-36. NORI-D camera imagery showing change from Type 2 (left) to Type 3 (right) ........... 5-49 Figure 5-37. Geoform structure of NORI-D.................................................................................... 5-51

Document Number: FINAL
Revision: V20
Revision Date: 24 September, 2021
Page xxii
Figure 5-38. CCZ Level 1 classes of tectonic setting, geomorphology and algorithmic terrain classification. ............................................................................................................ 5-53
Figure 5-39. NORI-D Level 2 geoforms. ........................................................................................ 5-54 Figure 5-40. NORI-D Level 3 geoforms. Red lines indicate alignment of two knoll-seamount chains. 5-
55 Figure 5-41. Substrate structure of NORI-D .................................................................................. 5-56 Figure 5-42. Seabed types encountered across NORI-D study areas. .......................................... 5-57 Figure 5-43. NORI-D Level 2 substrates. ...................................................................................... 5-58 Figure 5-44. NORI-D Level 3 substrates (excludes volcanic rock which is a Level 2 substrate). .... 5-59 Figure 5-45. Location of CTA and PRZ in relation to nodule type on NORI-D ................................ 5-60 Figure 6-1. Example of megafauna imaged from Ocean Infinity campaign .................................... 6-8 Figure 6-2. Example images captured from moorings #1 (A-C) and reference mooring #2 (D) ...... 6-9 Figure 6-3. Macrofauna box-core sites Campaign 5A (16/10/20 -30/11/20) in CTA and surrounds (A)
and PRZ (B) .............................................................................................................. 6-11 Figure 6-4. Images of recovered box-cores with topwater siphoned off. ...................................... 6-12 Figure 6-5. Images of the nodule fauna collected during Campaign 5A. ...................................... 6-13 Figure 6-6. Images of the live-sorted macrofauna during Campaign 5A. ..................................... 6-13 Figure 6-7. Overall composition of the macrofauna from all Campaign 5A sites pooled. ............. 6-15 Figure 6-8. Relative abundance of the macrofauna from the NORI-D 5A sites. ........................... 6-15 Figure 6-9. Community composition of the macrofauna from the NORI-D 5A sites. ..................... 6-16 Figure 6-10. Sediment slicing for meiofauna analysis. ................................................................... 6-18 Figure 6-11. Taxonomic composition of eukaryotic communities using V1V2 and V9 markers and
considering the richness (number of OTUs) or the abundance (number of reads). .... 6-20 Figure 6-12. Taxonomic composition of Metazoa communities using V1V2 and V9 markers and
considering the presence (OTUs) or the abundance (reads) of each OTU. ............... 6-21 Figure 6-13. (A) alpha-diversity indices (B)NMDS calculated using V9 marker for UK area samples
(red) and for NORI_D samples (green). .................................................................... 6-22 Figure 6-14. Pelagic specimens collected during Campaign 5B (yet to be identified) .................... 6-27 Figure 6-15. Upward-looking ADCP backscatter intensity plots (75 kHz) at 500 m depth from January
2 to January 12, 2020. .............................................................................................. 6-28 Figure 6-16. Downward looking ADCP backscatter intensity plots (75 kHz) at 500 m depth from
March 30 to April 09, 2020 ........................................................................................ 6-28 Figure 6-17. Examples of surface biota observations from NORI-D ............................................... 6-30 Figure 6-18. Hydrophone setup and operation .............................................................................. 6-31 Figure 7-1. Potential impacts from the disturbance of seafloor sediment ....................................... 7-6 Figure 7-2. Summary of measured near bed current data from NORI-D (14 October 2019 to 26 June
2020) .......................................................................................................................... 7-8 Figure 7-3. Collector test model mesh ......................................................................................... 7-10 Figure 7-4. Longitudinal slice through test field site* .................................................................... 7-10 Figure 7-5. Sediment settling velocity model ............................................................................... 7-11 Figure 7-6. Measured current conditions at the NORI-D long mooring (current flowing to) at
approximately 980m and 1179m (right) below the surface - 14 October 2019 to 26 June 2020 ......................................................................................................................... 7-13

Document Number: FINAL
Revision: V20
Revision Date: 24 September, 2021
Page xxiii
Figure 7-7. Seasonal variability in near bed current conditions (current flowing to) at the location of the long mooring in the NORI-D area based on HYCOM data 2004 to 2018 (HYCOM 2021) ........................................................................................................................ 7-14
Figure 7-8. Model scenarios ........................................................................................................ 7-16 Figure 7-9. Sediment deposition footprints† ................................................................................. 7-19 Figure 7-10. Benthic plume scenario model results showing exceedance percentage of 0.1, 1.0, 5.0
and 10.0 mg/l, at 5m and 20m above seabed, from the start of nodule production to 24 and 48 hours post-nodule production for all scenarios. .............................................. 7-21
Figure 7-11. Modelled dynamics of mid-water plume .................................................................... 7-32 Figure 7-12. Mid-water plume scenario model results for all scenarios. ......................................... 7-33 Figure 7-13. Cumulative sedimentation for base case (A), Shift 1 (B) and Shift 2 (C) .................... 7-39 Figure 7-14. Total duration (hours) where 1mg/l is exceeded at 5 m above the seabed. ............... 7-40 Figure 7-15. Total duration (hours) where 1 mg/l is exceeded at 20 m above the seabed.............. 7-40 Figure 7-16. Total duration (hours) where 0.1mg/l is exceeded at 50 m below the mid water column
discharge point. ........................................................................................................ 7-41 Figure 8-1 Tracking data for migratory species in the eastern tropical Pacific ............................... 8-4 Figure 9-1. HIRA process ............................................................................................................. 9-6 Figure 12-1. Collector test monitoring framework .......................................................................... 12-3 Figure 12-2. Proposed BACI design with three sampling events (solid dots) before and multiple after
system testing (arrow) from the IRZ and Control site; modified from Underwood (1996) ............................................................................................................................... 12-12
Figure 12-3. Benthic sampling sites ........................................................................................... 12-13 Figure 12-4. Map of image survey operations per sampling event within NORI-D* ...................... 12-16 Figure 12-5. Types of biodiversity reference libraries that will be developed for NORI-D (from Glover
et al 2016)............................................................................................................... 12-18 Figure 12-6. Pelagic sampling sites ............................................................................................ 12-21 Figure 12-7. Offshore monitoring techniques .............................................................................. 12-22 Figure 12-8. Example of PelagOS data recording screen. ........................................................... 12-25 Figure 13-1. Impact vs uncertainty matrix (modified from Speziale & Geneletti 2014).................... 13-2 Figure 14-1. Participants at the NORI global stakeholders workshop, San Diego, USA, 5 and
6 February 2020 ....................................................................................................... 14-4

Document Number: FINAL
Revision: V20
Revision Date: 24 September, 2021
Page 1-1
1 INTRODUCTION
1.1 Background
Nauru Ocean Resources Inc. (NORI), a wholly owned subsidiary of The Metals Company Metals Inc. (The Metals Company), plans to carry out testing of a polymetallic nodule collector system in the NORI-D lease area (NORI-D) of the eastern Clarion Clipperton Zone (CCZ), north Pacific Ocean (Figure 1-1). The CCZ is a region of commercial interest due to the presence of polymetallic nodules, covering an area over 4.5-million-km2 with a typical nodule concentration of 15 kg/m2 (MIDAS, 2016a).
The nodules contain nickel, copper, and cobalt (around 2 - 3% of the nodule weight) as well as traces of other metals such as molybdenum, rare earth elements, and lithium, which are important to high-tech industries. The amount of copper contained in the CCZ nodules is estimated to be about 20% of that held in global land-based reserves (MIDAS, 2016a).
At the time of writing an operational Environmental and Social Impact Assessment (ESIA) is in process for the commercial mining of polymetallic nodules within NORI-D. The information gathered will inform an operational Environmental Impact Statement (EIS) that will accompany NORI’s application for a commercial contract. The operational EIS will include the information required by the International Seabed Authority (ISA) to make an informed decision on the feasibility of the application in terms of its social benefits and environmental impacts. Testing of the prototype collector vehicle (PCV), nodule processing system, the nodule riser system, and surface processing onboard the surface support vessel (SSV) (collectively referred to as The Collector Test) is considered an essential component of the operational ESIA.
The ISA requires that an Environmental Impact Assessment (EIA) also be conducted for the collector test and an EIS (this document) submitted by the contractor to the Secretary-General no later than one year in advance of the activity taking place (ISBA/25/LTC/6/Rev.1/6B/B/34).
1.2 The Collector Test
It is necessary to demonstrate the technical, economic, and environmental feasibility of operations proposed for the commercial mining of polymetallic nodules. The collector test is NORI’s opportunity to demonstrate to the regulator that nodules can be successfully harvested from the seabed and transported to a surface vessel. It will also allow assumptions about the design of the PCV and riser system to be tested under field conditions. The results of the test will be used to inform and improve the design and environmental performance of the full-scale collection system.
The collector test will be conducted in parallel with studies of the physicochemical and biological baseline of NORI-D; the combined results will provide critical data for the operational ESIA.
The collector test will take place in international waters and will adhere to the latest ISA recommendations (ISBA/25/LTC/6/Rev.1; 30 March 2020).
This EIS has been informed by data collected from the eastern CCZ and NORI-D and outlines the potential environmental impacts associated with the collector test and serves to provide the basis for assessment of the proposed activities by the ISA.

Docum
ent Num
ber: FIN
AL
Revision:
V20
Revision D
ate: 24 S
eptember, 2021
P
age 1-2 Figure 1-1.
CC
Z location showing exploration areas.

Document Number: FINAL
Revision: V20
Revision Date: 24 September, 2021
Page 1-3
1.3 Objectives
The key objectives of the collector test (the Project) are to:
• Test the PCV and riser system components to inform the design and operation of the full-scale system.
• Develop sound procedures to assess environmental risks associated with polymetallic nodule collection.
• Study the environmental impacts of polymetallic nodule collection to inform monitoring and mitigation measures and the development of management plans for full-scale operations.
1.4 Project Proponent
The Project proponent is Nauru Ocean Resources Inc. (NORI), a wholly owned subsidiary of The Metals Company which holds interests in commercially exploring the seafloor for polymetallic nodule deposits that are rich in base and strategic metals. The Government of Nauru is the sponsor of NORI’s exploration rights within the NORI exploration areas as shown in Figure 1-1 and Figure 1-2.
The Metals Company (TMC) is a private Canadian deep-sea mining company focused on producing clean base metals from polymetallic nodules. TMC has exploration rights issued by the ISA to three designated areas in the CCZ, sponsored by Nauru (NORI exploration areas), Tonga (TOML exploration area), and Kiribati (Marawa exploration area) (Figure 1-1).
In July 2011, NORI formally signed the agreement with the ISA for exploration tenements in the Pacific Ocean and became the first private sector organisation to be granted an exploration contract. The contract gives NORI exclusive rights to conduct polymetallic nodule exploration activities within the four NORI exploration areas in the CCZ. NORI has been granted 74,380 km2 of exploration territory with their initial contract period maintained for 15 years.
Figure 1-2. NORI exploration areas

Document Number: FINAL
Revision: V20
Revision Date: 24 September, 2021
Page 1-4
1.5 Offshore Campaigns
1.5.1 Completed Prior to NORI obtaining an exploration contract in 2011, sampling of the seafloor environment of the NORI-D site was conducted by three pioneer explorers, namely:
• The AMR group from the Federal Republic of Germany, which included Preussag (a German mining company).
• State Enterprise Yuzhmorgeologiya of the Russian Federation.
• Interoceanmetal Joint Organization (IOM), a consortium formed by Bulgaria, Cuba, the Czech Republic, Poland, the Russian Federation, and Slovakia.
The data collected by these explorers has been used as the foundation for development of a program of works to develop an environmental baseline for NORI-D. Since 2011, NORI has conducted 14 research campaigns to NORI leases A, B, C and D, including:
• Campaign 1 (2012) – Exploration of the polymetallic nodule resource in NORI-C and NORI-D aboard the RV Mt. Mitchell; including extensive multibeam geophysical surveying of the seafloor and bulk sampling. Approximately 4,500 kg of nodules were recovered from the seafloor as evidenced from video footage.
• Campaign 2 (2013) – Exploration of the polymetallic nodule resource in NORI-A and NORI-B aboard the RV Mt. Mitchell; including extensive multibeam geophysical surveying of the seafloor along with recovery of approximately 270 kg of nodules by bulk sampling.
• Campaign 3 (26/4 to 5/6/18) – Benthic sampling at NORI-D to support environmental studies and undertake geotechnical studies to inform PCV and riser system design, collected high-resolution imagery, including Autonomous Underwater Vehicle (AUV) geophysical and light geotechnical surveys. A total of 2,286 km of AUV geophysical data were collected that included high resolution multibeam. Camera traverses were completed at 3 km line spacing to investigate nodule abundance. Forty-five (45) box-cores were collected, with 35 used for environmental work. This resulted in the recovery of 239 nodule biota specimens, 62 megafauna (>20 mm) specimens, and macrofaunal infauna (>0.25 mm) samples sieved from sediment to depth of 100 mm. Sediments were also collected for geochemical analysis.
• Campaign 6A (19/8 to 1/10/19) – Box-core sampling of nodules and seafloor sediments at 100 locations within NORI-D for biological, geochemical, geotechnical and mineral assays.
• Campaign 4A (2/10 to 23/10/19) – Deployment of three oceanographic moorings within NORI-D from the Maersk Launcher to collect continuous metocean data. Water sampling and oceanographic profiling were also conducted.
• Campaign 6B (22/11 to 21/12/19) - Box-core sampling of nodules and seafloor sediments for biological, geochemical, geotechnical and mineral assays at 104 locations within NORI-D and 18 locations in the Marawa exploration area.
• Campaign 4B (6/1 to 4/02/20) – Bulk sampling of nodules from NORI-D for mineral assays using an epibenthic sled and first stage of benthic habitat disturbance studies.
• Campaign 4C (5/2 to 16/3/20) – Bulk sampling of nodules from NORI-D for mineral assays using an epibenthic sled and second stage of benthic habitat disturbance studies.
• Ocean Infinity Campaign (23/05 – 30/05/20) - The availability of the vessel Pacific Constructor, operated by Ocean Infinity provided the opportunity to commission ROV/AUV surveys of the collector site, the expected plume impact area, the Preservation Reference Zone (PRZ), and intermediate control sites within NORI-D. This resulted in the acquisition of approximately 25K images of the sea floor acquired by an ROV mounted camera at an altitude of <3 m. This information will be used to characterize the megafaunal communities and survey planning for upcoming campaigns.

Document Number: FINAL
Revision: V20
Revision Date: 24 September, 2021
Page 1-5
• Campaign 4D (16/6 – 15/7/20) – Serviced the oceanographic moorings deployed at NORI-D during Campaign 4A and undertook additional oceanographic profiling.
• Campaign 5A (16/10 – 30/11/20) - Collected data on the benthic biology, sediment geochemistry and surface biology of NORI-D using box-core, multicore and floating hydrophones.
• Campaign 5B (5/3 – 14/4/21) - Pelagic biology studies of NORI-D supported by ROV, CTDs, MOCNESS nets and rosette water quality samplers for trace metals.
• Campaign 5D – (27/4 – 12/6/21). Collected data on the benthic biology, sediment geochemistry and surface biology of NORI-D using box-core, multicore and floating hydrophones.
• Campaign 4E – (6/7-29/7/21). Scheduled annual servicing of moorings on NORI-D site.
1.5.2 Upcoming The forward work plan over the next two years will involve a further six offshore campaigns to NORI-D1, including:
• Campaign 5C – (Q3/2021). Seasonal pelagic biology studies to compliment those conducted on Campaign 5B.
• Campaign 5E - (Q4/2021). ROV pelagic and benthic transects and sample collection
• Pre/Mid- Collector Test – (Q3/2022). Metocean, benthic and pelagic data will be collected both prior and during the collector test.
• Post - Collector Test – (Q3/2022). Disturbance studies during and after the Collector Test will be conducted.
• Campaign 4F – (Q2/2022). Scheduled annual servicing of moorings on NORI-D site.
• Campaign 4G – (Q2/2023). Scheduled annual servicing of moorings on NORI-D site.
The accumulation of data collected over the 20 campaigns described above represents approximately 250,000 offshore research hours, plus an equivalent amount of time in onshore analysis. The data set collected by NORI for the operational ESIA will be the most comprehensive single body of information on the nature of the seabed, sampling procedures, and potential environmental impacts of nodule collection in the CCZ.
NORI’s scientific studies are designed to meet international best practice specifications and the standardized methodologies recommended by the ISA. This allows comparison with other CCZ technical studies, scientific publications and provides data that can be utilised by third parties. All data collected will be submitted to the ISA DeepData database making it available to other contractors and researchers.
1.6 Collector Test EIS
The ISA recommendations state that the collector test EIS should be submitted 12 months prior to the date of the test. The current schedule has the NORI-D Collector Test EIS being submitted Q3/2021, the collector test being conducted in Q3/2022.
1.7 Operational ESIA
The objective of the operational ESIA is to provide the ISA with sufficient information on the impacts of the proposed polymetallic collection operations to make an informed assessment of NORI’s application for a commercial contract for NORI-D.
1 Schedules are subject to revision depending on COVID-19 situation

Document Number: FINAL
Revision: V20
Revision Date: 24 September, 2021
Page 1-6
The operational ESIA will include descriptions of the baseline conditions, project activities, impact assessment, proposed mitigation measures, and an Environmental Monitoring and Management Plan (EMMP). An outline of the topics that will be addressed by the environmental baseline studies is provided in Figure 1-3.
The ISA recommends that a collector test be conducted as part of the operational ESIA to test assumptions about the collector system design, test hypotheses about impacts on the receiving environment, and to test the functionality of the collector system at a small scale prior to commercial scale operations (ISBA/25/LTC/6/Rev.1). The results of the collector test will be integral to the development of a full-scale system design and operational strategy that effectively minimises the environmental impacts of commercial operations.
1.8 This Report
1.8.1 Objective The Collector Test EIS is intended to provide the ISA and stakeholders with a clear description of the Project, the potential environmental impacts, environmental risks and hazards, risk management measures and monitoring programs relating to the collector test.
As environmental impacts will be temporary, of short duration and limited to a small area of seafloor, socio-economic issues have not been included in the Collector Test EIS, however they will be addressed by the operational ESIA for the full-scale operating system.
1.8.2 Report Structure The structure of this report follows a logical sequence and the individual sections follow the major headings listed in ISBA/25/LTC/6/Rev.1/Annex III, with the following additions: Section 4 - Impact Assessment Methods; Section 10 – Risk Prioritization; Section 11 – Cumulative Impacts; Section 13 – Limitations, Assumptions & Uncertainty; and Section 12 - Conclusions and Recommendations.
The report is structured as follows: Executive Summary
1. Introduction 2. Legal & Regulatory Framework, Policy, Standards & Guidelines 3. Project Description 4. Impact Assessment Methods. 5. Physicochemical Environment 6. Biological Environment 7. Physicochemical Environmental Impacts 8. Biological Environmental Impacts 9. Hazards, Mitigation & Emergency Response Plan 10. Risk Prioritization 11. Cumulative Impacts 12. Environmental Management, Monitoring & Reporting 13. Limitations, Assumptions & Uncertainty 14. Consultation & Review 15. Conclusions & Recommendation 16. Glossary & Abbreviations 17. Study Team 18. References 19. Appendices

Docum
ent Num
ber: FIN
AL
Revision:
V20
Revision D
ate: 24 S
eptember, 2021
P
age 1-7 Figure 1-3.
Overview
of environmental studies being conducted as part of the operational ESIA

Document Number: FINAL
Revision: V20
Revision Date: 24 September, 2021
Page 2-1
2 LEGAL & REGULATORY FRAMEWORK, POLICY, STANDARDS & GUIDELINES
2.1 Introduction
This section describes the main laws, regulations and policies applicable to the collector test at the time of writing, and good practice standards and guidelines that have informed the preparation of this document, namely:
• The 1982 United Nations Convention of the Law of the Sea (UNCLOS).
• Nauru legislation relevant to regulating the Project.
• The guidance that applies to the approvals and environmental permitting of the Project under the International Seabed Authority (ISA).
• Other international environmental and social conventions, standards and guidelines, which have informed the preparation of this Environmental Impact Statement (EIS).
• NORI’s obligations relevant to the Project.
2.2 1982 United Nations Convention of the Law of the Sea
UNCLOS is an international treaty which was adopted and signed in 1982. It replaced the Geneva Conventions (1958) which addressed the territorial sea and the contiguous zone, the continental shelf, the high seas, fishing and conservation of living resources on the high seas. The convention created three new institutions being the International Seabed Authority (ISA), International Tribunal for the Law of the Sea and Commission on the Limits of the Continental Shelf. The convention has become the legal framework for marine and maritime activities.
Exploration for polymetallic nodules by NORI will be conducted in the ‘Area’ as defined by Article 1 of UNCLOS, that is, ‘…the seabed and ocean floor and subsoil thereof, beyond the limited of national jurisdiction’.
The ISA is an autonomous international organisation established under UNCLOS to organise, regulate and control activities in the Area, where activities are defined by Article 1 of UNCLOS as ‘…all activities of exploration for, and exploitation of, the resources of the Area’ and resources are defined as ‘…all solid, liquid or gaseous mineral resources in situ in the Area at or beneath the seabed, including polymetallic nodules’ (Article 133 of UNCLOS). The ISA has the duty to ensure the effective protection of the marine environment from harmful effects that may arise from deep-sea-related activities. The ISA comprises the European Union and 167 Member States, of which Nauru is a member state with permanent missions, becoming a party to UNCLOS on 23 January 1996, that is, State Party.
The Project is therefore governed by the ISA, UNCLOS and the agreement relating to the implementation of Part XI (The Area) of UNCLOS (1994 Implementation Agreement).
NORI’s exploration contract is a contract area established in 2011 between NORI and the ISA (NORI Exploration Contract) covering an area of 74,830 km2, that is, NORI Area A (Block 13), NORI Area B (Block 15), NORI Area C (Block 22) and NORI Area D (Block 25). NORI Area D (NORI-D) will be the location where the collector test will be conducted.

Document Number: FINAL
Revision: V20
Revision Date: 24 September, 2021
Page 2-2
2.3 The ISA Mining Code
The ISA Mining Code is comprised of rules, regulations, and procedures to regulate prospecting, exploration, and exploitation of marine resources in the Area. These rules, regulations and procedures are issued within a general legal framework established by UNCLOS (for example, Part IX) and the 1994 Implementation Agreement (UN, 2016).
2.3.1 Recommendations There are a number of recommendations that have been issued as part of the Draft Mining Code that once finalised will become regulations (see Section 2.3.2). The most relevant are the:
• Recommendations for the Guidance of Contractors for the Assessment of the Possible Environmental Impacts Arising from Exploration for Marine Minerals in the Area (30 March 2020; ISBA/25/LTC/6/Rev.1).
This recommendation defines the activities that require environmental impact assessments (EIAs), the form and content of the EIAs, as well as guidance on baseline studies, monitoring and reporting, especially related to impacts on marine biodiversity. Annex III provides a template for the Environmental Impact Statement (EIS), although more detailed documentation on the requirement of an EIA is provided in draft regulations on exploitation of mineral resources in the Area (ISBA/25/C/WP.1) (see Section 2.3.2).
Section VI(B)(33) states:
33. The following activities require prior environmental impact assessment, as well as an environmental monitoring programme to be carried out during and after the specific activity, in accordance with the recommendations contained in paragraphs 33 and 38. It is important to note that baselines, monitoring and impact assessment studies are likely to be the primary inputs to the environmental impact assessment for commercial mining. The activities include:
(a) Use of sediment disturbance systems that create artificial disturbances and plumes on the sea floor;
(b) Testing of mining components;
(c) Test-mining;
(d) Testing of discharge systems and equipment;
(e) Drilling activities using on-board drilling rigs;
(f) Sampling with epibenthic sled, dredge or trawl, or similar technique, in nodule fields, that exceeds 10,000 m2;
(g) Taking of large samples to test land base processes.
Therefore, the collector test (to test the mining components, discharge systems and equipment) requires a prior EIA and an environmental monitoring program, as the activities proposed to be undertaken include:
o The use of sediment disturbance systems that create plumes.
o The testing of mining components.
o The testing of discharge systems.
o The collection of large samples.

Document Number: FINAL
Revision: V20
Revision Date: 24 September, 2021
Page 2-3
The collector test EIS is to be submitted to the Secretary-General of the ISA no later than one year in advance of the activity taking place.
• Recommendations for the Guidance of Contractors for the Assessment of the Possible Environmental Impacts Arising from Exploration for Polymetallic Nodules in the Area (ISBA/16/LTC/7; 2 November 2020).
This recommendation specifies baseline data collection requirements in detail and EIA requirements which are similar to those of ISBA/25/LTC/6/Rev.1 including the timing of submission. Section B(13) identifies activities requiring prior EIA:
(a) Sampling with epibenthic sled, dredge or trawl, to collect nodules for on-land studies for mining and/or processing if the sampling area of any one sampling activity exceeds 10,000 m2;
(b) Use of specialized equipment to study the effect of artificial disturbances that may be created on the sea floor;
(c) Testing of collection systems and equipment.
• ISBA/25/LTC/6/Rev.1 Section E. outlines the recommendations for stakeholder consultation. A stakeholder consultation process is required and while the Recommendations do not require that they be conducted by the Sponsoring State, the Secretary General may encourage the Sponsoring State to conduct them. To date three collector test EISs have been submitted and in all instances, the Sponsoring States hosted a consultation process.
2.3.2 Regulations To date, the ISA has issued four regulations as part of the Mining Code, with those most relevant to the Project being:
• Regulations on Prospecting and Exploration for Polymetallic Nodules in the Area (adopted 15 July 2013; (ISBA/16/A/12/Rev.1).
Part 5 (Protection and Preservation of the Marine Environment) addresses:
o Environmental baseline data and monitoring of environmental impacts of all its activities.
o Reporting incidents caused by the contractor that might pose the risk of serious environmental harm and stopping activities if the risks warrant it.
o Not undertaking any activities that might cause serious harm to coastal States.
o Reporting on and preserving any potential historic or archaeological sites.
Sections 5 to 7 of Annex IV (Standard Clauses for Exploration Contract) elaborate on these matters and specify:
5.2 Prior to the commencement of exploration activities, the Contractor shall submit to the Authority:
(a) An impact assessment of the potential effects on the marine environment of the proposed activities;
(b) A proposal for a monitoring programme to determine the potential effect on the marine environment of the proposed activities; and

Document Number: FINAL
Revision: V20
Revision Date: 24 September, 2021
Page 2-4
(c) Data that could be used to establish an environmental baseline against which to assess the effect of the proposed activities.
• Draft regulations on exploitation of mineral resources in the Area (March 2019; ISBA/25/C/WP.1). These regulations are expected to be finalised in 2021.
Part 4, Section 2 (Preparation of the Environmental Impact Statement and the Environmental Management and Monitoring Plan) outlines the purpose of, and requirements for, the EIS and environmental management and monitoring plan, including recommended formats to guide the content of the EIS.
The first set of draft standards and guidelines to support the Mining Code have been developed and were available for public consultation until 20 October 2020. These include three documents related to the preparation and assessment of an application for the approval of a commercial plan of work, the development and application of environmental management systems and the calculation of an environmental performance guarantee (noting that it is not permitted to quote or cite these documents).
These documents cover the obligations of NORI to the ISA with respect to exploration of the Area under contract. The EIS for activities associated with the collector test within NORI-D is consistent with the requirements described above.
2.4 Nauru Legislation
The Republic of Nauru International Seabed Minerals Act 2015 governs Nauru’s engagement in seabed mineral activities in the Area beyond national jurisdiction and the associated administrative functions of the republic. The Act defines exploration as:
‘use and testing of recovery systems and equipment, processing facilities and transportation systems in the Area’
The Act recognises:
6 (d) the rules, regulations, procedures, codes and standards adopted by the ISA for the:
i. protection and preservation of the natural resources of the Area and the prevention of damage to the flora and fauna of the Marine Environment.
ii. preservation, reduction and control of pollution and other hazards to, and the interference with the ecological balance of the Marine Environment.
iii. exercise of control over activities in the Area as is necessary for the purpose of securing compliance with the UNCLOS and the Rules of the ISA by contractors carrying out activities in the Area.
Under the Act, to be eligible to perform seabed mineral activities, a Sponsorship Applicant must first:
(a) obtain a valid Sponsorship Certificate from the ISA; and
(b) obtain a valid contract from the ISA, pertaining to those seabed mineral activities.
A Sponsored Party is a person who holds a current Sponsorship Certificate issued under Part 3 of the Act, that person’s representatives or officers, and any person or persons to whom the Sponsorship Certificate may lawfully have been assigned. The NORI Exploration Contract grants NORI tenure and the exclusive right to explore for polymetallic nodules in the NORI Areas for a period of 15 years. NORI will perform all exploration activities under this contract.
The following clauses within the Act provide guidance to Nauru in terms of their legal obligations:

Document Number: FINAL
Revision: V20
Revision Date: 24 September, 2021
Page 2-5
7 Establishment of the Nauru Seabed Minerals Authority
(2) The Authority shall be a body corporate with perpetual succession and a common seal,
10 Objectives of the Authority
(c) ensure compliance by Sponsored Parties or any sub-contractors engaged by the State of Sponsored Parties in relation to Seabed Mineral Activities with relevant rules and internationally agreed standards;
(f) act in a way that is compatible with principles of best regulatory practice, including that regulatory activities should be proportionate, accountable, consistent, transparent and targeted only at cases where needed.
11 Functions of the Authority
The functions of the Authority are to:
(g) liaise with the ISA and any other relevant international organizations to facilitate a Sponsored Party’s application to the ISA for a contract;
(i) assist the ISA in its work to establish, monitor, implement and secure compliance with the Rules of the ISA;
(j) undertake any advisory, supervisory or enforcement activities in relation to Seabed Mineral Activities or the protection of the Marine Environment, insofar as this is required in addition to the ISA’s work in order for Nauru to meet its obligations under the UNCLOS as a Sponsoring State;
(n) seek expert advice on factual matters pertaining to the administration of this Act and concerning the management of Nauru’s Seabed Mineral Activities including but not limited to advice on economic, legal, scientific, technical matters and the management and conservation of the Marine Environment, including from experts outside of the country.
17 Consultation The Authority may at any time and in way that it sees fit, consult with persons of relevant expertise, interest groups, or the general public before taking a decision or action under this Act.
30 State Responsibilities Where Nauru is sponsoring a Sponsored Party which holds a contract with the ISA to conduct Seabed Mineral Activities, Nauru via the Authority will:
(a) seek to ensure that its conduct in relation to the ISA, the Area and Seabed Mineral Activities adheres to the requirements and standards established by general principles of international law;
(b) take all appropriate means to exercise its effective control over Sponsored Parties or any relevant sub-contractors engaged by the State, seeking to ensure that any Seabed Mineral Activities are carried out in conformity with the UNCLOS, the Rules of the ISA and other requirements and standards established by general principles of international law;
(c) do all things reasonably necessary to give effect to its sponsorship of a Sponsored Party, including undertaking any communication with and providing any assistance, documentation, certificates and undertakings to the ISA or other relevant party required in respect of the Sponsorship;
31 Monitoring powers (1) The Authority shall have the power to make such examinations, inspections and enquiries of Sponsored Parties and the conduct of Seabed Mineral Activities as are necessary to meet its responsibilities under international law, which may include the:

Document Number: FINAL
Revision: V20
Revision Date: 24 September, 2021
Page 2-6
(a) sending of an observer to the site of the Seabed Mineral Activities and vessel or premises of the Sponsored Party.
2.5 Other International Conventions, Standards & Guidelines
The International Maritime Organisation (IMO) International Convention for the Prevention of Pollution from Ships (MARPOL), including the subsequent annexes I to VI (outlined below), is applicable to the operation of the vessel and the exploration activities.
• Annex I – Regulations for the Prevention of Pollution by Oil.
• Annex II – Regulations for the Control of Pollution by Noxious Liquid Substances in Bulk.
• Annex III – Prevention of Pollution by Harmful Substances Carried in Sea in Packaged Form.
• Annex IV – Prevention of Pollution by Sewage from Ships.
• Annex V – Prevention of Pollution by Garbage from Ships.
• Annex VI – Prevention of Air Pollution from Ships.
Table 2-1 provides additional environmental conventions, protocols and codes that are applicable to the Project and its implementation.
Table 2-1. Relevant conventions, protocols and codes CONVENTIONS, PROTOCOLS AND CODES DESCRIPTION/IMPLICATIONS
Marine
Convention for the Protection of the Natural Resources and Environment of the South Pacific Region (1986) Also known as the SPREP Convention or Noumea Convention.
Agreement for the protection, management and development of the marine and coastal environment of the South Pacific Region and represents the legal framework of the Action Plan for managing the Natural Resources and Environment of the South Pacific adopted in 1982.
Protocol for the Prevention of Pollution of the South Pacific Region by Dumping (1990) (Amendment) 2006
The objective of the protocol is to prevent, reduce and control pollution by dumping of wastes and other matter in the South Pacific.
International Convention for the Control and Management of Ships’ Ballast Water and Sediments (2004)
Under the Convention, all ships in international traffic are required to manage their ballast water and sediments to a certain standard, according to a ship-specific ballast water management plan. The Convention requires all ships to implement a Ballast Water and Sediments Management Plan, and to carry a Ballast Water Record Book and are required to carry out ballast water management procedures to a given standard.
1996 Protocol to the Convention on the Prevention of Marine Pollution by Dumping of Wastes and Other Matter, 1972 (as amended in 2006)
Article 1 Definitions Article 4.2 “Dumping” does not include: 4.3 The disposal or storage of wastes or other matter directly arising from, or related to the exploration, exploitation and associated offshore

Document Number: FINAL
Revision: V20
Revision Date: 24 September, 2021
Page 2-7
CONVENTIONS, PROTOCOLS AND CODES DESCRIPTION/IMPLICATIONS processing of seabed mineral resources is not covered by the provisions of this Protocol.
The International Marine Minerals Society’s Code for Environmental Management of Marine Mining (2001)
The code anticipates and integrates environmental considerations for responsible marine mining. The Code seeks to complement national and international marine mining environmental regulations where they exist, and to provide environmental principles and guidelines where these are absent or could be improved.
Fauna and Flora
Convention on Biological Diversity (1992)
The convention covers conservation of biological diversity, the sustainable use of its components and the fair and equitable sharing of the benefits arising from using genetic resources, including on the deep seabed.
Memorandum of Understanding for Cetaceans and their Habitats in the Pacific Island Region (2006)
To provide an awareness of international responsibilities to conserve cetacean populations of the Pacific Islands Region, in particular, pursuant to the Convention on Biological Diversity (CBD) for which the Convention on the Conservation of Migratory Species of Wild Animals (CMS) is the CBD lead partner in the global conservation of migratory species over their entire range.
UNCLOS (article 145 Part XII) Protection of the Marine Environment
To ensure the marine environment and all species related are protected and that no harm comes to flora or fauna during human activities.
Climate Vienna Convention for the Protection of the Ozone Layer (the Vienna Convention) (1993) and the Montreal Protocol on Substances that Deplete the Ozone Layer (1992)
To provide guidelines and protocols for the protection of the ozone layer on a global scale.
United Nations Framework Convention on Climate Change (1992)
An international environmental treaty providing guidelines and frameworks addressing climate change on a global scale.

Document Number: FINAL
Revision: V20
Revision Date: 24 September, 2021
Page 3-1
3 PROJECT DESCRIPTION
3.1 Context
The ISA recommendations require that test-mining and testing of mining components be conducted as part of an EIA in support of an application for a commercial mining contract (ISBA/25/LTC/6/Rev.1.[I7]). NORI has scheduled testing of a collector system for Q3/2022. Testing of mining components will be conducted over approximately 60 days, in an area of 8 km2 involving 860 hours of seafloor trials, of which approximately 259 hours will be full system test runs.
The creation of plumes, testing of mining components, test mining, and testing of discharge systems and equipment are identified as activities requiring an EIA and monitoring during and after testing (ISBA/25/LTC/6/Rev.1. [II.C11(c)]/[VIB33(a)(b)(c)(d)]).
Baseline data documenting natural conditions prior to test mining is required in order to monitor changes in the receiving environment resulting from these activities and to predict impacts of commercial scale mining (ISBA/25/LTC/6/Rev.1[III.B.15]).
3.2 Objectives
Testing of a prototype nodule harvesting system will be conducted in small area of NORI-D. The prototype system is currently under development by Allseas Group S.A. (Allseas) in the Netherlands; and will be a fully functioning 1/5 scale prototype of the commercial system.
Allseas and NORI will conduct a series of sea trials of the prototype system to assess its technical and environmental performance, and in doing so achieve the following objectives:
• Demonstrate the technical feasibility of the polymetallic nodule collection system.
• Assess the technical performance of the prototype collection system and incorporate learnings into the design of the full-scale commercial system.
• Assist in predicting potential environmental impacts associated with full-scale operations.
The prototype collector system will be put through the following sea trials:
• Deployment from the surface vessel to the seabed.
• Coupling of the riser pipe and umbilical with the prototype collector vehicle (PCV).
• Propulsion and manoeuvring of the PCV on the seabed.
• Collection of nodules.
• Transfer of nodules up the riser pipe to the surface vessel.
• Separation and retention of nodules from entrained water and sediment on the surface vessel.
• Release of entrained seawater and sediment through a return pipe at a depth of approximately 1,200 m.
• Recovery of riser pipe and PCV to the surface vessel.
3.3 Site Location
NORI-D is located in the eastern Pacific Ocean and is bounded by the Clarion Fracture Zone to the north and the Clipperton Fracture Zone to the south. Collectively the area is called the Clarion-Clipperton Zone

Document Number: FINAL
Revision: V20
Revision Date: 24 September, 2021
Page 3-2
(CCZ). The CCZ spans 4.5-million-km2 Hawaii and Mexico. Most of the polymetallic nodule exploration contracts issued by the ISA in the Pacific are in this region.
NORI-D is approximately 1,600 km offshore from the nearest landmass in the south-eastern part of the CCZ. It covers an area of 25,160 km2 with water depths ranging between 3,000 and 4,600 m.
The centre of NORI-D is approximately 11°N and 117°W.
3.3.1 Collector Test Area The testing will be conducted within the Collector Test Area (CTA) located in the southwest part of NORI-D. The CTA covers an area of 150 km2 (10x15 km) and water depths are between 4,248 m and 4,336 m.
The location of the CTA was selected to be representative of target mining areas within NORI-D in terms of bathymetry, water depth, nodule type, nodule distribution, geoform, and slope. CTA selection is based on the following rationale:
• Located in the abyssal plain domain which constitutes the majority of NORI-D and is characterised by gentle slopes of 0˚ to 6˚ and nodules lying on soft sediment. Nodules are observed to be ubiquitous in this domain wherever surveyed and sampled. The abyssal plains are considered to be a highly prospective domain for nodules and constitute the majority of the target mining areas within NORI-D (AMC, 2020).
• NORI-D site is characterised by undulating seafloor topography with a mean slope of 2°; the mean slope of the CTA is <4° trending towards the mean for the site as a whole. (slope analysis is based on EM120 Bathymetric data (collected by Williamson & Associates, 2012) and is mapped at 50m resolution).
• Water depth across NORI-D ranges from 3,000 – 4,600 m, with a mean of 4,325 m. The CTA is at 4,200 m.
• Three broad classes of nodule distribution at seafloor have been identified from NORI-D. Type 1 nodule distribution facies are typically characterised by >50% nodules (by area of coverage). The majority of these nodules are medium-sized (1-10 cm) and closely packed, with many nodules in contact with their neighbours. Type 1 facies were the most dominant type observed on the site during the 2018 and 2019 campaigns and are well represented in the CTA. Type 1 facies are the prime mining target.
• Applying the “Clustering Large Applications” (CLARA) (Kaufman and Rousseeuw, 1990) algorithm to physical data collected for NORI-D resolved an eight-cluster geoform classification (including, seamounts, bathymetric highs, bathymetric lows, and flat plains). Within each geoform key compartments were identified (e.g., slopes associated with abyssal hills, depressions within bathymetric lows, seamount sub-features, etc). At this scale, biological communities are expected to be organised in response to abiotic type (Dunson et al. 1991). The CTA is located in the abyssal (flat) plains geoform (and presumably a habitat type), that is well represented throughout NORI-D.
3.3.2 Test Field Within the CTA, the testing will be conducted in a 2km x 4km Test Field (TF), this will be the only area of the seabed to be directly impacted by the PCV.
Areas of the CTA outside of the TF may be indirectly impacted by sedimentation or deterioration of water quality.

Document Number: FINAL
Revision: V20
Revision Date: 24 September, 2021
Page 3-3
The information used to select the CTA was also used to identify suitable TFs on which to conduct the collector test. A “Go/No-Go” map was prepared and used to determine the most suitable part of the CTA to conduct the collector test with the lowest potential for environmental impacts. The findings of the assessment are summarised below:
• Nine potentially suitable TFs (contiguous areas of adequate size, that is, 2km x 4km minimum) were identified using a maximum slope constraint of 4° (Figure 3-1).
• The identified fields differ in their location, size, orientation, and site conditions.
• The majority of potential TFs are typically 1.5 km - 2.5 km wide and 4km - 7km long.
• Field No 6 was selected in view of its size (2 km x 4 km), considered to have a moderate impact on future commercial operations. Figure 3-1 shows the Test Field (TF) selected for the collector test operation. Bathymetry data was acquired by AUV during Campaign 3 and gridded at 27cm (Figure 3-2).
3.3.3 Impact Reference Zone ISA recommendations include the delineation of an Impact Reference Zone (IRZ) for the impact assessment of mining activities (ISBA/25/LTC/6/Rev.1.[VI7.C.38[o]). The IRZ should be a site where the mining activities and related direct impacts have previously occurred. It is intended that the TF and parts of the wider CTA are designated as IRZs after collector test activities are complete. A post-test long-term monitoring program for the IRZ will be included in the EMMP developed for submission with the application for the exploitation contract.

Docum
ent Num
ber: FIN
AL
Revision:
V20
Revision D
ate: 24 S
eptember, 2021
P
age 3-4 Figure 3-1.
CTA
selection constraints analysis

Docum
ent Num
ber: FIN
AL
Revision:
V20
Revision D
ate: 24 S
eptember, 2021
P
age 3-5 Figure 3-2.
Test Field bathymetry (27cm
grid)

Document Number: FINAL
Revision: V20
Revision Date: 24 September, 2021
Page 3-6
3.3.4 Preservation Reference Zone ISA recommendations identify Preservation Reference Zones (PRZs) as being important in identifying natural variations in environmental conditions against which impacts of the mining tests can be assessed.
A PRZ should be representative of the pre-mining condition so that impacts in mined areas can be benchmarked against it. Therefore, it is important that the composition and condition of the biotic and abiotic components of the PRZ are representative of those of the pre-mined IRZ, including comparable species composition. The PRZ should be established during exploration test-mining and located within the contractor’s lease area if possible (ISBA/25/LTC/6/Rev.1[Annex1.67]). The relative locations of the NORI-D IRZ and primary PRZ are shown in Figure 3-3. Suitable areas for secondary control sites for Before-After-Control-Impact (BACI) monitoring studies are currently being explored as part of the operational ESIA studies.
Figure 3-3. Bathymetric map of NORI-D showing relative locations of the CTA and PRZ
The PRZ was selected based on the following characteristics:
• Distance from the IRZ. ISA recommendations state that the preservation reference zone should be carefully located and far enough away (from the IRZ) not to be affected by testing activities, including effects from seabed-disturbance and discharge plumes.
The PRZ is located approximately 100 km from the IRZ and remains within the boundaries of NORI-D. This is considered to be a sufficient distance not to be impacted by mining activities, as per ISA recommendations. Recent autonomous underwater vehicle (AUV) measurements of artificial benthic plume generation found that suspended sediment concentrations reduced to a level similar to the background concentrations (order of 10 µg/l) at a distance of around 1 km from the source (Spearman et al., 2020). Furthermore, laboratory experimentation reveals that

Document Number: FINAL
Revision: V20
Revision Date: 24 September, 2021
Page 3-7
flocculation would lead to rapid deposition, restricting heavy sediment blanketing to a smaller fall-out area near the source (Gillard et al., 2019). Similar results have been shown through benthic plume modelling conducted for NORI-D (see Section 7.2.2.3(d)).
• Species Composition. ISA recommendations state that the species composition of the IRZ and the PRZ should be comparable (ISBA/25/LTC/6/Rev.1[VI7.C.38[o]). “Clustering Large Applications” (CLARA) (Kaufman and Rousseeuw, 1990) has been applied to the NORI-D lease which resolved an eight-cluster geoform classification; biological communities are expected to be organised in response to abiotic geoform type at this scale, for example, following the nodule facies classification of biotic and abiotic heterogeneity described in Tilot (2010). The PRZ represents five geoform types, including that represented in the IRZ (white dotted area Figure 3-3).
Analysis of the abundance of the major macrofaunal groups collected from box-cores on Campaign 5A suggests that at a coarse level of resolution, the IRZ sites are broadly similar to the PRZ (see Section 6.3.2). Additional data will be available late 2021.
• Geochemistry. Multicore samples were collected from the IRZ and PRZ areas during Campaign 5A (October to December 2020). Analysis of the samples compared the following parameters between sites, nodule types (areas with Type 1 and Type 2 nodules), and geoforms (abyssal plain and hills):
o Aerobic microbial respiration - consumes oxygen from overlying seawater. o Nitrate (NO3-), Nitrite (NO2-), Ammonia (NH4+), Phosphate (PO43-) produced from
degradation of organic matter. o Silica (SiO2) dissolution from sediments/biogenic opal. o Phosphate (PO43-) adsorption to iron and manganese minerals. o Nitrate (NO3-) at depth with nodule type or geoform. o Nitrate (NO3-) and Silica (SiO2) with depth between sites. o Alkalinity.
Preliminary results found no evidence to suggest differences in key geochemical parameters across test sites (University of Leeds, UK, pers comm) suggesting that the geochemistry of the PRZ is representative of the IRZ.
• Size. The PRZ should be large enough to include representative biota, habitats, biodiversity, and ecological function potentially impacted by mining, and take into account the geographical ranges of the biota present. The proposed PRZ is 750 km2, five times the size of the 150 km2 IRZ. The PRZ encompasses all the habitat types that could be impacted by future mining operations, not just the collector test, providing multiple undisturbed points of reference for all vulnerable habitat types.
• Longevity. The PRZ will be maintained for the duration of the commercial contract, including the closure plan period.
• Location. ISA recommendations state that PRZs should be located within the contractor’s area if possible (ISBA/25/LTC/6/Rev.1.[VI7.C.38[o]). The proposed site of the PRZ is within the NORI-D lease area.
The suitability of the selected PRZ will be assessed against the above criteria as part of the operational ESIA; the size, location, or format (e.g., one large site or multiple smaller sites) of the PRZ may be changed in response to the findings of the studies if necessary.

Document Number: FINAL
Revision: V20
Revision Date: 24 September, 2021
Page 3-8
3.4 Collector Test Components
The equipment developed for collector test will leverage advances made in the offshore oil and gas, telecommunications, and dredging industries. Proven technology, such as the dynamically positioned surface vessel, ROVs, electric motors, pumps, riser pipes, hydraulic systems, and umbilical power cables, will be directly transferable to the collector system. The exception to this is the PCV which has been designed and built specifically for the collection of polymetallic nodules.
The main components of the test collector system are:
• Surface Support Vessel (SSV). A dynamically positioned ship that will accommodate the PCV, ROV and associated launch and recovery systems. The riser system, dewatering plant, and nodule storage will also be housed on the SSV.
• Prototype collector vehicle (PCV). The PCV (also referred to as ‘the collector’), will be a tracked vehicle that uses suction technology to collect nodules from the seafloor. It will be controlled from the surface vessel via an umbilical.
• Riser and Return. The riser system will transport nodules collected at the seabed to the SSV using an air lift system. A return pipe will discharge entrained water and sediment separated from nodules at the surface at a depth of -1,200 m.
• Remotely Operated Vehicle (ROV). A support system used to conduct visual and sonar surveys, monitor the PCV, attach the riser system, and to provide assistance to the PCV as needed.
• Umbilicals. An umbilical will be used on both the PCV and the ROV to power and control the subsea equipment from the SSV. When the PCV and ROV are operating, the umbilical(s) will extend from the SSV to the seafloor.
Figure 3-4 shows how the SSV, riser, return pipe, and collector will be connected during system testing.

Document Number: FINAL
Revision: V20
Revision Date: 24 September, 2021
Page 3-9
Figure 3-4. Nodule Collection System
Source: Allseas (2020)

Document Number: FINAL
Revision: V20
Revision Date: 24 September, 2021
Page 3-10
3.4.1 Surface Support Vessel The SSV will be the converted drill ship Hidden Gem (Figure 3-5). The ship is single hulled with a carrying capacity of 61,042 t DWT. Current draught is reported to be 16 m, with an overall length of 228 m and a width of 42 m.
The vessel will be capable of supporting mining activities and launching and recovering all subsea equipment (e.g., the PCV, riser system, ROV) in conditions up to sea state 5 (where significant wave heights2 can reach 3.5 m).
Dynamic positioning (DP) will enable the vessel to hold position and follow the PCV as it moves along the seafloor. Acoustic long baseline (LBL) transponders deployed on the seafloor will provide the SSV with information on the location of the PCV and ensure that all components of the system are within operational limits.
A dewatering plant will be fitted to the vessel that will separate nodules from seawater.
Figure 3-5 Mining Vessel Hidden Gem
3.4.2 Prototype Collector Vehicle Polymetallic nodules will be collected from the seafloor using a PCV currently under development by Allseas Group S.A. based in Delft, Netherlands (www.allseas.com) (Figure 3-6).
2 The average height (trough to crest) of the one-third of the largest waves.

Document Number: FINAL
Revision: V20
Revision Date: 24 September, 2021
Page 3-11
Figure 3-6. Rendering of Prototype Collector Vehicle
The PCV has been designed to collect nodules from the seafloor and transfer them to the base of the riser system which transports them to the SSV. The PCV design has been structured around five core functions that the vehicle must be capable of executing in order to collect and transfer nodules:
• Nodule pick-up
• Nodule processing system (at seabed)
• Nodule transfer to surface
• Propulsion
• Docking, launch and recovery.
These core functions are provided by the following systems and components:
• Nodule collection system
• Nodule sorting system
• Riser system
• Return water system
• Propulsion system
• Structural frames
• Control system
• Power distribution
• Electrical and instrumentation
• Hydraulic actuation
• Control and automation
• Navigation
• Slurry monitoring
• Deployment and recovery system
• Weight balance
• Weight and buoyancy
The main components of the PCV shown in Figure 3-7.

Document Number: FINAL
Revision: V20
Revision Date: 24 September, 2021
Page 3-12
Figure 3-7 Main components of the Prototype Collector Vehicle
Source: • Source: Cellula Robotics Production Harverster Design Report, CRL-DCD15-RP-09 Rev R01
The dimensions of the PCV are:
• Length - 12 m
• Width - 6 m
• Height - 5 m
• Weight in air - 80 tonnes
• Weight on seabed - 14 tonnes
3.4.3 Nodule Collection System The nodule collection system is comprised of the components described below.
3.4.3.1 Pick-up Coandă Nozzle
The pick-up nozzles have been designed to utilize the Coandă effect – a tendency of a fluid jet to stay attached to a convex surface. The nozzle design utilizes a water jet and suction combination together with a convex nozzle head geometry to create lift from the Coandă effect (Figure 3-8). It is expected that this system will disturb the top 10-15 cm of sediment depending on the height of the nozzle above the seabed and the water jet and suction forces applied. An advantage of this design is that it minimises disturbance of the surface sediments, this will be verified during the collector test.
3.4.3.2 Height Adjustment System
The nodule collection system has been designed to be height adjustable. This allows distance between the nozzle head and the seabed to be varied in response to terrain and nodule size. Height adjustment
Figure 3-8. Coandă Nozzle

Document Number: FINAL
Revision: V20
Revision Date: 24 September, 2021
Page 3-13
also allows for fine tuning of the Coandă effect by changing the relative force of the water jet and suction combination on the seabed. The ability to fine tune in this manner will optimise the efficiency of nodule pick-up whilst minimising sediment disturbance.
The height adjustment system will consist of clearance arms mounted near the pick-up head (Figure 3-9), a hydraulic cylinder with stroke sensor, drag plate and encoder, ultrasonic altimeter, and overload protection system (cylinder pressure relief valve).
3.4.3.3 Pick-up Pumps
Multiple pick-up pumps powered by an electric motor will be used to create suction in the nozzle heads. The final design of the pump system will consist of either axial or radial flow pumps.
3.4.3.4 Nodule Processing System
The nodule processing system is designed to separate nodules from sediment inside the PCV. Special pump equipment is used for separating fines from the nodule flow stream, keeping as much sediment as possible at the seafloor. Figure 3-10 shows the general layout of the nodule processing system which will operate as follows:
• Seawater, sediment, and nodules are sucked into the PCV and pass through an 80 mm screen mesh. Any material that cannot pass through the screen mesh will be rejected and will remain on the seafloor. Finer nodules and sediment that pass through the screen will be pumped into a hopper.
• Inside the hopper, the bulk of sediment will be separated from the nodules and will be discharged behind the PCV via a diffuser system. This material will be discharged above the seafloor as a laminar flow.
• Nodules (and sediment that has not been separated) inside the hopper will settle into a buffer tank at the base of the hopper. Slurry material is then pumped up into a jumper hose for transfer to the riser pipe and the SSV.
Figure 3-9. Clearance Arms

Document Number: FINAL
Revision: V20
Revision Date: 24 September, 2021
Page 3-14
Figure 3-10. General layout of nodule processing system
Source: Allseas (2020). Arrows represent direction of nodule/sediment/water flow and dispersal.
3.4.3.5 Riser System
The riser system will pump nodules from the sea floor to the SSV. Entrained water separated from nodules during the dewatering process will be returned to the water column via a return pipe and discharged at 1,200 m (see Section 3.4.3.6). The riser system consists of the following components:
• Jumper hose. The jumper hose will consist of a 500m long flexible hose, that will connect the PCV to the base of the riser pipe. The jumper will be fitted with buoyancy and weight elements to achieve a lazy-S configuration to accommodate changes in horizontal and vertical distance between the PCV and the riser pipe during operations. The jumper hose connector and pivot swivel are the point of contact between the riser pipe and the PCV. A wet connection will be made on the sea floor with the aid of an ROV and a buoyant pull-in wire.
• Riser pipe. The riser pipe will consist of 27.4m (90 ft.) long sections of steel pipe. The sections, similar to those used for subsea drilling activities in the oil and gas industry, will be hoisted into position with a derrick tower onboard the mining vessel. They will be joined together and sequentially lowered to the seafloor. The riser joints will be pre-fitted with the air injection line and return water pipe.
• Air lift. An air lift line will be fitted to the riser pipe and will be used to inject compressed air at up to 200 bar into the riser pipe at 2,500 m (Figure 3-11). Air bubbles in the riser pipe will lift the large particle slurry material consisting of nodules, sediment, and seawater to the SSV. Sensors at the air injection point on the riser pipe will measure slurry flow rates; based on these measurements, airflow in the riser will be adjusted to maintain flow velocities above settling velocities so nodules do not fall back down the riser pipe.

Document Number: FINAL
Revision: V20
Revision Date: 24 September, 2021
Page 3-15
Figure 3-11. Air lift system
3.4.3.6 Return Water System (a) Return Water Discharge
During test runs of the integrated system, sediment and deep-sea water will be entrained into the riser pipe from the ocean floor and transferred to the surface as by-product of nodule harvesting. All entrained sediment, deep-sea water, and small nodule fragments will be returned to the ocean via a return water discharge.
Collector test operations generating return water discharge are necessary to provide the system engineers with important information relating to the optimum functional and environmental discharge depth for the fully operational system. Test operations generating a return water discharge will be of short duration (approx. 259 hours).
For the purposes of the collector test a 0.2 m (external) diameter return water pipe will be used to transport the discharge water to a depth of 1,200 m. The return water will be discharged vertically downwards at a rate of 0.0981 m3/s.
It should be noted that the optimal depth for return water discharge and the design of the discharge nozzle (i.e., vertical or horizontal discharge) are yet to be determined and are not limited by engineering constraints. Mid-water/seabed and vertical/horizontal discharge options will be considered as part of the operational ESIA. The optimal discharge depth and design will ultimately be decided based on an assessment of the engineering requirements and environmental impacts of the options under consideration.

Document Number: FINAL
Revision: V20
Revision Date: 24 September, 2021
Page 3-16
(b) Return Water Discharge Depth
For the purpose of the Collector Test return water will be discharged outside the core of the oxygen minimum zone (i.e., 100 to 700m; Section 5.7.5.3) and below the lower oxycline (700 to 800m) and the mesopelagic-bathypelagic interface (700 to 950 m Section 5.7.1) at a depth of 1,200 m (Figure 3-12). This is intended to minimise potential impacts to the mesopelagic zone and the potential of resuspending bottom sediments. A detailed rationale for this decision is provided in Appendix 1.
Figure 3-12. Proposed discharge depth for integrated system tests.
(c) Return Water Characteristics
• As per current design of the return water hose (internal diameter of 0.16 m), the discharge speed is 3.9 m/s (Allseas, 2021).
• The mean volumetric sediment concentration in the return water is 21.3 g/l assuming the specific sediment density of 2,500 kg/m3 (Allseas, 2021).
• A range of particle sizes in the return water is expected as per seabed grain size distribution at the collector test site. In addition, an unknown amount of nodule fines ≤3 mm (particle size rejection limit) may enter the return waterline. Degradation of nodules will likely occur during uplift in the airlift riser. Based on the dewatering plant recovery efficiency of 98%, as per base specifications, the sediment flow calculations assume a fraction of 2% by volume of uplifted nodule fines will be entrained in the return waterline (Allseas, 2021).
• The modelled temperature of discharge water within the return pipe between -5 m to -4,200 m is shown in Figure 3-13. At the buffer tank (after surface processing) the temperature is modelled
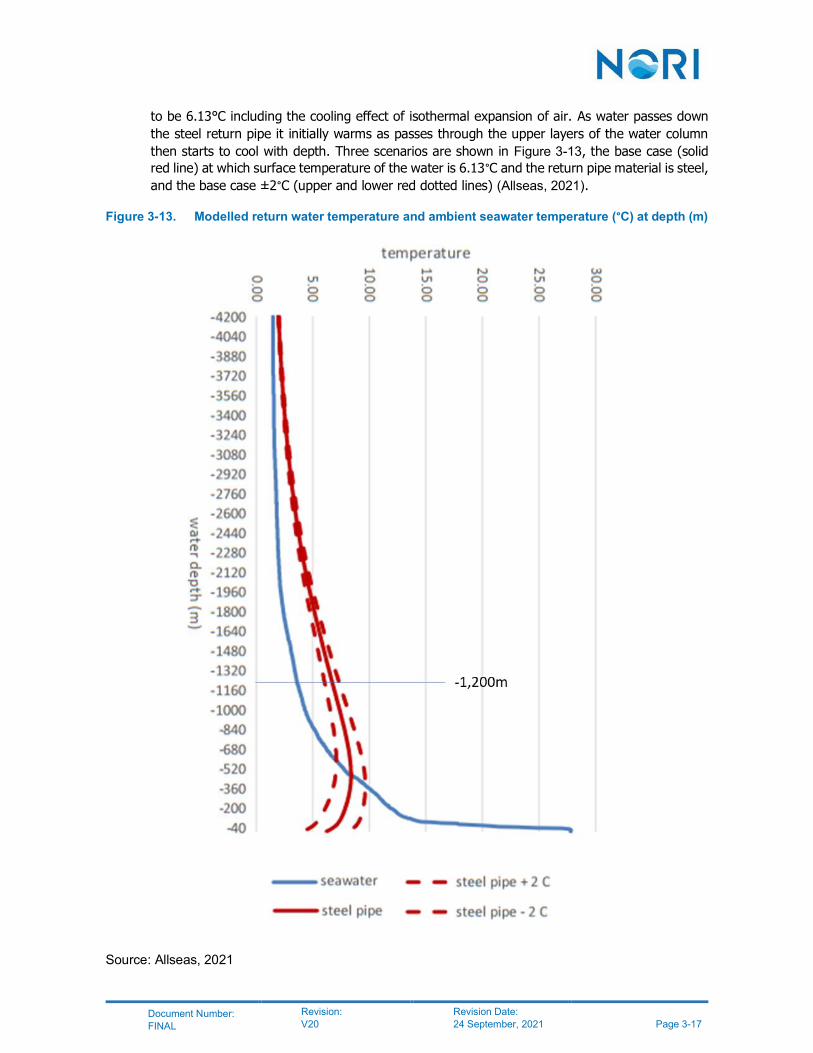
Document Number: FINAL
Revision: V20
Revision Date: 24 September, 2021
Page 3-17
to be 6.13°C including the cooling effect of isothermal expansion of air. As water passes down the steel return pipe it initially warms as passes through the upper layers of the water column then starts to cool with depth. Three scenarios are shown in Figure 3-13, the base case (solid red line) at which surface temperature of the water is 6.13°C and the return pipe material is steel, and the base case ±2°C (upper and lower red dotted lines) (Allseas, 2021).
Figure 3-13. Modelled return water temperature and ambient seawater temperature (°C) at depth (m)
Source: Allseas, 2021

Document Number: FINAL
Revision: V20
Revision Date: 24 September, 2021
Page 3-18
3.4.3.7 PCV Propulsion System
The PCV will move along the seafloor using a set of continuous tracks (Figure 3-14). The tracks will be 2 m wide, 6 m long at the base, and their outer edges will sit 6 m apart. The tracks will consist of a hydraulic motor, a gear box, a sprocket, and an encoder (speed sensor). A typical track design is shown in Figure 3-14.
Tracks will be fitted with water jets, powered by a dedicated pump, which will clean sediment from the outer track surface and inner sprocket path prior to ascending to the surface.
Figure 3-14. PCV track system (A); 2 m wide, 6m apart (B); 6 m long at the base (C)
The PCV will also be equipped with thrusters powered by a hydraulic motor (Figure 3-15A). The thrusters will be positioned at each corner of the PCV (Figure 3-15B) which are designed to aid with positioning of the PCV when suspended in the water column during deployment and recovery.
Figure 3-15. Thruster unit (A) and position on the PCV (B - dotted red circles)
3.4.3.8 Structural Frame
The chassis of the PCV will consist of structural frames supporting the propulsion and nodule processing systems, connecting the articulated height adjustable frame supporting the nozzles, and the lifting

Document Number: FINAL
Revision: V20
Revision Date: 24 September, 2021
Page 3-19
interface which will provide a secure connection with the umbilical. The frame will be constructed of either steel or aluminium with each material offering pro’s and con’s in terms of weight, stiffness, and cost.
3.4.3.9 Electrical & Instrumentation
The PCV will be powered from the surface via an umbilical. It is expected that the onboard power system will consist of: 1x320kW hydraulic power unit; 1x200kW hydraulic power unit; 2x200kW electric motor pumps; and a 15kW control unit. The total power draw of the PCV will be approximately 1 MW.
A synthetic armoured umbilical will power and communicate with the PCV. The umbilical will consist of a combination of fibre optic, power conducting, strengthening, and armouring cables and sheaths. The exact configuration of the umbilical has not been finalised at the time of writing.
3.4.3.10 Hydraulic Actuation
An onboard hydraulic system will be used to drive the tracks, thrusters, concentrator pump, rejector jet pump, track jet pump, collector height cylinders, collector rotation cylinder, and the diffuser pumps. The hydraulic system will consist of a hydraulic power unit, bellow compensators, valve pack and headers and piping to receiving components.
3.4.3.11 Control & Automation
The onboard automation system will control the various functions of the PCV, including:
• Process system power
• Collector head
• Nodule transport • Thrust
• Tracks
• Track tension • Track navigation controls
The information from the onboard automation system will be fed to a manned control van (Figure 3-16) onboard the surface vessel, similar to that used for an ROV setup. From here, the deployment, recovery, and operation of the PCV will be monitored and real time adjustments made in response to the data feedback.
Figure 3-16. PCV surface control van setup
Source: Cellula Robotics Production Harverster Design Report, CRL-DCD15-RP-09 Rev R01

Document Number: FINAL
Revision: V20
Revision Date: 24 September, 2021
Page 3-20
3.4.3.12 Navigation System
The PCV will orientate on the seabed using a multicomponent navigation system. This will be comprised of doppler velocity log (DVL), inertial navigation system (INS); front looking multibeam echosounder (F-L MBES); down looking multibeam echosounder (D-L MBES); long baseline (LBL) acoustic positioning system, ultrashort baseline (USBL) acoustic positioning system.
The DVL will be positioned over undisturbed ground forwards of the collector to give operators a view of the resource collection. The F-L MBES will provide information on the terrain in front of the PCV.
The configuration of the navigation system components is shown in Figure 3-17.
Figure 3-17. PCV navigation system
3.4.3.13 Slurry Monitoring
The slurry monitoring system will measure the large particle slurry at various points in the nodule processing system. The slurry monitoring system will consist of several meters including, an ultrasonic (volumetric) flow meter, an electrical impedance slurry density meter, and an ultrasound altimeter. The meters will receive and process information from various sensors, including pressure sensors, position sensors, flow sensors, filling level altimeter (in buffer), speed sensor, density sensor, and temperature sensor.

Document Number: FINAL
Revision: V20
Revision Date: 24 September, 2021
Page 3-21
3.4.3.14 Docking Launch & Recovery System
The PCV will be launched and recovered from the surface vessel with the use of a deck/skid-mounted overside launch-and-recovery system (LARS) to enable the safe, precise handling of the PCV in all weather conditions and sea states.
An articulated and fully dampened snubber will used to provide increased load security and full load rotation (Figure 3-18).
Figure 3-18. Snubber configuration
3.5 Collector Test
The collector test in the CCZ will be conducted immediately following a Sea Acceptance Trial (SAT) and the Harbour Acceptance Trial (HAT) in the Atlantic (location TBD) to sea-trial the functionality of the system in shallow water before the deep-water commissioning test in the CCZ. This sequencing of shallow and deep-water tests provides opportunity for teething problems in the system to be addressed prior to deep-water testing.
The collector test program will consist of the following sequence of activities:
1. Transit to Collector Test Area
2. Offshore Inspection and Preparation
3. PCV Deployment
4. Jumper and Riser Deployment
5. Riser Commissioning
6. Subsea Connection of Jumper on PCV
7. System Testing
8. Emergency Shutdown Testing
9. Riser and PCV Recovery
10. Transit from Test Site

Document Number: FINAL
Revision: V20
Revision Date: 24 September, 2021
Page 3-22
3.5.1 Transit to Collector Test Area The SSV (converted drill ship Hidden Gem) and an accompanying scientific research vessel (yet to be identified) will transit from the port of San Diego, USA. to NORI-D; approximately a five-day transit by sea. There is no access by helicopter to NORI-D. Once on site the vessel will position itself on the CTA.
3.5.2 Offshore Inspection & Preparation The first task to be conducted on arrival at the CTA will be a field inspection and examination of the seafloor at the TF using the ROV to ensure the landing sites are suitable for the equipment. This will include:
• Arrive at TF
• Pre-dive checks and system verification
• Deployment of ROV/Basket to seabed - track beacon position
• Deployment of first sparse LBL array beacon and undertake subsea positioning verification
• Deployment of remaining LBL beacons and perform SLAM once array is installed
• ROV undertakes pre-survey whilst the PCV is being deployed.
Field inspection and preparation will require positioning equipment and the ROV. This task is expected to take 20 hours to complete.
3.5.3 PCV Deployment The PCV will be deployed and recovered using a bespoke LARS designed to accommodate the 80 tonnes weight of the PCV. The system consists of rails that guide the PCV down the side of the vessel and through the splash zone before being released from the cursor frame prior to descent. This is a six-step process summarised in Figure 3-19.
i. Skidding in launch position (A)
ii. Lowering the collector with the cursor winch through the splash zone (B)
iii. Disconnect collector from the cursor frame (C)
iv. Subsea lowering (D)
v. Collector touchdown (E)
vi. Collector on seabed (F)
The steps for recovery are the same steps as for deployment but in reversed order.

Document Number: FINAL
Revision: V20
Revision Date: 24 September, 2021
Page 3-23
Figure 3-19. PCV deployment and recovery sequence
When lowering the PCV through the splash zone, the vessel heading will be adjusted such that the LARS is on the lee side, and wave shielding is provided to the LARS. This is done to reduce the splash zone loads, as illustrated in Figure 3-20. When the PCV has passed through the splash zone, the heading will be adjusted to bow incoming waves again.
Figure 3-20. Design to provide wave shielding during lowering through the splash zone

Document Number: FINAL
Revision: V20
Revision Date: 24 September, 2021
Page 3-24
3.5.4 Jumper & Riser Deployment The riser deployment is conducted in two parts:
1. Jumper hose deployment
2. Riser deployment, which consists of multiple riser joints (lengths) and connections (Figure 3-21). Some joints have special functionality, these are called the “riser specials”, from bottom to top:
o Riser base
o Air injection piece
o Diameter transitions
o Stress joint
o Riser head
For deployment and recovery, the riser specials are not treated any differently than the riser joints. During riser deployment, the sensor line is attached to the riser. The sensor line connects the junction boxes on the riser specials to each other (daisy chained) and to the vessel. When the riser is deployed, the riser commissioning sub-task commences. This involves connection of the riser systems to the vessel systems and pre-operation checks are conducted.
3.5.4.1 Jumper Hose Deployment
The jumper hose will consist of a 500 m flexible hose with a “lazy S” shape. The jumper hose will be installed from a reel over the side of the vessel. The upper part of the jumper will be lowered from the reel and keel-hauled through the moonpool and connected to the riser base. The riser and jumper will be lowered to reduce the risk of jumper damage. The lower part of the jumper will be lowered using a lift cable also mounted to the reel. The jumper will be pre-fitted with buoyancy and weight elements to achieve the “lazy-S” configuration when afloat.
To enable recovery, a messenger wire will be pre-mounted on the lower part of the jumper, the base case is to have assistance by ROV, although recovery can be done without an ROV if necessary.
3.5.4.2 Riser Deployment
The riser joints (Figure 3-21) will be pre-assembled with the air injection line and the return line assembled to the load carrying production line, similar to a production riser used in the oil and gas drilling industry. The joints have a length of 27.4m (90 ft.) each.
Upending the riser joints is done with an established method used by the drilling industry. The equipment for this procedure is already installed on former drill ship Hidden Gem.

Document Number: FINAL
Revision: V20
Revision Date: 24 September, 2021
Page 3-25
Figure 3-21. Riser joints
A riser joint is loaded on to trolley cradle and skate moved towards the moon pool. The riser is upended by hanging it from the riser running tool that is suspended from the top drive. The riser is lowered/pulled up with a winch. When the desired position is reached, the arms of the lifting tool are lowered to support the riser. The riser running tool is disconnected to pick up the next riser joint to be installed.
During running and pulling of the riser joints, a sensor line will be piggybacked on to the joints, the riser joints feature special clamps for this purpose. The purpose of the sensor line is to transmit the signals from the sensors on the riser specials to the controller station on the SSV.
3.5.5 Riser Commissioning Riser commissioning involves the following tasks:
1. The sensor line is routed over drill floor to the connector of the controller station and protected in a cable tray.
2. The air pressure hose is skidded/hoisted into place and connected to the hard piping on the vessel and to the stress joint (top joint of the riser) or to a point below the drill floor.
3. Leak testing and locking of the pressure hose. This is a safety precaution, as the pressure hose is 3–4-inch inner diameter and contains up to 200 bar compressed air.
4. The riser head is skidded/hoisted over the end of the riser and secured to the drill floor and end of the riser.
5. The hose to connect riser head to dewatering plant is skidded / hoisted in place and connected.
Riser and jumper hose are now in ‘disconnect’ state: suspended and ready for operation, but not connected with the PCV.

Document Number: FINAL
Revision: V20
Revision Date: 24 September, 2021
Page 3-26
3.5.6 Subsea Connection of Jumper on PCV The subsea connection procedure consists of the following tasks:
1. The PCV is positioned close to the jumper hose connector, based on the current, the SSV will adopt a heading and position such that:
o The jumper S-shape is close to the PCV.
o The PCV umbilical does not clash with the riser and the jumper hose.
2. ROV attaches pull-in wire on the jumper hose. The ROV is launched to make the connection, extra attention should be paid to avoid entanglement. The connection hook located on the top of the PCV is pulled up by means of releasing buoyancy and paying out with the winch. The pull-in wire is paid out until it reaches the approximate height of the connector on the jumper hose, which is floating in its neutral position (Figure 3-22). Next, the ROV connects the hook of the pull-in wire on the jumper hose. The wire is connected approximately 10 m above the hose connector, to allow some slack for final positioning.
Figure 3-22. Connection configuration
3. The jumper hose is pulled down to the PCV. The ROV guides the jumper connector on the hose in the horizontal plane, while the wire pulls in the hose.
4. Connection is made. The wire is routed via the buoyancy at the top of the pivot swivel. The pivot swivel on the PCV will therefore face in the direction of the hose connector. The jumper connector is kept in position (locked) with three cylinders. The conical shape allows for ~15 deg misalignment.
5. Jumper hose is disconnected by retracting the locking cylinders. For controlled ascent of the jumper hose (hose is buoyant at connected position) the cable will be used (inverse of connection procedure).
For emergency disconnection, releasing pressure to the cylinders and pulling by the hose is expected to be enough to release the connection.

Document Number: FINAL
Revision: V20
Revision Date: 24 September, 2021
Page 3-27
In case of PCV black-out, a ROV operated valve can release the pressure to the locking cylinder.
In case of jumper hose overloading, (unexpected) high pulling force, pressure relief valve is activated, and hose is disconnected as well.
6. Once the connection is fixed the pull-in wire is released by the ROV. After this the ROV can be recovered.
3.5.7 Collector test operations Once field inspection and preparation are complete (estimated to take approximately 20 hours), the PCV will be lowered to the seafloor and manoeuvrability and pick-up tests will be conducted.
3.5.7.1 Manoeuvrability Test Runs (HTR.1)
Manoeuvrability tests (without nodule collection) will be conducted to confirm the PCV can move across the seafloor as required and loads on the umbilical connecting the PCV to the mining vessel are within design specifications.
The following manoeuvrability tests will be conducted as shown in Figure 3-23:
• Straight line test. The PCV will be driven in a straight line at various speeds. A distance of approximately 3km will be travelled during this test,
• Turning test. The PCV turning capabilities will be tested over a distance of approximately 1km by turning the PCV as follows:
o Manoeuvring the PCV through a 90°, 200 m radius turn at 0.1 m/s.
o Manoeuvring the PCV through a 90°, 200 m radius turn at 0.3 m/s.
o Manoeuvring the PCV through a 90°, 100 m radius turn at 0.1 m/s.
o Manoeuvring the PCV through a 90°, 50 m radius turn at 0.05 m/s.
o Manoeuvring the PCV through a 180°, 30 m radius turn at 0.05 m/s.
o Manoeuvring the PCV through a 180°, 3 m radius turn at 0.05 m/s.
• Obstacle avoidance test. The PCV will be driven along a straight line and then around virtual test objects to test obstacle avoidance capability on the seafloor (e.g., rock outcrops) and then return to the straight line. A distance of less than 2km will be travelled during this test.
• Lane tracking test. The PCV will be driven along a straight line and then turned through 180° and driven along a parallel line to the initial line to test the PCV navigation and positioning system capabilities. During this test a distance of less than 2km will be travelled.
The manoeuvrability test runs are expected to take approximately 4 days to complete and the PCV will travel a distance of approximately 8 km. During manoeuvrability tests, the PCV will not be collecting nodules and the riser system will not be deployed.

Document Number: FINAL
Revision: V20
Revision Date: 24 September, 2021
Page 3-28
Figure 3-23. Test runs
Notes: Productive runs (nodules collected and transported to surface) – grey; non-productive runs (nodules not collected OR not transported to surface) – blue. Source: After Allseas (2020)
3.5.7.2 Pick-up Test Runs (HTR.2)
This component will test the ability of the PCV to collect nodules from the seafloor. The PCV will not be connected to the riser system and nodules and sediments that are collected will be discharged behind the vehicle and remain on the seafloor. (i.e., nodules will be displaced, no nodule production will take place)
The following pick-up test runs will be conducted:
• First pick-up test. The PCV will be driven in a straight line at various speeds. Pick-up nozzles will be raised off the seafloor and pumps and nozzle height adjustment systems will be tested. A distance of approximately 3km will be travelled during this test.
• Pick-up test during turning. This will be a similar test as the first pick-up test but will include the PCV turning through a 180°. Several hundred meters will be travelled during this test.
• Pick-up efficiency test. The PCV will be driven in a straight line and nodules will be collected to measure and fine-tune pick-up efficiency. The test will then be repeated at a different speed. Nodules and sediment collected during this test will be returned to the seafloor. A distance of approximately 3km will be travelled during this test.

Document Number: FINAL
Revision: V20
Revision Date: 24 September, 2021
Page 3-29
• Pick-up performance test with turning. The PCV will collect nodules as it is driven along a straight line, through a 180° turn and then back along a parallel like to test performance during turning. A distance of approximately 3km will be travelled during this test.
The pick-up test runs are expected to take approximately 5.5 days to complete and the PCV will travel a total distance of approximately 10 km.
3.5.7.3 Riser Installation & Commissioning Test
After the riser system is installed, functional testing of the system will occur. Testing will include pumping seawater from approximately -4,200 m to the SSV and then pumping seawater via the return water pipe to 1,200 m where it will be discharged.
Riser installation and commissioning is estimated to take approximately 8 days to complete.
3.5.7.4 System Integration Test
During the system integration test the jumper hose will be fitted to the PCV and the riser system. The SSV position and orientation relative to the PCV will then be changed to test the loads and performance of the umbilical, jumper hose and riser system under various operational conditions.
The system integration test is estimated to take approximately 1 day.
3.5.7.5 System Test Runs
System test runs will take approximately 13.5 days to complete and will test the manoeuvrability and productivity of the full system that is: the PCV, jumper hose, riser system and SSV all connected. Commissioning test runs, nominal performance test runs and advanced test runs will be undertaken, this phase of nodule production will last approximately 259 hours during which approximately 3,600 wet tons of nodules will be collected and pumped to the surface.
The system test runs shown in Figure 3-23 are described below.
i. Commissioning Test Runs (STR 1a and 1b)
• Manoeuvrability test with no nodule production. The PCV will be driven a total estimated distance of 6.5km along two lines as follows:
o Line 1. The PCV will be driven along a straight line at various speeds. The SSV will be offset to avoid horizontal forces on the PCV or will be used to aid propulsion. This will test the ability of the PCV, jumper hose, riser system and SSV to move in a straight line as an integrated system.
o Line 2. Turns and obstacle avoidance will be tested along this line to confirm the integrated system can manoeuvre over the seafloor.
• Nodule production ramp-up. The PCV will be driven along four straight lines, each one parallel to the previous line with a total estimated distanced travelled of 12.5km. Collection of nodules will increase with each line from minimum capacity (Line 1) through to low (Line 2), nominal (Line 3) and then full capacity (Line 4). During the Line 4 run, the PCV speed will be increased to a speed at which stable nodule production is achieved.
During commissioning test runs the PCV will travel a distance of approximately 19 km.
ii. Nominal Performance Test Runs (STR 2a and 2b)
The following nominal performance test runs will be performed:

Document Number: FINAL
Revision: V20
Revision Date: 24 September, 2021
Page 3-30
• Straight line performance test. A number of straight lines will be run, followed by a 180° turn at each end. Line spacing between lines will gradually be decreased while nodule production is ramped up. During this test the PCV will travel an estimated distance of 9.5 km.
• Contour mining test. The collector system will be moved along pre-defined contour lines. The PCV turning radius will be increasing or decreasing to assess variable collection conditions. An estimated distance of 22.5km will be travelled during this test.
During nominal performance test runs the PCV will travel a distance of approximately 32km.
iii. Advanced Test Runs
The following advanced test runs will be conducted:
• 150% capacity test runs. The PCV will be driven along a series of straight lines while collection rate is continuously increased to a safe maximum of approximately 150%. This will test maximum capacity of the system. A distance of approximately 6.5km will be travelled.
• Slope stability test runs. The PCV will be driven along a series of straight lines with inclined seafloor slopes exceeding 4° to test the system performance along uneven terrain. During this test an estimated distance of 7.0 km will be travelled.
During the advanced test runs the PCV will travel a distance of approximately 13.5km.
The PCV will travel a total linear distance of 82.5 km across the test field in completing all the trials described above. The tracks of the PCV are 6m across (see Section 3.4.3.7). The absolute location of each of the HTR’s and STR’s is not known and will be subject to TF bathymetry and prevailing operating conditions. However, they will take place within the bounds of the test field; the cumulative disturbance footprint from these operations will be approximately 0.492km2 (approx. 0.5km2) representing 0.0019% of the NORI-D lease (Figure 3-24).
3.5.8 Emergency Shutdown Testing Controlled shutdown of the system will be performed to emulate an emergency shutdown. This will assist in understanding the procedures required for an emergency shutdown and the length of time such an actual event would take.
The emergency shutdown test will be performed over a period of 1 day.
3.5.9 Riser & PCV Recovery When all tests are complete the jumper and riser will be disconnected from the PCV, the riser system will be dismantled and recovered to the mining vessel along with the PCV and all other seafloor components. The sequence of activities for recovery of the riser and PCV are as described for deployment in reverse.
Decommissioning and site closure are expected to take 63 hours.
3.5.10 Transit From Test Site Following successful riser and PCV recovery the SSV will leave the CTA and return to San Diego.
3.6 Workforce
The Project will have a workforce of approximately 80 personnel, comprising vessel crew, system operators, scientists, contractors, NORI personnel and potentially ISA or Nauru observers. The Project will operate 24 hrs/day split across two 12-hour shifts.

Docum
ent Num
ber: FIN
AL
Revision:
V20
Revision D
ate: 24 S
eptember, 2021
P
age 3-31
Figure 3-24. A
pproximate im
pact footprint from collector test operations in relation to (A
) the wider N
OR
I-D contract area and (B
) collector test area (C
TA) and Test Field (TF).
Collector Test A
rea (CTA
)150km
2N
OR
I-D25,160km
2
Test Field8km
2
Cum
ulative footprint of P
CV
tracks0.5km
2
Potential
sedimentation
cover 6km
2
AB

Document Number: FINAL
Revision: V20
Revision Date: 24 September, 2021
Page 3-32
3.7 Project Duration
The Project will commence with a transit from San Diego to NORI-D that will take approximately five days to reach site.
At the time of writing a tentative start date for the test is July 2022 for a duration of approximately 60 days. Figure 3-25 outlines the sequencing and duration of tasks, all timings are approximate and subject to change.

Document Number: FINAL
Revision: V20
Revision Date: 24 September, 2021
Page 3-33
Figure 3-25. Sequencing and duration of collector test tasks
Source: AllSeas, 2020

Document Number: FINAL
Revision: V20
Revision Date: 24 September, 2021
Page 4-1
4 IMPACT ASSESSMENT METHODS
4.1 Introduction
This section describes the methods used to identify potential risks and significant impacts to the marine environment from the collector test. Impacts occur at the points of interaction between project related activities and the receiving environment. These points of interaction are termed ‘Environmental Effects’ defined in the draft Exploitation Regulations as “any consequences in the Marine Environment arising from the conduct of Exploitation activities, whether positive, negative, direct, indirect, temporary, or permanent, or cumulative effect arising over time or in combination with other mining impacts”.
To assess significant impacts the environmental effects of the project must first be described. This requires characterization of the project activities and the Valued Ecosystem Components (VECs) represented in the receiving environment.
4.2 Significant Impacts
An environmental impact is defined as the effect a project related activity has on the receiving environment; the effect can be positive, negative, or neutral, and range from low to high in extent or duration. A ‘significant impact’ occurs if an environmental effect causes a change in a VEC that is deemed unacceptable by the regulating body or relevant authority. In the context of the ISA recommendations, a significant impact would have potential to cause ‘serious harm’ to the marine environment (ISBA/25/LTC/6/Rev.1(II)).
The concept of significance is at the core of impact identification, prediction, evaluation and decision-making. Deciding whether the project is likely to cause significant adverse environmental effects is the core objective of the collector test EIA.
The concept of significance remains largely undefined and there is no international consensus on a single definition or process for assigning thresholds of significance (CEAA, 1992).
For the purposes of this EIA the following process was applied to collect information required make an informed determination of significance:
1. Identification of activities associated with the project that may be sources of impact.
2. Identification and characterization of VECs represented in the receiving environment.
3. Characterization of environmental effects, that is, points of interaction between project related activities and VECs.
4. Assessment of environmental effects to determine if any are likely to result in significant impacts based on the anticipated magnitude of the impacting activity and the sensitivity of the impacted VEC.
For Step 4 an approach proposed by the Canadian Environmental Agency (1992) was used which assigns significance based on whether environmental impacts are adverse, significant and likely as defined in Table 4-1.

Document Number: FINAL
Revision: V20
Revision Date: 24 September, 2021
Page 4-1
Table 4-1. Approach used by Canadian Environmental Agency (1992) to determine if environmental impacts are adverse, significant, and likely.
STEP CRITERIA
Step 1 Deciding whether the environmental effects are adverse
The quality of the existing environment is compared with the predicted quality of the environment once the project is in place.
Step 2 Deciding whether the adverse environmental effects are significant
Criteria used are: • Magnitude • Geographic extent • Duration and frequency • Degree to which the adverse environmental effects
are reversible or irreversible. • Ecological context
Step 3
Deciding whether the significant adverse environmental effects are likely
Criteria used are: • Probability of occurrence • Scientific uncertainty
The central question for the regulator when assessing the findings presented in this EIS is whether the any of the impacts associated with the collector can be considered adverse, significant and likely.
4.3 Project Related Activities
Based on the description of the collector test operations provided Allseas (summarised in Section 3.5), the following project related activities have been identified as potential sources of impact:
• Transit to Collector Test Area
• Offshore inspection and preparation
o Pre-dive checks and system verification
o Deployment of ROV/basket to seabed
o Deployment of first LBL array beacons subsea positioning verification
o Deployment of remaining LBL beacons and SLAM
• PCV deployment
o Parking position
o Skidding in launch position
o Lowering the PCV with the cursor winch through the splash zone
o Disconnect PCV from the cursor frame
o Subsea lowering
o PCV touchdown
• Jumper and riser deployment
o Jumper hose deployment
o Riser deployment
• Riser commissioning

Document Number: FINAL
Revision: V20
Revision Date: 24 September, 2021
Page 4-2
o Sensor line routing over drill floor
o Air pressure hose skidded/hoisted into place and connected
o Leak testing and locking of the pressure hose
o Hose to connect riser head to dewatering plant is skidded/hoisted/connected
o Riser head is skidded/hoisted over the end of the riser
• Subsea connection of jumper on PCV
o Collector placed close to the jumper hose
o ROV attaches pull-in wire on jumper hose
o Connector is pulled down
o Connection is made
o Pull-in wire is disconnected
o Disconnect Jumper hose
• Operations
o Manoeuvrability test runs
o Pick-up test runs
o Riser installation and commissioning test
o System integration test
o System test runs
• Emergency shutdown testing
• Riser and PCV recovery
o Jumper hose recovery
o Riser recovery
o PCV recovery
• Transit from test site
The tasks associated with each activity are described in Section 3 (Project Description) and the potential impacts that the tasks may pose to the physicochemical and biological VECs of the receiving environment VECs are described in detail in Section 6. An understanding of each task, the equipment used and how it will be operated, is necessary to accurately assess the extent, frequency and duration of potentially impacting activities.
4.4 Valued Ecosystem Components
Valued Ecosystem Components (VECs) are defined as any part of the receiving environment that is considered important by the proponent, public, scientists, and government (or regulator) involved in the assessment process. Importance may be determined on the basis of cultural values or scientific concern. (Hegmann et al., 1999).
VECs can be identified once there is an understanding of: (i) the project works and activities; (ii) the environment likely to be affected; and (iii) the potential interactions between project works and activities and the environment (environmental effects).

Document Number: FINAL
Revision: V20
Revision Date: 24 September, 2021
Page 4-3
The following physicochemical and biological VECs have been identified as being relevant to the collector test.
Physical
• Acoustic quality (noise)
• Vibration
• Air quality
• Water quality
• Light
Chemical
• Sediment geochemistry
Biological
• Birds
• Cetaceans/Turtles
• Nekton
• Phytoplankton
• Zooplankton
• Microbes
• Sediment biota
• Nodule Biota
• Sediment habitat quality
• Nodule habitat quality
4.5 Environmental Effects
Characterization of project related activities has identified 34 tasks as potential sources of impact, and 25 vulnerable VECs, distributed through the atmospheric, euphotic, mesopelagic, bathypelagic, and abyssal zones. In total, 850 (34x25) potential interaction points were entered into a Leopold Matrix (Table 4-2), of which 103 were considered to be environmental effects with potential to cause impact. It should be noted that the Leopold Matrix has been used to identify interaction points only, the relative significance impacts is addressed in subsequent sections
The environmental effects are distributed amongst the zones and activities at the frequencies shown in Table 4-3 and Table 4-4. This information demonstrates that the highest proportion of vulnerable VECs are located in the abyssal and bathypelagic zones and most of the potential impacts are associated with System Testing. This information has been used to focus the EIA on the most relevant points of interaction.
.

Document Number: FINAL
Revision: V20
Revision Date: 24 September, 2021
Page 4-4
Table 4-2. Leopold Matrix
Pre-dive checks and system verification
Deployment of ROV/Basket to seabed
Deployment of first Sparse LBL array beacons subsea positioning verification
Deployment of remaining LBL beacons and SLAM
Parking Position
Skidding in Launch Position
Lowering the PCV with the cursor winch through the splash zone
Disconnect PCV from the cursor frame
Subsea lowering
PHV touchdown
Jumper hose deployment
Riser deployment
Sensor line routed over drill floor
Air pressure hose is skidded / hoisted into place and connected
Leak testing and locking of the pressure hose
Hose to connect riser head to dewatering plant is skidded / hoisted / connected
Riser head is skidded / hoisted over the end of the riser
Collector placed close to the jumper hose
ROV attaches pull-in wire on jumper hose
Connector is pulled down
Connection is made
Pull-in wire is disconnected
Disconnect Jumper hose
Manoeuvrability Test Runs
Pick-up Test Runs
Riser Installation and Commissioning Test
System Integration Test
System Test Runs
Jumper hose recovery
Riser recovery
PCV recovery
Zone↓
VEC↓
12
34
56
78
910
1112
1314
1516
1718
1920
2122
2324
2526
2728
2930
3132
3334
Noise / V
ibration / Light1
Air Q
uality / GH
G E
missions
2
Cetaceans / Turtles
31
41
11
11
11
11
11
11
11
11
4
Nekton
4
Phytoplankton
5
Zooplankton6
Water Q
uality7
1 4
1 1
1 1
1 1
1 1
Noise / V
ibration8
Cetaceans
9
Nekton
10
Zooplankton1
1
Water Q
uality1
2
Noise / V
ibration / Light1
3
Nekton
14
1 2
1 2
Zooplankton1
51
21
2
Water Q
uality1
61
11
11
11
21
21
1
Noise / V
ibration / Light1
7
Nekton
18
1 2
1 2
Zooplankton1
91
21
2
Microbes
20
2 1
1 2
1 2
Water Q
uality2
11
11
11
11
11
21
11
21
1
Noise / V
ibration / Light2
21
1
Benthic B
iota2
32
12
12
12
12
11
21
2
Sedim
ent Geochem
istry2
42
11
21
2
Benthic H
abitat Quality
25
2 1
2 1
2 1
2 1
2 1
1 2
1 2
40
7103
103
System Testing
Emergency Shutdown Testing
Riser and PCV Recovery
Transit From Collector Test Area
TASK →
ACTIVITY →
Transit to Collector Test Area
Offshore Inspection and
PreparationPCV Deploym
entJum
per and Riser
Deployment
Riser Comm
issioning
Abyssal
(4000-6000m)
Bathypelagic
(1000-4000m)
Euphotic
(0-200m)
Mesopelagic
(200-1000m)
Subsea Connection of Jumper on PCV
Atm
ospheric
43
15
←TOTAL NUMBER OF ENVIRONMENTAL EFFECTS
TOTA
L NU
MBER O
F ENV
IRON
MEN
TAL EFFECTS→
10
78
63
823
11
17
44

Document Number: FINAL
Revision: V20
Revision Date: 24 September, 2021
Page 4-5
Table 4-3. Environmental effects per zone ZONE NUMBER OF ENVIRONMENTAL EFFECTS
Atmospheric 8
Euphotic (0-200 m) 23
Mesopelagic (200-1,000 m) 11
Bathypelagic (1,000-4,000 m), and 17
Abyssal (4,000-6,000 m; inc. benthos) 44
TOTAL 103
Table 4-4. Environmental effects per project related activity ACTIVITY NUMBER OF ENVIRONMENTAL EFFECTS
Transit to Collector Test Area 4
Offshore inspection and preparation 10
PCV Deployment 7
Jumper and riser deployment 8
Riser commissioning 6
Subsea connection of jumper on PCV 3
System Testing 43
Emergency shutdown testing 0
Riser and PCV recovery 15
Transit from test site 7
TOTAL 103
Table 4-5 describes the project activities, vulnerable VECs and potential impact pathways.
Table 4-5. Activities, valued ecosystem components, and impact pathways ACTIVITY VULNERABLE VECS IMPACT PATHWAYS
Transit of the vessel from San Diego to the CCZ
Air quality/GHG Vessel’s diesel engines will emit fumes into the atmosphere reducing local air quality and contributing to GHG emissions.
Noise/vibration/light Vessel’s diesel engines will generate noise and vibrations which could disturb birds, cetaceans, and turtles. Vessel will emit light.
Cetaceans/turtles Vessel strike on cetaceans or turtles
Water quality Intentional or accidental release of pollutants from the vessels could negatively impact water quality
Offshore Inspection and Preparation
Water quality
Leakage of hydraulic fluids, oil, or other substances from the ROV could negatively impact water quality throughout the water column during its descent to the seabed.

Document Number: FINAL
Revision: V20
Revision Date: 24 September, 2021
Page 4-6
ACTIVITY VULNERABLE VECS IMPACT PATHWAYS
Noise/vibration/light Deployment of ROV top the seabed has potential to generate noise, vibration, and light.
Benthic Biota
(sediment, nodule, free swimming)
Deployment of the ROV and other equipment (inc. LBL network) to the seabed has the potential to physically disturb sediment and nodule dwelling animals.
Benthic Habitat Quality Deployment of other equipment (inc. LBL network) to the seabed will physically disturb benthic habitat by creating contours in the sediment.
PCV Deployment
Cetaceans/Turtles Lowering the PCV through the splash zone could disturb or physically strike cetaceans or turtles that are in close proximity to the vessel.
Water Quality Leakage of hydraulic fluids, oil, or other substances from the PCV could negatively impact water quality throughout the water column during subsea lowering.
Benthic Biota (sediment, nodule, free swimming)
Touchdown of the PCV on the seabed will physically disturb, displace or kill sediment and nodule dwelling animals.
Benthic Habitat Quality Touchdown of the PCV on the seabed will physically disturb the benthic habitat by creating contours in the sediment and/or moving or crushing nodules.
Jumper and Riser Deployment
Cetaceans/Turtles
Lowering the jumper and riser tubes through the splash zone has the potential to disturb or physically strike cetaceans or turtles that are in close proximity to the vessel.
Water Quality
Leakage of hydraulic fluids, oil, or other substances from the ROV during manipulation of the jumper or riser could negatively impact water quality throughout the water column.
Riser Commissioning Noise/Vibration
Surface and/or subsea noise or vibrations caused by pressure testing of the riser pipe could disturb birds, cetaceans, and turtles.
Cetaceans/Turtles Surface and/or subsea noise or vibrations caused by pressure testing of the riser pipe could disturb birds, cetaceans, and turtles
Subsea Connection of Jumper on PCV
Water Quality
Leakage of hydraulic fluids, oil, or other substances from the ROV during connection of the jumper on the PCV could negatively impact water quality throughout the water column.

Document Number: FINAL
Revision: V20
Revision Date: 24 September, 2021
Page 4-7
ACTIVITY VULNERABLE VECS IMPACT PATHWAYS
System Testing
Cetaceans/Turtles
Riser installation and commissioning tests, system integration testing, and system test runs all have the potential to create noise and vibration disturbances at the surface and throughout the water column from use of the air lift and through pressure testing of the system which could disturb diving and foraging behaviour.
Microbes
Manoeuvring the PCV on the seabed, pick-up test runs, and system test runs will physically disturb the sediments and nodules potentially disrupting the microbial community structure in the surface layers of the sediment, and seafloor metabolic activity
Water Quality
Manoeuvring the PCV on the seabed, pick-up test runs, and system test runs will physically disturb the sediments and nodules creating a sediment plume and potentially mobilizing particle-bound nutrients and trace metals.
Noise/Vibration/Light
Manoeuvring the PCV on the seabed and pick-up test runs will create noise and vibration which could disturb or displace motile large macrofauna. Riser installation and commissioning tests, system integration testing, and system test runs all have the potential to create noise and vibration disturbances at the surface and throughout the water column from use of the air lift and through pressure testing of the system. PCV will emit light.
Benthic Biota (sediment, nodule, free swimming)
Manoeuvring the PCV on the seabed and pick-up test runs will create noise and vibration which could disturb or displace motile large macrofauna.
Riser installation and commissioning tests, system integration testing, and system test runs all have the potential to create noise and vibration disturbances at the surface and throughout the water column from use of the air lift and through pressure testing of the system. PCV will emit light.
Manoeuvring the PCV on the seabed and pick-up test runs will physically disturb or remove sediment and nodule dwelling animals.
System test runs will create a benthic plume, as entrained sediment is ejected from the rear of the PCV; this plume will be denser than that formed during the manoeuvrability and pick-up test runs and will blanket and smother surrounding sessile biota.
Sediment Geochemistry Manoeuvring the PCV on the seabed, pick-up test runs, and system test runs will mix the surface layers of the sediment, disrupting oxygen concentration gradients in

Document Number: FINAL
Revision: V20
Revision Date: 24 September, 2021
Page 4-8
ACTIVITY VULNERABLE VECS IMPACT PATHWAYS the surface layers and potentially mobilizing particle-bound nutrients and trace metals.
Benthic Habitat Quality
Manoeuvring the PCV on the seabed and pick-up test runs will physically disturb the benthic habitat by creating contours in the sediment, disrupting surface layers of sediment, and/or moving or crushing nodules.
System test runs will create a benthic plume, as entrained sediment is ejected from the rear of the PCV; this plume will be denser than that formed during the manoeuvrability and pick-up test runs and will blanket and smother surrounding sessile biota.
Nekton
Nekton in the mesopelagic and bathypelagic zones could be impacted by noise and vibration from the air lift system and by suspended sediment and mobilized chemicals released from the return water pipe outlet at 1,200 m.
Zooplankton
Zooplankton in the euphotic, pelagic and bathypelagic zones could be impacted by noise and vibration from the air lift system and by suspended sediment and mobilized chemicals released from the return water pipe outlet at 1,200 m.
Water Quality
Water quality in the bathypelagic zone and below could be impacted by increased turbidity caused by suspended sediments and mobilized chemicals released from the return water pipe outlet at 1,200 m.
Emergency Shutdown Testing N/A
There are no environmental aspects anticipated to be associated with the emergency shutdown testing of the system.
Riser and PCV Recovery
Cetaceans / Turtles Rising the jumper hose, riser pipe, and PCV through the splash zone could disturb or physically strike cetaceans or turtles that are in close proximity to the vessel.
Water Quality
A ROV will be used for recovery, leakage of hydraulic fluids, oil, or other substances from the ROV could negatively impact water quality throughout the water column.
Transit of the vessel from the CCZ to San Diego
As for previous transit As for previous transit

Document Number: FINAL
Revision: V20
Revision Date: 24 September, 2021
Page 4-9
4.5.1 Significant Impact Assessment Assessment of significant impacts requires an understanding of both the sensitivity of the VEC and the magnitude of the impact after management measures have been applied; a cross tabulation method has been used to assess significance as described by Percival et al. 1999.
4.5.1.1 Sensitivity & Magnitude
VEC sensitivity is assigned on the basis of its intrinsic value as well as its susceptibility or vulnerability to threatening processes. For the operational ESIA, sensitivity will be assigned based on data collected during baseline studies which will characterize key attributes such as existing condition, conservation status, rarity or uniqueness, replacement potential, and resilience to change. This level of detail is not available for the collector test as the baseline studies are not yet complete, and there remains a degree of uncertainty around the sensitivity of many of the VECs represented within NORI-D.
However, as both impact magnitude and VEC sensitivity are components of significance, it is possible to assess significance with confidence if a high level of control can be exerted over the magnitude (that is, extent, duration, or frequency) of impacting activities. The collector test has been designed to minimise the magnitude of impacts by:
• Restricting the TF to an area of just 8 km2 within the CTA, minimising the likelihood that the collector test will result in significant impacts by making the disturbance footprint very small relative to the size of NORI-D.
• Locating the CTA in the abyssal plain geoform which is well represented within NORI-D; minimising the likelihood for significant impacts, as VECs in the CTA are likely to be well represented in the other abyssal plain geoforms represented within NORI-D.
• Locating the return pipe outlet at 1,200 m to avoid the productive mesopelagic zone and sensitive mesopelagic/bathypelagic interface.
• Minimising system testing operations generating return water discharge to 259 hours.
Residual impacts refer to those environmental effects that are an inevitable consequence of the project activities that cannot be avoided or reduced any further by the application of mitigation measures. Of concern to regulators are significant residual impacts that cannot be minimised further with the application of mitigation measures.
Potential significant residual impacts have been assessed by considering the likely magnitude of an impact following the application of management measures and the sensitivity of the VEC using the descriptors in Table 4-6 and Table 4-7. Uncertainty has been accounted for in the assessment by assigning the maximum sensitivity score in circumstances where little or no information is available on how a VEC may respond to an impact.
Based on the anticipated magnitude of the impact and the sensitivity of the VEC, the significance of residual impact has been assessed using the criteria described in Table 4-8.
Table 4-6. Descriptions of impact magnitude MAGNITUDE (M)
1 Negligible - Impact is unlikely to occur, or the effect persists only for the duration of the impacting activity, and/or is restricted to the Test Field (including the overlying water column or atmosphere).
2 Small – Effect is temporary and persists for a short duration (weeks – months) after cessation of the impacting activity, and/or is mostly restricted to the CTA (including the overlying water column or atmosphere).

Document Number: FINAL
Revision: V20
Revision Date: 24 September, 2021
Page 4-10
3 Medium - Effect is temporary and persists for a long duration (years) after cessation of the impacting activity, and/or is restricted to NORI-D (including the overlying water column or atmosphere).
4 Large - Effect is permanent and extends beyond NORI-D (including the overlying water column or atmosphere).
Table 4-7. Descriptions of VEC sensitivity SENSITIVITY (S)
1 None - High probability that the impacted VEC is well represented throughout the CCZ.
2 Low - High probability that the impacted VEC is well represented throughout NORI-D.
3 Medium - High probability that the impacted VEC found only in the CTA.
4 High - High probability that the impacted VEC is found only in the Test Field OR there is uncertainty around the status or distribution of the VEC or it’s likely response to the impacting activity.
Table 4-8. Significance criteria SIGNIFICANCE SCORE (M*S)
1 - 4 Negligible - Very high probability that the impacted VEC is well represented throughout the CCZ. The proposed activities pose no threat to the long-term viability of the VEC at a regional scale. Not Significant.
5 - 8
Low - High probability that the impacted VEC is well represented throughout NORI-D. The proposed activities pose little threat to the long-term viability of the VEC within NORI-D. Not Significant – Impacts are reduced to a level that pose negligible threat to the receiving environment with the implementation of the proposed management measures.
9 - 12 Medium - High probability that the impacted VEC found only in the CTA. The proposed activities may pose a threat to long-term viability within NORI-D. Potentially Significant – Additional mitigation measures may be necessary.
13 - 16
High - High probability that the impacted VEC is found only in the Test field. Proposed activities will pose a threat to long-term viability within NORI-D and regionally OR there is insufficient information available on the sensitivity of the VEC to make an informed determination. Significant.
Using the criteria described above an assessment of the significance of the residual impacts of the project on the physicochemical and biological VECs is provided in Sections 7.5 and 8.3 respectively.
4.6 Cumulative Impacts
The definition of cumulative impacts adopted for this assessment is consistent with the IFC Good Practice Handbook for Cumulative Impact Assessment and Management (IFC, 2013), which states: “Cumulative impacts are those that result from the successive, incremental, and/or combined effects of an action, project, or activity when added to other existing, planned, and/or reasonably anticipated future ones.”
Furthermore, the IFC (2013) considers that: A cumulative impact assessment includes two components:
– The anticipated future condition, which is the total effect of the other existing, and predictable future developments and external natural environmental and social drivers, and

Document Number: FINAL
Revision: V20
Revision Date: 24 September, 2021
Page 4-11
– The contribution of the development under evaluation to the cumulative impacts.
This definition considers the additive impact of the primary activity (that is, the current Project) and third-party activities. Cumulative impact assessment requires taking into account existing or other projects planned in the foreseeable future, it is intended to overcome the deficiencies associated with the limited scope of an individual project-based environmental impact assessment.
Any contribution of the collector test to future cumulative impacts on NORI-D will be considered as part of the operational ESIA.
4.7 Major Hazards
A hazard is a situation with the potential for harm in terms of human injury or ill-health, damage to property, damage to the environment, or a combination of these. In the context of offshore projects hazards are often associated with chemical spills, fires, explosions and/or hazardous emissions.
While rare, such events may result in loss of life, environmental harm, asset loss and reputational damage. These are essentially unplanned events, to be anticipated as possibilities, for which preventative action and reactive responses are required. Potential major hazards and suggested management responses are described in Section 9.
4.7.1 Risk Assessment NORI has identified potential hazards associated with the collector test based on our knowledge of the activities, tasks, personnel and equipment required to implement the project and the receiving environment. Risk assessment is a three-step process:
1. Review of unplanned events that could impact on the environment.
2. Assessment of the potential hazards or threats that those activities might pose to the physical, biological or social/cultural environment.
3. Assessment of the risk posed by the hazards.
Potential unplanned impacts arising from Project related activities were assessed in terms of both likelihood and consequences if an impact were to occur. The risk assessment assumes the effective implementation of the proposed management measures. It then examines the residual likelihood of an impact occurring as a result of an incident or hazard, and the severity of the potential consequences.
The principles of risk management described in the following documents were adopted in the risk assessment method:
• AS/NZS ISO 31000:2009 Risk management – principles and guidelines (Standards Australia, 2009).
• SA/SNZ HB 436:2013 Risk management guidelines companion to AS/NZS 31000:2009 (Standards Australia, 2013).
• HB 203:2012 Managing environmental-related risk (Standards Australia, 2012).
Table 4-9 and Table 4-10 describe qualitative criteria developed to rank the likelihood and consequence of potential hazards. Consequences are defined in terms of – environment, health and safety, business reputation and financial loss.
The level of risk is assessed by combining likelihood and consequence in a matrix as per Table 4-11.

Document Number: FINAL
Revision: V20
Revision Date: 24 September, 2021
Page 4-12
Table 4-9. Qualitative criteria for likelihood RATING DESCRIPTION
Rare (A)
The impact may only occur in exceptional circumstances. Very rare occurrence (once per 1,000 years). Unlikely that it has occurred elsewhere and, if it has occurred, it is regarded as unique
Unlikely (B)
The impact could occur but is not expected. May be technically possible but extremely unusual. A rare occurrence (once per 100 years)
Possible (C)
The impact could occur, however has seldom occurred in similar operations. There is likely to be an impact on average every 5 to 20 years
Likely (D)
There is likely to be an impact on average every 1 to 5 years. Likely to have been a similar incident occurring in similar environments. The impact will probably occur in most circumstances
Almost certain (E)
The impact will occur, is of a continuous nature, or the likelihood is unknown. There is likely to be an impact at least once per year or more (up to 10 times per year). It often occurs in similar environments. The impact is expected to occur in most circumstances
Table 4-10 Qualitative criteria for consequence
RATING HEALTH AND SAFETY ENVIRONMENT BUSINESS
REPUTATION FINANCIAL LOSS
None (0)
No injury or health effect No impact No impact No loss
Negligible (1) Minimal impact Minimal impact Minimal impact Minor financial loss
Minor (2) First-aid treatment
Minor local impact and/or regulatory notification required
Some impact Financial loss <1 million US$
Moderate (3) Medical treatment
Significant local environmental impact and/or regulatory intervention
Small to moderate impact
Financial loss 1 to 4 million US$
Major (4)
Extensive injury or hospitalisation
Significant ecological or cultural impact and/or regulatory intervention
Significant impact and/or national media exposure
Financial loss 4 to 40 million US$
Severe (5) Fatality
Critical ecological or cultural impact and/or regulatory intervention
Critical impact and/or international media exposure
Financial loss >40 million US$

Document Number: FINAL
Revision: V20
Revision Date: 24 September, 2021
Page 4-13
Table 4-11. Qualitative risk assessment matrix Likelihood A B C D E
Rare Unlikely Possible Likely Almost Certain
Consequence
0 None Low Low Low Low Low
1 Negligible Low Low Low Low Low 2 Minor Low Low Low Medium Medium 3 Moderate Low Low Medium Medium High 4 Major Low Medium Medium High High
5 Severe Medium Medium High High High
Low risk outcomes are considered to have been reduced to low as reasonably practicable (ALARP) by the implementation of the prescribed management measures.
Medium risk outcomes are also considered to have been reduced to ALARP by the implementation of the prescribed management measures, however, a degree of unresolved uncertainty may exist or the consequences of a realised risk are high. Monitoring of these operations will be a priority and they may be modified or suspended if unanticipated outcomes are observed.
High risk outcomes, activity should not proceed without the development of additional focused mitigation measures.
Using the criteria described above a risk assessment of potential hazards arising from the collector test is provided in Section 9.

Document Number: FINAL
Revision: V20
Revision Date: 24 September, 2021
Page 5-1
5 PHYSICOCHEMICAL ENVIRONMENT
5.1 General Setting
The Clarion-Clipperton Zone (CCZ) is a 4.5-million-km2 region in the northern part of the Central Pacific Ocean (Figure 5-1). This region is situated between the Clarion Fracture Zone to the north, the Clipperton Fracture Zone to the south, the Mathematician Ridge to the east and the Line Islands Ridge to the west, with the closest populated land mass being Manzanillo, Mexico, approximately 1,700 km to the northeast.
The vast areas of the CCZ are comprised of muddy-clay abyssal plains, punctuated by discrete deep-sea features such as seamounts. Water depths range from 4,000 m in the east to 6,500 m in the west (ISA, 2010).
5.2 NORI-D
The study area, NORI-D, is in the southeast sector of the CCZ and has an approximate area of 25,160 km2.
Isolated seamounts occur in the southern half of NORI-D, becoming larger and more prominent towards the southeast. The flanks of the seamounts are the steepest slopes encountered in NORI-D, ranging from 8° to near vertical in places. These geomorphologic structures are thought to be directly related to seafloor spreading from the East Pacific Rise (ISA, 2010a). Sedimentation and particulate organic carbon (POC) flux in the area is influenced by change in gradients and water depth, and potentially have an important controlling function on abundance and diversity of species (Golder Associates, 2018).
Water depths within NORI-D range from approximately 3,000 to 4,600 m, with a mean of 3,800 m. Water depths increase to the west of the area, with a range of 3,000 to 4,250 m in the east and 4,000 to 4,600 m in the west (Golder Associates, 2018).
5.3 Climate & Meteorology
NORI-D is located in the southern part of the subtropical sea pressure ridge of the North Pacific High and just north of the sea level pressure trough associated with the Intertropical Convergence Zone (ITCZ) (Golder Associates, 2018).
The climate is dominated by north-easterly trade winds from April to November. Seasonal discrepancies of sea level pressure, surface winds and rainfall reflect the seasonal change of the ITCZ and fluctuations of the Subtropical High. NORI-D is dominated by high sea level atmospheric pressure and low precipitation in the northern hemisphere spring, when the influence of the ITCZ is weakest due to it being close to the equator. In winter, the ITCZ is 10 degrees of latitude further north, and sea level atmospheric pressure is lower. Precipitation and cloud cover are sporadic, with winds persistently changing direction (Golder Associates, 2018). Sea surface temperatures are lowest during February and highest in August with average temperatures of 20 and 32ºC, respectively (BGR, 2019). The hurricane season starts in May with approximately one tropical storm event occurring per month. Storm counts subside in October but storms can occur as late as November.

Docum
ent Num
ber: FIN
AL
Revision:
V20
Revision D
ate: 24 S
eptember, 2021
P
age 5-2 Figure 5-1.
Location of the Clarion-C
lipperton Zone

Document Number: FINAL
Revision: V20
Revision Date: 24 September, 2021
Page 5-3
5.4 Ambient Air Quality
There is no known ambient air quality data available for NORI-D. Given the site is extremely remote, with the nearest land being over 1,700 km northeast (Manzanillo, Mexico), ambient air quality is assumed to be near pristine.
Ambient air quality pollutant measurements (e.g., carbon monoxide, nitrogen dioxide, sulphur dioxide, particulate matter) will be collected as part of the ongoing baseline studies.
5.5 Noise & Light
5.5.1 Anthropogenic Noise Passing shipping will be the main source of anthropogenic generated noise in NORI-D. However, shipping movements in the area are relatively few in comparison to other global shipping routes (Figure 5-2).
Figure 5-2. Shipping routes around the CCZ and NORI-D
Source: Flynn and Donnelly (2020). NORI-D represented by yellow rectangle, green squares represent areas of particular environmental interest, and pink polygons are contract areas.
5.5.1.1 Measured Ambient Noise Levels
Two static acoustic recorder (SAR) units were deployed from October 2019 to June 2010 on a mooring (Long Mooring in Figure 5-3) in NORI-D at water depths of 538 m and 4,297 m.
The SARs recorded sounds produced by cetaceans, fish and/or invertebrates (see Section 6.5), and anthropogenic activity including vessels and seismic airguns (CSA, 2020).
Non-biological sources of noise included anthropogenic noise such as passing vessels (Figure 5-4A), geophysical exploration activity (Figure 5-4B), along with unidentified noise.
Noise from waves and rain were recorded during the deployment period, while this noise was occasionally detected at the deep SAR, it was more prevalent at the shallow SAR (Figure 5-4C).
Ambient noise measurements will continue to be recorded as part of the ongoing baseline studies.

Docum
ent Num
ber: FIN
AL
Revision:
V20
Revision D
ate: 24 S
eptember, 2021
P
age 5-4 Figure 5-3.
NO
RI-D
oceanographic mooring deploym
ent and water quality sam
pling locations

Document Number: FINAL
Revision: V20
Revision Date: 24 September, 2021
Page 5-5
5.5.2 Anthropogenic Light NORI-D is located some 1,700 km from the nearest inhabited land mass, and the occurrence of artificial lighting within the upper water column is assumed to be absent, with the exception of occasional passing vessels.
Ambient light levels from SSVs will be measured as part of the ongoing baseline studies.
5.6 Physical Oceanography
5.6.1 Waves The CCZ is subject to South Pacific swells from winter storms. These storms produce swells from the south with long periods (14 to 22 s) and low amplitudes (approximately 1m) (BGR, 2019).
The region is dominated by northerly swells from November to March with largest amplitudes occurring in February. Smaller easterly and south-easterly swells occur from May. Waves generated by the north-eastern trade winds typically have periods of 5 s to 8 s with heights of 1m to 4m. Wave patterns tend to approach from the northeast, east or southeast (Dee et al, 2011).
Figure 5-4. Spectrograms from 538 m showing traces for sounds produced by passing vessels (A); geological exploration (B) and weather (C)

Document Number: FINAL
Revision: V20
Revision Date: 24 September, 2021
Page 5-6
Figure 5-5 shows the average monthly wave heights in the region. Highest waves occur in December and January, decreasing to lowest heights in October.
Figure 5-5. Average monthly wave heights in the CCZ
Source: Dee et al. (2011)
Six SOFAR spotter metocean buoys were deployed at NORI-D during Campaign 4A (2 - 23 October 2019) and two more were deployed during Campaign 4D (16 June – 15 July 2020) (Figure 5-6). These floating, free-drifting instruments recorded wind, wave and temperature data. Wind speeds of between 3.0 to 19 knots and wave heights from 1.3 to 2.8 m were recorded.
5.6.2 Tides Tides in the CCZ are mixed semi-diurnal, that is, there are two uneven tidal cycles per day (Aleynik, 2017).
5.6.3 Currents Upper ocean circulation within the CCZ is affected by trade winds and a system of large-scale currents (Demidova et al., 1993). Wind-driven upper ocean circulation in the central Pacific Ocean undergoes substantial variation in response to the shifting of the major wind systems. The six SOFAR surface drifters deployed during Campaign 4A all initially drifted south-eastward to eastward across the NORI-D block, with times of calm periods (circular drifting) until late-October 2019 when they left the block boundary and drifted north-westward, with a net westerly displacement towards the central Pacific Ocean (Figure 5-6).
Collection of current information will continue through the deployment of additional SOFAR drifters as part of the ongoing baseline studies.

Docum
ent Num
ber: FIN
AL
Revision:
V20
Revision D
ate: 24 S
eptember, 2021
P
age 5-7 Figure 5-6.
Drift tracks of the SO
FAR
spotters deployed during Cam
paign 4A (O
ctober 2019) and Cam
paign 4D (June 2020) in N
OR
I-D

Document Number: FINAL
Revision: V20
Revision Date: 24 September, 2021
Page 5-8
The eastern CCZ is influenced by the North Equatorial Current, with westward surface current speeds sometimes exceeding 20 cm/s. In boreal summers, surface currents weaken when the ITCZ and associated weak winds are further north.
Currents in the mesopelagic zone continue the westward flow but slow their speed considerably in May and October. In the bathypelagic zone currents are reversed, flowing eastward from February to June and westward for the remainder of the year (BGR, 2019).
Morgan et al. (1999) collated benthic current data from a number of studies in the CCZ and describes the following three benthic current regimes occurring in the region:
• Calm periods, characterised by minimal current speeds (0 to 3 cm/s), moderate to low variance, and low tidal activity with time intervals lasting about 11 days.
• Intermediate, mostly inertial-tidal periods characterised by the alteration of current speed (0 to 5 or 6 cm/s) with a corresponding increase in the variance of data.
• Active periods, associated with an initial sharp increase in current speed, which can maintain relatively stable speeds to produce 24-hour means up to 8 cm/s and 1-hour means between 13 and 15 cm/s. These events are termed ‘benthic storms’, which are regular (but not periodic) increases in current speed lasting from about one or two weeks to five or six weeks.
5.6.4 Metocean Data Three oceanographic moorings were deployed in NORI-D in October 2019, at the locations shown in Figure 5-3. The placement of the moorings was based upon the following criteria:
• Consideration of bathymetric features within NORI-D to ensure that the mooring design depth for scientific data collection is in accordance with ISA recommendations3.
• Establish representative baseline conditions of the water column in proximity to the collector test site with minimal disturbance to the test site.
• Establish baseline conditions for reference areas within NORI-D to provide a comparative assessment of potential impacts to the water column by activities conducted at the collector test site.
Scientific instrumentation attached to the moorings included:
• Conductivity-temperature-depth (CTD), turbidity, transmissivity, and dissolved oxygen sensors.
• Acoustic Doppler current profilers (ADCP) and Doppler velocity samplers (DVS).
• Acoustic hydrophone (SAR).
• Sediment traps.
• Seafloor camera system.
Mooring instrumentation is detailed in Table 5-1.
3 The type and placement of scientific instrumentation on the moorings is based upon, and compliant with, ISA recommendations for the assessment of the possible environmental impacts arising from exploration for polymetallic nodules (ISBA/16/LTC/7, ISBA/19/LTC/8).

Document Number: FINAL
Revision: V20
Revision Date: 24 September, 2021
Page 5-9
Table 5-1. Mooring depths and equipment
ZONE MOORING INSTRUMENTATION
LONG MOORING REFERENCE 1 REFERENCE 2
Oceanic Layer • (4,070-m-long mooring)
• (32-m-long mooring) • (552-m-long
mooring) Epipelagic Zone (0 to 200 m depth) • None • None • None
Mesopelagic Zone (200 to 1,000 m depth)
• RBR CTD • 2 x 75 kHz ADCP • SAR • SBE CTD
• None • None
Bathypelagic Zone (1,000 to 4,000 m depth)
• 2 x 300 kHz ADCP • 2 x Sediment trap • 2 x DVS current
meter • 2 x SBE CTD
• None • Sediment trap
Abyssopelagic Zone to Seafloor (4,000 to 4,320 m depth)
• 150 kHz ADCP • 300 kHz ADCP • SAR • 2 x SBE CTD • 600 kHz ADCP • DVS Current Meter
• 150 kHz ADCP • 300 kHz ADCP • Sediment Trap • 2 x Turbidity sensor • 600 kHz ADCP • SBE CTD • Baited camera
• 150 kHz ADCP • 150 kHz ADCP • 300 kHz ADCP • 2 x Turbidity sensor • 600 kHz ADCP • SBE CTD • Baited camera
Source: CSA, 2020. ADCP = acoustic Doppler current profiler; CTD = conductivity-temperature-depth; DVS = Doppler velocity sensor; SAR = static acoustic recorder; SBE = Sea-Bird Electronics.
Mooring instruments were positioned to capture data throughout the water column, and with a focus on the following:
• Upper water column, where most marine mammals and marine traffic will occur.
• Mid-water zone, where discharge return water will occur.
• Near-seafloor zone, where collection activities will occur.
Sediment traps were positioned in accordance with ISA recommendations, that is, at depths >1,000 m and 500 m above the seafloor, and with an additional sediment trap attached to one mooring at a height of 17 m above the seafloor.
During Campaign 6D, the moorings were recovered, serviced and redeployed, resulting in a metocean dataset covering the period 14 October 2019 to 26 June 2020.
Current roses generated for the upper water column (498 m depth), in the vicinity of the return water discharge depth (1,232 m depth) and near seafloor (4,321 m depth) at the Long Mooring site (Figure 5-3) are provided in Figure 5-7 and summarised below:
• Upper water column:
o Average current speeds were between 3.25 and 4.41 cm/s over the period of record.
o The dominant current direction was to the northeast, however current direction varied monthly, sometimes trending south (April 2020) or southeast (January, March 2020) (CSA, 2020).
• Vicinity of return water depth:
o Average current speeds were between 4.49 and 6.98 cm/s over the period of record.

Document Number: FINAL
Revision: V20
Revision Date: 24 September, 2021
Page 5-10
o While there was some month-to-month variation in current direction, for example, to the north (October 2019 and May 2020) or to the south (January 2020), the dominant direction was to the west.
• Near-seafloor:
o Average current speed varied between 2.16 and 3.16 cm/s over the period of record.
o The dominant current direction was to the northwest but did trend toward to the south in October 2019 and to the east in March 2020.
Metocean data will continue to be collected from the moorings as part of the ongoing baseline studies.
5.7 Water Quality
Seawater samples were collected at five stations (ND001 to ND005 on Figure 5-3 during Campaign 4A. Samples were collected at 16 discrete depths from each site (Table 5-2). Samples were analysed for nutrients, metals and metalloids, carbon, total suspended solids (TSS), alkalinity and chlorophyll-a (for water depths <1,150m). Analytical results are reported in CSA (2020) and are summarised in the following sections.
Table 5-2. Water sampling sites OCEANIC LIGHT
ZONE OCEANIC LAYER WATER SAMPLE DEPTH (m)
ND001 ND002 ND003 ND004 ND005
Euphotic Zone Epipelagic Zone (0 to 200 m)
30 30 30 30 30
100 100 100 100 100
190 190 190 190 190
Dysphotic Zone Mesopelagic Zone (200 to 1,000 m)
300 300 300 300 300
600 600 600 600 600
950 950 950 950 950
Aphotic Zone
Bathypelagic Zone (1,000 to 4,000 m)
1,150 1,150 1,150 1,150 1,150
1,250 1,250 1,250 1,250 1,250
1,500 1,500 1,500 1,500 1,500
1,750 1,750 1,750 1,750 1,750
2,500 2,500 2,500 2,500 2,500
3,500 3,500 3,500 3,500 3,500
Abyssopelagic Zone to seafloor (4,000 to 4,320 m)
4,007 4,085 4,047 3,970 4,011
4,057 4,135 4,097 4,020 4,061
4,107 4,185 4,147 4,070 4,111
4,157 4,235 4,197 4,120 4,161 Water depth at each site: ND001: 4,207 m, ND002: 4,285 m, ND003: 4,247 m, ND004: 4,170 m and ND005: 4,211 m.

Document Number: FINAL
Revision: V20
Revision Date: 24 September, 2021
Page 5-11
Figure 5-7. Current roses at 498 m (A), 1,232 m (B) and 4,321 m (C)
5.7.1 Nutrients Average concentrations of nitrogen and phosphorous compounds and silicon dioxide at various depths in the water column are provided in Table 5-3, with comparison also made to other locations in the CCZ and the broader Pacific Ocean.
All nutrient concentrations were lowest within the upper 30 m, while the highest average nitrite, nitrate, orthophosphate, and total phosphorous concentrations occurred below the core of the oxygen minimum zone (as defined in; Section 5.7.5.3) at sampling depths between 950 and 1,500 m (Table 5-3). Concentrations of orthophosphate were generally higher, although variable, at near-seafloor water depths below 4,000 m. The highest average silicon dioxide concentration was found below the oxygen minimum zone, at the 2,500 m sampling depth.

Document Number: FINAL
Revision: V20
Revision Date: 24 September, 2021
Page 5-12
Average nutrient concentrations throughout the water column were generally similar to concentrations, vertical profile trends, variability and nutrient maxima reported within the BGR contract area and regional reference values for the Pacific Ocean, but noticeably dissimilar to values reported by GSR (2018).
Table 5-3. Seawater nutrient concentrations in NORI-D, October 2019
WATER DEPTH (m)
TOTAL NITROGEN NITRATE NITRITE ORTHO-
PHOSPHATE TOTAL
PHOSPHATE SILICON DIOXIDE
AVERAGE CONCENTRATION ± STANDARD DEVIATION (μmol/l)
CSA (2020)
30 -- 2.14 ± 0.71 <1.4 0.34 ± 0.48 0.32 ± 0.18 1.47 ± 0.40
100 29.77 ± 1.85 24.56 ± 5.50 5.21 ± 3.91 2.59 ± 1.75 2.10 ± 0.98 16.37 ± 8.71
190 30.80 ± 0.95 26.42 ± 7.47 4.39 ± 7.39 2.91 ± 0.53 2.38 ± 0.42 21.88 ± 4.33
300 30.74 ± 2.00 25.48 ± 6.84 4.90 ± 5.73 2.93 ± 1.44 2.69 ± 0.68 28.79 ± 6.37
600 37.44 ± 1.12 28.99 ± 7.70 8.45 ± 8.68 3.43 ± 0.94 3.37 ± 0.39 60.29 ± 10.47
950 42.89 ± 1.39 35.70 ± 9.67 7.20 ± 10.41 3.43 ± 1.73 3.29 ± 0.38 94.84 ± 3.63
1,150 41.79 ± 0.94 36.98 ± 6.69 4.81 ± 6.28 4.15 ± 0.84 3.41 ± 0.08 112.35 ± 5.57
1,250 41.78 ± 1.11 38.27 ± 2.79 3.51 ± 3.06 4.49 ± 2.81 2.58 ± 1.15 113.45 ± 3.67
1,500 40.52 ± 1.26 45.98 ± 6.91 < 1.4 2.80 ± 0.82 3.28 ± 0.12 128.70 ± 4.02
1,750 38.87 ± 1.31 36.84 ± 10.35 2.03 ± 10.03 2.38 ± 1.08 2.63 ± 1.04 141.25 ± 8.00
2,500 36.64 ± 2.17 39.12 ± 8.15 < 1.4 2.32 ± 0.70 3.60 ± 1.04 155.96 ± 8.44
3,500 38.07 ± 7.62 34.41 ± 5.11 3.65 ± 10.61 2.17 ± 1.67 2.79 ± 0.10 147.10 ± 6.04
4,000 34.98 ± 0.99 32.98 ± 11.32 2.0 ± 11.46 4.15 ± 2.57 2.69 ± 0.10 148.00 ± 9.91
4,050 38.40 ± 8.68 22.56 ± 8.98 15.84 ± 11.45 3.64 ± 1.97 2.74 ± 0.21 149.73 ± 8.05
4,100 34.37 ± 1.51 25.56 ± 4.88 8.81 ± 5.20 3.94 ± 1.35 2.64 ± 0.17 146.07 ± 9.93
4,150 34.68 ± 2.06 23.56 ± 10.55 11.12 ± 12.35 2.40 ± 1.97 2.25 ± 0.98 148.37 ± 9.63
COMPARISON CONCENTRATION RANGES
CCZ
BGR (2019)
30–100 0.09–0.60 -- -- 0.10–0.37 -- 0.23–1.38 (as SiO4)
100–950 10.00–50.00 -- -- 0.50–3.00 -- 10.0–55.0 (as SiO4)
950–1,500 53.3–59.49 -- -- 2.78–3.17 -- 55.0–75.0 (as SiO4)
1,500 35.37–49.72 -- -- 2.04–2.64 -- 60.7–104.3 (as SiO4)
GSR (2018)
64 0.60–5.59 -- -- < 0.03–3.66 -- 3.91–264.7
490 0.55–6.14 -- -- < 0.03–4.38 -- 5.32–93.0
1,000 7.05–7.20 -- -- 4.65–4.86 -- 149.6–170.9
4,356 0.30–5.87 -- -- < 0.33–3.39 -- 5.78–240.2
Pacific Ocean
World Oceans Atlas (2018)
30–100 -- 0.00–7.50 -- 0.00–0.75 -- --
100–950 -- 0.00–42.63 -- 0.00–3.40 -- --
950–1,500 -- 28.14–45.13 -- 2.20–3.60 -- --
1,500–seafloor
-- 34.21–41.22 -- 2.30–3.30 -- --
5.7.2 Carbon Seawater samples were analysed for particulate carbon, total inorganic carbon (TIC), total organic carbon (TOC) and dissolved organic carbon (DOC). Average concentrations of particulate carbon (PC) and TIC are shown in Table 5-4.

Document Number: FINAL
Revision: V20
Revision Date: 24 September, 2021
Page 5-13
Table 5-4. Carbon concentrations in NORI-D, October 2019
WATER DEPTH (m) PARTICULATE CARBON
(μmol/kg) TOTAL INORGANIC CARBON
(μmol/kg)
AVERAGE ± STANDARD DEVIATION
30 12.99 ± 1.26 1,903 ± 22
100 12.66 ± 0.37 2,148 ± 12
190 12.66 ± 2.23 2,143 ± 49
300 11.99 ± 0.46 2,183 ± 23
600 11.99 ± 0.46 2,201 ± 48
950 10.99 ± 0.70 2,246 ± 19
1,150 12.32 ± 0.91 2,256 ± 14
1,250 11.66 ± 0.00 2,246 ± 31
1,500 11.99 ± 1.12 2,275 ± 23
1,750 12.16 ± 121 2,251 ± 46
2,500 12.82 ± 1.39 2,266 ± 55
3,500 11.49 ± 0.37 2,260 ± 41
4,000 11.82 ± 1.09 2,235 ± 31.5
4,050 11.32 ± 0.46 2,251 ± 16.2
4,100 11.99 ± 1.73 2,235 ± 54.5
4,150 11.99 ± 0.46 2,215 ± 42.5 Source: CSA (2020).
Average concentrations of particulate carbon were generally similar throughout the water column, ranging from 10.99±0.70 μmol/kg to 12.99±1.26 μmol/kg. Average concentrations of TIC were lowest within the upper 30 m (1,903 ± 22 μmol/kg) and relatively similar through the remainder of the water column, ranging from 2,143 to 2,275 μmol/kg.
While there is limited available data from the deep-sea regions of the Pacific Ocean for comparison, concentrations of TIC in NORI-D are consistent with values reported from deep-sea regions in the Atlantic and Indian Oceans (Lee et al., 2000).
Concentrations of TOC and DOC were below the laboratory limit of reporting (i.e., 83 μmol/kg) in all samples from all depths. Literature values for TOC and DOC concentrations reported within the central equatorial and eastern Pacific are similar (i.e., <83 μmol/kg) (Ogawa and Tanoue, 2003).
5.7.3 Total Suspended Solids, Alkalinity & Major Constituents Average concentrations of total suspended solids (TSS), alkalinity (including alkalinity normalised for salinity) and the major seawater constituents – sodium, sulfur and strontium – are shown in Table 5-5.
Table 5-5. TSS, alkalinity and major constituent concentrations in NORI-D, October 2019
WATER DEPTH
(M)
TSS (MG/L)
ALKALINITY (μmol/kg)
NORMALISED ALKALINITY
(μmol/kg)
SODIUM (mmol/kg)
SULFUR (mmol/kg)
STRONTIUM (μmol/kg)
AVERAGE ± STANDARD DEVIATION
30 4.46 ± 0.84 2,244 ± 41 2,332 ± 43 441.5 ± 44.9 37.05 ± 2.96 81.58 ± 2.41
100 3.03 ± 0.40 2,320 ± 40 2,333 ± 40 80.5 ± 28.7 39.68 ± 2.47 86.94 ± 3.12

Document Number: FINAL
Revision: V20
Revision Date: 24 September, 2021
Page 5-14
WATER DEPTH
(M)
TSS (MG/L)
ALKALINITY (μmol/kg)
NORMALISED ALKALINITY
(μmol/kg)
SODIUM (mmol/kg)
SULFUR (mmol/kg)
STRONTIUM (μmol/kg)
AVERAGE ± STANDARD DEVIATION
190 4.30 ± 1.90 2,324 ± 41 2,340 ± 41 473.4 ± 28.9 39.40 ± 1.90 86.28 ± 2.40
300 4.00 ± 1.18 2,332 ± 41 2,353 ± 42 62.9 ± 30.9 39.47 ± 2.10 85.67 ± 3.12
600 2.30 ± 0.98 2,368 ± 36 2,399 ± 37 465.5 ± 27.4 38.99 ± 1.73 84.47 ± 2.54
950 2.74 ± 0.62 2,396 ± 46 2,428 ± 46 464.6 ± 26.6 38.74 ± 2.25 83.93 ± 3.05
1,150 3.50 ± 1.37 2,416 ± 38 2,446 ± 39 476.8 ± 32.5 39.99 ± 2.82 83.19 ± 2.74
1,250 1.95 ± 1.32 2,428 ± 30 2,458 ± 31 465.5 ± 35.8 39.44 ± 2.35 82.66 ± 2.77
1,500 3.10 ± 1.31 2,424 ± 30 2,453 ± 30 475.1 ± 38.0 40.15 ± 2.55 83.23 ± 2.73
1,750 3.84 ± 0.51 2,436 ± 30 2,463 ± 30 470.3 ± 27.7 39.48 ± 2.12 82.97 ± 3.09
2,500 2.58 ± 1.71 2,444 ± 36 2,468 ± 36 469.5 ± 28.7 39.56 ± 2.46 83.54 ± 2.85
3,500 3.06 ± 1.24 2,444 ± 30 2,467 ± 30 463.7 ± 30.4 38.94 ± 2.18 82.71 ± 3.06
4,000 3.48 ± 1.20 2,448 ± 23 2,471 ± 23 483.4 ± 25.9 38.13 ± 2.51 82.48 ± 3.03
4,050 1.50 ± 0.50 2,452 ± 23 2,475 ± 23 461.5 ± 29.5 38.67 ± 2.23 83.11 ± 3.24
4,100 3.00 ± 1.57 2,448 ± 23 2,471 ± 23 467.3 ± 26.7 39.04 ± 2.51 83.59 ± 3.04
4,150 3.08 ± 1.99 2,456 ± 26 2,479 ± 26 468.8 ± 30.5 39.35 ± 2.54 83.05 ± 2.87 Source: CSA (2020).
Average TSS ranged from 1.5 to 4.5 mg/L with no discernible trend throughout the water column. There are no known reference values for TSS concentrations within the open waters of the Pacific Ocean; however, in 2015, Tonga Offshore Mining Limited (TOML) analysed water samples collected through the water column for TSS from a number of locations in the CCZ, including TOML Area F immediately to the west of NORI-D. Results show TSS concentrations ranged between 1 and 15 mg/L (TOML, 2015).
Unnormalized alkalinity concentrations were notably lower than normalised concentrations in the surface 30 m; however, concentrations were otherwise similar throughout the remainder of the water column. Average normalised alkalinity concentrations generally increased slightly with depth and ranged from 2,332 μmol/kg at 30 m to 2,479 μmol/kg at 4,150 m (50 m above seafloor). These concentrations were generally similar to comparable reference values for the equatorial Pacific (Key et al., 2004; Jiang et al., 2014).
Concentrations of sodium, sulfur and strontium were generally lower (or more variable) in the upper water column than >300 m.
Concentrations of the major seawater constituents were generally uniform from the near-surface to the seafloor and vertical profiles trends were comparable to reference values for the equatorial Pacific (Key et al., 2004; Jiang et al., 2014).
Chlorophyll-a concentrations were generally below the laboratory limit of reporting (i.e., 0.5 mg/m3). Consistent with these results, surface water concentrations of chlorophyll in the CCZ are reported to range from 0.1 to 0.2 mg/m3 in the east and 0.07 to 0.08 mg/m3 in the west (BGR, 2019; ISBA/16/LTC/7, 2010).
5.7.4 Metals & Metalloids Average concentrations of selected metals and metalloids are provided in Table 5-6 and Figure 5-8. Concentrations of aluminium, antimony, bismuth, cobalt, gold, iron, manganese, selenium and tellurium

Document Number: FINAL
Revision: V20
Revision Date: 24 September, 2021
Page 5-15
were below their respective laboratory limits of detection (i.e., 5.01 µg/L, 0.4 µg/L, 6.0 µg/L, 0.01 µg/L, 2.0 µg/L, 8.03 µg/L, 0.81 µg/L, 0.4 µg/L and 1.29 µg/L, respectively) and are not included in Table 5-6.
Trace metal concentrations were generally comparable to other reported values for the Pacific Ocean (Nameroff et al.,2002). Copper, molybdenum, uranium and vanadium showed variability at certain water depths which was generally due to elevated concentrations at one particular, but varying, sampling station.
While concentrations of zinc, lead and silver were highly variable, this was attributed to results being close to the laboratory detection limits (CSA, 2020).
Further sampling of these metals will be conducted as part of the ongoing baseline studies.
Table 5-6. Metal and metalloid (µg/L) concentrations NORI-D, October 2019
WATER DEPTH (m)
As Ba Cd Cr Cu Pb Hg
DETECTION LIMIT
0.06 0.41 0.003 0.02 0.02 0.02 0.0001
AVERAGE ± STANDARD DEVIATION
30 1.18 ± 0.05 4.33 ± 0.30 <3.01 0.18 ± 0.01 0.07 ± 0.02 63.88 ± 49.08 0.29 ± 0.04
100 1.50 ± 0.15 5.83 ± 2.23 61.11 ± 6.57 0.16 ± 0.03 0.09 ± 0.01 35.74 ± 8.69 0.28 ± 0.07
190 1.52 ± 0.07 5.69 ± 0.60 68.45 ± 6.72 0.18 ± 0.02 0.08 ± 0.03 34.13 ± 21.92 0.39 ± 0.05
300 1.55 ± 0.05 6.14 ± 0.22 72.39 ± 1.51 0.16 ± 0.00 0.07 ± 0.02 29.12 ± 8.41 0.34 ± 0.06
600 1.55 ± 0.08 9.02 ± 0.31 101.72 ± 1.64 0.18 ± 0.01 0.07 ± 0.01 27.08 ± 4.95 0.29 ± 0.07
950 1.48 ± 0.07 11.54 ± 0.48 107.10 ± 6.26 0.20 ± 0.02 0.09 ± 0.01 27.23 ± 6.39 0.30 ± 0.08
1,150 1.42 ± 0.13 13.88 ± 0.64 105.00 ± 5.71 0.23 ± 0.01 0.20 ± 0.19 53.20 ± 50.93 0.34 ± 0.06
1,250 1.46 ± 0.07 14.01 ± 0.49 106.94 ± 5.97 0.22 ± 0.01 0.12 ± 0.02 30.35 ± 9.64 0.32 ± 0.07
1,500 1.49 ± 0.17 15.85 ± 0.40 103.43 ± 3.33 0.24 ± 0.01 0.13 ± 0.02 44.58 ± 18.92 0.33 ± 0.01
1,750 1.46 ± 0.17 18.57 ± 2.06 99.75 ± 5.30 0.24 ± 0.01 0.14 ± 0.01 34.24 ± 11.72 0.34 ± 0.02
2,500 1.46 ± 0.16 17.12 ± 0.81 99.16 ± 5.16 0.25 ± 0.01 0.14 ± 0.01 25.53 ± 15.63 0.33 ± 0.03
3,500 1.43 ± 0.19 19.53 ± 0.71 90.74 ± 5.31 0.25 ± 0.02 0.19 ± 0.01 19.73 ± 9.90 0.39 ± 0.04
4,000 1.40 ± 0.21 20.25 ± 0.49 86.21 ± 2.24 0.24 ± 0.004 0.26 ± 0.01 18.65 ± 8.28 0.51 ± 0.08
4,050 1.45 ± 0.24 19.89 ± 0.22 85.63 ± 1.91 0.24 ± 0.01 0.29 ± 0.01 18.03 ± 7.88 0.55 ± 0.06
4,100 1.44 ± 0.23 19.67 ± 0.52 90.13 ± 10.73 0.24 ± 0.01 0.29 ± 0.01 36.64 ± 21.39 0.48 ± 0.08
4,150 1.46 ± 0.22 19.27 ± 0.61 83.05 ± 1.61 0.24 ± 0.01 0.28 ± 0.01 52.10 ± 61.36 0.54 ± 0.02
WATER DEPTH (m)
Mo Ni Ag Tl U V Zn
DETECTION LIMIT
0.6 0.03 0.004 0.01 0.17 0.8 0.2
AVERAGE ± STANDARD DEVIATION
30 10.95 ± 0.32 0.14 ± 0.01 <4.01 11.63 ± 1.95 2.99 ± 0.09 1.87 ± 0.13 0.4 3 ±0.23
100 12.94 ± 4.28 0.25 ± 0.01 <4.01 12.59 ± 1.95 3.80 ± 1.32 2.36 ± 0.86 0.43 ± 0.19
190 10.86 ± 0.26 0.30 ± 0.02 <4.01 12.97 ± 3.46 3.18 ± 0.13 1.88 ± 0.19 1.15 ± 1.01
300 10.81 ± 0.35 0.31 ± 0.01 <4.01 12.57 ± 1.13 3.16 ± 0.04 1.93 ± 0.13 0.33 ± 0.15
600 10.85 ± 0.28 0.43 ± 0.01 <4.01 12.34 ± 1.51 3.21 ± 0.04 2.09 ± 0.14 0.37 ± 0.14

Document Number: FINAL
Revision: V20
Revision Date: 24 September, 2021
Page 5-16
WATER DEPTH (m)
As Ba Cd Cr Cu Pb Hg
DETECTION LIMIT
0.06 0.41 0.003 0.02 0.02 0.02 0.0001
AVERAGE ± STANDARD DEVIATION
950 10.63 ± 0.14 0.49 ± 0.03 <4.01 12.13 ± 0.84 3.15 ± 0.05 1.95 ± 0.15 0.55 ± 0.12
1,150 11.03 ± 0.28 0.55 ± 0.01 7.15 ± 8.23 13.09 ± 2.16 3.24 ± 0.05 2.02 ± 0.27 0.72 ± 0.21
1,250 10.55 ± 0.38 0.54 ± 0.01 4.37 ± 2.86 12.11 ± 1.09 3.14 ± 0.10 2.06 ± 0.19 0.48 ± 0.07
1,500 11.01 ± 0.28 0.56 ± 0.01 10.11 ± 8.45 12.48 ± 2.05 3.19 ± 0.06 2.10 ± 0.19 0.61 ± 0.10
1,750 11.46 ± 1.48 0.57 ± 0.02 7.32 ± 1.93 11.67 ± 1.30 3.27 ± 0.32 2.12 ± 0.22 0.69 ± 0.13
2,500 10.89 ± 0.34 0.57 ± 0.01 5.74 ± 0.83 11.88 ± 1.21 3.16 ± 0.08 2.08 ± 0.20 0.71 ± 0.11
3,500 10.71 ± 0.13 0.56 ± 0.01 5.72 ± 0.44 11.25 ± 1.13 3.10 ± 0.03 2.01 ± 0.09 0.76 ± 0.22
4,000 10.94 ± 0.50 0.55 ± 0.02 5.11 ± 0.44 11.40 ± 0.88 3.22 ± 0.17 2.02 ± 0.28 0.98 ± 0.63
4,050 10.80 ± 0.46 0.53 ± 0.02 4.90 ± 0.69 11.17 ± 1.11 3.15 ± 0.08 2.00 ± 0.30 0.76 ± 0.20
4,100 10.97 ± 0.39 0.54 ± 0.05 5.09 ± 2.89 10.18 ± 0.54 3.15 ± 0.06 2.10 ± 0.23 1.15 ± 0.60
4,150 10.71 ± 0.49 0.53 ± 0.02 4.31 ± 0.54 10.77 ± 0.00 3.09 ± 0.09 2.17 ± 0.20 0.82 ± 0.24
Source: CSA (2020). Note: CSA (2006) reported results as nmol/kg. Results were converted to µg/L using the molar mass of each metal and metalloid, and an assumed water density of 1.025 kg/L.

Document Number: FINAL
Revision: V20
Revision Date: 24 September, 2021
Page 5-17
Figure 5-8. Average (± standard deviation) metal and metalloid concentrations by depth

Document Number: FINAL
Revision: V20
Revision Date: 24 September, 2021
Page 5-18
Source: CSA (2020)
5.7.5 Physicochemical Parameters
5.7.5.1 Temperature
A CTD was used to collect water temperature data from 5 stations in NORI-D in October 2019; a temperature profile shown in Figure 5-9 (CSA, 2020). Surface waters were warm (approximately 27°C) and well mixed in the upper 30 to 50 m of the water column then dropped sharply (~15°C) below the main thermocline at 50 m through the first 100 m of the water column. Temperatures continued to decrease gradually from 15°C to 2°C through the next 2,000 m and remained relatively stable at 1.5°C to 2°C down to the seafloor.
Temperature data obtained from moorings deployed between October 2019 and June 2020 were consistent with the CTD profile data and showed the decline in temperatures from around 11.5 to 12.0°C at 274 m depth to a uniform 1.5°C close to the seafloor, Short term fluctuations (likely tidally induced) dropped from approximately one degree at 274 m, half a degree at 538 m and less than a tenth of a degree below 2,000 m. (Figure 5-10). Temperatures throughout the upper 2,000 m of the water column showed an overall upward trend from October 2019 to June 2020.

Document Number: FINAL
Revision: V20
Revision Date: 24 September, 2021
Page 5-19
Figure 5-9. In-situ temperature profiles in NORI-D, October 2019
Source: CSA (2020).

Document Number: FINAL
Revision: V20
Revision Date: 24 September, 2021
Page 5-20
Figure 5-10. Temperature time series in NORI-D
Source: CSA (2020).

Document Number: FINAL
Revision: V20
Revision Date: 24 September, 2021
Page 5-21
5.7.5.2 Salinity
Figure 5-11 shows the corresponding salinity profiles for October 2019 within the water column, which ranged from approximately 33.5 practical salinity units (psu) in surface waters to 34.5 psu near the seafloor, with a strong halocline present between ~30 to 100 m. Maximum salinity occurred between 100 m and 150 m water depth, gradually decreased to approximately 450 m and then slightly increased to approximately 2,500 m, from which it was similar down to the seafloor.
Salinity data obtained from moorings deployed between October 2019 and June 2020 showed stable salinity values at each depth over the deployment period (Figure 5-12). Salinity measured at 538 m (approximately 34.0 psu) was notably lower than the other measurements at 274 m, 2,008 m and 4,324 m depths (34.6 to 34.8 psu).
Figure 5-11. Salinity profiles in NORI-D October, 2019
Source: CSA (2020)

Document Number: FINAL
Revision: V20
Revision Date: 24 September, 2021
Page 5-22
Figure 5-12. Salinity time series in NORI-D
Source: CSA (2020)

Document Number: FINAL
Revision: V20
Revision Date: 24 September, 2021
Page 5-23
5.7.5.3 Dissolved Oxygen
Water column profile measurements of dissolved oxygen (DO) collected in October 2019 are typical for deep oceanic waters in the Pacific Ocean with high levels of oxygen (6 to 7 mg/L) in the upper surface layers, and the presence of an oxygen minimum zone, where respiration of oxygen by organisms exceeds renewal, resulting in very low oxygen concentrations of less than 0.35 mg/L (equivalent to 0.5 ml/L as defined by Levin, 2003 and Sweetman et al., 2017). Using this definition, the core of the OMZ is located between 100 and 700 m (Figure 5-13). Below the lower oxycline, at approximately 700 m, waters become oxic (> 0.7 mg/L equivalent to > 1 ml/L as defined by Rhoads & Morse, 1971) and the DO concentrations gradually increase, reaching 4.5 mg/L at the seafloor.
DO data obtained from moorings deployed between October 2019 and June 2020 showed a stable level of DO in the oxygen minimum zone at 538 m, albeit with a slight increase and fluctuations occurring during November and December 2019 (Figure 5-14). At depths >2,000 m, a small decrease in DO concentration was observed between October 2019 and June 2020.
Figure 5-13. Dissolved oxygen profiles in the NORI-D, October 2019
Source: CSA (2020)

Document Number: FINAL
Revision: V20
Revision Date: 24 September, 2021
Page 5-24
Figure 5-14. Dissolved oxygen time series in NORI-D
Source: CSA, (2020)

Document Number: FINAL
Revision: V20
Revision Date: 24 September, 2021
Page 5-25
5.7.5.4 pH
Water column profile measurements of pH undertaken in October 2019 show that pH values were generally uniform between the five test stations from 0 to 100 m water depth and from 2,000 m to the seafloor, with pH decreasing rapidly with depth within the upper 100 m of the water column (Figure 5-15). Within the core of oxygen minimum zone (as defined by Section 5.7.5.3) and the lower oxycline, pH values were more variable between stations with a general trend of increasing pH from west to northeast in NORI-D (Figure 5-15).
Figure 5-15. pH profiles in NORI-D, October 2019
Source: CSA (2020).

Document Number: FINAL
Revision: V20
Revision Date: 24 September, 2021
Page 5-26
5.7.5.5 Turbidity
Water column profile measurements of turbidity collected in October 2019 showed turbidity was fairly uniform from the surface to the seafloor and generally less than 0.1 NTU (Figure 5-16), which is indicative of clear waters with minimal suspended particulates.
Time series turbidity measurements at the Long Mooring (Figure 5-3) were low throughout the water column from near-surface to near-seafloor as shown in Figure 5-17.
There are a number of high turbidity events indicated in the time-series which cannot be explained at this time. Additional turbidity monitoring is currently being conducted.
Figure 5-16. Turbidity profiles in NORI-D, October 2019
Source: CSA (2020)

Document Number: FINAL
Revision: V20
Revision Date: 24 September, 2021
Page 5-27
Figure 5-17. Turbidity time series in NORI-D, June 2020
Source: CSA (2020)

Document Number: FINAL
Revision: V20
Revision Date: 24 September, 2021
Page 5-28
5.7.5.6 Transmissivity
Light transmissivity profiles (Figure 5-18) closely track the turbidity profiles (Figure 5-17) and are mostly constant (~98%) through the water column, indicating little particle suspension at any depth, which is typical for open ocean systems remote from terrigenous inputs or upwelling regions.
Seasonal transmissivity measurements obtained from moorings deployed between October 2019 and June 2020 showed transmissivity to be consistently high at water depths below 2,000 m, being above 95% for the duration of the deployments (Figure 5-19). A brief decrease in transmissivity of about 8% was observed at 2,008 m water depth in April 2020, for reasons unknown.
At the shallowest deployment (538 m), transmissivity steadily decreased from about 99% in October 2019 to about 87% in June 2020, possibly due to sensor. In early January 2020, an acute decrease of about 3% transmissivity also occurred for a period of about one week followed by a rapid increase to previous levels, the reason for this is unknown.
Figure 5-18. Static transmissivity profiles in NORI-D (June 2020)

Document Number: FINAL
Revision: V20
Revision Date: 24 September, 2021
Page 5-29
Figure 5-19. Seasonal transmissivity profiles in NORI-D, (Oct, 2019 – Jun, 2020)
Source: CSA, (2020)
5.7.5.7 Chlorophyll-a
Water column profile measurements collected in October 2019 show chlorophyll-a concentrations (as indicated by measurements of fluorescence) across NORI-D were highest in surface waters between 30 m and 70 m water depth at about 0.7 mg/m3, then decreased to 0.1 mg/m3 at about 120 m water depth,

Document Number: FINAL
Revision: V20
Revision Date: 24 September, 2021
Page 5-30
remaining at this level to the seafloor (Figure 5-20). The bottom of the zone of maximum chlorophyll concentrations coincides with the start of the oxygen minimum zone (see Figure 5-13).
Figure 5-20. Fluorescence profile in NORI-D, October 2019
Source: CSA (2020)
5.7.5.8 Suspended Particles
Suspended sediment concentrations have been studied in the CCZ benthic boundary layer and are some of the lowest in the entire global ocean (Gardner et al., 2018). Particle concentrations in the upper water column near the discharge depth are also low but likely vary seasonally in response to export pulses of organic particles from the euphotic zone (Kiko et al., 2017; Marsay et al., 2015). Particles also play an important role in the export of biologically relevant elements and trace elements to the sediments (McDonnell et al., 2015). A number of trace elements can sorb onto particles which can then facilitate their export to deeper waters (Anderson, 2020).
Water column particle/sediment profiles were measured on Campaign 5B using a transmissometer on the CTD rosette which measures light transmission. This data will be used to evaluate changes in the ranges for bioluminescent signalling in a qualitative fashion. Further, with information on particle size frequencies, it will also be used to approximate sediment concentration. The transmissometer will be calibrated using particle loadings collected onto pre-weighed filters that are used to filter known volumes of GO-Flo collected waters.

Document Number: FINAL
Revision: V20
Revision Date: 24 September, 2021
Page 5-31
Particulate metal concentrations (Fe, Mn, Cu, Cd, Zn, Ni, Co, Pb, Al, etc.) will be measured at a small subset of stations before and after collector test activities to assess changes in particulate metal speciation in the plume (Fitzsimmons et al., 2017).
A Laser In-Situ Scattering and Transmissometry (LISST) system was used to measure sediment concentrations and particle size frequencies (from 1.25-250 um) (e.g., Turner et al., 2017). This system uses a red laser diode to measure small angle scattering from suspended particles that are then used to calculate particle size distribution, volume concentration and optical transmission. This system is mounted onto the CTD as with the transmissometer but can only be deployed to 3000m. Analytical results for these samples were not available at the time of writing.
These studies will be repeated during the collector test monitoring campaign to supplement the data collected on Campaign 5B.
5.7.5.9 Trace Elements
Baseline distribution of inorganic nutrients (Si, N, P), carbonate alkalinity, and total organic carbon (TOC), as well as the biologically essential trace elements such as iron, manganese, copper, zinc, nickel, and cobalt, and toxic trace elements such as cadmium, copper, lead, and mercury, will be measured. Samples will be collected using the sampling system and the protocols developed for the International GEOTRACES Program (Cutter and Bruland, 2012). The equipment will consist of a plastic-coated rosette system equipped with metal-free GO-Flo sampling bottles that is lowered through the water column using a plastic-coated Kevlar conducting cable. An initial sampling of the CTA and PRZ was conducted during Campaign 5B consisting of 6 full column profiles of 24 water samples each focusing on near bottom waters and the depth of the discharge plume. Analytical results for these samples were not available at the time of writing.
5.8 Sediment Characteristics
Over the course of Campaigns 3, 6A and 6B, seafloor sediment chemistry samples were collected from 235 sites within NORI-D as shown in Figure 5-21.
5.8.1 Sediment Particle Size Fugro (2018) reports the percent passing by weight for sieve size 32 μm ranged from about 73% to 99%4, while 100% of samples passed 250 μm. All samples were classified as clay or calcareous clay. Hydrometer results showed that the <2 μm fraction ranged from 13% to 88%. By comparison, Halbach and Abram (2013) found the particle size of 88.6% of surface sediments in the eastern part of the CCZ (west of the current sampling area) was less than 4 μm, thereby classifying the bulk of the sediment in that area as clay or silty clay.
4 Fine sand = 75 to 425 μm, silt = 2 to 75 µm, clay <2 μm (Fugro, 2018).

Docum
ent Num
ber: FIN
AL
Revision:
V20
Revision D
ate: 24 S
eptember, 2021
P
age 5-32 Figure 5-21.
NO
RI-D
seafloor sediment sam
pling locations

Document Number: FINAL
Revision: V20
Revision Date: 24 September, 2021
Page 5-33
Sediments were generally described by Fugro (2018) as: a thin veneer (about 6-cm thick) of surficial very soft dark brown semi-liquid clay generally grades into very soft, dark brown clay to core penetration depths between 0.27 to 0.50 m BSF (below sea floor). At about 0.15 m BSF, typically, a colour change from dark brown to light brown occurs. Evidence of bioturbation of the light brown layer is indicated by mottling with dark brown and brown clays.
PSD data will continue to be collected as part of the ongoing baseline studies.
5.8.2 Metals
5.8.2.1 Vertical Variability Analyses of metals were undertaken on the 0 to 1 cm, 1 to 5 cm and 5 to 10 cm sections of cores collected on Campaign 3 (26/4 to 5/6/18) and 0 to 10 cm core sections collected during Campaign 6A (19/8 to 1/10/19) and Campaign 6B (22/11 to 21/12/19). The results show few consistent trends across sites in terms of metal concentrations with depth ERIAS (2020), although the following observations are noted:
• A number of sites have maximum metal concentrations (aluminium (Al), chromium (Cr), cobalt (Co), copper (Cu), iron (Fe), lead (Pb), manganese (Mn), nickel (Ni), vanadium (V) and zinc (Zn)) in the surface 0 to 1 cm section, while at other sites the maximum metal concentrations occur in the 1 to 5 cm or 5 to 10 cm sections.
• Some metals exhibit virtually no change in concentration with increasing depth.
To allow comparison with the Campaign 6A and 6B sites, where samples represented a single depth (i.e., 0 to 10 cm), the results from Campaign 3 were combined to calculate a weighted average for the entire 0 to 10 cm core depth, that is, the results were integrated to present a single value for each site rather than three individual values. These results are discussed below. There are no universally accepted guidelines for deep-sea sediment quality. In the absence of standards relevant to highly mineralised areas, such as the CCZ, assessment of the laboratory data was undertaken based initially on screening quick reference tables (SQuiRTs) published by NOAA. Comparison of total metal concentrations has been made with the SQuiRT “Effects Range-Low” ERL and “Effects Range-Medium” ERM guidelines. This comparison shows the following:
• All Ni results exceeded the SQuiRT ERM (51.6 mg/kg) (Figure 5-22), with the maximum being more than ten times that value (950 mg/kg) and the minimum two to three times the ERM (130 mg/kg). The median value was 224 mg/kg.
• All cadmium (Cd) results were below the SQuiRT ERM (9.6 mg/kg), with five of the results being higher than the SQuiRT ERL (1.2 mg/kg) (Figure 5-23).
• The majority of mercury (Hg) results were equal to or less than the SQuiRT ERL (0.15 mg/kg), with three values lying between the ERL and ERM values (including one value that was reported as <0.16 mg/kg). One value exceeded the ERM (0.71 mg/kg).
• Most Zn results were less than the ERL (150 mg/kg); however, around a quarter of values were between the ERL and the ERM (410 mg/kg) (Figure 5-24). The median value was 138 mg/kg (that is, below the ERL).
• All Cr results were lower than the SQuiRT ERL (81 mg/kg), with the highest value (including calculated weighted averages of sectioned cores) being 31 mg/kg. Results for Cr(VI) were no more than 50% of the total Cr values.

Document Number: FINAL
Revision: V20
Revision Date: 24 September, 2021
Page 5-34
• All Pb results above the limit of reporting were less than the SQuiRT ERL (46.7 mg/kg), with the exception of two results, with the highest value (including weighted averages where appropriate) being 61.1 mg/kg.
• Most Cu results exceeded the SQuiRT ERM (270 mg/kg) (Figure 5-25), with the maximum being 1,260 mg/kg. Only one result was between the ERL and ERM, and no results were less than the ERL (34 mg/kg). The median value was 442 mg/kg.
• The concentrations of a number of metals/metalloids were lower than the limits of reporting for all samples, with varying reporting limits due to different dilution requirements to address matrix effects. These include antimony (Sb) <100 to <150 mg/kg, arsenic (As) <34 to <110 mg/kg, boron (B) <69 to <110 mg/kg, selenium (Se) <34 to <110 mg/kg, silver (Ag) <3.4 to <5.0 mg/kg, thallium (Tl) <68 to <110 mg/kg and uranium (U) <0.63 to <1.1 mg/kg. Of these metals/metalloids, SQuiRT guideline values are available for As and Ag. The reporting limits achieved for As and Ag in most samples were higher than SQuiRT ERM and ERL guideline values, therefore assessment of compliance with these guidelines is not possible.

Document Number: FINAL
Revision: V20
Revision Date: 24 September, 2021
Page 5-35
Figure 5-22. Nickel concentrations in sedim
ent
Figure 5-23.
Cadmium
concentrations in sediment
NIC
KE
L C
ON
CE
NT
RA
TIO
NS
IN S
ED
IME
NT
NO
RI A
rea D | S
ediment G
eochemistry C
haracterisation
ER
IAS
Group |01263A
_11_F5-10_v1
FIG
UR
E 5.10
RE
AN
AL
YS
ED
CA
DM
IUM
CO
NC
EN
TR
AT
ION
S IN
SE
DIM
EN
T
NO
RI A
rea
D | S
ed
ime
nt G
eo
che
mistry C
ha
racte
risatio
n
ER
IAS
Gro
up |0
1263A
_11_F
5-1
4_v1
FIG
UR
E 5
.14

Document Number: FINAL
Revision: V20
Revision Date: 24 September, 2021
Page 5-36
Figure 5-24. Zinc concentrations in sedim
ent
Figure 5-25.
Copper concentrations in sediment
ZIN
C C
ON
CE
NT
RA
TIO
NS
IN S
ED
IME
NT
NO
RI A
rea
D | S
ed
ime
nt G
eo
che
mistry C
ha
racte
risatio
n
ER
IAS
Gro
up |0
1263A
_11_F
5-12_v1
FIG
UR
E 5
.12
COPPER CO
NCENTRATIONS IN SEDIM
ENT
NORI Area D | Sediment Geochem
istry Characterisation
ERIAS Group |01263A_11_F5-6_v1
FIGURE 5.6

Document Number: FINAL
Revision: V20
Revision Date: 24 September, 2021
Page 5-37
5.8.2.2 Horizontal Variability
Horizontal variability in metal concentrations across NORI-D for selected metals is shown in Figure 5-26, with results presented as ‘heat maps’ that show changes in concentrations over the sampling area. Higher concentrations are shown in red and lower concentrations green. Points of note include:
• The spatial distribution of Ni and Cu values is very similar, with a number of higher values evident in the north-western, southern and central/eastern part of the sample area. A similar distribution is observed for the Zn values.
• The highest Cr values tend to be in the central part of the sample area trending towards the north.
• The highest Pb values are located in the northwest with a band of higher values also occurring in the central part of the area where Cr values are also high.
The mean metal concentrations in sediments determined from the NORI sampling campaigns are generally similar to these reported by Halbach and Abram (2013) for surficial sediments in the CCZ in an area west of NORI-D. Concentrations are also generally similar to typical values reported in the literature for deep-sea clays (Salomons and Förstner, 1984), apart from Al, Cr and Fe (which are two to four times lower in the NORI-D samples). In terms of possible adverse ecological impacts, the results show that the naturally occurring Ni and Cu were significantly elevated at levels that are generally associated with adverse benthic impacts. Some Zn and Hg results also fall into this category. Other metals such as Cr and Pb were present at relatively low concentrations. Sediment metals concentration data will continue to be collected as part of the ongoing NORI-D baseline studies.
5.8.3 Carbon Sediment samples collected during Campaign 3 showed no consistent trend in total carbon (TC) concentrations with depth, with some sites showing lower concentrations with increasing depth and others showing higher concentrations with depth. In contrast, a consistent trend was evident for total organic carbon (TOC) with concentrations increasing with depth in all samples (ERIAS, 2020).
Comparison of TC, TOC and total inorganic carbon (TIC) results obtained during Campaigns 3, 6A and 6B indicate the following:
• TOC values were consistent across samples from all three campaigns, with an average value of 0.47%.
• Average TIC values were slightly higher in the Campaign 6A and 6B (2019) samples than for those from Campaign 3 (2018).
• In terms of spatial variation, TC and TIC showed considerable variability between sampling sites; however, there was little variation in TOC between sites.

Document Number: FINAL
Revision: V20
Revision Date: 24 September, 2021
Page 5-38
Figure 5-26. Relative variability of selected metal concentrations across NORI-D
5.8.4 Nutrients and Chlorophyll-a Total phosphorus results for sediment samples collected during Campaign 3 showed either no change in concentration between 0 to 1 cm and 5 to 10 cm or a notable increase, with all values then generally decreasing in the 5 to 10 cm samples. Not surprisingly, the highest values were obtained in the 0 to 1 cm sample at all sites, that is, at the sediment/water interface (ERIAS, 2020).
Total phosphorus concentrations for all sample sites ranged from 570 mg/kg to 2,310 mg/kg, which is within the range reported in the literature for open ocean sediments (i.e., 216 to 9,500 mg/kg; Filippelli,

Document Number: FINAL
Revision: V20
Revision Date: 24 September, 2021
Page 5-39
1997). Little spatial variation was evident in total phosphorus concentrations, apart from a few elevated values, and one noticeably low value, with most samples having concentrations around 1,000 mg/kg.
Concentrations of nitrate and nitrite in all samples were below the limits of reporting.
Chlorophyll-a values were spatially highly variable, with concentrations ranging from non-detectable to 132.7 mg/kg.
5.8.5 Comparison of CTA & PRZ Preliminary comparisons of geochemistry of sediments in the CTA and the PRZ were conducted during Campaign 5A (16/10 – 30/12/20). The following parameters were compared between sites, nodule types (areas with type 1 and 2 nodules), and geoforms (abyssal plain and hills):
• Aerobic microbial respiration - consumes oxygen from overlying seawater.
• Alkalinity.
• Nitrate (NO3-), Nitrite (NO2-), Ammonia (NH4+), Phosphate (PO43-) produced from degradation of organic matter.
• Silica (SiO2) dissolution from sediments/biogenic opal.
• Phosphate (PO43-) adsorption to iron and manganese minerals.
• Nitrate (NO3-) at depth with nodule type or geoform.
• Nitrate (NO3-) and Silica (SiO2) with depth between sites.
• Alkalinity.
These data are summarised in Figure 5-27, Figure 5-28, and Figure 5-29. Preliminary results found no evidence to suggest differences in key geochemical parameters across test sites (UOL, pers comm) suggesting that the geochemistry of the PRZ is representative of the CTA. Sediment geochemical studies will continue as part of the ongoing baseline studies.
Figure 5-27. Campaign 5A ex-situ oxygen results†‡
†No significant difference observed between different regions, nodule type or geoform
‡Within range of previous CCZ observations near NORI-D (Jahnke et al. 1982)

Document Number: FINAL
Revision: V20
Revision Date: 24 September, 2021
Page 5-40
Figure 5-28. Campaign 5A alkalinity results†
†No significant difference observes between sites, slight increase down core.

Docum
ent Num
ber: FIN
AL
Revision:
V20
Revision D
ate: 24 S
eptember, 2021
P
age 5-41 Figure 5-29.
Cam
paign 5A nutrient results
A
– Regional com
parison - No difference observed betw
een different regions, nodule type or geoform; W
ithin range of previous CC
Z observations near NO
RI-D
(Jahnke et al. 1982) B
– Nodule Type / G
eoform - †N
o difference between nodule type or geoform
C
– Sim
ilar variability at each site down the core

Document Number: FINAL
Revision: V20
Revision Date: 24 September, 2021
Page 5-42
5.9 Bathymetry
The seafloor of the CCZ lies mostly between 4,000 and 6,000 m water depth and is characterized by numerous seamounts, some of which reach depths of less than 3,000 m. The widespread seafloor, oriented approximately orthogonal to the trend of the bounding fracture zones, provides a large number of flat‐floored valleys, separated by irregular, often discontinuous ridges a few hundred metres high, as shown in Figure 5-30 (ISA, 2010b).
Figure 5-30. Bathymetric overview of the CCZ
NORI-D shown as yellow box; other exploration areas outlined.
Bathymetric data from NORI-D was collected during Campaign 1 using a hull-mounted Kongsberg Simrad EM120 12 kHz, full-ocean depth multibeam system, with 25,720 km2 of seafloor mapped. This multibeam bathymetry data was combined with backscatter data to locate areas of high nodule densities for targeted dredge sampling (Golder Associates, 2018).
Figure 5-31 shows several seamounts in the south of NORI-D, particularly in the southeast sector, and deeper waters towards the west. NORI-D is characterised by undulating seafloor topography with a mean slope of 2º but greater than 8º along ridges (Figure 5-32). Linear ridges are dominant across the northwest and southeast, with the most defined ridges found in the north. Figure 5-32 also shows the currently assessed boundaries of inferred, indicated, and measured resource.
The various seamounts in the area are all of submarine volcanic origin. Their formation is related to the seafloor spreading of the East Pacific Rise 18 to 22 million years ago (Barckhausen et al., 2013). The East Pacific Rise is located to the west southwest of the area and is characterised as having the most volcanic activity in the CCZ (Vithana et al.,2019).

Document Number: FINAL
Revision: V20
Revision Date: 24 September, 2021
Page 5-43
Figure 5-31. Bathymetry of NORI-D
Figure 5-32. NORI-D geological domains
Source: NORI (2019). Lines show resource classification boundaries: black –inferred, blue – indicated, purple – measured.

Document Number: FINAL
Revision: V20
Revision Date: 24 September, 2021
Page 5-44
5.10 Seafloor Characteristics
Two sediment types have been identified in the eastern CCZ, namely carbonate sediment (e.g., carbonate silts, clays and oozes) found predominantly in the southwest, and siliceous sediments (e.g., red clays, siliceous silts, clays and oozes) found predominantly in the west-northwest (BGR, 2019).
The occurrence of siliceous sediments in the western part of the CCZ is thought to be due to the greater water depths in this area, with increased solubility of carbonate minerals with increasing hydrostatic pressure (BGR, 2019).
Results from field tests conducted on Campaign 3 (26/4 to 5/6/18) indicated that in NORI-D the shallow soil stratigraphy consists of a veneer (about 6 cm thick) of surficial, dark brown, very soft semi-liquid clay overlying very soft, dark brown clay to a maximum core penetration depth of about 0.5 m. At about 0.15 m depth, typically, a colour change from dark brown to light brown occurs. Evidence of bioturbation of the light brown layer is indicated by mottling with dark brown and brown clays (Figure 5-33). It was noted on the high-resolution geophysical survey data that a reflector at about 15 cm to 20 cm depth was consistently present across all the box-core sites sampled. This depth corresponds with the top of the light brown clay. Qualitative carbonate content testing typically indicates no reaction with dilute hydrochloric acid (10% concentration) (AMC, 2020).
Figure 5-33. Sediment cores from NORI-D showing sediment colour changes and mottling.

Document Number: FINAL
Revision: V20
Revision Date: 24 September, 2021
Page 5-45
5.11 Nodules
Polymetallic nodules are black, potato-shaped concretions made up of multiple layers of hydroxides around a core and can contain valuable metals (Table 5-7). Box-core sampling of nodules within NORI-D shows nodules in vary in size, with some nodules smaller than 4 cm in diameter while others are over 20 cm. Samples of nodule sizes collected are shown in Figure 5-34; more than half the nodules found in NORI-D are medium-sized (8 to 12 cm diameter).
Table 5-7. Chemical composition of polymetallic nodules ELEMENT COMPOSITION +/- (%)
Manganese (Mn) 29.40%
Iron (Fe) 6.00%
Nickel (Ni) 1.4%
Copper (Cu) 1.3%
Cobalt (Co) 0.25%
Titanium (Ti) 0.2%
Aluminium (Al) 3%
Sodium (Na) 1.5%
Silicon (Si) 5%
Oxygen (O) 1.5%
Hydrogen (H) 1.5%
Calcium (Ca) 1.5%
Magnesium (Mg) 0.5%
Potassium (K) 0.5%
Barium (Ba) 0.2% Source: ISA webpage. Nodule composition is subject to alterations dependant on size.

Document Number: FINAL
Revision: V20
Revision Date: 24 September, 2021
Page 5-46
Figure 5-34. NORI-D nodule collection showing ranges of sizes.
Notes: Upper left – example of large nodules with rough texture. Top right – close up of medium nodule. Source: NORI (2019).
The following three classes of nodule distribution have been identified in NORI-D based on camera imagery.
• Type 1 is typically characterised by medium-sized (1 to 10 cm) and densely packed nodules. Many nodules are in contact with their neighbours and over 50% of the seafloor is occupied by nodules.
• Type 2 is characterised by lower nodule abundance, larger nodules (5 to 20 cm) and noticeable sediment gaps between individual nodules. Between 20 and 40% of the seafloor is occupied by nodules.
• Type 3 has sparser nodule abundance, nodules between 5 to 20 cm in size and increased sediment gaps between individual nodules. Between 10 and 20% of the seafloor is occupied by nodules.
Further description and photographic examples of nodule types is provided in Table 5-8.

Document Number: FINAL
Revision: V20
Revision Date: 24 September, 2021
Page 5-47
Table 5-8. Nodule facies types
NODULE FACIES TYPE DESCRIPTION PHOTOGRAPHIC EXAMPLE
Type 1 – Densely packed and interconnected
More than 50% nodules are type 1. ~1 to 10 cm width. Low to moderate confidence in camera imagery to resolve individual nodules
Type 2 – Mostly individual and locally interconnected
~20 to 40% nodules. ~5 to 20 cm width. Moderate to high confidence in camera imagery to resolve individual nodules
Type 3 – Mostly individual and sparse
10 to 20% nodules. ~5 to 20 cm width. Moderate to high confidence in camera imagery to resolve individual nodules
Other Volcanic outcrop- associated with NW-SE ridges
Source: NORI (2019).
Type 1 nodule facies are the most common, this trend is also found within the neighbouring German contract area and all four NORI contract areas (NORI, 2019). Type 2 and 3 nodule facies typically correlate with higher amplitude acoustic backscatter survey data. These correlations are shown in Figure 5-35 , which shows nodule classification according to AUV (coloured ribbon-track: Type1 (green), Type 2 (yellow), Type 3 (red)) against a background of acoustic backscatter data.
The backscatter responses are coloured by amplitude; high amplitude areas associated with Type 2 and 3 nodule facies are shown in warmer colours, with Type 1 represented by colder colours. Facies boundaries are often well-defined and variable over short distances (less than 100 m), as shown in Figure 5-36.

Docum
ent Num
ber: FIN
AL
Revision:
V20
Revision D
ate: 24 S
eptember, 2021
P
age 5-48 Figure 5-35.
Nodule classification in N
OR
I-D
S
ource: NO
RI (2019).

Docum
ent Num
ber: FIN
AL
Revision:
V20
Revision D
ate: 24 S
eptember, 2021
P
age 5-49 Figure 5-36.
NO
RI-D
camera im
agery showing change from
Type 2 (left) to Type 3 (right)
Source: N
OR
I (2019).

Document Number: FINAL
Revision: V20
Revision Date: 24 September, 2021
Page 5-50
5.12 Benthic Geoforms
Abyssal seafloor topography influences near-bottom hydrodynamic regimes (Hernandez-Molina et al. 2008), sedimentology (Pickering & Hiscott 2015; Graf 1989) and particulate organic matter fluxes (Wei et al. 2010b). The combinations of these physical variables can influence the maximum spatial extent (fundamental niche) of benthic species (Harris & Baker, 2011; Huang et al. 2018). Therefore, these abiotic and biotic environmental factors influence the characteristics of biological community structure and spatially discrete classes of geomorphic features (geoforms) and substrate types are known to be broadly indicative of abyssal seafloor habitats and ecological groupings (Przeslawski et al. 2011; Huang et al. 2014). However, abiotic factors alone cannot be used to predict community distributions due to the various biological interactions that place controls on how species can exploit their fundamental niche (Harris & Baker 2011). In addition, the scales and resolution of the predictive power of abiotic surrogates for community types and biodiversity must be carefully considered (Williams et al. 2009).
Mapping of geoforms and substrates has become central to marine ecology and spatial planning. In the CCZ, management of deep-sea mining has a strong spatial component at the regional- and contract-scales. The identification of areas of particular environmental interest (APEIs), PRZs, test mine areas, definition of the resource and consideration of suitable terrain for mining, and ultimately the derivation of a Mine Plan are all principally spatial questions. For environmental impact assessment purposes, the determination of suitable spatial scales of environmental investigations within a contract scale is a key consideration.
5.12.1 Classification Classification of the benthic environment within NORI-D was undertaken at three levels by layering geoform, substrate and biological information over the regional setting. Geoform and substrate classification has been completed to date (Fathom Pacific, 2019a; 2019b; 2020a), with the biological classification component, using ROV imagery, in progress (see Section 6.3.1).
5.12.1.1 Geoform Mapping
Geoform mapping involved a two-step process of an algorithmic approach to investigate seabed terrain from bathymetric data, followed by an integrative approach which combined these with concurrent geological investigations that used interpretations of mulitibeam backscatter and data on nodule and sediment characteristics from boxcores throughout NORI-D.
A multivariate raster-based clustering algorithm known as “Clustering Large Applications” (CLARA) (Kaufman and Rousseeuw, 1990) was applied to bathymetric data and derivatives of Topographic Position Index (TPI), Terrain Ruggedness Index (TRI) and slope. TPI and TRI rasters were calculated using the SAGA TPI and TRI algorithms (Conrad et al. 2015). CLARA uses a Partitioning Around Medoids (PAM) approach that produced a number of potential clustering solutions for further assessment. In this study, the number of potential clusters (geoform types) ranged from 2 to 12. The performance of these 11 potential clustering solutions was assessed using the Silhouette Index (Rousseeuw, 1987), a statistical and graphical method of validating clustering results. The silhouette method calculates the dissimilarity between raster values (taking a sample of 5% of the raster values) within a cluster and the values belonging to all other clusters and this is repeated for all potential clustering solutions. The average distances between clusters (known as the silhouette width) provided a summary index to compare the performance of each clustering solution. The clustering solutions with largest average silhouette widths are deemed to be the solutions that best fit the data. The silhouette method identified optimal solutions at 3 and 8 clusters. Further interrogation of the 3-cluster solution revealed the analysis grouped knoll, seamount and abyssal hill geoforms. These are known to be differentiated seabed features and further examination identified that the 4-cluster solution provided more parsimonious results. The clustering process therefore identified a 4-geoform solution and an 8-geoform solution that conformed with seabed

Document Number: FINAL
Revision: V20
Revision Date: 24 September, 2021
Page 5-51
features that were nested at the 1-10s km scale and the 0.1-1 km scale respectively and conformed with the operational definitions used by the project geologists. These two clustering solutions also represented the seabed features that were considered key ecological structures of abyssal hills, plains, slopes, troughs, etc. The evaluation of clustering solution also considered the alignment with seafloor features with a defined spatial scale following standardised feature categories (Harris 2012a, b; IHO 2019) and the hierarchical structure of ecological classification, specifically the geoform classification hierarchy of the Coastal and Marine Ecological Classification Standard (CMECS) (FGDC 2012). This clustering basis was taken forward to the next stage of interpretation.
Concurrent geological resource studies within NORI-D which used bathymetric and acoustic backscatter analysis, boxcore sampling and boxcore-attached camera methods, combined with expert geological interpretation, produced seafloor terrain classifications that were closely aligned with the cluster analysis described above. These geological results enabled the combining of geoform clustering results into the project geological mapping basis, thereby allowing the parsimonious linking of key topographic structures with the nodule resource and sediment information that will form operational mine planning and therefore links directly to environmental sample design. Furthermore, a concurrent whole-of-CCZ analysis provided further context for nesting the geoforms into an appropriate scaling regime, reserving terminologies for the appropriate scales. This way more finely resolved future studies can be nested into the hierarchical classification, and studies in other contract areas can be aligned so that a common basis exists for layering biological information onto abiotic habitats, thus supporting ecosystem-based assessments.
The final geoform classification is presented in Figure 5-37 and described below.
Figure 5-37. Geoform structure of NORI-D
LEVEL 1 - NORI-D is situated in the southern margin of an abyssal plain, spanning close to the latitudinal range of the eastern CCZ (Figure 5-38). The abyssal plain, known as “Mike Plain” (AMC, 2016), is one of 11 abyssal plains mapped within the CCZ.
LEVEL 2 - Abyssal hills are the most spatially common Level 2 geoform within NORI-D, followed by flatter areas, knoll-seamount chains and sediment drifts. Abyssal hills are also the most common landform on the seafloor at the global scale (Harris et al. 2014). Formation of abyssal hills is believed to be by seafloor spreading, with slight landform variations due to spreading rate, magma effusion and cooling related subsidence (Olive et al. 2015). A major knoll-seamount chain runs from the central west to southeast within NORI-D (Figure 5-39).

Document Number: FINAL
Revision: V20
Revision Date: 24 September, 2021
Page 5-52
A large seamount occurs to the north of NORI-D and larger knolls occur in the far northeast. It is believed these features form a knoll-seamount chain that extends beyond the northeastern boundary of NORI-D but confirmation would require additional multibeam data outside the NORI-D deposit. Isolated seamounts can also form on the deep-seafloor, likely due to increased local heat flow associated with tectonic related thinning or fractures (AMC, 2016). Geoforms were mapped to the full extent of the available bathymetry as their interaction with surrounding habitats is important for their classification and considerations of potential oceanographic influence, pelagic processes, and connectivity.
The least common Level 2 geoforms within NORI-D are sediment drifts, which occur in relatively small patches throughout the contract area. These features are large mounds or ridges of sediment that accumulate beneath persistent geostrophic bottom currents (Stow & Holbrook 1984; McCave & Tucholke 1986). These geostrophic currents generally flow parallel to bathymetric contours, hence are known as contour currents. They can be indicative of present day or palaeoceanographic conditions. The sediments associated with these features have been called contourites (Hollister & Heezen 1972) and are deposited parallel to the abyssal hills.
LEVEL 3 - Valley Type A is the most spatially common Level 3 geoform within NORI-D, followed by Valley Type B, Hill Top Type A, Slope Type A, Hill Top Type B and Slope Type B. Type A Hill Tops and Slopes represent these geoform features with hard consolidated grounds, where Type B of these features represent areas of soft unconsolidated grounds. This has been confirmed with the use of multibeam backscatter and ground-truthing boxcore and imagery data (AMC, 2020). Valley Type A features represent broader Inter-Hill Valley geoforms occurring in shallower depths (~4,000 m to 4,100 m), while Valley Type B features represent narrower to broad Inter-hill valley geoforms occurring in deeper depth ranges (~4,200 m –4,300 m). As such, these two valley types (A and B) are hypothesised to represent different abiotic habitats (Figure 5-40).

Docum
ent Num
ber: FIN
AL
Revision:
V20
Revision D
ate: 24 S
eptember, 2021
P
age 5-53 Figure 5-38.
CC
Z Level 1 classes of tectonic setting, geomorphology and algorithm
ic terrain classification.

Docum
ent Num
ber: FIN
AL
Revision:
V20
Revision D
ate: 24 S
eptember, 2021
P
age 5-54 Figure 5-39.
NO
RI-D
Level 2 geoforms.

Docum
ent Num
ber: FIN
AL
Revision:
V20
Revision D
ate: 24 S
eptember, 2021
P
age 5-55 Figure 5-40.
NO
RI-D
Level 3 geoforms. R
ed lines indicate alignment of tw
o knoll-seamount chains.

Document Number: FINAL
Revision: V20
Revision Date: 24 September, 2021
Page 5-56
5.12.1.2 Substrate Mapping
A geological model was developed for NORI-D (Margin, 2020) which mapped the benthic substrates. Substrates were generated by project geologists after segmentation and classification of acoustic backscatter data using the ISO-Cluster algorithm in ArcGIS. Substrate classes were ground-truthed using the box-core data and imagery. ESIA field studies provided an additional level of ground-truthing as imagery and samples from environmental boxcore and multicore samples positioned in NORI-D on the basis of substrate classification were found to comprise the substrate types predicted by the classification on the vast majority of occasions.
The combined substrate map included the derived substrates from the nodule resource assessment and those polygons from the geoform classification that related to a substrate class rather than a geoform class. Similar to the geoform classification scheme, the substrate scheme used internationally accepted terms and a structure that reflected hierarchical spatial scales (Figure 5-41).
Figure 5-41. Substrate structure of NORI-D
NORI-D contains substrates ranging from consolidated hard grounds to unconsolidated sediment beds (Figure 5-42). Hard substrates are present in various forms: exposed rock, rock fragments, bedrock, nodules. Hard substrate generates heterogeneity and complexity in abyssal habitats and is expected to influence the composition of abyssal benthic assemblages, most obviously in relation to the abundance of species that are sessile obligate hard substrate attached fauna (Amon et al. 2016; Gooday et al. 2017; Buhl-Mortensen et al. 2010; Bell et al. 2016). Hard substrates can also influence larval settlement processes of abyssal fauna (Van Dover et al. 1988; Roberts et al. 2016). Volcanic substrates are present in the form of knolls, seamounts and outcrops. Knolls and seamounts are known features of enhanced biodiversity (Cuvelier et al. 2020; Clark et al. 2009) and hence may represent areas of interest within NORI-D. Nodules themselves are also considered to host specialised species and communities that are distinct from bare sediments (Mullineaux et al. 1987; Gooday et al. 2015). Simon-Lledó et al. (2019) reported differences in metazoan community structure and giant protists between bare sediment areas and areas with nodules cover at APEI 6 in the north-northeast of the CCZ. The location of nodule provinces on NORI-D are shown in Figure 5-43 and Figure 5-44.

Document Number: FINAL
Revision: V20
Revision Date: 24 September, 2021
Page 5-57
Figure 5-42. Seabed types encountered across NORI-D study areas.
A) Nodules: Type I.B) Nodules: Type II. C) Nodules: Type III. D) Nodule-free. E and F: Exposed rock: E) Fragments; F) Bedrock

Docum
ent Num
ber: FIN
AL
Revision:
V20
Revision D
ate: 24 S
eptember, 2021
P
age 5-58 Figure 5-43.
NO
RI-D
Level 2 substrates.

Docum
ent Num
ber: FIN
AL
Revision:
V20
Revision D
ate: 24 S
eptember, 2021
P
age 5-59 Figure 5-44.
NO
RI-D
Level 3 substrates (excludes volcanic rock which is a Level 2 substrate).

Document Number: FINAL
Revision: V20
Revision Date: 24 September, 2021
Page 5-60
5.12.1.3 Habitat Classifications
Mapping of geoforms and substrates of NORI-D provides an ecosystem-basis for depicting habitat strata that is linked with the geological resource model and thus eventual mine planning strata. The abiotic habitat mapping provides a hypothesis for the spatial distribution of biological communities and ecosystem function in both the benthic and midwater environments. The habitat mapping also provides a robust basis for spatial planning and for designing ESIA studies to answer key questions at the contract scale that are also relevant at the regional scale, such as differentiation in community and functions between geoform and nodule types, influence of proximity to seamounts, etc. Through the ESIA, sampling is therefore stratified in response to the habitat strata in addition to other spatial strata relevant to the environment and statistical replication.
According to this classification, the NORI-D is dominated by several large, flat habitat classes with constant slope and relatively small topographic features, with many smaller pockets of different habitat classes interspersed across the region. Areas of high nodule abundance are predominantly located in the central part of the lease, with a large patch of high nodule abundance in the northeast. This information has been used to inform the selection process for the CTA, PRZ and sampling sites for baseline studies (Figure 5-45).
Figure 5-45. Location of CTA and PRZ in relation to nodule type on NORI-D
At this scale, it is hypothesised that some biological communities are organised in response to some combination of the mapped habitat strata. For example, slopes and plateaus of abyssal hills may be expected to house contrasting communities as a result of habitat differences (e.g., water movement regimes and sediment grain sizes). Abyssal hills and seamounts have been shown to be higher in species richness and standing stock biomass compared to adjacent areas devoid of topographic variability (Durden et al. 2020; Durden et al. 2015; Cuvelier et al. 2020; Clark et al. 2009; McClain 2007; Ramirez-Llodra et al. 2005; Rowden et al. 2010). Bathymetric gradients are known to influence benthic community structure due to the physical depth preferences of species (Rex & Etter 2010; Durden et al. 2020). Additionally, these topographic features are thought to influence currents and near-bed flows (Hernandez-Molina et al. 2008) which in turn are predicted to alter the local sedimentology, sedimentary environments and deposition of particulate organic matter (Pickering & Hiscott 2016; Graf 1989; Levin &

Document Number: FINAL
Revision: V20
Revision Date: 24 September, 2021
Page 5-61
Nittrouer 1987; Rex & Etter 2010; Wei et al. 2010a) that are expected to also influence community structure. Such gradients in biological community distribution have been identified for benthic megafauna at the contract scale (Simon-Lledo et al. 2020). However, the influence of geoform and substrate type on macro-, meio- and microfauna community composition and sediment biochemistry is not yet confirmed from previous sampling, due in part to the fact that this kind of a-priori stratification of sampling into habitat strata has not been prioritised until now. Preliminary results from the NORI-D ESIA baseline studies suggests that macro- and meiofauna communities may be more ubiquitous and that sediment biochemistry may vary on larger spatial scales.
The NORI-D habitat mapping in one aspect of a multi-faceted Ecosystem Based Management approach. Ecosystem models will be developed through the ESIA program that are spatially tied to habitats, and these will be progressively refined on the basis of biological community and function data. Classification of the abiotic habitats within a robust hierarchical scheme with an established nomenclature and within the context of the CCZ enables effective communication and unification of NORI’s environmental studies. With these scaled geoforms described, and with further validation from field studies, a basis exists for defining the properties of seafloor terrain that effectively describe abiotic habitats. The properties of the geoforms and substrates can be used to establish the libraries and parameter reference set that can be taken forward to algorithmic large-scale approaches to terrain classification such as geomorphon approaches (Jasiewicz and Stepinski 2013).

Document Number: FINAL
Revision: V20
Revision Date: 24 September, 2021
Page 6-1
6 BIOLOGICAL ENVIRONMENT
6.1 General Setting
The nodule provinces found in the CCZ typically provide hard substrates in the form of the nodules and soft substrates in the red clays that surround them. Thus, there are organisms that live in the sediment, on the sediment, attached to the nodules and those that are free swimming (Snelgrove and Smith, 2002). The overarching framework for the biological baseline studies has been structured to characterize the biotic communities in each of these habitat types.
6.2 Baseline Studies
NORI has committed to conducting a total of thirteen campaigns to the CCZ during the period Q4/2019 to Q3/2023. The studies conducted during this time will be focused on providing environmental baseline data to inform the operational ESIA.
Table 6-1 lists the contractors, institutions, principal investigators, and area of study that have been contracted by NORI to conduct the biological baseline studies for the operational ESIA.
Table 6-1. Contractors, institutions, principal investigators and areas of study INSTITUTION
(Abbreviation; Country) PRINCIPAL
INVESTIGATORS AREA OF STUDY
Natural History Museum (NHM; UK)
Dr Adrian Glover • Benthic macrofauna (nodules and sediments)
University of Gothenburg (UoG; SE) Dr Thomas Dahlgren • Benthic macrofauna
(nodules and sediments) National Oceanography Centre (NOC; UK) Dr Daniel Jones • Benthic megafauna
University of Leeds (UoL; UK) Dr Claire Woulds • Sediment geochemistry
Heriot Watt University (HWU; UK)
Dr Andrew Sweetman / Dr. Theodore Henry
• Benthic scavengers. Sediment respiration
• Benthic ecotoxicology Florida State University (FSU; US) Dr Jeroen Ingels • Meiofauna
Cawthorn Institute (CI; NZ) Dr. Olivier Laroche / Dr. Xavier Pochon • Microbes (sediment)
University of Southern Florida (USF; US)
Dr. Patrick Schwing / Bryan O’Malley • Foraminifera
University of Hawaii at Manoa (UoH; US)
Dr Jeff Drazen
• Micronekton assemblage • Bioacoustic mid-water ROV
transects, • Upper trophic levels of food web
study
Dr Angel White
• Microbial assemblages Phytoplankton community and productivity
• Particles
Dr Brian Popp • Stable isotopes • Food web linkages
Dr Sara Ferron • Phytoplankton productivity

Document Number: FINAL
Revision: V20
Revision Date: 24 September, 2021
Page 6-2
INSTITUTION (Abbreviation; Country)
PRINCIPAL INVESTIGATORS AREA OF STUDY
Dr Mariko Hatta / Dr Chris Measures
• Chemical oceanography • Trace metals
Dr Erika Goetze
• Zooplankton, metabarcoding • Mid-water eDNA • DNA barcoding • ROV transects
University of Maryland (UMD; US)
Dr Dana Sackett • Microneckton ecotoxicology
Japan Agency for Marine-Earth Science and Technology (JAMSTEC; JP)
Dr Dhugal Lindsay • Gelatinous zooplankton • Mid-water ROV transects
Texas A&M University (TA&M; US)
Dr Jessica Fitzsimmons • Chemical oceanography • Trace metals
CSA Ocean Sciences Inc. (CSA; US) Dr Chris Kelly • Metocean moorings
Fathom Pacific (FP; AU) Dr Adrian Flynn • Surface Biology
At the time of writing no published biological findings from the NORI-D baseline campaigns are available, although preliminary data has been provided by some researchers. The baseline campaign schedule is ongoing and analysis of samples, specimens and data collected at sea is a time-consuming process, with research institutions requiring up to 12 months post-campaign to conduct a full post-campaign analysis.
Over the 12-month period required by the ISA to assess the Collector Test EIS, additional data and information will be submitted by the research institutions as outlined in Table 6-2. As this information becomes available it will be collated and submitted to the ISA both as part of the NORI Annual Report, and as an addendum to the EIS. Information that will not be available prior to the collector test has been highlighted in Table 6-2. As uncertainty in the biological baseline has been incorporated into the risk assessment (see Section 13.3) it is unlikely that new information will arise that will require a material change in the findings of this EIS. Should this occur however, revised findings will be submitted based on the new information.
Table 6-2. Baseline campaign and reporting schedule for NORI-D*
# Campaign
ID Start Date
End Date
Days at
Sea Focus
Contractor / Institution
Data Status
Reporting Status
1
Cam
paig
n 4A
2/10
/19
23/1
0/19
21
Deployment of three oceanographic moorings within NORI-D to collect continuous metocean data. Water sampling and oceanographic profiling also conducted.
CSA
All data collected and analysed
Report received 04/01/20
2
Oce
an In
finity
23/0
5/20
30/0
5/20
7
Over 25K seabed images collected from PRZ and TMA used for megafauna identification and quantification.
Ocean Infinity / NOC
Images provided to NOC on 01/05/21. Awaiting findings of analysis
Report due 01/04/22

Document Number: FINAL
Revision: V20
Revision Date: 24 September, 2021
Page 6-3
# Campaign ID
Start Date
End Date
Days at
Sea Focus Contractor /
Institution Data
Status Reporting
Status
3
Cam
paig
n 4D
16/6
/20
15/7
/20
29
Serviced the oceanographic moorings deployed at NORI-D during Campaign 4A. Conducted additional oceanographic profiling.
CSA
All data collected and analysed
Report received 18/12/20
4
Cam
paig
n 5A
16/1
0/20
30/1
1/20
45
Collected data on the benthic biology, sediment geochemistry and surface biology of NORI-D using box-core, multicore and floating hydrophones.
NHM / UoG / UoL / FSU / USF / FP
Data currently with institutions for analysis
Mid-term reports due 11/21
5
Cam
paig
n 5B
5/3/
21
14/4
/21
40
Pelagic biology studies of NORI-D supported by ROV, CTDs, MOCNESS nets and rosette water quality samplers for trace metals.
UoH / TA&M / JAMSTEC /UMD
Data currently with institutions for analysis
Mid-term reports due 4/22
6
Cam
paig
n 5D
27/4
/21
12/6
/21
45
Collected seasonal data on the benthic biology, sediment geochemistry and surface biology of NORI-D using box-core, multicore and floating hydrophones. Lander deployments for scavengers, respiration and ecosystem function
NHM / UoG / UoL / FSU / USF / BU / HWU / FP / CI
Data currently with institutions for analysis
Final reports due 6/22
7
Cam
paig
n 4E
6/7/
21
29/7
/21
21
Serviced the oceanographic moorings deployed at NORI-D during Campaign 4A. Conducted additional oceanographic profiling.
CSA
Data currently with contractor for analysis
Report due 11/21
8
Cam
paig
n 5C
21/9
/21
2/11
/21
42
Seasonal pelagic biology studies of NORI-D supported by CTDs, MOCNESS nets and rosette water quality samplers for trace metals.
UoH / TA&M / UMD
Pending Final reports due 9/22
9
Cam
paig
n 5E
12/1
1/21
22/1
2/21
40
ROV pelagic and benthic transects and sample collection. Collection of seasonal seabed images collected from PRZ and TMA used for megafauna identification and quantification. Lander deployments for scavengers, respiration and ecosystem function
JAMSTEC / HWU / NOC
/ NHM / UoG
Pending
Final reports due 11/22
10
Pre/
Mid
- C
olle
ctor
Te
st
Q2/
2022
TBA TBA
Studies before and during the Collector Test will be conducted during this campaign.
TBA NA Q1/2023

Document Number: FINAL
Revision: V20
Revision Date: 24 September, 2021
Page 6-4
# Campaign ID
Start Date
End Date
Days at
Sea Focus Contractor /
Institution Data
Status Reporting
Status
11
Cam
paig
n 4F
Q2/
2022
TBA
TBA
Serviced the oceanographic moorings deployed at NORI-D during Campaign 4A. Conducted additional oceanographic profiling.
TBA NA Q3/2022
12
Post
- C
olle
ctor
Te
st
Q3/
2022
TBA
TBA
Disturbance studies during and after the Collector Test will be conducted. TBA NA Q1/2023
13
Cam
paig
n 4G
Q2/
2023
TBA
TBA
Serviced the oceanographic moorings deployed at NORI-D during Campaign 4A. Conducted additional oceanographic profiling.
TBA NA Q3/2023
*Note: data from highlighted campaigns will not be available prior to the collector test
The following sections provide a brief overview of relevant studies from the wider CCZ region with descriptions of preliminary data from NORI-D where available. Detailed scopes for the biological investigations that are ongoing for the operational ESIA baseline, elements of which will be incorporated into a long-term monitoring program, are provided in Section 12.3.
6.3 Benthic Baseline
6.3.1 Megafauna Benthic megafauna (i.e., metazoans >1 cm) of the CCZ comprise a variety of fauna from scavengers/bait-attending communities (including fish, amphipods and shrimp); deposit feeders (dominated by the echinoderms) and suspension-feeding organisms (including sponges, anemones, corals and other cnidarians). Together, these communities play an important role in functioning of deep-sea ecosystems, in terms of phytodetrital consumption, bioturbation (Smith et al. 2008) and benthic carbon flow through the abyssal food web (Stratmann and Voorsmit et al. 2018).
Although biomass is reported to be low, the CCZ is thought to have one of the highest levels megafaunal species richness in the deep-sea (Kamenskaya, Melnik, and Gooday 2013; Tilot et al. 2018). Previous studies of areas targeted for mining, indicate morphospecies richness estimations from imagery data can rise above 150 taxa (for example, UK-1; (Amon et al. 2016); NORIA; (Tilot et al. 2018)) with variations in megafaunal density observed between different geoforms (for example, hills, plains, troughs) and nodule coverage (Simon-Lledó et al. 2020)
Sessile epifauna (particularly suspension feeders) are shown to have increased numerical densities in locations with higher nodule coverage (Vanreusel et al. 2016) with up to 50% of the overall megafauna identified shown to depend on them (Amon et al. 2016). In nodule-free areas, echinoderms (asteroids, echinoids, and holothuroids) are shown to represent a high-proportion of the deposit-feeding megafauna (De Smet et al. 2021; Stoyanova 2012).
Regional differences in the community composition of benthic megafauna and scavengers in the CCZ has been observed, with a decrease in density with increasing in depth (Simon-Lledó et al. 2020; Leitner et al. 2017). Fish densities detected from AUV imagery are reported to be much higher in the CCZ (Simon-Lledó et al. 2020; 2019; Simon‐Lledó et al. 2019c; Drazen et al. 2019a) than those from other abyssal plain areas of the global ocean (e.g., Porcupine abyssal plain; Milligan et al. 2016a). Limited studies of

Document Number: FINAL
Revision: V20
Revision Date: 24 September, 2021
Page 6-5
the scavenging community have shown them be a diverse, low abundance assemblage, intermediate in taxonomic structure between the Hawaiian ophidiid-dominated and the Californian macrourid- and zoarcid-dominated abyssal bait-attending communities with bathymetric derivatives (e.g., BPI) influencing diversity and community composition (Leitner et al. 2017).
On regional scales, the overall density of megafauna decreases with increasing water depths from the east to the west of the CCZ and has shown not to be correlated to regional productivity gradients (Simon-Lledó et al. 2020; Leitner et al. 2017) suggesting that the presence and density of nodules (Simon‐Lledó et al. 2019a; Vanreusel et al. 2016; De Smet et al. 2021; Leitner et al. 2017) as well as typology (e.g., shape and volume; Simon-Lledó et al. 2020; 2019) may play an important role in driving the abundance and community composition of both mobile and sessile megafauna.
6.3.1.1 Baseline investigations
The methods and proposed survey array for both the collector test and long-term environmental studies on NORI-D will provide data to meet the following objectives:
1. Establish the standing stocks (in both abundance and biomass terms), diversity and community structure of key megafauna in the sampled areas, including comparisons between baseline conditions in areas planned for nodule collection and reference sites (e.g., preservation reference zones, APEIs and other abyssal areas).
2. Compare the megafauna of the NORI-D to the regional distribution patterns of megafaunal morphotypes across the CCZ.
3. Examine how megafaunal communities respond to spatial variation in the environment.
4. Examine whether visible physical conditions (e.g., turbidity, nodule position, sediment cover) changes over time and determine if this affects the biology.
To characterise the abundance, biomass, morphotype structure and diversity of megafauna from scaled photographic transects, the methodologies for data acquisition, image processing and analysis proposed will align with those already published in the peer reviewed literature (e.g., Simon-Lledó et al. 2019) to allow for local (within NORI-D) and regional (wider CCZ) comparisons.
During the Ocean Infinity Campaign (23/05 – 30/05/20) an ROV was mobilized to conduct a series of photo transects at the collector test area (CTA; 10° 22.4’ N, 117° 9.6’ W); plume dispersal zone (PDS; 10° 25.5’ N, 117° 11.9’ W); preservation reference zone (PRZ; 10° 54.273’ N, 116° 15.026’ W), and a secondary reference site (SRS; 10° 27’ N, 116° 46’ W) currently under consideration as supplementary control site for the disturbance monitoring studies that will be conducted on the CTA.
In total, over 25K images covering an area of 68,000m2 have been collected from NORI-D at an altitude of <3 m generating images that cover 2.53 0.16 m2 (Table 6-3). Quantitative analyses of the megafauna in the ROV images are currently ongoing, but preliminary assessments reveal the quality of the images are more than sufficient for megafaunal (> 2 cm) identifications (see Figure 6-1 for examples).
Table 6-3. Summary of ROV transects conducted on Ocean Infinity campaign AREA TRANSECT IMAGES SEABED AREA (m2)
SRS_R01 1,356 3,606.6
SRS_R02 1,294 3,193.6
SRS _R03 1,282 3,244.0
SRS _R04 1,340 3,392.5
SRS _R05 1,342 3,506.9
CTA_R01 1,456 3,549.1

Document Number: FINAL
Revision: V20
Revision Date: 24 September, 2021
Page 6-6
AREA TRANSECT IMAGES SEABED AREA (m2) CTA _R02 1,330 3,211.7
CTA _R03 1,447 3,534.6
CTA _R04 1,312 3,255.1
CTA _R05 1,450 3,528.1
PLU_R01 1,394 3,418.5
PLU_R02 1,409 3,427.3
PLU_R03 1,415 3,439.0
PLU_R04 1,365 3,363.0
PLU_R05 1,341 3,316.8
PRZ_R01 1,299 3,484.0
PRZ_R02 1,329 3,456.9
PRZ_R03 1,316 3,605.0
PRZ_R04 1,082 3,123.9
PRZ_R05 1,358 3,542.7
Total 26,917 68,199.5
To confirm identifications of morphospecies from photographs and to undertake DNA taxonomy on any new species, megafauna that were collected during macrofauna box-core studies (see Section 10 Section 12.3) or preserved as part of earlier baseline resource campaigns (Campaign 6A and Campaign 6B) will be examined. To further confirm identifications, target morphotypes identified from the ROV image surveys will also be collected during the ROV campaign (planned for Q4/2021).
Time-lapse images will be obtained from the study area for a number of months using an automated camera lander (to be deployed on Campaign 5D). The time lapse camera will be deployed at the edge of the CTA to quantify natural variability and document the arrival and impacts of any sediment plume events. Time-lapse images will be assessed to qualitatively examine the physical dynamics of surface sediment and the frequency of resuspension events. Any visible changes in the physical environment (e.g., visible turbidity, nodule coverage, sedimentation) will be documented. Time-lapse images will also be used to document the activity levels of surface megafauna. Deposit feeding rates for abundant taxa will be quantified by measuring the creation rates of their associated traces.
Studies of megafauna are ongoing and additional baseline data is being collected during the ROV Campaign 5E planned for Q4/2020.
6.3.1.2 Demersal fish & scavenging megafauna
The methods and proposed survey array for NORI-D will provide data to meet the overall objectives: 1. Establish the baseline predator and scavenger assemblage (diversity and relative abundance) in
NORI-D and determine baseline scavenging rates.
2. Examine how scavenging fauna changes with environmental parameters within NORI-D and determine relationships to seafloor geology (e.g., presence of seamounts, nodule abundance, etc.)
3. Examine how scavenging biodiversity and activity changes inter-annually within the NORI-D.
4. Compare the baseline scavenger diversity, sediment physical and benthic biogeochemical/ ecological function parameters following system testing.

Document Number: FINAL
Revision: V20
Revision Date: 24 September, 2021
Page 6-7
During Campaign 4A baited and un-baited cameras were deployed on two oceanographic moorings with the purpose of detecting the presence/absence of motile scavengers. These moorings were recovered by Campaign 4D.
To characterise the presence of organisms during the deployment period, the condition of the bait was assessed during these observations. Table 6-4 provides a summary of the data that was collected from Reference Mooring #1 in respect to bait condition and Reference Mooring #2 which was un-baited. Example images are provided in Figure 6-2.

Document Number: FINAL
Revision: V20
Revision Date: 24 September, 2021
Page 6-8
Figure 6-1. Example of megafauna imaged from Ocean Infinity campaign
A) Anemone, Actiniaria mtp 75; B) Sponge Hyalonema (Corynonema) depressum sp. inc.; C) Black coral Alternatipathes sp. indet.; D) From left to right: sponge Porifera mtp 33; sponge Holascus taraxacum sp. inc.; E) Shrimp Cerataspis monstrosus sp. inc.; F) Top to bottom; sponge Hyalonema (Onconema) clarioni sp. inc.; (on stalk) brisingid Freyastera sp. indet.; G) Holothurian Paelopatides sp. indet., mtp 1; H) Left to right: brittle star, Ophiuroidea indet.; barnacle Catherinum sp. indet.; sponge Cladorhiza sp. indet.; sponge Hyalonema (Corynonema) tylostylum sp. inc.; I) Holothurian Synallactes sp. indet. mtp 2.; J) Nudibranch Bathydoris sp. indet.; K) Anemone, Actiniaria mtp 4; L) Sponge Docosaccus maculatus sp. inc.

Document Number: FINAL
Revision: V20
Revision Date: 24 September, 2021
Page 6-9
Table 6-4. Summary of photo duration and bait condition for reference mooring #1 and #2
DEPLOYMENT PHOTO-GRAPHIC INTERVALS DURATION DATES
BAIT CONDITION
AND DURATION
TOTAL DURAT-
ION
% PRESENCE OF SCAVENGING FISH
SPECIES
Reference mooring #1
1 hour 15 Oct 2019 - 19 Oct 2019
5 days (with bait)
188 days
70%
4 hours 21 Oct 2019 - 16 Nov 2019
26 days (with bait)
100%
4 hours 17 Nov 2019 - 23 Jan 2020
67 days (with scraps) 37%
4 hours 24 Jan 2020 - 23 Apr 2020
90 days (no scraps)
25%
Reference mooring #2
2 hours 14 Oct 2019 - 18 Oct 2019
5 days (no bait)
121 days 5%
8 hours 19 Oct 2019 - 12 Feb 2020
116 days (no bait)
25%
Figure 6-2. Example images captured from moorings #1 (A-C) and reference mooring #2 (D)
Preliminary identifications A) Coryphaenoides stet.; B) pair of Ophidiidae indet. eels; C) Bassozetus sp. indet. D) Reference
A B
C D

Document Number: FINAL
Revision: V20
Revision Date: 24 September, 2021
Page 6-10
To quantify demersal predator and scavenger diversity and processes (e.g., feeding rates), baited camera lander and baited trap system deployments will be conducted across NORI-D. Detailed methods are provided in Section 12.3.2.1.
Additional scavenger studies have been conducted on Campaign 5D and will be deployed on Campaign 5E with the overall objective to quantify the magnitude of temporal variation in scavenger biodiversity and processes. Baited camera and trap data exist for the UK1 and OMS contract areas (Leitner et al. 2017) and the BGR contract area (Harbour and Sweetman, in prep.). Comparisons of scavenger biodiversity and processes in NORI-D will be made to these other data sets to address the question of whether unique populations/processes and/or endemic species exist within NORI-D, and to develop a biogeography of the scavenging fauna across the CCZ.
6.3.2 Macrofauna Macrofauna (considered to be animals retained on 250 μm - 300 μm sieves) are primarily sediment-dwelling, with communities from the CCZ numerically dominated by polychaete worms and crustaceans (including Tanaidacea, and Isopoda) (Borowski and Thiel 1998; De Smet et al. 2017; Wilson 2017; Francesca et al. 2021; Washburn et al. 2021).
Most macrofaunal abundance is found at the sediment–water interface with abundance, diversity and community structure varying across the CCZ in response to variations in particulate organic carbon (POC) flux, variations in sediment characteristics and nodule abundance (De Smet et al. 2017; Washburn et al. 2021; Chuar et al. 2020; Wilson 2017). At local scales however, (e.g., within contract areas; GSR), there is no significant difference in the community composition of the soft sediment macrofauna in relation to the presence/absence of nodules (Francesca et al. 2021) and some known common macrofaunal species have shown to have spatial ranges from hundreds to thousands of kilometres across the CCZ (Washburn et al. 2021; Wilson 2017).
6.3.2.1 Baseline Investigations
The methods and proposed survey array for NORI-D will provide data to meet the following objectives:
1. Establish the biodiversity in terms of species richness estimators in the NORI-D sampled regions.
2. Compare the baseline diversity in impacted areas (e.g., the IRZ) to reference sites (e.g., the PRZ, other control sites, APEIs and other abyssal locations).
3. Compare the regional distribution patterns (species ranges and biogeographic patterns confirmed with DNA analysis) of fauna in impacted sites to other areas in the CCZ and globally.
4. For taxa that are present in more than one site, and in sufficient numbers to enable analysis, determine the degrees of population connectivity as measured using population genetic methods (e.g., analyses of haplotype diversity, frequencies and distribution), and discern any demographic patterns such as the stability of populations.
In addition to addressing these questions, the Natural History Museum (NHM) in London and the University of Gothenburg (UoG) team will also undertake integrative DNA taxonomy on new species recovered from the sampling, directly benefiting the iterative development of knowledge of not only NORI-D but the wider CCZ.
It should be noted that in regards Annex I of ISBA/25/LTC/6 the NHM/UoG team have defined and published the standards necessary (Glover et al., 2016) to implement paragraph 32(a).
In total, 47 box-core samples collected on Campaign 5A (16/10/20 -30/11/20) at the sites shown in Figure 6-3, were accepted for quantitative work; five box-core samples where the top water had drained out were sampled for nodule fauna and live-sort only. Following recovery and quality assessment, quantitative box-cores (n=47) were sampled quantitatively for megafauna, nodule fauna, and

Document Number: FINAL
Revision: V20
Revision Date: 24 September, 2021
Page 6-11
macrofauna, with a live-sort of a 15 cm x 15 cm square subsample (either one or two 15 cm x 15cm samples) sampled at 0 cm - 2 cm and 2 cm - 5 cm depth layers (Figure 6 4).
Figure 6-3. Macrofauna box-core sites Campaign 5A (16/10/20 -30/11/20) in CTA and surrounds (A) and PRZ (B)

Document Number: FINAL
Revision: V20
Revision Date: 24 September, 2021
Page 6-12
All remaining sediment was sieved on 300-micron sieves sliced in 0-2 cm, 2-5 cm and 5-10 cm layers and the residue retained on 300-micron sieves bulk fixed in non-denatured ethanol. In the live-sorting process, all specimens were imaged, and preliminary identifications were given, with most specimens individually preserved in 80% ethanol in barcoded sample jars or tubes linked to a database. Sediment residues from the 15x15cm live-sort were returned to respective bulk-fixed depth layers following the removal and processing of animals.
The preliminary results presented are pooled data from the 15x15cm sub-samples from all the box-cores collected on Campaign 5A. Samples have been pooled into the following categories based on the location of the collection site:
• CTA – Collector Test Site (purple bounding box blue infill; Figure 6-3A)
• CTA – Near Field (dark green bounding box NE of Collector Test Site [TF]; Figure 6-3A)
• CTA – Far Field (light green bounding box NE of Collector Test Site [TF]; Figure 6-3A)
• CTA – All other sites (Figure 6-3A)
• PRZ - All the samples collected in the Preservation Reference Zone (Figure 6-3B)
Figure 6-4. Images of recovered box-cores with topwater siphoned off.
These categories are the first attempt at pooled analyses from Campaign 5A; they are likely to change in the future as more data becomes available. Analysis undertaken is a measurement of the abundance of different community components (in most cases, at Phylum level) on these pooled data. This includes macrofauna found on nodules, but excludes meiofaunal taxa such as copepods, nematodes and ostracods, as is typical in macrofaunal studies (Figure 6-5 and Figure 6-6).
In total 4,824 specimens were collected with the box-core and a further 71 opportunistically collected from multicore deployments (Table 6-5). The most abundant faunal groups were annelids and crustaceans, followed by the nodule dwelling groups Bryozoa and Porifera. The large number of specimens in Cnidaria consists mainly of cf. Nausithoe, many of which could be old tubes with no living tissue remaining. The samples will form the basis of future analyses of biodiversity, biogeography and connectivity, all assessed with DNA-based integrative taxonomy.

Document Number: FINAL
Revision: V20
Revision Date: 24 September, 2021
Page 6-13
Figure 6-5. Images of the nodule fauna collected during Campaign 5A.
Image credits: H Wiklund, R Drennan, C Boolukos, G Bribiesca Contreras.
Figure 6-6. Images of the live-sorted macrofauna during Campaign 5A.
Image credits: H Wiklund, R Drennan, C Boolukos, G Bribiesca Contreras.

Document Number: FINAL
Revision: V20
Revision Date: 24 September, 2021
Page 6-14
Table 6-5. Number of specimens per phylum found in box-core and multi core samples†. PHYLUM BOX-CORE MULTICORE
Annelida 1,163 13
Arthropoda 1,347 2
Brachiopoda 48 0
Bryozoa 694 16
Chaetognatha 11 0
Chordata 21 0
Cnidaria 503 14
Ctenophora 1 0
Echinodermata 58 3
Foraminifera 5 0
Metazoa 43 0
Mollusca 316 1
Nemertea 4 0
Platyhelminthes 2 0
Porifera 608 22 †Note: This includes meiofaunal taxa excluded in subsequent analyses.
The dominance of the macrofauna by deposit feeding annelids and crustaceans from Campaign 5A (Figure 6-7) is as expected for the CCZ (e.g., Glover et al. 2002; De Smet et al. 2017; Washburn et al. 2021) and when meiofaunal taxa are excluded, the most abundant macrofaunal component is annelids (polychaete worms). Less expected is the high numbers of suspension feeding Porifera and Bryozoa, not previously reported for the CCZ. It is now recognised that there are a high number of small, hard-to-identify, macrofaunal organisms residing on nodules throughout the CCZ, for example, Plenaster craigi (Lim et al. 2017) and the results from NORI-D are likely attributed to the careful sampling of nodule fauna undertaken on Campaign 5A, which is rarely done in CCZ studies. It is likely that as other studies within the CCZ start to also survey nodule dwelling macrofauna using methods described in Glover et al. (2016) they will also find such high numbers.
Analysis of the abundance of the major faunal groups split into the CTA/PRZ categories outlined suggests that at this coarse level of resolution, the CTA and the PRZ sites are broadly similar in community composition (Figure 6-8).

Document Number: FINAL
Revision: V20
Revision Date: 24 September, 2021
Page 6-15
Figure 6-7. Overall composition of the macrofauna from all Campaign 5A sites pooled.
Figure 6-8. Relative abundance of the macrofauna from the NORI-D 5A sites.
With the samples based on the 15x15cm sub-sample only, variance is high across all samples and including standard error bars suggests that at present these differences between the sites are not significant (Figure 6-9).

Document Number: FINAL
Revision: V20
Revision Date: 24 September, 2021
Page 6-16
Figure 6-9. Community composition of the macrofauna from the NORI-D 5A sites.
As expected, owing to close proximity, there is yet no discernible differences between the sample sites within the CTA. This is at least suggestive (based on limited live sort data) that non-impacted areas within the CTA could be suitable secondary control sites for the collector test if required.
Studies for macrofauna are ongoing and additional baseline data has been collected during Campaign 5D.
6.3.3 Meiofauna Benthic meiofauna is defined (as per the ISA Recommendations ISBA/25/LTC/6) as the interstitial fauna found in seafloor sediments. Despite their ecological and evolutionary distinctness from larger organisms such as macro- and megafauna (meiofauna occupy the space in between the sediment grains, rather than pushing the sediment away to create living space), they are operationally defined as those organisms that will pass a 300 μm sieve and remain on a 32 μm mesh sieve.
Meiofauna are the most abundant components of the metazoan benthos in the deep sea (Rex and Etter, 2010) dominating the metazoan biomass below 3000m (Wei et al. 2010b) and are often the dominant metazoan size-class in food-limited abyssal waters, with the CCZ being no exception (Hauquier et al. 2019; Miljutina et al. 2010; Radziejewska 2014). In the north-eastern Pacific abyss, including the CCZ, a relatively high number of meiofauna higher taxa have been found (including, but not limited to, nematodes, harpacticoid copepods, ostracods, kinorhynchs, tardigrades, gastrotrichs, halacaroid mites, loriciferans, meiofauna-sized polychaetes). Nematodes especially dominate the metazoan meiofauna in these abyssal plains, followed by copepods as second most-abundant taxon. Both groups are very diverse in terms of genus/species richness, with up to 246 and 62 genera of nematodes and harpacticoids, respectively (Radziejewska 2014; Miljutina et al. 2010, and references therein) although these numbers are conservative, given the number of studies that are being conducted currently which expand the overall study area, and the fact that many undescribed taxa (mostly species and genera) are being recovered.

Document Number: FINAL
Revision: V20
Revision Date: 24 September, 2021
Page 6-17
Meiofauna abundance is expected to exhibit generally limited spatial and temporal variability in the wider region (Bik et al. 2010; 2012; Zeppilli et al,. 2011) although distinct differences between habitat/geoform and nodule density categories are expected on small-to-medium sized spatial scales (Thiel et al. 1993; Uhlenkott et al. 2020; Pape et al. 2017; Hauquier et al., 2019).
Recent evidence has shown that similar meiofaunal assemblages (although still in differing orders of dominance and rarity) may also occur in both nodule bearing, and nodule free sediment samples within the CCZ (Pape et al. 2017), potentially supporting the concept of low-level endemism for meiofauna taxa and nematode genera in the deep sea (Bik et al. 2010; 2012; Zeppilli, Vanreusel, and Danovaro 2011). However, more morphological and molecular studies support high meiofauna/nematode rarity levels and phylogenetic clustering across various licencing areas and APEIs, suggesting potential vulnerability to localized polymetallic nodule extraction (Hauquier et al., 2019; Macheriotou et al., 2020).
6.3.3.1 Baseline Investigations
The methods and proposed survey array for NORI-D will provide data to meet the following objectives:
1. Establish meiofauna (32 μm – 300 μm) benthic biology/ecology time-series (two sampling campaigns and collector test) from selected sites in the collector test area, adjacent plume impact areas, control sites, and preservation reference zone in order to enable a baseline study, including spatio-temporal aspects, and study of conditions pre- and post-impact.
2. Characterize meiofauna biological communities (i.e., metazoan meiofauna higher taxa, and Nematode genera/species as dominant taxon (> 85% abundance)) living within or on seafloor sediments and hard substrates in the investigated areas.
3. Characterize the environmental drivers of meiofauna communities in the investigated areas.
4. Investigate the relationship between habitat heterogeneity (e.g., nodule abundance and type), sediment type and meiofauna communities.
5. Develop a meiofauna dataset of baseline seafloor sediment ecological status that can be used to guide management actions during future operations.
The sampling strategy in the baseline survey seeks to maximize data collection to fill in knowledge gaps in spatial variability of infaunal communities in terms of community structure, richness, diversity/evenness, taxonomic distinctness, and functional diversity metrics, as well an assessment of metrics that indicate ecological quality status. The latter two are reliable indicators of disturbance which have been demonstrated in numerous publications and different types of habitats, as well as for different types of disturbances including physical disturbance and sedimentation. These metrics include trophic diversity index (TDI), Maturity Index (MI), and Ecological Quality Status (EcoQS). Calculating these metrics will be important to demonstrate the level of impact of the collector test in the direct impact area, the plume settlement zone and the control or reference areas.
During Campaign 5A, 83 cores from 55 deployments at 44 different sites were collected for meiofauna analyses, yielding a total of 732 samples (including 0-1, 1-3, 3-5, and 5-10 cm sediment slices for each core). While ISA (ISBA/25/LTC/6) recommends collecting the 0-5 cm slice of the sediment core, we opted to sample the 0-1 cm, 1-3 cm, 3-5 cm and the 5-10 cm slices from each sediment core for meiofauna analysis (Figure 6-10). This will allow a better understanding of vertical meiofauna distributions and enable comparisons with macrofaunal and biogeochemical sediment profiles. Studies have shown that >90% of the meiofauna resides in the top 3 cm of the sediment, with distinct community differences along the vertical sediment core profile (Radziejewska, 2014). Data can be pooled to provide 0-5 cm data for standard comparisons with other studies. Pseudo replication of at least three cores per deployment was included to assess small-scale spatial variability and reproducibility, an important factor in collecting accurate quantitative data.

Document Number: FINAL
Revision: V20
Revision Date: 24 September, 2021
Page 6-18
In addition, at each of seven sampling sites, surface nodules were collected from an individual core to investigate meiofauna presence in/on nodule material. Thiel et al. (1993) and Bussau et al. (1995) have demonstrated that nodule crevices, which are filled with sediment, harbour distinct meiobenthos from the surrounding sediments. Further research is needed to determine the extent and relative importance of these differences, and whether they are maintained for different nodule types and across the region.
As of February 2021, 66 samples have been processed ready for morphological analyses. In the coming year, meiofauna individuals from subsamples (10% or at least 300 individuals from each sample) will be identified and counted at higher taxon level under stereomicroscope (250× magnification). Preliminary data on a limited set of 0-1cm meiofauna samples (from the CTA) suggest densities of at least 40 individuals per 10 cm2 in the surface cm, comparable in magnitude to data from meiofauna baseline studies in other eastern CCZ contract areas (Hauquier et al. 2019; Miljutina et al. 2010; Pape et al. 2017; Uhlenkott et al. 2020). As more samples from the environmental baseline study are analysed, we expect meiofauna abundance to range between 100-250 individuals per 10 cm2 for the top five cm of the sediment, potentially with peaks of over 400 individuals per 10 cm2 (based on data from other contract areas) but dependent on local habitat conditions and heterogeneity.
Studies for meiofauna are ongoing and additional samples have been collected during Campaign 5D which are currently being analysed.
Figure 6-10. Sediment slicing for meiofauna analysis.
A) Using the aluminium plates, mud was sliced in between the core tube and the slicing ring. B) The plate was slid off the tube with light downward pressure (without pushing the core tube down further onto the extruder), removing the slicing ring and mud with it. C&D) Presence of nodules at the sediment surface and in the deeper sediment layers.
B

Document Number: FINAL
Revision: V20
Revision Date: 24 September, 2021
Page 6-19
6.3.4 Foraminiferal Meiofauna Benthic foraminifera are single-celled protists that are ideal bioindicators for ecological monitoring because of their high biodiversity, short turnover rate, low trophic status, varying degrees of environmental sensitivities, and high abundance in all marine environments (Schwing et al. 2018; Lei et al. 2015; Morvan et al. 2004; Mojtahid et al. 2006). Foraminiferal assemblages have been found to be highly diverse, yet very similar across nodule-rich sites within contract areas in the eastern CCZ (Goineau and Gooday 2019; 2017) with approximately 400 individual morphospecies (Goineau and Gooday 2017).
Some species of benthic foraminifera have been shown to colonize areas that have been exposed to episodic organic enrichment, physically disturbed sediment, and anoxia (Schwing et al. 2015; Romero et al. 2016), with biodiversity and biomass shown to rapidly decline after episodic plume settling events with faster documented recoveries than comparable macrofauna (Schwing, et al. 2018; Romero et al. 2016). As such, foraminifera represent a good candidate as indicator species, and internationally recognized and standardized marine biotic indices based on foraminifera assemblages such as the AZTI Marine Biotic Index (ForamAMBI) have also proven essential in monitoring benthic ecological quality status (EcoQS) and determining benthic habitat suitability (Borja et al. 2000; Alve et al. 2015; Jorissen et al. 2018; O’Malley et al. 2021).
6.3.4.1 Baseline Investigations
The methods and proposed survey array for NORI-D will provide data to meet the following objectives:
1. Establish foraminiferal biodiversity baselines using traditional taxonomic methods
2. Establish foraminiferal biomass baselines
3. Identify opportunistic indicator species
4. Calibrate the Foram-AMBI and calculate baseline pre-mining Ecological Quality Statuses.
Multicore samples (1 x core) were collected from 44 successful OKTOPUS MC20 multicore deployments during Campaign 5A. Foraminifera samples were sliced in the following sections 0-1 cm, 1-2 cm, 2-3 cm, 3-4 cm, 4-5 cm, 5-10 cm yielding 288 samples and have been processed and preserved in line with the ISA Recommendations. These samples are waiting analyses.
Studies of foraminifera are ongoing and additional samples have been collected during Campaign 5D which are currently being analysed.
6.3.5 eDNA-based Bioassessment of Eukaryotes The monitoring of marine biodiversity is traditionally performed using morph-taxonomy-based methods (described above), focusing on selected morphologically identifiable biological quality elements (mega-, macro-, and meio- fauna).
As significant taxon gaps in DNA databases have been shown to limit the use of marine metabarcoding of macrofauna (Hestetun et al. 2020) environmental DNA (eDNA) can be used to complement these traditional methods (Valencia et al. 2016) and can be used to characterize microeukaryote communities (Shulse et al., 2017).
To facilitate taxonomic studies and potential use of metabarcoding for future environmental impact assessments within the CCZ, new species are being described with type material stored in museums and DNA sequences uploaded to NCBI GenBank (e.g., Wiklund et al. 2019).
6.3.5.1 Baseline Investigations
The methods and proposed survey array for NORI-D will provide data to meet the following objectives:
1. Determine deep-sea eukaryotes diversity and biotic indices using sedimentary eDNA.

Document Number: FINAL
Revision: V20
Revision Date: 24 September, 2021
Page 6-20
2. Determine the taxonomic composition of eukaryotes communities and identify abundant species.
3. Compare these data with data from other CCFZ regions.
4. Compare these data with morphotaxonomy-based methods.
As a preliminary study, fifty sediment samples within NORI-D from Campaign 6A were collected from box-cores and shipped to ID-Gene ecodiagnostics in Switzerland for analysis.
Over 60 million high-quality sequences were obtained for two nuclear ribosomal markers (18S V1V2 and 18S V9) targeting wide range of eukaryotic taxa (ID Gene ecodiagnostics, 2019).
Using eDNA analysis, eukaryotic OTUs were classified into 6 different categories (Alveolata, Excavata, Metazoa, Rhizaria, Stramenopiles and Others) (Figure 6-11). This was done for both markers (V1V2 and V9). Metazoa were classified into 5 categories (Annelida, Arthropoda, Nematoda, Nemertea and Other). The most abundant Metazoa OTUs assigned to the genus/species were reported in Figure 6-12. The taxonomic composition as depicted by the two markers presented a significance dominance of Nematoda and Annelida.
Figure 6-11. Taxonomic composition of eukaryotic communities using V1V2 and V9 markers and considering the richness (number of OTUs) or the abundance (number of reads).

Document Number: FINAL
Revision: V20
Revision Date: 24 September, 2021
Page 6-21
Figure 6-12. Taxonomic composition of Metazoa communities using V1V2 and V9 markers and considering the presence (OTUs) or the abundance (reads) of each OTU.
Fifty-seven sediment samples from the UK exploration area were analysed using the same protocol as with V9 marker. Alpha-diversity, beta-diversity and biotic indices were calculated and compared with the results obtained for NORI-D samples. While alpha-diversity and biotic indices did not significantly differ between the two sites (Figure 6-13A), eukaryotic communities profiles showed a clear separation between NORI and UK samples. NORI samples communities also appeared less spread than the UK samples communities, indicating less variations in the composition of communities. (Figure 6-13B).
Studies for eukaryote eDNA are ongoing and additional baseline data were collected during Campaign 5A and 5D.

Document Number: FINAL
Revision: V20
Revision Date: 24 September, 2021
Page 6-22
Figure 6-13. (A) alpha-diversity indices (B)NMDS calculated using V9 marker for UK area samples (red) and for NORI_D samples (green).

Document Number: FINAL
Revision: V20
Revision Date: 24 September, 2021
Page 6-23
6.3.6 Microbial Prokaryotes To comprehensively characterize microbial communities, metabarcoding represents a convenient and efficient tool for deep-sea surveys due to its high sensitivity, high throughput, and low volumes of material needed. A few recent studies have taken advantage of eDNA metabarcoding to unveil the prokaryote assemblages associated with sediments and nodules within the CCZ (e.g., Wang et al. 2010; Dong et al. 2016; Lindh et al. 2017; 2018; Shulse et al. 2017).
Studies to date suggest regional similarity in taxonomic diversity and community composition across sampled areas of the CCZ, but clear differences per habitat type (sediment and nodule versus seawater samples) and cruises (likely due to differences in high- throughput sequencing library preparation) (ISBA 2020). While the available literature reveals some insights on microbial communities populating sediments and nodules within the CCZ, it is acknowledged that the current information provides poor temporal and spatial resolution, with most data deriving from sampling conducted in 2015 in the north-eastern section (including UK1, Ocean Mineral Singapore (OMS), and APEI 6 sites).
6.3.6.1 Baseline Investigations
The methods and proposed survey array for NORI-D will provide data to meet the following objective:
• Characterize the relative abundance, composition, diversity, and the spatio-temporal variability of the taxonomic and functional prokaryotic community (focusing primarily on bacteria) within sediment core samples.
Multicore samples (1 x core) were collected from 44 successful OKTOPUS MC20 multicore deployments during Campaign 5A. eDNA samples were sliced in the following sections (including. nodules) 0-2 cm, 3-5 cm yielding 561 samples. These samples are cryogenically stored and awaiting analyses.
Studies for microbial prokaryotes are ongoing and additional samples were collected during Campaign 5D.
6.3.7 Metazoan & Microbial Metabolic Activity Upper-ocean dynamics (e.g., stratification) fluctuate through the year in open-ocean environments, which alters surface ocean primary production, and the export of particulate organic carbon (POC) to the seafloor; POC flux is the main driver regulating seafloor respiration and biogeochemistry, redox zonation, nutrient fluxes, bioturbation rates, and benthic metabolic activity at the abyssal seafloor (Smith et al. 2008).
6.3.7.1 Baseline Investigations
The methods and proposed survey array for NORI-D will provide data to meet the following objectives:
• Establish the baseline sediment physical and benthic biogeochemical/ecosystem function properties (inc. sediment respiration, metabolic activities of the benthos).
• Determine how these change with the abundance and type of nodules, as well as spatially and temporally across NORI-D.
Studies for metazoan and microbial activity are ongoing. Landers were deployed during Campaign 5D and will be deployed on Campaign 5E.
6.3.8 Trace Metals & Potential Toxic Elements Many metals (e.g., copper, lead, cadmium, chromium, mercury, zinc, arsenic, nickel, iron, lanthanum, yttrium) have been shown to exert toxic effects across trophic levels: from phytoplankton and zooplankton

Document Number: FINAL
Revision: V20
Revision Date: 24 September, 2021
Page 6-24
to top level predators and humans that consume contaminated fish (Brown et al. 2017; Hauton et al. 2017; Mestre et al. 2017).
The types of adverse effects have also been seen to range from oxidative stress and depleted energy reserves to declines in populations and biodiversity (Sokolova and Lannig 2008). While the toxicity and mode of action for most individual metals is well known, we still lack the ability to predict the impact of the mixtures of metals and other pollutants that may be released by mining the deep-sea; especially under the extreme cold temperature and pressure conditions in which they will be released (Hauton et al. 2017).
6.3.8.1 Baseline Investigations
The methods and proposed survey array for NORI-D will provide data to meet the following objectives:
• Determine the baseline metal concentrations in key selected benthic fauna from the NORI-D area and investigate how levels change inter-annually or following system testing.
• Determine the baseline metal concentrations in key selected pelagic fish from the NORI-D area and investigate how levels change inter-annually or following system testing.
• Describe the movement of metals through the food web.
Trace metals studies are ongoing with samples collected from Campaigns 5B, and 5D. Additional baseline data will be collected during Campaign 5C and 5E.
6.3.9 Bioturbation Faunal-mediated sediment mixing (bioturbation) is a key process in marine sediments partly dictating how much carbon is mixed into seafloor sediments (Smith et al. 1993; Smith and Rabouille 2002). Furthermore, it is a readily measured index of benthic community activity indicating the depth scales over which redeposited sediment will be mixed during community recovery (ISBA, 2002).
However, bioturbation activity (rates) has only been assessed at the abyssal seafloor in the central Pacific along the 140°W transect as part of the EQPAC programme (Smith et al. 1997) with bioturbation occurring in the top 1-2 cm of sediment at abyssal depths, and the mixed-layer depth shallows under more oligotrophic conditions.
Recent, in situ studies in the UK1 and OMS contract areas of the CCZ have shown that microbes dominate benthic biomass in upper sediment (0 cm - 5 cm) layers and are the most important organism group cycling organic material (Sweetman et al. 2019). They are also capable of absorbing significant amounts of dissolved inorganic carbon into their biomass thereby removing carbon dioxide from the water column. Thus, microbes and macrofauna play extremely important ecosystem roles in abyssal environments (Mevenkamp et al. 2017; Stratmann et al. 2018).
6.3.9.1 Baseline Investigations
The methods and proposed survey array for NORI-D will provide data to meet the following objectives:
• Establish the baseline sediment physical and benthic biogeochemical / ecosystem function properties (inc. bioturbation rates, and porewater nutrient profiles)
• Determine how these change with the abundance and type of nodules, as well as spatially and temporally across the NORI-D claim area.
Studies for bioturbation activity are ongoing with samples collected on Campaigns 5A and 5D with additional baseline data to be collected on Campaign 5E.

Document Number: FINAL
Revision: V20
Revision Date: 24 September, 2021
Page 6-25
6.4 Pelagic Baseline
Mid-water ecosystems have been studied very little in the CCZ, in part due to a focus on mining-specific effects on the seafloor. However, deep-sea mining activities may have a variety of potential effects on biological communities in the ocean’s mid-waters or pelagic realm (Christiansen, Denda, and Christiansen 2020; Drazen et al. 2019a; Drazen et al. 2020).
Deep mid-waters have established ecological and societal importance. These ecosystems represent more than 90% of the liveable volume on our planet (Robison 2009) contain a fish biomass 100 times greater than the global annual fish catch (Irigoien et al. 2014), connect shallow-living ecosystems to deeper ones including the benthos, and play key roles in carbon export (Boyd et al. 2019), nutrient regeneration, and in the provisioning of harvestable fish stocks (Drazen and Sutton 2017).
There have been limited studies of pelagic fauna in the benthic boundary layer (BBL) of the CCZ (Kersten et al. 2017; Kersten et al. 2019) with recent eDNA diversity studies for metazoans identifying the BBL as the most diverse region of the water column, highlighting the importance of targeted sampling within this depth horizon for baseline surveys (Laroche et al. 2020).
Water sampling from surface to seafloor has provided some information on surface phytoplankton (Zinssmeister et al. 2017) and water column microbial communities (Lindh et al. 2017; 2018; Shulse et al. 2017). These limited studies highlighted several key features of the CCZ upper and mid water column: 1) water column planktonic microorganisms are genetically distinct from those inhabiting the abyssal sediments or those associated with polymetallic nodules (Lindh et al. 2017; Shulse et al. 2017); 2) the mid-water oxygen minimum zone (OMZ) plays a key role in structuring water column microbial distributions (Lindh et al. 2018). This OMZ varies vertically along an east-west gradient through the CCZ, with its vertical position shoaling upwards toward the eastern CCZ; and 3) water column microbial communities (eukaryotic and prokaryotic) segregate vertically, including a distinct and diverse assemblage of microbes in the mesopelagic waters (between approximately 200-1000 m; Shulse et al. 2017).
Studies of meso- and bathypelagic zooplankton and micronekton have been conducted around the CCZ but not within. Zooplankton and micronekton assemblages have been characterized in some areas of the central Pacific, including around Hawaii (De Forest & Drazen 2009; Drazen et al., 2011; Landry et al. 2001; Maynard, Riggs, and Walters’, n.d.; Reid et al. 1991; Sommer et al. 2017; Valencia et al. 2016; Young, 1978), in the equatorial region south of Hawaii (Barnett 1984; Clarke 1987) and in the Costa Rica Dome region to the east of the CCZ (Evseenko & Shtaut 2005; Maas et al. 2014; Wishner et al. 2013). Although these studies provide useful information for the wider Pacific region, they are location, taxon and/or size class specific and reveal only a partial assessment of communities.
6.4.1 Baseline Investigations During Campaign 5B (05/03/21 -14/04/21) NORI implemented pelagic studies to provide baseline data for the operational ESIA with the following objectives:
• Characterize the abundance, biomass, composition and diversity of the microbial community (focusing on Bacteria and Archaea) from the surface to the benthic boundary layer.
• Characterize the composition, biomass, and productivity of phytoplankton communities in the epipelagic zone.
• Characterize the abundance, biomass, diversity and composition of the zooplankton community from the surface to the benthic boundary layer.
• Characterize the abundance, biomass, diversity and composition of the gelatinous zooplankton community from the surface to the benthic boundary layer.

Document Number: FINAL
Revision: V20
Revision Date: 24 September, 2021
Page 6-26
• Characterize the abundance, biomass, diversity and composition of the micronekton community (small fishes, squids and shrimps) from the surface to the benthic boundary layer.
• Determine food web linkages between trophic levels of dominant taxa in the region using stable isotope analysis.
• Characterize temporal variability of all above listed pelagic biological communities.
• Determine the sound scattering density of mid-water animals and resolve diel vertical migration.
At the time of writing the pelagic specimens collected during Campaign 5B (Figure 6-14) have been transported to the University of Hawaii at Manoa for identification and analysis. Additional samples will be collected during Campaign 5C.
6.4.1.1 Preliminary data
Data from moorings indicates that diel vertical migration was readily observable on the upward-and downward-looking 75 kHz ADCPs mounted at 500 m depth on the Long Mooring (Figure 6-15 and Figure 6-16). As expected, deep scatters were not observed at the other ADCPs placed at deeper depths along the Long Mooring or on the two deeper reference moorings.
The 500 m depth location appeared to be well suited for viewing the presence of the deep scattering layer and its daily migration pattern. Based on a cursory visual review of the data, the majority of daytime backscatter fell between 300 m to 550 m depth, with weaker scattering signal extending as deep as 850 m.
Migration corridors appear to extend between 100 m to 300 m depth – these had a steep vertical orientation that was likely a function of the limited hourly pinging (Figure 6-15). There appeared to be a strengthening of the overnight signal in the upper 100 m of the water column (Figure 6-16), likely a function of scatterers concentrating into surface waters.
Overall, this pattern appears to be in agreement with previous studies in the Eastern Pacific (Klevjer et al. 2016) with migrators correlating to oxygen at low oxygen levels.

Document Number: FINAL
Revision: V20
Revision Date: 24 September, 2021
Page 6-27
Figure 6-14. Pelagic specimens collected during Campaign 5B (yet to be identified)

Document Number: FINAL
Revision: V20
Revision Date: 24 September, 2021
Page 6-28
Figure 6-15. Upward-looking ADCP backscatter intensity plots (75 kHz) at 500 m depth from January 2 to January 12, 2020.
Notes: Visible pattern of alternating upward and downward migration over the course of the day are shown from the changes in intensity colour. During overnight hours, one can see a concentration (thin green layer) in the upper-most regions of the water column and between 200-300 meters above the ADCP (somewhat blurry signal). During daylight hours, the concentrated green area is generally absent, replaced with a lighter blue signature in the shallowest waters and more concentrated intensity (warm colours –red, orange, yellow) is apparent between 0 and 150meters above the ADCP. The light blue vertical streaks between 200-400 m above the ADCP coarsely exhibit the vertical migration between the upper and lower depths.
Figure 6-16. Downward looking ADCP backscatter intensity plots (75 kHz) at 500 m depth from March 30 to April 09, 2020
Notes: The visible pattern of alternating upward and downward migration over the course of days is shown from the changes in intensity colour. The increasing concentration (green layer ~ 300 meters below the ADCP) may be a function of lunar phase, seasonality, or a combination of the two and other factors.
Studies of the mid-water pelagic baseline are ongoing and baseline data is being collected during Campaigns 5B and 5C.
6.5 Marine Mammals, Birds, Turtles, Bony Fish & Sharks
Large vertebrates (particularly seabirds and marine mammals) are useful bio-indicators of the upper trophic levels of the food chain. Their distribution has the potential to reflect prey abundance lower in the food chain (e.g., phytoplankton, zooplankton, nekton and fish) and can reflect the status of the ecology of the upper water column.
6.5.1 Baseline Investigations Opportunistic observations of seabirds and marine mammals were recorded in a non-standardised but daily basis during NORI-D surveys in 2018 and 2019 (Campaign 6A and 6B). A total of 16 identified bird

Document Number: FINAL
Revision: V20
Revision Date: 24 September, 2021
Page 6-29
species and several unidentified bird species were observed during the campaigns. Abundant sightings of red footed booby (Sula sula) and masked booby (Sula dactylatra) were recorded across the area. Marine bird species assessed as being threatened under the International Union for Conservation of Nature (IUCN) Red List of Threatened Species were sighted within NORI-D, including the critically endangered Newell’s shearwater (Puffinus newelli), the endangered Hawaiian Petrel (Pterodroma sandwichensis), the near threatened black footed albatross (Phoebastria nigripes) and Laysan Albatross (Phoebastria immutabilis).
More than 100 spinner dolphin (Stenella longirostris) sightings occurred during the 2019 Campaign 6B. There were no recorded sightings of other cetaceans. A single manta ray (Mobula sp.) was recorded in the western zone of NORI-D and one endangered green turtle (Chelonia mydas).
On Campaign 5A, the PelagOS (Pelagic Observer System) was employed to collect opportunistic data on surface observations. PelagOS is a marine monitoring application specifically designed to replace ad-hoc observations with a streamlined recording and reporting system that provides the user with a range of simple data collection and processing capabilities. Training, built-in species lists and photo guide helps to ensure accuracy of species identification at sea which is further quality assured through validation by our offsite taxonomic experts.
A total of 25 biological observations were recorded by observers during Campaign 5A. Using PelagOS, the post-cruise quality assurance process was able to identify an additional 17 observations from photographs that were not recorded at the time. The total number of 43 biological observations in 39 days of observation is considered relatively low, this could be due to low productivity in the survey area, absence of fauna, challenging sighting conditions or a combination of all of these factors. Biological observations were dominated by bird species (28 records). The remaining observations were made up of 9 fish and 5 marine mammal (all cetacean) sightings. No marine reptiles were recorded during this cruise.
Birds - The most commonly recorded seabird species were the brown booby (Sula leucogaster) and masked booby (Sula dactylatra, Figure 6-17A). One species of normally terrestrial bird, the cattle egret (Bubulcus ibis, Figure 6-17B), was also recorded multiple times during the cruise. No significant bird aggregations were recorded.
Fish - Mahi mahi (Coryphaena hippurus, Figure 6-17C) was the most commonly observed fish species (three records). Also, of note was one sighting of a manta ray (no verification image) and one sighting of tuna. No sharks were reported from this cruise.
Marine mammals - Five marine mammal sightings were recorded during the cruise, all being from the Order Cetacea and identified as bottlenose, spinner, and likely spotted dolphins. The most prevalent species of dolphin was the oceanic bottlenose dolphin (Tursiops truncates, Figure 6-17D) which was sighted on two occasions, most notably on one occasion, in a large group of several hundred individuals. No large whale species were visually detected during this cruise.
The deployment of moored hydrophones has proven to be a powerful tool for investigating the presence, distribution, migration, relative abundance and behaviour of marine mammals (Erbe et al. 2017). Two underwater sound recorders were successfully deployed on a static mooring within the NORI-D at depths of 520 m (shallow) and 4,295 m (deep) by CSA Ocean Sciences Inc on 14 October 2019 (see, Section 5.5.1). The shallow recorder recorded 1 minute in every 5 minutes for the whole deployment up until 26 June 2020 (257 days in the water), but the deep recorder stopped on 8th May 2020 after recording 1 minute in every 5 mins 44 s for 207 days in the water which results in over 2,000 hours of underwater sound recordings (CSA 2020).

Document Number: FINAL
Revision: V20
Revision Date: 24 September, 2021
Page 6-30
Figure 6-17. Examples of surface biota observations from NORI-D
A) Masked booby (Sula dactylatra); B) Cattle egret (Bubulcus ibis); C) Mahi mahi (Coryphaena hippurus); D) oceanic bottlenose dolphin (Tursiops truncates).
A bioacoustics analysis workflow has been developed, which combines automatic routines and systematic manual reviewing of recordings (Parnum 2020). Automatic detection routines include one that searches for FM signals (such as dolphin whistles and whale calls) and another for low frequency tones (e.g., blue whale calls and songs). From preliminary analysis, Delphinidae (dolphins), Physeteroidea (sperm whales), and minke whales have been detected on the shallow recorder; and Delphinidae on the deep recorder. The sample rate and hydrophone sensitivity used for these recordings were too low to be able to detect Ziphiidae (beaked whales) species.
It is likely the sounds detected from Delphinidae, Physeteroidea, and minke whales were made within the NORI-D area, as it is unlikely any of these sounds could be detected beyond the range from the mooring to the nearest boundary which was approximately 60 km away. Future deployments of the mooring arrays will include the addition of a SoundTrap ST500HF hydrophone to target high frequency vocalisations (e.g., beaked whales).
Beaked whales are of specific relevance in the CCZ due to their occurrence in the area (Barlow et al. 2009) their deep-diving behaviour (Schorr et al. 2014) and therefore possible interaction with deep-sea mining (Marsh et al. 2018), and their sensitivity to anthropogenic noise (Pirotta et al. 2012). To improve the project’s capability of detecting beaked whale species, multiple deployments of a drifting hydrophone system, targeting high frequency vocalisations, will be conducted throughout NORI-D during offshore environmental baseline campaigns. The system comprises of a ST500HF (high frequency) SoundTrap that records at a bandwidth of 20 Hz–150 kHz, which covers the vocalisation spectrum of beaked whales (25 kHz - 60 kHz) (Figure 6-18). The unit will be mounted in a protective frame and attached to a buoyed drifting line. The system may be deployed to two depths (either 300 m or 450 m). This capability allows for flexibility in determining the optimum deployment depth for detection of beaked whales and other cetacean species.

Document Number: FINAL
Revision: V20
Revision Date: 24 September, 2021
Page 6-31
Figure 6-18. Hydrophone setup and operation
Schematic: 450 m long drifting hydrophone; Photos: Deck deployment of drifting hydrophone (A&B); Drifting hydrophone surface string in-situ post deployment (C).
A solar powered SOFAR Spotter V2 buoy with Iridium Satellite capability will be attached to the buoy line and used to track the system. The Spotter V2 buoy will also collect data on wave height and sea surface temperature. Acoustic data collected during hydrophone deployments will be downloaded after retrieval of the drifter. Detections will then be assigned to the lowest taxonomic level possible, which is usually to the sub-order level for cetaceans. Acoustic detections will be time-matched to at-sea observations to seek a greater level of confidence when assigning species identification to acoustic detections.
A total of six drifting hydrophone deployments were achieved during Campaign 5A. The hydrophone was placed at a depth of 450 m and the water depth at the deployment sites ranged from 4,057 m to 4,350 m. Recording times ranged between 40 and 175 hours per deployment with an overall recording time of 544 hours across the six deployments. Analysis of the data recovered is yet to be completed.
Hydrophone studies and observations for surface biology are ongoing and baseline data is being collected from ongoing and future environmental campaigns.

Document Number: FINAL
Revision: V20
Revision Date: 24 September, 2021
Page 7-1
7 PHYSICOCHEMICAL ENVIRONMENTAL IMPACTS
7.1 Overview
This section identifies and assesses the direct and indirect impacts of the collector test to the physicochemical components of the receiving environment. Impacts of various stages of the collector test are considered for the following zones: atmospheric (above surface), euphotic (0 to 200 m), mesopelagic (200 to 1,000 m), bathypelagic (1,000 to 4,000 m) and abyssal (4,000 to 6,000 m) including the benthic component. A summary of relevant environmental effects considered (that is, project related activities that interact with the physicochemical receiving environment) is provided in Table 7-1.
The collector test EIA is a sub-component of a comprehensive operational ESIA that is currently in progress. It is anticipated that all planned ESIA baseline studies will be completed by Q3/2022, until then gaps may remain in our understanding of the sensitivity of key valued ecosystem components (VECs) represented in NORI-D. Where uncertainty exists, it has been acknowledged, and a precautionary approach applied. It is a key objective of the collector test to collect information which reduces the level of inherent uncertainty for the operational phase of the project.
Table 7-1. Summary of environmental effects for the physicochemical environment
ACTIVITY VULNERABLE VECS ENVIRONMENTAL EFFECTS
Return transit of vessel from San Diego to the CCZ
Air Quality / GHG Vessel’s diesel engines will emit fumes into the atmosphere.
Light / Noise / Vibration
Vessel will be illuminated at night and the and diesel engines will generate noise and vibration.
Water Quality Intentional or accidental release of pollutants from the vessel.
Offshore Inspection and Preparation Water Quality Leakage of hydraulic fluids, oil, or other substances from the
ROV.
PCV Deployment Water Quality Leakage of hydraulic fluids, oil, or other substances from the PCV.
Riser Commissioning
Water Quality Leakage of hydraulic fluids, oil, or other substances from the ROV.
Noise / Vibration Surface and/or subsea noise or vibrations caused by pressure testing of the riser pipe.
Subsea Connection of Jumper on PCV Water Quality Leakage of hydraulic fluids, oil, or other substances from the
ROV.

Document Number: FINAL
Revision: V20
Revision Date: 24 September, 2021
Page 7-2
ACTIVITY VULNERABLE VECS ENVIRONMENTAL EFFECTS
System Testing
Water Quality Manoeuvring the PCV on the seabed, pick-up test runs, and system test runs will physically disturb the sediments and nodules creating a sediment plume.
Light / Noise / Vibration
The PCV will be equipped with lights and cameras to monitor operations during system testing.
Manoeuvring the PCV on the seabed and pick-up test runs will create noise and vibration.
Riser installation and commissioning tests, system integration testing, and system test runs all have the potential to create noise and vibration at the surface and throughout the water column from use of the air lift and through pressure testing of the system.
Sediment Geochemistry and micro-topography
Manoeuvring the PCV on the seabed, pick-up test runs, and system test runs will mix the surface layers of the sediment.
Water Quality Mid water plume will be released into the bathypelagic zone at 1,200 m.
Riser and PCV Recovery Water Quality Leakage of hydraulic fluids, oil, or other substances from the
ROV.
7.2 Environmental Effects
The environmental effects of the collector test have the potential to impact a number of physicochemical VECs including: air quality and greenhouse gases, acoustics and vibration, ambient light, water quality, sediment biogeochemistry and micro-topography.
Relevant environmental effects have been categorised as:
• Those associated with surface vessel operations, such as atmospheric emissions, acoustics, light, and routine vessel discharges which will primarily affect the surface and ambient environment.
• Those specific to the collector test operations such as changes to water quality, plume generation, sediment biogeochemistry, and the generation of noise and vibration within the water column.
Impact assessment focusses primarily on the second category as many of the impacts associated with routine shipping operations are mitigated through adherence to international conventions and guidelines or through the shipping companies standard operating procedures.

Document Number: FINAL
Revision: V20
Revision Date: 24 September, 2021
Page 7-3
7.3 Surface Vessel Operations
7.3.1 Air Quality & GHG Emissions All vessels used to execute the project will be registered in a country that has ratified the Protocol of 1978 relating to the International Convention for the Prevention of Pollution from Ships (MARPOL). MARPOL is the main international convention aimed at the prevention of pollution from ships by operational or accidental causes (see Section 2.5 for details).
Adherence to MARPOL requirements will minimise the risk of pollution to the marine environment and atmosphere in accordance with established international practices.
7.3.2 Noise & Vibration Commercial shipping vessels operate in almost all parts of the ocean and are the major source of anthropogenic noise (McKenna et al. 2013). The predominant noise from shipping is low frequency (<500 Hz) (OSPAR5, 2009). Underwater sound is made up of both particle motion and acoustic pressure. While sound pressure in the marine environment naturally acts in all directions, vibration is particle oscillation back and forward in a particular direction (ISO/DIS, 2016). Species exposed to ocean noise can experience damage from either component of sound-pressure or vibration.
The main components of underwater noise are generated from the ship design (that is, hull form, propeller, the interaction of the hull and propeller, and machinery configuration), which are fixed dependent on the design of the ship used. However, operational modifications and maintenance measures can be implemented as ways of reducing noise for both new and existing ships. In 2014, the International Maritime Organisation (IMO) developed non-mandatory technical guidelines to minimize the introduction of incidental noise from commercial shipping operations into the marine environment to reduce potential adverse impacts on marine life. These guidelines provide shipping operators with recommend design and operational measures to reduce radiated noise6, that will be implemented during the project as practicable.
In addition, the IMO has designated “Particularly Sensitive Sea Areas” (PSSAs) that deserve special protection due to their recognized ecological, socio-economic, or scientific significance, and which may be vulnerable to damage by ships. Ship routeing measures are proposed for adoption in connection with a PSSA to protect marine life. The CCZ is not designated as a PSSA.
Most noise and vibration generation by the ship’s propeller and hull will occur during transit to and from the CCZ. Whilst on station, ship movements will be minimised although there will still be some noise and vibration generated by the dynamic positioning thrusters.
7.3.3 Light As operations will be continuous surface vessels will emit light during the hours of darkness. Known and potential impacts to biota from changes to ambient light regimes include: (i) hindrances to navigation, migration, and communication; (ii) localised suppression of zooplankton diel vertical migration by artificial skyglow; (iii) aggregating fish under lighting leading to intensified predation; (iv) night-time bird strikes on illuminated vessels; (v) altered recruitment and site selection of invertebrate larvae (Merkel et al., 2011; Davies et al., 2014; 2015; 2016; Black 2005; Hu et al., 2018).
Lighting of the back deck of the vessel will be unavoidable during night-time operations. High intensity lighting (e.g., spotlights) will only be used as necessary (e.g., during equipment deployment) and night-time ambient light levels will be maintained at levels appropriate for the activities being undertaken. As
5 OSPAR: Convention for the Protection of the Marine Environment of the North-East Atlantic 6 https://www.imo.org/en/MediaCentre/HotTopics/Pages/Noise.aspx

Document Number: FINAL
Revision: V20
Revision Date: 24 September, 2021
Page 7-4
NORI-D is not located in an area of high marine traffic it is unlikely that cumulative light impacts will be of concern.
7.3.4 Water Quality Water quality within NORI-D is considered near pristine (Section 5.7) and is important for sustaining a diverse ecosystem from the surface to the seafloor. Due to the distance of the site from the nearest source anthropogenic pollutants from the land, these pristine conditions are widely distributed and abundant throughout the offshore deep-sea environments in this part of the Pacific Ocean.
Intentional or accidental releases of pollutants from vessels can take the form of oil, garbage, chemicals, fuel, sewage, and non-putrescibles such as plastics. Adherence to MARPOL will minimise the potential of pollution from ships by intentional or accidental causes (see Section 7.3).
7.4 Collector System Testing
7.4.1 Noise & Vibration While the SSV is on station noise will be generated by onboard machinery used during the collector test and the dynamic positioning thrusters. A source of underwater noise will be the air lift fitted to the riser pipe, used to inject compressed air at up to 200 bar into the pipe to lift large particle slurry material (consisting of nodules, sediment, and seawater) to the SSV. Injection of air and the impact of nodules with the walls of the riser pipe will cause underwater noise and vibration. It is not known at this stage what levels of noise and vibration will be generated by the system or if it will be impacting to marine species. During the collector test an array of hydrophones, positioned at varying depths and distances from the source, will be deployed to collect this data.
The air lift will only be in operation during the system integration test and system test runs, limiting the time of underwater noise and vibration generation from this source to approximately 259 hours.
The electric motors and nodules passing through the onboard nodule processing system of the PCV will be sources of benthic noise and vibration.
7.4.2 Light The camera systems on the PCV and ROV will be equipped with high intensity lights to illuminate the surroundings so that operations can be monitored and recorded. During benthic operations, the volume of water illuminated by submersible lights is limited, since the light cone shines mostly upon the substrate, rather than travelling through the water. Benthic operations represent a different type of impact than mid-water dives as sites on the sea floor are inherently static and many benthic organisms are sessile, there exists a possibility of benthic organisms being exposed repeatedly to light for extended periods of time. Although the vast majority of benthic sessile organisms are non-visual, and thus not likely to be affected by light, some visual benthic and epi-benthic organisms, particularly those specifically associated with substrates or communities under intensive study, may be at increased risk relative to their mid-water counterparts.
Researchers from the Monterey Bay Aquarium recommend that ongoing use of submersibles with lights should not be curtailed; although they might present a potential hazard to deep-sea fauna, the potential volume of impact is miniscule relative to the habitat volume (Kochevar, 1998).
The intensity of light emitted from the PCV and ROV and the potentially sensitive benthic organisms that may be impacted will be studied as part of the collector test monitoring program.

Document Number: FINAL
Revision: V20
Revision Date: 24 September, 2021
Page 7-5
7.4.3 Water Quality
7.4.3.1 Leakage of fluids from underwater equipment In the unlikely event of a leak, all chemicals used in submersible equipment (that is, ROV and PCV), will be compliant with OSPAR (2009) standards, ensuring compliance with established international standards for acceptable levels of environmental performance of chemicals in terms of toxicity, persistence, and bioaccumulation.
7.4.3.2 Return Water Temperature
As return water from surface processing of slurry passes down the steel return pipe it initially warms as passes through the upper layers of the water column then starts to cool with depth. When released, the temperature of the return water could be several degrees above the ambient seawater temperature (Figure 3-13). This will be verified during the Collector Test.
7.4.3.3 Sediment Plumes
Operations will generate two plumes, a benthic plume in abyssal zone at >-4,000 m and mid-water plume in the bathypelagic zone at -1,200 m. The benthic plume will be generated as the PCV moves across the seabed collecting nodules and in doing so disturbing bottom sediments up to a depth of 10-15 cm. The mid-water plume will be generated by the return of surface processing water from the SSV to the water column.
(a) Plume Composition
As the plumes originate from the same source material, both will consist of fine clay and silt material with elevated concentrations of authigenic manganese oxides. The proportion and size of broken nodule fragments in the benthic and mid-water plumes will differ as agitation in the riser pipe and surface processing will cause nodules to breakdown resulting in a higher proportion of small nodule fragments in the mid-water plume. This will be quantified during the Collector Test.
Studies have shown that the upper 10-15 cm of the sediments of the eastern CCZ are characterized by solid-phase Mn enrichments (Mewes et al., 2014) and a broad upper oxic zone expanding over > 0.5 m (e.g., Halbach et al., 1988; Mewes et al., 2014; 2016; Wegorzewski and Kuhn, 2014; Kuhn et al., 2017; Volz et al., 2018; Heller et al., 2018). In such oxic environments, reduction of oxides leading to the release of associated bound metals, is unlikely to occur (BGR, 2019). The mobilisation of particle-bound trace metals will instead be determined by the solubility of the particular minerals present, particle concentration and size (BGR, 2019). Conversely, adsorption of dissolved metals on to suspended particles will depend on pH, the type of minerals present, and their concentrations. Manganese and iron oxides, which are relatively abundant in CCZ sediments, are strong scavengers (BGR, 2019), which readily bind to dissolved metals.
Movement of the PCV across the seabed will disturb the top 10-15 cm of sediment which has mostly oxic porewater. Laboratory experiments investigating the impacts of deep-sea mining on water quality have shown an increase in particulate loads (and therefore an increase in available surface area of oxide particles) leads to increased sorption of particle-reactive elements from the water column (Koschinsky et al., 2003). Koschinsky et al. (2001) also reported the following findings:
• Nutrients and heavy metals were released to bottom waters as the pH decreased slightly after sediment disturbance. Following this mobilisation, fast re-adsorption of heavy metals onto suspended particles occurred.
• The time required and degree of metal adsorption were strongly dependent on the type of particle available, with manganese oxides having a stronger sorption capacity for most heavy metals than the sediment particles.

Document Number: FINAL
Revision: V20
Revision Date: 24 September, 2021
Page 7-6
• If the environment becomes more reducing, or if strongly complexing organic compounds are present, heavy metals are released rather than adsorbed which could occur where there is an increased availability of degradable organic matter or chemically reactive waste is deposited.
• The metals manganese (Mn), cobalt (Co), nickel (Ni), zinc (Zn), copper (Cu), cadmium (Cd), lead (Pb) and iron (Fe) were generally found in higher concentrations in sediment porewater than water of the overlying water column and show fast reabsorption to suspended particles after release and are strongly complexing organic agents (that is, a substance capable of forming a complex compound with other materials in solution).
These findings (summarised in Figure 7-1) indicate that if high concentrations of dissolved metals are released from pore waters during sediment disturbance, they would likely be immobilised by scavenging mineral oxides and suspended particulates found in oxic bottom waters. This hypothesis will be tested as part of the operational ESIA baseline studies and informed by the collector test.
Figure 7-1. Potential impacts from the disturbance of seafloor sediment
Source: Koschinsky et al. (2001).
(b) Plume Model
DHI Water & Environment, Inc. (DHI) was commissioned to carry out hydrodynamic and plume modelling studies for the collector test assuming that the activities would be conducted in the TF (Area 6; Section 3.3.2). Models have been developed for dispersal of both the benthic plume and the mid-water plume (DHI, 2021, Appendix 2).
While the modelling approach adopted allows a differentiation between the near field (where momentum and density are controlling) and the far field (passive dispersion), sediment discharge volumes for the collector test are relatively small, such that only the far field processes are considered in the assessment

Document Number: FINAL
Revision: V20
Revision Date: 24 September, 2021
Page 7-7
(that is, the effects of momentum and buoyancy are assumed to effect less than one model computational cell ca. 50 m). (i) Software
The numerical modelling involved a range of ‘MIKE by DHI’ models that captured, reproduced, and evaluated the deep ocean hydrodynamic processes, mid-water column and near seabed sediment spill within the TF. This necessitated coupling with a hydrodynamic sediment transport model. The model modules applied in this study are briefly described below.
• MIKE 3 FM HD is a three-dimensional hydrodynamic model is based on a flexible mesh approach and it has been developed for applications within oceanographic, coastal, and estuarine environments. The spatial discretization of the equations is performed using a cell cantered finite volume method. The horizontal discretization can combine triangles and quadrilateral elements, while the vertical is based on a combined sigma-z discretization. MIKE 3 FM HD is used to simulate the water levels, current, salinity and temperature in the area of interest over a typical January production period.
• MIKE 3 FM MT is a three-dimensional model for multi-fraction cohesive sediment transport that describes the processes of settling, erosion, transport and deposition of sediment under the influence of currents and waves. This model was directly coupled with the hydrodynamic model to include sediment plume density effects etc. in the hydrodynamics. The model includes routines for flocculation, hindered settling and fluid mud and can incorporate both cohesive and non-cohesive material in the same simulation. The MIKE 3 FM MT model calculates the resulting transport, dispersion, deposition, and re-suspension of fine sediments brought into suspension by the collector test works.
(ii) Validation
Since 2019, DHI has progressively developed the hydrodynamic (HD) model for NORI-D. At the time of writing, model validation has been performed against the first set of current measurements from the site (CSA, 2020). A summary of the near-bed current data is provided in Figure 7-2 showing a dominant north-north-west/south-east flow direction for the approximately 8 months of data available. The HD model will continue to be progressively improved as more data becomes available from subsequent field campaigns. It is, however, considered appropriate for the assessment of the small-scale collector test (DHI, 2021).
The model predictions described below represent the most realistic predictions of plume behaviour with the input data available at the present time. Predictions and assumption will be validated during the collector test, which will inform further iterations of the model.

Document Number: FINAL
Revision: V20
Revision Date: 24 September, 2021
Page 7-8
Figure 7-2. Summary of measured near bed current data from NORI-D (14 October 2019 to 26 June 2020)
(iii) Parameters
The sediment plume model results are presented in terms of incremental (above background) sedimentation and incremental (above background) total suspended sediment (TSS) concentrations, rather than absolute sedimentation and suspended sediment concentration. This is considered normal practice for sediment plume modelling (e.g., PIANC 2010, Marnane et al. 2017) for cases where:
• The background sedimentation and suspended sediment concentration varies weakly in space and time. In these cases, it can be assumed that the environmental receptors are adapted to this weakly varying background and will thus respond to incremental stress above this background.
• Background concentrations are sufficiently low as to not influence the settling properties of the incremental material brought into suspension by the activities.
Adequate field data to fully define background concentrations from NORI-D will only be available after operational ESIA baseline studies are complete. However, it is considered reasonable that, due to the slowly varying current conditions in the area and deep oceanic nature of the environment, these two fundamental assumptions supporting the use of an incremental rather than absolute approach to the sediment plume modelling, are valid (DHI, 2021).

Document Number: FINAL
Revision: V20
Revision Date: 24 September, 2021
Page 7-9
In assuming the validity of these assumptions, absolute concentration can be calculated from the model results by adding the spatially and temporally averaged background concentration to the incremental concentrations determined from the sediment plume model.
Results are presented for five individual scenarios in terms of incremental sedimentation and incremental TSS concentration and cumulative effect.
The incremental sedimentation is expressed in mm based upon an assumed medium term deposition density of 180 kg/m3 (iSeaMC, 2020). To account for both the magnitude and duration of the incremental TSS it is expressed as the percentage exceedance of 0.1 mg/l, 1 mg/l, 5 mg/l and 10 mg/l above background concentration.
Exceedance is calculated according to the following example:
• A concentration of 2 mg/l present for two hours over a 10-hour analysis period would result in an exceedance of the 1 mg/l threshold of 20% and an exceedance of 5 mg/l threshold of 0%
• A concentration of 6 mg/l present for two hours a 10-hour analysis period would result in the exceedance of the 1 mg/l threshold of 20%, but also an exceedance of the 5 mg/l threshold of 20%
Incremental TSS results are presented at fixed heights above the seabed (5 m and 20 m) for the benthic plume and at a fixed water depth (1,050 m) for the mid-water plume (that is, 50 m below the point of discharge; see point viii for further explanation). As exceedance is influenced by the duration over which the statistics are calculated, results are presented for a statistical period starting from when nodule production commences and finishing 24 hours and 48 hours after nodule production stops.
(iv) Horizontal Resolution
The model bathymetry of NORI-D has been established from the survey point cloud of depth soundings. The resolution of the model is high for the multi-beam survey data from within the TF (Area 6) progressively decreasing to 2,000 m from global (GEBCO) data at the boundaries of NORI-D. For the collector test model design, a nominal 50 m mesh resolution covering the TF is found to provide a reasonable balance between resolution of bed features and the sediment plume against computational time (DHI, 2021).
(v) Vertical Resolution
Testing of various vertical layer schemes was undertaken during the development of the sediment plume model. Focus has been placed on achieving a near-bed layer and mid-water column resolution that will provide adequately resolution of the sediment plume (Figure 7-3).

Document Number: FINAL
Revision: V20
Revision Date: 24 September, 2021
Page 7-10
Figure 7-3. Collector test model mesh
(vi) Temporal Resolution
Due to the requirement to model suspended sediment dynamics the timesteps were set at 300 seconds to provide high resolution. The duration of the model production period for each collector test scenario was set at 11 days, this provides adequate time for subsequent transport, dispersion and settling of the plume to a level where all concentrations fall to a level of an order of magnitude below anticipated background levels (see Figure 7-4).
Figure 7-4. Longitudinal slice through test field site*
* Vertical resolution increases around the mid water column discharge (-1000m) and near the seabed.

Document Number: FINAL
Revision: V20
Revision Date: 24 September, 2021
Page 7-11
(vii) Sediment Characteristics
Detailed laboratory tests of seabed sediment dynamics were undertaken by iSeaMC (2020) (Appendix 3). The results of these experiments are incorporated into the plume model as a set of sediment settling velocities as a function of sediment concentration. From the derived settling characteristics, expected flocculation characteristics across the range of test concentrations was derived. Based on this data, flocculation is assumed not to occur at concentrations below 0.03 g/l (30 mg/l). Between 0.03 g/l and 10 g/l flocculation is assumed to occur as a function of the total concentration of floc generating material as shown in Figure 7-5. There is a very high level of agreement between measured and modelled setting velocity, providing confidence in the settling velocity measurements provided by iSeaMC (2020).
In addition to seabed sediment, residual nodule material was included in the model with mean grain size and settling velocity included as parameters.
(viii) Discharge Characteristics
The collector test run scenario plan was developed based on the best available information at the time of model inception. At this time, it was assumed that the collector test would take place in January 2022, and that the mid-water outlet would be at 1,000 m. In the interim period the timing of the collector test has been revised to Q3/2022 and the depth of the mid-water outlet increased to 1,200 m. These changes were made in response to emerging information to minimise the environmental impacts of the planned activities. It is not anticipated that these changes will fundamentally affect the results or findings of the plume modelling (DHI, 2021).
Table 7-2 shows key benthic plume discharge characteristics for the PCV based on the engineering specifications provided by Allseas at the time of model inception.
Table 7-2. Benthic plume discharge characteristics PARAMETER VALUE
Discharge port vertical orientation 0°
Number of nozzles 4
Height above seabed 4m
Discharge port velocity 0.7 m/s
Discharge port area 1 m2
Residual nodule sediment Load Base 0.38 kg/s (0.0002m3/s)
Residual seabed sediment load Base 16.72 kg/s (0.007m3/s)
Water discharge Base 2.186 m3/s (2241kg/s)
Total discharge including sediment Base 2.1932 m3/s
Discharge temperature Ambient at bed
Figure 7-5. Sediment settling velocity model

Document Number: FINAL
Revision: V20
Revision Date: 24 September, 2021
Page 7-12
PARAMETER VALUE
Discharge Salinity Ambient at bed
PCV speed Varies depending on scenario
PCV track Varies depending on scenario
Spill from tracks and track cleaning system Not included for collector test sediment plume assessment as no data on spill rates, but expected to be small
Spill from collector head
Disturbance allowance of 2% of fine sediment flux = 0.02 * 17.10 kg/s = 0.342 kg/s released at seabed with no discharge velocity. This is in line with data from hydraulic suction dredging techniques.
Table 7-3 shows key mid-water plume discharge characteristics for the return pipe based on the engineering specifications provided by Allseas at the time of model inception.
Table 7-3. Mid-water plume discharge characteristics PARAMETER VALUE
Residual nodule sediment load 1.17 kg/s (0.0006 m3/s)
Residual seabed sediment load 1.17 kg/s (0.0005 m3/s)
Water discharge 0.097 m3/s (99/51kg/s)
Total Discharge including sediment 0.0981 m3/s
Discharge temperature 7.5°C
Discharge salinity 34.67 PSU
Discharge configuration Single 0.2m ø
Discharge velocity 3.12 m/s
Discharge orientation Vertically down
Discharge depth 1,000 m
Mid water column discharge offset 330 m in advance of crawler.
Riser movement Same speed as crawler
(ix) Mid-water Discharge Depth
As indicated in the preceding sections, the sediment plume modelling has been based on a mid-water column discharge located at 1000m below the surface. This was the best information available at the time of simulation. Ultimately, design decisions may result in some minor (within a few 100m) adjustment to this discharge depth for the collector test. Figure 7-6 presents the measured current conditions at approximately 1000m and 1200m below the surface from the NORI-D long mooring data available at the time of writing (CSA 2020). This indicates that, as expected, there is a slight decrease in current speed with depth, and a slight shift in the dominant current direction. It can thus be concluded that, while there will be some minor differences in the behaviour of the plume depending on discharge depth (slight change in spatial extent and slight change in dominant drift direction), but these differences will not be significant from an overall plume impact perspective for mid-water column discharges falling within the depth range of 1000m to 1200m.

Document Number: FINAL
Revision: V20
Revision Date: 24 September, 2021
Page 7-13
Figure 7-6. Measured current conditions at the NORI-D long mooring (current flowing to) at approximately 980m and 1179m (right) below the surface - 14 October 2019 to 26 June 2020
(x) Seasonality
Sediment plume modelling has been based on a collector test program occurring in January 2022. This was the best information available at the time of simulation. Ultimately it is recognized that the schedule for the collector test may vary. Due to variability in the prevailing current conditions at the site (both seasonal and inter-annual variability due to the presence / absence of macro eddies, strength of oceanic processes etc.) some variability in the net migration of the sediment plume, depending on the ultimate schedule of the pilot test program, is to be expected. Figure 7-7 shows the average monthly near-bed current roses for 2004 to 2018 based upon the Hybrid Coordinate Ocean Model (HYCOM; www.hycom.org) that are used as boundary conditions for the sediment plume model (DHI, 2021). Based upon these current roses and consistent with the sediment plume results, a collector test campaign undertaken during typical (that is, average) January conditions is likely to see a north-westerly drift of the plume. Conversely, the same program occurring during June/July would likely see a net easterly plume drift, with a similar overall magnitude, but slightly higher spatial extent (in terms of area) (DHI, 2021).

Document Number: FINAL
Revision: V20
Revision Date: 24 September, 2021
Page 7-14
Figure 7-7. Seasonal variability in near bed current conditions (current flowing to) at the location of the long mooring in the NORI-D area based on HYCOM data 2004 to 2018 (HYCOM 2021)

Document Number: FINAL
Revision: V20
Revision Date: 24 September, 2021
Page 7-15
(xi) Scenarios Productive system test runs (STRs) are the only components of the collector test that have the potential to generate significant sediment displacement (see Figure 3-23). Three key test run scenarios (STR1b; STR 2a; STR2b) and two advanced run scenarios (STR3a; STR3b) were identified as candidates for plume modelling (Figure 7-8).
The STRs will be strategically placed within the TF to avoid locations with the largest elevation variance (for example, the northwestern corner). The PCV track for each scenario has been mapped based on the information provided by Allseas. The run length and speed for each scenario modelled is shown in Figure 7-8A-E; where, each blue line represents the progressive minute-by-minute point locations of the PCV. After one pass (3.1 km) has been completed (excluding Scenario STR2b), the PCV makes a turn and begins the next pass at 50 m south of its last location. The turning is not simulated in the model as it does not produce significant spill of sediment; however, the time delay for each turning event is considered before the start of the next pass.
It is important to note that the mid-water column discharge follows the tracks of the PCV. The assumption is made that, rather than moving constantly with at the speed of the PCV, the surface vessel (and thereby the mid water column discharge) moves in 600 m steps, moving from 300 m behind to 300 m in front of the collector with each step.
For additional information on model parameters the reader is referred to the DHI source report (DHI, 2021) in Appendix 2.

Docum
ent Num
ber: FIN
AL
Revision:
V20
Revision D
ate: 24 S
eptember, 2021
P
age 7-16 Figure 7-8.
Model scenarios

Docum
ent Num
ber: FIN
AL
Revision:
V20
Revision D
ate: 24 S
eptember, 2021
P
age 7-17

Document Number: FINAL
Revision: V20
Revision Date: 24 September, 2021
Page 7-18
(c) Plume Model Results Results are presented for the five individual scenarios in terms of net sedimentation and total suspended sediment. (i) Sedimentation Accumulated sediment deposition footprint at the end of each scenario is shown in Figure 7-9. Analysis of the model results indicate that:
• The range of sediment deposition expected for all scenarios is from 0-5 mm.
• Sediment deposition > 5 mm is not predicted for any scenario.
• The deposition footprint is confined to the TF for all scenarios, with a minor exception for Scenario 1 which is the longest continuous run modelled.
• The area of the sedimentation footprint appears to be dependent on a combination of duration, speed, and nodule production rate. Scenario 3 has by far the highest nodule production but deposition slightly smaller than Scenario 1. Comparing Scenarios 4 and 5 seems to indicate speed may be a factor. Determination of dominant factors determining the area of the sedimentation footprint will be a focus of the PCV performance trials.
• For all scenarios, sediment deposition falls to <0.5 mm within 1,000 m of the source of disturbance.

Document Number: FINAL
Revision: V20
Revision Date: 24 September, 2021
Page 7-19
Figure 7-9. Sediment deposition footprints†
†Note: TF (red dotted line) is 2x4 km

Document Number: FINAL
Revision: V20
Revision Date: 24 September, 2021
Page 7-20
(ii) Benthic Plume
Benthic plume footprint at the end of each scenario is shown in Figure 7-10. Analysis of the model results indicate that:
• For all scenarios, exceedances of 0.1 mg/l extend laterally outside the TF for up to 5km at 5 m and 20 m above the seabed.
• For all scenarios, exceedances of ≥5 mg/l are mostly laterally confined to the TF at 5 m and 20 m above the seabed.
• For all scenarios, exceedances of 1 mg/l extend laterally towards the northwest of the TF, extending up to 2.0 km past the boundary of the TF in some cases.
• For all scenarios, exceedances 5 mg/l and 10 mg/l typically persist for no more than 2-4% of the time period modelled.
• For scenario STR1b, exceedance of 1 mg/l is predicted at 5 m and 20 m for more than 15% of the timesteps within 24 hours (that is, exceedance persists for 3.6 out of 24 hours). Exceedance falls to approximately 8% after 48 hours (that is, exceedance persists for 3.8/48 hours)
• For scenarios STR2a and STR2b, exceedances of 1 mg/l are predicted at 5 m for more than 15% of the timesteps within 24 hours (that is, exceedance persists for 3.6 out of 24 hours).
• For all scenarios, exceedances of 1 mg/l fall to 10% or less of the timesteps within 48 hours (that is, exceedance persists for 4.8 out of 48 hours).
• For all scenarios, exceedances of 5 mg/l and above fall to 4% or less within 48 hours (that is, exceedance persists for 1.9 out of 48 hours).

Document Number: FINAL
Revision: V20
Revision Date: 24 September, 2021
Page 7-21
Figure 7-10. Benthic plume scenario model results showing exceedance percentage of 0.1, 1.0, 5.0 and 10.0 mg/l, at 5m and 20m above seabed, from the start of nodule production to 24 and 48 hours post-nodule production for all scenarios.

Document Number: FINAL
Revision: V20
Revision Date: 24 September, 2021
Page 7-22

Document Number: FINAL
Revision: V20
Revision Date: 24 September, 2021
Page 7-23

Document Number: FINAL
Revision: V20
Revision Date: 24 September, 2021
Page 7-24

Document Number: FINAL
Revision: V20
Revision Date: 24 September, 2021
Page 7-25

Document Number: FINAL
Revision: V20
Revision Date: 24 September, 2021
Page 7-26

Document Number: FINAL
Revision: V20
Revision Date: 24 September, 2021
Page 7-27

Document Number: FINAL
Revision: V20
Revision Date: 24 September, 2021
Page 7-28

Document Number: FINAL
Revision: V20
Revision Date: 24 September, 2021
Page 7-29

Document Number: FINAL
Revision: V20
Revision Date: 24 September, 2021
Page 7-30

Document Number: FINAL
Revision: V20
Revision Date: 24 September, 2021
Page 7-31
(iii) Mid-water Plume It is anticipated that approximately 8,500 m3 of process water will be discharged per day during testing of the riser system, with a total of approximately 22,000 m3 over the course of the collector test.
The mid-water discharge point has been modelled at 1,000 m below the surface and follows the tracks of the PCV for all scenarios previously described.
The modelled dynamics of the mid-water discharge as it is released from the return pipe is summarised in Figure 7-11. As discharge exits the pipe the heavier fraction (for example, nodule fragments, cold water and larger sediment particles) falls towards the seabed and contributes to the benthic plume generated by the PCV (Figure 7-11A-C). Eventually, all the heavier components of the discharge will fall to the seabed creating two plumes: a mid-water plume of the lighter faction below the point of discharge and a benthic plume of the heavier faction at the seabed (Figure 7-11D-E). As the surface vessel and riser pipe move away from the benthic plume it dissipates, as does the remaining mid-water plume (Figure 7-11G-I).
Exceedances of 0.1 mg/l, from the start of nodule production to 24- and 48-hours post-nodule production at 50 m below the mid-water column discharge location (-1,050 m below the surface) have been modelled for all scenarios shown in Figure 7-12.
Analysis of the model results indicate that:
• For all scenarios, exceedances of 0.1 mg/l are laterally constrained to <100 m from the point of discharge. The modelling does not show a strong lateral trajectory of the plume in any particular direction.
• For all scenarios, the 0.1 mg/l exceedances of the lateral dispersal plume do not extend outside the TF.
• For scenarios STR2a, STR 3a and STR 3b, 0.1 mg/l exceedances fall to below 2% within 48 hours, the area of exceedance is spatially constrained to a small area around the point of discharge.
• For scenarios STR1b and STR2b, 0.1 mg/l exceedances remain above 5% at 48 hours, the area of exceedance is spatially constrained to a small area around the point of discharge.
• Scenarios STR1b and STR2b have the longest continuous trial duration modelled.

Docum
ent Num
ber: FIN
AL
Revision:
V20
Revision D
ate: 24 S
eptember, 2021
P
age 7-32 Figure 7-11.
Modelled dynam
ics of mid-w
ater plume
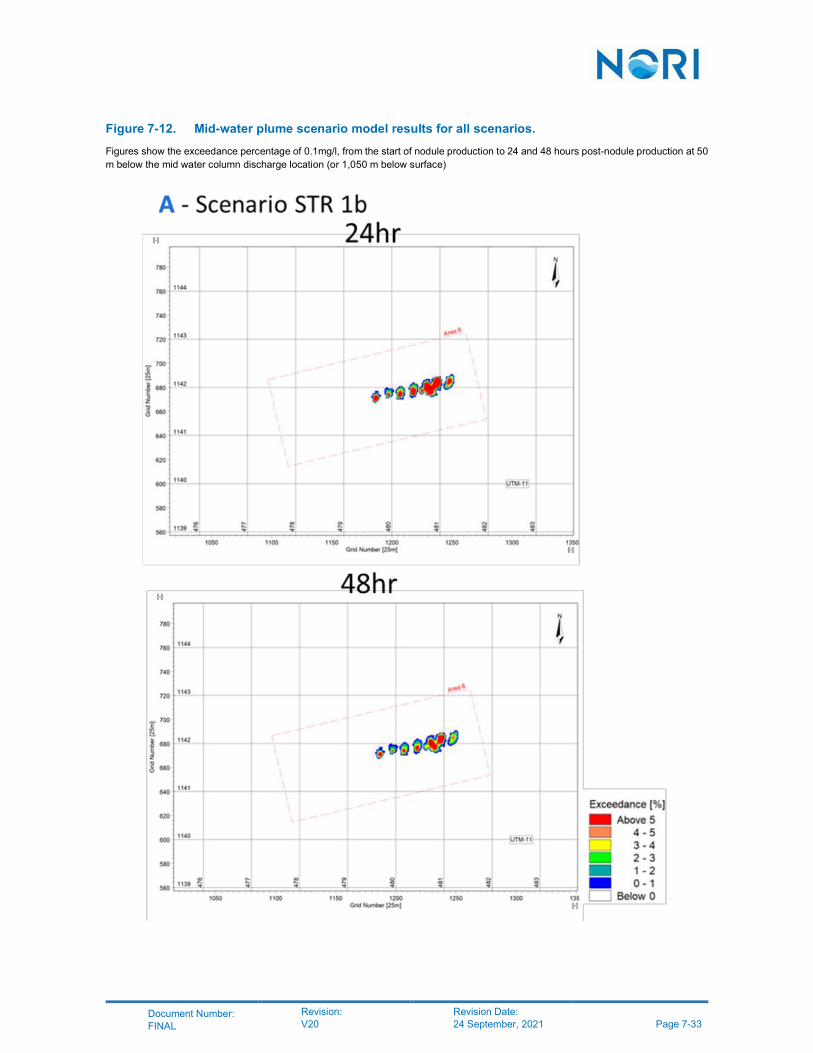
Document Number: FINAL
Revision: V20
Revision Date: 24 September, 2021
Page 7-33
Figure 7-12. Mid-water plume scenario model results for all scenarios.
Figures show the exceedance percentage of 0.1mg/l, from the start of nodule production to 24 and 48 hours post-nodule production at 50 m below the mid water column discharge location (or 1,050 m below surface)

Document Number: FINAL
Revision: V20
Revision Date: 24 September, 2021
Page 7-34

Document Number: FINAL
Revision: V20
Revision Date: 24 September, 2021
Page 7-35

Document Number: FINAL
Revision: V20
Revision Date: 24 September, 2021
Page 7-36

Document Number: FINAL
Revision: V20
Revision Date: 24 September, 2021
Page 7-37

Document Number: FINAL
Revision: V20
Revision Date: 24 September, 2021
Page 7-38
(d) Cumulative Results
The results presented above represent the effects of the five individual collector test run scenarios that will generate sediment displacement. These scenarios will be executed in sequence over a number of days, such that it is also important to consider the cumulative effect on sedimentation and suspended sediment concentration. (i) Sedimentation
The relative location of the individual run lines may vary scenario to scenario in the field. To provide an indication of the sensitivity of the net sedimentation field to the specific offset of the individual test run lines, three sensitivity tests were undertaken.
The base cumulative scenario is all tracks as described in Figure 7-8. For the other two sensitivity tests, the centreline of the tracks is offset as per Table 7-4, with positive offsets representing a northerly shift and negative offsets a southerly shift of the individual scenario tracks.
Results for these two sensitivity tests are presented in Figure 7-13. The cumulative area of the sedimentation footprint that will remain after the completion of the collector test for the worst-case scenario (that is, Test Shift 2, Figure 7-13C) is described in Table 7-5.
Table 7-4. Track centreline offsets for cumulative sedimentation sensitivity testing
SHIFT OFFSET (M) FOR EACH SENSITIVITY TEST
STR 1b STR 2a STR 2b STR 3a STR 3b
Base 0 0 0 0 0
Shift 1 -150 0 150 50 100
Shift 2 -300 0 300 100 200
Table 7-5. Worst case scenario cumulative sedimentation metrics DESCRIPTION AREA (km2)*
Cumulative area covered with sediment 6.0
Cumulative area covered with sediment outside of TF 2.0
Cumulative area covered with 0.5-0.75 mm of sediment outside of TF 1.5
Cumulative area covered with 0.75-1.0 mm of sediment outside of TF 0.3
Cumulative area covered with 1.0-1.5 mm of sediment outside of TF 0.2
*Note – This is a rough approximation for comparative purposes only.
Analysis of the worst-case scenario model indicates that:
• The total area that will be subjected to increased levels (>0.5 mm) of sedimentation after the completion of the collector test is approximately 6 km2.
• Most sediment settles within the 8 km2 TF site. An area of approximately 2.5 km2 outside of the TF will be subjected to increased levels of sedimentation under the worst-case scenario.
• Most of the sedimentation outside the TF boundary (75%) is in the range of 0.5-0.75 mm of deposition.
• The highest levels of cumulative sedimentation are 5-10mm and occur on, or immediately adjacent to, the test tracks.

Document Number: FINAL
Revision: V20
Revision Date: 24 September, 2021
Page 7-39
Figure 7-13. Cumulative sedimentation for base case (A), Shift 1 (B) and Shift 2 (C)
(ii) Benthic Plume
For cumulative suspended sediment, summary statistics are provided showing the total duration (hours) where 1mg/l is exceeded over the entire test period at 5m (Figure 7-14) and 20m (Figure 7-15) above the seabed.
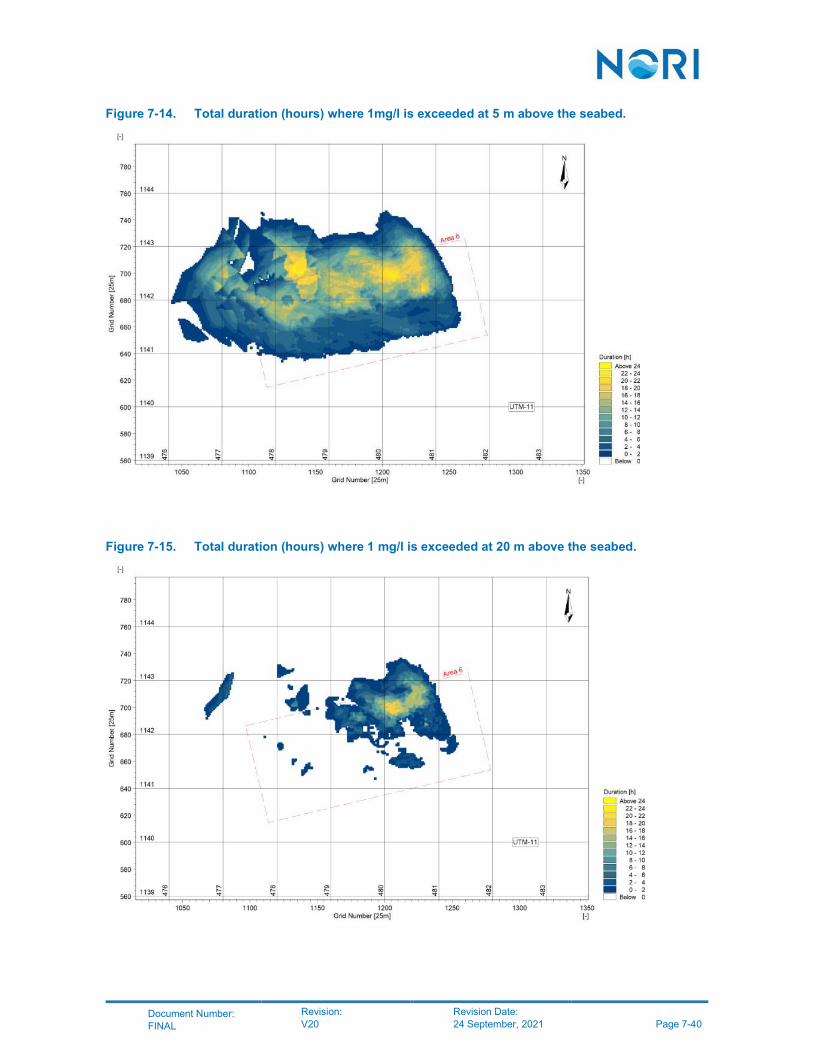
Document Number: FINAL
Revision: V20
Revision Date: 24 September, 2021
Page 7-40
Figure 7-14. Total duration (hours) where 1mg/l is exceeded at 5 m above the seabed.
Figure 7-15. Total duration (hours) where 1 mg/l is exceeded at 20 m above the seabed.

Document Number: FINAL
Revision: V20
Revision Date: 24 September, 2021
Page 7-41
Analysis of the model results indicate that:
• At 5 m above the seabed the duration of exceedances of 1mg/l are expected to last less than 24 hrs over the 259 hours of operations (that is, <10%).
• At 5 m above the seabed exceedances 1 mg/l lasting up to 24 hours may occur up to 1 km outside of the TF.
• At 20 m above the seabed the duration of exceedances of 1 mg/l are expected to last less than 24 hours over the 259 hours of operations (that is, <10%).
• At 20 m above the seabed exceedances of 1 mg/l lasting up to 24 hours are confined to the TF. (iii) Mid-water plume Summary statistics for the cumulative collector test mid-water plume are provided in Figure 7-16. Results show total hours where 1mg/l is exceeded over the entire 259-hour operation and where 0.1 mg/l is exceeded at 50 m below the mid-water column discharge location (or -1,050 m below the surface).
Figure 7-16. Total duration (hours) where 0.1mg/l is exceeded at 50 m below the mid water column discharge point.
Analysis of the model results indicate:
• At 50 m below the mid-water discharge point (that is -1,050 m) the maximum total duration where 0.1 mg/l is exceeded is less than 12 hours over the 259 hours of operations (that is, <5%).
• All exceedances of 0.1 mg/l are spatially confined to a small area around the point of discharge over the 259 hours of operations. The modelling does not show a strong lateral trajectory in any direction.

Document Number: FINAL
Revision: V20
Revision Date: 24 September, 2021
Page 7-42
7.4.3.4 Impact of plumes on water quality
TSS concentrations were measured via Niskin bottle sampling throughout the water column by CSA (2020); the results for average TSS (± standard deviation) are summarised in Table 7-6. Average TSS concentrations were less than 5 mg/l while turbidity was generally less than 0.5 NTU (CSA, 2020) indicative of clear waters with minimal suspended particulates. TSS concentrations below 4,000m ranged from approximately 1 to 5 mg/l. Based on this information exceedances up to 1mg/l would appear to be within the natural range of variation of TSS at 4,000m+ and it would be expected that temporary, short duration exceedances of ≤ 1mg/l could be tolerated by benthic biota.
It is acknowledged that the existing information on the background concentration of TSS and other water quality parameters is inadequate for full assessment of impacts at this stage. Additional information will be collected as part of the operational ESIA baseline studies and the collector test monitoring to develop a robust estimate of average TSS and natural levels of variation. Based on the information presented in Table 7-6, a working hypothesis that temporary exceedances of ≤ 1mg/l are not expected to be significant in the context of the scale of the collector test, would appear to be reasonable. This hypothesis will be tested as part of the operational ESIA studies.
Table 7-6. TSS concentrations at depth at NORI-D WATER DEPTH (m) TSS (mg/l)
30 4.46 ± 0.84
100 3.03 ± 0.40
190 4.30 ± 1.90
300 4.00 ± 1.18
600 2.30 ± 0.98
950 2.74 ± 0.62
1,150 3.50 ± 1.37
1,250 1.95 ± 1.32
1,500 3.10 ± 1.31
1,750 3.84 ± 0.51
2,500 2.58 ± 1.71
3,500 3.06 ± 1.24
4,000 3.48 ± 1.20
4,050 1.50 ± 0.50
4,100 3.00 ± 1.57
4,150 3.08 ± 1.99
Source: (CSA, 2020)
For the purpose of the Collector Test exceedances of >1 mg/l above background have been identified as a potentially critical threshold for biota. This supposition is based on the advice summarised in Appendix 4. Additional resolution will be possible when the baseline studies and Collector Test have been completed.
Benthic plume modelling results indicate that exceedances at levels >1 mg/l (that is, 5 mg/l and 10 mg/l) are confined to the water column above the TF and dissipate to background levels at 20 m above the seabed after 24 hours. It is unlikely that the benthic plume will have a wide-ranging negative impact on bathypelagic water quality as the suspended sediments, and any mobilised trace elements, will be confined to the TF and concentrations will return to background levels within a few days of disturbance.

Document Number: FINAL
Revision: V20
Revision Date: 24 September, 2021
Page 7-43
Mid-water plume modelling indicates that for all scenarios tested, exceedances of 0.1 mg/l are spatially confined to a small area around the actual discharge points, and the modelling does not show a strong lateral trajectory in any particular direction. Therefore, it is unlikely that mid-water discharges from the collector test will have a wide-ranging negative impact on water quality as the suspended sediment, and any mobilised trace elements, will be diluted to background levels within several hundred meters of the point of discharge.
7.4.4 Sediment Geochemistry & Micro-topography The sediment properties of the seafloor throughout the CTA and wider NORI-D are not unique to this area and are comparable to other areas in the eastern tropical Pacific. Nodules are also abundant and widespread throughout the CCZ (van Wijk and de Hoog, 2020; Wedding et al., 2013). Also, the CTA does not include any major seafloor features, such as seamounts. and has been selected as it is relatively flat with a slope grade of less than 4°.
The seafloor properties represented in the CTA are not unique to this area and are well represented throughout NORI-D and the wider eastern CCZ.
7.4.4.1 Sediment Geochemistry
Sediment geochemistry is determined by complex interactions of chemical and microbially controlled processes and benthic food webs. These processes and systems allow organic matter from the overlying water to become available to benthic communities, sustaining their biomass and unique biodiversity (BGR, 2019). The degradation of organic matter leads to the development of a distinct geochemical redox zonation in deep-sea sediment (Volz et al., 2018), determined by the flux of organic matter to the seafloor, the sedimentation rate, and the availability of the right electron acceptors, or oxidising agents (Froelich et al., 1979; Berner, 1981). Aerobic respiration is the dominant biogeochemical process in CCZ sediments, consuming most of the organic matter delivered to the seafloor (Volz, 2019). The oxic zone in CCZ sediments can extend beyond 1 m and is reported to be 2 to 3 m deep in the adjacent eastern German contract area (BGR, 2019; Mewes et al. 2014).
Information regarding the impacts of anthropogenic disturbances on the biogeochemical processes of the deep-sea sediments is limited in part due to the unavailability of suitable technology to assess such changes. Studies on the impacts of the DISCOL experiment conducted in 1978 in the Peru Basin found evidence of impacts on seafloor biogeochemical processes several decades after the disturbance with geochemical composition and redox layering of surface sediments found to be noticeably altered (Thiel, et al., 2001; BGR, 2019).
Impacts to biogeochemical processes are specific to the type and intensity of the physical impact, where removing the reactive surface layer of sediment together with labile organic matter and exposing deeper sediments produces the most detectable effects (BGR, 2019). This scenario could be comparable to the PCV disturbing the upper 5 to 10 cm of sediment during nodule production.
7.4.4.2 Sediment Micro-topography
As the PCV moves across the seafloor the tracks of the propulsion system and the removal/burial of nodules will modify the micro-topography of the disturbed sediments. In addition, the PCV will create a benthic plume of suspended sediment which will be deposited across the broader seafloor outside of the area directly disturbed by the PCV.
The mid-water discharge will also contribute to sediment being dispersed, settling on the seafloor and modifying topography.
Small-scale alterations to seafloor topography may be short-lived or long lasting and could affect hydrodynamic currents close to the seafloor as well as sediment transport processes (BGR, 2019).

Document Number: FINAL
Revision: V20
Revision Date: 24 September, 2021
Page 7-44
Experiments conducted at Jacobs University Bremen in Germany found that the presence of nodules may influence seafloor hydrodynamics by creating vortexes, erosion and accumulation zones (iSeaMC, 2020).
During the collector test the PCV will traverse a distance of about 82 km in completing the system test runs. Approximately 3,600 wet tonnes of nodules will be collected, and although nodules >80 mm in diameter will not be collected, they will likely be buried as the PCV passes over them or be covered by sedimentation. The area of the TF from which nodules will be removed or buried is estimated to be about 0.5 km2. The removal and burial of nodules will create a change in seafloor micro-topography (that is, changes in seafloor topography of tens of centimetres) over the disturbed area.
7.5 Impact Management
7.5.1 Impact Minimisation Through Planning The primary method for minimisation of impacts to physicochemical VECs is by considered planning and design of the collector system and test program. The following measures and design features have been incorporated into the collector test as part of the overall impact minimisation strategy:
1. All collector test operation will be conducted within an 8 km2 TF.
2. The area of direct physical disturbance within the test field is limited to approximately 0.5 km2.
3. Sedimentation modeling indicates that the total area of the seabed that will be subjected to increased levels (>0.5 mm) of sedimentation after the completion of the collector test will be limited to approximately 6 km2.
4. Modelling of the benthic plume indicates that the area impacted by sedimentation (>0.5 mm) outside the TF, but still primarily within the CTA, is limited to approximately 2 km2.
5. The PCV is 20% of the scale of the full-size collector, considered sufficient to meet the testing objectives while minimizing the disturbance footprint.
6. The CTA is located in the abyssal plain geoform, which is the most common geoform in NORI-D and the wider CCZ. Mapping and geophysical sampling confirms a predominance of Type I nodule facies in this geoform which is the most common nodule facies across NORI-D. Therefore, it is likely that the physicochemical VECs on the CTA are well represented regionally.
7. The TF selected is not close to any potentially sensitive, or poorly represented, habitat features.
8. The duration of the entire collector test is limited to 860 hours, and the duration of system testing (period of maximum plume generation) is limited to 259 hours. Most impacts associated with the collector test will be temporary, of short duration, and spatially constrained.
9. The depth of the outlet of the mid-water return pipe has been increased from 1,000 m to 1,200 m to avoid the biologically richer mesopelagic/bathypelagic transition zone.
10. The TF and impacted parts of the CTA will be designated as IRZs following the collector test and used as a reference site for ongoing long-term environmental studies.
11. A precautionary approach has been applied to significance analysis by assigning a maximum sensitivity score (that is, most conservative) to VECs for which there is currently uncertainty around how they might respond to an impact.
12. All relevant international standards and best practices (for example, MARPOL) will be adopted regarding the vessels commissioned to conduct the collector test.
13. The results of monitoring during and after the collector test will inform and validate plume modelling and impact prediction for the operational ESIA.

Document Number: FINAL
Revision: V20
Revision Date: 24 September, 2021
Page 7-45
7.5.2 Risk Assessment Risk assessment is an analysis of the probability of occurrence of an event and the impact on the receiving environment if it occurs. The EIA study team conducted a risk assessment for physicochemical VECs (Table 7-7, Column 5 “Risk”), based on the current understanding of the project, using the criteria described in Table 4-10 and Table 4-11.
The results of the risk assessment indicate that with the implementation of the proposed management measures (Table 7-7, Column 4 “Management Measures”) all risks to the physicochemical component of the receiving environmental can be managed to acceptable (i.e., Low-Medium) levels without the need for focussed mitigation measures.
7.5.3 Residual Impacts Residual impacts refer to those environmental effects predicted to remain after the application of management measures – essentially the unavoidable consequences of seabed mining. Of concern to regulators are ‘significant’ residual impacts that cannot be reduced to acceptable levels with the application of focussed mitigation measures.
Potentially significant residual impacts have been assessed by considering the likely magnitude of an impact and the sensitivity of the VEC according to the methods described in Section 4.2. Application of the precautionary principle requires that uncertainty be incorporated into the assessment by assigning a maximum sensitivity score in circumstances where little or no information is available on how a VEC may respond to an impact.
Table 7-7 summarises the significance of residual impacts of the proposed activities on the physicochemical VECs represented in the receiving environment. No significant residual impacts are anticipated at a regional scale.

Docum
ent Num
ber: FIN
AL
Revision:
V20
Revision D
ate: 24 S
eptember, 2021
P
age 7-46 Table 7-7.
Impact significance and risk assessm
ent - physicochemical VEC
s
AC
TIVITY
V
ULN
ER
AB
LE V
EC
S
IMP
AC
TS
MA
NA
GE
ME
NT M
EA
SU
RE
S
RIS
K†
SIG
NIFIC
AN
CE
‡ L
C
RA
TING
M
S
S
CO
RE
Return transit of
the vessel from
San D
iego to the C
CZ
Air Q
uality / GH
G
Vessel’s diesel engines will em
it fum
es into the atmosphere reducing
local air quality and contributing to G
HG
emissions.
MA
RP
OL requirem
ents will be adhered
to on all vessels used during the project, m
inimising the risk of pollution
to the marine environm
ent and atm
osphere in accordance with
established international standards.
E
1 Low
1
1 1
Noise / V
ibration
Vessel’s diesel engines will
generate noise and vibrations which
could disturb birds, cetacean, and turtles.
Vessels w
ill not pass through any “Particularly Sensitive Sea Areas” (P
SS
As) as designated by the IM
O.
While on station ship m
ovements w
ill be m
inimised to reduce propeller
generated noise.
The maxim
um sensitivity score (4) has
been applied to the significance analysis (colum
n 9) to account for the uncertainty of the indirect im
pacts of noise and vibration disturbances on V
EC
s.
The monitoring conducted during the
collector test will provide inform
ation that w
ill inform the design of the full-
scale system and the operational
EM
MP
to facilitate reduction of this im
pact to ALA
RP during full-scale
operations.
E
1 Low
1
4 4
Water Q
uality Intentional or accidental release of pollutants from
the vessels could M
AR
PO
L requirements w
ill be adhered to on all vessels used during the
B
2 Low
1
1 1

Docum
ent Num
ber: FIN
AL
Revision:
V20
Revision D
ate: 24 S
eptember, 2021
P
age 7-47
AC
TIVITY
V
ULN
ER
AB
LE V
EC
S
IMP
AC
TS
MA
NA
GE
ME
NT M
EA
SU
RE
S
RIS
K†
SIG
NIFIC
AN
CE
‡ L
C
RA
TING
M
S
S
CO
RE
negatively im
pact water quality
negatively impact w
ater quality throughout the w
ater column.
project, minim
ising the risk of pollution to the m
arine environment and
atmosphere in accordance w
ith established international standards.
Offshore
Inspection and P
reparation W
ater Quality
Leakage of hydraulic fluids, oil, or other substances from
the RO
V
could negatively impact w
ater quality throughout the w
ater column
during its descent to the seabed.
The RO
V and all associated equipm
ent will be m
aintained and inspected for leaks prior to deploym
ent.
All chem
icals used in underwater
equipment, such as the R
OV
and PC
V, w
ill be compliant w
ith the OS
PA
R
standards, ensuring compliance w
ith established international standards for acceptable levels of environm
ental perform
ance of chemicals in term
s of toxicity, persistence, and bioaccum
ulation.
B
2 Low
1
1 1
PC
V D
eployment
Water Q
uality
Leakage of hydraulic fluids, oil, or other substances from
the PCV
could negatively im
pact water
quality throughout the water colum
n during subsea low
ering.
The PC
V and all associated equipment
will be m
aintained and inspected for leaks prior to deploym
ent.
All chem
icals used in underwater
equipment, such as the R
OV
and PC
V, w
ill be compliant w
ith the OS
PA
R
standards, ensuring compliance w
ith established international standards for acceptable levels of environm
ental perform
ance of chemicals in term
s of toxicity, persistence, and bioaccum
ulation.
B
2 Low
1
1 1

Docum
ent Num
ber: FIN
AL
Revision:
V20
Revision D
ate: 24 S
eptember, 2021
P
age 7-48
AC
TIVITY
V
ULN
ER
AB
LE V
EC
S
IMP
AC
TS
MA
NA
GE
ME
NT M
EA
SU
RE
S
RIS
K†
SIG
NIFIC
AN
CE
‡ L
C
RA
TING
M
S
S
CO
RE
Jumper and R
iser D
eployment
Water Q
uality
Leakage of hydraulic fluids, oil, or other substances from
the RO
V
during manipulation of the jum
per or riser could
The PC
V and all associated equipment
will be m
aintained and inspected for leaks prior to deploym
ent.
All chem
icals used in underwater
equipment, such as the R
OV
and PC
V, w
ill be compliant w
ith the OS
PA
R
standards, ensuring compliance w
ith established international standards for acceptable levels of environm
ental perform
ance of chemicals in term
s of toxicity, persistence, and bioaccum
ulation.
B
2 Low
1
1 1
Riser
Com
missioning
Noise / V
ibration
Surface and/or subsea noise or
vibrations caused by pressure testing of the airlift in the riser pipe could disturb birds, fish, cetaceans, and turtles.
The air lift will only be in operation
during the System Integration Test and
System
Test Runs lim
iting exposure to underw
ater noise to approximately 343
hours.
This impact is tem
porary and will be
removed once the collector test has
ended without any residual im
pacts.
The maxim
um sensitivity score (4) has
been applied to the significance analysis (colum
n 9) to account for the uncertainty of the indirect im
pacts of noise and vibration disturbances on V
EC
s.
The monitoring conducted during the
collector test will provide inform
ation that w
ill inform the design of the full-
D
3 M
edium
2 4
8

Docum
ent Num
ber: FIN
AL
Revision:
V20
Revision D
ate: 24 S
eptember, 2021
P
age 7-49
AC
TIVITY
V
ULN
ER
AB
LE V
EC
S
IMP
AC
TS
MA
NA
GE
ME
NT M
EA
SU
RE
S
RIS
K†
SIG
NIFIC
AN
CE
‡ L
C
RA
TING
M
S
S
CO
RE
scale system
and the operational E
MM
P to reduce this im
pact to A
LAR
P.
Subsea
Connection of
Jumper on P
CV
Water Q
uality
Leakage of hydraulic fluids, oil, or other substances from
the RO
V
during connection of the jumper on
the PC
V could negatively impact
water quality throughout the w
ater colum
n.
The RO
V, Jumper and R
iser hoses and all associated equipm
ent will be
maintained and inspected for leaks
prior to deployment.
All chem
icals used in underwater
equipment, such as the R
OV
and PC
V, w
ill be compliant w
ith the OS
PA
R
standards, ensuring compliance w
ith established international standards for acceptable levels of environm
ental perform
ance of chemicals in term
s of toxicity, persistence, and bioaccum
ulation.
B
2 Low
1
1 1
System
Testing W
ater Quality
Manoeuvring the PC
V on the
seabed, pick-up test runs, and system
test runs will physically
disturb the sediments and nodules
creating a sediment plum
e and potentially m
obilizing particle-bound nutrients and trace m
etals.
Water quality in the bathypelagic
zone and below could be im
pacted by increased turbidity caused by suspended sedim
ents and m
obilized chemicals released from
The area of direct physical disturbance of the sea floor w
ill be restricted to 0.5km
2 within the 8 km
2 TF.
Statistical analysis of TS
S concentration m
odelling results of the benthic plum
e at 5m above the seabed
indicate that the duration of exceedances of 1m
g/l are expected to be less than 24 hrs over the 259 hours of operations (i.e., <10%
). This suggests that in term
s of TSS
, impacts
to bathypelagic water quality w
ill be tem
porary and of short duration, although im
pacts may extend for up to
E
1 Low
1
1 1

Docum
ent Num
ber: FIN
AL
Revision:
V20
Revision D
ate: 24 S
eptember, 2021
P
age 7-50
AC
TIVITY
V
ULN
ER
AB
LE V
EC
S
IMP
AC
TS
MA
NA
GE
ME
NT M
EA
SU
RE
S
RIS
K†
SIG
NIFIC
AN
CE
‡ L
C
RA
TING
M
S
S
CO
RE
the return w
ater pipe outlet at 1,200m
. 2.0 km
outside the boundary of the TF at a height of 5m
above the seabed.
Statistical analysis of TS
S concentration m
odelling results of the m
id-water plum
e at -1050m depth
indicate that the cumulative duration of
exceedances of 0.1mg/l are expected
to be less than 8 hrs over the 259 hours of operation (i.e., <5%
), and show
very little lateral migration. This
suggests that in terms of TS
S, im
pacts to m
id-water w
ater quality will be
temporary, of short duration, and
confined to the water colum
n above the TF.
The monitoring conducted during the
collector test will provide inform
ation that w
ill inform the design of the full-
scale system and the operational
EM
MP
to reduce this impact to
ALA
RP
.
Light / Noise / V
ibration
Manoeuvring the PC
V on the
seabed and pick-up test runs will
create light, noise, and vibration.
Riser installation and
comm
issioning tests, system
integration testing, and system test
runs all have the potential to create noise and vibration disturbances at the surface and throughout the w
ater column from
use of the air lift
Exposure to underw
ater light, noise and vibration generated by the P
CV
will be lim
ited to 566 hours over the span of the system
testing.
The air lift will only be in operation
during the System Integration Test and
System
Test Runs lim
iting exposure to underw
ater noise to approximately 343
hours.
E
2 M
edium
2 4
8

Docum
ent Num
ber: FIN
AL
Revision:
V20
Revision D
ate: 24 S
eptember, 2021
P
age 7-51
AC
TIVITY
V
ULN
ER
AB
LE V
EC
S
IMP
AC
TS
MA
NA
GE
ME
NT M
EA
SU
RE
S
RIS
K†
SIG
NIFIC
AN
CE
‡ L
C
RA
TING
M
S
S
CO
RE
and through pressure testing of the system
. These im
pacts are temporary and w
ill be rem
oved once the collector test has ended w
ithout any residual impacts.
The maxim
um sensitivity score (4) has
been applied to the significance analysis (colum
n 9) to account for the uncertainty of the indirect im
pacts of noise / light / vibration disturbances on V
EC
s.
The monitoring conducted during the
collector test will provide inform
ation that w
ill inform the design of the full-
scale system and the operational
EM
MP
to reduce this impact to
ALA
RP
.
Sedim
ent Geochem
istry and m
icro-topography
Manoeuvring the PC
V on the
seabed, pick-up test runs, and system
test runs will m
ix the surface layers of the sedim
ent, disrupting oxygen concentration gradients in the surface layers and potentially m
obilizing particle-bound nutrients and trace m
etals.
Sedim
entation from the operational
and mid-w
ater plumes m
ay also alter m
icro-topography of benthic sedim
ents.
The area of direct physical disturbance of the sea floor w
ill be restricted to 0.5 km
2 within the 8 km
2 TF.
Based on m
odelling results the total area that w
ill be subjected to sedim
entation is approximately 6km
2; of w
hich approximately 4 km
2 (66%)
lies within the TF. O
f the 2 km2 that lies
outside of the TF approximately 1.8
km2 (90%
) will be subjected to
cumulative sedim
entation rates of <1 m
m.
The maxim
um sensitivity score (4) has
been applied to the significance analysis (colum
n 9) to account for the
E
2 M
edium
2 4
8

Docum
ent Num
ber: FIN
AL
Revision:
V20
Revision D
ate: 24 S
eptember, 2021
P
age 7-52
AC
TIVITY
V
ULN
ER
AB
LE V
EC
S
IMP
AC
TS
MA
NA
GE
ME
NT M
EA
SU
RE
S
RIS
K†
SIG
NIFIC
AN
CE
‡ L
C
RA
TING
M
S
S
CO
RE
uncertainty of the indirect im
pacts of sedim
ent geochemistry and m
icro-topography to physical disturbance and sedim
entation.
The monitoring conducted during the
collector test will provide inform
ation that w
ill inform the design of the full-
scale system and the operational
EM
MP
to reduce this impact to
ALA
RP
.
Riser and P
CV
Recovery
Water Q
uality
A R
OV
will be used for recovery,
leakage of hydraulic fluids, oil, or other substances from
the RO
V
could negatively impact w
ater quality throughout the w
ater colum
n.
The RO
V, Jumper and R
iser hoses and all associated equipm
ent will be
maintained and inspected for leaks
prior to deployment.
All chem
icals used in underwater
equipment, such as the R
OV
and PC
V, w
ill be compliant w
ith the OS
PA
R
standards, ensuring compliance w
ith established international standards for acceptable levels of environm
ental perform
ance of chemicals in term
s of toxicity, persistence, and bioaccum
ulation.
B
1 Low
1
1 1
(Notes:; †- L – Likelihood; C
– Consequence; ‡- M
– Magnitude; S
– Sensitivity)

Document Number: FINAL
Revision: V20
Revision Date: 24 September, 2021
Page 8-1
8 BIOLOGICAL ENVIRONMENTAL IMPACTS
8.1 Overview
This section identifies and assesses the impacts of the collector test on biological VECs Impacts of various stages of the collector test are considered for the following zones: atmospheric (above the water), euphotic (0 to 200 m), mesopelagic (200 m to 1,000 m), bathypelagic (1,000 m to 4,000 m) and abyssal (4,000 m to 6,000 m) including the benthic component. A summary of relevant environmental effects (that is, project related activities that interact with biological components of the receiving environment) considered is provided in Table 8-1.
The collector test EIA is a sub-component of a comprehensive operational ESIA that is currently being conducted. It is anticipated that all the planned ESIA baseline studies will be completed by the end of 2022, until then gaps may remain in our understanding of the sensitivity of key VECs represented within NORI-D. Where such uncertainty exists, it has been acknowledged, and the precautionary approach applied to the analysis. It is a key objective of the collector test to collect information which reduces the level of inherent uncertainty in the operational phase of the project.
Table 8-1. Summary of environmental effects for biological VECs
ACTIVITY VULNERABLE VECS ENVIRONMENTAL EFFECTS
Return transit of vessel from San Diego to the CCZ
Cetaceans/Turtles Vessel strike
Offshore Inspection and Preparation
Benthic Biota (sediment, nodule, free swimming)
Deployment of the ROV and other equipment (inc. LBL network) to the seabed will physically disturb animals living on the nodules and in sediments.
Benthic Habitat Quality Deployment of other equipment (inc. LBL network) to the seabed will physically disturb benthic habitat by creating contours in the sediment.
PCV Deployment
Cetaceans/Turtles Lowering the PCV through the splash zone could disturb or physically strike cetaceans or turtles that are in close proximity to the vessel.
Benthic Biota (sediment, nodule, free swimming)
Touchdown of the PCV on the seabed will disturb animals living on the nodules and in sediments.
Benthic Habitat Quality Touchdown of the PCV on the seabed will disturb the benthic habitat by creating contours in the sediment and/or moving or crushing nodules.
Jumper and Riser Deployment
Cetaceans/Turtles Lowering the jumper and riser tubes through the splash zone has the potential to disturb or strike cetaceans or turtles that are in close proximity to the vessel.
System Testing Cetaceans
Riser installation and commissioning tests, system integration testing, and system test runs all have the potential to create noise and vibration disturbances at the surface and throughout the water column from use of the air lift and through pressure testing of the system which could disturb diving and foraging behaviour.

Document Number: FINAL
Revision: V20
Revision Date: 24 September, 2021
Page 8-2
ACTIVITY VULNERABLE VECS ENVIRONMENTAL EFFECTS
Microbes
Manoeuvring the PCV on the seabed, pick-up test runs, and system test runs will physically disturb the sediments and nodules potentially disrupting the microbial community structure in the surface layers of the sediment, and seafloor metabolic activity,
Benthic Biota (sediment, nodule, free swimming)
Manoeuvring the PCV on the seabed and pick-up test runs will create noise and vibration which could disturb or displace motile large macrofauna. Riser installation and commissioning tests, system integration testing, and system test runs all have the potential to create noise and vibration disturbances at the surface and throughout the water column from use of the air lift and through pressure testing of the system. PCV will emit light. Manoeuvring the PCV on the seabed and pick-up test runs will physically disturb or remove sediment and nodule dwelling animals. System test runs will create a benthic plume, as entrained sediment is ejected from the rear of the PCV; this plume will be denser than that formed during the manoeuvrability and pick-up test runs and will blanket and smother surrounding sessile biota.
Benthic Habitat Quality
Manoeuvring the PCV on the seabed and pick-up test runs will physically disturb the benthic habitat by creating contours in the sediment, disrupting surface layers of sediment, and/or moving or crushing nodules. System test runs will create a benthic plume, as entrained sediment is ejected from the rear of the PCV; this plume will be denser than that formed during the manoeuvrability and pick-up test runs and will blanket surrounding benthic habitat.
Nekton
Nekton in the euphotic, pelagic and bathypelagic zones could be impacted by noise and vibration from the air lift system and by suspended sediment and mobilized chemicals released from the return water pipe outlet at 1,200 m.
Zooplankton
Zooplankton in the euphotic, pelagic and bathypelagic zones could be impacted by noise and vibration from the air lift system and by suspended sediment and mobilized chemicals released from the return water pipe outlet at 1,200 m.
Riser and PCV Recovery Cetaceans/Turtles
Rising the jumper hose, riser pipe, and PCV through the splash zone could disturb or physically strike cetaceans or turtles that are in close proximity to the vessel.
8.2 Environmental Effects
The environmental effects of the collector test have the potential to impact a number of biological VECs, including: cetaceans/turtles; benthic biota (sediment, nodule, free swimming); benthic habitat quality; microbes; nekton; zooplankton.
Relevant environmental effects have been categorised as:
• Those associated with surface support vessel operations, such as vessel strike; and

Document Number: FINAL
Revision: V20
Revision Date: 24 September, 2021
Page 8-3
• Those specific to the collector test operations such as physical disturbance to biota and habitats.
8.2.1 Surface Support Vessel Operations Changes to air quality, greenhouse gases emissions, acoustics and vibration, ambient light, and water quality resulting from surface support vessel operations have been assessed as ‘non-significant’ in Section 7; and as such are unlikely to cause adverse significant impacts to the biotic component of the receiving environment.
Direct vessel strike of cetaceans and turtles is an impact pathway that has not been addressed. Most reports of collisions between whales and vessels involve large whales, but all species can be affected. Collisions with large vessels often go unnoticed and unreported. Animals can be injured or killed and vessels can sustain damage. Serious and even fatal injuries to passengers have occurred involving hydrofoil ferries, whale watching vessels and recreational craft (IWC, 2021).
The International Maritime Organisation has developed a guidance document for minimising the risk of collisions between ships and whales (IMO, 2013) and recommends that the most effective mitigation measures include good route planning, keeping watch and continued scientific research.
Tracking data for key migratory species in the eastern Pacific is available which shows that NORI-D is located outside of many of the known migratory routes (Figure 8-1). In addition, all vessels will keep watch from the bridge 24/7 as is best practice, and NORI will continue to research the frequency of cetacean and turtle sightings in NORI-D as part of the ongoing PelagOS observation efforts.
8.2.2 Collector System Testing
8.2.2.1 Benthic Biota (a) Physical disturbance
Benthic biota can be impacted in a number of ways by activities associated with the collector test. Sessile fauna attached to nodules (e.g., corals, bryozoans, xenophyophores, sponges etc.), sediment infauna (e.g., polychaetes, nematodes etc.) and motile deposit feeders (e.g., holothurians, echinoids etc.) may be compressed within the sediments if caught under the tracks of the PCV. These organisms will also be extracted with nodules or entrained into the onboard nodule processing system. Any surviving organisms will be either ejected from the rear of the PCV or transported up the 4km riser pipe to the surface attached to a nodule.
The feasibility of assessing survival rates for megafauna passing through the onboard nodule processing system and ejected with the benthic plume will be investigated as part of the collector test. It is proposed to add a basket to the rear of the PCV to collect ejected biota. Any captured specimens will be brought to the surface when the PCV is recovered and examined for signs of trauma and the likelihood they would have survived the passage through the nodule processing system will be assessed.
The PCV will generate noise and vibration and emit light as it passes over the seafloor. Although the vast majority of benthic biota comprise of sessile and motile invertebrate mega-, macro and meio- fauna, there is potential for motile organisms (e.g., fish) to be displaced from an area due to disturbances of this nature.
The intensity of noise, vibration and light generated by the PCV and the biological receptors that may be impacted will be studied as part of the collector test monitoring.

Document Number: FINAL
Revision: V20
Revision Date: 24 September, 2021
Page 8-4
Figure 8-1 Tracking data for migratory species in the eastern tropical Pacific
Source: Fathom Pacific (2020b) adapted from Block et al (2011)
(b) Biodiversity Loss and the Potential for Habitat Recovery
Since the 1970s, a number of studies have been undertaken to understand the potential impacts of polymetallic nodule mining related activities by creating small-scale disturbances in the deep-sea (for example, OMI, OMA, OMCO, DISCOL, BIE-II, ION NIE, JET and INDEX; for review see (Jones et al. 2017)).
While the results of these studies provide an indication of the impacts on the benthic biota associated with seafloor disturbance related to nodule removal, meta-analyses reveal recovery for different organisms varies on spatial and temporal scales and has been shown to vary depending on the organism’s size and mode of life (e.g., sessile suspension feeder; motile deposit feeder; predator or scavenger) (Gollner et al. 2017; Jones et al. 2017).
Suspension feeder abundance is predominantly controlled by substratum availability (Vanreusel et al. 2016) and the loss of hard substrata or alteration of substrata composition may cause substantial community shifts that persist over geological timescales at mined sites (Gollner et al. 2017).The DISCOL experiments show that 26 years after simulated mining disturbance suspension-feeder presence remained significantly reduced in disturbed areas, while deposit-feeders showed no diminished presence in disturbed areas (Simon-Lledó et al. 2019b; Stratmann, Voorsmit, et al. 2018). Significantly lower heterogeneity diversity in disturbed areas and markedly distinct faunal compositions along different disturbance levels were also evident (Simon-Lledó et al. 2019b). Fish density was also shown to be lower in ploughed habitat at 6 months and 3 years following disturbance, but 26 years after disturbance there were no differences in overall total fish densities between reference and experimental areas. However, a change in the assemblage in ploughed habitat, suggests that benthic fish communities may remain affected to some extent after decades (Drazen et al. 2019b).
Analyses of the nematode community 26 years after the OMC experimental dredging revealed that total nematode density and biomass within the dredging track was significantly lower than outside the track

Document Number: FINAL
Revision: V20
Revision Date: 24 September, 2021
Page 8-5
and the structure of the nematode assemblage within the track differed significantly from those in the two undisturbed sites, indicating the nematode assemblage had not returned its initial state, and the degree and character of the disturbance appeared to be of considerable importance for the recovery rate of nematode assemblages and their ability to recolonize disturbed areas (Miljutin et al. 2011; Simon-Lledó et al. 2019; Stratmann, Voorsmit, et al. 2018)
Although some organisms show densities similar to areas not subjected to disturbance (Miljutin et al. 2011), composition of groups of organisms are different suggesting that communities remain affected to some extent after decades (Simon-Lledó et al. 2019b; Vanreusel et al. 2016; Drazen et al. 2019b). High variance in recovery rates among taxa, prevents predicting a general pattern of recovery or a sequence of successional stages at nodule fields (Gollner et al. 2017) with variation in the recovery potential observed between studies likely also derived from the differences in disturbance, location, type, and intensity.
8.2.2.2 Benthic Habitat Quality (a) Changes in micro-topography
As the PCV moves across the seafloor the tracks of the propulsion system and the removal/burial of nodules will modify the biogeochemical and physical characteristics of the sediments, and micro-topography of the seafloor. In addition, the PCV will create a benthic plume of suspended sediment which will be deposited across the broader seafloor beyond the area directly disturbed by the PCV.
As expected, owing to the low bottom current speeds and low sediment accumulation rates in the CCZ, the DISCOL experiments show that 26 years after simulated mining disturbance, the plough tracks were devoid of nodules, and clearly distinguishable microhabitats (including ridges, furrows and exposed subsurface sediments) remained (Vonnahme et al. 2020). Furthermore, burial of nodules from benthic plumes essentially removed any remaining hard substrate from the wider area, limiting the potential for recolonization by suspension feeders (Simon-Lledó et al. 2019).
Computer tomography scans of sediment cores obtained from reference stations and in areas of disturbance where the subsurface sediments were exposed, reveal sediment density was higher and porosity was lower than at the reference stations, with fewer bioturbation channels noted in sediments from within the disturbed area, indicating reduced biological activity (Vonnahme et al. 2020).
Similar changes to the biogeochemical and physical characteristics of the sediments and micro-topography of the seafloor are expected following disturbance at the collector test site. (b) Sediment Plumes
The potential impacts of sediment plumes on benthic and benthopelagic organisms are well documented (e.g., Glover et al., 2003; Jones et al., 2017; Oebius et al., 2001; Ramirez-Llodra, 2011; Jumas 1981; Sharma, 2011; 2015; Smith, 1999) and Christiansen et al., (2020) provide a summary of the potential impacts of benthic plumes on pelagic and benthopelagic fauna, including:
• Burying/smothering of sessile organisms.
• Impaired respiration and filter feeding efficiency through clogging of gills and filtration apparatus as a result of high loads of suspended inorganic particles.
• Competition of unpalatable particles with organic food particles resulting in less efficient suspension feeding.
• Interference with odour plumes released from food falls, resulting in lower detection rates and generally lower food availability for scavengers.
• Attenuation of chemosensory and bioluminescent capacity in some organisms leading to reduced probability of finding a mate and to lower reproduction rates.

Document Number: FINAL
Revision: V20
Revision Date: 24 September, 2021
Page 8-6
It is anticipated that benthic, benthopelagic and mid-water organisms within the TF and other parts of the CTA will experience some of these impacts. However, modelling of the benthic plume indicates that exceedances outside the recorded range of natural variation (that is ±1 mg/l) are expected for less than 24 hours over the 259 hours of operations (that is, <10% of the time). This suggests, that in terms of TSS, impacts to bathypelagic water quality will be temporary and of short duration, although impacts may extend for up to 2.0 km outside the boundary of the TF site at a height of 5 m above the seabed (Section 7). Modelling of the mid-water plume suggests that all exceedances of ≥0.1 mg/l will be spatially confined to a small area around the point of discharge over the 259 hours of operations. The modelling does not show a strong lateral trajectory in any direction. Impacts associated with the mid-water plume are characterised as temporary, of short duration and confined to a small footprint within the TF.
During the collector test, the behaviour of both benthic and mid-water plumes will be monitored in real-time using a number of static and autonomous platforms integrated with a suite of sensors. The ultimate fate of the materials from the plumes will also be determined. (c) Long-term Monitoring
Post-collector test, the TF site and impacted parts of the CTA will be designated as IRZs and used to conduct long-term environmental recovery studies (Section 10).
The aim of long-term studies will be to monitor recovery in areas subjected to disturbance. Results of monitoring will be benchmarked against the pre-test baseline of the CTA (Section 6) and the ongoing monitoring of VECs at the PRZ.
The IRZs will not be disturbed further following the collector test will be preserved and monitored for the duration of operations (i.e., up to 30 years).
8.2.2.3 Microbes
Removing nodules from the seafloor may alter the provision of ecosystem services, such as nutrient regeneration, C-transformation and burial through dissolved inorganic carbon fixation and bioturbation (Wenzhöfer et al. 2001; Smith et al. 2008; Thurber et al. 2014; Sweetman et al. 2017; 2019).
Recent in-situ studies in the contract areas in the eastern CCZ have shown that microbes dominate benthic biomass in upper sediment (0-5cm) layers and are the most important organism group cycling organic material (Sweetman et al. 2019)
Microbes are also capable of absorbing significant amounts of dissolved inorganic C into their biomass thereby removing CO2 from the water column, indicating that microbes and macrofauna play important ecosystem roles in abyssal environments, and may be sensitive to disturbance (Mevenkamp et al. 2017; Stratmann, Mevenkamp, et al. 2018)
Previous studies have shown that benthic ecosystem functioning is exponentially related to benthic biodiversity (Danovaro et al. 2008), any modifications to benthic biodiversity caused by disturbnce may have significant impacts on microbial activities, seafloor respiration rates and bioturbation activities. Analyses of data from the DISCOL experiments shows that microbially mediated biogeochemical function may need over 50 years to return to undisturbed levels (Vonnahme et al., 2020).
Post-collector test, the TF and impacted parts of the CTA will be designated as IRZs used to conduct long-term environmental recovery studies (Section 10).
The aim of long-term studies will be to assess how microbial activities, C-cycling and seafloor respiration rates have altered following the disturbance, and how they recover. Results of monitoring will be benchmarked against the pre-test baseline of the CTA (Section 6) and the ongoing monitoring of VECs at the PRZ.
The IRZs will not be disturbed further following the collector test will be preserved and monitored for the duration of operations (i.e., up to 30 years).

Document Number: FINAL
Revision: V20
Revision Date: 24 September, 2021
Page 8-7
8.2.2.4 Nekton & Zooplankton
Impacts to nekton and zooplankton communities from nodule collection are most likely to originate from the effects of the mid-water plume as a result of surface processing water being returned to the ocean (Drazen et al., 2020).
Abundant suspension feeders, including protists, crustaceans, polychaetes, salps, and appendicularians, filter small particles from the water and form an important part of the pelagic food web (Conley et al, 2018) and mid-water plumes have the potential to cause distress by clogging respiratory and olfactory surfaces (Wilber and Clarke 2001). Suspension feeders may also suffer from dilution of food materials by inorganic sediments and clogging of fragile mucous filter nets (Hu 1981). Fine sediment may adhere to gelatinous plankton, reducing their buoyancy (Robison 2009).
The impact of resuspending metals from sediment and nodules transported from the seafloor and released from the mid-water plume has been highlighted (Hauton et al. 2017). Many metals (e.g., copper, lead, cadmium, chromium, mercury, zinc, arsenic, nickel, iron, lanthanum, yttrium) have been shown to exert toxic effects across trophic levels: from phytoplankton and zooplankton (Hauton et al. 2017; Mestre et al. 2017) and although extensive data quantify the toxicity of metals in solution in shallow-water organisms, these may not be representative of the toxicity in deep-sea organisms, which may differ biochemically and physiologically and which will experience those toxicants under conditions of low temperature and high hydrostatic pressure, (Hauton et al. 2017).
Sediment plumes will also absorb light and change backscatter properties, reducing visual communication and bioluminescent signalling that are essential for prey capture and reproduction in mid-water animals (Haddock et al., 2010). Noise from mining activities could cause physiological stress or interfere with larval settlement, (Lin et al. 2019) foraging, and communication in fish (Popper et al. 2003).
Modelling of the mid-water plume predicts that all exceedances ≥0.1 mg/l will be spatially confined to a small area around the actual discharge points over the 259 hours of productive operations. The modelling does not show a strong lateral trajectory in any particular direction. Impacts associated with the mid-water plume are characterised as temporary, of short duration and confined to a small footprint.
As part of the collector test monitoring program, nekton and zooplankton communities will continue to be tracked post-disturbance. Baseline metal concentrations in pelagic fish will also be established and tracked (see Section 12.3.3).
The aim of long-term studies will be to monitor any effects on these communities following the disturbance and document recovery. Results of monitoring will be benchmarked against the pre-test baseline of the CTA (Section 6) and the ongoing monitoring of VECs at the PRZ.
8.2.2.5 Noise
All marine biota are susceptible to impacts from underwater noise and vibration. Various natural and anthropogenic activities contribute to noise in the ocean creating a complex acoustic environment. Changes in the acoustic environment can change an animal’s ability to function within its given acoustic habitat (for review, see Duarte et al. 2021).
A primary source of underwater noise generation during the collector test will be the air lift fitted to the riser pipe. It is not known at this stage what levels of noise and vibration will be generated by the system or if it will be primarily impulsive or non-impulsive.
During the collector test an array of hydrophones will be integrated on to and static moorings and/or autonomous platforms at varying depths and distances from the source to collect data on underwater noise and vibration.
The PCV will also be equipped with a hydrophone to measure noise levels originating from the benthic equipment.

Document Number: FINAL
Revision: V20
Revision Date: 24 September, 2021
Page 8-8
8.3 Impact Management
8.3.1 Impact Minimisation Through Planning The primary method for minimisation of impacts to biological VECs is by considered planning and design of the collector system and test program. In addition to measures to minimise impacts to physicochemical VECs described in Section 7.5.1, the following additional design features have been incorporated into the collector test to minimise impacts to biological VECs:
1. The wet weight of nodules collected during the collector test will be restricted to approximately 3,600 tonnes, limiting the impacts of the test due to loss of nodule habitat and direct impacts to benthic biota.
2. Nodules >80 mm in diameter will not be collected. Larger nodules will be left in the TF where they may continue to provide habitat value for nodule obligate biota, if not buried by sediment.
3. Modelling of the mid-water plume predicts that all exceedances of ≥0.1 mg/l will be spatially confined to a small area around the actual discharge points over the 259 hours of operations. The modelling does not show a strong lateral trajectory in any particular direction. Impacts associated with the mid-water plume are characterised as temporary, of short duration and confined to a small footprint.
8.3.2 Risk Assessment
The EIA study team has conducted a risk assessment for biological VECs (Table 8-2, Column 5 “Risk”), based on the criteria described in Table 4-10 and Table 4-11..
The results of the risk assessment indicate that with the implementation of the proposed management measures (Table 8-2, Column 4 “Management Measures”) risks to the biological component of the receiving environmental can be managed to acceptable (i.e., Low-Medium) levels without a requirement for additional focused mitigation measures.
8.3.3 Residual Impacts Residual impacts refer to those environmental effects predicted to remain after the application of management measures – essentially the unavoidable consequences of seabed mining. Of concern to regulators are any significant residual impacts that cannot be reduced to levels acceptable to the ISA after successful application of the proposed and focussed mitigation measures.
Potentially significant residual impacts have been assessed by considering the estimated magnitude of an impact following the application of management measures and the sensitivity of the VEC according to the methods described in Section 4.2. Application of a precautionary approach requires that uncertainty be incorporated into the assessment by assigning a maximum sensitivity score (4) in circumstances where little or no information is available on how a VEC may respond to an impact.
Table 8-2 summarises the significance of residual impacts of the proposed activities on the biological VECs represented in the receiving environment. No significant residual impacts are anticipated at a regional scale.

Docum
ent Num
ber: FIN
AL
Revision:
V20
Revision D
ate: 24 S
eptember, 2021
P
age 8-9 Table 8-2
Impact significance &
risk assessment - B
iological VECs
AC
TIVITY
V
ULN
ER
AB
LE V
EC
S
IMP
AC
TS
MA
NA
GE
ME
NT M
EA
SU
RE
S
RIS
K†
SIG
NIFIC
AN
CE‡
L C
R
ATIN
G
M
S
SC
OR
E
Return transit
of the vessel from
San
Diego to the
CC
Z
Cetaceans/Turtles
Vessel strike
Measures
recomm
ended by
the International
Maritim
e O
rganisation (IMO
, 2013) for m
inimising the risk of collisions
between
ships and
whales
will
be im
plemented
during the
collector test
campaign, including: good route planning for
transit to the site, keeping watch, continued
scientific research into the migratory species
that utilize NO
RI-D
.
A
2 Low
1
1 1
Offshore
Inspection and P
reparation
Benthic B
iota
(sediment, nodule, free sw
imm
ing)
Deploym
ent of the RO
V and other
equipment (inc. LB
L network) to
the seabed has the potential to physically disturb sedim
ent and nodule dw
elling animals.
The area of the seabed that will be disturbed
with each touchdow
n of the RO
V will be
negligible. Many of the operations involving
the RO
V and com
missioning of the PC
V and
associated infrastructure will be constrained
to the water colum
n above the seafloor.
E
1 Low
1
1 1
Benthic H
abitat Quality
Deploym
ent of other equipment
(inc. LBL netw
ork) to the seabed w
ill physically
disturb benthic
habitat by creating contours in the sedim
ent.
The area of the seabed that will be disturbed
with each touchdow
n of an LBL beacon w
ill be negligible.
E
1 Low
1
1 1
PC
V
Deploym
ent C
etaceans/Turtles
Lowering the
PCV
through the
splash zone
could disturb
or physically
strike cetaceans
or turtles that are in close proxim
ity to the vessel.
Back
deck operations
will
be closely
observed during
equipment
deployment.
Operations w
ill be imm
ediately suspended if cetaceans or turtles are observed from
the ship. A
period of 30 mins observation w
ill be undertaken to confirm
that the animals have
left the imm
ediate area before resuming
operations.
A
2 Low
1
1 1

Docum
ent Num
ber: FIN
AL
Revision:
V20
Revision D
ate: 24 S
eptember, 2021
P
age 8-10
AC
TIVITY
V
ULN
ER
AB
LE V
EC
S
IMP
AC
TS
MA
NA
GE
ME
NT M
EA
SU
RE
S
RIS
K†
SIG
NIFIC
AN
CE‡
L C
R
ATIN
G
M
S
SC
OR
E
Continued
scientific research
into the
migratory species that utilize N
OR
I-D w
ill be conducted.
Benthic B
iota
(sediment, nodule, free sw
imm
ing)
Touchdown of the PC
V on the seabed w
ill physically disturb or displace
sediment
and nodule
dwelling anim
als.
The footprint of the PCV
measures 6x6 m
the area that w
ill be disturbed with each
touchdown of the PC
V (i.e., non-propelled)
will be negligible.
E
1 Low
1
4 4
Benthic H
abitat Quality
Touchdown of the PC
V on the seabed w
ill physically disturb the benthic
habitat by
creating contours in the sedim
ent and/or m
oving or crushing nodules.
The footprint of the PCV
measures 6x6 m
the area that w
ill be disturbed with each
touchdown of the PC
V (i.e., non-propelled)
will be negligible.
E
1 Low
1
4 4
Jumper and
Riser
Deploym
ent C
etaceans/Turtles
Lowering
the jum
per and
riser tubes through the splash zone has the
potential to
disturb or
physically strike
cetaceans or
turtles that are in close proximity
to the vessel.
Back
deck operations
will
be closely
observed during
equipment
deployment.
Operations w
ill be imm
ediately suspended if cetaceans or turtles are observed from
the ship. A
period of 30 mins observation w
ill be undertaken to confirm
that the animals have
left the imm
ediate area before resuming
operations.
Continued
scientific research
into the
migratory species that utilize N
OR
I-D w
ill be conducted.
A
2 Low
1
1 1
System
Testing
Cetaceans/Turtles
Riser
installation and
comm
issioning tests,
system
integration testing,
and system
test runs all have the potential to create
noise and
vibration disturbances at the surface and
The air lift will be in operation during the
Riser
installation and
comm
issioning, S
ystem Integration Test and S
ystem Test
Runs lim
iting exposure to underwater noise
to approximately 529 hours.
E
2 M
edium
2 4
8

Docum
ent Num
ber: FIN
AL
Revision:
V20
Revision D
ate: 24 S
eptember, 2021
P
age 8-11
AC
TIVITY
V
ULN
ER
AB
LE V
EC
S
IMP
AC
TS
MA
NA
GE
ME
NT M
EA
SU
RE
S
RIS
K†
SIG
NIFIC
AN
CE‡
L C
R
ATIN
G
M
S
SC
OR
E
throughout the water colum
n from
use of the air lift
and through pressure
testing of
the system
which
could disturb
diving and
foraging behaviour.
This im
pact is
temporary
and w
ill be
removed once the collector test has ended
without any residual im
pacts.
The maxim
um sensitivity score (4) has been
applied to account for the current uncertainty of the indirect im
pacts of noise and vibration disturbances on biological V
EC
s.
The m
onitoring conducted
during the
collector test will provide inform
ation that will
inform the design of the full-scale system
and the operational E
MM
P to reduce this
impact to A
LAR
P.
Microbes
Manoeuvring
the PC
V
on the
seabed, pick-up test
runs, and
system test runs w
ill physically disturb the sedim
ents and nodules potentially disrupting the m
icrobial com
munity
structure in
the surface layers of the sedim
ent, and seafloor m
etabolic activity
The area of direct physical disturbance of the sea floor w
ill be limited to 0.5 km
2 within the
8 km2 TF.
Based on m
odelling results the total area that w
ill be subjected to sedimentation is
approximately 6 km
2; of which approxim
ately 4 km
2 (66%) lies w
ithin the TF. Of the 2 km
2 that lies outside of the TF approxim
ately 1.8 km
2 (90%) w
ill be subjected to cumulative
sedimentation rates of <1 m
m.
The maxim
um sensitivity score (4) has been
applied to account for the current uncertainty in the rate of recovery of seafloor respiration rates,
seafloor m
etabolic activity,
E
2 M
edium
2 4
8

Docum
ent Num
ber: FIN
AL
Revision:
V20
Revision D
ate: 24 S
eptember, 2021
P
age 8-12
AC
TIVITY
V
ULN
ER
AB
LE V
EC
S
IMP
AC
TS
MA
NA
GE
ME
NT M
EA
SU
RE
S
RIS
K†
SIG
NIFIC
AN
CE‡
L C
R
ATIN
G
M
S
SC
OR
E
bioturbation and sediment geochem
istry to physical disturbance and sedim
entation.
The m
onitoring conducted
during the
collector test will provide inform
ation that will
inform the design of the full-scale system
and the operational E
MM
P to reduce this
impact to A
LAR
P.
Benthic B
iota
(sediment, nodule, free sw
imm
ing)
Manoeuvring
the PC
V
on the
seabed and pick-up test runs will
create noise and vibration which
could disturb or displace motile
large macrofauna.
Riser
installation and
comm
issioning tests,
system
integration testing,
and system
test runs all have the potential to create
noise and
vibration disturbances at the surface and throughout the w
ater column from
use of the air
lift and through
pressure testing of the system.
PC
V w
ill emit light.
Manoeuvring
the PC
V
on the
seabed and pick-up test runs will
physically disturb
or rem
ove sedim
ent and
nodule dw
elling anim
als.
System
test
runs w
ill create
a benthic
plume,
as entrained
sediment is ejected from
the rear
The area of direct physical disturbance of the sea floor w
ill be limited to 0.5 km
2 within the
8 km2 TF.
Based on m
odelling results the total area that w
ill be subjected to sedimentation is
approximately 6km
2; of which approxim
ately 4 km
2 (66%) lies w
ithin the TF. Of the 2 km
2 that lies outside of the TF approxim
ately 1.8 km
2 (90%) w
ill be subjected to cumulative
sedimentation rates of <1 m
m.
The maxim
um sensitivity score (4) has been
applied to account for the current uncertainty in the rate of recovery of benthic biota from
direct rem
oval of nodules and sediment and
any changes
to sedim
ent geochem
istry, m
icro-topography and
any physical
disturbance from sedim
entation.
The m
onitoring conducted
during the
collector test will provide inform
ation that will
inform the design of the full-scale system
and the operational E
MM
P to reduce this
impact to A
LAR
P.
E
2 M
edium
2 4
8

Docum
ent Num
ber: FIN
AL
Revision:
V20
Revision D
ate: 24 S
eptember, 2021
P
age 8-13
AC
TIVITY
V
ULN
ER
AB
LE V
EC
S
IMP
AC
TS
MA
NA
GE
ME
NT M
EA
SU
RE
S
RIS
K†
SIG
NIFIC
AN
CE‡
L C
R
ATIN
G
M
S
SC
OR
E
of the PCV
; this plume w
ill be denser than that form
ed during the m
anoeuvrability and pick-up test
runs and
will
blanket and
smother
surrounding sessile
biota.
B
enthic Habitat Q
uality
Manoeuvring
the PC
V
on the
seabed and pick-up test runs will
physically disturb
the benthic
habitat by creating contours in the sedim
ent, disrupting
surface layers of sedim
ent, and/or moving
or crushing nodules.
System
test
runs w
ill create
a benthic
plume,
as entrained
sediment is ejected from
the rear of the PC
V; this plum
e will be
denser than that formed during
the manoeuvrability and pick-up
test runs
and w
ill blanket
and sm
other surrounding
sessile biota.
The area of direct physical disturbance of the sea floor w
ill be limited to 0.5 km
2 within the
8 km2 TF.
Based on m
odelling results the total area that w
ill be subjected to sedimentation is
approximately 6km
2; of which approxim
ately 4 km
2 (66%) lies w
ithin the TF. Of the 2 km
2 that lies outside of the TF approxim
ately 1.8 km
2 (90%) w
ill be subjected to cumulative
sedimentation rates of <1 m
m.
The maxim
um sensitivity score (4) has been
applied to account for the current uncertainty in the extent and rate of recovery of the benthic habitat from
the benthic plume.
The m
onitoring conducted
during the
collector test will provide inform
ation that will
inform the design of the full-scale system
and the operational E
MM
P to reduce this
impact to A
LAR
P.
E
2 M
edium
2 4
8
N
ekton N
ekton in the euphotic, pelagic and bathypelagic zones could be im
pacted by noise and vibration from
the air lift system and by
The air lift will be in operation during the
Riser
installation and
comm
issioning, S
ystem Integration Test and S
ystem Test
D
2 Low
1
4 4

Docum
ent Num
ber: FIN
AL
Revision:
V20
Revision D
ate: 24 S
eptember, 2021
P
age 8-14
AC
TIVITY
V
ULN
ER
AB
LE V
EC
S
IMP
AC
TS
MA
NA
GE
ME
NT M
EA
SU
RE
S
RIS
K†
SIG
NIFIC
AN
CE‡
L C
R
ATIN
G
M
S
SC
OR
E
suspended sedim
ent and
mobilized
chemicals
released from
the return water pipe outlet at
1,200 m.
Runs lim
iting exposure to underwater noise
to approximately 529 hours.
This im
pact is
temporary
and w
ill be
removed once the collector test has ended
without any residual im
pacts.
Statistical
analysis of
TSS
concentration m
odelling results of the mid-w
ater plume at -
1050m depth indicate that the cum
ulative duration
of exceedances
of 0.1m
g/l are
expected to be less than 8 hrs over the 259 hours of operation (that is, <5%
), and show
very little lateral migration. This suggests
that in terms of TS
S, impacts to m
id-water
water quality w
ill be temporary, of short
duration, and confined to the water colum
n above the TF.
The maxim
um sensitivity score (4) has been
applied to account for the current uncertainty in the extent of the m
id-water plum
e and of the indirect im
pacts of noise and vibration disturbances on biological V
EC
s.
The m
onitoring conducted
during the
collector test will provide inform
ation that will
inform the design of the full-scale system
and the operational E
MM
P to reduce this
impact to A
LAR
P.
Zooplankton
Zooplankton in
the euphotic,
pelagic and bathypelagic zones could be im
pacted by noise and vibration from
the air lift system
Statistical
analysis of
TSS
concentration m
odelling results of the mid-w
ater plume at -
1050m depth indicate that the cum
ulative duration
of exceedances
of 0.1m
g/l are
D
2 Low
1
4 4

Docum
ent Num
ber: FIN
AL
Revision:
V20
Revision D
ate: 24 S
eptember, 2021
P
age 8-15
AC
TIVITY
V
ULN
ER
AB
LE V
EC
S
IMP
AC
TS
MA
NA
GE
ME
NT M
EA
SU
RE
S
RIS
K†
SIG
NIFIC
AN
CE‡
L C
R
ATIN
G
M
S
SC
OR
E
and by suspended sediment and
mobilized
chemicals
released from
the return water pipe outlet at
1,200 m.
expected to be less than 8 hrs over the 259 hours of operation (that is, <5%
), and show
very little lateral migration. This suggests
that in terms of TS
S, impacts to m
id-water
water quality w
ill be temporary, of short
duration, and confined to the water colum
n above the TF.
The maxim
um sensitivity score (4) has been
applied to account for the current uncertainty in the extent of the m
id-water plum
e and of the indirect im
pacts of noise and vibration disturbances on biological V
EC
s.
The m
onitoring conducted
during the
collector test will provide inform
ation that will
inform the design of the full-scale system
and the operational E
MM
P to reduce this
impact to A
LAR
P.
Riser and
PC
V
Recovery
Cetaceans / Turtles
Rising the jum
per hose, riser pipe, and PC
V through the splash
zone could disturb or physically strike cetaceans or turtles that are in close proxim
ity to the vessel.
Back
deck operations
will
be closely
observed during
equipment
deployment.
Operations w
ill be imm
ediately suspended if cetaceans or turtles are observed from
the ship. A
period of 30 mins observation w
ill be undertaken to confirm
that the animals have
left the imm
ediate area before resuming
operations.
Continued
scientific research
into the
migratory species that utilize N
OR
I-D w
ill be conducted.
A
2 Low
1
1 1
(Notes:; †- L – Likelihood; C
– Consequence; ‡- M
– Magnitude; S
– Sensitivity)

Document Number: FINAL
Revision: V20
Revision Date: 24 September, 2021
Page 9-1
9 HAZARDS, MITIGATION & EMERGENCY RESPONSE PLAN
9.1 Introduction
This section provides a high-level overview of NORI’s approach to management of unpredicted hazards and emergency planning. All project related activities will be conducted from the Allseas vessel ‘Hidden Gem’ and a yet to be identified scientific support vessel. It is a requirement that shipping companies supplying the vessels will have established procedures for health and safety, emergency response, international maritime and navigational certification and compliance audits, crew qualifications and certifications, organisational charts of responsibilities, oil spill prevention and response plans, training, drills, inductions, audits, standard operating procedures etc.
The safety, hazard management systems and emergency response plans developed by the vessel suppliers will be reviewed and approved by NORI during contractual negotiations.
Once vessel selection has been finalised, NORI will develop task-specific procedures to cover hazards, environmental risks, and mitigations specific to the activities of contracted staff and points of integration with the vessel’s safety and emergency response procedures. This section describes the overarching principles that NORI will apply as part of this integration.
9.2 Potential Hazards
Hazards associated with the collector test and vessel operations with potentially severe consequences have been identified and are discussed below. Offshore, such events are usually associated with accidents leading to fuel or chemical spills, fires, explosions, or hazardous emissions.
Environmentally hazardous discharges resulting from accidental and extreme natural events are fundamentally different from normal operational discharges and emissions. These are essentially unplanned events, to be anticipated as possibilities, for which preventative action, reactive responses, or both, are required.
The probability of accidental events is low, given that the design of Project components and the selection of contractors are subject to the requirements of relevant technical codes, operating procedures, and control measures designed to minimise the likelihood of accidents. Similarly, natural events of sufficient magnitude to cause severe consequences have a low probability of occurrence and specific operational procedures will be developed and implemented under such circumstances.
While rare, accidents and extreme events can occur and there is potential for loss of life, environmental harm, asset loss and reputational damage. The focus of this assessment is to evaluate the potential consequences associated with major hazards, in terms of the criteria provided in Section 4.
Should accidents occur, NORI will mobilise resources according to established emergency response plans. Hazard and risk assessment of such events is integral to the Project and will be undertaken from Project design through to execution. This process includes:
• Hazard Identification Risk Assessment (HIRA).
• Assessment of identified risks against screening criteria, taking into consideration the likelihood of occurrence and the severity of consequences.
• Implementation of mitigation measures to reduce risks to ‘As Low As Reasonably Practicable’ (ALARP).

Document Number: FINAL
Revision: V20
Revision Date: 24 September, 2021
Page 9-2
• Systematic examination of process and engineering safety during operations, through the conduct of a hazard and operability (HAZOP) study.
• Induction training, drills and regular refresher courses that address site safety and emergency procedures in the event of an accident or natural hazard.
• Planning for recovery in the event of an incident.
Risks have been mitigated through a combination of design features, material selection, monitoring equipment, standard operating procedures, personnel competence and training.
A preliminary HIRA was conducted using the risk assessment approach described in Section 4. Project activities were assessed in terms of the likelihood and consequence should a hazard be realised. The risk assessment assumes the effective implementation of proposed mitigation measures and examines the residual risks resulting from accidental or extreme natural events. A precautionary approach to risk has been adopted with rankings assigned considering a worst-case credible scenario.
A summary of the HIRA is provided in Table 9-1. All residual risk ratings were assessed as Low or Medium. Further discussion of risks rated as Medium is provided below.
9.2.1 Chemical Leakage or Spillage Spills of chemicals or fuel may potentially occur as a result of leaks or failure of equipment or extreme incident such as a vessel collision (Section 9.2.3) or loss of containment. A spill may have detrimental impacts on water quality and adversely affect the marine ecosystem.
A spill risk assessment will be undertaken following the completion of the final project design. This will identify specific activities where there is potential for spills and describe mitigation measures to minimise the risk.
Mitigations measures and operating procedures will be reviewed and revised as needed considering the outcomes of the spill risk assessment. Proactive and reactive measures will be used to minimise the risk of fuel and other hazardous materials and their potential impacts. Proactive measures may include:
• Appropriate material selection and corrosion control in hoses, equipment and storage tanks.
• Pipe/hose pressures to be monitored to enable early detection of any leakages or spillage.
• Maintenance and monitoring programs to ensure the integrity of equipment and detect loss of containment.
• Emergency shutdown and containment systems.
• Provision and maintenance of spill response and containment equipment appropriate to the level and type of risk and located at all areas of possible spills.
• Ensure sufficient containment or bunding of chemical storage areas to prevent rain/drainage water being contaminated.
• Implementation of personnel training and field exercises in spill prevention, containment, and response.
• Reporting of all spills and near misses followed by a root cause analysis and corrective actions plan to prevent recurrence.
• Implementation of waste (solid and liquid) management plans.
• Implementation of a vessel water management plan that separates clean runoff from potentially contaminated water to minimise the potential for the release of contaminated water.

Document Number: FINAL
Revision: V20
Revision Date: 24 September, 2021
Page 9-3
Reactive measures in the event of an incident will be dependent on the level of the spill, consistent with international government and industry approaches to spill response management.
All activities associated with the implementation of the project will be subject to the requirements of the International Convention for the Prevention of Pollution from Ships (MARPOL) which includes regulations aimed at preventing both accidental pollution and pollution from routine vessel operations.
MARPOL includes six technical annexes the requirements of which will be adhered to throughout the Project.
9.2.2 Fire and Explosion The collector test will involve the storage and handling of flammable and combustible substances that can lead to the generation of potentially explosive and/or flammable gas emissions resulting in a fire or explosion. While the Project does not require the use of explosives, potential environmental impacts associated with the use of other flammable and combustible substances, such as fuel, may result in fire, release of significant quantities of hazardous smoke to the air and contaminated runoff, for example, from water used for firefighting.
Preliminary mitigation measures include:
• Induction to include all areas of risks of fire and types of fire, reporting fire events, response actions, locations/usage of fire-fighting equipment.
• Restricted access to high fire-risk areas.
• Storage and handling of all flammable and combustible substances, including waste, under conditions which minimise the risk of fire or toxic emissions, for example, provide adequate separation distances between potential ignition sources and flammable materials and classify hazard areas.
• Specific design criteria for fire prevention, detection, control and personnel safety requirements.
• Ensuring that ‘hot works’ do not take place near flammable materials.
• Implementation of passive and active fire prevention and fire-fighting techniques for each hazard area.
• Identification and regular maintenance and testing of fire equipment adequate for the level of risk to ensure good working order.
9.2.3 Vessel Collisions The transit route will intersect a number of international shipping routes, some utilised more than others. International maritime practices will be observed and the vessel equipped with communication and navigation aids.
Vessel collisions may occur during extreme weather conditions or due to human error, for example, due to poor coordination and communication with third-party vessels, mechanical faults, poor visibility and rough sea conditions. Resulting impacts includes injuries to people, the release of ballast water and spills of fuels and other hazardous materials that have the potential to impact water and sediment quality and ecological receptors.
A number of mitigation measures will be implemented to minimise the potential for impacts associated with vessel collisions:
Relevant maritime authorities notified of the planned collector test activities as required.

Document Number: FINAL
Revision: V20
Revision Date: 24 September, 2021
Page 9-4
Third parties potentially operating in the vicinity of the collector test location notified of the timing of the collector test and any safety exclusion zones.
Vessel positioning equipment used, including marine radar and a global navigation satellite system (that is, the United States Government NAVSTAR Global Positioning System).
9.2.4 Detachment of PCV from Umbilical The detachment of the PCV from its umbilical while in the water column or on seabed, for whatever reason, will represent a serious operational incident. The umbilical supplies power and telemetry, and also serves as the lift line. Therefore, in this situation the PCV will be a “dead vehicle” and will have to be recovered using independent means.
This situation, while not expected and relatively serious, does nevertheless occur on occasion and therefore shall be covered by a contingency procedure. This “emergency recovery procedure” is currently under development and final details are not available. However, the procedure shall be reviewed and approved by both Allseas and TMC management, and the Joint Technical Steering Committee, prior to mobilisation.
It is tentatively expected that the emergency recovery procedure will involve deployment of a separate back-up lift line from either the Hidden Gem vessel or another support vessel. The lift line will be certified for a suitable SWL and terminated with a suitable ROV-shackle. During PCV recovery it will be connected to the PCV’s emergency recovery points using the work-class ROV which will be on the Hidden Gem. The vehicle will be recovered through the water column and handed over at a pre-determined depth to the LARS on the Hidden Gem which will then lift the dead vehicle through the transition zone and to deck. It LARS has already been designed with an actively rotatable “snubber” which is specifically configured for aligning the dead PCV through the recovery cursor, as may be necessary should it be lifted in an adverse orientation.
9.2.5 Detachment of Riser Pipe from PCV If the riser detaches from the PCV, for whatever reason, and there is nodule slurry present within the riser and or jumper then some release of nodules and slurry is possible. While this is not a planned operation in any situation, it is an unexpected possibility and thus contingency procedures shall be prepared. This procedure is currently under development and final details are not available. However, the procedure shall be reviewed and approved by both Allseas and TMC management, and the Joint Technical Steering Committee, prior to mobilisation.
It is tentatively expected that the dump valve at the base of the vertical riser section shall be automatically closed in the event of disconnection of the PCV and this should serve to limit the slurry material which can drop to the seabed. However, there may be some material from the vertical riser section which is not captured. The lower flexible riser “jumper” section possesses no such valve and the majority of slurry retained within the jumper can be expected to fall to the seabed. However, the quantities of slurry released will in any event be small and the density, and location of the release will be precisely recorded for subsequent inspection using the vessel ROV. A process will then be activated in order to decide whether to recover the PCV or re-connect it to the riser. It will also be decided whether it will be necessary to perform further intervention and/or recover of any nodule slurry which has fallen to the seabed.
9.3 Emergency Response Planning
A high level of emergency preparedness will be established and maintained to ensure that responses to emergencies and incidents are effective and without delay.

Document Number: FINAL
Revision: V20
Revision Date: 24 September, 2021
Page 9-5
A pre-established emergency response team will be on-call and capable of mobilising and responding to emergencies. It will be staffed with competent individuals and organised into teams with allocated and clearly defined roles.
The crew and science teams will be trained to respond to emergencies, rescue injured persons and perform emergency actions in coordination with other agencies and organisations that may be involved in emergency response.
An emergency response plan (ERP) shall be developed with a systematic approach in managing incidents and emergencies. This will be based on potential emergency scenarios identified by risk assessment processes.
The ERP will contain as a minimum:
• Description of the emergency response team organisation (structure, roles, responsibilities and decision makers).
• Process flow chart for managing various emergency response scenarios, with contact details for relevant personnel.
• Description of response procedures (details of response equipment and location, procedures, training requirements, duties) for the following:
o Hazardous materials spills.
o Fire and explosions.
o Vessel collisions.
o Man overboard.
o Emergency medical evacuation (MEDEVAC) procedures for injured or ill personnel.
o Extreme weather.
o Attack by third parties.
• Descriptions and procedures for alarm and communications systems.
• Description of on-site first aid supplies and available backup medical support.
• Description of other available emergency facilities and response times.
• Description of survival equipment.
All personnel will be provided with and trained in the use of suitable emergency response equipment, including medical emergency equipment and lifeboats. These will be appropriately managed and located for effective use.
Exercises in emergency preparedness shall be practiced regularly.
9.4 Hazard Identification Risk Assessment (HIRA)
Prior to the commencement of each campaign associated with the collector test a HIRA will be complected to identify and assess the hazards associated with the activities that will be conducted and thereby controlling the risk by implementing mitigation measures before the start of the work to avoid the incident. HIRA is intended to develop a proactive rather than reactive approach to risk management.

Document Number: FINAL
Revision: V20
Revision Date: 24 September, 2021
Page 9-6
The HIRA process that will be implemented is summarised in Figure 9-1.
9.4.1 Summary of Residual Risk Table 9-1 provides a summary of the residual risk assessment.
Assuming the successful implementation of mitigation measures and emergency control procedures described, all residual risks associated with potential major hazards have been assessed as Low to Medium and are considered to be ALARP.
Figure 9-1. HIRA process

Docum
ent Num
ber: FIN
AL
Revision:
V20
Revision D
ate: 24 S
eptember, 2021
P
age 9-7 Table 9-1.
Major hazards residual risk assessm
ent
HA
ZAR
D/E
VE
NT
IMP
AC
T M
ITIGA
TION
S
RIS
K
L C
R
ATIN
G
Extrem
e weather Tropical
cyclones, (storms and
hurricanes), lightning)
Vessel
damage
resulting in
loss of
containment/
unplanned release
and environm
ental contamination
• M
onitor routine weather forecasting and alert system
s.
• P
rovisions for detachment and buoying of the riser to allow
the vessel to move
away from
danger areas, returning and re-coupling after the storm (C
onfirm
if this applies to the PCV
test if it is necessary). •
Develop procedures:
o W
ave shielding. o
‘Survival m
ode’ procedure for when the sea state exceeds the design
sea state. o
Dam
age assessment and clean up.
• P
rovide supplies to protect personnel and equipment during a severe w
eather event.
• D
evelop standard operating procedures for lightning storms.
C
2 Low
Seism
ic event S
eafloor instability S
ubsidence •
Real-tim
e monitoring for seism
ic activity during collector test. A
3
Low
Hazardous m
aterial leakage or spillage
Potential contam
ination having a detrimental
impact on w
ater and sediment quality and
potentially adversely
affecting the
marine
ecosystem.
• U
ndertake spill risk assessment.
o D
evelop / familiarise w
ith procedures that consider: o
Induction and
training (e.g.,
chains of
comm
and and
procedures/reporting in event of a spill) o
Locations of potential spill areas, types of spill, safety equipment, clean
up equipment, contam
ination separation systems.
o E
mergency shutdow
n and response systems.
o M
aintenance and monitoring program
s of equipment and discharges.
o P
ersonnel training and field exercises in oil spill prevention, containment,
and response (e.g., absorbent mop-up and recovery).
o R
eporting of all spills and near misses follow
ed by a root cause analysis and corrective actions plan to prevent recurrence.
• Im
plement w
aste and water m
anagement plans.
B
4 M
edium

Docum
ent Num
ber: FIN
AL
Revision:
V20
Revision D
ate: 24 S
eptember, 2021
P
age 9-8
HA
ZAR
D/E
VE
NT
IMP
AC
T M
ITIGA
TION
S
RIS
K
L C
R
ATIN
G
Fire and explosion E
nvironmental harm
Fatality
• P
rovide adequate separation distances between potential ignition sources
and flamm
able materials.
• C
lassify hazard areas and implem
ent passive and active fire prevention and fire-fighting techniques for each hazard area.
• E
nsure adequate
fire-fighting equipm
ent is
available and
routinely m
aintained.
A
5 M
edium
Vessel collisions
Potential loss of containm
ent of hazardous m
aterials having a detrimental im
pact on w
ater and sediment quality and potentially
adversely affecting the marine ecosystem
.
Fatality
• Im
plement
standard operating
procedures consistent
with
international m
aritime practices.
• M
aintain contact with relevant m
aritime authorities.
• C
omm
unication and navigation aids.
• D
efine and implem
ent a safety exclusion zone.
A
5 M
edium
Detachm
ent of PC
V from
Um
bilical
Loss of comm
unications and control of PC
V, ‘dead
vehicle’ on
seabed. Potential
for leakage of fluids from
the PCV
if damaged or
not recovered.
• The PC
V and all associated equipm
ent will be m
aintained and inspected for leaks prior to deploym
ent.
• A
ll chemicals used in underw
ater equipment, such as the R
OV
and PC
V, will
be com
pliant w
ith the
OS
PAR
standards,
ensuring com
pliance w
ith established international standards for acceptable levels of environm
ental perform
ance of
chemicals
in term
s of
toxicity, persistence,
and bioaccum
ulation.
• A
n emergency recovery procedure w
ill be developed and included in the collector test environm
ental managem
ent plan, prior to the start of operations. •
RO
V w
ill be on standby at all times to assist w
ith emergency recovery
procedures.
C
2 Low
Detachm
ent of Riser P
ipe from
PCV
If the riser detaches from the P
CV and there
is nodule slurry present within the riser and or
jumper then som
e release of nodules and slurry is possible.
• The R
iser P
ipe and
all associated
equipment w
ill be m
aintained and
inspected prior to deployment.
• A
n emergency recovery procedure w
ill be developed and included in the collector test environm
ental managem
ent plan, prior to the start of operations. •
RO
V w
ill be on standby at all times to assist w
ith emergency recovery
procedures.
C
2 Low

Document Number: FINAL
Revision: V20
Revision Date: 24 September, 2021
Page 11-1
10 RISK PRIORITISATION The risks posed by predictable impacts associated with the Collector Test on physicochemical and biological VECs have been assessed in Table 7-7 and Table 8-2 respectively. Similarly, the risks posed by unpredictable events (hazards) have been assessed in Table 9-1. Risks have been characterised as ‘low’ ‘medium’ or ‘high’ based on the following descriptions:
• Low risk outcomes are considered to have been reduced to low as reasonably practicable (ALARP) by the implementation of the prescribed management measures;
• Medium risk outcomes are also considered to have been reduced to ALARP by the implementation of the prescribed management measures, however, a degree of unresolved uncertainty may exist or the consequences of a realised risk are high. Monitoring of these operations will be a priority and they may be modified or suspended if unanticipated outcomes are observed;
• High risk outcomes, activity should not proceed without the development of additional focused mitigation measures.
Based on the EIA team’s understanding of the activities associated with the Collector Test and receiving environment, no activities have been assessed as being ‘high’ risk; due to the routine nature of many of the activities (e.g., operation of surface vessels) and the small scale of the Collector Test. Therefore, it is not considered necessary to develop additional mitigation measures to supplement the management measures described in Sections 8.3.1, 7.5.1 and 9.3. to further reduce residual risks.
Activities and hazards ranked posing ‘medium’ risk in Table 7-7, Table 8-2 or Table 9-1 will be prioritised for resourcing and monitoring in the EMMP.
11 CUMULATIVE IMPACTS Cumulative impacts have been considered at three levels:
1. The cumulative impact of the project as a sum of all the individual impacts described in Sections 7, 8 and 9;
2. The cumulative impact of the project and third-party impacts from other anthropogenic activities (e.g., fishing); and
3. The cumulative impact of the project with other environmental changes such as climate change and rising in sea temperature.
There is potential for cumulative impacts at the project scale (level 1); for example, the 0.5km2 of the TF that is disturbed by the PCV tracks is also likely to be impacted by sedimentation from both the benthic and mid-water plumes. The wider TF could also be impacted by sedimentation from both the benthic and mid-water plumes. The cumulative impact of subsequent sedimentation events resulting from the collector test has been modelled in Figure 7-13. Similarly, the cumulative impact of an extended period of mid-water plume release has been modelled in Figure 7-14. In both cases the impacting activity is temporary and constrained to a small area, as such the potential for a significant cumulative impact is considered to be negligible.
Cumulative impacts with third-party activities (level 2) are not considered to be relevant due to the small scale of the Collector test and the low levels of anthropogenic activities (e.g., fishing and shipping) that occur in the area (Fathom Pacific.,2020b). Cumulative impact of the projects with other environmental changes are not considered to be relevant due to the small temporal and spatial scale of the project.

Document Number: FINAL
Revision: V20
Revision Date: 24 September, 2021
Page 12-2
12 ENVIRONMENTAL MONITORING, MANAGEMENT & REPORTING
12.1 Introduction
The collector test and testing of mining components are part of baseline studies required by the ISA as primary inputs to the ESIA for a commercial mining contract (ISBA/25/LTC/6/Rev.1(s. VI(B)(33)). The test provides an opportunity to challenge assumptions about how the mining system will function and how VECs will respond to disturbance from project related activities. This information will be used to optimize the design of the full-scale mining system and the operational environmental monitoring and management plan (EMMP). This section describes the scope of requirements for the collector test monitoring programme.
In Q1 of 2020, NORI contracted scientists and commercial consultants to conduct a programme of environmental baseline studies at NORI-D. Key to this work is a comprehensive characterization and comparison of the baseline conditions at the CTA and the PRZ.
Monitoring at the CTA and the subsequent IRZ will be conducted in the following phases:
1. Collector System Performance
a. Pre-test baseline characterisation
b. Test monitoring
c. Post-test monitoring
The collection of environmental baseline data from NORI-D has been ongoing since 2012. The offshore studies currently in progress are part of the operational ESIA focussing on the surface, pelagic and benthic components of the receiving environment. The anticipated completion date for the baseline studies is Q2/2022. The pre-test baseline data for both the CTA and the PRZ will serve as a benchmark against which post-test changes in the status of VECs, and long-term recovery, can be compared. Full details of the ongoing monitoring program to be implemented during commercial operations will be detailed in the EMMP developed for the operational ESIA.
Monitoring of the collector test will be conducted over two sequential campaigns currently scheduled for Q3/2022. The first campaign will focus on testing the PCV, and the second campaign will focus on the performance of the full collection system (Figure 12-1).
Monitoring will comprise of pre-test, test, and post-test phases conducted over short temporal scales (hours, days, weeks), predominantly focusing on the technical performance of the collection system and immediate environmental impacts. The collector test also provides an opportunity to challenge assumptions made during collector system design and verify plume models.
Post-test studies will be conducted in the hours, days, weeks or months immediately following the completion of testing activities. The purpose of this monitoring program will be to quantify the immediate impacts of mining to the receiving environment, the findings will inform the operational ESIA.

Document Number: FINAL
Revision: V20
Revision Date: 24 September, 2021
Page 12-3
Figure 12-1. Collector test monitoring framework
2. Long-term Environmental Studies
Long-term environmental recovery studies will be conducted over a timeframe of years to decades post-test, and details will be included in the operational EMMP. The aim of long-term studies will be to monitor how benthic and pelagic communities recover following disturbance. Results of monitoring will be benchmarked against the pre-test baseline of the CTA and the ongoing monitoring of VECs at the PRZ. Parts of the CTA will be designated as an impact reference zones (IRZ) following the test. The IRZs will not be mined following the collector test will be preserved and monitored for the duration of mining operations.
12.2 Environmental Monitoring
12.2.1 Collector System Performance During the collector test the technical and environmental performance of the PCV and the collector system will be monitored over two campaigns scheduled for Q3/2022. The PCV and collector system will be deployed and controlled by Allseas from the mining vessel Hidden Gem, and the monitoring activities will be conducted from a yet to be identified support vessel.
The performance of the PCV and collector system will be monitored in real-time in the near-field (that is, <200 m from the collector system) and far-field (≥200 m to the limit of measurable change in an environmental parameter). It is acknowledged that this is a broad definition and that far-field limits will vary depending on the metrics being measured. However, real time measurements of turbidity and total suspended sediment (TSS) will provide indications of the likely extent of other ecological changes.
For the purpose of monitoring collector system performance, the receiving environment has been divided into the following impact zones based on the nature of the impacts expected to occur and the monitoring methods that will be applied:
• Impact Zone 1 – Atmosphere, Surface Waters and Euphotic (0 m - 200 m) zone
• Impact Zone 2 – Mesopelagic (200-1,000 m) and Bathypelagic (1,000 m - 4,000 m) zones
• Impact Zone 3 – Abyssal (4,000 m - 6,000 m) and Benthic (seabed) zones
12.2.1.1 Impact Zone 1
Twenty-four-hour operations aboard the mining vessel and support vessel will introduce new sources of air, light, noise and vibration pollution into the atmosphere, surface waters and euphotic zone. This has the potential disturb feeding and migration behaviours of charismatic megafauna (for example, dolphins, turtles, fishes, birds) inhabiting or transiting through the area. Increased night-time light levels from the

Document Number: FINAL
Revision: V20
Revision Date: 24 September, 2021
Page 12-4
vessels could also interfere with diurnal feeding patterns of some organisms, as may noise and vibration from the riser pipe and air lift system.
Monitoring of the environmental performance of the collector system in Impact Zone 1 will address the following questions:
• What are the potential sources of impact to VECs in Impact Zone 1 from the vessel and shallow water components of the collection system?
• What are the baseline levels for the following environmental effects during the operation of the collector system and surface vessels?
o Air pollutants
o Noise and vibration generation from vessels and collector system components
o Light emissions both above and below water
o Sources of surface and shallow water pollutants from the support vessels and collection system
Table 12-1 summarises the objectives for monitoring in Impact Zone 1, rational for monitoring, available monitoring methods, proximity of monitoring to the collector system (near or far field), and the phase of the monitoring program during which the activities will be conducted (that is, (1) Pre-collector test baseline characterisation; (2) Collector test monitoring; (3) Post-collector test monitoring).
Table 12-1. Monitoring parameters for Impact Zone 1
OBJECTIVE / MEASUREMENT RATIONALE
POTENTIAL MONITORING
METHODS
FIELD† MONITORING PHASE‡
NEAR FAR 1 2 3
Physicochemical
Monitor vessel air pollutant emissions
Long-term occupation of the area can alter local air quality and be detrimental to the health of workers and crew
Onboard air quality sensors (NOx, SOx, COx, VOCs, PAH, particulates); stack and vessel emission models.
● - - ● -
Measure baseline light emissions to the atmosphere and shallow waters from the surface vessels and associated shallow water assets.
Increased night-time light levels from the vessel may interfere with diurnal feeding patterns and migratory behaviours in some organisms
Photosynthetically active radiation (PAR) sensor aboard the vessel Diurnal CTD casts using rosette with PAR sensor affixed.
● - - ● -
Measure noise generation levels from the vessel and associated shallow water assets (e.g., air lift and riser pipe)
Increased noise levels from the vessel and associated assets may interfere with feeding and migratory patterns in some organisms
Sound meters aboard the vessel
Surface mixed layer drifting hydrophone arrays
● ● - ● -
Particle sizes and load of return water
Size spectra and total particle load of return water must be characterised prior to
Laser Diffraction Particle Size Analyzer (LISST)
● - - ● -

Document Number: FINAL
Revision: V20
Revision Date: 24 September, 2021
Page 12-5
OBJECTIVE / MEASUREMENT RATIONALE
POTENTIAL MONITORING
METHODS
FIELD† MONITORING PHASE‡
NEAR FAR 1 2 3 its return to ocean to inform plume modelling and impacts on biological VECs
Discrete water sample for TSS
Monitor quality of surface processing water on the vessel.
The quality of the water that is entrained into the riser needs to be measured onboard the surface vessel and thresholds for potential pollutant levels in the return water developed.
Onboard sampling of riser water quality for
Nutrients (NO3, NO2, NH4, PO4, SiO4, TOC, Alkalinity): discrete water samples.
Metals (Al, Cd, Co, Cu, Fe, Pb, Mn, Hg, Ni, Zn): discrete, trace metal clean water samples.
Oxygen inline optode and Winkler titrations
Temperature, Salinity: pH
● - - ● -
Biological
Presence of cetaceans, turtles and birds
Changes in behaviour or exposures to risk
On-board observation program,
● ● ● ● -
†Near field is defined as within 200 m of the collector system, far-field as >200 m from the collector system to the limit of measurable changes in environmental parameters.‡ (1) Pre-collector test baseline characterisation; (2) Collector test monitoring; (3) Post-collector test monitoring.
12.2.1.2 Impact Zone 2
During system test runs (STRs) water and sediment from a depth of ≥4,000 m will be entrained into the riser pipe and transported to the surface processing vessel where it will be separated from nodules, filtered, and returned to the ocean at a mid-water depth of 1,200 m. When returned to the ocean discharged bottom waters will be warmer, more oxygenated, and contain higher concentrations of fine particles (sediments and nanoparticles) and dissolved metals than mesopelagic water. Thus, it is essential to understand the dynamics and fate of the mid-water discharge plume. Impacts from the discharge could affect the mesopelagic (200 m - 1,000 m) and bathypelagic (1,000 m – 4,000 m) zones.
DHI has developed a hydrodynamic (HD) model of NORI-D, which has been partially validated against measured metocean observations from the moorings that have been deployed across the site for the past two years (see Section 7.4.3). Monitoring of plume dispersal during the STRs represents an opportunity to further validate, refine, and update the HD model. The information gathered during real-time monitoring of the mid-water plume is considered essential to scaling up the HD model to be representative of conditions during commercial mining operations.
Monitoring of the environmental performance of the collector system in Impact Zone 2 will address the following questions:
• What is the lateral and vertical expanse of the mid-water discharge plume?
• What is the TSS concentration gradient with distance from the return water outlet?
• What is the optimum depth for the return water outlet?

Document Number: FINAL
Revision: V20
Revision Date: 24 September, 2021
Page 12-6
• What are the effects of the plume on the chemical properties of the mesopelagic and bathypelagic?
• What are the effects of the plume on physical properties of the mesopelagic and bathypelagic?
• What are the effects of the plume on biota of the mesopelagic and bathypelagic?
• What are the effects of riser noise and vibration on the biota of the mesopelagic and bathypelagic?
Table 12-2 summarises the objectives for monitoring in Impact Zone 2, rational for monitoring, monitoring methods, proximity of monitoring to the collector system (near or far field), and the phase of the monitoring program during which the monitoring activities will be conducted.
Table 12-2. Monitoring parameters for Impact Zone 2
OBJECTIVE/ MEASUREMENT RATIONALE
POTENTIAL MONITORING
METHODS
FIELD† MONITORING PHASE‡
NEAR FAR 1 2 3
Physicochemical
Particle sizes and load of plume at outfall
Measurement of discharge at the surface and plume TSS at discrete distances from the outfall to limits of lateral/vertical detection. This information will be used to validate the mid-water plume modelling
Laser Diffraction Particle Size Analyzer (LISST) Discrete water sample for TSS Discrete filter samples for particle-based metal concentrations
● ● - ● -
Measurement of plume properties gradients from the point of discharge
ISA Recommendations III.B.14; III.B.15. (a).(i)–(ii)
Monitoring of the particle sizes / concentrations and the physical and chemical properties of mid-waters along vertical and lateral transects from the discharge location is required to determine the extent of potential impacts to pelagic water quality and biota from the point of discharge.
Robotic or autonomous vehicle(s) equipped with Acoustic Doppler Current Profiler(s) (ADCP(s)), and sensors/sampling capabilities for NO3, NO2, NH4, PO4, SiO4, TOC, Alkalinity.
Trace metal CTD-rosette with sensors / sampling capabilities for Al, Cd, Co, Cu, Fe, Pb, Mn, Hg, Ni, Zn. Static moorings or landers with upward and downward facing ADCPs (where appropriate) for profiling, CTD, LISST, redox, optode, transmissometer. Onboard determination of select tracer
● ● - ● -

Document Number: FINAL
Revision: V20
Revision Date: 24 September, 2021
Page 12-7
OBJECTIVE/ MEASUREMENT RATIONALE
POTENTIAL MONITORING
METHODS
FIELD† MONITORING PHASE‡
NEAR FAR 1 2 3 concentrations. (e.g., Al, Mn) Oxygen: Winkler titrations w/ discrete samples (due to low O2 discharge zone)
Monitor riser and discharge-based noise / vibration pollution
ISA Recommendations III.A.13; III.B.15.(b)(iv)
Noise from mining activities may alter the behaviours of marine mammals and other animals.
Autonomous vehicles and static moorings equipped with hydrophones
● ● - ● -
Biological
Evaluate plume related impacts on pelagic filter feeders
ISA Recommendations III.A.13; III.B.14; III.B.15.(d).(iii)
Increased TSS in the mid-water could cause abrasion or overloading of filtering or respiratory apparatus of pelagic suspension feeders.
1 m MOCNESS net tows. In situ pumping inside and outside of plume Compound Specific Stable Isotope Analysis of Mesozooplankton (0.2-0.5 mm) amino acids Transects with shadowgraph camera equipped ROV.
- ● ● ● ●
Evaluate effects of mid-water return system and plume on total biomass
Discharge and noise associated with mining could lead to death or alteration of lifestyle / feeding behaviours in mid-water communities.
Saildrone transects through the discharge areas to evaluate changes to water column biomass vertical structure (volume backscatter) and diel vertical migration patterns
- ● - ● ●
†Near field is defined as within 200 m of the collector system, far-field as >200 m from the collector system to the limit of measurable changes in environmental parameters‡ (1) Pre-collector test baseline characterisation; (2) Collector test monitoring; (3) Post-collector test monitoring.
12.2.1.3 Impact Zone 3
The prototype collector vehicle (PCV) will disturb sediments as it collects nodules from the surface of the seabed. Nodule obligate organisms permanently attached to nodules will be entrained in to the PCV and may suffer trauma as they pass through the onboard nodule processing system or they may be transported to the surface vessel. The majority of the hard substrate habitat that nodules provide may be removed in mined areas.

Document Number: FINAL
Revision: V20
Revision Date: 24 September, 2021
Page 12-8
Sediments resuspended by the PCV will increase turbidity in bathypelagic boundary water layer to a height of up to 20 m above the seabed (Section 7.2.2). Displaced sediments will form a plume behind the PCV which will eventually settle potentially covering nodule habitat, smothering benthic organisms, and affecting pelagic filter feeders. The behaviour of sediment plumes in terms of TSS concentrations and lateral and vertical dispersal is important to understand when predicting the magnitude of potential impacts of the benthic plume to benthic biota and habitats.
As for the mid-water plume, DHI has developed a hydrodynamic (HD) model for the benthic plume from the collector test. Monitoring the benthic plume dispersal during PCV operations represents an opportunity to further validate, refine, and update the HD model to predict full operational scale conditions.
Realtime monitoring of plume dispersal and concentrations will be conducted with the aid of sensors placed on the seabed, and PCV, AUV and ROV assets, which will track the PCV as it conducts field trials.
Monitoring of the environmental performance of the collector system in Impact Zone 3 will address the following questions:
• How much light and noise will be generated by the PCV during operations?
• How will the hydrodynamic conditions created by the PCV movement and onboard processes impact sediment behaviour?
• How does the PCV impact the physical structure (micro-topography) and geochemistry of the sediments?
• Does sediment flocculation occur as predicted by models developed from laboratory-based experimentation (that is, iSeaMC, 2020)?
• How efficient is the PCV at collecting nodules?
• What is the habitat value of the nodules left behind by the PCV?
• What is the lateral and vertical dispersal footprint of the benthic plume?
• What is the sedimentation area and deposition thickness?
• What are the sedimentation gradients with distance from the source?
• What is the fate of biota entrained into the collector system?
Table 12-3 summarises the objectives for monitoring in Impact Zone 3, rational for monitoring, monitoring methods, proximity of monitoring to the collector system (near or far field), and the phase of the monitoring program during which the monitoring activities will be conducted.
Table 12-3. Monitoring parameters for Impact Zone 3
OBJECTIVE/ MEASUREMENT RATIONALE
POTENTIAL MONITORING
METHODS
FIELD† MONITORING PHASE‡
NEAR FAR 1 2 3 Physicochemical
Depth of penetration of the PCV tracks into the sediment
ISA Recommendations III.C.38(b)
Robotic or autonomous vehicle multibeam echo sounder surveys
● - - ● -
Lateral disturbance to sediment micro-topography caused by the PCV
ISA Recommendations III.C.38(c)
Robotic or autonomous vehicle multibeam echo sounder surveys
● - - ● -
Width, length and pattern of collector tracks on seafloor
ISA Recommendations III.C.38(c)
Robotic or autonomous vehicle
● - - ● -

Document Number: FINAL
Revision: V20
Revision Date: 24 September, 2021
Page 12-9
OBJECTIVE/ MEASUREMENT RATIONALE
POTENTIAL MONITORING
METHODS
FIELD† MONITORING PHASE‡
NEAR FAR 1 2 3 multibeam echo sounder surveys
Ratio of sediment separated from the mineral source by the PCV
ISA Recommendations III.C.38(d)
PCV mounted sensors ● - - ● -
Volume and size spectra of material rejected by the PCV
ISA Recommendations III.C.38(f)
PCV mounted sensors ● - - ● -
Measure plume particle load and size distributions
ISA Recommendations III.C.38(k)
In-situ pumps for particle collection Robotic or autonomous vehicle mounted transmissometer. ROV-mounted niskin bottles
● ● - ● -
Lateral and vertical dispersal profile of plume
ISA Recommendations III.C.38(k)
Benthic lander equipped with optical backscatter sensors (OBS) and an upward looking ADCP. Robotic or autonomous vehicle equipped with transmissometer Trace metal CTD (w/LADCP) casts along transects from the plume (metals, TSS, etc.)
● ● - ● -
Thickness of sediment redeposition layer
ISA Recommendations III.C.38(k)
Benthic lander equipped with sediment traps. Robotic or autonomous vehicle multibeam echo sounder and image surveys
● ● - ● -
Monitor PCV generated noise pollution
Noise from mining activities may alter the behaviour of marine animals.
Hydrophones deployed near riser system and remote monitoring via moored and static instruments and autonomous vehicles.
● ● - ● -
Monitor collector generated light pollution
Light from mining activities may alter the behaviours of marine animals.
Light output estimate for collector Light sensor on rosette
● ● - ● -
Biological Changes in seabed respiration and redox structure
Understanding change and recovery of ecosystem function
Benthic respirometer chamber landers
● ● ● - ●

Document Number: FINAL
Revision: V20
Revision Date: 24 September, 2021
Page 12-10
OBJECTIVE/ MEASUREMENT RATIONALE
POTENTIAL MONITORING
METHODS
FIELD† MONITORING PHASE‡
NEAR FAR 1 2 3 Benthic microelectrode landers Multicore pore water samples (Pb210, redox chemistry)
Changes in seabed microbial communities
Understanding change and recovery of ecosystem function
eDNA samples with multicore
● ● ● - ●
Changes in seabed meiofauna communities
Understanding change and recovery of ecosystem function
eDNA samples with multicore Multicore or ROV pushcore samples for sieving, taxonomy and quantification
● ● ● - ●
Changes in seabed macrofauna communities
Understanding change and recovery of ecosystem function
eDNA samples with multicore Box-core or ROV pushcore samples for sieving, taxonomy and quantification
● ● ● - ●
Changes in seabed megafauna communities
Understanding change and recovery of ecosystem function
ROV mounted cameras
- ● ● - ●
Changes to demersal scavenger communities
Understanding change and recovery of ecosystem function
Baited lander traps and cameras
- ● ● - ●
Characterise concentrations of trace toxic metals in dominant animals
Introduction of sediment and porewaters into the boundary layer can alter community structure, animal abundance and food web function.
ROV target sampling of benthic organisms along transect vertical and lateral transects from PCV/impact area. Representative pelagic samples from the zooplankton in the epi-, meso- and bathypelagic collected from MOCNESS samples.
● ● ● ● ●
Evaluate plume-related effects to the food web
A likely effect of sediment discharge or resuspension into the bottom waters is the alteration of feeding for suspension feeders.
In situ pumping inside and outside of plume ROV with D-samplers and suction samplers Baited traps and camera traps for demersal scavengers Box or multi cores for infauna and nodule-attached fauna Stable isotope analysis of tissues
● ● ● ● ●
Evaluate plume effects on microbes
High tissue turnover rate organisms are most likely to show
Discrete CTD samples in and out of the plume, ideally as
● ● ● ● ●

Document Number: FINAL
Revision: V20
Revision Date: 24 September, 2021
Page 12-11
OBJECTIVE/ MEASUREMENT RATIONALE
POTENTIAL MONITORING
METHODS
FIELD† MONITORING PHASE‡
NEAR FAR 1 2 3 changes / toxicity from metals and other compounds in bottom water
close to discharge as possible In situ pumping
Evaluate changes in bioluminescent communities in bottom waters
Suspended particles can alter ranges for bioluminescent signalling
CTD rosette with transmissometer deployed from surface vessel ROV with transmissometer
● ● - ● -
Evaluate effects of plume (blanketing) on sessile & pelagic filter feeders
Discharges and noise associated with mining could lead to death or alteration of lifestyle / feeding behaviours in benthic communities
ROV transects with 4K camera
● ● ● ● ●
Evaluate effects of plume (blanketing) on demersal scavenger communities
Discharges and noise associated with mining could lead to death or alteration of lifestyle / feeding behaviours in benthic communities
ROV transects with 4K camera Baited camera landers
● ● ● ● ●
Survivability of benthic organisms entrained into the collector system
Physical trauma to benthic organisms as they pass through the collector system
Install cages on the collector to trap entrained biota
● ● - ● -
†Near field defined as within 200 m of the collector system, far-field as >200 m from the collector system to the limit of measurable changes in environmental parameters‡ (1) Pre-collector test baseline characterisation; (2) Collector test monitoring; (3) Post-collector test monitoring.
12.3 Long-Term Environmental Studies
12.3.1 Experimental Design Long-term environmental studies will be conducted over a timeframe of years to decades post collector test. The objective of these studies will be to monitor how benthic and pelagic communities and habitats recover following disturbance. Results of monitoring will be benchmarked against the pre-test baseline of the CTA (which will become the IRZ after the collector test) and the ongoing monitoring of VECs at the PRZ.
Studies on the long-term effects of the disturbance will be structured as a before-after-control-impact (BACI) design for key variables employing a stratified random sampling design. Environmental change (impact) will be detected by measuring variables sampled from the two separate sites (that is, IRZ and PRZ), before and after the disturbance.
Impacts from disturbance to the IRZ will be apparent as a significant interaction term in an analysis of variance (ANOVA), where the factors in the analysis would be ‘time’ with two levels (‘before’ and ‘after’) and ‘site’ with two levels (‘control’ and ‘impact’). The behaviour of variables in the IRZ would change relative to the behaviour of the PRZ after the disturbance (Figure 12-2). The values of the measurement variable would not have to be identical in the two sites before the disturbance because the inference would be based on the interaction term in the analysis.

Document Number: FINAL
Revision: V20
Revision Date: 24 September, 2021
Page 12-12
After disturbance, if the variable’s pattern of behaviour in the IRZ areas differs significantly from its pattern of behaviour in the control site, the differences are unlikely to be due to chance.
Figure 12-2. Proposed BACI design with three sampling events (solid dots) before and multiple after system testing (arrow) from the IRZ and Control site; modified from Underwood (1996)
Data informing the ‘before’ component of the BACI design will be collected during three benthic and three pelagic focussed campaigns to be conducted in October 2020, April 2021, and May 2022. Data informing the ‘After’ component of the BACI design will be part of the long-term monitoring plan for NORI-D and will be detailed in the operational EMMP. The first scheduled post-test monitoring campaign is planned for Q2/2022 as shown in Figure 12-1.
The variables described in the following sections will be characterised and/or quantified at the CTA and the PRZ pre-test as components of the BACI design studies. Relevant elements of these studies will be continued as part of the long-term monitoring program for the operational phase of the project. The details of the long-term monitoring program will be provided in the operational EMMP.
12.3.2 Benthic Studies Figure 12-3 shows the relative locations of the benthic sampling sites in and around the CTA and PRZ. The locations of boxcore sites, multicore sites, benthic lander deployments and benthic video transects are represented. Benthic studies will be conducted at these sites as described below.
12.3.2.1 Quantification of Demersal Predator and Scavenger Diversity
To quantify demersal predator and scavenger diversity and processes, baited camera lander and baited trap systems will be deployed at sample sites in the CTA, PRZ, and surrounding areas of the NORI-D lease. Species accumulation rates from previous studies carried out on the BGR lease have shown that 10x24 hour baited camera deployments provide sufficient replication to adequately assess demersal biodiversity. Scavenger studies will be repeated over the three pre-test campaigns to quantify the baseline magnitude of temporal variation in scavenger biodiversity and processes. Post-test scavenger studies will be incorporated into the post-mining monitoring studies as part of the BACI design.

Docum
ent Num
ber: FIN
AL
Revision:
V20
Revision D
ate: 24 S
eptember, 2021
P
age 12-13 Figure 12-3.
Benthic sam
pling sites

Document Number: FINAL
Revision: V20
Revision Date: 24 September, 2021
Page 12-14
12.3.2.2 Quantification of Seafloor Respiration and CO2 Production Rates
Seafloor respiration and CO2 production will be quantified at seven sites during each of the pre-test campaigns using a benthic chamber lander system equipped with three seafloor respirometers. Each lander will deploy for 36 hours. Benthic chamber landers will be used to quantify a variety of biological properties and functions such as biodiversity, nutrient fluxes, metabolic activities of microbes, meio- and macrofauna and biological respiration.
During each 36-hour lander deployment, benthic O2 consumption (seafloor respiration) will be assessed in three chambers by continuously logging O2 concentrations in the overlying waters. In addition, water samples will be extracted from each chamber at pre-programmed times by an onboard syringe sampler allowing CO2 concentrations and fluxes to be quantified from the change in CO2 concentrations over time. From the O2 and CO2 fluxes it will be possible to assess the contribution of organism respiration versus O2 consumption by chemical oxidation processes occurring in the sediment column.
In addition, five deployments will also be made with a benthic micro-profiler lander during each campaign to characterise in-situ micro-profiles of O2 from 3 cm above the sediment-water interface to 5 cm - 10 cm sediment depth. These will be used to document changes in O2 through the sediment and calculate diffusive O2 uptake (DOU) at the seafloor. From the DOU data plus the total sediment oxygen uptake (TOU) rates generated with the benthic chamber lander faunal-mediated uptake (FMU) of O2 will be calculated. Changes in FMU from pre- to post-test may be indicative of impacts to seafloor respiration and nutrient recycling rates.
The main objective of these studies will be to characterise the baseline conditions at the CTA and PRZ as part of the BACI design.
12.3.2.3 Quantification of Seafloor Metabolic Activity
Rate of C-processing (that is, metabolic activity) will be quantified for main groups of benthic organisms by measuring the incorporation of labelled 13C organic (phytodetritus) material and labelled 13C (bicarbonate) in to microbial and macrofauna at 0-1 cm, 1-5 cm, and 5-10 cm sediment depth intervals using approaches described by Sweetman et al., (2009, 2010, 2014b, 2016 and 2019). Applying this technique in the CTA and PRZ both pre- and post-collector test will also allow observation of any changes in bioturbation resulting from mining. A sub-core will be collected from each chamber and analysed using the techniques described by Sweetman and Witte (2008a&b) so the depth of faunal-mediated mixing of 13C organic material to deeper sediment layers can be determined.
12.3.2.4 Characterisation of Bioturbation & Sediment Geochemistry
Seafloor sediments will be collected using a multicore and box-core. To estimate bioturbation rates and the mixed-layer depth, three randomised multicore deployments will be made at each of three study sites per campaign. Excess 210Pb profiles will be measured from duplicate 10 cm diameter multicore tubes. Once onboard ship, cores will be transferred to a cold room. Here surface water will be carefully removed from each multicore tube and the sediments extruded and sectioned at 0.5 cm intervals to a depth of 1.5 cm, 1 cm intervals to 2.5 cm, and then at 2,.5 cm intervals to the bottom of the core (Smith et al., 1997). Depth intervals will be analysed back in the laboratory for excess 210Pb activity. To evaluate mixed-layer depths and Pb from 210Pb profiles log-linear plots of excess 210Pb profiles will be examined. The eddy diffusive bioturbation coefficient will then be estimated for the surface mixed layer (Smith et al., 1993).
Porewater will be collected at 0.5 cm intervals to a depth of 2 cm, then 1 cm to a depth of 10 cm followed by 2 cm intervals to the bottom of the core. Porewater samples for nutrients, metals, and alkalinity. Three replicate cores per site will be sampled for each set of analytes. Porewater will be collected using rhizons and pre-prepared core tubes. Porewater samples will be prepared for transport back to the laboratory where they will be analysed for phosphate, nitrate, nitrites, silicate, and ammonium using a Skala San++ continuous flow autoanalyzer. Porewater samples collected for the determination of dissolved metals will

Document Number: FINAL
Revision: V20
Revision Date: 24 September, 2021
Page 12-15
be analysed for Fe, Mn, Zn, Cd, Pb, Cu and Hg by Inductively Coupled Plasma Mass Spectrometry (ICP-MS). Porewater alkalinity will be quantified at sea using a Metrohm 916 auto-titrator.
Sediment samples will be collected from the multicore and analysed for Total C and N using an Elemantar vario MICRO cube elemental analyser. Total organic carbon (TOC) and total inorganic carbon (TIC) will also be calculated using the same equipment and similar techniques.
Because mining-induced sedimentation of old sediments may lead to the dilution of labile organic matter the quality of the organic material at the seafloor will be measured also. A subset of samples from the multicore will be analysed for amino acids using high performance liquid chromatography (HPLC), and for phospholipid fatty acids using gas chromatography mass spectrometry GC-MS. These organic geochemical techniques will provide information on organic carbon source (algal vs bacterial) and degradation rate (for example, Dauwe and Middleburg, 1998), and will thus allow assessment of the effect of system testing on sediment C storage, and of the sediment food bank for benthic organisms, which may be diluted upon re-sedimentation of organic material. Three separate multicore sediment cores per site will be sectioned at the intervals described previously and freeze dried. Sections will then be subject to total digestion using HF and H2O2, and then analysed for metals, including Fe, Mn, Zn, Cd, Pb, Cu, Hg and P by inductively coupled plasma-mass spectrometry. In addition, aliquots of the sediment will be subjected to sequential extraction to quantify the bioavailability of the Fe and Mn phases, providing vital information for modelling of biogeochemical processing rates.
Sediment solid phase (TOC, TOC isotopes, accumulation rate, Fe and MN speciation) and pore water (nutrients and alkalinity) data, together with micro-profiles (pH, Eh, and O2) will be modelled using the biogeochemical reaction network simulator (BRNS) reaction transport model (Aguileria et al., 2005). This will provide full, depth-resolved, quantification of all biogeochemical process rates that are involved in determining the redox zonation and thus the geochemical environment of the sediment, and which also drives the benthic-pelagic nutrient fluxes. Further, reaction transport modelling will constrain the organic C decay rate, allowing determination of the effect of system testing of sediment C storage.
Two sediment cores from each multicorer deployment will be allocated for analysis of sediment physical properties, including specific gravity, bulk density, porosity, sediment grain size and shear strength. This will provide information on whether mining caused changes to the physical properties of the sediment between sites.
12.3.2.5 Characterisation of Megafauna
Data will be acquired from scaled photographic ROV/AUV transects to characterise the abundance, biomass, morphotype structure and diversity of megafauna at the collector test area (CTA, centred: 10° 22.4’ N, 117° 9.6’ W; Figure 12-4); plume dispersal zone (PDZ, centred: 10° 25.5’ N, 117° 11.9’ W); preservation reference zone (PRZ, centred: 10° 54.273’ N, 116° 15.026’ W), and a secondary reference site (SRS, centred: 10° 27’ N, 116° 46’ W). These sites are approximately similar depth and some level of representation of each different nodule facies type (Figure 12-4).
Image collection will be repeated in a consistent way during each sampling event using a ROV. A stratified random sampling design (Andrew & Mapstone, 1987) with even sample replication across study areas applied to collect image transects (1 transect = 1 sample). In each study area, a zig-zag survey design with random start point will be conducted within the area of interest to maximise sampling efficiency while minimising design-based bias in the spatial distribution of the replicate samples (Buckland et al., 2001, Strindberg and Buckland, 2004). A total of five ROV transects, the straight-line zig and zag sections, will be surveyed in each of the study areas (Figure 12-4) per sampling event. Transect length has been set to 2 km to encompass a minimum of 500 individuals per sample unit, following recommendations for optimal image-based megafauna sampling at the CCZ (Ardron et al., 2019; Simon-Lledó et al., 2019a), and based on faunal abundance data reported in nearby CCZ locations (Amon et al., 2016; Simon-Lledo et al., 2020).

Document Number: FINAL
Revision: V20
Revision Date: 24 September, 2021
Page 12-16
Images of benthic megafauna will be annotated using a two-step approach, which has been designed to minimise operator error in annotation and identification (and help with quality assurance). Using BIIGLE 2.0 software (Langenkämper et al., 2017), metazoan megafauna specimens (>1 cm) will be first detected in images analysed in random order (to minimise any sequence or time-related bias (for example, Durden et al 2016); and then identified to the lowest taxonomic hierarchy possible (that is, morphotype: typically, Genus or Family level) using open nomenclature (Horton et al. 2021). The physical dimensions of each specimen will be measured based on known image pixel sizes. An abyssal-Pacific standardised megafauna catalogue compiled from previous studies in the CCZ and by reference to existing literature will be used to ensure consistency in specimen identification. Oblique video data will be used to assist taxonomical classification of specimens detected in (ROV-collected) vertical stills. Each specimen will be assigned to a “nodule‐attached” (NA) or “nodule-free-living” (FL) life‐habit category. The likely feeding behaviour of each morphotype will be inferred from similar organisms described in the literature. Taxa with unclear dead/alive determination, for example, invertebrates living in a shell or tube (most polychaete and gastropod taxa), will be excluded from quantitative analyses.
Figure 12-4. Map of image survey operations per sampling event within NORI-D*
Notes: *Background data displayed: A: bathymetrical chart; B to D: Geomorphological chart. A) All survey operations. Areas of interest (white rectangles): Collector Test Area (left); Secondary Reference Site (middle); and Preservation Reference Zone (right);. B) Detail of survey operations within the Collector Test Area (CTA), and Plume Dispersal Study area (PLU). C) Detail of survey operations within the

Document Number: FINAL
Revision: V20
Revision Date: 24 September, 2021
Page 12-17
Secondary Reference Site (SRS). D) Detail of survey operations within the Preservation Reference Zone (PRZ). Note ROV surveys use a larger angle between individual lines to facilitate ship movements.
Biomass of each specimen will be estimated using the length–mass relationships detailed by Durden et al. (2016) and Durden et al. (2019), for example, based on the relationship known between the lengths of particular body parts of each taxon (measured during image annotation) and their fresh wet masses (grams of fresh wet weight; g fwwt). Where species‐specific conversions are not available, either the nearest morphological equivalent will be used or individual fresh wet masses will be estimated using the generalised volumetric method described by Benoist et al. (2019) as a proxy for biomass.
Time‐lapse images will be obtained in each study area for at least one year using an automated camera lander. The time lapse camera would be deployed at the edge of the collector test area to quantify natural variability and document the arrival and impacts of any sediment plume events. Time-lapse images will be scaled using photogrammetric approaches (Wakefield and Genin, 1987) using known optical properties of the camera and the camera position on the lander (altitude and orientation). Time‐lapse images are acquired at a suitable resolution to identify organisms greater than 1 cm in their smallest dimension.
A set of different ecological parameters will be consistently used to explore variations in megafaunal abundance and diversity at different temporal and spatial scales (for example, between CTA, and PRZ, years, disturbance levels, or between environmental strata) NORI-D. Replicate sample units are anticipated to contain a minimum of 500 specimens each, to ensure optimal accuracy and precision rates in ecological parameter estimation (Ardron et al., 2019; Simon-Lledó et al., 2019a), but subject to actual densities in the test area. This information will be used to establish a megafauna baseline for NORI-D, informing future monitoring surveys of indicators using imaging techniques.
12.3.2.6 Macrofauna & Nodule Associated Megafauna
An Oktopus MC 12-20-Series multicorer (Figure 12-7a) and a BX-650 (USNEL) box-core (Figure 12-7b) will be used to collect sediment and nodule samples using methods as described by Glover et al., (2016). The macrofauna team will then follow established DNA-taxonomy protocols (Glover et al 2016) for the collection of macrofauna and megafauna specimens at-sea. The specimens will then be transported to the Natural History Museum (NHM) in London and the University of Gothenburg (UoG), where the analyses described below will be conducted.
(a) Baseline DNA Taxonomy & Biodiversity
High-throughput DNA taxonomy methods (Glover et al., 2016) will be used to deliver DNA taxonomy data (Figure 12-5) on dominant megafaunal and macrofaunal animals (up to 300 species documented), including nodule-dwelling fauna, represented at the CTA and the PRZ. The DNA-species lists developed will provide a baseline for future monitoring surveys using eDNA data, a significant contribution to the development of a long-term cost-effective monitoring technique.
(b) Biogeographic Patterns & Species Ranges
The eDNA data collected will be combined into a regional database to analyse the geographic ranges of species within the NORI-D lease, between the CTA and the PRZ, and between the NORI-D lease and other areas of the CCZ and global abyssal plains.
(c) Genetic Connectivity
High-resolution population genetic methods will be conducted to study the connectivity of target taxa from a range of functional taxonomic groups. This will provide a representative baseline of species ranges and population connectivity over the NORI-D lease and with respect to comparative data from nearby Areas

Document Number: FINAL
Revision: V20
Revision Date: 24 September, 2021
Page 12-18
of Particular Environmental Interest. Connectivity data is considered an important variable in determining the potential for loss of species from the CTA.
Figure 12-5. Types of biodiversity reference libraries that will be developed for NORI-D (from Glover et al 2016)
(d) Quantitative Nodule Fauna Assessment
Methods described by Glover et al., (2016) will be used to pick, image, sort and provide preliminary identification at-sea of all macrofauna and megafauna sessile nodule metazoan fauna within a 50x50 cm quantitative box-core section. These data will contribute to an abundance/community composition baseline for the CTA and PRZ, which will be important in the establishment of a long-term cost-effective monitoring technique.
(e) Quantitative Macrofauna Assessment
Macrofauna from bulk sediment samples collected with the BX-650 (USNEL) box-core will be sorted initially to class/phylum, with annelid polychaetes sorted initially to family level and only intact individuals or heads counted. Preliminary data analysis will be undertaken on these sorted samples at NHM. The samples will then be split, with polychaetes and molluscs being transferred to UGot (expected to be approximately 50% of the fauna), Crustacea to the National Oceanographic Centre (NOC, UK) (approximately 25% of the fauna) and the remainder of the groups (for example, echinoderms, bryozoans, and miscellaneous phyla, the remaining 25%) being identified at NHM. Typical meiofaunal taxa such as ostracods, copepods and nematodes will be included in counts but not included in the identified macrofauna, following normal practice for macrofaunal studies. Some specimens from this sorting may be used for DNA barcoding to supplement eDNA data. Samples will then be identified at NHM, UGot and NOC to putative species-level based on a combination of morphology with inferences from molecular phylogenetic analyses. All data will be combined into a master database and analyses will be led at NHM. Representative voucher specimens from all groups will be curated and accessioned in the permanent

Document Number: FINAL
Revision: V20
Revision Date: 24 September, 2021
Page 12-19
collections of the NHM (London), with barcoded material including tissues samples in deep cryogenic storage in the NHM Molecular Collection Facility. These specimens and tissue will be accessible to a global audience for future generations. Additional voucher material may be archived at the NOC Discovery collections as appropriate.
12.3.2.7 Metazoan Meiofauna
The multicorer (Figure 12-7A) will be used to allow for retrieval of sediment cores with an undisturbed sediment-water interface. From each multicorer deployment, a minimum of three and up to six cores will be processed for meiofauna analyses. Each individual core will be extruded and sediment will be sliced into 0 to 5 and 5 to 10 cm horizons. Sediment slices will then be preserved with dimethyl sulphoxide, disodium ethylenediamine tetra-acetic acid (DESS) and saturated NaCl. Formalin samples will be stained with Bengal Rose to facilitate identification.
The samples (each consisting of 5 cm of sediment) that will be processed and analysed will consist of a combination of newly acquired samples during pre and post mining research campaigns and existing samples acquired during research campaigns in previous years, which are currently in storage with NORI. This will maximise the spatial as well as (limited) temporal coverage of the study area.
Meiofauna individuals from subsamples (10% or at least 300 individuals from each sample) will be identified and counted at higher taxon level (Higgins and Thiel, 1988; Schmidt-Rhaesa, 2020) under stereomicroscope (250× magnification). From each sample, 120 (or all if fewer individuals are present) nematodes will be picked out and placed in cavity blocks with a glycerol solution (5% glycerol, 45% ethanol, 50% purified water) and left semi-covered overnight in a 60°C oven to enable evaporation to pure glycerol. Nematode specimens will then be mounted on glass slides for genus/species identification under a compound microscope (400 to 1,000× magnification) following latest taxonomic literature (Ridall, 2020) and Nemys, the online world database on nematode taxonomy linked to the World Register of Marine Species. These data will contribute to a meiofauna abundance/community composition baseline for the CTA and PRZ which will be important in the establishment of a long-term cost-effective monitoring technique.
12.3.2.8 Benthic Foraminifera
Multicore samples will be taken from sites on the CTA and PRZ during pre and post mining campaigns. Sediment samples for foraminifera identification will be sectioned in 0-1 cm, 1-2 cm, 2-3 cm, 3-4 cm, 4-5 cm, 5-10 cm increments and appropriately preserved. In the lab, these samples will be stained with Rose Bengal solution (2 g Rose Bengal: 1L DI water) for 24 hours and then washed over a 63 µm sieve. The samples will then be dried in a drying oven at 45°C. The processed samples will then be poured onto a gridded picking tray and any stained/living foraminifera will be picked onto a separate storage slide and identified using appropriate taxonomic references.
Light microscope and scanning electron microscope photos of species will be captured. Baseline abundance, density, diversity indices (Shannon, Fisher’s-Alpha, Evenness) will be calculated using the PAST statistical software and a corresponding heat map of the NORI-D area will be created using Ocean Data View software. Opportunistic species will be determined by correlating foraminiferal species found to environmental parameters (total organic matter, grain size).
Foraminifera species will be correlated to biogeochemical parameters (total organic matter, grain size, metals, oxygen) and indicator species will be identified through the Foram-AMBI calibration. The Foram-AMBI will also provide standardised baseline EcoQS of NORI-D. These results will be presented as an interactive baseline heatmap of EcoQS across the CTA, PRZ, and the wider NORI-D. An identification handbook of scanning electron microscope and light microscope photographs of common benthic foraminifera indicator species found at NORI-D will be developed to aid in future monitoring efforts.

Document Number: FINAL
Revision: V20
Revision Date: 24 September, 2021
Page 12-20
12.3.2.9 Microbial Prokaryotes
Two samples (0-2 and 3-5 cm layers) per multicore station will be processed for extraction and High-Throughput Sequencing (HTS) library preparation. Once extracted, single stranded RNA will be converted to complementary DNA following Laroche et al. (2017). Aliquots will be amplified in duplicate to reduce stochasticity and processed using the same primer pair used on previous benthic CCZ samples to enable comparative studies, namely from Parada et al. (2016). These primers target the V4-V5 region of the 16S rRNA gene to specifically characterize bacterial and archaeal communities and will be modified to include Illumina overhang adaptors as described in Kozich et al. (2013) to allow direct indexing and multiplexing.
12.3.2.10 Nodule Microbial Diversity & Metabolic Activity
Nodule microbial diversity will be assessed to add to our understanding of how microbes and minerals interact on the microscale through “in-place” activity assessments and imaging, the degree to which permeability and three-dimensional nodule structure dictates microbial abundance and activity, and the rates at which nodule- and sediment-hosted communities process biogeochemically relevant elements.
This integrated research will assess microbe-mineral interactions across several spatial orders of magnitude. Visualising anabolically active cells in relation to specific mineral grains, will link metabolic activity to spatial arrangements on the microscale. In concert with high-throughput sequencing, a community-scale metabolic model based on microbe-mineral and microbe-microbe interactions will be developed. By examining intact nodules with micro-CT scanning, internal fluid conduits will be developed; through computational image analysis and correlation with the microscale mapping, porosity and permeability effect on microbial abundance and metabolic activity levels will be investigated. Quantification of rates of oxygen consumption, carbon remineralisation, ammonia oxidation, and metal cycling will help link microbial activity to emergent biogeochemical processes.
This information will be important in determining how nodule removal from the CTA may impact biogeochemical processes, habitat quality and the associated biota.
12.3.2.11 Baseline Metals Concentrations in Benthic & Pelagic Organisms
Data will be gathered on baseline metals concentrations in the tissues of target benthic species collected in the baited traps (e.g., scavenging fishes, amphipods and shrimp) or by ROV (e.g., holothurians) and representative pelagic species from the zooplankton in the epi-, meso- and bathypelagic collected from the midwater pelagic studies (see section 10.3.3). Metal concentrations will be assessed within the sediments via the analysis of sediment cores and water column while the examination of organism’s tissues will establish the presence and accumulation of bioavailable metals to enable comparison to be made both pre- and post-collector test and between the CTA and the PRZ. Specific tissues or whole organisms will be digested by routine methods and analysed by ICP-MS (Jang et al. 2014).
12.3.3 Pelagic Studies Pelagic ecosystems have been studied very little in the CCZ region, not just due to its vastness and remoteness, but also a greater focus on mining-specific effects on the seafloor. However, deep-sea mining activities will have a variety of potential effects on biological communities in the ocean ’s mid-waters or pelagic realm (Drazen et al., 2020).
Figure 12-6 shows the relative locations of the pelagic sampling sites in and around the CTA and PRZ. The locations of hydrographic casts, trace metals casts, MOCNESS net tows, McLane pump lander sites and sediment drifter deployments are represented. Pelagic studies will be conducted at these sites as described below.

Docum
ent Num
ber: FIN
AL
Revision:
V20
Revision D
ate: 24 S
eptember, 2021
P
age 12-21 Figure 12-6.
Pelagic sampling sites

Document Number: FINAL
Revision: V20
Revision Date: 24 September, 2021
Page 12-22
Figure 12-7. Offshore monitoring techniques
A – Multicore; B – Box-core; C – MOCNESS net; D – Trace metal rosette; E – McLane pump; F – Zooplankton Lander; G – Remotely Operated Vehicle; H – Rosette Sampler

Document Number: FINAL
Revision: V20
Revision Date: 24 September, 2021
Page 12-23
12.3.3.1 Microbial Communities
Full water column (0 m – 4,300 m) quantification of microbial abundances, biomass, and biodiversity will be conducted in the CTA and PRZ using full ocean depth CTD casts (0 m – 4,300 m) equipped with the rosette (Figure 12-7H) of water sampling bottles. Microbial abundances and biomass will be quantified from seawater subsampled at appropriate depth intervals triggered from the CTD rosette and transferred to the ship-board laboratory for processing. Onshore, microbial abundances will be quantified through flow cytometry, including analyses of both photosynthetic bacteria (those containing chlorophyll a) and non-pigmented microorganisms (presumably heterotrophic and chemoautotrophic bacteria and archaea). In addition, for selected samples, epifluorescence microscopy will be used to quantify microbial cell sizes.
To evaluate the taxonomic diversity of microbial communities (focused on prokaryotes) PCR amplification and next-generation sequencing of 16S rRNA genes will be used.
12.3.3.2 Phytoplankton Communities
Characterisation of phytoplankton biomass and composition will rely on shipboard sampling during pre- and post- system testing campaigns. Biomass contributions of key phytoplankton taxa will be estimated based on analyses of photosynthetic pigments including carotenoids. Phytoplankton abundances and biomass will be quantified from seawater subsampled at appropriate depth intervals triggered from the CTD rosette and transferred to the ship-board laboratory for processing. Onshore, quantification of phytoplankton pigment concentrations (including light-harvesting and photoprotective pigments) will be performed via HPLC at Ocean Ecology and Biogeochemistry Facilities at Oregon State University using methods described in Bidigare et al. (2005).
Phytoplankton productivity will be investigated using in situ measurements of O2/Ar ratios to estimate net community productivity (NCP) utilising methods described by Craig and Hayward, (1987).
12.3.3.3 Zooplankton Communities
An integrated sampling program to characterise zooplankton abundance, biomass, diversity, and community composition from the sea surface to the seafloor will be implemented at the CTA and PRZ. Several distinct sampling tools will be used, given exponential declines in zooplankton biomass and abundance across depth into the deep ocean. A 1 m2 MOCNESS (MOC1) will be used to collect depth-stratified mesozooplankton assemblages in the epipelagic, mesopelagic and upper bathypelagic zones (to 1,500 m, approximately the depth of the discharge plume). Material from this 10-net system will be quantitatively split, with fractions used to determine biomass across size fractions for bulk zooplankton (wet/dry weight, C/N/P content, and splits for metals and stable isotopes), abundance and biomass at broad taxonomic resolution for the full assemblage (Zooscan, image-based), at high taxonomic resolution for dominant species (microscopy), and with diversity and community composition resolved both morphological and amplicon sequencing methods (metabarcoding). In order to sample zooplankton in the bathy- and abyssopelagic ocean, very large volumes of water must be sampled due to low abundance and biomass (for example, Wishner, 1980b; Yamaguchi et al., 2002). To accomplish this, three fine-mesh nets (200, 333 µm) made for the 10 m2 MOCNESS system will be used in order to obtain quantitative depth-stratified samples in low velocity deep tows. Microscopy, imaging, and targeted DNA sequencing will be used to characterise and describe these assemblages. These deep bathypelagic tows will be among the first conducted in the central Pacific and will provide critical baseline information on the communities likely to be impacted by the dewatering (or discharge) plume in the context of seabed mining.
Benthic boundary layer plankton will be sampled with two plankton pumps (McClane Large Volume Water Transfer System WTS-LV30) mounted on a free-vehicle, yielding one sample per pump per deployment. Plankton will be collected on 63 µm mesh filters, over a ~ 20-24 hour pumping period with the pump intake positioned at 3 m above the seafloor. Ethanol-preserved material will be used for microscopic

Document Number: FINAL
Revision: V20
Revision Date: 24 September, 2021
Page 12-24
identification of individual larvae, DNA barcoding of single specimens and metabarcoding of the full assemblage.
Environmental DNA (eDNA) surveys will be used to capture metazoan diversity that may be overlooked using other survey techniques by amplicon sequencing of particulate material collected from seawater samples taken from CTD casts.
12.3.3.4 Gelatinous Zooplankton Communities
Using a bespoke suite of imaging technologies (inc. a shadow graph camera and 4K systems), oblique descent and horizontal ROV-based surveys (at pre-determined water depths) will be conducted to characterise the gelatinous midwater community (Netburn 2018). To collect gelatinous zooplankton, the ROV will be equipped with a suction sampler and detritus samplers (D-sampler) for retrieval of near pristine samples.
12.3.3.5 Micronekton Communities
Micronekton will be sampled with a 10 m MOCNESS; (Wiebe et al., 1985), which monitors environmental conditions in real time and allows for five depth-discrete samples per tow using multiple 3 mm mesh nets. Sampling will be undertaken at depths separating the epipelagic (0 m – 200 m), mesopelagic as dictated by the local OMZ conditions (estimates of 200 m – 400 m, 400 m- 700 m, 700 m – 1,000 m) and in the bathypelagic (1,000 m – 1,500 m, 1,500 m – 2,500 m, 2,500 m – 3,500 m, 3,500 - ~4,000 m) and in the benthic boundary layer (~ 200 - ~50 m above the seafloor).
Micronekton samples will be used for community analysis. Samples will be sorted to lowest taxon possible using a variety of taxonomic keys with verification by taxonomic experts. Estimates of diversity will be constructed including species richness, evenness, and expected diversity using rarefaction methods. In the laboratory ashore, each taxa will be counted and weighted for estimates of abundance and biomass for each net sample using the quantitative measure of volume sampled provided by the MOCNESS system. Community composition will be evaluated as a function of depth, sampling area (CTA vs PRZs) and in relation to that sampled elsewhere in the Pacific region from the literature.
12.3.3.6 Food Web Linkages Between Trophic Levels
Stable isotopes will be used to characterise trophic structure in pelagic ecosystems (for example, Choy et al., 2015; Popp et al., 2007; Romero-Romero et al., 2016). They can be used to evaluate if sediment and resuspended organic matter enter food webs, and if it is it consumed by suspension feeders. To characterise food webs during baseline studies and pre- and post- system testing the stable isotopic composition of water column particles, the food of suspension feeders, size fractionated zooplankton (Hannides et al., 2013), and several dominant micronekton will be analysed.
Comparisons of the isotopic values of food sources and animals will be done using Bayesian mass balance approaches (for example, MixSIAR; Stock and Semmens, 2013) modified to accommodate AA-CSIA of δ15N and δ13C to quantify the relative contributions of each of the particle food sources.
12.3.3.7 Water Column Profiles of Trace Elements
Baseline distribution of inorganic nutrients (Si, N, P), carbonate alkalinity, and total organic carbon (TOC), as well as the biologically essential trace elements (Fe, Mn, Cu, Zn, Ni, and Co, and also toxic trace elements such as Cd, Pb, and Hg, will be measured. Samples will be collected using the sampling system and the protocols developed for the International GEOTRACES Program (Cutter and Bruland, 2012). The equipment will consist of a plastic-coated rosette system equipped with metal-free GO-Flo sampling bottles that is lowered through the water column using a plastic-coated Kevlar conducting cable. An initial sampling of the CTA and PRZ prior to the collector test will include approximately six full column profiles of 24 water samples each, focusing on near bottom waters and the depth of the discharge plume.

Document Number: FINAL
Revision: V20
Revision Date: 24 September, 2021
Page 12-25
12.3.4 Surface Observations Populations of surface fauna in NORI-D are likely to be sparsely or patchily distributed. Meso-scale oceanographic processes can lead to localised areas of enhanced seasonal productivity which can lead to feeding aggregations that are disproportionately important to the life cycles of fauna. As such, observation programs must be over a large-area and conducted over a long time. Collaboration is therefore favourable and the deep-sea mining industry conducting multiple voyages to the remote CCZ has the potential to contribute significantly to the global knowledge base.
The PelagOS observation and recording system will be used to record daytime sightings of surface fauna, marine debris and other marine users. PelagOS was developed with the specific intent of being distributed widely and used by people with a range of skill levels from interns to experts to collect data that meets with the requirements of ESIA while also contributing to global scientific research collaborations. The system operates as an Android application. (Figure 12-8). The primary function of PelagOS is to replace ad hoc observational recording with high quality and streamlined recording and reporting that provides the user with a range of data collection and processing capabilities. Training, built-in species lists, and photo guide helps to ensure accuracy of species identification at sea which is further quality assured through validation by our offsite taxonomic experts.
Figure 12-8. Example of PelagOS data recording screen.
PelagOS has the capability to record numerous data points, including: sightings of species of conservation significance and other marine species including birds, mammals, reptiles, fish aggregations and larger marine predators. Additional data points include:
• environmental conditions
• marine debris
• vessel activities
• vessel tracks
• observer details
• observer effort
• sighting time and position.

Document Number: FINAL
Revision: V20
Revision Date: 24 September, 2021
Page 12-26
The system can interface with a ship’s navigation system or operate independently and has the capability to operate offline. The operator may use PelagOS to produce daily reports as well as end of project reports through the automated reporting system. Externally, PelagOS connects to a centralised database housing client data and open access data. Field tablets synchronise to the central server when internet connectivity allows data transfers. Further details of the PelagOS system can be found in Fathom Pacific (2020b).
12.3.5 Data Management
12.3.5.1 qCore Database
All monitoring data will be entered into the qCore database that has been designed by NORI specifically as a repository for data collected during the ESIA studies. The qCore database provides:
• A repository for field events, sample data, platform details and various metadata associated with scientific operations and monitoring activities.
• A register for specimens and sampling products such as specimens, images and electronic datafiles.
• An efficient sample barcode labelling and tracking system, including for validation, inventory, and chain of custody purposes.
• Record and dashboard program progress.
• A facility for OHS, environmental and QA/QC management of projects.
• A facility for data checking and rapid data exploration.
• A facility for efficient output of regular data and reporting product.
• Centralised storage of any type of ecological and environmental data.
During the collector test monitoring the qCore database system will be utilised to achieve the following:
• Registration of sample collecting platforms and processes.
• Registration of sampling events (deployments and recoveries of sampling platforms).
• Registration of data and sample objects generated by sampling events, such as imagery, physical samples, data files, sensor readings, observations, mapping files (for example rasters, spatial data) etc.
• Printing sample object labels for sample receptacles.
• Tracking completeness of sample objects and completeness of trace-back information
• Tracking chain-of-custody of samples off the ship to destination laboratory.
• Registration and querying of analysed data submitted post-voyage.
To achieve these requirements, the data management system will have access to:
• A dedicated offshore data officer supported by on-land data manager.
• Necessary hardware and software components.
• Internet connection to central database computer.
• Intranet connection to a positioning system to track locations of the vessel, transponders and other positioning feeds associated with a shipboard survey system.

Document Number: FINAL
Revision: V20
Revision Date: 24 September, 2021
Page 12-27
12.3.5.2 Data Dissemination
The qCore data management system is designed to fulfil the obligations of reporting to ISA and delivery of data to the ISA DeepData database. These obligations set the requirements for science team collaboration. The core requirements are:
• Spatial and temporal allocation of data.
• Responsible person allocation to data.
• Unique sample IDs nested in voyage information, locations, gear types.
• Layers and measurement parameters nested in sample IDs and linked to methods.
• Photos linked directed to samples.
• All attributes in a standardised list of “valid values”, required fields, units of measurements etc.
• Compliance with ISA upload data structures (melted or long-format data).
In addition, contracted scientific organisations will publish data in open access publications to encourage scientific advances and transparency.
12.4 Environmental Management
Measures to manage potential environmental impacts to non-significant levels are described in Sections 7.5 and 8.3. In addition, design features of the collector system developed to further minimise environmental impacts have been discussed in Section 3. Details of specific management measures will be documented in an Environmental Monitoring and Management Plan (EMMP) that will be developed for the collector test and submitted to the ISA prior to the commencement of operations. This plan will outline commitments and procedures on how management measures will be implemented, how the effectiveness of such measures will be monitored, what the management responses will be to the monitoring results and what reporting systems will be adopted and followed.
12.5 Reporting
12.5.1 Internal Reporting Results from monitoring activities will be recorded and reports prepared that contain data used to assess performance of the collector test equipment and the effectiveness of the design and management measures. Findings will assist in validating the plume model and impact predictions in this EIS and inform the EIS and EMMP for commercial scale mining. The general structure of the monitoring reports will be:
• Introduction.
• Legislative framework and standards.
• Monitoring criteria.
• Monitoring methods.
• Monitoring results.
• Auditing.
• Recommendations and corrective action.

Document Number: FINAL
Revision: V20
Revision Date: 24 September, 2021
Page 12-28
12.5.2 External Reporting Monitoring reports will be submitted to the International Seabed Authority (ISA) on an annual basis as per ISBA/19/C/17 Regulation 32 which states:
The contractor shall report annually in writing to the Secretary-General on the implementation and results of the monitoring programme and shall submit data and information, taking into account any recommendations issued by the (Legal and Technical) Commission.
Compliance with the EMMP will be described in these reports, plus recommendations made for any corrective actions.
NORI will also disclose the results of additional assessments and monitoring activities to the ISA annually.
12.5.3 Incident Reporting Any spills, incident or uncontrolled release which enters the marine environment is a recordable incident which will be notified to the ISA within required reporting timeframes of the incident occurring as per ISBA/19/C/17 Regulation 33 which states:
A contractor shall promptly report to the Secretary-General in writing, using the most effective means, any incident arising from activities which have caused, are causing or pose a threat of serious harm to the marine environment.
The notification to the ISA will include the following:
• The incident and all material facts and circumstances concerning the incident that is known at the time.
• Any actions taken to avoid or mitigate any adverse environmental impacts.
• Any corrective actions that have been taken, or may be taken, to prevent a repeat of similar incidents occurring.
Following MARPOL OPRC-HNS 2000 Protocol any relevant third-party authorities will also be notified as required.
12.5.4 Corrective Actions The monitoring and inspection process incorporates both formal and informal corrective actions. Any environmental incident investigations or non-conformance identify the factor(s) that led to the hazard, injury/illness, incident, or other system failure and recommend appropriate corrective actions to be taken including the re-evaluation of work practices. Revised work practices are communicated through the relevant manager to employees, contractors, and the ISA.

Document Number: FINAL
Revision: V20
Revision Date: 24 September, 2021
Page 13-1
13 LIMITATIONS, ASSUMPTIONS & UNCERTIANTY
13.1 Limitations
• This EIA is only applicable to the Collector Test which will consist of the equipment and activities described in Section 3 of this EIS.
• The plume modelling results presented in Section 7 are only applicable to the Collector Test activities described in Section 3 of this EIS.
• The findings of this EIA are applicable to the Collector Test activities only and not the operational phase.
13.2 Assumptions
The findings of this EIA assume the following (letters A-F refer to Figure 13-1):
A. All activities associated with the collector test are confined to the CTA (150 km2) and the over lying water column.
B. All direct disturbance of the seabed by the PCV is confined to the TF (8 km2).
C. The overall area of seabed that will be directly disturbed by the PCV is limited to 0.5 km2.
D. Collector test activities will be conducted in accordance with the test plan described in Section 3.5.7All onsite activities associated with the Collector Test will be completed within a 3-month period. The duration of the entire collector test is limited to approximately 36 days, and the duration of system testing (period of maximum plume generation) is limited to approximately 12 days. Most impacts associated with the collector test will be temporary, of short duration, and spatially constrained.
E. The benthic and mid-water plume exceedance models in Section 7.4.3 are an accurate representation of plume dynamics.
F. Seasonal variations in physical oceanography (e.g., current direction; water temperature etc.) will not cause a material change in the magnitude of TSS exceedances described by the plume models in Section 7.4.3. And that any seasonal change in direction of plume drift is inconsequential to the findings of this EIA.
G. The biota impacted by activities associated with the Collector Test are well represented in similar abyssal plain and pelagic habitat abundant throughout NORI-D and the wider CCZ.
13.3 Uncertainty
Uncertainty is almost unavoidable in EIAs (Tennøy et al., 2006) as they typically involve situations in which the full range of possible options and their impacts cannot be known (Ozdemir and Saaty, 2006). Assumptions then have to be made to address knowledge gaps, which introduce uncertainty into the EIA process. It is important for informed decision making that the sources of uncertainty are identified and treatments proposed. Some forms of uncertainty are easily managed, for example the uncertainties introduced by assumptions A-E in Section 13.2 are readily treated by ensuring that the specifications for the Collector Test described in the EIS are implemented as described. Thus, although an activity may have the potential to cause a

Document Number: FINAL
Revision: V20
Revision Date: 24 September, 2021
Page 13-2
high impact, there is a low level of uncertainty (i.e., high confidence) in the measures put in place to ensure this does not occur. These assumptions occupy the top left-hand corner of the impact/uncertainty matrix (i.e., high impact/low uncertainty; Figure 13-1). Uncertainty around plume dynamics (assumptions F and G in Section 13.2) has been treated by the development of TSS exceedance models (Section 7.4.3). The models predict that benthic and mid-water plumes will be mostly constrained to the TF and associated water column, and that TSS will rapidly fall to background levels. However, the models are in the early stages of development and need to be verified by field observations that will be conducted during the collector test and any observed excursions outside predicted plume boundaries will provide empirical data as an ongoing process for improvement of the model’s predictive reliability. As such, there is still some degree (medium) of uncertainty around the accuracy of the models. Due to the temporary nature and limited size of plumes that will be generated by the small-scale activities of the Collector Test (as described in Section 7.4.3) the potential impact is conservatively described as medium. These assumptions occupy the central part of the impact vs uncertainty matrix (i.e., medium impact/medium uncertainty; Figure 13-1). At the time of writing, the physical baseline is well progressed but the biological baseline data is considered preliminary. The current work program will collect baseline biological data as required for statistical impact assessment prior to the commencement of the collector test. Notwithstanding, any residual uncertainty in the Collector Test EIA has been treated by minimising the magnitude of impacts to the biological component of the receiving environment (i.e., impacts are temporary; the area of seabed and volume of the water column impacted by the PCV and plumes has been minimised). This treatment positions assumption H in the bottom right-hand corner of the impact/uncertainty matrix (i.e., low impact/high uncertainty; Figure 13-1).
Figure 13-1. Impact vs uncertainty matrix (modified from Speziale & Geneletti 2014)
(Note: Letters refer to Assumptions in Section 13.2)
Figure 13-1 depicts the uncertainty profile for the Collector Test and shows that the ‘high risk’ top right-hand corner of the matrix (i.e., high impact/high uncertainty) has been avoided.

Document Number: FINAL
Revision: V20
Revision Date: 24 September, 2021
Page 14-3
14 CONSULTATION & REVIEW
14.1 Introduction
NORI conducted a global stakeholder consultation workshop in Q1 2020 to inform both the collector test EIA and operational ESIA processes. ISA Recommendations (ISBA/25/LTC/6/Rev.1/E41(d)) encourage sponsoring states to also conduct stakeholder consultations as part of the collector test EIA process. The EIS document has also been subjected to expert review prior to submission. Details of the stakeholder consultation conducted to date, planned consultation by the sponsoring state and the peer review process is provided below.
14.2 NORI Global Stakeholder Workshop
NORI conducted a Global Stakeholders Workshop was in San Diego, USA, on 5 and 6 February 2020. The objective of the event was to elicit stakeholder input into the strategy and philosophy proposed by NORI for the Collector Test EIA and operational ESIA processes.
Over 55 stakeholders attended the two-day event in person and a further 20 attended via webinar. Workshop participants came from over 20 countries, including: Australia, Belgium, Canada, Chile, Cook Islands, Fiji, Germany, Ghana, India, Jamaica, Kiribati, Nauru, Norway, Poland, Portugal, Switzerland, The Netherlands, Trinidad and Tobago, United Kingdom, and United States of America.
Invitations were sent to over 250 people and a detailed participant list can be found in Appendix 5. Independent facilitators led the workshop and a number of external and internal speakers made presentations on different aspects of the mining process, environmental considerations, and NORI’s ESIA program.
Presenters included:
• Brian Balcom, CSA Ocean Sciences
• Gerard Barron, Chairman and CEO of The Metals Company
• Dr. Michael Clarke, NORI/The Metals Company
• Dr. Thomas Dahlgren, University of Gothenburg
• Dr. Jennifer Durden, National Oceanography Centre
• Margo Deiye, Permanent Representative to the ISA
• Matt Edmunds, Fathom Pacific Ltd
• Dr. Jeff Drazen, University of Hawaii
• Dr. Adrian Flynn, Fathom Pacific Ltd
• Dr. Daniel Jones, National Oceanography Centre
• Dr. Steven Katona, College of the Atlantic
• Larry Madin, Woods Hole Oceanographic Institution
• Alex Laugharne, CRU International Consulting
• Tony O’Sullivan, NORI/The Metals Company
• Daina Paulikas, The Metals Company
• Wanfei Qiu, Programme Manager (Marine Environment), ISA
• Dr. Gregory Stone, Chief Ocean Scientist, NORI/The Metals Company
• Professor Andrew Sweetman, Heriot Watt University
• Scott Wilson, Maersk
• Dr. Clare Woulds, University of Leeds
• Dr. Chris Kelly, CSA Ocean sciences

Document Number: FINAL
Revision: V20
Revision Date: 24 September, 2021
Page 14-4
5th February 2020
Day 1 of the workshop provided participants with an overview of the workshop format and insight into metal supply and demand in the 21st century. Other topics included thoughts about where metals for the green transition should come from. The ISA Secretariat’s environmental programme manager gave an overview of the ISA’s regulatory processes. Nauru’s Permanent Representative to the ISA presented shared why their nation has chosen to be involved in the industry and a facilitated discussion was undertaken with all participants to discuss concerns about nodule collection.
Figure 14-1. Participants at the NORI global stakeholders workshop, San Diego, USA, 5 and 6 February 2020
6th February 2020
Day 2 presentations included discussion on the deep-sea environment in the CCZ, details on how the deep-sea nodule collection system works, and the EIA process (including the TOR and scoping report), objectives, and details of NORI’s proposed program for both the Collector Test EIA and operational ESIA. The key environmental baseline and monitoring studies were also presented and an overview of each study package was presented by the scientific and research organizations who were conducting the work packages. The issue of serious harm was also discussed. A detailed agenda from the workshop has been supplied as Appendix 5.
Learnings from this workshop have been incorporated into the Collector Test EIA process and the proposed environmental monitoring plans.
14.3 Sponsoring State Stakeholder Consultation
ISA Recommendations (ISBA/25/LTC/6/Rev.1/E41(d)) state: (d) In the event that a stakeholder consultation has not yet been conducted by the sponsoring State, the Commission, through the Secretary-General, may encourage the sponsoring

Document Number: FINAL
Revision: V20
Revision Date: 24 September, 2021
Page 14-5
State(s) to conduct such consultation. The Commission, through the Secretary-General, may request the sponsoring State, in the event it conducts the stakeholder consultation, to forward to the Secretary-General the comments submitted by stakeholders with a view to passing this information to the contractor. Any available information concerning such stakeholder consultation will be made available on the website of the International Seabed Authority;
Although sponsoring states are encouraged to conduct stakeholder consultation there is currently no legal obligation to do so and a preferred process is not prescribed. After reviewing previous EIA collector test stakeholder consultation processes and considering international best practice, Nauru has developed the following consultation process. This process was shared with the ISA Secretariat prior to finalization.
30 July 21
• Submission of NORI EIA to ISA
o Within 30 days the Secretary General will acknowledge the receipt of the EIS and check for completeness
o The LTC will initiate the review of the EIA at its next meeting for completeness, accuracy and statistical reliability in conformity of the Recommendations
30 August 21
• Secretary General to provide feedback on EIA completeness.
1 September 2021
• If the Secretary General determines that the EIA is complete and requires to no additional information
o Nauru will provide formal notification to ISA Members of the submission of the NORI EIA and share the stakeholder consultation process
o Nauru to post EIA for comment on Nauru government website (45-day comment period)
o NORI to post EIA on TMC website for comment (45-day comment period)
6 -10 September 2021
• Nauru will host a preliminary stakeholder workshop. NORI will present an overview of the EIA to facilitate the start of the stakeholder consultation phase
15 October 2021
• Stakeholder comment period closes
• Nauru to share stakeholder comments with NORI for review and comment
15 -19 November 2021
• Nauru to host stakeholder workshop to provide NORI with the opportunity to respond to stakeholder comments
• Nauru may provide direction or feedback to NORI based on its review and stakeholder comments
26 November 2021
• Nauru to submit summary of stakeholder comments and NORI’s response to Secretary General
• NORI to submit any revisions or updates to the to the EIA based on stakeholder comments to the ISA

Document Number: FINAL
Revision: V20
Revision Date: 24 September, 2021
Page 14-6
• On or before 30 July 2022
At the conclusion of its review, the LTC will provide recommendations to the Secretary General as to whether the EIA should be incorporated into the programme of activities under the contract.
(*note: dates are indicative and subject to change)
14.4 Expert Review
Expert review will be included at several points in the operational ESIA process. The Collector Test EIS is considered an appropriate milestone in the process at which to elicit expert opinion as this will augment the overall quality of the operational ESIA. Experts from a range of disciplines have provided comment on the Collector Test EIS, including oceanographers, marine biologists, and environmental impact specialists.
The expert review panel members listed in Table 14-1 have provided comment and input in to this EIS.
Table 14-1. Expert panel review members
NAME AFFILIATION AREA OF EXPERTISE
Dr Larry Madin Independent Consultant
Pelagic Biology
Dr Dan Jones National Oceanographic Centre (UK)
Benthic megafauna
Lochlan Gibson Certified Impact Assessor
Environmental Impact Assessment
Conn Nugent Independent Consultant
Communications specialist on conservation and sustainable economies.

Document Number: FINAL
Revision: V20
Revision Date: 24 September, 2021
Page 15-1
15 CONCLUSION & RECOMMENDATION
15.1 Conclusion
The collector test is an essential component of the operational ESIA. It is necessary to demonstrate the technical, economic, and environmental feasibility of operations proposed for the commercial phase of the project. The collector test is an opportunity to demonstrate the feasibility of the nodule collector system and test any assumptions made during its design.
The information presented in this EIS supports the finding that the design features incorporated into the collector system and small scale of the test program sufficiently minimise all impacts to non-significant levels without the need for additional focused mitigation measures. In the absence of significant impacts, the risk of the collector test resulting in ‘serious harm’ to the marine environment at a regional scale, is negligible.
15.2 Recommendation
The collector test should proceed under the conditions described in this EIS. The learnings from the information gathered during the testing should be reflected in the findings of the operational EIS and applied to the design and operations of the full-scale system to reduce uncertainty and minimise environmental impacts during commercial operations.

Document Number: FINAL
Revision: V20
Revision Date: 24 September, 2021
Page 16-2
16 GLOSSARY, ABBREVIATIONS & ACRONYMS
16.1 Glossary
TERM DEFINITION
Allseas Allseas Group S.A. is a Swiss-based offshore contractor specialising in subsea construction and strategic partner with NORI designing the PCV and riser system.
Collector Test Testing of the prototype collector vehicle (PCV), nodule processing system, the nodule riser system, surface processing onboard the SSV and the discharge of the return water.
Collector Test EIA Environmental Impact Assessment of activities associated with the collector test, a sub-component of the operational ESIA.
Collector Test EIS
Environmental Impact Statement provides a description of the Project, the potential environmental impacts, environmental risks and hazards, risk management measures and monitoring programs relating to the collector test (i.e., the current document)
Production (mid-water) plume
The plume generated by the return of surface processing water into the water column at -1,200 m during system testing (i.e., nodule production)
Operational (benthic) plume
The plume generated by the PCV at the seabed during system testing (i.e., nodule production)
operational EIS Operational Environmental Impact Statement that will be conducted as part of NORI’s application for a commercial mining contract
operational EMMP Operational Environmental Management and Monitoring Plan
operational ESIA Environmental and Social Impact Assessment conducted in support of NORI’s application for a commercial permit to the ISA
nodule production
Nodules collected by the PCV, processed, and transported to the SSV via the riser system. This will create an Operational (benthic) plume. Nodules will undergo surface processing and the return water will be discharged. This discharge will create a Production (mid-water) plume.
nodule processing system
Separation of nodules from sediment within the PCV (i.e., on the seafloor)
surface processing Separation of nodules from water, nodule fragments and/or entrained sediments. Generates the return water.
Sediment spill Sediment generated by an activity or system component
TF (Area 6) A 2 km x 4 km sub-division of the Pilot Mining Area in which collector test operations will be conducted.
16.2 Abbreviations & Acronyms
ABBREVIATION DEFINITION ADCP Acoustic doppler current profiler Ag Silver ALARP As low as reasonably practicable APEI Area of particular environmental interest APP Application Au Gold AUV Autonomous underwater vehicle BACI Before-After-Control-Impact

Document Number: FINAL
Revision: V20
Revision Date: 24 September, 2021
Page 16-3
ABBREVIATION DEFINITION bar Metric unit of pressure BBL Benthic Boundary Layer Ca Cadmium CCZ Clarion-Clipperton zone CLARA Clustering large applications cm Centimetre Co Cobalt CTA Collector Test Area CTD Conductivity temperature depth Cu Copper D-L MBES Down looking multibeam echosounder DO Dissolved oxygen DOC Dissolved organic carbon DP Dynamic Positioning DVL Doppler velocity log DWT Deadweight tonnage EcoQS Ecological quality status EIA Environmental impact assessment EIS Environmental impact statement EMMP Environmental monitoring and management plan ERL Effects range low ERM Effects range medium ERP Emergency response plan ESIA Environmental and social impact assessment et al And others Fe Iron F-L MBES Front looking multibeam echosounder g Gram GEBCO General bathymetric chart of the oceans GHG Greenhouse gas HAT Harbour Acceptance Trial HD Hydrodynamic HPU Hydraulic power unit HYCOM Hybrid Coordinate Ocean Model ICP-MS Inductively coupled plasma mass spectrometry IMO International maritime organisation INS Inertial navigation system IRZ Impact reference zone ISA International seabed authority ITCZ Intertropical convergence zone kg Kilogram kg/m2 Kilograms per square metre kHz Kilohertz km Kilometre

Document Number: FINAL
Revision: V20
Revision Date: 24 September, 2021
Page 16-4
ABBREVIATION DEFINITION km2 Square kilometre kW Kilowatt l Litre LARS Launch and recovery system Lat Latitude LBL Long baseline acoustic positioning system Long Longitude m Metre m/s Metres per second m3/s Cubic metres per second MARPOL International Convention for the Prevention of Pollution from Ships mbsl Metres below sea level MEDEVAC Emergency medical evacuation metocean Meteorology and (physical) oceanography. mg Milligram mg/l Milligrams per litre MI Maturity index mm Millimetre Mn Manganese MW Megawatt NH4+ Ammonia Ni Nickel NO2- Nitrite NO3- Nitrate NORI Nauru Ocean Resources Inc NORI-D Nauru Ocean Resources Inc Lease Area D NTU Nephelometric turbidity units OSPAR Convention for the Protection of the Marine Environment of the North-East Atlantic OTUs Operational Taxonomic Units PC Particulate carbon POC Particulate organic carbon PCV Prototype Collector Vehicle pH Measure of acidity/alkalinity PO43- Phosphate PRZ Preservation reference zone PSSA Particularly sensitive sea areas psu Practical salinity unit ROV Remotely operated vehicle SAR Static acoustic recorder SAT Sea Acceptance Trial SiO2 Silica SOFAR Sound Fixing and Ranging Channel (brand name) SQuiRT Screening quick reference table SSV Surface Support Vessel

Document Number: FINAL
Revision: V20
Revision Date: 24 September, 2021
Page 16-5
ABBREVIATION DEFINITION TC Total carbon TDI Trophic diversity index TF Test Field TIC Total inorganic carbon TOC Total organic carbon TOML Tonga offshore mining limited TSS Total suspended solids USBL Ultrashort baseline acoustic position system VEC Valued ecosystem component W Watt Zn Zinc μg/l Micrograms per litre < Less than ≤ Less than or equal to > Greater than ≥ Greater than or equal to