В І С НИ К
116
ВІСНИК КИЇВСЬКОГО НАЦІОНАЛЬНОГО УНІВЕРСИТЕТУ ІМЕНІ ТАРАСА ШЕВЧЕНКА ISSN 1728-2667 ЕКОНОМІКА 3(198)/2018 Засновано 1958 року Представлено дослідження актуальних проблем економічної теорії, страхування, управління ризи- ками, перестрахування, державного управління, міжнародної економіки, економіки підприємства, ме- неджменту, маркетингу, управління інвестиціями, теорії фінансів, банківської справи, статистики та шляхи й засоби розв'язання зазначених проблем. Для наукових працівників, практиків, викладачів, аспірантів, студентів. The research results on current problems of economic theory, insurance, risk management, reinsurance, public administration, international economics, business economics, management, marketing, investment management, theory of finance, banking, statistics, the ways and means of solving these problems are released in the issue. For researchers, practitioners, teachers and students. ВІДПОВІДАЛЬНИЙ РЕДАКТОР В. Д. Базилевич, д-р екон. наук, проф., чл.-кор. НАН України РЕДАКЦІЙНА КОЛЕГІЯ Г. О. Харламова, канд. екон. наук, доц. (відп. секр.) (Україна); С. Х. Аггелопо- улос, д-р наук, проф. (Греція); Х. Алпас, д-р екон. наук, проф. (Туреччина); Х. Батзіос, д-р наук, проф. (Греція); Х. Я. Башев, д-р екон. наук, проф. (Бол- гарія); М. ван Рооіджен, д-р наук, проф. (Велика Британія); Г. Друтейкіне, д-р наук, проф. (Литва); К. Віталє, д-р наук, проф. (Хорватія); М. Зінельдін, д-р наук, проф. (Швеція); А. Савватєєв, канд. наук, проф. (РФ); Г. Заротіадіс, канд. наук, доц. (Греція), Р. С. Сербу, канд. наук, проф. (Румунія); Е. Стойка, канд. наук, доц. (Румунія); А. Москардіні, д-р наук, проф. (Велика Брита- нія); С. Нате, канд. наук, проф. (Румунія); О. Погорлецький, д-р екон. наук, проф. (РФ); В. Поліменіс, д-р екон. наук, проф. (Греція); Н. І. Гражевська, д-р екон. наук, проф. (Україна); А. І. Ігнатюк, д-р екон. наук, проф. (Україна), Г. І. Купалова, д-р екон. наук, проф. (Україна); І. О. Лютий, д-р екон. наук, проф. (Україна); С. В. Науменкова, д-р екон. наук, проф. (Україна); Р. В. Пікус, канд. екон. наук, проф. (Україна); А. О. Старостіна, д-р екон. наук, проф. (Україна); О. І. Черняк, д-р екон. наук, проф. (Україна) Адреса редколегії 03022, Київ-22, вул. Васильківська, 90-а, економічний факультет (38044) 259 71 82; http://bulletin-econom.univ.kiev.ua Затверджено Вченою радою економічного факультету 19.06.18 (протокол № 10) Атестовано Атестовано Вищою атестаційною комісією України. Постанова Президії ВАК України № 241 від 09.03.16 Зареєстровано Державною реєстраційною службою України. Свідоцтво про державну реєстрацію КВ № 19866-9666ПР від 29.04.13 Засновник та видавець Київський національний університет імені Тараса Шевченка, Видавничо-поліграфічний центр "Київський університет". Свідоцтво внесено до Державного реєстру ДК № 1103 від 31.10.02 Адреса видавця 01601, Київ-601, б-р Т. Шевченка, 14, кімн. 43 (38044) 239 31 72, 239 32 22; факс 239 31 28 Журнал входить до наукометричних баз / Abstracted and Indexed: РИНЦ (E-Library), Science Index, Ulrich's Periodicals Directory, Google Scholar, RepEc, Socionet, Index Copernicus (ICV 2016 = 78,52), CyberLeninka, OCLC WorldCat, CrossRef, J-Gate, Microsoft Academic Search, Bielefeld Academic Search Engine (BASE), Registry of Open Access Repositories (ROAR), The Directory of Open Access Repositories (OpenDOAR), IDEAS, EconPapers, CiteFactor (indexed), Maksymovych Scientific Library of Taras Shevchenko National University of Kyiv, National Library of Ukraine Vernadsky, DOAJ, ProQuest, CitEc, RedLink, Infobase (India), Researchbib (Japan), MIAR (Spain) (ICDS = 6,5), Directory of Research Journals Indexing (DRJI), Social Science Research Network, Scіentіfіc Іndexіng Servіces, Open Academic Journals IndexGIGA Information Centre, Thomson Reutars ESCI (under evaluation), Сabell's (pending), Scopus (under evaluation) etc. © Київський національний університет імені Тараса Шевченка, Видавничо-поліграфічний центр "Київський університет", 2018
-
Upload
khangminh22 -
Category
Documents
-
view
3 -
download
0
Transcript of В І С НИ К

В ІСНИК КИЇВСЬКОГО НАЦІОНАЛЬНОГО УНІВЕРСИТЕТУ ІМЕНІ ТАРАСА ШЕВЧЕНКА
ISSN 1728-2667
ЕКОНОМІКА 3(198)/2018 Засновано 1958 року
Представлено дослідження актуальних проблем економічної теорії, страхування, управління ризи-ками, перестрахування, державного управління, міжнародної економіки, економіки підприємства, ме-неджменту, маркетингу, управління інвестиціями, теорії фінансів, банківської справи, статистики та шляхи й засоби розв'язання зазначених проблем.
Для наукових працівників, практиків, викладачів, аспірантів, студентів. The research results on current problems of economic theory, insurance, risk management, reinsurance,
public administration, international economics, business economics, management, marketing, investment management, theory of finance, banking, statistics, the ways and means of solving these problems are released in the issue.
For researchers, practitioners, teachers and students.
ВІДПОВІДАЛЬНИЙ РЕДАКТОР
В. Д. Базилевич, д-р екон. наук, проф., чл.-кор. НАН України
РЕДАКЦІЙНА КОЛЕГІЯ
Г. О. Харламова, канд. екон. наук, доц. (відп. секр.) (Україна); С. Х. Аггелопо-улос, д-р наук, проф. (Греція); Х. Алпас, д-р екон. наук, проф. (Туреччина); Х. Батзіос, д-р наук, проф. (Греція); Х. Я. Башев, д-р екон. наук, проф. (Бол-гарія); М. ван Рооіджен, д-р наук, проф. (Велика Британія); Г. Друтейкіне, д-р наук, проф. (Литва); К. Віталє, д-р наук, проф. (Хорватія); М. Зінельдін, д-р наук, проф. (Швеція); А. Савватєєв, канд. наук, проф. (РФ); Г. Заротіадіс, канд. наук, доц. (Греція), Р. С. Сербу, канд. наук, проф. (Румунія); Е. Стойка, канд. наук, доц. (Румунія); А. Москардіні, д-р наук, проф. (Велика Брита-нія); С. Нате, канд. наук, проф. (Румунія); О. Погорлецький, д-р екон. наук, проф. (РФ); В. Поліменіс, д-р екон. наук, проф. (Греція); Н. І. Гражевська, д-р екон. наук, проф. (Україна); А. І. Ігнатюк, д-р екон. наук, проф. (Україна), Г. І. Купалова, д-р екон. наук, проф. (Україна); І. О. Лютий, д-р екон. наук, проф. (Україна); С. В. Науменкова, д-р екон. наук, проф. (Україна); Р. В. Пікус, канд. екон. наук, проф. (Україна); А. О. Старостіна, д-р екон. наук, проф. (Україна); О. І. Черняк, д-р екон. наук, проф. (Україна)
Адреса редколегії 03022, Київ-22, вул. Васильківська, 90-а, економічний факультет (38044) 259 71 82; http://bulletin-econom.univ.kiev.ua
Затверджено Вченою радою економічного факультету 19.06.18 (протокол № 10)
Атестовано Атестовано Вищою атестаційною комісією України. Постанова Президії ВАК України № 241 від 09.03.16
Зареєстровано Державною реєстраційною службою України. Свідоцтво про державну реєстрацію КВ № 19866-9666ПР від 29.04.13
Засновник та видавець
Київський національний університет імені Тараса Шевченка, Видавничо-поліграфічний центр "Київський університет". Свідоцтво внесено до Державного реєстру ДК № 1103 від 31.10.02
Адреса видавця 01601, Київ-601, б-р Т. Шевченка, 14, кімн. 43 (38044) 239 31 72, 239 32 22; факс 239 31 28
Журнал входить до наукометричних баз / Abstracted and Indexed:
РИНЦ (E-Library), Science Index, Ulrich's Periodicals Directory, Google Scholar, RepEc, Socionet, Index Copernicus (ICV 2016 = 78,52), CyberLeninka, OCLC WorldCat, CrossRef, J-Gate, Microsoft Academic Search, Bielefeld Academic Search Engine (BASE), Registry of Open Access Repositories (ROAR), The Directory of Open Access Repositories (OpenDOAR), IDEAS, EconPapers, CiteFactor (indexed), Maksymovych Scientific Library of Taras Shevchenko National University of Kyiv, National Library of Ukraine Vernadsky, DOAJ, ProQuest, CitEc, RedLink, Infobase (India), Researchbib (Japan), MIAR (Spain) (ICDS = 6,5), Directory of Research Journals Indexing (DRJI), Social Science Research Network, Scіentіfіc Іndexіng Servіces, Open Academic Journals IndexGIGA Information Centre, Thomson Reutars ESCI (under evaluation), Сabell's (pending), Scopus (under evaluation) etc.
© Київський національний університет імені Тараса Шевченка, Видавничо-поліграфічний центр "Київський університет", 2018
B U L L E T I N OF TARAS SHEVCHENKO NATIONAL UNIVERSITY OF KYIV
ISSN 1728-2667
ECONOMICS 3(198)/2018 Established in 1958
The research results on current problems of economic theory, insurance, risk management, reinsurance,
public administration, international economics, business economics, management, marketing, investment management, theory of finance, banking, statistics, the ways and means of solving these problems are released in the issue.
For researchers, practitioners, teachers and students. Представлено дослідження актуальних проблем економічної теорії, страхування, управління ризи-
ками, перестрахування, державного управління, міжнародної економіки, економіки підприємства, ме-неджменту, маркетингу, управління інвестиціями, теорії фінансів, банківської справи, статистики та шляхи й засоби розв'язання зазначених проблем.
Для наукових працівників, практиків, викладачів, аспірантів, студентів.
CHIEF EDITOR
Prof. Viktor Bazylevych (Ukraine)
EDITORIAL BOARD
Dr. Kharlamova Ganna (Executive Editor) (Ukraine); Prof. Aggelopoulos Stamatis Ch. (Greece); Prof. Alpas Hami (Turkey); Prof. Bachev Hrabrin (Bulgaria); Prof. Batzios Christos (Greece); Prof. Chernyak Oleksandr (Ukraine); Prof. Druteikiene Gretta (Lithuania); Prof. Grazhevskaya Nadezhda (Ukraine); Prof. Ignatyuk Angela (Ukraine); Prof. Kupalova Galyna (Ukraine); Prof. Lyutyy Igor (Ukraine); Prof. Moscardini Alfredo (UK); Prof. Nate Silviu (Romania); Prof. Naumenkova Svitlana (Ukraine); Prof. Pogorletskiy Alexandr (Russia); Prof. Polimenis Vassilis (Greece); Prof. Pikus Ruslana (Ukraine); Prof. Savaateev Alexey (Russia); Dr. Serbu Razvan Sorin (Romania); Dr. Stoica Eduard (Romania); Prof. Starostina Alla (Ukraine); Prof. Vitale Ksenia (Croatia); Prof. Van Rooijen Maurits (UK); Dr. Zarotiadis Grigoris (Greece); Prof. Zineldin Mosad (Sweden)
Editorial address 90-A, Vasyl'kivska str., room. 701, 808; Faculty of Economics, Taras Shevchenko National University of Kyiv, Kyiv, Ukraine, 03022, Kyiv, phone: +38 044 259-71-82; E-mail: [email protected] Web: http://bulletin-econom.univ.kiev.ua/index.php/en/
Approved by The Academic Council of the Faculty of Economics, Taras Shevchenko National University of Kyiv, Kyiv, Ukraine (Protocol #10 of 19th June 2018)
Accreditation The journal is in the List of specialized scientific publications, which are to publish the main results of dissertations in Economic Sciences (Resolution of the Presidium of HAC of Ukraine # 241 of 09.03.2016)
Registration SRSU. Registration certificate KV No. 19866-9666PR dated 29.04.13
Publisher Taras Shevchenko National University of Kyiv, Kyiv, Ukraine Publishing center "Kyiv University". DK №1103 of 31.10.02
Address of publisher 01601, Kyiv-601, Boulevard Shevchenko, 14, room. 43 : +38 044 239-31-72, +38 044 239-32-22; fax: +38 044 239-31-28
© Taras Shevchenko National University of Kyiv, Kyiv, Ukraine, Publishing center "Kyiv University", 2018
ЗМІСТ Башев Х.
Емпіричне дослідження зв'язку між управлінням та стійкістю в болгарському сільському господарстві ............................................................................................................................ 6
Беласку Л., Хоробет О., Поповичі О. Локальні атрибути країн, що розвиваються: аналіз використання основних компонент ............................................... 29
Бурнете С. Трансатлантична інтеграція: важливий стрибок до глобалізованого світу ..................................................................... 34
Думітреску Л., Фучі М., Горські Г. Упровадження нових маркетингових стратегій у контексті Інтернет-середовища: переваги, недоліки, статистика та тенденції ..................................................................................................................... 39
Глінковська Б., Чеботарьов Є., Чеботарьов В. Аналіз походження, сучасні характеристики та перспективи визначення профілю українського менеджера ..................................................................................................................................... 43
Iвохін Є., Aпанасенко Д., Навродський В. Про зведення виробничо-транспортної задачі до дворівневої задачі оптимізації та її застосування ....................................................................................................... 48
Харламова Г., Ставицький А., Нате С. Оцінка застосування відновлюваних джерел енергії в синергії з політикою Європейського Союзу .................................................................................................................................... 54
Лоулер К., Садік С.
Нестабільність обмінного курсу: емпіричне дослідження Держави Кувейт .................................................................... 66
Попа С. Вплив ордолібералізму в Європі ....................................................................................................................................... 69
Рімбу Г., Константинеску Л. Удосконалення соціальної ситуації для молоді в Європейському Союзі ....................................................................... 74
Тюркеш M., Константинеску Л., Топор Д. Порівняльний аналіз реалізації комерційних банківських груп: Туреччина та Румунія ................................................. 87
Васі Д., Іллє Л. Кореляції між показниками фінансової ефективності компаній з основною діяльністю в енергетичному секторі й суміжних галузях, що торгують на Бухарестській фондовій біржі, та індексом Bet-Ng ................................................................................ 95
Додаток 1 Анотація та література (латинізація) ............................................................................................................................... 101
Додаток 2 Інформація про авторів .................................................................................................................................................... 112

СОДЕРЖАНИЕ Башев Х.
Эмпирическое исследование связи между управлением и устойчивостью в болгарском сельском хозяйстве ....................................................................................................................................... 6
Беласку Л., Хоробет О., Поповичи О. Атрибуты местоположения стран с формирующиемся рынками: анализ с использованием основных компонент ............................................................................................................... 29
Бурнете С. Трансаталантическая интеграция: важный прыжок к глобализованному миру ............................................................. 34
Думитреску Л., Фучи M., Горски Г. Внедрение новых маркетинговых стратегий в контексте интернет-среды: преимущества, недостатки, статистика и тенденции ....................................................................................................... 39
Глинковска Б., Чеботарев Е., Чеботарев В. Анализ происхождения, современные характеристики и перспективы определения профиля украинского менеджера ...................................................................................................................................... 43
Ивохин Е., Aпанасенко Д., Навродский В. О сведении производственно-транспортной задачи к двухуровневой задаче оптимизации и ее применение ................................................................................................. 48
Харламова Г., Ставицкий А., Натэ С. Оценка применения возобновляемых источников энергии в синергии с политикой Европейского Союза ...................................................................................................................................... 54
Лоулер К., Садик С. Нестабильность обменного курса: эмпирическое исследование Государства Кувейт ................................................. 66
Попа С. Влияние ордолиберализма в Европе ................................................................................................................................ 69
Римбу Г., Константинеску Л. Совершенствование социальной ситуации для молодежи в Европейском Союзе ....................................................... 74
Тюркеш M., Константинеску Л., Топор Д. Сравнительный анализ реализации коммерческих банковских групп: Турция и Румыния .............................................................................................................................................................. 87
Васи Д., Илле Л. Корреляции между показателями финансовой эффективности компаний с основной деятельностью в энергетическом секторе и смежных отраслях, торгующих на Бухарестской фондовой бирже, и индексом Bet-Ng ................................................................................ 95
Приложение 1 Аннотация и литература (латинизация) .......................................................................................................................... 101
Приложение 2 Сведения об авторах ........................................................................................................................................................ 112

CONTENTS Bachev H.
An Empirical Study on Relations between Governance and Sustainability in Bulgarian Agriculture .......................................................................................................................................................... 6
Belascu L., Horobet А., Popovici O. Location Attributes of Emerging Economies: an Analysis Using Principal Components ...................................................... 29
Burnete S. Trans-Atalantic Integration: а Crucial Pace Toward а Globalized World .............................................................................. 34
Dumitrescu L., Fuciu M., Gorski H. Implementing New Marketing Strategies in the Context of the Online Environment – Advantages, Disadvantages, Statistics and Trends ............................................................................................................. 39
Glinkowska B., Chebotarov Ie., Chebotarov V. Analysis of the Origin, Modern Characteristics and Prospects of Determining the Profile of Ukrainian Manager .................................................................................................................. 43
Ivokhin E., Apanasenko D., Navrodskiy V. About Production-Transport Problem Reduction to the Two-Level Problem of Discrete Optimization and its Application ......................................................................................................................... 48
Kharlamova G., Stavytskyy А., Nate S. Estimation of Renewable Energy Sources Application in the Synergy with European Union Policy ..................................... 54
Lawler K., Sadiq S. Exchange Rate Volatility: an Empirical Study for State of Kuwait ......................................................................................... 66
Popa C. The Influence of Ordoliberalism in Europe ........................................................................................................................... 69
Rîmbu G., Constantinescu L. Improving Youths' Social Situation in the European Union ................................................................................................... 74
Turkes M. C., Constantinescu L., Topor D. Comparative Analysis of Banking Performance of Comercial Banks Groups. Case Study: Turkey vs. Romania ......................................................................................................................................... 87
Vasiu D., Ilie L. Correlations Between Financial Performance Indicators of Companies with Core Activity in the Energy Sector and Related Industries, Traded on Bucharest Stock Exchange, and the Bet-Ng Index ............................................................................................. 95
Annex 1 Extended abstract in English and References (in Latin): Translation / Transliteration / Transcription ................................ 101
Annex 2 Information about Authors (Meta-Data) .............................................................................................................................. 112

В И П У С К 3 ( 1 9 8 )
Bulletin of Taras Shevchenko National University of Kyiv. Economics, 2018; 3(198): 6-29 УДК 339.92 JEL classification: Q13, Q12, Q18, D23, E61, H23, L14, L22, L33, L51 DOI: https://doi.org/10.17721/1728-2667.2018/198-3/1
H. Bachev, Doctor of Sciences (Economics), Professor ORCID iD 0000-0003-0555-7468
Institute of Agricultural Economics, Sofia, Bulgaria
AN EMPIRICAL STUDY ON RELATIONS BETWEEN GOVERNANCE AND SUSTAINABILITY IN BULGARIAN AGRICULTURE
This paper applies the interdisciplinary New Institutional Economics framework, identifies diverse market, private, collective,
public and hybrid modes of governance and assesses their impact on agrarian sustainability in Bulgaria. First, the methodological framework of the study is outlined. After that dominating governing modes in Bulgarian farms of different juridical type, size, specialization, ecological and geographical location are identified, and their impacts on agrarian sustainability and its economic, social, and environmental pillars evaluated. In conclusion implications for further research, public policy improvement, and private managerial strategy formation are presented. Agricultural producers of different type use quite unlike mixture of effective market, private, collective and hybrid modes for governance of their activities and relations. Individual factors and modes most contributing to improvement of agrarian sustainability at the current stage of development are: manager's personal convictions and initiatives, farms resources and innovation potential, near future profit and benefits strategies, market prices levels and dynamics, area-based EU subsidies, and informal agreements.
Key words: Agrarian Governance, Sustainability, Market, Private, Collective, Hybrid modes, Bulgaria. Introduction. Achievement of diverse economic,
social, environment conservation, intergenerational, etc. goals of sustainable development greatly depend on the specific system of governance in different countries, industries, regions, communities, etc. (Furuboth E. and Richter R. [21], North D. [23], Williamson O. [29]). Having in mind the importance of agrarian sector (in terms of employed resources, contribution to individuals and social welfare, positive and/or negative impacts on environment, etc.), the improvement of the governance of agrarian sustainability is among the most topical issues in Bulgaria and around the globe: Bachev [5, 8], Bachev et al. [16], EC [20], Raman S. [24], Sauvenier X. et al. [25], Terziev D. and Radeva D. [26], UN [27, 28].
Nevertheless, research on forms and efficiency of the governance of agrarian sustainability is at the beginning stage due to the "newness" of the problem, and the emerging new challenges at the current phase of development (environmental pollution and degradation, climate change, competition for natural resources with other sectors, etc.), and the fundamental institutional modernization during recent years, and the "lack" of long-term experiences and relevant data, etc. Most studies in the area are focused on the formal modes and mechanisms while the important informal institutions and organizations are not included into analysis. What is more, research is commonly restricted to a certain form (contract, cooperative, industry initiative, public program), or a management level (farm, eco-system, region, international) without taking into consideration the interdependency, complementarities and/or competition of different governing structures. Besides, widely used complex forms of governance (multi-lateral, multi-level, reciprocial, interlinked, hybrid) are usually ignored.
Likewise, one-dimensional and uni-sectoral analyses are broadly used separating the management of agricultural activity from the governance of environmental and the overall households and rural activities. Furthermore, most studies concentrate on technology related ("production") costs ignoring significant transaction costs associated with the identification, assignment, protection, exchange and disputing of diverse property rights and rules. Moreover, "normative" (to some "ideal" or "model in other countries") rather than a "comparative institutional approach" (between feasible alternatives in the specific socio-economic and natural conditions of a country, region, sector, ecosystem) is employed. Furthermore, uni-disciplinary approach dominates ("pure
economic", "pure ecological", "pure juridical", "pure political", etc.) preventing a proper understanding of the driving factors ("logic") and the full consequences (multiple effects, costs, risks) of a particular governance choice. Consequently, a complete understanding and adequate assessment of the system of agrarian governance and its contribution to agrarian sustainability is impeded, and the effective assistance to public policy and private (individual and collective) strategy formation cannot be given by researchers and experts.
In Bulgaria, with very few exceptions (Bachev H. [1, 2, 3, 4], Bachev H. and Tsuji M. [12], Bachev H. and Kagatsume M. [13, 14], Bachev H. and Nanseki T. [15], Bachev H. and Terziev D. [18], Georgiev M. [22]), there are no empirical studies on dominating governing structures in agriculture, and their impact(s) on agrarian sustainability. In this paper interdisciplinary New Institutional Economics framework (combining Economics, Organization, Sociology, Law, Political and Behavioral Sciences) is incorporated, and the impact of diverse private, collective, public and hybrid modes of governance on agrarian sustainability at the current stage of development in Bulgaria assessed. First, the methodological framework of the study is outlined. After that dominating governing modes in Bulgarian farms of different juridical type, size, specialization, ecological and geographical location are identified, and their impacts on agrarian sustainability and its economic, social, and environmental pillars evaluated. In conclusion implications for further research, public policy improvement, and private managerial strategy formation are presented.
Framework of Analysis. Maintaining and improving the social, economic and ecological functions of agriculture requires an effective social order (a "good governance") – a system of "human created" mechanisms and forms regulating, coordinating, stimulating, and controlling behaviors, actions and relations of individual agents at different levels [4]. The system of governance of agrarian sustainability is a part of the specific system of "agrarian" governance and includes: diverse agrarian and non-agrarian agents, and a variety of mechanisms and forms for governing of behavior, activity, relations, and impacts of related agents.
The individual farms are the main organizational and production units in agriculture, which manage resources, technologies and activity, and maintain social, economic and ecological functions of the sector. Thus, farms and farm (production, service, innovation, marketing, etc.) organizations are the major elements of the system of
© Bachev H., 2018
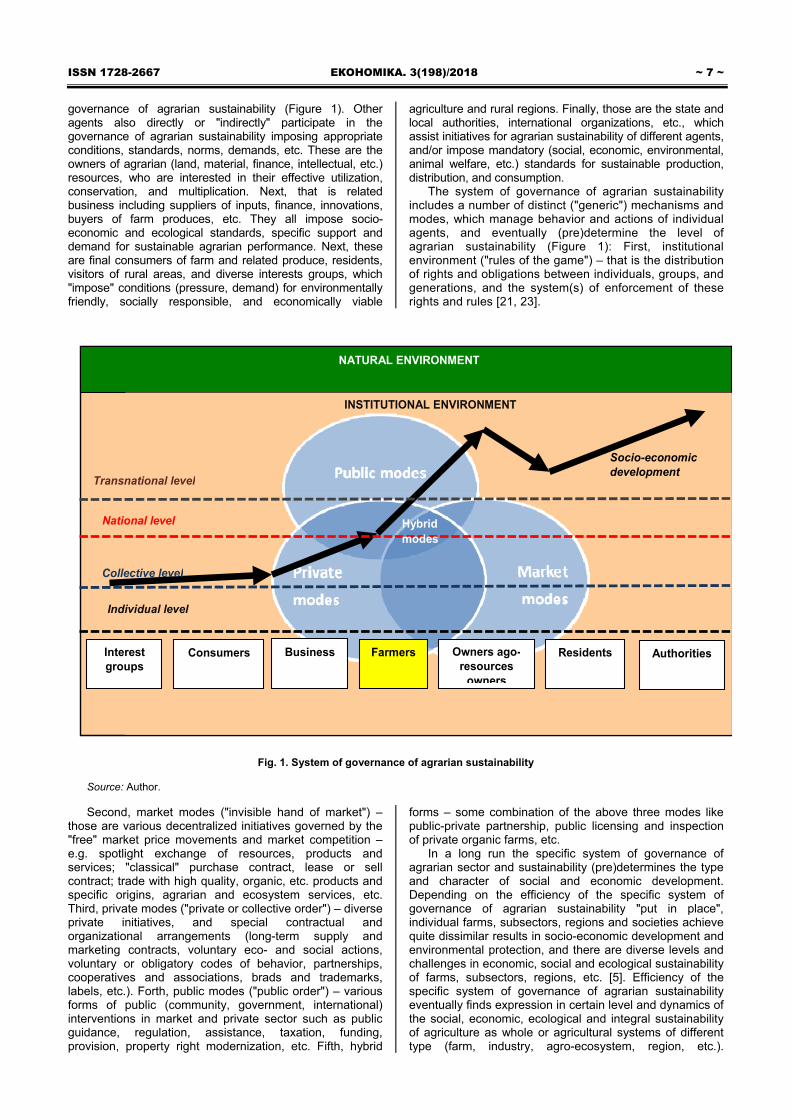
ISSN 1728-2667 ЕКОНОМІКА. 3(198)/2018 ~ 7 ~ governance of agrarian sustainability (Figure 1). Other agents also directly or "indirectly" participate in the governance of agrarian sustainability imposing appropriate conditions, standards, norms, demands, etc. These are the owners of agrarian (land, material, finance, intellectual, etc.) resources, who are interested in their effective utilization, conservation, and multiplication. Next, that is related business including suppliers of inputs, finance, innovations, buyers of farm produces, etc. They all impose socio-economic and ecological standards, specific support and demand for sustainable agrarian performance. Next, these are final consumers of farm and related produce, residents, visitors of rural areas, and diverse interests groups, which "impose" conditions (pressure, demand) for environmentally friendly, socially responsible, and economically viable
agriculture and rural regions. Finally, those are the state and local authorities, international organizations, etc., which assist initiatives for agrarian sustainability of different agents, and/or impose mandatory (social, economic, environmental, animal welfare, etc.) standards for sustainable production, distribution, and consumption.
The system of governance of agrarian sustainability includes a number of distinct ("generic") mechanisms and modes, which manage behavior and actions of individual agents, and eventually (pre)determine the level of agrarian sustainability (Figure 1): First, institutional environment ("rules of the game") – that is the distribution of rights and obligations between individuals, groups, and generations, and the system(s) of enforcement of these rights and rules [21, 23].
NATURAL ENVIRONMENT
INSTITUTIONAL ENVIRONMENT
Interest groups
Consumers Business Farmers Owners ago-resources
owners
Residents Authorities
Individual level
Collective level
National level
Transnational level
Hybrid modes
Socio-economic development
Fig. 1. System of governance of agrarian sustainability
Source: Author. Second, market modes ("invisible hand of market") –
those are various decentralized initiatives governed by the "free" market price movements and market competition – e.g. spotlight exchange of resources, products and services; "classical" purchase contract, lease or sell contract; trade with high quality, organic, etc. products and specific origins, agrarian and ecosystem services, etc. Third, private modes ("private or collective order") – diverse private initiatives, and special contractual and organizational arrangements (long-term supply and marketing contracts, voluntary eco- and social actions, voluntary or obligatory codes of behavior, partnerships, cooperatives and associations, brads and trademarks, labels, etc.). Forth, public modes ("public order") – various forms of public (community, government, international) interventions in market and private sector such as public guidance, regulation, assistance, taxation, funding, provision, property right modernization, etc. Fifth, hybrid
forms – some combination of the above three modes like public-private partnership, public licensing and inspection of private organic farms, etc.
In a long run the specific system of governance of agrarian sector and sustainability (pre)determines the type and character of social and economic development. Depending on the efficiency of the specific system of governance of agrarian sustainability "put in place", individual farms, subsectors, regions and societies achieve quite dissimilar results in socio-economic development and environmental protection, and there are diverse levels and challenges in economic, social and ecological sustainability of farms, subsectors, regions, etc. [5]. Efficiency of the specific system of governance of agrarian sustainability eventually finds expression in certain level and dynamics of the social, economic, ecological and integral sustainability of agriculture as whole or agricultural systems of different type (farm, industry, agro-ecosystem, region, etc.).
~ 8 ~ В І С Н И К Київського національного університету імені Тараса Шевченка ISSN 1728-3817 Accordingly, a high or increasing agrarian sustainability means a high efficiency of the system of governance, and vice versa. Agrarian sustainability is defined in a number of ways and still there is no agreement about what agrarian sustainability is and how to evaluate its level [24, 25]. In this paper sustainability is understood as a "system characteristic" and the ability of agriculture to maintain its economic, ecological and social functions over a long period of time. Agrarian sustainability and its individual aspects have multiple dimensions. In order to assess the efficiency of the governance a holistic system for assessing the social, economic, ecological and integral sustainability is applied, presented in other publications [8, 10, 11, 16].
For identification and assessment of diverse market, private, collective, hybrid, etc. modes of governance and its impact on agrarian sustainability in Bulgarian agriculture, its major subsectors, in various geographical and ecological regions, as well as sustainability contribution of farms of different juridical type and size, in-depth interviews have been carried out with the managers of "representative" market-oriented farms of different kind and location. The study was carried out in the summer of 2017 and comprised 40 agricultural holdings from four administrative regions of the country – North-Central, South-East, South-Central, and South-West. Identification of the "typical" for the particular regions agricultural farms have been made with the assistance of the major producers associations in the country (National Union of Agricultural Cooperatives, National Association of Grain Producers, Association of Livestock Raring, etc.), state agencies (National Agricultural Advisory Service, Executive Agency on Vine and Wine), processors, bio-certifying, and service providing organizations, and local authorities.
Agricultural producers of different type have been interviewed as entire spectrum of the farms in respective regions included: farms of major juridical types (Physical Persons, Sole Traders, Cooperatives, Companies); holdings with different sizes (Predominately for subsistence, rather Small for the sector, with Middle size for the sector, Large for the sector); farms of different production specialization (Field crops, Vegetables, Flowers, and Mushrooms, Permanent crops, Grazing Livestock, Pigs, Poultry, and Rabbits, Mix crop-livestock, Mix crops, Mix livestock); enterprises which are (vertically and/or horizontally) integrated in more complex forms such as Corporations, Holdings, etc.; farms in specific geographical and ecological locations (Plain, Semi-mountainous, and Mountain regions, less-favorable and protected areas, etc.). From initially selected 45 holdings for investigation the interviews with five managers (11,11% of total) have not been carried out because of the lack of availability, unwillingness to participate, or other reasons. The structure and the specific features of surveyed farms approximately correspond to the real structure of all farms in the studied regions.
The survey comprises multiple questions associated with the usage and the impact of diverse components of governing system (personal preferences, resource endowment, specific managerial strategies, applied contractual and collective forms, participation in public support schemes, community and counterparts initiatives and pressure, etc.) on agrarian sustainability, and its social, economic and environmental aspects. Initially the
managers assessed the impact of each particular governing mode as "positive", "neutral", or "negative". After that, the relations between the "estimates" of the managers for the efficiency of governing modes, and the sustainability level of respective farms are specified. The integral estimates are arithmetic averages of the assessments of individual farms of a particular type.
The assessment is based on first-hand data collected from the managers of "typical" farms of different type and location. That approach is only feasible since there are no available "objective" statistical, monitoring, survey, etc. information about the employed (preferred, failed) governing modes, and the impact of a particular element of the governing system on agrarian sustainability. Besides, the farm managers are the most aware with the "efficiency" of dominating governance mechanisms and modes, and its relation (timing, direction, and extent of the effect) to agrarian sustainability in the specific conditions of their own farm, region, subsector, etc. Besides, when there is available aggregate data for certain mode(s) of governance (e.g. particular type of contract, public regulation or support schemes, etc.) there is no way to know how they contribute to sustainability since "rational" agents adapt modes maximizing their efficiency (minimizing private costs, maximizing private benefits) which may or often fail to maintain/improve the overall efficiency and sustainability [4, 5]. Furthermore, for certain data the farm managers are the sole or only reliable source of information – e.g. personal ideology, preferences, and satisfaction, interlinked and complex forms, widespread informal modes, level of sensibility and adaptation to outside pressure and demand, etc. Nevertheless, in order to diminish subjectivity, the assessments ("perceptions") of the managers is complemented with the "objective" assessment of sustainability level of their farms, and the correlation determined between the managers' estimates on the importance of a particular governing mode and the actual sustainability level.
Results and Discussion. Our surveyed has found out that, for all managers their "own personal conviction and initiatives" are important positive factor for maintaining and improving agrarian sustainability and its dimensions (Figure 2). Understandings, skills, and targeted actions of the agrarian entrepreneurs and managers of farms of all juridical types, sizes, production specialization, ecological and geographical locations, are a key factor for accomplishing socio-economic and environmental aspects of agrarian sustainability.
At the same time, merely a quarter of the managers indicates, that the "personal conviction and initiatives of workers" is a positive factor for agrarian sustainability (Figure 2). The latter is important for innovating enterprises of different type, which rely on and create conditions for involvement of all workers in improvement of farm activity and agrarian sustainability – selection of qualified stuff, continuing training, freedom to apply and experiment initiatives, delegation of management and responsibilities, strong incentives, output based compensation, etc. However, for the biggest part of Bulgarian farms the hired labor does not have needed quality, freedom, and/or motivation and contribute little to amelioration of agrarian sustainability.

ISSN 1728-2667 ЕКОНОМІКА. 3(198)/2018 ~ 9 ~
Fig. 2. Impact of private, collective and hybrid factors, forms and strategies on agrarian sustainability in Bulgaria (percent)
Source: Interviews with managers of farms, 2017. Available and accessible resources and innovations are
essential factors for effective and sustainable development. According to three quarters of the managers of surveyed holdings existing "resource and innovation potential of the farm" contribute positively to agrarian sustainability and its individual aspects (Figure 2). The majority of farmers appreciate highly the significance of that factor and believe that their holding possesses necessary human, land, material and intellectual resources for achieving socio-economic and environmental goals of agrarian sustainability. Commonly, the control on "critical" for the farm resources are secured through internal governance (acquiring ownership, permanent labor contract, etc.) or external collective or leading organization (cooperative, association, holding, etc.). More "mobile" resources are governed through long-term lease contracts, while for the "universal" assets and products it is relied on market modes.
Nevertheless, 15% of the surveyed farms assess as negative the effect of their insufficient resource and innovation potential for the needs of sustainable development. Many farms with a smaller size, with lower public support, and poor regions of the country do not have sufficient own resources and innovations, neither access to external sources for effective and sustainable operations. On the other hand, every tenth manager does not suggest that existing resource and innovation potential of the farm is important for agrarian sustainability and some of its aspects. For that portion of the farmers, for the accomplishment of socio-economic and environmental sustainability are more important personal conviction, skills and strategies of the farmers, public stimulation, regulation and support policies, etc., rather than currently available resources.

~ 10 ~ В І С Н И К Київського національного університету імені Тараса Шевченка ISSN 1728-3817
The farms of different type and sizes, subsectors and locations are with unequal potential of own and external resources and innovations for successful implementation of sustainable development strategies. The greatest share of holdings with existing resources and innovation potential for sustainable development are among Sole Traders (87,5%) and Companies (81,82%), farms with Middle
(85,71%) and Big (100%) sizes, holdings specialized in Grazing livestock (100%), Mix livestock (100%), and Permanent crops (90%), and located in Plain regions (81,25%) and Less-favored non-mountainous regions (100%) as well as in South-East (85,71%) and North-Central (80%) regions of the country (Figure 3).
Fig. 3. Positive impact of farm's resource and innovation potential on agrarian sustainability in Bulgaria (percent)
Source: Interviews with managers of farms, 2017. The smallest number of farms with effective resource
and innovation potential for sustainable development are among Cooperatives (50%), holdings Predominately for subsistence (33,33%) and Small size (60%), and producers specialized in Pigs, Poultries and Rabbits (50%), Field crops and Mix crops (by 60%), as well as farms located in Mountainous regions (66,67%), with Lands in protected zones and territories (60%), and in South-Central region of the country (70,59%).
Strategies with a different time horizon to a different extent contribute for maintaining and achieving agrarian sustainability. For instance, realization of some economic objectives and most environmental and social goals of sustainable development often requires continuous long-term efforts and investments from participating agents. According to the majority of surveyed managers (60%) "current profit and benefits" are a substantial factor, which affect positively the governance of agrarian sustainability and its main aspects (Figure 2). Simultaneously, the rest significant part of the managers (37,5%) evaluate the importance of that type of strategy as neutral in relation to agrarian sustainability and its individual dimensions. The latter know that orientation of activity and efforts solely to present profit and benefits little contribute to agrarian sustainability and its aspects.
The best fraction of surveyed farms (87,5%) believes that "profit and benefits in near future" are important factors favorable for sustainable agriculture (Figure 2). The majority of managers are convinced that realization of the diverse socio-economic and environmental goals of agrarian sustainability requires longer-term efforts, and therefore undertake such managerial strategies. Only a tiny portion of questioned (2,5%) evaluate that orientation toward near future profit and benefits is negative in relation to agrarian sustainability and its aspects. Besides, every tenth manager thinks that undertaking a "short-term" strategy aimed merely at profit and benefits in near future is a neutral factor not contributing significantly to agrarian sustainability and its socio-economic and environmental aspects.
A relatively smaller segment of the Bulgarian farms applies strategies oriented to profit and benefits in a long-term (which are actually the means for achieving and maintaining agrarian sustainability). One considerable part of all surveyed managers (45%) assess as positive for agrarian sustainability and its main aspects directing the farm activity toward "profit and benefits in a longer-term" (Figure 2). Only a small portion of holdings (5%) suggests that such strategy for profiting and benefiting in a longer-term is negative for agrarian sustainability. At the same time, every another farm evaluates as neutral in relation to agrarian sustainability and its aspects the strategy for profit and benefits in a longer-term.
All these demonstrates that the best part of the Bulgarian farms does not direct their activities for achieving the long-term goals of socio-economic development of the sector, but are oriented toward specific goals in shorter time horizons. Many holdings are forced to direct their efforts toward immediate benefits in current period or in near future because of the necessity for "economic survival" in the conditions of intensive competition. Numerous farms are less interested in or able for long-term investments for improving its economic viability, social responsibility, and environmental stewardship. According to many interviewed presidents of Cooperatives "the young generation does not care for the future" and future development of the cooperative farms is associated with a great uncertainty. It is well-known that similar type of (short-term) private farming strategies does not correspond to (long-term) governance needs of sustainable development. That further necessitates the intervention of a "third party "(the state, local authority, private, non-governmental and international organizations, etc.) for effective achievement of agrarian sustainability.
Effective contribution of the various types of farms through long-term strategies for agrarian sustainability is quite different. In the greatest extent strategies directed to longer-term profit and benefits are applied by the firms of different type – Companies (63,64%) and Sole Traders (62,5%) as well as holdings with Big sizes (62,5%)

ISSN 1728-2667 ЕКОНОМІКА. 3(198)/2018 ~ 11 ~ (Figure 4). All these farms have greater financial and overall capabilities for long-term investments for agrarian sustainability, stronger incentives (goal) for development of the firm, and evaluate as positive the orientation of efforts toward long-term benefits. On the other hand, relatively smaller parts of the Cooperative farms (16,67%), Physical Persons (33,33%), holdings with Small size (26,67%) and Predominately for subsistence (33,33%) employ strategies
for long-term profit and benefits. The latter is caused by the lack of funding, strive to survival in the conditions of low efficiency and high competition as well as the typical for these kind of farms short investment horizon due to the advance age of farmers, lack of successor ready to take up the farm, impossibility to trade unregistered farms or cooperative shares, low rent and lack of dividend for cooperative shares, etc.
Fig. 4. Positive impact of strategy, oriented to profit and benefits in longer-term, on agrarian sustainability in Bulgaria (percent)
Source: Іnterviews with managers of farms, 2017. Toward long-term profit and benefits orient their
strategies most of the farms specialized in Permanent crops (80%), Mix livestock (100%), and Grazing livestock (66,67%). Those are predominately productions, requiring long-term investments and commonly "paying back" in longer periods of time. On the other hand, in productions with a rapid return on investments the long-term profit and benefits are to a lesser extent a factor for the strategy formation. Neither of producers in the Field crops and Pigs, Poultries and Rabbits assess as positive such a strategy, while in the Vegetables, Flowers and Mushrooms only a quarter of them. Obviously, these types of strategies little contribute to improvement of the social and environmental aspects of agrarian sustainability.
Similarly, in the regions with natural handicaps a relatively larger share of the managers assesses as positive the strategy oriented towards long-term profit and benefits – accordingly 75% in Less-favored non-mountainous regions and 57,14% in Less-favored mountainous regions. At the same time, in Plain-mountainous regions solely a third of the agricultural producers apply long-term strategies for agrarian sustainability. In different geographical regions approximately similar portions of the farms (around 40-43%) implement long-term strategies for governing of agrarian sustainability. Only holdings in South-west region are exceptions where favorable effects of long-term strategies for diverse aspects of agrarian sustainability are appreciated to a greater extent (58,92%).
Received benefits from other persons and groups from the farm activity are important (social and environmental) aspects of agrarian sustainability. Our survey has found out that, merely for 10% of interviewed managers the "immediate benefits for other persons and groups" are a positive factor for directing of activity (Figure 2). Such objectives are predominately important for the agricultural cooperatives, for which in addition to the members and workers, benefits are particularly of significance (or at least so declared) for farm households and rural communities as
well. However, for a remaining greater portion of the farms the immediate benefits for other persons and groups, are not parts of strategies and has no importance (neutrality) in relation to agrarian sustainability.
Diversification of activity is an important strategy for amelioration of socio-economic and environmental sustainability in agriculture. That mode of management of agrarian sustainability is widely practiced by the Bulgarian farmers as well. According to 30% of questioned managers they implement a strategy for "diversification of activity in the farm" affecting positively the agrarian sustainability and its aspects (Figure 2). Many farms produce several products and services for better utilization of available land and other resources, application of effective agro-technics (crop rotation) and protection of natural environment, reduction of risk from climate and market prices variation, using free machinery (providing mechanization and other services), etc. At the same time, none of the holdings considers as negative for the agrarian sustainability the diversification of activity within the farm boundaries.
Nevertheless, most of the surveyed farms employ another more effective strategy – for specialization of activity in one or more products. For 70% of the managers the diversification of activity in the farm has no effect (neutral) on agrarian sustainability and its different aspects. A greater specialization allows exploration of economies of sizes and scopes, increasing productivity, investing in specialized skills and technologies, more efficient marketing (selling a single product in large volumes, negotiation of better prices, reputation building, establishing supply chain networks, etc.).
Many examples have been found among surveyed farmers of "experimenting" in production diversification in search for higher benefits, and depending on the outcome it is either given up or entered in the new productions. For instance, a strawberry producer invested in a large-scale potato production, while a livestock farmer experimented in open vegetable operation, but after realized losses both producers abandoned diversification strategy. Similarly, a

~ 12 ~ В І С Н И К Київського національного університету імені Тараса Шевченка ISSN 1728-3817 cooperative and a farm tried with rapeseed or field vegetables (the latter quit due to a lack of profitability), another farmer is experimenting on the part of lands with organic production to test the efficiency and take advantage of provided public subsidies, etc. Many cooperatives sell yields immediately after harvesting and lose from not-waiting the best prices. Here diversification into grain storage is unbeneficial both temporary storing at farm (destructions by birds, rodents, bad weather, etc.) as well as long-term renting of external warehouses (a high price of 1 stotinka per kg).
Farms of different type, production specialization and location, to a various extent take advantage of the favorable effect of the diversification within the farm. To a greatest extent the diversification in the farm is employed and appreciated as positive for agrarian sustainability by the Companies (36,33%) and every third of the Cooperatives and Physical Persons (Figure 5). At the same time, most of the Sole Traders widely practice product specialization, and only 12,5% of them suggest that diversification in the farm is a positive factor for agrarian sustainability.
Fig. 5. Positive impact of diversification of activity in the farm on agrarian sustainability in Bulgaria (percent)
Source: Іnterviews with managers of farms, 2017. Our survey has also found out that to a greatest extent
the diversification of activity within the farm is applied by the holdings with a Big for the sector size (62,5%). That type of farms possesses bigger capability for seeking benefits in many directions, incentives for distribution of risk, and agro-technological necessity for certain diversification for effective utilization of resources (land, labor, machinery) and environmentally friendly agriculture (needs for crop rotation). On the other hand, smaller farms to a lesser extent appreciate as positive the implementation of strategies for intra-farm diversification – only a fifth of holdings with Small sizes and 21,43% of those with Middle sizes. Every third holding Predominately for subsistence diversifies its activity in the farm for a greater satisfaction of its divers needs of agricultural products and better utilization of family resources.
To the greatest extent diversification within the borders of the farm is implemented by holdings specialized in Mix livestock (all of them), and Mix crop-livestock orientation (60%). Simultaneously, none of the farms in highly specialized production like Vegetables, Flowers and Mushrooms, and in Pigs, Poultries and Rabbits applies product specialization in the farm. Relatively to a lesser extent that strategy is employed in the sectors Field crops and Mix crops – merely 20% of holding. A greater share of the farms, located in Mountainous regions (44,44%), in Less-favored non-mountainous regions (every other one), and with Lands in protected zones and territories (40%) implement diversification within the farm for improving agrarian sustainability. Most part of farms in Plain regions (three quarters) and Plain-mountainous regions (73,33%) as well as in Less-favored mountainous regions (71,43%) do not believe that diversification of activity in the farm is an effective strategy for enhancing agrarian sustainability. All these farms aim at specialization in particular product/s for increasing productivity of limited agrarian resources in such regions. To the greatest extent are diversified farms in
South-East region of the country (57,14%), while none of the holdings in the North-Central region assess as positive that type of strategy in relation to agrarian sustainability.
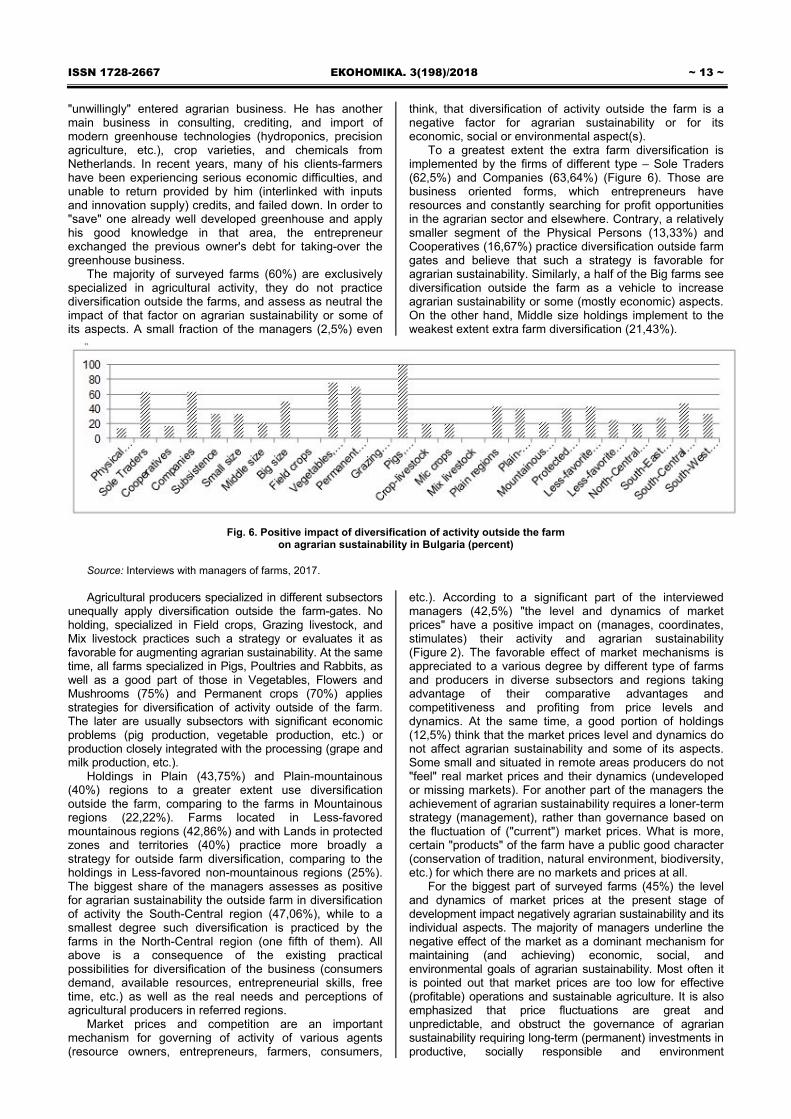
Diversification of activity outside of the farm is another feasible strategy for improving efficiency and elevating agrarian sustainability. It gives possibility for specialization in the farm for achieving maximum productivity (efficiency) of agrarian resources, while simultaneously it is looked for new opportunities in related to agriculture (such as processing, marketing, supply of services, agro-tourism, restaurant, eco-system services, etc.) and/or unrelated activities (other industries, services) for assuring employment, additional income, profit, risk sharing, etc. outside the farm gates. A good portion of interviewed managers (37,5%) practice a strategy for diversification of activity outside the farm and evaluate its impact on agrarian sustainability as positive (Figure 2). A good fraction of holdings diversifies into farm produce processing (vine, dairy, etc.) or marketing (own shops, labels, trademarks, etc.), while others point out a great variety of other activities (inputs and technology supply for green houses, hotel and hospitality, transportation, mountain tourism, etc.).
Our study has also found out that many individuals and households, having another major (non-agrarian) business or temporary available resources (free time, unemployment, students, own farmland, etc.) "diversify" into farming activity in order to increase family incomes or utilize free resources. Those are mainly younger entrepreneurs with a successful (or developing) family business in other sectors of the economy (hotel, fitness club, mountain tourism, etc.) who invested in agrarian sphere (production of snails, strawberries, etc.). Some of them get involved in the activity and/or management of existing family farms (of parents, relatives) in order to take advantage of different forms of public support such as assistance to young farmers, etc. A manager of a modern vegetable greenhouse has been also interviewed, who
ISSN 1728-2667 ЕКОНОМІКА. 3(198)/2018 ~ 13 ~ "unwillingly" entered agrarian business. He has another main business in consulting, crediting, and import of modern greenhouse technologies (hydroponics, precision agriculture, etc.), crop varieties, and chemicals from Netherlands. In recent years, many of his clients-farmers have been experiencing serious economic difficulties, and unable to return provided by him (interlinked with inputs and innovation supply) credits, and failed down. In order to "save" one already well developed greenhouse and apply his good knowledge in that area, the entrepreneur exchanged the previous owner's debt for taking-over the greenhouse business.
The majority of surveyed farms (60%) are exclusively specialized in agricultural activity, they do not practice diversification outside the farms, and assess as neutral the impact of that factor on agrarian sustainability or some of its aspects. A small fraction of the managers (2,5%) even
think, that diversification of activity outside the farm is a negative factor for agrarian sustainability or for its economic, social or environmental aspect(s).
To a greatest extent the extra farm diversification is implemented by the firms of different type – Sole Traders (62,5%) and Companies (63,64%) (Figure 6). Those are business oriented forms, which entrepreneurs have resources and constantly searching for profit opportunities in the agrarian sector and elsewhere. Contrary, a relatively smaller segment of the Physical Persons (13,33%) and Cooperatives (16,67%) practice diversification outside farm gates and believe that such a strategy is favorable for agrarian sustainability. Similarly, a half of the Big farms see diversification outside the farm as a vehicle to increase agrarian sustainability or some (mostly economic) aspects. On the other hand, Middle size holdings implement to the weakest extent extra farm diversification (21,43%).
Fig. 6. Positive impact of diversification of activity outside the farm on agrarian sustainability in Bulgaria (percent)
Source: Interviews with managers of farms, 2017. Agricultural producers specialized in different subsectors
unequally apply diversification outside the farm-gates. No holding, specialized in Field crops, Grazing livestock, and Mix livestock practices such a strategy or evaluates it as favorable for augmenting agrarian sustainability. At the same time, all farms specialized in Pigs, Poultries and Rabbits, as well as a good part of those in Vegetables, Flowers and Mushrooms (75%) and Permanent crops (70%) applies strategies for diversification of activity outside of the farm. The later are usually subsectors with significant economic problems (pig production, vegetable production, etc.) or production closely integrated with the processing (grape and milk production, etc.).
Holdings in Plain (43,75%) and Plain-mountainous (40%) regions to a greater extent use diversification outside the farm, comparing to the farms in Mountainous regions (22,22%). Farms located in Less-favored mountainous regions (42,86%) and with Lands in protected zones and territories (40%) practice more broadly a strategy for outside farm diversification, comparing to the holdings in Less-favored non-mountainous regions (25%). The biggest share of the managers assesses as positive for agrarian sustainability the outside farm in diversification of activity the South-Central region (47,06%), while to a smallest degree such diversification is practiced by the farms in the North-Central region (one fifth of them). All above is a consequence of the existing practical possibilities for diversification of the business (consumers demand, available resources, entrepreneurial skills, free time, etc.) as well as the real needs and perceptions of agricultural producers in referred regions.
Market prices and competition are an important mechanism for governing of activity of various agents (resource owners, entrepreneurs, farmers, consumers,
etc.). According to a significant part of the interviewed managers (42,5%) "the level and dynamics of market prices" have a positive impact on (manages, coordinates, stimulates) their activity and agrarian sustainability (Figure 2). The favorable effect of market mechanisms is appreciated to a various degree by different type of farms and producers in diverse subsectors and regions taking advantage of their comparative advantages and competitiveness and profiting from price levels and dynamics. At the same time, a good portion of holdings (12,5%) think that the market prices level and dynamics do not affect agrarian sustainability and some of its aspects. Some small and situated in remote areas producers do not "feel" real market prices and their dynamics (undeveloped or missing markets). For another part of the managers the achievement of agrarian sustainability requires a loner-term strategy (management), rather than governance based on the fluctuation of ("current") market prices. What is more, certain "products" of the farm have a public good character (conservation of tradition, natural environment, biodiversity, etc.) for which there are no markets and prices at all.
For the biggest part of surveyed farms (45%) the level and dynamics of market prices at the present stage of development impact negatively agrarian sustainability and its individual aspects. The majority of managers underline the negative effect of the market as a dominant mechanism for maintaining (and achieving) economic, social, and environmental goals of agrarian sustainability. Most often it is pointed out that market prices are too low for effective (profitable) operations and sustainable agriculture. It is also emphasized that price fluctuations are great and unpredictable, and obstruct the governance of agrarian sustainability requiring long-term (permanent) investments in productive, socially responsible and environment

~ 14 ~ В І С Н И К Київського національного університету імені Тараса Шевченка ISSN 1728-3817 preservation production. Moreover, the lack of any prices and markets for some of the socially important (public, quasi-public, collective, quasi-private, etc.) products and services of the farms (like conservation, improvement and restoration of natural resources and ecosystems) fail to induce sufficient incentives for effective actions in such directions.
The negative impact of the market prices level and dynamics on agrarian sustainability to a greatest extent affects Sole Traders (62,5%) and Physical Persons (46,67%), farms with Small and Middle sizes (60% and 42,86% accordingly), holdings specialized in Vegetables, Flowers, and Mushrooms (75%), Grazing livestock (66,67%), and Mix livestock (100%), farms located in Mountainous regions (66,67%) and with Lands in protected zones and territories (80%), as well as in North-Central region of the country (60%) (Figure 7). To the smallest extent the market prices level and dynamics negatively
impact the Cooperatives (one third) and Companies (36,36%), Big farms (a quarter) and holdings Predominately for subsistence (every third), producers specialized in Field crops (every fifth) and Permanent crops (30%), farms located in Plain regions (3,25%) and in Less-favorite non-mountainous regions (25%), as well as in South-Central region of the country (41,18%).
Effective realization (marketing) of farm products and services is an essential factor for agrarian sustainability and for economically viable, socially stable, and environmentally friendly agriculture. In order to benefit from market opportunities and safeguard against market risks (low prices, price fluctuations, contractual asymmetry, likely opportunism, delayed payment, etc.) agricultural producers use and/or develop diverse effective forms of marketing of farm produce.
Fig. 7. Negative impact of level and dynamics of market prices on agrarian sustainability in Bulgaria (percent)
Source: Interviews with managers of farms, 2017. "Direct retail sale of products and services" is practiced
as an effective form of marketing by 32,5% of surveyed farms (Figure 2). Those are holdings with different sizes, specialization, and location, for which direct sales are highly efficient due to superior "retail" prices, low costs for direct marketing (on farm or local farm market), low risk for opportunism, etc. Usually, those are producers with smaller sizes, having small volume of production and sales, loyal clients in the region and/or good location (proximity to highway, resort, large consumer center), seasonable and high quality products with a big demand (fresh fruits and vegetables, lamb meat, eco-products). In some cases, agricultural produce is sold "in package" with another service and it is profited from the interlinked retail marketing – e.g. self-pick up of farm produce by client, serving of produced fresh or processed produces in own restaurant, etc.). Many of the biggest vertically integrated agricultural producers (vine growing and wine producing complexes and vineries, dairy and meat processors with own livestock, etc.) possess own brand shops for direct retail sale of final products in the region and/or big cities.
None of the surveyed managers believes that such mode of marketing affects negatively agrarian sustainability. Simultaneously, for the majority of Bulgarian farms (67,5%) direct retail sale output does not have significant importance for the governance of agrarian sustainability or some of its aspects. The greatest portion of the Bulgarian farms uses other (more efficient) forms for realization of farm produce. Most of the surveyed farms (57,5%) widely practice "direct wholesale" of output and evaluate its impact as positive on agrarian sustainability (Figure 2). Those are bigger producers of different type
having sufficient volumes and product standardization. The sale commonly is negotiated and implemented directly on farm (field) as most frequent buyers are large processors, retail chains, middlemen, exporters, etc. A considerable fraction of all farms in the country (40%) does not apply direct wholesale or do not believe that mode is having a significant importance for agrarian sustainability and some of its aspects. On the other hand, only a tiny fraction of the agricultural producers think that the direct wholesale marketing is not an effective form, mostly for the economic sustainability of agriculture due to lower prices and profit.
The "sale on wholesale and commodity markets" is not a popular form for realization of produced output in Bulgarian farms. For the great majority of surveyed farms (92,5%) that mode is not essential for agrarian sustainability and its all aspects (Figure 2). Simultaneously, for a small proportion of holdings (7,5%) possibility to trade on wholesale and commodity markets is a positive factor in the governance of agrarian sustainability. The latter considers predominately the economic aspect of sustainability for which "discovery" of actual (competitive) market prices through sale on official wholesale or commodity market is a crucial factor for maximum marketing efficiency.
The "sale contract for products and services" is another major mode for governing of marketing of farm produce. According to more than a half of the surveyed managers (52,5%) they often use a sale contract and it affects positively agrarian sustainability (Figure 2). Farms commonly deal with several buyers for securing a successful marketing and maximizing revenues. The contract for purchase, sale, or marketing is an important

ISSN 1728-2667 ЕКОНОМІКА. 3(198)/2018 ~ 15 ~ means for planning of realization of output and sale prices. That form is applied by commercial farms of different type, product specialization and location as primary a one year or a yield contact are used. A short-term contract form usually is a policy and requirement of big buyers (processors, food-chains, middlemen, exporters) or preferred by farmers. Very often farmers wish to preserve freedom in order to be able to change a buyer during the next season in case of unsatisfactory (low) prices, delayed payment for product, lack of complementary (crediting, interlinked services, etc.) benefits, change in structure of activity, emergence of a favorable new partner and/or more-effective marketing channel, etc.
Only a tiny segment of holdings (2,5%) assess as positive in regard to agrarian sustainability utilization of the sale contract for product and services. That is mostly in the cases, when farmers face a small number of gig buyers (situation of quasi or full monopoly) imposing unfavorable contract prices, conditions and/or not complying with negotiated terms and compensating affected farms. Frequently smaller producers are not able to comply with requirements of the buyers for certain volumes, timing and regularity of supply, produce quality, variety structure, etc. In other cases, the contract does not include payment for unsold by the retailer products which is returned to the farmer (fresh vegetables and fruits) additionally diminishing the profit for agricultural producers. A good part of the Bulgarian holdings (45%) does not employ the contact form for output realization and consider that mode as important for agrarian sustainability or its individual dimensions.
The majority of surveyed farms (85%) does not practice barter "exchange of products and services for other products and services" and think that governance mode has a significant importance in relation to agrarian sustainability (Figure 2). Similarly, for none of the holdings, such natural exchanges represent a negative factor for agrarian sustainability and some of its aspects. A small portion of the farms believe that product and service exchanges for other products and services have a positive impact on agrarian sustainability. Those are mainly farms with smaller sizes in depopulated and remote from residential places areas. In the condition of imperfect or missing markets for products and services, low incomes (cash) of farmers and rural households, lack of alternative employment or advance age of occupied persons, domination of monopolies etc., some farmers exchange (instead of trading) a portion of produce in mutual benefit and subsequently improve the overall economic, social and/or environmental sustainability of agriculture in the region.
The majority of interviewed managers (85%) does not use "free provision of resources, products, services and activities" and think they are important in regard to agrarian sustainability (Figure 2). Nevertheless, none of the holdings assess as negative the free provision of resources, products, services and activities from or to others. For a relatively small portion of the farms (15%) the free provision of resources, products, services and activities is a positive factor for amelioration of agrarian sustainability. Some of the smaller size producers receive free services from other agents and organizations (farmers, cooperatives, non-governmental and international organizations, state and local agencies). Such assistance improves efficiency of the "beneficiaries" and increase agrarian sustainability in the region or subsector. However, often the "free" provision of certain goods and/or services between agrarian (and other) agents comes with an expectation of other or future "recoprocial" free products and/or services.
Some farmers report for informal "free "leasing-out of critical resources such as farmland, buildings etc. as a single
form for keeping the land and other assets in a good condition of absent from the region (country) or old of age owners. Also examples are given for "free lease" of agricultural lands in exchange of giving up rights for area based, etc. subsidies from using farmers. The latter is illegitimate form for receiving mutual benefits from the landlords and farmers, which nonetheless maintain agrarian sustainability and do not adversely affect the taxpayers.
The effective governance of farms supplies with needed resources, materials etc. is an important factor for agrarian sustainability. According to the three-quarters of surveyed managers their holdings do not use special "contracts for supply of needed resources" and such a form have no importance regarding agrarian sustainability (Figure 2). Usually markets for supply with major inputs and resources in agriculture "work" well (strong competition, multiple suppliers, etc.) and it is not necessary to apply special modes of governance (guarantee) of supplies. Moreover, farmers are not big users of "external" resources and it is not necessary to develop special (contractual) forms for governing of standard supplies as commonly free markets are used when procurement needs arise. What is more, often long-term relations evolving (high frequency of deals between the farmer and the supplier), and counterparts get to know each other, and are interested in restriction of opportunistic behavior (the bad reputation is punished easily through changing the supplier).
Only a small fraction of the holdings (2,5%) estimates as negative the existence of a contract for supply of required inputs in mind of unfavorable prices or terms of contracts (singe of a small number of supplier). A good portion of the managers (22,5%) thinks that employment of a contractual form for supply of needed resources is a positive factor for agrarian sustainability. The contractual mode is preferred in case of greater and frequent supplies of required by the farm resources. The special contract gives possibility to tailor the conditions of exchange and supplies for the needs of a particular farm, as well as to guarantee stable relations between counterparts, and possibility to protect (dispute) the rights through the formal (court) system. Some big producers point out examples for supply of special varieties (grape, wheat, etc.) from abroad – France and other leading countries. However, often the existence of quasi or full monopoly (in forage, electricity, water, essential materials etc. supply) leads to serious damages for farmers despite the presence of a contract. In such cases is impossible to effectively punish a supplier through switching to another supplier and/or enforcement of contract (getting compensation of damages) through a lawful way.
"Purchasing of needed resources and services from free market" is a positive factor for agrarian sustainability and is practiced by one fifth of the surveyed farms (Figure 2). Those are holdings of different type for which market governance of procurement of necessary resources and service is the most efficient. At the same time, for a fraction of farms (5%) regular purchase of resources and serviced from the "free" market is a negative factor for agrarian sustainability. The latter is consequence of already mentioned cases of occasional or small number of suppliers for certain farms, subsectors and/or regions of the country. The best part of the managers (75%) believes that supplying of necessary resources and serviced though a purchase from free market is a neutral mode of governance in regards to agrarian sustainability. That implies competitive (well working) markets for supply of standardized products, which are not associated with any special benefits or disadvantages for using farmers.
The lease is a widely used and efficient form for governing of supply of land and other long-term assets in
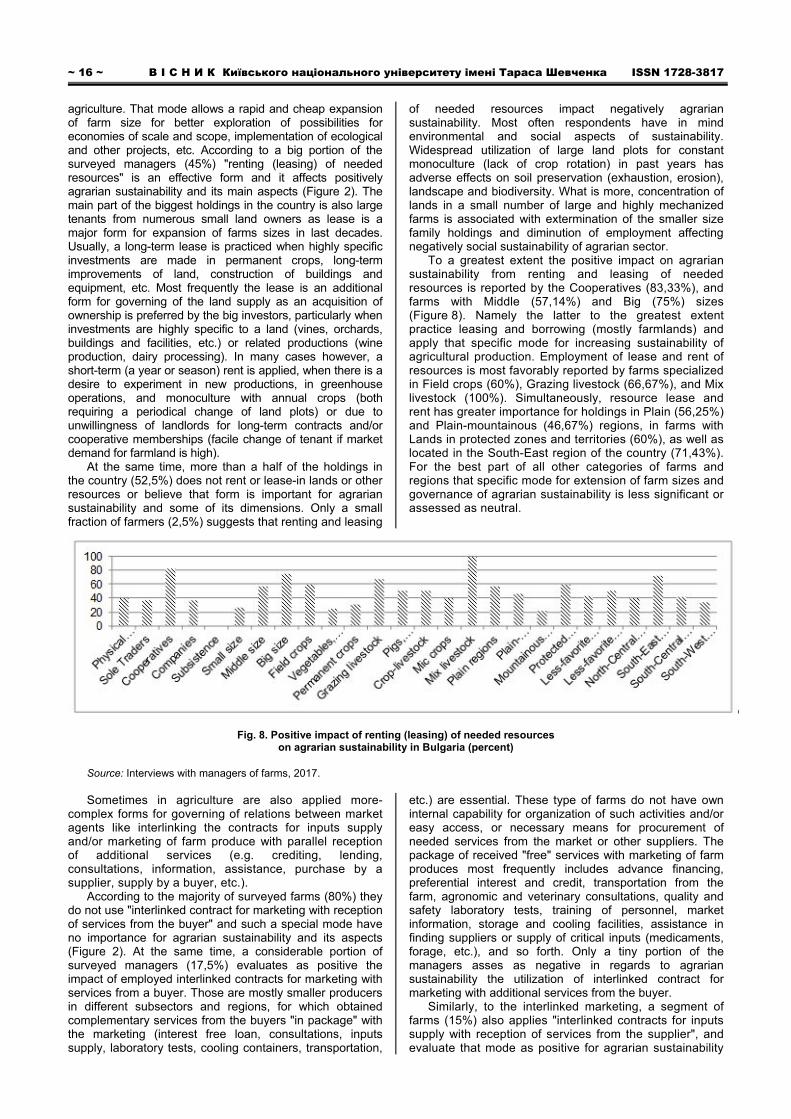
~ 16 ~ В І С Н И К Київського національного університету імені Тараса Шевченка ISSN 1728-3817 agriculture. That mode allows a rapid and cheap expansion of farm size for better exploration of possibilities for economies of scale and scope, implementation of ecological and other projects, etc. According to a big portion of the surveyed managers (45%) "renting (leasing) of needed resources" is an effective form and it affects positively agrarian sustainability and its main aspects (Figure 2). The main part of the biggest holdings in the country is also large tenants from numerous small land owners as lease is a major form for expansion of farms sizes in last decades. Usually, a long-term lease is practiced when highly specific investments are made in permanent crops, long-term improvements of land, construction of buildings and equipment, etc. Most frequently the lease is an additional form for governing of the land supply as an acquisition of ownership is preferred by the big investors, particularly when investments are highly specific to a land (vines, orchards, buildings and facilities, etc.) or related productions (wine production, dairy processing). In many cases however, a short-term (a year or season) rent is applied, when there is a desire to experiment in new productions, in greenhouse operations, and monoculture with annual crops (both requiring a periodical change of land plots) or due to unwillingness of landlords for long-term contracts and/or cooperative memberships (facile change of tenant if market demand for farmland is high).
At the same time, more than a half of the holdings in the country (52,5%) does not rent or lease-in lands or other resources or believe that form is important for agrarian sustainability and some of its dimensions. Only a small fraction of farmers (2,5%) suggests that renting and leasing
of needed resources impact negatively agrarian sustainability. Most often respondents have in mind environmental and social aspects of sustainability. Widespread utilization of large land plots for constant monoculture (lack of crop rotation) in past years has adverse effects on soil preservation (exhaustion, erosion), landscape and biodiversity. What is more, concentration of lands in a small number of large and highly mechanized farms is associated with extermination of the smaller size family holdings and diminution of employment affecting negatively social sustainability of agrarian sector.
To a greatest extent the positive impact on agrarian sustainability from renting and leasing of needed resources is reported by the Cooperatives (83,33%), and farms with Middle (57,14%) and Big (75%) sizes (Figure 8). Namely the latter to the greatest extent practice leasing and borrowing (mostly farmlands) and apply that specific mode for increasing sustainability of agricultural production. Employment of lease and rent of resources is most favorably reported by farms specialized in Field crops (60%), Grazing livestock (66,67%), and Mix livestock (100%). Simultaneously, resource lease and rent has greater importance for holdings in Plain (56,25%) and Plain-mountainous (46,67%) regions, in farms with Lands in protected zones and territories (60%), as well as located in the South-East region of the country (71,43%). For the best part of all other categories of farms and regions that specific mode for extension of farm sizes and governance of agrarian sustainability is less significant or assessed as neutral.
Fig. 8. Positive impact of renting (leasing) of needed resources on agrarian sustainability in Bulgaria (percent)
Source: Interviews with managers of farms, 2017. Sometimes in agriculture are also applied more-
complex forms for governing of relations between market agents like interlinking the contracts for inputs supply and/or marketing of farm produce with parallel reception of additional services (e.g. crediting, lending, consultations, information, assistance, purchase by a supplier, supply by a buyer, etc.).
According to the majority of surveyed farms (80%) they do not use "interlinked contract for marketing with reception of services from the buyer" and such a special mode have no importance for agrarian sustainability and its aspects (Figure 2). At the same time, a considerable portion of surveyed managers (17,5%) evaluates as positive the impact of employed interlinked contracts for marketing with services from a buyer. Those are mostly smaller producers in different subsectors and regions, for which obtained complementary services from the buyers "in package" with the marketing (interest free loan, consultations, inputs supply, laboratory tests, cooling containers, transportation,
etc.) are essential. These type of farms do not have own internal capability for organization of such activities and/or easy access, or necessary means for procurement of needed services from the market or other suppliers. The package of received "free" services with marketing of farm produces most frequently includes advance financing, preferential interest and credit, transportation from the farm, agronomic and veterinary consultations, quality and safety laboratory tests, training of personnel, market information, storage and cooling facilities, assistance in finding suppliers or supply of critical inputs (medicaments, forage, etc.), and so forth. Only a tiny portion of the managers asses as negative in regards to agrarian sustainability the utilization of interlinked contract for marketing with additional services from the buyer.
Similarly, to the interlinked marketing, a segment of farms (15%) also applies "interlinked contracts for inputs supply with reception of services from the supplier", and evaluate that mode as positive for agrarian sustainability

ISSN 1728-2667 ЕКОНОМІКА. 3(198)/2018 ~ 17 ~ (Figure 2). Usually those are producers of different type, subsectors and regions, for which obtained additional services "in package" with the supply are very important. The package of services most often includes: crediting, transportation, consultation, finding a buyer or purchasing of farm produce, etc. The majority of surveyed holdings (85%) does not practice such form of interlinked supply not believing the latter is important for agrarian sustainability. Also no manager thinks that such mode of governance of supply negatively affects agrarian sustainability or some of its aspects.
Setting up and/or participation in various collective organizations outside the farms gates (cooperatives, associations, professional initiatives, etc.) considerably facilitates overcoming disadvantages of pure private or market forms for governing of agrarian sustainability. Our survey has found out that the great majority of surveyed farms (85%) do not take "part in cooperatives" of any type (joint supply, marketing, crediting, logistics, lobbying, etc.) and assess such membership as essential for agrarian sustainability and its individual aspects (Figure 2). Most holdings do not consider as effective the cooperatives membership since they see no significant private benefits but only costs for membership fee, participation in activity, etc. For instance, surveyed cooperative in the South-East region of the country, which used to be a member of the National Union of Agricultural Cooperatives, terminated membership because "there is no benefits and a high cost for membership" (10 stotinki per dka) as well as experienced financial difficulties. Another big producer (and processor) of grape in the same region is a member of a professional association but has "no voice" for protection of its interests.
In the last years the number of traditional cooperatives in Bulgaria substantially decreased and their activity restricted due to the low efficiency, bad management, and losing the comparative advantages in relations to other forms such as own farm, contract, market, firm mode, etc. Many of existing cooperatives started to function as market oriented production cooperatives, and/or in "private" interests of the managers and small groups around them. At the same time, very few coops managed to orient its activity toward better servicing the needs of members and rural communities, as well as for realization of collective projects for socio-economic development, ecology, risk sharing, lobbying, etc. Subsequently, the number of cooperatives, the number of cooperatives members, and the size of cooperative farms considerable decreased in recent years. Therefore, many farmers asses as neutral the impact of cooperatives in achieving the socio-economic and environmental sustainability in the sector. What is more, a small proportion of the managers (2,5%) even think that such membership in a cooperative is a negative factor for governing of agrarian sustainability at the contemporary stage. Merely an insignificant portion of farms (12,5%) participates in some cooperative and evaluate that membership as positive for agrarian sustainability or some of its aspects. Those are mainly smaller holdings belonging to farmers in advanced age. For the latter participation in a cooperative give possibility for (full or part-time) employment and/or cheap and secured supply of essential services and products (e.g. cultivation of farmland, provision of food for household, feed for domestic livestock, mechanization and other services etc.).
In recent years there are also examples for formation of successful "new generation" cooperatives for effective servicing the real needs of members such as collective marketing, processing, negotiating, contracting, lobbying for public support, etc. Such instances are not many as membership in that type of cooperatives is small, while
participants small producers. The latter further hinders exploring the potential of cooperative form for improving agrarian sustainability even in cases the collective mode outside of the farm gates is strongly needed (collecting negotiation and marketing of output). Many vegetable producers pointed out that the lack of an effective nationwide producers organization is a significant problem. However, such an organization is difficult to establish at the current stage due to the big numbers and conflicting interests of producers, tendency for waiting and "free riding" by nonmember farmers, etc. A big buffalo producer also underlines that the existence of two associations in the country in a situation of small overall number of holdings and animals (total 9000) is a significant problem – inefficiency of activity, division of producers, etc.
The "failure" of collective modes in Bulgarian conditions is also a reason for the low participation of farms in joint initiatives with other agrarian and non-agrarian agents. According to the majority of interviewed managers (72,5%) "participation in collective actions with other farmers and non-farmers" do not have significant importance for agrarian sustainability, and practicing by them (Figure 2). For the remaining good portion of holdings however (27,5%) participation in diverse collective actions with other farmers and non-farmers is a positive factors contributing for improvement of agrarian sustainability or some of its aspects.
In recent years there have emerged and becoming more and more popular various farmers and non-farmers informal and formal initiatives ("collective actions") for innovation and quality, revival of rural regions and traditional productions, protection of natural environment, "codes of behavior", protection of intellectual agrarian property (traditional livestock breeds and crops varieties, special products, specific origins and protected names) etc. Such collective forms are initiated by entrepreneurial farmers, professional organizations, related (processing, trade) industries, non-governmental and civic organizations, etc. These forms are increasingly supported by younger farmers of different type, professional and non-governmental organizations, state and local authorities, and other interested parties. The great potential of and the farmers needs from such "collective" actions however has not been completely explored and the positive effect(s) on agrarian sustainability realized. There are also a few examples of successful collective initiatives for sustainable exploration of natural resources (lands, waters, ecosystem services, etc.) when a great common interests and benefits are present. A good example are the joint actions of one of the surveyed cooperative with other cooperatives and farmers in the South-East region for consolidation of the agricultural lands in managed by them areas.
A partial or complete integration of farms in the vertical (food, supply, etc.) chain is a popular form for improving governance efficiency and the activity of related agents for sustainable development. When market prices and standard ("classical") contracts do not work well the agrarian agents design integrated modes for governing of their relations. Our investigations have found out that only a tiny proportion of surveyed farms (2,5%) are involved in some "integration with a supplier of the farm" and evaluate that form as positive in relation to agrarian sustainability (Figure 2). For instance, one of the interviewed livestock operator uses the veterinary and medical services of his retired parents. Such services are critical for successful development of his holding and therefore their supply is internalized ("fully integrated") in the family farm. The predominant part of the surveyed managers (97,5%) does not believe that integration with a supplier to the farm is
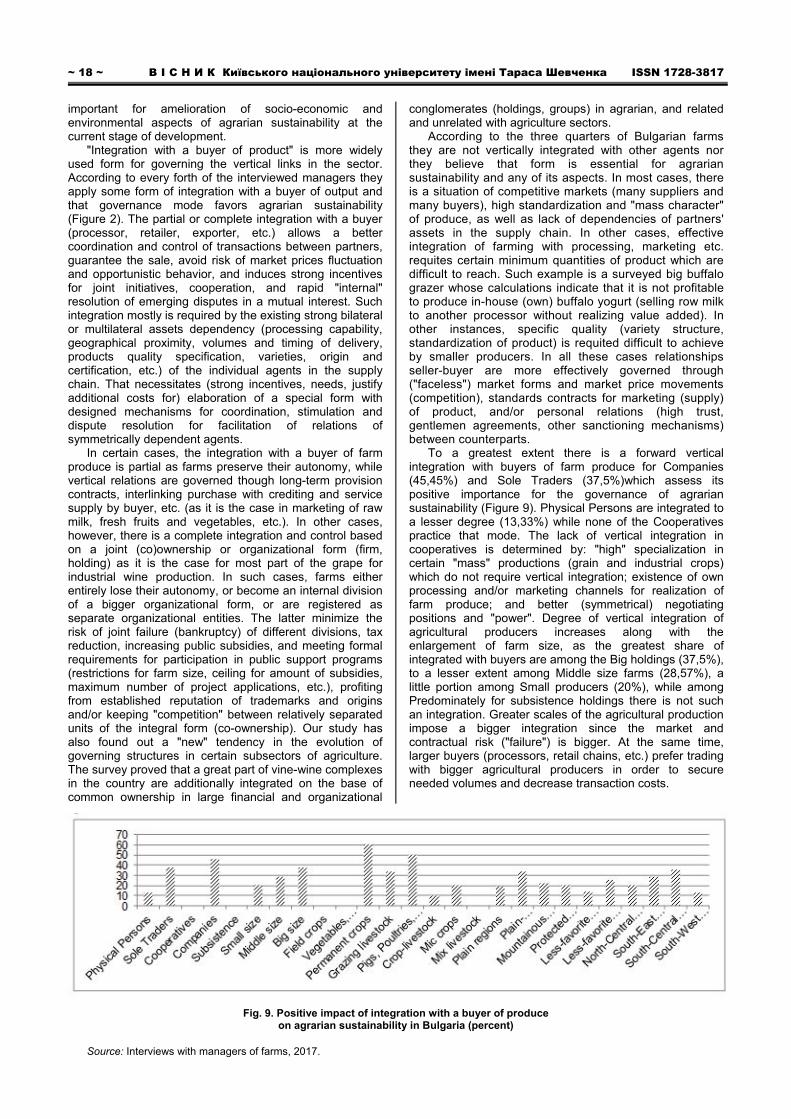
~ 18 ~ В І С Н И К Київського національного університету імені Тараса Шевченка ISSN 1728-3817 important for amelioration of socio-economic and environmental aspects of agrarian sustainability at the current stage of development.
"Integration with a buyer of product" is more widely used form for governing the vertical links in the sector. According to every forth of the interviewed managers they apply some form of integration with a buyer of output and that governance mode favors agrarian sustainability (Figure 2). The partial or complete integration with a buyer (processor, retailer, exporter, etc.) allows a better coordination and control of transactions between partners, guarantee the sale, avoid risk of market prices fluctuation and opportunistic behavior, and induces strong incentives for joint initiatives, cooperation, and rapid "internal" resolution of emerging disputes in a mutual interest. Such integration mostly is required by the existing strong bilateral or multilateral assets dependency (processing capability, geographical proximity, volumes and timing of delivery, products quality specification, varieties, origin and certification, etc.) of the individual agents in the supply chain. That necessitates (strong incentives, needs, justify additional costs for) elaboration of a special form with designed mechanisms for coordination, stimulation and dispute resolution for facilitation of relations of symmetrically dependent agents.
In certain cases, the integration with a buyer of farm produce is partial as farms preserve their autonomy, while vertical relations are governed though long-term provision contracts, interlinking purchase with crediting and service supply by buyer, etc. (as it is the case in marketing of raw milk, fresh fruits and vegetables, etc.). In other cases, however, there is a complete integration and control based on a joint (co)ownership or organizational form (firm, holding) as it is the case for most part of the grape for industrial wine production. In such cases, farms either entirely lose their autonomy, or become an internal division of a bigger organizational form, or are registered as separate organizational entities. The latter minimize the risk of joint failure (bankruptcy) of different divisions, tax reduction, increasing public subsidies, and meeting formal requirements for participation in public support programs (restrictions for farm size, ceiling for amount of subsidies, maximum number of project applications, etc.), profiting from established reputation of trademarks and origins and/or keeping "competition" between relatively separated units of the integral form (co-ownership). Our study has also found out a "new" tendency in the evolution of governing structures in certain subsectors of agriculture. The survey proved that a great part of vine-wine complexes in the country are additionally integrated on the base of common ownership in large financial and organizational
conglomerates (holdings, groups) in agrarian, and related and unrelated with agriculture sectors.
According to the three quarters of Bulgarian farms they are not vertically integrated with other agents nor they believe that form is essential for agrarian sustainability and any of its aspects. In most cases, there is a situation of competitive markets (many suppliers and many buyers), high standardization and "mass character" of produce, as well as lack of dependencies of partners' assets in the supply chain. In other cases, effective integration of farming with processing, marketing etc. requites certain minimum quantities of product which are difficult to reach. Such example is a surveyed big buffalo grazer whose calculations indicate that it is not profitable to produce in-house (own) buffalo yogurt (selling row milk to another processor without realizing value added). In other instances, specific quality (variety structure, standardization of product) is requited difficult to achieve by smaller producers. In all these cases relationships seller-buyer are more effectively governed through ("faceless") market forms and market price movements (competition), standards contracts for marketing (supply) of product, and/or personal relations (high trust, gentlemen agreements, other sanctioning mechanisms) between counterparts.
To a greatest extent there is a forward vertical integration with buyers of farm produce for Companies (45,45%) and Sole Traders (37,5%)which assess its positive importance for the governance of agrarian sustainability (Figure 9). Physical Persons are integrated to a lesser degree (13,33%) while none of the Cooperatives practice that mode. The lack of vertical integration in cooperatives is determined by: "high" specialization in certain "mass" productions (grain and industrial crops) which do not require vertical integration; existence of own processing and/or marketing channels for realization of farm produce; and better (symmetrical) negotiating positions and "power". Degree of vertical integration of agricultural producers increases along with the enlargement of farm size, as the greatest share of integrated with buyers are among the Big holdings (37,5%), to a lesser extent among Middle size farms (28,57%), a little portion among Small producers (20%), while among Predominately for subsistence holdings there is not such an integration. Greater scales of the agricultural production impose a bigger integration since the market and contractual risk ("failure") is bigger. At the same time, larger buyers (processors, retail chains, etc.) prefer trading with bigger agricultural producers in order to secure needed volumes and decrease transaction costs.
Fig. 9. Positive impact of integration with a buyer of produce on agrarian sustainability in Bulgaria (percent)
Source: Interviews with managers of farms, 2017.
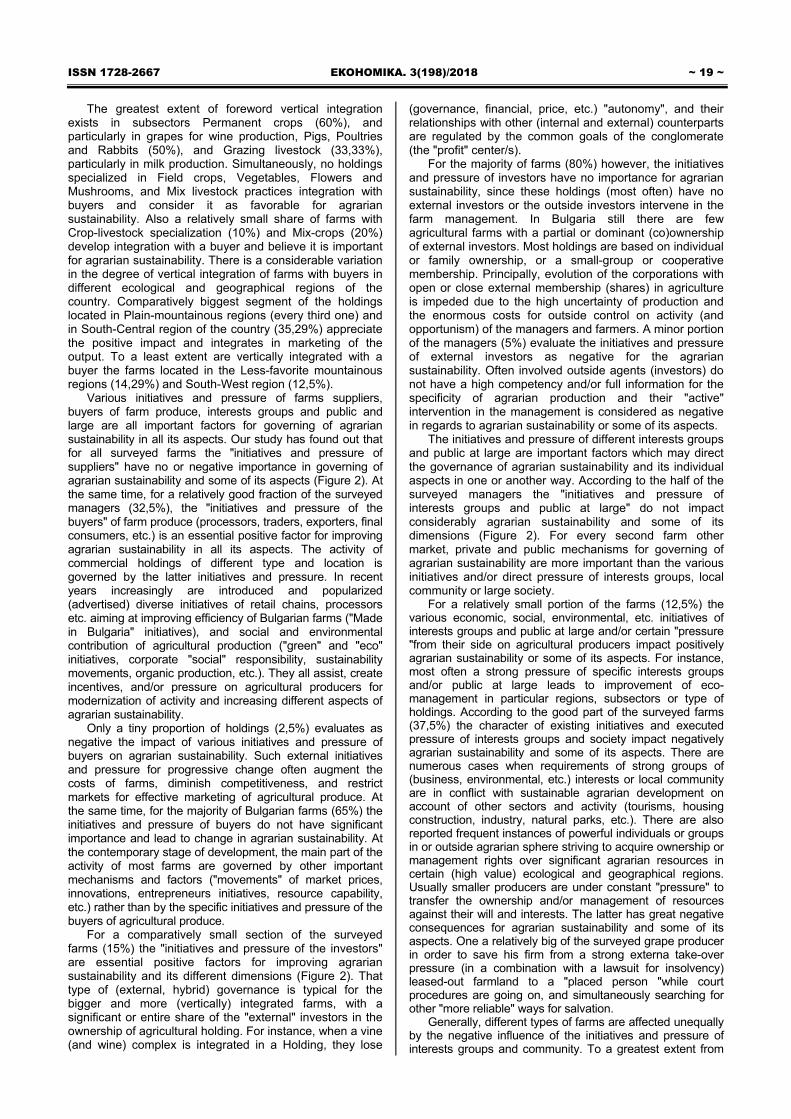
ISSN 1728-2667 ЕКОНОМІКА. 3(198)/2018 ~ 19 ~
The greatest extent of foreword vertical integration exists in subsectors Permanent crops (60%), and particularly in grapes for wine production, Pigs, Poultries and Rabbits (50%), and Grazing livestock (33,33%), particularly in milk production. Simultaneously, no holdings specialized in Field crops, Vegetables, Flowers and Mushrooms, and Mix livestock practices integration with buyers and consider it as favorable for agrarian sustainability. Also a relatively small share of farms with Crop-livestock specialization (10%) and Mix-crops (20%) develop integration with a buyer and believe it is important for agrarian sustainability. There is a considerable variation in the degree of vertical integration of farms with buyers in different ecological and geographical regions of the country. Comparatively biggest segment of the holdings located in Plain-mountainous regions (every third one) and in South-Central region of the country (35,29%) appreciate the positive impact and integrates in marketing of the output. To a least extent are vertically integrated with a buyer the farms located in the Less-favorite mountainous regions (14,29%) and South-West region (12,5%).
Various initiatives and pressure of farms suppliers, buyers of farm produce, interests groups and public and large are all important factors for governing of agrarian sustainability in all its aspects. Our study has found out that for all surveyed farms the "initiatives and pressure of suppliers" have no or negative importance in governing of agrarian sustainability and some of its aspects (Figure 2). At the same time, for a relatively good fraction of the surveyed managers (32,5%), the "initiatives and pressure of the buyers" of farm produce (processors, traders, exporters, final consumers, etc.) is an essential positive factor for improving agrarian sustainability in all its aspects. The activity of commercial holdings of different type and location is governed by the latter initiatives and pressure. In recent years increasingly are introduced and popularized (advertised) diverse initiatives of retail chains, processors etc. aiming at improving efficiency of Bulgarian farms ("Made in Bulgaria" initiatives), and social and environmental contribution of agricultural production ("green" and "eco" initiatives, corporate "social" responsibility, sustainability movements, organic production, etc.). They all assist, create incentives, and/or pressure on agricultural producers for modernization of activity and increasing different aspects of agrarian sustainability.
Only a tiny proportion of holdings (2,5%) evaluates as negative the impact of various initiatives and pressure of buyers on agrarian sustainability. Such external initiatives and pressure for progressive change often augment the costs of farms, diminish competitiveness, and restrict markets for effective marketing of agricultural produce. At the same time, for the majority of Bulgarian farms (65%) the initiatives and pressure of buyers do not have significant importance and lead to change in agrarian sustainability. At the contemporary stage of development, the main part of the activity of most farms are governed by other important mechanisms and factors ("movements" of market prices, innovations, entrepreneurs initiatives, resource capability, etc.) rather than by the specific initiatives and pressure of the buyers of agricultural produce.
For a comparatively small section of the surveyed farms (15%) the "initiatives and pressure of the investors" are essential positive factors for improving agrarian sustainability and its different dimensions (Figure 2). That type of (external, hybrid) governance is typical for the bigger and more (vertically) integrated farms, with a significant or entire share of the "external" investors in the ownership of agricultural holding. For instance, when a vine (and wine) complex is integrated in a Holding, they lose
(governance, financial, price, etc.) "autonomy", and their relationships with other (internal and external) counterparts are regulated by the common goals of the conglomerate (the "profit" center/s).
For the majority of farms (80%) however, the initiatives and pressure of investors have no importance for agrarian sustainability, since these holdings (most often) have no external investors or the outside investors intervene in the farm management. In Bulgaria still there are few agricultural farms with a partial or dominant (co)ownership of external investors. Most holdings are based on individual or family ownership, or a small-group or cooperative membership. Principally, evolution of the corporations with open or close external membership (shares) in agriculture is impeded due to the high uncertainty of production and the enormous costs for outside control on activity (and opportunism) of the managers and farmers. A minor portion of the managers (5%) evaluate the initiatives and pressure of external investors as negative for the agrarian sustainability. Often involved outside agents (investors) do not have a high competency and/or full information for the specificity of agrarian production and their "active" intervention in the management is considered as negative in regards to agrarian sustainability or some of its aspects.
The initiatives and pressure of different interests groups and public at large are important factors which may direct the governance of agrarian sustainability and its individual aspects in one or another way. According to the half of the surveyed managers the "initiatives and pressure of interests groups and public at large" do not impact considerably agrarian sustainability and some of its dimensions (Figure 2). For every second farm other market, private and public mechanisms for governing of agrarian sustainability are more important than the various initiatives and/or direct pressure of interests groups, local community or large society.
For a relatively small portion of the farms (12,5%) the various economic, social, environmental, etc. initiatives of interests groups and public at large and/or certain "pressure "from their side on agricultural producers impact positively agrarian sustainability or some of its aspects. For instance, most often a strong pressure of specific interests groups and/or public at large leads to improvement of eco-management in particular regions, subsectors or type of holdings. According to the good part of the surveyed farms (37,5%) the character of existing initiatives and executed pressure of interests groups and society impact negatively agrarian sustainability and some of its aspects. There are numerous cases when requirements of strong groups of (business, environmental, etc.) interests or local community are in conflict with sustainable agrarian development on account of other sectors and activity (tourisms, housing construction, industry, natural parks, etc.). There are also reported frequent instances of powerful individuals or groups in or outside agrarian sphere striving to acquire ownership or management rights over significant agrarian resources in certain (high value) ecological and geographical regions. Usually smaller producers are under constant "pressure" to transfer the ownership and/or management of resources against their will and interests. The latter has great negative consequences for agrarian sustainability and some of its aspects. One a relatively big of the surveyed grape producer in order to save his firm from a strong externa take-over pressure (in a combination with a lawsuit for insolvency) leased-out farmland to a "placed person "while court procedures are going on, and simultaneously searching for other "more reliable" ways for salvation.
Generally, different types of farms are affected unequally by the negative influence of the initiatives and pressure of interests groups and community. To a greatest extent from

~ 20 ~ В І С Н И К Київського національного університету імені Тараса Шевченка ISSN 1728-3817 that factor suffer Physical Persons and holdings with Small sizes, out of which 86,67% and 93,33% evaluate as negative the importance of initiatives and pressure of interests groups and community for agrarian sustainability (Figure 10). Relatively a smaller portion of the Cooperatives (16,67%) and farms with Middle sizes (7,14%) assess as negative for
agrarian sustainability the existing initiatives and pressure of interests groups and society. That "external" factor is determined as negative to a minor extent by the Companies (9,09%) and none of the Sole Traders, farms with Big sizes, and Predominantly for subsistence.
Fig. 10. Negative impact of initiatives and pressure of interests groups and community
on agrarian sustainability in Bulgaria (percent) Source: interviews with managers of farms, 2017. As a rule, firms and larger structures have stronger
mechanisms for adaptation to external social pressure and/or confrontation to unacceptable pressure of certain interests groups and community. In some cases, certain firms and big farms represent interests of the "special" interests groups aiming at acquiring resources, activity and markets of other agricultural producers. On the other hand, having in mind their miniature size and unimportant resources, the semi-market holdings most often are not subject to external pressure of interests groups and/or community. There is a great variation on the negative impact of the external initiatives and pressure of interests groups and community on agrarian sustainability in different subsectors of agriculture and regions of the country. All farms with Mix crop-livestock specialization and every third in Grazing livestock feel the negative impact of the initiatives and pressure of interests groups and community. On the other hand, none of the holdings in Field crops, Vegetables, Flowers, and Mushrooms as well as Pigs, Poultries and Rabbits and Mix livestock assess as negative for agrarian sustainability the existing initiatives and pressure of interests groups and community.
The initiatives and pressure of interests groups and community is a negative factor for all farms located in the Mountainous regions and Less-favored mountainous regions as well as for a considerable part (40%) of the holdings with Lands in protected zones and territories. Simultaneously, the majority of farms in Plain and Plain-mountainous regions evaluate as favorable or neutral for agrarian sustainability the impact of the initiatives and pressure of interests groups and community. The initiatives and pressure of interests groups and community adversely affect the most farms in the South-West region of the country (91,07%), and comparatively minor portion in the South-East (14,29%) and South-Central (11,76%) regions, and none in the North-Central region.
Cooperation with and an assistance of farms by a business organization or non-governmental organization may contribute to enhancement of agrarian sustainability or some of its aspects. Such an involvement of a "third" party in the governance of agrarian sustainability is necessitated when pure market and private forms do not work, while a state intervention is inefficient or untimely. However, not always such a complex mode of governance of agrarian sustainability produces good results. The majority of interviewed managers (90%) assess as neutral for agrarian
sustainability the "partnership with a business organization", since the later usually does not exist or it is not essential for the aspects of agrarian sustainability. However, every tenth holding practices some form of partnership with a business organization and believe that such kind ("profit-oriented") partnership with an external organization have a positive impact on agrarian sustainability and some of its dimensions.
Similarly, a great majority of the surveyed farms (90%) report that "assistance by non-governmental organization" has no significant importance for agrarian sustainability since it either does not exist or the contribution of non-governmental organization toward agrarian sustainability is negligible. What is more, a tiny portion of the managers (2,5%) even suggest that "assistance" from the non-governmental organization hinders sustainable agrarian development. The latter is a consequence of the inefficient activity of existing non-governmental organizations, or of its content with directions distinct from sustainable development goals. A small proportion of farms (7,5%) however implements a beneficial collaboration with some non-governmental organization(s) and evaluates that type ("non-for-profit oriented") assistance as favorable for agrarian sustainability or some of its aspects. For instance, some of the interviewed managers are taken part in a beneficial long-term training in farm management in foreign (German) organizations, while others received (Swiss) support for transition to organic agriculture.
A public intervention in private and market sectors is a necessary and effective means for reaching the objectives of sustainable agrarian development. For example, state subsidizing is one of the main instruments for supporting agricultural producers in the European Union. Different type of subsidies to a various degree favor agrarian sustainability and its individual aspects in different type of farms, subsectors of agriculture, and ecological and geographical regions of the country.
"Farmland area-based state subsidy" is a major component of the Common Agricultural Policy for supporting the income of agricultural producers. According to the majority of surveyed managers (57,5%) that type of subsidies impact positively agrarian sustainability and all its dimensions (Figure 2). That mode of public assistance aims at increasing economic and social sustainability of agriculture and rural regions and overcoming disproportions with other sectors of economy. Along with
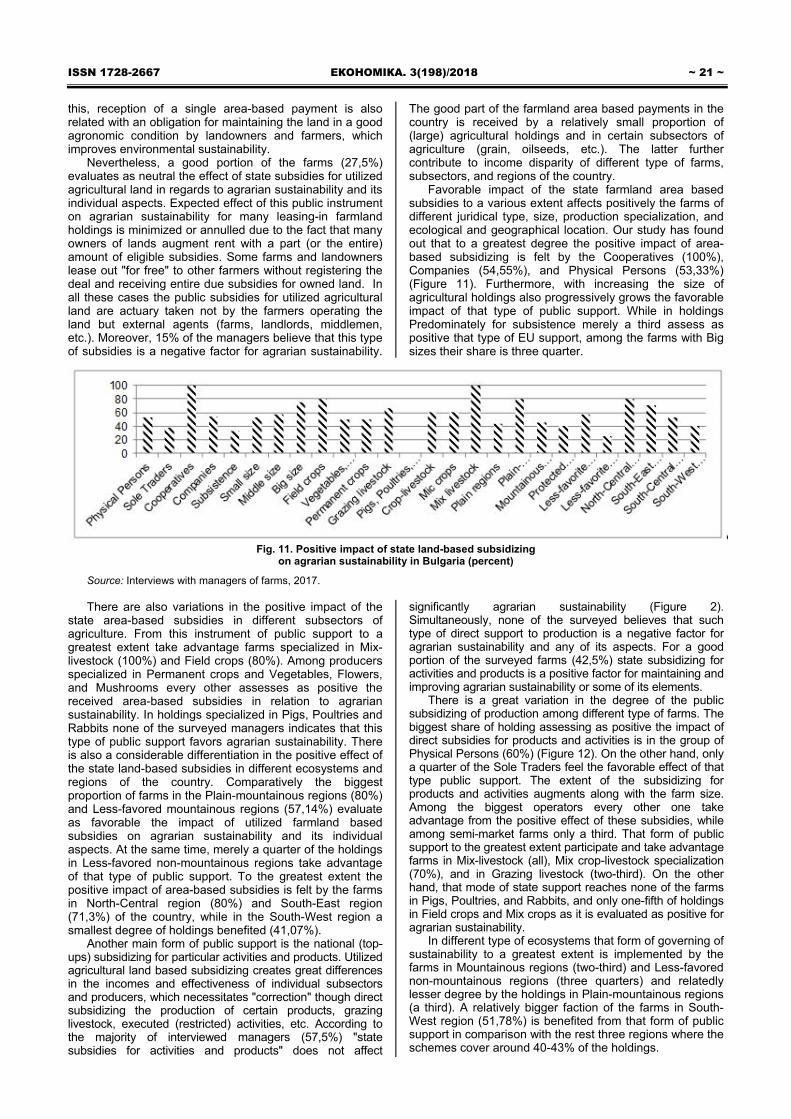
ISSN 1728-2667 ЕКОНОМІКА. 3(198)/2018 ~ 21 ~ this, reception of a single area-based payment is also related with an obligation for maintaining the land in a good agronomic condition by landowners and farmers, which improves environmental sustainability.
Nevertheless, a good portion of the farms (27,5%) evaluates as neutral the effect of state subsidies for utilized agricultural land in regards to agrarian sustainability and its individual aspects. Expected effect of this public instrument on agrarian sustainability for many leasing-in farmland holdings is minimized or annulled due to the fact that many owners of lands augment rent with a part (or the entire) amount of eligible subsidies. Some farms and landowners lease out "for free" to other farmers without registering the deal and receiving entire due subsidies for owned land. In all these cases the public subsidies for utilized agricultural land are actuary taken not by the farmers operating the land but external agents (farms, landlords, middlemen, etc.). Moreover, 15% of the managers believe that this type of subsidies is a negative factor for agrarian sustainability.
The good part of the farmland area based payments in the country is received by a relatively small proportion of (large) agricultural holdings and in certain subsectors of agriculture (grain, oilseeds, etc.). The latter further contribute to income disparity of different type of farms, subsectors, and regions of the country.
Favorable impact of the state farmland area based subsidies to a various extent affects positively the farms of different juridical type, size, production specialization, and ecological and geographical location. Our study has found out that to a greatest degree the positive impact of area-based subsidizing is felt by the Cooperatives (100%), Companies (54,55%), and Physical Persons (53,33%) (Figure 11). Furthermore, with increasing the size of agricultural holdings also progressively grows the favorable impact of that type of public support. While in holdings Predominately for subsistence merely a third assess as positive that type of EU support, among the farms with Big sizes their share is three quarter.
Fig. 11. Positive impact of state land-based subsidizing
on agrarian sustainability in Bulgaria (percent)
Source: Interviews with managers of farms, 2017. There are also variations in the positive impact of the
state area-based subsidies in different subsectors of agriculture. From this instrument of public support to a greatest extent take advantage farms specialized in Mix-livestock (100%) and Field crops (80%). Among producers specialized in Permanent crops and Vegetables, Flowers, and Mushrooms every other assesses as positive the received area-based subsidies in relation to agrarian sustainability. In holdings specialized in Pigs, Poultries and Rabbits none of the surveyed managers indicates that this type of public support favors agrarian sustainability. There is also a considerable differentiation in the positive effect of the state land-based subsidies in different ecosystems and regions of the country. Comparatively the biggest proportion of farms in the Plain-mountainous regions (80%) and Less-favored mountainous regions (57,14%) evaluate as favorable the impact of utilized farmland based subsidies on agrarian sustainability and its individual aspects. At the same time, merely a quarter of the holdings in Less-favored non-mountainous regions take advantage of that type of public support. To the greatest extent the positive impact of area-based subsidies is felt by the farms in North-Central region (80%) and South-East region (71,3%) of the country, while in the South-West region a smallest degree of holdings benefited (41,07%).
Another main form of public support is the national (top-ups) subsidizing for particular activities and products. Utilized agricultural land based subsidizing creates great differences in the incomes and effectiveness of individual subsectors and producers, which necessitates "correction" though direct subsidizing the production of certain products, grazing livestock, executed (restricted) activities, etc. According to the majority of interviewed managers (57,5%) "state subsidies for activities and products" does not affect
significantly agrarian sustainability (Figure 2). Simultaneously, none of the surveyed believes that such type of direct support to production is a negative factor for agrarian sustainability and any of its aspects. For a good portion of the surveyed farms (42,5%) state subsidizing for activities and products is a positive factor for maintaining and improving agrarian sustainability or some of its elements.
There is a great variation in the degree of the public subsidizing of production among different type of farms. The biggest share of holding assessing as positive the impact of direct subsidies for products and activities is in the group of Physical Persons (60%) (Figure 12). On the other hand, only a quarter of the Sole Traders feel the favorable effect of that type public support. The extent of the subsidizing for products and activities augments along with the farm size. Among the biggest operators every other one take advantage from the positive effect of these subsidies, while among semi-market farms only a third. That form of public support to the greatest extent participate and take advantage farms in Mix-livestock (all), Mix crop-livestock specialization (70%), and in Grazing livestock (two-third). On the other hand, that mode of state support reaches none of the farms in Pigs, Poultries, and Rabbits, and only one-fifth of holdings in Field crops and Mix crops as it is evaluated as positive for agrarian sustainability.
In different type of ecosystems that form of governing of sustainability to a greatest extent is implemented by the farms in Mountainous regions (two-third) and Less-favored non-mountainous regions (three quarters) and relatedly lesser degree by the holdings in Plain-mountainous regions (a third). A relatively bigger faction of the farms in South-West region (51,78%) is benefited from that form of public support in comparison with the rest three regions where the schemes cover around 40-43% of the holdings.
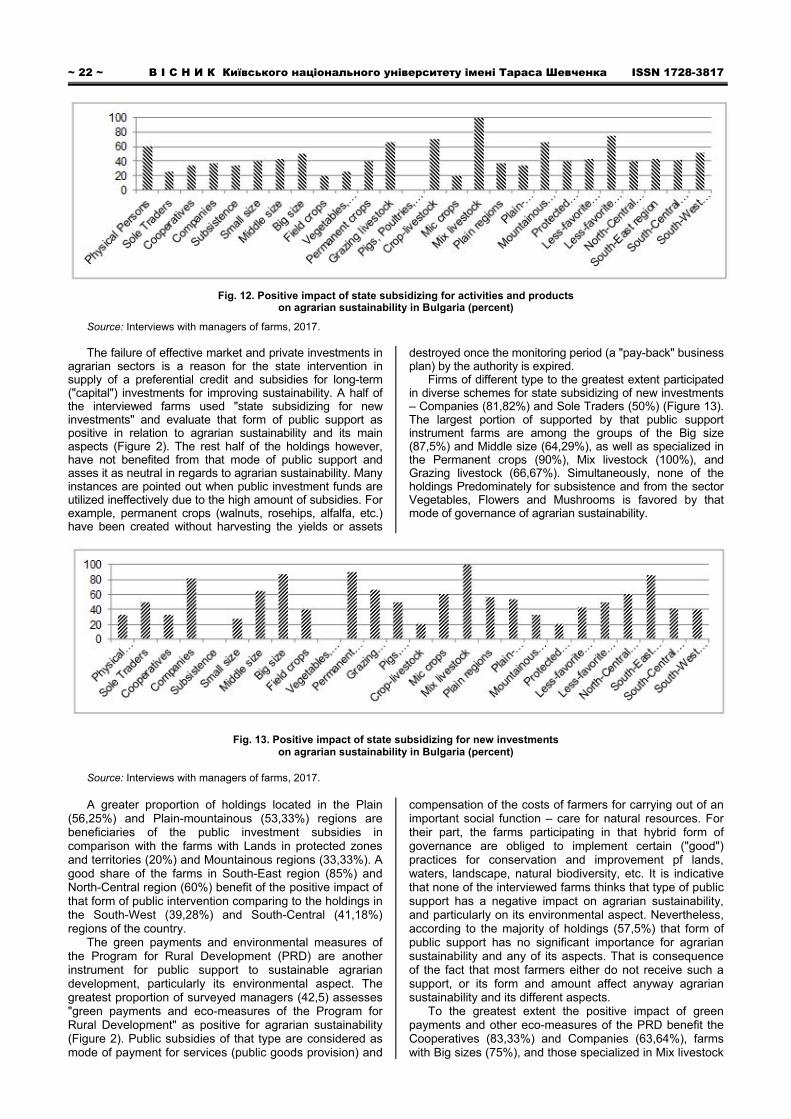
~ 22 ~ В І С Н И К Київського національного університету імені Тараса Шевченка ISSN 1728-3817
Fig. 12. Positive impact of state subsidizing for activities and products on agrarian sustainability in Bulgaria (percent)
Source: Interviews with managers of farms, 2017. The failure of effective market and private investments in
agrarian sectors is a reason for the state intervention in supply of a preferential credit and subsidies for long-term ("capital") investments for improving sustainability. A half of the interviewed farms used "state subsidizing for new investments" and evaluate that form of public support as positive in relation to agrarian sustainability and its main aspects (Figure 2). The rest half of the holdings however, have not benefited from that mode of public support and asses it as neutral in regards to agrarian sustainability. Many instances are pointed out when public investment funds are utilized ineffectively due to the high amount of subsidies. For example, permanent crops (walnuts, rosehips, alfalfa, etc.) have been created without harvesting the yields or assets
destroyed once the monitoring period (a "pay-back" business plan) by the authority is expired.
Firms of different type to the greatest extent participated in diverse schemes for state subsidizing of new investments – Companies (81,82%) and Sole Traders (50%) (Figure 13). The largest portion of supported by that public support instrument farms are among the groups of the Big size (87,5%) and Middle size (64,29%), as well as specialized in the Permanent crops (90%), Mix livestock (100%), and Grazing livestock (66,67%). Simultaneously, none of the holdings Predominately for subsistence and from the sector Vegetables, Flowers and Mushrooms is favored by that mode of governance of agrarian sustainability.
Fig. 13. Positive impact of state subsidizing for new investments on agrarian sustainability in Bulgaria (percent)
Source: Interviews with managers of farms, 2017. A greater proportion of holdings located in the Plain
(56,25%) and Plain-mountainous (53,33%) regions are beneficiaries of the public investment subsidies in comparison with the farms with Lands in protected zones and territories (20%) and Mountainous regions (33,33%). A good share of the farms in South-East region (85%) and North-Central region (60%) benefit of the positive impact of that form of public intervention comparing to the holdings in the South-West (39,28%) and South-Central (41,18%) regions of the country.
The green payments and environmental measures of the Program for Rural Development (PRD) are another instrument for public support to sustainable agrarian development, particularly its environmental aspect. The greatest proportion of surveyed managers (42,5) assesses "green payments and eco-measures of the Program for Rural Development" as positive for agrarian sustainability (Figure 2). Public subsidies of that type are considered as mode of payment for services (public goods provision) and
compensation of the costs of farmers for carrying out of an important social function – care for natural resources. For their part, the farms participating in that hybrid form of governance are obliged to implement certain ("good") practices for conservation and improvement pf lands, waters, landscape, natural biodiversity, etc. It is indicative that none of the interviewed farms thinks that type of public support has a negative impact on agrarian sustainability, and particularly on its environmental aspect. Nevertheless, according to the majority of holdings (57,5%) that form of public support has no significant importance for agrarian sustainability and any of its aspects. That is consequence of the fact that most farmers either do not receive such a support, or its form and amount affect anyway agrarian sustainability and its different aspects.
To the greatest extent the positive impact of green payments and other eco-measures of the PRD benefit the Cooperatives (83,33%) and Companies (63,64%), farms with Big sizes (75%), and those specialized in Mix livestock

ISSN 1728-2667 ЕКОНОМІКА. 3(198)/2018 ~ 23 ~ (100%), Field crops (60%), and Permanent crops (50%) (Figure 14). The favorable impact of the public payments for environmentally friendly agriculture are mostly felt by the holdings in the Less-Favored mountainous regions (57,14%) and Plain-mountainous regions (46,67'%), as well as those located in the South-East region of the country
(57,14%). On the other hand, this instrument of public support is a positive factor for agrarian sustainability for a relatively small portion of the holdings in the Less-favored non-mountainous regions (25%), North-Central (20%) and South-West (22,93%) regions of the country.
Fig. 14. Positive impact of green payments and eco-measures of Program for Rural Development on agrarian sustainability in Bulgaria (percent)
Source: Interviews with managers of farms, 2017. Various forms of public support to farmers
organizations of different type are a major component of the public intervention in agriculture and mode for increasing agrarian sustainability. That type of public support is extremely important for Bulgarian agriculture where evolution of the effective organizations of agricultural producers for correction of market and private failures considerably lag behind the needs of farmers. For predominant part of the interviewed managers (95%) existing at the contemporary stage of development in the country "state support to farmers organizations" does not assist in any way agrarian sustainability (Figure 2). Apparently envisaged instruments of the state intervention in that exceptionally important area are not used by the farmers and/or lead to actual improvement of the governance of agrarian sustainability in the country. For the rest tiny portion of the holdings (5%) the state forms for supporting farmers organizations are a positive factor for improving sustainability in the sector or some of its main aspects (social, economic, environmental).
In Bulgarian agriculture there are also applied some other measures of the Program for Agrarian and Rural Development aiming at supporting the actions of agrarian
agents for improving different aspects of agrarian sustainability. According to the great part of the surveyed managers (72,5%) "other measures of the Program for Agrarian and Rural Development" do not impact significantly the level of agrarian sustainability (Figure 2). That is subsequent of the fact that considerable number of the Bulgarian farmers either do not have practically access to that form of public support or see that intervention as an essential factor for agrarian sustainability or some of its dimensions. The rest smaller portion of the farms (27,5%) have taken and/or are taking part in other measures of the PRD, and evaluate them as positive for agrarian sustainability or some of its aspects.
To a greatest extent the favorable impact of other measures of the PRD is pointed out by Companies (45,45%), holdings with Big size (50%), farms specializes in Permanent crops (60%), and located in Plain-mountainous regions (46,67%), and North-Central region of the country (80%) (Figure 15). For the best portion of the farms in the rest groups of juridical type, sizes, product specialization, ecological and geographical situation, the favorable impact of that form of public support is relatively small or absent.
Fig. 15. Positive impact of other measures of program for agrarian and rural development on agrarian sustainability in Bulgaria (percent)
Source: Interviews with managers of farms, 2017. As far as the remaining public programs are concerned,
according to the greatest part of the interviewed managers (95%) they do not contribute in any way for agrarian sustainability (Figure 2). The rest mall portion of the
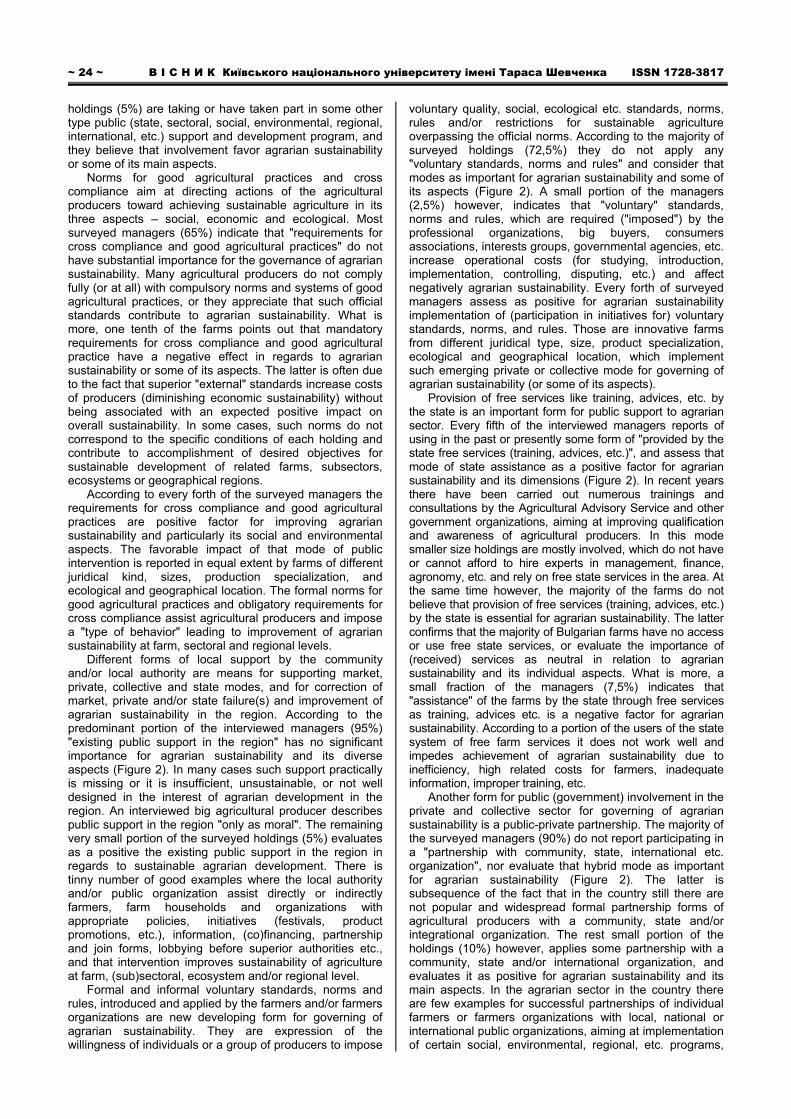
~ 24 ~ В І С Н И К Київського національного університету імені Тараса Шевченка ISSN 1728-3817 holdings (5%) are taking or have taken part in some other type public (state, sectoral, social, environmental, regional, international, etc.) support and development program, and they believe that involvement favor agrarian sustainability or some of its main aspects.
Norms for good agricultural practices and cross compliance aim at directing actions of the agricultural producers toward achieving sustainable agriculture in its three aspects – social, economic and ecological. Most surveyed managers (65%) indicate that "requirements for cross compliance and good agricultural practices" do not have substantial importance for the governance of agrarian sustainability. Many agricultural producers do not comply fully (or at all) with compulsory norms and systems of good agricultural practices, or they appreciate that such official standards contribute to agrarian sustainability. What is more, one tenth of the farms points out that mandatory requirements for cross compliance and good agricultural practice have a negative effect in regards to agrarian sustainability or some of its aspects. The latter is often due to the fact that superior "external" standards increase costs of producers (diminishing economic sustainability) without being associated with an expected positive impact on overall sustainability. In some cases, such norms do not correspond to the specific conditions of each holding and contribute to accomplishment of desired objectives for sustainable development of related farms, subsectors, ecosystems or geographical regions.
According to every forth of the surveyed managers the requirements for cross compliance and good agricultural practices are positive factor for improving agrarian sustainability and particularly its social and environmental aspects. The favorable impact of that mode of public intervention is reported in equal extent by farms of different juridical kind, sizes, production specialization, and ecological and geographical location. The formal norms for good agricultural practices and obligatory requirements for cross compliance assist agricultural producers and impose a "type of behavior" leading to improvement of agrarian sustainability at farm, sectoral and regional levels.
Different forms of local support by the community and/or local authority are means for supporting market, private, collective and state modes, and for correction of market, private and/or state failure(s) and improvement of agrarian sustainability in the region. According to the predominant portion of the interviewed managers (95%) "existing public support in the region" has no significant importance for agrarian sustainability and its diverse aspects (Figure 2). In many cases such support practically is missing or it is insufficient, unsustainable, or not well designed in the interest of agrarian development in the region. An interviewed big agricultural producer describes public support in the region "only as moral". The remaining very small portion of the surveyed holdings (5%) evaluates as a positive the existing public support in the region in regards to sustainable agrarian development. There is tinny number of good examples where the local authority and/or public organization assist directly or indirectly farmers, farm households and organizations with appropriate policies, initiatives (festivals, product promotions, etc.), information, (co)financing, partnership and join forms, lobbying before superior authorities etc., and that intervention improves sustainability of agriculture at farm, (sub)sectoral, ecosystem and/or regional level.
Formal and informal voluntary standards, norms and rules, introduced and applied by the farmers and/or farmers organizations are new developing form for governing of agrarian sustainability. They are expression of the willingness of individuals or a group of producers to impose
voluntary quality, social, ecological etc. standards, norms, rules and/or restrictions for sustainable agriculture overpassing the official norms. According to the majority of surveyed holdings (72,5%) they do not apply any "voluntary standards, norms and rules" and consider that modes as important for agrarian sustainability and some of its aspects (Figure 2). A small portion of the managers (2,5%) however, indicates that "voluntary" standards, norms and rules, which are required ("imposed") by the professional organizations, big buyers, consumers associations, interests groups, governmental agencies, etc. increase operational costs (for studying, introduction, implementation, controlling, disputing, etc.) and affect negatively agrarian sustainability. Every forth of surveyed managers assess as positive for agrarian sustainability implementation of (participation in initiatives for) voluntary standards, norms, and rules. Those are innovative farms from different juridical type, size, product specialization, ecological and geographical location, which implement such emerging private or collective mode for governing of agrarian sustainability (or some of its aspects).
Provision of free services like training, advices, etc. by the state is an important form for public support to agrarian sector. Every fifth of the interviewed managers reports of using in the past or presently some form of "provided by the state free services (training, advices, etc.)", and assess that mode of state assistance as a positive factor for agrarian sustainability and its dimensions (Figure 2). In recent years there have been carried out numerous trainings and consultations by the Agricultural Advisory Service and other government organizations, aiming at improving qualification and awareness of agricultural producers. In this mode smaller size holdings are mostly involved, which do not have or cannot afford to hire experts in management, finance, agronomy, etc. and rely on free state services in the area. At the same time however, the majority of the farms do not believe that provision of free services (training, advices, etc.) by the state is essential for agrarian sustainability. The latter confirms that the majority of Bulgarian farms have no access or use free state services, or evaluate the importance of (received) services as neutral in relation to agrarian sustainability and its individual aspects. What is more, a small fraction of the managers (7,5%) indicates that "assistance" of the farms by the state through free services as training, advices etc. is a negative factor for agrarian sustainability. According to a portion of the users of the state system of free farm services it does not work well and impedes achievement of agrarian sustainability due to inefficiency, high related costs for farmers, inadequate information, improper training, etc.
Another form for public (government) involvement in the private and collective sector for governing of agrarian sustainability is a public-private partnership. The majority of the surveyed managers (90%) do not report participating in a "partnership with community, state, international etc. organization", nor evaluate that hybrid mode as important for agrarian sustainability (Figure 2). The latter is subsequence of the fact that in the country still there are not popular and widespread formal partnership forms of agricultural producers with a community, state and/or integrational organization. The rest small portion of the holdings (10%) however, applies some partnership with a community, state and/or international organization, and evaluates it as positive for agrarian sustainability and its main aspects. In the agrarian sector in the country there are few examples for successful partnerships of individual farmers or farmers organizations with local, national or international public organizations, aiming at implementation of certain social, environmental, regional, etc. programs,
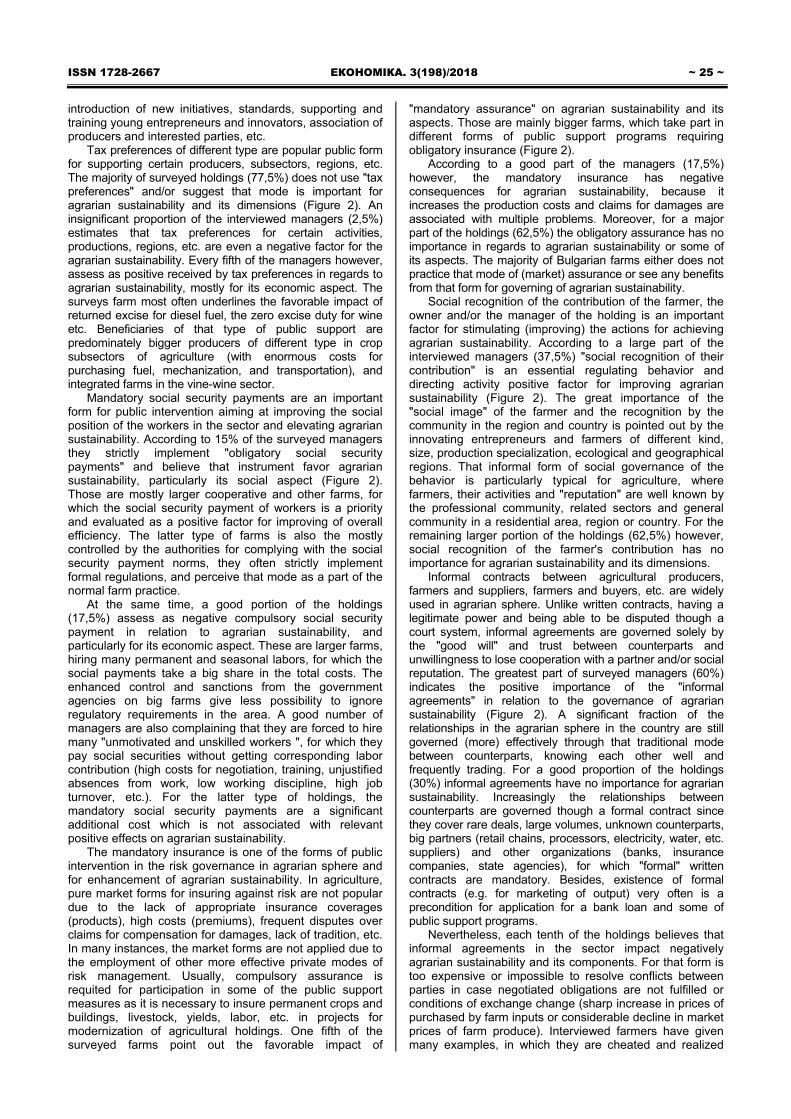
ISSN 1728-2667 ЕКОНОМІКА. 3(198)/2018 ~ 25 ~ introduction of new initiatives, standards, supporting and training young entrepreneurs and innovators, association of producers and interested parties, etc.
Tax preferences of different type are popular public form for supporting certain producers, subsectors, regions, etc. The majority of surveyed holdings (77,5%) does not use "tax preferences" and/or suggest that mode is important for agrarian sustainability and its dimensions (Figure 2). An insignificant proportion of the interviewed managers (2,5%) estimates that tax preferences for certain activities, productions, regions, etc. are even a negative factor for the agrarian sustainability. Every fifth of the managers however, assess as positive received by tax preferences in regards to agrarian sustainability, mostly for its economic aspect. The surveys farm most often underlines the favorable impact of returned excise for diesel fuel, the zero excise duty for wine etc. Beneficiaries of that type of public support are predominately bigger producers of different type in crop subsectors of agriculture (with enormous costs for purchasing fuel, mechanization, and transportation), and integrated farms in the vine-wine sector.
Mandatory social security payments are an important form for public intervention aiming at improving the social position of the workers in the sector and elevating agrarian sustainability. According to 15% of the surveyed managers they strictly implement "obligatory social security payments" and believe that instrument favor agrarian sustainability, particularly its social aspect (Figure 2). Those are mostly larger cooperative and other farms, for which the social security payment of workers is a priority and evaluated as a positive factor for improving of overall efficiency. The latter type of farms is also the mostly controlled by the authorities for complying with the social security payment norms, they often strictly implement formal regulations, and perceive that mode as a part of the normal farm practice.
At the same time, a good portion of the holdings (17,5%) assess as negative compulsory social security payment in relation to agrarian sustainability, and particularly for its economic aspect. These are larger farms, hiring many permanent and seasonal labors, for which the social payments take a big share in the total costs. The enhanced control and sanctions from the government agencies on big farms give less possibility to ignore regulatory requirements in the area. A good number of managers are also complaining that they are forced to hire many "unmotivated and unskilled workers ", for which they pay social securities without getting corresponding labor contribution (high costs for negotiation, training, unjustified absences from work, low working discipline, high job turnover, etc.). For the latter type of holdings, the mandatory social security payments are a significant additional cost which is not associated with relevant positive effects on agrarian sustainability.
The mandatory insurance is one of the forms of public intervention in the risk governance in agrarian sphere and for enhancement of agrarian sustainability. In agriculture, pure market forms for insuring against risk are not popular due to the lack of appropriate insurance coverages (products), high costs (premiums), frequent disputes over claims for compensation for damages, lack of tradition, etc. In many instances, the market forms are not applied due to the employment of other more effective private modes of risk management. Usually, compulsory assurance is requited for participation in some of the public support measures as it is necessary to insure permanent crops and buildings, livestock, yields, labor, etc. in projects for modernization of agricultural holdings. One fifth of the surveyed farms point out the favorable impact of
"mandatory assurance" on agrarian sustainability and its aspects. Those are mainly bigger farms, which take part in different forms of public support programs requiring obligatory insurance (Figure 2).
According to a good part of the managers (17,5%) however, the mandatory insurance has negative consequences for agrarian sustainability, because it increases the production costs and claims for damages are associated with multiple problems. Moreover, for a major part of the holdings (62,5%) the obligatory assurance has no importance in regards to agrarian sustainability or some of its aspects. The majority of Bulgarian farms either does not practice that mode of (market) assurance or see any benefits from that form for governing of agrarian sustainability.
Social recognition of the contribution of the farmer, the owner and/or the manager of the holding is an important factor for stimulating (improving) the actions for achieving agrarian sustainability. According to a large part of the interviewed managers (37,5%) "social recognition of their contribution" is an essential regulating behavior and directing activity positive factor for improving agrarian sustainability (Figure 2). The great importance of the "social image" of the farmer and the recognition by the community in the region and country is pointed out by the innovating entrepreneurs and farmers of different kind, size, production specialization, ecological and geographical regions. That informal form of social governance of the behavior is particularly typical for agriculture, where farmers, their activities and "reputation" are well known by the professional community, related sectors and general community in a residential area, region or country. For the remaining larger portion of the holdings (62,5%) however, social recognition of the farmer's contribution has no importance for agrarian sustainability and its dimensions.
Informal contracts between agricultural producers, farmers and suppliers, farmers and buyers, etc. are widely used in agrarian sphere. Unlike written contracts, having a legitimate power and being able to be disputed though a court system, informal agreements are governed solely by the "good will" and trust between counterparts and unwillingness to lose cooperation with a partner and/or social reputation. The greatest part of surveyed managers (60%) indicates the positive importance of the "informal agreements" in relation to the governance of agrarian sustainability (Figure 2). A significant fraction of the relationships in the agrarian sphere in the country are still governed (more) effectively through that traditional mode between counterparts, knowing each other well and frequently trading. For a good proportion of the holdings (30%) informal agreements have no importance for agrarian sustainability. Increasingly the relationships between counterparts are governed though a formal contract since they cover rare deals, large volumes, unknown counterparts, big partners (retail chains, processors, electricity, water, etc. suppliers) and other organizations (banks, insurance companies, state agencies), for which "formal" written contracts are mandatory. Besides, existence of formal contracts (e.g. for marketing of output) very often is a precondition for application for a bank loan and some of public support programs.
Nevertheless, each tenth of the holdings believes that informal agreements in the sector impact negatively agrarian sustainability and its components. For that form is too expensive or impossible to resolve conflicts between parties in case negotiated obligations are not fulfilled or conditions of exchange change (sharp increase in prices of purchased by farm inputs or considerable decline in market prices of farm produce). Interviewed farmers have given many examples, in which they are cheated and realized
~ 26 ~ В І С Н И К Київського національного університету імені Тараса Шевченка ISSN 1728-3817 huge damages due to nonfulfillment of certain informal agreements by the partners, without been able to enforce their rights in court (as a result of difficulties, failure, more favorable opportunities for deals, etc.). Moreover, widely used informal agreements in the country are associated with development of a huge informal (grey) sector in agriculture, with unenforced quality, safety and environmental standards, unpaid taxes and social securities, juridical consultations fees, costs for contracts preparation, writing and registration, etc. All these increase production costs in the "light" sector of agriculture, and inferior competitiveness and efficiency comparing to the informal sector. Therefore, farms complying with the formal rules assess as negative for agrarian sustainability widespread application of informal agreements.
Different type of holdings, subsectors and regions apply unevenly the informal agreements and evaluate as positive their role for agrarian sustainability. To the greatest extent informal agreements dominate among Physical Persons (73,33%) and firms of various kind – Sole Traders (62,5%) and Companies (63,64%) (Figure 16). Simultaneously, relatively a small portion of the cooperative farms (16,67%)
applies that mode for governing relations with divers agents, and assess it as positive for agrarian sustainability.
The smallest semi-market holdings entirely govern their relationships with other agents through informal agreements. At the same time, farms with Middle sizes to the least extent (50%) use contract of the latter type. Informal agreements are most popular in subsectors Mix livestock (100%), Permanent crops and Mix crop-livestock (by 80%). Farms applying at least informal agreements and assessing them positively are among Field crops (20%) and in Vegetables, Flowers, and Mushrooms (25%). Informal contracts to the biggest degree are employed by the holdings in Mountainous regions (88,89%), while in the Plain regions to smallest extent. The South-West region of the country is the leader in terms of the proportion of farms (73,21%) practicing informal agreements, while fewer number of farms in the South-East region (42,86%) evaluate as positive that type of governance of relations. The structure and the scope of informal agreements in different type of farms, subsectors of agriculture, type of ecosystems and regions of the country give also some tentative insight for the evolution of the informal sector in agrarian sphere at the present time.
Fig. 16. Positive impact of informal agreements on agrarian sustainability in Bulgaria (percent) Source: Interviews with managers of farms, 2017.
Identification of the links (correlation) between the
level of agrarian sustainability in individual farms and the importance (efficient, "positive" impact) of diverse private, contractual, collective and hybrid modes of governance for these holdings, allows to determine the real efficiency of the specific governing modes for improving agrarian sustainability in the country. For most of implemented governing forms there exist a strong correlation between the positive estimates of the managers for the impacts on agrarian sustainability, and the archived good (and high) level of agrarian sustainability in the corresponding farms (Figure 17).
Thus, preferred and employed by the farms governing forms are critical and (most likely) their choice by the managers to a certain extent actually contribute to achievement of a higher agrarian sustainability in surveyed holdings. Effectiveness of individual governing modes is as following: personal conviction and initiatives of the farmer (92,5%), personal conviction and initiatives of workers (100%), profit and benefits in the present time (92%),
immediate benefits for other persons and groups (75%), diversification of activity in the farm (83,33%), direct retail sells of products and services (84,62%), sale on wholesale and commodity markets (100%), marketing contract for products and services (95,24%), barter exchange of products and services (100%), free provision of resources, products, services and activities (83,33%), interlinked supply contract with services by the supplier (100%), participation in joint actions with other farmers and non-farmers (100%), integration with the buyer of produce (100%), partnership with a business organization (100%), state subsidies for activities and products (88,24%), state subsidies for new investments (100%), green payments and eco-measures of the PRD (94,12%), state support to farmers organizations (100%), other measure of the PARD (100%), participation in other public programs (100%), existing public support in the region (100%), partnership with community, state, and integrational organization (100%), and social recognition of the contribution (93,33%).
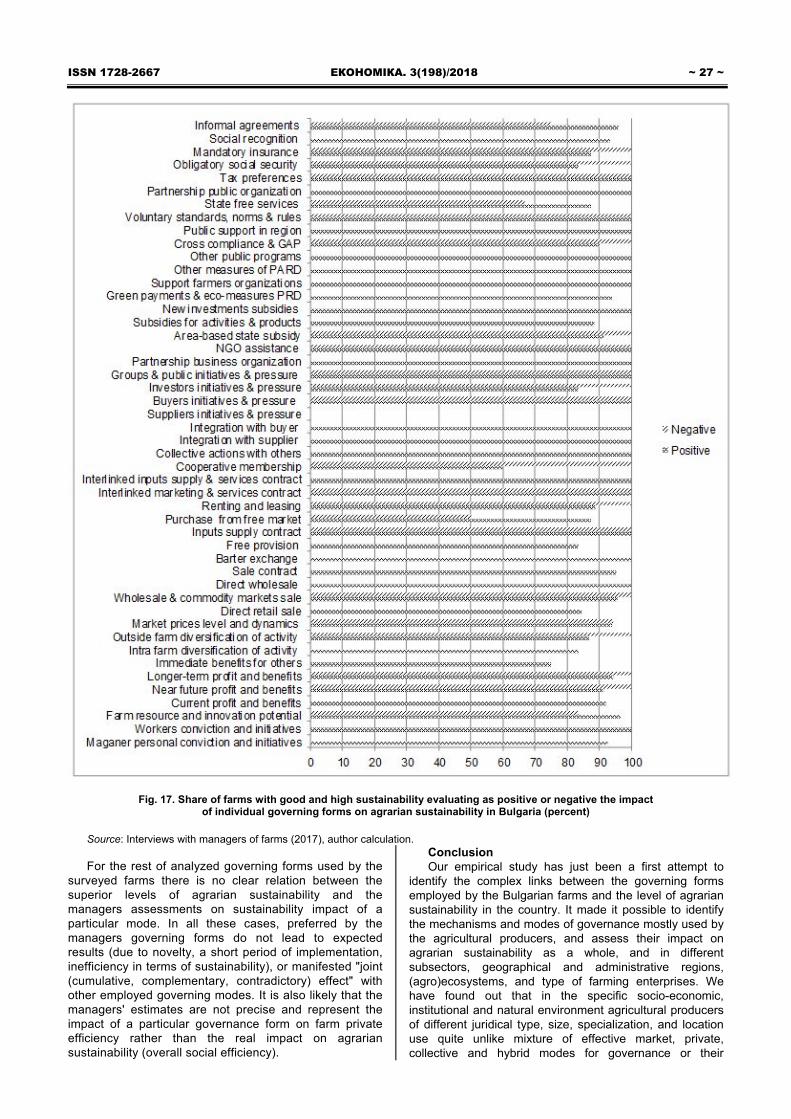
ISSN 1728-2667 ЕКОНОМІКА. 3(198)/2018 ~ 27 ~
Fig. 17. Share of farms with good and high sustainability evaluating as positive or negative the impact of individual governing forms on agrarian sustainability in Bulgaria (percent)
Source: Interviews with managers of farms (2017), author calculation. For the rest of analyzed governing forms used by the
surveyed farms there is no clear relation between the superior levels of agrarian sustainability and the managers assessments on sustainability impact of a particular mode. In all these cases, preferred by the managers governing forms do not lead to expected results (due to novelty, a short period of implementation, inefficiency in terms of sustainability), or manifested "joint (cumulative, complementary, contradictory) effect" with other employed governing modes. It is also likely that the managers' estimates are not precise and represent the impact of a particular governance form on farm private efficiency rather than the real impact on agrarian sustainability (overall social efficiency).
Conclusion Our empirical study has just been a first attempt to
identify the complex links between the governing forms employed by the Bulgarian farms and the level of agrarian sustainability in the country. It made it possible to identify the mechanisms and modes of governance mostly used by the agricultural producers, and assess their impact on agrarian sustainability as a whole, and in different subsectors, geographical and administrative regions, (agro)ecosystems, and type of farming enterprises. We have found out that in the specific socio-economic, institutional and natural environment agricultural producers of different juridical type, size, specialization, and location use quite unlike mixture of effective market, private, collective and hybrid modes for governance or their
~ 28 ~ В І С Н И К Київського національного університету імені Тараса Шевченка ISSN 1728-3817 activities and relations. Individual factors and modes which most contribute to improvement of agrarian sustainability at the current stage of development in the country are: managers' personal convictions and initiatives, farms resources and innovation potential, near future profit and benefits strategies, market prices levels and dynamics, area-based EU subsidies, and informal agreements.
Nevertheless, evolution of the system of agrarian governance and the level of agrarian sustainability depends on various economic, political, behavioral, demographic, technological, international, natural etc. factors. Individual, joint and spillover effects of all these factors are to be accounted for and assessed in further research in that new area. Particularly, it is important to incorporate into analysis and assess the impact of the formal and informal components of institutional environment which are critical and eventually determine agents' behavior and level of agrarian sustainability. Besides, always there is a certain "time lag" between the "improvement" of the system of governance, and the positive, negative or neutral impact on agrarian sustainability, and its economic, social and environmental aspects. All these factors are to be studied in such assessments as estimates also made on the "dynamics" of the impact over a longer time horizon.
Research on the relations between the governing structure and the (level and dynamics of) agrarian sustainability is to continue though expansion of the number and representation of surveyed holdings, and the spectrum of the specific governing modes used by the farms of different type as well as assessments of the impact of institutions on agrarian sustainability. What is more, applied methods are to be enriched in order to specify better the complex relations between the agrarian governance and sustainability. Furthermore, modes of governance at higher hierarchical levels (sector, national, transnational) have to be specified and their separate and/or complementary impact on agrarian sustainability evaluated.
Having in mind the importance of comprehensive assessments of the impacts of governing system on agrarian sustainability, and the enormous benefits for farm management and agrarian policies, this type of studies are to be expended and their precision and representation increased. The latter however, requires a close cooperation between all interested parties, and participation of farmers, agrarian organizations, local and central authorities, interest groups, research institutes and experts, etc. Moreover, the precision of estimates has to be improved, and besides on the estimates of farm managers to incorporate other relevant information – experts and stakeholders' assessments, monitoring, report, statistical, etc. data, studies on "actual" (rather than declared) behavior of various agrarian and non-agrarian agents, and associated "effects" on agrarian sustainability, etc.
References 1. Bachev, H., 2002. Study on Land Supply in Bulgarian Farms, Farm
Management and Rural Planning, 3, pp. 189-203. 2. Bachev, H., 2003. Study on Labor Supply in Bulgarian Farms,
Farm Management and Rural Planning, 4, pp. 129-145. 3. Bachev, H., 2009. Mechanisms of Governance of Agro-Ecosystem
Services, in P. Liotta, D. Mouat, J. Lancaster, B. Kepner and D. Smith (editors), Achieving Environmental Security: Ecosystem Services and Human Welfare, Amsterdam: IOS Press, pp. 31-52.
4. Bachev, H., 2010. Governance of Agrarian Sustainability, New York: Nova Science Publishers.
5. Bachev, H., 2010. Management of Farm Contracts and Competitiveness, Saarbrücken: VDM Verlag Dr.Muller.
6. Bachev, H., 2011. Water Governance in Bulgarian Agriculture, in A. Baba, G. Tayfur, O. Gunduz, K.Howard, M.Friedel, and A.Chambel (editord), Climate Change and its Effects on Water Resources, Issues of National and Global Security, Springer Science+Business Media B.V., 215-224.
7. Bachev, H., 2014. Environmental Management in Agriculture, Mechanisms, Forms and Efficiency, Saarbrücken: LAP LAMBERT Academic Publishing.
8. Bachev, H., 2016. Defining and Assessing the Governance of Agrarian Sustainability, Journal of Advanced Research in Law and Economics, Volume VII, Issue 4(18), 797-816. DOI: 10.14505/ jarle.v7.4(18).12.
9. Bachev, H., 2017. Sustainability Level of Bulgarian Farms, Bulgarian Journal of Agricultural Science, 23 (1), pp. 1-13.
10. Bachev, H., 2018: Impact of Institutional Environment on Agrarian Sustainability in Bulgaria, Economic Thought, 2 (fortcoming).
11. Bachev, H., 2018. The Sustainability of Farming Enterprises in Bulgaria, Newcastle upon Tyne: Cambridge Scholars Publishing.
12. Bachev, H. and Tsuji, M., 2001. Structures for Organization of Transactions in Bulgarian Agriculture, Journal of the Faculty of Agriculture of Kyushu University, No 46 (1), pp. 123-151.
13. Bachev, H. and Kagatsume, M., 2002. Governing of Financial Supply in Bulgarian Farms, The Natural Resource Economics Review, No 8, pp. 131-150.
14. Bachev, H. and Kagatsume, M., 2003. Governing of Output Realization in Bulgarian Farms, The Natural Resource Economics Review, 9, pp. 55-69.
15. Bachev, H. and Nanseki, T., 2008. Environmental Management in Bulgarian Agriculture – Risks, Modes, Major Challenges, Journal of the Faculty of Agriculture of Kyushu University, No 53(1), pp. 363-373.
16. Bachev, H., Ivanov, B., Toteva, D., Sokolova, E., 2016: Agrarian Sustainability and its Governance – Understanding, Evaluation, Improvement, Journal of Environmental Management and Tourism, Vol. 7 (4), pp. 639-663. DOI: https://doi.org/10.14505//jemt.v7.4(16).11.
17. Bachev, H., Ivanov, B., Toteva, D. and Toteva, E., 2017: Agrarian sustainability in Bulgaria – economic, social and ecological aspects, Bulgarian Journal of Agricultural Science, Vol. 23 (4), pp. 519-525.
18. Bachev, H., Terziev, D., 2018. A Study on Agrarian Sustainability Impact of Governance Modes in Bulgaria, Journal of Applied Economic Sciences, Volume 8, 2(56) (fortcoming).
19. Bachev, H. and Terziev, D., 2017. Environmental Sustainability of Agricultural Farms in Bulgaria, Journal of Environmental Management and Tourism, Vol. 8, No 5, pp. 968-994. DOI:10.14505/jemt.v8.5(21).02.
20. EC. 2017 Sustainable agriculture and rural development policy – agricultural development, European Commission.
21. Furuboth, E. and Richter, R., 1998. Institutions and Economic Theory: The Contribution of the New Institutional Economics, Ann Arbor: The University of Michigan Press.
22. Georgiev, M., 2010. "Rent Seeking" in Agricultural Contracts in the Country, Trakia Journal of Sciences, Vol. 8, 3, pp. 230-233.
23. North, D., 1990. Institutions, Institutional Change and Economic Performance, Cambridge: Cambridge University Press.
24. Raman, S., 2006. Agricultural Sustainability. Principles, Processes and Prospect, New York: The Haworth Press Inc.
25. Sauvenier, X., Valekx, J, Van Cauwenbergh, N., Wauters, E., Bachev, H., Biala, K., Bielders, C. and Peeters, A., 2005. Framework for Assessing Sustainability Levels in Belgium Agricultural Systems – SAFE, Belgium Science Policy, Brussels.
26. Terziev, D., Radeva, D., 2016. Studying the New Agriculture, 2nd International Conference on Development and Economics (I.CO.D.ECON.), Thessaloniki, Greece, Conference proceedings: https://icodecon.com/ images/docs/proceedings_2017_3_18.pdf, 175-179.
27. UN. 1992. Report of the United Nations Conference on Environment and Development, 3-14 June 1992, Rio de Janeiro: United Nation.
28. UN. 2015. Paris Climate Change Conference, November-December 2015.
29. Williamson, O., 1996. The Mechanisms of Governance, Oxford: Oxford University Press.
R e c e i ve d : 26 / 0 3 / 20 18 1 s t Re v is i o n : 2 0 / 04 / 18
Ac c e p t e d : 10 / 0 5 / 20 18 Author's declaration on the sources of funding of research
presented in the scientific article or of the preparation of the scientific article: budget of university's scientific project

ISSN 1728-2667 ЕКОНОМІКА. 3(198)/2018 ~ 29 ~ Х. Башев, д-р екон. наук, проф. Інститут аграрної економіки, Софія, Болгарія
ЕМПІРИЧНЕ ДОСЛІДЖЕННЯ ЗВ'ЯЗКУ МІЖ УПРАВЛІННЯМ ТА СТІЙКІСТЮ В БОЛГАРСЬКОМУ СІЛЬСЬКОМУ ГОСПОДАРСТВІ
Застосовано міждисциплінарну структуру нової інституціональної економіки, визначено різні ринкові, приватні, колективні, гро-мадські та гібридні способи управління й оцінено їхній вплив на аграрну стійкість у Болгарії. Викладено методологічну основу дослі-дження, визначено домінуючі режими управління в болгарських господарствах різного юридичного типу, розмір, спеціалізацію, еколо-гічне й географічне розташування та оцінено їхній вплив на стійкість сільського господарства і його економічні, соціальні та екологі-чні основи. Представлено висновки для подальших досліджень, удосконалення державної політики та формування приватної управлін-ської стратегії. Сільськогосподарські виробники різного призначення у своїй діяльності й відносинах використовують абсолютно не схожі комбінації ефективних ринкових, приватних, колективних і гібридних способів управління. Окремі фактори і способи, які найбільше сприяють поліпшенню аграрної стійкості на сучасному етапі розвитку, – це особисті переконання та ініціативи менедже-ра, ресурси фермерських господарств, інноваційний потенціал, стратегії майбутніх прибутків і вигод, рівні та динаміка ринкових цін, субсидії на основі регіонів, а також і неофіційні угоди.
Ключові слова: аграрне управління, стійкість, ринок, приватний, колективний, гібридний режими, Болгарія Х. Башев, д-р экон. наук, проф. Институт аграрной экономики, София, Болгария
ЭМПИРИЧЕСКОЕ ИССЛЕДОВАНИЕ СВЯЗИ МЕЖДУ УПРАВЛЕНИЕМ И УСТОЙЧИВОСТЬЮ
В БОЛГАРСКОМ СЕЛЬСКОМ ХОЗЯЙСТВЕ Применена междисциплинарная структура новой институциональной экономики, определяются различные рыночные, частные,
коллективные, общественные и гибридные способы управления и оценивается их влияние на аграрную устойчивость в Болгарии. Изложена методологическая основа исследования, определены доминирующие режимы управления в болгарских хозяйствах различно-го юридического типа, размер, специализация, экологическое и географическое расположение и оценено их влияние на устойчивость сельского хозяйства и его экономические, социальные и экологические основы. Представлены выводы относительно дальнейших исследований, совершенствования государственной политики и формирования частной управленческой стратегии. Сельскохозяй-ственные производители различного назначения в своей деятельности и отношениях используют совершенно не похожие комбина-ции эффективных рыночных, частных, коллективных и гибридных способов управления. Отдельные факторы и способы, наиболее способствующие улучшению аграрной устойчивости на современном этапе развития, – это личные убеждения и инициативы мене-джера, ресурсы фермерских хозяйств и инновационный потенциал, стратегии будущих прибылей и выгод, уровни и динамика рыноч-ных цен, субсидии на основе регионов, и неофициальные соглашения.
Ключевые слова: аграрное управление, устойчивость, рынок, частный, коллективный, гибридный режимы, Болгария.
Bulletin of Taras Shevchenko National University of Kyiv. Economics, 2018; 3(198): 29-34 УДК 340 JEL classification: F21, F23 DOI: https://doi.org/10.17721/1728-2667.2018/198-3/2
L. Belascu, Doctor of Sciences (Economics), Professor ORCID iD 0000-0002-7711-3746
Lucian Blaga University of Sibiu, Sibiu, Romania, А. Horobet, Doctor of Sciences (Economics), Professor,
ORCID iD 0000-0001-5821-0244 O. Popovici, Doctor of Sciences (Economics), Assistant Professor
ORCID iD 0000-0002-0457-9190 Bucharest University of Economic Studies, Bucharest, Romania
LOCATION ATTRIBUTES OF EMERGING ECONOMIES: AN ANALYSIS USING PRINCIPAL COMPONENTS
Our paper investigates the location attributes of a large sample of emerging economies from the perspective of foreign direct
investments and multinational companies' presence abroad. We use several macroeconomic variables that take into account the relevant location attributes for the decision of multinational companies to invest abroad and include them in a Principal Compo-nents Analysis to reveal the most relevant locational attributes or combination of such attributes that influence the decision of multinational companies to invest abroad. We find that only four variables had the most important contributions to the principal components: GDP per capita, international reserves, mobile phones subscriptions and labour force. Labour force is the variable that contributes the most to the first factor and its contribution grows in importance as we depart from 1994. At the same time, GDP per capita has become less important in recent years.
Key words: foreign direct investments, emerging economies, principal components analysis. Introduction. The interest that emerging markets de-
veloped for attracting foreign direct investments (FDI) is based on the latter being perceived as drivers of sustained economic growth, through various channels – increased employment (Santos-Paulino A. and Wan G. [22], Inekwe J. [14]), higher factor productivity (Nair-Reichert U. and Wein-hold D. [21], Zhou D. et al. [25]), technological spillovers (Balasubramanyam V. et al. [2], Borensztein E. et al. [6]), human capital development (Miyamoto K. [18], Majeed M. and Ahmad E. [19]) and export markets (Zhang K. and Song S. [24], Kneller R. and Pisu M. [16]). On the other hand, when one observes multinational enterprises' prefer-ence for foreign direct investments instead of exports or oth-er internationalization forms, these companies tend to delo-
calize in foreign markets only if their so-called "internalization advantages" allow them to do so (Dunning J. [9]).
In this framework one should not be surprised that a permanent competition between emerging and developed markets, on one hand, and between emerging markets, on the other hand, has surfaced in the last decades. This competition is based on two types of attractiveness factors for multinational enterprises: on one hand, one can identify a number of "genuine" attributes of emerging markets, and, on the other hand, we may refer to various types of incen-tives and stimuli offered by emerging markets governments to multinational enterprises, in their attempts to attract higher volumes of foreign direct investments.
The "genuine" factors were divided in two main catego-ries, according to existing academic literature: (1) the "tra-
© Belascu L., Horobet А., Popovici O., 2018

~ 30 ~ В І С Н И К Київського національного університету імені Тараса Шевченка ISSN 1728-3817 ditional" factors, and (2) the "new" factors. Among the "tra-ditional" factors the literature makes reference to: (1) mar-ket size and growth potential, as indicators of a country's potential to absorb outputs and/or to benefits from large production volumes in the form of economies of scale (Bevan A. and Estrin S. [4]); (2) low costs and higher avail-ability of production factors, particularly in terms of labour and raw materials (Kinda T. [15]); (3) low and/or immature competition, which might provide a "first-mover" advantage to the multinational company (Boeri T. and Brucker H. [5], Liang Y. [17]); (d) infrastructure, as transportation and communication networks (Mollick A. et al. [20]). The "new" factors advanced by the existing literature and that have the potential to increase the emerging economies' attrac-tiveness for foreign direct investments are: (1) macroeco-nomic stability, which encompasses transparent institutions (Campos N. and Kinoshita Y. [7]), the extent of private property (Carstensen K. and Toubal F. [8]), the conditions related to profit repatriation, general legislation and tax regimes applicable to foreign companies (Wei S. [23]), or the corruption level (Al-Sadig A. [1]); (2) geographic dis-tance, particularly the establishment of closer links be-tween industrial locations and marketplaces, with influence on transport and communication costs (Bénassy-Quéré A. et al. [3]); (3) the level and dynamics of country risk (Hol-land D. and Pain N. [11], Hayakawa K. et al. [10]).
The goal of the present paper resides in investigating the dynamics of location attributes of emerging markets by taking into account several of the above mentioned factors and in identifying the changing importance of these factors in time foreign direct investments. The main contribution our paper has to the academic literature in the field is to characterize in dynamics the shifting location attributes of emerging economies from the FDI perspective, thus provid-ing support for local institutions regarding the decision-making process in favor of multinational enterprises' pres-ence in these economies.
The paper is organized as follows: Section 1 describes the data and methodology used in the empirical analysis, Section 2 presents the most important results of our re-search, while Section 3 concludes and indicates directions for further research.
1. Data and research methodology. The research is undertaken on a large sample of emerging countries (41), from different regions and with various levels of develop-ment, but included in this category by BBVA Research. The emerging countries employed in our analysis are classified in three categories, based on countries' absolute growth, as follows: (1) Emerging and Growth Leading Emerging Econ-omies (EAGLE) – these countries have an expected incre-mental GDP that will surpass the average G7 economies' GDP (except USA) in the next ten years: China, India, Indo-nesia, South Korea, Brazil, Mexico, Russia, and Turkey; (2) NEST – these are countries with an expected incremental GDP lower than the average G7 economies' GDP (except USA) in the next ten years, but higher than Italy's: Argentina, Bangladesh, Chile, Colombia, Egypt, Malaysia, Nigeria, Pa-kistan, Peru, Poland, Thailand, South Africa, Ukraine and Vietnam; (3) Other Emerging Markets: Bahrain, Bulgaria, Czech Republic, Estonia, Hungary, Jordan, Kuwait, Latvia, Lithuania, Mauritius, Morocco, Oman, Romania, Slovakia, Sri Lanka, Sudan, Tunisia, UAE and Venezuela.
The empirical analysis uses ten macroeconomic varia-bles that illustrate the relevant locational attributes for MNE's decisions to invest abroad, grouped in five catego-ries: (1) Market size and potential attributes – this category includes three variables: (i) GDP per capita in US dollars (GDPC); (ii) domestic credit to private sector as percentage of GDP (DC); and (iii) the percentage of urban population
in total population (UP); (2) Country risk attributes – this category includes two variables: (i) the inflation rate (INF), as the annual percentage change of the Consumer Price Index; and (ii) international reserves including gold (IR), denominated in US dollars; (3) Infrastructure and access to information attributes – one variable, as the number of mobile cellular subscriptions per one hundred people (MS); (4) Labour market attributes – this category includes two variables: (i) the labour force (LBF), as the number of peo-ple aged 15 and older who represent economically active population, according to the International Labour Organiza-tion, and (ii) labour force participation rate (LBP), calculat-ed as percentage of total economically active population above 15 years, who work for the production of goods and services during a specified period; (5) World economic integration attributes – two variables: (i) trade balance in US dollars (TB) and (ii) trade openness (TO), calculated as sum of imports and exports and divided by GDP. Data on location attributes is collected for the period 1994–2011 with annual frequency from various data sources: Eurostat, Organization for Economic Co-operation and Development (OECD) Database, World Trade Organization (WTO) Da-tabase and World Bank.
Principal Components Analysis (PCA) is a multivariate data analysis method that aims at converting a set of ob-servations belonging to probably correlated variables into principal components that represent a set of linearly uncor-related variables. PCA was developed by Hotelling (1933) and Hotelling (1936) and is typically used as an exploratory data analysis tool and for constructing predictive models. The technique finds a set of weighted linear composites of the original variables where each composite (a "principal component") is uncorrelated with the others. The weights are identified through eigen-decomposition that generates eigenvalues (these represent the amount of variation ac-counted for by the composite) and eigenvectors (they give the weights for the original variables).
In our paper, PCA is used with the aim of reducing the number of variables that supposedly influence the location decision of multinational companies (MNEs), thus allowing us to identify of a smaller number of country or location attributes that are relevant for the decision of MNEs to in-vest abroad. PCA leads to this set of factors by developing an analysis in the N-dimensional space defined by P varia-bles (countries' location attributes) and N cases (each emerging country is a particular case), which presumes diagonalizing of a symmetric matrix – a covariance or cor-relation matrix. The result consists of a set of factors that represent a linear combination of original variables and that are uncorrelated. Also, their number is reduced, while their contribution to total data variance is maximal.
In performing the PCA we are interested in identifying the countries' grouping based on the two most important factors and in observing the contribution of each variable to the first most important factor, as a way of determining which variables contribute the most to the grouping. PCA is undertaken for each year and for the entire time frame of our analysis. This approach provides us with a dynamic perspective on the shifting country attributes that influence the MNEs' decisions to delocalize abroad.
2. Results. The first step in our empirical analysis in-volves calculating the eigenvalue for each factor and of retaining only those factors that had a eigenvalue which is higher than 1. As Table 1 shows, the number of principal components (factors) that are significant varies between two to four, depending on the year, as well as over the en-tire period. At the same time, the first two factors explain more than 50% of the total variance, while the first factor is

ISSN 1728-2667 ЕКОНОМІКА. 3(198)/2018 ~ 31 ~ always the most significant, regardless of the time frame of the analysis – annual or over the entire time frame.
The second step is an analysis of how much each var-iable has contributed to the first factor, annually (see Ta-ble 2) and overall. Only four variables have the most im-portant contributions to the principal components, regard-less of the year for which the analysis is undertaken: GDP per capita (in 1994, 1995 and 1996), international reserves (in 1999 and 2000), mobile subscriptions (in 2004, 2009 and 2010) and labour force (in 1997, 1998, 2001, 2002, 2003, 2005, 2006, 2007, 2008 and 2011). By far, labour force is the variable that contributes the most to the first factor and its contribution becomes more important as we move from 1994 to 2011. At the same time, GDP per capita becomes less important towards 2011. International
reserves is a variable that displays an interesting pattern over the years, with important contributions between 1997 and 2003, and afterwards with diminishing importance in 2004 and with increasing values of its contribution until 2010. The fact that labour force is the most important vari-able that explains the differences between countries should not come as a surprise, given the various sizes of emerg-ing countries' populations and, consequently, their labour force. Interesting enough, GDP per capita does not play a significant role in terms of differentiation, except for 1994 to 1996. At the other end, a number of variables hold small explanatory power for the differences between countries: domestic credit, trade balance, trade openness, percent-age of urban population and labour participation.
Tab le 1. Eigenvalues and total variance explained by the significant principal components
YearValue
NumberEigenvalue
% Total Variance
Cumulative Eigenvalue
Cumulative %
YearValue
NumberEigenvalue
% Total Variance
Cumulative Eigenvalue
Cumulative %
1 2.681 26.812 2.681 26.812 1 3.014 30.139 3.014 30.1392 2.515 25.154 5.197 51.966 2 2.500 25.001 5.514 55.1403 1.417 14.171 6.614 66.138 3 1.427 14.267 6.941 69.4074 1.100 10.999 7.714 77.136 1 3.137 31.373 3.137 31.3731 2.751 27.511 2.751 27.511 2 2.433 24.331 5.570 55.7042 2.309 23.088 5.060 50.599 3 1.337 13.369 6.907 69.0733 1.512 15.117 6.572 65.715 1 3.045 30.448 3.045 30.4481 2.770 27.700 2.770 27.700 2 2.438 24.376 5.482 54.8252 2.384 23.835 5.154 51.535 3 1.309 13.091 6.792 67.9163 1.315 13.149 6.468 64.684 4 1.031 10.310 7.823 78.2264 1.149 11.489 7.617 76.173 1 3.021 30.212 3.021 30.2121 3.073 30.733 3.073 30.733 2 2.925 29.255 5.947 59.4672 2.453 24.527 5.526 55.260 3 1.347 13.470 7.294 72.9373 1.198 11.981 6.724 67.241 1 3.038 30.378 3.038 30.3784 1.107 11.075 7.832 78.316 2 2.777 27.771 5.815 58.1491 2.852 28.521 2.852 28.521 3 1.464 14.642 7.279 72.7912 2.718 27.184 5.571 55.705 1 2.790 27.900 2.790 27.9003 1.325 13.245 6.895 68.951 2 2.528 25.282 5.318 53.1821 2.678 26.777 2.678 26.777 3 1.565 15.655 6.884 68.8362 2.510 25.099 5.188 51.876 4 1.030 10.299 7.914 79.1353 1.385 13.855 6.573 65.731 1 48.753 27.085 48.753 27.0854 1.170 11.697 7.743 77.428 2 43.365 24.092 92.118 51.1761 2.554 25.543 2.554 25.543 3 22.636 12.575 114.753 63.7522 2.496 24.956 5.050 50.499 4 15.130 8.405 129.883 72.1573 1.356 13.561 6.406 64.060 5 10.323 5.735 140.206 77.8921 2.673 26.733 2.673 26.733 6 7.253 4.029 147.458 81.9212 2.491 24.914 5.165 51.646 7 6.010 3.339 153.468 85.2603 1.304 13.045 6.469 64.691 8 4.675 2.597 158.143 87.8574 1.093 10.925 7.562 75.616 9 3.469 1.927 161.613 89.7851 2.876 28.757 2.876 28.757 10 3.016 1.676 164.629 91.4612 2.578 25.784 5.454 54.541 11 2.305 1.280 166.934 92.7413 1.444 14.445 6.899 68.985 12 2.075 1.153 169.009 93.8941 2.813 28.127 2.813 28.127 13 1.522 0.845 170.531 94.7392 2.610 26.097 5.422 54.225 14 1.373 0.763 171.904 95.5023 1.596 15.964 7.019 70.188 15 1.255 0.697 173.158 96.1991 2.864 28.643 2.864 28.643 16 1.084 0.602 174.243 96.8022 2.605 26.054 5.470 54.6973 1.523 15.230 6.993 69.9271 2.910 29.101 2.910 29.1012 2.651 26.505 5.561 55.6063 1.514 15.141 7.075 70.747
2005
1999
2001
2002
1995
1996
1997
1998
2000
2004
2006
2003
2007
2008
2009
2011
1994-2011
2010
1994
Source: Authors' calculations. For the entire period, the results uncovered by the an-
nual analysis are confirmed: cumulatively, labor force con-tributes to the first component by 29.20%, followed by in-ternational reserves (22.25%) and the percentage of urban
population (11.45%). The variables with the lowest cumula-tive importance are inflation rate (0.31%), domestic credit (1.13%) and labour participation (3.63%).
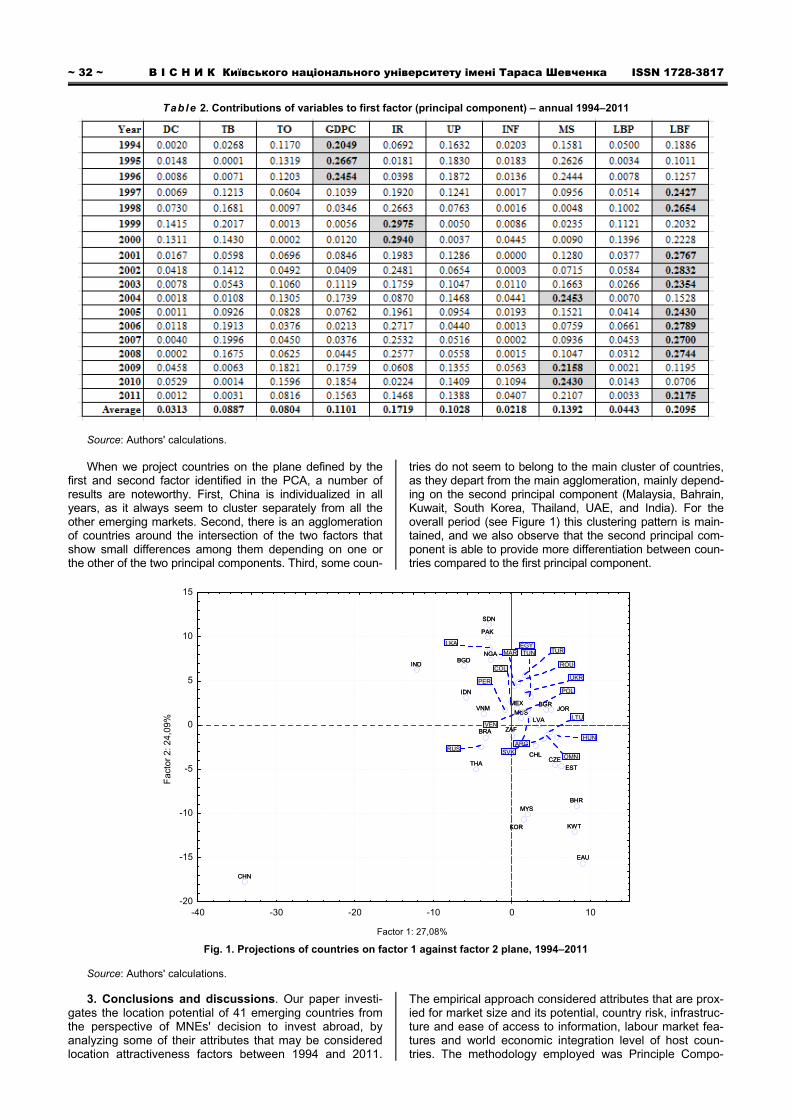
~ 32 ~ В І С Н И К Київського національного університету імені Тараса Шевченка ISSN 1728-3817
Table 2. Contributions of variables to first factor (principal component) – annual 1994–2011
Source: Authors' calculations. When we project countries on the plane defined by the
first and second factor identified in the PCA, a number of results are noteworthy. First, China is individualized in all years, as it always seem to cluster separately from all the other emerging markets. Second, there is an agglomeration of countries around the intersection of the two factors that show small differences among them depending on one or the other of the two principal components. Third, some coun-
tries do not seem to belong to the main cluster of countries, as they depart from the main agglomeration, mainly depend-ing on the second principal component (Malaysia, Bahrain, Kuwait, South Korea, Thailand, UAE, and India). For the overall period (see Figure 1) this clustering pattern is main-tained, and we also observe that the second principal com-ponent is able to provide more differentiation between coun-tries compared to the first principal component.
ARG
BHR
BGD
BRA
BGR
CHL
CHN
COL
CZE
EGY
EST
HUN
IND
IDN
JOR
KWT
LVA LTU
MYS
MUS
MEX
MARNGA
OMN
PAK
PER
POL
ROU
RUS SVK
ZAF
KOR
LKA
SDN
THA
TUN TUR
UKR
EAU
VEN
VNM
-40 -30 -20 -10 0 10
Factor 1: 27,08%
-20
-15
-10
-5
0
5
10
15
Fac
tor
2: 2
4,09
%
ARG
BHR
BGD
BRA
BGR
CHL
CHN
COL
CZE
EGY
EST
HUN
IND
IDN
JOR
KWT
LVA LTU
MYS
MUS
MEX
MARNGA
OMN
PAK
PER
POL
ROU
RUS SVK
ZAF
KOR
LKA
SDN
THA
TUN TUR
UKR
EAU
VEN
VNM
Fig. 1. Projections of countries on factor 1 against factor 2 plane, 1994–2011
Source: Authors' calculations. 3. Conclusions and discussions. Our paper investi-
gates the location potential of 41 emerging countries from the perspective of MNEs' decision to invest abroad, by analyzing some of their attributes that may be considered location attractiveness factors between 1994 and 2011.
The empirical approach considered attributes that are prox-ied for market size and its potential, country risk, infrastruc-ture and ease of access to information, labour market fea-tures and world economic integration level of host coun-tries. The methodology employed was Principle Compo-

ISSN 1728-2667 ЕКОНОМІКА. 3(198)/2018 ~ 33 ~ nents Analysis, with the purpose of identifying of a smaller number of location attributes that are relevant for MNEs' decision to delocalize abroad.
The empirical analysis revealed that a number of only four variables had the most important contributions to the principal components, regardless of the year for which the analysis is undertaken: GDP per capita, international re-serves, mobile subscriptions and labour force. By far, la-bour force is the variable that contributes the most to the first factor and its contribution becomes more important as we depart from 1994. At the same time, GDP per capita became less important in recent years.
Further research on this topic is intended, as follows. First, a larger panel of emerging markets is to be included in the analysis, differentiated according to their develop-ment level and volume of inward FDI. Second, the number of variables employed in the analysis needs to be enlarged, as to reflect in a more comprehensive and accurate man-ner the characteristics of emerging host economies. Third, these attributes need to be connected with the existing level of foreign direct investments and other investigation methods to be used in order to reveal the connection be-tween those attributes and the multinational enterprises' decision to invest abroad.
References 1. Al-Sadig, A. 2009. The Effects of Corruption on FDI Inflows, Cato
Journal, Vol. 29, рр. 267-294. 2. Ballasubramanyam, V.N., Salisu, M., Sapford, D. 1998. Foreign
Direct Investment and Growth in EP and IS Countries, Economic Journal, Vol. 106, рр. 92-105. Available at: http://dx.doi.org/10.2307/2234933.
3. Bénassy-Quéré, A., Coupet, M., Mayer, T. 2007. Institutional Determinants of Foreign Direct Investment, The World Economy, Vol. 30, рр. 764-782, DOI: 10.1111/j.1467-9701.2007.01022.x
4. Bevan, A., Estrin, S. 2000. The Determinants of Foreign Direct Investment in Transition Economies, Discussion Paper 342. [Online], William Davidson Institute, 2000. Available at: http://wdi.umich.edu/files/ publications/workingpapers/wp342.pdf
5. Boeri T., Brucker, H. 2000. The Impact of Eastern Enlargement on Employment and Labour Markets in the EU Member States, Report under contract SOC-97-102454. [Online], European Integration Consortium, 2000, http://www.diw.de/documents/dokumentenarchiv/17/38468/eic_employment.pdf
6. Borensztein, E., De Gregorio, J., Lee, J-W. 1998. How does foreign direct investment affect economic growth? Journal of International Economics,. Vol. 45, рр. 115-135, https://doi.org/10.1016/S0022-1996(97)00033-0.
7. Campos, N., Kinoshita, Y., 2003. Why Does Foreign Direct Investment Go Where It Goes? New Evidence from the Transition Economies, Working Paper Number 573. [Online], William Davidson Institute, 2003. Available at: http://deepblue.lib.umich.edu/bistream/handle/ 2027.42/39959/wp573.pdf
8. Carstensen, K., Toubal, F. 2002. Foreign Direct Investment in CEE countries: a dynamic panel analysis, Journal of Comparative Economics, Vol. 32, рр. 3-22. Available at: https://doi.org/10.1016/j.jce.2003.11.001
9. Dunning, J. 2001. The Eclectic (OLI) Paradigm of International Production: Past, Present and Future, Journal of the Economics of
Business, Vol. 8. рр. 173-190. Available at: https://doi.org/10.1080/ 13571510110051441.
10. Hayakawa, K., Kimura, F., Lee, H-H. 2013. How Does Country Risk Matter for Foreign Direct Investment?, The Developing Economies, Vol. 51, рр. 60-78. DOI: 10.1111/deve.12002.
11. Holland, D., Pain, N. The Determinants and Impact of Foreign Direct Investments in the Transition Economies: A Panel Data Analysis [Online]. Available at: https://www.researchgate.net/publication/ 228972963_The_determinants_and_impact_of_foreign_direct_investment_in_the_transition_economies_a_panel_data_analysis
12. Hotelling, H. 1933. Analysis of a complex of statistical variables into principal components, Journal of Educational Psychology, Vol. 24, рр. 417–441 and 498–520. Available at: http://dx.doi.org/10.1037/h0071325
13. Hotelling, H. 1936. Relations between two sets of variates, Biometrika, Vol. 28, рр. 321–77. Available at: https://doi.org/10.1093/ biomet/28.3-4.321.
14. Inekwe, J. N. 2013. FDI, Employment and Economic Growth in Nigeria, African Journal of Development, Vol. 25, рр. 421-433. DOI: 10.1111/1467-8268.12039.
15. Kinda, T. 2010. Investment Climate and FDI in Developing Countries: Firm-Level Evidence, World Development, Vol. 38, рр. 498-513. Available at: https://doi.org/10.1016/j.worlddev.2009.12.001.
16. Kneller, R., Pisu, M. 2007. Industrial Linkages and Export Spillovers from FDI, World Economy, Vol. 30, рр. 105-134. DOI: 10.1111/j.1467-9701.2007.00874.x
17. Liang, Y. 2007. FDI, Competitive Menace, and the Evolution of Labor Practices in China, The Chinese Economy, Vol. 40, рр. 21-51, DOI 10.2753/CES1097-1475400502
18. Miyamoto, K. 2003. Human Capital Formation and Foreign Direct Investment in Developing Countries, Working paper 211. [Online], Organisation for Economic Co-operation and Development (OECD), 2003. Available at: http://papers.ssrn.com/sol3/papers.cfm?abstract_id=668505.
19. Majeed, M. T., Ahmad, E. 2008. Human Capital Development and FDI in Developing Countries, Journal of Economic Cooperation, Vol. 29. рр. 79-104.
20. Mollick, A. V., Ramos-Duran, R., Silva-Ochoa, E. 2006. Infrastructure and FDI flows in Mexico: A Panel Data Approach, Global Economy Journal, Vol. 6. рр. 1-27. Available at: https://doi.org/10.2202/1524-5861.1094.
21. Nair-Reichert, U., Weinhold, D. 2001. Causality Tests for Cross-Country Panels: a New Look at FDI and Economic Growth in Developing Countries, Oxford Bulletin of Economics and Statistics, Vol. 63., рр. 153-171, DOI: 10.1111/1468-0084.00214.
22. Santos-Paulino, A. W., Wan, G. 2009. FDI, Employment, and Growth in China and India, Review of Development Economics, Vol. 13, рр. 737-739, DOI: 10.1111/j.1467-9361.2009.00512.x
23. Wei, S. 2000. How Taxing Is Corruption on International Investors, Review of Economics and Statistics, Vol. 82, рр. 1-11. Available at: https://doi.org/10.1162/003465300558533.
24. Zhang, K. H., Song, S. 2002. Promoting exports: the role of inward FDI in China, China Economic Review, Vol. 11. рр. 385-396. Available at, https://doi.org/10.1016/S1043-951X(01)00033-5.
25. Zhou, D., Li, S., Tse, D. K. 2002. The impact of FDI on the productivity of domestic firms: the case of China, International Business Review, Vol. 11, рр. 465-484. Available at: https://doi.org/10.1016/S0969-5931(02)00020-3.
R e c e i ve d : 30 / 0 1 / 20 18 1 s t Re v i s i o n : 1 0 / 05 / 20 1 8
Ac c e p t e d : 01 / 0 6 / 18 Author's declaration on the sources of funding of research
presented in the scientific article or of the preparation of the scientific article: budget of university's scientific project
Л. Беласку, д-р екон. наук, проф. Університет імені Лучіана Блага, Сібіу, Румунія, О. Хоробет, д-р екон. наук, проф., О. Поповичі, д-р екон. наук, доц. Бухарестський економічний університет, Бухарест, Румунія
ЛОКАЛЬНІ АТРИБУТИ КРАЇН, ЩО РОЗВИВАЮТЬСЯ: АНАЛІЗ ВИКОРИСТАННЯ ОСНОВНИХ КОМПОНЕНТ
Досліджуються атрибути розташування великої вибірки країн з економікою, що розвивається, в аспекті прямих іноземних інвес-тицій та присутності міжнародних компаній за кордоном. Використовуються кілька макроекономічних змінних, які є гіпотезами, щоб ілюструвати, як саме відповідні атрибути місцеположення включати в аналіз основних компонент для рішень міжнародних компаній, щоб виявити найбільш релевантні географічні характеристики або комбінацію таких атрибутів, які впливають на рішення багато-національних компаній інвестувати за кордон. Виявлено, що основні компоненти складаються лише із чотирьох змінних: ВВП на душу населення, міжнародні резерви, підписки на мобільні телефони та робочу силу. Робоча сила – це змінна, яка найбільшою мірою зале-жить від першого фактора, і її внесок зростає, оскільки початковою є позиція 1994 року. Разом із тим, ВВП на душу населення остан-нім часом став менш важливим.
Ключові слова. Прямі іноземні інвестиції, перехідна економіка, аналіз основних компонент.

~ 34 ~ В І С Н И К Київського національного університету імені Тараса Шевченка ISSN 1728-3817 Л. Беласку, д-р экон. наук, проф. Университет имени Лучиана Блага, Сибиу, Румыния, О. Хоробет, д-р экон. наук, проф., О. Поповичи, д-р экон. наук, доц. Бухарестский экономический университет, Бухарест, Румыния
ЛОКАЛЬНЫЕ АТРИБУТЫ РАЗВИВАЮЩИХСЯ СТРАН: АНАЛИЗ ИСПОЛЬЗОВАНИЯ ОСНОВНЫХ КОМПОНЕНТ
Исследуются атрибуты расположения большой выборки стран с развивающейся экономикой с точки зрения прямых ино-странных инвестиций и присутствия международных компаний за рубежом. Используется несколько макроэкономических пере-менных, которые являются гипотезами, для иллюстрации того, как именно соответствующие атрибуты местоположения включать в анализ основных компонент для решений международных компаний, чтобы выявить наиболее релевантные географи-ческие характеристики или комбинацию таких атрибутов, которые влияют на решение многонациональных компаний инвести-ровать за границу. Установлено, что основные компоненты состоят лишь из четырех переменных: ВВП на душу населения, меж-дународные резервы, подписки на мобильные телефоны, рабочая сила. Рабочая сила – это переменная, которая в наибольшей степени зависит от первого фактора, и ее вклад растет, поскольку исходной является позиция 1994 года. В то же время, ВВП на душу населения в последнее время стал менее важным.
Ключевые слова. Прямые иностранные инвестиции, переходная экономика, анализ основных компонент.
Bulletin of Taras Shevchenko National University of Kyiv. Economics, 2018; 3(198): 34-39 УДК 330 JEL classification: F02, F1, F2, F6 DOI: https://doi.org/10.17721/1728-2667.2018/198-3/3
S. Burnete, PhD, Professor Lucian Blaga University, Sibiu, Romania
TRANS-ATALANTIC INTEGRATION: A CRUCIAL PACE TOWARD A GLOBALIZED WORLD
In this paper we deal with the much "touted and taunted" upcoming transatlantic economic integration. We scrutinize the
issue through the prism of both economic theory and historical development, in an attempt to contend that economic integration is no less lucrative on a transcontinental level than it used to be on a regional level. We use theoretical and historical arguments to emphasize the necessity and opportunity of a trade and investment agreement between the United States and the European Union, which is likely to turn the Atlantic into a redoubtable economic pole. We show that Europe and America are full readiness to enter into this paramount agreement.
Key words. trans-Atlantic integration, international trade, regional blocs, investment, partnership. Introduction. Contrary to popular belief, globalization
did not speed up but slowed down the advance toward freer international trade. Mobility of capital across national borders and the attendant increase in the power of multinational companies are acting rather as disincentives to nations' willingness to further open their markets to international trade. Moreover, conventional trade in merchandise and services is increasingly being blamed for many evils of today's world such as environment degradation, labor standards infringement, domestic firms' exposure to unfair competition from abroad etc. As a consequence, regional and bilateral agreements have been proliferating lately, not as surrogates but as interim solutions to the halting progress in multilateral negotiations aimed at fully liberalizing international trade. In this context, trans-Atlantic integration should be perceived as a natural and necessary step toward a truly globalized world. The mere fact that two huge trade blocks are involved therein makes it appear as one of the most prominent challenges the world has been facing in its entire history.
Trans-Atlantic integration is by no means a sui generis phenomenon even though it involves the union of two tectonic plates, separated by an ocean. Yet the geographic gap is ever less a barrier to trade and investment flows between the two. In fact, integration has been steadily advancing on both sides of the Atlantic after World War 2: the European Union (EU) is more than sixty years old, while North American Free Trade Agreement (NAFTA) has a quarter of a century of existence. In all this time, the bonds between the two blocs have kept tightening. Now they are poised for a big step forward: the Trans-Atlantic Trade and Investment Partnership (TTIP).
1. Economic integration: a few theoretical and historical considerations
From among the founders of economic integration theory, perhaps Jacob Viner and Bela Balassa are most noteworthy. Viner's "Customs Union Issue" as well as Balassa's "Theory of Economic Integration" was a solid bedrock on which the first integration organizations were built after World War II. The former is preoccupied by (even concerned about) the conditions under which customs unions are compatible with basic principles of international trade such as most-favored nation treatment [8], which lead him to the conclusion that free trade areas are a second best optimum. Balassa follows the same logic, defining economic integration as "abolition of discrimination within an area" [13]. Clearly, both scholars are focused upon the discriminatory nature of regional blocs: customs unions eliminate discrimination within the trade among member-countries on the one hand, yet they discriminate against outside nations on the other hand. Lipsey R. [19] tackles "empirical evidence relating to the gains from European Economic Union", asking to what extent customs union-type arrangements are welfare-improving. The 1990s bring about a slight change of approach in that scholars (e.g. Panagariya A. and Findlay R. [25]) begin to take into consideration an important dimension of the economic integration issue, which is the endogeneity of trade policies. The idea is also emphasized by Krugman P. [16] according to whom, "in a fundamental sense, the issue of the desirability of free trade areas is a question of political economy rather than of economics proper. In practice, the reputed Nobel prize-winner economist contends, the move toward free trade zones will continue because the benefits of freer trade within regions largely outweigh the discrimination against third parties (aka trade diversion) downside. "The real objection is a political judgment: fear
© Burnete S., 2018

ISSN 1728-2667 ЕКОНОМІКА. 3(198)/2018 ~ 35 ~ that regional deal will undermine the delicate balance of interests that supports the GATT", concludes Krugman.
Historically, economic integration boomed in Western Europe after World War II. In the wake of a devastating war, integration was looked upon as a countervailing force to long standing enmity among nations in the region. Time for confrontation was up; Western nations had to collaborate if they wanted to live in peace and avoid another major conflict. Conditions for rapprochement and cooperation were then ripe, while political will to accomplish this paramount objective was strong enough, as can be inferred from article 2 of the Treaty of Rome: "The Community shall have as its task, by establishing a common market and progressively approximating the economic policies of Member States, to promote throughout the Community a harmonious development of economic activities, a continuous and balanced expansion, an increase in stability, an accelerated raising of the standard of living and closer relations between the States belonging to it."1
From the trade ethics viewpoint, in principle, regional integration obviously runs counter to general international trade rules, as they are enshrined in the General Agreement for Tariffs and Trade (GATT), first and foremost non-discrimination. Yet because the phenomenon had gained immense popularity and momentum, nations signatories of the GATT had no alternative but insert a special article therein, stating there was no contradiction between free trade areas and the spirit of the agreement. In part III, article XXIV, paragraph 4 it is provided that: "…the contracting parties recognize the desirability of increasing freedom of trade by the development, through voluntary agreements, of closer integration between the economies of the countries parties to such agreements. They also recognize that the purpose of a customs union or of a free-trade area should be to facilitate trade between the constituent territories and not to raise barriers to the trade of other contracting parties with such territories." 2
The economic integration process has two chief dimensions: markets integration respectively national policies integration. The former started with the formation of a customs union in the late 1960s, which later on (early 1990s) became a common market for goods, services and factors of production. Yet free circulation has been systematically hampered by the existence of a host of technical and fiscal barriers, many of them either hard to remove or highly resilient. Technical barriers result from differences and discriminations among national legislations in respect of such fields as technical standards, public procurement procedures etc. They seriously impede not only intra-union trade but equally investment flows across borders.
The second dimension, integration of policies, has led to the creation of an economic and monetary union. This stage involves monetary, fiscal and exchange rate systems unification as well as the promotion of a common macroeconomic policy. More importantly, economic unions are expected to lead to important efficiency gains for firms due to opportunities to cut transaction and information costs, reduced prices volatility, removal of speculative capital flows e.g. The ultimate goal is securing well-balanced development of all member-states, economic
1 Treaty establishing the European Economic Community, pp. 5-183,
Luxembourg: Publishing Services of the European Communities. URL : http://www.cvce.eu/en/obj/treaty_establishing_the_european_economic_ community_rome_25_march_1957-en-cca6ba28-0bf3-4ce6-8a76-6b0b3252696e.html
2 The General Agreement for Tariffs and Trade, World Trade Organization, GATT 1947, legal texts. URL : https://www.wto.org/english/ docs_e/legal_e/gatt47_02_e.htm#articleXXIV
convergence and the raising of European citizens' living standards, as article 2 of the Treaty of Maastricht emphasizes: "The Community shall have as its task, by establishing a common market and an economic and monetary union and by implementing the common policies or activities (…) to promote throughout the Community a harmonious and balanced development of economic activities, sustainable and non-inflationary growth respecting the environment, a high degree of convergence of economic performance, a high level of employment and of social protection, the raising of the standard of living and quality of life, and economic and social cohesion and solidarity among Member States."3
In compliance with the Lisbon Treaty, the Commission conducts trade agreements on behalf of the Union given the previous mandate of the EU Council [31]. This reinforced supremacy of the supranational level over the national level in the realm of political economy empowers todays EU to act in considerable unity in matters of commercial policy [30]. Moreover, the introduction of the euro, its single position in the WTO, its autonomous seat in the G8 and G20 summits as well as the international financial institutions (IFIs) signify just another bunch of manifold instances where the EU exercises leadership on the economic front [21, 22].
The incontestable success of European integration prompted other countries and regions to follow suit. In 1993, the United States, Canada and Mexico entered into the North-American Free Trade Agreement (NAFTA). NAFTA did not emerge on a barren land but was built upon an existing free-trade accord between the US and Canada, concluded in 1989. As regards Mexico, although less advanced economically as compared with its two neighbors in the North, it could not remain aside, being highly dependent especially on the US economy. Actually, Mexican and USA economies are rather interdependent, as emphasized by Aguilar [1]: in 1971, US accounted for 61.4% of Mexico's imports but received 61.6% of the latter's exports. In 1989, the shares were 70.4% and 70.0% respectively. NAFTA gave great impetus to intraregional trade, not least to trade in intermediate inputs. The removal of intra-bloc customs barriers stimulated US manufacturers to outsource production, in part or in whole, to Mexican firms, the resulted finished products or components being either imported back to be distributed on the US market or exported overseas. Aside from trade, NAFTA includes provisions in other important domains, closely related to trade such as foreign investment, labor and environment standards, intellectual property etc.4
Europe's model has also been borrowed by organizations from other regions of the world, for example the Association of South-East Asian Nations (ASEAN). On the occasion of a summit in Cebu (Philippines) in January 2007, member-nations committed themselves to adopting a regional chart, containing rules similar to the ones included in EU's treaties.5
3 Treaty on European Union, art.2, title II, Official Journal of European
Commission, nr. C 191/1, 29.07.1992. URL : https://www.ecb.europa.eu/ ecb/legal/pdf/maastricht_en.pdf
4 NAFTA Key Provisions, http://www.iatp.org/files/NAFTA_Key_ Provisions.htm
5 ASEAN Bulletin, January 2007. URL : https://web.archive.org/web/ 20070128030214/http://www.aseansec.org/19223.htm
~ 36 ~ В І С Н И К Київського національного університету імені Тараса Шевченка ISSN 1728-3817
2. Trans-continental integration: a necessary alternative to the failure of multilateralism
According to many scholars (e.g. Meunier S. and Kalypso N. [23]), the foundation of the world trade organization (WTO) in 1995 stands proof of the paramount importance of the trans-Atlantic partnership. Moreover, the world organization has been promoted by both governments and multinationals (MNEs) [28]. Yet before long, disappointed by the fading prospect of multilateralism, both governments and MNEs have been increasingly lobbying for either regional trade areas (RTAs) or bilateral agreements. Unlike previous waves of RT, which were typically formed between geographically proximate economies, some of the most recent RTAs even span continents to form new agreements or generate fusions between existing ones (Bouzas R. [4], Sampson G. and Woolcock S. [27]). The EU-Mexico, US-Morocco or EU-Korea trade agreements cover just a couple of vanguards of this new era [9]. It is readily understandable that the US and EU are tempted by plentiful incentives to strengthen their bond via this kind of inter-continental trade agreement.
The slowing down of multilateral negotiations gave impetus to bilateralism, with America and EU as flagships. Having traditionally been accommodated to exert substantial influence on the course of multilateralism, both are profoundly discomforted by nowadays cumbersome negations at the WTO level. Difficulties mostly stem from the complexity of issues in the light of an ever-growing membership [3]. As Pascal Lamy pointed out, the United States reckons Europe as an ally in the race for regulatory policies encompassing services, investment, competition, standards and technical regulations, intellectual property rights, government procurement as well as rules of origin [18].
3. Europe and North America: inseparable partners While the EU and US account for almost half of world
GDP and an overwhelming third of world trade, they are also each other's most essential trade and investment partners as goods worth about EUR 2 billion cross the Atlantic every single day [24]. This backs Fisman R. [10] findings, derived from empirical data that cultural proximity (shared codes, beliefs and ethnicity) improves efficiency transaction level. In brief, both commercial blocs are of similar size, feature an equivalently high level of economic development and accommodate the world's most prosperous and educated populations [7].
Aside from mutual trade, the TTIP has an important investment component resulting from large amounts of mutual investment flowing between the two entities.
This trend is buttressed by MNEs' policy. The resulted "alliance capitalism" is materialized not only in closer intra-firma cooperation but also in a thriving growth of inter-firm cooperative agreements and bilateral FDI [2, 6, 17].
Undoubtedly, the European integration process played a decisive role in shaping transatlantic relations, ushering in an era of greater cohesion [24]. The US did not only strongly endorse the initiative of the Rome Treaty but also carried on to support the course of integration well guided by the intention of warranting political stability and thriving prosperity in West Europe [12, 28]. The corresponding institutional reforms in turn elevated the EU on a level playing field with the US [29]. Based on US sponsorship, a united Europe has been manifesting its status as an indispensable agent of global governance [11, 20]. The two amicable allies still act as the main driving force behind the institutions which shape today's free trade system,
international financial order and collective security arrangements [5, 14, 15].
4. Transatlantic integration: a necessary step From a retrospective point of view, the current
negotiations on the TTIP figuratively denote an affirmation of the long-standing transatlantic dialogue as well as several initiatives to institutionalize collaboration on regulation issues [26]. Numerous accords on cooperation in a wide spectrum of regulatory fields have been signed over the last two decades exemplified by the US-EC Mutual Recognition Agreement (MRA) and its six sector annexes [26]. According to the French Research Centre CEPII, institutions were deliberately set up to stimulate dialogue and cooperation including the Transatlantic Business Dialogue (TABD), the Transatlantic Consumer Dialogue (TACD) and the Transatlantic Economic Council (TEC)6. At the behest of the EU-US summit, the very latter founded the High-Level Working Group on Jobs and Growth in November 2011 on the notion of preparing the ongoing TTIP negations [7].
Reinforcement of trans-Atlantic integration was marked by European Parliament's vote in favor of the Comprehensive Economic and Trade Agreement (CETA) between the EU and Canada, which pledges to extensively curtail customs tariffs (staggering 99 %) and other barriers to trade between the signatory parts. CETA is supposed to substantially improving market access not only to industrial goods but also agricultural produce, services, investment and government procurement7. Apart from safeguarding environmental protection and labor rights, a focal thrust of the agreement lies in field investment protection. CETA distinguishes itself from former RTAs by implementing an Investment Court System (ICS) instead of the highly controversial investor-state dispute settlement (ISDS) mechanism8. CETA was preceded by yet another trans-Atlantic economic partnership, namely the EU-Mexico Free Trade Agreement which entered into force in 2000. From EU's perspective, the agreement is meant to preserve deep-rooted economic ties with Mexico or rather to mitigate trade diversion, in view of the huge gap between Mexico's average applied most favored nation tariff (8.7 %) and the preferential NAFTA tariff of below 2% [27].
Methodology. We use statistical data in order to emphasize the basic prerequisites of TTIP: the gradual tightening of trans-Atlantic commercial and investment ties during the last two decades.
6 Transatlantic Trade: Whither Partnership, Which Economic
Consequences? CEPІІ, 2013. URL : http://www.cepii.fr/PDF_PUB/ pb/2013/pb2013-01.pdf
7 EU-CANADA: Comprehensive Economic and Trade Agreement (CETA), European Commission, 2017. URL : http://ec.europa.eu/trade/ policy/in-focus/ceta/index_en.htm
8 As opposed to the ISDS, the new ICS will appoint independent judges, work transparently via public hearings and enshrine the right of governments to regulate in the public interest even if regulations were to affect foreign investment. (Comprehensive Economic and Trade Agreement, Federal Ministry for Economic Affairs and Energy, BMWi, 2017. URL : http://www.bmwi.de/Redaktion/EN/Artikel/Foreign-Trade/ceta.html)

ISSN 1728-2667 ЕКОНОМІКА. 3(198)/2018 ~ 37 ~
Table 1. The share of EU and NAFTA in world merchandise trade during 1993–2013 (%)
1993 2003 2013 NAFTA of which: United States Canada Mexico
17.9
12.6 3.9 1.4
15.7
9.8 3.7 2.2
13.3
8.6 2.6 2.1
EU 37.3 42.4 33.2 NAFTA + EU 55.2 58.1 46.5
Source: WTO, World Trade Statistics 2014
Table 2. Trade in manufactures between EU and North America in selected years
Exports/year 2002 2010 2014 Total ($ bn.) US share (%) Total ($ bn.) US share (%) Total ($ bn.) US share (%)
UE 2002.7 10.9 3,999 7.9 4,718 8.9
Total ($ bn.) EU share (%) Total ($ bn.) EU share (%) Total ($ bn.) EU share (%) US 571 21.7 944 19.9 1,164 18.5
Source: WTO, World Trade Statistics 2002-2015.
Table 3. Trade in transportation services between EU and North America in selected years
Exports/year 2009 2011 Total ($ bn.) US share (%) Total ($ bn.) US share (%)
EU 313.4 11.3 384.1 10.9 Total ($ bn.) EU share (%) Total ($ bn.) EU share (%)
US 61.8 32.1 79.4 29.8
Source: WTO, World Trade Statistics 2002-2015.
Table 4. Exports/receipts of charges for mutual use of intellectual property (US and EU)
2013 2014
Exports ($ bn.)
Receipts ($ bn.)
Share (%)
Exports ($ bn.)
Receipts ($ bn.)
Share (%)
World 275,6 285 100 290,3 300 100 US 129,1 136* 47,0* 131,6 136* 47,0*
EU 83,2 83 30,2 90,5 91 30,2
*The data refers to North America as a whole.
Source: WTO, World Trade Statistics 2015
Table 5. US-UE combined share in world exports of various services in 2014
World ($ bn.)
EU ($ bn.)
North America ($ bn.)
Combined share (%)
Insurance and pension services 130 78 22 77 Financial services 415 225 95 77 Business services 1.120 156 527 67
Source: WTO, World Trade Statistics 2015
Table 6. United States' and Europe's inward FDI flows by country of origin in 2015
FDI into US FDI into Europe Country of origin Total ($ bn.) Share (%) Total ($ bn.) From US ($ bn.) US share (%)
1 2 3 4 5 6 6/5 World 384.4 100 Germany 22.5 2.9 12.8 Europe 267.3 69.5 UK 35.3 30.3 85.8
EU 259.2 67.4 Belgium 21.2 17.3 81.6 Germany 25.5 6.6 France 39.6 2.1 5.3
France 21.8 5.6 Ireland 188.2 111.0 58.4 Ireland 13.4 3.4
Luxembourg 143.2 37.2
Netherlands 23.9 6.2
UK 18.0 4.6
Non-Europe 117.0 30.5 Canada 25.0 6.5 Japan 31.1 8.0
Source: OECD. Stat, http://stats.oecd.org/Index.aspx?QueryId=64194
~ 38 ~ В І С Н И К Київського національного університету імені Тараса Шевченка ISSN 1728-3817
Results. Trade and investment exchanges between EU and US have been kept at a sustained level in the last decades, in spite of a small decline after 2000. As data in table 2 indicate, US constantly accounts for about 10 percent of EU exports of manufactures, while EU accounts for about one fifth of such US exports. Exchanges are even more enhanced in the invisible trade: more than 10 percent of EU exports of transportation services go to US, while about one third of US exports of this type of services go to EU (table 3).
The TTIP is a big step toward world-scale integration, due to the two partners' formidable size and overwhelming domination of world production and trade. EU and NAFTA are equally strong regional blocs in terms of GDP ($16.261 bn. and $20.731 bn. respectively in 20159) and trade power although their combined share slightly declined after the year 2000, mostly due to the waxing of China (see table 1). Yet EU and NAFTA still dominate with authority the international trade in intellectual property rights (77 percent of world total, as per data in table 4) as well as other various services (between two thirds and three fourths, as per data in table 5).
As data in table 6 indicate, Europe accounts for 69.5 percent of the total amount of FDI flowing into the US, 67.4 percent belonging to EU countries. In their turn, US companies invest a great deal in Western Europe, the UK and Belgium standing for the preferred destinations (85.8 percent of UK's FDI inflows respectively 81.6 percent of Belgium's FDI inflows originate in US).
In brief, transatlantic trade is mostly of intra-industry type, reflecting the high volumes of mutual capital flows, thanks to their exceptionally advanced and integrated financial sectors.
Conclusion & Discussion. The development and tightening of mutual commercial
connections between Europe and America in the course of the post-Second World War period points to their preparedness to enter into a paramount agreement.Thus, the US remains the last NAFTA member state with which the EU has not struck a trade deal yet. A FTA between those deep-rooted allies in form of a transatlantic partnership would therefore just mark the next logical step in the process of trans-Atlantic integration.
The TTIP is by no means a commercial concoction of some inflamed libertarian mindset but the natural outcome of a long standing market-based economic development of western countries. It is meant to pave the way for a completely integrated western economic area, with no barriers against trade and investment flows across the Atlantic.
There is a multitude of compelling reasons to believe that trans-Atlantic integration epitomizes a pinnacle of the trade liberalization process that has been unraveling since the Second World War and gaining momentum in the globalization context. Reality has shown that economic integration on a regional level has been profitable; there are no reasons to believe it will not be fruitful on a transcontinental scale. The projected TTIP is heralding the advent of a less segmented economic order, namely an interim solution until free trade becomes predominant the world over. Failing it, even the astounding economic and institutional achievements of both EU and NAFTA on the respective sides of the Atlantic will be in jeopardy. The danger of reverting to an interwar-type parochial world is not only real but menacing. Ultimately, it will be the wisdom of politicians and legislators on both sides of the Atlantic to refrain from popular protectionist policies but to resume the stagnating negotiations on TTIP and make every effort to set it in motion.
9 World Bank: Gross domestic product 2015. URL : http://databank.worldbank.org/data/download/GDP.pdf
References 1. Aguilar, Linda M. NAFTA: A Review of the Issues. In Philip Kinge
(Ed.) International Economics and International Economic Policy, McGraw-Hill Inc., 1995, pp.183-187.
2. Almeida, P. Knowledge sourcing by foreign multinationals: patent citation analysis in the U.S. semi-conductor industry. Strategic Management Journal, 17, 1996, 155-165.
3. Bhagwati, J. Regionalism and Multilateralism: An Overview. In J. Bhagwati, P. Krishna, & A. Panagariya (Eds.), Trading blocs: alternative approaches to analyzing preferential trade agreements. Cambridge, MA: MIT Press, 1999.
4. Bouzas, R. The "new regionalism" and the Free Trade Area of the Americas: a less benevolent view. Cepal Review, 85, 2005.
5. Bull, H. The Anarchical Society. A Study of Order in World Politics (Vol. 2nd edn). Basingstoke and London: Macmillan, 1995.
6. Cantwell, J., & Harding, R. The internationalization of German companies R&D. International Investment and Management, National Institute Economic Review, 1997, 163/1.
7. Cooper, W. EU-US Economic Ties: Framework, Scope, and Magnitude, Congressional Research Service, 2009.
8. Ducros, Bernard. Jacob Viner – The Customs Union Issue, Notes bibliographiques, Revue économique, année 1951, vol.2 (6), pp.801-802. Available at: http://www.persee.fr/doc/reco_0035-2764_1951_num_2_6_ 406878_t1_0801_0000_001.
9.Erixon, F. The Transatlantic Trade and Investment Partnership, CESifo Forum nr.4, 2013. Available at: http://www.ecipe.org/app/uploads/ 2014/12/TTIP_and_the_Shifting_Structure_of_Trade_Policy.pdf
10. Fisman, R., Paravisini, D., & Vig, V. Cultural proximity and loan outcomes. American Economic Review, 2017, 107(2), 457-492.
11. Gnesotto, N. Reshaping EU-US Relations. A concept paper. Notre Europe (Studies and Research 75), 2010.
12. Egan, M., Cowles, M. The Evolution of the Transatlantic Partnership. Transworld Working Paper, 5, 2012
13. Hosny, A. S. Theories of Economic Integration: A Survey of the Economic and Political Literature, International Journal of Economy, Management and Social Sciences, Vol. 2 (5), 2013, pp.133-155, http://www.waprogramming.com/papers/5157de7c463eb9.70128490.pdf
14. Keohane, R. After Hegemony. Cooperation and Discord in the World Political Economy. Princeton: Princeton University Press, 1984.
15. Keohane, R. Ironies of Sovereignty: The European Union and the United States. Journal of Common Market Studies, 40(4), 2002, 743-765, DOI: 10.1111/1468-5965.00396
16. Krugman, P. The Move Toward Free Trade Zones, In Philip Kinge (Ed.) International Economics and International Economic Policy, McGraw-Hill Inc., 1995, pp.163-182.
17. Kuemmerle, W. The drivers of foreign direct investment into research and development: An empirical investigation. Journal of International Business Studies, 1999, vol.30/1, pp. 1-24
18. Lamy, P. Stepping Stones or Stumbling Blocks? The EU's Approach Towards the Problem of Multilateralism vs Regionalism in Trade Policy. The World Economy, 25(10), 2002, 1399-1413.
19. Lipsey, R. The Theory of Customs Unions: A General Survey, In J. Bhagwati (Ed.), International Trade: Selected Readings. Cambridge, MA: MIT Press, 1984.
20. Manners, I. Normative Power Europe: A Contradiction in Terms? Journal of Common Market Studies, 20(2), 2000, 235-258, DOI: 10.1111/1468-5965.00353.
21. Meunier, S. What single voice? European institutions and EU-US trade negotiations. International Organization, 2000, 54(1), 103-120.
22. Meunier, S. Trading Voices. The European Union in International Commercial Negotiations. Princeton: Princeton University Press, 2005.
23. Meunier, S., Kalypso, N. The European Union as a conflicted trade power. Journal of European Public Policy, 2006, 13(6), 906-925.
24. Müftüler, B., Cihangir, D. The Transatlantic Relationship and the future Global Governance, Transworld, Oct., 2014.
25. Panagariya, A., Findlay, R. The Political Economy Analysis of Free-Trade Areas and Customs Unions, In R. C. Feenstra, G. M. Grossman and D. A. Irwin (Eds.), The Political Economy of Trade Policy: Papers in Honor of Jagdish Bhagwati, MIT Press: Cambridge, 1996, pp. 265-287.
26. Pollack, M. The Political Economy of the Transatlantic Partnership, Roberty Schuman Center for Advanced Studies, 2003.
27. Sampson, G., & Woolcock, S. Regionalism, Multilateralism and Economic Integration:The recent experience. Tokyo, New York, Paris: United Nations University Press, 2003.
28. Schwok, R. U.S. – EU Relations: Drifting Apart? Dissociative and Associative Approaches Ever Closer Parnership. Policy-Making in US-EU Relations (pp. 363-385 ). Brussels: European Interuniversity Press/Peter Lang, 2001.
29. Smith, M. A liberal Grand Strategy in a realist world? Power, purpose and the EU's changing global role. Journal of European Public Policy, 2010, 18(2), 144-163.
30. Tsoukalis, L. The New European Economy Revisited. Oxford: Oxford University Press, 1997.
31. Woolcock, S. The New Economic Diplomacy: Decision Making and Negotiation in International Economic Relations. Aldershot: Ashgate, 2003.
R e c e i ve d : 31 / 0 1 / 20 18 1 s t Re v is i o n : 1 0 / 04 / 18
Ac c e p t e d : 20 / 0 5 / 18 Author's declaration on the sources of funding of research
presented in the scientific article or of the preparation of the scientific article: budget of university's scientific project
ISSN 1728-2667 ЕКОНОМІКА. 3(198)/2018 ~ 39 ~ C. Бурнете, канд. екон. наук, проф. Університет імені Лучіана Блага, Сібіу, Румунія
ТРАНСАТЛАНТИЧНА ІНТЕГРАЦІЯ: ВАЖЛИВИЙ СТРИБОК ДО ГЛОБАЛІЗОВАНОГО СВІТУ Розглядається трансатлантична економічна інтеграція, що настає, через призму як економічної теорії, так і історичного розви-
тку. Стверджується, що економічна інтеграція на трансконтинентальному рівні є не менш прибутковою, ніж на регіональному рівні. Використано теоретичні та історичні аргументи, щоб підкреслити необхідність і можливість укладення торговельної та інвести-ційної угоди між Сполученими Штатами і Європейським Союзом, що, імовірно, перетворить Атлантику на могутній економічний по-люс. Показано, що Європа й Америка мають повну готовність до укладення цієї найважливішої угоди.
Ключові слова: трансатлантична інтеграція, міжнародна торгівля, регіональні блоки, інвестиції, партнерство.
C. Бурнете, канд. экон. наук, проф. Университет имени Лучиана Блага, Сибиу, Румыния
ТРАНСАТЛАНТИЧЕСКАЯ ИНТЕГРАЦИЯ: ВАЖНЫЙ ПРЫЖОК К ГЛОБАЛИЗОВАННОМУ МИРУ
Рассматривается предстоящая трансатлантическая экономическая интеграция через призму как экономической теории, так и исторического развития. Утверждается, что на трансконтинентальном уровне экономическая интеграция не менее прибыльна, чем на региональном уровне. Использованы теоретические и исторические аргументы, чтобы подчеркнуть необходимость и возмож-ность заключения торгового и инвестиционного соглашения между Соединенными Штатами и Европейским Союзом, которое, веро-ятно, превратит Атлантику в могучий экономический полюс. Показано, что Европа и Америка полны готовности к заключению это-го важнейшего соглашения.
Ключевые слова: трансатлантическая интеграция, международная торговля, региональные блоки, инвестиции, партнерство.
Bulletin of Taras Shevchenko National University of Kyiv. Economics, 2018; 3(198): 39-43 УДК 339 JEL classification: M30, M31, M39 DOI: https://doi.org/10.17721/1728-2667.2018/198-3/4
L. Dumitrescu, PhD, Professor ORCID iD 0000-0002-9935-0224
Lucian Blaga Unniversity of Sibiu, Sibiu, Romania, M. Fuciu, PhD, Assistant Professor,
ORCID iD 0000-0001-9811-1179 H. Gorski, PhD, Professor
ORCID iD 0000-0001-9811-1179 Romanian-German University of Sibiu, Sibiu, Romania
IMPLEMENTING NEW MARKETING STRATEGIES IN THE CONTEXT OF THE ONLINE ENVIRONMENT – ADVANTAGES, DISADVANTAGES,
STATISTICS AND TRENDS
In the context of the online environment and the pressure created by the new information and communication technologies, when the Internet is used by more than 40% of the world population, when the penetration rate of the online has reached more than 75% in Europe (52% in Romania) and almost 90% in North America and when the smartphone has become a constant com-panion of the individuals, today's companies must adapt or develop new marketing strategies that will help them win and retain the consumers, otherwise they will slowly perish. This paper aims to present several important marketing strategies based on the usage of the Internet tools like: search engine optimisation (SEO), content marketing, social media/online social networks, email marketing, lead generation, sales etc., that can be implemented by the Romanian companies. We are presenting several im-portant advantages and disadvantages of these marketing strategies. We will also bring forth several important statistics regard-ing the Internet usage and of the online marketing tools and we shall underline future trends related to these aspects, all this being designed to support future managerial decisions and to better understand the need for the companies to implement and use them successfully.
Key words: online marketing, marketing strategies, internet, social media. Introduction. The world is changing, the economies
are fluctuating, the consumers are becoming harder and harder to please and to transform into loyal customers and therefor the companies, the managers and the mar-keting specialists must change, must adapt to the new challenges provided by the rapid modifications brought upon us by the environment where we work, live or do business. Probably, the most important marketing and communication environment for the 21st century compa-nies in the Internet and the organizations and their em-ployees must use to the best of their abilities as well as to the fullest in order to reach and develop a relationship with the clients (either current or potential ones).
Our paper aims, in the first place, to underline sever-al important marketing strategies based on the usage of the Internet tools like: social media/online social net-works, search engine optimisation (SEO), content market-ing, email marketing, lead generation, online sales etc. that can be implemented by the Romanian companies. Secondly, we are presenting and explaining certain ad-vantages and disadvantages of these marketing strate-
gies. In the third part of our paper we shall point out sev-eral important statistics related to the Romanian internet usage, online social media tools and we will underline future trends related to these aspects.
Brief literature review. As we know "in the past 20 years, the importance of using the Internet as competi-tive marketing tool has been recognized by many practi-tioners and scholars. Whether we are talking about small or large organizations, who compete on a local, regional or international basis, the Internet is the bridge between the organization and its stakeholders" [9, p. 536]. The online has given marketing new tools that help experts in the field to come more quickly to meet customer needs and had a crucial impact on how buyers and sellers communicate. In the past 20 years, especially since 2000, new digital media marketer-s enable greater creativity, accuracy and meas-urement capability to lead consumers through the stages of decision [8, p. 389]. The same idea is supported by Kotler and Casilone, "appearance of new means of communica-tion, web sites, e-mail, instant messaging chart rooms, blogs, web seminaries, have created a global system that
© Dumitrescu L., Fuciu M., Gorski H., 2018

~ 40 ~ В І С Н И К Київського національного університету імені Тараса Шевченка ISSN 1728-3817 makes life easy for individuals and the companies that want to find each other" [10, 2009].
The emergence of the Internet has favored, in addition to changing the media and communication channels, the expansion of the marketing research to the new virtual space. In the past years more and more organizations have turned to marketing companies that organize online marketing research campaigns. There are many ways an organization can conduct an online marketing research. Companies can include their website in a questionnaire and provide an incentive for completing it, or add this ques-tionnaire on a website well known, such as Yahoo which invites visitors to answer a few questions and possibly to win a prize [11 p. 166].
As we can see, these are several elements show some of the changes brought upon by the emergence and implementation of the internet based technologies. But these elements are not the only ones, in the last five to ten years new communication, interaction marketing tools and marketing strategies have emerged and we will pre-sent them as follows:
Online social networks / social media / social networking sites are as shown in earlier researches developed by the authors "as tools for building virtual communities, or social networks, for individuals with similar education, lifestyles, interests, or activities" [2, p. 8]. One of the earliest social networking sites definitions was offered by Boyd and Ellison in 2007, whish state that "as web-based services that allow individuals to (1) construct a public or semi-public profile within a bounded system, (2) articulate a list of other users with whom they share a connection, and (3) view and trav-erse their list of connections and those made by others with-in the system" [3, 2007]. Diffley et. al. 2011 mention that OSN "are tools that provide people with the ability to collabo-rate and communicate with one another online. They facili-tate the creation and sharing of knowledge, information, me-dia, ideas, opinions and insights, and allow people to actively participate in the media itself" [5, p. 47-65].
Search engine optimisation (SEO). Before underlining the concept of SEO, we must understand the concept of search engine as types of software, which collects data about web sites. At this point, the collected data includes the web site URL, some keywords or keyword groups that define the content of the web site, the code structure that forms the web page and also links provided on the web site. The related collected data is indexed and stored on a database [15, p. 488]. "The search engine optimization (SEO) is enabling a web site to appear in top result lists of a search engine for some certain keywords. There are many different factors that enable a web site to move up top results. The most effective way to take attention of many users is connected with search engine optimization. Because the search engine optimization is basically based on keywords that are suitable to the web site and can be used to search with search engines. In order to optimize a web site according to search engines, it must be suitable to some technical conditions [14, p. 488].
Content marketing. According to the American Market-ing Association and the Content marketing Institute, con-tent marketing is "marketing technique of creating and dis-tributing valuable, relevant and consistent content to attract and acquire a clearly defined audience, with the objective of driving profitable customer action" [16; 17].
E-mail marketing / E-marketing. "Email is an online communication format that involves sending digital mes-sages from an author to one or more recipients (i.e., email addresses) across the internet or other computer networks and therefore mail marketing is simply "market-ing via email". [18]
Lead Generation. "Describes the marketing process of stimulating and capturing interest in a product or service for the purpose of developing sales pipeline. Lead gener-ation often uses digital channels, and has been undergo-ing substantial changes in recent years from the rise of new online and social techniques. In particular, the abun-dance of information readily available online has led to the rise of the "self-directed buyer" and the emergence of new techniques to develop and qualify potential leads before passing them to sales." [19]
Advantages and disadvantages. Of course, all mar-keting strategies, all marketing tools, especially those that are based on the usage of the online environment have certain advantages and disadvantages for the companies and for the managers that must take into account these elements in the decision-making process.
Online social networks / social media main advantages: (1) Low costs – it is much cheaper to contact the consum-ers using the online; (2) Fast – a company can reach its consumers faster, almost instantly; (3) OSN is able to rise internet traffic of your website resulting in a better image for your company; (5) It helps the company to develop a direct and personalized connection with the consumer; (6) Worldwide – the consumer can be reached at any time, in almost any part of the world; (7) It offers the possibility of a greater contact with the consumers by a faster feedback, interaction and support; (9) it improves the CRM system of the company etc. [4, p. 501-506]. The main disadvantages are: "(1) OSN are time consuming – the usage of OSN means that the employees and in the same time the poten-tial consumers spend to much time online. (2) Continuity in action – if a company wants to be successful it has to pre-sent online 24/7 not just now and then. This means that the company may need to hire someone for this purpose. (3) Speed – a negative message sent or placed on the company's OSN page is moving fast and viral and it can reach the consumers in a matter of hours; (4) Target audi-ence using many social sites – the social networking sites are so many and they serve many different audiences, use many ways to convey messages it becomes difficult to de-cide where to go, what to do and to what extent; (5) Lack of control – once a message is posted about the companies' products and services it can not be controlled by the mar-keting or public relation specialists especially if this mes-sage is negative etc" [7, p. 501-506].
The other major player in the new marketing tools, con-tent marketing, also has certain advantages and disad-vantages. Among the main advantages of this marketing method of connecting with the consumers we underline: (1) You develop an emotional response from the consum-ers – you must create content that means something for the targeted consumers; (2) You increase the chances of going viral – a meaningful and well-chosen message can go viral, especially in combination with social media; (3) Possibility to emerge as a reliable information source – constant update, clear and insightful information will lead to the development as an information source; (4) Relevant content attracts consumers o your website – providing a strong content and a reliable one, with time, energy and dedication invested in your message will lead to greater number of site viewers. At the same time, there are several important disadvantages that one must into account: (1) It can lead to some costs – even if the online marketing strategy is cheaper, the content marketing strategy will incur costs; (2) It takes time and dedication – a proper con-tent marketing strategy implies employing dedicated people which must dedicate a lot of time to this strategy; (3) New and innovative strategy can lead to conflict – the idea of using a content marketing based strategy is much different

ISSN 1728-2667 ЕКОНОМІКА. 3(198)/2018 ~ 41 ~ than the traditional one and certain companies may still adhere to traditional marketing tools and strategies. [13]
Statistics and trends related to the online marketing based strategies. As mentioned before, the development
of the Internet and its based marketing strategies has de-veloped greatly in the last decades. The same can be said in the case of the Romanian internet users. But before we can do that we must see the worldwide Internet statistics.
Fig. 1. Internet users world wide
Source: http://www.internetworldstats.com/stats.htm, accessed by the author on May, 10th, 2017 As we can see from figure 1, the largest number of In-
ternet users are from Asia, at about 50% of the population (taking into account that in Asia we have more than half of the world population). Followed by Europe with 17%, Latin America / Caribbean with 10% and North America with 9%.
Regarding the Internet penetration rate within the popula-tion, we can see a world average of 60,5%, with the high-est levels registered in North America (88,1%), Europe (77,4%), Oceania and Australia (68,1%), Latin America and the Caribbean with 59.6% and Middle East with 56,7%.
Fig. 2. Internet penetration rate – worldwide
Source: http://www.internetworldstats.com/stats.htm, accessed by the author on May, 10th, 2017
Regarding the internet users in Romania, according to the internetworldstats.com platform, Romania has a popu-lation of 21,599,736 inhabitants with 52% of the population
as Internet users (11,236,186). According to the United Nation, [20], Romania has as of June 2017 a number of 19,241,873 inhabitants which leads to a difference be-

~ 42 ~ В І С Н И К Київського національного університету імені Тараса Шевченка ISSN 1728-3817 tween the stats of UN and InternetWorldStats.com. The number of Romanian internet users is of 10,6 million peo-ple in 2016, a rise of 1,2% from the previous year. At the same time according to the National Institute of Statistics of Romania [21], the internet usage between the ages of 16 and 74 years old, the population that used the Internet at least once is of 69.7%, those that have use the Internet in the last 3 months are of 85,3%. The Romanian Internet users that have a daily usage frequency are 71,3% of the total of internet users of Romania.
Based on these statistics, we have researched the us-age of online social media in Romania and at a interna-tional level. According to Facebok.com and Zephoria Digi-tal Marketing and other sources [22; 23]: "1.94 billion monthly active Facebook users for March 2017; 1.28 billion daily active users on average for March 2017; 1.15 billion mobile daily active users (Mobile DAU) for December 2016; in Europe, over 307 million people are on Facebook; Age 25 to 34, at 29.7% of users, is the most common age de-mographic; Facebook users are 76% female and 66% male". In Romania, at this time, there are [24]: "9.6 million Facebook users; representing 44,44% of the Romanian population and 85,44% of the Romanian users; 57,54% of the Facebook users are between 13 – 34 years old".
As we can see from these data, we can underline the importance of using social media platforms to develop a clear online consumer profile and develop personalized marketing strategies and messages in order to increase the number of users and consumers that see the products and services offered by the companies.
Search engine optimisation and content marketing are two other marketing tools and strategies that can be used to attract consumer, to transform them into loyal consumers. Among the most important SEO statistics underlined by HubSpot in 2016 and 2017, at a worldwide level, and espe-cially in North America [25]: "the first position on Google search results on desktop has a 34.36% click through rate; 81% of shoppers conduct online research before making big purchases; 72% of consumers who did a local search visited a store within five miles; 65% of smartphone users agree that when conducting a search on their smartphones, they look for the most relevant information regardless of the com-pany providing the information".
Content marketing statistics for 2016 and 2017 pre-sented by the same website [25], show: "53% of marketers say blog content creation is their top inbound marketing priority; 55% of B2B marketers say they are unclear on what content marketing success or effectiveness looks like; 47% of buyers viewed 3-5 pieces of content before engag-ing with a sales representatives; 96% of B2B buyers want content with more input from industry thought leaders; 64% of podcasts are listened to on a smartphone or tablet".
Starting from the above-mentioned statistics and the main trends underlined by specialists for the next years' show that: (1) mobile technology will become more and more important; (2) social factors will have more weight; (3) fresh / up to date content will be rule; (4) voice search ap-pears to be the next best thing; (5) increase relevance of local search in the next period of time. [6; 12]. Content marketing activities and strategies directed in this year and in the next year [1]: "(1) an increased content marketing strategy that is more and more documented; (2) Increase level of visual content; (3) a personalised and more niche orientated specific content; (4) an increase in the level of user generated content; (5) promoting is more and more a priority while using the online environment; (6) Virtual Real-ity (VR) is becoming more accessible by the average user."
Conclusion & Discussion. The economic word is in a continuous state of flux and of change. Consumers have a
more choses than ever, they are better informed, they can buy products and services from all over the world, at every time, conditioned only by Internet access. The develop-ment of the internet, the evolution of the information and communication technologies of the last decades, the rise of online platforms like online social networking sites (social media), microblogging, emailing, video content sharing platform and more have offered the companies, to manag-ers, to the marketing specialists, web developers and more the opportunities and the possibility to better target, to bet-ter develop relationships with consumers and in general with the companies' stakeholders.
By underlining the concepts of social networking, con-tent marketing, lead content etc, by presenting several im-portant advantages and disadvantages and by pointing out several important statistics and trends for the upcoming period, we hope to bring forth the importance of developing specialised marketing strategies designed in order to target the 21st century consumers. Based on our current research and previous one, we can see a change in the statistics, trends and the main manner in which the consumers and companies target each other.
The smartphone, the tablet, the laptop, the SmartTv and other interconnected devices are to be targeted by companies in order to promote their organisations, their products and services. As we can see, the current paper is a statistical analysis that is meant to offer companies, managers and marketing specialists the tools to under-stand new marketing strategies and tools, and to open their appetite for them as well as to lead them towards the new ways of relating to the consumers.
References 1. Brenner, M., 2017, Content marketing trends to watch out for in
2017. Available at: https://marketinginsidergroup.com/content-marketing/ content-marketing-trends-2017-infographic/, accessed on June 17th, 2017.
2. Bolotaeva, V., Cata, T., 2011, Marketing Opportunities with Social Networks, Journal of Internet Social Networking and Virtual Communities, p. 8, DOI: 10.5171/2011.409860
3. Boyd, D., Ellison, N., 2007, Social network sites: a definition, histo-ry and scholarship, Journal of Computer Mediated Communication, vol.13, (1), DOI: 10.1111/j.1083-6101.2007.00393.x
4. Coetesee, F., 2010, Advantages and disadvantages of social me-dia and networking, April, 9, 2010. Available at: http://www.socialmediastrategy.co.za/index.php/social-networking/what-are-some-advantages-and-disadvantages-of-social-media-networking/ accessed on April 18, 2012 in Fuciu M, Dumitrescu, L., Gorski, H., (2012), The influ-ence of online social networks on companies, managers and the decision making process, Proceedings of the The Knowledged Based Organization conference, Sibiu, vol. 1 (management and military sciences), pp. 501-506.
5. Diffley, S., Kearns, J., Bennett, W., Kawalek, P., (2011), Consumer Behaviour in Social Networking Sites: Implications for Marketers, Irish Jour-nal of Management, vol. 30 2, pp. 47 – 65;
6. Fiorelli, G., 2016, SEO and digital trends in 2017. Available at: https://moz.com/blog/seo-and-digital-trends-in-2017, accessed on June 17th, 2017.
7. Fuciu M, Dumitrescu, L., Gorski, H., 2012, The influence of online social networks on companies, managers and the decision making process, Proceedings of the The Knowledged Based Organization conference, Sibiu, vol. 1 (management and military sciences), pp. 501-506.
8. Gray, R., Charlesworth, A., Esen, R., 2009, Marketing online – o abordare orientată spre client, All Publishing House Bucharest.
9. Ivanov, A. E., 2012, The internet's impact on integrated marketing communication, Procedia in economics and finance, issue, 3, pp. 536-542, DOI: 10.1016/S2212-5671(12)00192-X
10. Kotler, P. and Caslione, J. A., 2009, Chaotics – management si marketing in era turbulentelor, Publica Publishing House, Bucharest.
11. Kotler, P., Keller, K. L., 2008, Marketing management, 4th Edition, Teora Publishing House, Bucharest in Fuciu, M., Luncean, L., Dumitrescu, L., 2011, Internet and E-commerce – tools for creating value in the E-marketplace, (Marketing from Information to decision), pp. 129-140.
12. Lincoln, J., 2017, The hottest 14 SEO trends of 2017, Young En-trepreneur Council, Contributor. Available at: http://www.huffingtonpost.com/entry/the-hottest-14-seo-trends-of-2017_us_ 58de5866e4b0efcf4c66a7e2, accessed on June 17th, 2017.
13. Nelson, E. C., 2012, Pros and Cons of Content Marketing. Available at: http://www.business2community.com/content-marketing/7-pros-and-cons-of-content-marketing-0266634#iQ2rX7mmA2yFf8HP.97, accessed on June 15th, 2017.
14. Sezgin, G., 2009, Arama Motorlarsnun Davranslarinin Çözümlen-mesi Ve Web Sayfalarina Tasarim Asamasinda Yansitilmasi, Master Thesis,
ISSN 1728-2667 ЕКОНОМІКА. 3(198)/2018 ~ 43 ~ Beykent Üniversity Institute for Science and Technology, Istanbul., in Yulcin, N., Kose, U., 2010, What is search engine optimisation: SEO?, Procedia Social and Behavioral Sciences 9, pp. 487-493
15. Yulcin, N., Kose, U., 2010, What is search engine optimisation: SEO?, Procedia Social and Behavioral Sciences 9, pp. 487-493
16. American Marketing Association. Available at: http://www.marketing-dictionary.org/Content+marketing, accessed on June 15th, 2017.
17. Content Marketing Institute. Available at: http://contentmarketinginstitute.com/what-is-content-marketing/, accessed on June 15th, 2017.
18. American Marketing Association. Available at: http://www.marketing-dictionary.org/Email, accessed on June 15th, 2017.
19. https://www.marketo.com/lead-generation/, accessed on June 15th, 2017. 20. http://www.worldometers.info/world-population/romania-population/,
accessed on June 15th, 2017.
21. http://www.zf.ro/business-hi-tech/statistica-numarul-de-utilizatori-de-internet-a-crescut-in-2016-cu-1-2-la-10-6-milioane-16016618, accessed on June 16th, 2017.
22. https://newsroom.fb.com/company-info/, accessed on June 16th, 2017. 23. https://zephoria.com/top-15-valuable-facebook-statistics/, accessed
on June 16th, 2017. 24. http://www.facebrands.ro/demografice.html, accessed on June 16th, 2017. 25. https://www.hubspot.com/marketing-statistics, accessed on June
17th, 2017. R e c e i ve d : 22 / 0 1 / 20 18
1 s t Re v i s i o n : 0 6 / 03 / 20 1 8 Ac c e p t e d : 20 / 0 5 / 20 18
Author's declaration on the sources of funding of research presented in the scientific article or of the preparation of the scientific article: budget of university's scientific project
Л. Думітреску, канд. екон. наук, проф. Унівесритет імені Лучіана Блага, Сібіу, Румунія, М. Фучі, канд. екон. наук, доц., Г. Горські, канд. екон. наук, проф. Румуно-німецький університет, Сібіу, Румунія
УПРОВАДЖЕННЯ НОВИХ МАРКЕТИНГОВИХ СТРАТЕГІЙ У КОНТЕКСТІ ІНТЕРНЕТ-СЕРЕДОВИЩА –
ПЕРЕВАГИ, НЕДОЛІКИ, СТАТИСТИКА ТА ТЕНДЕНЦІЇ У контексті онлайн-середовища й тиску, створеного новими інформаційними та комунікаційними технологіями, коли Інтернетом
користується понад 40% населення світу, коли рівень проникнення в Інтернет у Європі досяг більш ніж 75% (52% у Румунії) і майже 90% у Північній Америці, і коли смартфон став постійним супутником окремих осіб, сьогоднішні компанії повинні адаптувати або розроб-ляти нові маркетингові стратегії, які допоможуть їм вигравати і зберегти споживачів, інакше ці компанії поволі щезнуть. Тому ме-тою є представлення кількох важливих маркетингових стратегій, що базуються на використанні румунськими компаніями таких інструментів Інтернету, як оптимізація пошукової системи (SEO), контент-маркетинг, соціальні мережі / соціальні мережі в Інтерне-ті, маркетинг електронної пошти, продажі тощо. Показано кілька важливих переваг та недоліків цих маркетингових стратегій. Також наведено кілька важливих статистичних даних стосовно використання Інтернету та інструментів онлайнового маркетингу й підк-реслено майбутні тенденції, пов'язані з цими аспектами. Усе це призначено для підтримки майбутніх управлінських рішень і кращого розуміння необхідності їх упровадження та успішного використання компаніями.
Ключові слова: інтернет-маркетинг, маркетингові стратегії, інтернет, соціальні мережі.
Л. Думитреску, канд. экон. наук, проф. Университет имени Лучиана Блага, Румыния, М. Фучи, канд. экон. наук, доц., Г. Горски, канд. экон. наук, проф. Румыно-немецкий университет, Сибиу, Румыния
ВНЕДРЕНИЕ НОВЫХ МАРКЕТИНГОВЫХ СТРАТЕГИЙ В КОНТЕКСТЕ ИНТЕРНЕТ-СРЕДЫ –
ПРЕИМУЩЕСТВА, НЕДОСТАТКИ, СТАТИСТИКА И ТЕНДЕНЦИИ В контексте онлайн-среды и давления, созданного новыми информационными и коммуникационными технологиями, когда Интер-
нет использует более 40% населения мира, когда уровень проникновения в Интернет в Европе достиг более 75% (52% в Румынии) и почти 90% в Северной Америке, и когда смартфон стал постоянным спутником отдельных лиц, сегодняшние компании должны адаптировать или разрабатывать новые маркетинговые стратегии, которые помогут им выигрывать и сохранить потребителей, в противном случае они постепенно исчезнут. Поэтому целью является представление нескольких важных маркетинговых страте-гий, базирующихся на использовании румынскими компаниями таких инструментов Интернета, как оптимизация поисковой системы (SEO), контент-маркетинг, социальные сети / социальные сети в Интернете, маркетинг электронной почты, продажи и т. п. Пока-зано несколько важных преимуществ и недостатков этих маркетинговых стратегий. Также приведено несколько важных статисти-ческих данных по использованию Интернета и инструментов онлайн- маркетинга, подчеркиваются будущие тенденции, связанные с этими аспектами. Все это предназначено для поддержки будущих управленческих решений и лучшего понимания необходимости их успешного внедрения и использования компаниями.
Ключевые слова: интернет-маркетинг, маркетинговые стратегии, интернет, социальные сети. Bulletin of Taras Shevchenko National University of Kyiv. Economics, 2018; 3(198): 43-48 УДК 316 JEL classification: F23, M12 DOI: https://doi.org/10.17721/1728-2667.2018/198-3/5
B. Glinkowska, Doctor ORCID iD 0000-0002-6915-3297 The University of Lodz, Poland,
Ie. Chebotarov, PhD in Economics, Senior Lecturer, ORCID iD 0000-0001-5963-7637
V. Chebotarov, Doctor of Science (Economics), Professor ORCID iD 0000-0003-1131-9116
SI "Luhansk Taras Shevchenko National University", Starobil'sk, Ukraine
ANALYSIS OF THE ORIGIN, MODERN CHARACTERISTICS AND PROSPECTS OF DETERMINING THE PROFILE OF UKRAINIAN MANAGER
The article is devoted to the development of the initial theoretical and methodological provisions for the study of profile of modern
Ukrainian manager. The results of the corresponding applied empirical analysis carried out by the authors are presented. The characteristics of the features of modern Ukrainian manager in the context of existing models of national business cultures are given.
Keywords: manager profile; Ukraine; entrepreneurship; national business culture; characteristics. The introduction. The socio-economic situation of any
country, as well as the common level of its development, is, in many respects, predetermined by the nature and level of
development of its national management and directly – the level of professionalism of managers of this country. In the generalized categorical definition in modern economic
© Glinkowska B., Chebotarov Ie., Chebotarov V., 2018
~ 44 ~ В І С Н И К Київського національного університету імені Тараса Шевченка ISSN 1728-3817 science, the latter was formalized in the definition of "manager profile". In accordance with the epistemology of cognition, the phenomena and processes reflected in this category are derived from phenomena and processes reflected in the categories "national business culture" and "corporate culture" (and interdependent with phenomena and processes reflected in the categories "company profile" and "product profile").
The analysis of these aspects is of particular relevance for post-socialist countries, in particular – for Ukraine. This is due to the fact that, on the one hand, some experience of market development of these countries has been accumulated in recent past: the thirty years from the beginning of market transformations in a number of former socialist countries will soon be fulfilled. On the other hand, the nature and pace of market reforms in some of the post-socialist countries (hence their current level of social and economic development, the place and role in the system of international division of labor) are far from not only the desired, but also the potential objective capabilities of these countries. This, first of all, refers to Ukraine.
In a more specific definition, the need to increase competitiveness of Ukrainian business structures necessitates the development of modern methods and technologies for making managerial decisions, building effective management systems for production and commercial processes by these business structures in the context of assessing the prospects for their entry into European markets. And this is already the mutual mediation of the problems of economic science and economic practices, the microlevel and the macro level, and with the "entrance" to the level of the international economy.
The review of the literature on the research topic and the analysis of the overall level of the problem's development. The general theoretical prerequisites for researching managerial problems are laid down in the framework of the study of social capital theory. Its founders were L. Hanifan [1] and P. Bourdieu [2]. In this respect, in the recent years, thanks to the works of O. Grishnova [3] and V. Elahin [4], significant theoretical breakthroughs have been carried out in Ukrainian economic science.
However, the subject of system research in Ukraine, as in other countries of the former USSR, the problem of manager profile has not yet become. There is not only a relatively well-established categorical determination of this definition, but also a classification of the profile characteristics of a manager, comparative evaluation of the profile of Ukrainian manager.
In modern conditions in the Ukrainian economic science, various aspects of manager's profile are developed as fragments of analysis of other socio-economic aspects. Thus, O. Grishnova explores them as a component of the formation of the modern level of organization of labor and personnel management [5]. V. Zaitsev – as a component of the rationale for the corporate culture of an industrial enterprise [6]. O. Kamenska – as an element of the development of the concept of human capital management in conditions of development of innovative development model by enterprises [7].
In the English-speaking economic science and the science of post-socialist countries of Central and Eastern Europe, the profile of manager has received a deeper development. D. Kembel at the turn of the 80–90 years in its foundation laid the concept of "competence of a specialist" [8]. On this basis, somewhat later D. Bertram, I. Robertson and M. Kellinen substantiated the need to additionally take into account the potential abilities of the employee, the conditions of his activity and the corresponding results [9]. B. Glinkowska and B. Kaczmarek
study of a set of management profile problems brought to the level of organization and practical implementation of enterprises in the international sphere [10]. At the same time, B. Kaczmarek substantiated approaches in overcoming cross-cultural barriers in the managerial activity of a modern specialist [11].
At the same time, the profile of a modern manager is very far from its acceptable scientific and practical solution in the countries of the European Union.
The methodology of the presented research covers a set of specific methods of dialectics. In particular, consideration of the conditions for the revival of entrepreneurship in Ukraine is built using, to the greatest extent, methods of logical and historical unity, induction and deduction, analysis and synthesis. In the process of questioning managers of Ukrainian enterprises and processing the collected material, economic and statistical methods (groupings, comparisons, extrapolations) were used. Identification and characterization of the profile of modern Ukrainian manager are based on the use of methods of system-structural analysis and concreteness of truth.
The purpose of the article is to develop the scientific and theoretical foundations of the "manager profile" category, the conceptual determination of this definition and the classification of the profile's characteristics of modern Ukrainian manager using empirical data of the research conducted by the authors on the problems and prospects of internationalization of Polish and Ukrainian enterprises.
The main material of the article. Proceeding from the canons of the methodology of scientific cognition of economic phenomena and processes, its starting point should be an analysis of the general prerequisites for the emergence of these phenomena and processes. To understand the content of the profile of Ukrainian manager, the necessary epistemological prerequisite is an analysis of the conditions for the revival of entrepreneurship in Ukraine in the late 80's and early 90's of the twentieth century.
The authors draw attention to the scientific incorrectness of the widespread thesis about the alleged emergence of entrepreneurship in Ukraine, as in most former socialist countries, within the specified time period (for details [12]). And from the historical, and economic, and from the gnoseological point of view, there is no doubt about the level of development of entrepreneurship in Ukraine in the last third of the nineteenth and beginning of the twentieth century as one of the leading not only in the Russian Empire but also in Europe as a whole. Also the same is absolutely characteristic for Poland, and is mostly reflected in the modern economic science of the post-socialist countries [13]. Confirmation of this is the multifaceted activity in Ukraine of the tycoons-bankers-philanthropists of the dynasties Tereshchenko and Brodsky, the Alchevsky brothers, etc. In Poland, the same examples were I. Poznansky, S. Bartsinsky, K. Scheibler and others.
That is why in the 50–60s of the ХІХ century on the basis of the Department of Political Economy and Statistics of the St. Vladimir Imperial University in Kyiv emerged Kyiv school of political economy. At the turn of the ХІХ–ХХ centuries it became one of the most authoritative in the world. Its representatives were world-renowned scientists, organizers of science and government leaders of the top magnitude S. Bulgakov, N. Bunge, I. Vernadsky, N. Sieber, S. Podolinsky, E. Slutsky, P. Struve, M. Tugan-Baranovsky, G. Tsekhanovsky and others.
Therefore, it is legitimate to speak about the revival of entrepreneurship in Ukraine, as in other post-socialist European countries, with the transition to market reforms in the 80-90s. XX century (however, it is necessary to
ISSN 1728-2667 ЕКОНОМІКА. 3(198)/2018 ~ 45 ~ highlight the features of these processes in each of the post-socialist countries).
The most important essential characteristics of the revival of entrepreneurship in Ukraine in the late 80's and early 90's. of the twentieth century is as follows.
The first. Proclaimed "from above" (even in the framework of the former USSR) declarative transition to the market economy without adoption of appropriate state programs of market transformation.
The second. The official negative attitude towards entrepreneurship of the leadership of the then ruling Communist Party of the Soviet Union, the administrative and managerial economic apparatus and law enforcement bodies (moreover, representatives of these social groups through the opaque privatization mechanisms quickly concentrated huge material and financial resources of the former state and collective-farm cooperative property).
The third. The rejection of ideas of entrepreneurship, moreover – a negative attitude towards it, of overwhelming part of society (this was incomparably less characteristic for the western and southwestern regions of Ukraine, which were occupied and annexed by the USSR in the late 30's and early 40's of the 20th century, in which the custom, the connection of veneration and respect for the very idea of entrepreneurship wasn't lost).
At the same time, not only the economic reform of A. Kosygin, but also a number of manifestations of the shadow economy, very common within the socialist economies, especially in the 70–80s, became the original stimulating factors for the revival of entrepreneurship. (stealing, false accounting, later – the so-called "manufacturing" as a kind of illegal entrepreneurship, etc.)
The fourth. The opaque nature of the formation of the first business structures using corruption schemes and non-economic mechanisms (the overwhelming majority of these structures and in modern conditions play a leading role at the national, regional and local levels).
The fifth. Absence of real state programs to support entrepreneurship (first of all, small and medium business) and the displacement of small businesses by large monopolistic and oligarchic business structures.
Thus, the unfavorable characteristics of the institutional environment for the revival of entrepreneurship in Ukraine (and it is difficult to call positive) allow an unambiguous conclusion.
Entrepreneurship in Ukraine in the 80–90 was revived not because of, but in spite of the continued dominance of communist dogmas and after gaining independence. The civil legal society that had not been formed in subsequent years and the absence of a national idea that could be unifying (these phenomena were absolutely characteristic until the last three or four years) were additional aggravating factors for the next three decades.
Together, this predetermined the nature of the national business culture and corporate culture that had not been formed yet in modern conditions (in this case, objectively it should be reported that such phenomena, being institutional in nature, really "require" a long time of their maturation, registration and consolidation).
The above analysis of the institutional environment for the revival of entrepreneurship in Ukraine and the development of problems of the internationalization of Polish and Ukrainian enterprises (with a parallel survey and in-depth interviews of managers of Ukrainian and Polish business structures) done in 2016-2017 by the Poland-Ukraine Research Center give grounds to note the following.
The above generalizations of the analysis of the institutional environment for the revival of entrepreneurship in Ukraine are the general theoretical
basis for researching the manager profile. Such analysis is necessary, but it must necessarily be supplemented by empirical applied developments.
They were implemented by the authors in the context of researching the problems and prospects for the internationalization of Polish and Ukrainian enterprises with the prospect of their entry into world markets. This research was conducted by the Poland – Ukraine Research Center in 2016–2017 (this Center was established in 2016 on the basis of the Department of Management of the University of Lodz and the Department of Economic Theory, Marketing and Entrepreneurship of the Luhansk Taras Schevchenko National University (Starobil'sk) as the implementation of the Framework Agreement between the relevant universities, agreed in 2014).
The main methodological tool for carrying out the noted applied developments was the parallel identical questioning of managers of Polish and Ukrainian enterprises. The questionnaire developed by Polish scientists-practitioners included 28 questions with variants of answers in both closed and open forms (the number of answers to questions ranged from 3 to 12).
The questioning in both Poland and Ukraine was conducted on a face-to-face basis with direct interviews with interviewees (attempts to conduct questionnaires with electronic mailing of questionnaires in both countries were almost 100% unsuccessful).
The questions of the questionnaire concerned preparation, implementation and evaluation of both managerial components, as well as aspects of economics, finance, marketing and commercial communication technologies. The questionnaires in both countries covered the production and commercial structures of small, medium and large businesses (according to the legislative foundations of Ukraine and Poland, the classification parameters of the business structures of these countries are quite close in modern conditions [12]).
In Ukraine, the survey was conducted in Kyiv, Kharkiv, and in Luhansk and Donetsk regions (on the territories under the control of the state). It should be noted that Ukrainian managers in the questionnaires and surveys took an active part and gave real answers, however, as a rule, they did this on the condition of guarantee of anonymity (the latter, naturally, did not belong to the managers of the small business sphere).
In addition to the questionnaires of production workers, similar questions were discussed in the framework of in-depth interview surveys with representatives of government bodies, the Ukrainian Chamber of Commerce and Industry, research institutions and business coaches at the Kyiv-Mohyla School of Business.
Based on the study of epistemological aspects of the problem, the general theoretical analysis of relevant institutional and economic issues, materials applied empirical research managerial contents and their extensive practical experience of the authors categorical definition of the definition of "manager profile" can be explained as follows.
This – the system of structured management, common cultural and psychological requirements of the competences (and the requirements of the competencies associated with the management of the areas of economics, finance and marketing), disclosed by classifying characteristics and relevant assessments, the criteria to be met by manager a certain hierarchical level of the organization (enterprise, institutions, etc.) to fulfill these job responsibilities.
Based on the studies conducted, it seems legitimate to conclude that the features of the Western management

~ 46 ~ В І С Н И К Київського національного університету імені Тараса Шевченка ISSN 1728-3817 model are more typical for characterizing the profile of modern Ukrainian manager.
On the basis of the approach of one of the classics of management I. Watanabе in comparison of Western
and Eastern management characteristics of the profile of modern Ukrainian manager can be represented as follows in the table 1.
Table 1. Comparison of Western and Eastern management practices
Management practices Characteristics of the profile of modern Ukrainian manager
The approaches to the strategic management
In the approaches to strategic management, the focus is on results (as a rule, it is understood as a financial result of the organization within the short, medium and long time periods, and due attention is not paid to the institutional and environmental aspects).
The order for the making of non-strategic decisions
For the order of non-strategic decisions, the most common is the "top-down" approach; Management proposals in the opposite direction are not encouraged.
The information exchange system
The information exchange system is highly formalized (but often – unclear) within the framework of rigidly established flows; the exchange of information at horizontal levels between the structural units of the various functional services of organizations is accompanied by bureaucratic misunderstanding.
The functioning of management systems
The functioning of management systems is built on a clearly expressed individualistic basis; with the change of top managers, there is often a significant "readjustment" of these systems throughout the organization as a whole.
The distribution of functional duties The distribution of functional duties in the organization is formed on the basis of the principle "from activity to personnel"; the individual characteristics of the executive managers of the lower levels (especially creative ones) are rarely taken into account.
The nature of job descriptions The nature of job descriptions is characterized by a number of restrictive provisions, mandatory regulations, regulations and standards; these provisions often allow the possibility of their ambiguous understanding and subsequent implementation not in full.
The planning system The system of intra-firm planning is built according to the "op-down" model; this is characteristic of planning in different time dimensions.
Source: Developed by the authors on the basis of [14]. In a generalized characteristic, we note that for modern
Ukrainian manager, the marked features of Western management are typical with a high degree of absolutization and a kind of "suppression". In contrast, the classical characteristics of oriental management (orientation to the behavior model, the widespread use of the system of planning business processes "from below upwards", the construction of the functioning of management systems on a group basis) in modern Ukrainian realities are poorly manifested.
At the same time, there are reasons to conclude that the marked features of the eastern management are no longer a rarity for Ukrainian vertically integrated holding structures. Moreover, in all sectors of the national economy: in the agri-food complex, in the mining industry and in the heat power industry, in the chemical industry, and so on.
If you characterize the profile of Ukrainian manager using the parameters of the most popular theories of national business culture in the modern management of F. Trompenaars, G. Hofstede and R. Lewis (all of them are not only authoritative theoretical researchers, but also practitioners of the top management of international companies in sphere of HR-management), then according to the results of our research it looks the following way.
According to the theory of F. Trompenaars [15] for modern Ukrainian manager the following characteristics are the most typical:
– particularism (as opposed to universalism of the same standards-rules in the implementation of industrial and commercial processes);
– collectivism (with a rather expressed desire to avoid own responsibility);
– neutrality (with a clear desire to hide one's own opinion);
– diffuseness (the boss-subordinate relationship permeates all spheres of the organization's life);
– ascription (the status of a member of a collective largely follows from belonging to a certain social and professional caste group).
According to the theory of H. Hofstede [16] modern Ukrainian manager is inherent:
– collectivism (with an explicit or implicit desire not to show self-actualization until a certain time);
– high power distance (honoring hierarchy within the organization is unshakable);
– "femininity" (the desire to resolve conflicts through compromises and certain mutual concessions);
– rather strong avoidance of uncertainty is the attraction to formalization and regulation within the organization).
According to the theory of R. Lewis [17], using his famous "triangles", the national business culture of Ukraine (the widely spread opinion Lewis mentioned it in his researches is unreasonable) could be placed on the cathetus on which Poland, Romania and the Russian Federation are located (according to the results of research, the tendency of strengthening the common features of the Ukrainian manager the younger generation with Polish and Romanian).
The theoretical and methodological developments of the Poland-Ukraine Research Center and the empirical scientific and practical studies supplementing them directly on the basis of Ukrainian enterprises of various forms of management give grounds for distinguishing the following typical characteristics of the profile of the modern Ukrainian manager.
To a large extent, one, especially in the first years of his/her professional career, is deprived of a sense of leadership as such (with a rather often inherent understatement of self-esteem). The desire to work proactively, to take personal responsibility for the organization and results of business processes is, rather, a rare case. For many managers, it is a challenge to implement business planning in practice (especially taking into account the industry specific features of enterprises and changing the world commodity and financial markets conjuncture), building a sound marketing policy and using cross-cultural communication technologies.
At the same time, Ukrainian manager for his general cultural and human qualities is a fairly efficient and communicative specialist, mastered (in principle) the
ISSN 1728-2667 ЕКОНОМІКА. 3(198)/2018 ~ 47 ~ fundamentals of modern management technologies, which can successfully work on a team basis. For most managers, the desire to earn "much, fast and on everything", which was atypically widespread in the 1990s of the last century, the orientation toward a long and persistent career is becoming clear. More and more characteristic of modern Ukrainian manager is the orientation to the constant development and implementation of innovations both within the framework of production and technological activities, and directly in the organization and management of business processes. The trend of developing socially responsible entrepreneurship the among modern Ukrainian managers becomes widespread.
The conclusions from the presented study. In Ukrainian economic science, the problems of manager profile have not yet become the subject of systematic research. Their theoretical and practical relevance caused the necessity and expediency of justifying the proposed concept definition of the definition of "management profile" and the outgoing (basic) classification of profile characteristics of modern Ukrainian manager. For these characteristics, a peculiar (and rather unexpected) interlacing of positive and negative qualities in professional activity is characteristic, with pronounced positive general cultural and psychological qualities.
The discussions and prospects for further development of the problem under analysis. Discussions in the study of these aspects are objectively determined by their general insufficient theoretical and methodological level of elaboration, the initial stage of analyzing the content of Ukrainian national business culture.
The prospects of the further development of the analyzed problem consist in conducting a comparative analysis of profiles of modern Ukrainian and Polish managers, and also in developing business methods for the effective adaptation of advanced cross-cultural technologies by Ukrainian managers.
References 1. Hanifan L. J. The Rural School Community Center / L. J. Hanifan //
Annals of the American Academy of Political and Social Science. – 1916. – No. 67. – P. 130–138. Available at: http://www.jstor.org/stable/pdf/1013498.pdf.
2. Bourdieu P. The forms of capital / P. Bourdieu // Handbook of Theory and Research for the Sociology of Education / Ed. by J. G. Richardson. – New York : Greenwood, 1986. – P. 241-258.
3. Грішнова О. Соціальний капітал: сутність, значення, взаємозв'я-зок з іншими формами капіталу / О. Грішнова, Н. Полив'яна // Україна: аспекти праці. – 2009. – № 3. – С. 19-24.
4. Єлагін В. П. Про сутність поняття "соціальний капітал" та його роль у процесі розбудови соціальної держави / В.П. Єлагін // Актуальні проблеми державного управління. – 2011. – № 1. – С. 46-55.
5. Грішнова О. А. Новітні технології в економіці персоналу: нові можливості і нові виклики / О. А. Грішнова, О. С. Заїчко // Вісник еко-номічної науки України. – 2016. – № 2. – С. 52-56.
6. Каменська О. Концепція управління людським капіталом проми-слового підприємства в умовах інноваційного розвитку // О. Каменська // Економічний вісник Донбасу. – 2016. – № 3 (45). – С. 225-229.
7. Зайцев В. С. Вибір моделі корпоративних вимог до компетенцій фахівця промислового підприємства / В. С. Зайцев // Економічний вісник Донбасу. – 2017. – № 2(48). – C. 207-213.
8. Campbell J. P. Modeling the performance prediction problem in industrial and organizational psychology / J. P. Campbell, M. D. Dunnette, L. M. Hough // Handbook of Industrial and Organizational Psychology. Consulting Psychologists Press, 1990. – Vol. 1. – P. 687-732.
9. Bartram D. Competency and individual performance / D. Bartram, I. T. Robertson, M. Callinen // Modeling the world of work. Organizational Effectiveness: The Role of Psycholog. – Chichester : Wiley, 2002. – P. 596–618.
10. Glinkowska B. Zarządzanie międzynarodowe i internacjonalizacja przedsiębiorstw. Teoria i praktyka. / В. Glinkowska, В. Kaczmarek. – Łódź : Wydawnictwo Uniwersytetu Łódzkiego, 2016. – 290 s.
11. Kaczmarek B. Zarządzanie międzykulturowe – wybrane aspekty / B. Kaczmarek; B. Glinkowska (red.), Internacjonalizacja przedsiębiorstw. Uwarunkowania, procesy, wyniki badań. – Łódź :Wydawnictwo Uniwersytetu Łódzkiego, 2016. – S. 87-95.
12. Глинковска Б. Малый и средний бизнес Польши и Украины: проблемы классификации и исходные институциональные основы трансформации / Б. Глинковска, В. Чеботарев; B. Glinkowska (red.), Internacjonalizacja przedsiębiorstw. Uwarunkowania, procesy, wyniki ba-dań. – Łódź :Wydawnictwo Uniwersytetu Łódzkiego, 2016. – S. 153-164.
13. Năsulea C. The Polish recipe / C. Năsulea, D. F. Spînu, R. M. Moroianu // Bulletin of Taras Shevchenko National University of Kyiv. Economics. – 2017. – 3(192). – Р. 34-38. DOI: https://doi.org/ 10.17721/1728-2667.2017/192-3/7.
14.Watanabe I. World-Glass management practices Enduring Methods for Competitive Success / Watanabe I. – Crisp Publications, Inc., 1999. – 85 р.
15. Trompenaars F. Business across cultures / F. Trompenaars, Р. Woolliams. – West Sussex, England : Capstone Publishing, 2003. – 28 р.
16. Hofstede G. Cultures and organizations: software of the mind. – London : McGraw-Hill, 1992. – 576 р.
17. Lewis R. Fish Can't See Water: How National Culture Can Make or Break Your Corporate Strategy / R. Lewis. – John Wiley & Sons, 2013. – 312 р.
R e c e i ve d : 20 / 0 1 / 20 18 1 s t Re v i s i o n : 1 5 / 03 / 20 1 8
Ac c e p t e d : 15 / 0 5 / 20 18 Author's declaration on the sources of funding of research
presented in the scientific article or of the preparation of the scientific article: budget of university's scientific project
Б. Глінковська, д-р екон. наук Університет м. Лодзь, Польща, Є. Чеботарьов, канд. екон. наук, В. Чеботарьов, д-р екон. наук, проф. ДЗ "Луганський національний університет імені Тараса Шевченка", Старобільськ, Україна
АНАЛІЗ ПОХОДЖЕННЯ, СУЧАСНІ ХАРАКТЕРИСТИКИ
ТА ПЕРСПЕКТИВИ ВИЗНАЧЕННЯ ПРОФІЛЮ УКРАЇНСЬКОГО МЕНЕДЖЕРА Розглядається розробка вихідних теоретико-методологічних положень дослідження профілю сучасного українського менеджера.
Представлено результати проведеного авторами відповідного прикладного емпіричного аналізу. Охарактеризовано риси сучасного українського менеджера в контексті існуючих моделей національних ділових культур.
Ключові слова: профіль менеджера; Україна; підприємництво; національна ділова культура; характеристики.
Б. Глинковска, д-р экон. Наук Университет м. Лодзь, Польша, Е. Чеботарев, канд. экон. наук, В. Чеботарев, д-р экон. наук, проф. ГУ "Луганский национальный университет имени Тараса Шевченко", Старобельск, Украина
АНАЛИЗ ПРОИСХОЖДЕНИЯ, СОВРЕМЕННЫЕ ХАРАКТЕРИСТИКИ И ПЕРСПЕКТИВЫ ОПРЕДЕЛЕНИЯ ПРОФИЛЯ УКРАИНСКОГО МЕНЕДЖЕРА
Рассматривается разработка исходных теоретико-методологических положений исследования профиля современного украин-ского менеджера. Представлены результаты проведенного авторами соответствующего прикладного эмпирического анализа. Дана характеристика черт современного украинского менеджера в контексте существующих моделей национальных деловых культур.
Ключевые слова: профиль менеджера; Украина; предпринимательство; национальная деловая культура; характеристики. References (in Latin) 1. Hanifan, L. J., 1916. The Rural School Community Center. Annals of the American Academy of Political and Social Science, 67, 130-
138. Available at: http://www.jstor.org/stable/pdf/1013498.pdf 2. Bourdieu, P., 1986. The forms of capital. Handbook of Theory and Research for the Sociology of Education / Ed. by J.G. Richardson.
New York: Greenwood, pр. 241-258.

~ 48 ~ В І С Н И К Київського національного університету імені Тараса Шевченка ISSN 1728-3817
3. Grishnova, O., Polyv'iana, N., 2009. Social capital: essence, significance, interconnection with other forms of capital. Ukraina: aspekty pratsi, № 3, рр. 19–24. [in Ukrainian].
4. Yelahin, V. P., 2011. On the essence of the concept of "social capital" and its role in the process of building a social state. № 1, р. 46–55. [in Ukrainian].
5. Grishnova O., Zaichko O. 2016. Modern Technologies in Labor Economics: New Opportunities and New Challenges. Herald of the Economic Sciences of Ukraine, № 2, pp. 52-56. [in Ukrainian].
6. Kamenska, O., 2016. Conception of management of industrial enterprise human capital is in the conditions of innovative development. Ekonomichnyi visnyk Donbasu, № 3(45), р. 225-229 [in Ukrainian].
7. Zaitsev, V., 2017. The choice of the model of corporate requirements to the competence of a specialist of industrial enterprise. Ekonomichnyi visnyk Donbasu, № 2(48), р. 207-213. [in Ukrainian].
8. Campbell, J. P., Dunnette, M. D., Hough, L. M., 1990. Modeling the performance prediction problem in industrial and organizational psychology. Handbook of Industrial and Organizational Psychology. Palo Alto: Consulting Psychologists Press, Second edition, vol. 1, р. 687-732.
9. Bartram, D., Robertson, I. T., Callinen, M., 2002. Competency and individual performance. Modeling the world of work. Organizational Effectiveness: The Role of Psycholog. – Chichester: Wiley, р. 596–618.
10. Glinkowska, B., Kaczmarek, B., 2016. Zarządzanie międzynarodowe i internacjonalizacja przedsiębiorstw. Teoria i praktyka. Wydawnictwo Uniwersytetu Łódzkiego. Łódź, 290 s. [in Poland].
11. Kaczmarek, B., 2016. Zarządzanie międzykulturowe – wybrane aspekty; B. Glinkowska (red.), Internacjonalizacja przedsiębiorstw. Uwarunkowania, procesy, wyniki badań, Łódź, s. 87-95. [in Poland].
12. Glinkovska, B., Chebotaryоv, V., 2016. Small and medium business in Poland and Ukraine: classification problems and initial institutional framework for transformation / B. Glinkowska (red.), Internacjonalizacja przedsiębiorstw. Uwarunkowania, procesy, wyniki badań, Łódź, s. 153-164. [in Poland].
13. Năsulea, C., Spînu, D. F., Moroianu, R. M., 2017. The Polish recipe. Visnyk Kyivskoho natsionalnoho universytetu imeni Tarasa Shevchenka. Ekonomika, 3(192), р. 34-38 [in Ukrainian]. DOI: https://doi.org/10.17721/1728-2667.2017/192-3/7.
14. Watanabe I. (1999). World-Glass management practices Enduring Methods for Competitive Success. Crisp Publications, Inc., 85 р. 15. Trompenaars, F., Woolliams, р., 2003. Business across cultures. West Sussex, England: Capstone Publishing. 16. Hofstede G., 1992. Cultures and organizations: software of the mind. London: McGraw-Hill. 17. Lewis R., 2013. Fish Can't See Water: How National Culture Can Make or Break Your Corporate Strategy, John Wiley & Sons, 312 p. Bulletin of Taras Shevchenko National University of Kyiv. Economics, 2018; 3(198): 48-53 УДК 519.85 JEL classification: C 610 DOI: https://doi.org/10.17721/1728-2667.2018/198-3/6
E. Ivokhin, Doctor of Sciences (Physics and Mathematics), Professor, ORCID iD 0000-0002-5826-7408
D. Apanasenko, PhD Student ORCID iD 0000-0001-8387-152X
Taras Shevchenko National University of Kyiv, Kyiv, Ukraine, V. Navrodskiy, PhD in Physics and Mathematics, Associate Professor
ORCID iD 0000-0002-0394-6593 Kyiv National University of Culture and Arts, Kyiv, Ukraine
ABOUT PRODUCTION-TRANSPORT PROBLEM REDUCTION TO THE TWO-LEVEL PROBLEM OF DISCRETE OPTIMIZATION AND ITS APPLICATION
In this study, the application of the production and transport task is considered to solve the problem of the distribution of the
limited capacities of data transmission channels between different nodes of the computer network. A scheme is proposed for reducing the problem to a two-level continuous-discrete optimization problem. The model is formulated and numerical results are obtained to solve the problem of power distribution in the network of the information and computing center.
Key words: power distribution, production and transport task, discrete-continuous programming, two-level model, optimization.
Introduction. Many applied problems relate to the distribution of limited resources in hierarchical systems [1–7]. This, for example, can be the task of balancing the load in a homogeneous network [2], the distribution of work for parallel computers [3], the allocation of resources in the negotiation process [4], etc. The main problem here is the formalization of the problem in the form of multicriteria multi-index transport type problems with constraints in the form of linear inequalities [5–7]. In this case it is assumed that the system contains three types of elements: source, intermediate (transshipment) points and consumer (subscriber) nodes. These elements and their relations are subjects to the conditions of limited resources that affect the amount of resources circulating in the system. There are "managed" elements that determine the conditions for the "effective" functioning of the system. Each managed item defines binary relationships on a suitable allowable range of resource allocation values. Relationships are determined by the preference (goal) functions formulated for the controlled elements. Thus, in the most general case, the problem of allocating resources in a hierarchical system consists in determining the variant of the permissible
resource allocation, in which the target functions of the managed elements take extreme values. Such problems can be formally represented by multicriteria problems under linear constraints and criteria whose types depend on the type of goal functions. In [6], for example, functions of piecewise linear and quadratic form are investigated. Examples of such tasks are also the transport task with intermediate stations (warehouses) [8], distribution of the load on the data transmission channels of Internet providers [5], and production planning [7].
Block optimization principles [9] simplify the analysis, solution and meaningful conclusions of many planning and management tasks. Thanks to such methods it is possible to break up the complex production-transport task (PTT) into autonomous tasks of production planning and organization of delivery of products. At the same time, naturally, there is a need for iterative harmonization of interests of production and transport systems. On the other hand, the interpretation of the results obtained in meaningful terms often allows us to determine rational approaches to the functioning of different economic and technical systems [10].
© Ivokhin E., Apanasenko D., Navrodskiy V., 2018

ISSN 1728-2667 ЕКОНОМІКА. 3(198)/2018 ~ 49 ~
The traditional production and transport task is to determine the production and transportation plan, which minimizes the total costs associated with the organization of production and transportation of the finished product to the points of consumption.
Production-transport problem and it solution The model of planning, production and transportation is
formalized in the form of a general scheme, which contains two groups of variables [9]:
min)()( xgzf , (1)
bBxAz , (2)
where Xx , Zz ; BA, – given matrices; )(),( xgzf
– continuous convex functions; ZX , – some convex
bounded sets. An iterative process is proposed in [2] for solving the
problem (1), (2), and at each step there are solved problems containing only one of two groups of variables:
min)( vAzzf , Zz , (3)
and min)( xg (4)
AzbBx , Xx . (5)
The vector v in the problem (3) has an auxiliary mean-ing and is refined as a result of solving the problem (4), (5).
Let us assume that sz and sv is the approximation of the vectors z and v , obtained on iterations with the num-
ber ,...2,1,0s . Then iterative processes
1 (1 )s s ss sz z z , (6)
1 (1 λ ) λs s ss sv v v , (7)
where 0 λ 1s , λ 0s , ,...2,1,0s , 0
λss
,
sz – solution of the problem (3) with svv , sv – vector of
optimal conditions estimates (5) with szz , converge, respectively, to the solution of the problem (1), (2) and to the vector of optimal conditions estimates (2) [9].
Approach to reduction of production-transport problem
Let's take a closer look at this problem in more detail. Let's assume that producers of products (the number of which is N ) can use several production methods ( S ), each of which is characterized by different quantities of goods, as well as different cost of production and the max-imum possible volume of goods of a certain type. We will assume that producers (suppliers) provide consumers (in quantity M ) with one kind of goods, and the specific cost of transportation from suppliers to consumers is known. Each consumer can meet their product needs through an arbitrary set of manufacturers.
Thus, the production-transport task is to determine the production plan and the plan of transportation with minimal transport costs in order to fully satisfy the de-mand of consumers.
We denote: pikc
– unit cost of production of the product by the і-th
manufacturer with the help of k -th method; tijc – unit cost of transportation of products from the i-th
manufacturer to the j-th consumer;
jb – the value of the demand of the j-th consumer;
ika – quantity of products manufactured by the i-th
manufacturer in the k-th way;
ikz – the intensity of the use of the k-th method by the
manufacturer for the part of the period, which is assumed
to be 1;
ijx – quantity of products transported by i-th manufac-
turer to the j-th consumer; Ni ,1 , Mj ,1 , Sk ,1 .
Then the production transport problem (1)–(2) can be
written in the form of a two-level optimization problem [11]:
min)(1 1
N
i
S
kik
pik zczf (8)
provided by
min)(1 1
M
j
N
iij
tij xcxg (9)
and constraints
j
N
iij bx
1
, Mj ,1 , (10)
S
kikik
M
jij zax
11
, Ni ,1 , (11)
11
S
kikz , Ni ,1 , (12)
0ikz , 0ijx , Ni ,1 , Mj ,1 , Sk ,1 . (13)
This means that the production and transportation of products should be organized in such a way as to ensure minimum production costs under conditions (10)–(13), in which the problem arises of obtaining a minimum-cost transportation plan (9), taking into account the restrictions (10)–(13).
Let each consumer can satisfy his need for products only at the expense of one manufacturer. Introduce the
variables
0
1ijy , Ni ,1 , Mj ,1 , assuming
that 1ijy , if the needs of the j-th consumer are satisfied
by the i-th producer, and 0ijy , in all other cases. Then
obtain a two-level continuous-discrete linear programming problem of this type [12]:
min)(1 1
N
i
S
kik
pik zczf (14)
provided by
min)(1 1
M
j
N
iijj
tij ybcyg (15)
and constraints
11
N
iijy , Mj ,1 , (16)
S
kikik
M
jijj zayb
11
, Ni ,1 , (17)
11
S
kikz , Ni ,1 , (18)

~ 50 ~ В І С Н И К Київського національного університету імені Тараса Шевченка ISSN 1728-3817
0ikz , }1,0{ijy , Ni ,1 , Mj ,1 , Sk ,1 . (19)
It is proposed in [12] to solve continuously discrete lin-ear programming problems according to the following scheme:
– the upper level problem (14), (16)–(19) is solved;
– the decision Sk ,1 is fixed; – the lower level problem (15) – (19) is solved. Since the value of the upper-level objective function
does not depend on the decision of the lower level and vice versa, this algorithm allows finding the optimal solution and the value of the corresponding goal functions for linear programming problems of both levels. At the first step of
the algorithm, an acceptable solution 0z is obtained, which will be the optimal solution of the upper-level problem. Taking this decision into account, the third step is the optimal solution for the lower-level problem.
Solving the problem of distributing the limited capacities of data transmission channels
The proposed above models of production-transport problems allow solving the problem of distributing the lim-ited capacities of data transmission channels between var-ious nodes of the Internet service provider's network. Sup-pose that there is a local computer network of the enter-prise (higher education institution) that provides access to the Internet network for users. Access of users to the glob-al network and obtaining the necessary information is made by means of several communication servers located on the territory of the information and computing center of the enterprise and connected by high-speed external communication channels with Internet providers. Server bandwidth levels lie within the bandwidth of the local net-work (for example, 1GB per second). Let's assume that the needs of network subscribers are known in increasing the speed of obtaining a certain amount of information. The wishes (preferences) of subscribers regarding possible volumes of increase in capacity for transferring information from the provider to the user node are specified. To imple-ment the wishes, it is necessary to update the capacity of the switching servers of the network by deploying new, more powerful computers or by increasing the number of existing servers. In other words, it is necessary to update the server park of the Information and Computing Center (IСC), which allows increasing the total bandwidth of a group of switching servers. In this case, the value of the total server capacity, both in case of increasing the capaci-ty of the existing computer fleet, and in the case of increas-ing the number of servers is assumed to be the same.
We assume that the network realizes the conditions for efficient commutation of channels (relative to their band-width), which are provided by programmable network de-vices (communication servers, routers). The structure of the network and the information distributed in it in the gen-eral case can be the most diverse. In this case, the prob-lem of distribution of limited capacities is considered with the following limitations:
– information is distributed from the provider to sub-scribers (nodes) through switching servers through com-munication channels with bandwidth that takes into account the given bandwidth;
– each subscriber of the network is served by one switching server;
– the bandwidth for obtaining information for switching nodes and subscribers is limited both from the top (princi-pal limitations of the provider's capabilities) and from the bottom (the minimum need for subscribers in the infor-mation received).
Obviously, the amount of payment for the use of com-munication channels of a certain bandwidth depends on the cost established by the providers and the used bandwidth of the external connection. Based on the available reserve bandwidth of the external connection, it is necessary to max-imally increase the total bandwidth of users' communication channels by changing the total capacity of the communica-tion servers, taking into account both the needs and wishes of subscribers (users) and the capabilities of the IСC.
Let 1N – a set of providers of the global network,
2N – a set of communication servers, 3N – a set of sub-
scribers. Through iA , 1,1 Ni , denote the maximum
bandwidth of the data channel that the provider i can pro-
vide, 1,1 Ni ; jB , 2,1 Nj , – the value of the maxi-
mum bandwidth of the data channel that the communica-
tion node j is capable of providing, 2,1 Nj ; kk CC , ,
3,1 Nk , – the values of the minimum and maximum
bandwidth of the data channel to be provided to the sub-
scriber k, 3,1 Nk ; kt - throughput of the k-th subscriber
station, 3,1 Nk . Then, assuming that the power distribu-
tion of the communication channels satisfies the conditions of additivity and proportionality, we can consider the distri-bution of a limited homogeneous resource (communication channel bandwidth) with constraints of the transport type in order to find the optimal data transfer plan. This ensures the effective functioning of the system of providing Internet access to users, which consists in finding the optimal val-
ues of data transmission capacities iT by the i-th infor-
mation provider (provider), 1,1 Ni , and the optimal val-
ues of the throughput kt of using local communication
channels by the k-th user, 3,1 Nk .
Formally, the statement of this problem can be written in the form:
1max t ; 2max t ; …3
max Nt , (20)
under the following conditions:
;A=tN
ii
N
kk
1
1
3
1
(21)
ii AT , 1,1 Ni , (22)
jj Bτ , 2,1 Nj , (23)
kkk CtC , 3,1 Nk , (24)
and with constraints
;CACN
kk
N
ii
N
kk
3
1
1
1
3
1
, (25)
where τ j – the transmission capacities of the
communication channels provided by the j-th
communication node, 2,1 Nj .
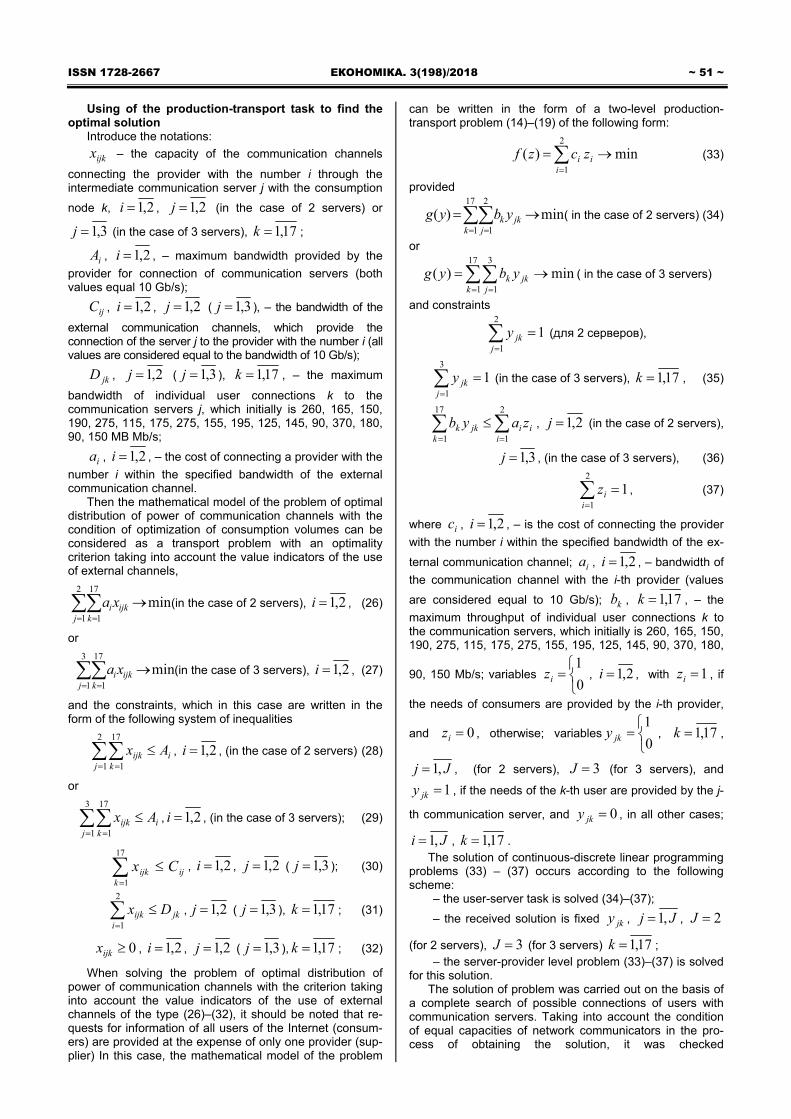
ISSN 1728-2667 ЕКОНОМІКА. 3(198)/2018 ~ 51 ~
Using of the production-transport task to find the optimal solution
Introduce the notations:
ijkx – the capacity of the communication channels
connecting the provider with the number i through the intermediate communication server j with the consumption
node k, 2,1i , 2,1j (in the case of 2 servers) or
3,1j (in the case of 3 servers), 17,1k ;
iA , 2,1i , – maximum bandwidth provided by the
provider for connection of communication servers (both values equal 10 Gb/s);
ijC , 2,1i , 2,1j ( 3,1j ), – the bandwidth of the
external communication channels, which provide the connection of the server j to the provider with the number i (all values are considered equal to the bandwidth of 10 Gb/s);
jkD , 2,1j ( 3,1j ), 17,1k , – the maximum
bandwidth of individual user connections k to the communication servers j, which initially is 260, 165, 150, 190, 275, 115, 175, 275, 155, 195, 125, 145, 90, 370, 180, 90, 150 MB Mb/s;
ia , 2,1i , – the cost of connecting a provider with the
number i within the specified bandwidth of the external communication channel.
Then the mathematical model of the problem of optimal distribution of power of communication channels with the condition of optimization of consumption volumes can be considered as a transport problem with an optimality criterion taking into account the value indicators of the use of external channels,
min2
1
17
1
j k
ijkixa (in the case of 2 servers), 2,1i , (26)
or
min3
1
17
1
j k
ijkixa (in the case of 3 servers), 2,1i , (27)
and the constraints, which in this case are written in the form of the following system of inequalities
ij k
ijk Ax
2
1
17
1
, 2,1i , (in the case of 2 servers) (28)
or
ij k
ijk Ax
3
1
17
1
, 2,1i , (in the case of 3 servers); (29)
ijk
ijk Cx
17
1
, 2,1i , 2,1j ( 3,1j ); (30)
jki
ijk Dx
2
1
, 2,1j ( 3,1j ), 17,1k ; (31)
0ijkx , 2,1i , 2,1j ( 3,1j ), 17,1k ; (32)
When solving the problem of optimal distribution of power of communication channels with the criterion taking into account the value indicators of the use of external channels of the type (26)–(32), it should be noted that re-quests for information of all users of the Internet (consum-ers) are provided at the expense of only one provider (sup-plier) In this case, the mathematical model of the problem
can be written in the form of a two-level production-transport problem (14)–(19) of the following form:
min)(2
1
i
ii zczf (33)
provided
min)(17
1
2
1
k j
jkk ybyg ( in the case of 2 servers) (34)
or
min)(17
1
3
1
k j
jkk ybyg ( in the case of 3 servers)
and constraints
12
1
j
jky (для 2 серверов),
13
1
j
jky (in the case of 3 servers), 17,1k , (35)
2
1
17
1 iii
kjkk zayb , 2,1j (in the case of 2 servers),
3,1j , (in the case of 3 servers), (36)
12
1
i
iz , (37)
where ic , 2,1i , – is the cost of connecting the provider
with the number i within the specified bandwidth of the ex-
ternal communication channel; ia , 2,1i , – bandwidth of
the communication channel with the i-th provider (values
are considered equal to 10 Gb/s); kb , 17,1k , – the
maximum throughput of individual user connections k to the communication servers, which initially is 260, 165, 150, 190, 275, 115, 175, 275, 155, 195, 125, 145, 90, 370, 180,
90, 150 Mb/s; variables
0
1iz , 2,1i , with 1iz , if
the needs of consumers are provided by the i-th provider,
and 0iz , otherwise; variables
0
1jky , 17,1k ,
Jj ,1 , (for 2 servers), 3J (for 3 servers), and
1jky , if the needs of the k-th user are provided by the j-
th communication server, and 0jky , in all other cases;
Ji ,1 , 17,1k . The solution of continuous-discrete linear programming
problems (33) – (37) occurs according to the following scheme:
– the user-server task is solved (34)–(37);
– the received solution is fixed jky , Jj ,1 , 2J
(for 2 servers), 3J (for 3 servers) 17,1k ; – the server-provider level problem (33)–(37) is solved
for this solution. The solution of problem was carried out on the basis of
a complete search of possible connections of users with communication servers. Taking into account the condition of equal capacities of network communicators in the pro-cess of obtaining the solution, it was checked

~ 52 ~ В І С Н И К Київського національного університету імені Тараса Шевченка ISSN 1728-3817
1611717
017 222
1
s
sC (for 2 servers) and
17
0
17
017172
1s
s
r
rs
s CC (for 3 servers) connection methods.
When solving this production and transportation prob-lem, the following results were obtained: when using 2 identical communication servers with a total capacity of 3 Gb / s, the capacity of local connections is 259, 159, 149, 166, 273, 115, 163, 274, 152, 148, 125, 144, 90, 365, 180, 89, 149 Mb / s, which coincided with the previous deci-sions. With the use of 3 communicators with a total capaci-ty of 3 Gb/s, the capacity of local connections is 260, 148, 146, 190, 258, 114, 175, 266, 146, 195, 124, 143, 90, 335, 180, 89, 141 Mb/s (also coincided with previous decisions).
With the increase in the maximum values of the throughput of local connections to 280, 180, 170, 200, 290, 125, 190, 290, 170, 210, 135, 160, 100, 390, 195, 95, 165 Mb / s in case of using two communication. Optimum speeds of local connections equal to 128, 161, 160, 124, 284, 124, 152, 287, 165, 208, 134, 158, 100, 378, 194, 94, 149 Mb/s were obtained with the total throughput of 3 Gb/s, respectively, and in the case of using 3 communicators, the values of local connections 271, 146, 153, 65, 273, 123, 123, 284, 162, 206, 131, 158, 97, 378, 192, 92, 146 Mb/s, respectively.
A complete list of the results obtained for a different number of switches and their capacities is given in Table 1 (optimal solutions are highlighted).
Conclusion and discussion In this study, the application of the production and
transport task is considered to solve the problem of the distribution of the limited capacities of data transmission channels between different nodes of the computer network. A scheme is proposed for reducing the problem to a two-level continuous-discrete optimization problem. A mathe-matical model of the problem of power distribution of com-munication channels is obtained. The problem of optimal distribution of capacities with a criterion that takes into ac-count the cost parameters of using external channels was solved, provided that requests for information from all users of the Internet (consumers) are provided at the expense of only one provider (supplier) This approach can be consid-ered when solving various optimization problems with a hierarchical structure of the process.
Further investigation of the problem of power distribu-tion of data transmission channels is planned to be based on the use of the traditional three-index transport problem, the use of streaming algorithms and the fuzzy approach to solving problems optimization of the distribution of limited resources. Conducting a comparative analysis of the re-sults obtained by different methods will allow us to draw definitive conclusions about the effectiveness of the pro-posed approach.
References 1. Воронин A. A. Оптимальные иерархические структуры / A. A. Во-
ронин, С. П. Mишин. – M. : ИПУ, 2003. – 214 с. 2. Elsasser, R., Monien B. and Preis R., 2002. Diffusion Schemes for
Load Balancing on Heterogeneous Networks. Theory Comput. System, 35(3), pp. 305-320. DOI: http://dx.doi.org/10.1007/s00224-002-1056-4.
3. Gairing, M., Lucking, T., Mavronicolas M. and Monien B., 2004. Computing Nash Equilibria for Scheduling on Restricted Parallel Links // Proc. 36th Annual ACM Sympos. Theory Comput., 2004, pp. 613-622.
4. Dunne, P. E., 2005. Extremal Behavior in Multiagent Contract Negotiation. Jour. Artificial Intelligence Res., 23(1), pp. 41-78.
5. Prilutskii, M. Kh. Distribution of a Homogeneous Resource in Tree-Structured Hierarchical Systems // Proc. III Int. Conf. Identification of Systems and Control Problems (SICPRO'2000), Moscow, IPU, 2000, pp. 2038-2049.
6. Прилуцкий М. Х. Потоковые алгоритмы распределения ресурсов в иерархических системах [Электронный ресурс] / М. Х. Прилуцкий, А. Г. Картомин // Исследовано в России. – 2003. – 39. – С. 444-452. – Режим доступа: http://zhurnal.ape.relarn.ru/ articles/2003/039.pdf
7. Афраймович Л. Г. Многоиндексные задачи распределения ре-сурсов в иерархических системах / Л. Г. Афраймович, М. Х. Прилуцкий // Автоматика и телемеханика. – 2006. – 6. – С. 194-205. (Autom. Remote Control, 67:6 (2006), 1007-1016). DOI: http://dx.doi.org/10.1134/ S0005117906060130
8. Серая О. В. Многоиндексные нелинейные транспортные задачи / О. В.Сeрая, О. И. Дунаевская // Информационные и управляющие системы на железнодорожном транспорте. – Харьков : ХГИЖT, 2009. – № 5. – С. 25-30.
9. Юдин Д. Б. Экстремальные модели в экономике / Д. Б. Юдин, А. Д. Юдин. – М. : Экономика, 1979. – 288 с.
10. Бурков В. Н. Введение в теорию управления организационными системами / В. Н. Бурков, Н. А. Коргин, Д. А. Новиков. – М. : Либроком, 2014. – 264 с.
11. Lukac, Z., Hunjet, D. and Neralic, L., 2008. Solving the production-transportation problem in the Petroleum Industry. Revista Investigacion Operacional, 29(1), рp.63-70.
12. Івохін Є. В. Про розв'язок однієї дворівневої моделі виробничо-транспортної задачі / Є. В. Івохін, Л. Т. Аджубей // Вісник Київського національного університету імені Тараса Шевченка. Серія: Фізико-математичні науки. – 2014. – Вип. 3. – С. 122-125.
R e c e i ve d : 20 / 0 1 / 20 18 1 s t Re v i s i o n : 2 5 / 02 / 20 1 8
Ac c e p t e d : 14 / 0 4 / 20 18 Author's declaration on the sources of funding of research
presented in the scientific article or of the preparation of the scientific article: budget of university's scientific project
Є. Iвохін, д-р фіз.-мат. наук, проф., Д. Aпанасенко, асп. Київський національний університет імені Тараса Шевченка, Київ, Україна, В. Навродський, канд. фіз.-мат. наук, доц. Київський національний університет культури і мистецтв, Київ, Україна
ПРО ЗВЕДЕННЯ ВИРОБНИЧО-ТРАНСПОРТНОЇ ЗАДАЧІ
ДО ДВОРІВНЕВОЇ ЗАДАЧІ ОПТИМІЗАЦІЇ ТА ЇЇ ЗАСТОСУВАННЯ Розглянуто застосування виробничо-транспортної задачі для розв'язання проблеми розподілу обмежених потужностей каналів
передачі даних між різними вузлами комп'ютерної мережі. Запропоновано схему для зведення задачі до дворівневої неперервно-дискретної задачі оптимізації. Сформульовано модель і отримано чисельні результати для розв'язання проблеми розподілу потужно-стей у мережі інформаційно-обчислювального центру.
Ключові слова: розподіл потужностей, виробничо-транспортна задача, дискретно-неперервне програмування, дворівнева модель, оптимізація.
Е. Ивохин, д-р физ.-мат. наук, проф., Д. Aпанасенко, асп. Киевский национальный университет имени Тараса Шевченко, Киев, Украина, В. Навродский, канд. физ.-мат. наук, доц. Киевский национальный университет культуры и искусств, Киев, Украина
О СВЕДЕНИИ ПРОИЗВОДСТВЕННО-ТРАНСПОРТНОЙ ЗАДАЧИ К ДВУХУРОВНЕВОЙ ЗАДАЧЕ ОПТИМИЗАЦИИ И ЕЕ ПРИМЕНЕНИЕ
Рассмотрено применение производственно-транспортной задачи для решения проблемы распределения ограниченных мощно-стей каналов передачи данных между различными узлами компьютерной сети. Предложена схема для сведения задачи к двухуровне-
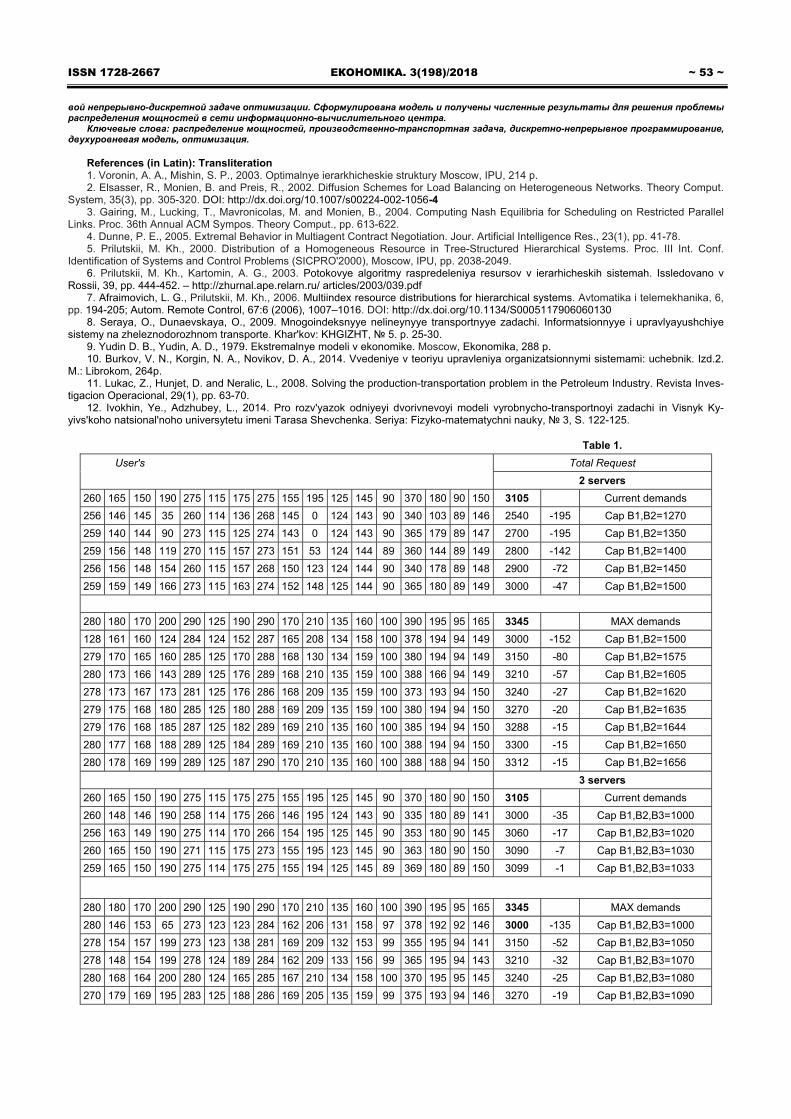
ISSN 1728-2667 ЕКОНОМІКА. 3(198)/2018 ~ 53 ~ вой непрерывно-дискретной задаче оптимизации. Сформулирована модель и получены численные результаты для решения проблемы распределения мощностей в сети информационно-вычислительного центра.
Ключевые слова: распределение мощностей, производственно-транспортная задача, дискретно-непрерывное программирование, двухуровневая модель, оптимизация.
References (in Latin): Transliteration 1. Voronin, A. A., Mishin, S. P., 2003. Оptimalnye ierarkhicheskie struktury Moscow, IPU, 214 p. 2. Elsasser, R., Monien, B. and Preis, R., 2002. Diffusion Schemes for Load Balancing on Heterogeneous Networks. Theory Comput.
System, 35(3), pp. 305-320. DOI: http://dx.doi.org/10.1007/s00224-002-1056-4 3. Gairing, M., Lucking, T., Mavronicolas, M. and Monien, B., 2004. Computing Nash Equilibria for Scheduling on Restricted Parallel
Links. Proc. 36th Annual ACM Sympos. Theory Comput., pp. 613-622. 4. Dunne, P. E., 2005. Extremal Behavior in Multiagent Contract Negotiation. Jour. Artificial Intelligence Res., 23(1), pp. 41-78. 5. Prilutskii, M. Kh., 2000. Distribution of a Homogeneous Resource in Tree-Structured Hierarchical Systems. Proc. III Int. Conf.
Identification of Systems and Control Problems (SICPRO'2000), Moscow, IPU, pp. 2038-2049. 6. Prilutskii, M. Kh., Kartomin, A. G., 2003. Potokovye algoritmy raspredeleniya resursov v ierarhicheskih sistemah. Issledovano v
Rossii, 39, pp. 444-452. – http://zhurnal.ape.relarn.ru/ articles/2003/039.pdf 7. Afraimovich, L. G., Prilutskii, M. Kh., 2006. Multiindex resource distributions for hierarchical systems. Avtomatika i telemekhanika, 6,
pp. 194-205; Autom. Remote Control, 67:6 (2006), 1007–1016. DOI: http://dx.doi.org/10.1134/S0005117906060130 8. Seraya, O., Dunaevskaya, O., 2009. Mnogoindeksnyye nelineynyye transportnyye zadachi. Informatsionnyye i upravlyayushchiye
sistemy na zheleznodorozhnom transporte. Khar'kov: KHGIZHT, № 5. p. 25-30. 9. Yudin D. B., Yudin, A. D., 1979. Ekstremalnye modeli v ekonomike. Moscow, Ekonomika, 288 p. 10. Burkov, V. N., Korgin, N. A., Novikov, D. A., 2014. Vvedeniye v teoriyu upravleniya organizatsionnymi sistemami: uchebnik. Izd.2.
M.: Librokom, 264p. 11. Lukac, Z., Hunjet, D. and Neralic, L., 2008. Solving the production-transportation problem in the Petroleum Industry. Revista Inves-
tigacion Operacional, 29(1), рp. 63-70. 12. Ivokhin, Ye., Adzhubey, L., 2014. Pro rozv'yazok odniyeyi dvorivnevoyi modeli vyrobnycho-transportnoyi zadachi іn Visnyk Ky-
yivs'koho natsional'noho universytetu imeni Tarasa Shevchenka. Seriya: Fizyko-matematychni nauky, № 3, S. 122-125.
Таble 1.
User's Total Request
2 servers
260 165 150 190 275 115 175 275 155 195 125 145 90 370 180 90 150 3105 Current demands
256 146 145 35 260 114 136 268 145 0 124 143 90 340 103 89 146 2540 -195 Cap B1,B2=1270
259 140 144 90 273 115 125 274 143 0 124 143 90 365 179 89 147 2700 -195 Cap B1,B2=1350
259 156 148 119 270 115 157 273 151 53 124 144 89 360 144 89 149 2800 -142 Cap B1,B2=1400
256 156 148 154 260 115 157 268 150 123 124 144 90 340 178 89 148 2900 -72 Cap B1,B2=1450
259 159 149 166 273 115 163 274 152 148 125 144 90 365 180 89 149 3000 -47 Cap B1,B2=1500
280 180 170 200 290 125 190 290 170 210 135 160 100 390 195 95 165 3345 MAX demands
128 161 160 124 284 124 152 287 165 208 134 158 100 378 194 94 149 3000 -152 Cap B1,B2=1500
279 170 165 160 285 125 170 288 168 130 134 159 100 380 194 94 149 3150 -80 Cap B1,B2=1575
280 173 166 143 289 125 176 289 168 210 135 159 100 388 166 94 149 3210 -57 Cap B1,B2=1605
278 173 167 173 281 125 176 286 168 209 135 159 100 373 193 94 150 3240 -27 Cap B1,B2=1620
279 175 168 180 285 125 180 288 169 209 135 159 100 380 194 94 150 3270 -20 Cap B1,B2=1635
279 176 168 185 287 125 182 289 169 210 135 160 100 385 194 94 150 3288 -15 Cap B1,B2=1644
280 177 168 188 289 125 184 289 169 210 135 160 100 388 194 94 150 3300 -15 Cap B1,B2=1650
280 178 169 199 289 125 187 290 170 210 135 160 100 388 188 94 150 3312 -15 Cap B1,B2=1656
3 servers
260 165 150 190 275 115 175 275 155 195 125 145 90 370 180 90 150 3105 Current demands
260 148 146 190 258 114 175 266 146 195 124 143 90 335 180 89 141 3000 -35 Cap B1,B2,B3=1000
256 163 149 190 275 114 170 266 154 195 125 145 90 353 180 90 145 3060 -17 Cap B1,B2,B3=1020
260 165 150 190 271 115 175 273 155 195 123 145 90 363 180 90 150 3090 -7 Cap B1,B2,B3=1030
259 165 150 190 275 114 175 275 155 194 125 145 89 369 180 89 150 3099 -1 Cap B1,B2,B3=1033
280 180 170 200 290 125 190 290 170 210 135 160 100 390 195 95 165 3345 MAX demands
280 146 153 65 273 123 123 284 162 206 131 158 97 378 192 92 146 3000 -135 Cap B1,B2,B3=1000
278 154 157 199 273 123 138 281 169 209 132 153 99 355 195 94 141 3150 -52 Cap B1,B2,B3=1050
278 148 154 199 278 124 189 284 162 209 133 156 99 365 195 94 143 3210 -32 Cap B1,B2,B3=1070
280 168 164 200 280 124 165 285 167 210 134 158 100 370 195 95 145 3240 -25 Cap B1,B2,B3=1080
270 179 169 195 283 125 188 286 169 205 135 159 99 375 193 94 146 3270 -19 Cap B1,B2,B3=1090

~ 54 ~ В І С Н И К Київського національного університету імені Тараса Шевченка ISSN 1728-3817
Bulletin of Taras Shevchenko National University of Kyiv. Economics, 2018; 3(198): 54-65 УДК 331 JEL classification: Q2 DOI: https://doi.org/10.17721/1728-2667.2018/198-3/7
G. Kharlamova, PhD in Economics, Associate Professor, ORCID iD 0000-0003-3614-712X
А. Stavytskуy, PhD in Economics, Associate Professor ORCID iD 0000-0002-5645-6758
Taras Shevchenko National University of Kyiv, Kyiv, Ukraine S. Nate, PhD in Economics, Associate Professor
ORCID iD 0000-0002-4711-1061 Lucian Blaga University in Sibiu, Sibiu, Romania
ESTIMATION OF RENEWABLE ENERGY SOURCES APPLICATION
IN THE SYNERGY WITH EUROPEAN UNION POLICY
This paper gives the possibility to analyze the application of renewable energy sources (RES) at different stages of their implementation to energy supply. Through the world experience we research the dynamics of energy consumption by its types; determine, what kinds of alternative sources are demanded most of all. In addition, we assess the efficiency of the application of RES in Ukraine. According to statistical and correlation analysis, it was proved that for Ukraine it is the most profitable to use biomass energy, while solar energy remains relatively expensive for our country. At the same time situation may change if costs for the solar panel will decrease in the future. It is shown that use of alternative energy sources decrease the energy intensity of GDP, while fossil resources increase this parameter. Unfortunately, Ukraine faces difficulties in attracting investments for development of RES as they are not so profitable at this time. It means that government should change its policy, increasing electricity prices to the European level, giving the chance for energy independence. In any case, in Ukraine, it will be necessary to increase the introduction of RES, as our country has only about 2% of RES in energy balance, while European countries in average have 17% and some of them have more than 60%.
Keywords. Energy, renewable energy sources, EU policy, supply.
Introduction. The issue of energy supply is now very vital in the world. Since, taking into account the fact that stocks of energy resources are decreasing, while the population is increasing. Therefore, a global problem appears in the future, which can lead to a possibility of an energy crisis. Such trends have a significant impact on the economies of countries that, with their high production potential, are not able to satisfy energy demand through their own traditional energy sources [1]. It is clear that today all the basic processes of activity and life of people are based on the use of a significant number of different sources of energy, and at last, people are coming to cognize that resources are not eternal and needed to be somehow saved.
Integrated system solutions together with improved management of municipal infrastructure and environments are essential for Ukraine, as any EU state, to address energy challenges. A number of aspects should be examined and developed, including eco-cycle models demonstrating integrated solutions for energy, waste and
water, integrated land use and transportation, ecosystems planning, sustainable building design, and strategies to reduce air pollution. It is imperative to apply the principles of sustainable development and support smart solutions today if we are not to compromise the ability of future generations to meet their needs tomorrow.
In this paper, we consider the term "Energy security" as diversification of energy supplies and the way to ensure certainty of supply at an acceptable for society and the economy price but also optimum utilization of domestic energy resources, while applying new technologies and active participation in international initiatives on environment and energy [15]. Unfortunately, the fuel and energy complex in Ukraine is not able to provide economically justified domestic and export demand for the country and of the appropriate quality. The question of energy security for Ukraine is now particularly relevant; we can say that this is a matter of "life" – the main condition for its existence as an independent state (Table 1).
Tab le 1. The main energy threats to the economic and national security of Ukraine
Internal threats External threats 1. The inconsistency of reforms in the economy as a whole and the transformations of Fuel and Energy Complex, due to the lack of a clear strategy for economic development, as well as the imperfect legislative framework.
1. High-level monopolization of supply of imported fuel and energy resources.
2. Excessive energy consumption of GDP. 2. The geo-economic and geopolitical pressure of foreign states. 3. High degree of deterioration of power capacities in the absence of the system of renewal and modernization of fixed assets and attractive investment climate.
3. Dependence on the import of a large part of the production equipment, materials, and services for the fuel and energy sectors.
4. Insufficient level of scientific and normative-technical support of the fuel and energy complex, the critical state of branch science.
4. The instability of the global energy prices.
5. Low effectiveness of propaganda and educational measures on the formation of a low-level attitude towards fuel and energy resources in the society, observance of the discipline of paying for them.
5. High level of energy usage may lead to climate changes and therefore to restructure of energy balances in countries [16].
Source: [2].
Fortunately, throughout the whole of the century,
various studies have been conducted on the invention of special devices and methods that would replace existing sources of energy or ensure their preservation. Now, most of these technologies are still in development, but there are
those that are set into operation and perfectly perform their functions. It would be advisable to consider some of the latest technologies that make up the underlying basis and are used in various energy industries (Table 2).
© Kharlamova G., Stavytskуy А., Nate S., 2018

ISSN 1728-2667 ЕКОНОМІКА. 3(198)/2018 ~ 55 ~
Table 2. Promising newest technologies in power engineering
New technology Status Initial introduction Potentially supplant Potential applications
Managed thermonuclear fusion
Theory and experiments over
50 years
Approximately 7–10 years of widespread use
(approx. 2027)
Combustible minerals, renewable energy,
nuclear power
Generation of electric energy, space flights
Geothermal energy Distribution of technology Already used Combustible minerals,
nuclear power Generation of electricity,
heat
Biofuels Spreading technology Already used Flammable minerals Energy conservation,
transportation
Hydrogen power
Technology distribution (hydrogen fuel cells);
Theory and experiments for less expensive hydrogen products
Already used for other hydrogen products, their entry into the market is scheduled
for the next 5 years (approx.2019)
Other energy-saving technologies (chemical
current sources, combustible minerals)
Energy conservation
Nanodel battery Working patterns
It was firstly designed in 2007 at Stanford University.
Now at the stage of perfection. Estimated implementation date
10–15 years (approx.2032)
Other energy conservation technologies: hydrogen power, chemical power supplies and fossil fuels
Portable computers, mobile phones, electric cars. Power saving from the power grid
Ionistor The spread of technology
and the continued development
Wide implementation has not yet gotten, technology
upgrades every year (approx. 2025)
Batteries
Recuperative Braking; fast-charging, durable,
flexible and environmentally friendly energy sources
Wireless transmission of
electricity
Working samples / Distribution and transition
into consumer goods category
Slowness. Wide use after 3–5 years (approx. 2020)
Batteries Wireless power equipment (PCs, smartphones, etc.)
Organic solar cells Laboratory samples Widespread use in
5–7 years (approx.2023) Silicon Solar Battery Electricity generation
Source: authors based on [3] First, it should be noted that the time when certain
developments will be implemented, is approximate and averaged for the world as a whole. In addition, Table 2 considers the positive scenario of technology development, without taking into account the subjective factors that may arise in the future. For clarity, we mentioned a chronological schedule for the emergence and application of promising technologies in the energy sector (column "Initial introduction"). It is clear that for Ukraine the given schedule will be different. There will be a bias of about 5–10 years, compared with more developed countries. After
all, for example, the same alternative energy sources, which include solar and geothermal energy, are only beginning to gain popularity in Ukraine.
One of the main sectors of human life where people use different sources of energy to create their comfortable existence is the public housing. That is why recently a considerable number of devices for energy saving appeared in this area. Table 3 lists the three major newest devices that are already used to save energy in the housing and are more widely available to most users.
Table 3. The latest technologies in the public housing
Technology Principle of operation
Heat accumulator for residential premises Electric heater accumulates thermal energy at night time (at low "night" tariff for electricity),
and then gives off heat, due to the use of materials of high heat capacity
LED profiles Profiles are based on LEDs that not only longer lasting, but also more economical than
conventional lamps
Smart Lighting One of the elements of a smart home that provides efficient power consumption and is
based on motion sensors
Source: authors on the base [4–6]. As for Ukraine, for the last five years, LED-profiles of
various types have begun to be used in the light-fitting premises, and more affluent users have installed intelligent lighting in their homes.
Keeping in mind all the latest technologies that are developed or are already being used in the energy sector the renewable energy sources (RES) are the most available alternative nowadays. The goal of the article is to prove this statement based on statistical data of energy sector.
Literature review: world experience in the application of renewable energy sources. The highest interest in RES was accompanied by the increase of financing in R&D in the energy sector by both state budgets and private companies,
including energy companies. That is displayed by the countries that are strongly dependent upon the import of traditional energy resources (the European Union countries, the USA, Japan, later China, etc.). Substantial progress was quickly made in improving energy independence and engineering-and-economic performance indicators of technologies of turning RES into heat and electricity. The technologies of RES energy conversion have become competitive with the traditional technologies. As a result of intensive research, the cost of the energy received from biofuel, produced by wind power stations, photoelectric transformers, sun, heat, geothermal and bioenergy power plants, reduced massively [4].
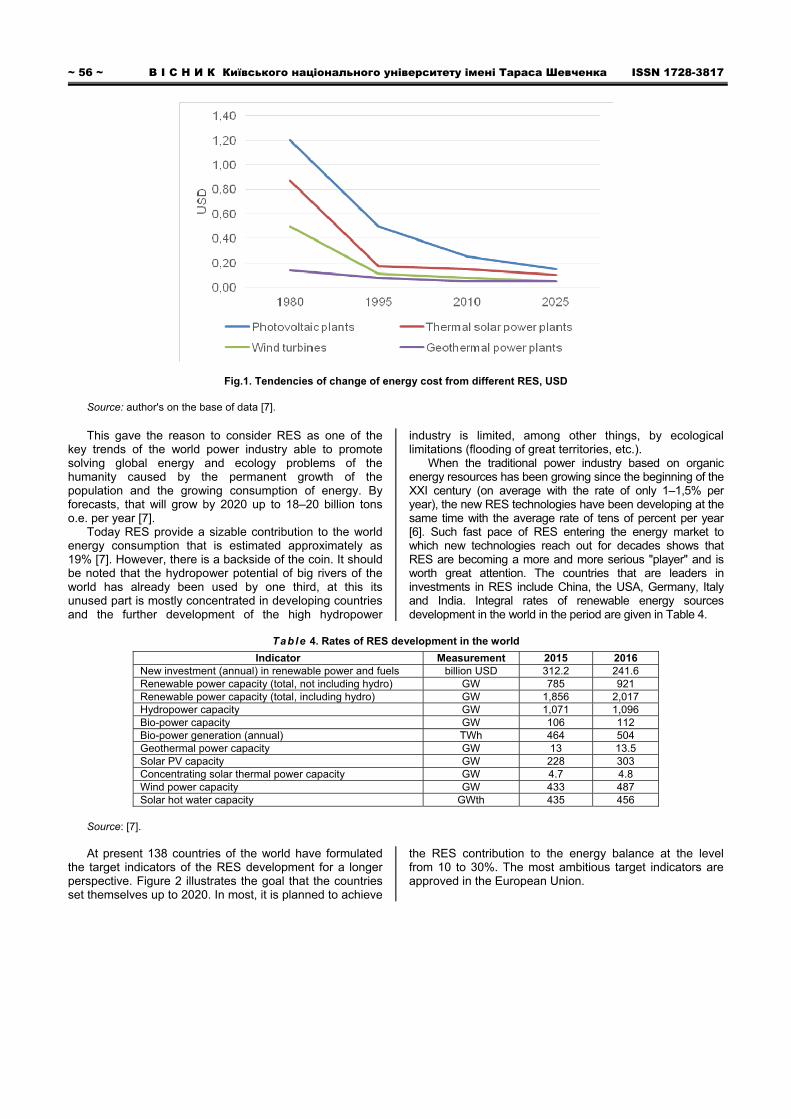
~ 56 ~ В І С Н И К Київського національного університету імені Тараса Шевченка ISSN 1728-3817
Fig.1. Tendencies of change of energy cost from different RES, USD
Source: author's on the base of data [7]. This gave the reason to consider RES as one of the
key trends of the world power industry able to promote solving global energy and ecology problems of the humanity caused by the permanent growth of the population and the growing consumption of energy. By forecasts, that will grow by 2020 up to 18–20 billion tons o.e. per year [7].
Today RES provide a sizable contribution to the world energy consumption that is estimated approximately as 19% [7]. However, there is a backside of the coin. It should be noted that the hydropower potential of big rivers of the world has already been used by one third, at this its unused part is mostly concentrated in developing countries and the further development of the high hydropower
industry is limited, among other things, by ecological limitations (flooding of great territories, etc.).
When the traditional power industry based on organic energy resources has been growing since the beginning of the XXI century (on average with the rate of only 1–1,5% per year), the new RES technologies have been developing at the same time with the average rate of tens of percent per year [6]. Such fast pace of RES entering the energy market to which new technologies reach out for decades shows that RES are becoming a more and more serious "player" and is worth great attention. The countries that are leaders in investments in RES include China, the USA, Germany, Italy and India. Integral rates of renewable energy sources development in the world in the period are given in Table 4.
Table 4. Rates of RES development in the world
Indicator Measurement 2015 2016 New investment (annual) in renewable power and fuels billion USD 312.2 241.6 Renewable power capacity (total, not including hydro) GW 785 921 Renewable power capacity (total, including hydro) GW 1,856 2,017 Hydropower capacity GW 1,071 1,096 Bio-power capacity GW 106 112 Bio-power generation (annual) TWh 464 504 Geothermal power capacity GW 13 13.5 Solar PV capacity GW 228 303 Concentrating solar thermal power capacity GW 4.7 4.8 Wind power capacity GW 433 487 Solar hot water capacity GWth 435 456
Source: [7]. At present 138 countries of the world have formulated
the target indicators of the RES development for a longer perspective. Figure 2 illustrates the goal that the countries set themselves up to 2020. In most, it is planned to achieve
the RES contribution to the energy balance at the level from 10 to 30%. The most ambitious target indicators are approved in the European Union.

ISSN 1728-2667 ЕКОНОМІКА. 3(198)/2018 ~ 57 ~
Fig. 2. Rates of the RES contribution to the final consumption of energy in the EU countries and goals for 2020. Source: Authors' on the base of [7]. Methods of encouragement to use RES in Ukraine.
Ukraine has the significant potential to develop RES. All the regions of the country have possibilities to use RES. At the same time, the introduction of RES in the country is too slow. Its contribution to the country's energy balance is not significant, especially, if to consider best practices in the neighbour states (see Annex 1). At present, the rate of RES (biomass) in Ukraine is about 2% only. Nevertheless, the Law of Ukraine "On Alternative Sources of Energy" [8] adopted in 2003 promises that the share of RES is to increase to 6-7% before 2030. There are many reasons for this state of things. The main one is the absence of the system that economically stimulates the transition to RES usage, the declarative nature of normative legal acts that have no concrete mechanisms of its implementation and low-performance discipline. One can not say that nothing is being done in this aspect, but what is being done is not enough to compensate the negative tendencies, such as the global increase of prices for energy carriers, the
increase of the country's energy dependence level and the environmental contamination. Ukraine still does not introduce new kinds of RES, not invest in technologies, not develop the production based on new technologies. Thus, it preserves its technological backwardness and can lose its chance to enter the European Community.
Factors favourable to the RES development in Ukraine are as follows:
the increase of prices for traditional energy carriers; ensuring of requirements of ecological norms and
standards; a growing chance to enter the European
Community; the necessity to replace the worn-out key assets. The technically achievable potential of the production of
energy carriers from renewable sources of energy and alternative kinds of fuels above 98.0 million tons of reference fuel per year.
Table 5. Potential of RES in Ukraine
№ RES Yearly technically achievable potential
bln. kilowatt-hours/year million tons o.e./year 1. Wind energetics 79.8 28 2. Solar energetics, including: 38.2 6
2.1. – electrical one 5.7 2 2.2. – thermal one 32.5 4 3. Small hydropower 8.6 3 4. Bioenergetics, including: 178 31
4.1. – electrical one 27 10.3 4.2. – thermal one 151 20.7 5. Geothermal energetics 97.6 12 6. Environmental energy 146.3 18
Total amounts of replacement of traditional and natural energy resources 548.5 98
Source: Made up by the authors on the basis of the data of Bloomberg New Energy Finance.
According to Table 5, the total amounts of replacement
make up almost half of the total energy balance of the country. Ukraine has favourable conditions for the development of wind energetics, solar energetics, and
midget power plants should be renewed – those that require renewal. The technically achievable energy potential of renewable energy sources regarding all the regions of the country is totalled up in Figure 3.

~ 58 ~ В І С Н И К Київського національного університету імені Тараса Шевченка ISSN 1728-3817
Fig. 3. Potential of different kinds of RES in million tons o.e.
Source: Made up by the authors on the basis of the data of Bloomberg New Energy Finance. Figure 4 illustrates how many tons of energy sources can be replaced be RES in perspective.
Fig. 4. Achievable yearly amounts of replacement of traditional fuel and energy resources in Ukraine until 2030 in the aspect of RES usage
Source: Made up by the authors on the basis of the data of Bloomberg New Energy Finance.
As seen, the available potential of RES in Ukraine, its
scientific and industrial potential allow it in the nearest time substantially accelerate the speed of RES usage in the country. However, for this, it is necessary to create the conditions to stimulate the development of this sphere taking proper measures and using European countries' experience (Annex 1). A number of general political and economic factors will condition the development of the RES sector in Ukraine. Largely, this is the stable legislative authority oriented at the stable development and growing wealth, the effective executive authority that is worth trusting it and judicial authority that provides legal reliability.
In the entire world, some countries invest in RES more than in other kinds of energy production. Net investments in additional production facilities for the extraction of fossil fuel are 132 bln USD whereas in ecologically clear sources 242.5 bln USD were invested [6]. The overwhelming
majority of investments is in solar and wind power, their share is more than 90% of all the investments. Anyway, there is the problem of lack of the information about the benefits (financial, social and ecological ones), the profitability of investments in RES usage. There are some factors that stimulate investments in the new forms of energy production and some competition problems. One of the reasons for using renewable resources is lower expenditures on the support of the local energy production and on its possibility which is better for the countries having no developed infrastructure. There are also some other factors that make the investments in renewable energy sources attractive:
RES industry is an enough "depoliticized" branch of electric power industry;
RES industry is positively accepted by local communities due to its ecological cleanness;
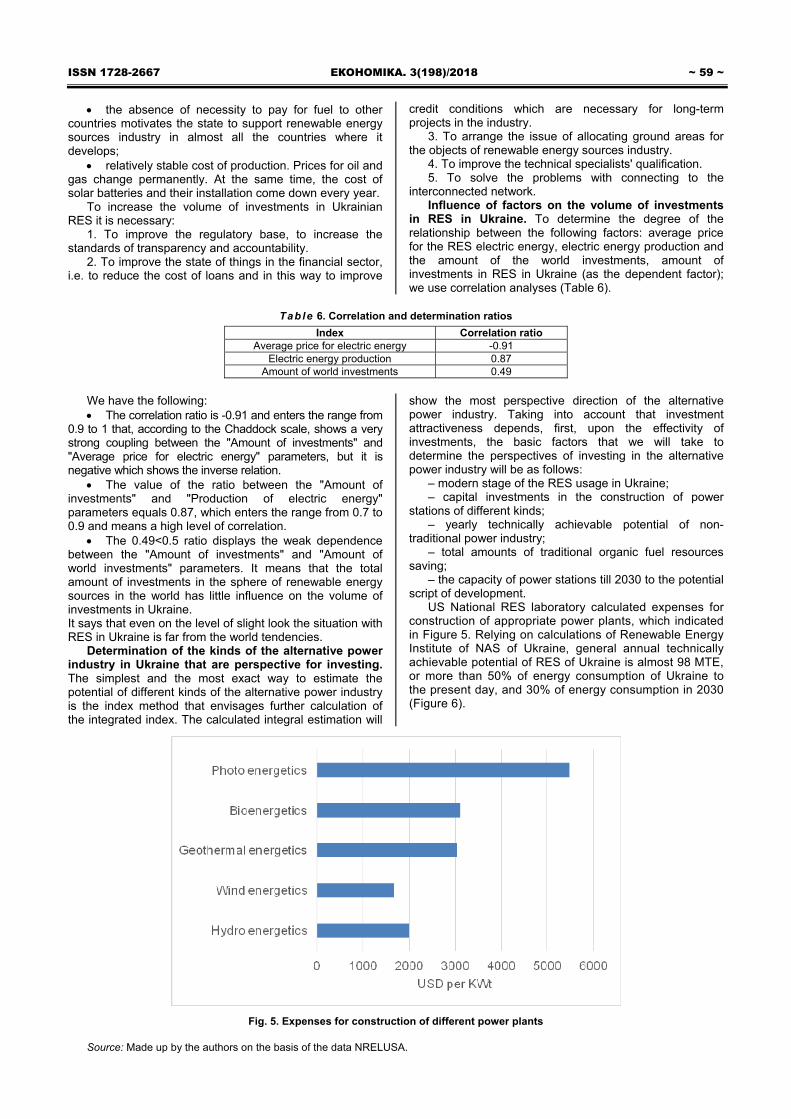
ISSN 1728-2667 ЕКОНОМІКА. 3(198)/2018 ~ 59 ~
the absence of necessity to pay for fuel to other countries motivates the state to support renewable energy sources industry in almost all the countries where it develops;
relatively stable cost of production. Prices for oil and gas change permanently. At the same time, the cost of solar batteries and their installation come down every year.
To increase the volume of investments in Ukrainian RES it is necessary:
1. To improve the regulatory base, to increase the standards of transparency and accountability.
2. To improve the state of things in the financial sector, i.e. to reduce the cost of loans and in this way to improve
credit conditions which are necessary for long-term projects in the industry.
3. To arrange the issue of allocating ground areas for the objects of renewable energy sources industry.
4. To improve the technical specialists' qualification. 5. To solve the problems with connecting to the
interconnected network. Influence of factors on the volume of investments
in RES in Ukraine. To determine the degree of the relationship between the following factors: average price for the RES electric energy, electric energy production and the amount of the world investments, amount of investments in RES in Ukraine (as the dependent factor); we use correlation analyses (Table 6).
Table 6. Correlation and determination ratios
Index Correlation ratio Average price for electric energy -0.91
Electric energy production 0.87 Amount of world investments 0.49
We have the following: The correlation ratio is -0.91 and enters the range from
0.9 to 1 that, according to the Chaddock scale, shows a very strong coupling between the "Amount of investments" and "Average price for electric energy" parameters, but it is negative which shows the inverse relation.
The value of the ratio between the "Amount of investments" and "Production of electric energy" parameters equals 0.87, which enters the range from 0.7 to 0.9 and means a high level of correlation.
The 0.49<0.5 ratio displays the weak dependence between the "Amount of investments" and "Amount of world investments" parameters. It means that the total amount of investments in the sphere of renewable energy sources in the world has little influence on the volume of investments in Ukraine. It says that even on the level of slight look the situation with RES in Ukraine is far from the world tendencies.
Determination of the kinds of the alternative power industry in Ukraine that are perspective for investing. The simplest and the most exact way to estimate the potential of different kinds of the alternative power industry is the index method that envisages further calculation of the integrated index. The calculated integral estimation will
show the most perspective direction of the alternative power industry. Taking into account that investment attractiveness depends, first, upon the effectivity of investments, the basic factors that we will take to determine the perspectives of investing in the alternative power industry will be as follows:
– modern stage of the RES usage in Ukraine; – capital investments in the construction of power
stations of different kinds; – yearly technically achievable potential of non-
traditional power industry; – total amounts of traditional organic fuel resources
saving; – the capacity of power stations till 2030 to the potential
script of development. US National RES laboratory calculated expenses for
construction of appropriate power plants, which indicated in Figure 5. Relying on calculations of Renewable Energy Institute of NAS of Ukraine, general annual technically achievable potential of RES of Ukraine is almost 98 MTE, or more than 50% of energy consumption of Ukraine to the present day, and 30% of energy consumption in 2030 (Figure 6).
Fig. 5. Expenses for construction of different power plants Source: Made up by the authors on the basis of the data NRELUSA.
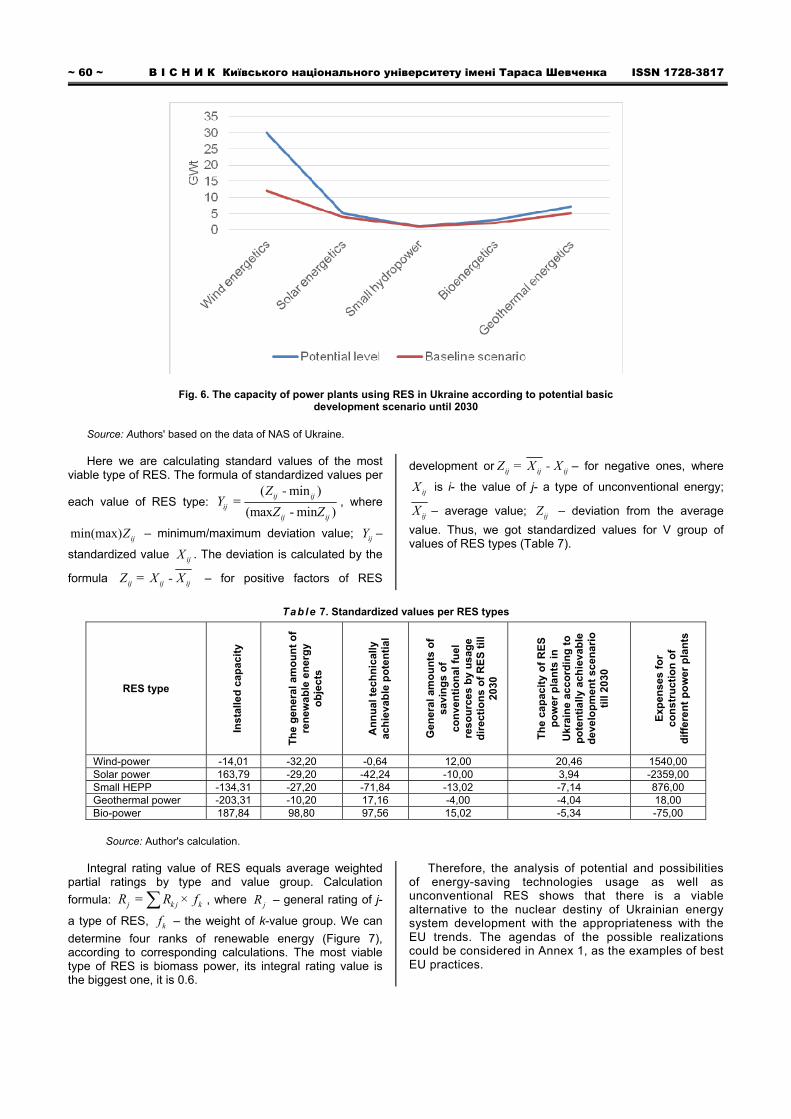
~ 60 ~ В І С Н И К Київського національного університету імені Тараса Шевченка ISSN 1728-3817
Fig. 6. The capacity of power plants using RES in Ukraine according to potential basic development scenario until 2030
Source: Authors' based on the data of NAS of Ukraine. Here we are calculating standard values of the most
viable type of RES. The formula of standardized values per
each value of RES type: ( - min )
=(max - min )
ij ijij
ij ij
ZY
Z Z, where
min(max) ijZ – minimum/maximum deviation value; ijY –
standardized value ijX . The deviation is calculated by the
formula ij ij ijZ = X - X – for positive factors of RES
development or ij ij ijZ = X - X – for negative ones, where
ijX is i- the value of j- a type of unconventional energy;
ijX – average value; ijZ – deviation from the average
value. Thus, we got standardized values for V group of values of RES types (Table 7).
Table 7. Standardized values per RES types
RES type
Inst
alle
d c
ap
acit
y
Th
e g
ener
al a
mo
un
t o
f re
new
ab
le e
ner
gy
ob
jec
ts
An
nu
al t
ech
nic
ally
ac
hie
vab
le p
ote
nti
al
Gen
era
l am
ou
nts
of
savi
ng
s o
f co
nve
nti
on
al f
uel
re
sou
rces
by
us
age
dir
ecti
on
s o
f R
ES
till
20
30
Th
e ca
pac
ity
of
RE
S
po
wer
pla
nts
in
U
krai
ne
acco
rdin
g t
o
po
ten
tia
lly a
chie
vab
le
dev
elo
pm
ent
scen
ario
ti
ll 20
30
Exp
ense
s fo
r co
ns
tru
ctio
n o
f d
iffe
ren
t p
ow
er p
lan
ts
Wind-power -14,01 -32,20 -0,64 12,00 20,46 1540,00 Solar power 163,79 -29,20 -42,24 -10,00 3,94 -2359,00 Small HEPP -134,31 -27,20 -71,84 -13,02 -7,14 876,00 Geothermal power -203,31 -10,20 17,16 -4,00 -4,04 18,00 Bio-power 187,84 98,80 97,56 15,02 -5,34 -75,00
Source: Author's calculation.
Integral rating value of RES equals average weighted
partial ratings by type and value group. Calculation
formula: =j k j kR R × f , where jR – general rating of j-
a type of RES, kf – the weight of k-value group. We can
determine four ranks of renewable energy (Figure 7), according to corresponding calculations. The most viable type of RES is biomass power, its integral rating value is the biggest one, it is 0.6.
Therefore, the analysis of potential and possibilities of energy-saving technologies usage as well as unconventional RES shows that there is a viable alternative to the nuclear destiny of Ukrainian energy system development with the appropriateness with the EU trends. The agendas of the possible realizations could be considered in Annex 1, as the examples of best EU practices.
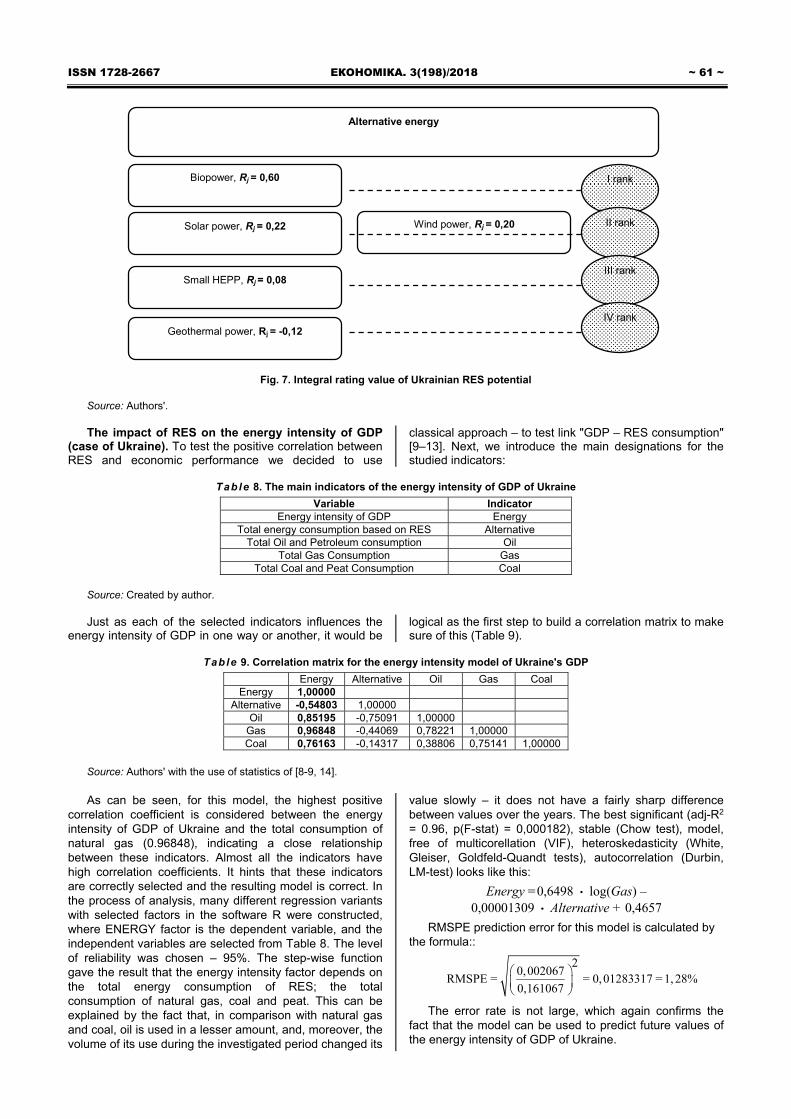
ISSN 1728-2667 ЕКОНОМІКА. 3(198)/2018 ~ 61 ~
Alternative energy
Biopower, Rj = 0,60
Solar power, Rj = 0,22
Small HEPP, Rj = 0,08
Geothermal power, Rj = -0,12
Wind power, Rj = 0,20
І rank
ІІ rank
ІІІ rank
ІV rank
Fig. 7. Integral rating value of Ukrainian RES potential
Source: Authors'. The impact of RES on the energy intensity of GDP
(case of Ukraine). To test the positive correlation between RES and economic performance we decided to use
classical approach – to test link "GDP – RES consumption" [9–13]. Next, we introduce the main designations for the studied indicators:
Table 8. The main indicators of the energy intensity of GDP of Ukraine
Variable Indicator Energy intensity of GDP Energy
Total energy consumption based on RES Alternative Total Oil and Petroleum consumption Oil
Total Gas Consumption Gas Total Coal and Peat Consumption Coal
Source: Created by author. Just as each of the selected indicators influences the
energy intensity of GDP in one way or another, it would be logical as the first step to build a correlation matrix to make sure of this (Table 9).
Table 9. Correlation matrix for the energy intensity model of Ukraine's GDP
Energy Alternative Oil Gas Coal Energy 1,00000
Alternative -0,54803 1,00000 Oil 0,85195 -0,75091 1,00000
Gas 0,96848 -0,44069 0,78221 1,00000 Coal 0,76163 -0,14317 0,38806 0,75141 1,00000
Source: Authors' with the use of statistics of [8-9, 14]. As can be seen, for this model, the highest positive
correlation coefficient is considered between the energy intensity of GDP of Ukraine and the total consumption of natural gas (0.96848), indicating a close relationship between these indicators. Almost all the indicators have high correlation coefficients. It hints that these indicators are correctly selected and the resulting model is correct. In the process of analysis, many different regression variants with selected factors in the software R were constructed, where ENERGY factor is the dependent variable, and the independent variables are selected from Table 8. The level of reliability was chosen – 95%. The step-wise function gave the result that the energy intensity factor depends on the total energy consumption of RES; the total consumption of natural gas, coal and peat. This can be explained by the fact that, in comparison with natural gas and coal, oil is used in a lesser amount, and, moreover, the volume of its use during the investigated period changed its
value slowly – it does not have a fairly sharp difference between values over the years. The best significant (adj-R2 = 0.96, p(F-stat) = 0,000182), stable (Chow test), model, free of multicorellation (VIF), heteroskedasticity (White, Gleiser, Goldfeld-Quandt tests), autocorrelation (Durbin, LM-test) looks like this:
Energy =0,6498 log(Gas) – 0,00001309 Alternative + 0,4657
RMSPE prediction error for this model is calculated by the formula::
20,002067
RMSPE = = 0,01283317 = 1, 28%0,161067
The error rate is not large, which again confirms the fact that the model can be used to predict future values of the energy intensity of GDP of Ukraine.
~ 62 ~ В І С Н И К Київського національного університету імені Тараса Шевченка ISSN 1728-3817
To summarize, the energy intensity of Ukraine's GDP is highly dependent on the total consumption of natural gas and energy generated by RES. As for natural gas, it is not surprising, because it is used most of all by the fuel and energy complex. The impact of energy consumption of RES can be explained by the fact that in recent years, alternative energy sources have begun to gain popularity in Ukraine, which has led to the expansion of the limits of their use in the country. In general, the value of the coefficient tends to decrease, which means that each year Ukraine is getting closer to world indicators.
Conclusions & discussion. As noted by L. P. Kapitsa: "The future of humanity depends on how it will provide itself with energy", thus, it can be concluded that "political and energy independence are mutually determined". In the modern world, the national security of the state, economic and energy security are interconnected. Forecasts show that in the coming decade energy consumption will not have a tendency to decrease. The unevenness of the supply of energy resources to the countries of the world and the regions of individual countries leads to threats to energy security and, as a consequence, to economic and national security. Especially it has sense in those countries that do not have sufficient reserves of minerals, in particular, coal, oil and natural gas [1].
A good political strategy based will strengthen transmission and distribution efficiency; reduce dependency on single sources; promote decentralized systems.
This paper contains some analysis of the potential of RES. The place of foreign investments has been determined as one of the moving forces of RES development among other factors. With the help of integral rating value calculation of potential of different RES types, the most viable direction for investments in RES has been determined. The given research following conclusions can be made:
For the present day, the contribution of renewable resources in the worldwide energy generation is nearly 6%, in Ukraine this value is less than 2%.
The greatest potential for Ukrainian energy operators is bio-power. Assured that implementation of bio-power is reasonable, an important issue appeared – what has specifically influence on the volume of foreign investments in this industry and what things are worth paying attention to.
To increase the volume of capital investments, requirements of transparency and accountability should be increased at the state level; credit conditions for the possibility of the long-term contributions in industry projects should be improved; land plots provision for RES facilities should be started; skills of technical personnel should be increased. In spite of that state has made some steps such as "Energy Strategy of Ukraine for the Period till 2030", inadequacy of regulations and non-performance of made decisions, low budget of research works and engineering developments, insufficient level of information provided to potential developers of RES technologies and consumers are restraining development of RES in Ukraine.
We can assume for the discussion that: • all the latest technologies that are developed or are
already being used in the energy sector are necessary complementary elements that will ensure longer use of non-renewable sources of energy in the future, therefore their further implementation is actual and absolutely necessary, especially in Ukraine;
• the energy intensity of Ukraine's GDP depends on the total consumption of natural gas and energy generated by RES. As for natural gas, it is not surprising, because it is used most of all from the fuel and energy complex. The impact of renewable energy consumption indicators can be explained by the fact that in recent years alternative energy sources have begun to gain popularity in Ukraine, which has led to the expansion of the limits of their use in the country.
Unfortunately, Ukraine faces difficulties in attracting investments for development of RES as they are not so profitable at this time. It means that government should change its policy, increasing electricity prices to the European level, giving the chance for energy independence. In any case in Ukraine, it will be necessary to increase the introduction of RES, as our country has only about 3% of RES in energy balance, while European countries in average have 17% and some of them have more than 60%.
An important role in the RES implementation is to play local authorities because implementation level depends much on local conditions. The rise of prices for traditional energy transporters and ecological payments has become a stimulus for it in the implementation of the RES implementation. However, the state should create the favourable conditions for investing activity in this field, involving both domestic and foreign investments (first of all private ones) and enable it to establish support funds for the most economically viable areas of RES given region.
References 1. Черняк О. І. Дослідження обсягів інвестування в "Зелену енер-
гетику" світу [Текст] / О. І. Черняк, Я. Фаренюк // Вісник Київського наці-онального університету імені Тараса Шевченка. Економіка – 2015. – № 177. – С. 60-68
2. Бобров Є. А. Концептуальні підходи до визначення поняття "енергетична безпека" [Текст] / Є. А. Бобров // Стратегічні пріоритети. – 2012. – № 2. – С. 70–75.
3. Tocher M. Technology Trends Survey: Future Emerging Technology Trends [Текст] / M.Tocher, Goffettre. – Ver.3, 2015.
4. Енергетична стратегія України до 2035 року: [Електронний ре-сурс]. – Режим доступу: http://mpe.kmu.gov.ua/minugol/doccatalog/ document?id=245032412
5. Офіційний сайт компанії IKNet: [Електронний ресурс] – Режим доступу: http://iknet.com.ua/uk/innovations/. – Інноваційні технології в енергетиці.
6. Офіційний сайт національного інституту стратегічних до-сліджень: [Електронний ресурс]. – Режим доступу: http://www.niss.gov.ua/articles/262/. – Використання енергозберігаючих технологій в країнах ЄС: досвід для України.
7. Renewables 2017 Global Status Report. [Електронний ресурс]. – Режим доступу: http://www.ren21.net/wp-content/uploads/2017/06/17-8399_GSR_2017_Full_Report_0621_Opt. pdf
8. Офійійний сайт Міністерства енергетики та вігільної промисло-вості України: [Електронний ресурс]. – Режим доступу: http://mpe.kmu.gov.ua/minugol/control/uk/publish/article?art_id=245183431&cat_id=245183225
9. Офіційний сайт державного агенства з енергоефективності та енергозбереження України: [Електронний ресурс]. – Режим доступу: http://saee.gov.ua/uk/about/polozhennya-derzhenerhoefektyvnosti-ukrainy. – Положення Держенергоефективності.
10. Глобальна енергетична безпека: проблеми і шляхи розв'язання загрози [Текст] / [ В. І Фортов, А. В Макаров, Т. І Митрова] // Віcник НАН України. – 2007. – № 8. – C. 40.
11. Гуcєва І. І. Методологічний підхід до визначення рівня енерге-тичної безпеки України на оcнові теорій ризику та надійноcті [Текст] / І. І. Гуcєва // Cайт електронного наукового фахового видання "Ефектив-на економіка". – [Електрон. реcурc]. – Режим доcтупу: http://www.economy.nayka.com.ua/index.php?operation=1&iid=399.
12. Харламова Г. О. Еколого-економічна конвергенція: перехід до стійкої енергетики [Текст] / Г. О. Харламова // Вісник Київського націо-нального університету імені Тараса Шевченка. Економіка. – 2013. – № 150. – С. 44-49.
13. Харламова Г. О. Енергетична складова екологічної безпеки у відображені [Текст] / Г. О. Харламова // Вісник Київського національ-ного університету імені Тараса Шевченка. Економіка. – 2015. – № 166. – С. 72-79.

ISSN 1728-2667 ЕКОНОМІКА. 3(198)/2018 ~ 63 ~
14. Енергетична стратегія України на період до 2030 року [Текст]: розпорядження Кабінету Міністрів України від 24 липня 2013 року №1071: [Електрон. ресурс]. – Режим доступу: http://zakon1.rada.gov.ua/ laws/show/145-2006-%D1%80
15. Chernayk O. I., Kharlamova G. O., Stavytskyy A. V. Energy Perspective 2030 for Ukraine in the Context of the EU Integration // Emerging Issues in the Global Economy. Springer Proceedings in Business and Economics. Springer, Cham., pp. 113-129. – https://doi.org/ 10.1007/978-3-319-71876-7_10
16. Stavytskyy A. V., Giedraitis V., Sakalauskas D., Huettinger M. Economic Crises And Emission Of Pollutants: A Historical Review Of Select Economies Amid Two Economic Recessions // Ekonomika, 2016, Vol. 95(1), рр. 7-21.
R e c e i ve d : 20 / 0 4 / 20 18 1 s t Re v i s i o n : 2 5 / 05 / 20 1 8
Ac c e p t e d : 14 / 0 6 / 20 18 Author's declaration on the sources of funding of research
presented in the scientific article or of the preparation of the scientific article: budget of university's scientific project
Г. Харламова, канд. екон. наук, доц., А. Ставицький, канд. екон. наук, доц. Київський національний університет імені Тараса Шевченка, Київ, Україна, С. Нате, канд. екон. Наук Університет імені Лучіана Блага, Сібіу, Румунія
ОЦІНКА ЗАСТОСУВАННЯ ВІДНОВЛЮВАНИХ ДЖЕРЕЛ ЕНЕРГІЇ В СИНЕРГІЇ З ПОЛІТИКОЮ ЄС Аналізується використання відновлюваних джерел енергії ВДЕ на різних етапах їх енергопостачання. Завдяки світовому досвіду,
досліджується динаміка споживання енергії за видами; визначається, які види альтернативних джерел країна потребує більше інших. Також оцінюється ефективність застосування ВДЕ в Україні. Згідно зі статистичним та кореляційним аналізом було доведено, що для України найвигіднішою є енергія біомаси, а сонячна енергія залишається відносно дорогою для нашої країни. Проте ситуація може змінитися, якщо витрати на сонячні батареї зменшаться в майбутньому. Показано, що використання альтернативних джерел енергії знижує енергоємність ВВП, а викопні ресурси збільшують цей параметр. На жаль, Україні доводиться стикатися із труднощами в залученні інвестицій для розвитку ВДЕ, оскільки в цей час вони не настільки вигідні. Це означає, що уряд має змінити свою політику, збільшити ціни на електроенергію до європейського рівня, надаючи шанс на енергетичну незалежність. У будь-якому випадку в Україні необхідно буде збільшити впровадження ВДЕ, оскільки в нашій країні є лише близько 2% ВДЕ в енергетичному балансі, тоді як європей-ські країни в середньому мають 17%, а деякі з них – понад 60%.
Ключові слова. Енергія, відновлювані джерела енергії, політика ЄС, постачання. Г. Харламова, канд. экон. наук, доц., А. Ставицкий, канд. экон. наук, доц. Киевский национальный университет имени Тараса Шевченко, Киев, Украина, С. Натэ, канд. экон. наук, доц. Университет имени Лучиана Блага, Сибиу, Румыния
ОЦЕНКА ПРИМЕНЕНИЯ ВОЗОБНОВЛЯЕМЫХ ИСТОЧНИКОВ ЭНЕРГИИ В СИНЕРГИИ С ПОЛИТИКОЙ ЕС Аанализируется использование возобновляемых источников энергии ВИЭ на разных этапах их энергоснабжения. Благодаря миро-
вому опыту, исследуется динамика потребления энергии по видам; определяется, какие виды альтернативных источников нужны для страны больше других. Также оценивается эффективность применения ВИЭ в Украине. Согласно статистического и корреляци-онного анализа было доказано, что для Украины выгодной является энергия биомассы, а солнечная энергия остается относительно дорогой для нашей страны. Однако ситуация может измениться, если расходы на солнечные батареи уменьшатся в будущем. Пока-зано, что использование альтернативных источников энергии снижает энергоемкость ВВП, а ископаемые ресурсы увеличивают этот параметр. К сожалению, Украине приходится сталкиваться с трудностями в привлечении инвестиций для развития ВИЭ, по-скольку в это время они не столь выгодны. Это означает, что правительство должно изменить свою политику, увеличить цены на электроэнергию до европейского уровня, предоставляя шанс на энергетическую независимость. В любом случае в Украине необхо-димо будет увеличить внедрение ВИЭ, поскольку в нашей стране есть всего около 2% ВИЭ в энергетическом балансе, тогда как ев-ропейские страны в среднем имеют 17%, а некоторые из них – более 60%.
Ключевые слова. Энергетика, возобновляемые источники энергии, политика ЕС, предложение.
Annex 1 GOOD PRACTICES AND CASE STUDIES
PROVINCE OF POTENZA, ITALY Background To implement an integrated energy policy at provincial scale coordinating measures for increasing energy efficiency and the
use of renewable energy sources at the local level also promoting a sustainable development process for the municipalities in the Province of Potenza Key issues: • Implementing RES and EE solutions into the Province high schools and public buildings; • Spreading the culture of energy savings and improving behaviours aiming to increase environmental protection; • Promoting of environmental management systems on the provincial territory.
Case 1 The Regional Energy Company foundation
The Lucana Energy Company promotes interventions for the rationalization and reduction of energy consumption and related costs of public authorities performing the following activities: • Energy planning at the regional, provincial and municipal levels, also supporting the Basilicata Region municipalities in joining, implementing and monitoring the Action Plans for Sustainable Energy under the Covenant of Mayors (2020); • Analysis, monitoring and management of energy consumption in on buildings owned by public bodies on the regional territory; • Implementation of renewable energy systems on buildings owned by public bodies in the region; • Dissemination on energy issues in the regional community; • RES behaviour.
Case 2 ENEPOLIS, the Potenza province Local Agenda 21
The project ENEPOLIS had been addressed to mountain district characterized by a high index of woodiness and a high risk of depopulation. The relevant objective was to realize an integration of tourist facilities and bio-energy.
Case 3 Sustainable Public Housing
The project is settled in a small neighbourhood of the Municipality of Filiano and it consists of three in line buildings for a total of 18 houses. Such buildings have been built applying the principles, methods and techniques of Green Building and Sustainable architecture with particular reference to energy saving and renewable sources energy production systems. The project represents a model of design-oriented to energy saving promoting the use of innovative materials with a low environmental impact, and RES technologies.
Case 4 Safe Ecological Schools
Improvement of energy performance in provincial high schools and public buildings can give a fundamental contribution to the achievement of CO2 abatement targets and to the other targets of EU2020 and can provide great savings for the Province with regard to energy and heating. The GP defines a standard methodology and a wide catalogue of applications which could be extended to a wider scale. The implementation of RES plants and EE measures on educational buildings raises the awareness among students and teach staff regarding EE and RES.

~ 64 ~ В І С Н И К Київського національного університету імені Тараса Шевченка ISSN 1728-3817
MUNICIPALITY OF SLAGELSE, DENMARK Background EnergyVillage Omø and Flakkebjerg in SlagelseMunicipality
CO2 emission reduction and identification of tools a municipality can use to motivate and support towards the installation of RES and EE. The municipality is not allowed to make any form of financial support for such installations.
Case 1 GPSmall and Medium Enterprises, SME, working with EE and RES in Slagelse Municipality
EE and RES installations in private homes and SME companies, increased competences of the SME. The municipality organized a workshop for SME with a brainstorming about how the municipality could help to promote RES and EE. On that basis, several models were investigated, and 4 companies decided to organize Slagelse Energy-network as a private association.
Case 2 Network for energy responsible personal employed in the municipality of Slagelse
Network with 15–20 responsible personal in different buildings in the municipality. They are each responsible for the energy consumption in own building. The network meets 4 times a year. In Slagelse all municipal buildings have one energy responsible person and are connected to a SCADA system "Min Energy".
SHEFFIELD CITY COUNCIL, UNITED KINGDOM Case 1 Think Low Carbon Centre, BarnsleyCollege
The Think Low Carbon Centre, based on BarnsleyCollege's Honeywell site, is packed with working low carbon technology. It has been constructed with the latest energy efficient materials. Amongst the Centre's features are solar panels, a green roof, triple glazing and a building management system which automatically opens windows and vents to regulate temperature. The power generated and used at any moment is publically displayed on-screen.
Case 2 23 homes, low energy, South Yorkshire Housing Association
All 23 properties have been constructed to Eco-homes "excellent" standard with super-insulation: timber frames; solar thermal (water heating); photovoltaics (electricity generation); a wind turbine is to be installed which is expected to provide around 800kw of electricity per annum.
DURHAM COUNTY COUNCIL, UNITED KINGDOM Case 1 Solid Biomass Boiler installation in an Off-Gas zone (Weardale, Durham)
The biomass installation will not only provide the quantified savings in LPG, and a commensurate reduction in CO2 emissions, but it will have a significant impact on the overall performance of the museum under the Green Tourism Business Scheme.
Case 2 Solar Photo-Voltaic Scheme, New Business Centre, Derwentside, Durham
The SPA project (Solar Photo-voltaic Array) sought to reduce the electricity costs and carbon footprint of its larger public facilities by utilizing the roof-space of appropriately sited buildings. In total 35 buildings were selected and over 860kWp of solar panels were installed, ranging from 3,5 kW to 149 kW in size. These sites annually generate over 700,000kWh of renewable electricity along with a CO2 reduction of 850 tonnes per year.
KAUNAS UNIVERSITY OF TECHNOLOGY, LITHUANIA Background Carbon reduction project is still ongoing so are not a clear evaluation of carbon dioxide reducing.KaunascityMunicipality is
planning to spend about 6 million Lt (1,7 mln. Euros) for this project. Modernization of Kaunas city street lighting significant reduced installed capacity of illuminators, reduced electricity consumption, ipso facto reduced CO2, other emissions in electricity production. Local companies performed implementation works of the project and in such a way was increased level of employment.
Case 1 Renovation of the Kaunas lighting system
Modernization of Kaunas public lighting system – Lighting has a substantial impact on the expenses for energy also on the environment, accounting for up to 40% of the electricity used in public buildings. Best examples from this field have shown that between 30% and 50% of the electricity used for lighting could be saved by investing in energy efficient lighting systems. In most cases, such investments are not only profitable but they also maintain or improve lighting quality. This activity is very important for KaunascityMunicipality.
CITY OF TULLN, AUSTRIA Background Concerning energy, Tulln is leading the way in the region Lower Austria and will act as a multiplier for suitable and feasible
technologies. By the State of Lower Austria, the construction of facilities for the production and use of alternative energy in various fields – and energy saving measures in general – is promoted.
Case 1 The small hydroelectric power plant
The municipality of Grafenwörth operates a small hydroelectric power plant to generate electricity. The power station produces since the year 2012 at full capacity (always available) about 19,200 kWh per month. The consumption of the local council is compared to, approximately 1,800 kWh per month.
Case 2 Wood chip heating plant with heat and electricity use
The decision to use wood chips as a fuel was made because this is a cheap raw material and comes from the region. The wood chip plant was built to supply the adjacent apartment buildings with electricity and heat. The objective of the investment is, also schools, communities and interested citizens bring closer the processes of electricity generation from renewable energy. Benefits that arise from this system are: • Environmental friendly energy 240 MWh electricity and 1,450 MWh of heat per year are produced. Therefore annually about 120,000 litres of heating oil will be replaced. Currently, 45 residential units, 8 large public buildings and households in the catchment area were provided with energy from wood chips. • Emission reduction Through the system, 600.000 kg / an of CO2 can be avoided. •Jobs
Case 3 Agricultural College Tulln
The Agricultural College Tulln is an educational and advisory establishment of the province of Lower Austria. The school is a training company with about 30 ha of arable land and about an acre of vegetables, wine and fruit growing area. The training and testing are carried out in the individual faculty labs. The school year 2012/2013 started with 56 students. The school lasts 3 years. The Agricultural College Tulln offers the possibility to choose between the branches General Agriculture, Agriculture and Renewable Energies, Agriculture and Heating, Agriculture and Municipal services, and school for farmers. The Agricultural College Tulln is involved in a variety of projects that are closely linked to the field of renewable energy, such as vegetable oils as fuels, biomass power plants, sustainable development and utilization of cereal plants, combined heat and power and more.
SZCZAWNICA MUNICIPALITY, POLAND Background Szczawnica decided to start using solar energy. The enterprise met with great interest of the Szczawnica community. Over
378 people joined The Association for the Eco-development of Szczawnica "EKOSzczawnica", which has been established in order to organize the project's implementation. Local authorities precisely defined conditions of participation in the enter-prise and adopted schedule and timetable of planned activities. The first institution which positively replied to Szczawnica's application for funding was Voivodeship Fund for Environmental Protection and Water Management (WFOŚiGW), which granted the municipality a loan of 2 873 366,79 PLN. The loan has an interest rate of 4% and there was a possibility of its amortization to the amount of 35%. Another institution requested for co-financing the project was National Fund for Environmental Protection and Water Management (NFOŚiGW). Szczawnica had to wait long for the answer but it paid off. Szczawnica received a grant of 3 591 710,00 PLN which covered 50% of the costs of the enterprise. These are significant resources, which – along with funds from WFOŚiGW and interested stakehold-ers – make it possible to carry out the enterprise.

ISSN 1728-2667 ЕКОНОМІКА. 3(198)/2018 ~ 65 ~ Case 1 Solar panels for citizens of Szczawnica
The authorities of Szczawnica – encouraged by existing programmes for financing environmental projects – decided to undertake unique in Poland enterprise consisting in installation solar collectors at individual consumers. The project entitled "Reduction of low emissions through utilization of renewable energy sources by individual and collective consumers at the area of Szczawnica munici-pality with special focus to solar installations" included purchase and installation of complete solar systems. Regular meetings for inhabitants of Szczawnica and members of the Association aiming at increasing of environmental awareness of inhabitants were organized. In the near future, awareness-raising activities at schools were planned. Outcomes: • improving the quality of residents' life and a state of the environment; • raising environmental awareness in the community and promotion of RES; • diversification of energy sources; • increasing the share of energy from renewable sources; • protection of natural and cultural heritage for future generations with a particular emphasis on areas valuable in terms of nature (Natura 2000) and tourism; • increasing the tourist attractiveness of the area covered by the project. Szczawnica, having about 7,5 thousand inhabitants, focuses on the utilization of solar energy. At present, it has over 5 430 m2 of solar panels in total (also on the roofs of larger buildings with rental apartments for spa guests and tourists), about 3 353,4 kW of energy used comes from this source. Complete solar systems made of approx. 1574 collectors with total absorption surface of about 3 714,64 m2 and capacity of 3037,82 kW for private owners were co-financed in about 60% by NFOŚiGW and WFOŚiGW. The main success is the reduction of emissions in the Szczawnica region (dust, sulphur dioxide, nitrogen dioxide, carbon monoxide, soot). In addition to ecological benefits, the project has brought significant cost savings. Inhabitants who have installed solar systems use the hot water for free since March till October. It is – in the context of constantly increasing energy prices – is a huge advantage for family budgets
Case 2 The network of energy saving schools – EURONET 50/50
To reach less CO2 emissions schools created a 50/50 NETWORK around Europe with the aim to save energy. Applying the German 50/50 methodology to 58 educational centres in order to contribute to the fight against climate change. Within the frameworks of the project, a European network of schools was created and energy efficiency measures were implemented in chosen school buildings. The 50/50 concept assumes that thanks to taken up actions 2,5% energy savings will be achieved and money saved will be divided between schools (50%) and municipalities (50%) In Poland: • raining seminars for teachers were organized; • educational materials (e-pack) were prepared and sent to all schools participating in the project; • 3 sets of measuring instruments (digital thermometer, luxmeter and energy consumption meter) were sent to schools for pupils to be used during preparation of the energy characteristics of their schools; • energy audits were conducted in schools to find out the schools' energy baselines and the potential energy savings; • every school has created an Energy Team to coordinate and monitor the implementation; • energy review of the school buildings was organized as well as the measurements of temperature, light intensity and energy consumption; • information and promotion campaigns (full of innovative ideas) were organized to promote the idea of 50/50 and to en-courage energy saving whole school community.
58 schools from 9 countries involved in the 50/50 methodology implementation and respective local authorities. In Poland 11 primary schools from 8 municipalities all over Poland. PNEC prepared Polish version of the e-pack, which consists of: a) Description of the EURONET 50/50 methodology (How to set up a successful 50/50 project) translated into Polish b) Teachers guide (with worksheets for pupils) translated into Polish c) Lesson scenarios for different school subjects concerning energy saving and climate protection issues d) Additional materials for teachers and pupils that were developed within the frameworks of other projects focusing on energy education of children and youths e) A movie about the implementation of the 50/50 methodology at German schools (with Polish subtitles) The energy savings achieved in 7 schools (out of 11 participating) in 2010 in Poland amounted to 6,1%, giving a total of 260 571,9 kWh and in 2011 energy savings achieved in 6 schools (out of 11 participating) amounted to 6.9% giving a total of 249 861,4 kWh The most impressive savings was achieved by Primary School No 13 in Bielsko-Biala: in 2010 it saved over 6 600 EUR, in 2011 – as much as over 7 750 EUR! The money saved in the first year let them purchased 2 laptops, 2 projectors and a camera, and organize for the most involved students a trip to Fairy Tales Centre in Pacanow.
Case 3 Energy Days as a tool of community involvement
Energy Day is a local event that aims at raising public awareness of issues such as energy efficiency, use of renewable energy sources and the links between energy and climate change. The event can take different forms and should join in-creasing energy awareness of different groups of stakeholders with good fun. Energy Days included activities such as work-shops, exhibitions, study visits, open-door days, forums, competitions for schools (of children drawings, rhymes, songs etc.) and general public etc. Energy Days activate the whole local community: institutions, citizens, local actors and stakeholders, schools: children and youth. As a result of Energy Days, the social awareness was increased – citizens practice saving energy and its efficient use of their houses and workplaces. They seem to be more willing to invest in EE measures. In total, about 4000 people participated in these events, however, due to the wide public campaign and competition orga-nized for schools more than 10 000 people were addressed.
AVRIG MUNICIPALITY, ROMANIA Background Avrig strengthen its leading position in a regional context as a key promoter of sustainable energy development and become
a model for other cities in the region and across the country in environmental and social sustainability, as it addressed the use and exploit resources natural abundantly present resources in the area, boosting local professional and entrepreneurial potential through sustainable enterprises.
Case 1 SC Enev-AVRIG LLC a council-owned investment and electricity distribution company
SC Enev-AVRIG LLC is dedicated to the integration of renewable energy systems in Avrig and surrounding villages. The company, founded by the City Council of Avrig assumed an operational role in all projects aiming at the installation of energy distribution, energy transport and thermo-energy rehabilitation of buildings maintained by the Local Council of Avrig. SC Enev-AVRIG LLC is also able to acquire new investment funds for future development projects as well as the implementation of existing energy projects and attracting new private and public investors to the city of Avrig. Feasibility study of small hydropower plants on the AvrigRiver and the construction of biogas and biomass power plants have been implemented. In addition, a plan was drawn up for a future centralized heat supply from renewable sources to the residential and commercial areas. Implementation of rooftop solar power to residential and municipality-owned buildings is also on the agenda. There is a possible replicability of the model to other small cities in Romania the other EU countries in using local energy sources to produce decentralized energy for their own uses to bring down local energy costs.
Case 2 Avrig has jointly imple-mented, with "The Lucian Blaga" University of Si-biu, a "Smart community-academic course"
Avrig City Hall proposes "Lucian Blaga" University of Sibiu, to develop and offer an academic multidisciplinary course based on Smart community issues with lecturers that have already demonstrated their knowledge, commitment and involvement to our projects such as Corporate Security Management Research Center, Total Quality Management Scientific Research Center, and other national/international interested lecturers, including Toshiba Group representatives. Establish local RES & EE Education to enhance "Lucian Blaga" University of Sibiu in a key role as a player within the community, the City Hall of Avrig proposes starting with basic topics of the academic course to support common growth and development for renewable sustainability in business, academia and local government sectors. Another objective of the Smart community-academic course proposal, to train public servants and public administration professionals in order to understand the impact, needs and responsibilities of the community in sustainable energy. Transferability to other university and colleges as an educational tool to promote the growth of employment in new sustainable energy industries.
~ 66 ~ В І С Н И К Київського національного університету імені Тараса Шевченка ISSN 1728-3817
Bulletin of Taras Shevchenko National University of Kyiv. Economics, 2018; 3(198): 66-69 УДК 336 JEL classification: G21, E44 DOI: https://doi.org/10.17721/1728-2667.2018/198-3/8
K. Lawler, Visiting Professor, ORCID iD 0000-0002-3409-6755
S. Sadiq, Graduate Research Student University of Kuwait, Kuwait City, Kuwait
EXCHANGE RATE VOLATILITY: AN EMPIRICAL STUDY FOR STATE OF KUWAIT
As an oil exporting nation Kuwait suffers from the well-known issue called the Resource Curse given the high reliance on oil revenues for economic growth and development. Traditionally research on small open economies such as Kuwait focus on versions of the Solow /Harrod/Domar growth models which are predominantly closed models which focus on exogenous growth issues such as saving ratios and the Solow Residual. For an open economy without core problems on capital accumulation, such as Kuwait, it is interesting to disentangle exchange rate volatility issues from key open economy fundamentals such as GDP growth, trade openness, inward foreign investment and exchange rate issues.
The purpose of this study is to empirically examine the impact of gross domestic product, trade openness and foreign direct investment on the exchange rate volatility of Kuwait. We have used several advanced statistical tools to better estimate different kinds of relationships. Results show that all factors are significant in determining exchange rate volatility.
Key words: exchange rate, volatility, GDP, trade openness. Introduction. Exchange rate volatility is of particular
importance to those countries which are small and conduct large amounts of trade [4]. This is particularly relevant to Kuwait. Exchange rate movements have important implications for a firm's profitability and stock market valuations. Prasad A. [26] sets out three main ways in which exchange rate movements can affect firm value: namely; translation, transaction and competitive effects. He concludes that together these effects can be substantial for small economies with specialized trade flows. The significance for Kuwait, in this way, is clear. Indeed, Dominguez [14] argues that the elimination of exchange rate risk for European firms was one of the central motivations behind the Euro. Evidence of significant exposure to exchange rate volatility is reinforced by Bodnar G. [6] who found significant exchange rate exposure for 28% of all industries in the UK, Canada and Japan. Other studies, such as Amihud Y. [2], found a lag in the relationship between a firm's value and the exchange rate change. Amihud (ibid) argues that the complex relationship between firms and the exchange rates means that it took time for all of the implications of exchange rate movements to be analysed. In particular, Bartov E. conjectured that the lagged market response to changes in exchange rates are normal so that large bubbles can be expected when trade is highly open in all trade data.
After the downfall of the Bretton Woods arrangement, several academic and empirical studies have analyzed the association between exchange rate volatility and other macroeconomic factors. The impact of exchange rate variations can impact the overall economic system in the country. Uncertainty in exchange rates can be a significant barrier to trade, investment and in total economic activity among countries as a devaluation of a local currency may affect the overall income – absorption of the economy.
The motivation behind this study is to empirically investigate the impact of trade openness, foreign direct investment and gross domestic product impact on exchange rate variation. Based on the reviewed theories this study stands unique in terms of its econometric model and the econometric tools that we used during this research. It is of utmost importance to check how the economy of Kuwait is responds to exchange rate fluctuation with its possible income impacts on the economy.
Many papers have conducted studies to investigate the factors affecting exchange rate volatility and have used different methodologies to reach an answer. Using panel techniques, Holland M. et al [17] have shown for Brazil a more (less) volatile exchange rate has significant negative (positive) impact on economic growth. For Sudan, Ebaidalla
E. [16] used GARCH to show that the volatility of the exchange rate has a positive impact on current account balance. For Nigeria, a simple OLS indicated that interest rate and rate of inflation have negative impact on economic growth but not significant [1]. In the GCC, a VECM revealed that the exchange rate volatility significant positively effects investments and other macroeconomic factors in GCC. [13]. Finally, Kuznobu H. and Fukonari K. [19] have also used VECM to show that intra-East Asian trade is discouraged by exchange rate volatility more seriously than trade in other regions. This could be because intermediate goods trade in production networks, which is quite sensitive to exchange rate volatility compared with other types of trade, occupies a significant fraction of trade
The objective of this study is to review the impact of GDP, TO and FDI on exchange rate of Kuwait.
Methodology. The volume of trade and the Balance of Payments is a vital macroeconomic fundamental that is heavily influenced by the prevailing exchange rate [11]. The effect is larger for small, highly open economies which are affected proportionally more by changes in international trade flows [4]. Once again, the Kuwaiti trade pattern falls into this category and is evident in the times series.
McKenzie M. [21] conducted a thorough empirical and theoretical study of the relationship between trade and ex-change rate volatility but with mixed results such that no solid conclusions on the relationship could be determined. Moreover Phillips P.C. [25] argues that not all previous studies deal with non-stationary integrated variables satis-factorily, leading to spurious regressions.
Despite no clear, consistent relationship between ex-change rates and trade at the international level there has been some success in studies of bilateral trade: Doyle E. [15] analysed the effects of exchange rate volatility on Irish exports to the UK between 1979 and 1992, finding that it was a significant determinant for 35% of the Irish-UK trade. Similar conclusions have been drawn in a number of stud-ies investigating bilateral trade between developing coun-tries: Brada J. [7], Cabarello R. [9] and Arize A. et al. [3] found exchange rate volatility to be significant in explaining trade flows and Balance of Payments issues in developing countries, indicating the importance of exchange rate re-gimes for developing countries. A reason for the signifi-cance of exchange rate volatility on trade is the narrow range of export goods from developing economies.
In econometric data analysis, it is essential that non-stationary variables are treated differently from stationary ones. Brooks C. [8] defines a series to be strictly stationary if "the distribution of its values remains the same as time progresses, implying that the probability that falls within a
© Lawler K., Sadiq S., 2018

ISSN 1728-2667 ЕКОНОМІКА. 3(198)/2018 ~ 67 ~ particular interval is the same now as at any time in the past or the future."
Early studies by Yule G. [27] discovered that the regres-sion of a non-stationary time series on another may produce a spurious regression, meaning it is imperative to test the time series for stationarity before commencing econometric testing. The predominant test of stationarity is the unit root test, pioneered by Dickey D. and Fuller W. [12].
The methodology uses times series analyses based around unit root tests and co-integration techniques which seek establish long run relationships between key variables which directly link to economic theory. Essentially these techniques seek to avoid creating spurious regressions based on unrelated variables. Moreover, the analysis goes on to develop a short run VECM for short run elasticities which reveal consistently viable results. The approach here follows the literature and achieves similar findings for Kuwait as discussed above. The positive income/ price elasticity effects noticed for East Asia trade is revealed in this study too. The fundamental drivers of exchange volatility are linked to the core fundamentals in ways predicted by the pure theory of exchange rate determination. We have used several econometric tools to empirically investigate the impact of GDP, TO and FDI on
exchange rate volatility of Kuwait. Study has used annual data from 1980 to 2015 obtained from World Development Indicators of World Bank. Based on existing literature we have used descriptive analysis to check the normality of data, augmented ADF for unit roots, Johansen co-integration used for long run relationship and VECM for short run relationship.
ER = β0 + β1GDP + β2TO + β3FDI where; ER = Exchange rate GDP = Gross domestic product TO = Trade openness FDI = Foreign direct investment.
Results. The present study has used several statistical tools to analyze all possible linkage between exchange rate volatility and the other explanatory variables. To get optimal outcome from the data we have used normality testing followed by the augmented Dickey-Fuller unit root test. To identify any long run relationships, we have used the Johansen co-integration technique and used the vector error correction model (VECM) to test for short run relationships and the significance of the data.
Table 1 shows the results of the standard unit root test (*significant at 5%). It clearly illustrates that, with the exception of TO, the majority of the variables are stationary at level.
Table 1. Results of the Unit root test
Variables Null Hypothesis Level І(0) First Difference І(1)
ER Stationary -2,877635 (0,0582)
-5,472231* (0,0001)
GDP Stationary -0,371763 (0,9033)
-5,318762* (0,0001)
TO Stationary -3,549038*
(0.0123) -7,556895*
(0.0000)
FDI Stationary -2,194831 (0,2116)
-7,043599* (0,0000)
Looking at the long run, table 2 shows the results of the Johansen co-integration test. used for long run relationships and VECM for the short run relationship.
Table 2. Results of the Johansen Cointegration test
Johansen Cointegration Test Hypothesis No of CE (s) Trace Statistics Critical Value P-Value None 51,765* 47,856 0,02 At Most 1 25,345 29,797 0,149 At Most 2 8,779 15,497 0,386 At Most 3 0,061 3,841 0,803
There is one co-integration equation in the model and a long run relationship exists. Looking at the short run, table 3 shows the results VECM and it can be seen that all variables are significant.
Table 3. Results of the VECM
Long Run Variables Coefficients t-values GDP -0,018 -2,04 TO 2,28E-01 5,292 FD 3,90E-12 5,196
Conclusion. The objective of this study is to empirically
examine the impact of Gross domestic product, Trade openness and Foreign Direct Investment on the exchange rate of Kuwait.
Several different empirical methods have been adopted in previous studies investigating volatility in exchange rate models. Many, including Meese R. [22, 23, 24] and Mark N. [20], used co-integration tests which had some strengths, especially since the Johansen (1992) paper improved the econometric methodology. However, this investigation de-veloped a vector autoregressive model and included key variables like trade openness, foreign direct investment and GDP. This has not been developed for Kuwait before.
An Augmented Dickey-Fuller [12] (ADF) unit root tests were run to examine stationarity in the time-series sam-ple. The first differences of the variables were taken to ensure that the variables are stationary. This investigation also conducted sub- tests using the model specified to isolate certain events. which could cause biased results. By isolating key periods of time, the investigation hopes to gain greater insight into the performance of the ex-change rate model and the determinants of movements in Kuwait dinar exchange rate.
The ADF was then used, and the results showed that all variables under study are integrated at order one except for Trade Openness. The Johansen co-integration tech-nique was used to examine long run relationships and it

~ 68 ~ В І С Н И К Київського національного університету імені Тараса Шевченка ISSN 1728-3817 shows that such a relationship exists. We have used the Vector Error Correction Model that produced significant results for all variables. Keeping in view all the results ob-tained, we can conclude that all factors are crucial to ex-plain exchange fluctuation. However, our results indicate that Trade Openness is the most important variable that effect exchange rate at any stage. This is evident in the co integration of the vector which gives the pseudo elasticity for Gross domestic product, Trade openness and Foreign Direct Investment. The results show that if Kuwait in-creased. trade openness and attracted more foreign direct investment, exchange rate volatility would increase. The pure theory of exchange rate determination is in evidence in these results and could inform future policy initia-tives. Policy makers are recommended to review FDI and TO as separate impact factors on the exchange rate and revisit the Kuwait policy stance. Future researchers could also consider other relevant factors like the current account balance in empirical studies.
As a small open economy Kuwait is subject to sudden changes in world prices of its exports. Long term this can cause serious terms of trade effects where the real exchange rate is dramatically affected. So paradoxically although exchange rate volatility is explained with the traditional pure theory paradigm, slight changes in the TO and FDI variables can cause asymmetrical effects with potentially large swings in the exchange rate. The VECM indicates this potential paradox and underlines that exchange rate issues in small open economies can have a huge impact on Balance of Payments positions even among oil exporters.
References 1. Adeniran, J. O., Yusuf, S. A. and Adeyemi, O. A., 2014. The Im-
pact of Exchange Rate Fluctuation on the Nigerian Economic Growth: An Empirical Investigation. International Journal of Academic Research in Business and Social Sciences. Vol 4, No.8
2. Amihud, Y., 1994. Exchange rates and the valuation of equity shares. (pp.49-59) In T. Amihud and R.M. Levich, Exchange rates and corporate performance. New York: Irwin.
3. Arize, A. C, Osang, T., Slottje, D. J., 2000. "Exchange-Rate Vola-tility and Foreign Trade: Evidence from Thirteen LDC's", Journal of Business & Economic Statistics, Vol. 18, pp. 10-17.
4. Armstrong, H. W., Read, R., 1998. "Trade and Growth in Small States: The Impact of Global Trade Liberalisation", The World Economy, Vol. 21, pp. 563-585.
5. Bartov, E., Bodnar, G. M., 1994. "Firm valuation, earnings expecta-tions, and the exchange-rate exposure effect", The Journal of Finance, Vol. 49, pp.1755–1785.
6. Bodnar, G., Gentry, W., 1993. "Exchange-rate exposure and indus-try characteristics: evidence from Canada, Japan and US', Journal of Inter-national Money and Finance, Vol.12, pp. 29– 45.
7. Brada, J. C., Mendez, J. A., 1988. ‘Exchange Rate Risk, Exchange Rate Regime and the Volume of International Trade', Kyklos, Vol. 41, pp.263-280.
8. Brooks, C., 2002. Introductory Econometrics for Finance. Cam-bridge: Cambridge University Press.
9. Caballero, R. J., Corbo, V., 1989. ‘The Effect of Real Exchange Rate Uncertainty on Exports: Empirical Evidence', The World Bank Econom-ic Review, Vol. 3, pp. 263-278.
10. Campbell, J. Y., Clarida, R. H., 1987. ‘The Dollar and Real Interest Rates: An empirical investigation', Carnegie-Rochester Conference Series on Public Policy, Vol. 27, pp. 103-140.
11. Chowdhury, A. R., 1993. ‘Does Exchange Rate Volatility Depress Trade Flows? Evidence from error-correction models', The Review of Eco-nomics and Statistics, Vol. 75, pp. 700-706.
12. Dickey, D. A., Fuller, W. A., 1979. ‘Distribution of Estimators for Time Series Regressions with a Unit Root', Jounral of the American Statisti-cal Association, Vol. 74 , pp. 427-431.
13. Djirimu, M. A., Tombolotutu, A. D., Tuty. F. M., 2000. Exchange Rate Volatility Effect on Macroeconomic Fundamental in the GCC. Journal of Economics and Sustainable Development
14. Dominguez, K. M., Tesar, L. L., 2006. ‘Exchange rate expo-sure', Journal of International Economics, Vol. 68, pp.188-218.
15. Doyle, E., 2001. ‘Exchange rate volatility and Irish-UK trade, 1979-1992', Applied Economics, Vol. 33, pp. 249-265.
16. Ebaidalla, E. M., 2013. Impact of Exchange Rate Volatality on Macroeconomic Performance. Working Paper 789. The Economic Research Forum (ERF).
17. Holland, M., Vieira, V. F., da Silva, C. G., Bottecchia, L. C., 2008. Growth and Exchange Rate Volatility: A Panel Data Analysis. International Journal of Academic Research in Business and Social Sciences August 2014, Vol. 4, No. 8 ISSN: 2222-6990.
18. Johansen, S., Juselius, K., 1992. ‘Testing structural hypotheses in a multivariate cointegration analysis of the PPP and the UIP for UK', Journal of Econometrics, Vol. 53, pp. 211-244.
19. Kazunobu, H., Fukunari, K., 2008. The Effect of Exchange Rate Volatility on International Trade: The Implication for Production Networks in East Asia. Institute of Developing Economics (IDE), JETRO 3-2-2
20. L Mark, N. C., 1995. ‘Exchange Rates and Fundamentals: Evi-dence on Long-Horizon Predictability', The American Economic Review, Vol. 85, pp. 201-218.
21. McKenzie, M. D., 1999. ‘The Impact of Exchange Rate Volatility on International Trade Flow', Journal of Economic Surveys, Vol. 13, pp. 71-106.
22. Meese, R. A., 1984. ‘Is the Sticky Price Assumption Reasonable for Exchange Rate Models?', Journal of International Money and Finance, Vol. 3, pp. 131-139.
23. Meese, R. A., Rogoff, K., 1983. ‘Empirical Exchange Rate Models of the Seventies: Do they fit out of sample?', Journal of International Eco-nomics, Vol. 14, pp. 3-24.
24. Meese, R. A., Rogoff, K., 1988. ‘Was It Real? The Exchange Rate-Interest Differential Relation over the Modern Floating-Rate Period', Journal of Finance, Vol. 43, pp. 933-948.
25. Phillips. P. C. B., 1986. ‘Understanding spurious regressions in econometrics', Journal of Econometrics, Vol. 33, pp. 311- 340.
26. Prasad, A. N., Rajan, M., 1995. ‘The role of exchange and interest risk in equity valuation: A comparative study of international stock markets', Journal of Economics and Business, Vol. 47, pp. 457–472
27. Yule, G. U., 1926. ‘Why Do We Sometimes Get Nonsense Correla-tions Between Time Series? A Study in Sampling and the Nature of Time Series', Journal of the Royal Statistical Society, Vol. 89 , pp. 1-64.
R e c e i ve d : 25 / 0 2 / 20 18 1 s t Re v i s i o n : 0 1 / 03 / 20 1 8
Ac c e p t e d : 13 / 0 6 / 20 18 Author's declaration on the sources of funding of research
presented in the scientific article or of the preparation of the scientific article: budget of university's scientific project
К. Лоулер, проф., С. Садік, здобувач Кувейтський університет, Кувейт, Кувейт
НЕСТАБІЛЬНІСТЬ ОБМІННОГО КУРСУ:
ЕМПІРИЧНЕ ДОСЛІДЖЕННЯ ДЕРЖАВИ КУВЕЙТУ Як країна, що експортує нафту, Кувейт страждає від відомої проблеми, яка має назву "прокляття ресурсів", з огляду на високу за-
лежність від надходжень від нафти для економічного зростання та розвитку. Традиційне дослідження невеликих відкритих економік, таких як Кувейт, зосереджено на версії моделей росту Solow /Harrod/ Domar, які є переважно закритими моделями, зосередженими на питаннях екзогенного зростання, таких як коефіцієнт економії та залишки Солоу. Для відкритої економіки без серйозних проблем накопичення капіталу, таких як Кувейт, цікаво розв'язати проблеми волатильності обмінного курсу з ключових основ відкритої еко-номіки, таких як зростання ВВП, відкритість торгівлі, внутрішні іноземні інвестиції та проблеми обмінного курсу.
Метою цього дослідження є емпіричне вивчення впливу валового внутрішнього продукту, відкритості торгівлі та прямих інозем-них інвестицій на нестабільність валютного курсу Кувейту. Для кращої оцінки різних видів відносин використано кілька передових статистичних інструментів. Результати показують, що всі чинники є значними при визначенні волатильності обмінного курсу.
Ключові слова: курс обміну, волатильність, ВВП, відкритість торгівлі.
ISSN 1728-2667 ЕКОНОМІКА. 3(198)/2018 ~ 69 ~ К. Лоулер, проф., С. Садик, соискатель Университет Кувейта, Кувейт, Кувейт
НЕСТАБИЛЬНОСТЬ ОБМЕННОГО КУРСА:
ЭМПИРИЧЕСКОЕ ИССЛЕДОВАНИЯ ГОСУДАРСТВА КУВЕЙТ Как страна, которая экспортирует нефть, Кувейт страдает от известной проблемы, которая называется "проклятие ресур-
сов", учитывая высокую зависимость от поступлений от нефти для экономического роста и развития. Традиционно исследования небольших открытых экономик, таких как Кувейт, сосредоточены на версии моделей роста Solow /Harrod/ Domar, которые являются преимущественно закрытыми моделями, сосредоточенными на вопросах экзогенного роста, таких как коэффициент экономии и остатки Солоу. Для открытой экономики без серьезных проблем накопления капитала, таких как Кувейт, интересно решить про-блемы волатильности обменного курса из ключевых основ открытой экономики, таких как рост ВВП, открытость торговли, внут-ренние иностранные инвестиции и проблемы обменного курса.
Целью этого исследования является эмпирическое изучение влияния валового внутреннего продукта, открытости торговли и прямых иностранных инвестиций на нестабильность валютного курса Кувейта. Для лучшей оценки различных видов отношений использовано несколько передовых статистических инструментов. Результаты показывают, что все факторы являются значи-тельными при определении волатильности обменного курса.
Ключевые слова: курс обмена, волатильность, ВВП, открытость торговли. Bulletin of Taras Shevchenko National University of Kyiv. Economics, 2018; 3(198): 69-74 УДК 330.131.7 JEL classification: B20, E58, F34, F36 DOI: https://doi.org/10.17721/1728-2667.2018/198-3/9
C. Popa, PhD in Economics, Assistant Lucian Blaga University of Sibiu, Sibiu, Romania
THE INFLUENCE OF ORDOLIBERALISM IN EUROPE
From the "sick man" of Europe, as it was called after the Second World War, Germany managed to become the greatest power
on the continent. This was due to hard austerity policies that perfectly suited a hard working and rigorous population. In this article I want to analyze if ordoliberalism, the German form of social liberalism that led to the country's economic miracle in the 1950s, can be the saving solution for a continent in crisis. For a more complete analysis, I studied the subject from an economical, historical, political and social perspective. Following an extensive review of existing literature I have highlighted the doctrinal confrontation between ordoliberalism and keynesianism, brought back in the spotlight by the European sovereign debt crisis.
The German economic elite embrace ordoliberal values, characterized by responsibility and strict monetary rules. In response to the Eurozone crisis, they tried to spread the ordoliberal ideology across Europe. Focused on the supply side of the economy, the followers of ordoliberalism strongly opposed the expansionary fiscal and monetary policy. The power held in Europe allowed Germany to impose its own vision, centered on austerity and price stability. If ordoliberalism worked very well in Germany after the Second World War, not the same happened in the case of the Eurozone's economy. The rigor and lack of flexibility of German ordoliberalism have only further deepened the crisis and the economic problems of vulnerable countries.
Keywords: ordoliberalism; keynesianism; Eurozone; crisis.
Introduction. The history of ordoliberalism. The theoretical foundations of ordoliberalism were set in the 1930s and 1940s by the Freiburg School and other thinkers whose intellectual influence went beyond German space. The most representative founders are Walter Eucken, Franz Bohm, Alfred Muller-Armack, Wilhelm Ropke and Ludwig Erhard. They outlined a conservative-liberal program as a response to the political and economic turmoil generated by the Weimar Republic and the Great Recession. In order to ensure the good functioning of the liberal market economy, the ordoliberals promoted a strong role for the state with respect to the market. As markets are not a "natural" phenomenon that works by itself, they need to be sustained and supported by the state. Markets work efficiently only if there is competition, but because competition is not spontaneous, the state must ensure it through norms and regulation. The two directions that ordoliberals focused on, were: dissolving economic power groups and regulating the economy without influencing the economic process.
Ordoliberalism opposed pure laissez-faire but not liberal values. The aim of their efforts was to achieve an economic and social reform program designed to "reconcile the immense advantages of the free market economy with the claims of social justice, stability, dispersal of power, fairness and the conditions of life and work which are proper to Man" [1, p. 45]. In other words, the freedom of individuals is carried out in a stricter legislative framework, but more concerned about social issues. Laws must be clear, non-interchangeable, impartial, and the state must ensure their compliance.
Ordoliberalism also opposed total interventionism characterized by economic planning, nationalization, and property erosion. The challenge was to find a middle path, that is, the state's optimal level of intervention, without the risk of too much intervention opening the way to collectivism or too little intervention to prove ineffective. Wilhelm Ropke divides state interventions into "compatible and incompatible... those that are in harmony with an economic structure based on the market, and those which are not". [2, p. 160] In his opinion, market-compatible interventions are those that do not intervene in the price formation mechanism, all the others will entail the need for new regulations and, in the end, the market will be taken over by the state.
Focused on the supply side of the economy, ordoliberals believed that output and employment are determined mainly by supply factors. They strongly opposed the expansionary fiscal and monetary policy in case of crisis, believing that the state's role is to maintain price stability. The fear of Germans over rising prices is justified by the hyperinflation experienced in 1929–1933. In 1914 the dollar was worth 4.20 marks but it reached 4.2 trillion marks in 1923 [3]. This hyperinflation almost destroyed Germany's economy and some say it created the right conditions for the rise of Adolf Hitler
For ordoliberals a good state is a strong state. The primary role of the state is to correct the imperfections of the economy from a social and moral perspective through a set of laws designed to ensure the order of the free market. Its responsibility is to create a framework of rules which provide the order that markets need to function freely and efficiently.
© Popa C., 2018
~ 70 ~ В І С Н И К Київського національного університету імені Тараса Шевченка ISSN 1728-3817
German ordoliberalism laid the foundations of a social market economy that was successfully implemented in West Germany after the Second World War, contributing to the economic and social recovery of the country in a spectacular way. When most developed countries in Europe have turned to Keynesian measures, Economy Minister Ludwig Erhard has chosen a different path that of ordoliberalism, meant "to lay down the order and the rules of the game" [4, p. 102]. He wanted to create a human economic order in which German citizens overcome the difficulties and problems they face, and society is reborn. After a war in which it was defeated, with a centralized economy focused mostly on weapons production, inflation in Germany reached alarming levels. In this context, Ludwig Erhard chose to combine freedom and free market competition with a strong state involved in ensuring social justice.
The cooperation of trade unions with the German state throughout the period of reforming the economy has contributed decisively to the efficiency of these reforms. The ordoliberal measures taken in 1948–1949 resulted in a decrease in the cost of living and the increase of wages in the background of increasing labor productivity. The increase of the industrial production index and the gross domestic product were a real proof that the social market economy proved to be a success.
Until 1960, Germany experienced a steady economic boom characterized by steadily rising production, falling unemployment, increasing consumption, surplus trade balance, stable prices, rising real wages, population growth, etc. The revival of the German economy after the Second World War and the scale of economic growth were considered a miracle. A kneeling country found the power to recover and to become one of the greatest economic powers in just a few years. The "German miracle" was due both to reforms specific to the social market economy and to the discipline and rigor of the German labor force.
The Keynesian alternative John M. Keynes was an eminent economist of the
20th century, whose ideas marked decisively the modern economic theory. His efforts to mitigate the adverse effects of economic recessions gave birth to a unique and personal doctrine that has been applied in many countries, many years after his death – Keynesianism. Similar to ordoliberalism, it opposed the economic theory of the Classical School and, in particular, the concept of "laissez-faire". Keynes was convinced that individual and collective interests are often in opposition. The unswerving desire of people to get rich, together with a system in which the state does not intervene enough in the economy, generates social discrepancies.
Keynes did not share the liberal view of the self-regulating market and limited intervention of the state in the economy. On the contrary, he considered that in case of economic depression "the first step has to be taken on the initiative of public authority; and it probably has to be on a large scale and organized with determination" [5]. His belief was that the market alone is not capable to overcome moments of crisis, so the state must intervene when the economy has troubles putting it back on the line. Keynes position was halfway between the "laissez-faire" principle and the planned economy of a totalitarian state. Its measures target an energetic state involved in the economy both during war and in peacetime, when the economy is facing difficulties.
In the interwar period, when unemployment in Europe and America reached record levels, Keynes sought the most effective ways to increase employment. The English economist wanted to find a "third way" through which to secure public good in a society controlled in a balanced
manner by the state. He believed that "the ideal size for the unit of control and organization lies somewhere between the individual and the modern State" [6, p. 4]. If ordoliberalism was focused on the supply side of the economy, Keynesian theory believed that public power intervention should contribute to the development of aggregate demand. The demand growth will generate output expansion, economic growth and employment.
Since the economy can't correct the lack of demand itself, the state needs to intervene through government policies. A first step of state control should take place in the currency and credit sectors, where individuals risk generating inequality and imbalances through their behavior. Another direction of control refers to the population savings and investments, with the state having the role of determining whether economies are materialized in productive investments or not. Keynes sees this issue as of utmost importance to the economy and "should not be left entirely to the chances of private judgment and private profits". [6, p. 4]
Keynes's confidence in the ability of the private sector to contract massive loans and make effective investments is rather small. The efficient, innovative, active entrepreneur of Jean-Baptiste Say is characterized by Keynes as insecure, fearful and cautious. Thus, extensive spending programs meant to generate price increases will best be carried out by public or semi-public institutions in areas such as construction, public utilities and transport. Keynes encourages the state to start a series of public investments as "engaging in public works of a number of people will have a much greater effect on aggregate employment when severe unemployment exists" [7, p. 190]. The fiscal policy has the role of encouraging the aggregate demand as well, as Keynes proposes that the poor population to be less taxed as it is the social cloth that consumes the most.
The Keynesian doctrine was not shunned by criticism. Government spending towards unemployment-affected sectors has been seen by liberal economists as an inefficient allocation of resources. Friedrich Hayek warns that when the government spending stream stops or moves, unemployment will rise again. Keynes's measures are beneficial in the short term, several months in periods of deep economic depression, after which the market should be left free. Concerned with the analysis of macroeconomic aggregates, Keynes did not focus enough on the activity of the economic agents on the market. Moreover, he did not take into account the time factor, respectively an insufficient offer for a certain period. He rejected the Classical School theory that in the long run the economy will be balanced on the basis of market forces, as "in the long run we are all dead" [8, p. 80].
On the short term, Keynes' theory proved to be beneficial to the economies that have adopted it, but its long-term measures have had negative effects. Keynes's expansionist monetary and fiscal policies, coupled with an unprecedented rise in oil prices, contributed to the emergence of the inflationary phenomenon of the 1970s in the US and other industrialized countries. Moreover, countries that have adopted this doctrine have faced increased tax and public debt. The countries entered a period of stagnation that overshadowed the effectiveness of the Keynesian model.
The Euro crisis between ordoliberalism and keynesianism
The 2007–2008 financial crisis has revealed the fundamental problems in the design of the single currency area. Greece, Ireland, Portugal, Spain, Italy, Cyprus have had very high interest rates on government debts, threatening to default. Trying to find a solution to these problems, European leaders divided into two camps,
ISSN 1728-2667 ЕКОНОМІКА. 3(198)/2018 ~ 71 ~ calling on two opposite models: the keynesian model and the ordoliberal model. The keynesian model, supported, among other countries, by France, encouraged a more interventionist governance, with the aim of demand-driven growth. The ordoliberal model supported especially by Germany, encouraged compliance with price stability, an institutional system based on strict rules, and supply side economics. Thus, the management of the European debt crisis brought back to the forefront the ideological confrontation between ordoliberalism and keynesianism.
German ordoliberalism Ordoliberalism is at the heart of the German social
market economy but it is no longer an important academic current. It was not very present in public discourses in recent years but after the European debt crisis its voice has been heard again, as the German elites have called for its lessons. Because of its strength in Europe, Germany has tried to impose this mentality in other European countries, through austerity and debt limitation policies enforced by strict rules. Germany, "today's engine of growth and anchor of stability in Europe", as its finance minister calls it, is the fourth world economy, and the biggest in Europe. It alone represents 21% of the European Union's GDP and it is the first in Europe in terms of population, current account and supplier of external credit [9]. It is the founder of the European Union and Euro Zone and the country that had the most important say in the context of the European sovereign debt crisis.
Ordoliberal theory has contributed greatly to the creation and development of the European Union. The European Monetary Union (EMU) was strongly influenced by ordoliberal concerns about sound money. Likewise, the strict rules that are part of the Maastricht Treaty are rooted in the ordoliberal doctrine. During the present crisis, the German Government required the provisions of the treaty to be respected and tried to impose its vision centered on austerity and price stability, to the rest of Europe.
Not all Germans are ordoliberals, but important people in leadership positions share these values. The members of the German Council of Economic Experts, are a relevant example from this perspective. Its members are known as the "wise men" and it is an independent body that has been advising German government on economic issues since 1963. It still plays an important role in government decision-making. Four of the five economists have ordoliberal visions and strongly endorse the compliance of the Maastricht stipulations and especially the no-bail-out clause, which "strengthens market discipline by ensuring that private lenders – not the other member countries – bear the consequences of unsustainable fiscal policies" [10]. Shifting the risk from national level to the shared central bank balance sheet only generates moral hazard problems. Thus, European Central Bank (ECB) should focus on maintaining price stability and not act as crisis manager putting its independence at risk.
In order to restore economic stability, the Council proposed that countries that have experienced government debt crises to adopt structural reforms and budget cuts. Lower government expenditure and, to some extent, higher taxes will contribute decisively to budget consolidation. Debtor countries have to put their own economy back on their feet without waiting for creditor countries, like Germany, to finance them permanently. In line with the Council's advice, the solutions proposed by Angela Merkel in solving the Euro Zone crisis had the purpose of not touching Germany's interests.
According to the ordoliberal doctrine, the Council encouraged responsibility, control and the punishment of those who do not obey the rules. If a permanently
uncooperative member state threatens the existence of the euro, it should be withdrawn from the currency union as an utterly last resort. [11, p. 2]. However, a country's withdrawal from the Euro Zone could create a dangerous precedent. This action could be followed by other exits that eventually might lead to the division of the Euro Zone. The fate of the Euro influences the fate of the European Union, so the domino effect will be all the more devastating. As this repercussions threatened to affect the US economy and financial markets, Obama administration has been actively involved in preventing Greece from being ejected from the single currency area. Even though on February 2015, the former head of the US central bank, Alan Greenspan saw Greece exit from the euro as inevitable, this has been avoided to this day.
Jens Weidmann president of the Deutsche Bundesbank, and Chairman of the Board of the Bank for International Settlements is also ordoliberal. Just like the four "wise men", he asked for the compliance with article 105 of the Maastricht Treaty who states that "the primary objective of the ECB shall be to maintain price stability" [12, p. 29]. He believed that expansionary monetary policy will only harm the productivity of an economy, including the banking sector's profitability. Stating that "you don't give your credit card to someone, if you can't control their spending" [13], doubted the success of the euro bonds to solve the crisis. Weidmann demanded for a clear boundary between monetary and fiscal policy and government bond purchases will only blur this boundary.
In order to avoid moral hazard he quotes Walter Eucken, "those who benefit from it must also carry the loss" [14, p. 3]. Everyone have to bear the consequences of their actions, otherwise excessive risks will be taken. In order for the market economy to work effectively, there must be clear rules, respected by all.
And yet Germany is not the most relevant example in terms of respecting Euro Zone's stability rules. In the context of the Euro Zone debt crisis, most economists have focused their attention on the countries that registered current account deficits, but neglected the countries with current account surplus, such as Germany. Since 2011, Germany has had a current account surplus of 6% of its GDP [15], higher than the maximum limit set in the Macroeconomic Imbalance Procedure (MIP). For several years the European Commission has recommended Germany to reduce its current account surplus by supporting its domestic demand and investment, without any effect. Given its size and level of development, Germany has a special responsibility to rebalance the European Union's economy. Apart from affecting Europe's economy, Germany is also putting its economy at risk. Because it relies so much on exports, it can become very vulnerable to global shocks, as domestic buyers would not be able to offset declining demand.
Ordoliberal beliefs are embraced by another distinguished personality in Germany, namely Wolfgang Schäuble, the current finance minister. He is perceived as one of the most powerful promoters of ordoliberal values in Europe. He also believes that the cause of the Euro crisis lies in the fiscal indiscipline, so more fiscal rules and brakes on national debt are the best solutions in case of crisis. Countries that receive financial support need to apply structural reforms, reforms meant to put them back on track towards long-term growth and secure sustainable prosperity for all [16]. The efficiency of these programs in Spain, Portugal and Ireland reinforced the beliefs of the German minister, who praised them for their efforts to reform labour markets and social security systems,
~ 72 ~ В І С Н И К Київського національного університету імені Тараса Шевченка ISSN 1728-3817 modernize their administrative structures, legal and tax systems, and consolidate their budgets.
Many other important names in Germany share ordoliberal views, so ordoliberalism has become a "basic value" among German decision makers. In 2016, at the celebration of Walter Eucken's (1891–1950) 125th birthday, one of the founders of ordoliberalism, Angela Merkel emphasized that principles of "the "Freiburg school" remain relevant" [17]. German leaders believed that the supply side theory and an independent central bank, were the solution to the European sovereign debt crisis and tried to spread the ordoliberal ideology across the entire continent.
Keynesian reaction Followers of Keynesian theory criticized the
rigorousness and inflexibility of Germany's position during the Euro crisis and the ordoliberal principles on which they relied. The ideological confrontation between ordoliberalism and keynesianism can be found within the German Council of Economic Experts, where the only representative of keynesianism is Peter Bofinger. He criticizes the rigidity with which Germany focuses on balanced fiscal budgets, price stability and structural reforms and neglects aggregate demand. A follower of the demand side theory, he promotes the importance of aggregate demand in the short-term determination of output and employment. He rejects the validity of Walter Euken's ideas, which he considers to be too limited compared to Keynes, Hayek or Schumpeter, and finds it hard to accept that his philosophy still shapes the German paradigm of macroeconomics [18].
However, the preference of Germans officials for the ordoliberal values, namely supply-side theory, can be also explained from the point of view of national interest. Exports were and still are Germany's main engine of economic growth. In the monetary union, member countries can't increase the competitiveness of exports by devaluing the currency, so they resort to alternative methods aimed at stimulating supply. Embracing supply-side theory, the German leaders planned to help companies achieve success on the globalized market, as they are the source of innovation and employment. These measures, in conjunction with a low wage policy, helped Germany register the highest current account surplus in the world at the end of 2016. While Germany claims that this surplus is a sign of economic virtue that reflects competitiveness, others believe that it has caused the deficits in other countries.
Most of the German leaders believed that the cause of the Euro debt crisis lied in the fiscal indiscipline and the lack of supervision. Thus, they rejected aid measures materialized in expansionary macroeconomic policies and insisted on fiscal austerity. The lack of sympathy regarding the case of Greece can be justified by the Greek government's actions to forge registers to cover the true size of the budget deficit. Why didn't Germany let the Greeks economy go bankrupt? Because it was not in Germany's interest. Many German banks held a large part of Greece's debt in 2009. This interconnection can generate a systemic risk, as the Greek government's inability to pay may lead to a banking crisis in Germany, and implicitly big problems for the government that will help these banks. So, despite opposition from some states, Germany managed to impose its own vision centered on austerity and price stability.
The austerity measures proposed by Germany were supported by the three major international forums: the European Central Bank, the European Commission and the International Monetary Fund also known as the Troika. These three institutions have dictated the terms of Greece's
economic and fiscal policy during the European debt crisis. As they imposed very hard austerity measures meant to correct macroeconomic imbalances, they seriously affected the democratic process and generated violent demonstrations. In order to receive emergency loans, the Greek government had to cut salaries, government spending and pensions, raise taxes etc. The effects were not the ones expected, as they led to mass unemployment, the collapse of the banking system, a real GDP decrease and an external debt increase to 175 percent of GDP. In spite of the enormous financial support the Greek economy has received, in 2015 it looked worse than ever.
Thomas Piketty, together with other four famous economists, wrote the same year, an open letter to Chancellor Angela Merkel and the Troika asking them "to restructure and reduce Greek debt" [19], in order to prevent a possible exit of Greece from Euro Zone. An eventual exit of Greece would have affected the whole area of the single currency with global repercussions. In the call made to the German Chancellor, they asked for sympathy, mentioning the debt reduction that Germany benefited after the Second World War. In 1953, at the London conference, German creditors, including Greece, agreed to erase 55% of Germany's sovereign debt worth 32.3 billion German marks. Without this measure, Germany would not have been able to rebuild its economy so fast.
Another economist who revolted against the austerity measures was Paul Krugman who brought up a Keynes quote "the boom, not the slump, is the right time for austerity". Austerity measures in already depressed economies depresses the economy further, so he demands these measures to be stopped until a strong recovery is well under way [20]. He believes that a quantitative easing program could be a solution, but only if it is large and aggressive in order to impress the markets.
His view and the view of many other Keynesian economists was shared by the USA, UK and Japan who have embarked on monetary stimulus after the 2007–2008 financial crisis. After reducing the short-term interest rates close to zero they tried to use another method to pump more money into the economy. During the quantitative easing programme, the central banks purchased large-scale assets which lowered the interest rates and increased the money supply. Even if the effect of these measures is difficult to quantify accurately, the level of employment increased and the countries experienced a higher rate of GDP growth.
Though later than other countries, Europe also appealed to Keynesian measures. Starting in 2012, when the Euro crisis reached the highest level, ECB President, Mario Draghi made a statement that sent a strong signal to investors: "within our mandate, the ECB is ready to do whatever it takes to preserve the euro. And believe me, it will be enough". This statement was soon backed up by policy actions. The ECB reacted through three instruments: a series of targeted long-term refinancing operations (TLTROs), a negative interest rate policy, and an asset purchase program that included both private and public sector securities. Much later than other countries, in January 2015, the ECB called for a quantitative easing program in amount of $ 1.2 trillion. Under this program, BCE bought public and private bonds and managed to stimulate investment and consumption. With the help of these unconventional monetary policy tools, Europe managed to stimulate the Euro Zone's economy and prevent it from tumbling into a deflationary spiral.
Conclusions As Barak Obama stated, the European Union is "one of
greatest political and economic achievements of modern
ISSN 1728-2667 ЕКОНОМІКА. 3(198)/2018 ~ 73 ~ times" [21]. One of its goals was that together, the states develop and raise their standard of living. The free movement of goods, services, people and money and the introduction of the single currency in 1999 were important steps in the process of European integration. The single currency was meant to limit the rate of inflation, to stimulate trade and create one of the world's strongest currencies. However, in the absence of adequate institutional and policy arrangements, the same currency rocked the entire European edifice. The 2007–2008 financial crisis revealed the vulnerability of the European Monetary Union, when a number of countries which accumulated massive deficits and public debt triggered a sovereign debt crisis. European countries with flexible exchange rates have managed the debt crisis better than those in the Euro Zone. The loss of national monetary policies and exchange rate flexibility left the member countries vulnerable to the crisis.
The lack of a fiscal and banking union, capable of offering a coherent solution to the crisis, have threatened the integrity of the single currency. Whether the problems came from the public or private sector, all debts were later transferred to governments. In the spirit of unity that characterizes the European area, the countries have sought solutions to the unprecedented crisis the continent has faced. The solutions found to the European sovereign debt crisis divided the continent into two sides: the followers of ordoliberalism and the followers of keynesianism.
Most of the German decision-makers positioned in the ordoliberal side, demanded the ECB's compliance with the Maastricht treaty, and the application of hard austerity measures to the countries requesting financial aid. Because of its lack of flexibility, Germany has opposed taking in a much-needed European rescue plan in the first years of the crisis and is considered responsible for ECB's lack of reaction. In 2011, when the Euro crisis emerged, the ECB raised the interest rate to 2.25 instead of diminishing it [22]. Other major central banks (from the USA and Japan to UK) started comprehensive quantitative easing programs rather early in comparison to ECB [23] whose inactivity is considered responsible for the prolongation of the crisis.
If ordoliberalism worked very well in Germany after the Second World War, not the same happened in the case of the Euro Zone's economy. European Union leaders realized they couldn't develop some general economic principles inspired from Germany's historical experience, in order to bring Europe out of the crisis. The fiscal austerity measures imposed in the countries where demand was collapsing have further deepened the economic problems of vulnerable countries, and the best example is Greece. The ordoliberal measures promoted by Germany did nothing but prove Keynes right all over again.
Even though the German government demanded the Maastricht treaty to be strictly respected, European Central Bank's interventions saved Euro Zone …for now. So far, efforts have been worthwhile as a possible exit of a country would affect all member countries and the repercussions will spread across the world. The Eurozone will be much stronger when all its members will be fiscally and politically integrated, until then it is vulnerable to many other crises.
During the Euro crisis a rift between the German macroeconomic policy, based on ordoliberal values, and the policies of other major economies was created. The decisions taken in the last years have strongly tightened relations between Germany and the peripheral countries of Europe affected by the crisis. Each blow that Europe
receives, divides the member countries instead of uniting them. The immigration crisis, UK's vote to leave the EU, the popularity of extreme right-wing parties, coupled with the tensions of the Euro crisis that are still present, have shaken the foundations of the European integration project.
References 1. Ropke, W., Two Essays, University Press of America, [Online],
1987, p. 45. Available at: https://mises.org/sites/default/files/ Two%20Essays_Ropke.pdf
2. Ropke, W., The Social Crises of Our Time, The University of Chicago Press, Chicago, [Online], 1950, p. 160. Available at: https://mises.org/sites/default/files/The%20Social%20Crisis%20of%20Our%20Time%20%281%29.pdf
3. Jung, A., Germany in the Era of Hyperinflation, Spiegel Online, [Online], 2009. Available at: http://www.spiegel.de/international/germany/ millions-billions-trillions-germany-in-the-era-of-hyperinflation-a-641758.html,
4. Erhard, L., Prosperity Through Competition, Frederick A. Praeger New York, 1958, p. 102. Available at: http://mises.org/sites/default/files/ Prosperity%20Through%20Competition_3.pdf, [Online]
5. Keynes, J. M., The raising of prices, [Online], 1933. Available at: http://www.panarchy.org/keynes/depression.html
6. Keynes, J. M., The end of laissez-faire, [Online], 1926, p. 4. Available at: https://www.panarchy.org/keynes/laissezfaire.1926.html
7. Keynes, J. M., The General Theory of Employment, Interest, and Money, Publica Publishing, Bucharest, 2009, p. 190.
8. Keynes, J. M., A Tract on Monetary Reform, Macmillan and Co, [Online], 1924, p. 80. Available at: http://delong.typepad.com/keynes-1923-a-tract-on-monetary-reform.pdf
9. World Bank Data, [Online]. Available at: http://data.worldbank.org/ 10. Feld L., Schmidt C., Schnabel I., Wieland V. VOX, Maastricht 2.0:
Safeguarding the future of the Eurozone, [Online], 2016. Available at: http://voxeu.org/article/maastricht-20-safeguarding-future-eurozone.
11. German Council of Economic Experts, German Council of Economic Experts discusses reform needs to make the euro area more stable and proposes sovereign insolvency mechanism. Press Release, [Online], 2015, p. 2, access at: https://www.sachverstaendigenrat-wirtschaft.de/fileadmin/dateiablage/download/pressemitteilungen/gcee_press_ release_07_15.pdf
12. Council of the European Communities. Commission of the European Communities. Treaty on European Union, [Online], Art. 105, 1992, p. 29. Available at: https://europa.eu/european-union/sites/europaeu/ files/docs/body/treaty_on_european_union_en.pdf
13. Deutsche Welle, German bank chief trashes Eurobonds, [Online], 2012. Available at: http://www.dw.com/en/german-bank-chief-trashes-eurobonds/a-15977530
14. Weidmann, J., Aspiration and reality – the situation in the European monetary union, [Online], 2016, p. 3. Available at: http://www.bis.org/review/r160928m.pdf
15. OECD Data [Online]. Available at: https://data.oecd.org/trade/ current-account-balance.htm
16. Schäuble, W., We Germans don't want a German Europe, [Online], 2013. Available at: https://www.theguardian.com/commentisfree/ 2013/jul/19/we-germans-dont-want-german-europe
17. Financial Times – Bofinger P., Here is one export Germany should not be making, [Online], 2016. Available at: https://www.ft.com/content/ da5b543c-2bbc-11e6-bf8d-26294ad519fc
18. Bofinger, P., German macroeconomics: The long shadow of Walter Eucken, [Online], VOX, 2016. Available at: http://voxeu.org/article/german-macroeconomics-long-shadow-walter-eucken
19. Piketty, T, Sachs, J. D., Flassbeck, H., Rodrik, D., Wren-Lewis, S., Austerity Has Failed: An Open Letter From Thomas Piketty to Angela Merkel, [Online], The Nation, 2015. Available at: https://www.thenation.com/article/austerity-has-failed-an-open-letter-from-thomas-piketty-to-angela-merkel/
20. Krugman, P., Keynes Was Right, The New York Times, [Online], 2011. Available at: http://www.nytimes.com/2011/12/30/opinion/keynes-was-right.html
21. BBC News, Obama calls for greater European unity, [Online], 2016. Available at: http://www.bbc.com/news/world-europe-36132526
22. European Central Bank, [Online], Statistics, Key ECB interest rates. Available at: http://www.ecb.europa.eu/stats/policy_and_exchange_ rates/key_ecb_interest_rates/html/index.en.html
23. Pronobis, M., Is Monetary Policy of ECB the Right Response to the Eurozone Crisis?, [Online], Procedia – Social and Behavioral Sciences, Volume 156, November 2014, pages 398-403, DOI: http://dx.doi.org/ 10.1016/j.sbspro.2014.11.210
R e c e i ve d : 25 / 0 1 / 20 18 1 s t Re v i s i o n : 0 3 / 02 / 20 1 8
Ac c e p t e d : 13 / 0 4 / 20 18 Author's declaration on the sources of funding of research
presented in the scientific article or of the preparation of the scientific article: budget of university's scientific project
~ 74 ~ В І С Н И К Київського національного університету імені Тараса Шевченка ISSN 1728-3817 С. Попа, д-р екон. наук, асист. Університ імені Лучіана Блага, Сібіу, Румунія
ВПЛИВ ОРДОЛІБЕРАЛІЗМУ В ЄВРОПІ
Із "хворої людини" Європи, як це було названо після Другої світової війни, Німеччина встигла стати найбільшою державою на кон-тиненті. Це було пов'язано з жорсткою політикою жорсткої економії, яка ідеально підходить для працьовитого й суворого населення. Автор аналізує, чи може ордолібералізм, німецька форма соціального лібералізму, яка привела до економічного дива країни в 1950-х роках, бути економічним рішенням для континенту в умовах кризи. Для більш повного аналізу вивчено предмет в економічному, істо-ричному, політичному та соціальному аспекті. Після широкого огляду існуючої літератури звернено увагу на доктринальну конфрон-тацію між ордолібералізмом і кейнсіанством, що знов привернула увагу до європейської кризи суверенного боргу.
Німецька економічна еліта охоплює ордоліберальні цінності, що характеризуються відповідальністю та жорсткими грошовими правилами. У відповідь на кризу єврозони еліта намагалася поширювати ордоліберальну ідеологію по всій Європі. Орієнтовані на про-позицію економіки, прихильники ордолібералізму рішуче виступили проти експансіоністської фіскальної та монетарної політики. Влада, яка прийшла в Європі, дозволила Німеччині нав'язати власне бачення, зосереджене на жорсткості та ціновій стабільності. Якщо ордолібералізм добре працював у Німеччині після Другої світової війни, то не так було в економіці єврозони. Суворість і нестача гнучкості нідерландського лібералізму ще більше поглибили кризу та економічні проблеми вразливих країн.
Ключові слова: ордолібералізм; кейнсіанство; Єврозона; криза. С. Попа, д-р экон. наук, ассист. Университет имени Лучиана Блага, Сибиу, Румыния
ВЛИЯНИЕ ОРДОЛИБЕРАЛИЗМА В ЕВРОПЕ Из "больного человека" Европы, как это было названо после Второй мировой войны, Германия успела стать крупнейшим государ-
ством на континенте. Это было связано с жесткой политикой жесткой экономии, которая идеально подходит для трудолюбивого и строгого населения. Автор анализирует, может ли ордолиберализм, немецкая форма социального либерализма, которая привела к экономическому чуду страны в 1950-х годах, быть экономичным решением для континента в условиях кризиса. Для более полного анализа изучен предмет с экономической, исторической, политической и социальной точки зрения. После широкого обзора суще-ствующей литературы обращено внимание на доктринальную конфронтацию между ордолиберализмом и кейнсианством, которая вновь привлекла внимание к европейскому кризису суверенного долга.
Немецкая экономическая элита охватывает ордолиберальные ценности, характеризующиеся ответственностью и жесткими денежными правилам. В ответ на кризис еврозоны элита пыталась распространять ордолиберальную идеологию по всей Европе. Ориентированные на предложение экономики, сторонники ордолиберализма решительно выступили против экспансионистской фис-кальной и монетарной политики. Власть, пришедшая в Европе, позволила Германии навязать свое видение, сосредоточенное на жесткости и ценовой стабильности. Если ордолиберализм хорошо работал в Германии после Второй мировой войны, то не так бы-ло в экономике еврозоны. Строгость и недостаточность гибкости нидерландского либерализма еще больше углубили кризис и эко-номические проблемы уязвимых стран.
Ключевые слова: ордолиберализм; кейнсианство; Еврозона; кризис.
Bulletin of Taras Shevchenko National University of Kyiv. Economics, 2018; 3(198): 74-87 УДК 330.342.146 JEL classification: E24, J010, J080 DOI: https://doi.org/10.17721/1728-2667.2018/198-3/10
G. Rîmbu, PhD Lucian Blaga University of Sibiu, Sibiu, Romania,
L. Constantinescu, PhD, Associate Professor Dimitrie Cantemir Christian University of Bucharest, Bucharest, Romania
IMPROVING YOUTHS' SOCIAL SITUATION IN THE EUROPEAN UNION
The European Union's social policies of the last years aimed at improving the social conditions of youths across Europe. The
goal of this paper is to comparatively analyse the characteristics of youths and their social conditions in the EU-27, during 2006-2016, using the following indicators associated to the young population: youth education and training, employment and unem-ployment rates, health, social inclusion, culture and creativity, participation and youth in the digital world. The paper also reviews the impact and efficiency of the EU's social policies in the current economic background, trying to catch the improvements in young people's social conditions. For this purpose, there were used Employment and Social Conditions Indicators and "Europe 2020" Strategy Indicators.
Our analysis reveals that over time the youths' aspirations and needs have changed along with their social conditions. The EU is obviously making progress in improving the social policies addressed to young people, but there are still visible differ-ences between the member states and new, innovative approaches are required to respond to youths' needs in the fast-changing economic and political context of Europe.
Key words: youth, social policy, social conditions, EU-27. Introduction. Nowadays, the European Commission
and the Government of each member state of the EU are getting more and more involved in the economy. They are also focusing on improving the social conditions and the educational level of young people in the EU, but also on tackling unemployment.
Among the EU's biggest concerns are the high youth unemployment rate and the differences between member states regarding this rate. For example, between Germany, which has the lowest youth unemployment rate, at 7% and Greece or Spain, the countries with the highest unemploy-ment rate, approximately 50%, there is a difference of 40 percentage points [6].
The government's implication, through each national social policy and low, including unemployment benefits and
support programmes, changed the behaviour of people during time, from people that where scared to reject a job during the Industrialisation period to people that are searching and accepting a job based on their motivation, minimum wage, health insurance or other benefits.
Although this is the tendency, the fast-changing eco-nomic and political context of Europe, along with the changes in different branches of industry, forced young people to work part-time, or to be underpaid, or even to accept jobs that do not match their educational background or professional experience. The social policy of each state gave young people more options and integrated them to the labour market.
The fast-changing economic and political context of Europe influences young people's decisions, especially
© Rîmbu G., Constantinescu L., 2018

ISSN 1728-2667 ЕКОНОМІКА. 3(198)/2018 ~ 75 ~ regarding their mobility in the labour market. As an EU citi-zen, a youth can choose to immigrate to another member state, to acquire better social conditions and to be integrat-ed into the labour market. To immigrate to another country to find a new job, as a citizen of the EU, can be perceived as an opportunity, but also as an unwanted decision that a citizen can make for better social conditions and wage. After 2007, when 12 new states became member states of the EU, countries that were already members, restricted the access of the citizens coming from the new states, to avoid massive migration [15].
Young people and the social policy in the European Union. The welfare system is different in every country and the expenses of each country on social policies are differ-ent. To associate the EU with a single welfare regime can-not be possible because each member state follows differ-ent welfare regimes [5].
Young people's employment and social conditions have always been a priority for the EU. The European Union Treaty from 1992 includes the "European Strategy for Em-ployment", the starting point of the EU policy regarding employment and labour market.
The EU strategy for smart, sustainable and inclusive growth, "Europa 2020", aims at reducing early school leav-ing, increasing the attainment of people in the tertiary edu-cational level, reducing the risk of poverty and increasing the number of employed people. These aims also target the young population [14].
In order to respond to young people's challenges and help them to succeed, the EU launched the "Youth on the Move" initiative, which focuses on key competences and quality learning outcomes linked with the labour market needs, seeks to improve the quality, attractiveness and responsiveness of higher education and promote more and better mobility and employability, to support the youth mo-bility for education, including workplace-based training. "Youth on the Move" also focuses on reducing unemploy-ment and within the initiative, a framework of policy priori-ties for action at national and EU level was developed [7].
The "New Skills Agenda for Europe" is the EU's initia-tive created to deal with the skills challenges across Eu-rope, focusing on improving the quality and relevance of the skills formation, to increase the visibility and compara-bility of the skills and qualifications and to improve skills intelligence and information for better career choices [8].
The "European Platform against Poverty and Social Exclusion" is another flagship initiative that will establish new actions to address poverty, develop prevention poli-cies and ensure the social cohesion across the EU [10].
In 2009, the "European Union Youth Strategy for 2010-2018" was adopted by the EU's Council. The Council recognises that there is a need to create youth policies in order to improve the youths' well-being, along with other measures that empower young people to contribute to the sustainable development of society. The Council also high-lights the need to establish cooperation between youth policies and other policies regarding employment, social inclusion, education, culture and health. Through this reso-lution, the EU's Council invites the member states to work together, to enhance European cooperation in the youth field and to adopt measures at national level, in line with
national priorities which support the achievement of the "European Union Youth Strategy for 2010–2018" [3].
Even if the "Resolution on a Renewed Framework for European cooperation in the Youth field 2010–2018" was adopted in order to respond to youth challenges, there are still important aspects that the resolution can't control. The economic crisis affects differently young people across Europe, and has an impact on their independent life to adulthood. Dealing with the challenges that the youths are facing and trying to improve their own well-being requires cross-sectoral cooperation in the youth field at EU level [4].
The mid-term evaluation of the EU's Youth Strategy, which covered 2010–2015 data, reveals some differences between member states. During its implementation, mem-ber states approached different issues from the strategy, and none of the countries worked on all actions covered by it. There were differences in approaching the EU's Youth Strategy, considering that there are member states where the youth policy is decentralised and where the countries make efforts to create connections between the regional and local topics and the EU youth cooperation framework.
Across the EU, the Youth Strategy's priorities and ac-tivities have different levels of relevance for each member state. There are differences between the states in ap-proaching the strategy's eight fields of action at policy level, some of the countries had focused on employment, educa-tion and training and other countries gave more attention to youth work, volunteering and participation [7].
Before the Industrial Revolution, the unemployment was not a problem, and the government did not intervene through measures to solve the lack of job opportunities in the labour market. The capitalism during the Industrial Revolution created a new understanding of unemployment, where an individual got hired by another individual, and when the economy was in recession, the employers were forced to fire or lay off personnel, without taking responsi-bility for their employees. In the beginning of capitalism, the idea that the unemployment was not a problem rises and the individuals were responsible for integrating themselves into the labour market. The basic needs of an individual, poverty and hunger were the most relevant solutions to tackle unemployment. As the society evolved the unem-ployment became an issue of the entire society and social assistance programmes have been developed, with gov-ernment implication being necessary [2].
Characteristics of youths and their social condi-tions in the EU-27 countries. Over time, youths' aspira-tions and needs have changed along with their social conditions. The level of education and training, health, social inclusion, job security and youth participation in the community have always been important for the welfare of young people.
The young population, aged between 16–29 years old, in the EU-27 countries, decreased from 2006 to 2016 because of their aging and declining birth rates (Figure 1). The number of young people decreased from 95,794,382 in 2006 to 87,915,034 in 2016, with more than 7 million individuals.
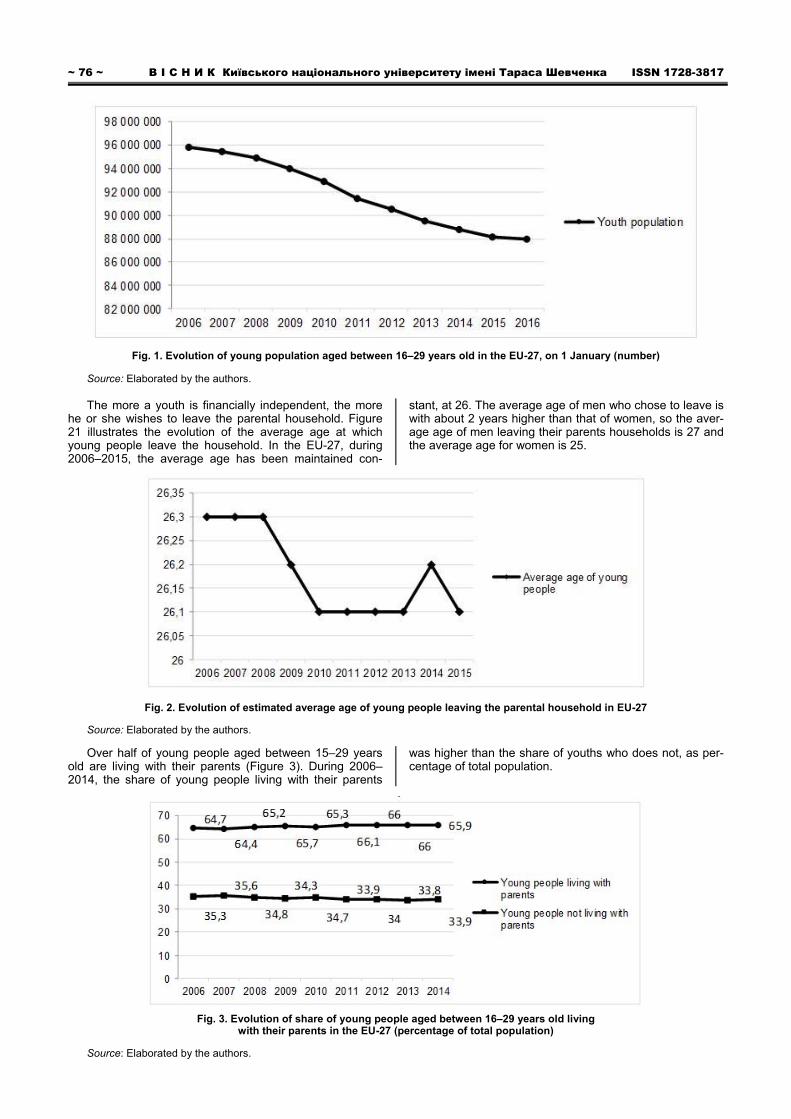
~ 76 ~ В І С Н И К Київського національного університету імені Тараса Шевченка ISSN 1728-3817
Fig. 1. Evolution of young population aged between 16–29 years old in the EU-27, on 1 January (number)
Source: Elaborated by the authors.
The more a youth is financially independent, the more he or she wishes to leave the parental household. Figure 21 illustrates the evolution of the average age at which young people leave the household. In the EU-27, during 2006–2015, the average age has been maintained con-
stant, at 26. The average age of men who chose to leave is with about 2 years higher than that of women, so the aver-age age of men leaving their parents households is 27 and the average age for women is 25.
Fig. 2. Evolution of estimated average age of young people leaving the parental household in EU-27
Source: Elaborated by the authors.
Over half of young people aged between 15–29 years old are living with their parents (Figure 3). During 2006–2014, the share of young people living with their parents
was higher than the share of youths who does not, as per-centage of total population.
Fig. 3. Evolution of share of young people aged between 16–29 years old living with their parents in the EU-27 (percentage of total population)
Source: Elaborated by the authors.
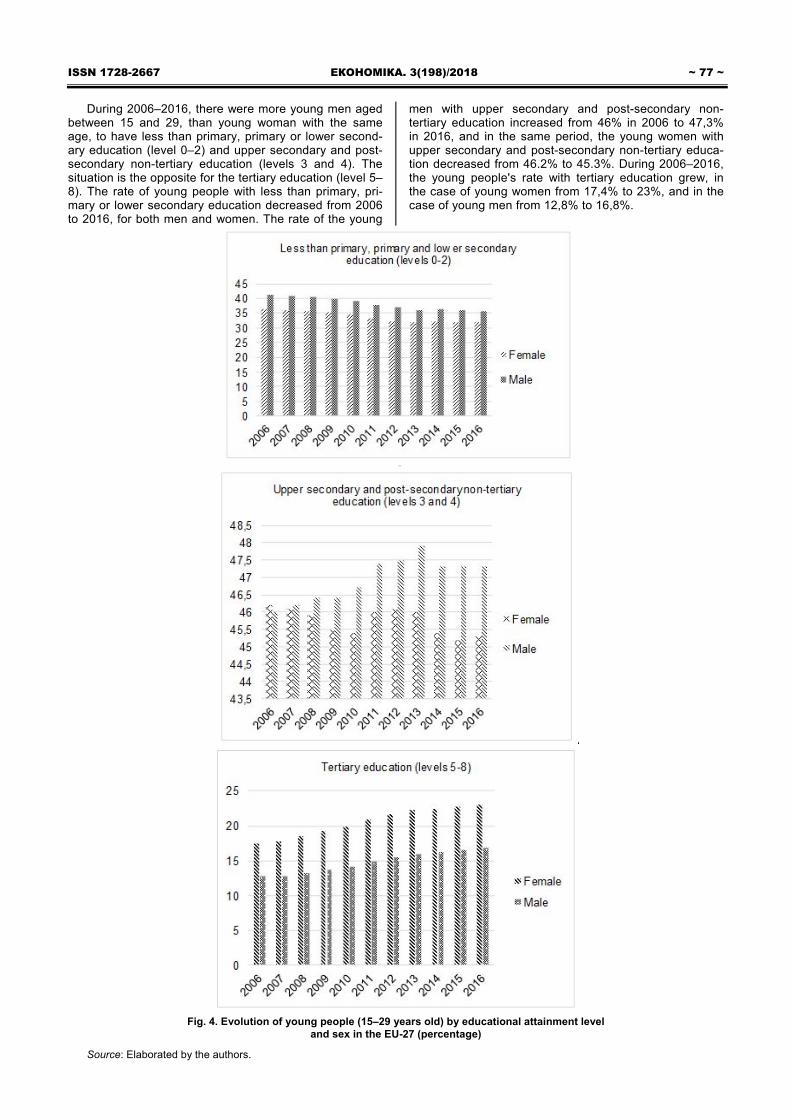
ISSN 1728-2667 ЕКОНОМІКА. 3(198)/2018 ~ 77 ~
During 2006–2016, there were more young men aged between 15 and 29, than young woman with the same age, to have less than primary, primary or lower second-ary education (level 0–2) and upper secondary and post-secondary non-tertiary education (levels 3 and 4). The situation is the opposite for the tertiary education (level 5–8). The rate of young people with less than primary, pri-mary or lower secondary education decreased from 2006 to 2016, for both men and women. The rate of the young
men with upper secondary and post-secondary non-tertiary education increased from 46% in 2006 to 47,3% in 2016, and in the same period, the young women with upper secondary and post-secondary non-tertiary educa-tion decreased from 46.2% to 45.3%. During 2006–2016, the young people's rate with tertiary education grew, in the case of young women from 17,4% to 23%, and in the case of young men from 12,8% to 16,8%.
Fig. 4. Evolution of young people (15–29 years old) by educational attainment level and sex in the EU-27 (percentage)
Source: Elaborated by the authors.

~ 78 ~ В І С Н И К Київського національного університету імені Тараса Шевченка ISSN 1728-3817
Early school leaving affects the individual, at both pro-fessional and personal level. At the professional level, the major negative impact is on the insertion into the labour market. Figure 5 shows the evolution of female early leavers, aged between 18–24 years old, from education and training, by labour status, in the EU-27. Most of the female early leavers are not employed persons. The female early leavers not employed decreased from 7.5% in 2006 to 6.1% in 2016,
registering the highest value in 2009 and 2010, 7,6% and 7,5%. The labour market demands have changed over the time, requiring more skilled and qualified labour force, and this aspect can be noticed in the case of the female early leavers as employed persons, where the rate decreased from 5,8% in 2006 to 3,1% in 2016. The female leavers who would have liked to work and the ones who did not want to work decreased as well in the 2006–2016 period.
Fig. 5. Evolution of female early leavers aged between 18–24 years old, from education and training by labour status in the EU-27 (percentage)
Source: Elaborated by the authors.
Most of the male early leavers where employed per-sons from 2006 to 2011, and from 2012 to 2016 most of the male early leavers where not employed people (Figure 6). Basically, it was easier for men to find jobs then for women. The highest value of employed male early leavers was in 2006, 11%, and decreased until 2016 at 5,9%. The male early leavers not employed maintained the value broadly at 6% in 2006–2008, broadly at 7% in 2009–
2013, and again broadly at 6% during 2014–2016, reach-ing the same value in 2016 as in 2006, of 6,4%. The atti-tude of the male early leavers regarding the desire to work or not, fluctuated during the analysed period. Compared to 2006, in 2016 there were more male early leavers who did not want to work, and fewer male early leavers who would have liked to work. This changing attitude can be related to the social protection programmes of each country.
Fig. 6. Evolution of male early leavers, aged between 18–24 years old, from education and training by labour status
Source: Elaborated by the authors.
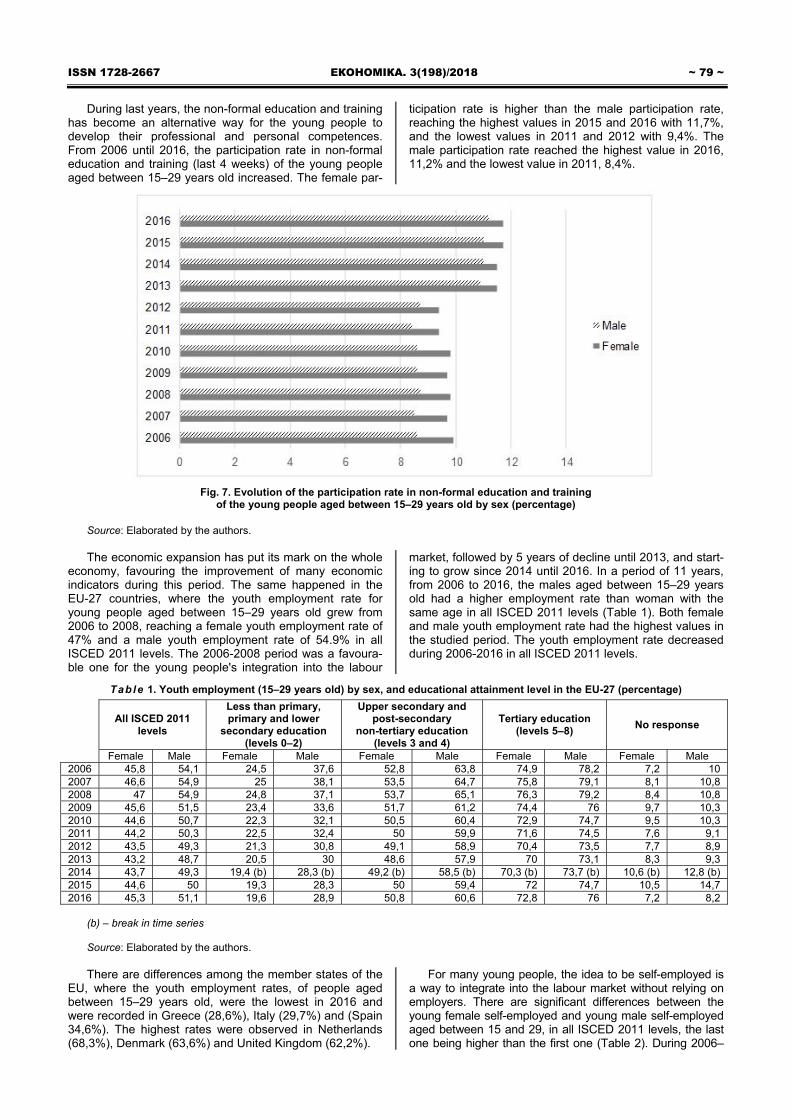
ISSN 1728-2667 ЕКОНОМІКА. 3(198)/2018 ~ 79 ~
During last years, the non-formal education and training has become an alternative way for the young people to develop their professional and personal competences. From 2006 until 2016, the participation rate in non-formal education and training (last 4 weeks) of the young people aged between 15–29 years old increased. The female par-
ticipation rate is higher than the male participation rate, reaching the highest values in 2015 and 2016 with 11,7%, and the lowest values in 2011 and 2012 with 9,4%. The male participation rate reached the highest value in 2016, 11,2% and the lowest value in 2011, 8,4%.
Fig. 7. Evolution of the participation rate in non-formal education and training of the young people aged between 15–29 years old by sex (percentage)
Source: Elaborated by the authors.
The economic expansion has put its mark on the whole
economy, favouring the improvement of many economic indicators during this period. The same happened in the EU-27 countries, where the youth employment rate for young people aged between 15–29 years old grew from 2006 to 2008, reaching a female youth employment rate of 47% and a male youth employment rate of 54.9% in all ISCED 2011 levels. The 2006-2008 period was a favoura-ble one for the young people's integration into the labour
market, followed by 5 years of decline until 2013, and start-ing to grow since 2014 until 2016. In a period of 11 years, from 2006 to 2016, the males aged between 15–29 years old had a higher employment rate than woman with the same age in all ISCED 2011 levels (Table 1). Both female and male youth employment rate had the highest values in the studied period. The youth employment rate decreased during 2006-2016 in all ISCED 2011 levels.
Table 1. Youth employment (15–29 years old) by sex, and educational attainment level in the EU-27 (percentage)
All ISCED 2011
levels
Less than primary, primary and lower
secondary education (levels 0–2)
Upper secondary and post-secondary
non-tertiary education (levels 3 and 4)
Tertiary education (levels 5–8)
No response
Female Male Female Male Female Male Female Male Female Male 2006 45,8 54,1 24,5 37,6 52,8 63,8 74,9 78,2 7,2 10 2007 46,6 54,9 25 38,1 53,5 64,7 75,8 79,1 8,1 10,8 2008 47 54,9 24,8 37,1 53,7 65,1 76,3 79,2 8,4 10,8 2009 45,6 51,5 23,4 33,6 51,7 61,2 74,4 76 9,7 10,3 2010 44,6 50,7 22,3 32,1 50,5 60,4 72,9 74,7 9,5 10,3 2011 44,2 50,3 22,5 32,4 50 59,9 71,6 74,5 7,6 9,1 2012 43,5 49,3 21,3 30,8 49,1 58,9 70,4 73,5 7,7 8,9 2013 43,2 48,7 20,5 30 48,6 57,9 70 73,1 8,3 9,3 2014 43,7 49,3 19,4 (b) 28,3 (b) 49,2 (b) 58,5 (b) 70,3 (b) 73,7 (b) 10,6 (b) 12,8 (b) 2015 44,6 50 19,3 28,3 50 59,4 72 74,7 10,5 14,7 2016 45,3 51,1 19,6 28,9 50,8 60,6 72,8 76 7,2 8,2
(b) – break in time series Source: Elaborated by the authors.
There are differences among the member states of the
EU, where the youth employment rates, of people aged between 15–29 years old, were the lowest in 2016 and were recorded in Greece (28,6%), Italy (29,7%) and (Spain 34,6%). The highest rates were observed in Netherlands (68,3%), Denmark (63,6%) and United Kingdom (62,2%).
For many young people, the idea to be self-employed is a way to integrate into the labour market without relying on employers. There are significant differences between the young female self-employed and young male self-employed aged between 15 and 29, in all ISCED 2011 levels, the last one being higher than the first one (Table 2). During 2006–
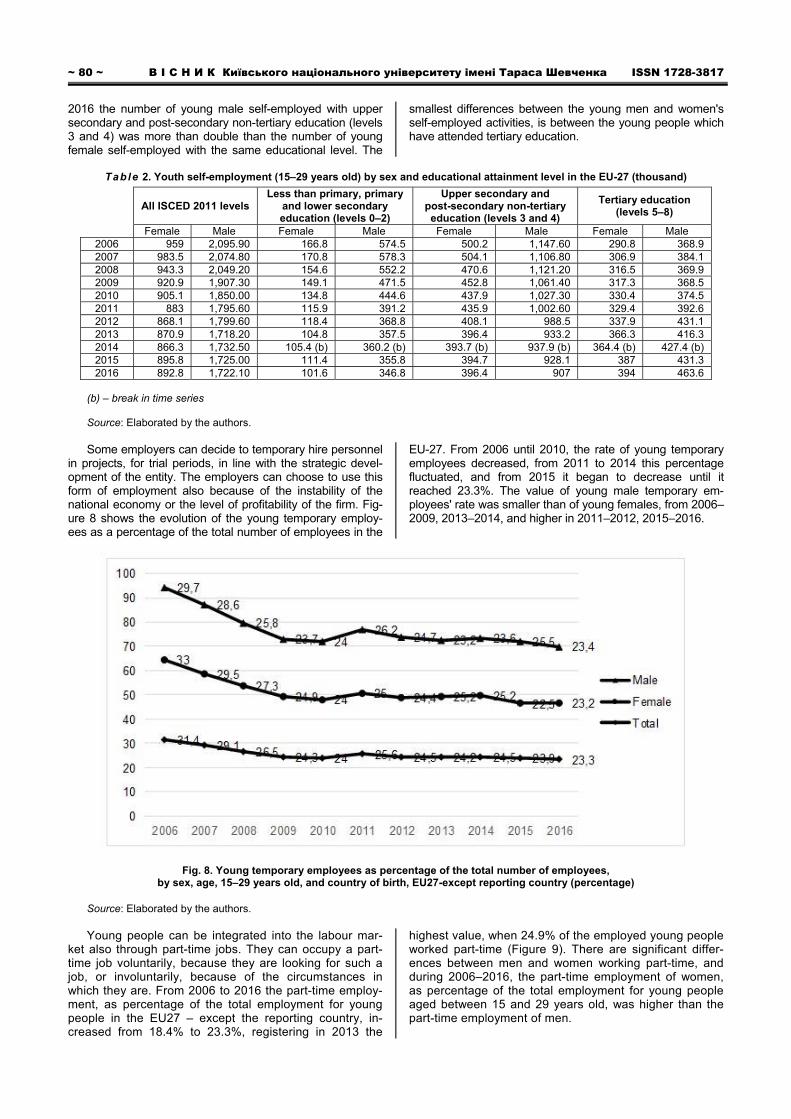
~ 80 ~ В І С Н И К Київського національного університету імені Тараса Шевченка ISSN 1728-3817 2016 the number of young male self-employed with upper secondary and post-secondary non-tertiary education (levels 3 and 4) was more than double than the number of young female self-employed with the same educational level. The
smallest differences between the young men and women's self-employed activities, is between the young people which have attended tertiary education.
Table 2. Youth self-employment (15–29 years old) by sex and educational attainment level in the EU-27 (thousand)
All ISCED 2011 levels Less than primary, primary
and lower secondary education (levels 0–2)
Upper secondary and post-secondary non-tertiary education (levels 3 and 4)
Tertiary education (levels 5–8)
Female Male Female Male Female Male Female Male 2006 959 2,095.90 166.8 574.5 500.2 1,147.60 290.8 368.9 2007 983.5 2,074.80 170.8 578.3 504.1 1,106.80 306.9 384.1 2008 943.3 2,049.20 154.6 552.2 470.6 1,121.20 316.5 369.9 2009 920.9 1,907.30 149.1 471.5 452.8 1,061.40 317.3 368.5 2010 905.1 1,850.00 134.8 444.6 437.9 1,027.30 330.4 374.5 2011 883 1,795.60 115.9 391.2 435.9 1,002.60 329.4 392.6 2012 868.1 1,799.60 118.4 368.8 408.1 988.5 337.9 431.1 2013 870.9 1,718.20 104.8 357.5 396.4 933.2 366.3 416.3 2014 866.3 1,732.50 105.4 (b) 360.2 (b) 393.7 (b) 937.9 (b) 364.4 (b) 427.4 (b) 2015 895.8 1,725.00 111.4 355.8 394.7 928.1 387 431.3 2016 892.8 1,722.10 101.6 346.8 396.4 907 394 463.6
(b) – break in time series Source: Elaborated by the authors. Some employers can decide to temporary hire personnel
in projects, for trial periods, in line with the strategic devel-opment of the entity. The employers can choose to use this form of employment also because of the instability of the national economy or the level of profitability of the firm. Fig-ure 8 shows the evolution of the young temporary employ-ees as a percentage of the total number of employees in the
EU-27. From 2006 until 2010, the rate of young temporary employees decreased, from 2011 to 2014 this percentage fluctuated, and from 2015 it began to decrease until it reached 23.3%. The value of young male temporary em-ployees' rate was smaller than of young females, from 2006–2009, 2013–2014, and higher in 2011–2012, 2015–2016.
Fig. 8. Young temporary employees as percentage of the total number of employees, by sex, age, 15–29 years old, and country of birth, EU27-except reporting country (percentage)
Source: Elaborated by the authors.
Young people can be integrated into the labour mar-
ket also through part-time jobs. They can occupy a part-time job voluntarily, because they are looking for such a job, or involuntarily, because of the circumstances in which they are. From 2006 to 2016 the part-time employ-ment, as percentage of the total employment for young people in the EU27 – except the reporting country, in-creased from 18.4% to 23.3%, registering in 2013 the
highest value, when 24.9% of the employed young people worked part-time (Figure 9). There are significant differ-ences between men and women working part-time, and during 2006–2016, the part-time employment of women, as percentage of the total employment for young people aged between 15 and 29 years old, was higher than the part-time employment of men.

ISSN 1728-2667 ЕКОНОМІКА. 3(198)/2018 ~ 81 ~
Fig. 9. Evolution of part-time employment as percentage of the total employment for young people (15–29 years old) by sex and country of birth, EU27-except reporting country
Source: Elaborated by the authors.
During 2006–2016, young people's main reason for
working part-time was that they were following a form of education or training. Even if the men and women had the same reason, there were more young men than young women that were working part-time (Table 3). The second reason was that they could not find a full-time job. For young women, looking after children or incapacitated
adults was the next reason for working part-time, followed by other reasons, like family or personal responsibilities and at the end because of their own illness or disability. For young men, looking after children or incapacitated adults, was the last reason for working part-time, having the lowest values during 2006–2016.
Table 3. Main reasons for part-time employment of young people (15–29 years old) in EU27 by sex (percentage)
Could not find a
full-time job Own illness or
disability
Other family or personal
responsabilities
Looking after children or
incapacitated adults
In education or training
Other
Female Male Female Male Female Male Female Male Female Male Female Male 2006 28.2 26.9 1.0 1.4 5.7 2.0 14.5 0.5(u) 37.0 56.6 13.7 12.6 2007 27.5 25.8 1.0 1.6 5.1 2.3 14.7 0.5(u) 38.4 56.8 13.3 13.0 2008 31.3(u) 27.4(u) 1.0(u) 1.7(u) 5.4(u) 2.8(u 13.0(u) 0.6(u) 35.0(u) 53.7(u) 14.2(u) 13.9(u) 2009 30.7(u 30.5(u) 0.8(u) 1.2(u) 5.1(u) 2.4(u) 14.4(u) 0.6(u) 35.7(u) 51.9(u) 13.3(u) 13.3(u) 2010 32.3(u) 32.5(u) 0.7(u) 1.1(u) 4.7(u) 2.1(u) 14.0(u) 0.8(u) 35.1(u) 49.7(u) 13.2(u) 13.8(u) 2011 31.1 33.3 1.0 1.2 4.8 1.8 15.2 0.6 34.9 49.6 12.9 13.5 2012 32.2 35.2 1.0 1.3 4.4 1.9 14.8 0.7 34.7 48.0 12.9 13.0 2013 33.4 35.1 0.8 1.2 4.4 2.0 14.3 0.7 36.3 49.8 10.8 11.2 2014 33.2 36.7 0.8 1.5 4.2 1.7 13.8 0.6 37.1 48.1 10.8 11.4 2015 32.4 35.9 0.9 1.2 4.4 1.7 13.6 0.7 36.7 49.6 12.0 10.8 2016 29. 32.8 1.1 1.3 5.3 2.2 13.7 0.5 37.6 50.4 12.4 12.8
(u) – low reliability Source: Elaborated by the authors.
Between 2007 and 2014, the share of involuntary
part-time employment, as percentage of the total part-time employment for young people aged between 15-29 years old in the EU-27, increased from 27.7% to 34.5%, and decreased until 2016 to 31% (Figure 10). Until 2010
the share of involuntary part-time employment, as per-centage of the total part-time employment for young women, was higher than of young men, and since then the situation has reversed.

~ 82 ~ В І С Н И К Київського національного університету імені Тараса Шевченка ISSN 1728-3817
Fig. 10. Involuntary part-time employment as percentage of the total part-time employment for young people (15–29 years old) by sex in EU-27 (percentage)
Source: Elaborated by the authors.
There are significant differences between the rate of
involuntary part-time employment, as percentage of the total part-time employment for young people (15–29 years old), among the member states of the EU; accord-ing to the Eurostat database, in 2016, most of the Italian young citizens where occupying involuntary part-time jobs, recording a rate of 80,4%, followed by Cyprus, 74.1% and Greece, 73,9%.
The lowest rate was observed in Estonia, 6.0% (low-liability), Denmark, 10.6% and Germany, 11.7%.
The economists who support Keynes's vision felt that everyone must have a job that matched the education re-ceived, the work experience and some facilities to work near home. On the opposite pole, classic economists thought it was the choice of an individual not to have a job and if he or she was looking well enough, a job would have been found regardless of the job specifications or the sala-ry offered [2]. They have also considered that the labour market is in constant balance and even if the number of job
vacancies is higher than the job demands, they admit that there are always a few unemployed [1].
Over the years, various solutions have been identified to reduce the unemployment rate. And for this, most of the times, the attention was directed to the governments of each state, as they must have solutions and apply measures in order to increase employment [13]. The mini-mum wage is one of the measures that the member states of EU are applying in their counties. This measure, the minimum wage, together with the experience of the worker can increase the youth unemployment rate [12].
Since 2007 and until 2013, the youth unemployment rate, for youths aged between 15–29 years old from the EU-27 countries, except the reporting country, increased from 9.7% to 19.2%, and deceased until 2016 at 13.6%. The youth unemployment rate among women during the 2006–2016 period, was higher than the youth unemploy-ment rate among men, except in 2009, where the rate was lower, but only with 0.1%.
Fig. 11. Youth unemployment rate (15–29 years old) by sex and country of birth – EU-27 countries except reporting country (percentage)
Source: Elaborated by the authors.
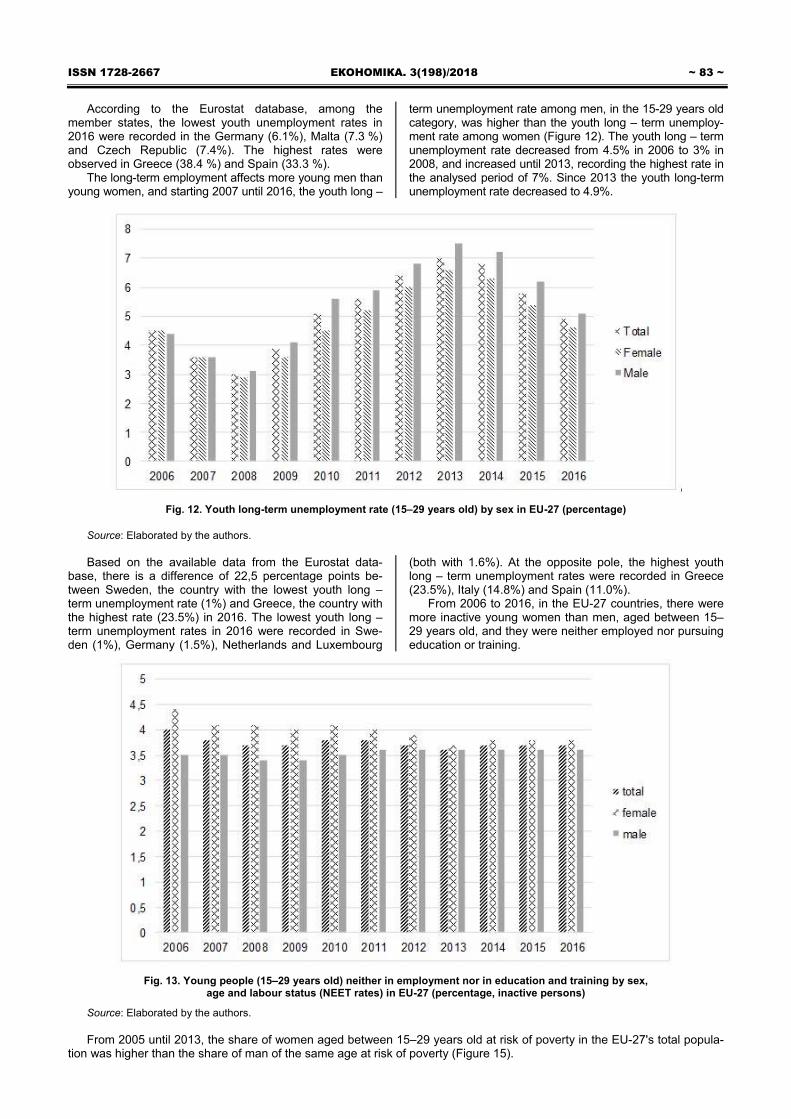
ISSN 1728-2667 ЕКОНОМІКА. 3(198)/2018 ~ 83 ~
According to the Eurostat database, among the member states, the lowest youth unemployment rates in 2016 were recorded in the Germany (6.1%), Malta (7.3 %) and Czech Republic (7.4%). The highest rates were observed in Greece (38.4 %) and Spain (33.3 %).
The long-term employment affects more young men than young women, and starting 2007 until 2016, the youth long –
term unemployment rate among men, in the 15-29 years old category, was higher than the youth long – term unemploy-ment rate among women (Figure 12). The youth long – term unemployment rate decreased from 4.5% in 2006 to 3% in 2008, and increased until 2013, recording the highest rate in the analysed period of 7%. Since 2013 the youth long-term unemployment rate decreased to 4.9%.
Fig. 12. Youth long-term unemployment rate (15–29 years old) by sex in EU-27 (percentage)
Source: Elaborated by the authors.
Based on the available data from the Eurostat data-base, there is a difference of 22,5 percentage points be-tween Sweden, the country with the lowest youth long – term unemployment rate (1%) and Greece, the country with the highest rate (23.5%) in 2016. The lowest youth long – term unemployment rates in 2016 were recorded in Swe-den (1%), Germany (1.5%), Netherlands and Luxembourg
(both with 1.6%). At the opposite pole, the highest youth long – term unemployment rates were recorded in Greece (23.5%), Italy (14.8%) and Spain (11.0%).
From 2006 to 2016, in the EU-27 countries, there were more inactive young women than men, aged between 15–29 years old, and they were neither employed nor pursuing education or training.
Fig. 13. Young people (15–29 years old) neither in employment nor in education and training by sex, age and labour status (NEET rates) in EU-27 (percentage, inactive persons)
Source: Elaborated by the authors.
From 2005 until 2013, the share of women aged between 15–29 years old at risk of poverty in the EU-27's total popula-tion was higher than the share of man of the same age at risk of poverty (Figure 15).
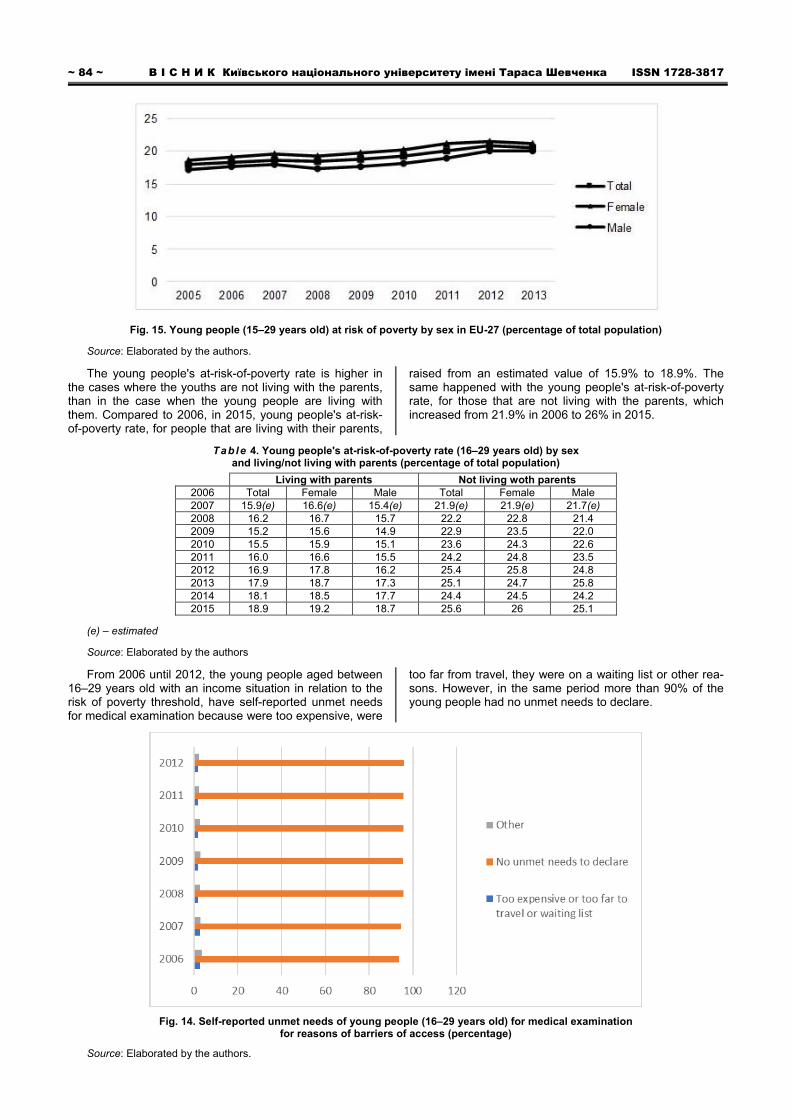
~ 84 ~ В І С Н И К Київського національного університету імені Тараса Шевченка ISSN 1728-3817
Fig. 15. Young people (15–29 years old) at risk of poverty by sex in EU-27 (percentage of total population)
Source: Elaborated by the authors.
The young people's at-risk-of-poverty rate is higher in the cases where the youths are not living with the parents, than in the case when the young people are living with them. Compared to 2006, in 2015, young people's at-risk-of-poverty rate, for people that are living with their parents,
raised from an estimated value of 15.9% to 18.9%. The same happened with the young people's at-risk-of-poverty rate, for those that are not living with the parents, which increased from 21.9% in 2006 to 26% in 2015.
Table 4. Young people's at-risk-of-poverty rate (16–29 years old) by sex and living/not living with parents (percentage of total population)
Living with parents Not living woth parents 2006 Total Female Male Total Female Male 2007 15.9(e) 16.6(e) 15.4(e) 21.9(e) 21.9(e) 21.7(e) 2008 16.2 16.7 15.7 22.2 22.8 21.4 2009 15.2 15.6 14.9 22.9 23.5 22.0 2010 15.5 15.9 15.1 23.6 24.3 22.6 2011 16.0 16.6 15.5 24.2 24.8 23.5 2012 16.9 17.8 16.2 25.4 25.8 24.8 2013 17.9 18.7 17.3 25.1 24.7 25.8 2014 18.1 18.5 17.7 24.4 24.5 24.2 2015 18.9 19.2 18.7 25.6 26 25.1
(e) – estimated
Source: Elaborated by the authors
From 2006 until 2012, the young people aged between 16–29 years old with an income situation in relation to the risk of poverty threshold, have self-reported unmet needs for medical examination because were too expensive, were
too far from travel, they were on a waiting list or other rea-sons. However, in the same period more than 90% of the young people had no unmet needs to declare.
Fig. 14. Self-reported unmet needs of young people (16–29 years old) for medical examination for reasons of barriers of access (percentage)
Source: Elaborated by the authors.
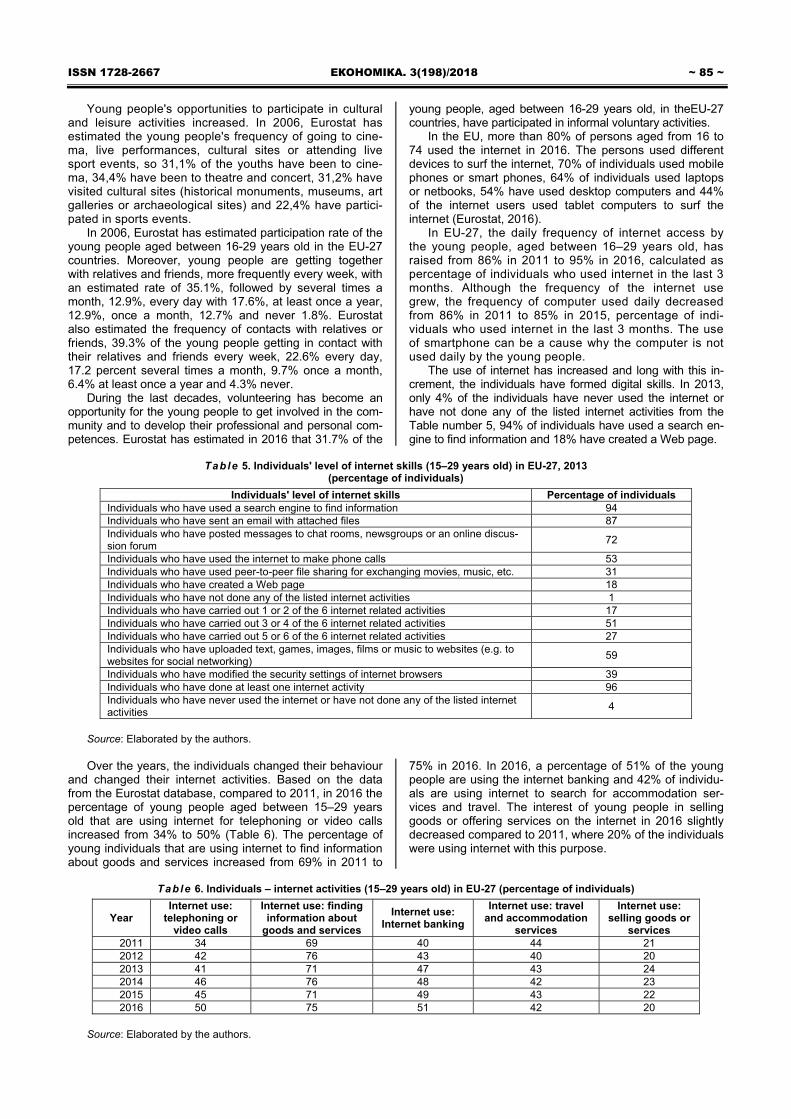
ISSN 1728-2667 ЕКОНОМІКА. 3(198)/2018 ~ 85 ~
Young people's opportunities to participate in cultural and leisure activities increased. In 2006, Eurostat has estimated the young people's frequency of going to cine-ma, live performances, cultural sites or attending live sport events, so 31,1% of the youths have been to cine-ma, 34,4% have been to theatre and concert, 31,2% have visited cultural sites (historical monuments, museums, art galleries or archaeological sites) and 22,4% have partici-pated in sports events.
In 2006, Eurostat has estimated participation rate of the young people aged between 16-29 years old in the EU-27 countries. Moreover, young people are getting together with relatives and friends, more frequently every week, with an estimated rate of 35.1%, followed by several times a month, 12.9%, every day with 17.6%, at least once a year, 12.9%, once a month, 12.7% and never 1.8%. Eurostat also estimated the frequency of contacts with relatives or friends, 39.3% of the young people getting in contact with their relatives and friends every week, 22.6% every day, 17.2 percent several times a month, 9.7% once a month, 6.4% at least once a year and 4.3% never.
During the last decades, volunteering has become an opportunity for the young people to get involved in the com-munity and to develop their professional and personal com-petences. Eurostat has estimated in 2016 that 31.7% of the
young people, aged between 16-29 years old, in theEU-27 countries, have participated in informal voluntary activities.
In the EU, more than 80% of persons aged from 16 to 74 used the internet in 2016. The persons used different devices to surf the internet, 70% of individuals used mobile phones or smart phones, 64% of individuals used laptops or netbooks, 54% have used desktop computers and 44% of the internet users used tablet computers to surf the internet (Eurostat, 2016).
In EU-27, the daily frequency of internet access by the young people, aged between 16–29 years old, has raised from 86% in 2011 to 95% in 2016, calculated as percentage of individuals who used internet in the last 3 months. Although the frequency of the internet use grew, the frequency of computer used daily decreased from 86% in 2011 to 85% in 2015, percentage of indi-viduals who used internet in the last 3 months. The use of smartphone can be a cause why the computer is not used daily by the young people.
The use of internet has increased and long with this in-crement, the individuals have formed digital skills. In 2013, only 4% of the individuals have never used the internet or have not done any of the listed internet activities from the Table number 5, 94% of individuals have used a search en-gine to find information and 18% have created a Web page.
Table 5. Individuals' level of internet skills (15–29 years old) in EU-27, 2013
(percentage of individuals)
Individuals' level of internet skills Percentage of individuals Individuals who have used a search engine to find information 94 Individuals who have sent an email with attached files 87 Individuals who have posted messages to chat rooms, newsgroups or an online discus-sion forum
72
Individuals who have used the internet to make phone calls 53 Individuals who have used peer-to-peer file sharing for exchanging movies, music, etc. 31 Individuals who have created a Web page 18 Individuals who have not done any of the listed internet activities 1 Individuals who have carried out 1 or 2 of the 6 internet related activities 17 Individuals who have carried out 3 or 4 of the 6 internet related activities 51 Individuals who have carried out 5 or 6 of the 6 internet related activities 27 Individuals who have uploaded text, games, images, films or music to websites (e.g. to websites for social networking)
59
Individuals who have modified the security settings of internet browsers 39 Individuals who have done at least one internet activity 96 Individuals who have never used the internet or have not done any of the listed internet activities
4
Source: Elaborated by the authors.
Over the years, the individuals changed their behaviour
and changed their internet activities. Based on the data from the Eurostat database, compared to 2011, in 2016 the percentage of young people aged between 15–29 years old that are using internet for telephoning or video calls increased from 34% to 50% (Table 6). The percentage of young individuals that are using internet to find information about goods and services increased from 69% in 2011 to
75% in 2016. In 2016, a percentage of 51% of the young people are using the internet banking and 42% of individu-als are using internet to search for accommodation ser-vices and travel. The interest of young people in selling goods or offering services on the internet in 2016 slightly decreased compared to 2011, where 20% of the individuals were using internet with this purpose.
Table 6. Individuals – internet activities (15–29 years old) in EU-27 (percentage of individuals)
Year Internet use:
telephoning or video calls
Internet use: finding information about
goods and services
Internet use: Internet banking
Internet use: travel and accommodation
services
Internet use: selling goods or
services 2011 34 69 40 44 21 2012 42 76 43 40 20 2013 41 71 47 43 24 2014 46 76 48 42 23 2015 45 71 49 43 22 2016 50 75 51 42 20
Source: Elaborated by the authors.

~ 86 ~ В І С Н И К Київського національного університету імені Тараса Шевченка ISSN 1728-3817
Conclusions and discussions. The youths' aspira-tions and needs have changed along with their social con-ditions. The EU is obviously making progress in improving the social policies addressed to young people, and new, innovative approaches are required to respond to the youths' needs in the fast-changing economic and political context of Europe.
Nevertheless, the government's implication to improve the social conditions, especially the youth employment rate, through social protection programmes, can change the atti-tude of youths regarding the desire to work, as we saw in the case of male early leavers' attitude regarding the desire to work or not; when compared to 2006, in 2016 there were more male early leavers who did not want to work, and fewer male early leavers who would have liked to work.
In the EU-27, the young population aged between 16-29 years old, decreased during 2006–2016. The youth em-ployment for the same category, decreased also from 2008 to 2015 for all the ISCED 2011 levels. There are significant differences between the young female self-employed and young male self-employed in all ISCED 2011 levels. From 2006 until 2016, the part-time employment, as percentage of the total employment for young people in the EU27 – except the reporting country increased, and the main rea-sons were because they were following a form of education or training or because they could not find a full-time job.
From 2007 to 2013, the youth unemployment rate, for youths aged between 15–29 years old, in the EU-27 coun-tries, except the reporting country, increased from 9.7% to 19.2%, and deceased until 2016 to 13.6%.
The long-term employment affects more young men than young women. The level of education can help young people to adapt to labour market changes. Compared to 2006, in 2017 there are more young people who attend tertiary education but the early school leavers have a nega-tive impact on the insertion into the labour market of indi-viduals. The participation rate in non-formal education and training of the young people, increased. Eurostat has esti-mated in 2016 that 31.7% of them have participated in in-formal voluntary activities.
Youths from the EU-27 countries, aged between 15 and 29 years old, chose to leave their parents at the av-erage age of 26, and over half of them are still living in the parental households. The at-risk-of-poverty rate is higher for those who are not living with the parents, than for those who do.
Young people's opportunities to participate in cultural and leisure activities have increased. They are getting to-gether with relatives and friends more frequently every week, with an estimated rate of 35.1%. The individuals' level of internet skills is registering high values.
References 1. Duguleană, C., Litră, A. V. 2015, Macroeconomie, Transilvania
University of Brasov Publisher, pp. 52-65, pp. 72-79, pp. 93-104. 2. Colander, D. C., 1998, Macroeconomics. Third Edition, United
States of America, Irwin/ McGraw-Hill, pp. 157-172. 3. Council of the European Union, 2009, Council Resolution of
27 November 2009 on a renewed framework for European cooperation in the youth field (2010-2018), Official Journal of the European Union, 2009/C 311/01, pp. 311/2-311/4.
4. Council of the European Union, 2015, COUNCIL RESOLUTIONS, Resolution of the Council and of the Representatives of the Governments of the Member States, meeting within the Council, on a European Union Work Plan for Youth for 2016-2018, Official Journal of the European Union, 2015/C 417/01, pg. 417/1.
5. Dumitrache, V., Răileanu Szeleş, M., 2012, Particuliarities of the Romnian Welfare state, Bulletin of the Transilvania University of Braşov, Vol. 5 (54), No. 1, Series V: Economic Sciences, Braşov.
6. European Commission, Addressing youth unemployment in the EU, Catalogue N.: KE-02-15-605-EN-N, 2015.
7. European Commission, 2016, Evaluation of the EU Youth Strategy and the Council Recommendation on the mobility of young volunteers across the EU Final Report Executive Summary, Luxembourg, pp. 1-5.
8. European Commission, 2010, Communication from the Commis-sion to the European Parliament, the Council, the European Economic and Social Committee and The Committee of the Regions, Youth on the Move An initiative to unleash the potential of young people to achieve smart, sustainable and inclusive growth in the European Union, COM(2010) 477 final, Brussels, pp 3-4.
9. European Commission, 2016, Communication from the Commis-sion to the European Parliament, the Council, the European Economic and Social Committee and The Committee of the Regions, A NEW SKILLS AGENDA FOR EUROPE Working together to strengthen human capital, employability and competitiveness, COM(2016) 381, Brussels, 3 p.
10. European Commission, 2010, Communication from the Commis-sion to the European Parliament, the Council, the European Economic and Social Committee and The Committee of the Regions, The European Plat-form against Poverty and Social Exclusion: A European framework for social and territorial cohesion, COM(2010) 758 final, Brussels, 3 p.
11. Eurostat, 2016, Newsletter Internet use by individuals Almost 8 out of 10 internet users in the EU surfed via a mobile or smart phone in 2016… Different patterns across Member States in managing personal information, 260/2016.
12. Gorry, A., 2013, Minimum wages and youth unemployment, European Economic Review, Issue 64, pp. 57-75.
13. Kiss, F., Cocheci, D. (1993), Economie contemporană. Introducere în Micro- şi Macroeconomie – note de curs, Cluj-Napoca, pp. 98-101, pp. 157-167.
14. Council of the European Union and European Commission, 2012, NOTICES FROM EUROPEAN UNION INSTITUTIONS, BODIES, OFFICES AND AGENCIES, COUNCIL, EUROPEAN COMMISSION, Joint Report of the Council and the Commission on the implementation of the renewed framework for European cooperation in the youth field (2010-18), Official Journal of the European Union, 2012/C 394/03, pp. 394/6.
15. Pascouau, Y., 2013, Intra-EU mobility: the ‘second building block' of EU labour migration policy, Issue Paper No.74, May 2013, pp. 1-11.
16. http://ec.europa.eu/eurostat/data/database 17. http://ec.europa.eu/europe2020/index_en.htm
R e c e i ve d : 19 / 0 1 / 20 18 1 s t Re v i s i o n : 2 5 / 03 / 20 1 8
Ac c e p t e d : 14 / 0 5 / 20 18 Author's declaration on the sources of funding of research
presented in the scientific article or of the preparation of the scientific article: budget of university's scientific project
Г. Рімбу, асп. Університет імені Лучіана Блага, Сібіу, Румунія, Л. Константинеску, канд. екон. наук, доц. Християнський університет імені Димитрі Кантеміра, Бухарест, Румунія
УДОСКОНАЛЕННЯ СОЦІАЛЬНОЇ СИТУАЦІЇ МОЛОДІ
В ЄВРОПЕЙСЬКОМУ СОЮЗІ Соціальна політика Європейського Союзу останніх років спрямована на поліпшення соціальних умов молоді в Європі. Метою дано-
го дослідження є порівняльний аналіз характеристик молоді та їхніх соціальних умов у країнах ЄС-27 протягом 2006–2016 рр. з викори-станням наступних показників, пов'язаних із молоддю: освіта й навчання молоді, рівень зайнятості та безробіття, здоров'я, соціаль-на інтеграція, культура і творчість, участь молоді в цифровому світі. Також розглядається вплив та ефективність соціальної політики ЄС за сучасних економічних умов у питаннях поліпшення соціальних умов молоді. Із цією метою були використані показники зайнятості й соціальних умов, а також показники стратегії "Європа 2020".
Аналіз показує, що з часом змінюються прагнення та потреби молоді разом з їхніми соціальними умовами. ЄС явно прогре-сує в удосконаленні соціальної політики, що адресована молодим людям, однак між країнами-членами все ще є помітні відмін-ності, тому необхідні нові інноваційні підходи для реагування на потреби молоді за швидкої зміни економічного та політичного контексту в Європі.
Ключові слова: молодь, соціальна політика, соціальні умови, ЄС-27.

ISSN 1728-2667 ЕКОНОМІКА. 3(198)/2018 ~ 87 ~ Г. Римбу, асп. Университет имени Лучиана Блага, Сибиу, Румыния, Л. Константинеску, канд. экон. наук, доц. Христианский университет имени Димитри Кантемира, Бухарест, Румыния
СОВЕРШЕНСТВОВАНИЕ СОЦИАЛЬНОЙ СИТУАЦИИ МОЛОДЕЖИ В ЕВРОПЕЙСКОМ СОЮЗЕ
Социальная политика Европейского Союза последних лет направлена на улучшение социальных условий молодежи в Европе. Це-лью данного исследования является сравнительный анализ характеристик молодежи и их социальных условий в странах ЕС-27 в течение 2006–2016 гг. с использованием следующих показателей, связанных с молодежью: образование и обучение молодежи, уровень занятости и безработицы, здоровья, социальная интеграция, культура и творчество, участие молодежи в цифровом мире. Также рассматривается влияние и эффективность социальной политики ЕС в современных экономических условиях в вопросах улучшения социальных условий молодежи. С этой целью были использованы показатели занятости и социальных условий, а также показатели стратегии "Европа 2020".
Анализ показывает, что со временем меняются стремления и потребности молодежи вместе с их социальными условиями. В ЕС очевиден прогресс в совершенствовании социальной политики, адресованной молодым людям, однако между странами-членами все еще заметны различия, и поэтому нужны новые необходимые инновационные подходы для реагирования на потребности молодежи в условиях быстро изменяющегося экономического и политического контекста в Европе.
Ключевые слова: молодежь, социальная политика, социальные условия, ЕС-27.
Bulletin of Taras Shevchenko National University of Kyiv. Economics, 2018; 3(198): 87-94 УДК 336.743 JEL classification: G20, G24 DOI: https://doi.org/10.17721/1728-2667.2018/198-3/11
M. Turkes, PhD in Economics, Lecturer, L. Constantinescu, PhD in Economics, Associate Professor
Dimitrie Cantemir Christian University of Bucharest, Bucharest, Romania, D. Topor, PhD in Economics, Lecturer
1 Decembrie 1918 University, Alba Iulia, Romania
COMPARATIVE ANALYSIS OF BANKING PERFORMANCE OF COMERCIAL BANKS GROUPS. CASE STUDY: TURKEY VS. ROMANIA
The purpose of this article is to present a comparative analysis of performance between two commercial bank groups from
Turkey and Romania. In conducting the study we have considered evaluating financial performance achieved by a group of commercial banks in Turkey and Romania in relation to the Eurozone during 1999–2016 and examine the level of liquidity of assets acquired during these 18 years of activity of these two banking groups, in comparison with the Eurozone. In this analysis there were tested three hypotheses based on the performance indicators used by the two banking trade groups and the indicators used in the specialty literature. Results and interpretations from this study/ testing were presented and interpreted, in the case of these two banking trade groups. The article ends with the authors' conclusions related to comparative analysis of bank performance between the two commercial bank groups in Turkey and Romania.
Keywords. Commercial banks, banking performance, Turkey, Romania, Eurozone, ANOVA
Introduction. Recent developments in the euro area banks, which have played an important role in the allocation and global liquidity intermediation, are closely monitored by the international financial markets. The most important concern for Eurozone banks is the low rates of return and this problem, if it persists, has the potential to adversely affect their ability of intermediation. The competition that comes from the state banks and the very slow pace of involvement of the Banking Regulation and Supervision Agencies suffocate the performance of private banks and increase the likelihood of a banking crisis. So far, the banking sector sustained the prosperity of the countries that find themselves in growth and development, but increasing the role of state banks, weakens the private banks and therefore prevented private consumption. The main objectives of the study were: (a) Evaluation of financial performance achieved by groups of commercial banks in Turkey and Romania in relation to the Eurozone during the period 1999–2016; (b) Examination of the liquidity level of assets acquired during the 18 years of activity of the two banking groups compared with the Eurozone; (c) The existence of significant differences in profitability between the two groups of commercial banks (Turkey vs. Romania). In this study they were tested three hypotheses: Ho1: There is no significant difference between the two banking groups ROA; Ho2: There is no significant difference between the two banking groups ROE; Ho3: There is no significant difference between the two banking groups NIM.
Literature review. Evaluating the financial perfor-mance of banks in European countries was carried out in the detailed research done by many specialists from Greece [19, 18, 2, 27], Czech Republic [15], Switzerland [10], Germany [12], Romania [22, 4], Great Britain [11]. Analyzing the main performance indicators of the first Romanian banks we found that in 2003–2007, the Romanian banking system registered a level of ROE slightly above the average of European Union countries, lower than the one in the former communist countries, but above countries that have a developed banking system. Also we have observed a downward trend in this indicator due to increased competition in the banking system and reduce inflation, which led to lower interest rates and thus revenue banks. Although there has been a significant drop in 2003–2007, the rate of return on assets of the Romanian banking system remains much higher than the average banking systems in the European Union, almost equal to the level recorded in other former communist countries [3].
In Asian countries, assessing financial performance of banks was carried out by specialists such as the ones above mentioned, from Turkey [1], and from Pakistan [17], Malay-sia [25, 23]. With the help of financial ratios, the relative per-formance of Islamic banks varies being influenced by the conventional financial indicators measured. Some specialists have found that, on average, six Islamic banks in Bahrain are as good as 15 homologous conventional parts in terms of liquidity and profitability, and even present a performance of lending better, using the financial indicators after the war Gulf 1991–2001 [26]. Moreover, Islamic banks found them-
© Türkeş M., Constantinescu L., Topor D., 2018
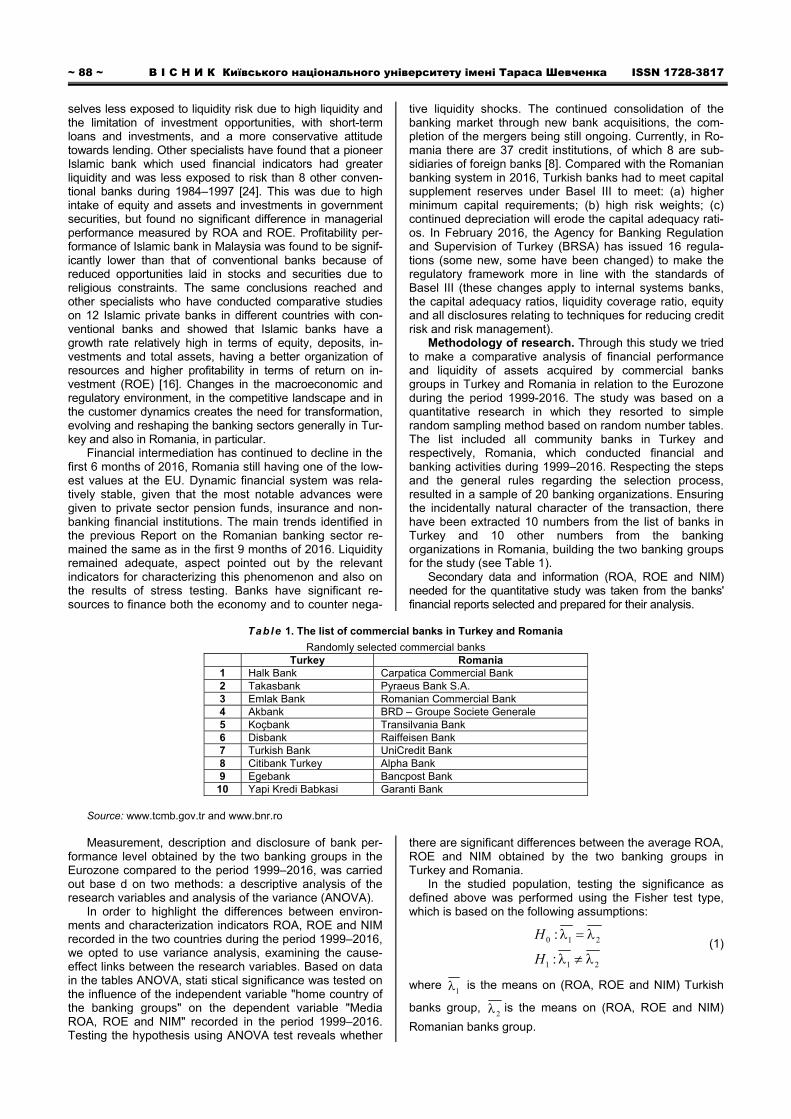
~ 88 ~ В І С Н И К Київського національного університету імені Тараса Шевченка ISSN 1728-3817 selves less exposed to liquidity risk due to high liquidity and the limitation of investment opportunities, with short-term loans and investments, and a more conservative attitude towards lending. Other specialists have found that a pioneer Islamic bank which used financial indicators had greater liquidity and was less exposed to risk than 8 other conven-tional banks during 1984–1997 [24]. This was due to high intake of equity and assets and investments in government securities, but found no significant difference in managerial performance measured by ROA and ROE. Profitability per-formance of Islamic bank in Malaysia was found to be signif-icantly lower than that of conventional banks because of reduced opportunities laid in stocks and securities due to religious constraints. The same conclusions reached and other specialists who have conducted comparative studies on 12 Islamic private banks in different countries with con-ventional banks and showed that Islamic banks have a growth rate relatively high in terms of equity, deposits, in-vestments and total assets, having a better organization of resources and higher profitability in terms of return on in-vestment (ROE) [16]. Changes in the macroeconomic and regulatory environment, in the competitive landscape and in the customer dynamics creates the need for transformation, evolving and reshaping the banking sectors generally in Tur-key and also in Romania, in particular.
Financial intermediation has continued to decline in the first 6 months of 2016, Romania still having one of the low-est values at the EU. Dynamic financial system was rela-tively stable, given that the most notable advances were given to private sector pension funds, insurance and non-banking financial institutions. The main trends identified in the previous Report on the Romanian banking sector re-mained the same as in the first 9 months of 2016. Liquidity remained adequate, aspect pointed out by the relevant indicators for characterizing this phenomenon and also on the results of stress testing. Banks have significant re-sources to finance both the economy and to counter nega-
tive liquidity shocks. The continued consolidation of the banking market through new bank acquisitions, the com-pletion of the mergers being still ongoing. Currently, in Ro-mania there are 37 credit institutions, of which 8 are sub-sidiaries of foreign banks [8]. Compared with the Romanian banking system in 2016, Turkish banks had to meet capital supplement reserves under Basel III to meet: (a) higher minimum capital requirements; (b) high risk weights; (c) continued depreciation will erode the capital adequacy rati-os. In February 2016, the Agency for Banking Regulation and Supervision of Turkey (BRSA) has issued 16 regula-tions (some new, some have been changed) to make the regulatory framework more in line with the standards of Basel III (these changes apply to internal systems banks, the capital adequacy ratios, liquidity coverage ratio, equity and all disclosures relating to techniques for reducing credit risk and risk management).
Methodology of research. Through this study we tried to make a comparative analysis of financial performance and liquidity of assets acquired by commercial banks groups in Turkey and Romania in relation to the Eurozone during the period 1999-2016. The study was based on a quantitative research in which they resorted to simple random sampling method based on random number tables. The list included all community banks in Turkey and respectively, Romania, which conducted financial and banking activities during 1999–2016. Respecting the steps and the general rules regarding the selection process, resulted in a sample of 20 banking organizations. Ensuring the incidentally natural character of the transaction, there have been extracted 10 numbers from the list of banks in Turkey and 10 other numbers from the banking organizations in Romania, building the two banking groups for the study (see Table 1).
Secondary data and information (ROA, ROE and NIM) needed for the quantitative study was taken from the banks' financial reports selected and prepared for their analysis.
Table 1. The list of commercial banks in Turkey and Romania
Randomly selected commercial banks Turkey Romania
1 Halk Bank Carpatica Commercial Bank 2 Takasbank Pyraeus Bank S.A. 3 Emlak Bank Romanian Commercial Bank 4 Akbank BRD – Groupe Societe Generale 5 Koçbank Transilvania Bank 6 Disbank Raiffeisen Bank 7 Turkish Bank UniCredit Bank 8 Citibank Turkey Alpha Bank 9 Egebank Bancpost Bank
10 Yapi Kredi Babkasi Garanti Bank
Source: www.tcmb.gov.tr and www.bnr.ro
Measurement, description and disclosure of bank per-formance level obtained by the two banking groups in the Eurozone compared to the period 1999–2016, was carried out base d on two methods: a descriptive analysis of the research variables and analysis of the variance (ANOVA).
In order to highlight the differences between environ-ments and characterization indicators ROA, ROE and NIM recorded in the two countries during the period 1999–2016, we opted to use variance analysis, examining the cause-effect links between the research variables. Based on data in the tables ANOVA, stati stical significance was tested on the influence of the independent variable "home country of the banking groups" on the dependent variable "Media ROA, ROE and NIM" recorded in the period 1999–2016. Testing the hypothesis using ANOVA test reveals whether
there are significant differences between the average ROA, ROE and NIM obtained by the two banking groups in Turkey and Romania.
In the studied population, testing the significance as defined above was performed using the Fisher test type, which is based on the following assumptions:
0 1 2
1 1 2
:
:
H
H
(1)
where 1 is the means on (ROA, ROE and NIM) Turkish
banks group, 2 is the means on (ROA, ROE and NIM)
Romanian banks group.
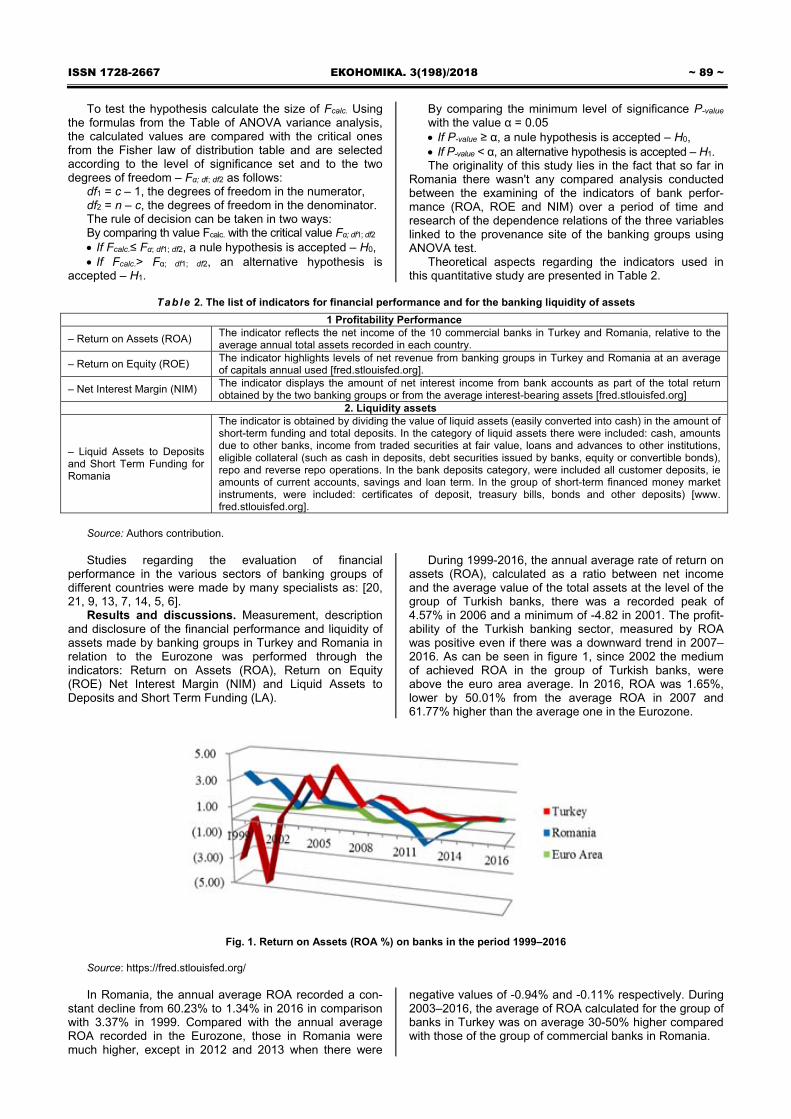
ISSN 1728-2667 ЕКОНОМІКА. 3(198)/2018 ~ 89 ~
To test the hypothesis calculate the size of Fcalc. Using the formulas from the Table of ANOVA variance analysis, the calculated values are compared with the critical ones from the Fisher law of distribution table and are selected according to the level of significance set and to the two degrees of freedom – Fα; df; df2 as follows:
df1 = c – 1, the degrees of freedom in the numerator, df2 = n – c, the degrees of freedom in the denominator. The rule of decision can be taken in two ways: By comparing th value Fcalc. with the critical value Fα; df1; df2 If Fcalc.≤ Fα; df1; df2, a nule hypothesis is accepted – H0, If Fcalc.> Fα; df1; df2, an alternative hypothesis is
accepted – H1.
By comparing the minimum level of significance P-value with the value α = 0.05 If P-value ≥ α, a nule hypothesis is accepted – H0, If P-value < α, an alternative hypothesis is accepted – H1. The originality of this study lies in the fact that so far in
Romania there wasn't any compared analysis conducted between the examining of the indicators of bank perfor-mance (ROA, ROE and NIM) over a period of time and research of the dependence relations of the three variables linked to the provenance site of the banking groups using ANOVA test.
Theoretical aspects regarding the indicators used in this quantitative study are presented in Table 2.
Table 2. The list of indicators for financial performance and for the banking liquidity of assets
1 Profitability Performance
– Return on Assets (ROA) The indicator reflects the net income of the 10 commercial banks in Turkey and Romania, relative to the average annual total assets recorded in each country.
– Return on Equity (ROE) The indicator highlights levels of net revenue from banking groups in Turkey and Romania at an average of capitals annual used [fred.stlouisfed.org].
– Net Interest Margin (NIM) The indicator displays the amount of net interest income from bank accounts as part of the total return obtained by the two banking groups or from the average interest-bearing assets [fred.stlouisfed.org]
2. Liquidity assets
– Liquid Assets to Deposits and Short Term Funding for Romania
The indicator is obtained by dividing the value of liquid assets (easily converted into cash) in the amount of short-term funding and total deposits. In the category of liquid assets there were included: cash, amounts due to other banks, income from traded securities at fair value, loans and advances to other institutions, eligible collateral (such as cash in deposits, debt securities issued by banks, equity or convertible bonds), repo and reverse repo operations. In the bank deposits category, were included all customer deposits, ie amounts of current accounts, savings and loan term. In the group of short-term financed money market instruments, were included: certificates of deposit, treasury bills, bonds and other deposits) [www. fred.stlouisfed.org].
Source: Authors contribution. Studies regarding the evaluation of financial
performance in the various sectors of banking groups of different countries were made by many specialists as: [20, 21, 9, 13, 7, 14, 5, 6].
Results and discussions. Measurement, description and disclosure of the financial performance and liquidity of assets made by banking groups in Turkey and Romania in relation to the Eurozone was performed through the indicators: Return on Assets (ROA), Return on Equity (ROE) Net Interest Margin (NIM) and Liquid Assets to Deposits and Short Term Funding (LA).
During 1999-2016, the annual average rate of return on assets (ROA), calculated as a ratio between net income and the average value of the total assets at the level of the group of Turkish banks, there was a recorded peak of 4.57% in 2006 and a minimum of -4.82 in 2001. The profit-ability of the Turkish banking sector, measured by ROA was positive even if there was a downward trend in 2007–2016. As can be seen in figure 1, since 2002 the medium of achieved ROA in the group of Turkish banks, were above the euro area average. In 2016, ROA was 1.65%, lower by 50.01% from the average ROA in 2007 and 61.77% higher than the average one in the Eurozone.
Fig. 1. Return on Assets (ROA %) on banks in the period 1999–2016 Source: https://fred.stlouisfed.org/ In Romania, the annual average ROA recorded a con-
stant decline from 60.23% to 1.34% in 2016 in comparison with 3.37% in 1999. Compared with the annual average ROA recorded in the Eurozone, those in Romania were much higher, except in 2012 and 2013 when there were
negative values of -0.94% and -0.11% respectively. During 2003–2016, the average of ROA calculated for the group of banks in Turkey was on average 30-50% higher compared with those of the group of commercial banks in Romania.

~ 90 ~ В І С Н И К Київського національного університету імені Тараса Шевченка ISSN 1728-3817
Table 3. Descriptive statistics results on ROA% 1999-2016
Turkey Romania Euro Area Mean 1.33 1.38 0.54 Standard Error 0.52 0.26 0.07 Standard Deviation 2.22 1.10 0.31 Sample Variance 4.92 1.20 0.09 Kurtosis 3.29 0.01 (1.41) Skewness (1.63) (0.20) 0.12 Range 9.39 4.31 0.94 Minimum (4.82) (0.94) 0.08 Maximum 4.57 3.37 1.02 Sum 23.94 24.89 9.77 Count 18 18 18
Source: Made by author.
The group of commercial banks in Turkey have achieved in the period under review an average ROA of 1.33% and a standard deviation of 0.52, while those in Romania have an average ROA of 1.38% and a higher standard deviation of 0.26. The highest annual average ROA in 2006 are recorded in Turkey (4.57%), in 1999 in Romania (3.37%) and in 2016 in the Eurozone (1.02%). The amplitude obtained by the group of banks in Romania (4.31) is half of the one obtained by the banks in Turkey (9.39), calculated as the difference between the maximum and minimum of the average ROA. Asymmetry index (Skewness) calculated for the group of banks in Turkey has negative value (-1.63), indicating an asymmetry to the left that departs significantly from the normal distribution form. The group of banks in Romania has an asymmetry index of 0.22 indicating a slight negative asymmetry to the left. In
the Eurozone there is a positively skewed to the right, due to positive Skewness index of 0.12. Boltirii indicators (Kur-tosis) for the group of banks in Turkey and Romania have positive values of 3.29 and 0.01 respectively showing a leptocurtik distribution, while Eurozone indicator has a val-ue of -1.41, indicating platicurtik distribution.
In the period 2006-2016, annual average ROE of the Group banks in Turkey have fluctuated, decreasing grad-ually from 28.43% in 2006 to 1.38% in 2013, but subse-quently increased to 13.79% in 2016. Despite the global crisis and the economic crisis in the Eurozone, banks in Turkey have maintained high levels of profitability. At the end of 2016, the group of banks in Romania recorded an average annual ROE of 12.06%, with 56.25% lower than that obtained in 2008 and 12.06% higher than the aver-age ROE in 2011.
Fig. 2. Return on Equity (ROE %) on banks in the period 1999–2016
Source: https://fred.stlouisfed.org/ In the same period, annual average ROE achieved in
the Eurozone fluctuated between 1.81% minimum and a maximum of 15.92%, ROE being rarely higher than the annual average of Turkey (1.38% in 2013) and of Romania (between -8.55% and 2.42% 2012–2014).
Overall, return on assets of the Turkish banking sector, as measured by annual averages, ROE was higher than that
of the commercial banks in Romania or in the major financial centers in Eastern Europe and the Eurozone. With a stand-ard deviation of 11.94 the bank group in Turkey had a dou-ble ROE risk than that of the commercial banks in Romania (St. Dev. – 8.07) and a triple one than the risk in the Euro-zone banks whose standard deviation were of only 4.49.
Table 4. Descriptive statistics results on ROE% 1999–2016
Turkey Romania Euro Area Mean 11.13 10.89 8.30 Standard Error 2.81 1.90 1.06 Median 11.99 12.66 7.59 Standard Deviation 11.94 8.07 4.49 Sample Variance 142.54 65.11 20.19 Kurtosis 2.05 0.56 (1.17) Skewness (0.83) (0.86) 0.25 Range 50.18 30.97 14.11 Minimum (21.13) (8.55) 1.81 Maximum 29.05 22.42 15.92 Sum 200.31 196.09 149.48 Count 18 18 18
Source: Made by author.

ISSN 1728-2667 ЕКОНОМІКА. 3(198)/2018 ~ 91 ~
Banks in Turkey and Romania have Skewness nega-tive indices of -0.83 and respectively, -0.86, developing a slight asymmetry to the left. Meanwhile, Eurozone bank group recorded an asymmetry index of 0.25, indicating a slightly positive asymmetry to the right of the ROE averag-es. Kurtosis negative indicator of -1.17 for the Eurozone, signals a platicurtik distribution, different than the normal one. Kurtosis indicators calculated for an annual average ROE for the banking groups in Turkey and Romania, have
obtained positive values of 2.05 and 0.56, drawing a lepto-curtik distribution.
Banks in Turkey recorded a maximum amplitude of 50.18, calculated as the difference between a maximum ROA of 29.05% achieved in 2004 and a minimum ROA of -21.13% in 2001. With reference to the situation in Turkey, banks in Romania obtained amplitude of less than 1.62 times and the Eurozone by 3.56 times.
Fig. 3. Net Interest Margin (NIM %) on banks in the period 1999–2016 Source: https://fred.stlouisfed.org/ In the context of implementing the Basel II standard
for credit risk assessment, the evaluation indicator of an-nual profitability assessed by the Net Interest Margin (NIM) in banks in Turkey, Romania and Eurozone has been positive during the period 1999–2016. Annual aver-ages pf NIM for the group of Turkish banks had a strongly fluctuating evolution, alternating between maximums of 12.11% in 2001 to minimums of 1.58% in 2005, above the average NIM in the Euro Area.
Although the profitability of Romanian banks, appreci-ated by NIM, continued to decrease from 6.32% in 2009 to 1.50% in 2016, it was still above the levels achieved by the commercial banks in Turkey and in the Eurozone. In Ro-mania, the banks present a greater risk to NIM indicator, having a standard deviation of 3.61, superior to those of Turkey (2.83) and of the "Eurozone" (0.33).
Table 5. Descriptive statistics results on NIM% 1999–2016
Turkey Romania Euro Area Mean 6.09 6.11 1.73 Standard Error 0.67 0.85 0.08 Median 5.49 5.60 1.72 Standard Deviation 2.83 3.61 0.33 Sample Variance 8.01 13.03 0.11 Kurtosis (0.25) 3.69 (1.44) Skewness 0.64 1.45 0.18 Range 10.53 15.35 0.96 Minimum 1.58 1.50 1.28 Maximum 12.11 16.85 2.24 Sum 109.59 109.93 31.22 Count 18 18 18
Source: Made by author.
The survey showed that banks in Turkey and Euro ar-
ea, achieved positive Skewness indices of 0.64 and of 0.18, developing a slightly positive asymmetry to the right. At the same time, commercial banks in Romania have achieved a Skewness index of 1.45, indicating a mismatch to the right that departs significantly from the normal distri-bution form. Kurtosis indicators for groups of banks in Tur-key and in the Eurozone took negative values of -0.25 and respectively, 1.44, indicating a platicurtik distribution, much more different from a normal one. Banks in Romania have
achieved a Kurtosis index of 3.69, showing a strong lepto-curtik distribution (curved vaulted more than normal).
Liquid Assets to Deposits and Short Term Funding (LA), registered by the banks in Turkey had an average of 24.62%/year, lower by 32.73%/year in comparison with the one in the Eurozone and most notably, the one from Ro-mania- by 38.26%/year. In the period under review, the positive Skewness indices were 0.77 and respectively, 0.14, developing a slightly positive asymmetry to the right, similar to that of the Eurozone.

~ 92 ~ В І С Н И К Київського національного університету імені Тараса Шевченка ISSN 1728-3817
Table 5. Descriptive statistics results on LA% 1999–2016
Turkey Romania Euro Area Mean 24.62 38.26 32.73 Standard Error 3.16 5.01 0.83 Median 20.13 37.99 32.13 Standard Deviation 13.41 21.25 3.52 Sample Variance 179.76 451.39 12.40 Kurtosis (1.05) (1.69) (0.38) Skewness 0.77 0.14 0.37 Range 39.20 56.05 13.46 Minimum 10.13 12.75 26.71 Maximum 49.33 68.80 40.17 Sum 443.16 688.69 589.12 Count 18 18 18
Source: Made by author. Kurtosis indicators of banking groups are negative:
-1.05 -1.69 in Turkey and respectively, Romania, indicating a platicurtik distribution, different from the one in the Euro Area (see table 5). The analysis of annual averages of
distribution in the two countries and in the Euro Area was represented using the "box plot" chart type (see Figure 4).
Fig. 4. Box plot – Liquid Assets to Deposits and Short Term Funding in the period 1999–2016
Source: Made by author. According to the chart we can see that the on Romani-
an banking market, assets can be most easily converted into cash. At the opposite pole lies Eurozone, where assets become liquidities much harder. This is due to the acceler-ated growth of incomes from interest and due to the com-missions granted to individual customers and organiza-tions, the income from trading securities or the income from repurchase agreements (repo), in relation to the incomes from the placement of deposits, savings accounts or selling money market instruments.
Results of statistic testing Testing the H01 Hypothesis: There is no significant
difference of ROA between the two banking groups.
In the second part of the research we proceeded to test the significant differences on the level of profitability meas-ured by ROA, ROE and NIM registered in the period of 1999–2016, by the groups of commercial banks in Turkey and Romania. Analysis of variance (ANOVA) for the de-pendent variables – ROA, ROE and NIM is presented in Tables 6, 7 and 8. If the dependent variable Return on As-sets (ROA), size Fcalc=0.008 (Levene statistics) is less than the critical value F0.05;1;34 = 4.13, thus accepting the null hypothesis that averages of ROA achieved at the level of the two banking groups are not so different. Analyzing the level of minimum significance P-value (0.928) of Table 6, we can observe that it is higher than α = 0.05, so the null hypothesis H0, is accepted.
Table 6. ANOVA-ROA
Source of variation SS df MS F P-value F crit Between Groups 0.03 1 0.03 0.008 0.928 4.130 Within Groups 104.17 34 3.06
Total 104.19 35
Source: Made by author.
Testing the H02 Hypothesis: There is no significant diference of ROE between the two banking groups
In the case of the variable Return on Equity (ROE), Fcalc
= 0.005<F0.05;1;34 = 4.13 and P-value < α = 0.05=0.94, so it supports the null hypothesis H0, therefore the independent
variable "country " doesn't have any significant influence on the dependent variable "ROE averages" obtained by the banking groups in Turkey and Romania for the period of 1999–2016.
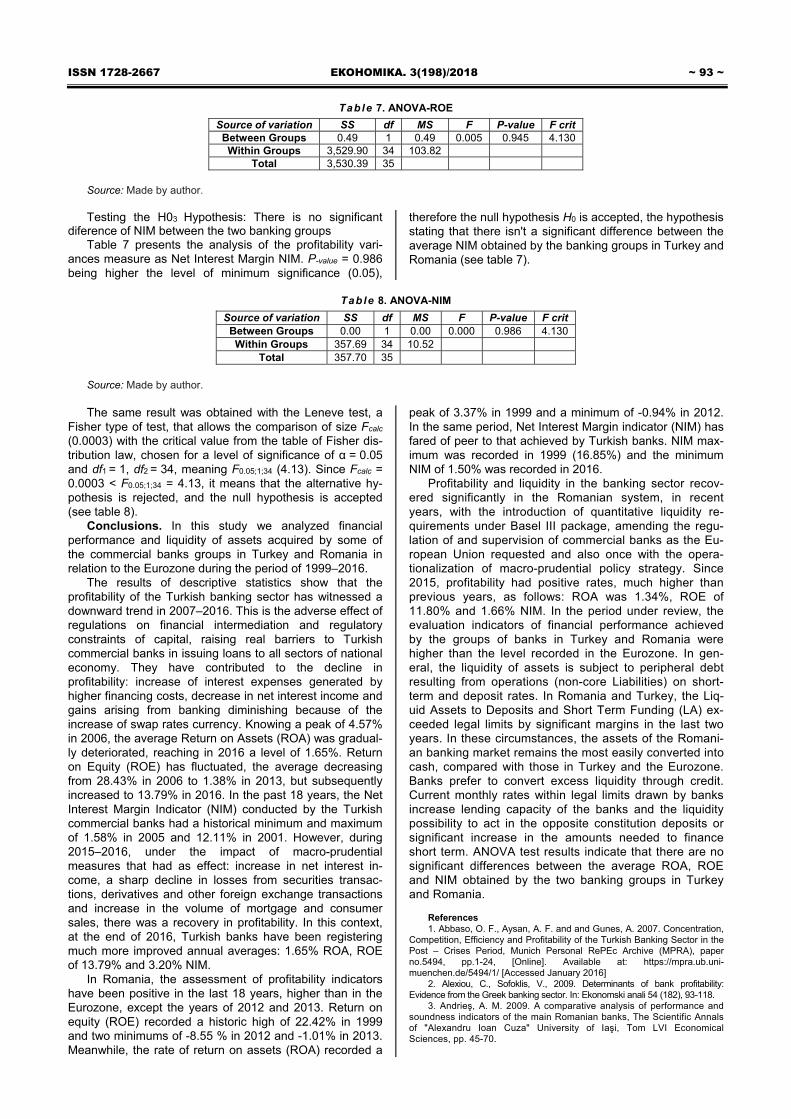
ISSN 1728-2667 ЕКОНОМІКА. 3(198)/2018 ~ 93 ~
Table 7. ANOVA-ROE
Source of variation SS df MS F P-value F crit Between Groups 0.49 1 0.49 0.005 0.945 4.130 Within Groups 3,529.90 34 103.82
Total 3,530.39 35
Source: Made by author.
Testing the H03 Hypothesis: There is no significant diference of NIM between the two banking groups
Table 7 presents the analysis of the profitability vari-ances measure as Net Interest Margin NIM. P-value = 0.986 being higher the level of minimum significance (0.05),
therefore the null hypothesis H0 is accepted, the hypothesis stating that there isn't a significant difference between the average NIM obtained by the banking groups in Turkey and Romania (see table 7).
Table 8. ANOVA-NIM
Source of variation SS df MS F P-value F crit Between Groups 0.00 1 0.00 0.000 0.986 4.130 Within Groups 357.69 34 10.52
Total 357.70 35
Source: Made by author. The same result was obtained with the Leneve test, a
Fisher type of test, that allows the comparison of size Fcalc (0.0003) with the critical value from the table of Fisher dis-tribution law, chosen for a level of significance of α = 0.05 and df1 = 1, df2 = 34, meaning F0.05;1;34 (4.13). Since Fcalc = 0.0003 < F0.05;1;34 = 4.13, it means that the alternative hy-pothesis is rejected, and the null hypothesis is accepted (see table 8).
Conclusions. In this study we analyzed financial performance and liquidity of assets acquired by some of the commercial banks groups in Turkey and Romania in relation to the Eurozone during the period of 1999–2016.
The results of descriptive statistics show that the profitability of the Turkish banking sector has witnessed a downward trend in 2007–2016. This is the adverse effect of regulations on financial intermediation and regulatory constraints of capital, raising real barriers to Turkish commercial banks in issuing loans to all sectors of national economy. They have contributed to the decline in profitability: increase of interest expenses generated by higher financing costs, decrease in net interest income and gains arising from banking diminishing because of the increase of swap rates currency. Knowing a peak of 4.57% in 2006, the average Return on Assets (ROA) was gradual-ly deteriorated, reaching in 2016 a level of 1.65%. Return on Equity (ROE) has fluctuated, the average decreasing from 28.43% in 2006 to 1.38% in 2013, but subsequently increased to 13.79% in 2016. In the past 18 years, the Net Interest Margin Indicator (NIM) conducted by the Turkish commercial banks had a historical minimum and maximum of 1.58% in 2005 and 12.11% in 2001. However, during 2015–2016, under the impact of macro-prudential measures that had as effect: increase in net interest in-come, a sharp decline in losses from securities transac-tions, derivatives and other foreign exchange transactions and increase in the volume of mortgage and consumer sales, there was a recovery in profitability. In this context, at the end of 2016, Turkish banks have been registering much more improved annual averages: 1.65% ROA, ROE of 13.79% and 3.20% NIM.
In Romania, the assessment of profitability indicators have been positive in the last 18 years, higher than in the Eurozone, except the years of 2012 and 2013. Return on equity (ROE) recorded a historic high of 22.42% in 1999 and two minimums of -8.55 % in 2012 and -1.01% in 2013. Meanwhile, the rate of return on assets (ROA) recorded a
peak of 3.37% in 1999 and a minimum of -0.94% in 2012. In the same period, Net Interest Margin indicator (NIM) has fared of peer to that achieved by Turkish banks. NIM max-imum was recorded in 1999 (16.85%) and the minimum NIM of 1.50% was recorded in 2016.
Profitability and liquidity in the banking sector recov-ered significantly in the Romanian system, in recent years, with the introduction of quantitative liquidity re-quirements under Basel III package, amending the regu-lation of and supervision of commercial banks as the Eu-ropean Union requested and also once with the opera-tionalization of macro-prudential policy strategy. Since 2015, profitability had positive rates, much higher than previous years, as follows: ROA was 1.34%, ROE of 11.80% and 1.66% NIM. In the period under review, the evaluation indicators of financial performance achieved by the groups of banks in Turkey and Romania were higher than the level recorded in the Eurozone. In gen-eral, the liquidity of assets is subject to peripheral debt resulting from operations (non-core Liabilities) on short-term and deposit rates. In Romania and Turkey, the Liq-uid Assets to Deposits and Short Term Funding (LA) ex-ceeded legal limits by significant margins in the last two years. In these circumstances, the assets of the Romani-an banking market remains the most easily converted into cash, compared with those in Turkey and the Eurozone. Banks prefer to convert excess liquidity through credit. Current monthly rates within legal limits drawn by banks increase lending capacity of the banks and the liquidity possibility to act in the opposite constitution deposits or significant increase in the amounts needed to finance short term. ANOVA test results indicate that there are no significant differences between the average ROA, ROE and NIM obtained by the two banking groups in Turkey and Romania.
References 1. Abbaso, O. F., Aysan, A. F. and and Gunes, A. 2007. Concentration,
Competition, Efficiency and Profitability of the Turkish Banking Sector in the Post – Crises Period, Munich Personal RePEc Archive (MPRA), paper no.5494, pp.1-24, [Online]. Available at: https://mpra.ub.uni-muenchen.de/5494/1/ [Accessed January 2016]
2. Alexiou, C., Sofoklis, V., 2009. Determinants of bank profitability: Evidence from the Greek banking sector. In: Ekonomski anali 54 (182), 93-118.
3. Andrieş, A. M. 2009. A comparative analysis of performance and soundness indicators of the main Romanian banks, The Scientific Annals of "Alexandru Ioan Cuza" University of Iaşi, Tom LVI Economical Sciences, pp. 45-70.
~ 94 ~ В І С Н И К Київського національного університету імені Тараса Шевченка ISSN 1728-3817
4. Andrieş, A. M., Cocriş, V., 2010. A Comparative Analysis of the Efficiency of Romanian Banks, Romanian Journal of Economic Forecasting 13,54-75.
5. Athanasoglou, P. P., Brissimis, S. N., Delis, M. D., 2005. Bank-Specific, Industry-Specific and Macroeconomic Determinants of Bank Profitability, Bank of Greece, Working Paper No. 25.
6. Athanasoglou, P. P., Delis, M. D., Staikouras, C. K., 2006. Determinants of Bank Profitability in the South Eastern European Region, Bank of Greece, Working Paper No. 47.
7. Bashir A., 2000. Assessing the Performance of Islamic Banks: Some Evidence from the Middle East, Paper presented at the ERF 8th meeting in Jordan.
8. NBR, 2016. Report on financial stability- december 2016, Year I, no. 2, pp. 56-57.
9. Demerguç-Kunt, A, Huizinga, H., 2001. Financial Structure and Bank Profitability, in "Financial Structure and Economic Growth: A Cross-Country Comparison of Banks, Markets, and Development". In: Demirguc-Kunt, A., Levine, R. (Eds.). MIT Press, Cambridge.
10. Dietrich, A., Wanzenried, G., (2009). What Determines the Profitability of Commercial Banks? New Evidence from Switzerland. 12th Conference of the Swiss Society for Financial Market Researches, Geneva.
11. Ekpu, V. and Paloni, A. 2015. Financialisation, Business Lending and Profitability in the UK, Adam Smith Business School, University of Glasgow, Glasgow UK, pp.1-22, [Online]. Available at: http://www.gla.ac.uk/ media/media_424705_en.pdf, [Accessed January 2016]
12. Gischer, H. and Richter, T., 2009. Performancemessung von Banken im internationalen Vergleich, Wirtschaftswissenschaftliches Studium (WiSt), Vol 38(11), 565 [Online]. Available at: http://www.vwlgeld.ovgu.de/ vwlgeld_media/downloads/publikationen/ Gischer_Richter_WiSt_2009.pdf, [Accessed january 2016]
13. Goddard, J., Molyneux, P., Wilson, J., 2004. Dynamics of Growth and Profitability in Banking, Journal of Money, Credit and Banking 36(3),1069-1090.
14. Hassan, M. K., Bashir, A., 2003. Determinants of Islamic Banking Profitability. Paper Presented at the Proceedings of the Economic Research Forum 10th Annual Conference, Marakesh-Morocco.
15. Horvath, R., 2009. The Determinants of the Interest Rate Margins of Czech Banks, Czech Journal of Economics and Finance 59(2), 128-136.
16. Iqbal, M. and Molyneux, Ph. 2005. Thirty Years ofIslamic Banking: History, Performance and Prospects. New York: Palgrave Macmillan.
17. Khan, H. M. I., Khan, I., Khan, M. S., Jan, R. U., Khattak, R. and Naveed, K., 2015. Profitability and Efficiency of Foreign and Domestic Banks: A Case Study of Pakistan, European Journal of Business of Management, 7(7), pp. 34-48.
18. Kosmidou, K., 2008. The Determinants of Banks' Profits in Greece during the Period of EU Financial Integration, Managerial Finance 34, 146-159.
19. Mamatzakis, E. C., Remoundos, P. C., 2003. Determinants of Greek Commercial Banks Profitability, 1989 – 2000. SPOUDAI 53(1), 94-94
20. Molyneux, P., Thorton, J., 1992. Determinants of European Bank Profitability; A Note. Journal of Banking and Finance 16, pp. 1173-78.
21. Molyneux, P., Forbes, W. 1995. Market Structure and Performance in European Banking, Applied Economics 27(2): 155-159
22. Nitoi M. (2009). Efficiency in the Romanian Banking System: An Application of Data Envelopment Analysis, Romanian Journal of Economics, vol. 29, issue 2(38), pp. 162-176
23. Ramlan, H. and Adnan, M. S., 2016. The Profitability of Islamic and Conventional Bank: Case Study in Malaysia, Procedia Economics and Finance, vol. 35 pp. 359–367.
24. Samad, A., and Hassan M. K. 1999. The Performance of Malaysian Islamic Bank During1984-1997: An Exploratory Study. International Journal of Islamic Financial Services 1, no. 3.
25. Samad, A., 2000. Islamic banking and finance in theory and practice: The experience of Malaysia and Bahrain. The American Journal of Islamic Social Sciences 22(2), 69-86.
26. Samad, A., 2004. Performance of Interest-Free Islamic Banks Vis-a-Vis Interest-BasedConventional Banks of Bahrain. IIUM Journal of Economics and Management 12, no. 2: 115-29.
27. Staikouras, C. and Steliaros, M., 1999. Determinants Factors of Profitability of the Greek Banking System. Journal of the Banking Association of Greece, 19(20), 61-66.
R e c e i ve d : 03 / 0 1 / 20 18 1 s t Re v i s i o n : 1 4 / 03 / 20 1 8
Ac c e p t e d : 21 / 0 5 / 20 18 Author's declaration on the sources of funding of research
presented in the scientific article or of the preparation of the scientific article: budget of university's scientific project
М. Тюркеш, канд. екон. наук, Л. Константинеску, канд. екон. наук, доц. Християнський університет імені Димитрі Кантеміра, Бухарест, Румунія, Д. Топор, канд. екон. наук Університет імені 1 грудня 1918 року, Альба Юлія, Румунія
ПОРІВНЯЛЬНИЙ АНАЛІЗ РЕАЛІЗАЦІЇ КОМЕРЦІЙНИХ БАНКІВСЬКИХ ГРУП: ТУРЕЧЧИНА ТА РУМУНІЯ
Представлено порівняльний аналіз ефективності двох комерційних банківських груп із Туреччини та Румунії. Під час проведення дослідження розглянуто фінансову ефективність, досягнуту групою комерційних банків Туреччини та Румунії порівняно з єврозоною протягом 1999–2016 рр. Вивчено рівень ліквідності активів, придбаних протягом 18 років діяльності цих двох банківських груп, порівняно з єврозоною. В аналізі були перевірені три гіпотези на основі показників ефективності, які використовуються двома групами банківської торгівлі, та індикатори, що використовуються у спеціальній літературі. Результати і тлумачення цього дослідження / тестування були представлені та інтерпретовані відносно цих двох банківських торговельних груп. Наведено висновки авторів щодо порівняльного аналізу діяльності двох груп комерційних банків Туреччини та Румунії.
Ключові слова. Комерційні банки, банківська діяльність, Туреччина, Румунія, Єврозони, ANOVA. М. Тюркеш, канд. экон. наук, Л. Константинеску, канд. экон. наук, доц. Христианский университет имени Димитри Кантемира, Бухарест, Румыния, Д. Топор, канд. экон. наук Университет имени 1 декабря 1918 года, Альба Юлия, Румыния
СРАВНИТЕЛЬНЫЙ АНАЛИЗ РЕАЛИЗАЦИИ КОММЕРЧЕСКИХ БАНКОВСКИХ ГРУПП: ТУРЦИЯ И РУМЫНИЯ
Представлен сравнительный анализ эффективности двух коммерческих банковских групп из Турции и Румынии. При проведении исследования рассмотрена финансовая эффективность, достигнутая группой коммерческих банков Турции и Румынии в сравнении с еврозоной в течение 1999–2016 гг. Изучен уровень ликвидности активов, приобретенных в течение 18 лет деятельности этих двух банковских групп, по сравнению с еврозоной. В анализе проверены три гипотезы на основе показателей эффективности, используемых двумя группами банковской торговли, и индикаторы, использемые в специальной литературе. Результаты и толкования этого исследования / тестирования были представлены и интерпретированы в случае двух банковских торговых групп. В заключительной части представлены выводы сравнительного анализа деятельности двух групп коммерческих банков Турции и Румынии.
Ключевые слова. Коммерческие банки, банковская деятельность, Турция, Румыния, Еврозоны, ANOVA.

ISSN 1728-2667 ЕКОНОМІКА. 3(198)/2018 ~ 95 ~
Bulletin of Taras Shevchenko National University of Kyiv. Economics, 2018; 3(198): 95-100 УДК 336.717.18 JEL classification: D53, G39 DOI: https://doi.org/10.17721/1728-2667.2018/198-3/12
D. Vasiu, Doctor of Sciences (Economics), Assistant, L. Ilie, Doctor of Sciences (Economics), Professor
Lucian Blaga University of Sibiu, Sibiu, Romania
CORRELATIONS BETWEEN FINANCIAL PERFORMANCE INDICATORS OF COMPANIES WITH CORE ACTIVITY IN THE ENERGY SECTOR AND RELATED INDUSTRIES,
TRADED ON BUCHAREST STOCK EXCHANGE, AND THE BET-NG INDEX The results we obtained are invalidating the research hypothesis: there is a strong and direct link between the evolution of
BET-NG index and the financial performance ratios of the component companies. The analysis performed on the correlations between the evolution of BET-NG index and financial performance ratios indicates
that in the majority of the cases the links are inverse and in 25% of the cases they are strong. In what concerns the intensity of the correlations between the major financial performance ratios (ROA; ROE; EPS; Net
Margin) and average values of BET-NG index, there is no strong link to justify the identification of a regression model. Consequently, we can affirm that the evolution of BET-NG index is determined by other factors, different than the financial performance of the component companies. This situation outlines new research developments that need extending the timeframe and the financial ratios used.
Key words: BET-NG INDEX, Financial Performance Indicators, Bucharest Stock Exchange. Introduction. Stock indices reflect the stock price
evolution of the most traded companies on the Stock Exchange, or of some representative industries like the financial sector or the energy sector [15].
In a previous research [14, p. 357] we analyzed the correlation between the main indicators of financial performance and the BET Index, for the companies participating in the BET Index, in the period 2011–2015. The analysis identified a strong correlation between EPS and BET Index, BET variation being explained in a proportion of 75% of the independent variable EPS. Between ROA, ROE and BET index, a weaker and reverse link has been found. This situation could be explained by the fact that EPS is used most frequently by investors when evaluating a security, being easier and faster to calculate, comparing with ROA and ROE.
Taking into account the obtained results, the aim of this paper is to continue the research, this time analyzing the correlation between the main indicators of financial performance for companies with core activity in the energy sector and related industries, traded on Bucharest Stock Exchange, and the BET-NG index.
Stock indices. Stock indices are synthetic products which are expressing the evolution of security prices in a particular market [1, p. 497], and represent the average price of all securities or of the representative ones that are listed on the stock exchange [11, p. 219]. They were developed to have a financial product that is reflecting the evolution of the market not only the evolution of a particular security.
Representing the numerical expression of the trends of the most representative titles in a market, measured in points, stock indices can be considered a mirror, reflecting the evolution of the reference market as a whole [3, p. 160].
Any investor in equity securities is interested to have a general idea of how the overall equity market performs, to guide their actions and to act as a benchmark against which to judge the performance of the securities they invest in [4, p. 332]. This role is played by the stock index. Investors are encouraged to invest if the stock index is moving upward and are encouraged to liquidate their holdings and invest in money market assets or funds when the sock index has a downward trend.[4, p. 333]
The first stock index, Dow Jones Industrial Average, was developed in 1896 at New York Stock Exchange, followed by the British index – FTSE 30, and the Japanese one – Nikkei. Along with many others, these first
generation indices were having a limited information capacity due to the fact that in their structure there were shares of companies belonging to the same industries.
The second generation of indices was a step forward for better characterizing the stock market by including more stocks from a variety of industries. These indices, named composite indices, provide more information about the stock market and are more relevant.
The diversity of stock indices is in close connection with the diversity of stock market products. They evolved from indices build based on one security (shares) or for one single market to indices that take into account different securities and are European or even global.
The stock indices are the most synthetic indicators of an economy since most of the representative companies in the respective economies are listed on the stock exchange [3, p. 160]. Representativeness for the stock exchange is ensured by the way the securities quoted on the stock exchange are included in the composition of the stock index, the quotations being in real time. Stock indices can be build based on the quoted securities or based only on the most active and representative ones. The securities can have equal weights in the stock index, or different weights based on the stock price or on the market capitalization.
There are several studies that analyze the correlation between the financial performance of the entities and the stock returns, respectively the value of the indexes to which they belong.
On the Romanian stock market, Tudor [13, p. 73] conducted an earlier research regarding the relationship between firm-specific ratios and stock returns. The results, calculated for the period 2002 to 2008, indicates that the variation in stock returns is determined mostly by size and E/P ratio. In the same time, ROA and ROE have little impact on returns.
The correlations between financial performance of companies and stock returns, in case of Oil and Gas Sector in Pakistan have been studied by Saleh [7, p.30]. Despite study limitations, highlighted by author, the study showed that in Pakistan's Oil and Gas sector, stock returns are significantly influenced by net profit margin, return on assets and return on equity, but also the fact that there are other factors that influence this relationship.
A highly influence on the stock prices in case of in Colombo Stock Exchange has been determined by Sujeewa
© Vasiu D., Ilie L., 2018

~ 96 ~ В І С Н И К Київського національного університету імені Тараса Шевченка ISSN 1728-3817 Kodithuwakku [6, p. 76] as due Earnings per Share, Dividend per Share, and Net Asset Value per Share.
In case of Pakistan, Khan [5, p. 171] analysis the effect of dividends on stock prices, during 2001–2010 for 29 companies which were listed at KSE-100 Index. A significant positive relation to stock market prices was registered in case of Stock Dividend, Earnings per Share and Profit after Tax, while Retention Ratio and Return on Equity have the negative insignificant relation with stock prices in case of chemical and pharmaceutical sector of Pakistan.
An analysis of the factors affecting stock price in case of he Case of Bahrain Stock Exchange was performed by Taimur [12, p. 207], the results indicating return on equity, book value per share, dividend per share, dividend yield, price earnings, and firm size as significantly determinanting the share prices.
Studies regarding the determinants of share price had been performed by Sharma [9, p. 58] in case of India, finding that earning per share, dividend per share and book value per share has significant impact on the market price
of share. Furthermore, dividend per share and earnings per share were identified as having the strongest determinants of market price.
Sattam Allahawiah [8, p. 241] analysis the Amman Stock Exchange and the factors which influences on share prices in the Bahrain market. Research has revealed that a significant influence was registred in case of return on equity, dividend yield, dividend per share, book value per share, price earnings and firm size.
In case of Romania, [10, p. 86] studied the correlations between BET-FI index and six companies forming the index, using a dynamic conditional correlation, during 2011–2016. The results indicate a high volatility. Almost all pairs correlations calculated between constituents recorded a downward trend, which means that components are becoming more independent.
The BET-NG index [15] was launched on July 1st, 2008. It is a sectorial index and reflects the evolution of the quoted companies on Bucharest Stock Exchange with core activities in the energy or utilities related industries. The index is composed based on 11 companies:
Table 1. The structure of BET-NG Index
Symbol Company Percentage (%) SNP OMV PETROM S.A. 29,86 SNG S.N.G.N. ROMGAZ S.A. 23,24 EL SOCIETATEA ENERGETICA ELECTRICA S.A. 16,29
TGN S.N.T.G.N. TRANSGAZ S.A. 14,76 TEL C.N.T.E.E. TRANSELECTRICA 7,59
COTE CONPET SA 3,54 SNN S.N. NUCLEARELECTRICA S.A. 2,64 RRC ROMPETROL RAFINARE S.A. 1,54 OIL OIL TERMINAL S.A. 0,36 PTR ROMPETROL WELL SERVICES S.A. 0,17 PEI PETROLEXPORTIMPORT S.A. 0,01
Source: www.bvb.ro
Out of the 11 companies, six (S.N.T.G.N. Transgaz
S.A, C.N.T.E.E. Transelectrica, Rompetrol Rafinare S.A., Oil Terminal S.A, Rompetrol Well Services, Petrolexportimport S.A) are in the index from the beginning in 2008.The highest weight of a company in the index is 30%. The weight of each security is determined based on the market capitalization adjusted by the free float factor and the representativeness. The calculation methodology allows the BET-NG index to be an underlying asset for derivatives and structured products.
According to BSE statistics [18], 5-year historical performance on June 30, 2016 indicates a decrease of 27.3% in the value of BET-NG index, as compared to January 2011. In addition, five of the companies participating in the BET Index are among the 10 most traded companies on Bucharest Stock Exchange (BSE), which means that they are recording higher financial performance.
In this context, the question is: How much of the BET-NG Index Value is determinate by the performance of component companies?
Methodology. In order to analyze the correlation between the BET-NG index and the financial performance of the companies that compose the index we used the financial statements and data available on www.bvb.ro and www.tradeville.eu.
For the homogeneity of the results, we considered the financial statements for the timeframe 2011–2015, when for the listed companies is compulsory to prepare the
financial statements based on national legal regulations (O. M. P. F. no. 1286/2012.) According to it, companies listed on a regulated market are required to apply IFRS in preparing individual financial statements. As a result, for the period 2012–2015 financial statements are consistent, being compiled according to a uniform methodology.
The average values of the BET-NG index were determined based on daily value over the period 2011–2015. The financial ratios Return on Total Assets (ROA),Return on Equity (ROE), Earnings per Share (EPS), Net Margin (NM) had been used, in order to evaluate the financial performance of the analyzed companies. They were computed as follows [2, p. 111]:
Net profit
Total assetsROA ; (1)
Net profit
EquityROE ; (2)
Net profit
Namber of shareson the marketEPS ; (3)
Net profit
TurnoverNM (4)
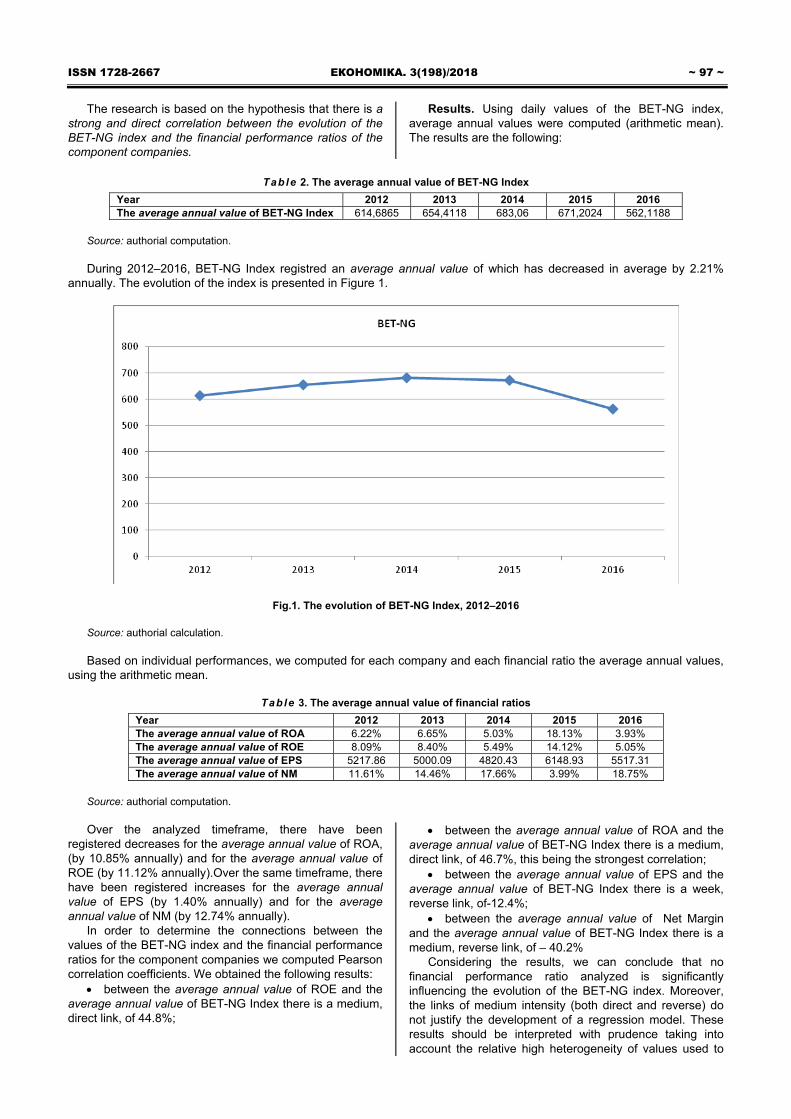
ISSN 1728-2667 ЕКОНОМІКА. 3(198)/2018 ~ 97 ~
The research is based on the hypothesis that there is a strong and direct correlation between the evolution of the BET-NG index and the financial performance ratios of the component companies.
Results. Using daily values of the BET-NG index, average annual values were computed (arithmetic mean). The results are the following:
Tab le 2. The average annual value of BET-NG Index
Year 2012 2013 2014 2015 2016 The average annual value of BET-NG Index 614,6865 654,4118 683,06 671,2024 562,1188
Source: authorial computation. During 2012–2016, BET-NG Index registred an average annual value of which has decreased in average by 2.21%
annually. The evolution of the index is presented in Figure 1.
Fig.1. The evolution of BET-NG Index, 2012–2016 Source: authorial calculation. Based on individual performances, we computed for each company and each financial ratio the average annual values,
using the arithmetic mean.
Table 3. The average annual value of financial ratios
Year 2012 2013 2014 2015 2016 The average annual value of ROA 6.22% 6.65% 5.03% 18.13% 3.93% The average annual value of ROE 8.09% 8.40% 5.49% 14.12% 5.05% The average annual value of EPS 5217.86 5000.09 4820.43 6148.93 5517.31 The average annual value of NM 11.61% 14.46% 17.66% 3.99% 18.75%
Source: authorial computation. Over the analyzed timeframe, there have been
registered decreases for the average annual value of ROA, (by 10.85% annually) and for the average annual value of ROE (by 11.12% annually).Over the same timeframe, there have been registered increases for the average annual value of EPS (by 1.40% annually) and for the average annual value of NM (by 12.74% annually).
In order to determine the connections between the values of the BET-NG index and the financial performance ratios for the component companies we computed Pearson correlation coefficients. We obtained the following results:
between the average annual value of ROE and the average annual value of BET-NG Index there is a medium, direct link, of 44.8%;
between the average annual value of ROA and the average annual value of BET-NG Index there is a medium, direct link, of 46.7%, this being the strongest correlation;
between the average annual value of EPS and the average annual value of BET-NG Index there is a week, reverse link, of-12.4%;
between the average annual value of Net Margin and the average annual value of BET-NG Index there is a medium, reverse link, of – 40.2%
Considering the results, we can conclude that no financial performance ratio analyzed is significantly influencing the evolution of the BET-NG index. Moreover, the links of medium intensity (both direct and reverse) do not justify the development of a regression model. These results should be interpreted with prudence taking into account the relative high heterogeneity of values used to
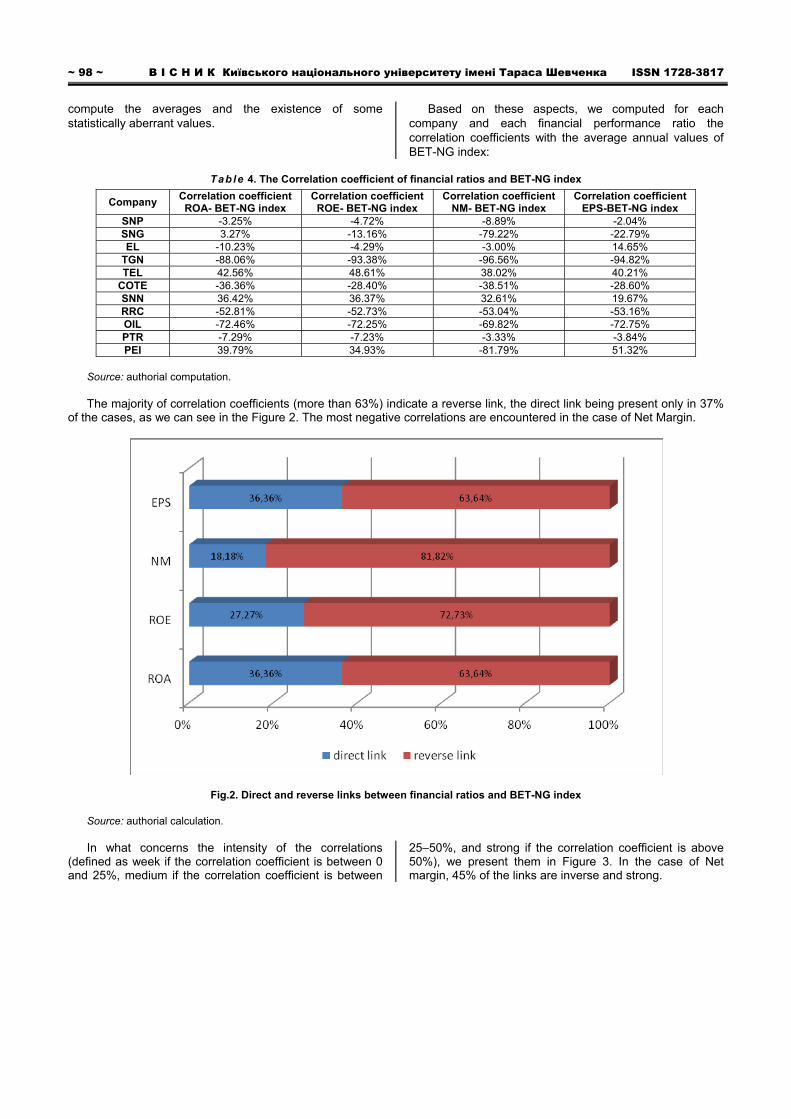
~ 98 ~ В І С Н И К Київського національного університету імені Тараса Шевченка ISSN 1728-3817 compute the averages and the existence of some statistically aberrant values.
Based on these aspects, we computed for each company and each financial performance ratio the correlation coefficients with the average annual values of BET-NG index:
Table 4. The Correlation coefficient of financial ratios and BET-NG index
Company Correlation coefficient ROA- BET-NG index
Correlation coefficient ROE- BET-NG index
Correlation coefficient NM- BET-NG index
Correlation coefficient EPS-BET-NG index
SNP -3.25% -4.72% -8.89% -2.04% SNG 3.27% -13.16% -79.22% -22.79% EL -10.23% -4.29% -3.00% 14.65%
TGN -88.06% -93.38% -96.56% -94.82% TEL 42.56% 48.61% 38.02% 40.21%
COTE -36.36% -28.40% -38.51% -28.60% SNN 36.42% 36.37% 32.61% 19.67% RRC -52.81% -52.73% -53.04% -53.16% OIL -72.46% -72.25% -69.82% -72.75% PTR -7.29% -7.23% -3.33% -3.84% PEI 39.79% 34.93% -81.79% 51.32%
Source: authorial computation. The majority of correlation coefficients (more than 63%) indicate a reverse link, the direct link being present only in 37%
of the cases, as we can see in the Figure 2. The most negative correlations are encountered in the case of Net Margin.
Fig.2. Direct and reverse links between financial ratios and BET-NG index
Source: authorial calculation. In what concerns the intensity of the correlations
(defined as week if the correlation coefficient is between 0 and 25%, medium if the correlation coefficient is between
25–50%, and strong if the correlation coefficient is above 50%), we present them in Figure 3. In the case of Net margin, 45% of the links are inverse and strong.
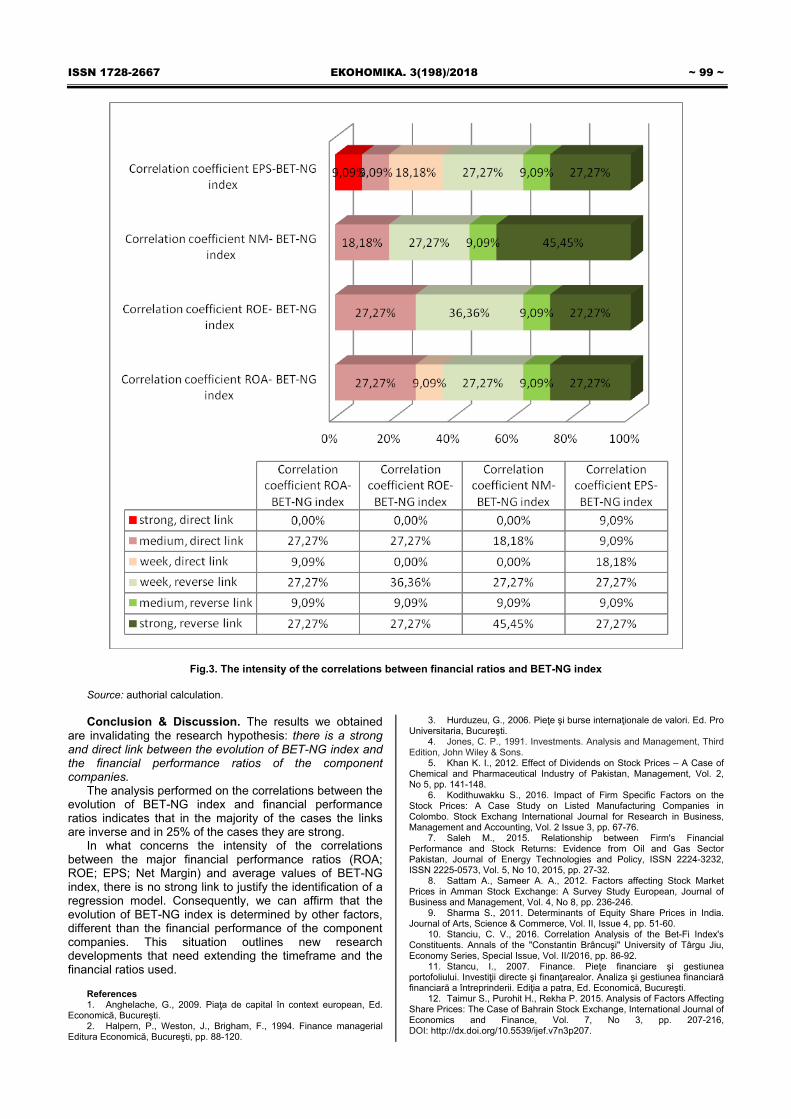
ISSN 1728-2667 ЕКОНОМІКА. 3(198)/2018 ~ 99 ~
Fig.3. The intensity of the correlations between financial ratios and BET-NG index
Source: authorial calculation. Conclusion & Discussion. The results we obtained
are invalidating the research hypothesis: there is a strong and direct link between the evolution of BET-NG index and the financial performance ratios of the component companies.
The analysis performed on the correlations between the evolution of BET-NG index and financial performance ratios indicates that in the majority of the cases the links are inverse and in 25% of the cases they are strong.
In what concerns the intensity of the correlations between the major financial performance ratios (ROA; ROE; EPS; Net Margin) and average values of BET-NG index, there is no strong link to justify the identification of a regression model. Consequently, we can affirm that the evolution of BET-NG index is determined by other factors, different than the financial performance of the component companies. This situation outlines new research developments that need extending the timeframe and the financial ratios used.
References 1. Anghelache, G., 2009. Piaţa de capital în context european, Ed.
Economică, Bucureşti. 2. Halpern, P., Weston, J., Brigham, F., 1994. Finance managerial
Editura Economică, Bucureşti, pp. 88-120.
3. Hurduzeu, G., 2006. Pieţe şi burse internaţionale de valori. Ed. Pro Universitaria, Bucureşti.
4. Jones, C. P., 1991. Investments. Analysis and Management, Third Edition, John Wiley & Sons.
5. Khan K. I., 2012. Effect of Dividends on Stock Prices – A Case of Chemical and Pharmaceutical Industry of Pakistan, Management, Vol. 2, No 5, pp. 141-148.
6. Kodithuwakku S., 2016. Impact of Firm Specific Factors on the Stock Prices: A Case Study on Listed Manufacturing Companies in Colombo. Stock Exchang International Journal for Research in Business, Management and Accounting, Vol. 2 Issue 3, pp. 67-76.
7. Saleh M., 2015. Relationship between Firm's Financial Performance and Stock Returns: Evidence from Oil and Gas Sector Pakistan, Journal of Energy Technologies and Policy, ISSN 2224-3232, ISSN 2225-0573, Vol. 5, No 10, 2015, pp. 27-32.
8. Sattam A., Sameer A. A., 2012. Factors affecting Stock Market Prices in Amman Stock Exchange: A Survey Study European, Journal of Business and Management, Vol. 4, No 8, pp. 236-246.
9. Sharma S., 2011. Determinants of Equity Share Prices in India. Journal of Arts, Science & Commerce, Vol. II, Issue 4, pp. 51-60.
10. Stanciu, C. V., 2016. Correlation Analysis of the Bet-Fi Index's Constituents. Annals of the "Constantin Brâncuşi" University of Târgu Jiu, Economy Series, Special Issue, Vol. II/2016, pp. 86-92.
11. Stancu, I., 2007. Finance. Pieţe financiare şi gestiunea portofoliului. Investiţii directe şi finanţarealor. Analiza şi gestiunea financiară financiară a întreprinderii. Ediţia a patra, Ed. Economică, Bucureşti.
12. Taimur S., Purohit H., Rekha P. 2015. Analysis of Factors Affecting Share Prices: The Case of Bahrain Stock Exchange, International Journal of Economics and Finance, Vol. 7, No 3, pp. 207-216, DOI: http://dx.doi.org/10.5539/ijef.v7n3p207.
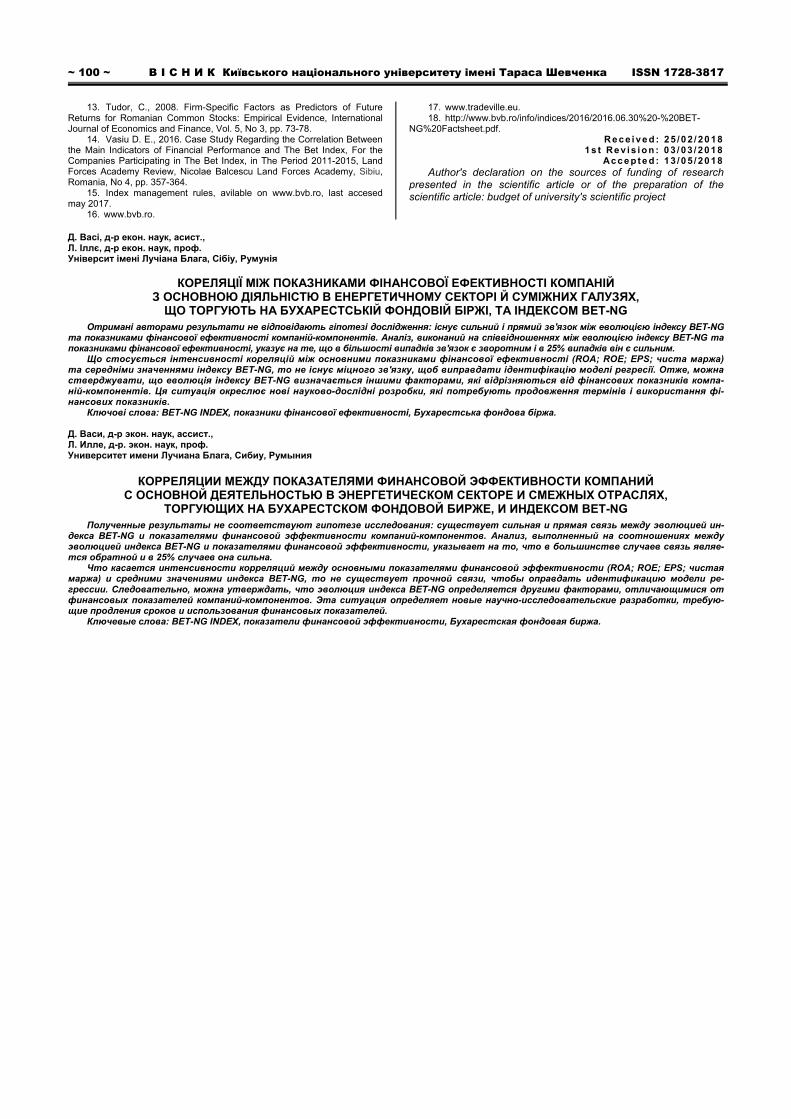
~ 100 ~ В І С Н И К Київського національного університету імені Тараса Шевченка ISSN 1728-3817
13. Tudor, C., 2008. Firm-Specific Factors as Predictors of Future Returns for Romanian Common Stocks: Empirical Evidence, International Journal of Economics and Finance, Vol. 5, No 3, pp. 73-78.
14. Vasiu D. E., 2016. Case Study Regarding the Correlation Between the Main Indicators of Financial Performance and The Bet Index, For the Companies Participating in The Bet Index, in The Period 2011-2015, Land Forces Academy Review, Nicolae Balcescu Land Forces Academy, Sibiu, Romania, No 4, pp. 357-364.
15. Index management rules, avilable on www.bvb.ro, last accesed may 2017.
16. www.bvb.ro.
17. www.tradeville.eu. 18. http://www.bvb.ro/info/indices/2016/2016.06.30%20-%20BET-
NG%20Factsheet.pdf. R e c e i ve d : 25 / 0 2 / 20 18
1 s t Re v i s i o n : 0 3 / 03 / 20 1 8 Ac c e p t e d : 13 / 0 5 / 20 18
Author's declaration on the sources of funding of research presented in the scientific article or of the preparation of the scientific article: budget of university's scientific project
Д. Васі, д-р екон. наук, асист., Л. Іллє, д-р екон. наук, проф. Університ імені Лучіана Блага, Сібіу, Румунія
КОРЕЛЯЦІЇ МІЖ ПОКАЗНИКАМИ ФІНАНСОВОЇ ЕФЕКТИВНОСТІ КОМПАНІЙ
З ОСНОВНОЮ ДІЯЛЬНІСТЮ В ЕНЕРГЕТИЧНОМУ СЕКТОРІ Й СУМІЖНИХ ГАЛУЗЯХ, ЩО ТОРГУЮТЬ НА БУХАРЕСТСЬКІЙ ФОНДОВІЙ БІРЖІ, ТА ІНДЕКСОМ BET-NG
Отримані авторами результати не відповідають гіпотезі дослідження: існує сильний і прямий зв'язок між еволюцією індексу BET-NG та показниками фінансової ефективності компаній-компонентів. Аналіз, виконаний на співвідношеннях між еволюцією індексу BET-NG та показниками фінансової ефективності, указує на те, що в більшості випадків зв'язок є зворотним і в 25% випадків він є сильним.
Що стосується інтенсивності кореляцій між основними показниками фінансової ефективності (ROA; ROE; EPS; чиста маржа) та середніми значеннями індексу BET-NG, то не існує міцного зв'язку, щоб виправдати ідентифікацію моделі регресії. Отже, можна стверджувати, що еволюція індексу BET-NG визначається іншими факторами, які відрізняються від фінансових показників компа-ній-компонентів. Ця ситуація окреслює нові науково-дослідні розробки, які потребують продовження термінів і використання фі-нансових показників.
Ключові слова: BET-NG INDEX, показники фінансової ефективності, Бухарестська фондова біржа. Д. Васи, д-р экон. наук, ассист., Л. Илле, д-р. экон. наук, проф. Университет имени Лучиана Блага, Сибиу, Румыния
КОРРЕЛЯЦИИ МЕЖДУ ПОКАЗАТЕЛЯМИ ФИНАНСОВОЙ ЭФФЕКТИВНОСТИ КОМПАНИЙ
С ОСНОВНОЙ ДЕЯТЕЛЬНОСТЬЮ В ЭНЕРГЕТИЧЕСКОМ СЕКТОРЕ И СМЕЖНЫХ ОТРАСЛЯХ, ТОРГУЮЩИХ НА БУХАРЕСТСКОМ ФОНДОВОЙ БИРЖЕ, И ИНДЕКСОМ BET-NG
Полученные результаты не соответствуют гипотезе исследования: существует сильная и прямая связь между эволюцией ин-декса BET-NG и показателями финансовой эффективности компаний-компонентов. Анализ, выполненный на соотношениях между эволюцией индекса BET-NG и показателями финансовой эффективности, указывает на то, что в большинстве случаев связь являе-тся обратной и в 25% случаев она сильна.
Что касается интенсивности корреляций между основными показателями финансовой эффективности (ROA; ROE; EPS; чистая маржа) и средними значениями индекса BET-NG, то не существует прочной связи, чтобы оправдать идентификацию модели ре-грессии. Следовательно, можна утверждать, что эволюция индекса BET-NG определяется другими факторами, отличающимися от финансовых показателей компаний-компонентов. Эта ситуация определяет новые научно-исследовательские разработки, требую-щие продления сроков и использования финансовых показателей.
Ключевые слова: BET-NG INDEX, показатели финансовой эффективности, Бухарестская фондовая биржа.

ISSN 1728-2667 ЕКОНОМІКА. 3(198)/2018 ~ 101 ~
Annex 1
EXTENDED ABSTRACT IN ENGLISH AND REFERENCES (IN LATIN): TRANSLATION / TRANSLITERATION / TRANSCRIPTION
H. Bachev, Doctor of Sciences (Economics), Professor ORCID iD 0000-0003-0555-7468
Institute of Agricultural Economics, Sofia, Bulgaria DOI: https://doi.org/10.17721/1728-2667.2018/198-3/1
p. 6-29
AN EMPIRICAL STUDY ON RELATIONS BETWEEN GOVERNANCE AND SUSTAINABILITY IN BULGARIAN AGRICULTURE
This paper applies the interdisciplinary New Institutional Economics framework, identifies diverse market, private, collective,
public and hybrid modes of governance and assesses their impact on agrarian sustainability in Bulgaria. First, the methodological framework of the study is outlined. After that dominating governing modes in Bulgarian farms of different juridical type, size, specialization, ecological and geographical location are identified, and their impacts on agrarian sustainability and its economic, social, and environmental pillars evaluated. In conclusion implications for further research, public policy improvement, and private managerial strategy formation are presented. Agricultural producers of different use quite unlike mixture of effective market, private, collective and hybrid modes for governance of their activities and relations. Individual factors and modes most contributing to improvement of agrarian sustainability at the current stage of development are: manager's personal convictions and initiatives, farms resources and innovation potential, near future profit and benefits strategies, market prices levels and dynamics, area-based EU subsidies, and informal agreements.
1. Bachev, H., 2002. Study on Land Supply in Bulgarian Farms, Farm Management and Rural Planning, 3, pp. 189-203. 2. Bachev, H., 2003. Study on Labor Supply in Bulgarian Farms, Farm Management and Rural Planning, 4, pp. 129-145. 3. Bachev, H., 2009. Mechanisms of Governance of Agro-Ecosystem Services, in P. Liotta, D. Mouat, J. Lancaster, B. Kepner and
D. Smith (editors), Achieving Environmental Security: Ecosystem Services and Human Welfare, Amsterdam: IOS Press, pp. 31-52. 4. Bachev, H., 2010. Governance of Agrarian Sustainability, New York: Nova Science Publishers. 5. Bachev, H., 2010. Management of Farm Contracts and Competitiveness, Saarbrücken: VDM Verlag Dr. Muller. 6. Bachev, H., 2011. Water Governance in Bulgarian Agriculture, in A. Baba, G. Tayfur, O. Gunduz, K. Howard, M. Friedel, and
A. Chambel (editord), Climate Change and its Effects on Water Resources, Issues of National and Global Security, Springer Science+Business Media B.V., 215-224.
7. Bachev, H., 2014. Environmental Management in Agriculture, Mechanisms, Forms and Efficiency, Saarbrücken: LAP LAMBERT Academic Publishing.
8. Bachev, H., 2016. Defining and Assessing the Governance of Agrarian Sustainability, Journal of Advanced Research in Law and Economics, Vol. VII, Issue 4(18), 797-816. DOI: 10.14505/jarle.v7.4(18).12.
9. Bachev, H., 2017. Sustainability Level of Bulgarian Farms, Bulgarian Journal of Agricultural Science, 23 (1), pp. 1-13. 10. Bachev, H., 2018: Impact of Institutional Environment on Agrarian Sustainability in Bulgaria, Economic Thought, 2 (fortcoming). 11. Bachev, H., 2018. The Sustainability of Farming Enterprises in Bulgaria, Newcastle upon Tyne: Cambridge Scholars Publishing. 12. Bachev, H. and Tsuji, M., 2001. Structures for Organization of Transactions in Bulgarian Agriculture, Journal of the Faculty of
Agriculture of Kyushu University, No 46 (1), pp. 123-151. 13. Bachev, H. and Kagatsume, M., 2002. Governing of Financial Supply in Bulgarian Farms, The Natural Resource Economics
Review, No 8, pp. 131-150. 14. Bachev, H. and Kagatsume, M., 2003. Governing of Output Realization in Bulgarian Farms, The Natural Resource Economics
Review, 9, pp. 55-69. 15. Bachev H. and Nanseki, T., 2008. Environmental Management in Bulgarian Agriculture – Risks, Modes, Major Challenges, Journal
of the Faculty of Agriculture of Kyushu University, No 53(1), pp. 363-373. 16. Bachev, H., Ivanov, B., Toteva, D., Sokolova, E., 2016: Agrarian Sustainability and its Governance – Understanding, Evaluation,
Improvement, Journal of Environmental Management and Tourism, Vol. 7 (4), pp. 639-663. DOI: https://doi.org/10.14505//jemt.v7.4(16).11. 17. Bachev, H., Ivanov, B., Toteva, D. and Toteva, E., 2017: Agrarian sustainability in Bulgaria – economic, social and ecological
aspects, Bulgarian Journal of Agricultural Science, 23 (4), pp. 519-525. 18. Bachev, H., Terziev, D., 2018. A Study on Agrarian Sustainability Impact of Governance Modes in Bulgaria, Journal of Applied
Economic Sciences, Vol. 8, 2(56) (fortcoming). 19. Bachev, H. and Terziev, D., 2017. Environmental Sustainability of Agricultural Farms in Bulgaria, Journal of Environmental
Management and Tourism, Vol. 8, No 5, pp. 968-994. DOI:10.14505/jemt.v8.5(21).02. 20. EC. 2017. Sustainable agriculture and rural development policy – agricultural development, European Commission 21. Furuboth, E. and Richter, R., 1998. Institutions and Economic Theory: The Contribution of the New Institutional Economics, Ann
Arbor: The University of Michigan Press 22. Georgiev, M., 2010. "Rent Seeking" in Agricultural Contracts in the Country, Trakia Journal of Sciences, Vol. 8, 3, pp. 230-233. 23. North, D., 1990. Institutions, Institutional Change and Economic Performance, Cambridge: Cambridge University Press. 24. Raman, S., 2006. Agricultural Sustainability. Principles, Processes and Prospect, New York: The Haworth Press Inc. 25. Sauvenier, X., Valekx, J, Van Cauwenbergh, N., Wauters, E., Bachev, H., Biala, K., Bielders, C. and Peeters, A., 2005. Framework
for Assessing Sustainability Levels in Belgium Agricultural Systems – SAFE, Belgium Science Policy, Brussels. 26. Terziev, D., Radeva, D., 2016. Studying the New Agriculture, 2nd International Conference on Development and Economics
(I.CO.D.ECON.), Thessaloniki, Greece, Conference proceedings: https://icodecon.com/images/docs/proceedings_2017_3_18.pdf, 175-179. 27. UN. 1992. Report of the United Nations Conference on Environment and Development, 3-14 June 1992, Rio de Janeiro: United
Nation. 28. UN. 2015. Paris Climate Change Conference, November-December 2015. 29. Williamson, O., 1996. The Mechanisms of Governance, Oxford: Oxford University Press.
~ 102 ~ В І С Н И К Київського національного університету імені Тараса Шевченка ISSN 1728-3817
L. Belascu, Doctor of Sciences (Economics), Professor ORCID iD 0000-0002-7711-3746
University Lucian Blaga of Sibiu, Sibiu, Romania, А. Horobet, Doctor of Sciences (Economics), Professor,
ORCID iD 0000-0001-5821-0244 O. Popovici, Doctor of Sciences (Economics), Assistant Professor
ORCID iD 0000-0002-0457-9190 Bucharest University of Economic Studies, Bucharest, Romania
DOI: https://doi.org/10.17721/1728-2667.2018/198-3/2 p. 29-34
LOCATION ATTRIBUTES OF EMERGING ECONOMIES: AN ANALYSIS USING PRINCIPAL COMPONENTS
Our paper investigates the location attributes of a large sample of emerging economies from the perspective of foreign direct
investments and multinational companies' presence abroad. We use several macroeconomic variables that are hypothesized to illustrate the relevant location attributes for multinational companies' decisions and include them in a Principal Components Analysis to reveal the most relevant locational attributes or combination of such attributes that influence the decision of multina-tional companies to invest abroad. We find that only four variables had the most important contributions to the principal compo-nents: GDP per capita, international reserves, mobile phones subscriptions and labour force. Labour force is the variable that contributes the most to the first factor and its contribution grows in importance as we depart from 1994. At the same time, GDP per capita has become less important in recent years.
1. Al-Sadig, A. 2009. The Effects of Corruption on FDI Inflows, Cato Journal, Vol. 29, pp. 267-294. 2. Ballasubramanyam, V. N., Salisu, M., Sapford, D. 1998. Foreign Direct Investment and Growth in EP and IS Countries, Economic
Journal, Vol. 106, рр 92-105. Available at: http://dx.doi.org/10.2307/2234933 3. Bénassy-Quéré, A., Coupet, M., Mayer, T. 2007. Institutional Determinants of Foreign Direct Investment, The World Economy,
Vol. 30, pp. 764-782, DOI: 10.1111/j.1467-9701.2007.01022.x 4. Bevan, A., Estrin, S. 2000. The Determinants of Foreign Direct Investment in Transition Economies, Discussion Paper 342.
[Online], William Davidson Institute. Available at: http://wdi.umich.edu/files/publications/workingpapers/wp342.pdf 5. Boeri T., Brucker, H. 2000. The Impact of Eastern Enlargement on Employment and Labour Markets in the EU Member States, Report
under contract SOC-97-102454. [Online], European Integration Consortium, http://www.diw.de/documents/dokumentenarchiv/ 17/38468/eic_employment.pdf
6. Borensztein, E., De Gregorio, J., Lee, J-W. 1998. How does foreign direct investment affect economic growth? Journal of International Economics, Vol. 45. рр. 115-135, https://doi.org/10.1016/S0022-1996(97)00033-0
7. Campos, N., Kinoshita, Y., 2003. Why Does Foreign Direct Investment Go Where It Goes? New Evidence from the Transition Economies, Working Paper Number 573. [Online], William Davidson Institute. Available at: http://deepblue.lib.umich.edu/ bistream/handle/2027.42/39959/wp573.pdf
8. Carstensen, K., Toubal, F. 2002. Foreign Direct Investment in CEE countries: a dynamic panel analysis, Journal of Comparative Economics, Vol. 32. pp. 3-22. Available at: https://doi.org/10.1016/j.jce.2003.11.001
9. Dunning, J. 2001. The Eclectic (OLI) Paradigm of International Production: Past, Present and Future, Journal of the Economics of Business, Vol. 8. pp. 173-190. Available at: https://doi.org/10.1080/13571510110051441.
10. Hayakawa, K., Kimura, F., Lee, H-H. 2013. How Does Country Risk Matter for Foreign Direct Investment? The Developing Economies, Vol. 51. pp. 60-78. DOI: 10.1111/deve.12002
11. Holland, D., Pain, N. The Determinants and Impact of Foreign Direct Investments in the Transition Economies: A Panel Data Analysis [Online]. Available at: https://www.researchgate.net/publication/228972963_The_determinants_and_impact_of_foreign_direct_ investment_in_the_transition_economies_a_panel_data_analysis
12. Hotelling, H. 1933. Analysis of a complex of statistical variables into principal components, Journal of Educational Psychology, Vol. 24. pp. 417-441 and 498-520. Available at: http://dx.doi.org/10.1037/h0071325
13. Hotelling, H. 1936. Relations between two sets of variates, Biometrika, Vol. 28. pp. 321-77. Available at: https://doi.org/10.1093/biomet/28.3-4.321
14. Inekwe, J.N. 2013. FDI, Employment and Economic Growth in Nigeria, African Journal of Development, Vol. 25. pp. 421-433. DOI: 10.1111/1467-8268.12039
15. Kinda, T. 2010. Investment Climate and FDI in Developing Countries: Firm-Level Evidence, World Development, Vol. 38. pp. 498-513. Available at: https://doi.org/10.1016/j.worlddev.2009.12.001
16. Kneller, R., Pisu, M. 2007. Industrial Linkages and Export Spillovers from FDI, World Economy, Vol. 30. pp. 105-134. DOI: 10.1111/j.1467-9701.2007.00874.x
17. Liang, Y. 2007. FDI, Competitive Menace, and the Evolution of Labor Practices in China, The Chinese Economy, Vol. 40. pp. 21-51, DOI 10.2753/CES1097-1475400502
18. Miyamoto, K. 2003. Human Capital Formation and Foreign Direct Investment in Developing Countries, Working paper 211. [Online], Organisation for Economic Co-operation and Development (OECD). Available at: http://papers.ssrn.com/sol3/ papers.cfm?abstract_id=668505
19. Majeed, M.T., Ahmad, E. 2008. Human Capital Development and FDI in Developing Countries, Journal of Economic Cooperation, Vol. 29. pp. 79-104.
20. Mollick, A.V., Ramos-Duran, R., Silva-Ochoa, E. 2006. Infrastructure and FDI flows in Mexico: A Panel Data Approach, Global Economy Journal, Vol. 6. pp. 1-27. Available at: https://doi.org/10.2202/1524-5861.1094.
21. Nair-Reichert, U., Weinhold, D. 2001. Causality Tests for Cross-Country Panels: a New Look at FDI and Economic Growth in Developing Countries // Oxford Bulletin of Economics and Statistics, Vol. 63. pp. 153-171, DOI: 10.1111/1468-0084.00214.
22. Santos-Paulino, A.W., Wan, G. 2009. FDI, Employment, and Growth in China and India, Review of Development Economics, Vol. 13. pp. 737-739, DOI: 10.1111/j.1467-9361.2009.00512.x
23. Wei, S. 2000. How Taxing Is Corruption on International Investors, Review of Economics and Statistics, Vol. 82. pp. 1–11. Available at: https://doi.org/10.1162/003465300558533
24. Zhang, K.H., Song, S. 2002. Promoting exports: the role of inward FDI in China, China Economic Review, Vol. 11. pp. 385-396. Available at: https://doi.org/10.1016/S1043-951X(01)00033-5
25. Zhou, D., Li, S., Tse, D.K. 2002. The impact of FDI on the productivity of domestic firms: the case of China, International Business Review, Vol. 11. pp. 465-484. Available at: https://doi.org/10.1016/S0969-5931(02)00020-3
ISSN 1728-2667 ЕКОНОМІКА. 3(198)/2018 ~ 103 ~
S. Burnete, PhD, Professor Lucian Blaga University, Sibiu, Romania
DOI: https://doi.org/10.17721/1728-2667.2018/198-3/3 p. 34-39
TRANS-ATALANTIC INTEGRATION: A CRUCIAL PACE TOWARD A GLOBALIZED WORLD
In this paper we deal with the much "touted and taunted" upcoming transatlantic economic integration. We scrutinize the
issue through the prism of both economic theory and historical development, in an attempt to contend that economic integration is no less lucrative on a transcontinental level than it used to be on a regional level. We use theoretical and historical arguments to emphasize the necessity and opportunity of a trade and investment agreement between the United States and the European Union, which is likely to turn the Atlantic into a redoubtable economic pole. We show that Europe and America are full readiness to enter into this paramount agreement.
1. Aguilar, Linda M. NAFTA: A Review of the Issues. In Philip Kinge (Ed.) International Economics and International Economic Policy,
McGraw-Hill Inc., 1995, pp. 183-187. 2. Almeida, P. Knowledge sourcing by foreign multinationals: patent citation analysis in the U.S. semi-conductor industry. Strategic
Management Journal, 17, 1996, 155-165. 3. Bhagwati, J. Regionalism and Multilateralism: An Overview. In J. Bhagwati, P. Krishna, & A. Panagariya (Eds.), Trading blocs:
alternative approaches to analyzing preferential trade agreements. Cambridge, MA: MIT Press, 1999. 4. Bouzas, R. The ‘new regionalism' and the Free Trade Area of the Americas: a less benevolent view. Cepal Review, 85, 2005. 5. Bull, H. The Anarchical Society. A Study of Order in World Politics (Vol. 2nd edn). Basingstoke and London: Macmillan, 1995. 6. Cantwell, J. & Harding, R. The internationalization of German companies R&D. International Investment and Management, National
Institute Economic Review, 1997, 163/1. 7. Cooper, W. EU-US Economic Ties: Framework, Scope, and Magnitude, Congressional Research Service, 2009. 8. Ducros, B., Viner J. The Customs Union Issue, Notes bibliographiques, Revue économique, année 1951, Vol. 2 (6), pp. 801-802.
Available at: http://www.persee.fr/doc/reco_0035-2764_1951_num_2_6_406878_t1_0801_0000_001 9. Erixon, F. The Transatlantic Trade and Investment Partnership, CESifo Forum nr. 4, 2013. Available at: http://www.ecipe.org/
app/uploads/2014/12/TTIP_and_the_Shifting_Structure_of_Trade_Policy.pdf 10. Fisman, R., Paravisini, D. & Vig, V. Cultural proximity and loan outcomes. American Economic Review, 2017, 107(2), 457-492. 11. Gnesotto, N. Reshaping EU-US Relations. A concept paper. Notre Europe (Studies and Research 75), 2010. 12. Egan, M., Cowles, M. The Evolution of the Transatlantic Partnership. Transworld Working Paper, 5, 2012. 13. Hosny, A. S. Theories of Economic Integration: A Survey of the Economic and Political Literature, International Journal of Economy,
Management and Social Sciences, Vol. 2 (5), 2013, pp. 133-155, http://www.waprogramming.com/papers/5157de7c463eb9.70128490.pdf 14. Keohane, R. After Hegemony. Cooperation and Discord in the World Political Economy. Princeton: Princeton University Press, 1984. 15. Keohane, R. Ironies of Sovereignty: The European Union and the United States. Journal of Common Market Studies, 40(4), 2002,
743-765, DOI: 10.1111/1468-5965.00396 16. Krugman, P. The Move Toward Free Trade Zones, In Philip Kinge (Ed.) International Economics and International Economic Policy,
McGraw-Hill Inc., 1995, pp. 163-182. 17. Kuemmerle, W. The drivers of foreign direct investment into research and development: An empirical investigation. Journal of
International Business Studies, 1999, Vol.30/1, pp. 1-24. 18. Lamy, P. Stepping Stones or Stumbling Blocks? The EU's Approach Towards the Problem of Multilateralism vs Regionalism in
Trade Policy. The World Economy, 25(10), 2002, 1399-1413. 19. Lipsey, R. The Theory of Customs Unions: A General Survey, In J. Bhagwati (Ed.), International Trade: Selected Readings.
Cambridge, MA: MIT Press, 1984. 20. Manners, I. Normative Power Europe: A Contradiction in Terms? Journal of Common Market Studies, 20(2), 2000, 235-258,
DOI: 10.1111/1468-5965.00353 21. Meunier, S. What single voice? European institutions and EU-US trade negotiations. International Organization, 2000, 54(1), 103-120. 22. Meunier, S. Trading Voices. The European Union in International Commercial Negotiations. Princeton: Princeton University Press, 2005. 23. Meunier, S., Kalypso, N. The European Union as a conflicted trade power. Journal of European Public Policy, 2006, 13(6), 906-925. 24. Müftüler, B., Cihangir, D. The Transatlantic Relationship and the future Global Governance, Transworld, Oct., 2014. 25. Panagariya, A., Findlay, R. A Political Economy Analysis of Free-Trade Areas and Customs Unions, In R.C. Feenstra,
G.M. Grossman and D.A. Irwin (Eds.), The Political Economy of Trade Policy: Papers in Honor of Jagdish Bhagwati, MIT Press: Cambridge, 1996, pp. 265-287.
26. Pollack, M. The Political Economy of the Transatlantic Partnership, Roberty Schuman Center for Advanced Studies, 2003. 27. Sampson, G., & Woolcock, S. Regionalism, Multilateralism and Economic Integration:The recent experience. Tokyo, New York,
Paris: United Nations University Press, 2003. 28. Schwok, R.U.S. – EU Relations: Drifting Apart? Dissociative and Associative Approaches Ever Closer Parnership. Policy-Making in
US-EU Relations, pp. 363-385. Brussels: European Interuniversity Press/Peter Lang, 2001. 29. Smith, M. A liberal Grand Strategy in a realist world? Power, purpose and the EU's changing global role. Journal of European
Public Policy, 2010, 18(2), 144-163. 30. Tsoukalis, L. The New European Economy Revisited. Oxford: Oxford University Press, 1997. 31. Woolcock, S. The New Economic Diplomacy: Decision Making and Negotiation in International Economic Relations. Aldershot:
Ashgate, 2003.
~ 104 ~ В І С Н И К Київського національного університету імені Тараса Шевченка ISSN 1728-3817
L. Dumitrescu, PhD, Professor ORCID iD 0000-0002-9935-0224
Lucian Blaga Unniversity of Sibiu, Sibiu, Romania, M. Fuciu, PhD, Assistant Professor,
ORCID iD 0000-0001-9811-1179 H. Gorski, PhD, Professor
ORCID iD https://orcid.org/0000-0001-9811-1179 DOI: https://doi.org/10.17721/1728-2667.2018/198-3/4
p. 39-43
IMPLEMENTING NEW MARKETING STRATEGIES IN THE CONTEXT OF THE ONLINE ENVIRONMENT – ADVANTAGES, DISADVANTAGES, STATISTICS AND TRENDS
In the context of the online environment and the pressure created by the new information and communication technologies,
when the Internet is used by more than 40% of the world population, when the penetration rate of the online has reached more than 75% in Europe (52% in Romania) and almost 90% in North America and when the smartphone has become a constant com-panion of the individuals, today's companies must adapt or develop new marketing strategies that will help them win and retain the consumers, otherwise they will slowly perish. This paper aims to present several important marketing strategies based on the usage of the Internet tools like: search engine optimisation (SEO), content marketing, social media/online social networks, email marketing, lead generation, sales etc., that can be implemented by the Romanian companies. We are presenting several im-portant advantages and disadvantages of these marketing strategies. We will also bring forth several important statistics regard-ing the Internet usage and of the online marketing tools and we shall underline future trends related to these aspects, all this being designed to support future managerial decisions and to better understand the need for the companies to implement and use them successfully.
1. Brenner, M., 2017. Content marketing trends to watch out for in 2017. Available at: https://marketinginsidergroup.com/content-
marketing/content-marketing-trends-2017-infographic/, accessed on June 17th, 2017. 2. Bolotaeva, V., Cata, T., 2011, Marketing Opportunities with Social Networks, Journal of Internet Social Networking and Virtual
Communities, p. 8, DOI: 10.5171/2011.409860 3. Boyd, D., Ellison, N., 2007. Social network sites: a definition, history and scholarship, Journal of Computer Mediated Communica-
tion, Vol. 13, (1), DOI: 10.1111/j.1083-6101.2007.00393.x 4. Coetesee, F., 2010, Advantages and disadvantages of social media and networking, April, 9, 2010. Available at:
http://www.socialmediastrategy.co.za/index.php/social-networking/what-are-some-advantages-and-disadvantages-of-social-media-networking/ accessed on April 18, 2012 in Fuciu M, Dumitrescu, L., Gorski, H., (2012), The influence of online social networks on compa-nies, managers and the decision making process, Proceedings of the The Knowledged Based Organization conference, Sibiu, Vol. 1 (man-agement and military sciences), pp. 501-506.
5. Diffley, S., Kearns, J., Bennett, W., Kawalek, P., 2011, Consumer Behaviour in Social Networking Sites: Implications for Marketers, Irish Journal of Management, Vol. 30 2, pp. 47-65;
6. Fiorelli, G., 2016, SEO and digital trends in 2017. Available at: https://moz.com/blog/seo-and-digital-trends-in-2017, accessed on June 17th, 2017.
7. Fuciu M, Dumitrescu, L., Gorski, H., 2012, The influence of online social networks on companies, managers and the decision mak-ing process, Proceedings of the The Knowledged Based Organization conference, Sibiu, Vol. 1 (management and military sciences), pp. 501-506.
8. Gray, R., Charlesworth, A., Esen, R., 2009, Marketing online – o abordare orientată spre client, All Publishing House Bucharest. 9. Ivanov, A. E., 2012, The internet's impact on integrated marketing communication, Procedia in economics and finance, issue, 3,
pp. 536-542, DOI: 10.1016/S2212-5671(12)00192-X 10. Kotler, P. and Caslione, J.A., 2009, Chaotics – management si marketing in era turbulentelor, Publica Publishing House, Bucharest. 11. Kotler, P., Keller, K., 2008, Marketing management, 4th Edition, Teora Publishing House, Bucharest in Fuciu, M., Luncean, L., Du-
mitrescu, L., 2011, Internet and E-commerce – tools for creating value in the E-marketplace (Marketing from Information to decision), pp. 129-140.
12. Lincoln, J., 2017, The hottest 14 SEO trends of 2017, Young Entrepreneur Council, Contributor. Available at: http://www.huffingtonpost.com/entry/the-hottest-14-seo-trends-of-2017_us_58de5866e4b0efcf4c66a7e2, accessed on June 17th, 2017.
13. Nelson, E. C., 2012, Pros and Cons of Content Marketing. Available at: http://www.business2community.com/content-marketing/ 7-pros-and-cons-of-content-marketing-0266634#iQ2rX7mmA2yFf8HP.97, accessed on June 15th, 2017.
14. Sezgin, G., 2009, Arama Motorlarsnun Davranslarinin Çözümlenmesi Ve Web Sayfalarina Tasarim Asamasinda Yansitilmasi, Mas-ter Thesis, Beykent Üniversity Institute for Science and Technology, Istanbul., in Yulcin, N., Kose, U., 2010, What is search engine optimi-sation: SEO?, Procedia Social and Behavioral Sciences 9, pp. 487-493
15. Yulcin, N., Kose, U., 2010, What is search engine optimisation: SEO?, Procedia Social and Behavioral Sciences 9, pp. 487-493 16. American Marketing Association. Available at: http://www.marketing-dictionary.org/Content+marketing, accessed on June 15th, 2017. 17. Content Marketing Institute. Available at: http://contentmarketinginstitute.com/what-is-content-marketing/ , accessed on June 15th, 2017. 18. American Marketing Association. Available at: http://www.marketing-dictionary.org/Email, accessed on June 15th, 2017. 19. https://www.marketo.com/lead-generation/, accessed on June 15th, 2017. 20. http://www.worldometers.info/world-population/romania-population/, accessed on June 15th, 2017. 21. http://www.zf.ro/business-hi-tech/statistica-numarul-de-utilizatori-de-internet-a-crescut-in-2016-cu-1-2-la-10-6-milioane-16016618,
accessed on June 16th, 2017. 22. https://newsroom.fb.com/company-info/, accessed on June 16th, 2017. 23. https://zephoria.com/top-15-valuable-facebook-statistics/, accessed on June 16th, 2017. 24. http://www.facebrands.ro/demografice.html, accessed on June 16th, 2017. 25. https://www.hubspot.com/marketing-statistics, accessed on June 17th, 2017.
ISSN 1728-2667 ЕКОНОМІКА. 3(198)/2018 ~ 105 ~
B. Glinkowska, Doctor of Sciences ORCID iD 0000-0002-6915-3297 The University of Lodz, Poland,
Ie. Chebotarov, PhD in Economics, ORCID iD 0000-0001-5963-7637
V. Chebotarov, Doctor of Science (Economics), Professor ORCID iD 0000-0003-1131-9116
SI "Luhansk Taras Shevchenko National University", Starobil'sk, Ukraine DOI: https://doi.org/10.17721/1728-2667.2018/198-3/5
p. 43-48
ANALYSIS OF THE ORIGIN, MODERN CHARACTERISTICS AND PROSPECTS OF DETERMINING THE PROFILE OF UKRAINIAN MANAGER
The article is devoted to the development of the initial theoretical and methodological provisions for the study of profile of
modern Ukrainian manager. The results of the corresponding applied empirical analysis carried out by the authors are presented. The characteristics of the features of modern Ukrainian manager in the context of existing models of national business cultures are given.
1. Hanifan, L. J., 1916. The Rural School Community Center. Annals of the American Academy of Political and Social Science, 67, 130-
138. Available at: http://www.jstor.org/stable/pdf/1013498.pdf 2. Bourdieu, P., 1986. The forms of capital. Handbook of Theory and Research for the Sociology of Education / Ed. by J.G. Richardson.
New York: Greenwood, p. 241-258. 3. Grishnova, O., Polyv'iana, N., 2009. Social capital: essence, significance, interconnection with other forms of capital. Ukraina:
aspekty pratsi, № 3, Р. 19–24. [in Ukrainian]. 4. Yelahin, V. P., 2011. On the essence of the concept of "social capital" and its role in the process of building a social state. № 1,
Р. 46–55. [in Ukrainian]. 5. Grishnova O., Zaichko O. 2016. Modern Technologies in Labor Economics: New Opportunities and New Challenges. Herald of the
Economic Sciences of Ukraine, № 2, pp. 52-56. [in Ukrainian]. 6. Kamenska, O., 2016. Conception of management of industrial enterprise human capital is in the conditions of innovative
development. Ekonomichnyi visnyk Donbasu, № 3(45), Р. 225-229 [in Ukrainian]. 7. Zaitsev, V., 2017. The choice of the model of corporate requirements to the competence of a specialist of industrial enterprise.
Ekonomichnyi visnyk Donbasu, № 2(48), Р. 207-213. [in Ukrainian]. 8. Campbell, J. P., Dunnette, M. D., Hough, L. M., 1990. Modeling the performance prediction problem in industrial and organizational
psychology. Handbook of Industrial and Organizational Psychology. Palo Alto: Consulting Psychologists Press, Second edition, vol. 1. – P. 687-732.
9. Bartram, D., Robertson, I. T., Callinen, M., 2002. Competency and individual performance. Modeling the world of work. Organizational Effectiveness: The Role of Psycholog. – Chichester: Wiley, P. 596–618.
10. Glinkowska, B., Kaczmarek, B., 2016. Zarządzanie międzynarodowe i internacjonalizacja przedsiębiorstw. Teoria i praktyka. Wydawnictwo Uniwersytetu Łódzkiego. Łódź, 290 s. [in Poland].
11. Kaczmarek, B., 2016. Zarządzanie międzykulturowe – wybrane aspekty; B. Glinkowska (red.), Internacjonalizacja przedsiębiorstw. Uwarunkowania, procesy, wyniki badań, Łódź, S. 87-95. [in Poland].
12. Glinkovska, B., Chebotaryоv, V., 2016. Small and medium business in Poland and Ukraine: classification problems and initial institutional framework for transformation / B. Glinkowska (red.), Internacjonalizacja przedsiębiorstw. Uwarunkowania, procesy, wyniki badań, Łódź, S. 153-164. [in Poland].
13. Năsulea, C., Spînu, D. F., Moroianu, R. M., 2017. The Polish recipe. Visnyk Kyivskoho natsionalnoho universytetu imeni Tarasa Shevchenka. Ekonomika, 3(192), 34-38 [in Ukrainian]. DOI: https://doi.org/10.17721/1728-2667.2017/192-3/7.
14. Watanabe I. (1999). World-Glass management practices Enduring Methods for Competitive Success. Crisp Publications, Inc., 85 р. 15. Trompenaars, F., Woolliams, P., 2003. Business across cultures. West Sussex, England: Capstone Publishing. 16. Hofstede G., 1992. Cultures and organizations: software of the mind. London: McGraw-Hill. 17. Lewis R., 2013. Fish Can't See Water: How National Culture Can Make or Break Your Corporate Strategy, John Wiley & Sons, 312 p.
E. Ivokhin, Doctor of Sciences (Physics and Mathematics), Professor, ORCID iD 0000-0002-5826-7408
D. Apanasenko, PhD Student ORCID iD 0000-0001-8387-152X
Taras Shevchenko National University of Kyiv, Kyiv, Ukraine, V. Navrodskiy, PhD in Physics and Mathematics, Associate Professor
ORCID iD 0000-0002-0394-6593 Kyiv National University of Culture and Arts, Kyiv, Ukraine
DOI: https://doi.org/10.17721/1728-2667.2018/198-3/6 p. 48-53
ABOUT PRODUCTION-TRANSPORT PROBLEM REDUCTION TO THE TWO-LEVEL PROBLEM
OF DISCRETE OPTIMIZATION AND ITS APPLICATION In this study, the application of the production and transport task is considered to solve the problem of the distribution of the
limited capacities of data transmission channels between different nodes of the computer network. A scheme is proposed for reducing the problem to a two-level continuous-discrete optimization problem. The model is formulated and numerical results are obtained to solve the problem of power distribution in the network of the information and computing center.
1. Voronin, A. A., Mishin, S. P., 2003. Оptimalnye ierarkhicheskie struktury Moscow, IPU, 214 p. 2. Elsasser, R., Monien, B. and Preis, R., 2002. Diffusion Schemes for Load Balancing on Heterogeneous Networks. Theory Comput.
System, 35(3), pp. 305-320. DOI: http://dx.doi.org/10.1007/s00224-002-1056-4

~ 106 ~ В І С Н И К Київського національного університету імені Тараса Шевченка ISSN 1728-3817
3. Gairing, M., Lucking, T., Mavronicolas, M. and Monien, B., 2004. Computing Nash Equilibria for Scheduling on Restricted Parallel Links. Proc. 36th Annual ACM Sympos. Theory Comput., pp. 613-622.
4. Dunne, P. E., 2005. Extremal Behavior in Multiagent Contract Negotiation. Jour. Artificial Intelligence Res., 23(1), pp. 41-78. 5. Prilutskii, M. Kh., 2000. Distribution of a Homogeneous Resource in Tree-Structured Hierarchical Systems. Proc. III Int. Conf.
Identification of Systems and Control Problems (SICPRO'2000), Moscow, IPU, pp. 2038-2049. 6. Prilutskii, M. Kh., Kartomin, A. G., 2003. Potokovye algoritmy raspredeleniya resursov v ierarhicheskih sistemah. Issledovano v
Rossii, 39, pp. 444-452. – http://zhurnal.ape.relarn.ru/ articles/2003/039.pdf 7. Afraimovich, L. G., Prilutskii, M. Kh., 2006. Multiindex resource distributions for hierarchical systems. Avtomatika i telemekhanika, 6,
pp. 194-205; Autom. Remote Control, 67:6 (2006), 1007-1016. DOI: http://dx.doi.org/10.1134/S0005117906060130 8. Seraya, O., Dunaevskaya, O., 2009. Mnogoindeksnyye nelineynyye transportnyye zadachi. Informatsionnyye i upravlyayushchiye
sistemy na zheleznodorozhnom transporte. – Khar'kov: KHGIZHT, № 5. p. 25-30. 9. Yudin, D. B., Yudin, A. D., 1979. Ekstremalnye modeli v ekonomike. Moscow, Ekonomika, 288 p. 10. Burkov, V. N., Korgin, N. A., Novikov, D. A., 2014. Vvedeniye v teoriyu upravleniya organizatsionnymi sistemami: uchebnik Izd.2.
Izd. 2-ye. M.: Librokom, 264 p. 11. Lukac, Z., Hunjet, D. and Neralic, L., 2008. Solving the production-transportation problem in the Petroleum Industry. Revista Inves-
tigacion Operacional, 29(1), рp. 63-70. 12. Ivokhin, Ye., Adzhubey, L., 2014. Pro rozv'yazok odniyeyi dvorivnevoyi modeli vyrobnycho-transportnoyi zadachi// Visnyk
Kyyivs'koho natsional'noho universytetu imeni Tarasa Shevchenka. Seriya: Fizyko-matematychni nauky, № 3, S. 122-125.
G. Kharlamova, PhD in Economics, Associate Professor, ORCID iD 0000-0003-3614-712X
А. Stavytskyy, PhD in Economics, Associate Professor ORCID iD 0000-0002-5645-6758
Taras Shevchenko National University of Kyiv, Kyiv, Ukraine S. Nate, PhD in Economics, Associate Professor
ORCID iD 0000-0002-4711-1061 Lucian Blaga University in Sibiu, Sibiu, Romania
DOI: https://doi.org/10.17721/1728-2667.2018/198-3/7 p. 54-65
ESTIMATION OF RENEWABLE ENERGY SOURCES APPLICATION
IN THE SYNERGY WITH EU POLICY This paper gives the possibility to analyze the application of renewable energy sources (RES) at different stages of their
implementation to energy supply. Through the world experience we research the dynamics of energy consumption by its types; determine, what kinds of alternative sources are demanded most of all. In addition, we assess the efficiency of the application of RES in Ukraine. According to statistical and correlation analysis, it was proved that for Ukraine it is the most profitable to use biomass energy, while solar energy remains relatively expensive for our country. At the same time situation may change if costs for the solar panel will decrease in the future. It is shown that use of alternative energy sources decrease the energy intensity of GDP, while fossil resources increase this parameter. Unfortunately, Ukraine faces difficulties in attracting investments for development of RES as they are not so profitable at this time. It means that government should change its policy, increasing electricity prices to the European level, giving the chance for energy independence. In any case, in Ukraine, it will be necessary to increase the introduction of RES, as our country has only about 2% of RES in energy balance, while European countries in average have 17% and some of them have more than 60%.
1. Chernyak, O. I., Farenyuk, Ya., 2015. Doslidzhennya obsyagiv investuvannya v "Zelenu energetiku" svitu. Visnik Kiyivskogo
nacionalnogo universitetu imeni Tarasa Shevchenka. Ekonomika,177, p. 60-68 2. Bobrov, Ye., 2012. Konceptualni pidhodi do viznachennya ponyattya "energetichna bezpeka". Strategichni prioriteti, 2, p. 70–75. 3. Tocher, M., 2015. Technology Trends Survey: Future Emerging Technology Trends, Ver. 3. 4. Energetichna strategiya Ukrayini do 2035 roku. Access: http://mpe.kmu.gov.ua/minugol/doccatalog/document?id=245032412 5. Oficijnij sajt kompaniyi IKNet. Access: http://iknet.com.ua/uk/innovations/. – Innovacijni tehnologiyi v energetici. 6. Oficijnij sajt nacionalnogo institutu strategichnih doslidzhen. Access mode: http://www.niss.gov.ua/articles/262/. 7. Renewables 2017 Global Status Report. Access: http://www.ren21.net/wp-content/uploads/2017/06/17-
8399_GSR_2017_Full_Report_0621_Opt.pdf 8. Ofijсijnij sajt Ministerstva energetiki ta vigilnoyi promislovosti Ukrayini. Access: http://mpe.kmu.gov.ua/minugol/control/uk/
publish/article?art_id=245183431&cat_id=245183225 9. Oficijnij sajt derzhavnogo agenstva z energoefektivnosti ta energozberezhennya Ukrayini. Access: http://saee.gov.ua/uk/
about/polozhennya-derzhenerhoefektyvnosti-ukrainy. – Polozhennya Derzhenergoefektivnosti. 10. Fortov, V. I., Makarov, A. V., Mitrova, T. I., 2007. Globalna energetichna bezpeka: problemi i shlyahi rozv'yazannya zagrozi. Vicnik
NAN Ukrayini, 8, p. 40. 11. Gucyeva, I. I., 2008. Metodologichnij pidhid do viznachennya rivnya energetichnoyi bezpeki Ukrayini na ocnovi teorij riziku ta
nadijnocti. Cajt elektronnogo naukovogo fahovogo vidannya "Efektivna ekonomika". Access: http://www.economy.nayka.com.ua/ index.php?operation=1&iid=399
12. Kharlamova, G. O., 2013. Ekologo-ekonomichna konvergenciya: perehid do stijkoyi energetiki. Visnik Kiyivskogo nacionalnogo universitetu imeni Tarasa Shevchenka. Ekonomika, 150, p. 44-49 http://dx.doi.org/10.17721/1728-2667.2013/150-9/8
13. Kharlamova, G. O., 2015. Energetichna skladova ekologichnoyi bezpeki u vidobrazheni. Visnik Kiyivskogo nacionalnogo universitetu imeni Tarasa Shevchenka. Ekonomika, 166, p. 72-79. http://dx.doi.org/10.17721/1728-2667.2015/166-1/11
14. Energetichna strategiya Ukrayini na period do 2030 roku: rozporyadzhennya Kabinetu Ministriv Ukrayini vid 24 lipnya 2013 roku №1071": Access: http://zakon1.rada.gov.ua/laws/show/145-2006-%D1%80
15. Chernayk, O. I., Kharlamova, G. O., Stavytskyy, A. V., 2017. Energy Perspective 2030 for Ukraine in the Context of the EU Integration. Emerging Issues in the Global Economy. Springer Proceedings in Business and Economics. Springer, Cham, pp. 113-129. https://doi.org/10.1007/978-3-319-71876-7_10
16. Stavytskyy, A. V., Giedraitis, V., Sakalauskas, D., Huettinger, M., 2016. Economic Crises And Emission Of Pollutants: A Historical Review Of Select Economies Amid Two Economic Recessions, Ekonomika, Vol. 95(1), p. 7-21.
ISSN 1728-2667 ЕКОНОМІКА. 3(198)/2018 ~ 107 ~
K. Lawler, Visiting Professor, ORCID iD 0000-0002-3409-6755
S. Sadiq, PhD Student University of Kuwait, Kuwait City, Kuwait
DOI: https://doi.org/10.17721/1728-2667.2018/193-3/8 p. 66-69
EXCHANGE RATE VOLATILITY: AN EMPIRICAL STUDY FOR STATE OF KUWAIT
As an oil exporting nation Kuwait suffers from the well-known issue called the Resource Curse given the high reliance on oil
revenues for economic growth and development. Traditionally research on small open economies such as Kuwait focus on ver-sions of the Solow /Harrod/Domar growth models which are predominantly closed models which focus on exogenous growth issues such as saving ratios and the Solow Residual. For an open economy without core problems on capital accumulation, such as Kuwait, it is interesting to disentangle exchange rate volatility issues from key open economy fundamentals such as GDP growth, trade openness, inward foreign investment and exchange rate issues.
The purpose of this study is to empirically examine the impact of gross domestic product, trade openness and foreign direct investment on the exchange rate volatility of Kuwait. We have used several advanced statistical tools to better estimate different kinds of relationships. Results show that all factors are significant in determining exchange rate volatility.
1. Adeniran, J. O., Yusuf, S. A. and Adeyemi, O. A., 2014. The Impact of Exchange Rate Fluctuation on the Nigerian Economic
Growth: An Empirical Investigation. International Journal of Academic Research in Business and Social Sciences. Vol 4, No.8 2. Amihud, Y., 1994. Exchange rates and the valuation of equity shares. In T. Amihud and R.M. Levich, Exchange rates and corpo-
rate performance. New York: Irwin. 3. Arize, A. C, Osang, T. and Slottje, D. J., 2000. ‘Exchange-Rate Volatility and Foreign Trade: Evidence from Thirteen LDC's', Jour-
nal of Business & Economic Statistics, Vol. 18, pp. 10-17. 4. Armstrong, H. W. and Read, R., 1998. ‘Trade and Growth in Small States: The Impact of Global Trade Liberalisation', The World
Economy, Vol. 21, pp. 563-585. 5. Bartov, E. and Bodnar, G. M., 1994. ‘Firm valuation, earnings expectations, and the exchange-rate exposure effect', The Journal of
Finance, Vol. 49, pp.1755–1785. 6. Bodnar, G. and Gentry, W., 1993. ‘Exchange-rate exposure and industry characteristics: evidence from Canada, Japan and US',
Journal of International Money and Finance, Vol.12, pp. 29– 45. 7. Brada, J. C. and Mendez, J. A., 1988. ‘Exchange Rate Risk, Exchange Rate Regime and the Volume of International Trade',
Kyklos, Vol. 41, pp.263-280. 8. Brooks, C., 2002. Introductory Econometrics for Finance. Cambridge: Cambridge University Press. 9. Caballero, R. J., and Corbo, V., 1989. ‘The Effect of Real Exchange Rate Uncertainty on Exports: Empirical Evidence', The World
Bank Economic Review, Vol. 3, pp. 263-278. 10. Campbell, J. Y. and Clarida, R. H., 1987. ‘The Dollar and Real Interest Rates: An empirical investigation', Carnegie-Rochester Con-
ference Series on Public Policy, Vol. 27, pp. 103-140. 11. Chowdhury, A. R., 1993. ‘Does Exchange Rate Volatility Depress Trade Flows? Evidence from error-correction models', The Re-
view of Economics and Statistics, Vol. 75, pp. 700-706. 12. Dickey, D. A. and Fuller, W. A., 1979. ‘Distribution of Estimators for Time Series Regressions with a Unit Root', Jounral of the
American Statistical Association, Vol. 74 , pp. 427-431. 13. Djirimu, M. A., Tombolotutu, A. D. and Tuty. F. M., 2000. Exchange Rate Volatility Effect on Macroeconomic Fundamental in the
GCC. Journal of Economics and Sustainable Development 14. Dominguez, K.M. & Tesar, L.L., 2006. ‘Exchange rate exposure', Journal of International Economics, Vol. 68, pp.188-218. 15. Doyle, E., 2001. ‘Exchange rate volatility and Irish-UK trade, 1979-1992', Applied Economics, Vol. 33, pp. 249 – 265. 16. Ebaidalla, E. M., 2013. Impact of Exchange Rate Volatality on Macroeconomic Performance. Working Paper 789. The Economic
Research Forum (ERF). 17. Holland, M., Vieira, V. F., da Silva, C. G., and Bottecchia, L. C., 2008. Growth and Exchange Rate Volatility: A Panel Data Analysis.
International Journal of Academic Research in Business and Social Sciences August 2014, Vol. 4, No. 8 ISSN: 2222-6990. 18. Johansen, S. and Juselius, K., 1992. ‘Testing structural hypotheses in a multivariate cointegration analysis of the PPP and the UIP
for UK', Journal of Econometrics, Vol. 53, pp. 211-244. 19. Kazunobu, H., and Fukunari, K., 2008. The Effect of Exchange Rate Volatility on International Trade: The Implication for Production
Networks in East Asia. Institute of Developing Economics (IDE), JETRO 3-2-2 20. L Mark, N. C., 1995. ‘Exchange Rates and Fundamentals: Evidence on Long-Horizon Predictability', The American Economic Re-
view, Vol. 85, pp. 201-218. 21. McKenzie, M. D., 1999. ‘The Impact of Exchange Rate Volatility on International Trade Flow', Journal of Economic Surveys,
Vol. 13, pp. 71–106. 22. Meese, R. A., 1984. ‘Is the Sticky Price Assumption Reasonable for Exchange Rate Models?', Journal of International Money and
Finance, Vol. 3, pp. 131-139. 23. Meese, R. A. and Rogoff, K., 1983. ‘Empirical Exchange Rate Models of the Seventies: Do they fit out of sample?', Journal of Inter-
national Economics, Vol. 14, pp. 3-24. 24. Meese, R.A. and Rogoff, K., 1988. ‘Was It Real? The Exchange Rate-Interest Differential Relation over the Modern Floating-Rate
Period', Journal of Finance, Vol. 43, pp. 933-948. 25. Phillips. P.C. B., 1986. ‘Understanding spurious regressions in econometrics', Journal of Econometrics, Vol. 33, pp. 311-340. 26. Prasad, A. N. and Rajan, M., 1995. ‘The role of exchange and interest risk in equity valuation: A comparative study of international
stock markets', Journal of Economics and Business, Vol. 47, pp. 457–472 27. Yule, G. U., 1926. ‘Why Do We Sometimes Get Nonsense Correlations Between Time Series? A Study in Sampling and the Nature
of Time Series', Journal of the Royal Statistical Society, Vol. 89, pp. 1-64.
~ 108 ~ В І С Н И К Київського національного університету імені Тараса Шевченка ISSN 1728-3817
C. Popa, PhD in Economics, Assistant, Lucian Blaga University of Sibiu, Sibiu, Romania
DOI: https://doi.org/10.17721/1728-2667.2018/198-3/9 p. 69-74
THE INFLUENCE OF ORDOLIBERALISM IN EUROPE
From the "sick man" of Europe, as it was called after the Second World War, Germany managed to become the greatest power
on the continent. This was due to hard austerity policies that perfectly suited a hard working and rigorous population. In this article I want to analyze if ordoliberalism, the German form of social liberalism that led to the country's economic miracle in the 1950s, can be the saving solution for a continent in crisis. For a more complete analysis, I studied the subject from an economical, historical, political and social perspective. Following an extensive review of existing literature I have highlighted the doctrinal confrontation between ordoliberalism and keynesianism, brought back in the spotlight by the European sovereign debt crisis.
The German economic elite embrace ordoliberal values, characterized by responsibility and strict monetary rules. In response to the Eurozone crisis, they tried to spread the ordoliberal ideology across Europe. Focused on the supply side of the economy, the followers of ordoliberalism strongly opposed the expansionary fiscal and monetary policy. The power held in Europe allowed Germany to impose its own vision, centered on austerity and price stability. If ordoliberalism worked very well in Germany after the Second World War, not the same happened in the case of the Eurozone's economy. The rigor and lack of flexibility of German ordoliberalism have only further deepened the crisis and the economic problems of vulnerable countries.
1. Ropke, W., Two Essays, University Press of America, [Online], 1987, p. 45. Available at: https://mises.org/sites/default/
files/Two%20Essays_Ropke.pdf 2. Ropke, W., The Social Crises of Our Time, The University of Chicago Press, Chicago, [Online], 1950, p. 160. Available at:
https://mises.org/sites/default/files/The%20Social%20Crisis%20of%20Our%20Time%20%281%29.pdf 3. Jung A., Germany in the Era of Hyperinflation, Spiegel Online, [Online], 2009. Available at:
http://www.spiegel.de/international/germany/millions-billions-trillions-germany-in-the-era-of-hyperinflation-a-641758.html, 4. Erhard, L., Prosperity Through Competition, Frederick A. Praeger New York, 1958, p. 102. Available at: http:
//mises.org/sites/default/files/Prosperity%20Through%20Competition_3.pdf, [Online] 5. Keynes, J. M., The raising of prices, [Online], 1933. Available at: http://www.panarchy.org/keynes/depression.html 6. Keynes, J. M., The end of laissez-faire, [Online], 1926, p. 4. Available at: https://www.panarchy.org/keynes/laissezfaire.1926.html 7. Keynes, J. M., The General Theory of Employment, Interest, and Money, Publica Publishing, Bucharest, 2009, p. 190. 8. Keynes, J. M., A Tract on Monetary Reform, Macmillan and Co, [Online], 1924, p. 80. Available at:
http://delong.typepad.com/keynes-1923-a-tract-on-monetary-reform.pdf 9. World Bank Data, [Online]. Available at: http://data.worldbank.org/ 10. Feld, L., Schmidt, C., Schnabel, I., Wieland, V. VOX, Maastricht 2.0: Safeguarding the future of the Eurozone, [Online], 2016.
Available at: http://voxeu.org/article/maastricht-20-safeguarding-future-eurozone 11. German Council of Economic Experts, German Council of Economic Experts discusses reform needs to make the euro area more
stable and proposes sovereign insolvency mechanism. Press Release, [Online], 2015, p. 2, access at: https://www.sachverstaendigenrat-wirtschaft.de/fileadmin/dateiablage/download/pressemitteilungen/gcee_press_release_07_15.pdf
12. Council of the European Communities. Commission of the European Communities. Treaty on European Union, [Online], Art. 105, 1992, p. 29. Available at: https://europa.eu/european-union/sites/europaeu/files/docs/body/treaty_on_european_union_en.pdf
13. Deutsche Welle, German bank chief trashes Eurobonds, [Online], 2012. Available at: http://www.dw.com/en/german-bank-chief-trashes-eurobonds/a-15977530
14. Weidmann, J., Aspiration and reality – the situation in the European monetary union, [Online], 2016, p. 3. Available at: http://www.bis.org/review/r160928m.pdf
15. OECD Data [Online]. Available at: https://data.oecd.org/trade/current-account-balance.htm 16. Schäuble, W., We Germans don't want a German Europe, [Online], 2013. Available at:
https://www.theguardian.com/commentisfree/2013/jul/19/we-germans-dont-want-german-europe 17. Financial Times – Bofinger P., Here is one export Germany should not be making, [Online], 2016. Available at:
https://www.ft.com/content/da5b543c-2bbc-11e6-bf8d-26294ad519fc 18. Bofinger, P., German macroeconomics: The long shadow of Walter Eucken, [Online], VOX, 2016. Available at:
http://voxeu.org/article/german-macroeconomics-long-shadow-walter-eucken 19. Piketty, T., Sachs, J. D., Flassbeck, H., Rodrik, D., Wren-Lewis, S., Austerity Has Failed: An Open Letter From Thomas Piketty to
Angela Merkel, [Online], The Nation, 2015. Available at: https://www.thenation.com/article/austerity-has-failed-an-open-letter-from-thomas-piketty-to-angela-merkel/
20. Krugman, P., Keynes Was Right, The New York Times, [Online], 2011. Available at: http://www.nytimes.com/ 2011/12/30/opinion/keynes-was-right.html
21. BBC News, Obama calls for greater European unity, [Online], 2016. Available at: http://www.bbc.com/news/world-europe-36132526
22. European Central Bank, [Online], Statistics, Key ECB interest rates. Available at: http://www.ecb.europa.eu/ stats/policy_and_exchange_rates/key_ecb_interest_rates/html/index.en.html
23. Pronobis, M., Is Monetary Policy of ECB the Right Response to the Eurozone Crisis?, [Online], Procedia – Social and Behavioral Sciences, Volume 156, November 2014, pages 398-403, DOI: http://dx.doi.org/10.1016/j.sbspro.2014.11.210
ISSN 1728-2667 ЕКОНОМІКА. 3(198)/2018 ~ 109 ~
G. Rîmbu, PhD candidate Lucian Blaga University of Sibiu, Sibiu, Romania
L. Constantinescu, PhD in Economics, Associate Professor Dimitrie Cantemir Christian University of Bucharest
DOI: https://doi.org/10.17721/1728-2667.2018/198-3/10 p. 74-87
IMPROVING YOUTHS' SOCIAL SITUATION IN THE EUROPEAN UNION
The European Union's social policies of the last years aimed at improving the social conditions of youths across Europe. The goal of
this paper is to comparatively analyse the characteristics of youths and their social conditions in the EU-27, during 2006-2016, using the following indicators associated to the young population: youth education and training, employment and unemployment rates, health, social inclusion, culture and creativity, participation and youth in the digital world. The paper also reviews the impact and efficiency of the EU's social policies in the current economic background, trying to catch the improvements in young people's social conditions. For this purpose, there were used Employment and Social Conditions Indicators and "Europe 2020" Strategy Indicators.
Our analysis reveals that over time the youths' aspirations and needs have changed along with their social conditions. The EU is obviously making progress in improving the social policies addressed to young people, but there are still visible differ-ences between the member states and new, innovative approaches are required to respond to youths' needs in the fast-changing economic and political context of Europe.
1. Duguleană, C., Litră A., V. 2015, Macroeconomie, Transilvania University of Brasov Publisher, pp. 52-65, pp. 72-79, pp. 93-104. 2. Colander, D. C., 1998, Macroeconomics. Third Edition, United States of America, Irwin/ McGraw-Hill, pp. 157-172. 3. Council of the European Union, 2009, Council Resolution of 27 November 2009 on a renewed framework for European cooperation
in the youth field (2010-2018), Official Journal of the European Union, 2009/C 311/01, pp.311/2-311/4. 4. Council of the European Union, 2015, COUNCIL RESOLUTIONS, Resolution of the Council and of the Representatives of the
Governments of the Member States, meeting within the Council, on a European Union Work Plan for Youth for 2016-2018, Official Journal of the European Union, 2015/C 417/01, pg. 417/1.
5. Dumitrache, V., Răileanu Szeleş, M., 2012, Particuliarities of the Romnian Welfare state, Bulletin of the Transilvania University of Braşov, Vol. 5 (54), No 1, Series V: Economic Sciences, Braşov.
6. European Commission, Addressing youth unemployment in the EU, Catalogue N.: KE-02-15-605-EN-N, 2015. 7. European Commission, 2016, Evaluation of the EU Youth Strategy and the Council Recommendation on the mobility of young vol-
unteers across the EU Final Report Executive Summary, Luxembourg, pp. 1-5. 8. European Commission, 2010, Communication from the Commission to the European Parliament, the Council, the European Eco-
nomic and Social Committee and The Committee of the Regions, Youth on the Move An initiative to unleash the potential of young people to achieve smart, sustainable and inclusive growth in the European Union, COM(2010) 477 final, Brussels, pp. 3-4.
9. European Commission, 2016, Communication from the Commission to the European Parliament, the Council, the European Eco-nomic and Social Committee and The Committee of the Regions, A NEW SKILLS AGENDA FOR EUROPE Working together to strengthen human capital, employability and competitiveness, COM(2016) 381, Brussels, 3 p.
10. European Commission, 2010, Communication from the Commission to the European Parliament, the Council, the European Eco-nomic and Social Committee and The Committee of the Regions, The European Platform against Poverty and Social Exclusion: A Europe-an framework for social and territorial cohesion, COM(2010) 758 final, Brussels, 3 p.
11. Eurostat, 2016, Newsletter Internet use by individuals Almost 8 out of 10 internet users in the EU surfed via a mobile or smart phone in 2016. Different patterns across Member States in managing personal information, 260/2016, 1 p.
12. Gorry, A., 2013, Minimum wages and youth unemployment, European Economic Review, Issue 64, pp. 57–75. 13. Kiss, F., Cocheci, D. (1993), Economie contemporană. Introducere în Micro- şi Macroeconomie – note de curs, Cluj-Napoca,
pp. 98-101, pp. 157-167. 14. Council of the European Union and European Commission, 2012, NOTICES FROM EUROPEAN UNION INSTITUTIONS,
BODIES, OFFICES AND AGENCIES, COUNCIL, EUROPEAN COMMISSION, Joint Report of the Council and the Commission on the implementation of the renewed framework for European cooperation in the youth field (2010-18), Official Journal of the European Union, 2012/C 394/03, pp. 394/6.
15. Pascouau, Y., 2013, Intra-EU mobility: the ‘second building block' of EU labour migration policy, Issue Paper No.74, May 2013, pp. 1-11. 16. http://ec.europa.eu/eurostat/data/database 17. http://ec.europa.eu/europe2020/index_en.htm
M. C. Turkes, PhD in Economics, Lecturer, L. Constantinescu, PhD in Economics, Associate Professor
Dimitrie Cantemir Christian University of Bucharest, Bucharest, Romania D. Topor, PhD in Economics, Lecturer
ORCID iD 0000-0002-9092-1449 1 Decembrie 1918 University, Alba Iulia
DOI: https://doi.org/10.17721/1728-2667.2018/198-3/11 p. 87-94
COMPARATIVE ANALYSIS OF BANKING PERFORMANCE OF COMERCIAL BANKS GROUPS.
CASE STUDY: TURKEY VS. ROMANIA
The purpose of this article is to present a comparative analysis of performance between two commercial bank groups from Turkey and Romania. In conducting the study we have considered evaluating financial performance achieved by a group of commercial banks in Turkey and Romania in relation to the Eurozone during 1999-2016 and examine the level of liquidity of assets acquired during these 18 years of activity of these two banking groups, in comparison with the Eurozone. In this analysis there were tested three hypotheses based on the performance indicators used by the two banking trade groups and the indicators used in the specialty literature. Results and interpretations from this study/ testing were presented and interpreted, in the case of these two banking trade groups. The article ends with the authors' conclusions related to comparative analysis of bank performance between the two commercial bank groups in Turkey and Romania.
1. Abbaso, O. F., Aysan, A. F. and and Gunes, A. 2007. Concentration, Competition, Efficiency and Profitability of the Turkish Banking
Sector in the Post – Crises Period, Munich Personal RePEc Archive (MPRA), paper no. 5494, pp. 1-24, [Online]. Available at: https://mpra.ub.uni-muenchen.de/5494/1/ [Accessed January 2016].

~ 110 ~ В І С Н И К Київського національного університету імені Тараса Шевченка ISSN 1728-3817
2. Alexiou, C., Sofoklis, V., 2009. Determinants of bank profitability: Evidence from the Greek banking sector. In: Ekonomski anali 54 (182), 93-18.
3. Andrieş, A. M. 2009. A comparative analysis of performance and soundness indicators of the main Romanian banks, The Scientific Annals of "Alexandru Ioan Cuza" University of Iaşi, Tom LVI Economical Sciences, pp. 45-70.
4. Andrieş, A. M., Cocriş, V., 2010. A Comparative Analysis of the Efficiency of Romanian Banks, Romanian Journal of Economic Forecasting 13, рр. 54-75.
5. Athanasoglou, P. P., Brissimis, S. N., Delis, M. D., 2005. Bank-Specific, Industry-Specific and Macroeconomic Determinants of Bank Profitability, Bank of Greece, Working Paper No. 25.
6. Athanasoglou, P. P., Delis, M. D., Staikouras, C. K., 2006. Determinants of Bank Profitability in the South Eastern European Region, Bank of Greece, Working Paper No 47.
7. Bashir, A., 2000. Assessing the Performance of Islamic Banks: Some Evidence from the Middle East, Paper presented at the ERF 8th meeting in Jordan.
8. NBR, 2016. Report on financial stability- december 2016, Year I, no. 2, pp. 56-57. 9. Demerguç-Kunt, A, Huizinga, H., 2001. Financial Structure and Bank Profitability, in "Financial Structure and Economic Growth: A
Cross-Country Comparison of Banks, Markets, and Development". In: Demirguc-Kunt, A., Levine, R. (Eds.). MIT Press, Cambridge. 10. Dietrich, A., Wanzenried, G., (2009). What Determines the Profitability of Commercial Banks? New Evidence from Switzerland. 12th
Conference of the Swiss Society for Financial Market Researches, Geneva. 11. Ekpu, V. and Paloni, A. 2015. Financialisation, Business Lending and Profitability in the UK, Adam Smith Business School, University of
Glasgow, Glasgow UK, pp.1-22, [Online]. Available at: http://www.gla.ac.uk/media/media_424705_en.pdf, [Accessed January 2016] 12. Gischer, H. and Richter, T., 2009. Performancemessung von Banken im internationalen Vergleich, Wirtschaftswissenschaftliches
Studium (WiSt), Vol 38(11), 565 [Online]. Available at: http://www.vwlgeld.ovgu.de/vwlgeld_media/downloads/publikationen/ Gischer_Richter_WiSt_2009.pdf, [Accessed january 2016].
13. Goddard, J., Molyneux, P., Wilson, J., 2004. Dynamics of Growth and Profitability in Banking, Journal of Money, Credit and Banking 36(3),1069-1090.
14. Hassan, M. K., Bashir, A., 2003. Determinants of Islamic Banking Profitability. Paper Presented at the Proceedings of the Economic Research Forum 10th Annual Conference, Marakesh-Morocco.
15. Horvath, R., 2009. The Determinants of the Interest Rate Margins of Czech Banks, Czech Journal of Economics and Finance 59(2), 128-136.
16. Iqbal, M., and Molyneux, Ph. 2005. Thirty Years ofIslamic Banking: History, Performance and Prospects. New York: Palgrave Macmillan.
17. Khan, H. M. I., Khan, I., Khan, M. S., Jan, R. U., Khattak, R. and Naveed, K., 2015. Profitability and Efficiency of Foreign and Domestic Banks: A Case Study of Pakistan, European Journal of Business of Management, 7(7), pp. 34-48.
18. Kosmidou, K., 2008. The Determinants of Banks' Profits in Greece during the Period of EU Financial Integration, Managerial Finance 34, 146-159
19. Mamatzakis, E. C., Remoundos, P. C., 2003. Determinants of Greek Commercial Banks Profitability, 1989 – 2000. SPOUDAI 53(1), 94-94. 20. Molyneux, P., Thorton, J., 1992. Determinants of European Bank Profitability; A Note. Journal of Banking and Finance 16,
pp. 1173-78. 21. Molyneux, P., Forbes, W. 1995. Market Structure and Performance in European Banking, Applied Economics 27(2): 155-159. 22. Nitoi Mihai (2009). Efficiency in the Romanian Banking System: An Application of Data Envelopment Analysis, Romanian Journal of
Economics, vol. 29, issue 2(38), pp. 162-176. 23. Ramlan, H. and Adnan, M. S., 2016. The Profitability of Islamic and Conventional Bank: Case Study in Malaysia, Procedia
Economics and Finance, vol. 35 pp. 359–367. 24. Samad, A., and Hassan M.K. 1999. The Performance of Malaysian Islamic Bank During1984-1997: An Exploratory
Study. International Journal of Islamic Financial Services 1, no. 3. 25. Samad, A., 2000. Islamic banking and finance in theory and practice: The experience of Malaysia and Bahrain. The American
Journal of Islamic Social Sciences 22(2), 69-86. 26. Samad, A., 2004. Performance of Interest-Free Islamic Banks Vis-a-Vis Interest-BasedConventional Banks of Bahrain. IIUM
Journal of Economics and Management 12, no. 2: 115-29. 27. Staikouras, C. and Steliaros, M., 1999. Determinants Factors of Profitability of the Greek Banking System. Journal of the Banking
Association of Greece, 19(20), 61-66.
D. Vasiu, Doctor of Sciences (Economics), Assistant,
L. Ilie, Doctor of Sciences (Economics), Professor Lucian Blaga University of Sibiu, Sibiu, Romania
DOI: https://doi.org/10.17721/1728-2667.2018/198-3/12 p. 95-100
CORRELATIONS BETWEEN FINANCIAL PERFORMANCE INDICATORS OF COMPANIES WITH CORE ACTIVITY IN THE ENERGY SECTOR AND RELATED INDUSTRIES, TRADED ON BUCHAREST STOCK EXCHANGE,
AND THE BET-NG INDEX
The results we obtained are invalidating the research hypothesis: there is a strong and direct link between the evolution of BET-NG index and the financial performance ratios of the component companies.
The analysis performed on the correlations between the evolution of BET-NG index and financial performance ratios indicates that in the majority of the cases the links are inverse and in 25% of the cases they are strong.
In what concerns the intensity of the correlations between the major financial performance ratios (ROA; ROE; EPS; Net Margin) and average values of BET-NG index, there is no strong link to justify the identification of a regression model. Consequently, we can affirm that the evolution of BET-NG index is determined by other factors, different than the financial performance of the component companies. This situation outlines new research developments that need extending the timeframe and the financial ratios used.
1. Anghelache, G., 2009. Piaţa de capital în context european, Ed. Economică, Bucureşti. 2. Halpern, P., Weston, J., Brigham, F,. 1994. Finance managerial Editura Economică, Bucureşti, pp. 88-120. 3. Hurduzeu, G., 2006. Pieţe şi burse internaţionale de valori. Ed. Pro Universitaria, Bucureşti.
ISSN 1728-2667 ЕКОНОМІКА. 3(198)/2018 ~ 111 ~
4. Jones, C. P., 1991. Investments. Analysis and Management, Third Edition, John Wiley & Sons. 5. Khan K. I., 2012. Effect of Dividends on Stock Prices – A Case of Chemical and Pharmaceutical Industry of Pakistan, Management,
Vol. 2, No 5, pp. 141-148. 6. Kodithuwakku S., 2016. Impact of Firm Specific Factors on the Stock Prices: A Case Study on Listed Manufacturing Companies in
Colombo. Stock Exchang International Journal for Research in Business, Management and Accounting, Vol. 2, Issue 3, pp. 67-76. 7. Saleh, M., 2015. Relationship between Firm's Financial Performance and Stock Returns: Evidence from Oil and Gas Sector
Pakistan. Journal of Energy Technologies and Policy, ISSN 2224-3232,ISSN 2225-0573, Vol. 5, No 10, 2015, pp. 27-32. 8. Sattam, A., Sameer A. A., 2012. Factors affecting Stock Market Prices in Amman Stock Exchange: A Survey Study European.
Journal of Business and Management Vol 4, No.8, x pp. 236-246. 9. Sharma, S., 2011. Determinants of Equity Share Prices in India. Journal of Arts, Science & Commerce Vol. II, Issue 4, pp. 51-60. 10. Stanciu, C. V., 2016. Correlation Analysis of the Bet-Fi Index's Constituents. Annals of the "Constantin Brâncuşi" University of
Târgu Jiu, Economy Series, Special Issue, vol. II/2016 pp. 86-92. 11. Stancu, I., 2007. Finance. Pieţe financiare şi gestiunea portofoliului. Investiţii directe şi finanţarealor. Analiza şi gestiunea financiară
financiară a întreprinderii. Ediţia a patra, Ed. Economică, Bucureşti. 12. Taimur S., Purohit H., Rekha P., Analysis of Factors Affecting Share Prices: The Case of Bahrain Stock Exchange. International
Journal of Economics and Finance, Vol. 7, No. 3; 2015, pp. 207-216, DOI: http://dx.doi.org/10.5539/ijef.v7n3p207. 13. Tudor, C., 2008. Firm-Specific Factors as Predictors of Future Returns for Romanian Common Stocks: Empirical Evidence.
International Journal of Economics and Finance, Vol.5, No. 3., pp. 73-78. 14. Vasiu, D. E., 2016.Case Study Regarding the Correlation Between the Main Indicators of Financial Performance and The Bet
Index, For the Companies Participating in The Bet Index, in The Period 2011-2015, Land Forces Academy Review, Nicolae Balcescu Land Forces Academy, Sibiu, Romania, No 4, pp. 357-364.
15. Index management rules, avilable on www.bvb.ro, last accesed may 2017. 16. www.bvb.ro. 17. www.tradeville.eu. 18. http://www.bvb.ro/info/indices/2016/2016.06.30%20-%20BET-NG%20Factsheet.pdf.

~ 112 ~ В І С Н И К Київського національного університету імені Тараса Шевченка ISSN 1728-3817
Annex 2
INFORMATION ABOUT AUTHORS (META-DATA)
Башев Храбрін – доктор економічних наук, професор, Інститут аграрної економіки, Софія, Болгарія Контактна інформація: [email protected] Башев Храбрин – доктор экономических наук, профессор, Институт аграрной экономики, София, Болгария Bachev Hrabrin – Doctor of Sciences (Economics), Professor, Institute of Agricultural Economics, Sofia, Bulgaria
Беласку Лучіан – доктор економічних наук, професор, кафедра менеджменту, маркетингу та ділового адміністрування, Уні-
верситет імені Лучіана Блага, Сібіу, Румунія Контактна інформація: +40742610003, [email protected], [email protected], [email protected] Хоробет Олександра – доктор економічних наук, професор, кафедра міжнародного бізнесу та економіки, Бухарестський еко-
номічний університет, Бухарест, Румунія Поповичі Оана – доктор економічних наук, доцент, кафедра міжнародного бізнесу та економіки, Бухарестський економічний
університет, Бухарест, Румунія Беласку Лучиан – доктор экономических наук, профессор, кафедра менеджмента, маркетинга и делового администрирова-
ния, Университет имени Лучиана Блага, Сибиу, Румыния Хоробет Олександра – доктор экономических наук, профессор, кафедра международного бизнеса и экономики, Бухарестский
экономический университет, Бухарест, Румыния Поповичи Оана – доктор экономических наук, доцент, кафедра международного бизнеса и экономики, Бухарестский экономи-
ческий университет, Бухарест, Румыния Belascu Lucian – Doctor of Sciences (Economics), Professor, Department of Management, Marketing and Business Administration,
Lucian Blaga University of Sibiu, Sibiu, Romania Horobet Alexandra – Doctor of Sciences (Economics), Professor, Department of International Business and Economics, Bucharest
University of Economic Studies, Bucharest, Romania Popovici Oana – Doctor of Sciences (Economics), Assistant Professor, Department of International Business and Economics, Bucha-
rest University of Economic Studies, Bucharest, Romania Бурнете С. – кандидат економічних наук, професор, кафедра менеджменту, маркетингу, ділового адміністрування, Університет
імені Лучіана Блага, Сібіу, Румунія Бурнете С. – кандидат экономических наук, профессор, кафедра менеджмента, маркетинга, делового администрирования,
Университет имени Лучиана Блага, Сибиу, Румыния Burnete S. – PhD in Economics, Professor, Department of Management, Marketing, Business Administration, Lucian Blaga University
of Sibiu, Sibiu, Romania Думітреску Луїджі-Ніколає – доктор економічних наук, професор, кафедра менеджменту, маркетингу та ділового адміністру-
вання, Університ імені Лучіана Блага, Сібіу, Румунія Контактна інформація: +4 (0269) 210375 Фучі Мірча М. – доктор економічних наук, доцент, кафедра економіки, Румуно-німецький університет, Сібіу, Румунія Контактна інформація: +4 (0269) 233568 Горські Гортензія – доктор економічних наук, професор, кафедра економіки, Румуно-німецький університет, Сібіу, Румунія Контактна інформація: +4 (0269) 233568 Думитреску Луиджи-Николае – доктор экономических наук, профессор, кафедра менеджмента, маркетинга и бизнес-
администрирования, Университет имени Лучиана Блага, Сибиу, Румыния Фучи, Мирча М. – доктор экономических наук, доцент, кафедра экономики, Румынско-германский университет, Сибиу, Румыния Горски Гортензия – доктор экономических наук, профессор, кафедра экономики, Румынско-германский университет, Сибиу,
Румыния Dumitrescu Luigi-Nicolae – Doctor of Sciences (Economic – Marketing), Professor, Management, Marketing and Business Admin-
istration, Faculty of Economics, Lucian Blaga University of Sibiu, Sibiu, Romania Fuciu Mircea M. – Doctor of Sciences (Economic - Marketing), Assistant Professor, Department of Economics, Romanian-German
University of Sibiu, Sibiu, Romania Gorski Hortensia – Doctor of Sciences (Economic – Management), Professor, Department of Economics, Romanian-German Univer-
sity of Sibiu, Sibiu, Romania
Глінковська Беата – доктор економічних наук, адьюнкт кафедри менеджменту, відділ теорії менеджменту, Університет
м. Лодзь, Польща Контактна інформація: +48 608-405-470, [email protected] Чеботарьов Єгор Вячеславович – кандидат економічних наук, старший викладач кафедри економічної теорії, маркетингу та
підприємництва, ДЗ "Луганський національний університет імені Тараса Шевченка", Старобільськ, Україна Контактна інформація: +38(098)119 45 05, [email protected] Чеботарьов Вячеслав Анатолійович – доктор економічних наук, професор, завідувач кафедри економічної теорії, маркетингу
та підприємництва, ДЗ "Луганський національний університет імені Тараса Шевченка", Старобільськ, Україна Контактна інформація: +38(050)62 00 798, [email protected] Глинковска Беата – доктор экономических наук, адьюнкт кафедры менеджмента, отдел теории менеджмента, Университет
г. Лодзь, Польша Чеботарёв Егор Вячеславович – кандидат экономических наук, старший преподаватель кафедры экономической теории,
маркетинга и предпринимательства, ГУ "Луганский национальный университет имени Тараса Шевченко", Старобельск Чеботарёв Вячеслав Анатольевич – доктор экономических наук, профессор, заведующий кафедрой экономической теории,
маркетинга и предпринимательства, ГУ "Луганский национальный университет имени Тараса Шевченко", Старобельск
ISSN 1728-2667 ЕКОНОМІКА. 3(198)/2018 ~ 113 ~
Glinkowska Beata – Doctor of Sciences (Economics), Department of Management, Chair of Management Theory, The University of Lodz, Poland
Сhebotarov Іеgor – PhD in Economics, senior lecturer, Departments of economic theory, marketing and entrepreneurship, SI "Luhansk Taras Shevchenko National University", Starobilsk, Ukraine
Сhebotarov Viacheslav – Doctor of Science (Economics), Professor, Head of the Department of economic theory, marketing and en-trepreneurship, SI "Luhansk Taras Shevchenko National University", Starobilsk, Ukraine
Івохін Євген Вікторович – доктор фізико-математичних наук, професор, кафедра системного аналізу та теорії прийняття рі-шень, факультет комп'ютерних наук та кібернетики, Київський національний університет імені Тараса Шевченка, Київ, Україна
Контактна інформація: 066-709-83-24, (044) 044-258-8984, [email protected] Навродський Володимир Олександрович – кандидат фізико-математичних наук, доцент, кафедра економіки, Київський
національний університет культури і мистецтв, Київ, Україна Контактна інформація: 050-836-77-31, (044) 044-2588984, е-mail: [email protected] Aпанасенко Дмитро Володимирович – аспірант, кафедра системного аналізу та теорії прийняття рішень, факультет комп'-
ютерних наук та кібернетики, Київський національний університет імені Тараса Шевченка, Київ, Україна Контактна інформація: 063-144-00-82, (044) 044-2588984, [email protected] Ивохин Евгений Викторович – доктор физико-математических наук, профессор, кафедра системного анализа и теории при-
нятия решений, факультет компьютерных наук и кибернетики, Киевский национальный университет имени Тараса Шевченко, Ки-ев, Украина
Навродский Владимир Александрович – кандидат физико-математических наук, доцент, кафедра экономики, Киевский национальный университет культуры и искусств, Киев, Украина
Aпанасенко Дмитрий Владимирович – аспирант, кафедра системного анализа и теории принятия решений, факультет ком-пьютерных наук и кибернетики, Киевский национальный университет имени Тараса Шевченко, Киев, Украина
Ivokhin Eugene – Doctor of Sciences (Physics and Mathematics), Professor, Department of System Analysis and Decision Making Theory, Faculty of Computer Science and Cybernetics, Taras Shevchenko National University of Kyiv, Kyiv, Ukraine
Navrodskiy Volodymyr – PhD in Physics and Mathematics, Associate Professor, Department of Economy, Kyiv National University of Culture and Arts, Kyiv, Ukraine
Apanasenko Dmytro – PhD Student, Department of System Analysis and Decision Making Theory, Faculty of Computer Science and Cybernetics, Taras Shevchenko National University of Kyiv, Kyiv, Ukraine
Харламова Ганна Олексіївна – кандидат економічних наук, доцент, доцент кафедри економічної кібернетики, Київський наці-ональний університет імені Тараса Шевченка, Київ, Україна
Контактна інформація: 067-449-20-45, (044)259-70-43, [email protected] Ставицький Андрій Володимирович – кандидат економічних наук, доцент, доцент кафедри економічної кібернетики, Київсь-
кий національний університет імені Тараса Шевченка, Київ, Україна Контактна інформація: 067-755-56-47, (044)259-70-43, [email protected] Нате Сільвіу – кандидат економічних наук, доцент, Університет імені Лучіана Блага, Сібіу, Румунія Харламова Ганна Алексеевна – кандидат экономических наук, доцент кафедры экономической кибернетики, Киевский наци-
ональный университет имени Тараса Шевченко, Киев, Украина Ставицкий Андрей Владимирович – кандидат экономических наук, доцент кафедры экономической кибернетики, Киевский
национальный университет имени Тараса Шевченко, Киев, Украина Натэ Сильвиу – кандидат экономических наук, доцент, Университет имени Лучиана Блага, Сибиу, Румыния Kharlamova Ganna – PhD in Economics, Associate Professor, Department of Economic Cybernetics, Taras Shevchenko National
University of Kyiv, Kyiv, Ukraine Stavytskyy Andriy – PhD in Economics, Associate Professor, Department of Economic Cybernetics, Taras Shevchenko National
University of Kyiv, Kyiv, Ukraine Nate Silviu – PhD (Economics), Associate Professor, Lucian Blaga University of Sibiu, Sibiu, Romania Лоулер Кевін Ентоні – професор, економічний факультет, коледж ділового адміністрування, Кувейтський університет, Кувейт,
Кувейт Контактна інформація: [email protected] Садік Савсан – здобувач, економічний факультет, коледж ділового адміністрування, Кувейтський університет, Кувейт, Кувейт Лоулер Кевин Энтони – профессор экономики, экономический факультет, колледж делового администрирования, Кувейтский
университет, Кувейт, Кувейт Садік Савсан – соискатель, аспирант факультета экономики, колледж делового администрирования, Кувейтский университет,
Кувейт, Кувейт Kevin Anthony Lawler – Professor, Department of Economics, College of Business Administration, Kuwait University, Kuwait, Kuwait Sadeq Sawsan – Graduate Research Student, Department of economics, College of Business Administration, Kuwait University,
Kuwait, Kuwait Попа Себастьян – доктор економічних наук, асистент, економічний факультет, кафедра менеджменту, маркетингу, ділового
адміністрування, Університет імені Лучіана Блага, Сібіу, Румунія Попа Cебастьян – доктор экономических наук, ассистент, факультет экономических наук, кафедра менеджмента, маркетинга,
делового администрирования, Университет имени Лучиана Блага, Сибиу Румыния Popa Cebastian – Doctor of Sciences (Economic), Teaching Assistant, Faculty of Economic Science, Department of Management,
Marketing, Business Administration, Lucian Blaga University of Sibiu, Sibiu, Romania Рімбу Габріела – аспірант, Університ імені Лучіана Блага, Сібіу, Румунія Контактна інформація: +40755072690, [email protected] Константинеску Ліліана Аврора – кандидат економічних наук, доцент, Християнський університет імені Димитрі Кантеміра,
Бухарест, Румунія Контактна інформація: +40744555066, [email protected]

~ 114 ~ В І С Н И К Київського національного університету імені Тараса Шевченка ISSN 1728-3817
Римбу Габриэла – аспирант, Университет имени Лучиана Блага, Сибиу, Румыния Константинеску Лилиана Аврора – кандидат экономических наук, доцент, Христианський университет имени Димитри Кан-
темира, Бухарест, Румыния Rîmbu Gabriela – PhD student, Lucian Blaga University of Sibiu, Sibiu, Romania Constantinescu Liliana Aurora – PhD in Economics, Associate Professor, Dimitrie Cantemir Christian University, Bucharest, Romania Тюркеш М. К. – кандидат економічних наук, Християнський університет імені Димитрі Кантеміра, Бухарест, Румунія Контактна інформація: [email protected] Константинеску Ліліана Аврора – кандидат економічних наук, доцент, Християнський університет імені Димитрі Кантеміра,
Бухарест, Румунія Контактна інформація: +40744555066, [email protected] Топор Д. І. – кандидат економічних наук, лектор, Університет імені 1 грудня 1918 року, Альба Юлія, Румунія Контактна інформація: [email protected] Тюркеш М. К. – кандидат экономических наук, лектор, Христианський университет имени Димитри Кантемира, Бухарест,
Румыния Константинеску Лилиана Аврора – кандидат экономических наук, доцент, Христианський университет имени Димитри Кан-
темира, Бухарест, Румыния Топор Д. І. – кандидат экономических наук, лектор, Университет имени 1 декабря 1918 года, Альба Юлія, Румыния Turkes M. C. – PhD in Economics, Dimitrie Cantemir Christian University, Bucharest, Romania Constantinescu Liliana Aurora – PhD in Economics, Associate Professor, Dimitrie Cantemir Christian University, Bucharest, Romania Topor D. I. – PhD in Economics, Lecturer. 1 Decembrie 1918 University, Alba Iulia, Romania Васі Діана Олена – доктор економічних наук, асистенит, Університет імені Лучіана Блага, Сібіу, Румунія Контактна інформація: +400744452733, [email protected] Іллє Лівія – доктор економічних наук, професор, Університ імені Лучіана Блага, Сібіу, Румунія Васи Диана Елена – доктор экономических наук, ассистент, Университет имени Лучиана Блага, Сибиу, Румыния Илле Ливия – доктор экономических наук, профессор, Университет имени Лучиана Блага, Сибиу, Румыния Vasiu Diana Elena – Doctor of Sciences (Economics), Assistant, Lucian Blaga University of Sibiu, Sibiu, Romania Ilie Livia – Doctor of Economics, Professor, Lucian Blaga University of Sibiu, Sibiu, Romania

ISSN 1728-2667 ЕКОНОМІКА. 3(198)/2018 ~ 115 ~
Вісник Київського національного університету імені Тараса Шевченка. Економіка. – це рецензований, цитований у міжнародних наукометричних базах науковий
журнал, що видається із 2017 року шість разів на рік і присвячений дослідженням в економічній сфері.
Журнал видається з 1958 року
Атестовано
Вищою атестаційною комісією України. Постанова Президії ВАК України № 241 від 09.03.16
Зареєстровано
Державною реєстраційною службою України. Свідоцтво про державну реєстрацію КВ № 19866-9666ПР від 29.04.13
Засновник та видавець Київський національний університет імені Тараса Шевченка,
Видавничо-поліграфічний центр "Київський університет". Свідоцтво внесено до Державного реєстру
ДК № 1103 від 31.10.02 Адреса видавця: 01601, Київ-601, б-р Т. Шевченка
Індексується в таких міжнародних наукометричних базах та депозитаріях:
РИНЦ (E-Library), Science Index, Ulrich's Periodicals Directory, Google Scholar, RepEc, Socionet, Index Copernicus (ICV 2016 = 78,52), CyberLeninka, OCLC WorldCat, CrossRef, J-Gate, Microsoft Academic Search, Bielefeld Academic Search Engine (BASE), Registry of Open Access Repositories (ROAR), The Directory of Open Access Repositories (OpenDOAR), IDEAS, EconPapers, CiteFactor (indexed), Maksymovych Scientific Library of Taras Shevchenko National University of Kyiv, National Library of Ukraine Vernadsky, DOAJ, ProQuest, CitEc, RedLink, Infobase (India), Researchbib (Japan), MIAR (Spain) (ICDS = 6,5), Directory of Research Journals Indexing (DRJI), Social Science Research Network, Scіentіfіc Іndexіng Servіces, Open Academic Journals IndexGIGA Information Centre, Thomson Reutars ESCI (under evaluation), Сabell's (pending), Scopus (under evaluation) etc.
DOI префікс: 10.17721 (з 2013)
"Вісник Київський національний університет імені Тараса Шевченка. ЕКОНОМІКА" вітає рукописи, що відповіда-ють загальним критеріям значимості в зазначеній предметній галузі:
• оригінальні статті із фундаментальних і прикладних досліджень, • тематичні дослідження, • критичні відгуки, огляди, думки, коментарі й есе.
Проблематика: актуальні проблеми економіки й економічної теорії; менеджмент; маркетинг; міжнародна економіка й економічні відносини; облік, аудит та оподаткування; фінанси, банківська справа та страхування; підпрприємництво, торгівля та біржова діяльність; економіко-математичне моделювання та інформаційні технології в економіці.
Запрошуємо науковців до співпраці! Статті збираються на постійній основі. Тексти приймаються чотирма мовами:
українською, російською, англійською та німецькою. Приймаємо файли на емейл [email protected]
або через форму на сайті: http://bulletin-econom.univ.kiev.ua
Наукове видання
ВІСНИК
КИЇВСЬКОГО НАЦІОНАЛЬНОГО УНІВЕРСИТЕТУ ІМЕНІ ТАРАСА ШЕВЧЕНКА
ЕКОНОМІКА
Випуск 3(198)
Друкується за авторською редакцією
Оригінал-макет виготовлено Видавничо-поліграфічним центром "Київський університет"
Автори опублікованих матеріалів несуть повну відповідальність за підбір, точність наведених фактів, цитат, економіко-статистичних даних, власних імен та інших відомостей. Редколегія залишає за собою право скорочувати та редагувати подані матеріали.
Формат 60х841/8. Ум. друк. арк. 13,5. Наклад 300. Зам. № 218-8769. Гарнітура Arial. Папір офсетний. Друк офсетний. Вид. № Е3.
Підписано до друку 27.06.18
Видавець і виготовлювач Видавничо-поліграфічний центр "Київський університет"
01601, Київ, б-р Т. Шевченка, 14, кімн. 43 (38044) 239 3222; (38044) 239 3172; тел./факс (38044) 239 3128
e-mail: [email protected]; [email protected] http: vpc.univ.kiev.ua
Свідоцтво суб'єкта видавничої справи ДК № 1103 від 31.10.02