Uttaranchal - CMO Dehradun
192
Uttaranchal Reproductive and Child Health District Level Household Survey 2002-04 International Institute for Ministry of Health & Family Population Research Centre Population Sciences Welfare, Government of India Institute of Economic Growth (Deemed University) New Delhi – 110 011 University Enclave, Delhi – 110 007 Mumbai – 400 088 DLHS -2
-
Upload
khangminh22 -
Category
Documents
-
view
0 -
download
0
Transcript of Uttaranchal - CMO Dehradun
DLHS-2
Uttaranchal
Reproductive and Child Health
District Level Household Survey 2002-04
International Institute for Ministry of Health & Family Population Research Centre
Population Sciences Welfare, Government of India Institute of Economic Growth (Deemed University) New Delhi – 110 011 University Enclave, Delhi – 110 007
Mumbai – 400 088
DLHS -2
Reproductive and Child Health
District Level Household Survey (DLHS - 2)
Uttaranchal
2002-04
International Institute for Population Sciences, (Deemed University) Mumbai – 400 088
Ministry of Health & Family
Welfare, Government of India, New Delhi- 110 011
Population Research Centre Institute of Economic Growth University Enclave, Delhi - 7
Contributors
Population Research Centre, Institute of Economic Growth, Delhi
S.C. Gulati P.N. Mari Bhat Suresh Sharma
International Institute for Population Sciences, Mumbai
F. Ram B. Paswan
L. Ladu Singh Rajiv Ranjan Ashok Kumar
CONTENTS Page Tables …………………………………………………………………………….………
Figures …………………………………………………………………………..…..……Maps… …………………………………………………………………..……………….Preface and acknowledgement ……………………………………………………………Key Indicators …………………………………………………………………….………Salient Findings …………………………………………………………………..………
iv vii vii ix xi
xiii CHAPTER I INTRODUCTION 1.1
1.2 1.3 1.4 1.5 1.6 1.7 1.8 1.9
Background and Objectives of the Survey ………...……….……………………….Survey Design..………………………….………..…………….………………….House Listing and Sample Selection …………….………….……….…………….Questionnaire ….……………………………….….………..…………….………..Fieldwork and Sample Coverage ……………..…………..………………………..Data processing ………………………………………..…………………………..Sample Weights ………………………………..…………………………………..Sample Implementation ………………………..…………………………………..Basic Demographic Profile of the State…….………..………..……………………
1 2 2 3 5 5 5 7 8
CHAPTER II BACKGROUND CHARACTERISTICS OF HOUSEHOLD 2.1
2.2 2.3 2.4 2.5 2.6 2.7 2.8 2.9 2.10 2.11 2.12 2.13
Age –Sex Structure.…………………………………………………………………Household Characteristic …………………………………………………………..Educational Level .…………………………………………………………………Marital Status of the Household Population ……………………………………….Marriages ……….………………………………………………………………….Morbidity Rates …..………………………………………………………………..Morbidity Rates by District……………… …………………………………………Housing Characteristics ……………………………………………………………Housing Characteristics by District……………...…………………………………Iodization of Salt ……………………………………………………………………Iodization of Salt by District……………… .………………………………………Availability of Facilities and Services in Rural India ………………………………Availability of Education Facility and Health Services by District…………………
11 12 14 17 18 19 20 21 23 24 26 26 28
CHAPTER III CHARACTRERISTICS OF WOMEN, HUSBANDS AND FERTILITY
3.1 3.2 3.3 3.4 3.5 3.6 3.7 3.8 3.9 3.10
Background Characteristics of Women ……………………………………………Educational Level of Women ………………………………………………………Background Characteristics of Husbands’ of Eligible Women ……………………Educational Level of Husbands’ of Eligible Women ………………………………Children Ever Born and Surviving …………………………………………………Completed Fertility by District……………. ………………………………………Birth Order …………………………………………………………………………Birth Order by District ……………………………………………………………..Fertility Preference …………………………………………………………………Pregnancy Outcomes ………………………………………………………………
33 35 36 38 39 41 42 43 45 46
ii
Page CHAPTER IV MATERNAL HEALTH CARE 4.1
4.2 4.3 4.4 4.5 4.6 4.7 4.8 4.9 4.9.1 4.9.2 4.9.3 4.10 4.11 4.12 4.13 4.14
Antenatal Check-Ups………………………………………………………………Antenatal Check-Ups at Health Facility……………………………………………Antenatal Check-Ups by District……………………………………………………Reasons for Not Seeking Antenatal Check-Ups……………………………………Components of Antenatal Check-Ups………………………………………………Antenatal Care Services……………………………………………………………Antenatal Care Indicator by Districts………………………………………………Pregnancy Complication and Treatment……………………………………………Delivery Care…………………………………………………………………….…Place of Delivery……………………………………………………………………Assistance during Home Delivery …………………………………………………Delivery Assisted by Skilled Person…………………..……………………………Reasons for Not Going to Health Institutions for Delivery…………………………Delivery Characteristics by Districts……………………………………………….Complication during Delivery….……….………………………………………….Post Delivery Complication and Treatment ……………………………………….Extent of Obstetric Morbidity by District………..…………………………………
50 52 53 54 55 56 61 62 65 65 67 69 70 71 72 74 78
CHAPTER V CHILD CARE AND IMMUNIZATION 5.1
5.1.1 5.2 5.3 5.4 5.5 5.6 5.7 5.7.1 5.7.2 5.7.3 5.7.4 5.7.5
Breastfeeding……………………………….……………..………………………Breastfeeding by Districts…………………………………………………………Immunization of Children…………………………………………………………Source of Immunization……………………………………………………………Reasons for Not Immunizing the Children…………………………………………Vitamin A and Iron Supplementation…….. ………………………………………Immunization Coverage by Districts………………………………………………Child Morbidity and Treatment……………………………………………………Awareness of Diarrhoea…………………….………………………………………Treatment of Diarrhoea……………………………………………………………Awareness of Pneumonia …………………….……………………………………Treatment of Pneumonia……………………………………………………………Awareness of Pneumonia and Incidence of Pneumonia by District……….. …….
83 86 87 92 92 93 95 96 96 97 99 99 101
CHAPTER VI FAMILY PLANNING
6.1 6.1.1 6.1.2 6.1.3 6.2 6.2.1 6.2.2 6.2.3 6.3 6.4
Knowledge of Family Planning Methods…….……………………………………Knowledge of Family Planning Methods by District……..………………………Knowledge of No-Scalpel Vasectomy ….……………..……………………………Knowledge of No-Scalpel Vasectomy by District………..…………………………Current Use of Family Planning Methods….……………..………………………Current Use of Family Planning Methods by District……..………………………Current Use and Ever Use of Family Planning Methods by Women.………………Current Use and Ever Use of Family Planning Methods by Husbands……………Reasons for Not Using Male Methods.…….……………..…………………………Source of Contraceptive Methods………….……………..…………………………
105 108 108 109 109 111 112 113 114 115
iii
Page 6.5
6.6 6.7 6.7.1 6.7.2 6.8 6.8.1 6.9 6.9.1
Problems with Current Use of Contraceptive Method……..………………………Treatment for Contraceptive Related Health Problems.…..………………………Advice to Non-Users to Use Contraception…………..…………………………..Future Intention to Use Contraceptive ….……………..…………………………Future Intention to Use by Number of Living Children …………………………Reasons for Discontinuation and Non-Use of Contraception………………………Reasons for Not Using Contraceptive Methods…………..………………………Unmet Need for Family Planning Services..……………..…………………………Unmet Need for Family Planning Services by District…..…………………………
117 118 119 119 120 121 122 123 125
CHAPTER VII ACCESSIBILITY AND PERCEPTION ABOUT GOVERNMENT HEALTH FACILITIES
7.1 7.2 7.3 7.4 7.5 7.6 7.7 7.8 7.9 7.10 7.11 7.12
Home Visit By Health Worker………………………..……………………………Home Visit By Health Worker by District..……………..…………………………Matter Discussed during Home Visit or Visits to Health Facilities.………………Visit to Health Facility………………….……………..……………………………Visit to Health Facility by District…………….……..……………………………Client’s Perception of Quality of Government Health Services.…………………Reasons for Not Visiting Government Health Centre….…………………………Family Planning Services and Advice Received………….………………………Availability of Pills and Condom………..…………..……………………………Quality of Care of Family Planning Services……………..………………………Quality of Care of Family Planning Services District…………….………………Quality of Care of Maternal Health Care….……………..…………………………
127 129 130 132 133 134 134 135 135 136 138 139
CHAPTER VIII REPRODUCTIVE HEALTH PROBLEMS AND AWARENESS OF RTIs/STIs and HIV/AIDS
8.1 8.1.1 8.2 8.3 8.4 8.5 8.5.1 8.5.2 8.5.3 8.5.4 8.5.5 8.6
Awareness of RTI/STI………………..……………………………………………Knowledge of Mode of Transmission of RTI/STI…………………………………Prevalence of RTI/STI …………………..…………………………………………Menstruation Related Problems……………………………………………………Prevalence of RTIs/STIs by District ..………………………………………………HIV/AIDS……………………………………………………………………………Knowledge of HIV/AIDS……………………………………………………………Knowledge of Mode of Transmission about HIV/AIDS……………………………How to avoid HIV/AIDS……………………………………………………………Misconception about HIV/AIDS……………………………………………………Knowledge of Curability of HIV/AIDS……………………………………………Awareness of RTI/STI and HIV/AIDS by Districts…………….…………………
141 145 147 151 153 153 154 158 160 162 164 165
APPENDICES
Appendix A Estimation of Sampling Errors ……………………….…………….… Appendix B DLHS-RCH Staff .………………………………………………..…. Appendix C Questionnaires ………………………………………………..………
167 175 179
iv
TABLES PageTable 1.1 Table 1.2 Table 1.3
Number of Households Interviewed…………………………………..………Number of Women and Husbands Interviewed….…………………..………Basic demographic indicator ……………………………………………..…
7 8 9
Table 2.1 Table 2.2 Table 2.3 Table 2.4 Table 2.5 Table 2.6 Table 2.7 Table 2.8 Table 2.9 Table 2.10 Table 2.11 Table 2.12 Table 2.13 Table 2.14 Table 2.15 Table 3.1 Table 3.2 Table 3.3 Table 3.4 Table 3.5 Table 3.6 Table 3.7 Table 3.8 Table 3.9 Table 3.10 Table 4.1 Table 4.2 Table 4.3 Table 4.4 Table 4.5 Table 4.6 Table 4.7 Table 4.8 Table 4.9 Table 4.10 Table 4.11 Table 4.12 Table 4.13 Table 4.14 Table 4.15 Table 4.16
Household population by age and sex …………………………………..……Household characteristics ………………………….……………………..…Educational level of the household population …………………………..…Marital status of the household population ……………………………..……Marriage ……………………………………………………………..………Morbidity rates ……………………….…………………………………..…Morbidity rates by district……… …………………………………..………Housing characteristics …………………………………………………..…Housing characteristics by district……….. ………………………..……….Iodization of salt…………………………………………………………..…Iodization of salt by district……… ………………………………..……….Distance from the nearest education facility …………………………..……Distance from the nearest health facility ………………………………..……Availability of services …………………………………………………..…Availability of facility and services by district…………. …………..………Background characteristics of women …………………………………..……Level of education of eligible women …………………………………..……Background characteristics of men ……………………………………..……Level of education of men ………………………………………………..…Children ever born and living …………………………………………..……Completed fertility by district …………………………………………..……Birth order ……………………………………………………………..……Birth order by district …………………………………………………..……Fertility preference ……………………………………………………..……Outcomes of pregnancy ……….………………………………………..……Antenatal check-up ……………………………………………………..……Place of antenatal check-up ……………………………………………..……Antenatal check-ups by district …………………………………………..…Reasons for not seeking antenatal check-ups …………………………..……Components of antenatal check-ups ……………………………………..…Antenatal care ………………………………….…………………..……….Antenatal care indicators by district ……………………………………..…Pregnancy complications …….……………………………………..………Treatment for pregnancy complications ………………………………..……Place of delivery…………………………………………………………..…Assistance during home delivery and safe delivery ……………………..……Reasons for not going to health institutions for delivery ………………..……Delivery characteristics by district ……………………………………..……Delivery complications …………………………………………………..…Post delivery complications ……………………………………………..……
Treatment for post delivery complications ………………………………..
12 13 14 17 18 19 20 22 24 25 26 27 27 28 29 34 36 37 39 40 41 42 44 46 47 51 52 54 55 56 57 61 63 65 66 68 71 72 73 75 77
v
Page Table 4.17 Table 5.1 Table 5.2 Table 5.3 Table 5.4 Table 5.5 Table 5.6 Table 5.7 Table 5.8 Table 5.9 Table 5.10 Table 5.11 Table 5.12 Table 5.13 Table 5.14 Table 6.1 Table 6.2 Table 6.3 Table 6.4 Table 6.5 Table 6.6 Table 6.7 Table 6.8 Table 6.9 Table 6.10 Table 6.11 Table 6.12 Table 6.13 Table 6.14 Table 6.15 Table 6.16 Table 6.17 Table 6.18 Table 6.19 Table 7.1 Table 7.2 Table 7.3 Table 7.4 Table 7.5 Table 7.6 Table 7.7 Table 7.8 Table 7.9 Table 7.10
Pregnancy, Delivery and Post delivery complications by district ………….Initiation of breastfeeding ………………………………………………..…Exclusive breastfeeding by child’s age ………………………………………Breastfeeding by district ………………………………………………..……Vaccination of children …………………………………………………..…Childhood vaccination received by 12 months of age ………………………Source of childhood vaccination ………….…………………………..……Reason for not giving vaccination ……………………………………..……Vitamin a and IFA supplementation for children ………………………..…Childhood vaccination by district ………………………………………..…Awareness of diarrhoea …………………………………………………..…Treatment of diarrhoea …………………………………………………..…Awareness of pneumonia ………………………………………………..……Treatment of pneumonia ………………………………………………..……Knowledge of diarrhoea management and pneumonia by district ……..……Knowledge of contraceptive methods …………………………………..……Knowledge of contraceptive methods by districts ……………………..……No-scalpel vasectomy (NSV)……………………………………………..…No-scalpel vasectomy by district ………………………………………..……Contraceptive prevalence rate …………………………………………..……Contraceptive prevalence rates by districts ……………………………..……Use of contraception by women ………………………………………..……Use of contraception by men ……………………………………………..…Reasons for not using male methods ……………………………………..…Source of modern contraceptive methods ………………………………..…Health problems with current use of contraception……………………..……Sought treatment for health problems with current use of contraception ……Advice on contraceptive use ………………..………………………………Future intention to use …………………………………………………..……Future use of contraception by number of living children ……………..……Reasons for discontinuation of contraception ………………………………Reason for not using contraceptive method ………….………………..……Unmet need for family planning services ………………………………..…Unmet need by district …………………………………………………..……Home visit by health worker ……………………………………………..…Home visit by health worker by district ………………………………..……Matter discussed during contact with a health worker ….………………..…Visit to health facility …………………………………………………..……Visit to health facility by district ………………………………………..……Quality of government health facility …………………………………..……Reason for not preferring government health facility …………………..……Advise to adopt family planning method ………………………………..……Availability of regular supply of condoms/pills ………………………..……Information of other modern method before sterilization ………………..…
78 84 85 86 88 91 92 93 94 95 97 98 100 101 102 106 107 108 109 110 112 113 114 115 116 117 118 119 120 121 122 123 124 125 128 130 131 132 133 134 135 136 136 137
vi
Page
Table 7.11 Table 7.12 Table 7.13 Table 7.14 Table 8.1 Table 8.2 Table 8.3 Table 8.4 Table 8.5 Table 8.6 Table 8.7 Table 8.8 Table 8.9 Table 8.10 Table 8.11 Table 8.12 Table 8.13 Table 8.14 Table 8.15 Table 8.16 Table 8.17 Table 8.18 Table 8.19
Information on side effect and follow-up for current method …………..……Quality of care indicators for contraceptive users by district ………………Advised to have delivery at health facility and follow-up services for post partum check-up ………………….………..…………………………..……Quality of care indicators for maternal care …………….………………..…Source of knowledge about RTI/STI among women ………………………Source of knowledge about RTI/STI among men ………………………..…Source of knowledge about mode of transmission of RTI/STI among women ……………………………………………………………..……….Source of knowledge about mode of transmission of RTI/STI among men…Symptoms of RTI/STI among women …………………………………..……Symptoms of RTI/STI among men ……………………………………..……Abnormal vaginal discharge …………………………………………..……Menstruation related problems …………………………………………..…Reproductive health care indicators by district …………………………..…Source of knowledge about HIV/AIDS among women ………………..……Source of knowledge about HIV/AIDS among men ……………………..…Source of knowledge about mode of transmission of HIV/AIDS among women ……………………………………………………………..……….Source of knowledge about mode of transmission of HIV/AIDS among men ……………………………………………………………..…………..Knowledge about avoidance of HIV/AIDS among women ……………..…Knowledge about avoidance of HIV/AIDS among men ………………..……Misconception about transmission of HIV/AIDS among women ……………Misconception about transmission of HIV/AIDS among men …………..…Knowledge of curability about HIV/AIDS ……………………………..……Awareness of RTI/STI and HIV/AIDS by district ……………………..……
137 138
139 140 143 144
145 146 147 149 151 152 153 155 156
158
159 161 162 163 164 165 166
vii
FIGURES
Page Figure 2.1 Figure 2.2 Figure 3.1 Figure 3.2 Figure 3.3 Figure 4.1 Figure 4.2 Figure 4.3 Figure 4.4 Figure 4.5 Figure 4.6 Figure 4.7 Figure 5.1 Figure 5.2 Figure 5.3 Figure 5.4 Figure 6.1 Figure 6.2 Figure 6.3 Figure 7.1 Figure 8.1 Figure 8.2 Figure 8.3 Figure 8.4
Age-sex-pyramid ………………………………………………………..……Percentage literate by age and sex ………….…………………………..……Birth order 3 & above by selected background characteristic …………..……Birth order 3 & above by district …………………………………..……….Fertility preference……………………………………………………..……Source of antenatal care ………………………………………………..……Full antenatal care by background characteristic ………………………..……Percentage of women with pregnancy complication and by symptoms ……Place of delivery and assistance during delivery ………………………..……Delivery assisted by skilled person by background characteristic …………Percentage of women with delivery complication and by symptoms ………Percentage of women with post delivery complication and by symptoms.…Initiation of breastfeeding ………………………………………………..…Percentage of children age 12-23 months who have received specific vaccination ……………………………………………………………..……Percentage of children age 12-23 months who have received all vaccination ……………………………………………………………..……Child vaccination by age ………………………………………………..……Knowledge of family planning method …………………………………..…Practice of family planning methods …..…………………………..……….Source of family planning among current users of modern contraceptive methods ……………………………………………………………..………Distribution of districts by home visit by health worker ………………..……Awareness of RTI/STI by sex according to residence …………………..……Symptoms of RTI/STI among women …………………………………..……Symptoms of RTI/STI among husbands…………………………..……….Awareness of HIV/AIDS by sex according to residence ………………..……
11 15 43 44 45 50 60 62 69 70 74 76 85
89
90 91 107 111
116 129 142 148 148 157
MAPS Page
Map 1 Map 2 Map 3 Map 4 Map 5 Map 6
Percent Girl Marrying Below Legal Age At Marriage…………………..……Percentage of Households Using Salt that Contains 15 ppm Level of Iodine……………………………………………………………...Percentage of Women Received Three or More Antenatal Check-ups..……Percentage of Delivery Attended by Skilled Person.……………………..…Percent Children (Age 12-23 Months) Who Have Received Full Vaccination……………………………………………………………..Current Use of Any Family Planning Method…..………………………..…
30
31 80 81
103 126
PREFACE AND ACKNOWLEDGEMENT
Government of India had launched the Reproductive and Child Health (RCH) program to ensure that couples have access to adequate information and services for reproductive health care. As a first step, family planning target has been withdrawn and an effort is being made to provide a package of reproductive services at different levels of health care centres.
Monitoring of the services is also being improved. New indicators are being added to assess quality of services and provision of an integrated reproductive health care service. The District Level Household Survey (DLHS) was initiated by Government of India and financed by the World Bank covering all the districts in the country. For the second time, district level estimates will be available for most of the critical reproductive health indicators. These important initiatives are certainly quite satisfying for all those who are concerned with taking ICPD reproductive health agenda ahead. The project is being coordinated by International Institute for Population Sciences, Mumbai and implemented by a number of consulting agencies.
For the purpose of data collection, uniform questionnaires, sampling design and field procedures were used throughout the country. The survey thus provided comparable data for all the districts in the state. The present report provides salient findings of Uttaranchal and covers all the districts. The findings of selected indicators of reproductive and child health services from the state of Uttaranchal are presented in the report.
It is believed that the data generated through the survey will meet the requirements of the Programme Administrators and Policy Makers for making effective interventions for providing quality services and achieving multiple objectives.
The DLHS-RCH could not have been successfully completed without cooperation and support from innumerable sources at various stages of the project. Although, it is not possible to acknowledge everyone involve in the survey, several organizations and individuals deserve special mention.
We would like to take this opportunity to acknowledge Shri P.K. Hota, Secretary, Ministry of Health and Family Welfare (MoHFW), Government of India. Our special thanks are due to Shri Y.N. Chaturvedi, Shri A.R. Nanda and Shri J.V.R. Prasada Rao, former Secretaries, Department of Family Welfare, GoI, who gave us an opportunity to participate as consulting organization in the survey of national importance. Our special thanks are due to Shri S.K. Sinha, Additional Director General, Ministry of Health and Family Welfare, GoI. Thanks are also due to Dr. K.V. Rao, Shri S.K Das and Shri D.K. Joshi, former Chief Directors for their help. We are also thankful to Shri Partho Chattopadhyaya, Chief Director and Shri K.D. Maiti, Director, Mrs. Rashmi Verma and Mr. Rezimohn, Assistant Directors, Statistics division of MoHFW for all the support extended by them. Our special thanks are due to Dr. T.K Roy, former Director and Senior Professor, IIPS, Mumbai, for his timely advice and valuable guidance. Thanks are also due to Dr. G. Rama Rao, Officiating Director, IIPS, Mumbai. We also acknowledge the contribution of Dr. F. Ram, Dr B. Paswan, Dr. L. Ladu Singh, coordinators of the project at IIPS,
x
Mumbai. It also gives us immense pleasure to thank Dr. G.N.V. Ramana, Public Health Specialist, World Bank, New Delhi for the able guidance and technical support he gave to the project. We would also like to thank the NSSO for their help in providing UFS Block for DLHS-2. Thanks are also due to state officials, Mr. Alok Sharma, State Secretary of Uttaranchal, Census and NSSO officials and other Districts authorities for all the support rendered. This facilitated us in the smooth and timely completion of the data collection.
We owe special thanks to Mr. Raghubansh Mani Singh, IEG, Delhi for his analytical and
drafting support for the report. Thanks are also due to Mr. Kailash Chandra Lakhara, Senior Research Officer and Mr. Manoj Kumar, Research Officer, IIPS, Mumbai for their assistance in the fieldwork of the project.
Thanks are due to UNICEF for funding the health component of survey. We are
especially thankful to Dr. C. Chandrasekar and Dr. V. Jayachandran, for their keen interest and timely supply of necessary inputs for the successful completion of health component of the survey. Our thanks are also to Dr. Prema Ramchandran, Advisor, Planning Commission for her keen interest in the subject.
We express our deep sense of gratitude to Prof. Kanchan Chopra, Director, Institute of
Economic Growth, for her constant encouragement and crucial administrative support all through the project work. We would like to express special appreciation and gratitude to the district Chief Medical Officers, who had rendered all the requisite support while conducing the fieldwork for the project. We would also acknowledge the strenuous work done by our field staff comprising Supervisors, Listers and Mappers, Male and Female investigators, without whose hard work the project work could never be successfully accomplished. We would be failing in our duty if we do not thank our respondents who spent their valuable time with tremendous patience. Prof. S.C. Gulati Prof. P.N. Mari Bhat
Dr. Suresh Sharma Population Research Centre Institute of Economic Growth University Enclave, Delhi – 7 September 2006
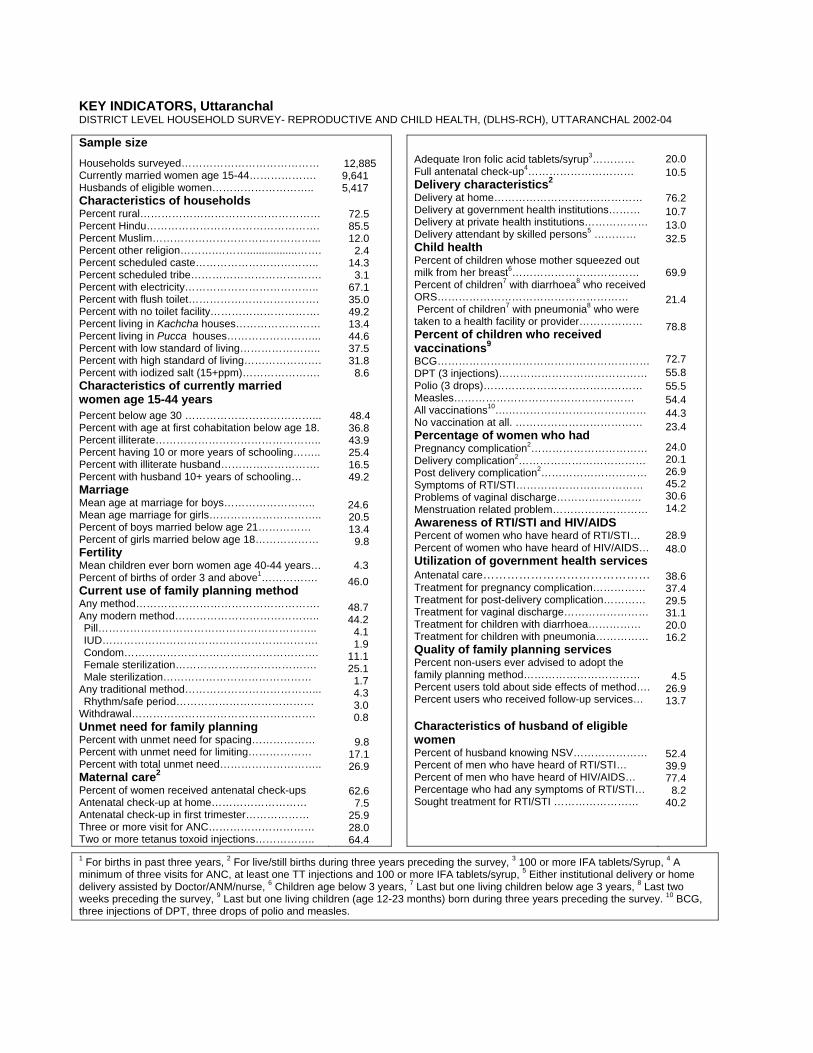
KEY INDICATORS, Uttaranchal DISTRICT LEVEL HOUSEHOLD SURVEY- REPRODUCTIVE AND CHILD HEALTH, (DLHS-RCH), UTTARANCHAL 2002-04
Sample size
Households surveyed………………………………… Currently married women age 15-44………………. Husbands of eligible women……………………….. Characteristics of households Percent rural…………………………………………… Percent Hindu…………………………………………. Percent Muslim………………………………………... Percent other religion……….……….................……. Percent scheduled caste…………………………….. Percent scheduled tribe………………………………. Percent with electricity……………………………….. Percent with flush toilet………………………………. Percent with no toilet facility…………………………. Percent living in Kachcha houses…………………… Percent living in Pucca houses……………………... Percent with low standard of living………………….. Percent with high standard of living…………………. Percent with iodized salt (15+ppm)…………………. Characteristics of currently married women age 15-44 years
Percent below age 30 ………………………………... Percent with age at first cohabitation below age 18. Percent illiterate……………………………………….. Percent having 10 or more years of schooling…….. Percent with illiterate husband………………………. Percent with husband 10+ years of schooling…
Marriage
Mean age at marriage for boys…………………….. Mean age marriage for girls………………………….. Percent of boys married below age 21…………… Percent of girls married below age 18……………… Fertility Mean children ever born women age 40-44 years… Percent of births of order 3 and above1……………. Current use of family planning method Any method……………………………………………. Any modern method………………………………….. Pill…………………………………………………….. IUD……………………………………………………. Condom………………………………………………. Female sterilization…………………………………. Male sterilization…………………………………… Any traditional method………………………………... Rhythm/safe period………………………………… Withdrawal……………………………………………. Unmet need for family planning Percent with unmet need for spacing……………… Percent with unmet need for limiting……………… Percent with total unmet need……………………….. Maternal care2 Percent of women received antenatal check-ups Antenatal check-up at home……………………… Antenatal check-up in first trimester……………… Three or more visit for ANC………………………… Two or more tetanus toxoid injections……………..
12,885 9,641 5,417
72.5 85.5 12.0
2.4 14.3
3.1 67.1 35.0 49.2 13.4 44.6 37.5 31.8
8.6
48.4 36.8 43.9 25.4 16.5 49.2
24.6 20.5 13.4
9.8
4.3 46.0
48.7 44.2 4.1 1.9 11.1 25.1 1.7 4.3 3.0 0.8
9.8
17.1 26.9
62.6
7.5 25.9 28.0 64.4
Adequate Iron folic acid tablets/syrup3………… Full antenatal check-up4………………………… Delivery characteristics2 Delivery at home…………………………………… Delivery at government health institutions……… Delivery at private health institutions……………… Delivery attendant by skilled persons5 ………… Child health Percent of children whose mother squeezed out milk from her breast6……………………………… Percent of children7 with diarrhoea8 who received ORS……………………………………………… Percent of children7 with pneumonia8 who were taken to a health facility or provider……………… Percent of children who received vaccinations9 BCG…………………………………………………… DPT (3 injections)…………………………………… Polio (3 drops)……………………………………… Measles…………………………………………… All vaccinations10….………………………………… No vaccination at all. ……………………………… Percentage of women who had Pregnancy complication2…………………………… Delivery complication2……………………………… Post delivery complication2………………………… Symptoms of RTI/STI……………………………… Problems of vaginal discharge…………………… Menstruation related problem……………………… Awareness of RTI/STI and HIV/AIDS Percent of women who have heard of RTI/STI… Percent of women who have heard of HIV/AIDS… Utilization of government health services Antenatal care…………………………………… Treatment for pregnancy complication…………… Treatment for post-delivery complication………… Treatment for vaginal discharge…………………… Treatment for children with diarrhoea…………… Treatment for children with pneumonia…………… Quality of family planning services Percent non-users ever advised to adopt the family planning method…………………………… Percent users told about side effects of method…. Percent users who received follow-up services… Characteristics of husband of eligible women Percent of husband knowing NSV………………… Percent of men who have heard of RTI/STI… Percent of men who have heard of HIV/AIDS… Percentage who had any symptoms of RTI/STI… Sought treatment for RTI/STI ……………………
20.0 10.5 76.2 10.7 13.0 32.5
69.9 21.4 78.8
72.7 55.8 55.5 54.4 44.3 23.4
24.0 20.1 26.9 45.2 30.6 14.2 28.9 48.0
38.6 37.4 29.5 31.1 20.0 16.2
4.5 26.9 13.7 52.4 39.9 77.4 8.2 40.2
1 For births in past three years, 2 For live/still births during three years preceding the survey, 3 100 or more IFA tablets/Syrup, 4 A minimum of three visits for ANC, at least one TT injections and 100 or more IFA tablets/syrup, 5 Either institutional delivery or home delivery assisted by Doctor/ANM/nurse, 6 Children age below 3 years, 7 Last but one living children below age 3 years, 8 Last two weeks preceding the survey, 9 Last but one living children (age 12-23 months) born during three years preceding the survey. 10 BCG, three injections of DPT, three drops of polio and measles.
SALIENT FINDINGS
For the assessment of district level Reproductive and Child Health indicators, Government of India proposed to undertake district level household surveys through non- governmental agencies on an annual basis. The District Level Household Survey (DLHS) was the result of government’s initiative. In Uttaranchal, PRC, Delhi was entrusted the work of carrying out of the survey. The survey for Phase-I of the DLHS covering 7 districts of the state was conducted during March 2002 to July 2002. The survey for Phase-II covering the remaining 6 districts of the state was carried out during April 2004 to June 2004. The focus of the survey was on: i) Coverage on ante natal care (ANC) and immunization services, ii) Extent of safe deliveries, iii) Contraceptive prevalence rate and unmet need for family planning, iv) Awareness about RTI/STI and HIV/AIDS and v) Utilization of government health services and users’ satisfaction. The salient findings of the survey are presented here.
For both the phases together, the data was collected from 12,885 households in Uttaranchal. From these households, 9,641 eligible women (usual resident or visitors who stayed in the sample household the night before the interview, currently married aged 15-44 years whose marriage was consummated) and 5,417 husbands of eligible women were interviewed.
Of the total households interviewed in Uttaranchal, nearly 27.5 percent were from urban areas. There were 85.5 percent Hindu households, 12 percent Muslim and 1.9 percent came under other category in the sample. About 17.4 percent of the households belonged to either scheduled castes or scheduled tribes. Only 13.4 percent of the households lived in Kachcha and about 42.1 percent are in Semi-pacca and 44.6 percent are in pucca houses. More than one-third of the households belonged to low economic status (37.5 percent in low SLI). About 72 percent of population aged seven and above are literate. Percent literate among females is 60.3 where as it is 83.3 percent for males. Proportion of non-literate is much higher among the older cohort compared to the younger ones. Nearly 44 percent of eligible women in the state are non-literate, and 25.4 percent have completed 10 or more years of schooling. In Uttaranchal the level of literacy among the eligible women is low. As regards distribution of non-literate women, lesser proportion of young women below age 30 are illiterate compared to older women age 30 and above, but in case of husbands illiteracy is more or less uniform across age, though it is marginally more for husbands above 45 years.
The reporting of the marriages during three yeas prior to the survey gives the mean age at marriage among the boys and girls in the state as 24.6 and 20.5 years respectively. About 13.4 percent of boys and 9.8 percent of girls in the state got married before attaining the minimum legal age at marriage of 21 and 18 years respectively. In all the districts, except Hardwar and Udham Singh Nagar less than one-fifth of boys got married below the legal minimum age at marriage. In all the districts nearly 2.5 to 19.3 percent of the girls got married below the legal minimum age at marriage. Only 8.6 percent of the households use cooking salt that is iodized at the recommended level of 15 parts per million or higher level of iodine content whereas 29.5 percent of households used salts that are not iodized at all. Lowest proportion of households (11.1 percent) in Almora is
xiv
using non-iodized salt whereas in Chamoli the highest proportion of households (43.7 percent) used non-iodized salt. In all the districts except Champawat and Udham Singh Nagar, less than one-fifth of the households consume adequately iodized salt. On an average, women on the verge of completion of reproductive period have given birth to 4.3 children. The completed fertility in the districts varies from the lowest of 3.5 children ever born per women in Chamoli to the highest of 4.9 children ever born per women in Nainital.
The share of births of order 3 and above in the total births that occurred three years prior to survey is 46 percent. In most of the districts, proportion of higher order births is quite high, ranging from the lowest of around 29.5 percent in Pauri Garhwal, to the highest of about 59.9 percent in Hardwar. The data collected on the utilization of ANC services for the women who had their last live/ still birth during three years prior to survey shows that the ANC coverage in the state is good as 62.6 percent of the women received at least one ante-natal care during pregnancy. About 7.5 percent of the women were visited by health workers at their residence for providing ANC during their pregnancy. More than 13 percent of the women visited private health facilities and 38.6 percent received ANC from government health facilities. The percent of women who got some kind of ANC during pregnancy range between 45.5 percent in Hardwar to 81.7 percent in Bageshwar. In 7 districts out of 13, 70 percent or more women got some antenatal care.
Though 62.6 percent of the women in Uttaranchal received ANC, only 22, 23.3 and 65.3 percent women had check-up of weight, blood pressure and abdomen respectively. Fifty four percent women received Iron and Folic Acid (IFA) tablets and 71 percent got at least one TT injection. A full package of ANC including minimum three ANC visits, at least one TT injection and 100 or more IFA tablets/Syrup was received by 10.5 percent of women.
Minimum three ANC and timing of first check up is crucial for maternal and child care.
In Uttaranchal nearly 26 percent of women got ANC in the first trimester and 28 percent had minimum three antenatal check-ups. An extent of ANC in first trimester varies from a minimum of 11.2 percent in Uttarkashi to a maximum of 35.7 percent in Nainital. In Rudraprayag, only 16.3 percent of women had minimum three ANC whereas in Nainital almost 38 percent women had got minimum three ANC.
Nearly 24 percent of the total deliveries in Uttaranchal were conducted in health
institutions; 7 percentage points up from RCH Round I. The majority of the institutional deliveries were conducted in private institutions (13 percent of total deliveries) as against in government institutions (10.7 percent of total deliveries). Nearly 12 percent of the total deliveries, that took place at home, were assisted by midwifery trained persons i.e. doctor/ nurse and ANM. So in all, 32.5 percent of the deliveries, an improvement from RCH Round I (20.8 percent), in the state were assisted by skilled personnel. The extent of institutional deliveries varies from the highest of 33.2 percent in Pauri Garhwal to the lowest of 8.2 percent in Uttarkashi. In all the districts, comparatively lower proportion of the deliveries took place in government health institutions. Safe deliveries were on a similar pattern in all the districts. The
xv
percent of the institutional deliveries increases substantially with increase in women’s education and economic status.
In Uttaranchal, 24, 20.1 and 26.9 percent of the women experienced pregnancy, delivery
and post delivery complications respectively. About 35.7 percent of the women sought treatment for the pregnancy complications and 43.9 percent for the post-delivery complications. The pregnancy complication varies from the lowest of 15.2 percent in Pauri Garhwal to the highest of 36.4 percent in Dehradun. The incidence of all the three types of complications seems to be linked with each other. In the districts where the incidence of pregnancy complications is high, the incidence of delivery and post-delivery complications is also high.
In most of the districts and the state as a whole, the practice of breast-feeding is almost
universal. However, the practice of initiation of breastfeeding within two hours of birth of the child is not common. In Uttaranchal, only 27.2 percent women started breastfeeding the child within two hours of birth and 54.3 percent started after one day of birth. There is a great deal of variation in the pattern of breastfeeding across the districts. In Udham Singh Nagar district only 9.7 percent of the women breastfed the child within two hours of birth. In Dehradun and Rudraprayag districts, the percentage is highest (47.6 and 50 percent respectively).
In Uttaranchal 72.7, 55.8, 55.5 and 54.4 percent of the children received the BCG
vaccine, three doses of DPT, Polio and measles vaccine respectively. There is a 18 percentage points drop from BCG to measles. It means that large number of children that have contact with services providers are missed out of subsequent services. The complete schedule of immunization including BCG, three doses of DPT and Polio each and measles was received by 44.3 percent of the children, whereas 23.4 percent of the children did not receive a single vaccination under routine programme. About 19.2 percent of the children received supplementation of at least one dose of vitamin A and only 4.8 percent children received IFA tablets/liquid for iron supplementation.
The extent of complete immunization consisting of BCG, three injections of DPT, three
doses of Polio and measles is the lowest in Hardwar (15.1 percent) and highest in Pauri Garhwal (71.7 percent). In 6 districts (Pauri Garhwal, Bageshwar, Nainital, Champawat, Chamoli and Pithoragarh) more than 60 percent of the children received complete immunization.
In Uttaranchal, 66.2 percent of the women were aware of diarrhoea management and 19.1
percent were aware of Oral Rehydration Salt (ORS). During the two-week period prior to survey, children of 16.4 percent of the women suffered from diarrhoea. And 21.4 percent women treated diarrhoea among children by giving ORS. The awareness about danger signs of pneumonia is almost the same as awareness about diarrhoea management. About 60.4 percent of the women reported awareness about danger sings of pneumonia. Thirteen percent of the women reported that their children suffered from cough, cold and difficulty in breathing in the two-week period prior to the survey and 78.8 percent sought treatment.
The knowledge of family planning methods is almost universal in all districts of
Uttaranchal except Dehradun and Hardwar, with over 99 percent women reporting knowledge of one method or the other. However, the knowledge of any spacing method is marginally lower,
xvi
but the proportion per se is quite high (89.2 percent). The knowledge of any modern methods is also universal in all the districts except Dehradun and Hardwar, though the knowledge of all modern methods is only 56.3 percent. The proportion knowing all modern methods (males and females’ sterilization, IUD, oral pills and condom) varies from about 28 percent in Dehradun to 83.5 percent in Udham Singh Nagar.
In DLHS, knowledge about No-scalpel vasectomy has been asked to husbands of eligible
women. A majority of the husbands were aware of no-scalpel vasectomy in the state. The proportion of husbands knowing No-scalpel vasectomy varies from about 40.4 percent in Hardwar to 65.8 percent in Bageshwar.
The contraceptive prevalence rate (any method) in the state is 48.7 percent, comprising of
prevalence of about 44.2 percent of modern methods and 4.3 percent of traditional methods. Twenty seven percent of the couples adopted sterilization. The percent user of the two male methods of sterilization and condom is only 13 percent. There has been positive association between contraceptive use and female education, economic development and availability of health facility. The highest contraceptive prevalence is in Chamoli (57 percent) followed by Pithoragarh (56.1 percent) and the lowest is in Hardwar (39.9 percent).
In Uttaranchal, a total of 26.9 percent of women are found to have unmet need for family
planning, with 17.1 percent for limiting and 9.8 percent for spacing. There are no significant inter-district differences in the pattern of unmet need. The total unmet need varies from 18 percent in Chamoli to 35.5 percent in Hardwar followed by Dehradun (34.8 percent).
Only 11 percent of the women in the state reported that either ANM/LHV or health
worker visited them at their residence at least once in the past three months. About 79.1 percent of the women who were visited by ANM felt that ANM had given them sufficient time to discuss health-related matters.
In more than 50 percent of the districts, less than 10 percent of the women reported the
visit of ANM/LHV to their residence. In 2 districts (Pauri Garhwal and Chamoli), 10-15 percent of the women reported visits of ANM/LHV and in the remaining 4 districts (Champawat, Udham Singh Nagar, Tehri Garhwal and Bageshwar), more than 15 percent of the women reported visit of ANM/LHV.
It has been observed that in the three months period prior to the survey, 38.8 percent of
the eligible women who needed to visit health facility visited the government health facilities. Very small proportion of the women who visited the health facility rated facility as excellent. On the other hand, nearly 25 percent of the women who did not visit the government health facility reported “doctors/health workers do not examine properly” as the main reason.
The district level variation in the utilization of the government health facilities ranges
from 21.9 percent in Udham Singh Nagar to 69.7 percent in Rudraprayag. Majority of the women visited private health facilities (59 percent), ranging from 21.2 percent in Rudraprayag, 73 percent in Hardwar to 78.1 percent in Udham Singh Nagar.
xvii
In Uttaranchal, 28.9 and 48 percent of women are aware of RTI/STI and HIV/AIDS respectively. The corresponding level of awareness among husbands of eligible women is 39.9 and 77.4 percent. The percent of women who are aware of RTI/STI and HIV/AIDS is lowest in Uttarkashi – 9.9 and 24.9 percent respectively and is highest in Almora and Pauri Garhwal with 51.6 and 66.3 percent respectively. Similarly, the awareness level of husbands of eligible women of RTI/STI and HIV/AIDS is lowest in Uttarkashi (15 percent) and Uttarkashi/Hardwar (68.5 percent) respectively and is highest in Champawat (65.4 percent) and Pauri Garhwal (87.1 percent) respectively. Out of 13, in 7 districts the awareness of HIV/AIDS is below the state figure for women and in 4 districts for husbands of eligible women.
About 45.2 percent of women and 8.2 percent of husbands of eligible women in the state
reported having at least one symptoms of RTI/STI. In most of the districts the reported prevalence of RTI/STI among husbands was low. The prevalence of RTI/STI is lowest in Hardwar (37.6 percent) for women and in Champawat (3.1 percent) for husbands and is highest in Bageshwar (54.5 percent) for women and in Hardwar (13.2 percent) for husbands. About 33.2 percent of women reported vaginal discharge with the lowest in Dehradun (10.4 percent) and the highest in Champawat (44.7 percent). About 25.4 percent of women sought treatment for vaginal discharge problem and 40.3 percent of husbands sought treatment with at least one symptoms of RTI/STI. It may be noted that only in 2 out of 13 districts, a higher proportion of women compared to husbands sought treatment for their reproductive health problems.
CHAPTER I
INTRODUCTION 1.1 Background and Objectives of the Survey The Reproductive and Child Health (RCH) programme that has been launched by Government of India (GoI) in 1996-97 is expected to provide quality services and achieve multiple objectives. It ushered a positive paradigm shift from method-oriented, target-based activity to providing client-centred, demand-driven quality services. Also, efforts are being made to reorient provider’s attitude at grassroots level and to strengthen the services at outreach levels. The new approach requires decentralization of planning, monitoring and evaluation of the services. The district being the basic nucleus of planning and implementation of the RCH programme, Government of India has been interested in generating district level data on utilization of the services provided by government health facilities, other then that based on service statistics. It is also of interest to assess people’s perceptions on quality of services. Therefore, it was decided to undertake District Level Household Survey (DLHS) under the RCH programme in the country. The Round I of RCH survey was conducted during the year 1998–99 in two phases (each phase covered half of the districts from all states/union territories) in 504 districts for which International Institute for Population Sciences (IIPS), Mumbai was designated as the nodal agency.
In Round II, survey was completed during 2002-04 in 593 districts as per the 2001 Census. In DLHS-RCH, information about RCH has been collected using a slightly modified questionnaire. In Round II, some new dimensions, such as test of cooking salt to assess the consumption of salt fortified with iodine, collection of blood of children, adolescents and pregnant women to assess the level of anaemia, and measurement of weight of children to assess the nutritional status, were incorporated. The main focus of the DLHS-RCH has been on the following aspects:
Coverage of ANC & immunization services Proportion of safe deliveries Contraceptive prevalence rates Unmet need for family planning Awareness about RTI/ STI and HIV/AIDS Utilization of government health services and users’ satisfaction.
For the purpose of conducting DLHS-RCH, all the states and the union territories were
grouped into 16 regions. A total of twelve research organizations including Population Research Centres (PRCs) were involved in conducting the survey in 16 regions with IIPS as the nodal agency.
2
1.2 Survey Design In Round II, a systematic, multi-stage stratified sampling design was adopted. In each district, 40 Primary Sampling Units (PSUs – Villages/Urban Frame Size) were selected with probability proportional to size (PPS) using the 1991 Census data. All the villages were stratified according to population size, and female literacy was used for implicit arrangement within each strata. The number of PSUs in rural and urban areas was decided on the basis of percent of urban population in the district. However, a minimum of 12 urban PSUs were selected in each district in case the percent urban was low. The target sample size in each district was set at 1,000 complete residential households from 40 selected PSUs. In the second stage, within each PSU, 28 residential households were selected with Circular Systematic Random Sampling (CSRS) procedure after house listing. In order to take care of non-response due to various reasons, sample was inflated by 10 percent (i.e. 1,100 households).
For selecting the urban sample, the National Sample Survey Organization (NSSO) provided the list of selected urban frame size (UFS) blocks in the district. The UFS blocks were made available separately for each district for urban areas. The maps of selected blocks were obtained from the NSSO field office located in each state/union-territory. But in each state, in two districts, the PSUs that were surveyed in Round I of DLHS-RCH (also known as RHS-RCH) were also selected for survey in Round II. This was done in order to measure the changes more accurately. Two districts, one with the highest proportion of safe delivery and another with the lowest proportion of safe delivery among those surveyed during Round I of the survey were selected for this purpose. In all other districts, fresh sample of PSUs were selected. 1.3 House Listing and Sample Selection The household listing operation was carried out in each of the selected PSU segment prior to the data collection that provided the necessary frame for selecting the households. The household listing operation also involved preparation of location map and layout sketch map of the structures and recording the details of the households in these structures in each selected PSU. This exercise was carried out by independent teams each comprising one lister, one mapper and one supervisor under the overall guidance and monitoring of the survey coordinator of households of the selected regional agencies. A complete listing of households was carried out in villages with households up to 300. In case of villages with more than 300 households but less than or equal to 600 households, two segments of more or less same size were formed and one segment was selected at random and household listing was carried out. In case of villages with more than 600 households, segments each of about 150 households were formed and two segments were selected for listing using the systematic random sampling method.
Small villages with less than 50 households were linked with a nearest village. After combining it with the nearest village, the same sampling procedure was adopted as mentioned above.
3
For the urban PSUs, the selected UFS blocks needed no segmentation as they were of almost equal size and contained less than 300 households. No replacement was made if selected household was absent during data collection. However, if a PSU was inaccessible, a replacement PSU with similar characteristics was selected by the IIPS and provided to the regional agency for survey. 1.4 Questionnaire DLHS-RCH collected information on a various indicators pertaining to RCH that would assist policymakers and programme managers to formulate and implement the goals set for RCH programmes. The International Institute for Population Sciences (IIPS), Mumbai, the Nodal Agency for DLHS–RCH project has made necessary modifications in the two Questionnaires: Households Questionnaire and Women’s Questionnaire and added three more Questionnaires i.e., Husband’s Questionnaire, Village Questionnaire and Health Questionnaire, in consultation with MoHFW and World Bank. These Questionnaires were discussed and finalized in training cum workshop organized at IIPS during the first week of November 2001. These modified questionnaires had been canvassed of round II of the DLHS–RCH survey, taking into consideration the views of all the regional agencies involved. The house–listing teams and the interviewers and the supervisors for the main survey were given rigorous training based on the manuals developed for the purpose by the Nodal Agency. All the questionnaires were bilingual, with questions in both regional and English language. The Details of questionnaires are as follows: Household Questionnaire: The household questionnaire lists all usual residents in each sample household including visitors who stayed in the household the night before the interview. For each listed household member, the survey collected basic information on age, sex, and marital status, relationship to the head of the household, education and the prevalence /incidence of tuberculosis, blindness and malaria. Information was also collected on the main source of drinking water, type of toilet facility, source of lighting, type of cooking fuel, religion and caste of household head and ownership of other durable goods in the household. In addition, a test was conducted to assess whether the household used cooking salt that has been fortified with iodine. Besides, details of marriages and deaths which happen to usual residents within reference period were collected. Efforts were also made to get information about maternal deaths. Women Questionnaire: Women questionnaire is designed to collect information from currently married women age 15 – 44 years who are usual residents of the sample household or visitors who stayed in the sample household the night before the interview. The women questionnaire covered the following sections:

4
Section I: Background Characteristics: In this section the information collected on age, educational status and birth and death history of biological children including still birth, induced and spontaneous abortions. Section II: Antenatal, Natal and Post natal Care: In this section the questionnaire collect information only from the women who had live birth, still birth, spontaneous or induced abortion during last three years preceding the survey date. The information on whether women received antenatal and postpartum care, who attended the delivery and the nature of complications during pregnancy for recent births were also collected. Section III: Immunization and childcare: This section gives information about feeding practices, the length of breastfeeding, immunization coverage and recent occurrence of diarrhoea, and pneumonia for young children (below age 3 years). Section IV: Contraception: This section provides information on knowledge and use of specific family planning methods. Questions were included about reasons for non-use, intentions about future use, desire for additional child, sex preference for next child etc. Section V: Assessment of quality of Government health services and client satisfaction. In this section the questions are targeted to assess the quality of family planning and health services provided by Government health facilities. The information were also collected about the rating of Government health facilities and staffs and reasons for not visiting to government health facilities by eligible woman. Section VI: Awareness about RTI/STI and HIV/AIDS: In this section the information were collected about women’s knowledge of RTI/STI about awareness, Source of knowledge, aware of mode of transmission, curability, symptoms and treatment seeking behaviour. About HIV/AIDS; Awareness, Source of knowledge, aware of mode of transmission and prevention etc were canvassed. Husband Questionnaire: In DLHS-RCH, round II, husband questionnaire was used to collect information from eligible women’s husbands about age, educational status, knowledge and source of knowledge of RTI/STI and HIV/AIDS reported symptoms of RTI/STI and male participation. Apart from these information desires for children, reasons for not using F.P. methods, future intention to use F.P. methods and knowledge about no scalpel vasectomy (NSV) has also been collected. Health Questionnaire: In DLHS-RCH, round II, a health questionnaire is included. The information collected were on weight of children age 0–71 months old and the blood sample to assess the haemoglobin levels of children age 0–71 months old, adolescents 10–19 years old and pregnant eligible women. This information is useful for assessing the levels of nutrition prevailing in the population and prevalence of anaemia among women, adolescent girls and children.
5
Village Questionnaire: A village questionnaire is also added in this round of DLHS. The information collected on the availability and accessibility of various facilities in the village especially on accessibility of educational and health facilities. 1.5 Fieldwork and Sample Coverage The fieldwork for RCH Round II was done in two phases. During Phase I, 7 districts were covered from March 2002 to July 2002 and remaining 6 districts were covered during Phase II from April 2004 to June 2004.
During Round II, a total of 12,885 thousand households were covered. From these surveyed households, 9,641 currently married women (aged 15-44 years) and 5,417 husbands of eligible women were interviewed.
1.6 Data processing All the five types of completed questionnaires were brought to the headquarters of the regional agencies and data were processed using microcomputers. The process consisted of office editing of questionnaires, data entry, data cleaning and tabulation. Data cleaning included validation, range and consistency checks. For both data entry and tabulation of the data, IIPS developed the software package. The district and state level reports were prepared by regional agency whereas national report is prepared by the nodal agency. 1.7 Sample Weights In generating district level demographic indicator sample weight for household, women and husband, weight have been used and these for a particular district are based on three selection probabilities f1
i, f2i and f3
i pertaining to ith PSU of the district. These probabilities are defined as f
i
1 = Probability of selection of ith PSU in a district
= )(
HHn ir *
Where, nr is the number of rural PSU to be selected in a district, H i refers to the number of household in the ith PSU and H = ∑Hi , total number of household in a district. f
i
2 = Probability of selecting segment (s) from segmented PSU
(in case the ith selected PSU is segmented) = (Number of segments selected after segmentation of PSU) / (number of segment created a PSU) The value of f
i
2 is to be equal to one for un-segmented PSU.

6
fi
3 = Probability of selecting a household from the total listed households of a PSU or in
segment(s) of a PSU
= HL
HRi
i*28
Where HRi is the household response rate of the ith sampled PSU and HLi is the number of households listed in i th PSU in a district. For urban PSU, f1
i is computed either as the ratio of number of urban PSUs to be included from the district to the total number of UFS blocks of the district or as the ratio of urban population of the selected PSU to the total urban population of the district. The probability of selecting a household from the district works out as; f i = ( )fff iii
321 **
The non-normalized household weight for the ith PSU of the district is, wi = f i1 , while the
normalized weight used in the generation of district indicators as
=ndi i
i
ii
ii
wwn
n*
*∑
∑
, i= 1,2,3……………40.
Where ni is the number of households interviewed in the ith PSU. The weight for women and husband are computed in the similar manner after multiplication of expression for fi by the corresponding response rate. State weights for households, women and husbands are further derived from the district weights nd
i for the ith psu in dth district using external control so that for sample results do not deviate from the corresponding information about the population. Let, ns = ∑
i
din and N I = ∑
i
diN , denote the number of households in the sample and census of
a particular state, then state level households weights are work out as;
nsi = nd
i *
⎟⎟⎠
⎞⎜⎜⎝
⎛
⎟⎟⎠
⎞⎜⎜⎝
⎛
NN
nn
sc
di
s
di
, where ndi household sample in ith district, ns is the total sample in the
state, N di is the census population in the ith district and N sc is the census population in the state.
These households’ weights are controlled for rural-urban separately. Considering sample and census currently married women in 15-44 years and married males above 15 years for specified state by districts and rural-urban residence, state level women and husbands’ weights are obtained for estimation of state level indicators.
7
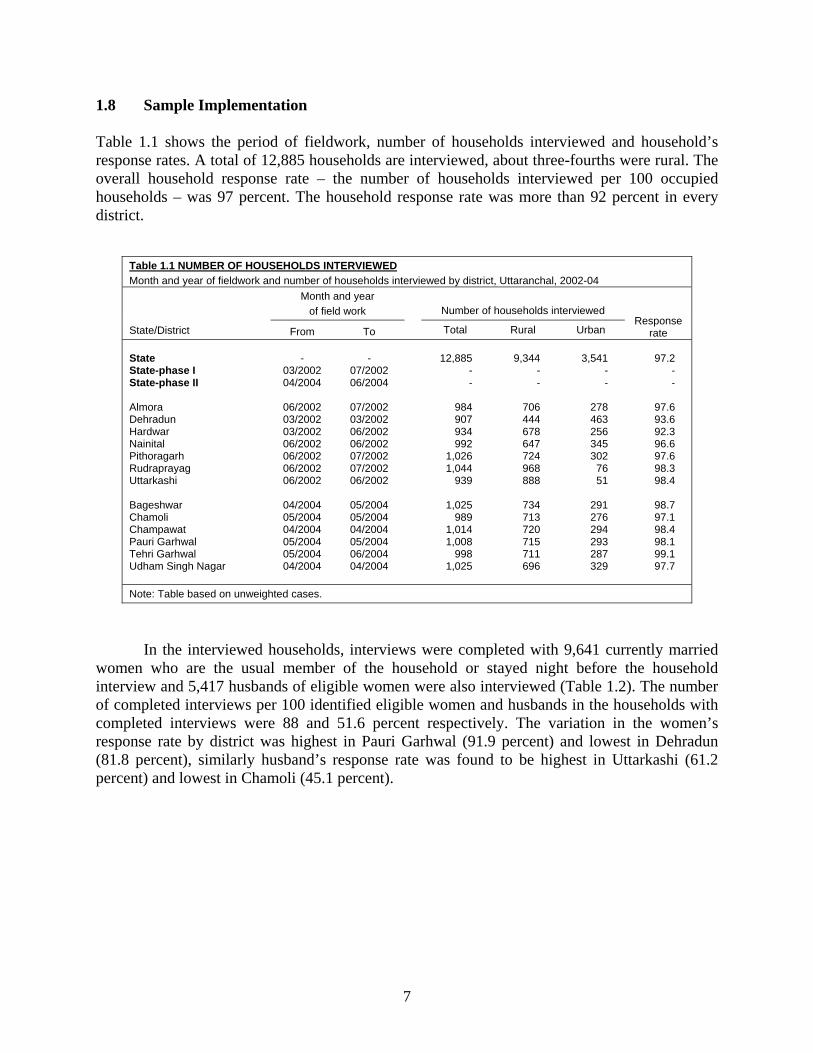
1.8 Sample Implementation Table 1.1 shows the period of fieldwork, number of households interviewed and household’s response rates. A total of 12,885 households are interviewed, about three-fourths were rural. The overall household response rate – the number of households interviewed per 100 occupied households – was 97 percent. The household response rate was more than 92 percent in every district.
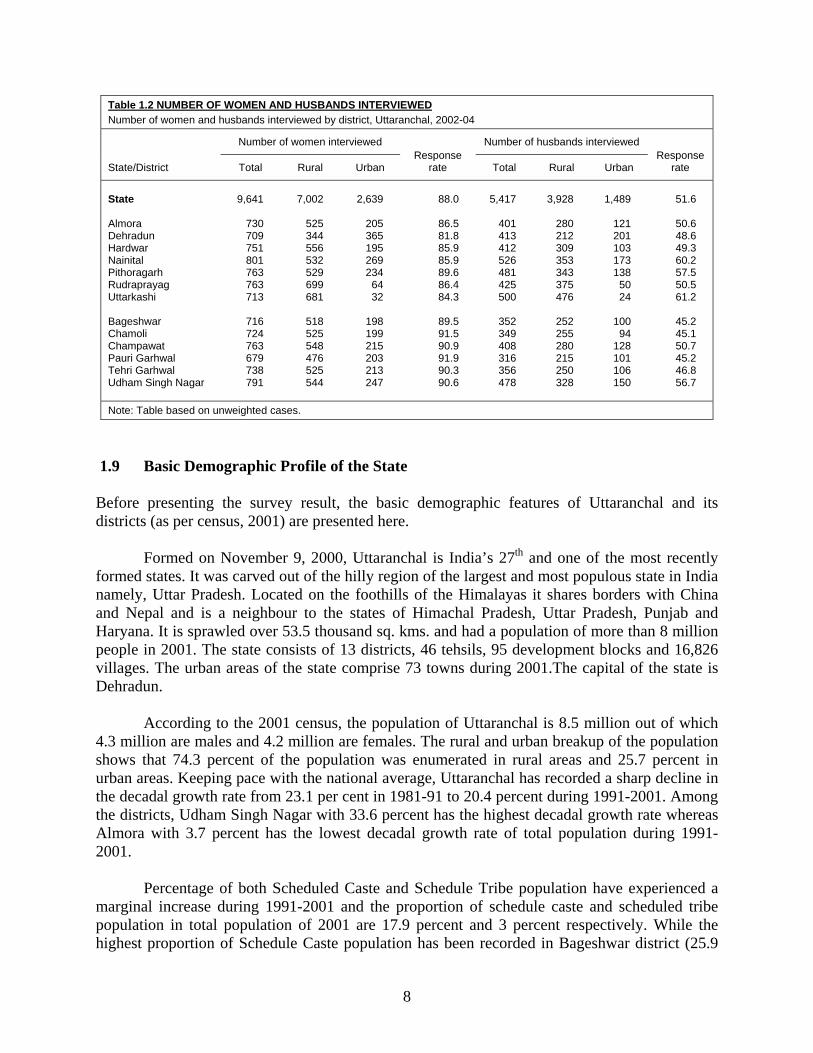
In the interviewed households, interviews were completed with 9,641 currently married women who are the usual member of the household or stayed night before the household interview and 5,417 husbands of eligible women were also interviewed (Table 1.2). The number of completed interviews per 100 identified eligible women and husbands in the households with completed interviews were 88 and 51.6 percent respectively. The variation in the women’s response rate by district was highest in Pauri Garhwal (91.9 percent) and lowest in Dehradun (81.8 percent), similarly husband’s response rate was found to be highest in Uttarkashi (61.2 percent) and lowest in Chamoli (45.1 percent).
Table 1.1 NUMBER OF HOUSEHOLDS INTERVIEWED Month and year of fieldwork and number of households interviewed by district, Uttaranchal, 2002-04
State/District
Month and year of field work Number of households interviewed
Response rate From To Total Rural Urban
State State-phase I State-phase II Almora Dehradun Hardwar Nainital Pithoragarh Rudraprayag Uttarkashi Bageshwar Chamoli Champawat Pauri Garhwal Tehri Garhwal Udham Singh Nagar
-
03/2002 04/2004
06/2002 03/2002 03/2002 06/2002 06/2002 06/2002 06/2002
04/2004 05/2004 04/2004 05/2004 05/2004 04/2004
-
07/2002 06/2004
07/2002 03/2002 06/2002 06/2002 07/2002 07/2002 06/2002
05/2004 05/2004 04/2004 05/2004 06/2004 04/2004
12,885
- -
984 907 934 992
1,026 1,044
939
1,025 989
1,014 1,008
998 1,025
9,344
- -
706 444 678 647 724 968 888
734 713 720 715 711 696
3,541
- -
278 463 256 345 302
76 51
291 276 294 293 287 329
97.2
- -
97.6 93.6 92.3 96.6 97.6 98.3 98.4
98.7 97.1 98.4 98.1 99.1 97.7
Note: Table based on unweighted cases.
8
Table 1.2 NUMBER OF WOMEN AND HUSBANDS INTERVIEWED Number of women and husbands interviewed by district, Uttaranchal, 2002-04
State/District
Number of women interviewed Response
rate
Number of husbands interviewed Response
rate Total Rural Urban Total Rural Urban
State Almora Dehradun Hardwar Nainital Pithoragarh Rudraprayag Uttarkashi Bageshwar Chamoli Champawat Pauri Garhwal Tehri Garhwal Udham Singh Nagar
9,641
730 709 751 801 763 763 713
716 724 763 679 738 791
7,002
525 344 556 532 529 699 681
518 525 548 476 525 544
2,639
205 365 195 269 234
64 32
198 199 215 203 213 247
88.0
86.5 81.8 85.9 85.9 89.6 86.4 84.3
89.5 91.5 90.9 91.9 90.3 90.6
5,417
401 413 412 526 481 425 500
352 349 408 316 356 478
3,928
280 212 309 353 343 375 476
252 255 280 215 250 328
1,489
121 201 103 173 138
50 24
100
94 128 101 106 150
51.6
50.6 48.6 49.3 60.2 57.5 50.5 61.2
45.2 45.1 50.7 45.2 46.8 56.7
Note: Table based on unweighted cases.
1.9 Basic Demographic Profile of the State Before presenting the survey result, the basic demographic features of Uttaranchal and its districts (as per census, 2001) are presented here.
Formed on November 9, 2000, Uttaranchal is India’s 27th and one of the most recently formed states. It was carved out of the hilly region of the largest and most populous state in India namely, Uttar Pradesh. Located on the foothills of the Himalayas it shares borders with China and Nepal and is a neighbour to the states of Himachal Pradesh, Uttar Pradesh, Punjab and Haryana. It is sprawled over 53.5 thousand sq. kms. and had a population of more than 8 million people in 2001. The state consists of 13 districts, 46 tehsils, 95 development blocks and 16,826 villages. The urban areas of the state comprise 73 towns during 2001.The capital of the state is Dehradun.
According to the 2001 census, the population of Uttaranchal is 8.5 million out of which 4.3 million are males and 4.2 million are females. The rural and urban breakup of the population shows that 74.3 percent of the population was enumerated in rural areas and 25.7 percent in urban areas. Keeping pace with the national average, Uttaranchal has recorded a sharp decline in the decadal growth rate from 23.1 per cent in 1981-91 to 20.4 percent during 1991-2001. Among the districts, Udham Singh Nagar with 33.6 percent has the highest decadal growth rate whereas Almora with 3.7 percent has the lowest decadal growth rate of total population during 1991-2001.
Percentage of both Scheduled Caste and Schedule Tribe population have experienced a
marginal increase during 1991-2001 and the proportion of schedule caste and scheduled tribe population in total population of 2001 are 17.9 percent and 3 percent respectively. While the highest proportion of Schedule Caste population has been recorded in Bageshwar district (25.9
9
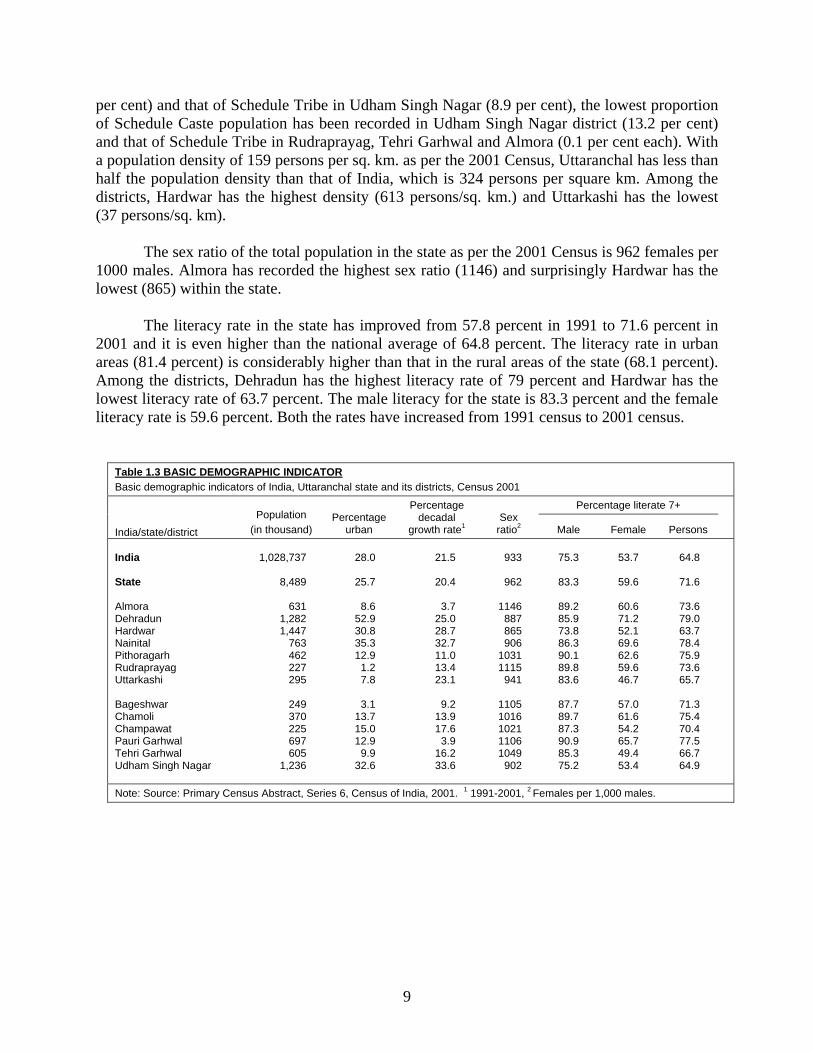
per cent) and that of Schedule Tribe in Udham Singh Nagar (8.9 per cent), the lowest proportion of Schedule Caste population has been recorded in Udham Singh Nagar district (13.2 per cent) and that of Schedule Tribe in Rudraprayag, Tehri Garhwal and Almora (0.1 per cent each). With a population density of 159 persons per sq. km. as per the 2001 Census, Uttaranchal has less than half the population density than that of India, which is 324 persons per square km. Among the districts, Hardwar has the highest density (613 persons/sq. km.) and Uttarkashi has the lowest (37 persons/sq. km).
The sex ratio of the total population in the state as per the 2001 Census is 962 females per 1000 males. Almora has recorded the highest sex ratio (1146) and surprisingly Hardwar has the lowest (865) within the state.
The literacy rate in the state has improved from 57.8 percent in 1991 to 71.6 percent in
2001 and it is even higher than the national average of 64.8 percent. The literacy rate in urban areas (81.4 percent) is considerably higher than that in the rural areas of the state (68.1 percent). Among the districts, Dehradun has the highest literacy rate of 79 percent and Hardwar has the lowest literacy rate of 63.7 percent. The male literacy for the state is 83.3 percent and the female literacy rate is 59.6 percent. Both the rates have increased from 1991 census to 2001 census.
Table 1.3 BASIC DEMOGRAPHIC INDICATOR Basic demographic indicators of India, Uttaranchal state and its districts, Census 2001
India/state/district Population
(in thousand) Percentage
urban
Percentage decadal
growth rate1 Sex
ratio2
Percentage literate 7+
Male Female Persons India State Almora Dehradun Hardwar Nainital Pithoragarh Rudraprayag Uttarkashi Bageshwar Chamoli Champawat Pauri Garhwal Tehri Garhwal Udham Singh Nagar
1,028,737
8,489
631
1,282 1,447
763 462 227 295
249 370 225 697 605
1,236
28.0
25.7
8.6
52.9 30.8 35.3 12.9
1.2 7.8
3.1
13.7 15.0 12.9
9.9 32.6
21.5
20.4
3.7
25.0 28.7 32.7 11.0 13.4 23.1
9.2
13.9 17.6
3.9 16.2 33.6
933
962
1146
887 865 906
1031 1115
941
1105 1016 1021 1106 1049
902
75.3
83.3
89.2 85.9 73.8 86.3 90.1 89.8 83.6
87.7 89.7 87.3 90.9 85.3 75.2
53.7
59.6
60.6 71.2 52.1 69.6 62.6 59.6 46.7
57.0 61.6 54.2 65.7 49.4 53.4
64.8
71.6
73.6 79.0 63.7 78.4 75.9 73.6 65.7
71.3 75.4 70.4 77.5 66.7 64.9
Note: Source: Primary Census Abstract, Series 6, Census of India, 2001. 1 1991-2001, 2 Females per 1,000 males.
CHAPTER II
BACKGROUND CHARACTERISTICS OF HOUSEHOLD
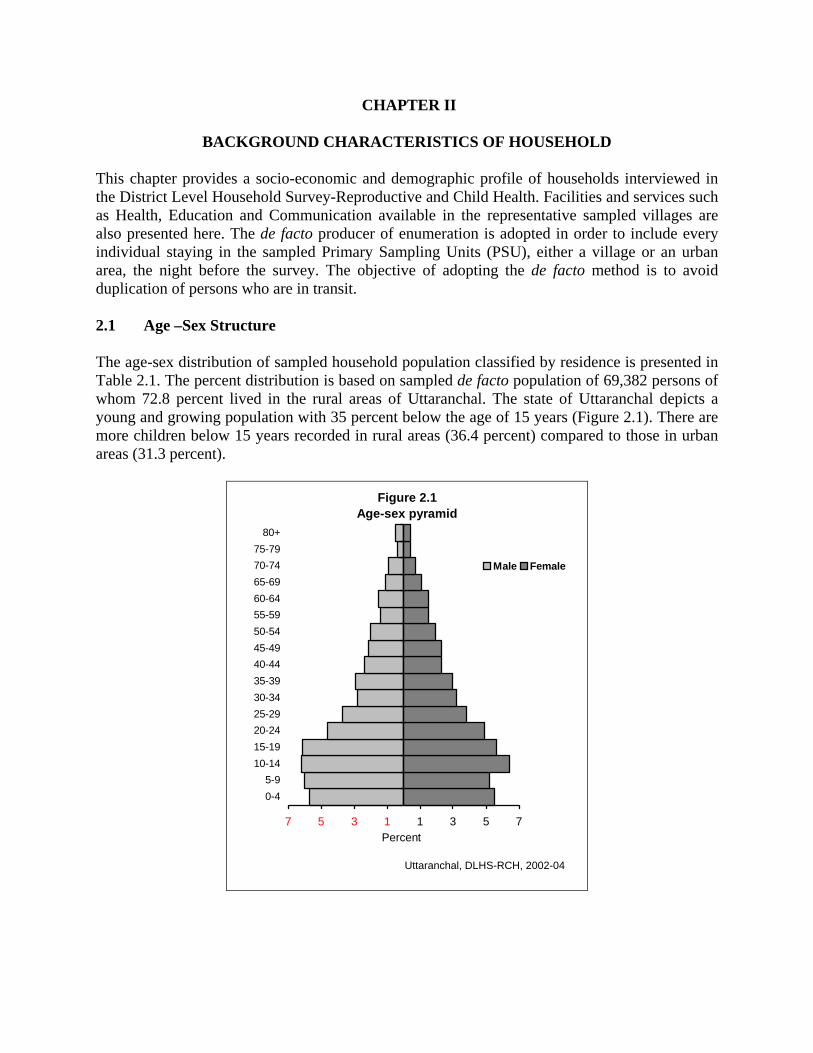
This chapter provides a socio-economic and demographic profile of households interviewed in the District Level Household Survey-Reproductive and Child Health. Facilities and services such as Health, Education and Communication available in the representative sampled villages are also presented here. The de facto producer of enumeration is adopted in order to include every individual staying in the sampled Primary Sampling Units (PSU), either a village or an urban area, the night before the survey. The objective of adopting the de facto method is to avoid duplication of persons who are in transit. 2.1 Age –Sex Structure The age-sex distribution of sampled household population classified by residence is presented in Table 2.1. The percent distribution is based on sampled de facto population of 69,382 persons of whom 72.8 percent lived in the rural areas of Uttaranchal. The state of Uttaranchal depicts a young and growing population with 35 percent below the age of 15 years (Figure 2.1). There are more children below 15 years recorded in rural areas (36.4 percent) compared to those in urban areas (31.3 percent).
Figure 2.1Age-sex pyramid
7 5 3 1 1 3 5 7
0-45-9
10-1415-1920-2425-2930-3435-3940-4445-4950-5455-5960-6465-6970-7475-79
80+
Percent
Male Female
Uttaranchal, DLHS-RCH, 2002-04
12
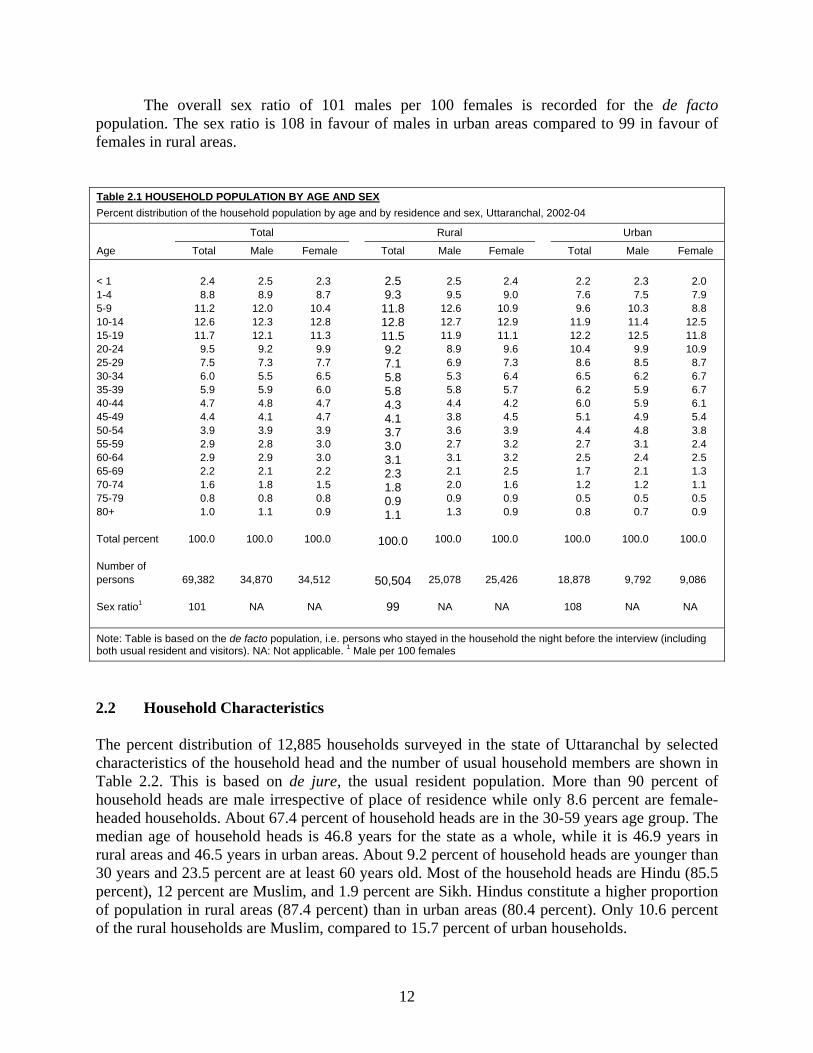
The overall sex ratio of 101 males per 100 females is recorded for the de facto population. The sex ratio is 108 in favour of males in urban areas compared to 99 in favour of females in rural areas. Table 2.1 HOUSEHOLD POPULATION BY AGE AND SEX Percent distribution of the household population by age and by residence and sex, Uttaranchal, 2002-04
Age
Total Rural Urban
Total Male Female Total Male Female Total Male Female < 1 1-4 5-9 10-14 15-19 20-24 25-29 30-34 35-39 40-44 45-49 50-54 55-59 60-64 65-69 70-74 75-79 80+ Total percent Number of persons Sex ratio1
2.4 8.8
11.2 12.6 11.7
9.5 7.5 6.0 5.9 4.7 4.4 3.9 2.9 2.9 2.2 1.6 0.8 1.0
100.0
69,382
101
2.5 8.9
12.0 12.3 12.1
9.2 7.3 5.5 5.9 4.8 4.1 3.9 2.8 2.9 2.1 1.8 0.8 1.1
100.0
34,870
NA
2.3 8.7
10.4 12.8 11.3
9.9 7.7 6.5 6.0 4.7 4.7 3.9 3.0 3.0 2.2 1.5 0.8 0.9
100.0
34,512
NA
2.5 9.3
11.8 12.8 11.5 9.2 7.1 5.8 5.8 4.3 4.1 3.7 3.0 3.1 2.3 1.8 0.9 1.1
100.0
50,504
99
2.5 9.5
12.6 12.7 11.9
8.9 6.9 5.3 5.8 4.4 3.8 3.6 2.7 3.1 2.1 2.0 0.9 1.3
100.0
25,078
NA
2.4 9.0
10.9 12.9 11.1
9.6 7.3 6.4 5.7 4.2 4.5 3.9 3.2 3.2 2.5 1.6 0.9 0.9
100.0
25,426
NA
2.2 7.6 9.6
11.9 12.2 10.4
8.6 6.5 6.2 6.0 5.1 4.4 2.7 2.5 1.7 1.2 0.5 0.8
100.0
18,878
108
2.3 7.5
10.3 11.4 12.5
9.9 8.5 6.2 5.9 5.9 4.9 4.8 3.1 2.4 2.1 1.2 0.5 0.7
100.0
9,792
NA
2.0 7.9 8.8
12.5 11.8 10.9
8.7 6.7 6.7 6.1 5.4 3.8 2.4 2.5 1.3 1.1 0.5 0.9
100.0
9,086
NA
Note: Table is based on the de facto population, i.e. persons who stayed in the household the night before the interview (including both usual resident and visitors). NA: Not applicable. 1 Male per 100 females
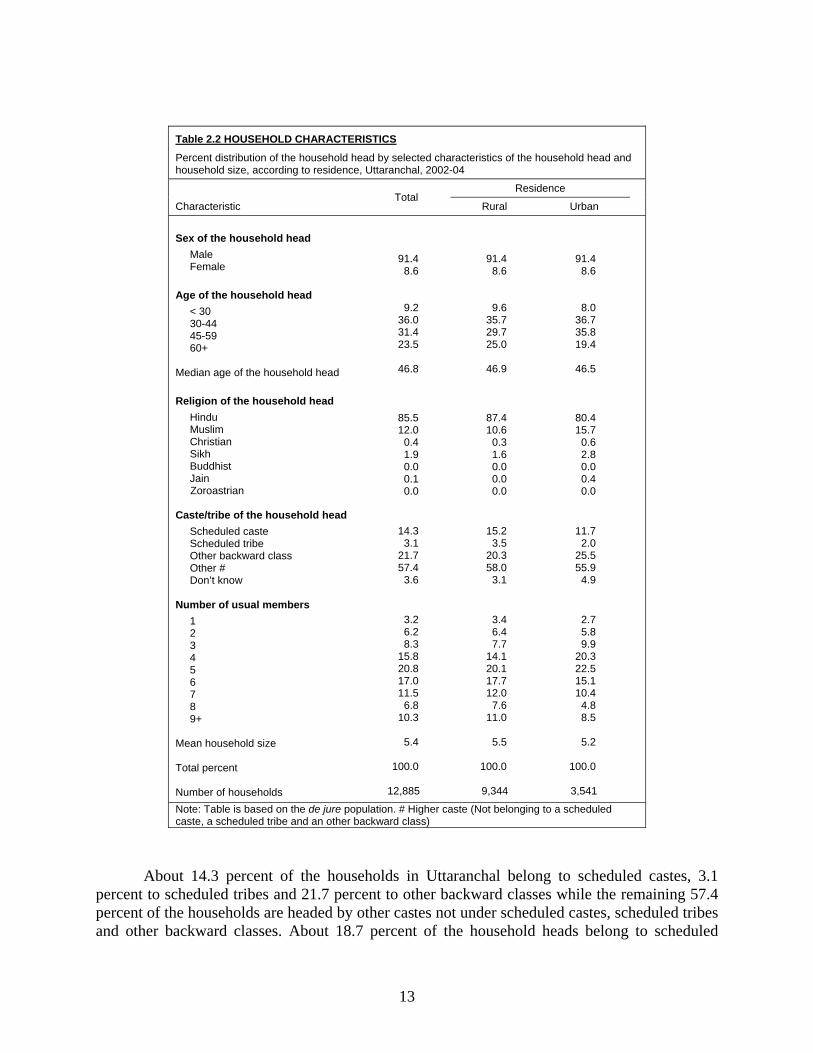
2.2 Household Characteristics The percent distribution of 12,885 households surveyed in the state of Uttaranchal by selected characteristics of the household head and the number of usual household members are shown in Table 2.2. This is based on de jure, the usual resident population. More than 90 percent of household heads are male irrespective of place of residence while only 8.6 percent are female-headed households. About 67.4 percent of household heads are in the 30-59 years age group. The median age of household heads is 46.8 years for the state as a whole, while it is 46.9 years in rural areas and 46.5 years in urban areas. About 9.2 percent of household heads are younger than 30 years and 23.5 percent are at least 60 years old. Most of the household heads are Hindu (85.5 percent), 12 percent are Muslim, and 1.9 percent are Sikh. Hindus constitute a higher proportion of population in rural areas (87.4 percent) than in urban areas (80.4 percent). Only 10.6 percent of the rural households are Muslim, compared to 15.7 percent of urban households.
13
About 14.3 percent of the households in Uttaranchal belong to scheduled castes, 3.1
percent to scheduled tribes and 21.7 percent to other backward classes while the remaining 57.4 percent of the households are headed by other castes not under scheduled castes, scheduled tribes and other backward classes. About 18.7 percent of the household heads belong to scheduled
Table 2.2 HOUSEHOLD CHARACTERISTICS
Percent distribution of the household head by selected characteristics of the household head and household size, according to residence, Uttaranchal, 2002-04
Characteristic Total
Residence
Rural Urban Sex of the household head Male Female Age of the household head < 30 30-44 45-59 60+ Median age of the household head Religion of the household head Hindu Muslim Christian Sikh Buddhist Jain Zoroastrian Caste/tribe of the household head Scheduled caste Scheduled tribe Other backward class Other # Don’t know Number of usual members 1 2 3 4 5 6 7 8 9+ Mean household size Total percent Number of households
91.4 8.6
9.2 36.0 31.4 23.5
46.8
85.5 12.0
0.4 1.9 0.0 0.1 0.0
14.3 3.1
21.7 57.4
3.6
3.2 6.2 8.3
15.8 20.8 17.0 11.5
6.8 10.3
5.4
100.0
12,885
91.4 8.6
9.6 35.7 29.7 25.0
46.9
87.4 10.6
0.3 1.6 0.0 0.0 0.0
15.2 3.5
20.3 58.0
3.1
3.4 6.4 7.7
14.1 20.1 17.7 12.0
7.6 11.0
5.5
100.0
9,344
91.4 8.6
8.0 36.7 35.8 19.4
46.5
80.4 15.7
0.6 2.8 0.0 0.4 0.0
11.7 2.0
25.5 55.9
4.9
2.7 5.8 9.9
20.3 22.5 15.1 10.4
4.8 8.5
5.2
100.0
3,541
Note: Table is based on the de jure population. # Higher caste (Not belonging to a scheduled caste, a scheduled tribe and an other backward class)
14
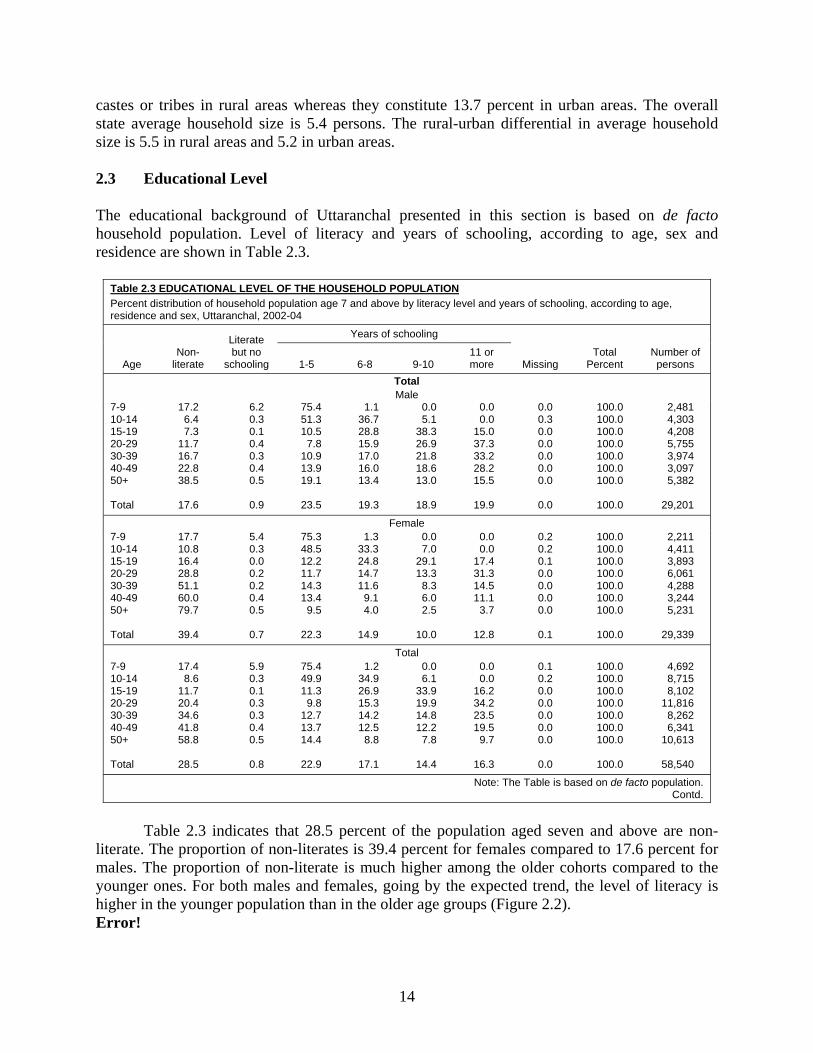
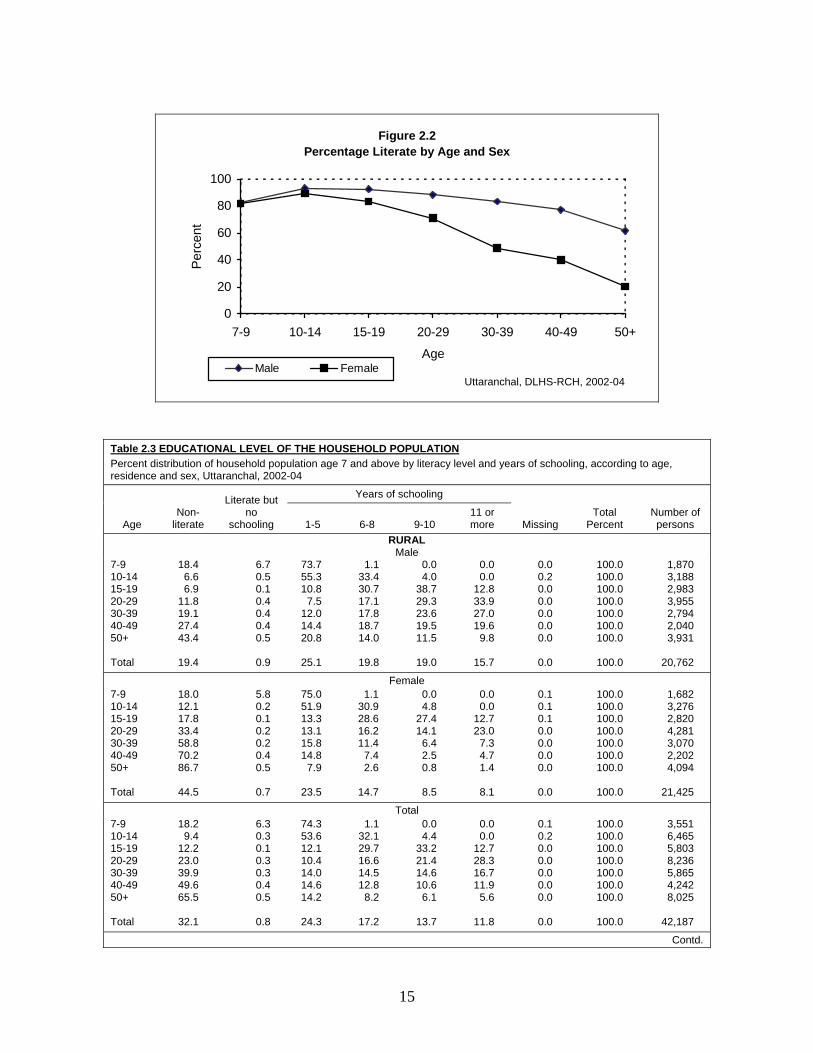
castes or tribes in rural areas whereas they constitute 13.7 percent in urban areas. The overall state average household size is 5.4 persons. The rural-urban differential in average household size is 5.5 in rural areas and 5.2 in urban areas. 2.3 Educational Level The educational background of Uttaranchal presented in this section is based on de facto household population. Level of literacy and years of schooling, according to age, sex and residence are shown in Table 2.3.
Table 2.3 EDUCATIONAL LEVEL OF THE HOUSEHOLD POPULATION Percent distribution of household population age 7 and above by literacy level and years of schooling, according to age, residence and sex, Uttaranchal, 2002-04
Age Non-
literate
Literate but no
schooling
Years of schooling
Missing Total
Percent Number of persons
1-5 6-8 9-10
11 or more
Total Male
7-9 10-14 15-19 20-29 30-39 40-49 50+ Total
17.2 6.4 7.3
11.7 16.7 22.8 38.5
17.6
6.2 0.3 0.1 0.4 0.3 0.4 0.5
0.9
75.4 51.3 10.5
7.8 10.9 13.9 19.1
23.5
1.1 36.7 28.8 15.9 17.0 16.0 13.4
19.3
0.0 5.1
38.3 26.9 21.8 18.6 13.0
18.9
0.0 0.0
15.0 37.3 33.2 28.2 15.5
19.9
0.0 0.3 0.0 0.0 0.0 0.0 0.0
0.0
100.0 100.0 100.0 100.0 100.0 100.0 100.0
100.0
2,481 4,303 4,208 5,755 3,974 3,097 5,382
29,201
Female 7-9 10-14 15-19 20-29 30-39 40-49 50+ Total
17.7 10.8 16.4 28.8 51.1 60.0 79.7
39.4
5.4 0.3 0.0 0.2 0.2 0.4 0.5
0.7
75.3 48.5 12.2 11.7 14.3 13.4
9.5
22.3
1.3 33.3 24.8 14.7 11.6
9.1 4.0
14.9
0.0 7.0
29.1 13.3
8.3 6.0 2.5
10.0
0.0 0.0
17.4 31.3 14.5 11.1
3.7
12.8
0.2 0.2 0.1 0.0 0.0 0.0 0.0
0.1
100.0 100.0 100.0 100.0 100.0 100.0 100.0
100.0
2,211 4,411 3,893 6,061 4,288 3,244 5,231
29,339
Total 7-9 10-14 15-19 20-29 30-39 40-49 50+ Total
17.4 8.6
11.7 20.4 34.6 41.8 58.8
28.5
5.9 0.3 0.1 0.3 0.3 0.4 0.5
0.8
75.4 49.9 11.3
9.8 12.7 13.7 14.4
22.9
1.2 34.9 26.9 15.3 14.2 12.5
8.8
17.1
0.0 6.1
33.9 19.9 14.8 12.2
7.8
14.4
0.0 0.0
16.2 34.2 23.5 19.5
9.7
16.3
0.1 0.2 0.0 0.0 0.0 0.0 0.0
0.0
100.0 100.0 100.0 100.0 100.0 100.0 100.0
100.0
4,692 8,715 8,102
11,816 8,262 6,341
10,613
58,540
Note: The Table is based on de facto population. Contd.
Table 2.3 indicates that 28.5 percent of the population aged seven and above are non-
literate. The proportion of non-literates is 39.4 percent for females compared to 17.6 percent for males. The proportion of non-literate is much higher among the older cohorts compared to the younger ones. For both males and females, going by the expected trend, the level of literacy is higher in the younger population than in the older age groups (Figure 2.2). Error!
15
Figure 2.2 Percentage Literate by Age and Sex
0
20
40
60
80
100
7-9 10-14 15-19 20-29 30-39 40-49 50+
Age
Per
cent
Male Female
Table 2.3 EDUCATIONAL LEVEL OF THE HOUSEHOLD POPULATION Percent distribution of household population age 7 and above by literacy level and years of schooling, according to age, residence and sex, Uttaranchal, 2002-04
Age Non-
literate
Literate but no
schooling
Years of schooling
Total Percent
Number of persons
1-5 6-8 9-10
11 or more Missing
RURAL Male
7-9 10-14 15-19 20-29 30-39 40-49 50+ Total
18.4 6.6 6.9
11.8 19.1 27.4 43.4
19.4
6.7 0.5 0.1 0.4 0.4 0.4 0.5
0.9
73.7 55.3 10.8
7.5 12.0 14.4 20.8
25.1
1.1 33.4 30.7 17.1 17.8 18.7 14.0
19.8
0.0 4.0
38.7 29.3 23.6 19.5 11.5
19.0
0.0 0.0
12.8 33.9 27.0 19.6
9.8
15.7
0.0 0.2 0.0 0.0 0.0 0.0 0.0
0.0
100.0 100.0 100.0 100.0 100.0 100.0 100.0
100.0
1,870 3,188 2,983 3,955 2,794 2,040 3,931
20,762
Female 7-9 10-14 15-19 20-29 30-39 40-49 50+ Total
18.0 12.1 17.8 33.4 58.8 70.2 86.7
44.5
5.8 0.2 0.1 0.2 0.2 0.4 0.5
0.7
75.0 51.9 13.3 13.1 15.8 14.8
7.9
23.5
1.1 30.9 28.6 16.2 11.4
7.4 2.6
14.7
0.0 4.8
27.4 14.1
6.4 2.5 0.8
8.5
0.0 0.0
12.7 23.0
7.3 4.7 1.4
8.1
0.1 0.1 0.1 0.0 0.0 0.0 0.0
0.0
100.0 100.0 100.0 100.0 100.0 100.0 100.0
100.0
1,682 3,276 2,820 4,281 3,070 2,202 4,094
21,425
Total 7-9 10-14 15-19 20-29 30-39 40-49 50+ Total
18.2 9.4
12.2 23.0 39.9 49.6 65.5
32.1
6.3 0.3 0.1 0.3 0.3 0.4 0.5
0.8
74.3 53.6 12.1 10.4 14.0 14.6 14.2
24.3
1.1 32.1 29.7 16.6 14.5 12.8
8.2
17.2
0.0 4.4
33.2 21.4 14.6 10.6
6.1
13.7
0.0 0.0
12.7 28.3 16.7 11.9
5.6
11.8
0.1 0.2 0.0 0.0 0.0 0.0 0.0
0.0
100.0 100.0 100.0 100.0 100.0 100.0 100.0
100.0
3,551 6,465 5,803 8,236 5,865 4,242 8,025
42,187
Contd.
Uttaranchal, DLHS-RCH, 2002-04
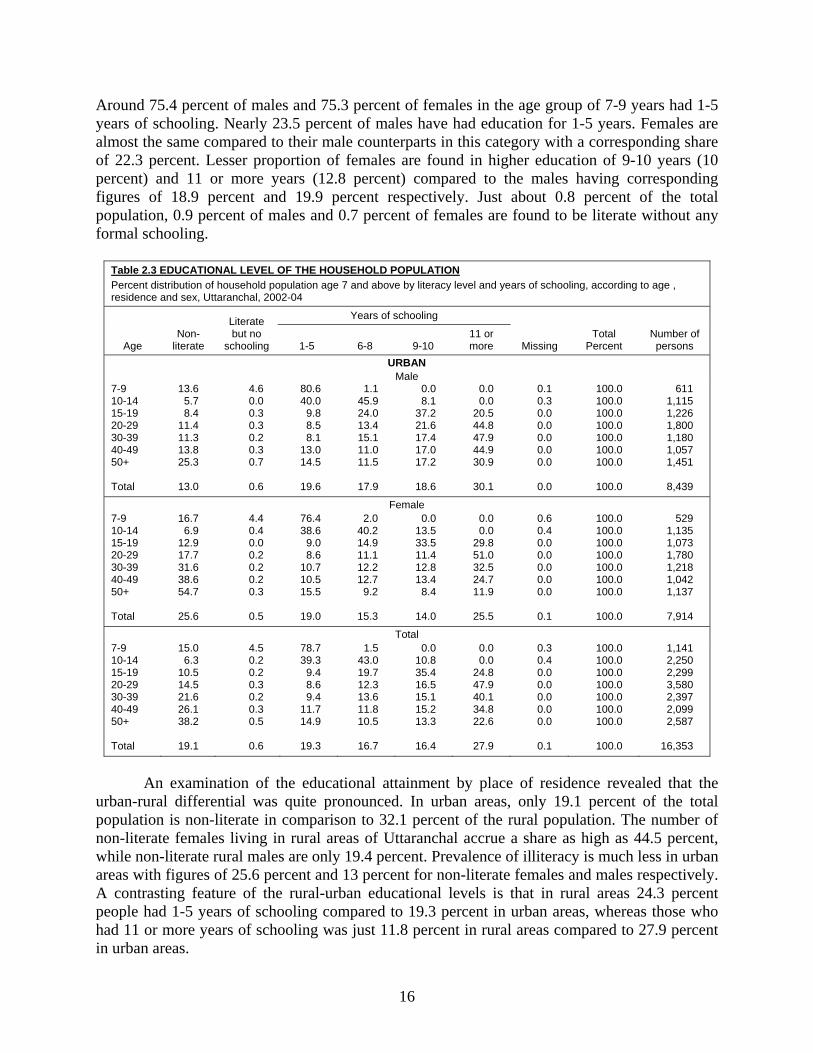
16
Around 75.4 percent of males and 75.3 percent of females in the age group of 7-9 years had 1-5 years of schooling. Nearly 23.5 percent of males have had education for 1-5 years. Females are almost the same compared to their male counterparts in this category with a corresponding share of 22.3 percent. Lesser proportion of females are found in higher education of 9-10 years (10 percent) and 11 or more years (12.8 percent) compared to the males having corresponding figures of 18.9 percent and 19.9 percent respectively. Just about 0.8 percent of the total population, 0.9 percent of males and 0.7 percent of females are found to be literate without any formal schooling.
Table 2.3 EDUCATIONAL LEVEL OF THE HOUSEHOLD POPULATION Percent distribution of household population age 7 and above by literacy level and years of schooling, according to age , residence and sex, Uttaranchal, 2002-04
Age Non-
literate
Literate but no
schooling
Years of schooling
Missing Total
Percent Number of persons
1-5 6-8 9-10
11 or more
URBAN Male
7-9 10-14 15-19 20-29 30-39 40-49 50+ Total
13.6 5.7 8.4
11.4 11.3 13.8 25.3
13.0
4.6 0.0 0.3 0.3 0.2 0.3 0.7
0.6
80.6 40.0
9.8 8.5 8.1
13.0 14.5
19.6
1.1 45.9 24.0 13.4 15.1 11.0 11.5
17.9
0.0 8.1
37.2 21.6 17.4 17.0 17.2
18.6
0.0 0.0
20.5 44.8 47.9 44.9 30.9
30.1
0.1 0.3 0.0 0.0 0.0 0.0 0.0
0.0
100.0 100.0 100.0 100.0 100.0 100.0 100.0
100.0
611 1,115 1,226 1,800 1,180 1,057 1,451
8,439
Female 7-9 10-14 15-19 20-29 30-39 40-49 50+ Total
16.7 6.9
12.9 17.7 31.6 38.6 54.7
25.6
4.4 0.4 0.0 0.2 0.2 0.2 0.3
0.5
76.4 38.6
9.0 8.6
10.7 10.5 15.5
19.0
2.0 40.2 14.9 11.1 12.2 12.7
9.2
15.3
0.0 13.5 33.5 11.4 12.8 13.4
8.4
14.0
0.0 0.0
29.8 51.0 32.5 24.7 11.9
25.5
0.6 0.4 0.0 0.0 0.0 0.0 0.0
0.1
100.0 100.0 100.0 100.0 100.0 100.0 100.0
100.0
529 1,135 1,073 1,780 1,218 1,042 1,137
7,914
Total 7-9 10-14 15-19 20-29 30-39 40-49 50+ Total
15.0 6.3
10.5 14.5 21.6 26.1 38.2
19.1
4.5 0.2 0.2 0.3 0.2 0.3 0.5
0.6
78.7 39.3
9.4 8.6 9.4
11.7 14.9
19.3
1.5 43.0 19.7 12.3 13.6 11.8 10.5
16.7
0.0 10.8 35.4 16.5 15.1 15.2 13.3
16.4
0.0 0.0
24.8 47.9 40.1 34.8 22.6
27.9
0.3 0.4 0.0 0.0 0.0 0.0 0.0
0.1
100.0 100.0 100.0 100.0 100.0 100.0 100.0
100.0
1,141 2,250 2,299 3,580 2,397 2,099 2,587
16,353
An examination of the educational attainment by place of residence revealed that the urban-rural differential was quite pronounced. In urban areas, only 19.1 percent of the total population is non-literate in comparison to 32.1 percent of the rural population. The number of non-literate females living in rural areas of Uttaranchal accrue a share as high as 44.5 percent, while non-literate rural males are only 19.4 percent. Prevalence of illiteracy is much less in urban areas with figures of 25.6 percent and 13 percent for non-literate females and males respectively. A contrasting feature of the rural-urban educational levels is that in rural areas 24.3 percent people had 1-5 years of schooling compared to 19.3 percent in urban areas, whereas those who had 11 or more years of schooling was just 11.8 percent in rural areas compared to 27.9 percent in urban areas.
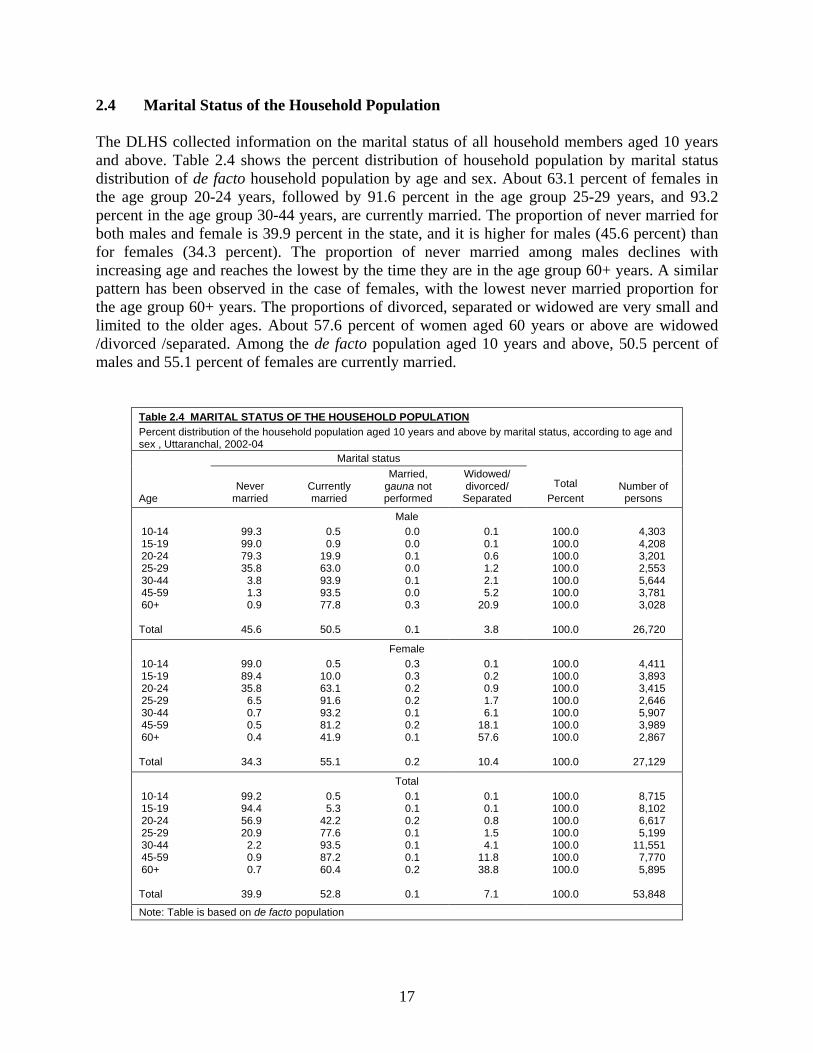
17
2.4 Marital Status of the Household Population The DLHS collected information on the marital status of all household members aged 10 years and above. Table 2.4 shows the percent distribution of household population by marital status distribution of de facto household population by age and sex. About 63.1 percent of females in the age group 20-24 years, followed by 91.6 percent in the age group 25-29 years, and 93.2 percent in the age group 30-44 years, are currently married. The proportion of never married for both males and female is 39.9 percent in the state, and it is higher for males (45.6 percent) than for females (34.3 percent). The proportion of never married among males declines with increasing age and reaches the lowest by the time they are in the age group 60+ years. A similar pattern has been observed in the case of females, with the lowest never married proportion for the age group 60+ years. The proportions of divorced, separated or widowed are very small and limited to the older ages. About 57.6 percent of women aged 60 years or above are widowed /divorced /separated. Among the de facto population aged 10 years and above, 50.5 percent of males and 55.1 percent of females are currently married.
Table 2.4 MARITAL STATUS OF THE HOUSEHOLD POPULATION Percent distribution of the household population aged 10 years and above by marital status, according to age and sex , Uttaranchal, 2002-04
Age
Marital status
Total Percent
Number of persons
Never married
Currently married
Married, gauna not performed
Widowed/ divorced/
Separated
Male 10-14 15-19 20-24 25-29 30-44 45-59 60+
Total
99.3 99.0 79.3 35.8
3.8 1.3 0.9
45.6
0.5 0.9
19.9 63.0 93.9 93.5 77.8
50.5
0.0 0.0 0.1 0.0 0.1 0.0 0.3
0.1
0.1 0.1 0.6 1.2 2.1 5.2
20.9
3.8
100.0 100.0 100.0 100.0 100.0 100.0 100.0
100.0
4,303 4,208 3,201 2,553 5,644 3,781 3,028
26,720
Female 10-14 15-19 20-24 25-29 30-44 45-59 60+
Total
99.0 89.4 35.8
6.5 0.7 0.5 0.4
34.3
0.5 10.0 63.1 91.6 93.2 81.2 41.9
55.1
0.3 0.3 0.2 0.2 0.1 0.2 0.1
0.2
0.1 0.2 0.9 1.7 6.1
18.1 57.6
10.4
100.0 100.0 100.0 100.0 100.0 100.0 100.0
100.0
4,411 3,893 3,415 2,646 5,907 3,989 2,867
27,129
Total 10-14 15-19 20-24 25-29 30-44 45-59 60+
Total
99.2 94.4 56.9 20.9
2.2 0.9 0.7
39.9
0.5 5.3
42.2 77.6 93.5 87.2 60.4
52.8
0.1 0.1 0.2 0.1 0.1 0.1 0.2
0.1
0.1 0.1 0.8 1.5 4.1
11.8 38.8
7.1
100.0 100.0 100.0 100.0 100.0 100.0 100.0
100.0
8,715 8,102 6,617 5,199
11,551 7,770 5,895
53,848
Note: Table is based on de facto population
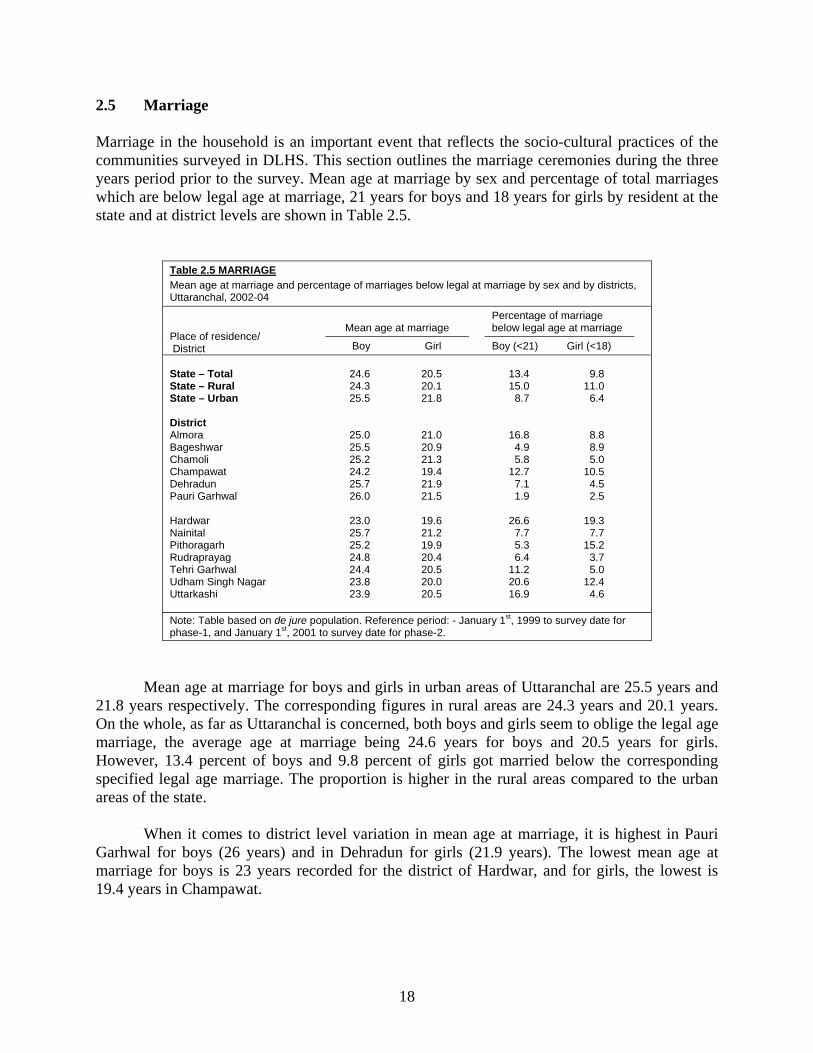
18
2.5 Marriage Marriage in the household is an important event that reflects the socio-cultural practices of the communities surveyed in DLHS. This section outlines the marriage ceremonies during the three years period prior to the survey. Mean age at marriage by sex and percentage of total marriages which are below legal age at marriage, 21 years for boys and 18 years for girls by resident at the state and at district levels are shown in Table 2.5.
Table 2.5 MARRIAGE Mean age at marriage and percentage of marriages below legal at marriage by sex and by districts, Uttaranchal, 2002-04
Place of residence/ District
Mean age at marriage Percentage of marriage below legal age at marriage
Boy Girl Boy (<21) Girl (<18) State – Total State – Rural State – Urban District Almora Bageshwar Chamoli Champawat Dehradun Pauri Garhwal Hardwar Nainital Pithoragarh Rudraprayag Tehri Garhwal Udham Singh Nagar Uttarkashi
24.6 24.3 25.5
25.0 25.5 25.2 24.2 25.7 26.0
23.0 25.7 25.2 24.8 24.4 23.8 23.9
20.5 20.1 21.8
21.0 20.9 21.3 19.4 21.9 21.5
19.6 21.2 19.9 20.4 20.5 20.0 20.5
13.4 15.0
8.7
16.8 4.9 5.8
12.7 7.1 1.9
26.6
7.7 5.3 6.4
11.2 20.6 16.9
9.8
11.0 6.4
8.8 8.9 5.0
10.5 4.5 2.5
19.3
7.7 15.2
3.7 5.0
12.4 4.6
Note: Table based on de jure population. Reference period: - January 1st, 1999 to survey date for phase-1, and January 1st, 2001 to survey date for phase-2.
Mean age at marriage for boys and girls in urban areas of Uttaranchal are 25.5 years and 21.8 years respectively. The corresponding figures in rural areas are 24.3 years and 20.1 years. On the whole, as far as Uttaranchal is concerned, both boys and girls seem to oblige the legal age marriage, the average age at marriage being 24.6 years for boys and 20.5 years for girls. However, 13.4 percent of boys and 9.8 percent of girls got married below the corresponding specified legal age marriage. The proportion is higher in the rural areas compared to the urban areas of the state.
When it comes to district level variation in mean age at marriage, it is highest in Pauri Garhwal for boys (26 years) and in Dehradun for girls (21.9 years). The lowest mean age at marriage for boys is 23 years recorded for the district of Hardwar, and for girls, the lowest is 19.4 years in Champawat.
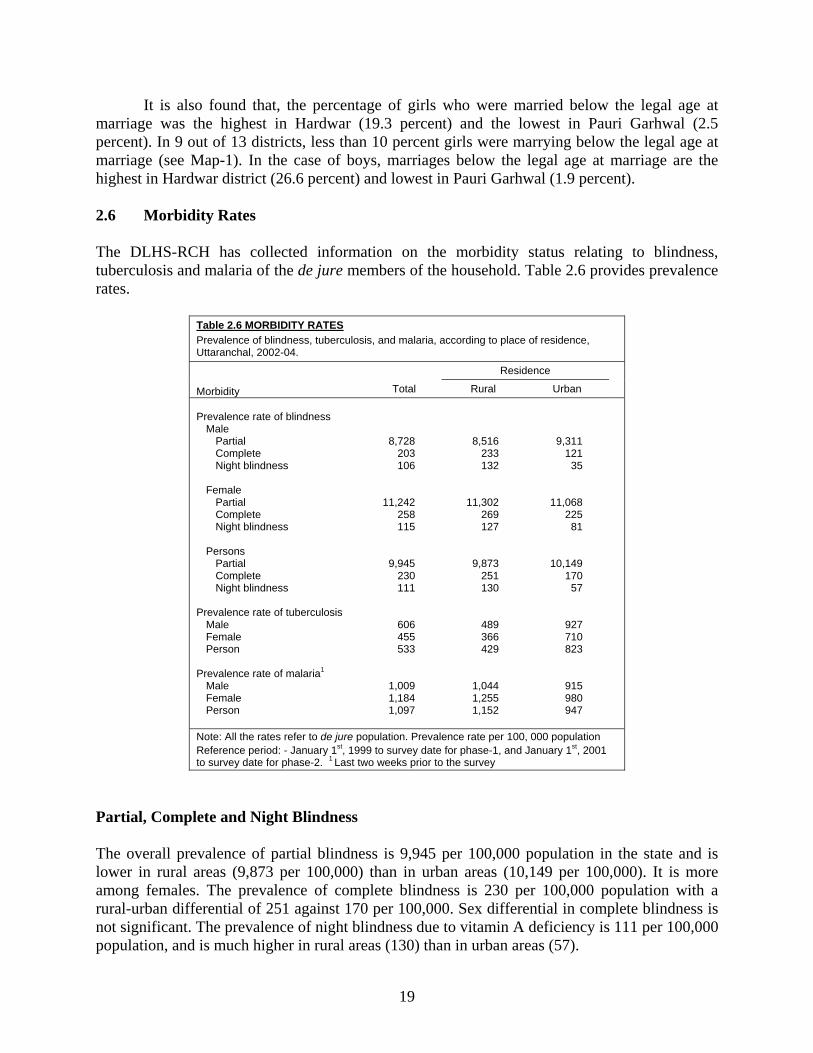
19
It is also found that, the percentage of girls who were married below the legal age at marriage was the highest in Hardwar (19.3 percent) and the lowest in Pauri Garhwal (2.5 percent). In 9 out of 13 districts, less than 10 percent girls were marrying below the legal age at marriage (see Map-1). In the case of boys, marriages below the legal age at marriage are the highest in Hardwar district (26.6 percent) and lowest in Pauri Garhwal (1.9 percent). 2.6 Morbidity Rates
The DLHS-RCH has collected information on the morbidity status relating to blindness, tuberculosis and malaria of the de jure members of the household. Table 2.6 provides prevalence rates.
Table 2.6 MORBIDITY RATES Prevalence of blindness, tuberculosis, and malaria, according to place of residence, Uttaranchal, 2002-04.
Morbidity Total
Residence
Rural Urban Prevalence rate of blindness Male Partial Complete Night blindness Female Partial Complete Night blindness Persons Partial Complete Night blindness Prevalence rate of tuberculosis Male Female Person Prevalence rate of malaria1 Male Female Person
8,728 203 106
11,242 258 115
9,945 230 111
606 455 533
1,009 1,184 1,097
8,516 233 132
11,302 269 127
9,873 251 130
489 366 429
1,044 1,255 1,152
9,311 121
35
11,068 225
81
10,149 170
57
927 710 823
915 980 947
Note: All the rates refer to de jure population. Prevalence rate per 100, 000 population Reference period: - January 1st, 1999 to survey date for phase-1, and January 1st, 2001 to survey date for phase-2. 1 Last two weeks prior to the survey
Partial, Complete and Night Blindness The overall prevalence of partial blindness is 9,945 per 100,000 population in the state and is lower in rural areas (9,873 per 100,000) than in urban areas (10,149 per 100,000). It is more among females. The prevalence of complete blindness is 230 per 100,000 population with a rural-urban differential of 251 against 170 per 100,000. Sex differential in complete blindness is not significant. The prevalence of night blindness due to vitamin A deficiency is 111 per 100,000 population, and is much higher in rural areas (130) than in urban areas (57).
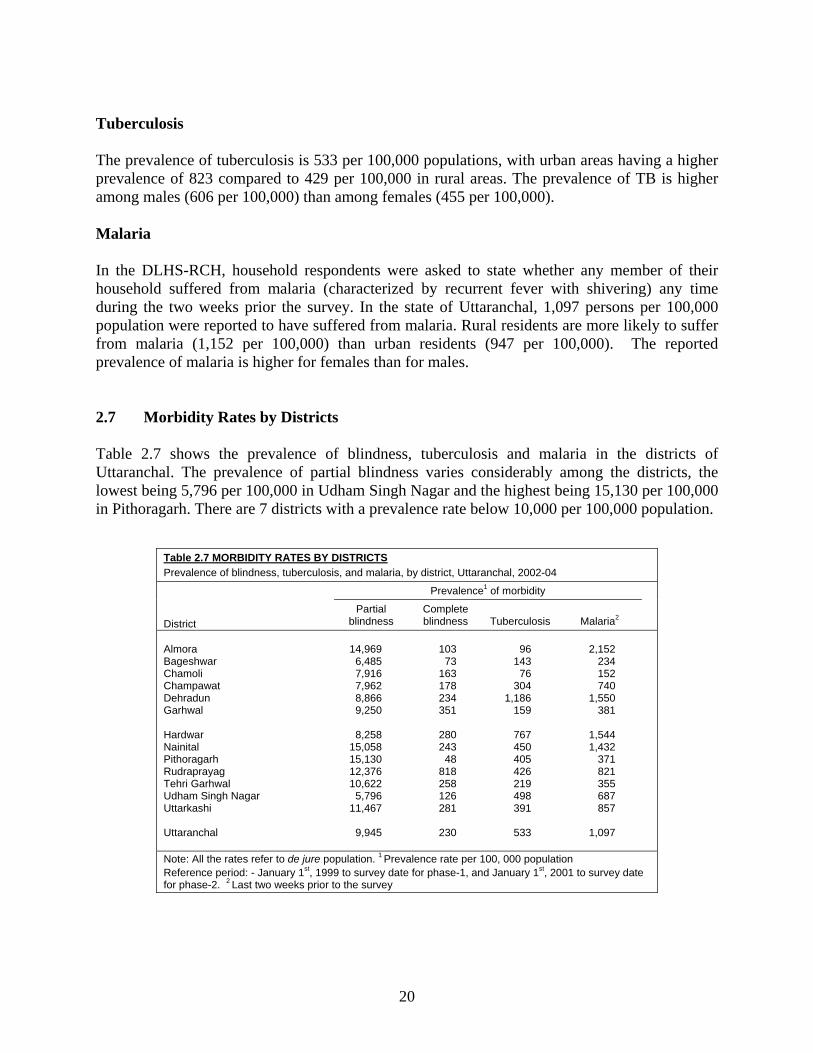
20
Tuberculosis The prevalence of tuberculosis is 533 per 100,000 populations, with urban areas having a higher prevalence of 823 compared to 429 per 100,000 in rural areas. The prevalence of TB is higher among males (606 per 100,000) than among females (455 per 100,000). Malaria In the DLHS-RCH, household respondents were asked to state whether any member of their household suffered from malaria (characterized by recurrent fever with shivering) any time during the two weeks prior the survey. In the state of Uttaranchal, 1,097 persons per 100,000 population were reported to have suffered from malaria. Rural residents are more likely to suffer from malaria (1,152 per 100,000) than urban residents (947 per 100,000). The reported prevalence of malaria is higher for females than for males. 2.7 Morbidity Rates by Districts
Table 2.7 shows the prevalence of blindness, tuberculosis and malaria in the districts of Uttaranchal. The prevalence of partial blindness varies considerably among the districts, the lowest being 5,796 per 100,000 in Udham Singh Nagar and the highest being 15,130 per 100,000 in Pithoragarh. There are 7 districts with a prevalence rate below 10,000 per 100,000 population.
Table 2.7 MORBIDITY RATES BY DISTRICTS Prevalence of blindness, tuberculosis, and malaria, by district, Uttaranchal, 2002-04
District
Prevalence1 of morbidity
Partial blindness
Complete blindness Tuberculosis Malaria2
Almora Bageshwar Chamoli Champawat Dehradun Garhwal Hardwar Nainital Pithoragarh Rudraprayag Tehri Garhwal Udham Singh Nagar Uttarkashi Uttaranchal
14,969
6,485 7,916 7,962 8,866 9,250
8,258
15,058 15,130 12,376 10,622
5,796 11,467
9,945
103
73 163 178 234 351
280 243
48 818 258 126 281
230
96
143 76
304 1,186
159
767 450 405 426 219 498 391
533
2,152
234 152 740
1,550 381
1,544 1,432
371 821 355 687 857
1,097
Note: All the rates refer to de jure population. 1 Prevalence rate per 100, 000 population Reference period: - January 1st, 1999 to survey date for phase-1, and January 1st, 2001 to survey date for phase-2. 2 Last two weeks prior to the survey
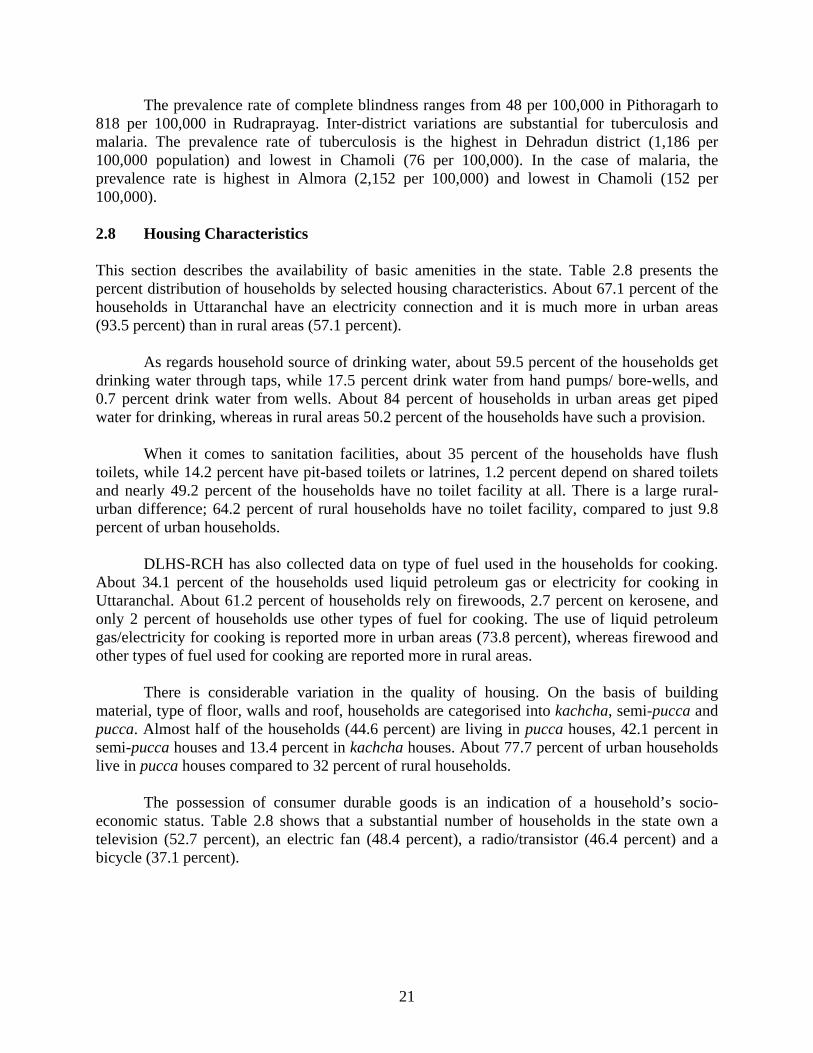
21
The prevalence rate of complete blindness ranges from 48 per 100,000 in Pithoragarh to 818 per 100,000 in Rudraprayag. Inter-district variations are substantial for tuberculosis and malaria. The prevalence rate of tuberculosis is the highest in Dehradun district (1,186 per 100,000 population) and lowest in Chamoli (76 per 100,000). In the case of malaria, the prevalence rate is highest in Almora (2,152 per 100,000) and lowest in Chamoli (152 per 100,000). 2.8 Housing Characteristics This section describes the availability of basic amenities in the state. Table 2.8 presents the percent distribution of households by selected housing characteristics. About 67.1 percent of the households in Uttaranchal have an electricity connection and it is much more in urban areas (93.5 percent) than in rural areas (57.1 percent).
As regards household source of drinking water, about 59.5 percent of the households get drinking water through taps, while 17.5 percent drink water from hand pumps/ bore-wells, and 0.7 percent drink water from wells. About 84 percent of households in urban areas get piped water for drinking, whereas in rural areas 50.2 percent of the households have such a provision.
When it comes to sanitation facilities, about 35 percent of the households have flush toilets, while 14.2 percent have pit-based toilets or latrines, 1.2 percent depend on shared toilets and nearly 49.2 percent of the households have no toilet facility at all. There is a large rural-urban difference; 64.2 percent of rural households have no toilet facility, compared to just 9.8 percent of urban households. DLHS-RCH has also collected data on type of fuel used in the households for cooking. About 34.1 percent of the households used liquid petroleum gas or electricity for cooking in Uttaranchal. About 61.2 percent of households rely on firewoods, 2.7 percent on kerosene, and only 2 percent of households use other types of fuel for cooking. The use of liquid petroleum gas/electricity for cooking is reported more in urban areas (73.8 percent), whereas firewood and other types of fuel used for cooking are reported more in rural areas.
There is considerable variation in the quality of housing. On the basis of building material, type of floor, walls and roof, households are categorised into kachcha, semi-pucca and pucca. Almost half of the households (44.6 percent) are living in pucca houses, 42.1 percent in semi-pucca houses and 13.4 percent in kachcha houses. About 77.7 percent of urban households live in pucca houses compared to 32 percent of rural households.
The possession of consumer durable goods is an indication of a household’s socio-economic status. Table 2.8 shows that a substantial number of households in the state own a television (52.7 percent), an electric fan (48.4 percent), a radio/transistor (46.4 percent) and a bicycle (37.1 percent).
22
Table 2.8 HOUSING CHARACTERISTICS
Percent distribution of the household by housing characteristics and percentage of households owing selected durable goods, according to residence, Uttaranchal , 2002-04
Housing characteristic Total
Residence
Rural Urban Electricity Yes No Source of drinking water Tap inside Tap shared public Hand pump/ bore well Well covered Well uncovered River Pond Spring Other Sanitation facility Own flush toilet Own pit toilet / latrine Shared toilet of any type Public / community toilet No toilet facility Main type of fuel used for cooking Liquid petroleum gas/ electricity Kerosene Wood Other Type of house Kachcha Semi - pucca Pucca Household assets Fan Radio/transistor Sewing machine Television Telephone Bicycle Motor cycle/ scooter Car / Jeep Tractor Standard of living index Low Medium High Number of households
67.1 32.9
35.3 24.2 17.5
0.3 0.4 0.4 0.1
18.7 3.1
35.0 14.2
1.2 0.4
49.2
34.1 2.7
61.2 2.0
13.4 42.1 44.6
48.4 46.4 43.0 52.7 16.4 37.1 15.1
2.6 2.6
37.5 30.8 31.8
12,885
57.1 42.9
24.0 26.2 19.4
0.3 0.4 0.6 0.2
25.1 3.8
20.3 14.6
0.6 0.2
64.2
19.1 1.8
76.8 2.3
15.9 52.0 32.0
34.7 43.7 34.6 41.4
9.6 30.9
8.0 1.5 3.4
49.2 33.2 17.6
9,344
93.5 6.5
65.0 19.0 12.8
0.1 0.2 0.0 0.0 1.8 1.1
73.6 13.0
2.5 1.1 9.8
73.8
5.1 20.1
0.9
6.5 15.8 77.7
84.5 53.3 65.0 82.7 34.6 53.4 33.8
5.6 0.5
6.5
24.3 69.2
3,541
Other durable goods found in the surveyed households are sewing machine (43 percent), telephone (16.4 percent), and motorcycle or scooter (15.1 percent). Car/jeep and tractor each are owned by 2.6 percent of households in Uttaranchal. Ownership of most of the consumer durable items is more among the urban households than among the rural households.
Considering household amenities, such as, source of drinking water, type of house, source of lighting, fuel for cooking, toilet facility and ownership of durable goods a composite measure, standard of living index (SLI) is made for classification of households. The standard of living index is calculated by adding the following scores:
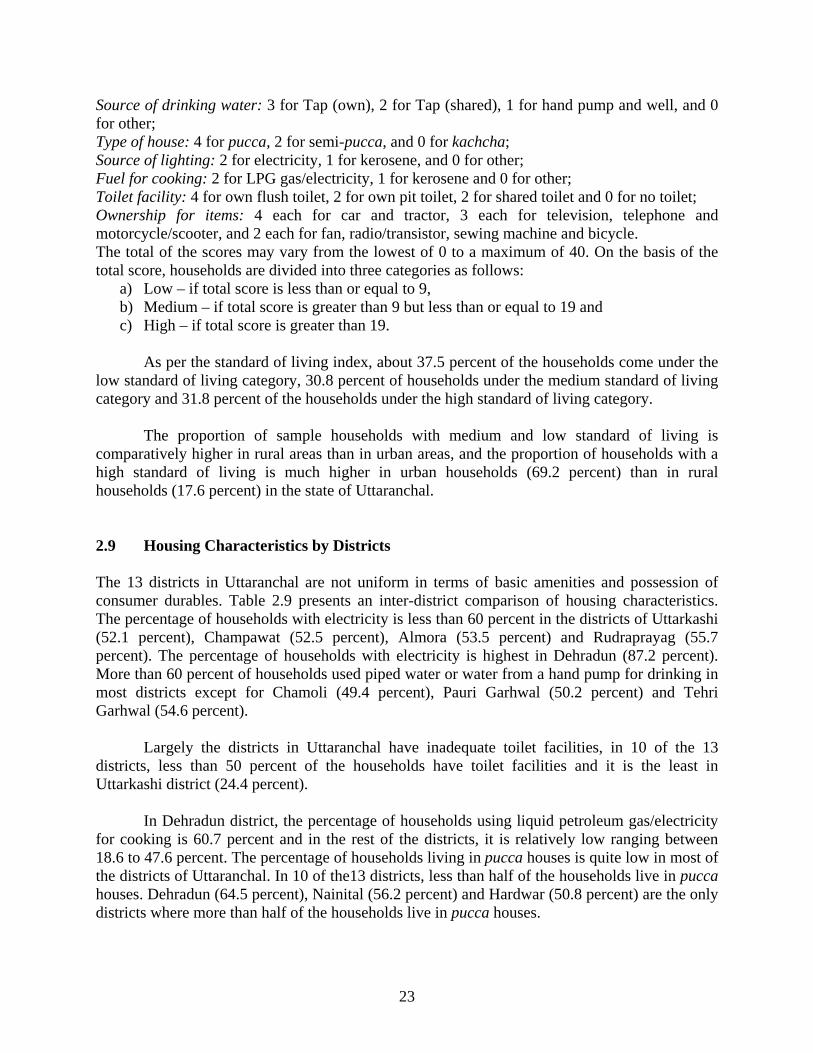
23
Source of drinking water: 3 for Tap (own), 2 for Tap (shared), 1 for hand pump and well, and 0 for other; Type of house: 4 for pucca, 2 for semi-pucca, and 0 for kachcha; Source of lighting: 2 for electricity, 1 for kerosene, and 0 for other; Fuel for cooking: 2 for LPG gas/electricity, 1 for kerosene and 0 for other; Toilet facility: 4 for own flush toilet, 2 for own pit toilet, 2 for shared toilet and 0 for no toilet; Ownership for items: 4 each for car and tractor, 3 each for television, telephone and motorcycle/scooter, and 2 each for fan, radio/transistor, sewing machine and bicycle. The total of the scores may vary from the lowest of 0 to a maximum of 40. On the basis of the total score, households are divided into three categories as follows:
a) Low – if total score is less than or equal to 9, b) Medium – if total score is greater than 9 but less than or equal to 19 and c) High – if total score is greater than 19.
As per the standard of living index, about 37.5 percent of the households come under the
low standard of living category, 30.8 percent of households under the medium standard of living category and 31.8 percent of the households under the high standard of living category.
The proportion of sample households with medium and low standard of living is comparatively higher in rural areas than in urban areas, and the proportion of households with a high standard of living is much higher in urban households (69.2 percent) than in rural households (17.6 percent) in the state of Uttaranchal.
2.9 Housing Characteristics by Districts The 13 districts in Uttaranchal are not uniform in terms of basic amenities and possession of consumer durables. Table 2.9 presents an inter-district comparison of housing characteristics. The percentage of households with electricity is less than 60 percent in the districts of Uttarkashi (52.1 percent), Champawat (52.5 percent), Almora (53.5 percent) and Rudraprayag (55.7 percent). The percentage of households with electricity is highest in Dehradun (87.2 percent). More than 60 percent of households used piped water or water from a hand pump for drinking in most districts except for Chamoli (49.4 percent), Pauri Garhwal (50.2 percent) and Tehri Garhwal (54.6 percent).
Largely the districts in Uttaranchal have inadequate toilet facilities, in 10 of the 13 districts, less than 50 percent of the households have toilet facilities and it is the least in Uttarkashi district (24.4 percent).
In Dehradun district, the percentage of households using liquid petroleum gas/electricity for cooking is 60.7 percent and in the rest of the districts, it is relatively low ranging between 18.6 to 47.6 percent. The percentage of households living in pucca houses is quite low in most of the districts of Uttaranchal. In 10 of the13 districts, less than half of the households live in pucca houses. Dehradun (64.5 percent), Nainital (56.2 percent) and Hardwar (50.8 percent) are the only districts where more than half of the households live in pucca houses.
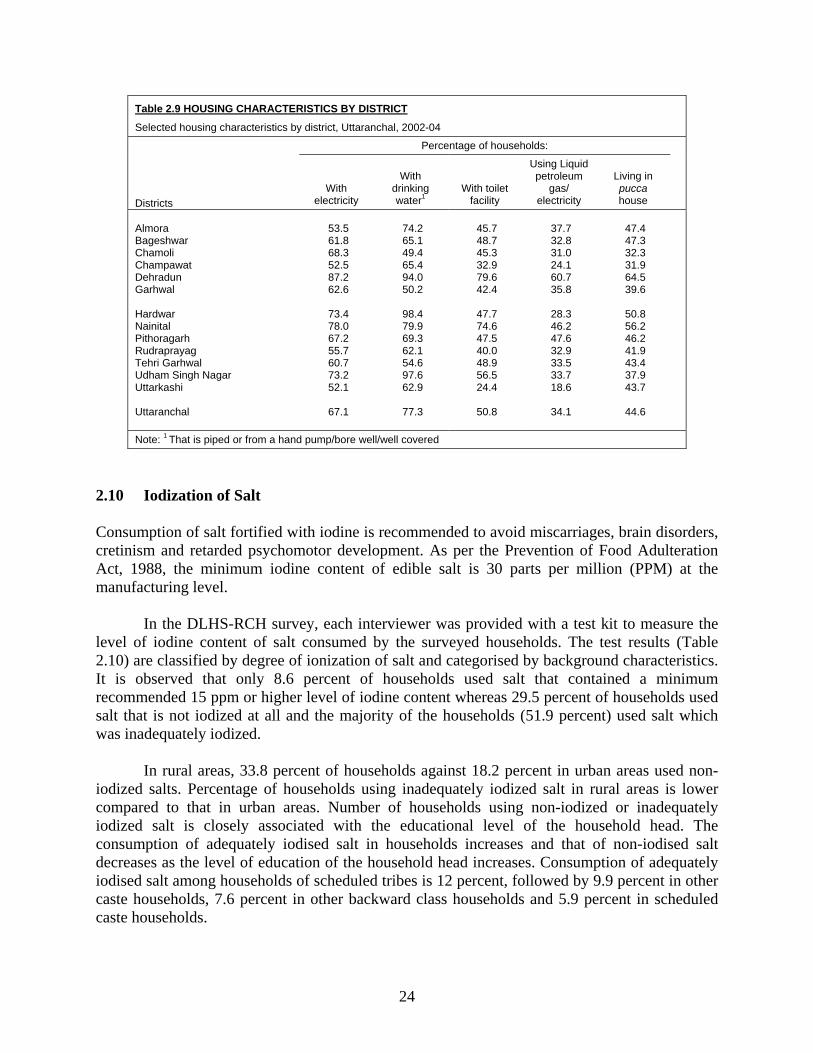
24
Table 2.9 HOUSING CHARACTERISTICS BY DISTRICT
Selected housing characteristics by district, Uttaranchal, 2002-04
Districts
Percentage of households:
With electricity
With drinking water1
With toilet facility
Using Liquid petroleum
gas/ electricity
Living in pucca house
Almora Bageshwar Chamoli Champawat Dehradun Garhwal Hardwar Nainital Pithoragarh Rudraprayag Tehri Garhwal Udham Singh Nagar Uttarkashi Uttaranchal
53.5 61.8 68.3 52.5 87.2 62.6
73.4 78.0 67.2 55.7 60.7 73.2 52.1
67.1
74.2 65.1 49.4 65.4 94.0 50.2
98.4 79.9 69.3 62.1 54.6 97.6 62.9
77.3
45.7 48.7 45.3 32.9 79.6 42.4
47.7 74.6 47.5 40.0 48.9 56.5 24.4
50.8
37.7 32.8 31.0 24.1 60.7 35.8
28.3 46.2 47.6 32.9 33.5 33.7 18.6
34.1
47.4 47.3 32.3 31.9 64.5 39.6
50.8 56.2 46.2 41.9 43.4 37.9 43.7
44.6
Note: 1 That is piped or from a hand pump/bore well/well covered
2.10 Iodization of Salt Consumption of salt fortified with iodine is recommended to avoid miscarriages, brain disorders, cretinism and retarded psychomotor development. As per the Prevention of Food Adulteration Act, 1988, the minimum iodine content of edible salt is 30 parts per million (PPM) at the manufacturing level.
In the DLHS-RCH survey, each interviewer was provided with a test kit to measure the
level of iodine content of salt consumed by the surveyed households. The test results (Table 2.10) are classified by degree of ionization of salt and categorised by background characteristics. It is observed that only 8.6 percent of households used salt that contained a minimum recommended 15 ppm or higher level of iodine content whereas 29.5 percent of households used salt that is not iodized at all and the majority of the households (51.9 percent) used salt which was inadequately iodized.
In rural areas, 33.8 percent of households against 18.2 percent in urban areas used non-
iodized salts. Percentage of households using inadequately iodized salt in rural areas is lower compared to that in urban areas. Number of households using non-iodized or inadequately iodized salt is closely associated with the educational level of the household head. The consumption of adequately iodised salt in households increases and that of non-iodised salt decreases as the level of education of the household head increases. Consumption of adequately iodised salt among households of scheduled tribes is 12 percent, followed by 9.9 percent in other caste households, 7.6 percent in other backward class households and 5.9 percent in scheduled caste households.
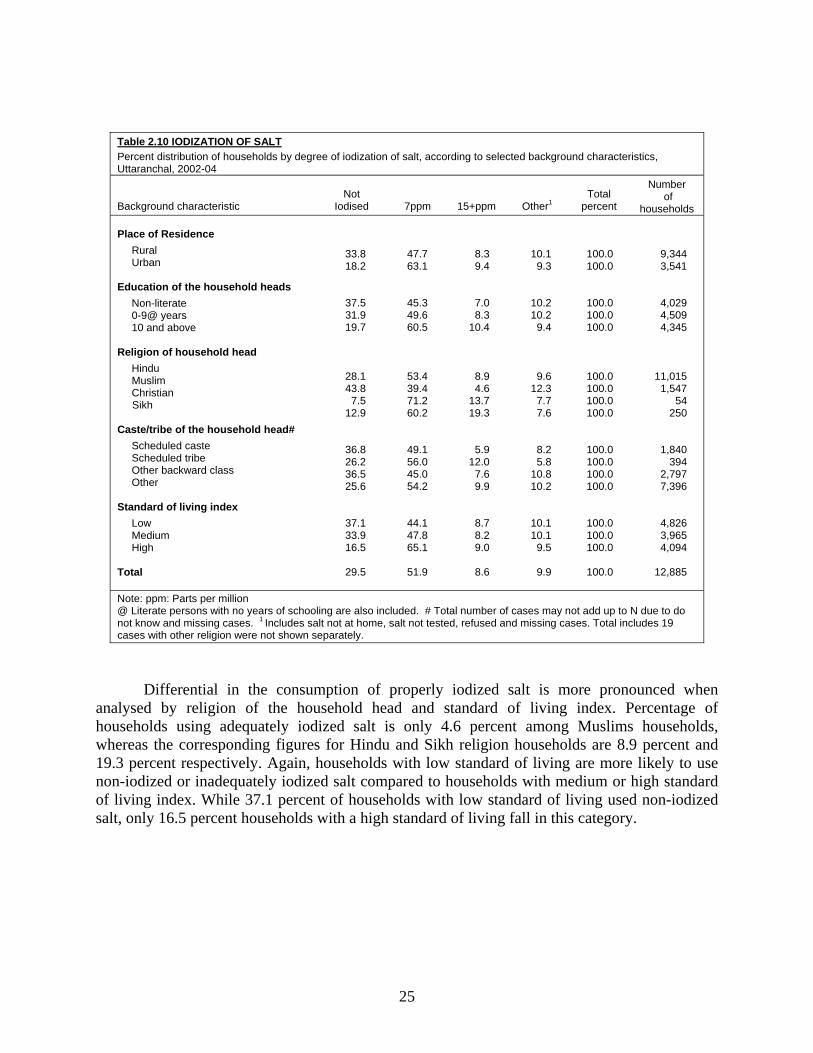
25
Table 2.10 IODIZATION OF SALT Percent distribution of households by degree of iodization of salt, according to selected background characteristics, Uttaranchal, 2002-04
Background characteristic Not
Iodised 7ppm 15+ppm Other1 Total
percent
Number of
households Place of Residence Rural Urban Education of the household heads Non-literate 0-9@ years 10 and above Religion of household head Hindu Muslim Christian Sikh Caste/tribe of the household head# Scheduled caste Scheduled tribe Other backward class Other Standard of living index Low Medium High Total
33.8 18.2
37.5 31.9 19.7
28.1 43.8
7.5 12.9
36.8 26.2 36.5 25.6
37.1 33.9 16.5
29.5
47.7 63.1
45.3 49.6 60.5
53.4 39.4 71.2 60.2
49.1 56.0 45.0 54.2
44.1 47.8 65.1
51.9
8.3 9.4
7.0 8.3
10.4
8.9 4.6
13.7 19.3
5.9 12.0
7.6 9.9
8.7 8.2 9.0
8.6
10.1 9.3
10.2 10.2
9.4
9.6 12.3
7.7 7.6
8.2 5.8
10.8 10.2
10.1 10.1
9.5
9.9
100.0 100.0
100.0 100.0 100.0
100.0 100.0 100.0 100.0
100.0 100.0 100.0 100.0
100.0 100.0 100.0
100.0
9,344 3,541
4,029 4,509 4,345
11,015 1,547
54 250
1,840 394
2,797 7,396
4,826 3,965 4,094
12,885
Note: ppm: Parts per million @ Literate persons with no years of schooling are also included. # Total number of cases may not add up to N due to do not know and missing cases. 1 Includes salt not at home, salt not tested, refused and missing cases. Total includes 19 cases with other religion were not shown separately.
Differential in the consumption of properly iodized salt is more pronounced when
analysed by religion of the household head and standard of living index. Percentage of households using adequately iodized salt is only 4.6 percent among Muslims households, whereas the corresponding figures for Hindu and Sikh religion households are 8.9 percent and 19.3 percent respectively. Again, households with low standard of living are more likely to use non-iodized or inadequately iodized salt compared to households with medium or high standard of living index. While 37.1 percent of households with low standard of living used non-iodized salt, only 16.5 percent households with a high standard of living fall in this category.
26
2.11 Iodization of Salt by Districts Table 2.11 shows district level variation in the percent distribution of households by level of iodization of salt used in the households. Almora has the lowest proportion of households (11.1 percent) using non-iodized salt, whereas Chamoli has the highest proportion of households (43.7 percent) using non-iodized salt. Percentage of households using inadequately iodized salt is the highest (76.9 percent) in Dehradun and the lowest in Chamoli (37.7 percent). Only 8.6 percent of the households in the state used adequately iodized salt, the highest being in the district of Udham Singh Nagar (20.8 percent) followed by Champawat (20.6 percent). In all the remaining districts, less than 20 percent of the households were using adequately iodized salt (see Map-2).
Table 2.11 IODIZATION OF SALT BY DISTRICT Percent distribution of households by degree of iodization of salt by district, Uttaranchal, 2002-04 District Not iodized 7ppm 15+ppm Other1 Almora Bageshwar Chamoli Champawat Dehradun Garhwal Hardwar Nainital Pithoragarh Rudraprayag Tehri Garhwal Udham Singh Nagar Uttarkashi Uttaranchal
11.1 29.1 43.7 30.0 13.1 32.2
40.7 32.0 12.5 30.5 37.0 31.9 22.0
29.5
71.7 43.2 37.7 39.8 76.9 40.4
47.3 51.9 70.4 48.8 40.9 38.1 60.6
51.9
5.6
18.7 9.4
20.6 1.7
15.4
4.1 2.8 4.0 7.6
14.0 20.8
6.1
8.6
11.6
9.0 9.2 9.6 8.3
12.0
8.0 13.3 13.0 13.1
8.1 9.2
11.3
9.9
Note: ppm: Parts per million. 1 Includes salt not at home, salt not tested, refused and missing cases
2.12 Availability of Facility and Services to the Rural Population The DLHS-RCH collected information about surveyed village from knowledgeable persons such as, the ‘Sarpanch’ or ‘Pradhan’, (village head) or other village officials or other persons including ‘teacher’ in the villages on health and educational facilities and other services available in the village. One important aspect was on the distance of the village, if not available within the village, from various types of education facilities, including primary school, middle school, secondary school, higher secondary school, college, Gurujee scheme and ‘Madarsa’. Further information on the distance of the village, if not available within the village, from various types of health facility, including sub-centres, primary health centres (PHCs), community health centres/ Rural Hospitals (CHCs/RHs), Government dispensary, hospital, private clinic or hospitals and health facilities of Indian system of Medicine (ISM).
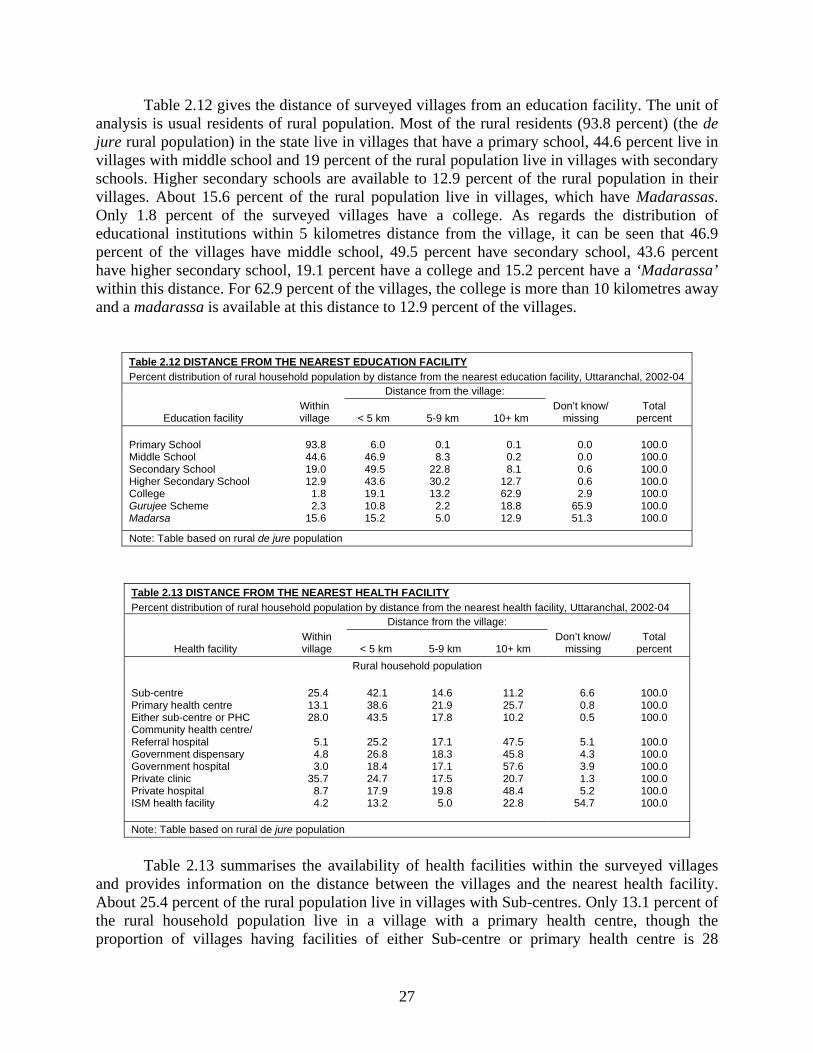
27
Table 2.12 gives the distance of surveyed villages from an education facility. The unit of analysis is usual residents of rural population. Most of the rural residents (93.8 percent) (the de jure rural population) in the state live in villages that have a primary school, 44.6 percent live in villages with middle school and 19 percent of the rural population live in villages with secondary schools. Higher secondary schools are available to 12.9 percent of the rural population in their villages. About 15.6 percent of the rural population live in villages, which have Madarassas. Only 1.8 percent of the surveyed villages have a college. As regards the distribution of educational institutions within 5 kilometres distance from the village, it can be seen that 46.9 percent of the villages have middle school, 49.5 percent have secondary school, 43.6 percent have higher secondary school, 19.1 percent have a college and 15.2 percent have a ‘Madarassa’ within this distance. For 62.9 percent of the villages, the college is more than 10 kilometres away and a madarassa is available at this distance to 12.9 percent of the villages.
Table 2.12 DISTANCE FROM THE NEAREST EDUCATION FACILITY Percent distribution of rural household population by distance from the nearest education facility, Uttaranchal, 2002-04
Education facility Within village
Distance from the village: Don’t know/
missing Total
percent < 5 km 5-9 km 10+ km
Primary School Middle School Secondary School Higher Secondary School College Gurujee Scheme Madarsa
93.8 44.6 19.0 12.9
1.8 2.3
15.6
6.0
46.9 49.5 43.6 19.1 10.8 15.2
0.1 8.3
22.8 30.2 13.2
2.2 5.0
0.1 0.2 8.1
12.7 62.9 18.8 12.9
0.0 0.0 0.6 0.6 2.9
65.9 51.3
100.0 100.0 100.0 100.0 100.0 100.0 100.0
Note: Table based on rural de jure population
Table 2.13 DISTANCE FROM THE NEAREST HEALTH FACILITY Percent distribution of rural household population by distance from the nearest health facility, Uttaranchal, 2002-04
Health facility Within village
Distance from the village: Don’t know/
missing Total
percent < 5 km 5-9 km 10+ km Rural household population
Sub-centre Primary health centre Either sub-centre or PHC Community health centre/ Referral hospital Government dispensary Government hospital Private clinic Private hospital ISM health facility
25.4 13.1 28.0
5.1 4.8 3.0
35.7 8.7 4.2
42.1 38.6 43.5
25.2 26.8 18.4 24.7 17.9 13.2
14.6 21.9 17.8
17.1 18.3 17.1 17.5 19.8
5.0
11.2 25.7 10.2
47.5 45.8 57.6 20.7 48.4 22.8
6.6 0.8 0.5
5.1 4.3 3.9 1.3 5.2
54.7
100.0 100.0 100.0
100.0 100.0 100.0 100.0 100.0 100.0
Note: Table based on rural de jure population
Table 2.13 summarises the availability of health facilities within the surveyed villages
and provides information on the distance between the villages and the nearest health facility. About 25.4 percent of the rural population live in villages with Sub-centres. Only 13.1 percent of the rural household population live in a village with a primary health centre, though the proportion of villages having facilities of either Sub-centre or primary health centre is 28
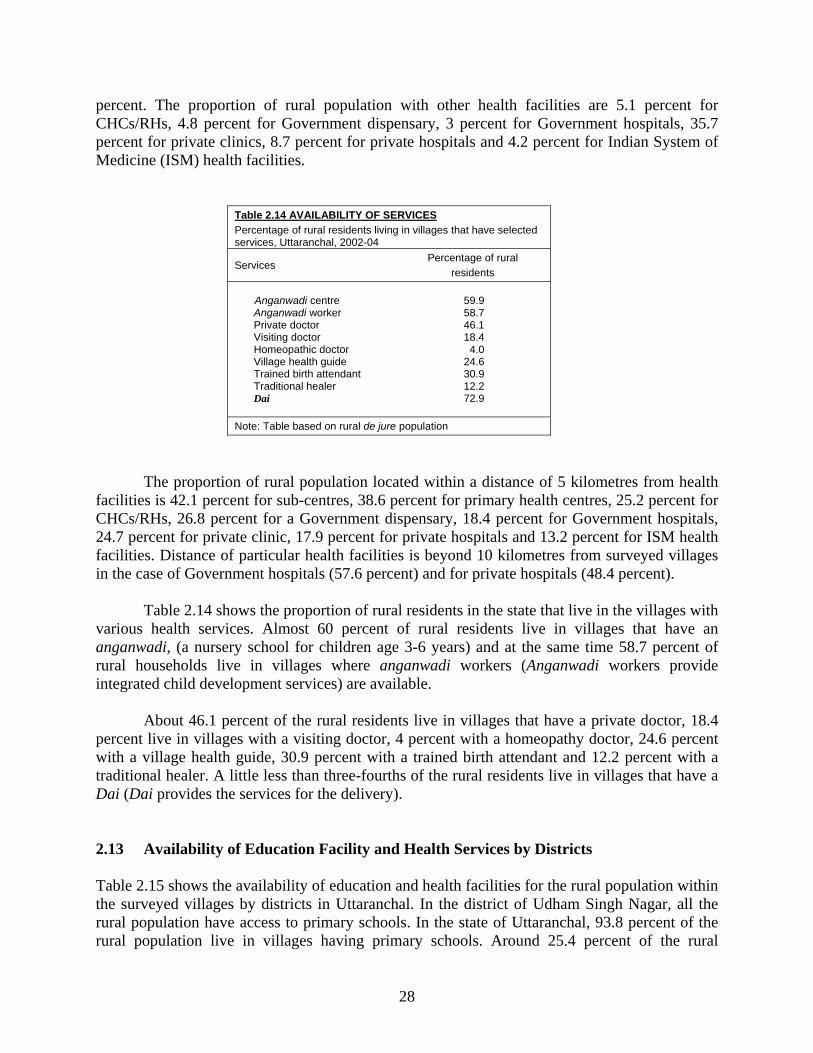
28
percent. The proportion of rural population with other health facilities are 5.1 percent for CHCs/RHs, 4.8 percent for Government dispensary, 3 percent for Government hospitals, 35.7 percent for private clinics, 8.7 percent for private hospitals and 4.2 percent for Indian System of Medicine (ISM) health facilities.
Table 2.14 AVAILABILITY OF SERVICES Percentage of rural residents living in villages that have selected services, Uttaranchal, 2002-04
Services Percentage of rural
residents Anganwadi centre Anganwadi worker Private doctor Visiting doctor Homeopathic doctor Village health guide Trained birth attendant Traditional healer Dai
59.9 58.7 46.1 18.4
4.0 24.6 30.9 12.2 72.9
Note: Table based on rural de jure population
The proportion of rural population located within a distance of 5 kilometres from health facilities is 42.1 percent for sub-centres, 38.6 percent for primary health centres, 25.2 percent for CHCs/RHs, 26.8 percent for a Government dispensary, 18.4 percent for Government hospitals, 24.7 percent for private clinic, 17.9 percent for private hospitals and 13.2 percent for ISM health facilities. Distance of particular health facilities is beyond 10 kilometres from surveyed villages in the case of Government hospitals (57.6 percent) and for private hospitals (48.4 percent). Table 2.14 shows the proportion of rural residents in the state that live in the villages with various health services. Almost 60 percent of rural residents live in villages that have an anganwadi, (a nursery school for children age 3-6 years) and at the same time 58.7 percent of rural households live in villages where anganwadi workers (Anganwadi workers provide integrated child development services) are available.
About 46.1 percent of the rural residents live in villages that have a private doctor, 18.4 percent live in villages with a visiting doctor, 4 percent with a homeopathy doctor, 24.6 percent with a village health guide, 30.9 percent with a trained birth attendant and 12.2 percent with a traditional healer. A little less than three-fourths of the rural residents live in villages that have a Dai (Dai provides the services for the delivery).
2.13 Availability of Education Facility and Health Services by Districts Table 2.15 shows the availability of education and health facilities for the rural population within the surveyed villages by districts in Uttaranchal. In the district of Udham Singh Nagar, all the rural population have access to primary schools. In the state of Uttaranchal, 93.8 percent of the rural population live in villages having primary schools. Around 25.4 percent of the rural
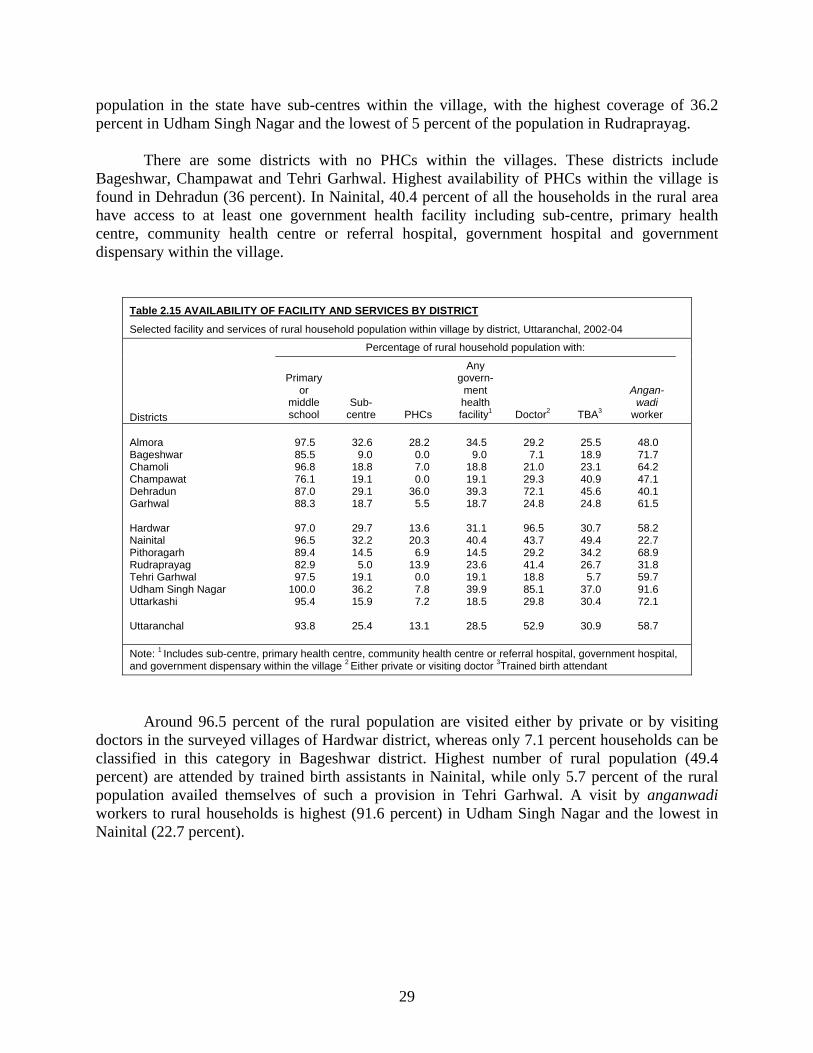
29
population in the state have sub-centres within the village, with the highest coverage of 36.2 percent in Udham Singh Nagar and the lowest of 5 percent of the population in Rudraprayag.
There are some districts with no PHCs within the villages. These districts include Bageshwar, Champawat and Tehri Garhwal. Highest availability of PHCs within the village is found in Dehradun (36 percent). In Nainital, 40.4 percent of all the households in the rural area have access to at least one government health facility including sub-centre, primary health centre, community health centre or referral hospital, government hospital and government dispensary within the village.
Table 2.15 AVAILABILITY OF FACILITY AND SERVICES BY DISTRICT
Selected facility and services of rural household population within village by district, Uttaranchal, 2002-04
Districts
Percentage of rural household population with:
Primary or
middle school
Sub-centre PHCs
Any govern-
ment health facility1 Doctor2 TBA3
Angan-wadi
worker
Almora Bageshwar Chamoli Champawat Dehradun Garhwal Hardwar Nainital Pithoragarh Rudraprayag Tehri Garhwal Udham Singh Nagar Uttarkashi Uttaranchal
97.5 85.5 96.8 76.1 87.0 88.3
97.0 96.5 89.4 82.9 97.5
100.0 95.4
93.8
32.6
9.0 18.8 19.1 29.1 18.7
29.7 32.2 14.5
5.0 19.1 36.2 15.9
25.4
28.2
0.0 7.0 0.0
36.0 5.5
13.6 20.3
6.9 13.9
0.0 7.8 7.2
13.1
34.5
9.0 18.8 19.1 39.3 18.7
31.1 40.4 14.5 23.6 19.1 39.9 18.5
28.5
29.2
7.1 21.0 29.3 72.1 24.8
96.5 43.7 29.2 41.4 18.8 85.1 29.8
52.9
25.5 18.9 23.1 40.9 45.6 24.8
30.7 49.4 34.2 26.7
5.7 37.0 30.4
30.9
48.0 71.7 64.2 47.1 40.1 61.5
58.2 22.7 68.9 31.8 59.7 91.6 72.1
58.7
Note: 1 Includes sub-centre, primary health centre, community health centre or referral hospital, government hospital, and government dispensary within the village 2 Either private or visiting doctor 3Trained birth attendant
Around 96.5 percent of the rural population are visited either by private or by visiting
doctors in the surveyed villages of Hardwar district, whereas only 7.1 percent households can be classified in this category in Bageshwar district. Highest number of rural population (49.4 percent) are attended by trained birth assistants in Nainital, while only 5.7 percent of the rural population availed themselves of such a provision in Tehri Garhwal. A visit by anganwadi workers to rural households is highest (91.6 percent) in Udham Singh Nagar and the lowest in Nainital (22.7 percent).
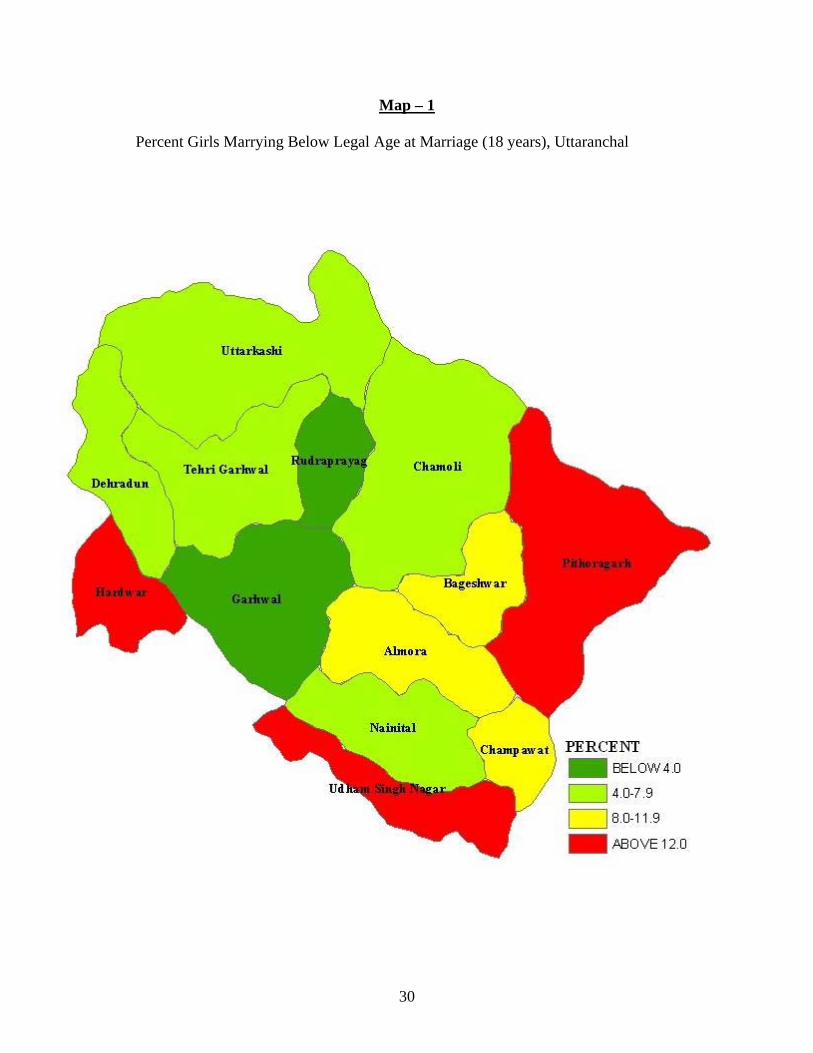
30
Map – 1
Percent Girls Marrying Below Legal Age at Marriage (18 years), Uttaranchal
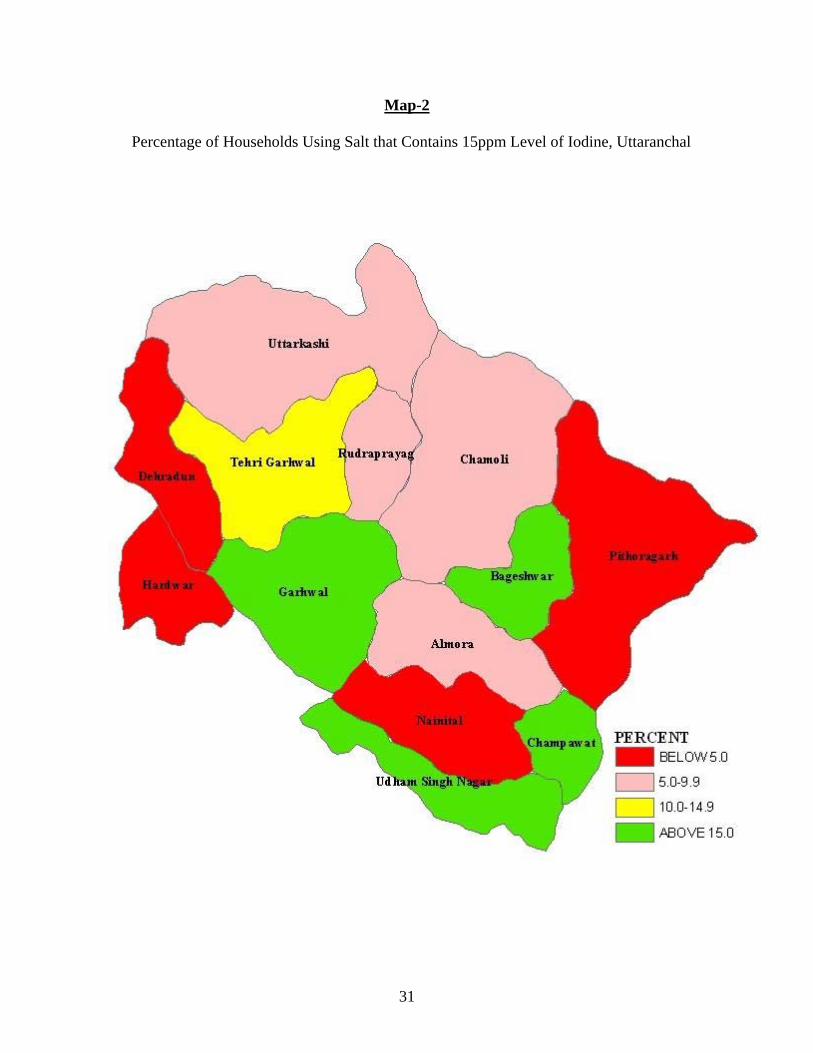
31
Map-2 Percentage of Households Using Salt that Contains 15ppm Level of Iodine, Uttaranchal
CHAPTER III
CHARACTERISTICS OF WOMEN, HUSBANDS AND FERTILITY
The Reproductive and Child Health (RCH) programme is targeted towards the underprivileged section of the population, particularly, women and children. The utilization of RCH services provided across the country depends to a large extent on the characteristics of women, their husbands and episodes of pregnancies, miscarriages, abortions, number of children born to them and survival status of children. Age of women, marital duration, educational attainment, social background and living standard are important factors, which influence reproductive and child health. With this in view, the DLHS-RCH data were collected on demographic characteristics, such as current age, age at consummation of marriage and number of pregnancies, live births and surviving children from eligible women respondents of selected representative households. Information regarding household background characteristics was collected using a separate household questionnaire that covered religion and caste of head of household, type of house, source of drinking water and possession of consumer durables. Fertility preference of women in terms of timing and desire for additional children in comparison to the number of living children provides information on the need for reproductive and child health services. This chapter provides a comprehensive outline of distribution of currently married women by present age, age at consummation of marriage, duration of marriage, complete years of schooling, pregnancy episodes, children ever born and children surviving, along with social and economic characteristics of households the women represent. 3.1 Background Characteristics of Women
The percent distribution of currently married women in the reproductive age group 15-44 years by residence, religion and caste of head of household, economic standard of household and other demographic characteristics are shown in Table 3.1. A sample of 9,641 eligible women represents the state of Uttaranchal in DLHS-RCH and nearly three-fourth of these women are drawn from rural areas. About 64.7 percent of the currently married women are in the age range of 20-34 years and a similar age distribution is observed both for urban and rural areas. Age at consummation of marriage is below 18 years for 36.8 percent women in the state with the figure being 39.4 percent in rural areas while it is 30 percent in urban areas. Looking at the distribution of marital duration it is noted that about 37.6 percent of the women across the state are married for more than 15 years.
Among the sample of 9,641 representative women in Uttaranchal, Hindus and Muslims constitute 86.8 percent and 11.1 percent respectively. More Hindu women are found in rural areas (90.1 percent) than in urban areas (78 percent). The presence of women belonging to other religious groups is insignificant in proportional and absolute terms. About 13.1 percent of the women belong to scheduled castes, 3.1 percent to scheduled tribes and 21.8 percent to other backward classes. Majority of the sample women (59.3 percent) belong to a general caste other than scheduled caste/tribe and other backward class. In rural areas, there are more women belonging to scheduled castes, scheduled tribes and other castes than in urban areas, while more women from other backward classes are found in urban areas. There is a clear rural-urban
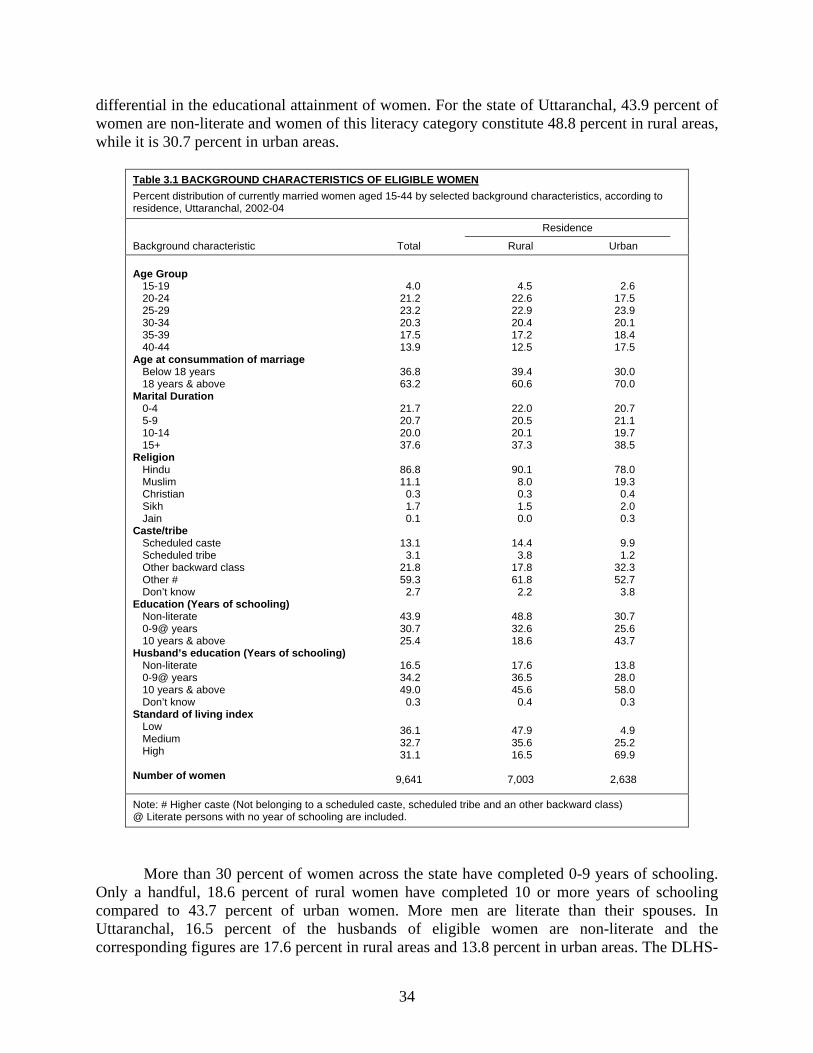
34
differential in the educational attainment of women. For the state of Uttaranchal, 43.9 percent of women are non-literate and women of this literacy category constitute 48.8 percent in rural areas, while it is 30.7 percent in urban areas.
Table 3.1 BACKGROUND CHARACTERISTICS OF ELIGIBLE WOMEN Percent distribution of currently married women aged 15-44 by selected background characteristics, according to residence, Uttaranchal, 2002-04
Background characteristic Total
Residence
Rural Urban Age Group 15-19 20-24 25-29 30-34 35-39 40-44 Age at consummation of marriage Below 18 years 18 years & above Marital Duration 0-4 5-9 10-14 15+ Religion Hindu Muslim Christian Sikh Jain Caste/tribe Scheduled caste Scheduled tribe Other backward class Other # Don’t know Education (Years of schooling) Non-literate 0-9@ years 10 years & above Husband’s education (Years of schooling) Non-literate 0-9@ years 10 years & above Don’t know Standard of living index Low Medium High Number of women
4.0 21.2 23.2 20.3 17.5 13.9
36.8 63.2
21.7 20.7 20.0 37.6
86.8 11.1
0.3 1.7 0.1
13.1
3.1 21.8 59.3
2.7
43.9 30.7 25.4
16.5 34.2 49.0
0.3
36.1 32.7 31.1
9,641
4.5 22.6 22.9 20.4 17.2 12.5
39.4 60.6
22.0 20.5 20.1 37.3
90.1
8.0 0.3 1.5 0.0
14.4
3.8 17.8 61.8
2.2
48.8 32.6 18.6
17.6 36.5 45.6
0.4
47.9 35.6 16.5
7,003
2.6 17.5 23.9 20.1 18.4 17.5
30.0 70.0
20.7 21.1 19.7 38.5
78.0 19.3
0.4 2.0 0.3
9.9 1.2
32.3 52.7
3.8
30.7 25.6 43.7
13.8 28.0 58.0
0.3
4.9 25.2 69.9
2,638
Note: # Higher caste (Not belonging to a scheduled caste, scheduled tribe and an other backward class) @ Literate persons with no year of schooling are included.
More than 30 percent of women across the state have completed 0-9 years of schooling.
Only a handful, 18.6 percent of rural women have completed 10 or more years of schooling compared to 43.7 percent of urban women. More men are literate than their spouses. In Uttaranchal, 16.5 percent of the husbands of eligible women are non-literate and the corresponding figures are 17.6 percent in rural areas and 13.8 percent in urban areas. The DLHS-
35
RCH includes data on materials used for floor, walls and roofs of the housing structure along with status of possession of a list of durables and these are utilized to construct a composite index of household standard of living. Households are further classified as those with low, medium and high standard of living. About 36.1 percent of women in the state live in low standard of living households and this is 47.9 percent in rural areas and 4.9 percent in urban areas. Almost one-third of the women across the state live in households categorised as medium standard of living. In urban areas, 69.9 percent of women belong to high standard of living households and the corresponding figure is just 16.5 percent in rural areas. 3.2 Educational Level of Women Table 3.2 provides details of educational level of eligible women in terms of classification by years of schooling, and selected background characteristics, such as, place of residence, religion, and caste and husbands’ education. As regards distribution of non-literate women, it is observed that a lesser proportion of younger women below 30 years of age are non-literate compared to older women above 30 years. This phenomenon is reversed among literate women. A distinct pattern of educational attainment of women is that a similar number of them attended schooling either for 1-5 years or 6-8 years and not as many had 9-10 years of schooling. For the women in the age group 15-19 years, 23.8 percent and 21 percent of them had 1-5 years and 6-8 years of schooling respectively, while only 4.5 percent had 11 or more years of schooling. Among the senior women in the age group 40-44 years, 14.1 percent, 8.9 percent, 6.1 percent and 15.5 percent of them have attended school for 1-5, 6-8, 9-10 and 11 or more years respectively.
There is a significant rural-urban differential in the level of education of women in Uttaranchal. About 48.8 percent of rural eligible women are non-literate and 16.3 percent, 14.5 percent, 9.5 percent and 10.7 percent of the women have 1-5, 6-8, 9-10 and 11 or more years of schooling. The corresponding figures in urban areas are 30.7 percent non-literate and 10.8 percent, 13.1 percent, 13.1 percent and 32.1 percent respectively. More Muslim women (76.3 percent) are non-literate compared to Hindu women (39.9 percent), Sikh women (37.2 percent) and women belonging to other religious communities (25.6 percent). For literate eligible women from all religious communities, maximum of them have either 11 or more or 1-5 years of schooling. The proportion of Hindu women with 1-5 years of schooling is 15.7 percent and the same is 7.9 percent for Muslim women, 12.5 percent for Sikh women and 4.7 percent for women from other religions. Among the Muslim women hardly 5.3 percent of them have 11 or more years of schooling, while 17.9 percent of Hindu women have attained this level of education.
The uneven level of educational attainment by caste can be noted from the recorded proportion of non-literate women among scheduled castes (66 percent), scheduled tribes (53.7 percent), other backward classes (58.6 percent) and other castes or tribes (32.7 percent). The literate women belonging to scheduled castes/tribes and other backward classes are concentrated more in the range of 1-5 to 6-8 years of schooling. The husband’s education is an important characteristic, which has strong association with the education of eligible women. As many as 91 percent of women whose husbands are non-literate are also non-literate, while only 10.7 percent of women whose husbands have 11 or more or years of schooling are non-literate. Forty six percent of literate women educated for 11 or more years of schooling have husbands who have the same level of education.
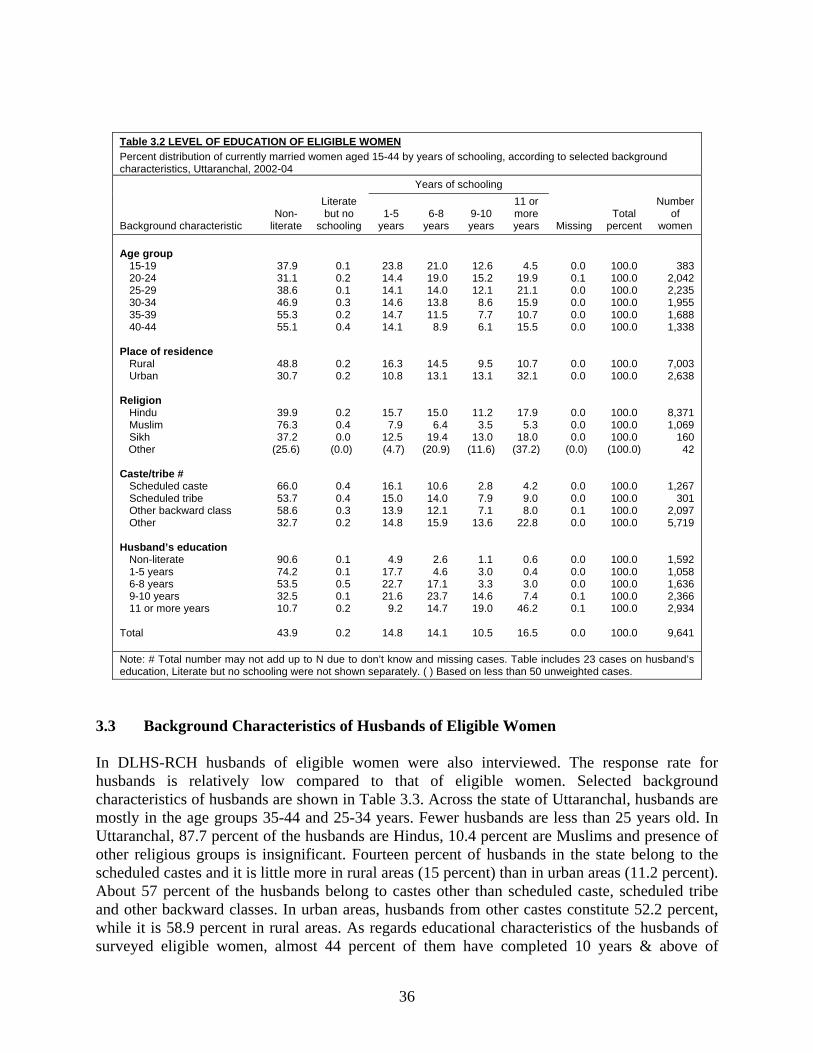
36
Table 3.2 LEVEL OF EDUCATION OF ELIGIBLE WOMEN Percent distribution of currently married women aged 15-44 by years of schooling, according to selected background characteristics, Uttaranchal, 2002-04
Background characteristic Non-
literate
Literate but no
schooling
Years of schooling
Missing Total
percent
Number of
women 1-5
years 6-8
years 9-10 years
11 or more years
Age group 15-19 20-24 25-29 30-34 35-39 40-44 Place of residence Rural Urban Religion Hindu Muslim Sikh Other Caste/tribe # Scheduled caste Scheduled tribe Other backward class Other Husband’s education Non-literate 1-5 years 6-8 years 9-10 years 11 or more years Total
37.9 31.1 38.6 46.9 55.3 55.1
48.8 30.7
39.9 76.3 37.2
(25.6)
66.0 53.7 58.6 32.7
90.6 74.2 53.5 32.5 10.7
43.9
0.1 0.2 0.1 0.3 0.2 0.4
0.2 0.2
0.2 0.4 0.0
(0.0)
0.4 0.4 0.3 0.2
0.1 0.1 0.5 0.1 0.2
0.2
23.8 14.4 14.1 14.6 14.7 14.1
16.3 10.8
15.7 7.9
12.5 (4.7)
16.1 15.0 13.9 14.8
4.9 17.7 22.7 21.6
9.2
14.8
21.0 19.0 14.0 13.8 11.5
8.9
14.5 13.1
15.0 6.4
19.4 (20.9)
10.6 14.0 12.1 15.9
2.6 4.6
17.1 23.7 14.7
14.1
12.6 15.2 12.1
8.6 7.7 6.1
9.5 13.1
11.2 3.5
13.0 (11.6)
2.8 7.9 7.1
13.6
1.1 3.0 3.3
14.6 19.0
10.5
4.5 19.9 21.1 15.9 10.7 15.5
10.7 32.1
17.9 5.3
18.0 (37.2)
4.2 9.0 8.0
22.8
0.6 0.4 3.0 7.4
46.2
16.5
0.0 0.1 0.0 0.0 0.0 0.0
0.0 0.0
0.0 0.0 0.0
(0.0)
0.0 0.0 0.1 0.0
0.0 0.0 0.0 0.1 0.1
0.0
100.0 100.0 100.0 100.0 100.0 100.0
100.0 100.0
100.0 100.0 100.0
(100.0)
100.0 100.0 100.0 100.0
100.0 100.0 100.0 100.0 100.0
100.0
383 2,042 2,235 1,955 1,688 1,338
7,003 2,638
8,371 1,069
160 42
1,267 301
2,097 5,719
1,592 1,058 1,636 2,366 2,934
9,641
Note: # Total number may not add up to N due to don’t know and missing cases. Table includes 23 cases on husband’s education, Literate but no schooling were not shown separately. ( ) Based on less than 50 unweighted cases.
3.3 Background Characteristics of Husbands of Eligible Women In DLHS-RCH husbands of eligible women were also interviewed. The response rate for husbands is relatively low compared to that of eligible women. Selected background characteristics of husbands are shown in Table 3.3. Across the state of Uttaranchal, husbands are mostly in the age groups 35-44 and 25-34 years. Fewer husbands are less than 25 years old. In Uttaranchal, 87.7 percent of the husbands are Hindus, 10.4 percent are Muslims and presence of other religious groups is insignificant. Fourteen percent of husbands in the state belong to the scheduled castes and it is little more in rural areas (15 percent) than in urban areas (11.2 percent). About 57 percent of the husbands belong to castes other than scheduled caste, scheduled tribe and other backward classes. In urban areas, husbands from other castes constitute 52.2 percent, while it is 58.9 percent in rural areas. As regards educational characteristics of the husbands of surveyed eligible women, almost 44 percent of them have completed 10 years & above of
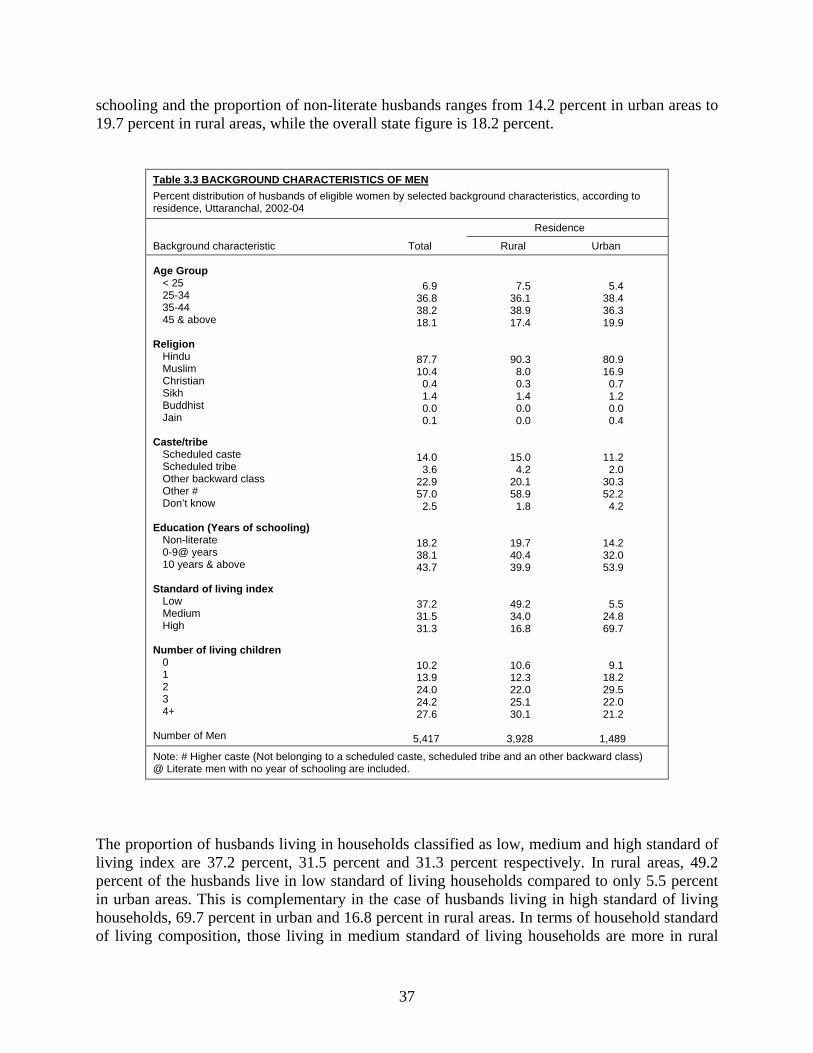
37
schooling and the proportion of non-literate husbands ranges from 14.2 percent in urban areas to 19.7 percent in rural areas, while the overall state figure is 18.2 percent.
Table 3.3 BACKGROUND CHARACTERISTICS OF MEN Percent distribution of husbands of eligible women by selected background characteristics, according to residence, Uttaranchal, 2002-04
Background characteristic Total
Residence
Rural Urban Age Group < 25 25-34 35-44 45 & above Religion Hindu Muslim Christian Sikh Buddhist Jain Caste/tribe Scheduled caste Scheduled tribe Other backward class Other # Don’t know Education (Years of schooling) Non-literate 0-9@ years 10 years & above Standard of living index Low Medium High Number of living children 0 1 2 3 4+ Number of Men
6.9 36.8 38.2 18.1
87.7 10.4
0.4 1.4 0.0 0.1
14.0 3.6
22.9 57.0
2.5
18.2 38.1 43.7
37.2 31.5 31.3
10.2 13.9 24.0 24.2 27.6
5,417
7.5 36.1 38.9 17.4
90.3 8.0 0.3 1.4 0.0 0.0
15.0 4.2
20.1 58.9
1.8
19.7 40.4 39.9
49.2 34.0 16.8
10.6 12.3 22.0 25.1 30.1
3,928
5.4 38.4 36.3 19.9
80.9 16.9
0.7 1.2 0.0 0.4
11.2 2.0
30.3 52.2
4.2
14.2 32.0 53.9
5.5 24.8 69.7
9.1 18.2 29.5 22.0 21.2
1,489
Note: # Higher caste (Not belonging to a scheduled caste, scheduled tribe and an other backward class) @ Literate men with no year of schooling are included.
The proportion of husbands living in households classified as low, medium and high standard of living index are 37.2 percent, 31.5 percent and 31.3 percent respectively. In rural areas, 49.2 percent of the husbands live in low standard of living households compared to only 5.5 percent in urban areas. This is complementary in the case of husbands living in high standard of living households, 69.7 percent in urban and 16.8 percent in rural areas. In terms of household standard of living composition, those living in medium standard of living households are more in rural
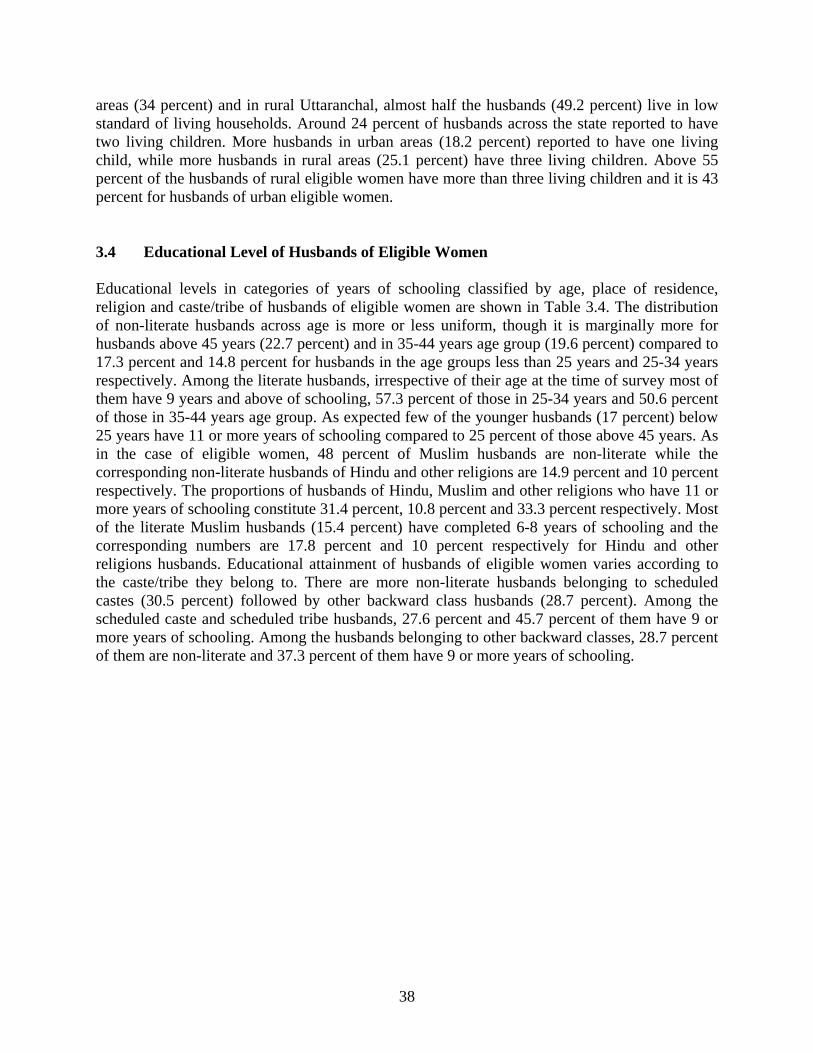
38
areas (34 percent) and in rural Uttaranchal, almost half the husbands (49.2 percent) live in low standard of living households. Around 24 percent of husbands across the state reported to have two living children. More husbands in urban areas (18.2 percent) reported to have one living child, while more husbands in rural areas (25.1 percent) have three living children. Above 55 percent of the husbands of rural eligible women have more than three living children and it is 43 percent for husbands of urban eligible women. 3.4 Educational Level of Husbands of Eligible Women Educational levels in categories of years of schooling classified by age, place of residence, religion and caste/tribe of husbands of eligible women are shown in Table 3.4. The distribution of non-literate husbands across age is more or less uniform, though it is marginally more for husbands above 45 years (22.7 percent) and in 35-44 years age group (19.6 percent) compared to 17.3 percent and 14.8 percent for husbands in the age groups less than 25 years and 25-34 years respectively. Among the literate husbands, irrespective of their age at the time of survey most of them have 9 years and above of schooling, 57.3 percent of those in 25-34 years and 50.6 percent of those in 35-44 years age group. As expected few of the younger husbands (17 percent) below 25 years have 11 or more years of schooling compared to 25 percent of those above 45 years. As in the case of eligible women, 48 percent of Muslim husbands are non-literate while the corresponding non-literate husbands of Hindu and other religions are 14.9 percent and 10 percent respectively. The proportions of husbands of Hindu, Muslim and other religions who have 11 or more years of schooling constitute 31.4 percent, 10.8 percent and 33.3 percent respectively. Most of the literate Muslim husbands (15.4 percent) have completed 6-8 years of schooling and the corresponding numbers are 17.8 percent and 10 percent respectively for Hindu and other religions husbands. Educational attainment of husbands of eligible women varies according to the caste/tribe they belong to. There are more non-literate husbands belonging to scheduled castes (30.5 percent) followed by other backward class husbands (28.7 percent). Among the scheduled caste and scheduled tribe husbands, 27.6 percent and 45.7 percent of them have 9 or more years of schooling. Among the husbands belonging to other backward classes, 28.7 percent of them are non-literate and 37.3 percent of them have 9 or more years of schooling.
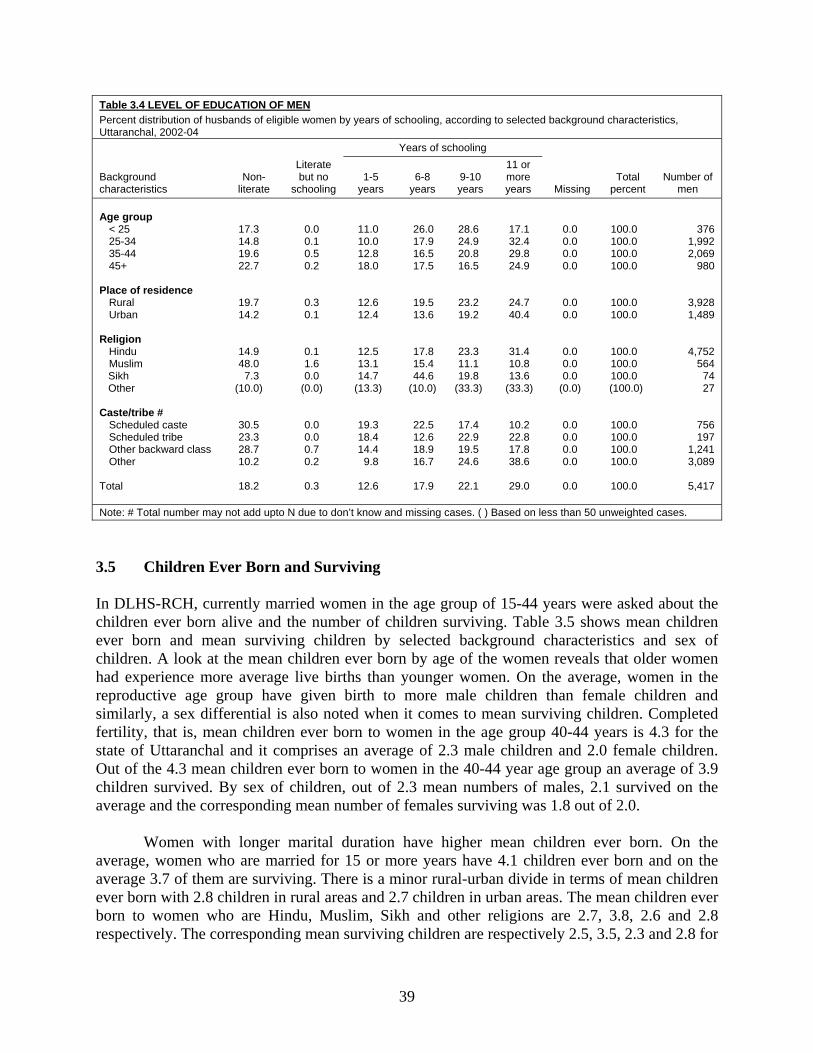
39
Table 3.4 LEVEL OF EDUCATION OF MEN Percent distribution of husbands of eligible women by years of schooling, according to selected background characteristics, Uttaranchal, 2002-04
Background characteristics
Non-literate
Literate but no
schooling
Years of schooling
Missing Total
percent Number of
men 1-5
years 6-8
years 9-10 years
11 or more years
Age group < 25 25-34 35-44 45+ Place of residence Rural Urban Religion Hindu Muslim Sikh Other Caste/tribe # Scheduled caste Scheduled tribe Other backward class Other Total
17.3 14.8 19.6 22.7
19.7 14.2
14.9 48.0
7.3 (10.0)
30.5 23.3 28.7 10.2
18.2
0.0 0.1 0.5 0.2
0.3 0.1
0.1 1.6 0.0
(0.0)
0.0 0.0 0.7 0.2
0.3
11.0 10.0 12.8 18.0
12.6 12.4
12.5 13.1 14.7
(13.3)
19.3 18.4 14.4
9.8
12.6
26.0 17.9 16.5 17.5
19.5 13.6
17.8 15.4 44.6
(10.0)
22.5 12.6 18.9 16.7
17.9
28.6 24.9 20.8 16.5
23.2 19.2
23.3 11.1 19.8
(33.3)
17.4 22.9 19.5 24.6
22.1
17.1 32.4 29.8 24.9
24.7 40.4
31.4 10.8 13.6
(33.3)
10.2 22.8 17.8 38.6
29.0
0.0 0.0 0.0 0.0
0.0 0.0
0.0 0.0 0.0
(0.0)
0.0 0.0 0.0 0.0
0.0
100.0 100.0 100.0 100.0
100.0 100.0
100.0 100.0 100.0 (100.0)
100.0 100.0 100.0 100.0
100.0
376 1,992 2,069
980
3,928 1,489
4,752 564
74 27
756 197
1,241 3,089
5,417
Note: # Total number may not add upto N due to don’t know and missing cases. ( ) Based on less than 50 unweighted cases.
3.5 Children Ever Born and Surviving In DLHS-RCH, currently married women in the age group of 15-44 years were asked about the children ever born alive and the number of children surviving. Table 3.5 shows mean children ever born and mean surviving children by selected background characteristics and sex of children. A look at the mean children ever born by age of the women reveals that older women had experience more average live births than younger women. On the average, women in the reproductive age group have given birth to more male children than female children and similarly, a sex differential is also noted when it comes to mean surviving children. Completed fertility, that is, mean children ever born to women in the age group 40-44 years is 4.3 for the state of Uttaranchal and it comprises an average of 2.3 male children and 2.0 female children. Out of the 4.3 mean children ever born to women in the 40-44 year age group an average of 3.9 children survived. By sex of children, out of 2.3 mean numbers of males, 2.1 survived on the average and the corresponding mean number of females surviving was 1.8 out of 2.0. Women with longer marital duration have higher mean children ever born. On the average, women who are married for 15 or more years have 4.1 children ever born and on the average 3.7 of them are surviving. There is a minor rural-urban divide in terms of mean children ever born with 2.8 children in rural areas and 2.7 children in urban areas. The mean children ever born to women who are Hindu, Muslim, Sikh and other religions are 2.7, 3.8, 2.6 and 2.8 respectively. The corresponding mean surviving children are respectively 2.5, 3.5, 2.3 and 2.8 for
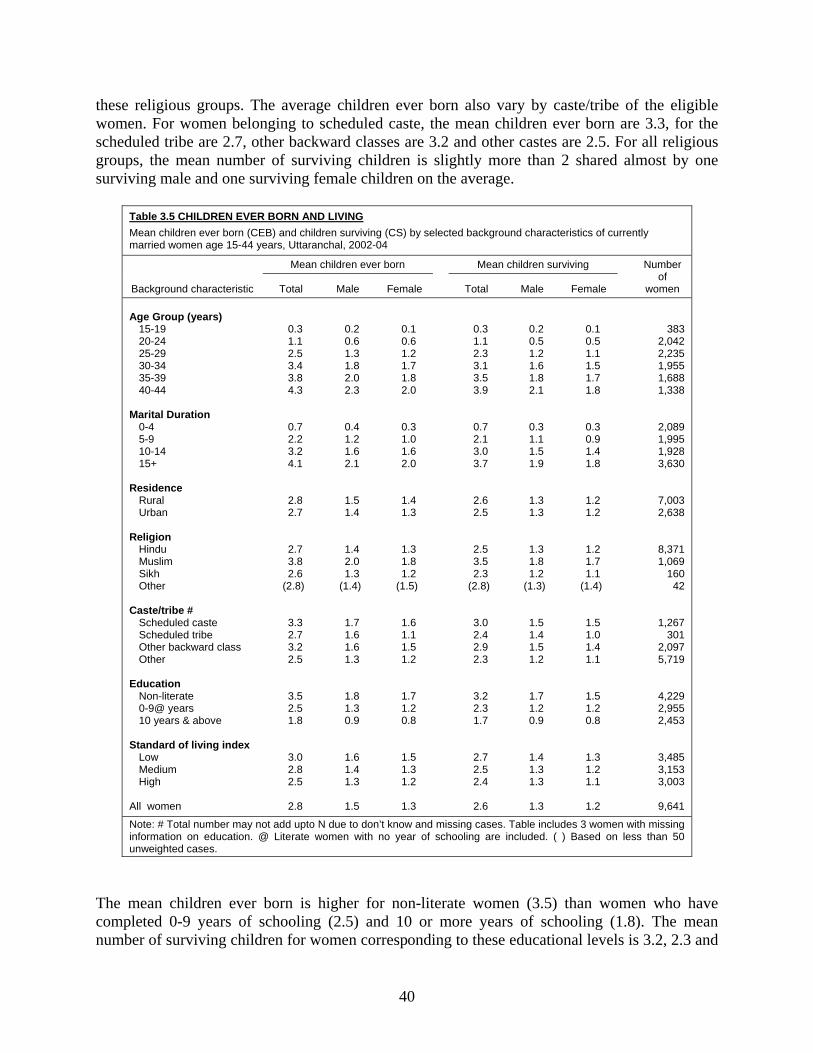
40
these religious groups. The average children ever born also vary by caste/tribe of the eligible women. For women belonging to scheduled caste, the mean children ever born are 3.3, for the scheduled tribe are 2.7, other backward classes are 3.2 and other castes are 2.5. For all religious groups, the mean number of surviving children is slightly more than 2 shared almost by one surviving male and one surviving female children on the average.
Table 3.5 CHILDREN EVER BORN AND LIVING Mean children ever born (CEB) and children surviving (CS) by selected background characteristics of currently married women age 15-44 years, Uttaranchal, 2002-04
Background characteristic
Mean children ever born Mean children surviving Number of
women Total Male Female Total Male Female
Age Group (years) 15-19 20-24 25-29 30-34 35-39 40-44 Marital Duration 0-4 5-9 10-14 15+ Residence Rural Urban Religion Hindu Muslim Sikh Other Caste/tribe # Scheduled caste Scheduled tribe Other backward class Other Education Non-literate 0-9@ years 10 years & above Standard of living index Low Medium High All women
0.3 1.1 2.5 3.4 3.8 4.3
0.7 2.2 3.2 4.1
2.8 2.7
2.7 3.8 2.6
(2.8)
3.3 2.7 3.2 2.5
3.5 2.5 1.8
3.0 2.8 2.5
2.8
0.2 0.6 1.3 1.8 2.0 2.3
0.4 1.2 1.6 2.1
1.5 1.4
1.4 2.0 1.3
(1.4)
1.7 1.6 1.6 1.3
1.8 1.3 0.9
1.6 1.4 1.3
1.5
0.1 0.6 1.2 1.7 1.8 2.0
0.3 1.0 1.6 2.0
1.4 1.3
1.3 1.8 1.2
(1.5)
1.6 1.1 1.5 1.2
1.7 1.2 0.8
1.5 1.3 1.2
1.3
0.3 1.1 2.3 3.1 3.5 3.9
0.7 2.1 3.0 3.7
2.6 2.5
2.5 3.5 2.3
(2.8)
3.0 2.4 2.9 2.3
3.2 2.3 1.7
2.7 2.5 2.4
2.6
0.2 0.5 1.2 1.6 1.8 2.1
0.3 1.1 1.5 1.9
1.3 1.3
1.3 1.8 1.2
(1.3)
1.5 1.4 1.5 1.2
1.7 1.2 0.9
1.4 1.3 1.3
1.3
0.1 0.5 1.1 1.5 1.7 1.8
0.3 0.9 1.4 1.8
1.2 1.2
1.2 1.7 1.1
(1.4)
1.5 1.0 1.4 1.1
1.5 1.2 0.8
1.3 1.2 1.1
1.2
383 2,042 2,235 1,955 1,688 1,338
2,089 1,995 1,928 3,630
7,003 2,638
8,371 1,069
160 42
1,267 301
2,097 5,719
4,229 2,955 2,453
3,485 3,153 3,003
9,641
Note: # Total number may not add upto N due to don’t know and missing cases. Table includes 3 women with missing information on education. @ Literate women with no year of schooling are included. ( ) Based on less than 50 unweighted cases.
The mean children ever born is higher for non-literate women (3.5) than women who have completed 0-9 years of schooling (2.5) and 10 or more years of schooling (1.8). The mean number of surviving children for women corresponding to these educational levels is 3.2, 2.3 and
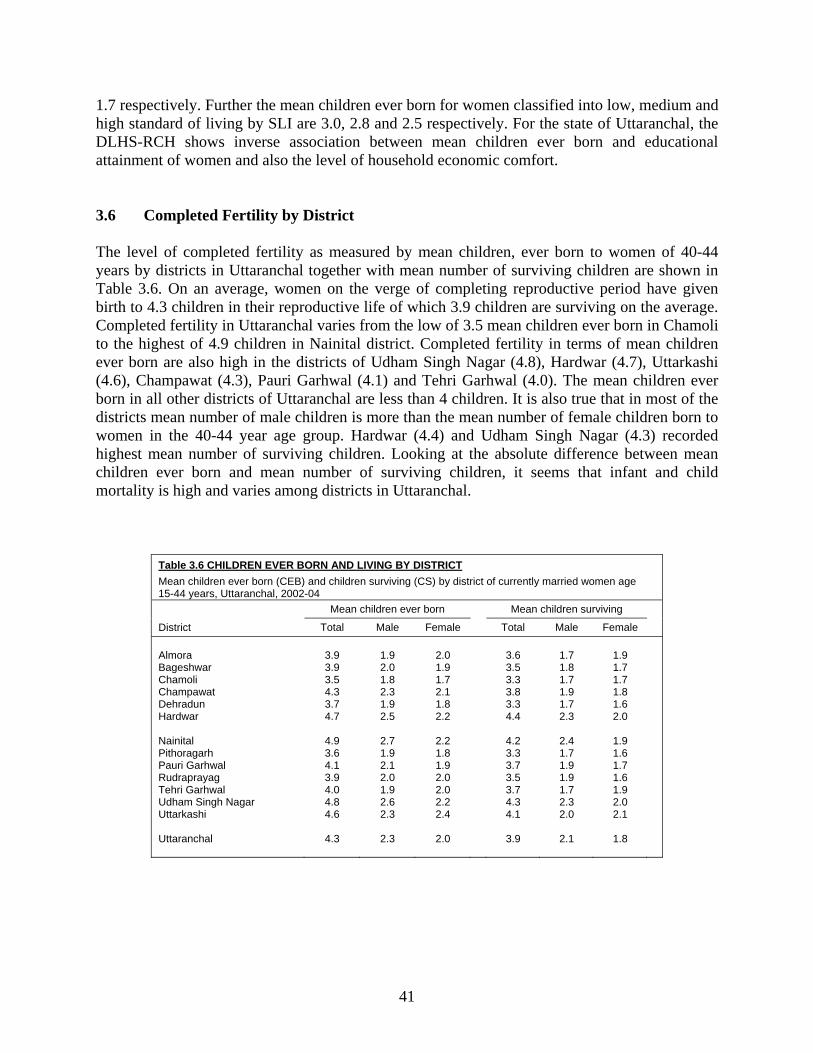
41
1.7 respectively. Further the mean children ever born for women classified into low, medium and high standard of living by SLI are 3.0, 2.8 and 2.5 respectively. For the state of Uttaranchal, the DLHS-RCH shows inverse association between mean children ever born and educational attainment of women and also the level of household economic comfort. 3.6 Completed Fertility by District The level of completed fertility as measured by mean children, ever born to women of 40-44 years by districts in Uttaranchal together with mean number of surviving children are shown in Table 3.6. On an average, women on the verge of completing reproductive period have given birth to 4.3 children in their reproductive life of which 3.9 children are surviving on the average. Completed fertility in Uttaranchal varies from the low of 3.5 mean children ever born in Chamoli to the highest of 4.9 children in Nainital district. Completed fertility in terms of mean children ever born are also high in the districts of Udham Singh Nagar (4.8), Hardwar (4.7), Uttarkashi (4.6), Champawat (4.3), Pauri Garhwal (4.1) and Tehri Garhwal (4.0). The mean children ever born in all other districts of Uttaranchal are less than 4 children. It is also true that in most of the districts mean number of male children is more than the mean number of female children born to women in the 40-44 year age group. Hardwar (4.4) and Udham Singh Nagar (4.3) recorded highest mean number of surviving children. Looking at the absolute difference between mean children ever born and mean number of surviving children, it seems that infant and child mortality is high and varies among districts in Uttaranchal.
Table 3.6 CHILDREN EVER BORN AND LIVING BY DISTRICT Mean children ever born (CEB) and children surviving (CS) by district of currently married women age 15-44 years, Uttaranchal, 2002-04
District
Mean children ever born Mean children surviving
Total Male Female Total Male Female
Almora Bageshwar Chamoli Champawat Dehradun Hardwar Nainital Pithoragarh Pauri Garhwal Rudraprayag Tehri Garhwal Udham Singh Nagar Uttarkashi Uttaranchal
3.9 3.9 3.5 4.3 3.7 4.7
4.9 3.6 4.1 3.9 4.0 4.8 4.6
4.3
1.9 2.0 1.8 2.3 1.9 2.5
2.7 1.9 2.1 2.0 1.9 2.6 2.3
2.3
2.0 1.9 1.7 2.1 1.8 2.2
2.2 1.8 1.9 2.0 2.0 2.2 2.4
2.0
3.6 3.5 3.3 3.8 3.3 4.4
4.2 3.3 3.7 3.5 3.7 4.3 4.1
3.9
1.7 1.8 1.7 1.9 1.7 2.3
2.4 1.7 1.9 1.9 1.7 2.3 2.0
2.1
1.9 1.7 1.7 1.8 1.6 2.0
1.9 1.6 1.7 1.6 1.9 2.0 2.1
1.8
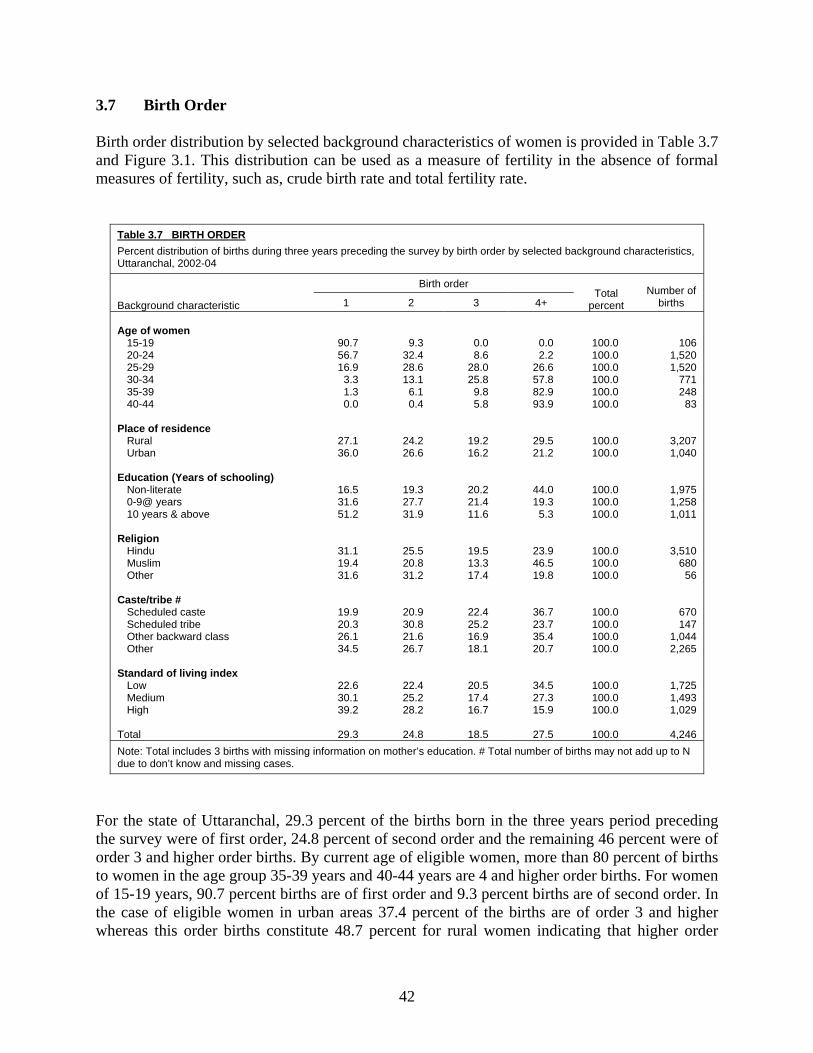
42
3.7 Birth Order Birth order distribution by selected background characteristics of women is provided in Table 3.7 and Figure 3.1. This distribution can be used as a measure of fertility in the absence of formal measures of fertility, such as, crude birth rate and total fertility rate.
Table 3.7 BIRTH ORDER Percent distribution of births during three years preceding the survey by birth order by selected background characteristics, Uttaranchal, 2002-04
Background characteristic
Birth order Total
percent Number of
births 1 2 3 4+ Age of women 15-19 20-24 25-29 30-34 35-39 40-44 Place of residence Rural Urban Education (Years of schooling) Non-literate 0-9@ years 10 years & above Religion Hindu Muslim Other Caste/tribe # Scheduled caste Scheduled tribe Other backward class Other Standard of living index Low Medium High Total
90.7 56.7 16.9
3.3 1.3 0.0
27.1 36.0
16.5 31.6 51.2
31.1 19.4 31.6
19.9 20.3 26.1 34.5
22.6 30.1 39.2
29.3
9.3 32.4 28.6 13.1
6.1 0.4
24.2 26.6
19.3 27.7 31.9
25.5 20.8 31.2
20.9 30.8 21.6 26.7
22.4 25.2 28.2
24.8
0.0 8.6
28.0 25.8
9.8 5.8
19.2 16.2
20.2 21.4 11.6
19.5 13.3 17.4
22.4 25.2 16.9 18.1
20.5 17.4 16.7
18.5
0.0 2.2
26.6 57.8 82.9 93.9
29.5 21.2
44.0 19.3
5.3
23.9 46.5 19.8
36.7 23.7 35.4 20.7
34.5 27.3 15.9
27.5
100.0 100.0 100.0 100.0 100.0 100.0
100.0 100.0
100.0 100.0 100.0
100.0 100.0 100.0
100.0 100.0 100.0 100.0
100.0 100.0 100.0
100.0
106 1,520 1,520
771 248
83
3,207 1,040
1,975 1,258 1,011
3,510 680
56
670 147
1,044 2,265
1,725 1,493 1,029
4,246
Note: Total includes 3 births with missing information on mother’s education. # Total number of births may not add up to N due to don’t know and missing cases.
For the state of Uttaranchal, 29.3 percent of the births born in the three years period preceding the survey were of first order, 24.8 percent of second order and the remaining 46 percent were of order 3 and higher order births. By current age of eligible women, more than 80 percent of births to women in the age group 35-39 years and 40-44 years are 4 and higher order births. For women of 15-19 years, 90.7 percent births are of first order and 9.3 percent births are of second order. In the case of eligible women in urban areas 37.4 percent of the births are of order 3 and higher whereas this order births constitute 48.7 percent for rural women indicating that higher order
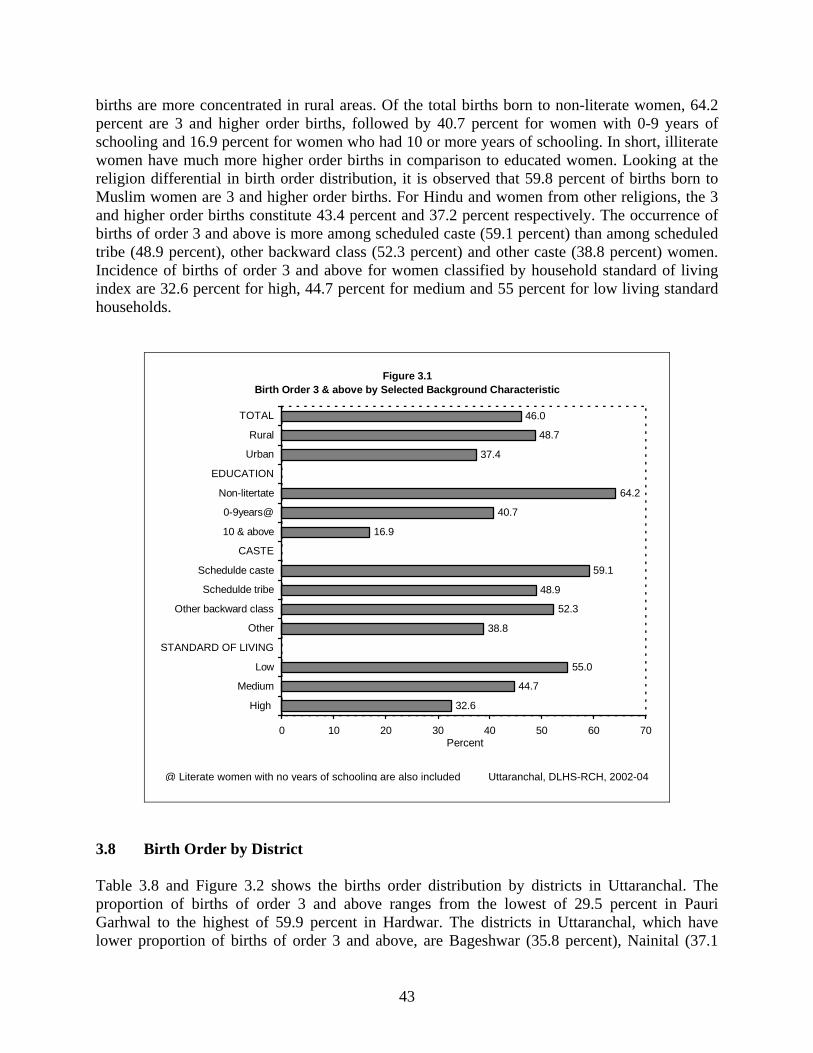
43
births are more concentrated in rural areas. Of the total births born to non-literate women, 64.2 percent are 3 and higher order births, followed by 40.7 percent for women with 0-9 years of schooling and 16.9 percent for women who had 10 or more years of schooling. In short, illiterate women have much more higher order births in comparison to educated women. Looking at the religion differential in birth order distribution, it is observed that 59.8 percent of births born to Muslim women are 3 and higher order births. For Hindu and women from other religions, the 3 and higher order births constitute 43.4 percent and 37.2 percent respectively. The occurrence of births of order 3 and above is more among scheduled caste (59.1 percent) than among scheduled tribe (48.9 percent), other backward class (52.3 percent) and other caste (38.8 percent) women. Incidence of births of order 3 and above for women classified by household standard of living index are 32.6 percent for high, 44.7 percent for medium and 55 percent for low living standard households.
Figure 3.1Birth Order 3 & above by Selected Background Characteristic
32.6
44.7
55.0
38.8
52.3
48.9
59.1
16.9
40.7
64.2
37.4
48.7
46.0
0 10 20 30 40 50 60 70
High
Medium
Low
STANDARD OF LIVING
Other
Other backward class
Schedulde tribe
Schedulde caste
CASTE
10 & above
0-9years@
Non-litertate
EDUCATION
Urban
Rural
TOTAL
Percent
3.8 Birth Order by District Table 3.8 and Figure 3.2 shows the births order distribution by districts in Uttaranchal. The proportion of births of order 3 and above ranges from the lowest of 29.5 percent in Pauri Garhwal to the highest of 59.9 percent in Hardwar. The districts in Uttaranchal, which have lower proportion of births of order 3 and above, are Bageshwar (35.8 percent), Nainital (37.1
@ Literate women with no years of schooling are also included Uttaranchal, DLHS-RCH, 2002-04
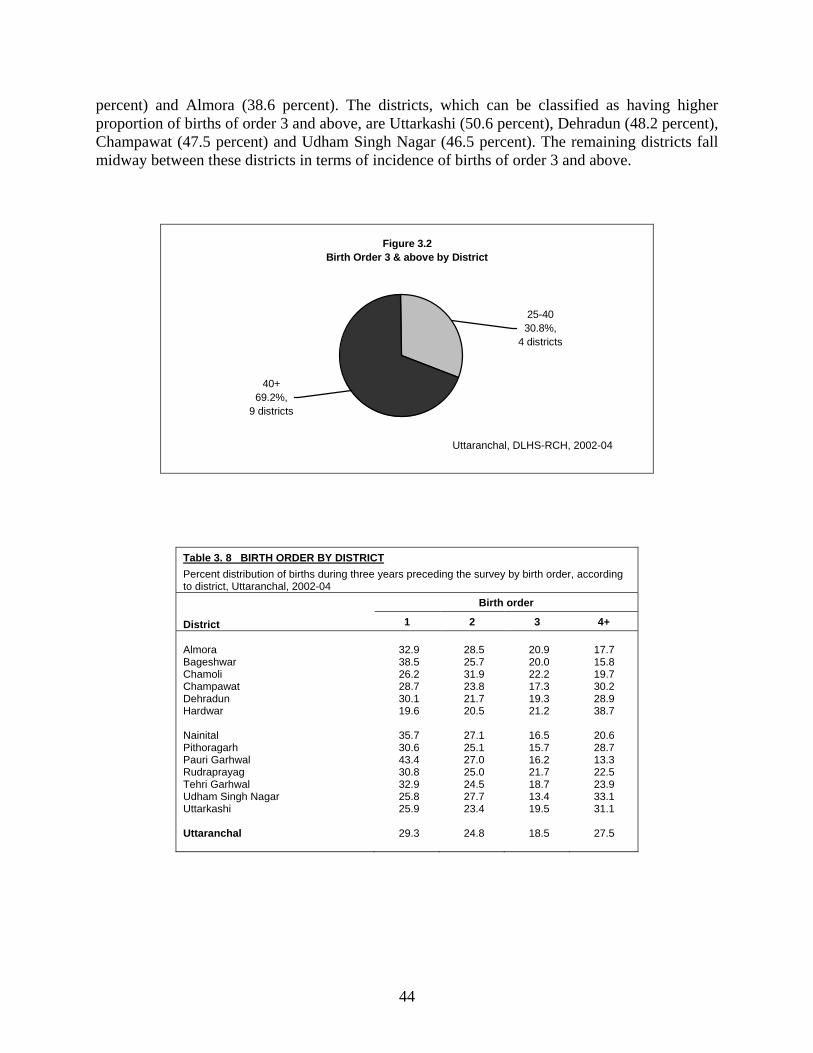
44
percent) and Almora (38.6 percent). The districts, which can be classified as having higher proportion of births of order 3 and above, are Uttarkashi (50.6 percent), Dehradun (48.2 percent), Champawat (47.5 percent) and Udham Singh Nagar (46.5 percent). The remaining districts fall midway between these districts in terms of incidence of births of order 3 and above.
Figure 3.2 Birth Order 3 & above by District
40+69.2%,
9 districts
25-4030.8%,
4 districts
Table 3. 8 BIRTH ORDER BY DISTRICT Percent distribution of births during three years preceding the survey by birth order, according to district, Uttaranchal, 2002-04
District
Birth order
1 2 3 4+ Almora Bageshwar Chamoli Champawat Dehradun Hardwar Nainital Pithoragarh Pauri Garhwal Rudraprayag Tehri Garhwal Udham Singh Nagar Uttarkashi Uttaranchal
32.9 38.5 26.2 28.7 30.1 19.6
35.7 30.6 43.4 30.8 32.9 25.8 25.9
29.3
28.5 25.7 31.9 23.8 21.7 20.5
27.1 25.1 27.0 25.0 24.5 27.7 23.4
24.8
20.9 20.0 22.2 17.3 19.3 21.2
16.5 15.7 16.2 21.7 18.7 13.4 19.5
18.5
17.7 15.8 19.7 30.2 28.9 38.7
20.6 28.7 13.3 22.5 23.9 33.1 31.1
27.5
Uttaranchal, DLHS-RCH, 2002-04
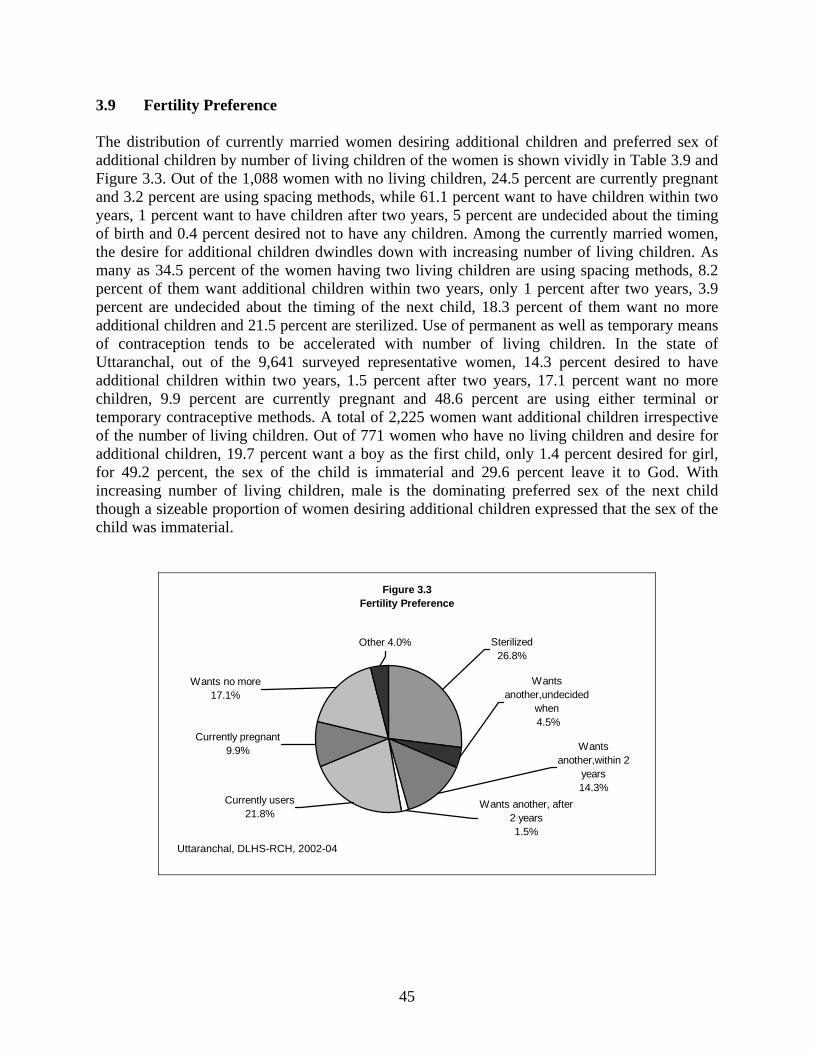
45
3.9 Fertility Preference The distribution of currently married women desiring additional children and preferred sex of additional children by number of living children of the women is shown vividly in Table 3.9 and Figure 3.3. Out of the 1,088 women with no living children, 24.5 percent are currently pregnant and 3.2 percent are using spacing methods, while 61.1 percent want to have children within two years, 1 percent want to have children after two years, 5 percent are undecided about the timing of birth and 0.4 percent desired not to have any children. Among the currently married women, the desire for additional children dwindles down with increasing number of living children. As many as 34.5 percent of the women having two living children are using spacing methods, 8.2 percent of them want additional children within two years, only 1 percent after two years, 3.9 percent are undecided about the timing of the next child, 18.3 percent of them want no more additional children and 21.5 percent are sterilized. Use of permanent as well as temporary means of contraception tends to be accelerated with number of living children. In the state of Uttaranchal, out of the 9,641 surveyed representative women, 14.3 percent desired to have additional children within two years, 1.5 percent after two years, 17.1 percent want no more children, 9.9 percent are currently pregnant and 48.6 percent are using either terminal or temporary contraceptive methods. A total of 2,225 women want additional children irrespective of the number of living children. Out of 771 women who have no living children and desire for additional children, 19.7 percent want a boy as the first child, only 1.4 percent desired for girl, for 49.2 percent, the sex of the child is immaterial and 29.6 percent leave it to God. With increasing number of living children, male is the dominating preferred sex of the next child though a sizeable proportion of women desiring additional children expressed that the sex of the child was immaterial.
Figure 3.3 Fertility Preference
Currently users21.8%
Wants another, after 2 years1.5%
Wants another,within 2
years14.3%
Wants another,undecided
when 4.5%
Currently pregnant9.9%
Wants no more17.1%
Other 4.0% Sterilized26.8%
Uttaranchal, DLHS-RCH, 2002-04
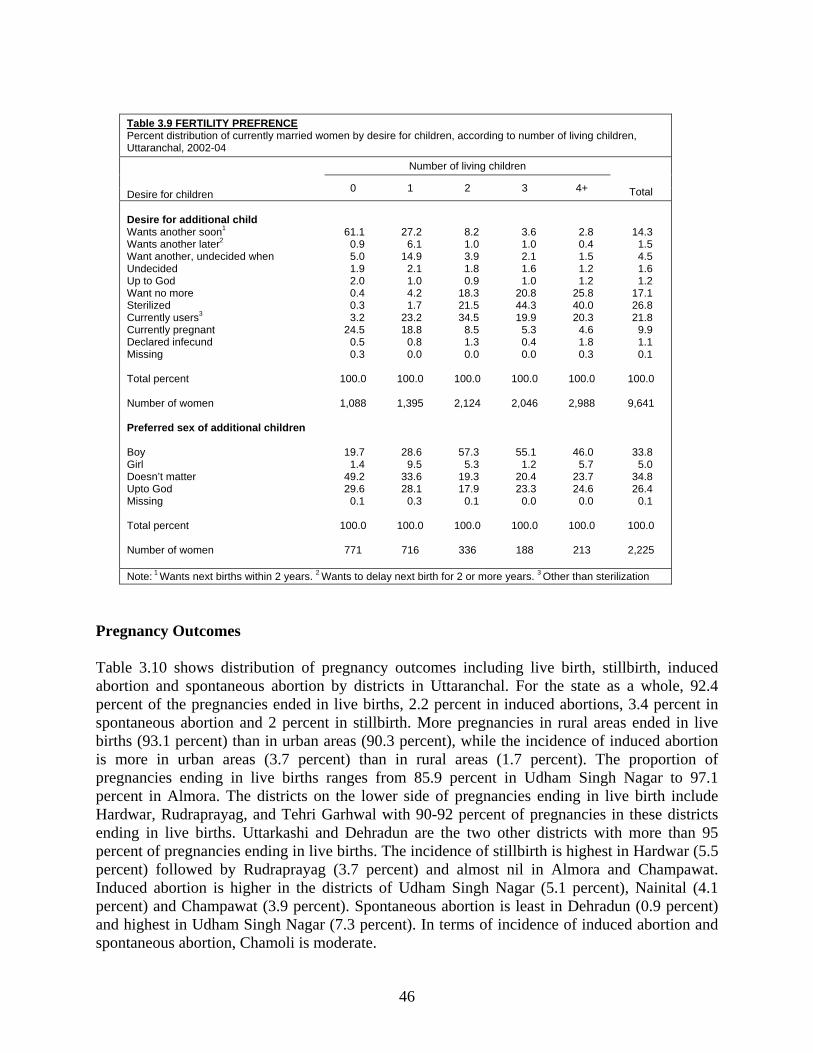
46
Table 3.9 FERTILITY PREFRENCE Percent distribution of currently married women by desire for children, according to number of living children, Uttaranchal, 2002-04
Desire for children
Number of living children
Total 0 1 2 3 4+
Desire for additional child Wants another soon1 Wants another later2 Want another, undecided when Undecided Up to God Want no more Sterilized Currently users3 Currently pregnant Declared infecund Missing Total percent Number of women Preferred sex of additional children Boy Girl Doesn’t matter Upto God Missing Total percent Number of women
61.1 0.9 5.0 1.9 2.0 0.4 0.3 3.2
24.5 0.5 0.3
100.0
1,088
19.7 1.4
49.2 29.6
0.1
100.0
771
27.2 6.1
14.9 2.1 1.0 4.2 1.7
23.2 18.8
0.8 0.0
100.0
1,395
28.6 9.5
33.6 28.1
0.3
100.0
716
8.2 1.0 3.9 1.8 0.9
18.3 21.5 34.5
8.5 1.3 0.0
100.0
2,124
57.3 5.3
19.3 17.9
0.1
100.0
336
3.6 1.0 2.1 1.6 1.0
20.8 44.3 19.9
5.3 0.4 0.0
100.0
2,046
55.1 1.2
20.4 23.3
0.0
100.0
188
2.8 0.4 1.5 1.2 1.2
25.8 40.0 20.3
4.6 1.8 0.3
100.0
2,988
46.0 5.7
23.7 24.6
0.0
100.0
213
14.3 1.5 4.5 1.6 1.2
17.1 26.8 21.8
9.9 1.1 0.1
100.0
9,641
33.8 5.0
34.8 26.4
0.1
100.0
2,225
Note: 1 Wants next births within 2 years. 2 Wants to delay next birth for 2 or more years. 3 Other than sterilization
Pregnancy Outcomes Table 3.10 shows distribution of pregnancy outcomes including live birth, stillbirth, induced abortion and spontaneous abortion by districts in Uttaranchal. For the state as a whole, 92.4 percent of the pregnancies ended in live births, 2.2 percent in induced abortions, 3.4 percent in spontaneous abortion and 2 percent in stillbirth. More pregnancies in rural areas ended in live births (93.1 percent) than in urban areas (90.3 percent), while the incidence of induced abortion is more in urban areas (3.7 percent) than in rural areas (1.7 percent). The proportion of pregnancies ending in live births ranges from 85.9 percent in Udham Singh Nagar to 97.1 percent in Almora. The districts on the lower side of pregnancies ending in live birth include Hardwar, Rudraprayag, and Tehri Garhwal with 90-92 percent of pregnancies in these districts ending in live births. Uttarkashi and Dehradun are the two other districts with more than 95 percent of pregnancies ending in live births. The incidence of stillbirth is highest in Hardwar (5.5 percent) followed by Rudraprayag (3.7 percent) and almost nil in Almora and Champawat. Induced abortion is higher in the districts of Udham Singh Nagar (5.1 percent), Nainital (4.1 percent) and Champawat (3.9 percent). Spontaneous abortion is least in Dehradun (0.9 percent) and highest in Udham Singh Nagar (7.3 percent). In terms of incidence of induced abortion and spontaneous abortion, Chamoli is moderate.
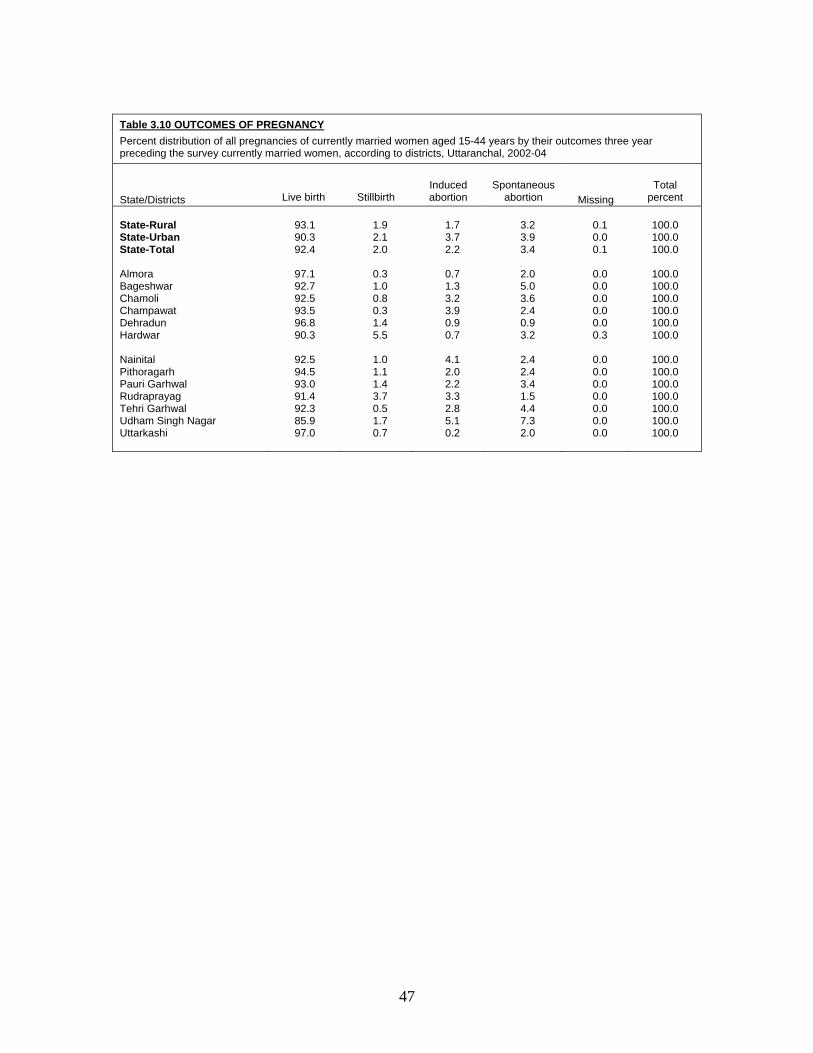
47
Table 3.10 OUTCOMES OF PREGNANCY Percent distribution of all pregnancies of currently married women aged 15-44 years by their outcomes three year preceding the survey currently married women, according to districts, Uttaranchal, 2002-04
State/Districts Live birth Stillbirth Induced abortion
Spontaneous
abortion Missing Total
percent State-Rural State-Urban State-Total Almora Bageshwar Chamoli Champawat Dehradun Hardwar Nainital Pithoragarh Pauri Garhwal Rudraprayag Tehri Garhwal Udham Singh Nagar Uttarkashi
93.1 90.3 92.4
97.1 92.7 92.5 93.5 96.8 90.3
92.5 94.5 93.0 91.4 92.3 85.9 97.0
1.9 2.1 2.0
0.3 1.0 0.8 0.3 1.4 5.5
1.0 1.1 1.4 3.7 0.5 1.7 0.7
1.7 3.7 2.2
0.7 1.3 3.2 3.9 0.9 0.7
4.1 2.0 2.2 3.3 2.8 5.1 0.2
3.2 3.9 3.4
2.0 5.0 3.6 2.4 0.9 3.2
2.4 2.4 3.4 1.5 4.4 7.3 2.0
0.1 0.0 0.1
0.0 0.0 0.0 0.0 0.0 0.3
0.0 0.0 0.0 0.0 0.0 0.0 0.0
100.0 100.0 100.0
100.0 100.0 100.0 100.0 100.0 100.0
100.0 100.0 100.0 100.0 100.0 100.0 100.0
CHAPTER IV
MATERNAL HEALTH CARE
Provisions of maternal health care services to ensure safe motherhood is one of the major components of the Reproductive and Child Health (RCH) programme. The RCH programme services for antenatal care, includes at least three antenatal care visits, iron prophylaxis for pregnant and lactating women, at least one dose of tetanus toxoid vaccine, detection and treatment of anaemia in mothers, and management and referral of high-risk pregnancies, natal care, that is encouragement of safe delivery, post-natal care, and management of unwanted pregnancies. In rural areas, the government delivers reproductive health and other health services through its network of Sub-Centres (SCs), Primary Health Centres (PHCs) and other health facilities. In addition, pregnant women and children can get services from private maternity homes, hospitals, private practitioners, and in some case non-governmental organisations (NGOs) and trust hospitals. In urban areas, reproductive health services are available mainly through government or municipal hospitals, Urban Health Posts (UHPs), Urban Family Welfare Centres (UFWCs), hospitals and nursing homes operated by NGOs, and private nursing and maternity homes. The National Population Policy (NPP), 2000 adopted by the Government of India (Ministry of Health and Family Welfare, 2000) reiterates the Government’s commitments to the safe motherhood programme within the wider context of reproductive health. Among the national socio-demographic goals for 2010 specified by the policy, several goals pertain to safe motherhood, that 80 percent of all deliveries should take place in institutions by 2010, hundred percent deliveries should be attended by trained personnel, and the maternal mortality ratio should be reduced to a level below 100 per 100,000 live births. Empowering women for improved health and nutrition is one of the 12 strategic themes identified in the policy to be pursued either as stand-alone programmes or as intersectoral programmes. In DLHS-RCH Phase-I, to all the eligible women who had their last pregnancy after January 1, 1999 a separate section on the status of maternal health and utilisation of maternal health care services was canvassed. In Phase-II, the same section was canvassed to all the eligible women who had their last pregnancy after January 1, 2001. The women whose last pregnancy terminated into live/still birth were asked about the details of antenatal, natal and post-natal care they received; pregnancy, delivery and post-delivery complications they suffered from and the treatment seeking behaviour in case of complications. Women whose last pregnancy terminated into abortion, either spontaneous or induced, were asked about the utilisation of safe abortion services and the post-abortion complications they experienced. This chapter presents information on antenatal, natal and postnatal care received by women whose last pregnancy had terminated during the three years preceding the survey as live birth or as stillbirth.
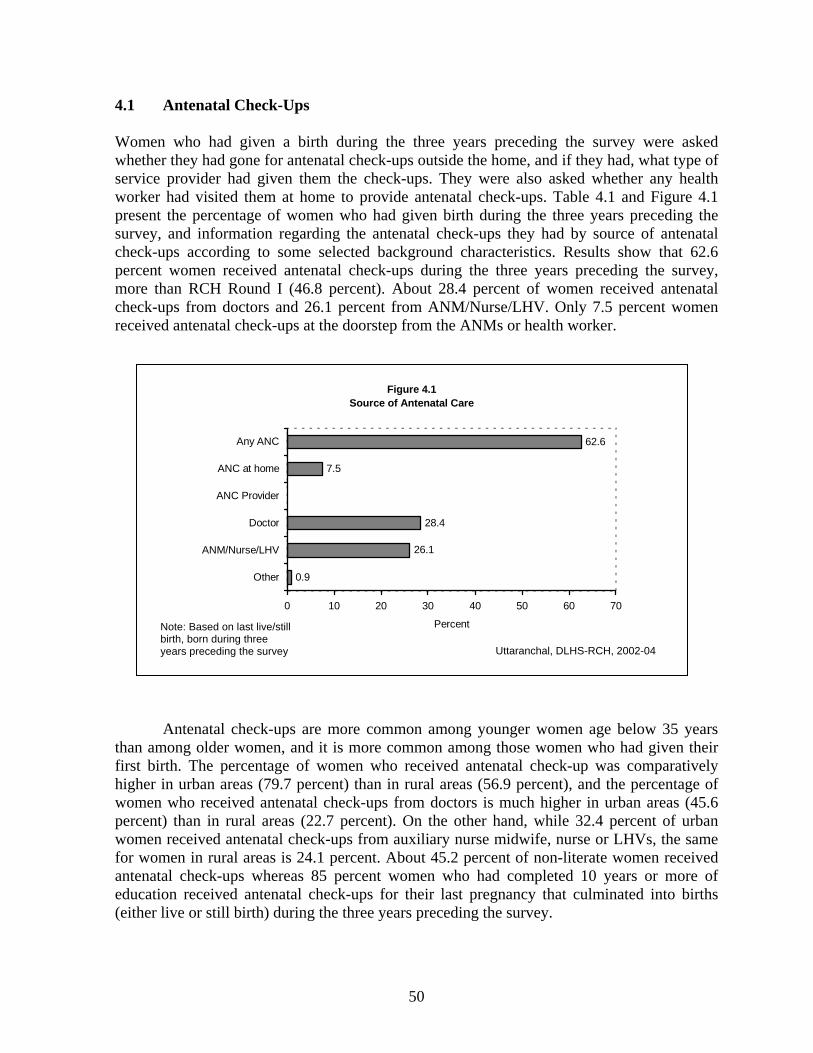
50
4.1 Antenatal Check-Ups Women who had given a birth during the three years preceding the survey were asked whether they had gone for antenatal check-ups outside the home, and if they had, what type of service provider had given them the check-ups. They were also asked whether any health worker had visited them at home to provide antenatal check-ups. Table 4.1 and Figure 4.1 present the percentage of women who had given birth during the three years preceding the survey, and information regarding the antenatal check-ups they had by source of antenatal check-ups according to some selected background characteristics. Results show that 62.6 percent women received antenatal check-ups during the three years preceding the survey, more than RCH Round I (46.8 percent). About 28.4 percent of women received antenatal check-ups from doctors and 26.1 percent from ANM/Nurse/LHV. Only 7.5 percent women received antenatal check-ups at the doorstep from the ANMs or health worker.
Antenatal check-ups are more common among younger women age below 35 years than among older women, and it is more common among those women who had given their first birth. The percentage of women who received antenatal check-up was comparatively higher in urban areas (79.7 percent) than in rural areas (56.9 percent), and the percentage of women who received antenatal check-ups from doctors is much higher in urban areas (45.6 percent) than in rural areas (22.7 percent). On the other hand, while 32.4 percent of urban women received antenatal check-ups from auxiliary nurse midwife, nurse or LHVs, the same for women in rural areas is 24.1 percent. About 45.2 percent of non-literate women received antenatal check-ups whereas 85 percent women who had completed 10 years or more of education received antenatal check-ups for their last pregnancy that culminated into births (either live or still birth) during the three years preceding the survey.
Figure 4.1Source of Antenatal Care
0.9
26.1
28.4
7.5
62.6
0 10 20 30 40 50 60 70
Other
ANM/Nurse/LHV
Doctor
ANC Provider
ANC at home
Any ANC
Percent
Note: Based on last live/still birth, born during three years preceding the survey Uttaranchal, DLHS-RCH, 2002-04
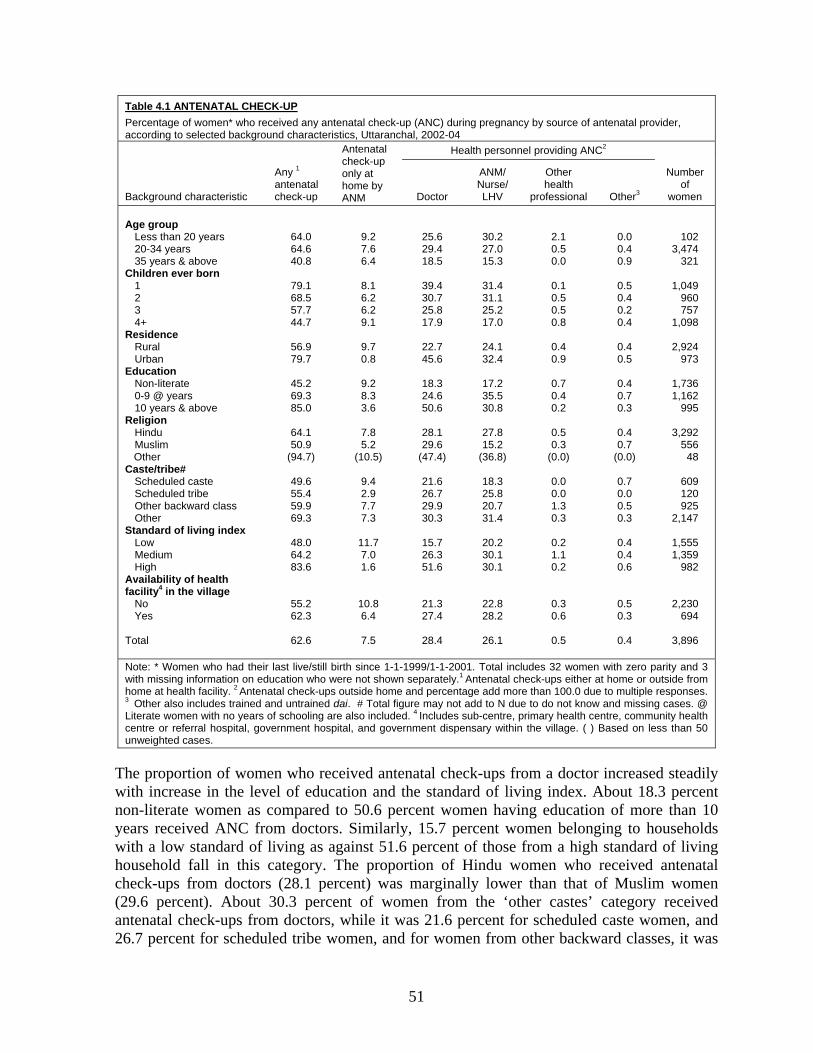
51
Table 4.1 ANTENATAL CHECK-UP Percentage of women* who received any antenatal check-up (ANC) during pregnancy by source of antenatal provider, according to selected background characteristics, Uttaranchal, 2002-04
Background characteristic
Any 1 antenatal check-up
Antenatal check-up only at home by ANM
Health personnel providing ANC2
Number of
women Doctor
ANM/ Nurse/ LHV
Other health
professional Other3 Age group Less than 20 years 20-34 years 35 years & above Children ever born 1 2 3 4+ Residence Rural Urban Education Non-literate 0-9 @ years 10 years & above Religion Hindu Muslim Other Caste/tribe# Scheduled caste Scheduled tribe Other backward class Other Standard of living index Low Medium High Availability of health facility4 in the village No Yes Total
64.0 64.6 40.8
79.1 68.5 57.7 44.7
56.9 79.7
45.2 69.3 85.0
64.1 50.9
(94.7)
49.6 55.4 59.9 69.3
48.0 64.2 83.6
55.2 62.3
62.6
9.2 7.6 6.4
8.1 6.2 6.2 9.1
9.7 0.8
9.2 8.3 3.6
7.8 5.2
(10.5)
9.4 2.9 7.7 7.3
11.7 7.0 1.6
10.8 6.4
7.5
25.6 29.4 18.5
39.4 30.7 25.8 17.9
22.7 45.6
18.3 24.6 50.6
28.1 29.6
(47.4)
21.6 26.7 29.9 30.3
15.7 26.3 51.6
21.3 27.4
28.4
30.2 27.0 15.3
31.4 31.1 25.2 17.0
24.1 32.4
17.2 35.5 30.8
27.8 15.2
(36.8)
18.3 25.8 20.7 31.4
20.2 30.1 30.1
22.8 28.2
26.1
2.1 0.5 0.0
0.1 0.5 0.5 0.8
0.4 0.9
0.7 0.4 0.2
0.5 0.3
(0.0)
0.0 0.0 1.3 0.3
0.2 1.1 0.2
0.3 0.6
0.5
0.0 0.4 0.9
0.5 0.4 0.2 0.4
0.4 0.5
0.4 0.7 0.3
0.4 0.7
(0.0)
0.7 0.0 0.5 0.3
0.4 0.4 0.6
0.5 0.3
0.4
102 3,474
321
1,049 960 757
1,098
2,924 973
1,736 1,162
995
3,292 556
48
609 120 925
2,147
1,555 1,359
982
2,230 694
3,896
Note: * Women who had their last live/still birth since 1-1-1999/1-1-2001. Total includes 32 women with zero parity and 3 with missing information on education who were not shown separately.1 Antenatal check-ups either at home or outside from home at health facility. 2 Antenatal check-ups outside home and percentage add more than 100.0 due to multiple responses. 3 Other also includes trained and untrained dai. # Total figure may not add to N due to do not know and missing cases. @ Literate women with no years of schooling are also included. 4 Includes sub-centre, primary health centre, community health centre or referral hospital, government hospital, and government dispensary within the village. ( ) Based on less than 50 unweighted cases.
The proportion of women who received antenatal check-ups from a doctor increased steadily with increase in the level of education and the standard of living index. About 18.3 percent non-literate women as compared to 50.6 percent women having education of more than 10 years received ANC from doctors. Similarly, 15.7 percent women belonging to households with a low standard of living as against 51.6 percent of those from a high standard of living household fall in this category. The proportion of Hindu women who received antenatal check-ups from doctors (28.1 percent) was marginally lower than that of Muslim women (29.6 percent). About 30.3 percent of women from the ‘other castes’ category received antenatal check-ups from doctors, while it was 21.6 percent for scheduled caste women, and 26.7 percent for scheduled tribe women, and for women from other backward classes, it was
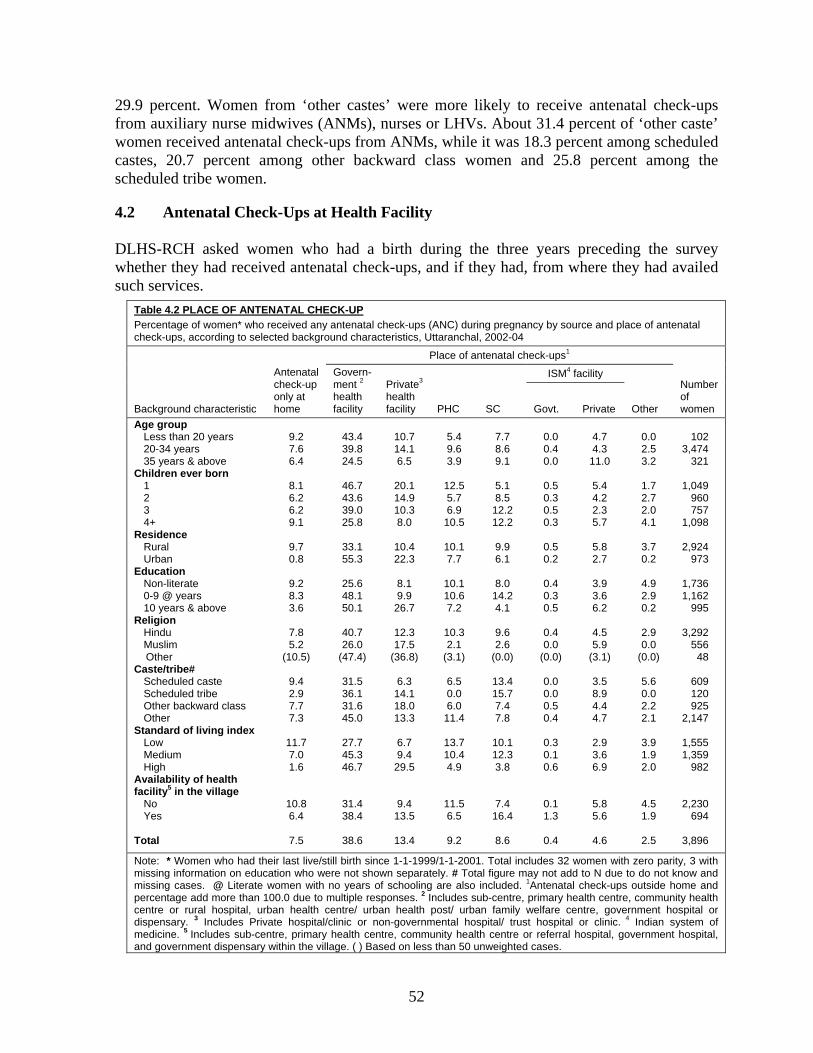
52
29.9 percent. Women from ‘other castes’ were more likely to receive antenatal check-ups from auxiliary nurse midwives (ANMs), nurses or LHVs. About 31.4 percent of ‘other caste’ women received antenatal check-ups from ANMs, while it was 18.3 percent among scheduled castes, 20.7 percent among other backward class women and 25.8 percent among the scheduled tribe women. 4.2 Antenatal Check-Ups at Health Facility DLHS-RCH asked women who had a birth during the three years preceding the survey whether they had received antenatal check-ups, and if they had, from where they had availed such services.
Table 4.2 PLACE OF ANTENATAL CHECK-UP Percentage of women* who received any antenatal check-ups (ANC) during pregnancy by source and place of antenatal check-ups, according to selected background characteristics, Uttaranchal, 2002-04
Background characteristic
Antenatal check-up only at home
Place of antenatal check-ups1
Number of women
Govern- ment 2 health facility
Private3 health facility PHC SC
ISM4 facility
Other Govt. Private Age group Less than 20 years 20-34 years 35 years & above Children ever born 1 2 3 4+ Residence Rural Urban Education Non-literate 0-9 @ years 10 years & above Religion Hindu Muslim Other Caste/tribe# Scheduled caste Scheduled tribe Other backward class Other Standard of living index Low Medium High Availability of health facility5 in the village No Yes Total
9.2 7.6 6.4
8.1 6.2 6.2 9.1
9.7 0.8
9.2 8.3 3.6
7.8 5.2
(10.5)
9.4 2.9 7.7 7.3
11.7 7.0 1.6
10.8 6.4
7.5
43.4 39.8 24.5
46.7 43.6 39.0 25.8
33.1 55.3
25.6 48.1 50.1
40.7 26.0
(47.4)
31.5 36.1 31.6 45.0
27.7 45.3 46.7
31.4 38.4
38.6
10.7 14.1 6.5
20.1 14.9 10.3 8.0
10.4 22.3
8.1 9.9
26.7
12.3 17.5
(36.8)
6.3 14.1 18.0 13.3
6.7 9.4
29.5
9.4 13.5
13.4
5.4 9.6 3.9
12.5 5.7 6.9
10.5
10.1 7.7
10.1 10.6 7.2
10.3 2.1
(3.1)
6.5 0.0 6.0
11.4
13.7 10.4 4.9
11.5 6.5
9.2
7.7 8.6 9.1
5.1 8.5
12.2 12.2
9.9 6.1
8.0
14.2 4.1
9.6 2.6
(0.0)
13.4 15.7 7.4 7.8
10.1 12.3 3.8
7.4 16.4
8.6
0.0 0.4 0.0
0.5 0.3 0.5 0.3
0.5 0.2
0.4 0.3 0.5
0.4 0.0
(0.0)
0.0 0.0 0.5 0.4
0.3 0.1 0.6
0.1 1.3
0.4
4.7 4.3
11.0
5.4 4.2 2.3 5.7
5.8 2.7
3.9 3.6 6.2
4.5 5.9
(3.1)
3.5 8.9 4.4 4.7
2.9 3.6 6.9
5.8 5.6
4.6
0.0 2.5 3.2
1.7 2.7 2.0 4.1
3.7 0.2
4.9 2.9 0.2
2.9 0.0
(0.0)
5.6 0.0 2.2 2.1
3.9 1.9 2.0
4.5 1.9
2.5
102
3,474 321
1,049
960 757
1,098
2,924 973
1,736 1,162
995
3,292 556
48
609 120 925
2,147
1,555 1,359
982
2,230 694
3,896
Note: * Women who had their last live/still birth since 1-1-1999/1-1-2001. Total includes 32 women with zero parity, 3 with missing information on education who were not shown separately. # Total figure may not add to N due to do not know and missing cases. @ Literate women with no years of schooling are also included. 1Antenatal check-ups outside home and percentage add more than 100.0 due to multiple responses. 2 Includes sub-centre, primary health centre, community health centre or rural hospital, urban health centre/ urban health post/ urban family welfare centre, government hospital or dispensary. 3 Includes Private hospital/clinic or non-governmental hospital/ trust hospital or clinic. 4 Indian system of medicine. 5 Includes sub-centre, primary health centre, community health centre or referral hospital, government hospital, and government dispensary within the village. ( ) Based on less than 50 unweighted cases.
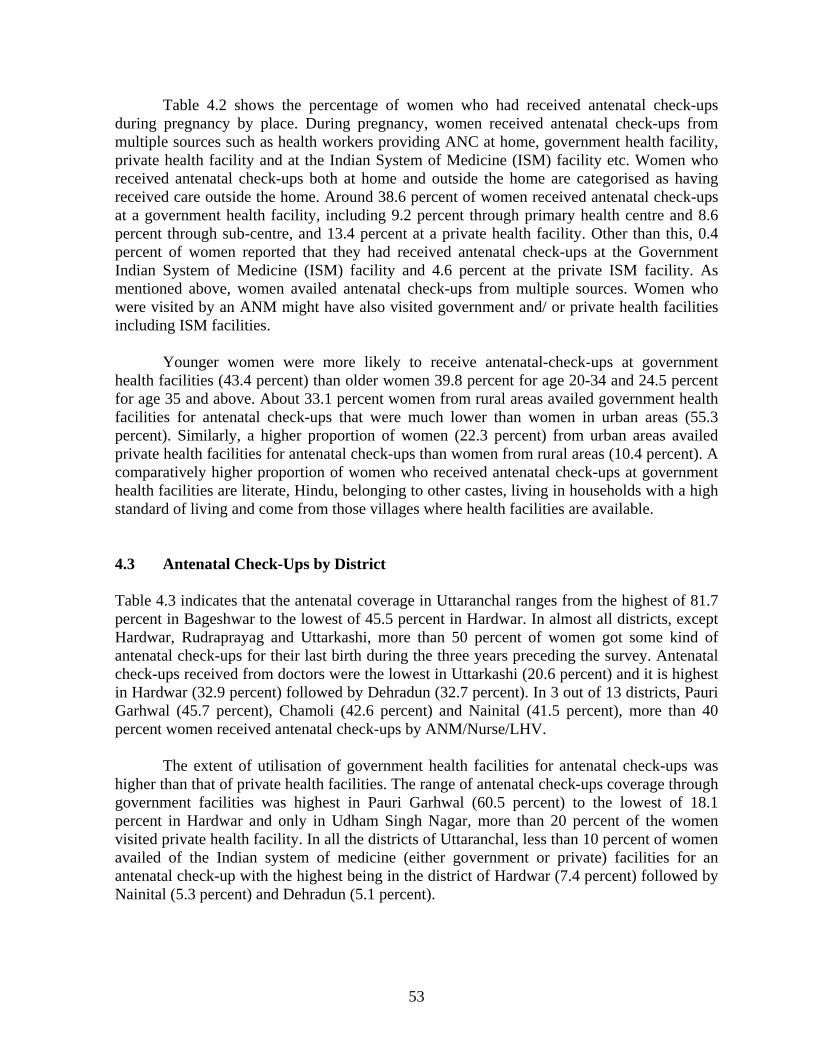
53
Table 4.2 shows the percentage of women who had received antenatal check-ups during pregnancy by place. During pregnancy, women received antenatal check-ups from multiple sources such as health workers providing ANC at home, government health facility, private health facility and at the Indian System of Medicine (ISM) facility etc. Women who received antenatal check-ups both at home and outside the home are categorised as having received care outside the home. Around 38.6 percent of women received antenatal check-ups at a government health facility, including 9.2 percent through primary health centre and 8.6 percent through sub-centre, and 13.4 percent at a private health facility. Other than this, 0.4 percent of women reported that they had received antenatal check-ups at the Government Indian System of Medicine (ISM) facility and 4.6 percent at the private ISM facility. As mentioned above, women availed antenatal check-ups from multiple sources. Women who were visited by an ANM might have also visited government and/ or private health facilities including ISM facilities. Younger women were more likely to receive antenatal-check-ups at government health facilities (43.4 percent) than older women 39.8 percent for age 20-34 and 24.5 percent for age 35 and above. About 33.1 percent women from rural areas availed government health facilities for antenatal check-ups that were much lower than women in urban areas (55.3 percent). Similarly, a higher proportion of women (22.3 percent) from urban areas availed private health facilities for antenatal check-ups than women from rural areas (10.4 percent). A comparatively higher proportion of women who received antenatal check-ups at government health facilities are literate, Hindu, belonging to other castes, living in households with a high standard of living and come from those villages where health facilities are available. 4.3 Antenatal Check-Ups by District Table 4.3 indicates that the antenatal coverage in Uttaranchal ranges from the highest of 81.7 percent in Bageshwar to the lowest of 45.5 percent in Hardwar. In almost all districts, except Hardwar, Rudraprayag and Uttarkashi, more than 50 percent of women got some kind of antenatal check-ups for their last birth during the three years preceding the survey. Antenatal check-ups received from doctors were the lowest in Uttarkashi (20.6 percent) and it is highest in Hardwar (32.9 percent) followed by Dehradun (32.7 percent). In 3 out of 13 districts, Pauri Garhwal (45.7 percent), Chamoli (42.6 percent) and Nainital (41.5 percent), more than 40 percent women received antenatal check-ups by ANM/Nurse/LHV.
The extent of utilisation of government health facilities for antenatal check-ups was higher than that of private health facilities. The range of antenatal check-ups coverage through government facilities was highest in Pauri Garhwal (60.5 percent) to the lowest of 18.1 percent in Hardwar and only in Udham Singh Nagar, more than 20 percent of the women visited private health facility. In all the districts of Uttaranchal, less than 10 percent of women availed of the Indian system of medicine (either government or private) facilities for an antenatal check-up with the highest being in the district of Hardwar (7.4 percent) followed by Nainital (5.3 percent) and Dehradun (5.1 percent).
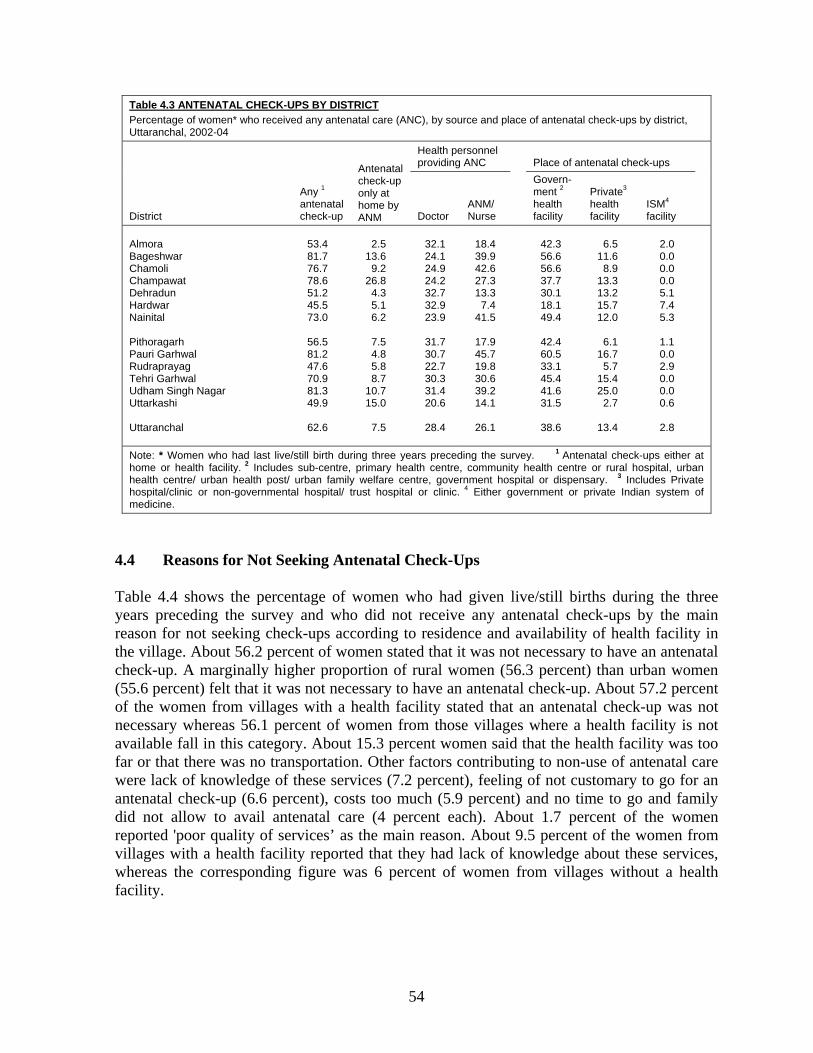
54
Table 4.3 ANTENATAL CHECK-UPS BY DISTRICT Percentage of women* who received any antenatal care (ANC), by source and place of antenatal check-ups by district, Uttaranchal, 2002-04
District
Any 1 antenatal check-up
Antenatal check-up only at home by ANM
Health personnel providing ANC
Place of antenatal check-ups
Doctor ANM/ Nurse
Govern- ment 2 health facility
Private3 health facility
ISM4 facility
Almora Bageshwar Chamoli Champawat Dehradun Hardwar Nainital Pithoragarh Pauri Garhwal Rudraprayag Tehri Garhwal Udham Singh Nagar Uttarkashi Uttaranchal
53.4 81.7 76.7 78.6 51.2 45.5 73.0
56.5 81.2 47.6 70.9 81.3 49.9
62.6
2.5
13.6 9.2
26.8 4.3 5.1 6.2
7.5 4.8 5.8 8.7
10.7 15.0
7.5
32.1 24.1 24.9 24.2 32.7 32.9 23.9
31.7 30.7 22.7 30.3 31.4 20.6
28.4
18.4 39.9 42.6 27.3 13.3
7.4 41.5
17.9 45.7 19.8 30.6 39.2 14.1
26.1
42.3 56.6 56.6 37.7 30.1 18.1 49.4
42.4 60.5 33.1 45.4 41.6 31.5
38.6
6.5
11.6 8.9
13.3 13.2 15.7 12.0
6.1
16.7 5.7
15.4 25.0
2.7
13.4
2.0 0.0 0.0 0.0 5.1 7.4 5.3
1.1 0.0 2.9 0.0 0.0 0.6
2.8
Note: * Women who had last live/still birth during three years preceding the survey. 1 Antenatal check-ups either at home or health facility. 2 Includes sub-centre, primary health centre, community health centre or rural hospital, urban health centre/ urban health post/ urban family welfare centre, government hospital or dispensary. 3 Includes Private hospital/clinic or non-governmental hospital/ trust hospital or clinic. 4 Either government or private Indian system of medicine.
4.4 Reasons for Not Seeking Antenatal Check-Ups Table 4.4 shows the percentage of women who had given live/still births during the three years preceding the survey and who did not receive any antenatal check-ups by the main reason for not seeking check-ups according to residence and availability of health facility in the village. About 56.2 percent of women stated that it was not necessary to have an antenatal check-up. A marginally higher proportion of rural women (56.3 percent) than urban women (55.6 percent) felt that it was not necessary to have an antenatal check-up. About 57.2 percent of the women from villages with a health facility stated that an antenatal check-up was not necessary whereas 56.1 percent of women from those villages where a health facility is not available fall in this category. About 15.3 percent women said that the health facility was too far or that there was no transportation. Other factors contributing to non-use of antenatal care were lack of knowledge of these services (7.2 percent), feeling of not customary to go for an antenatal check-up (6.6 percent), costs too much (5.9 percent) and no time to go and family did not allow to avail antenatal care (4 percent each). About 1.7 percent of the women reported 'poor quality of services’ as the main reason. About 9.5 percent of the women from villages with a health facility reported that they had lack of knowledge about these services, whereas the corresponding figure was 6 percent of women from villages without a health facility.
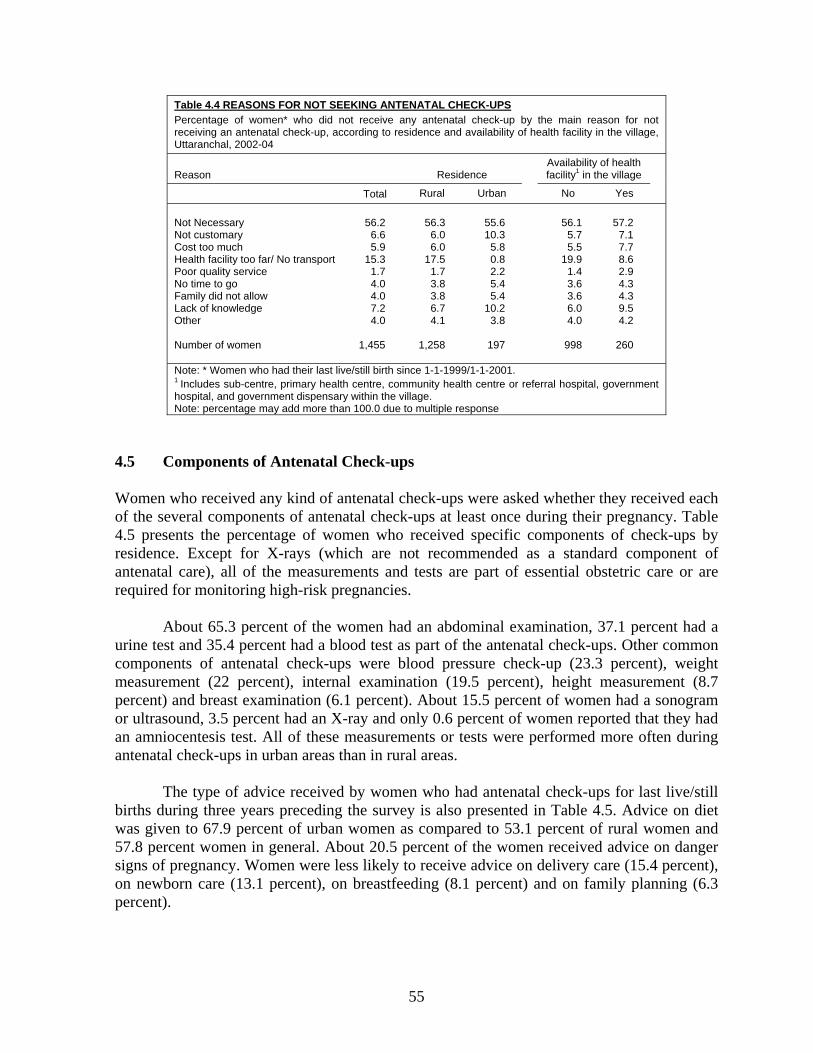
55
Table 4.4 REASONS FOR NOT SEEKING ANTENATAL CHECK-UPS Percentage of women* who did not receive any antenatal check-up by the main reason for not receiving an antenatal check-up, according to residence and availability of health facility in the village, Uttaranchal, 2002-04
Reason
Residence
Availability of health facility1 in the village
Total Rural Urban No Yes Not Necessary Not customary Cost too much Health facility too far/ No transport Poor quality service No time to go Family did not allow Lack of knowledge Other Number of women
56.2
6.6 5.9
15.3 1.7 4.0 4.0 7.2 4.0
1,455
56.3
6.0 6.0
17.5 1.7 3.8 3.8 6.7 4.1
1,258
55.6 10.3
5.8 0.8 2.2 5.4 5.4
10.2 3.8
197
56.1
5.7 5.5
19.9 1.4 3.6 3.6 6.0 4.0
998
57.2
7.1 7.7 8.6 2.9 4.3 4.3 9.5 4.2
260
Note: * Women who had their last live/still birth since 1-1-1999/1-1-2001. 1 Includes sub-centre, primary health centre, community health centre or referral hospital, government hospital, and government dispensary within the village. Note: percentage may add more than 100.0 due to multiple response
4.5 Components of Antenatal Check-ups Women who received any kind of antenatal check-ups were asked whether they received each of the several components of antenatal check-ups at least once during their pregnancy. Table 4.5 presents the percentage of women who received specific components of check-ups by residence. Except for X-rays (which are not recommended as a standard component of antenatal care), all of the measurements and tests are part of essential obstetric care or are required for monitoring high-risk pregnancies. About 65.3 percent of the women had an abdominal examination, 37.1 percent had a urine test and 35.4 percent had a blood test as part of the antenatal check-ups. Other common components of antenatal check-ups were blood pressure check-up (23.3 percent), weight measurement (22 percent), internal examination (19.5 percent), height measurement (8.7 percent) and breast examination (6.1 percent). About 15.5 percent of women had a sonogram or ultrasound, 3.5 percent had an X-ray and only 0.6 percent of women reported that they had an amniocentesis test. All of these measurements or tests were performed more often during antenatal check-ups in urban areas than in rural areas. The type of advice received by women who had antenatal check-ups for last live/still births during three years preceding the survey is also presented in Table 4.5. Advice on diet was given to 67.9 percent of urban women as compared to 53.1 percent of rural women and 57.8 percent women in general. About 20.5 percent of the women received advice on danger signs of pregnancy. Women were less likely to receive advice on delivery care (15.4 percent), on newborn care (13.1 percent), on breastfeeding (8.1 percent) and on family planning (6.3 percent).
56
Table 4.5 COMPONENTS OF ANTENATAL CHECK-UPS Percentage of women* who received an antenatal check-up by specific components of antenatal check-up, according to residence, Uttaranchal, 2002-04
Components of antenatal check-ups Total Rural Urban
Antenatal measurements/tests Weight measured Height measured Blood pressure checked Blood tested Urine tested Abdomen examined Internal examined Breast examined X-ray Sonography /ultrasound Amniocentesis
Antenatal advice Diet Danger signs of pregnancy Delivery care Breast feeding New born care Family planning Number of women who received any antenatal check-up
22.0 8.7
23.3 35.4 37.1 65.3 19.5
6.1 3.5
15.5 0.6
57.8 20.5 15.4
8.1 13.1
6.3
2,439
18.7 6.4
17.9 29.4 29.7 63.7 15.6
4.2 2.9
13.4 0.1
53.1 19.0 13.1
6.0 10.7
5.2
1,664
29.0 13.7 34.8 48.2 53.0 68.9 27.7 10.2
4.9 20.1
1.7
67.9 23.6 20.5 12.6 18.1
8.8
776
Note: * Women who had their last live/still birth since 1-1-1999/1-1-2001
4.6 Antenatal Care Services In India, as per the Reproductive and Child Health Programme, all pregnant women should be registered in the first 12-16 weeks (Ministry of Health and Family Welfare, 1997). Accordingly the first antenatal check-ups should take place at latest during the first trimester of the pregnancy. It also includes the provision of at least three antenatal care visits, of at least one tetanus toxoid injection, and supplementary iron in the form of IFA Tablets daily for 100 days. To assess whether the women had received all the care during pregnancy, information was collected regarding number of antenatal visits, timing of the first visit, received tetanus toxoid injection and supplement iron folic acid Tablets. The results are presented in Table 4.6. In Uttaranchal, 28 percent of the women received at least three antenatal check-ups and only 15.8 percent had four or more check-ups. At least three antenatal check-ups were received by 49.7 percent of women in urban areas compared with only 20.7 percent of women in rural areas. Number of visits for antenatal care varies by education, children ever born, religion, caste and standard of living index. Only 15.3 percent of non-literate, 26.4 percent literate women (educated below high school) and 51.5 percent of women who had 10 or more years of schooling visited for minimum three antenatal check-ups. Parity of women is negatively associated with antenatal check-ups. About 41.8 percent women with parity one received at least three antenatal check-ups compared to just 16.3 percent women with parity 4 and above.
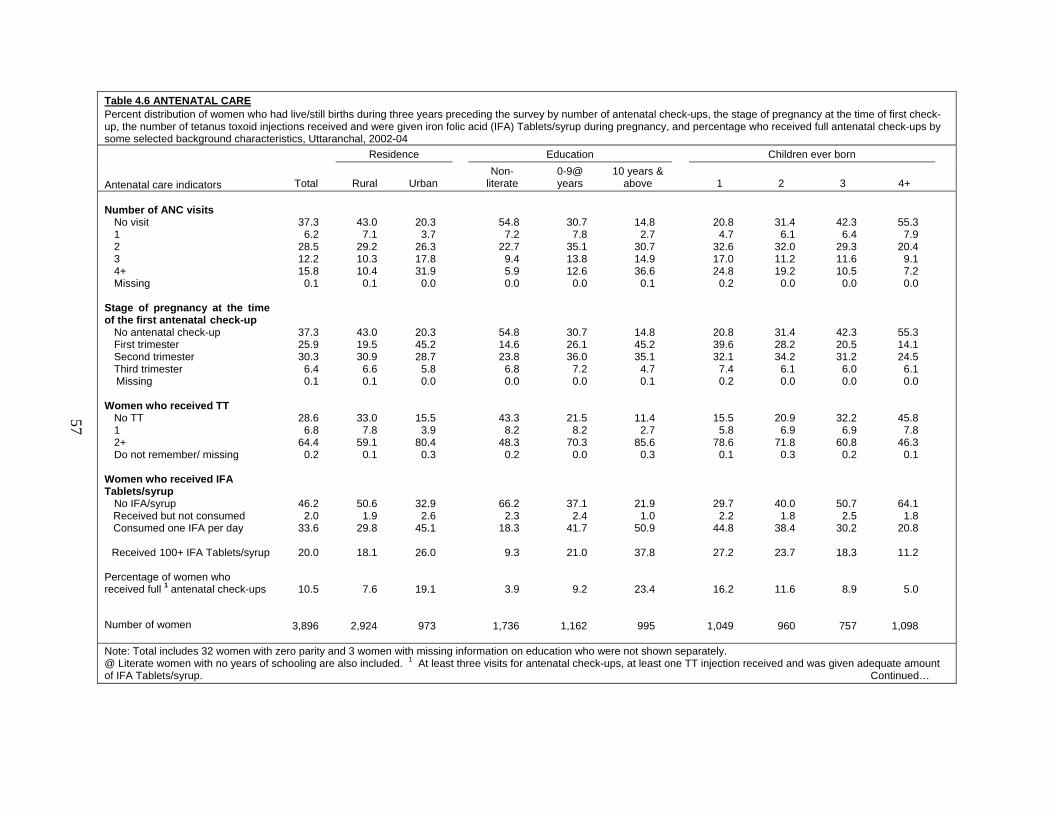
57
Table 4.6 ANTENATAL CARE Percent distribution of women who had live/still births during three years preceding the survey by number of antenatal check-ups, the stage of pregnancy at the time of first check-up, the number of tetanus toxoid injections received and were given iron folic acid (IFA) Tablets/syrup during pregnancy, and percentage who received full antenatal check-ups by some selected background characteristics, Uttaranchal, 2002-04
Antenatal care indicators Total
Residence Education Children ever born
Rural Urban Non-
literate 0-9@ years
10 years & above
1 2 3 4+
Number of ANC visits No visit 1 2 3 4+ Missing Stage of pregnancy at the time of the first antenatal check-up No antenatal check-up First trimester Second trimester Third trimester Missing Women who received TT No TT 1 2+ Do not remember/ missing Women who received IFA Tablets/syrup No IFA/syrup Received but not consumed Consumed one IFA per day
Received 100+ IFA Tablets/syrup Percentage of women who received full 1 antenatal check-ups
Number of women
37.3 6.2
28.5 12.2 15.8
0.1
37.3 25.9 30.3
6.4 0.1
28.6 6.8
64.4 0.2
46.2 2.0
33.6
20.0
10.5
3,896
43.0 7.1
29.2 10.3 10.4
0.1
43.0 19.5 30.9
6.6 0.1
33.0 7.8
59.1 0.1
50.6 1.9
29.8
18.1
7.6
2,924
20.3 3.7
26.3 17.8 31.9
0.0
20.3 45.2 28.7
5.8 0.0
15.5 3.9
80.4 0.3
32.9 2.6
45.1
26.0
19.1
973
54.8 7.2
22.7 9.4 5.9 0.0
54.8 14.6 23.8
6.8 0.0
43.3 8.2
48.3 0.2
66.2 2.3
18.3
9.3
3.9
1,736
30.7 7.8
35.1 13.8 12.6
0.0
30.7 26.1 36.0
7.2 0.0
21.5 8.2
70.3 0.0
37.1 2.4
41.7
21.0
9.2
1,162
14.8 2.7
30.7 14.9 36.6
0.1
14.8 45.2 35.1
4.7 0.1
11.4 2.7
85.6 0.3
21.9 1.0
50.9
37.8
23.4
995
20.8 4.7
32.6 17.0 24.8
0.2
20.8 39.6 32.1
7.4 0.2
15.5 5.8
78.6 0.1
29.7 2.2
44.8
27.2
16.2
1,049
31.4 6.1
32.0 11.2 19.2
0.0
31.4 28.2 34.2
6.1 0.0
20.9 6.9
71.8 0.3
40.0 1.8
38.4
23.7
11.6
960
42.3 6.4
29.3 11.6 10.5
0.0
42.3 20.5 31.2
6.0 0.0
32.2 6.9
60.8 0.2
50.7 2.5
30.2
18.3
8.9
757
55.3 7.9
20.4 9.1 7.2 0.0
55.3 14.1 24.5
6.1 0.0
45.8 7.8
46.3 0.1
64.1 1.8
20.8
11.2
5.0
1,098
Note: Total includes 32 women with zero parity and 3 women with missing information on education who were not shown separately. @ Literate women with no years of schooling are also included. 1 At least three visits for antenatal check-ups, at least one TT injection received and was given adequate amount of IFA Tablets/syrup. Continued…
57
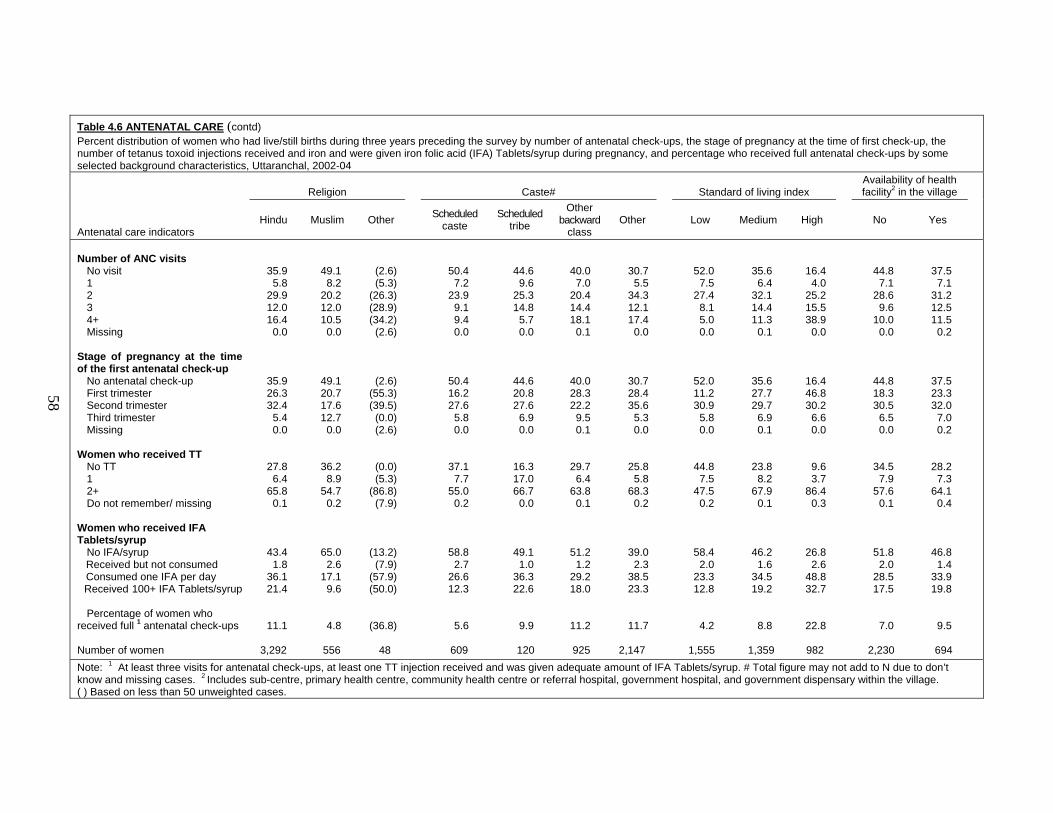
58
Table 4.6 ANTENATAL CARE (contd) Percent distribution of women who had live/still births during three years preceding the survey by number of antenatal check-ups, the stage of pregnancy at the time of first check-up, the number of tetanus toxoid injections received and iron and were given iron folic acid (IFA) Tablets/syrup during pregnancy, and percentage who received full antenatal check-ups by some selected background characteristics, Uttaranchal, 2002-04
Antenatal care indicators
Religion Caste# Standard of living index Availability of health facility2 in the village
Hindu Muslim Other
Scheduled caste
Scheduled tribe
Other backward
class Other
Low Medium High No Yes
Number of ANC visits No visit 1 2 3 4+ Missing Stage of pregnancy at the time of the first antenatal check-up No antenatal check-up First trimester Second trimester Third trimester Missing Women who received TT No TT 1 2+ Do not remember/ missing Women who received IFA Tablets/syrup No IFA/syrup Received but not consumed Consumed one IFA per day
Received 100+ IFA Tablets/syrup Percentage of women who received full 1 antenatal check-ups Number of women
35.9 5.8
29.9 12.0 16.4
0.0
35.9 26.3 32.4
5.4 0.0
27.8 6.4
65.8 0.1
43.4 1.8
36.1 21.4
11.1
3,292
49.1 8.2
20.2 12.0 10.5
0.0
49.1 20.7 17.6 12.7
0.0
36.2 8.9
54.7 0.2
65.0 2.6
17.1 9.6
4.8
556
(2.6) (5.3)
(26.3) (28.9) (34.2)
(2.6)
(2.6) (55.3) (39.5)
(0.0) (2.6)
(0.0) (5.3)
(86.8) (7.9)
(13.2) (7.9)
(57.9) (50.0)
(36.8)
48
50.4 7.2
23.9 9.1 9.4 0.0
50.4 16.2 27.6
5.8 0.0
37.1 7.7
55.0 0.2
58.8 2.7
26.6 12.3
5.6
609
44.6 9.6
25.3 14.8
5.7 0.0
44.6 20.8 27.6
6.9 0.0
16.3 17.0 66.7
0.0
49.1 1.0
36.3 22.6
9.9
120
40.0 7.0
20.4 14.4 18.1
0.1
40.0 28.3 22.2
9.5 0.1
29.7 6.4
63.8 0.1
51.2 1.2
29.2 18.0
11.2
925
30.7 5.5
34.3 12.1 17.4
0.0
30.7 28.4 35.6
5.3 0.0
25.8 5.8
68.3 0.2
39.0 2.3
38.5 23.3
11.7
2,147
52.0 7.5
27.4 8.1 5.0 0.0
52.0 11.2 30.9
5.8 0.0
44.8 7.5
47.5 0.2
58.4 2.0
23.3 12.8
4.2
1,555
35.6 6.4
32.1 14.4 11.3
0.1
35.6 27.7 29.7
6.9 0.1
23.8 8.2
67.9 0.1
46.2 1.6
34.5 19.2
8.8
1,359
16.4 4.0
25.2 15.5 38.9
0.0
16.4 46.8 30.2
6.6 0.0
9.6 3.7
86.4 0.3
26.8 2.6
48.8 32.7
22.8
982
44.8 7.1
28.6 9.6
10.0 0.0
44.8 18.3 30.5
6.5 0.0
34.5 7.9
57.6 0.1
51.8 2.0
28.5 17.5
7.0
2,230
37.5 7.1
31.2 12.5 11.5
0.2
37.5 23.3 32.0
7.0 0.2
28.2 7.3
64.1 0.4
46.8 1.4
33.9 19.8
9.5
694
Note: 1 At least three visits for antenatal check-ups, at least one TT injection received and was given adequate amount of IFA Tablets/syrup. # Total figure may not add to N due to don’t know and missing cases. 2 Includes sub-centre, primary health centre, community health centre or referral hospital, government hospital, and government dispensary within the village. ( ) Based on less than 50 unweighted cases.
58
59
Hindu women (28.4 percent) were more likely to have at least three visits for antenatal check-ups than Muslim women (22.5 percent). This coverage is slightly lower for women from scheduled castes (18.5 percent) and scheduled tribes (20.5 percent) than for women from other backward classes (32.5 percent) and other castes (29.5 percent). Having three or more antenatal visits also increased with the standard of living – 13.1 percent for women with a low standard of living, 25.7 percent for women with a medium standard of living and 54.4 percent for women with a high standard of living. Availability of health facility in the village does not make any significant difference to the minimum three visits for antenatal check-ups. Data on timing of first antenatal check-ups shows that about one-fourth of the women received their first antenatal check-up in the first trimester of pregnancy, another 30.3 percent received their first check-up in the second trimester and 6.4 percent of the women received their first check-up in the third trimester. A relatively higher proportion of women in the urban areas (45.2 percent) as compared to those in rural areas (19.5 percent) had a check-up in the first trimester of pregnancy. The first antenatal check-up in the first trimester has steadily increased with level of education. Only 14.6 percent of non-literate women had undergone their first antenatal check-up in the first trimester while 45.2 percent of women who had completed at least 10 years of schooling received their first antenatal check-up in the first trimester. About 39.6 percent of the women with parity-1 as compared to only 14.1 percent women with parity four and above had undergone an antenatal check-up in the first trimester. Muslim women were less likely to go for an antenatal check-up in the first trimester of their pregnancy as compared to Hindu women and just 16.2 percent of scheduled caste women undertook an antenatal check-up in the first trimester as compared with 20.8 percent of scheduled tribe women, 28.3 percent of other backward class women and 28.4 percent women from ‘other’ caste category. About 11.2 percent women with low standard of living, 27.7 percent women with medium standard of living and 46.8 percent women with high standard of living respectively had undergone their first antenatal check-up during the first trimester of their pregnancy period. Nutritional deficiencies in women are often exacerbated during pregnancy because of the additional nutrient requirements for foetal growth; therefore a pregnant woman needs six times more iron than a non-pregnant woman. The information on receiving iron folic acid Tablets/syrup during pregnancy is also collected. Table 4.6 shows that 53.8 percent of the women in Uttaranchal who had live/still births during three years preceding the survey received IFA supplements. The coverage of IFA Tablets is relatively higher in urban areas (67.1 percent) than in rural areas (49.4 percent). IFA coverage is lower among non-literate women, women with low standard of living, scheduled caste women and women of higher parity. IFA coverage is also lower among Muslim (35 percent) women than Hindu (56.6 percent) women. Again, during pregnancy in the last three years preceding the survey, only 20 percent of women received 100 or more IFA Tablets, 18.1 percent in rural areas and 26 percent in urban areas. Intake of 100 or more IFA is positively associated with education and standard of living index and negatively associated with parity. More Hindu women and other caste women received 100 or more IFA Tablets than their counterparts. Such a large difference in receiving IFA or intake of 100 or more IFA Tablets/syrup is not found while analysing the situation by availability of health facility in the village.
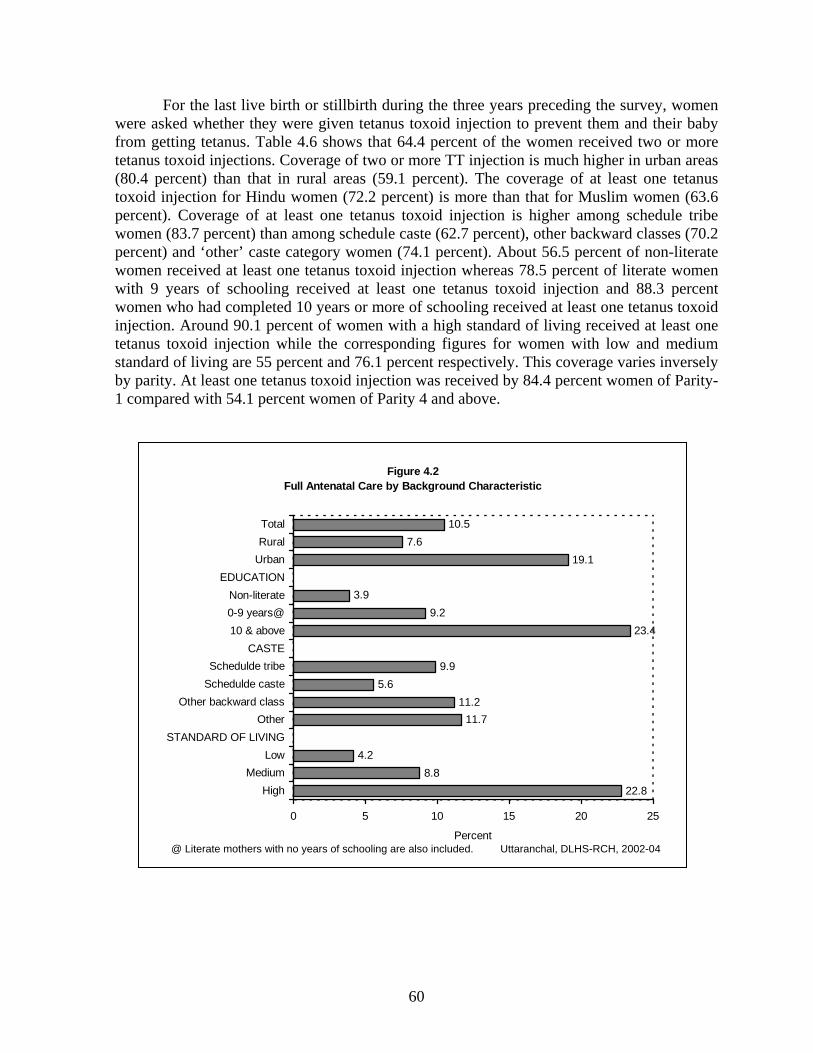
60
For the last live birth or stillbirth during the three years preceding the survey, women were asked whether they were given tetanus toxoid injection to prevent them and their baby from getting tetanus. Table 4.6 shows that 64.4 percent of the women received two or more tetanus toxoid injections. Coverage of two or more TT injection is much higher in urban areas (80.4 percent) than that in rural areas (59.1 percent). The coverage of at least one tetanus toxoid injection for Hindu women (72.2 percent) is more than that for Muslim women (63.6 percent). Coverage of at least one tetanus toxoid injection is higher among schedule tribe women (83.7 percent) than among schedule caste (62.7 percent), other backward classes (70.2 percent) and ‘other’ caste category women (74.1 percent). About 56.5 percent of non-literate women received at least one tetanus toxoid injection whereas 78.5 percent of literate women with 9 years of schooling received at least one tetanus toxoid injection and 88.3 percent women who had completed 10 years or more of schooling received at least one tetanus toxoid injection. Around 90.1 percent of women with a high standard of living received at least one tetanus toxoid injection while the corresponding figures for women with low and medium standard of living are 55 percent and 76.1 percent respectively. This coverage varies inversely by parity. At least one tetanus toxoid injection was received by 84.4 percent women of Parity-1 compared with 54.1 percent women of Parity 4 and above.
Figure 4.2 Full Antenatal Care by Background Characteristic
22.88.8
4.2
11.711.2
5.69.9
23.49.2
3.9
19.17.6
10.5
0 5 10 15 20 25
HighMedium
LowSTANDARD OF LIVING
OtherOther backward class
Schedulde casteSchedulde tribe
CASTE10 & above0-9 years@Non-literate
EDUCATIONUrbanRuralTotal
Percent @ Literate mothers with no years of schooling are also included. Uttaranchal, DLHS-RCH, 2002-04
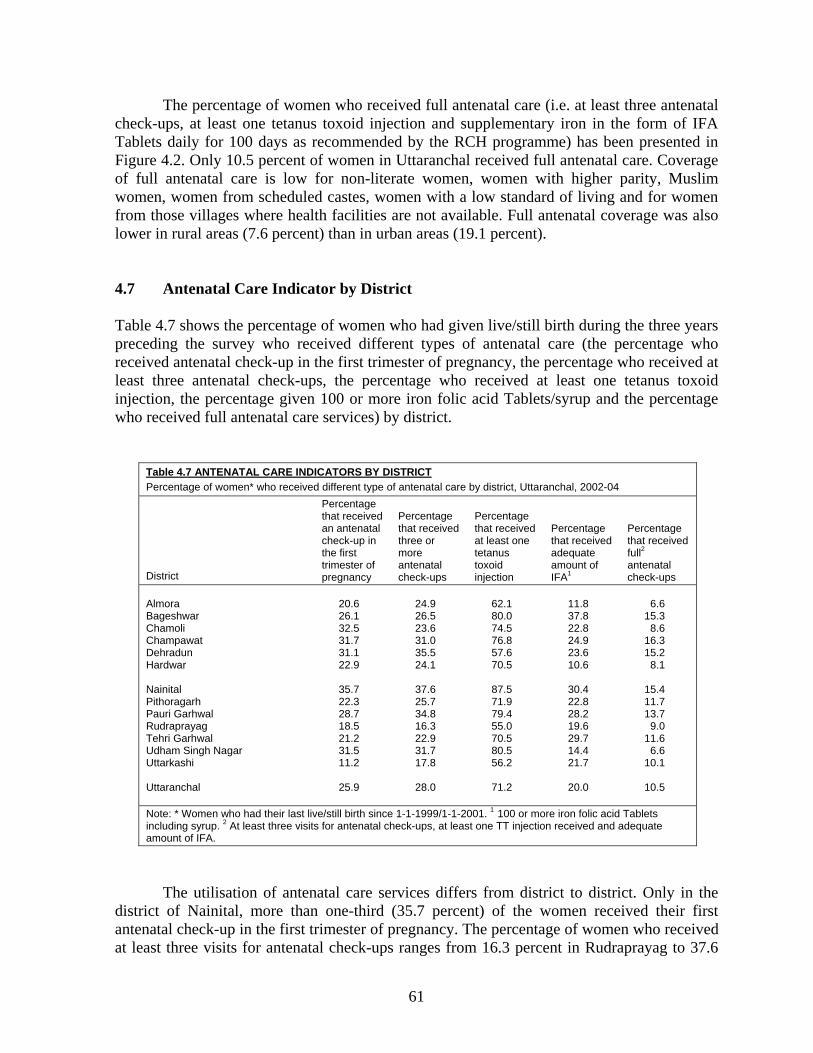
61
The percentage of women who received full antenatal care (i.e. at least three antenatal check-ups, at least one tetanus toxoid injection and supplementary iron in the form of IFA Tablets daily for 100 days as recommended by the RCH programme) has been presented in Figure 4.2. Only 10.5 percent of women in Uttaranchal received full antenatal care. Coverage of full antenatal care is low for non-literate women, women with higher parity, Muslim women, women from scheduled castes, women with a low standard of living and for women from those villages where health facilities are not available. Full antenatal coverage was also lower in rural areas (7.6 percent) than in urban areas (19.1 percent). 4.7 Antenatal Care Indicator by District Table 4.7 shows the percentage of women who had given live/still birth during the three years preceding the survey who received different types of antenatal care (the percentage who received antenatal check-up in the first trimester of pregnancy, the percentage who received at least three antenatal check-ups, the percentage who received at least one tetanus toxoid injection, the percentage given 100 or more iron folic acid Tablets/syrup and the percentage who received full antenatal care services) by district.
Table 4.7 ANTENATAL CARE INDICATORS BY DISTRICT Percentage of women* who received different type of antenatal care by district, Uttaranchal, 2002-04
District
Percentage that received an antenatal check-up in the first trimester of pregnancy
Percentage that received three or more antenatal check-ups
Percentage that received at least one tetanus toxoid injection
Percentage that received adequate amount of IFA1
Percentage that received full2
antenatal check-ups
Almora Bageshwar Chamoli Champawat Dehradun Hardwar Nainital Pithoragarh Pauri Garhwal Rudraprayag Tehri Garhwal Udham Singh Nagar Uttarkashi Uttaranchal
20.6 26.1 32.5 31.7 31.1 22.9
35.7 22.3 28.7 18.5 21.2 31.5 11.2
25.9
24.9 26.5 23.6 31.0 35.5 24.1
37.6 25.7 34.8 16.3 22.9 31.7 17.8
28.0
62.1 80.0 74.5 76.8 57.6 70.5
87.5 71.9 79.4 55.0 70.5 80.5 56.2
71.2
11.8 37.8 22.8 24.9 23.6 10.6
30.4 22.8 28.2 19.6 29.7 14.4 21.7
20.0
6.6
15.3 8.6
16.3 15.2
8.1
15.4 11.7 13.7
9.0 11.6
6.6 10.1
10.5
Note: * Women who had their last live/still birth since 1-1-1999/1-1-2001. 1 100 or more iron folic acid Tablets including syrup. 2 At least three visits for antenatal check-ups, at least one TT injection received and adequate amount of IFA.
The utilisation of antenatal care services differs from district to district. Only in the district of Nainital, more than one-third (35.7 percent) of the women received their first antenatal check-up in the first trimester of pregnancy. The percentage of women who received at least three visits for antenatal check-ups ranges from 16.3 percent in Rudraprayag to 37.6
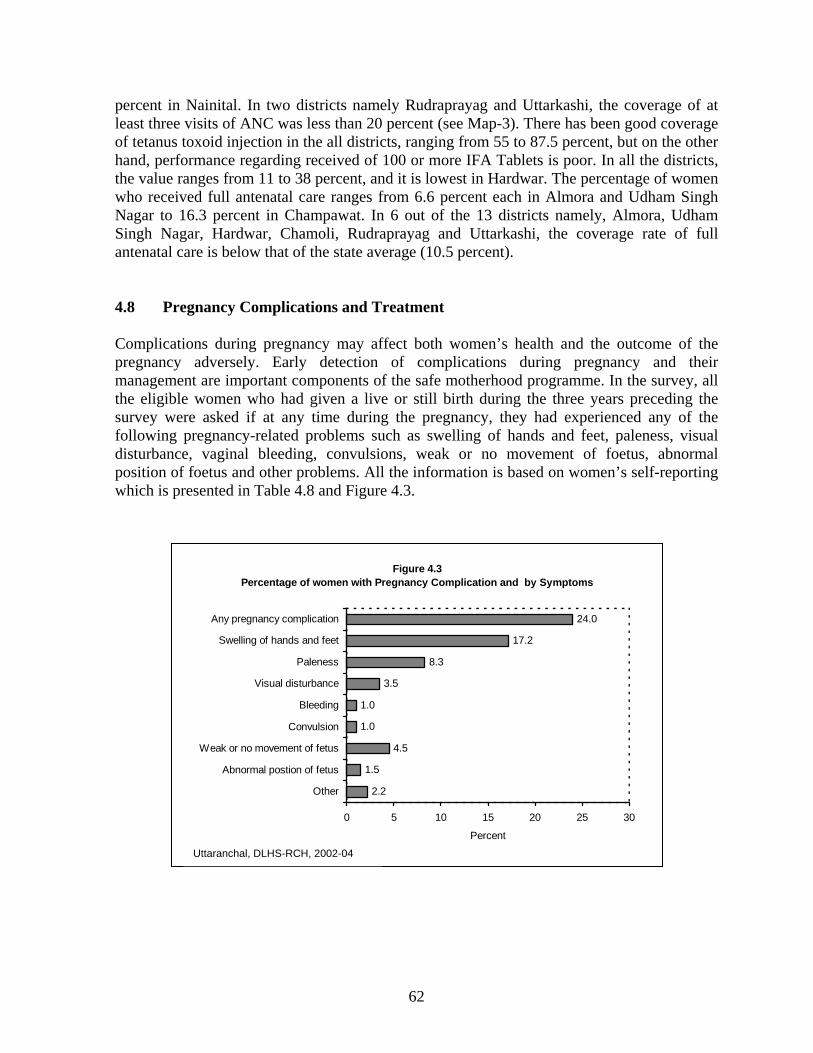
62
percent in Nainital. In two districts namely Rudraprayag and Uttarkashi, the coverage of at least three visits of ANC was less than 20 percent (see Map-3). There has been good coverage of tetanus toxoid injection in the all districts, ranging from 55 to 87.5 percent, but on the other hand, performance regarding received of 100 or more IFA Tablets is poor. In all the districts, the value ranges from 11 to 38 percent, and it is lowest in Hardwar. The percentage of women who received full antenatal care ranges from 6.6 percent each in Almora and Udham Singh Nagar to 16.3 percent in Champawat. In 6 out of the 13 districts namely, Almora, Udham Singh Nagar, Hardwar, Chamoli, Rudraprayag and Uttarkashi, the coverage rate of full antenatal care is below that of the state average (10.5 percent). 4.8 Pregnancy Complications and Treatment Complications during pregnancy may affect both women’s health and the outcome of the pregnancy adversely. Early detection of complications during pregnancy and their management are important components of the safe motherhood programme. In the survey, all the eligible women who had given a live or still birth during the three years preceding the survey were asked if at any time during the pregnancy, they had experienced any of the following pregnancy-related problems such as swelling of hands and feet, paleness, visual disturbance, vaginal bleeding, convulsions, weak or no movement of foetus, abnormal position of foetus and other problems. All the information is based on women’s self-reporting which is presented in Table 4.8 and Figure 4.3.
Figure 4.3 Percentage of women with Pregnancy Complication and by Symptoms
2.2
1.5
4.5
1.0
1.0
3.5
8.3
17.2
24.0
0 5 10 15 20 25 30
Other
Abnormal postion of fetus
Weak or no movement of fetus
Convulsion
Bleeding
Visual disturbance
Paleness
Swelling of hands and feet
Any pregnancy complication
Percent
Uttaranchal, DLHS-RCH, 2002-04
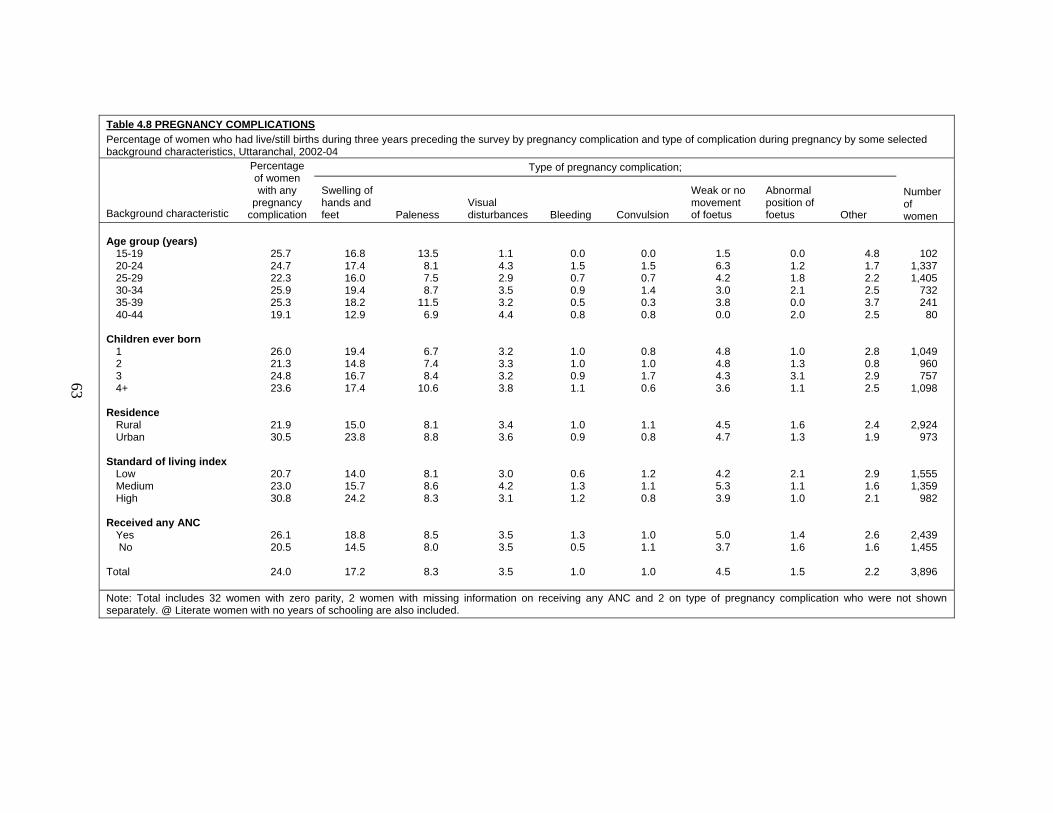
63
Table 4.8 PREGNANCY COMPLICATIONS Percentage of women who had live/still births during three years preceding the survey by pregnancy complication and type of complication during pregnancy by some selected background characteristics, Uttaranchal, 2002-04
Background characteristic
Percentage of women with any
pregnancy complication
Type of pregnancy complication;
Number of women
Swelling of hands and feet Paleness
Visual disturbances Bleeding Convulsion
Weak or no movement of foetus
Abnormal position of foetus Other
Age group (years) 15-19 20-24 25-29 30-34 35-39 40-44 Children ever born 1 2 3 4+ Residence Rural Urban Standard of living index Low Medium High Received any ANC Yes No Total
25.7 24.7 22.3 25.9 25.3 19.1
26.0 21.3 24.8 23.6
21.9 30.5
20.7 23.0 30.8
26.1 20.5
24.0
16.8 17.4 16.0 19.4 18.2 12.9
19.4 14.8 16.7 17.4
15.0 23.8
14.0 15.7 24.2
18.8 14.5
17.2
13.5 8.1 7.5 8.7
11.5 6.9
6.7 7.4 8.4
10.6
8.1 8.8
8.1 8.6 8.3
8.5 8.0
8.3
1.1 4.3 2.9 3.5 3.2 4.4
3.2 3.3 3.2 3.8
3.4 3.6
3.0 4.2 3.1
3.5 3.5
3.5
0.0 1.5 0.7 0.9 0.5 0.8
1.0 1.0 0.9 1.1
1.0 0.9
0.6 1.3 1.2
1.3 0.5
1.0
0.0 1.5 0.7 1.4 0.3 0.8
0.8 1.0 1.7 0.6
1.1 0.8
1.2 1.1 0.8
1.0 1.1
1.0
1.5 6.3 4.2 3.0 3.8 0.0
4.8 4.8 4.3 3.6
4.5 4.7
4.2 5.3 3.9
5.0 3.7
4.5
0.0 1.2 1.8 2.1 0.0 2.0
1.0 1.3 3.1 1.1
1.6 1.3
2.1 1.1 1.0
1.4 1.6
1.5
4.8 1.7 2.2 2.5 3.7 2.5
2.8 0.8 2.9 2.5
2.4 1.9
2.9 1.6 2.1
2.6 1.6
2.2
102 1,337 1,405
732 241
80
1,049 960 757
1,098
2,924 973
1,555 1,359
982
2,439 1,455
3,896
Note: Total includes 32 women with zero parity, 2 women with missing information on receiving any ANC and 2 on type of pregnancy complication who were not shown separately. @ Literate women with no years of schooling are also included.
63
64
About 24 percent of the women experienced at least one pregnancy related problem. The proportion was higher among urban women (30.5 percent) than among rural women (21.9 percent). The proportion of women aged 30 years and above and those with higher parity who have had at least one pregnancy complication is more than the proportion of younger women and women with low parity. This proportion is higher among women who had received some kind of antenatal care during their pregnancy than among those who did not. About 26.1 percent of women who had an antenatal check-up reported that they had experienced at least one problem during their pregnancy while 20.5 percent of women who did not receive any antenatal check-up during their pregnancy fall in this category. The major problems reported were ‘swelling of hands and feet’ (17.2 percent), ‘paleness’ (8.3 percent), and ‘weak or no movement of foetus’ (4.5 percent). Only 3.5 percent reported ‘visual disturbances’, 1.5 percent reported ‘abnormal position of foetus’ and 1 percent each reported ‘vaginal bleeding’ and ‘convulsions’. Other problems related to pregnancy were reported by 2.2 percent of women. Swelling of hands and feet is more common among older women, women with parity-1 and parity-4 and above and women with high a standard of living. The percentage of women who suffered from paleness were more from the age groups of 30-34 years and 40-44 years, more from rural areas, more with a low standard of living and more of those who did not receive any kind of antenatal care during pregnancy. Paleness, visual disturbances and convulsions increased steadily with increase of parity but are negatively associated with standard of living index. The younger women (15-19 years of age) were more likely to report vaginal bleeding and abnormal position of foetus as pregnancy complications. Women who reported at least one pregnancy related complication were asked whether they had consulted someone or had sought treatment for their problem and also the source of treatment. Table 4.9 shows the percentage of women who had pregnancy complications who obtained advice or had sought treatment by source of treatment according to residence and availability of health facility in the village. About 35.7 percent of women reported that they had obtained advice or consulted someone for their problem. The proportion was higher among urban women (43.5 percent) than among rural women (32 percent) and 39.4 percent of women who sought treatment were from those villages where health facilities were available as compared to 29.3 percent of women with non-availability of health facilities within their villages. Among women who sought treatment for pregnancy complications, 37.4 percent visited a government health facility including a primary health centre (5.7 percent) and sub-centre (1.6 percent). More than half of them visited a private health facility and 4.5 percent had gone to a facility with the Indian system of medicine, while another 4.9 percent obtained advice from another health facility. The proportion of women who visited a private health facility is higher in urban areas (62.7 percent) than in rural areas (50.7 percent). Among women who sought treatment, 80.9 percent went to a doctor and 14.9 percent to an auxiliary nurse midwife or nurse or LHV and another 4.1 percent to someone else. A doctor examined 87.3 percent of the women in urban areas and 76.9 percent in rural areas, whereas ANM/Nurse/LHV examined 16.7 percent women in rural areas and 12.1 percent in urban areas.
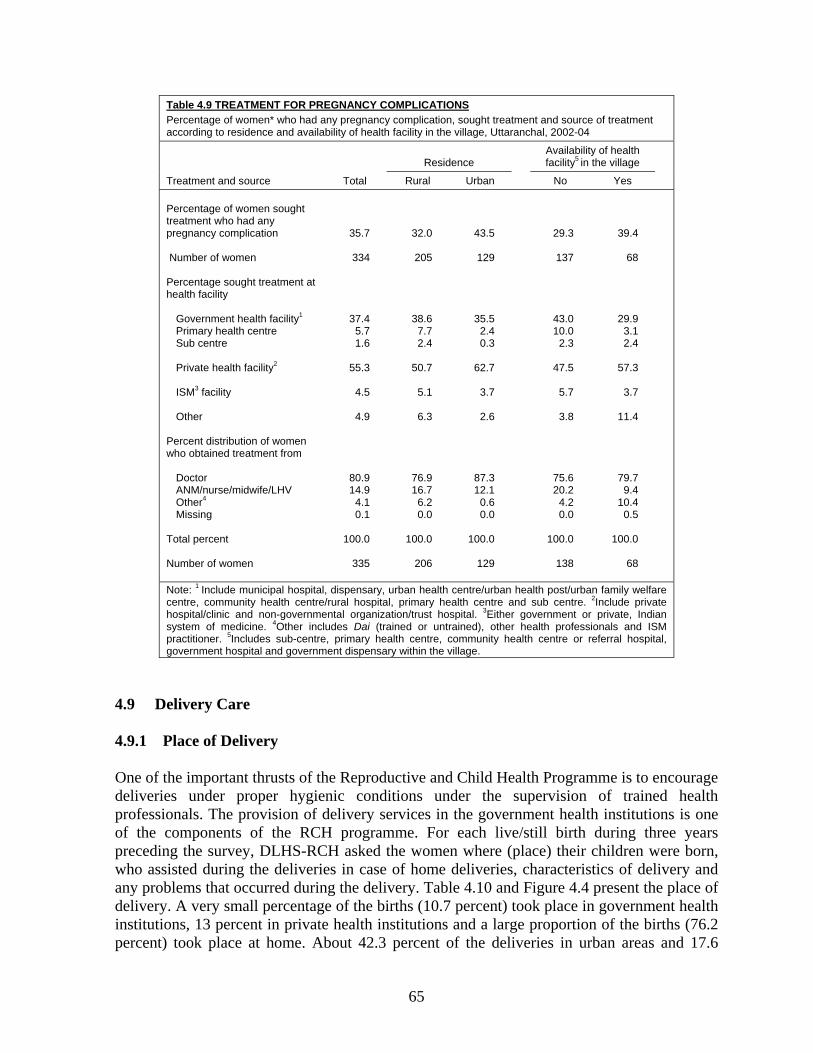
65
Table 4.9 TREATMENT FOR PREGNANCY COMPLICATIONS Percentage of women* who had any pregnancy complication, sought treatment and source of treatment according to residence and availability of health facility in the village, Uttaranchal, 2002-04
Treatment and source Total
Residence Availability of health
facility5 in the village
Rural Urban No Yes
Percentage of women sought treatment who had any pregnancy complication Number of women Percentage sought treatment at health facility Government health facility1 Primary health centre Sub centre Private health facility2 ISM3 facility Other Percent distribution of women who obtained treatment from
Doctor ANM/nurse/midwife/LHV Other4 Missing Total percent Number of women
35.7
334
37.4 5.7 1.6
55.3
4.5
4.9
80.9 14.9
4.1 0.1
100.0
335
32.0
205
38.6 7.7 2.4
50.7
5.1
6.3
76.9 16.7
6.2 0.0
100.0
206
43.5
129
35.5 2.4 0.3
62.7
3.7
2.6
87.3 12.1
0.6 0.0
100.0
129
29.3
137
43.0 10.0
2.3
47.5
5.7
3.8
75.6 20.2
4.2 0.0
100.0
138
39.4
68
29.9 3.1 2.4
57.3
3.7
11.4
79.7 9.4
10.4 0.5
100.0
68
Note: 1 Include municipal hospital, dispensary, urban health centre/urban health post/urban family welfare centre, community health centre/rural hospital, primary health centre and sub centre. 2Include private hospital/clinic and non-governmental organization/trust hospital. 3Either government or private, Indian system of medicine. 4Other includes Dai (trained or untrained), other health professionals and ISM practitioner. 5Includes sub-centre, primary health centre, community health centre or referral hospital, government hospital and government dispensary within the village.
4.9 Delivery Care 4.9.1 Place of Delivery One of the important thrusts of the Reproductive and Child Health Programme is to encourage deliveries under proper hygienic conditions under the supervision of trained health professionals. The provision of delivery services in the government health institutions is one of the components of the RCH programme. For each live/still birth during three years preceding the survey, DLHS-RCH asked the women where (place) their children were born, who assisted during the deliveries in case of home deliveries, characteristics of delivery and any problems that occurred during the delivery. Table 4.10 and Figure 4.4 present the place of delivery. A very small percentage of the births (10.7 percent) took place in government health institutions, 13 percent in private health institutions and a large proportion of the births (76.2 percent) took place at home. About 42.3 percent of the deliveries in urban areas and 17.6
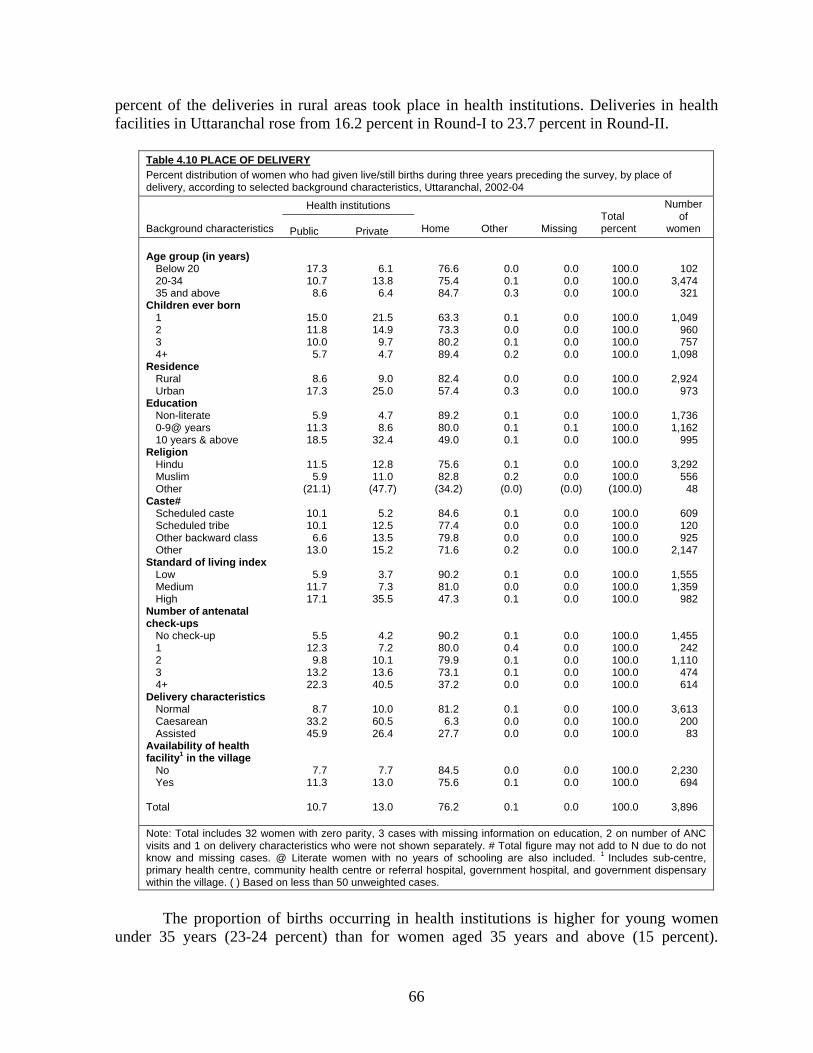
66
percent of the deliveries in rural areas took place in health institutions. Deliveries in health facilities in Uttaranchal rose from 16.2 percent in Round-I to 23.7 percent in Round-II.
Table 4.10 PLACE OF DELIVERY Percent distribution of women who had given live/still births during three years preceding the survey, by place of delivery, according to selected background characteristics, Uttaranchal, 2002-04
Background characteristics
Health institutions
Home Other Missing Total percent
Number of
women Public Private Age group (in years) Below 20 20-34 35 and above Children ever born 1 2 3 4+ Residence Rural Urban Education Non-literate 0-9@ years 10 years & above Religion Hindu Muslim Other Caste# Scheduled caste Scheduled tribe Other backward class Other Standard of living index Low Medium High Number of antenatal check-ups No check-up 1 2 3 4+ Delivery characteristics Normal Caesarean Assisted Availability of health facility1 in the village No Yes Total
17.3 10.7
8.6
15.0 11.8 10.0
5.7
8.6 17.3
5.9
11.3 18.5
11.5
5.9 (21.1)
10.1 10.1
6.6 13.0
5.9
11.7 17.1
5.5 12.3
9.8 13.2 22.3
8.7
33.2 45.9
7.7 11.3
10.7
6.1 13.8
6.4
21.5 14.9
9.7 4.7
9.0
25.0
4.7 8.6
32.4
12.8 11.0
(47.7)
5.2 12.5 13.5 15.2
3.7 7.3
35.5
4.2 7.2
10.1 13.6 40.5
10.0 60.5 26.4
7.7 13.0
13.0
76.6 75.4 84.7
63.3 73.3 80.2 89.4
82.4 57.4
89.2 80.0 49.0
75.6 82.8
(34.2)
84.6 77.4 79.8 71.6
90.2 81.0 47.3
90.2 80.0 79.9 73.1 37.2
81.2
6.3 27.7
84.5 75.6
76.2
0.0 0.1 0.3
0.1 0.0 0.1 0.2
0.0 0.3
0.1 0.1 0.1
0.1 0.2
(0.0)
0.1 0.0 0.0 0.2
0.1 0.0 0.1
0.1 0.4 0.1 0.1 0.0
0.1 0.0 0.0
0.0 0.1
0.1
0.0 0.0 0.0
0.0 0.0 0.0 0.0
0.0 0.0
0.0 0.1 0.0
0.0 0.0
(0.0)
0.0 0.0 0.0 0.0
0.0 0.0 0.0
0.0 0.0 0.0 0.0 0.0
0.0 0.0 0.0
0.0 0.0
0.0
100.0 100.0 100.0
100.0 100.0 100.0 100.0
100.0 100.0
100.0 100.0 100.0
100.0 100.0
(100.0)
100.0 100.0 100.0 100.0
100.0 100.0 100.0
100.0 100.0 100.0 100.0 100.0
100.0 100.0 100.0
100.0 100.0
100.0
102 3,474
321
1,049 960 757
1,098
2,924 973
1,736 1,162
995
3,292 556
48
609 120 925
2,147
1,555 1,359
982
1,455 242
1,110 474 614
3,613
200 83
2,230 694
3,896
Note: Total includes 32 women with zero parity, 3 cases with missing information on education, 2 on number of ANC visits and 1 on delivery characteristics who were not shown separately. # Total figure may not add to N due to do not know and missing cases. @ Literate women with no years of schooling are also included. 1 Includes sub-centre, primary health centre, community health centre or referral hospital, government hospital, and government dispensary within the village. ( ) Based on less than 50 unweighted cases.
The proportion of births occurring in health institutions is higher for young women under 35 years (23-24 percent) than for women aged 35 years and above (15 percent).
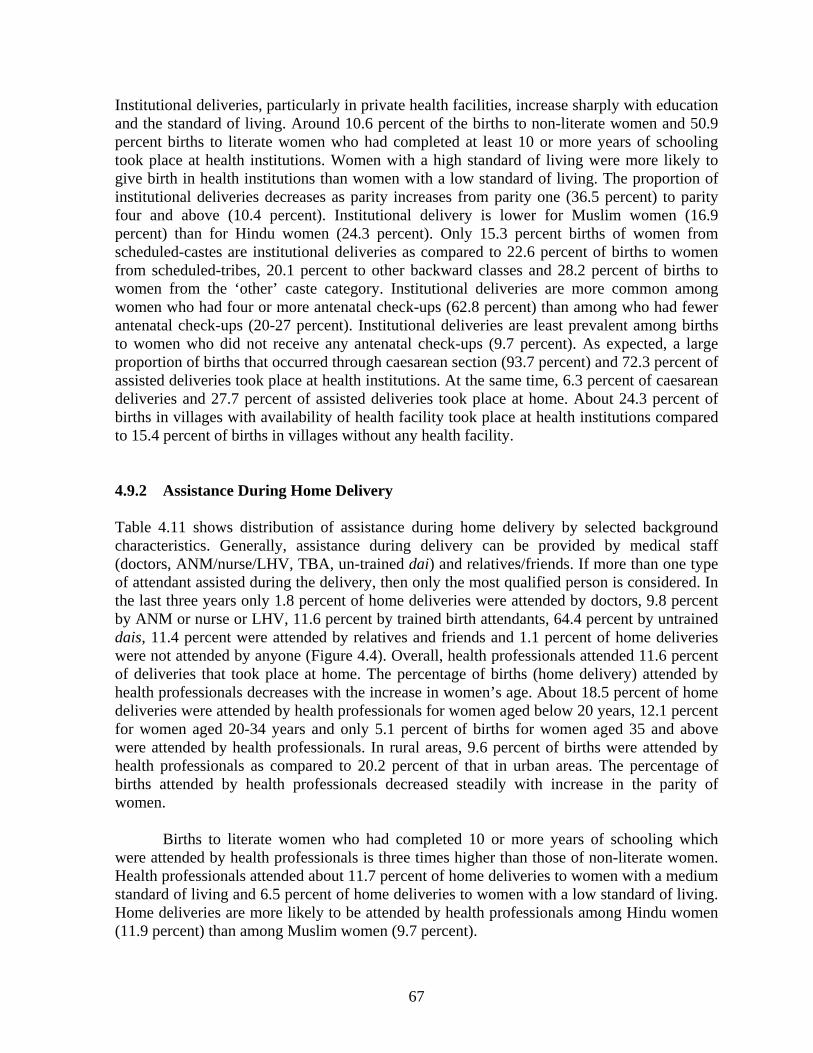
67
Institutional deliveries, particularly in private health facilities, increase sharply with education and the standard of living. Around 10.6 percent of the births to non-literate women and 50.9 percent births to literate women who had completed at least 10 or more years of schooling took place at health institutions. Women with a high standard of living were more likely to give birth in health institutions than women with a low standard of living. The proportion of institutional deliveries decreases as parity increases from parity one (36.5 percent) to parity four and above (10.4 percent). Institutional delivery is lower for Muslim women (16.9 percent) than for Hindu women (24.3 percent). Only 15.3 percent births of women from scheduled-castes are institutional deliveries as compared to 22.6 percent of births to women from scheduled-tribes, 20.1 percent to other backward classes and 28.2 percent of births to women from the ‘other’ caste category. Institutional deliveries are more common among women who had four or more antenatal check-ups (62.8 percent) than among who had fewer antenatal check-ups (20-27 percent). Institutional deliveries are least prevalent among births to women who did not receive any antenatal check-ups (9.7 percent). As expected, a large proportion of births that occurred through caesarean section (93.7 percent) and 72.3 percent of assisted deliveries took place at health institutions. At the same time, 6.3 percent of caesarean deliveries and 27.7 percent of assisted deliveries took place at home. About 24.3 percent of births in villages with availability of health facility took place at health institutions compared to 15.4 percent of births in villages without any health facility. 4.9.2 Assistance During Home Delivery Table 4.11 shows distribution of assistance during home delivery by selected background characteristics. Generally, assistance during delivery can be provided by medical staff (doctors, ANM/nurse/LHV, TBA, un-trained dai) and relatives/friends. If more than one type of attendant assisted during the delivery, then only the most qualified person is considered. In the last three years only 1.8 percent of home deliveries were attended by doctors, 9.8 percent by ANM or nurse or LHV, 11.6 percent by trained birth attendants, 64.4 percent by untrained dais, 11.4 percent were attended by relatives and friends and 1.1 percent of home deliveries were not attended by anyone (Figure 4.4). Overall, health professionals attended 11.6 percent of deliveries that took place at home. The percentage of births (home delivery) attended by health professionals decreases with the increase in women’s age. About 18.5 percent of home deliveries were attended by health professionals for women aged below 20 years, 12.1 percent for women aged 20-34 years and only 5.1 percent of births for women aged 35 and above were attended by health professionals. In rural areas, 9.6 percent of births were attended by health professionals as compared to 20.2 percent of that in urban areas. The percentage of births attended by health professionals decreased steadily with increase in the parity of women.
Births to literate women who had completed 10 or more years of schooling which were attended by health professionals is three times higher than those of non-literate women. Health professionals attended about 11.7 percent of home deliveries to women with a medium standard of living and 6.5 percent of home deliveries to women with a low standard of living. Home deliveries are more likely to be attended by health professionals among Hindu women (11.9 percent) than among Muslim women (9.7 percent).
68
Table 4.11 ASSISTANCE DURING HOME DELIVERY AND SAFE DELIVERY Percent distribution of women who had given live/still births during three years preceding the survey, by assistance during home delivery, and percentage of safe delivery, according to selected background characteristics, Uttaranchal, 2002-04
Background characteristics
Attendant assisting during home delivery1 Number
of women
Percentage of safe2 delivery Doctor
ANM/ Nurse/ LHV TBA
Un-trained
dai Relative/ friends None
Age group (in years) Below 20 20-34 35 and above Children ever born 1 2 3 4+ Residence Rural Urban Education Non-literate 0-9@ years 10 years & above Religion Hindu Muslim Other Caste# Scheduled caste Scheduled tribe Other backward class Other Standard of living index Low Medium High Number of antenatal check-ups No check-up 1 2 3 4+ Delivery characteristics Normal Caesarean Assisted Availability of health facility3 in the village No Yes Total
0.0 2.0 0.8
3.0 2.3 1.5 0.9
1.8 1.7
2.1 1.0 2.4
1.9 1.3 *
2.1 0.0 2.8 1.4
1.6 1.8 2.4
1.1 2.8 1.7 2.1 5.1
1.2 * *
1.7 2.1
1.8
18.5 10.1 4.3
15.2 14.6 6.8 4.6
7.8
18.5
4.9 11.4 22.5
10.0 8.4 *
5.3 4.8
11.7 10.8
4.9 9.9
24.6
3.6 10.0 13.8 16.1 20.5
9.5 * *
7.1 10.4
9.8
5.9 11.7 9.6
11.9 12.6 9.3
11.4
10.3 16.1
9.1
13.1 15.2
10.8 14.2
*
7.7 13.4 14.4 10.9
7.0
13.1 20.4
8.3 11.2 10.5 16.6 24.6
11.5
* *
10.0 11.2
11.6
63.8 63.4 74.7
57.8 56.9 69.0 71.4
65.4 60.4
73.3 56.9 50.5
62.5 75.1
*
74.0 76.5 64.4 60.1
66.9 67.5 49.8
74.1 67.7 58.3 54.1 45.8
65.0
* *
64.7 67.8
64.4
11.8 11.5 10.5
10.8 13.0 11.3 10.5
13.3 3.2
9.1
16.7 8.6
13.3 0.9 *
9.6 5.3 5.3
15.7
17.5 7.3 2.6
12.5 8.2
13.2 9.8 3.2
11.5
* *
14.7 8.3
11.4
0.0 1.3 0.2
0.8 0.6 2.0 1.2
1.4 0.1
1.5 0.9 0.4
1.3 0.1 *
1.4 0.0 1.4 1.0
2.0 0.5 0.1
0.5 0.2 2.5 1.3 0.0
1.1 * *
1.7 0.2
1.1
78 2,619
272
665 704 607 982
2,410
559
1,549 929 488
2,490
461 18
515
93 738
1,538
1,403 1,101
464
1,312 194 886 346 228
2,933
13 23
1,885 524
2,968
37.6 33.6 19.4
48.2 39.0 26.4 15.3
25.4 53.9
16.9 29.7 63.2
33.3 25.0 73.7
21.6 26.3 31.7 36.9
15.4 28.4 65.4
13.9 29.7 32.4 40.1 72.3
27.4 97.9 98.3
22.9 33.7
32.5
Note: Total includes 11 women with zero parity, 2 with missing information on education and 1 on number of ANC visits who were not shown separately. @ Literate women with no years of schooling are also included. # Total figure may not add to N due to do not know and missing cases. 1 If the respondent mentioned more than one attendant, only the most qualified attendant is shown. 2 Either institutional delivery or home delivery assisted by doctor/ANM/Nurse/LHV. 3 Includes sub-centre, primary health centre, community health centre or referral hospital, government hospital, and government dispensary within the village. ( ) Based on less than 50 unweighted cases. *: Percentage not shown due to very few cases.
Only 7.4 percent of home deliveries to women from scheduled castes, 4.8 percent to
scheduled tribes, 14.5 percent to other backward classes and 12.2 percent to women belonging
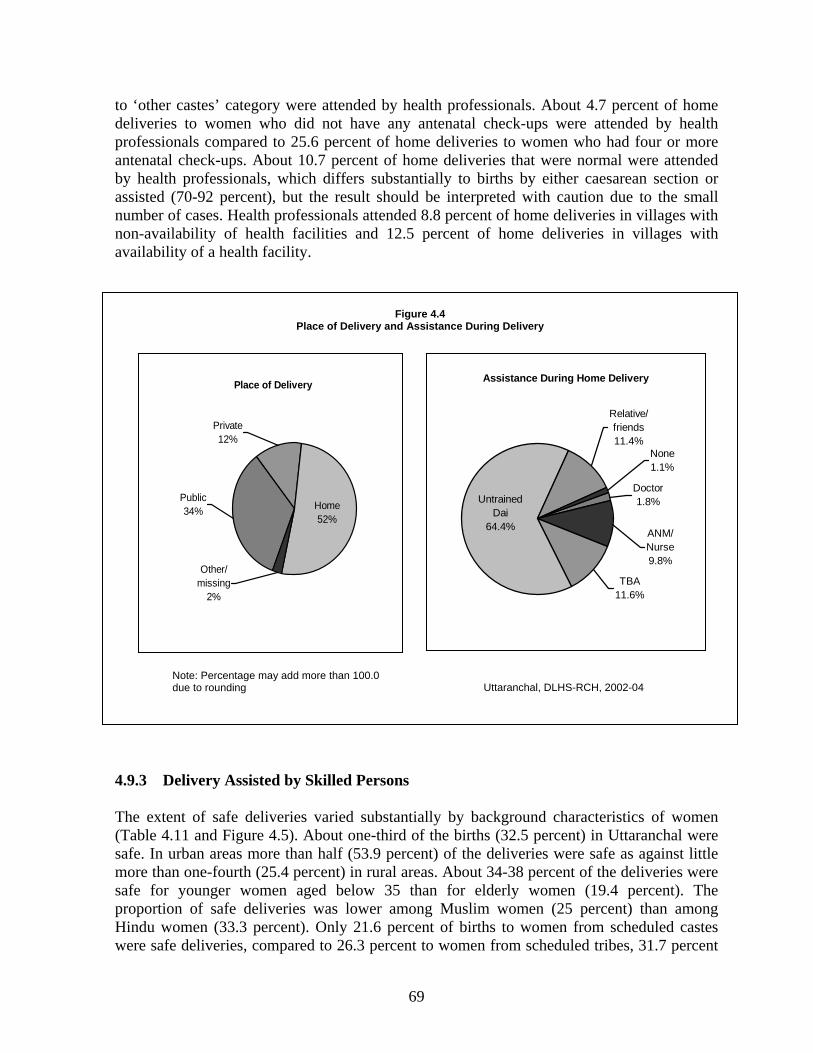
69
to ‘other castes’ category were attended by health professionals. About 4.7 percent of home deliveries to women who did not have any antenatal check-ups were attended by health professionals compared to 25.6 percent of home deliveries to women who had four or more antenatal check-ups. About 10.7 percent of home deliveries that were normal were attended by health professionals, which differs substantially to births by either caesarean section or assisted (70-92 percent), but the result should be interpreted with caution due to the small number of cases. Health professionals attended 8.8 percent of home deliveries in villages with non-availability of health facilities and 12.5 percent of home deliveries in villages with availability of a health facility.
4.9.3 Delivery Assisted by Skilled Persons The extent of safe deliveries varied substantially by background characteristics of women (Table 4.11 and Figure 4.5). About one-third of the births (32.5 percent) in Uttaranchal were safe. In urban areas more than half (53.9 percent) of the deliveries were safe as against little more than one-fourth (25.4 percent) in rural areas. About 34-38 percent of the deliveries were safe for younger women aged below 35 than for elderly women (19.4 percent). The proportion of safe deliveries was lower among Muslim women (25 percent) than among Hindu women (33.3 percent). Only 21.6 percent of births to women from scheduled castes were safe deliveries, compared to 26.3 percent to women from scheduled tribes, 31.7 percent
Place of Delivery
Other/ missing
2%
Private12%
Public34% Home
52%
Assistance During Home Delivery
Doctor1.8%
ANM/Nurse9.8%
TBA11.6%
None1.1%
Relative/friends11.4%
Untrained Dai
64.4%
Figure 4.4 Place of Delivery and Assistance During Delivery
Uttaranchal, DLHS-RCH, 2002-04 Note: Percentage may add more than 100.0 due to rounding
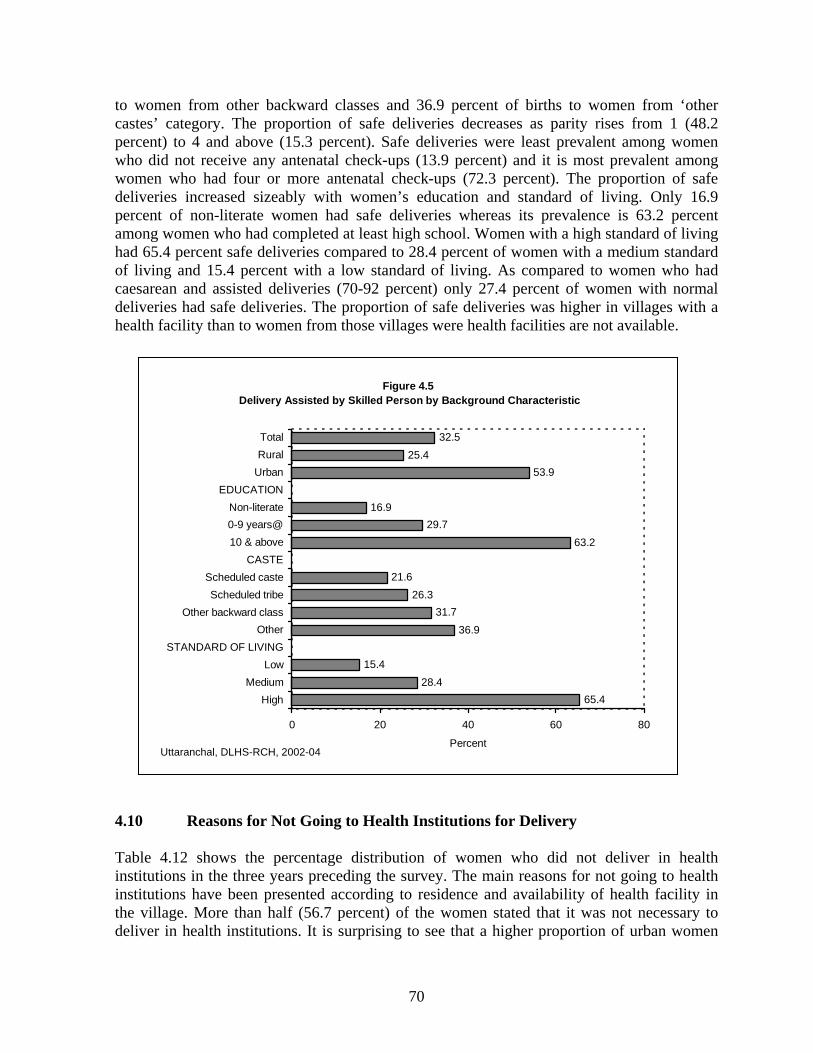
70
to women from other backward classes and 36.9 percent of births to women from ‘other castes’ category. The proportion of safe deliveries decreases as parity rises from 1 (48.2 percent) to 4 and above (15.3 percent). Safe deliveries were least prevalent among women who did not receive any antenatal check-ups (13.9 percent) and it is most prevalent among women who had four or more antenatal check-ups (72.3 percent). The proportion of safe deliveries increased sizeably with women’s education and standard of living. Only 16.9 percent of non-literate women had safe deliveries whereas its prevalence is 63.2 percent among women who had completed at least high school. Women with a high standard of living had 65.4 percent safe deliveries compared to 28.4 percent of women with a medium standard of living and 15.4 percent with a low standard of living. As compared to women who had caesarean and assisted deliveries (70-92 percent) only 27.4 percent of women with normal deliveries had safe deliveries. The proportion of safe deliveries was higher in villages with a health facility than to women from those villages were health facilities are not available. 4.10 Reasons for Not Going to Health Institutions for Delivery Table 4.12 shows the percentage distribution of women who did not deliver in health institutions in the three years preceding the survey. The main reasons for not going to health institutions have been presented according to residence and availability of health facility in the village. More than half (56.7 percent) of the women stated that it was not necessary to deliver in health institutions. It is surprising to see that a higher proportion of urban women
Figure 4.5 Delivery Assisted by Skilled Person by Background Characteristic
65.428.4
15.4
36.931.7
26.321.6
63.229.7
16.9
53.925.4
32.5
0 20 40 60 80
HighMedium
LowSTANDARD OF LIVING
OtherOther backward class
Scheduled tribeScheduled caste
CASTE10 & above0-9 years@Non-literate
EDUCATIONUrbanRuralTotal
PercentUttaranchal, DLHS-RCH, 2002-04
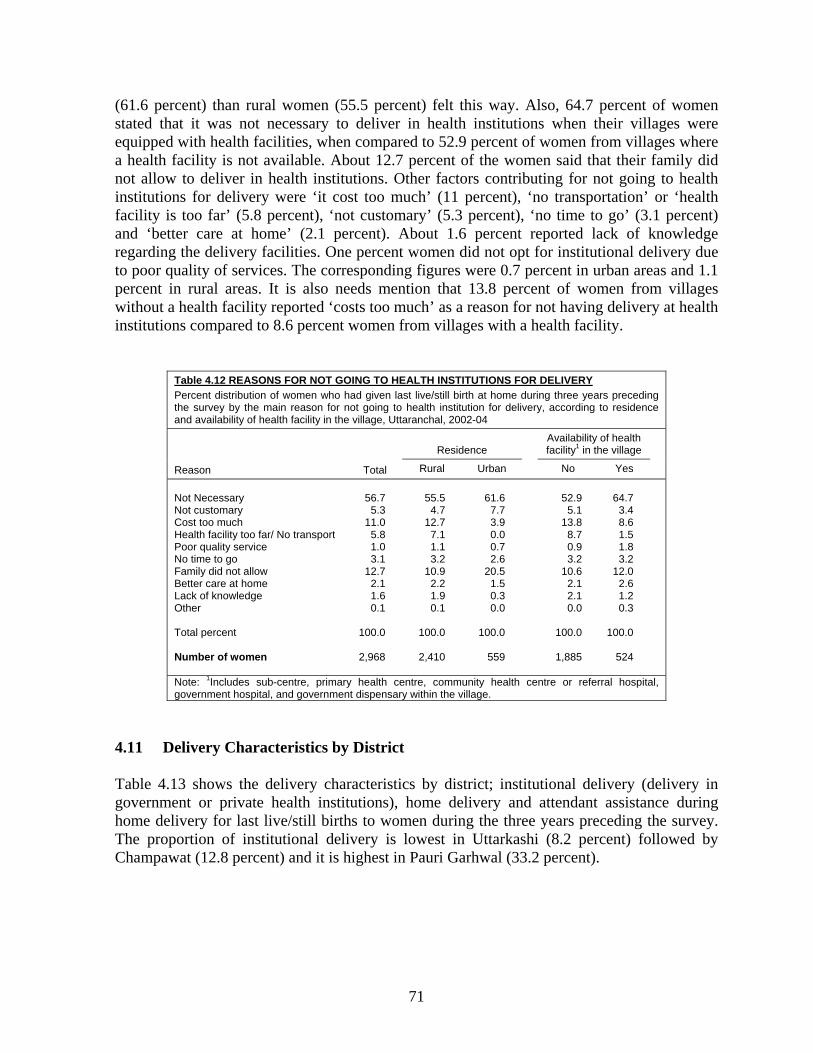
71
(61.6 percent) than rural women (55.5 percent) felt this way. Also, 64.7 percent of women stated that it was not necessary to deliver in health institutions when their villages were equipped with health facilities, when compared to 52.9 percent of women from villages where a health facility is not available. About 12.7 percent of the women said that their family did not allow to deliver in health institutions. Other factors contributing for not going to health institutions for delivery were ‘it cost too much’ (11 percent), ‘no transportation’ or ‘health facility is too far’ (5.8 percent), ‘not customary’ (5.3 percent), ‘no time to go’ (3.1 percent) and ‘better care at home’ (2.1 percent). About 1.6 percent reported lack of knowledge regarding the delivery facilities. One percent women did not opt for institutional delivery due to poor quality of services. The corresponding figures were 0.7 percent in urban areas and 1.1 percent in rural areas. It is also needs mention that 13.8 percent of women from villages without a health facility reported ‘costs too much’ as a reason for not having delivery at health institutions compared to 8.6 percent women from villages with a health facility.
Table 4.12 REASONS FOR NOT GOING TO HEALTH INSTITUTIONS FOR DELIVERY Percent distribution of women who had given last live/still birth at home during three years preceding the survey by the main reason for not going to health institution for delivery, according to residence and availability of health facility in the village, Uttaranchal, 2002-04
Reason
Total
Residence Availability of health facility1 in the village
Rural Urban No Yes Not Necessary Not customary Cost too much Health facility too far/ No transport Poor quality service No time to go Family did not allow Better care at home Lack of knowledge Other Total percent Number of women
56.7
5.3 11.0
5.8 1.0 3.1
12.7 2.1 1.6 0.1
100.0
2,968
55.5
4.7 12.7
7.1 1.1 3.2
10.9 2.2 1.9 0.1
100.0
2,410
61.6
7.7 3.9 0.0 0.7 2.6
20.5 1.5 0.3 0.0
100.0
559
52.9
5.1 13.8
8.7 0.9 3.2
10.6 2.1 2.1 0.0
100.0
1,885
64.7
3.4 8.6 1.5 1.8 3.2
12.0 2.6 1.2 0.3
100.0
524
Note: 1Includes sub-centre, primary health centre, community health centre or referral hospital, government hospital, and government dispensary within the village.
4.11 Delivery Characteristics by District Table 4.13 shows the delivery characteristics by district; institutional delivery (delivery in government or private health institutions), home delivery and attendant assistance during home delivery for last live/still births to women during the three years preceding the survey. The proportion of institutional delivery is lowest in Uttarkashi (8.2 percent) followed by Champawat (12.8 percent) and it is highest in Pauri Garhwal (33.2 percent).
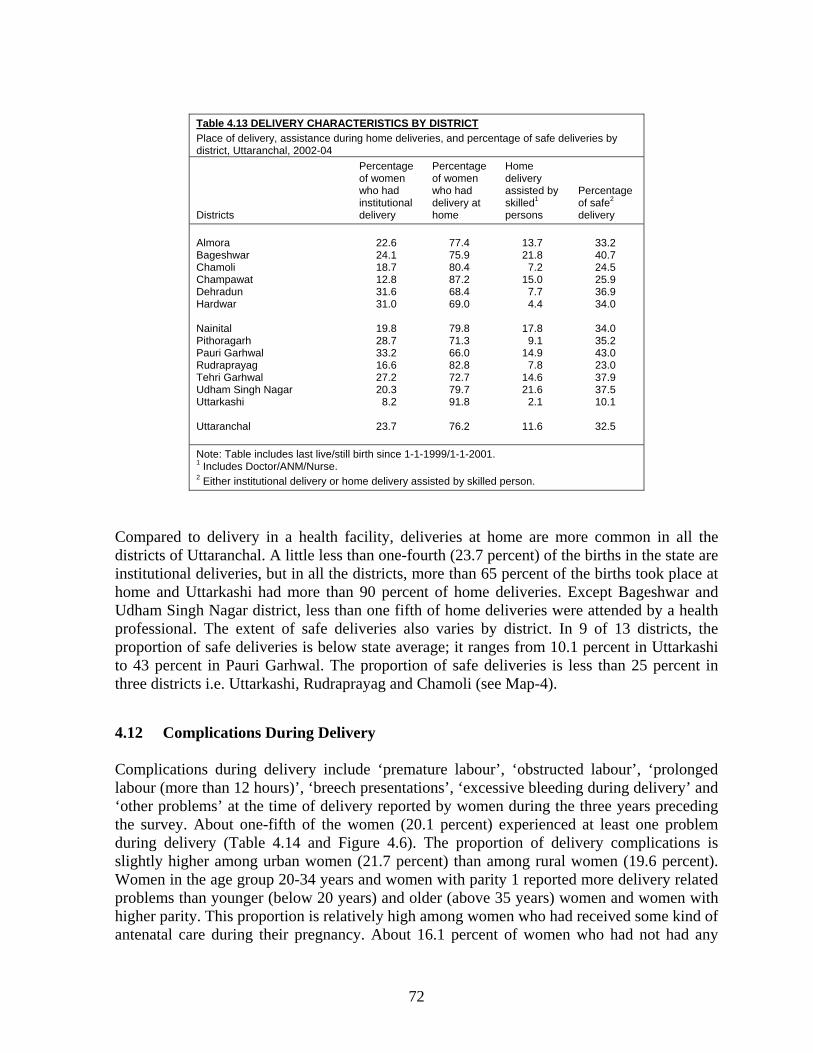
72
Table 4.13 DELIVERY CHARACTERISTICS BY DISTRICT Place of delivery, assistance during home deliveries, and percentage of safe deliveries by district, Uttaranchal, 2002-04
Districts
Percentage of women who had institutional delivery
Percentage of women who had delivery at home
Home delivery assisted by skilled1 persons
Percentage of safe2 delivery
Almora Bageshwar Chamoli Champawat Dehradun Hardwar Nainital Pithoragarh Pauri Garhwal Rudraprayag Tehri Garhwal Udham Singh Nagar Uttarkashi Uttaranchal
22.6 24.1 18.7 12.8 31.6 31.0
19.8 28.7 33.2 16.6 27.2 20.3
8.2
23.7
77.4 75.9 80.4 87.2 68.4 69.0
79.8 71.3 66.0 82.8 72.7 79.7 91.8
76.2
13.7 21.8
7.2 15.0
7.7 4.4
17.8
9.1 14.9
7.8 14.6 21.6
2.1
11.6
33.2 40.7 24.5 25.9 36.9 34.0
34.0 35.2 43.0 23.0 37.9 37.5 10.1
32.5
Note: Table includes last live/still birth since 1-1-1999/1-1-2001. 1 Includes Doctor/ANM/Nurse. 2 Either institutional delivery or home delivery assisted by skilled person.
Compared to delivery in a health facility, deliveries at home are more common in all the districts of Uttaranchal. A little less than one-fourth (23.7 percent) of the births in the state are institutional deliveries, but in all the districts, more than 65 percent of the births took place at home and Uttarkashi had more than 90 percent of home deliveries. Except Bageshwar and Udham Singh Nagar district, less than one fifth of home deliveries were attended by a health professional. The extent of safe deliveries also varies by district. In 9 of 13 districts, the proportion of safe deliveries is below state average; it ranges from 10.1 percent in Uttarkashi to 43 percent in Pauri Garhwal. The proportion of safe deliveries is less than 25 percent in three districts i.e. Uttarkashi, Rudraprayag and Chamoli (see Map-4). 4.12 Complications During Delivery Complications during delivery include ‘premature labour’, ‘obstructed labour’, ‘prolonged labour (more than 12 hours)’, ‘breech presentations’, ‘excessive bleeding during delivery’ and ‘other problems’ at the time of delivery reported by women during the three years preceding the survey. About one-fifth of the women (20.1 percent) experienced at least one problem during delivery (Table 4.14 and Figure 4.6). The proportion of delivery complications is slightly higher among urban women (21.7 percent) than among rural women (19.6 percent). Women in the age group 20-34 years and women with parity 1 reported more delivery related problems than younger (below 20 years) and older (above 35 years) women and women with higher parity. This proportion is relatively high among women who had received some kind of antenatal care during their pregnancy. About 16.1 percent of women who had not had any
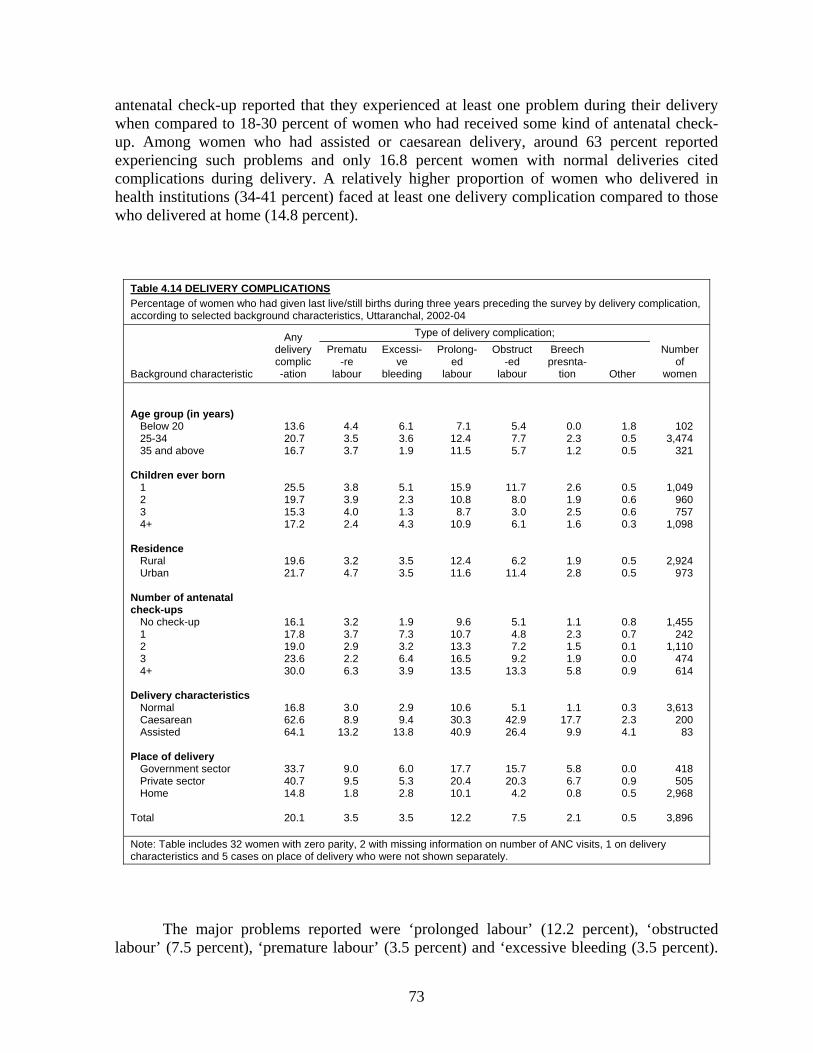
73
antenatal check-up reported that they experienced at least one problem during their delivery when compared to 18-30 percent of women who had received some kind of antenatal check-up. Among women who had assisted or caesarean delivery, around 63 percent reported experiencing such problems and only 16.8 percent women with normal deliveries cited complications during delivery. A relatively higher proportion of women who delivered in health institutions (34-41 percent) faced at least one delivery complication compared to those who delivered at home (14.8 percent).
Table 4.14 DELIVERY COMPLICATIONS Percentage of women who had given last live/still births during three years preceding the survey by delivery complication, according to selected background characteristics, Uttaranchal, 2002-04
Background characteristic
Any delivery complic-ation
Type of delivery complication; Number
of women
Prematu-re
labour
Excessi-ve
bleeding
Prolong-ed
labour
Obstruct-ed
labour
Breech presnta-
tion Other Age group (in years) Below 20 25-34 35 and above Children ever born 1 2 3 4+ Residence Rural Urban Number of antenatal check-ups No check-up 1 2 3 4+ Delivery characteristics Normal Caesarean Assisted Place of delivery Government sector Private sector Home Total
13.6 20.7 16.7
25.5 19.7 15.3 17.2
19.6 21.7
16.1 17.8 19.0 23.6 30.0
16.8 62.6 64.1
33.7 40.7 14.8
20.1
4.4 3.5 3.7
3.8 3.9 4.0 2.4
3.2 4.7
3.2 3.7 2.9 2.2 6.3
3.0 8.9
13.2
9.0 9.5 1.8
3.5
6.1 3.6 1.9
5.1 2.3 1.3 4.3
3.5 3.5
1.9 7.3 3.2 6.4 3.9
2.9 9.4
13.8
6.0 5.3 2.8
3.5
7.1 12.4 11.5
15.9 10.8
8.7 10.9
12.4 11.6
9.6 10.7 13.3 16.5 13.5
10.6 30.3 40.9
17.7 20.4 10.1
12.2
5.4 7.7 5.7
11.7 8.0 3.0 6.1
6.2 11.4
5.1 4.8 7.2 9.2
13.3
5.1 42.9 26.4
15.7 20.3
4.2
7.5
0.0 2.3 1.2
2.6 1.9 2.5 1.6
1.9 2.8
1.1 2.3 1.5 1.9 5.8
1.1 17.7
9.9
5.8 6.7 0.8
2.1
1.8 0.5 0.5
0.5 0.6 0.6 0.3
0.5 0.5
0.8 0.7 0.1 0.0 0.9
0.3 2.3 4.1
0.0 0.9 0.5
0.5
102 3,474
321
1,049 960 757
1,098
2,924 973
1,455 242
1,110 474 614
3,613 200
83
418 505
2,968
3,896
Note: Table includes 32 women with zero parity, 2 with missing information on number of ANC visits, 1 on delivery characteristics and 5 cases on place of delivery who were not shown separately.
The major problems reported were ‘prolonged labour’ (12.2 percent), ‘obstructed labour’ (7.5 percent), ‘premature labour’ (3.5 percent) and ‘excessive bleeding (3.5 percent).
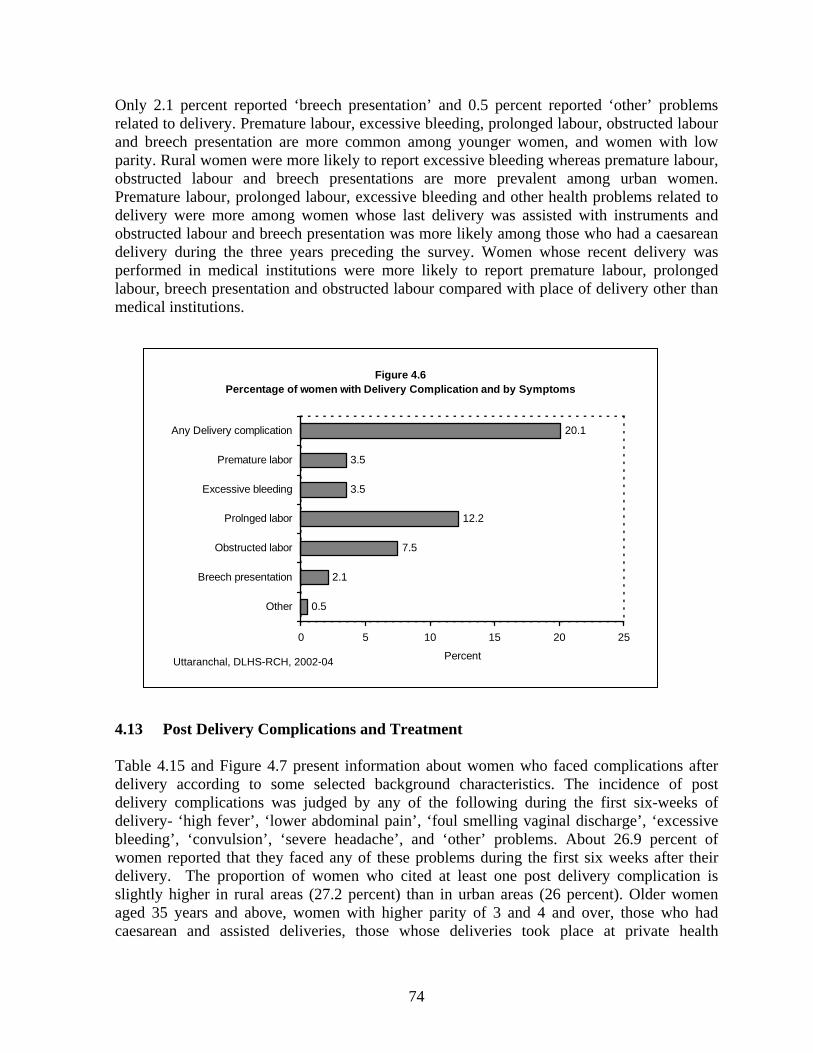
74
Only 2.1 percent reported ‘breech presentation’ and 0.5 percent reported ‘other’ problems related to delivery. Premature labour, excessive bleeding, prolonged labour, obstructed labour and breech presentation are more common among younger women, and women with low parity. Rural women were more likely to report excessive bleeding whereas premature labour, obstructed labour and breech presentations are more prevalent among urban women. Premature labour, prolonged labour, excessive bleeding and other health problems related to delivery were more among women whose last delivery was assisted with instruments and obstructed labour and breech presentation was more likely among those who had a caesarean delivery during the three years preceding the survey. Women whose recent delivery was performed in medical institutions were more likely to report premature labour, prolonged labour, breech presentation and obstructed labour compared with place of delivery other than medical institutions. 4.13 Post Delivery Complications and Treatment Table 4.15 and Figure 4.7 present information about women who faced complications after delivery according to some selected background characteristics. The incidence of post delivery complications was judged by any of the following during the first six-weeks of delivery- ‘high fever’, ‘lower abdominal pain’, ‘foul smelling vaginal discharge’, ‘excessive bleeding’, ‘convulsion’, ‘severe headache’, and ‘other’ problems. About 26.9 percent of women reported that they faced any of these problems during the first six weeks after their delivery. The proportion of women who cited at least one post delivery complication is slightly higher in rural areas (27.2 percent) than in urban areas (26 percent). Older women aged 35 years and above, women with higher parity of 3 and 4 and over, those who had caesarean and assisted deliveries, those whose deliveries took place at private health
Figure 4.6 Percentage of women with Delivery Complication and by Symptoms
0.5
2.1
7.5
12.2
3.5
3.5
20.1
0 5 10 15 20 25
Other
Breech presentation
Obstructed labor
Prolnged labor
Excessive bleeding
Premature labor
Any Delivery complication
PercentUttaranchal, DLHS-RCH, 2002-04
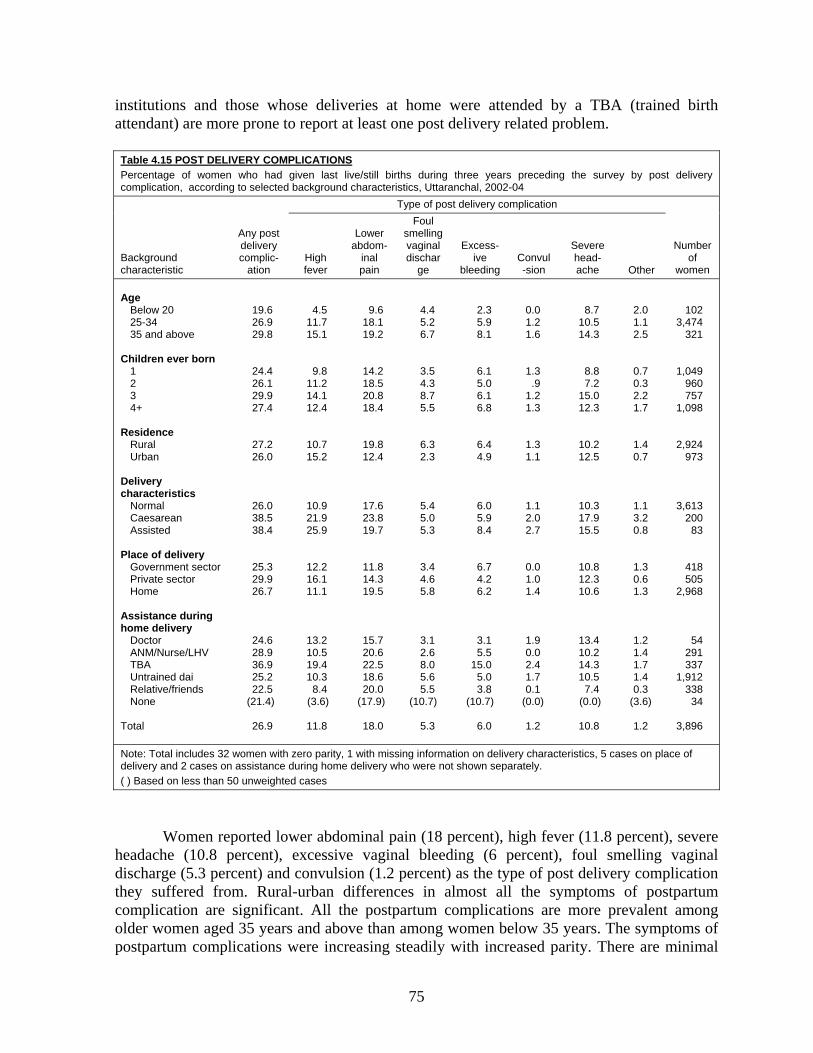
75
institutions and those whose deliveries at home were attended by a TBA (trained birth attendant) are more prone to report at least one post delivery related problem. Table 4.15 POST DELIVERY COMPLICATIONS Percentage of women who had given last live/still births during three years preceding the survey by post delivery complication, according to selected background characteristics, Uttaranchal, 2002-04
Background characteristic
Any post delivery complic-
ation
Type of post delivery complication
Number of
women High fever
Lower abdom-
inal pain
Foul smelling vaginal dischar
ge
Excess-ive
bleeding Convul-sion
Severe head-ache Other
Age Below 20 25-34 35 and above Children ever born 1 2 3 4+ Residence Rural Urban Delivery characteristics Normal Caesarean Assisted Place of delivery Government sector Private sector Home
Assistance during home delivery Doctor ANM/Nurse/LHV TBA Untrained dai Relative/friends None Total
19.6 26.9 29.8
24.4 26.1 29.9 27.4
27.2 26.0
26.0 38.5 38.4
25.3 29.9 26.7
24.6 28.9 36.9 25.2 22.5
(21.4)
26.9
4.5 11.7 15.1
9.8 11.2 14.1 12.4
10.7 15.2
10.9 21.9 25.9
12.2 16.1 11.1
13.2 10.5 19.4 10.3
8.4 (3.6)
11.8
9.6 18.1 19.2
14.2 18.5 20.8 18.4
19.8 12.4
17.6 23.8 19.7
11.8 14.3 19.5
15.7 20.6 22.5 18.6 20.0
(17.9)
18.0
4.4 5.2 6.7
3.5 4.3 8.7 5.5
6.3 2.3
5.4 5.0 5.3
3.4 4.6 5.8
3.1 2.6 8.0 5.6 5.5
(10.7)
5.3
2.3 5.9 8.1
6.1 5.0 6.1 6.8
6.4 4.9
6.0 5.9 8.4
6.7 4.2 6.2
3.1 5.5
15.0 5.0 3.8
(10.7)
6.0
0.0 1.2 1.6
1.3 .9
1.2 1.3
1.3 1.1
1.1 2.0 2.7
0.0 1.0 1.4
1.9 0.0 2.4 1.7 0.1
(0.0)
1.2
8.7 10.5 14.3
8.8 7.2
15.0 12.3
10.2 12.5
10.3 17.9 15.5
10.8 12.3 10.6
13.4 10.2 14.3 10.5
7.4 (0.0)
10.8
2.0 1.1 2.5
0.7 0.3 2.2 1.7
1.4 0.7
1.1 3.2 0.8
1.3 0.6 1.3
1.2 1.4 1.7 1.4 0.3
(3.6)
1.2
102 3,474
321
1,049 960 757
1,098
2,924 973
3,613 200
83
418 505
2,968
54 291 337
1,912 338
34
3,896
Note: Total includes 32 women with zero parity, 1 with missing information on delivery characteristics, 5 cases on place of delivery and 2 cases on assistance during home delivery who were not shown separately. ( ) Based on less than 50 unweighted cases
Women reported lower abdominal pain (18 percent), high fever (11.8 percent), severe headache (10.8 percent), excessive vaginal bleeding (6 percent), foul smelling vaginal discharge (5.3 percent) and convulsion (1.2 percent) as the type of post delivery complication they suffered from. Rural-urban differences in almost all the symptoms of postpartum complication are significant. All the postpartum complications are more prevalent among older women aged 35 years and above than among women below 35 years. The symptoms of postpartum complications were increasing steadily with increased parity. There are minimal

76
differences in the likelihood of having different symptoms in the postpartum period by place of delivery except for lower abdominal pain, which is prevalent more in home deliveries than in institutional deliveries. Women who had the last delivery at home and were not assisted by anyone were more likely to have lower abdominal pain, convulsions, foul smelling vaginal discharge and other postpartum problems during the first six weeks of delivery. Symptoms like high fever and severe headache are more common for women who delivered at home assisted by a doctor than for women whose home deliveries were assisted by a ANM/nurse/LHV, untrained dai, or relatives or friends.
Women who reported at least one complication during the postpartum period were asked whether they had consulted or sought treatment for their problems and also the source of treatment. Table 4.16 shows the percentage of women who had post delivery complications and who sought treatment by source of treatment according to residence and availability of health facility in the village. About 43.9 percent of women reported that they had obtained advice or had consulted someone for their problems. The proportion was higher among urban women (63.1 percent) than among rural women (37.8 percent) and 54.3 percent women sought treatment from those villages where health facility was available as compared to 33.7 percent women who did not have a health facility within their village.
Figure 4.7 Percentage of women with Post Delivery Complication
and by Symptoms
1.2
10.8
1.2
6.0
5.3
18.0
11.8
26.9
0 5 10 15 20 25 30
Other
Severe headache
Convulsion
Excessive bleeding
Foul smelling vaginal discharge
Lower abdominal pain
High fever
Any Post Delivery complication
PercentUttaranchal, DLHS-RCH, 2002-04
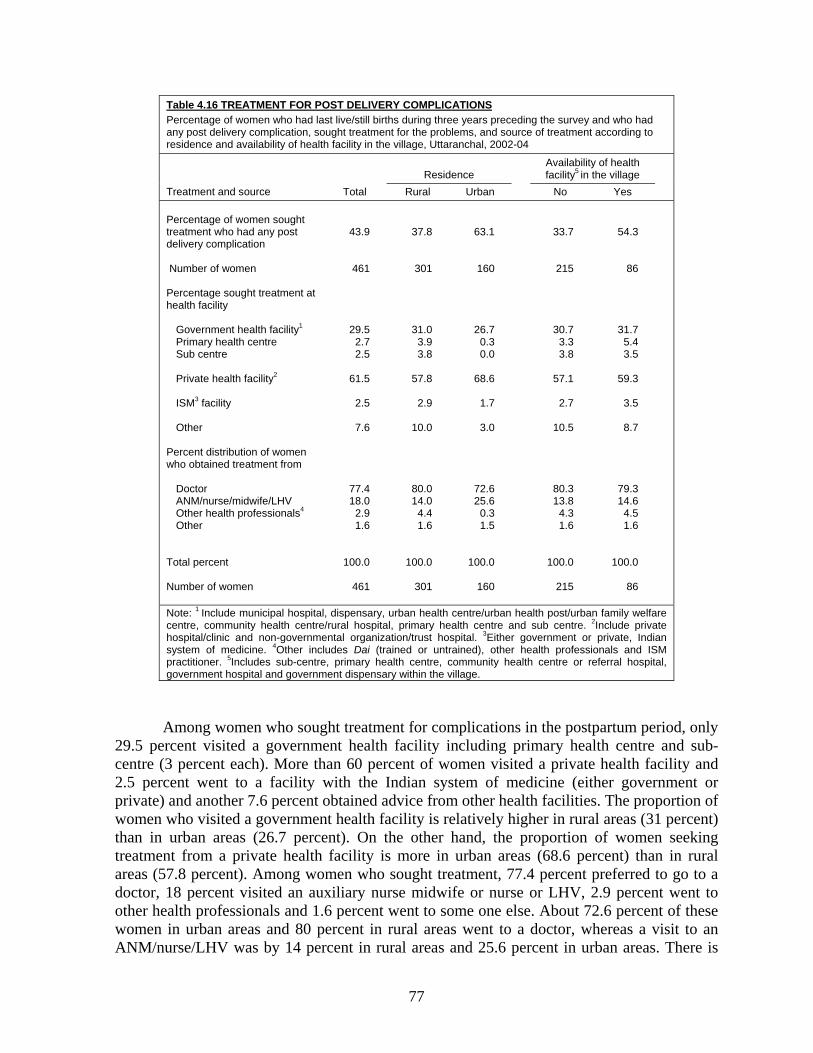
77
Table 4.16 TREATMENT FOR POST DELIVERY COMPLICATIONS Percentage of women who had last live/still births during three years preceding the survey and who had any post delivery complication, sought treatment for the problems, and source of treatment according to residence and availability of health facility in the village, Uttaranchal, 2002-04
Treatment and source Total Residence
Availability of health facility5 in the village
Rural Urban No Yes Percentage of women sought treatment who had any post delivery complication Number of women Percentage sought treatment at health facility Government health facility1 Primary health centre Sub centre Private health facility2 ISM3 facility Other Percent distribution of women who obtained treatment from
Doctor ANM/nurse/midwife/LHV Other health professionals4 Other Total percent Number of women
43.9
461
29.5 2.7 2.5
61.5
2.5
7.6
77.4 18.0
2.9 1.6
100.0
461
37.8
301
31.0 3.9 3.8
57.8
2.9
10.0
80.0 14.0
4.4 1.6
100.0
301
63.1
160
26.7 0.3 0.0
68.6
1.7
3.0
72.6 25.6
0.3 1.5
100.0
160
33.7
215
30.7 3.3 3.8
57.1
2.7
10.5
80.3 13.8
4.3 1.6
100.0
215
54.3
86
31.7 5.4 3.5
59.3
3.5
8.7
79.3 14.6
4.5 1.6
100.0
86
Note: 1 Include municipal hospital, dispensary, urban health centre/urban health post/urban family welfare centre, community health centre/rural hospital, primary health centre and sub centre. 2Include private hospital/clinic and non-governmental organization/trust hospital. 3Either government or private, Indian system of medicine. 4Other includes Dai (trained or untrained), other health professionals and ISM practitioner. 5Includes sub-centre, primary health centre, community health centre or referral hospital, government hospital and government dispensary within the village.
Among women who sought treatment for complications in the postpartum period, only 29.5 percent visited a government health facility including primary health centre and sub-centre (3 percent each). More than 60 percent of women visited a private health facility and 2.5 percent went to a facility with the Indian system of medicine (either government or private) and another 7.6 percent obtained advice from other health facilities. The proportion of women who visited a government health facility is relatively higher in rural areas (31 percent) than in urban areas (26.7 percent). On the other hand, the proportion of women seeking treatment from a private health facility is more in urban areas (68.6 percent) than in rural areas (57.8 percent). Among women who sought treatment, 77.4 percent preferred to go to a doctor, 18 percent visited an auxiliary nurse midwife or nurse or LHV, 2.9 percent went to other health professionals and 1.6 percent went to some one else. About 72.6 percent of these women in urban areas and 80 percent in rural areas went to a doctor, whereas a visit to an ANM/nurse/LHV was by 14 percent in rural areas and 25.6 percent in urban areas. There is
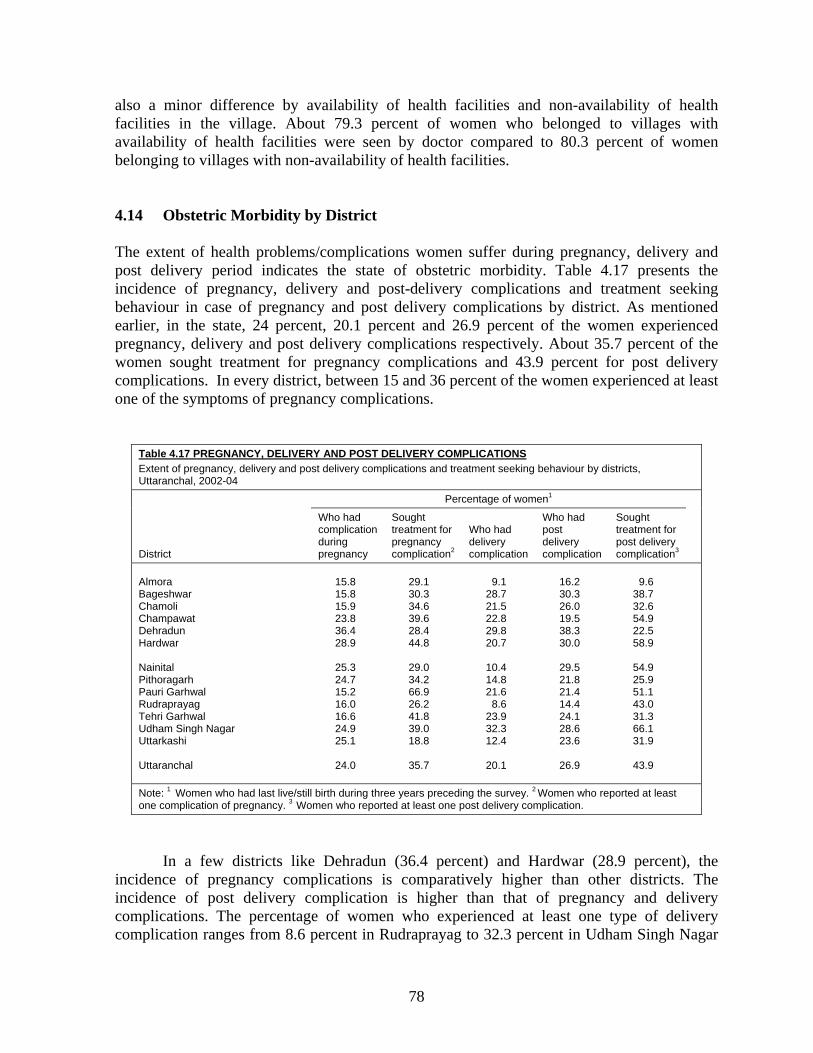
78
also a minor difference by availability of health facilities and non-availability of health facilities in the village. About 79.3 percent of women who belonged to villages with availability of health facilities were seen by doctor compared to 80.3 percent of women belonging to villages with non-availability of health facilities. 4.14 Obstetric Morbidity by District The extent of health problems/complications women suffer during pregnancy, delivery and post delivery period indicates the state of obstetric morbidity. Table 4.17 presents the incidence of pregnancy, delivery and post-delivery complications and treatment seeking behaviour in case of pregnancy and post delivery complications by district. As mentioned earlier, in the state, 24 percent, 20.1 percent and 26.9 percent of the women experienced pregnancy, delivery and post delivery complications respectively. About 35.7 percent of the women sought treatment for pregnancy complications and 43.9 percent for post delivery complications. In every district, between 15 and 36 percent of the women experienced at least one of the symptoms of pregnancy complications.
Table 4.17 PREGNANCY, DELIVERY AND POST DELIVERY COMPLICATIONS Extent of pregnancy, delivery and post delivery complications and treatment seeking behaviour by districts, Uttaranchal, 2002-04
District
Percentage of women1
Who had complication during pregnancy
Sought treatment for pregnancy complication2
Who had delivery complication
Who had post delivery complication
Sought treatment for post delivery complication3
Almora Bageshwar Chamoli Champawat Dehradun Hardwar Nainital Pithoragarh Pauri Garhwal Rudraprayag Tehri Garhwal Udham Singh Nagar Uttarkashi Uttaranchal
15.8 15.8 15.9 23.8 36.4 28.9
25.3 24.7 15.2 16.0 16.6 24.9 25.1
24.0
29.1 30.3 34.6 39.6 28.4 44.8
29.0 34.2 66.9 26.2 41.8 39.0 18.8
35.7
9.1
28.7 21.5 22.8 29.8 20.7
10.4 14.8 21.6
8.6 23.9 32.3 12.4
20.1
16.2 30.3 26.0 19.5 38.3 30.0
29.5 21.8 21.4 14.4 24.1 28.6 23.6
26.9
9.6
38.7 32.6 54.9 22.5 58.9
54.9 25.9 51.1 43.0 31.3 66.1 31.9
43.9
Note: 1 Women who had last live/still birth during three years preceding the survey. 2 Women who reported at least one complication of pregnancy. 3 Women who reported at least one post delivery complication.
In a few districts like Dehradun (36.4 percent) and Hardwar (28.9 percent), the incidence of pregnancy complications is comparatively higher than other districts. The incidence of post delivery complication is higher than that of pregnancy and delivery complications. The percentage of women who experienced at least one type of delivery complication ranges from 8.6 percent in Rudraprayag to 32.3 percent in Udham Singh Nagar
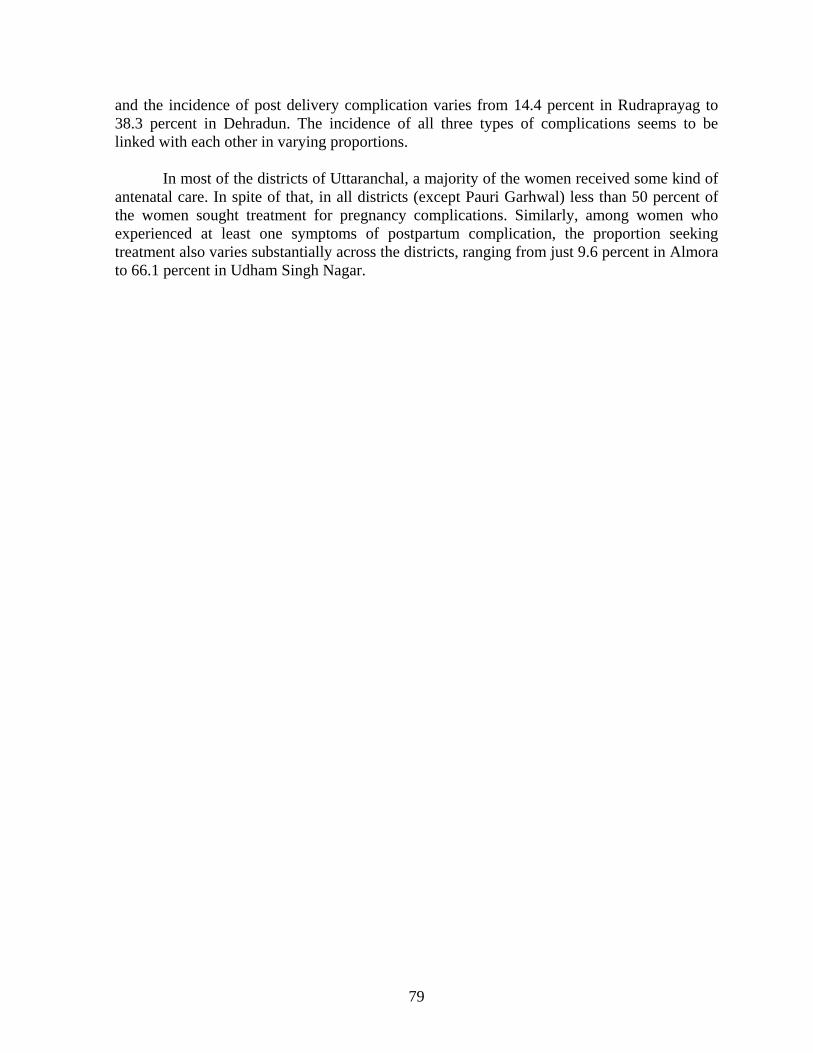
79
and the incidence of post delivery complication varies from 14.4 percent in Rudraprayag to 38.3 percent in Dehradun. The incidence of all three types of complications seems to be linked with each other in varying proportions. In most of the districts of Uttaranchal, a majority of the women received some kind of antenatal care. In spite of that, in all districts (except Pauri Garhwal) less than 50 percent of the women sought treatment for pregnancy complications. Similarly, among women who experienced at least one symptoms of postpartum complication, the proportion seeking treatment also varies substantially across the districts, ranging from just 9.6 percent in Almora to 66.1 percent in Udham Singh Nagar.
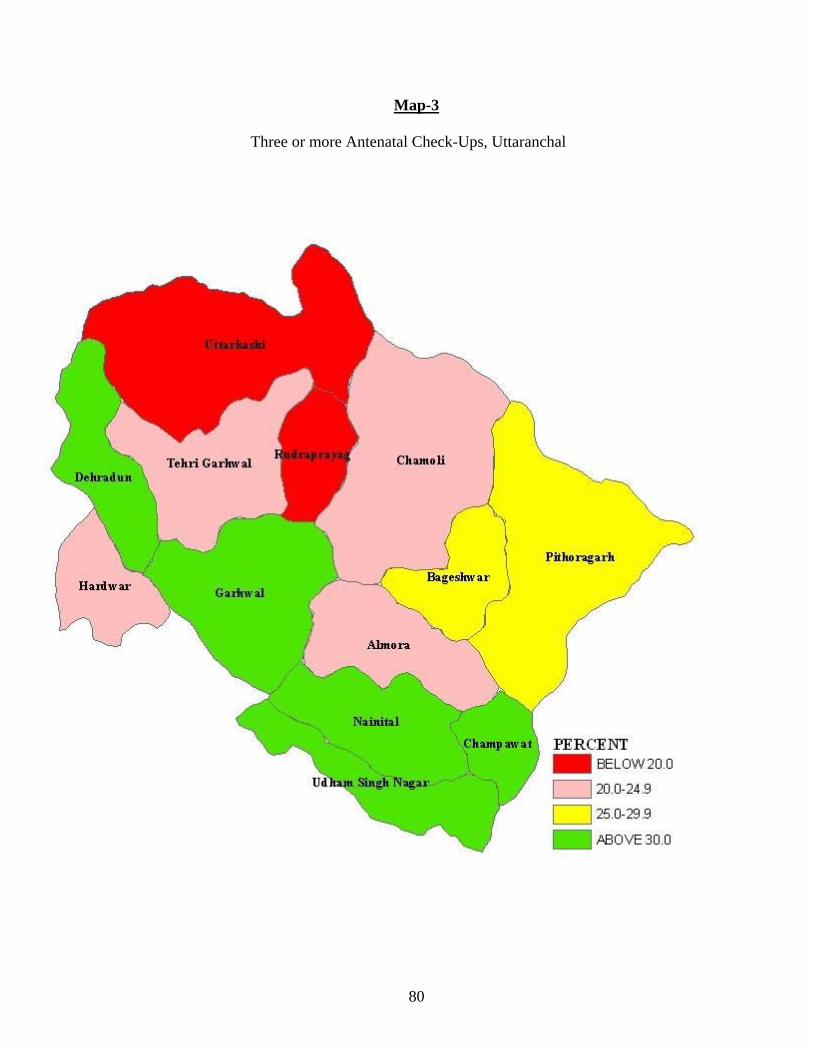
80
Map-3
Three or more Antenatal Check-Ups, Uttaranchal
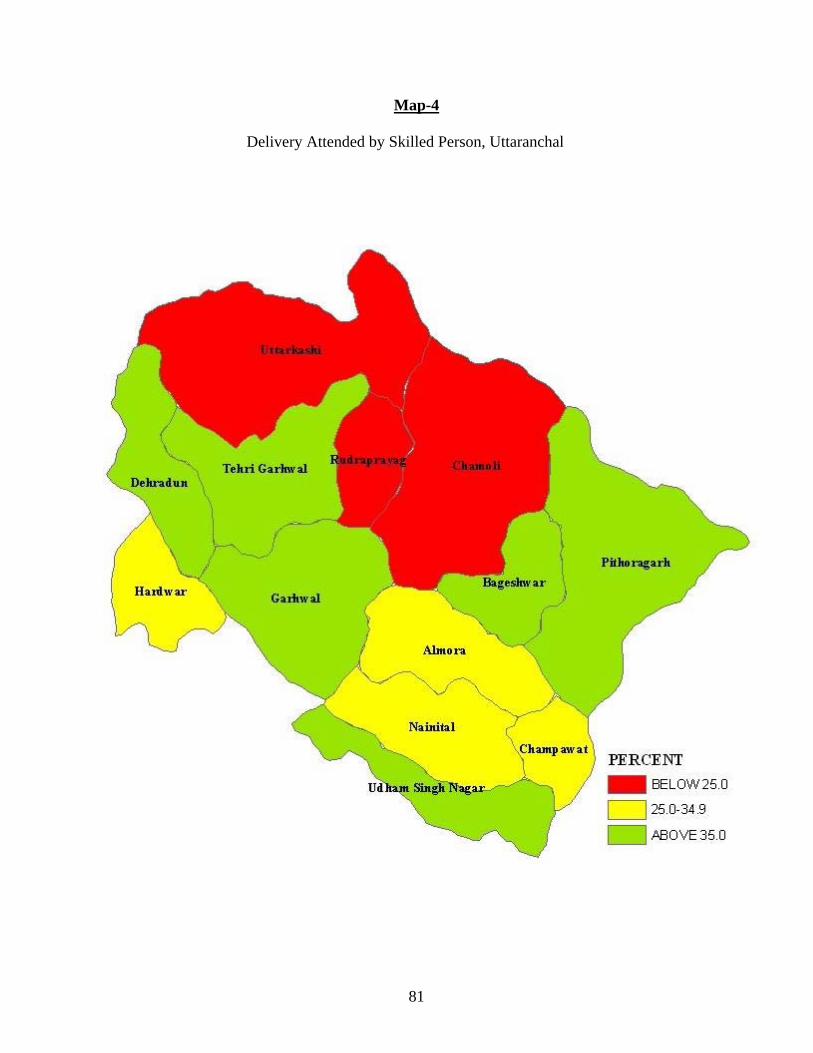
81
Map-4 Delivery Attended by Skilled Person, Uttaranchal
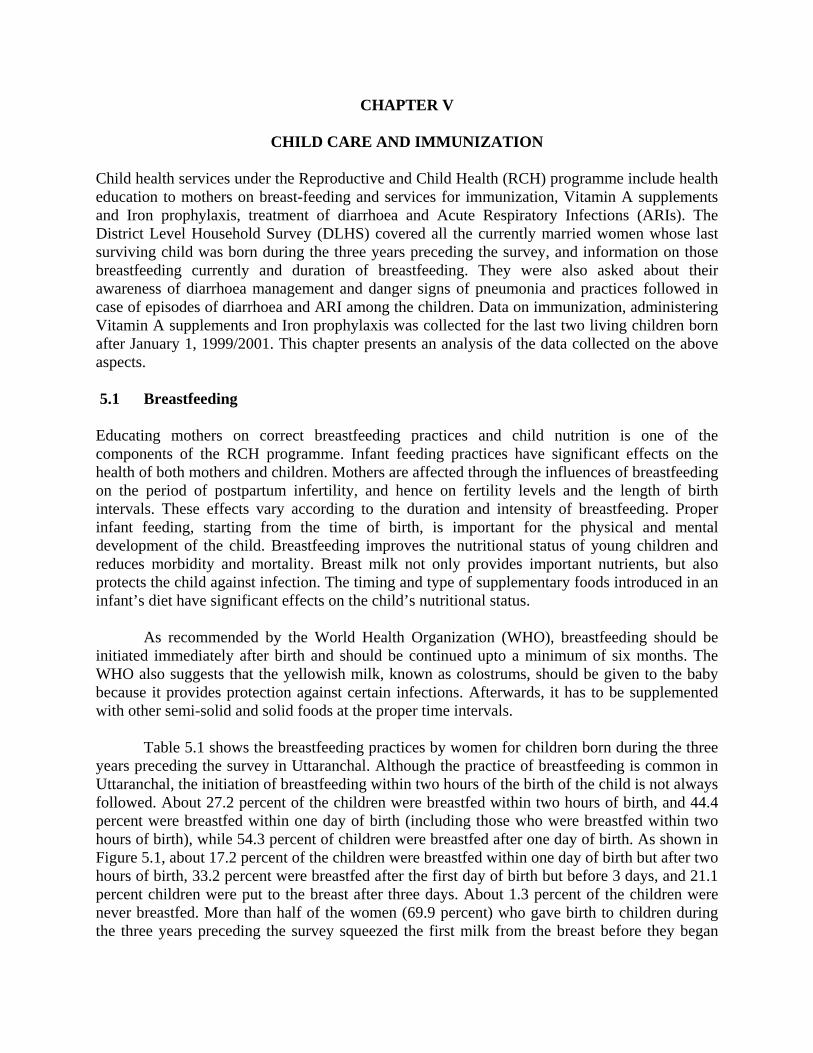
CHAPTER V
CHILD CARE AND IMMUNIZATION Child health services under the Reproductive and Child Health (RCH) programme include health education to mothers on breast-feeding and services for immunization, Vitamin A supplements and Iron prophylaxis, treatment of diarrhoea and Acute Respiratory Infections (ARIs). The District Level Household Survey (DLHS) covered all the currently married women whose last surviving child was born during the three years preceding the survey, and information on those breastfeeding currently and duration of breastfeeding. They were also asked about their awareness of diarrhoea management and danger signs of pneumonia and practices followed in case of episodes of diarrhoea and ARI among the children. Data on immunization, administering Vitamin A supplements and Iron prophylaxis was collected for the last two living children born after January 1, 1999/2001. This chapter presents an analysis of the data collected on the above aspects. 5.1 Breastfeeding Educating mothers on correct breastfeeding practices and child nutrition is one of the components of the RCH programme. Infant feeding practices have significant effects on the health of both mothers and children. Mothers are affected through the influences of breastfeeding on the period of postpartum infertility, and hence on fertility levels and the length of birth intervals. These effects vary according to the duration and intensity of breastfeeding. Proper infant feeding, starting from the time of birth, is important for the physical and mental development of the child. Breastfeeding improves the nutritional status of young children and reduces morbidity and mortality. Breast milk not only provides important nutrients, but also protects the child against infection. The timing and type of supplementary foods introduced in an infant’s diet have significant effects on the child’s nutritional status. As recommended by the World Health Organization (WHO), breastfeeding should be initiated immediately after birth and should be continued upto a minimum of six months. The WHO also suggests that the yellowish milk, known as colostrums, should be given to the baby because it provides protection against certain infections. Afterwards, it has to be supplemented with other semi-solid and solid foods at the proper time intervals. Table 5.1 shows the breastfeeding practices by women for children born during the three years preceding the survey in Uttaranchal. Although the practice of breastfeeding is common in Uttaranchal, the initiation of breastfeeding within two hours of the birth of the child is not always followed. About 27.2 percent of the children were breastfed within two hours of birth, and 44.4 percent were breastfed within one day of birth (including those who were breastfed within two hours of birth), while 54.3 percent of children were breastfed after one day of birth. As shown in Figure 5.1, about 17.2 percent of the children were breastfed within one day of birth but after two hours of birth, 33.2 percent were breastfed after the first day of birth but before 3 days, and 21.1 percent children were put to the breast after three days. About 1.3 percent of the children were never breastfed. More than half of the women (69.9 percent) who gave birth to children during the three years preceding the survey squeezed the first milk from the breast before they began
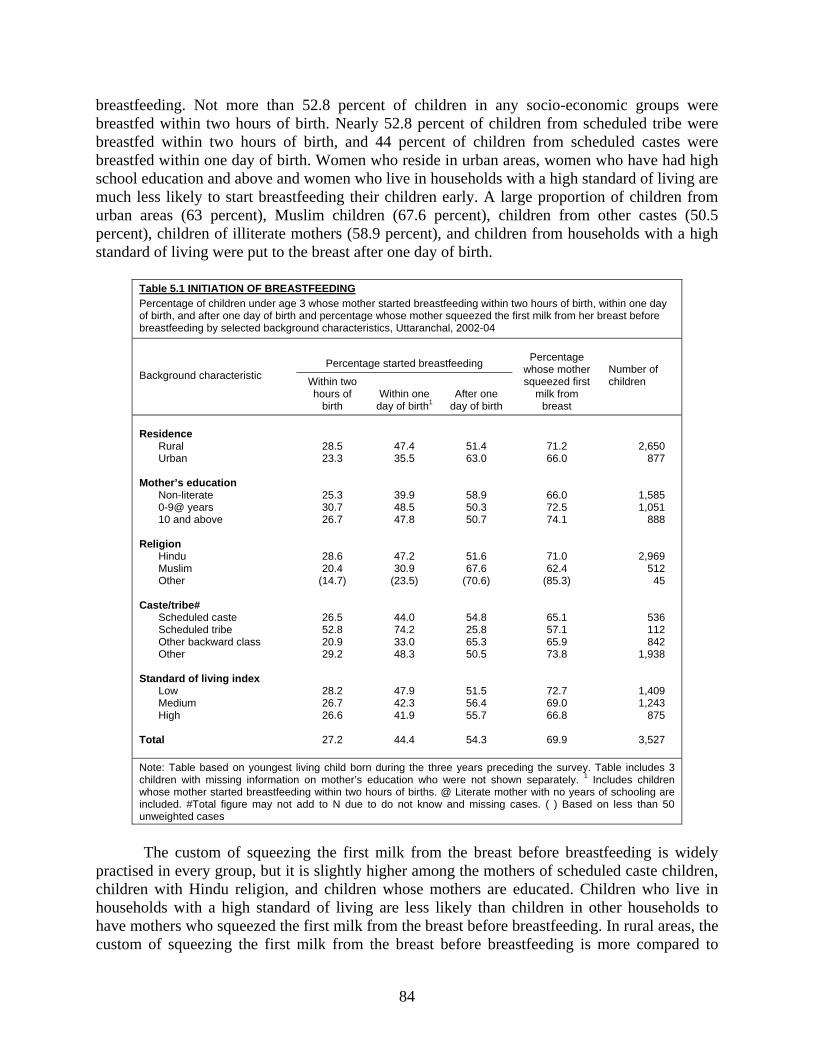
84
breastfeeding. Not more than 52.8 percent of children in any socio-economic groups were breastfed within two hours of birth. Nearly 52.8 percent of children from scheduled tribe were breastfed within two hours of birth, and 44 percent of children from scheduled castes were breastfed within one day of birth. Women who reside in urban areas, women who have had high school education and above and women who live in households with a high standard of living are much less likely to start breastfeeding their children early. A large proportion of children from urban areas (63 percent), Muslim children (67.6 percent), children from other castes (50.5 percent), children of illiterate mothers (58.9 percent), and children from households with a high standard of living were put to the breast after one day of birth.
Table 5.1 INITIATION OF BREASTFEEDING Percentage of children under age 3 whose mother started breastfeeding within two hours of birth, within one day of birth, and after one day of birth and percentage whose mother squeezed the first milk from her breast before breastfeeding by selected background characteristics, Uttaranchal, 2002-04
Background characteristic Percentage started breastfeeding Percentage
whose mother squeezed first
milk from breast
Number of children Within two
hours of birth
Within one day of birth1
After one day of birth
Residence Rural Urban
Mother’s education Non-literate 0-9@ years 10 and above
Religion Hindu Muslim Other
Caste/tribe# Scheduled caste Scheduled tribe Other backward class Other
Standard of living index Low Medium High Total
28.5 23.3
25.3 30.7 26.7
28.6 20.4
(14.7)
26.5 52.8 20.9 29.2
28.2 26.7 26.6
27.2
47.4 35.5
39.9 48.5 47.8
47.2 30.9
(23.5)
44.0 74.2 33.0 48.3
47.9 42.3 41.9
44.4
51.4 63.0
58.9 50.3 50.7
51.6 67.6
(70.6)
54.8 25.8 65.3 50.5
51.5 56.4 55.7
54.3
71.2 66.0
66.0 72.5 74.1
71.0 62.4
(85.3)
65.1 57.1 65.9 73.8
72.7 69.0 66.8
69.9
2,650 877
1,585 1,051
888
2,969
512 45
536 112 842
1,938
1,409 1,243
875
3,527
Note: Table based on youngest living child born during the three years preceding the survey. Table includes 3 children with missing information on mother’s education who were not shown separately. 1 Includes children whose mother started breastfeeding within two hours of births. @ Literate mother with no years of schooling are included. #Total figure may not add to N due to do not know and missing cases. ( ) Based on less than 50 unweighted cases
The custom of squeezing the first milk from the breast before breastfeeding is widely
practised in every group, but it is slightly higher among the mothers of scheduled caste children, children with Hindu religion, and children whose mothers are educated. Children who live in households with a high standard of living are less likely than children in other households to have mothers who squeezed the first milk from the breast before breastfeeding. In rural areas, the custom of squeezing the first milk from the breast before breastfeeding is more compared to

85
urban areas. Mothers of children born in the three years preceding the survey were asked whether the child had been fed breast milk exclusively and if so, what the duration was. Here it needs to be mentioned that, exclusive breastfeeding includes breastfeeding the child without giving it anything including water. Results are shown in Table 5.2.
Table 5.2 EXCLUSIVE BREASTFEEDING BY CHILD’S AGE Percentage of children under age 3 years by exclusive breastfeeding, according to child’s age in month, Uttaranchal, 2002-04
Age in months
Status of exclusive breastfeeding
Number of children
Exclusive breastfeeding At least 4 months At least 6 months
<2 2-3 4-5 6-7 8-9 10-11 12-13 14-15 16-17 18-19 20-21 22-23 24-25 26-27 28-29 30-31 32-33 34-35 < 4 months 4-6 months 7-9 Months
96.4 82.4 70.4 43.0 24.7 13.7
9.9 8.5 5.7 2.8 1.4 5.9 1.9 0.0 3.6 0.1 0.0 0.0
87.0 63.0 27.1
* *
86.6 90.6 80.5 85.3 81.9 85.5 81.6 92.7 82.9 92.0 88.5 85.5 82.2 83.7 80.9 86.0
*
87.9 83.6
* * *
62.7 62.2 63.3 67.5 64.6 52.9 60.6 62.7 75.0 65.7 44.7 60.8 56.3 55.7 68.6
* *
60.7
188 260 311 290 306 242 240 238 288 295 274 185 281 184 285 251 179 210
464 418 400
Note: Table based on youngest living child born during the three years preceding the survey
Figure 5.1 Initiation of Breastfeeding
After 2 hours, but same day
17.2%
After 3 days21.1%
1-3 days33.2%
Within 2 hours27.3%
Never1.3%
Uttaranchal, DLHS-RCH, 2002-04
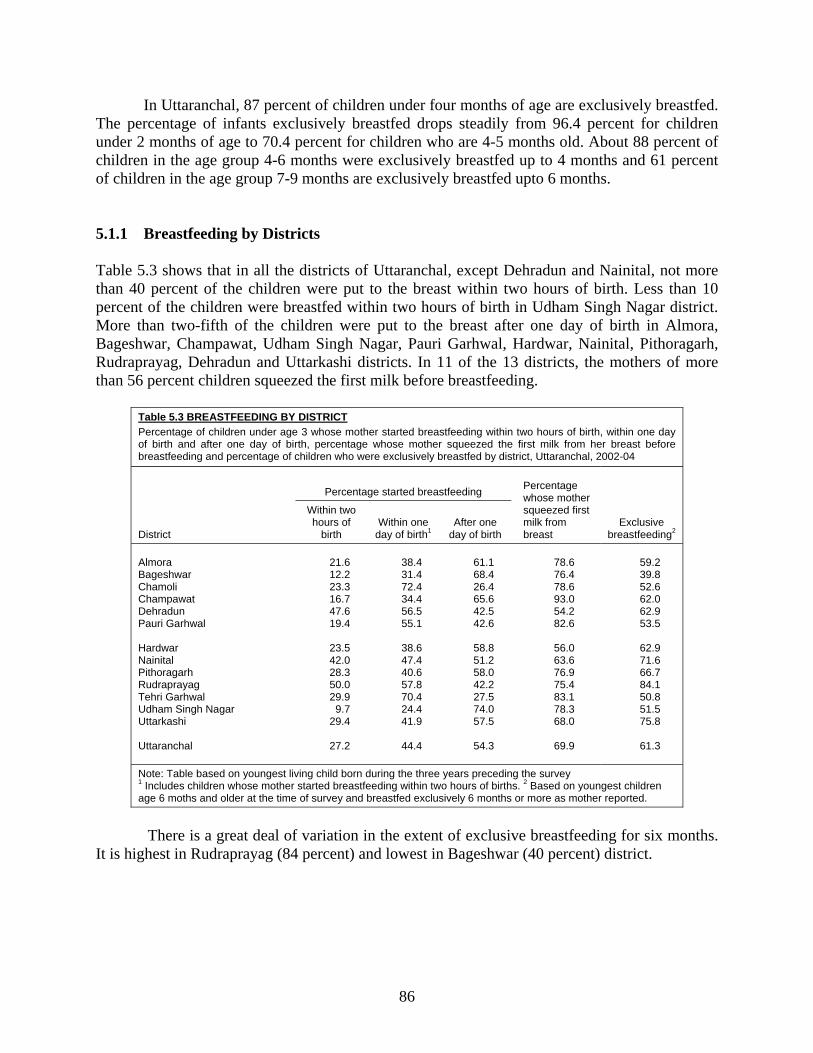
86
In Uttaranchal, 87 percent of children under four months of age are exclusively breastfed. The percentage of infants exclusively breastfed drops steadily from 96.4 percent for children under 2 months of age to 70.4 percent for children who are 4-5 months old. About 88 percent of children in the age group 4-6 months were exclusively breastfed up to 4 months and 61 percent of children in the age group 7-9 months are exclusively breastfed upto 6 months.
5.1.1 Breastfeeding by Districts Table 5.3 shows that in all the districts of Uttaranchal, except Dehradun and Nainital, not more than 40 percent of the children were put to the breast within two hours of birth. Less than 10 percent of the children were breastfed within two hours of birth in Udham Singh Nagar district. More than two-fifth of the children were put to the breast after one day of birth in Almora, Bageshwar, Champawat, Udham Singh Nagar, Pauri Garhwal, Hardwar, Nainital, Pithoragarh, Rudraprayag, Dehradun and Uttarkashi districts. In 11 of the 13 districts, the mothers of more than 56 percent children squeezed the first milk before breastfeeding.
Table 5.3 BREASTFEEDING BY DISTRICT Percentage of children under age 3 whose mother started breastfeeding within two hours of birth, within one day of birth and after one day of birth, percentage whose mother squeezed the first milk from her breast before breastfeeding and percentage of children who were exclusively breastfed by district, Uttaranchal, 2002-04
District
Percentage started breastfeeding Percentage whose mother squeezed first milk from breast
Exclusive breastfeeding2
Within two hours of
birth Within one
day of birth1 After one
day of birth Almora Bageshwar Chamoli Champawat Dehradun Pauri Garhwal Hardwar Nainital Pithoragarh Rudraprayag Tehri Garhwal Udham Singh Nagar Uttarkashi Uttaranchal
21.6 12.2 23.3 16.7 47.6 19.4
23.5 42.0 28.3 50.0 29.9
9.7 29.4
27.2
38.4 31.4 72.4 34.4 56.5 55.1
38.6 47.4 40.6 57.8 70.4 24.4 41.9
44.4
61.1 68.4 26.4 65.6 42.5 42.6
58.8 51.2 58.0 42.2 27.5 74.0 57.5
54.3
78.6 76.4 78.6 93.0 54.2 82.6
56.0 63.6 76.9 75.4 83.1 78.3 68.0
69.9
59.2 39.8 52.6 62.0 62.9 53.5
62.9 71.6 66.7 84.1 50.8 51.5 75.8
61.3
Note: Table based on youngest living child born during the three years preceding the survey 1 Includes children whose mother started breastfeeding within two hours of births. 2 Based on youngest children age 6 moths and older at the time of survey and breastfed exclusively 6 months or more as mother reported.
There is a great deal of variation in the extent of exclusive breastfeeding for six months. It is highest in Rudraprayag (84 percent) and lowest in Bageshwar (40 percent) district.
87
5.2 Immunization of Children The immunization of children against six serious but prevenTable diseases namely, tuberculosis, diphtheria, pertusis, poliomyelitis and measles is the main component of the child survival programme. As part of the National Health Policy, the National Immunization Programme is being implemented on a priority basis. The Government of India initiated the Expanded Programme on Immunization (EPI) in 1978 with the objective of reducing morbidity, mortality and disabilities among children from six diseases. The Universal Immunization Programme (UIP) was introduced in 1985-86 with the objective of covering at least 85 percent of all infants against the six vaccine prevenTable diseases by 1990. This scheme has been introduced in every district of the country. The standard immunization schedule developed for the child immunization programme specifies the age at which each vaccine should be administrated and the number of doses to be given. Routine vaccinations received by infants and children are usually recorded on a vaccination card that is issued for the child. In the first phase of Round II, all the women with last and last but one living child born after January 1, 1999 were asked whether the child/children had received the vaccination against polio, tuberculosis (BCG), diphtheria, whooping cough (pertusis), tetanus (DPT) and measles, and for the second phase, the reference period was from January 1, 2001. For Polio and DPT, further information on polio at birth and number of doses was asked. Children who received BCG, three doses of DPT and polio (excluding polio 0) and measles considered to be fully vaccinated. Information on the source of immunization for last dose and in case where immunization was not given, the reason for not giving immunization was also compiled. Table 5.4, Figures 5.2 and 5.3 presents vaccination coverage rates for children in the age group 12-25 months. Only 44.3 percent of the children are fully vaccinated, and around 23.4 percent have not received any routine vaccination. Coverage of each vaccination except Polio 0 is much higher than the percentage fully vaccinated. BCG, the first and second dose of DPT and Polio vaccine has each been given to more than three-fourths of children (Figure 5.3). Only 55.8 percent of the children have received three doses of DPT and 55.5 percent of the children received 3 drops of Polio, and only 54.4 percent of the children have been vaccinated against measles. Moreover, not all children who begin the DPT and polio vaccination series go on to complete them. The differences between the percentage of children receiving the first and third doses is 13-percentage point for DPT and 14 percentage points for polio. There has been some improvement in full vaccination coverage in Uttaranchal since the time of Round I in 1998-99. These data indicate that despite the progress that has been made in immunization coverage for children in Uttaranchal, coverage levels are still low and a large proportion of children who received some early vaccinations dropped out of the programme before receiving all of the recommended vaccinations.
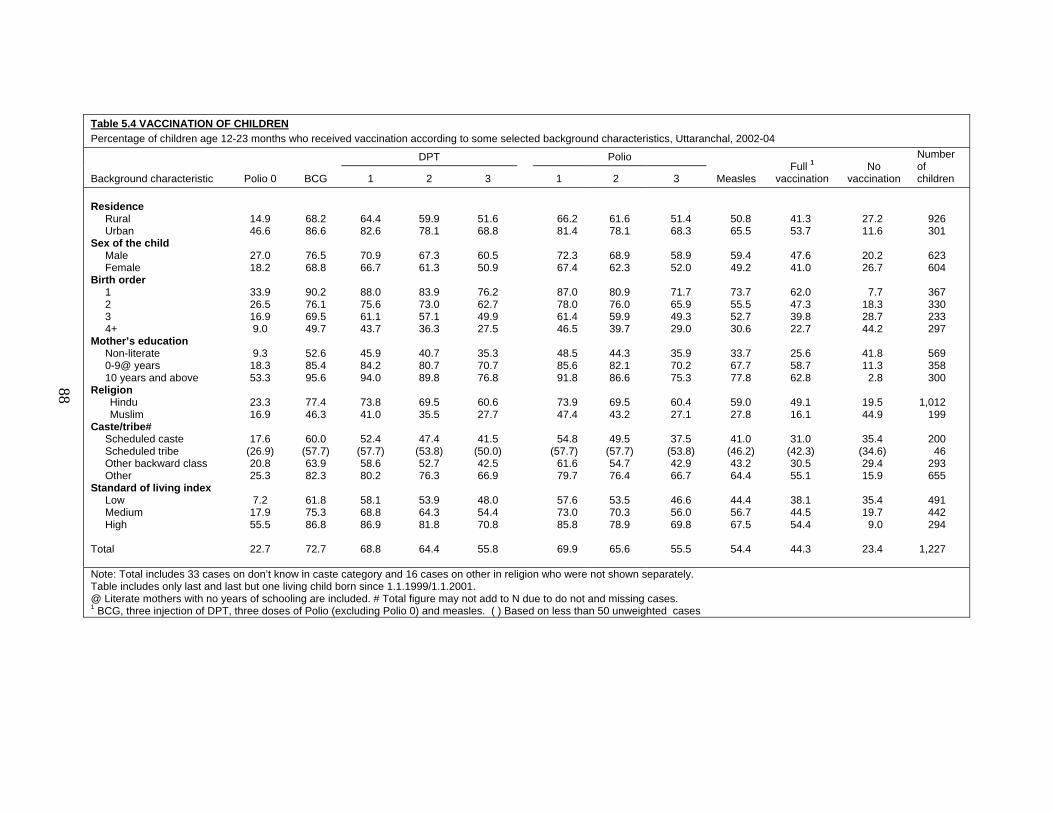
88
Table 5.4 VACCINATION OF CHILDREN Percentage of children age 12-23 months who received vaccination according to some selected background characteristics, Uttaranchal, 2002-04
Background characteristic Polio 0 BCG
DPT Polio
Measles Full 1
vaccination No
vaccination
Number of children 1 2 3 1 2 3
Residence Rural Urban Sex of the child Male Female Birth order 1 2 3 4+ Mother’s education Non-literate 0-9@ years 10 years and above Religion Hindu Muslim Caste/tribe# Scheduled caste Scheduled tribe Other backward class Other Standard of living index Low Medium High Total
14.9 46.6
27.0 18.2
33.9 26.5 16.9 9.0
9.3
18.3 53.3
23.3 16.9
17.6
(26.9) 20.8 25.3
7.2
17.9 55.5
22.7
68.2 86.6
76.5 68.8
90.2 76.1 69.5 49.7
52.6 85.4 95.6
77.4 46.3
60.0
(57.7) 63.9 82.3
61.8 75.3 86.8
72.7
64.4 82.6
70.9 66.7
88.0 75.6 61.1 43.7
45.9 84.2 94.0
73.8 41.0
52.4
(57.7) 58.6 80.2
58.1 68.8 86.9
68.8
59.9 78.1
67.3 61.3
83.9 73.0 57.1 36.3
40.7 80.7 89.8
69.5 35.5
47.4
(53.8) 52.7 76.3
53.9 64.3 81.8
64.4
51.6 68.8
60.5 50.9
76.2 62.7 49.9 27.5
35.3 70.7 76.8
60.6 27.7
41.5
(50.0) 42.5 66.9
48.0 54.4 70.8
55.8
66.2 81.4
72.3 67.4
87.0 78.0 61.4 46.5
48.5 85.6 91.8
73.9 47.4
54.8
(57.7) 61.6 79.7
57.6 73.0 85.8
69.9
61.6 78.1
68.9 62.3
80.9 76.0 59.9 39.7
44.3 82.1 86.6
69.5 43.2
49.5
(57.7) 54.7 76.4
53.5 70.3 78.9
65.6
51.4 68.3
58.9 52.0
71.7 65.9 49.3 29.0
35.9 70.2 75.3
60.4 27.1
37.5
(53.8) 42.9 66.7
46.6 56.0 69.8
55.5
50.8 65.5
59.4 49.2
73.7 55.5 52.7 30.6
33.7 67.7 77.8
59.0 27.8
41.0
(46.2) 43.2 64.4
44.4 56.7 67.5
54.4
41.3 53.7
47.6 41.0
62.0 47.3 39.8 22.7
25.6 58.7 62.8
49.1 16.1
31.0
(42.3) 30.5 55.1
38.1 44.5 54.4
44.3
27.2 11.6
20.2 26.7
7.7
18.3 28.7 44.2
41.8 11.3
2.8
19.5 44.9
35.4
(34.6) 29.4 15.9
35.4 19.7
9.0
23.4
926 301
623 604
367 330 233 297
569 358 300
1,012
199
200 46
293 655
491 442 294
1,227
Note: Total includes 33 cases on don’t know in caste category and 16 cases on other in religion who were not shown separately. Table includes only last and last but one living child born since 1.1.1999/1.1.2001. @ Literate mothers with no years of schooling are included. # Total figure may not add to N due to do not and missing cases. 1 BCG, three injection of DPT, three doses of Polio (excluding Polio 0) and measles. ( ) Based on less than 50 unweighted cases
88
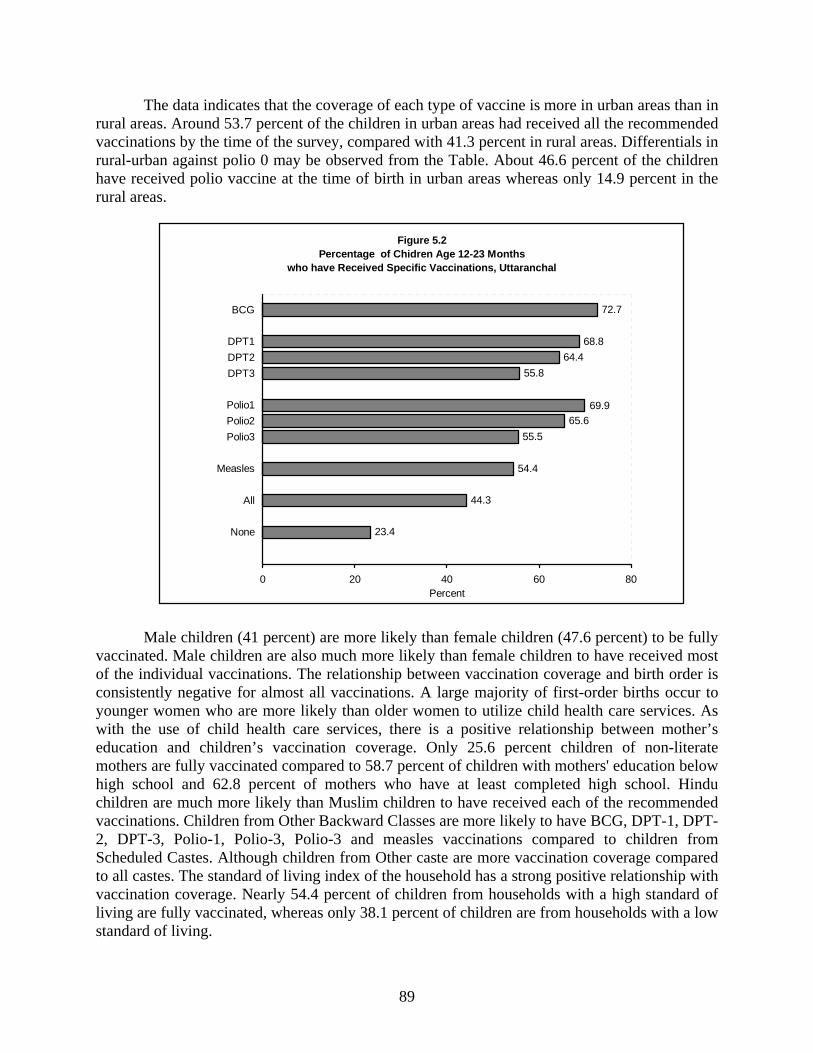
89
The data indicates that the coverage of each type of vaccine is more in urban areas than in rural areas. Around 53.7 percent of the children in urban areas had received all the recommended vaccinations by the time of the survey, compared with 41.3 percent in rural areas. Differentials in rural-urban against polio 0 may be observed from the Table. About 46.6 percent of the children have received polio vaccine at the time of birth in urban areas whereas only 14.9 percent in the rural areas.
Male children (41 percent) are more likely than female children (47.6 percent) to be fully
vaccinated. Male children are also much more likely than female children to have received most of the individual vaccinations. The relationship between vaccination coverage and birth order is consistently negative for almost all vaccinations. A large majority of first-order births occur to younger women who are more likely than older women to utilize child health care services. As with the use of child health care services, there is a positive relationship between mother’s education and children’s vaccination coverage. Only 25.6 percent children of non-literate mothers are fully vaccinated compared to 58.7 percent of children with mothers' education below high school and 62.8 percent of mothers who have at least completed high school. Hindu children are much more likely than Muslim children to have received each of the recommended vaccinations. Children from Other Backward Classes are more likely to have BCG, DPT-1, DPT-2, DPT-3, Polio-1, Polio-3, Polio-3 and measles vaccinations compared to children from Scheduled Castes. Although children from Other caste are more vaccination coverage compared to all castes. The standard of living index of the household has a strong positive relationship with vaccination coverage. Nearly 54.4 percent of children from households with a high standard of living are fully vaccinated, whereas only 38.1 percent of children are from households with a low standard of living.
Uttaranchal, DLHS-RCH, 2002-04
Figure 5.2 Percentage of Chidren Age 12-23 Months
who have Received Specific Vaccinations, Uttaranchal
72.7
68.864.4
55.8
69.965.6
55.5
54.4
44.3
23.4
0 20 40 60 80
None
All
Measles
Polio3Polio2Polio1
DPT3DPT2DPT1
BCG
Percent
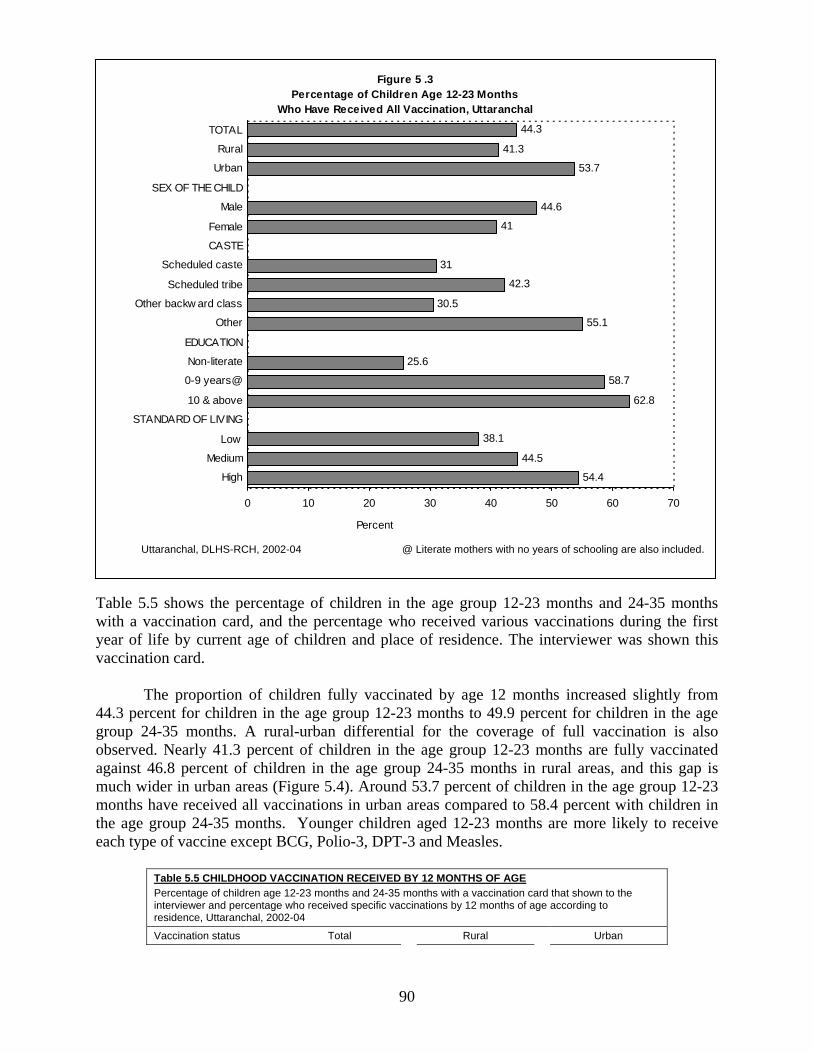
90
Table 5.5 shows the percentage of children in the age group 12-23 months and 24-35 months with a vaccination card, and the percentage who received various vaccinations during the first year of life by current age of children and place of residence. The interviewer was shown this vaccination card. The proportion of children fully vaccinated by age 12 months increased slightly from 44.3 percent for children in the age group 12-23 months to 49.9 percent for children in the age group 24-35 months. A rural-urban differential for the coverage of full vaccination is also observed. Nearly 41.3 percent of children in the age group 12-23 months are fully vaccinated against 46.8 percent of children in the age group 24-35 months in rural areas, and this gap is much wider in urban areas (Figure 5.4). Around 53.7 percent of children in the age group 12-23 months have received all vaccinations in urban areas compared to 58.4 percent with children in the age group 24-35 months. Younger children aged 12-23 months are more likely to receive each type of vaccine except BCG, Polio-3, DPT-3 and Measles.
Table 5.5 CHILDHOOD VACCINATION RECEIVED BY 12 MONTHS OF AGE Percentage of children age 12-23 months and 24-35 months with a vaccination card that shown to the interviewer and percentage who received specific vaccinations by 12 months of age according to residence, Uttaranchal, 2002-04
Vaccination status Total Rural Urban
Figure 5 .3Percentage of Children Age 12-23 Months
Who Have Received All Vaccination, Uttaranchal
31
41
54.4
44.5
38.1
62.8
58.7
25.6
55.1
30.5
42.3
44.6
53.7
41.3
44.3
0 10 20 30 40 50 60 70
High
Medium
Low
STANDARD OF LIVING
10 & above
0-9 years@
Non-literate
EDUCATION
Other
Other backw ard class
Scheduled tribe
Scheduled caste
CASTE
Female
Male
SEX OF THE CHILD
Urban
Rural
TOTAL
Percent
Uttaranchal, DLHS-RCH, 2002-04 @ Literate mothers with no years of schooling are also included.
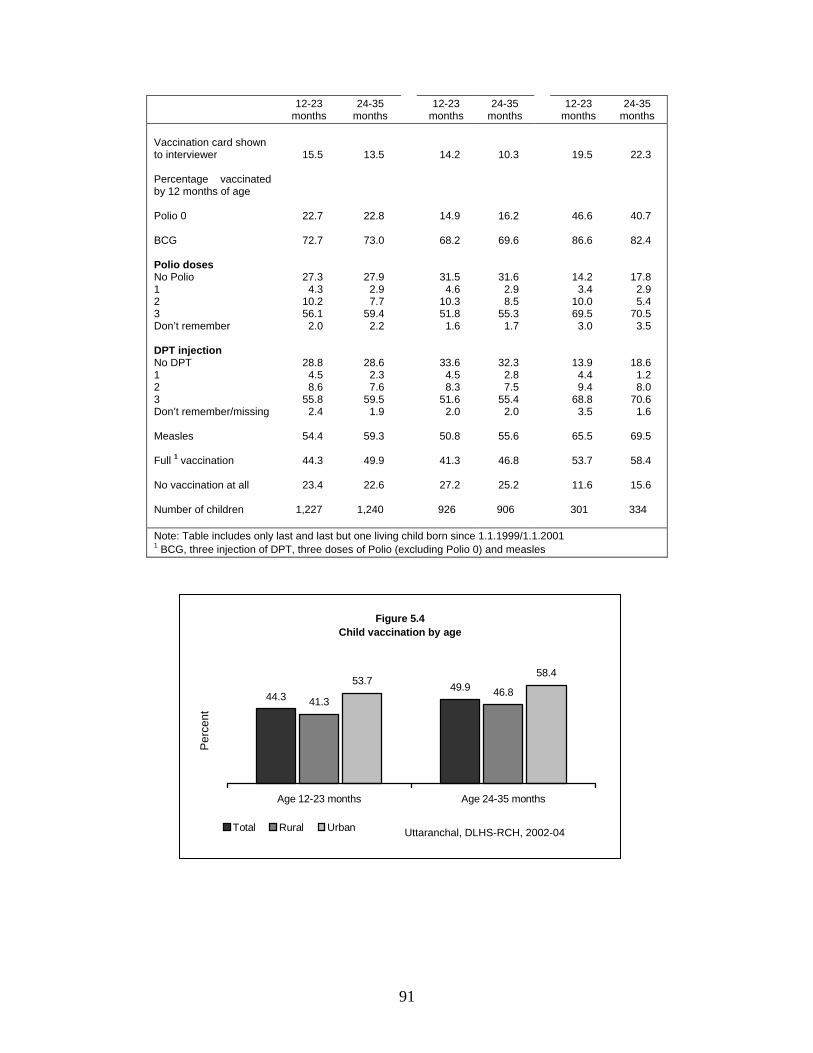
91
12-23 months
24-35 months
12-23 months
24-35 months
12-23 months
24-35 months
Vaccination card shown to interviewer Percentage vaccinated by 12 months of age Polio 0 BCG Polio doses No Polio 1 2 3 Don’t remember DPT injection No DPT 1 2 3 Don’t remember/missing Measles Full 1 vaccination No vaccination at all Number of children
15.5
22.7
72.7
27.3 4.3
10.2 56.1
2.0
28.8 4.5 8.6
55.8 2.4
54.4
44.3
23.4
1,227
13.5
22.8
73.0
27.9 2.9 7.7
59.4 2.2
28.6 2.3 7.6
59.5 1.9
59.3
49.9
22.6
1,240
14.2
14.9
68.2
31.5 4.6
10.3 51.8
1.6
33.6 4.5 8.3
51.6 2.0
50.8
41.3
27.2
926
10.3
16.2
69.6
31.6 2.9 8.5
55.3 1.7
32.3 2.8 7.5
55.4 2.0
55.6
46.8
25.2
906
19.5
46.6
86.6
14.2 3.4
10.0 69.5
3.0
13.9 4.4 9.4
68.8 3.5
65.5
53.7
11.6
301
22.3
40.7
82.4
17.8 2.9 5.4
70.5 3.5
18.6 1.2 8.0
70.6 1.6
69.5
58.4
15.6
334
Note: Table includes only last and last but one living child born since 1.1.1999/1.1.20011 BCG, three injection of DPT, three doses of Polio (excluding Polio 0) and measles
Figure 5.4Child vaccination by age
49.944.3 46.8
41.3
58.453.7
Age 12-23 months Age 24-35 months
Per
cent
Total Rural Urban Uttaranchal, DLHS-RCH, 2002-04
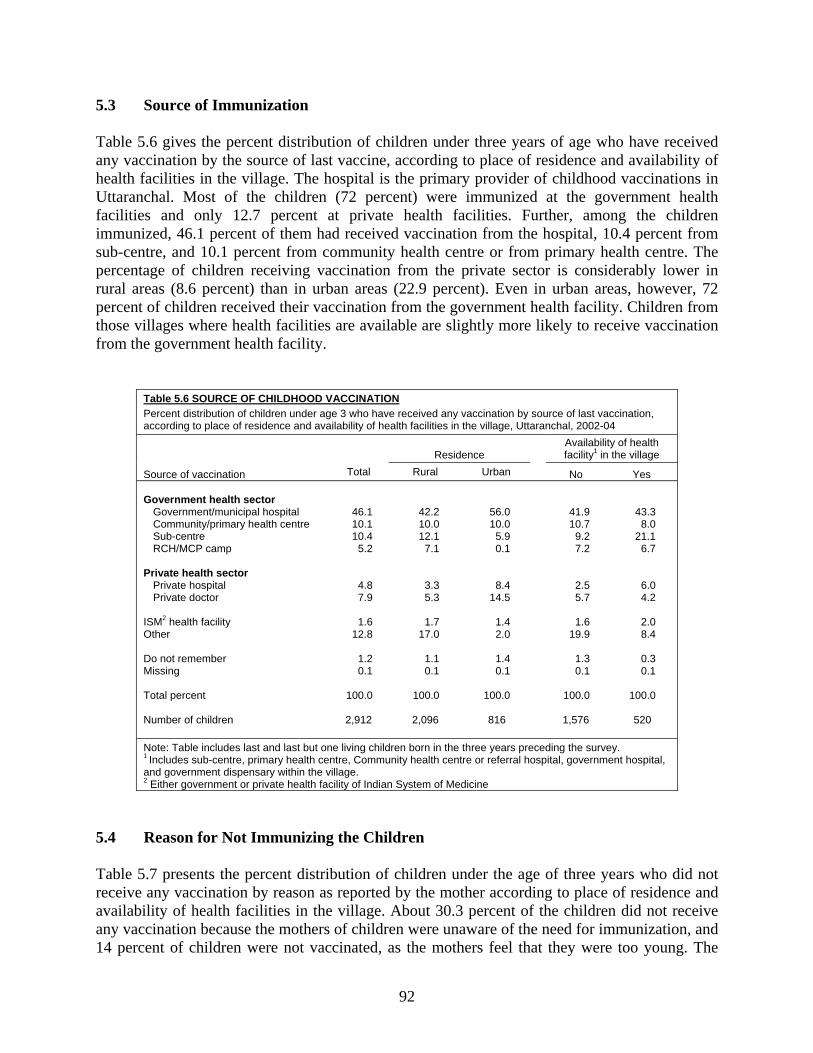
92
5.3 Source of Immunization Table 5.6 gives the percent distribution of children under three years of age who have received any vaccination by the source of last vaccine, according to place of residence and availability of health facilities in the village. The hospital is the primary provider of childhood vaccinations in Uttaranchal. Most of the children (72 percent) were immunized at the government health facilities and only 12.7 percent at private health facilities. Further, among the children immunized, 46.1 percent of them had received vaccination from the hospital, 10.4 percent from sub-centre, and 10.1 percent from community health centre or from primary health centre. The percentage of children receiving vaccination from the private sector is considerably lower in rural areas (8.6 percent) than in urban areas (22.9 percent). Even in urban areas, however, 72 percent of children received their vaccination from the government health facility. Children from those villages where health facilities are available are slightly more likely to receive vaccination from the government health facility.
Table 5.6 SOURCE OF CHILDHOOD VACCINATION Percent distribution of children under age 3 who have received any vaccination by source of last vaccination, according to place of residence and availability of health facilities in the village, Uttaranchal, 2002-04
Source of vaccination Total Residence
Availability of health facility1 in the village
Rural Urban No Yes Government health sector Government/municipal hospital Community/primary health centre Sub-centre RCH/MCP camp Private health sector Private hospital Private doctor ISM2 health facility Other Do not remember Missing Total percent Number of children
46.1 10.1 10.4
5.2
4.8 7.9
1.6
12.8
1.2 0.1
100.0
2,912
42.2 10.0 12.1
7.1
3.3 5.3
1.7
17.0
1.1 0.1
100.0
2,096
56.0 10.0
5.9 0.1
8.4 14.5
1.4 2.0
1.4 0.1
100.0
816
41.9 10.7
9.2 7.2
2.5 5.7
1.6
19.9
1.3 0.1
100.0
1,576
43.3 8.0
21.1 6.7
6.0 4.2
2.0 8.4
0.3 0.1
100.0
520
Note: Table includes last and last but one living children born in the three years preceding the survey. 1 Includes sub-centre, primary health centre, Community health centre or referral hospital, government hospital, and government dispensary within the village. 2 Either government or private health facility of Indian System of Medicine
5.4 Reason for Not Immunizing the Children Table 5.7 presents the percent distribution of children under the age of three years who did not receive any vaccination by reason as reported by the mother according to place of residence and availability of health facilities in the village. About 30.3 percent of the children did not receive any vaccination because the mothers of children were unaware of the need for immunization, and 14 percent of children were not vaccinated, as the mothers feel that they were too young. The
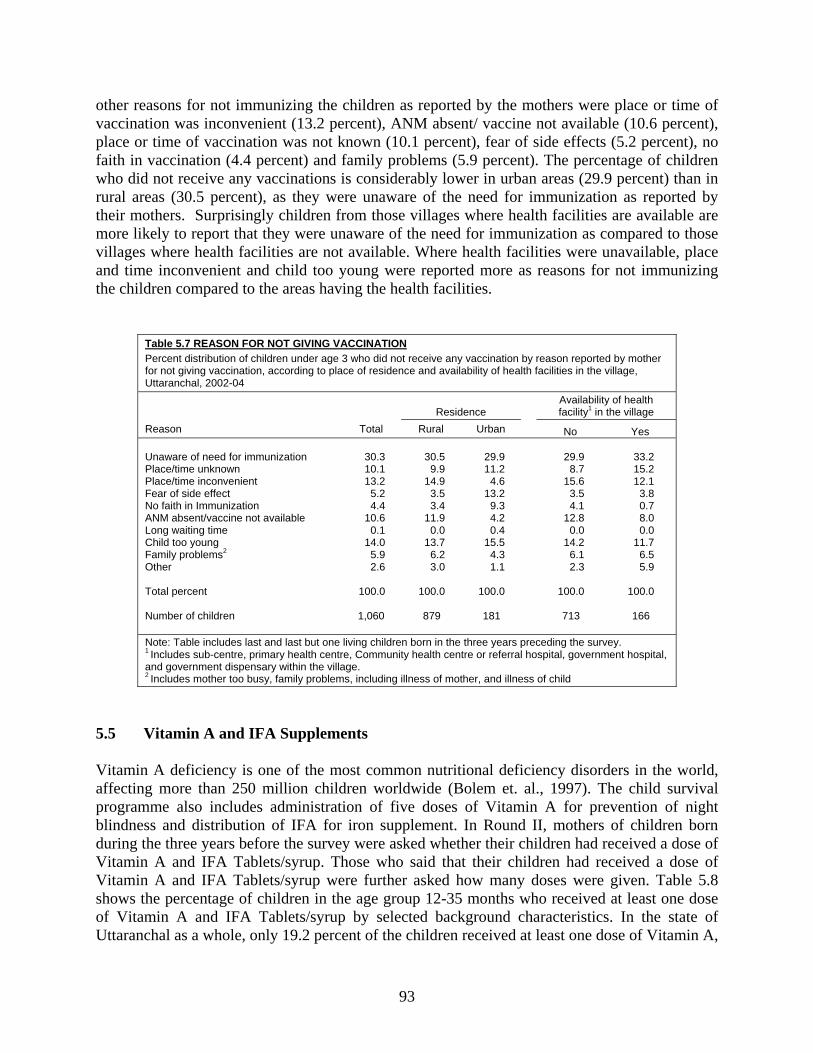
93
other reasons for not immunizing the children as reported by the mothers were place or time of vaccination was inconvenient (13.2 percent), ANM absent/ vaccine not available (10.6 percent), place or time of vaccination was not known (10.1 percent), fear of side effects (5.2 percent), no faith in vaccination (4.4 percent) and family problems (5.9 percent). The percentage of children who did not receive any vaccinations is considerably lower in urban areas (29.9 percent) than in rural areas (30.5 percent), as they were unaware of the need for immunization as reported by their mothers. Surprisingly children from those villages where health facilities are available are more likely to report that they were unaware of the need for immunization as compared to those villages where health facilities are not available. Where health facilities were unavailable, place and time inconvenient and child too young were reported more as reasons for not immunizing the children compared to the areas having the health facilities.
Table 5.7 REASON FOR NOT GIVING VACCINATION Percent distribution of children under age 3 who did not receive any vaccination by reason reported by mother for not giving vaccination, according to place of residence and availability of health facilities in the village, Uttaranchal, 2002-04
Reason Total Residence
Availability of health facility1 in the village
Rural Urban No Yes Unaware of need for immunization Place/time unknown Place/time inconvenient Fear of side effect No faith in Immunization ANM absent/vaccine not available Long waiting time Child too young Family problems2 Other Total percent Number of children
30.3 10.1 13.2
5.2 4.4
10.6 0.1
14.0 5.9 2.6
100.0
1,060
30.5
9.9 14.9
3.5 3.4
11.9 0.0
13.7 6.2 3.0
100.0
879
29.9 11.2
4.6 13.2
9.3 4.2 0.4
15.5 4.3 1.1
100.0
181
29.9
8.7 15.6
3.5 4.1
12.8 0.0
14.2 6.1 2.3
100.0
713
33.2 15.2 12.1
3.8 0.7 8.0 0.0
11.7 6.5 5.9
100.0
166
Note: Table includes last and last but one living children born in the three years preceding the survey. 1 Includes sub-centre, primary health centre, Community health centre or referral hospital, government hospital, and government dispensary within the village. 2 Includes mother too busy, family problems, including illness of mother, and illness of child
5.5 Vitamin A and IFA Supplements Vitamin A deficiency is one of the most common nutritional deficiency disorders in the world, affecting more than 250 million children worldwide (Bolem et. al., 1997). The child survival programme also includes administration of five doses of Vitamin A for prevention of night blindness and distribution of IFA for iron supplement. In Round II, mothers of children born during the three years before the survey were asked whether their children had received a dose of Vitamin A and IFA Tablets/syrup. Those who said that their children had received a dose of Vitamin A and IFA Tablets/syrup were further asked how many doses were given. Table 5.8 shows the percentage of children in the age group 12-35 months who received at least one dose of Vitamin A and IFA Tablets/syrup by selected background characteristics. In the state of Uttaranchal as a whole, only 19.2 percent of the children received at least one dose of Vitamin A,
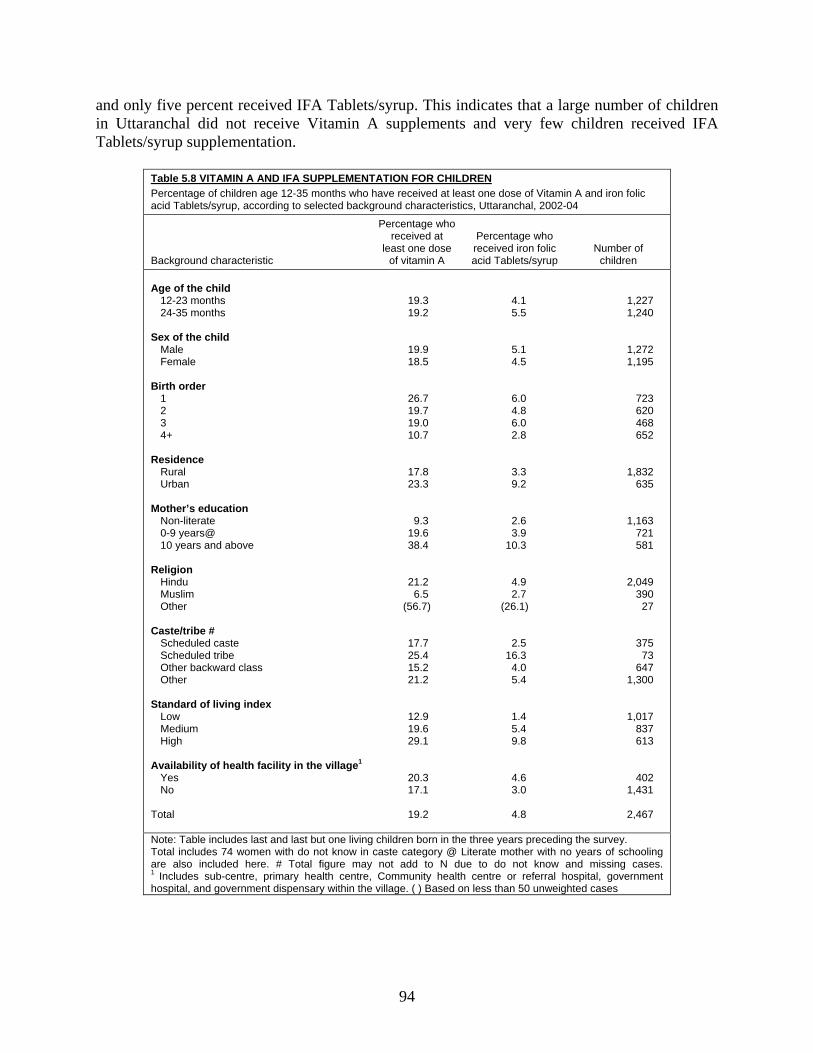
94
and only five percent received IFA Tablets/syrup. This indicates that a large number of children in Uttaranchal did not receive Vitamin A supplements and very few children received IFA Tablets/syrup supplementation.
Table 5.8 VITAMIN A AND IFA SUPPLEMENTATION FOR CHILDREN Percentage of children age 12-35 months who have received at least one dose of Vitamin A and iron folic acid Tablets/syrup, according to selected background characteristics, Uttaranchal, 2002-04
Background characteristic
Percentage who received at
least one dose of vitamin A
Percentage who received iron folic acid Tablets/syrup
Number of children
Age of the child 12-23 months 24-35 months Sex of the child Male Female Birth order 1 2 3 4+ Residence Rural Urban Mother’s education Non-literate 0-9 years@ 10 years and above Religion Hindu Muslim Other Caste/tribe # Scheduled caste Scheduled tribe Other backward class Other Standard of living index Low Medium High Availability of health facility in the village1 Yes No Total
19.3 19.2
19.9 18.5
26.7 19.7 19.0 10.7
17.8 23.3
9.3 19.6 38.4
21.2 6.5
(56.7)
17.7 25.4 15.2 21.2
12.9 19.6 29.1
20.3 17.1
19.2
4.1 5.5
5.1 4.5
6.0 4.8 6.0 2.8
3.3 9.2
2.6 3.9
10.3
4.9 2.7
(26.1)
2.5 16.3
4.0 5.4
1.4 5.4 9.8
4.6 3.0
4.8
1,227 1,240
1,272 1,195
723 620 468 652
1,832 635
1,163 721 581
2,049 390
27
375 73
647 1,300
1,017 837 613
402 1,431
2,467
Note: Table includes last and last but one living children born in the three years preceding the survey. Total includes 74 women with do not know in caste category @ Literate mother with no years of schooling are also included here. # Total figure may not add to N due to do not know and missing cases. 1 Includes sub-centre, primary health centre, Community health centre or referral hospital, government hospital, and government dispensary within the village. ( ) Based on less than 50 unweighted cases
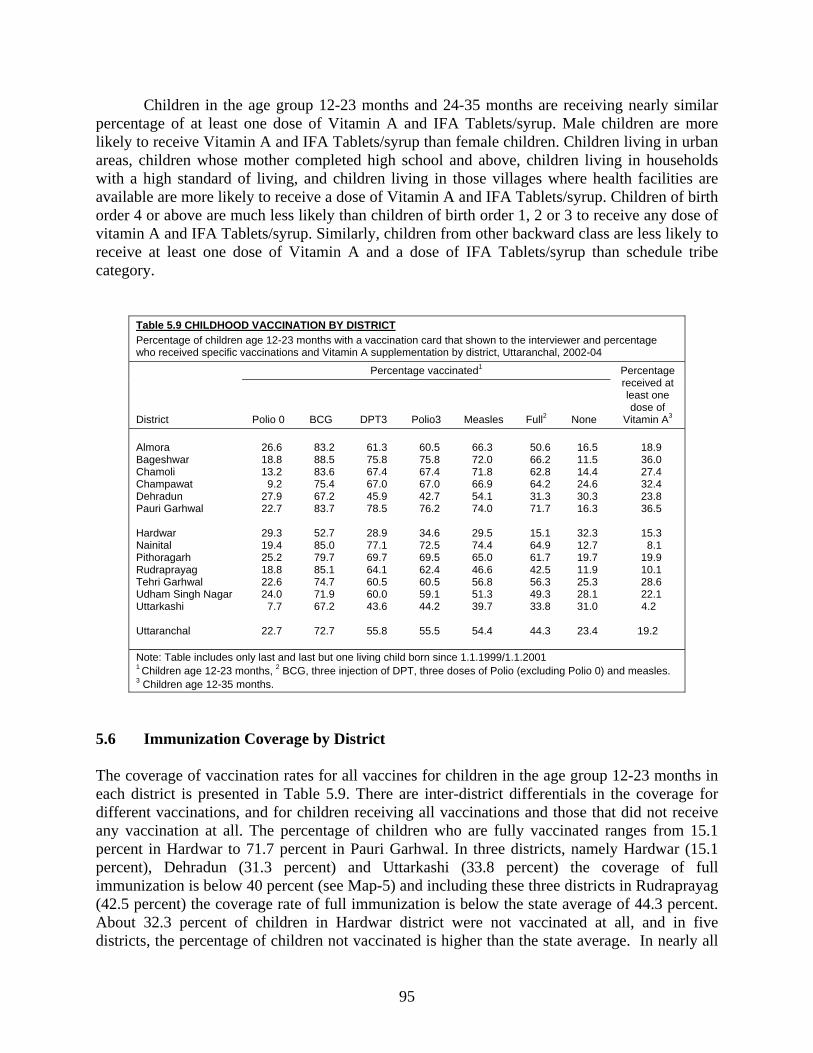
95
Children in the age group 12-23 months and 24-35 months are receiving nearly similar percentage of at least one dose of Vitamin A and IFA Tablets/syrup. Male children are more likely to receive Vitamin A and IFA Tablets/syrup than female children. Children living in urban areas, children whose mother completed high school and above, children living in households with a high standard of living, and children living in those villages where health facilities are available are more likely to receive a dose of Vitamin A and IFA Tablets/syrup. Children of birth order 4 or above are much less likely than children of birth order 1, 2 or 3 to receive any dose of vitamin A and IFA Tablets/syrup. Similarly, children from other backward class are less likely to receive at least one dose of Vitamin A and a dose of IFA Tablets/syrup than schedule tribe category.
Table 5.9 CHILDHOOD VACCINATION BY DISTRICT Percentage of children age 12-23 months with a vaccination card that shown to the interviewer and percentage who received specific vaccinations and Vitamin A supplementation by district, Uttaranchal, 2002-04
District
Percentage vaccinated1 Percentage received at least one dose of
Vitamin A3 Polio 0 BCG DPT3 Polio3 Measles Full2 None Almora Bageshwar Chamoli Champawat Dehradun Pauri Garhwal Hardwar Nainital Pithoragarh Rudraprayag Tehri Garhwal Udham Singh Nagar Uttarkashi Uttaranchal
26.6 18.8 13.2
9.2 27.9 22.7
29.3 19.4 25.2 18.8 22.6 24.0
7.7
22.7
83.2 88.5 83.6 75.4 67.2 83.7
52.7 85.0 79.7 85.1 74.7 71.9 67.2
72.7
61.3 75.8 67.4 67.0 45.9 78.5
28.9 77.1 69.7 64.1 60.5 60.0 43.6
55.8
60.5 75.8 67.4 67.0 42.7 76.2
34.6 72.5 69.5 62.4 60.5 59.1 44.2
55.5
66.3 72.0 71.8 66.9 54.1 74.0
29.5 74.4 65.0 46.6 56.8 51.3 39.7
54.4
50.6 66.2 62.8 64.2 31.3 71.7
15.1 64.9 61.7 42.5 56.3 49.3 33.8
44.3
16.5 11.5 14.4 24.6 30.3 16.3
32.3 12.7 19.7 11.9 25.3 28.1 31.0
23.4
18.9 36.0 27.4 32.4 23.8 36.5
15.3
8.1 19.9 10.1 28.6 22.1
4.2
19.2
Note: Table includes only last and last but one living child born since 1.1.1999/1.1.20011 Children age 12-23 months, 2 BCG, three injection of DPT, three doses of Polio (excluding Polio 0) and measles. 3 Children age 12-35 months.
5.6 Immunization Coverage by District The coverage of vaccination rates for all vaccines for children in the age group 12-23 months in each district is presented in Table 5.9. There are inter-district differentials in the coverage for different vaccinations, and for children receiving all vaccinations and those that did not receive any vaccination at all. The percentage of children who are fully vaccinated ranges from 15.1 percent in Hardwar to 71.7 percent in Pauri Garhwal. In three districts, namely Hardwar (15.1 percent), Dehradun (31.3 percent) and Uttarkashi (33.8 percent) the coverage of full immunization is below 40 percent (see Map-5) and including these three districts in Rudraprayag (42.5 percent) the coverage rate of full immunization is below the state average of 44.3 percent. About 32.3 percent of children in Hardwar district were not vaccinated at all, and in five districts, the percentage of children not vaccinated is higher than the state average. In nearly all
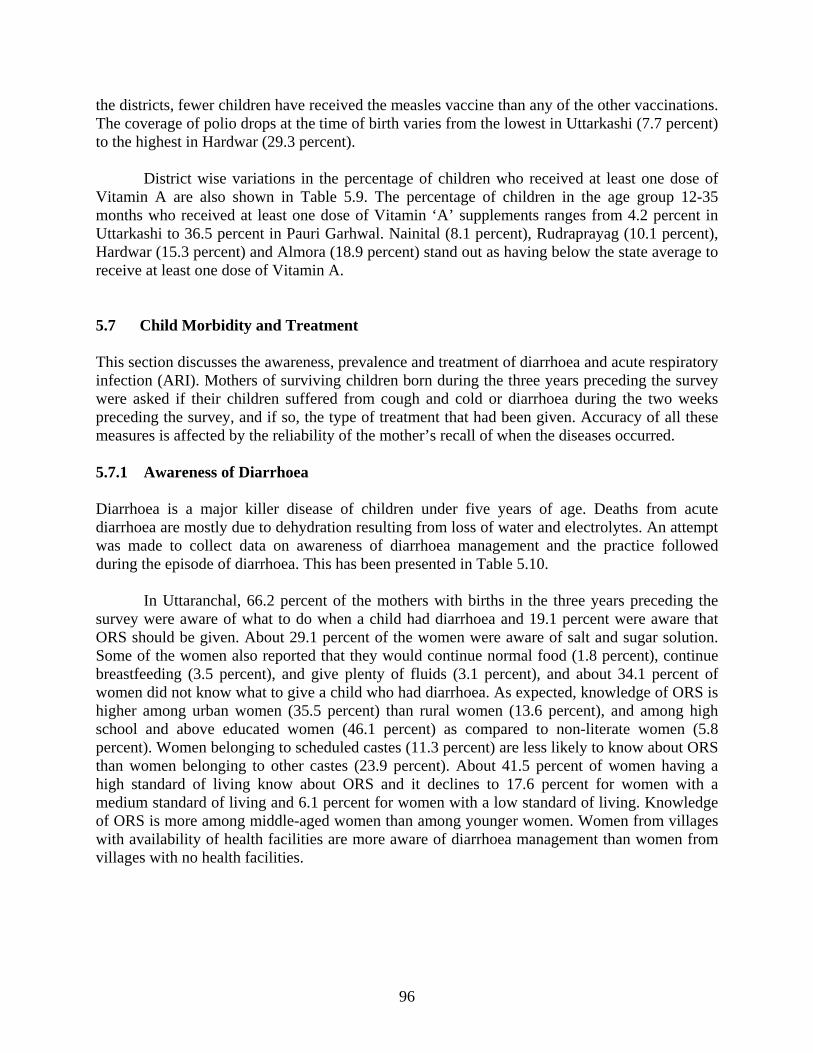
96
the districts, fewer children have received the measles vaccine than any of the other vaccinations. The coverage of polio drops at the time of birth varies from the lowest in Uttarkashi (7.7 percent) to the highest in Hardwar (29.3 percent).
District wise variations in the percentage of children who received at least one dose of
Vitamin A are also shown in Table 5.9. The percentage of children in the age group 12-35 months who received at least one dose of Vitamin ‘A’ supplements ranges from 4.2 percent in Uttarkashi to 36.5 percent in Pauri Garhwal. Nainital (8.1 percent), Rudraprayag (10.1 percent), Hardwar (15.3 percent) and Almora (18.9 percent) stand out as having below the state average to receive at least one dose of Vitamin A. 5.7 Child Morbidity and Treatment This section discusses the awareness, prevalence and treatment of diarrhoea and acute respiratory infection (ARI). Mothers of surviving children born during the three years preceding the survey were asked if their children suffered from cough and cold or diarrhoea during the two weeks preceding the survey, and if so, the type of treatment that had been given. Accuracy of all these measures is affected by the reliability of the mother’s recall of when the diseases occurred. 5.7.1 Awareness of Diarrhoea Diarrhoea is a major killer disease of children under five years of age. Deaths from acute diarrhoea are mostly due to dehydration resulting from loss of water and electrolytes. An attempt was made to collect data on awareness of diarrhoea management and the practice followed during the episode of diarrhoea. This has been presented in Table 5.10. In Uttaranchal, 66.2 percent of the mothers with births in the three years preceding the survey were aware of what to do when a child had diarrhoea and 19.1 percent were aware that ORS should be given. About 29.1 percent of the women were aware of salt and sugar solution. Some of the women also reported that they would continue normal food (1.8 percent), continue breastfeeding (3.5 percent), and give plenty of fluids (3.1 percent), and about 34.1 percent of women did not know what to give a child who had diarrhoea. As expected, knowledge of ORS is higher among urban women (35.5 percent) than rural women (13.6 percent), and among high school and above educated women (46.1 percent) as compared to non-literate women (5.8 percent). Women belonging to scheduled castes (11.3 percent) are less likely to know about ORS than women belonging to other castes (23.9 percent). About 41.5 percent of women having a high standard of living know about ORS and it declines to 17.6 percent for women with a medium standard of living and 6.1 percent for women with a low standard of living. Knowledge of ORS is more among middle-aged women than among younger women. Women from villages with availability of health facilities are more aware of diarrhoea management than women from villages with no health facilities.
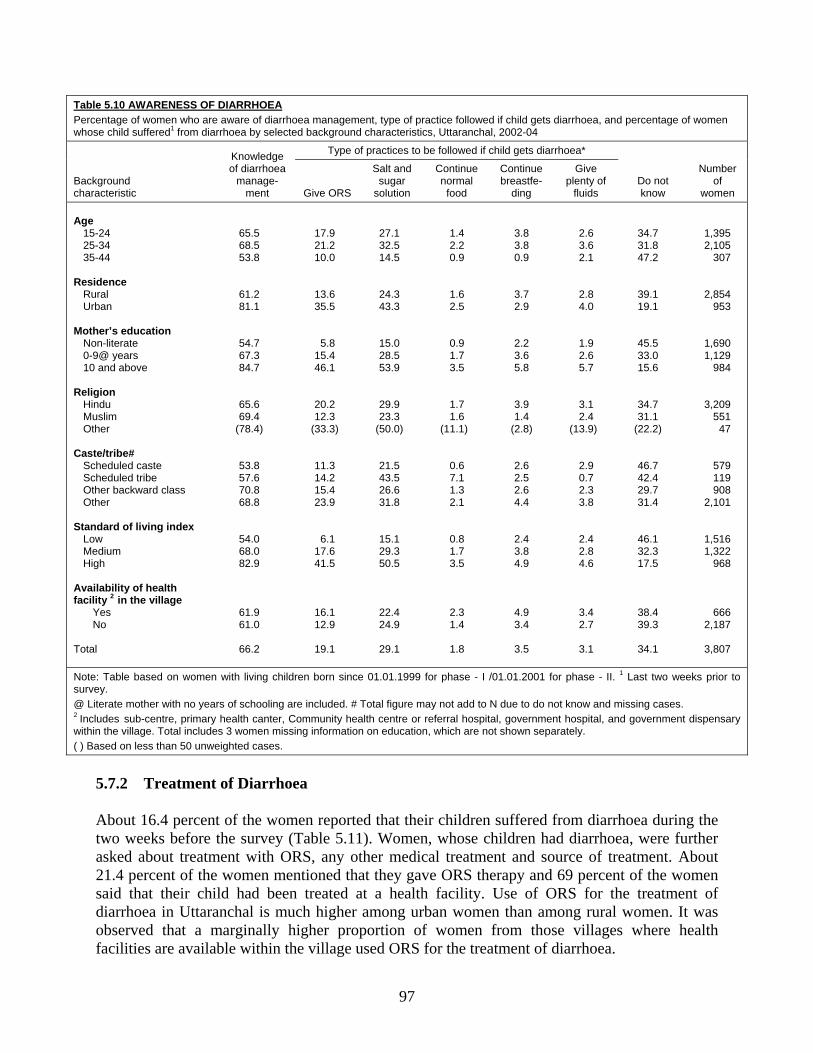
97
Table 5.10 AWARENESS OF DIARRHOEA Percentage of women who are aware of diarrhoea management, type of practice followed if child gets diarrhoea, and percentage of women whose child suffered1 from diarrhoea by selected background characteristics, Uttaranchal, 2002-04
Background characteristic
Knowledge of diarrhoea
manage-ment
Type of practices to be followed if child gets diarrhoea*
Do not know
Number of
women Give ORS
Salt and sugar
solution
Continue normal
food
Continue breastfe-
ding
Give plenty of
fluids Age 15-24 25-34 35-44 Residence Rural Urban Mother’s education Non-literate 0-9@ years 10 and above Religion Hindu Muslim Other Caste/tribe# Scheduled caste Scheduled tribe Other backward class Other Standard of living index Low Medium High Availability of health facility 2 in the village Yes No Total
65.5 68.5 53.8
61.2 81.1
54.7 67.3 84.7
65.6 69.4
(78.4)
53.8 57.6 70.8 68.8
54.0 68.0 82.9
61.9 61.0
66.2
17.9 21.2 10.0
13.6 35.5
5.8 15.4 46.1
20.2 12.3
(33.3)
11.3 14.2 15.4 23.9
6.1 17.6 41.5
16.1 12.9
19.1
27.1 32.5 14.5
24.3 43.3
15.0 28.5 53.9
29.9 23.3
(50.0)
21.5 43.5 26.6 31.8
15.1 29.3 50.5
22.4 24.9
29.1
1.4 2.2 0.9
1.6 2.5
0.9 1.7 3.5
1.7 1.6
(11.1)
0.6 7.1 1.3 2.1
0.8 1.7 3.5
2.3 1.4
1.8
3.8 3.8 0.9
3.7 2.9
2.2 3.6 5.8
3.9 1.4
(2.8)
2.6 2.5 2.6 4.4
2.4 3.8 4.9
4.9 3.4
3.5
2.6 3.6 2.1
2.8 4.0
1.9 2.6 5.7
3.1 2.4
(13.9)
2.9 0.7 2.3 3.8
2.4 2.8 4.6
3.4 2.7
3.1
34.7 31.8 47.2
39.1 19.1
45.5 33.0 15.6
34.7 31.1
(22.2)
46.7 42.4 29.7 31.4
46.1 32.3 17.5
38.4 39.3
34.1
1,395 2,105
307
2,854 953
1,690 1,129
984
3,209 551
47
579 119 908
2,101
1,516 1,322
968
666 2,187
3,807
Note: Table based on women with living children born since 01.01.1999 for phase - I /01.01.2001 for phase - II. 1 Last two weeks prior to survey. @ Literate mother with no years of schooling are included. # Total figure may not add to N due to do not know and missing cases. 2 Includes sub-centre, primary health canter, Community health centre or referral hospital, government hospital, and government dispensary within the village. Total includes 3 women missing information on education, which are not shown separately. ( ) Based on less than 50 unweighted cases.
5.7.2 Treatment of Diarrhoea About 16.4 percent of the women reported that their children suffered from diarrhoea during the two weeks before the survey (Table 5.11). Women, whose children had diarrhoea, were further asked about treatment with ORS, any other medical treatment and source of treatment. About 21.4 percent of the women mentioned that they gave ORS therapy and 69 percent of the women said that their child had been treated at a health facility. Use of ORS for the treatment of diarrhoea in Uttaranchal is much higher among urban women than among rural women. It was observed that a marginally higher proportion of women from those villages where health facilities are available within the village used ORS for the treatment of diarrhoea.
98
Table 5.11 TREATMENT OF DIARRHOEA Percentage of women who sought treatment whose child suffered from diarrhoea and by source of treatment, according to place of residence and availability of health facility in the village, Uttaranchal, 2002-04
Sought treatment/ source of treatment Total
Residence Availability of health fcaility2 in the village
Rural Urban Yes No Percentage of women whose child suffered1 from diarrhoea Number of women Percentage of women whose child suffered1 from diarrhoea treated with ORS Percentage of women whose child suffered1 from diarrhoea sought treatment Number of women Source of treatment Government health facility Hospital/dispensary UHC/UHP/UFWC CHC/ Rural hospital Primary health centre Sub centre Private health facility NGO/Trust hospital/clinic Private hospital clinic ISM3 facility Home remedy Other Percent distribution of women who seek treatment by Doctor ANM/Nurse/LHV Relative/friends Dai (trained or untrained) Chemist/medical shop ISM practitioner Total percent Number of women
16.4
3,807
21.4
69.0
625
12.2 0.1 1.6 3.4 2.9
0.1
64.5
13.6 8.5 3.4
87.3 4.2 3.7 0.3 4.3 0.3
100.0
431
16.4
2,854
15.6
68.8
469
11.6 0.1 2.1 2.9 3.9
0.1
61.0
13.4 11.2
3.7
84.4 5.5 4.9 0.0 5.2 0.0
100.0
323
16.4
953
38.8
69.7
156
13.8 0.0 0.0 4.7 0.0
0.0
75.1
14.2 0.6 2.2
96.1 0.3 0.0 1.0 1.5 1.1
100.0
109
17.4
666
15.8
83.4
116
49.2 0.8 3.7
34.2 3.0
0.6 7.7
30.5
1.3 4.4
85.3 5.1 4.1 0.0 5.5 0.0
100.0
97
16.1
2,187
15.6
64.0
353
53.6 3.7 0.0 1.4
10.2
0.0 14.8
23.6
.0 3.4
84.0 5.7 5.2 0.0 5.1 0.0
100.0
226
Note: Table based on women with living children born since 01.01.1999 for phase - I /01.01.2001 for phase - II. 1 Last two weeks prior to survey. 2 Includes sub-centre, primary health centre, Community health centre or referral hospital, government hospital, and government dispensary within the village. 3 Either government or private health facility of Indian System of Medicine.
Among those mothers whose children suffered from diarrhoea during the two weeks before the survey and who consulted or sought treatment, about 64.5 percent of women visited private hospitals/clinics and 13.6 percent of women treated their children through an Indian System of Medicine (ISM) facility.
99
5.7.3 Awareness of Pneumonia Another major killer disease among infants and children is Acute Respiratory Infections (ARI) including pneumonia. Early diagnosis and treatment with antibiotics can prevent a large proportion of ARI/pneumonia deaths. An attempt was made to understand the awareness level of pneumonia, and the proportion of children who had suffered from pneumonia during the two weeks before the survey and their treatment seeking behaviour. This is presented in Table 5.12. It was found that about 60.4 percent of the women in Uttaranchal with births in the three years preceding the survey were aware of the danger signs of pneumonia. A relatively higher proportion of women in urban areas (75.6 percent) were aware of the danger signs of pneumonia as compared to women from rural areas (55.4 percent). Knowledge of the danger signs of pneumonia is higher among women aged 25-34 years (61.7 percent), Muslim women (81.3 percent), other backward class women (68.1 percent), highly educated women (66 percent), women living in high standard of living households (72 percent) and women living in those villages with health facilities (55.6 percent). Women who were aware of the danger signs of pneumonia were further asked about the different types of signs of pneumonia. Most of the women mentioned ‘chest in drawing’ (91.6 percent), ‘difficulty in breathing’ (55.8 percent), ‘wheezing / whistling’ (33.1 percent), ‘pain in chest and productive cough’ (30.1 percent), ‘condition get worse than before’ (20.5 percent), ‘not able to drink or take a feed’ (18.5 percent), ‘rapid breathing’ (18.4 percent), and ‘excessive drowsy and difficulty in keeping awake’ (13.3 percent). 5.7.4 Treatment of Pneumonia About 13.1 percent of the women reported that their child had suffered from pneumonia during the two weeks before the survey; the corresponding figures were 13.6 percent in rural areas and 11.6 percent in urban areas (Table 5.13). The incidence of pneumonia varies little with availability of health facilities in the villages. Table 5.13 also shows the percentage of women whose children suffered from ARI symptoms in the two weeks before the survey and who sought advice/treatment at a health facility or provider. About 78.8 percent of women whose children were ill with ARI sought some advice or treatment. This percentage is relatively lower in rural areas (78.3 percent) than in urban areas (80.4 percent) and in villages without health facilities (77.3 percent) than in villages with health facilities (81.1 percent).
Among them who got advice for children ill with ARI, 71.5 percent of women visited private hospital/clinic, and only 10.5 percent went to government hospital/dispensary, whereas 9.6 percent of them opted for home remedy.
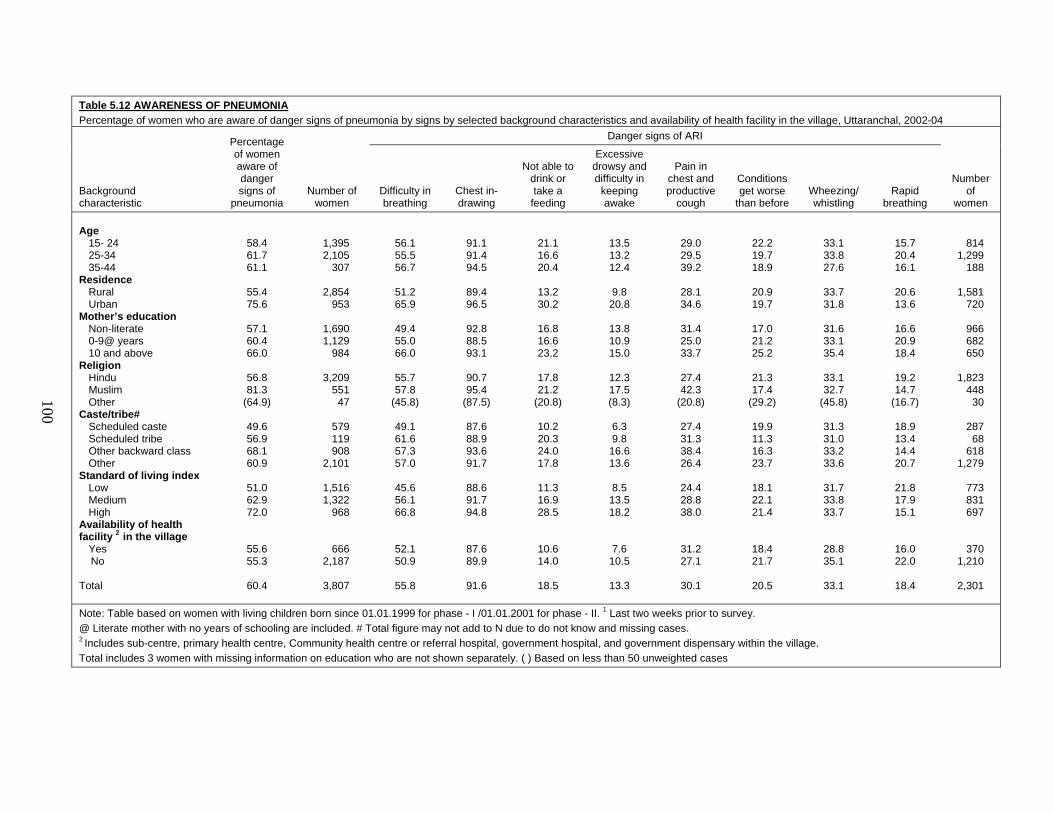
100
Table 5.12 AWARENESS OF PNEUMONIA Percentage of women who are aware of danger signs of pneumonia by signs by selected background characteristics and availability of health facility in the village, Uttaranchal, 2002-04
Background characteristic
Percentage of women aware of danger signs of
pneumonia Number of
women
Danger signs of ARI
Number of
women Difficulty in breathing
Chest in-drawing
Not able to drink or take a
feeding
Excessive drowsy and difficulty in
keeping awake
Pain in chest and productive
cough
Conditions get worse
than before Wheezing/ whistling
Rapid breathing
Age 15- 24 25-34 35-44 Residence Rural Urban Mother’s education Non-literate 0-9@ years 10 and above Religion Hindu Muslim Other Caste/tribe# Scheduled caste Scheduled tribe Other backward class Other Standard of living index Low Medium High Availability of health facility 2 in the village Yes No Total
58.4 61.7 61.1
55.4 75.6
57.1 60.4 66.0
56.8 81.3
(64.9)
49.6 56.9 68.1 60.9
51.0 62.9 72.0
55.6 55.3
60.4
1,395 2,105
307
2,854 953
1,690 1,129
984
3,209 551
47
579 119 908
2,101
1,516 1,322
968
666 2,187
3,807
56.1 55.5 56.7
51.2 65.9
49.4 55.0 66.0
55.7 57.8
(45.8)
49.1 61.6 57.3 57.0
45.6 56.1 66.8
52.1 50.9
55.8
91.1 91.4 94.5
89.4 96.5
92.8 88.5 93.1
90.7 95.4
(87.5)
87.6 88.9 93.6 91.7
88.6 91.7 94.8
87.6 89.9
91.6
21.1 16.6 20.4
13.2 30.2
16.8 16.6 23.2
17.8 21.2
(20.8)
10.2 20.3 24.0 17.8
11.3 16.9 28.5
10.6 14.0
18.5
13.5 13.2 12.4
9.8
20.8
13.8 10.9 15.0
12.3 17.5 (8.3)
6.3 9.8
16.6 13.6
8.5
13.5 18.2
7.6 10.5
13.3
29.0 29.5 39.2
28.1 34.6
31.4 25.0 33.7
27.4 42.3
(20.8)
27.4 31.3 38.4 26.4
24.4 28.8 38.0
31.2 27.1
30.1
22.2 19.7 18.9
20.9 19.7
17.0 21.2 25.2
21.3 17.4
(29.2)
19.9 11.3 16.3 23.7
18.1 22.1 21.4
18.4 21.7
20.5
33.1 33.8 27.6
33.7 31.8
31.6 33.1 35.4
33.1 32.7
(45.8)
31.3 31.0 33.2 33.6
31.7 33.8 33.7
28.8 35.1
33.1
15.7 20.4 16.1
20.6 13.6
16.6 20.9 18.4
19.2 14.7
(16.7)
18.9 13.4 14.4 20.7
21.8 17.9 15.1
16.0 22.0
18.4
814 1,299
188
1,581 720
966 682 650
1,823
448 30
287
68 618
1,279
773 831 697
370 1,210
2,301
Note: Table based on women with living children born since 01.01.1999 for phase - I /01.01.2001 for phase - II. 1 Last two weeks prior to survey. @ Literate mother with no years of schooling are included. # Total figure may not add to N due to do not know and missing cases. 2 Includes sub-centre, primary health centre, Community health centre or referral hospital, government hospital, and government dispensary within the village. Total includes 3 women with missing information on education who are not shown separately. ( ) Based on less than 50 unweighted cases
100
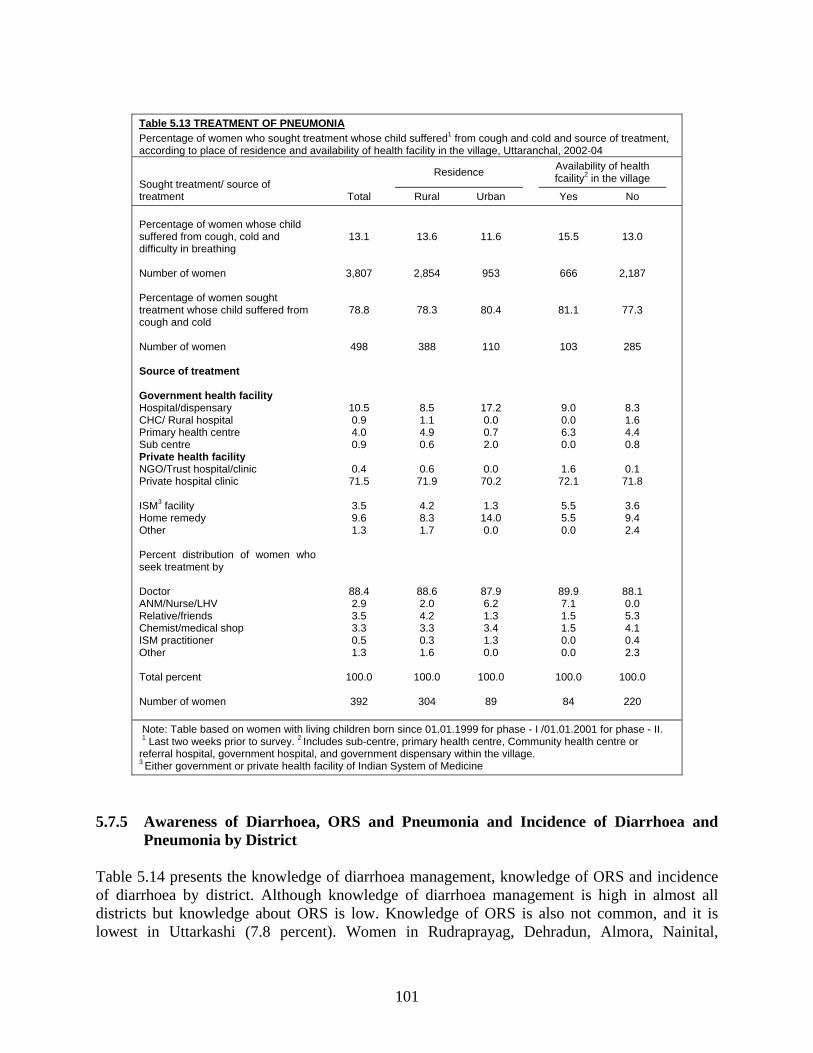
101
Table 5.13 TREATMENT OF PNEUMONIA Percentage of women who sought treatment whose child suffered1 from cough and cold and source of treatment, according to place of residence and availability of health facility in the village, Uttaranchal, 2002-04
Sought treatment/ source of treatment Total
Residence Availability of health fcaility2 in the village
Rural Urban Yes No Percentage of women whose child suffered from cough, cold and difficulty in breathing Number of women Percentage of women sought treatment whose child suffered from cough and cold Number of women Source of treatment Government health facility Hospital/dispensary CHC/ Rural hospital Primary health centre Sub centre Private health facility NGO/Trust hospital/clinic Private hospital clinic ISM3 facility Home remedy Other Percent distribution of women who seek treatment by Doctor ANM/Nurse/LHV Relative/friends Chemist/medical shop ISM practitioner Other Total percent Number of women
13.1
3,807
78.8
498
10.5 0.9 4.0 0.9
0.4
71.5
3.5 9.6 1.3
88.4 2.9 3.5 3.3 0.5 1.3
100.0
392
13.6
2,854
78.3
388
8.5 1.1 4.9 0.6
0.6
71.9
4.2 8.3 1.7
88.6 2.0 4.2 3.3 0.3 1.6
100.0
304
11.6
953
80.4
110
17.2 0.0 0.7 2.0
0.0
70.2
1.3 14.0 0.0
87.9 6.2 1.3 3.4 1.3 0.0
100.0
89
15.5
666
81.1
103
9.0 0.0 6.3 0.0
1.6
72.1
5.5 5.5 0.0
89.9 7.1 1.5 1.5 0.0 0.0
100.0
84
13.0
2,187
77.3
285
8.3 1.6 4.4 0.8
0.1
71.8
3.6 9.4 2.4
88.1 0.0 5.3 4.1 0.4 2.3
100.0
220
Note: Table based on women with living children born since 01.01.1999 for phase - I /01.01.2001 for phase - II. 1 Last two weeks prior to survey. 2 Includes sub-centre, primary health centre, Community health centre or referral hospital, government hospital, and government dispensary within the village. 3 Either government or private health facility of Indian System of Medicine
5.7.5 Awareness of Diarrhoea, ORS and Pneumonia and Incidence of Diarrhoea and
Pneumonia by District Table 5.14 presents the knowledge of diarrhoea management, knowledge of ORS and incidence of diarrhoea by district. Although knowledge of diarrhoea management is high in almost all districts but knowledge about ORS is low. Knowledge of ORS is also not common, and it is lowest in Uttarkashi (7.8 percent). Women in Rudraprayag, Dehradun, Almora, Nainital,
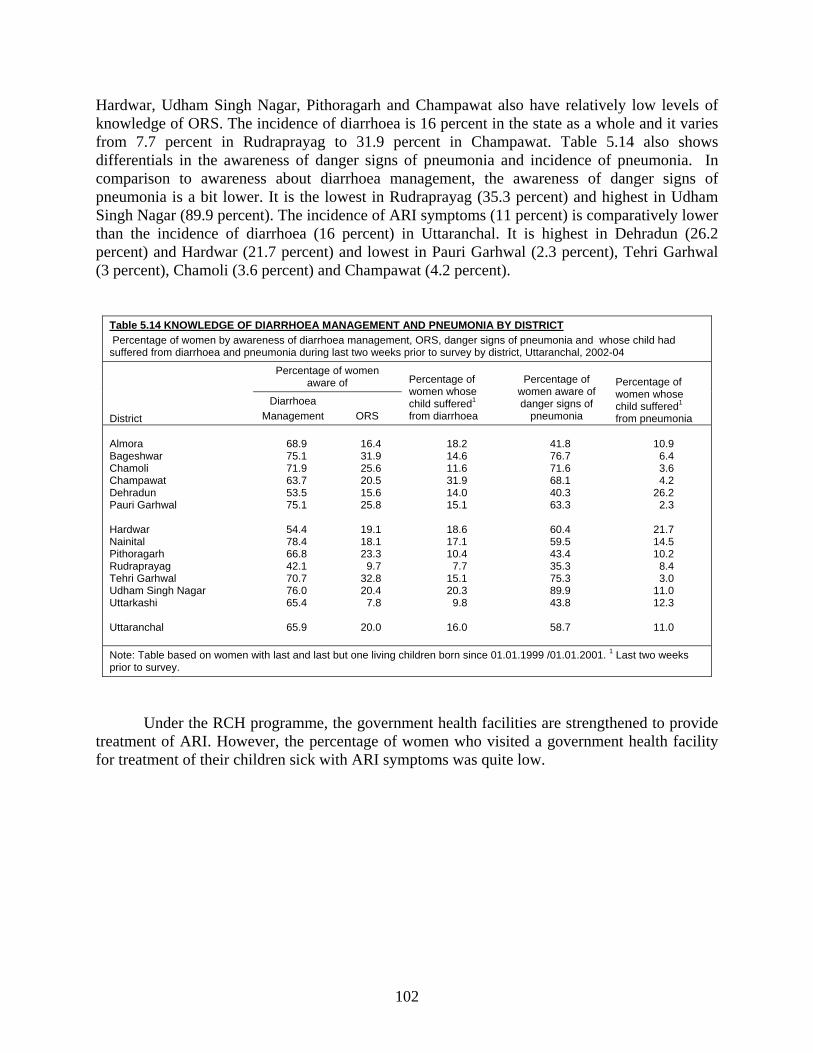
102
Hardwar, Udham Singh Nagar, Pithoragarh and Champawat also have relatively low levels of knowledge of ORS. The incidence of diarrhoea is 16 percent in the state as a whole and it varies from 7.7 percent in Rudraprayag to 31.9 percent in Champawat. Table 5.14 also shows differentials in the awareness of danger signs of pneumonia and incidence of pneumonia. In comparison to awareness about diarrhoea management, the awareness of danger signs of pneumonia is a bit lower. It is the lowest in Rudraprayag (35.3 percent) and highest in Udham Singh Nagar (89.9 percent). The incidence of ARI symptoms (11 percent) is comparatively lower than the incidence of diarrhoea (16 percent) in Uttaranchal. It is highest in Dehradun (26.2 percent) and Hardwar (21.7 percent) and lowest in Pauri Garhwal (2.3 percent), Tehri Garhwal (3 percent), Chamoli (3.6 percent) and Champawat (4.2 percent).
Table 5.14 KNOWLEDGE OF DIARRHOEA MANAGEMENT AND PNEUMONIA BY DISTRICT Percentage of women by awareness of diarrhoea management, ORS, danger signs of pneumonia and whose child had suffered from diarrhoea and pneumonia during last two weeks prior to survey by district, Uttaranchal, 2002-04
District
Percentage of women aware of Percentage of
women whose child suffered1 from diarrhoea
Percentage of women aware of danger signs of
pneumonia
Percentage of women whose child suffered1 from pneumonia
Diarrhoea Management ORS
Almora Bageshwar Chamoli Champawat Dehradun Pauri Garhwal Hardwar Nainital Pithoragarh Rudraprayag Tehri Garhwal Udham Singh Nagar Uttarkashi Uttaranchal
68.9 75.1 71.9 63.7 53.5 75.1
54.4 78.4 66.8 42.1 70.7 76.0 65.4
65.9
16.4 31.9 25.6 20.5 15.6 25.8
19.1 18.1 23.3
9.7 32.8 20.4
7.8
20.0
18.2 14.6 11.6 31.9 14.0 15.1
18.6 17.1 10.4
7.7 15.1 20.3
9.8
16.0
41.8 76.7 71.6 68.1 40.3 63.3
60.4 59.5 43.4 35.3 75.3 89.9 43.8
58.7
10.9
6.4 3.6 4.2
26.2 2.3
21.7 14.5 10.2
8.4 3.0
11.0 12.3
11.0
Note: Table based on women with last and last but one living children born since 01.01.1999 /01.01.2001. 1 Last two weeks prior to survey.
Under the RCH programme, the government health facilities are strengthened to provide treatment of ARI. However, the percentage of women who visited a government health facility for treatment of their children sick with ARI symptoms was quite low.
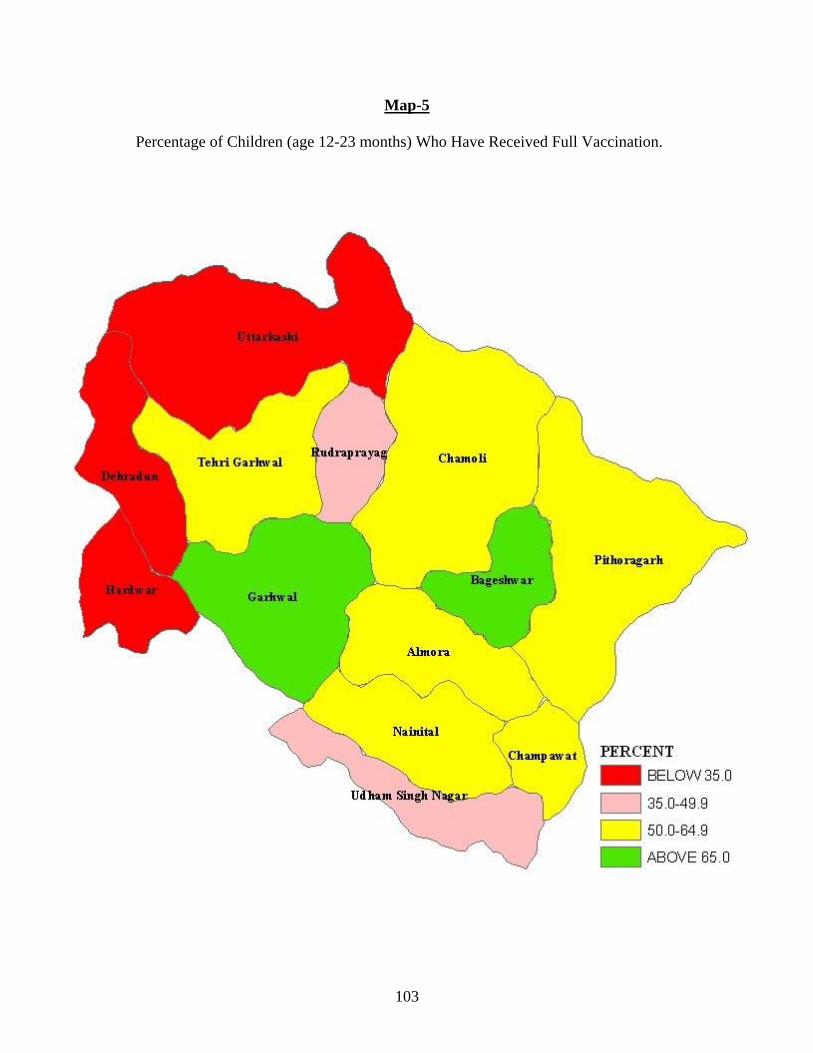
103
Map-5
Percentage of Children (age 12-23 months) Who Have Received Full Vaccination.
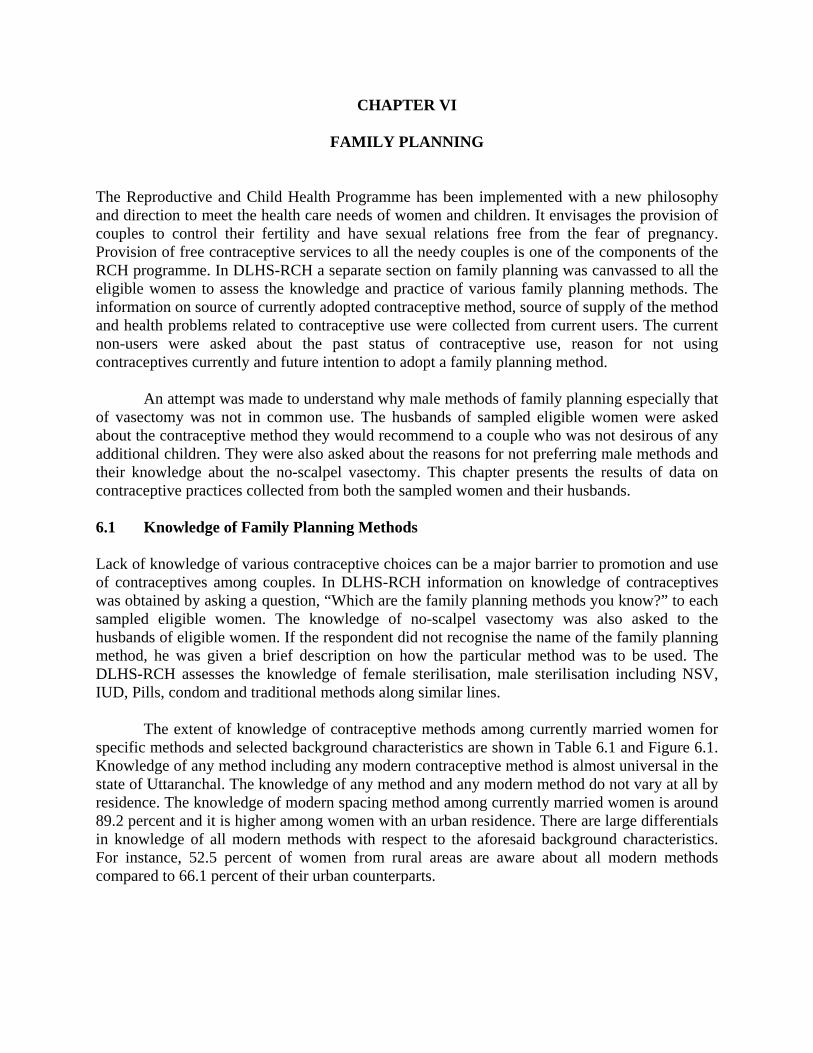
CHAPTER VI
FAMILY PLANNING The Reproductive and Child Health Programme has been implemented with a new philosophy and direction to meet the health care needs of women and children. It envisages the provision of couples to control their fertility and have sexual relations free from the fear of pregnancy. Provision of free contraceptive services to all the needy couples is one of the components of the RCH programme. In DLHS-RCH a separate section on family planning was canvassed to all the eligible women to assess the knowledge and practice of various family planning methods. The information on source of currently adopted contraceptive method, source of supply of the method and health problems related to contraceptive use were collected from current users. The current non-users were asked about the past status of contraceptive use, reason for not using contraceptives currently and future intention to adopt a family planning method.
An attempt was made to understand why male methods of family planning especially that of vasectomy was not in common use. The husbands of sampled eligible women were asked about the contraceptive method they would recommend to a couple who was not desirous of any additional children. They were also asked about the reasons for not preferring male methods and their knowledge about the no-scalpel vasectomy. This chapter presents the results of data on contraceptive practices collected from both the sampled women and their husbands. 6.1 Knowledge of Family Planning Methods Lack of knowledge of various contraceptive choices can be a major barrier to promotion and use of contraceptives among couples. In DLHS-RCH information on knowledge of contraceptives was obtained by asking a question, “Which are the family planning methods you know?” to each sampled eligible women. The knowledge of no-scalpel vasectomy was also asked to the husbands of eligible women. If the respondent did not recognise the name of the family planning method, he was given a brief description on how the particular method was to be used. The DLHS-RCH assesses the knowledge of female sterilisation, male sterilisation including NSV, IUD, Pills, condom and traditional methods along similar lines. The extent of knowledge of contraceptive methods among currently married women for specific methods and selected background characteristics are shown in Table 6.1 and Figure 6.1. Knowledge of any method including any modern contraceptive method is almost universal in the state of Uttaranchal. The knowledge of any method and any modern method do not vary at all by residence. The knowledge of modern spacing method among currently married women is around 89.2 percent and it is higher among women with an urban residence. There are large differentials in knowledge of all modern methods with respect to the aforesaid background characteristics. For instance, 52.5 percent of women from rural areas are aware about all modern methods compared to 66.1 percent of their urban counterparts.

106
Table 6.1 KNOWLEDGE OF CONTRACEPTIVE METHODS Percentage of currently married women age 15-44 years who know any contraceptive method by specific method and selected background characteristics, Uttaranchal, 2002-04
Contraceptive methods Total
Residence Availability of health facility in the village3
Rural Urban No Yes Any method Any modern method Any modern spacing method1 All modern methods2 Female sterilization Tubectomy Laparoscopy Male sterilization Vasectomy No-scalpel vasectomy IUD/Loop Pills Daily Weekly Condom/Nirodh Sponge (today) InjecTables Norplant Contraceptive herbs Any traditional method Any other Indian system of medicinal contraceptives Number of women
97.7 97.6 89.2 56.3
94.8 72.6 19.3
78.2 30.8 21.0
71.9
84.4 52.8 34.7 75.7
6.0 18.3
1.8 12.3 36.4
0.8
9,641
97.7 97.6 87.4 52.5
95.3 72.0 17.5
77.5 31.3 17.5
67.2
82.6 51.6 30.9 73.1
4.3 15.1
1.3 12.5 37.2
0.8
7,003
97.7 97.6 94.1 66.1
93.4 74.1 24.1
80.3 29.3 30.2
84.6
89.5 56.1 44.7 82.8 10.5 26.6
3.2 11.8 34.4
1.0
2,638
97.7 97.7 86.8 51.6
95.4 72.4 17.7
77.2 31.5 15.8
65.7
81.8 51.1 30.0 72.2
3.7 14.1
1.2 12.2 36.2
0.7
5,344
97.6 97.4 89.2 55.5
95.2 71.0 17.1
78.3 30.6 22.9
72.0
85.0 53.3 33.8 76.0
6.1 18.6
1.6 13.6 40.4
1.0
1,659
Note: 1 Include IUD, Pills and condom. 2 Include Female sterilization, Male sterilization, IUD, Pills and condom 3 Includes sub-centre, primary health centre, community health centre or referral hospital, government hospital, and government dispensary within the village.
Female sterilisation is the most widely known method of all contraceptive methods in Uttaranchal followed by Pills. Overall, 94.8 percent of currently married women are aware of female sterilization and 78.2 percent knew about male sterilization. There is a very small rural - urban difference in the knowledge of female sterilization and male sterilization. About 80.3 percent of urban women know about male sterilization as compared to 77.5 percent of rural women. There are differentials in spacing methods such as IUD/Loop, Pill and condom users with respect to the background characteristics. The best-known spacing methods are Pills (84.4 percent) and condoms (75.7 percent) respectively. About 71.9 percent of women know about the IUD/Loop. There is a large differential in knowledge of IUD/Loop by residence, as only 67.2 percent of the rural women know about them compared to 84.6 percent of urban women. The modern spacing methods, Pill and condom are known by 82.6 and 73.1 percent of rural women respectively while the corresponding figures in urban areas are 89.5 and 82.8 percent respectively of eligible women respondents. The knowledge of these spacing methods remains low as compared to knowledge of sterilization. In Uttaranchal, about 36.4 percent of the women are aware of a traditional method and only 0.8 percent are aware of other contraceptives of the Indian System of Medicine. It is also
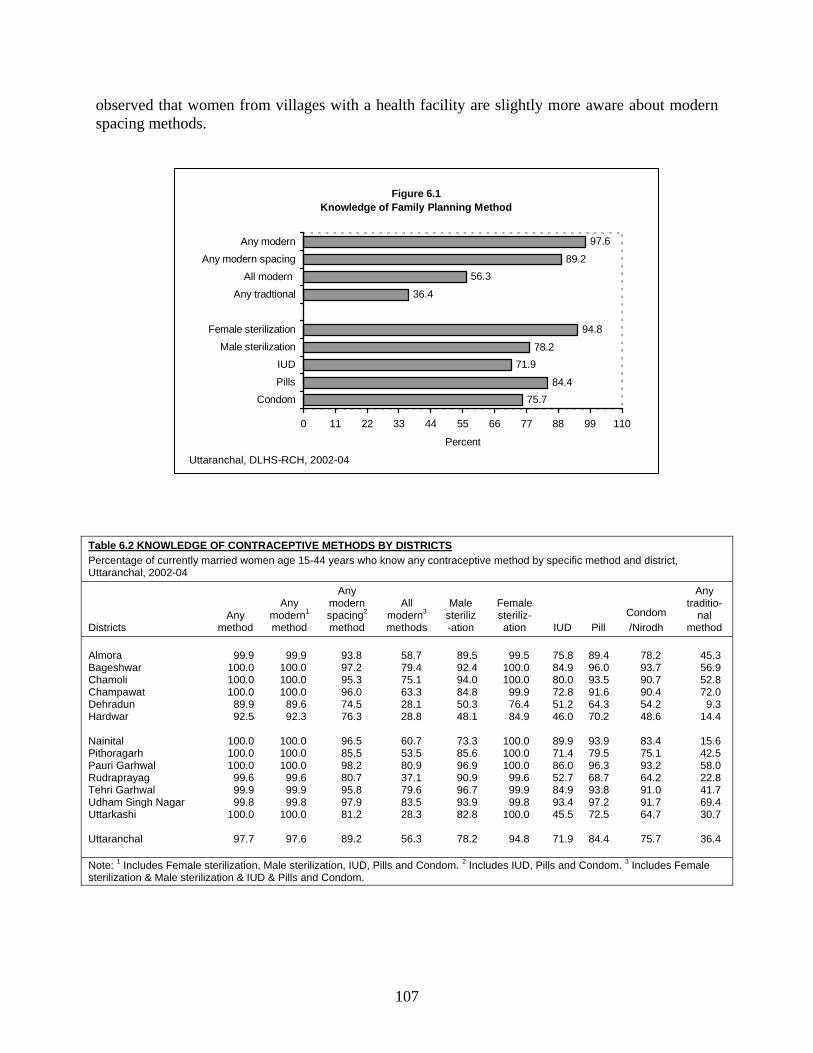
107
observed that women from villages with a health facility are slightly more aware about modern spacing methods.
Table 6.2 KNOWLEDGE OF CONTRACEPTIVE METHODS BY DISTRICTS Percentage of currently married women age 15-44 years who know any contraceptive method by specific method and district, Uttaranchal, 2002-04
Districts Any
method
Any modern1 method
Any modern spacing2 method
All modern3 methods
Male steriliz-ation
Female steriliz-ation IUD Pill
Condom /Nirodh
Any traditio-
nal method
Almora Bageshwar Chamoli Champawat Dehradun Hardwar Nainital Pithoragarh Pauri Garhwal Rudraprayag Tehri Garhwal Udham Singh Nagar Uttarkashi Uttaranchal
99.9
100.0 100.0 100.0
89.9 92.5
100.0 100.0 100.0
99.6 99.9 99.8
100.0
97.7
99.9
100.0 100.0 100.0
89.6 92.3
100.0 100.0 100.0
99.6 99.9 99.8
100.0
97.6
93.8 97.2 95.3 96.0 74.5 76.3
96.5 85.5 98.2 80.7 95.8 97.9 81.2
89.2
58.7 79.4 75.1 63.3 28.1 28.8
60.7 53.5 80.9 37.1 79.6 83.5 28.3
56.3
89.5 92.4 94.0 84.8 50.3 48.1
73.3 85.6 96.9 90.9 96.7 93.9 82.8
78.2
99.5
100.0 100.0
99.9 76.4 84.9
100.0 100.0 100.0
99.6 99.9 99.8
100.0
94.8
75.8 84.9 80.0 72.8 51.2 46.0
89.9 71.4 86.0 52.7 84.9 93.4 45.5
71.9
89.4 96.0 93.5 91.6 64.3 70.2
93.9 79.5 96.3 68.7 93.8 97.2 72.5
84.4
78.2 93.7 90.7 90.4 54.2 48.6
83.4 75.1 93.2 64.2 91.0 91.7 64.7
75.7
45.3 56.9 52.8 72.0
9.3 14.4
15.6 42.5 58.0 22.8 41.7 69.4 30.7
36.4
Note: 1 Includes Female sterilization, Male sterilization, IUD, Pills and Condom. 2 Includes IUD, Pills and Condom. 3 Includes Female sterilization & Male sterilization & IUD & Pills and Condom.
Figure 6.1Knowledge of Family Planning Method
75.784.4
71.978.2
94.8
36.4
56.389.2
97.6
0 11 22 33 44 55 66 77 88 99 110
Condom
Pills
IUD
Male sterilization
Female sterilization
Any tradtional
All modern
Any modern spacing
Any modern
Percent
Uttaranchal, DLHS-RCH, 2002-04
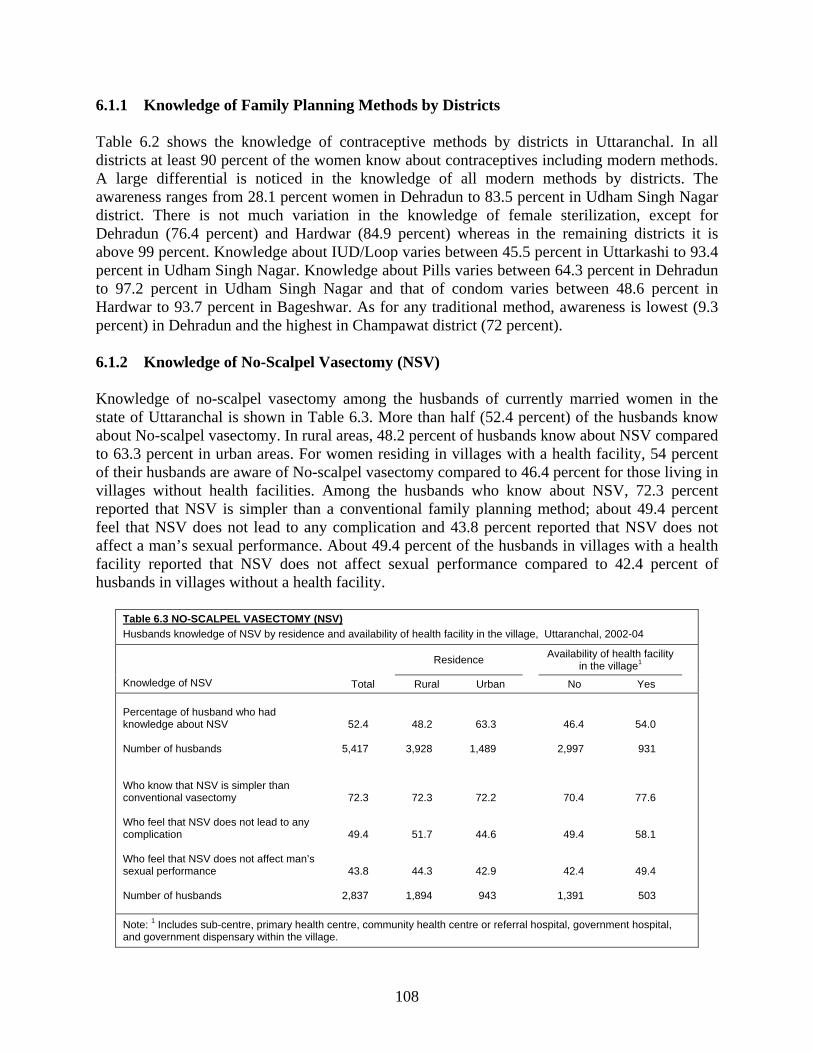
108
6.1.1 Knowledge of Family Planning Methods by Districts Table 6.2 shows the knowledge of contraceptive methods by districts in Uttaranchal. In all districts at least 90 percent of the women know about contraceptives including modern methods. A large differential is noticed in the knowledge of all modern methods by districts. The awareness ranges from 28.1 percent women in Dehradun to 83.5 percent in Udham Singh Nagar district. There is not much variation in the knowledge of female sterilization, except for Dehradun (76.4 percent) and Hardwar (84.9 percent) whereas in the remaining districts it is above 99 percent. Knowledge about IUD/Loop varies between 45.5 percent in Uttarkashi to 93.4 percent in Udham Singh Nagar. Knowledge about Pills varies between 64.3 percent in Dehradun to 97.2 percent in Udham Singh Nagar and that of condom varies between 48.6 percent in Hardwar to 93.7 percent in Bageshwar. As for any traditional method, awareness is lowest (9.3 percent) in Dehradun and the highest in Champawat district (72 percent). 6.1.2 Knowledge of No-Scalpel Vasectomy (NSV) Knowledge of no-scalpel vasectomy among the husbands of currently married women in the state of Uttaranchal is shown in Table 6.3. More than half (52.4 percent) of the husbands know about No-scalpel vasectomy. In rural areas, 48.2 percent of husbands know about NSV compared to 63.3 percent in urban areas. For women residing in villages with a health facility, 54 percent of their husbands are aware of No-scalpel vasectomy compared to 46.4 percent for those living in villages without health facilities. Among the husbands who know about NSV, 72.3 percent reported that NSV is simpler than a conventional family planning method; about 49.4 percent feel that NSV does not lead to any complication and 43.8 percent reported that NSV does not affect a man’s sexual performance. About 49.4 percent of the husbands in villages with a health facility reported that NSV does not affect sexual performance compared to 42.4 percent of husbands in villages without a health facility.
Table 6.3 NO-SCALPEL VASECTOMY (NSV) Husbands knowledge of NSV by residence and availability of health facility in the village, Uttaranchal, 2002-04
Knowledge of NSV Total
Residence Availability of health facility
in the village1
Rural Urban No Yes Percentage of husband who had knowledge about NSV Number of husbands Who know that NSV is simpler than conventional vasectomy Who feel that NSV does not lead to any complication Who feel that NSV does not affect man’s sexual performance Number of husbands
52.4
5,417
72.3
49.4
43.8
2,837
48.2
3,928
72.3
51.7
44.3
1,894
63.3
1,489
72.2
44.6
42.9
943
46.4
2,997
70.4
49.4
42.4
1,391
54.0
931
77.6
58.1
49.4
503
Note: 1 Includes sub-centre, primary health centre, community health centre or referral hospital, government hospital, and government dispensary within the village.
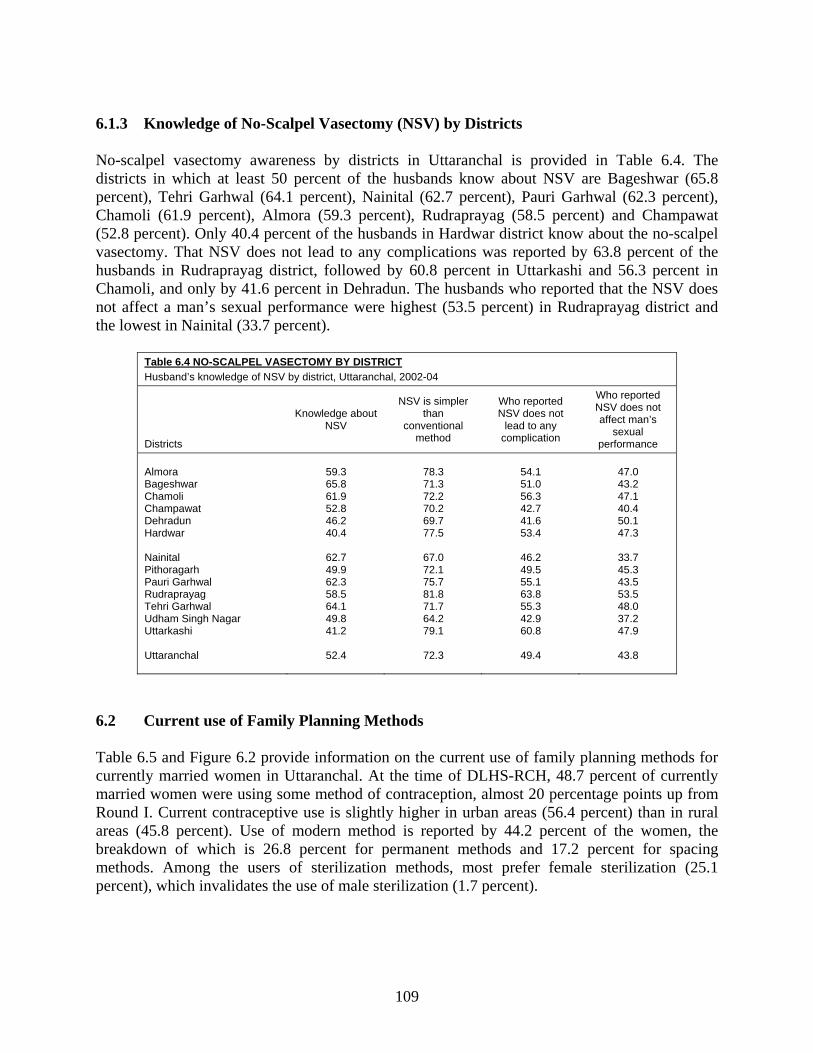
109
6.1.3 Knowledge of No-Scalpel Vasectomy (NSV) by Districts No-scalpel vasectomy awareness by districts in Uttaranchal is provided in Table 6.4. The districts in which at least 50 percent of the husbands know about NSV are Bageshwar (65.8 percent), Tehri Garhwal (64.1 percent), Nainital (62.7 percent), Pauri Garhwal (62.3 percent), Chamoli (61.9 percent), Almora (59.3 percent), Rudraprayag (58.5 percent) and Champawat (52.8 percent). Only 40.4 percent of the husbands in Hardwar district know about the no-scalpel vasectomy. That NSV does not lead to any complications was reported by 63.8 percent of the husbands in Rudraprayag district, followed by 60.8 percent in Uttarkashi and 56.3 percent in Chamoli, and only by 41.6 percent in Dehradun. The husbands who reported that the NSV does not affect a man’s sexual performance were highest (53.5 percent) in Rudraprayag district and the lowest in Nainital (33.7 percent).
Table 6.4 NO-SCALPEL VASECTOMY BY DISTRICT Husband’s knowledge of NSV by district, Uttaranchal, 2002-04
Districts
Knowledge about NSV
NSV is simpler than
conventional method
Who reported NSV does not
lead to any complication
Who reported NSV does not affect man’s
sexual performance
Almora Bageshwar Chamoli Champawat Dehradun Hardwar Nainital Pithoragarh Pauri Garhwal Rudraprayag Tehri Garhwal Udham Singh Nagar Uttarkashi Uttaranchal
59.3 65.8 61.9 52.8 46.2 40.4
62.7 49.9 62.3 58.5 64.1 49.8 41.2
52.4
78.3 71.3 72.2 70.2 69.7 77.5
67.0 72.1 75.7 81.8 71.7 64.2 79.1
72.3
54.1 51.0 56.3 42.7 41.6 53.4
46.2 49.5 55.1 63.8 55.3 42.9 60.8
49.4
47.0 43.2 47.1 40.4 50.1 47.3
33.7 45.3 43.5 53.5 48.0 37.2 47.9
43.8
6.2 Current use of Family Planning Methods Table 6.5 and Figure 6.2 provide information on the current use of family planning methods for currently married women in Uttaranchal. At the time of DLHS-RCH, 48.7 percent of currently married women were using some method of contraception, almost 20 percentage points up from Round I. Current contraceptive use is slightly higher in urban areas (56.4 percent) than in rural areas (45.8 percent). Use of modern method is reported by 44.2 percent of the women, the breakdown of which is 26.8 percent for permanent methods and 17.2 percent for spacing methods. Among the users of sterilization methods, most prefer female sterilization (25.1 percent), which invalidates the use of male sterilization (1.7 percent).
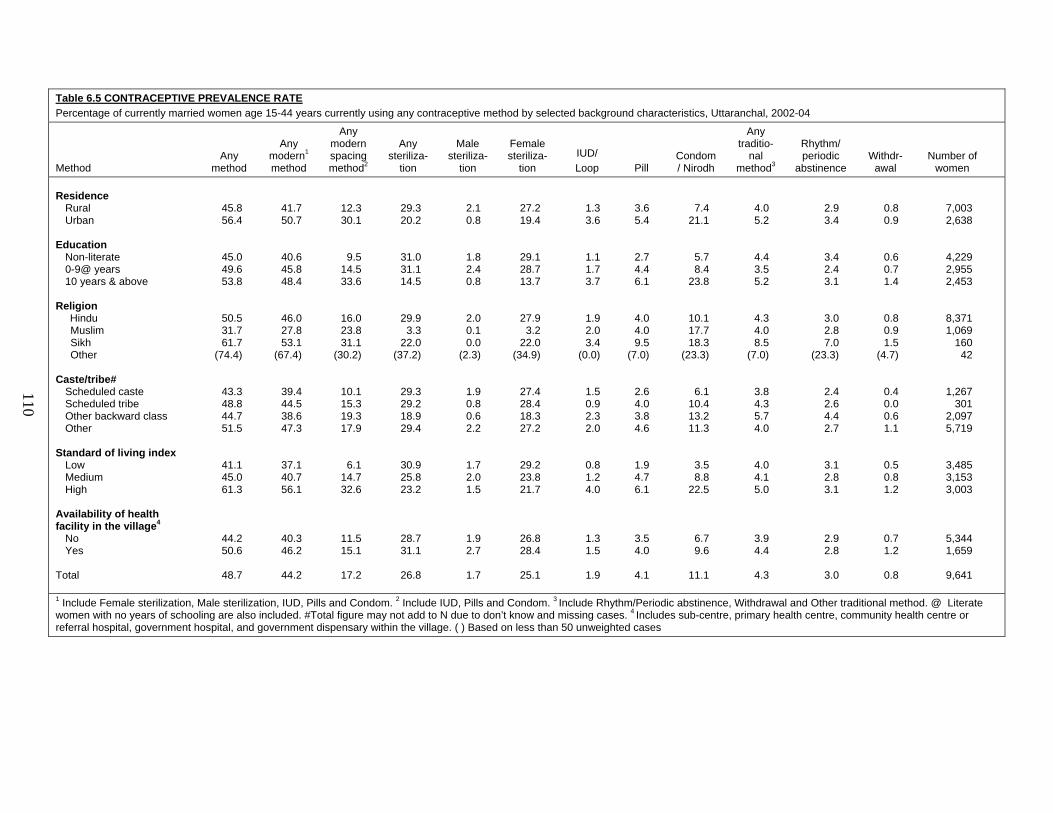
110
Table 6.5 CONTRACEPTIVE PREVALENCE RATE Percentage of currently married women age 15-44 years currently using any contraceptive method by selected background characteristics, Uttaranchal, 2002-04
Method Any
method
Any modern1 method
Any modern spacingmethod2
Any steriliza-
tion
Male steriliza-
tion
Female steriliza-
tion IUD/ Loop Pill
Condom / Nirodh
Any traditio-
nal method3
Rhythm/ periodic
abstinence Withdr-
awal Number of
women Residence Rural Urban Education Non-literate 0-9@ years 10 years & above Religion Hindu Muslim Sikh Other Caste/tribe# Scheduled caste Scheduled tribe Other backward class Other Standard of living index Low Medium High Availability of health facility in the village4 No Yes Total
45.8 56.4
45.0 49.6 53.8
50.5 31.7 61.7
(74.4)
43.3 48.8 44.7 51.5
41.1 45.0 61.3
44.2 50.6
48.7
41.7 50.7
40.6 45.8 48.4
46.0 27.8 53.1
(67.4)
39.4 44.5 38.6 47.3
37.1 40.7 56.1
40.3 46.2
44.2
12.3 30.1
9.5 14.5 33.6
16.0 23.8 31.1
(30.2)
10.1 15.3 19.3 17.9
6.1 14.7 32.6
11.5 15.1
17.2
29.3 20.2
31.0 31.1 14.5
29.9 3.3
22.0 (37.2)
29.3 29.2 18.9 29.4
30.9 25.8 23.2
28.7 31.1
26.8
2.1 0.8
1.8 2.4 0.8
2.0 0.1 0.0
(2.3)
1.9 0.8 0.6 2.2
1.7 2.0 1.5
1.9 2.7
1.7
27.2 19.4
29.1 28.7 13.7
27.9 3.2
22.0 (34.9)
27.4 28.4 18.3 27.2
29.2 23.8 21.7
26.8 28.4
25.1
1.3 3.6
1.1 1.7 3.7
1.9 2.0 3.4
(0.0)
1.5 0.9 2.3 2.0
0.8 1.2 4.0
1.3 1.5
1.9
3.6 5.4
2.7 4.4 6.1
4.0 4.0 9.5
(7.0)
2.6 4.0 3.8 4.6
1.9 4.7 6.1
3.5 4.0
4.1
7.4 21.1
5.7 8.4
23.8
10.1 17.7 18.3
(23.3)
6.1 10.4 13.2 11.3
3.5 8.8
22.5
6.7 9.6
11.1
4.0 5.2
4.4 3.5 5.2
4.3 4.0 8.5
(7.0)
3.8 4.3 5.7 4.0
4.0 4.1 5.0
3.9 4.4
4.3
2.9 3.4
3.4 2.4 3.1
3.0 2.8 7.0
(23.3)
2.4 2.6 4.4 2.7
3.1 2.8 3.1
2.9 2.8
3.0
0.8 0.9
0.6 0.7 1.4
0.8 0.9 1.5
(4.7)
0.4 0.0 0.6 1.1
0.5 0.8 1.2
0.7 1.2
0.8
7,003 2,638
4,229 2,955 2,453
8,371 1,069
160 42
1,267 301
2,097 5,719
3,485 3,153 3,003
5,344 1,659
9,641
1 Include Female sterilization, Male sterilization, IUD, Pills and Condom. 2 Include IUD, Pills and Condom. 3 Include Rhythm/Periodic abstinence, Withdrawal and Other traditional method. @ Literate women with no years of schooling are also included. #Total figure may not add to N due to don’t know and missing cases. 4 Includes sub-centre, primary health centre, community health centre or referral hospital, government hospital, and government dispensary within the village. ( ) Based on less than 50 unweighted cases
110
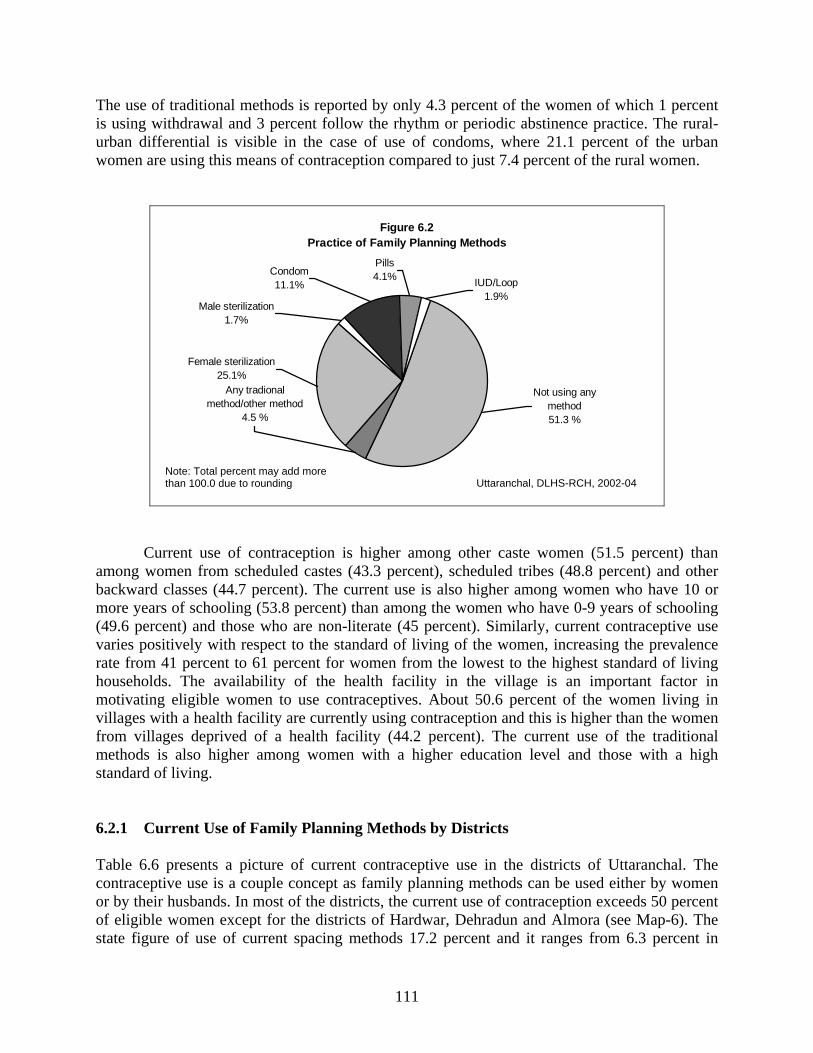
111
The use of traditional methods is reported by only 4.3 percent of the women of which 1 percent is using withdrawal and 3 percent follow the rhythm or periodic abstinence practice. The rural-urban differential is visible in the case of use of condoms, where 21.1 percent of the urban women are using this means of contraception compared to just 7.4 percent of the rural women.
Figure 6.2 Practice of Family Planning Methods
Condom11.1%
Male sterilization1.7%
IUD/Loop1.9%
Pills4.1%
Any tradional method/other method
4.5 %
Female sterilization25.1%
Not using any method51.3 %
Current use of contraception is higher among other caste women (51.5 percent) than among women from scheduled castes (43.3 percent), scheduled tribes (48.8 percent) and other backward classes (44.7 percent). The current use is also higher among women who have 10 or more years of schooling (53.8 percent) than among the women who have 0-9 years of schooling (49.6 percent) and those who are non-literate (45 percent). Similarly, current contraceptive use varies positively with respect to the standard of living of the women, increasing the prevalence rate from 41 percent to 61 percent for women from the lowest to the highest standard of living households. The availability of the health facility in the village is an important factor in motivating eligible women to use contraceptives. About 50.6 percent of the women living in villages with a health facility are currently using contraception and this is higher than the women from villages deprived of a health facility (44.2 percent). The current use of the traditional methods is also higher among women with a higher education level and those with a high standard of living. 6.2.1 Current Use of Family Planning Methods by Districts Table 6.6 presents a picture of current contraceptive use in the districts of Uttaranchal. The contraceptive use is a couple concept as family planning methods can be used either by women or by their husbands. In most of the districts, the current use of contraception exceeds 50 percent of eligible women except for the districts of Hardwar, Dehradun and Almora (see Map-6). The state figure of use of current spacing methods 17.2 percent and it ranges from 6.3 percent in
Note: Total percent may add more than 100.0 due to rounding Uttaranchal, DLHS-RCH, 2002-04
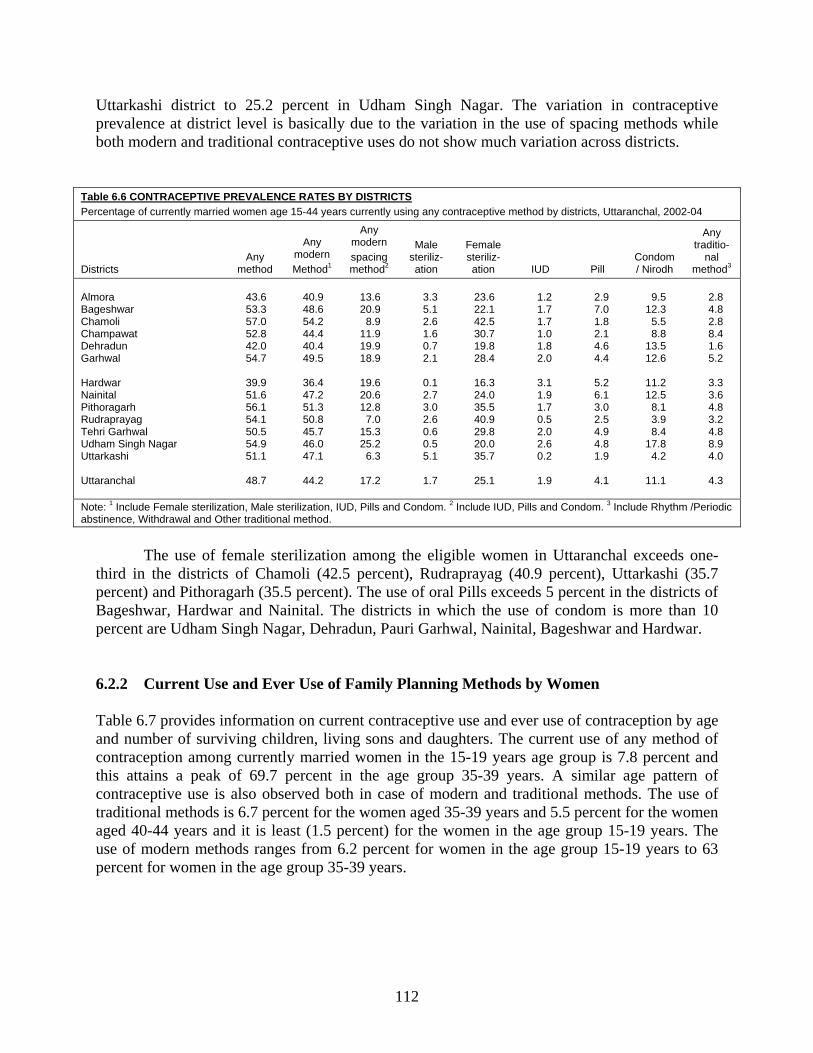
112
Uttarkashi district to 25.2 percent in Udham Singh Nagar. The variation in contraceptive prevalence at district level is basically due to the variation in the use of spacing methods while both modern and traditional contraceptive uses do not show much variation across districts.
Table 6.6 CONTRACEPTIVE PREVALENCE RATES BY DISTRICTS Percentage of currently married women age 15-44 years currently using any contraceptive method by districts, Uttaranchal, 2002-04
Districts Any
method
Any modern Method1
Any modern spacing method2
Male steriliz-ation
Female steriliz-ation IUD Pill
Condom/ Nirodh
Any traditio-
nal method3
Almora Bageshwar Chamoli Champawat Dehradun Garhwal Hardwar Nainital Pithoragarh Rudraprayag Tehri Garhwal Udham Singh Nagar Uttarkashi Uttaranchal
43.6 53.3 57.0 52.8 42.0 54.7
39.9 51.6 56.1 54.1 50.5 54.9 51.1
48.7
40.9 48.6 54.2 44.4 40.4 49.5
36.4 47.2 51.3 50.8 45.7 46.0 47.1
44.2
13.6 20.9
8.9 11.9 19.9 18.9
19.6 20.6 12.8
7.0 15.3 25.2
6.3
17.2
3.3 5.1 2.6 1.6 0.7 2.1
0.1 2.7 3.0 2.6 0.6 0.5 5.1
1.7
23.6 22.1 42.5 30.7 19.8 28.4
16.3 24.0 35.5 40.9 29.8 20.0 35.7
25.1
1.2 1.7 1.7 1.0 1.8 2.0
3.1 1.9 1.7 0.5 2.0 2.6 0.2
1.9
2.9 7.0 1.8 2.1 4.6 4.4
5.2 6.1 3.0 2.5 4.9 4.8 1.9
4.1
9.5
12.3 5.5 8.8
13.5 12.6
11.2 12.5
8.1 3.9 8.4
17.8 4.2
11.1
2.8 4.8 2.8 8.4 1.6 5.2
3.3 3.6 4.8 3.2 4.8 8.9 4.0
4.3
Note: 1 Include Female sterilization, Male sterilization, IUD, Pills and Condom. 2 Include IUD, Pills and Condom. 3 Include Rhythm /Periodic abstinence, Withdrawal and Other traditional method.
The use of female sterilization among the eligible women in Uttaranchal exceeds one-third in the districts of Chamoli (42.5 percent), Rudraprayag (40.9 percent), Uttarkashi (35.7 percent) and Pithoragarh (35.5 percent). The use of oral Pills exceeds 5 percent in the districts of Bageshwar, Hardwar and Nainital. The districts in which the use of condom is more than 10 percent are Udham Singh Nagar, Dehradun, Pauri Garhwal, Nainital, Bageshwar and Hardwar. 6.2.2 Current Use and Ever Use of Family Planning Methods by Women Table 6.7 provides information on current contraceptive use and ever use of contraception by age and number of surviving children, living sons and daughters. The current use of any method of contraception among currently married women in the 15-19 years age group is 7.8 percent and this attains a peak of 69.7 percent in the age group 35-39 years. A similar age pattern of contraceptive use is also observed both in case of modern and traditional methods. The use of traditional methods is 6.7 percent for the women aged 35-39 years and 5.5 percent for the women aged 40-44 years and it is least (1.5 percent) for the women in the age group 15-19 years. The use of modern methods ranges from 6.2 percent for women in the age group 15-19 years to 63 percent for women in the age group 35-39 years.

113
Table 6.7 USE OF CONTRACEPTION BY WOMEN Percentage of currently married women in 15-44 years by current use and ever use of contraception according to selected demographic characteristics, Uttaranchal, 2002-04
Demographic Characteristic
Percentage of women/husbands using
Percentage of women/husbands by contraceptive status
Number of
women
Any modern
method1
Any traditionalmethod2
Any method
Not using any
method Ever used Never used Age-group 15-19 20-24 25-29 30-34 35-39 40-44 Surviving children 0 1 2 3 or more Surviving sons 0 1 2 or more Surviving daughters 0 1 2 or more All women
6.2 15.0 41.9 57.3 63.0 60.6
2.6 22.4 52.4 57.1
13.8 44.9 61.7
31.8 51.9 48.7
44.2
1.5 2.6 3.3 5.0 6.7 5.5
0.9 2.7 5.3 5.2
2.2 5.3 4.8
2.7 4.7 5.6
4.3
7.8 17.6 45.2 62.3 69.7 67.1
3.5 25.1 57.7 62.6
16.0 50.1 66.8
34.8 56.7 54.3
48.7
92.2 82.4 54.8 37.7 30.3 32.9
96.5 74.9 42.3 37.4
84.0 49.9 33.2
65.2 43.3 45.7
51.3
8.7 22.9 50.3 66.1 72.1 71.2
5.1 31.4 61.9 66.6
20.1 54.5 70.8
38.0 61.5 58.5
52.8
91.3 77.1 49.5 33.9 27.8 28.8
94.9 68.6 38.1 33.3
79.9 45.4 29.2
61.9 38.4 41.4
47.2
383 2,042 2,235 1,955 1,688 1,338
1,132 1,495 2,326 4,689
2,373 3,279 3,989
3,178 3,214 3,250
9,641
Note: 1 Include Female sterilization, Male sterilization, IUD, Pills and Condom. 2 Include Rhythm/Periodic abstinence, Withdrawal and Other traditional method.
It is crucial to understand the association between the number of living children and contraceptive use. The contraceptive use is highest among the women who have three or more surviving children invariably of methods in Uttaranchal. The use of any method of contraception is 66.8 percent for the women who have two or more sons and is marginally higher than the women who have two or more daughters (54.3 percent). The same trend can be observed in the case of use of any modern method which is 61.7 percent for the women who have two or more surviving sons and it is higher than the women who have two or more daughters (48.7 percent). 6.2.3 Current Use and Ever Use of Family Planning Methods as Reported by Husbands Information pertaining to current use of family planning methods among the husbands of currently married women in Uttaranchal by age and number of surviving children, sons and daughters are given in Table 6.8. The current use of any method of contraception among the husbands (aged below 25 years) of currently married women is 16.5 percent and it gradually picks up with the age of husband, to a peak of 72.1 percent in the age group 45+ years. Similar age patterns of contraceptive use are observed both in the case of modern and traditional methods. Among the husbands in the age group 45 years and above, the use of traditional methods is 7 percent and it is least (1.1 percent) among the husbands in the younger age group of
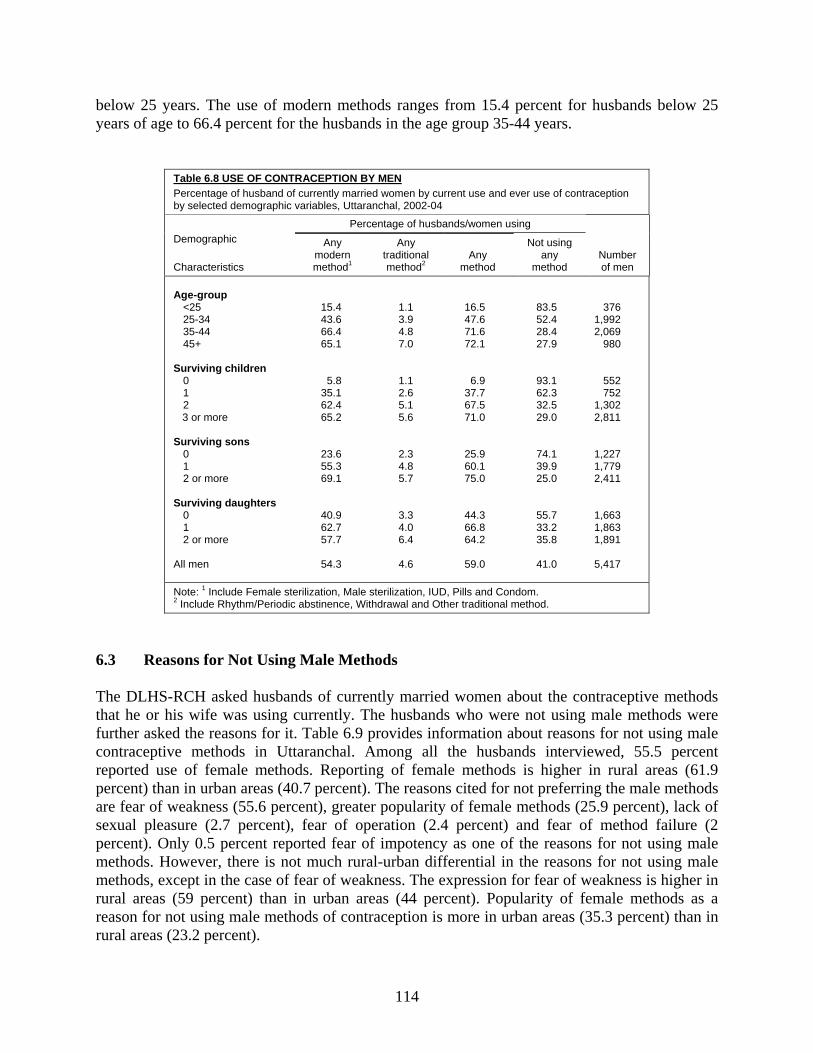
114
below 25 years. The use of modern methods ranges from 15.4 percent for husbands below 25 years of age to 66.4 percent for the husbands in the age group 35-44 years.
Table 6.8 USE OF CONTRACEPTION BY MEN Percentage of husband of currently married women by current use and ever use of contraception by selected demographic variables, Uttaranchal, 2002-04
Demographic
Characteristics
Percentage of husbands/women using
Number of men
Any modern
method1
Any traditionalmethod2
Any method
Not using any
method Age-group <25 25-34 35-44 45+ Surviving children 0 1 2 3 or more Surviving sons 0 1 2 or more Surviving daughters 0 1 2 or more All men
15.4 43.6 66.4 65.1
5.8 35.1 62.4 65.2
23.6 55.3 69.1
40.9 62.7 57.7
54.3
1.1 3.9 4.8 7.0
1.1 2.6 5.1 5.6
2.3 4.8 5.7
3.3 4.0 6.4
4.6
16.5 47.6 71.6 72.1
6.9 37.7 67.5 71.0
25.9 60.1 75.0
44.3 66.8 64.2
59.0
83.5 52.4 28.4 27.9
93.1 62.3 32.5 29.0
74.1 39.9 25.0
55.7 33.2 35.8
41.0
376 1,992 2,069
980
552 752
1,302 2,811
1,227 1,779 2,411
1,663 1,863 1,891
5,417
Note: 1 Include Female sterilization, Male sterilization, IUD, Pills and Condom. 2 Include Rhythm/Periodic abstinence, Withdrawal and Other traditional method.
6.3 Reasons for Not Using Male Methods The DLHS-RCH asked husbands of currently married women about the contraceptive methods that he or his wife was using currently. The husbands who were not using male methods were further asked the reasons for it. Table 6.9 provides information about reasons for not using male contraceptive methods in Uttaranchal. Among all the husbands interviewed, 55.5 percent reported use of female methods. Reporting of female methods is higher in rural areas (61.9 percent) than in urban areas (40.7 percent). The reasons cited for not preferring the male methods are fear of weakness (55.6 percent), greater popularity of female methods (25.9 percent), lack of sexual pleasure (2.7 percent), fear of operation (2.4 percent) and fear of method failure (2 percent). Only 0.5 percent reported fear of impotency as one of the reasons for not using male methods. However, there is not much rural-urban differential in the reasons for not using male methods, except in the case of fear of weakness. The expression for fear of weakness is higher in rural areas (59 percent) than in urban areas (44 percent). Popularity of female methods as a reason for not using male methods of contraception is more in urban areas (35.3 percent) than in rural areas (23.2 percent).
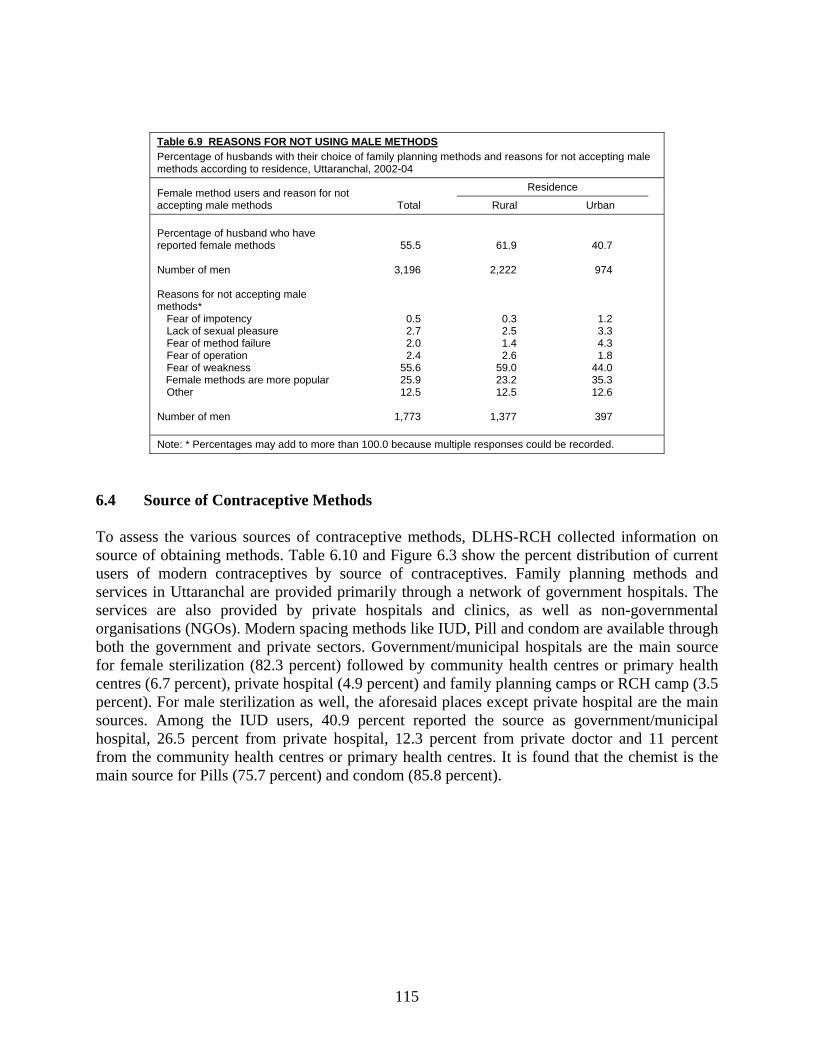
115
Table 6.9 REASONS FOR NOT USING MALE METHODS Percentage of husbands with their choice of family planning methods and reasons for not accepting male methods according to residence, Uttaranchal, 2002-04
Female method users and reason for not accepting male methods Total
Residence
Rural Urban Percentage of husband who have reported female methods Number of men Reasons for not accepting male methods* Fear of impotency Lack of sexual pleasure Fear of method failure Fear of operation Fear of weakness Female methods are more popular Other Number of men
55.5
3,196
0.5 2.7 2.0 2.4
55.6 25.9 12.5
1,773
61.9
2,222
0.3 2.5 1.4 2.6
59.0 23.2 12.5
1,377
40.7
974
1.2 3.3 4.3 1.8
44.0 35.3 12.6
397
Note: * Percentages may add to more than 100.0 because multiple responses could be recorded.
6.4 Source of Contraceptive Methods To assess the various sources of contraceptive methods, DLHS-RCH collected information on source of obtaining methods. Table 6.10 and Figure 6.3 show the percent distribution of current users of modern contraceptives by source of contraceptives. Family planning methods and services in Uttaranchal are provided primarily through a network of government hospitals. The services are also provided by private hospitals and clinics, as well as non-governmental organisations (NGOs). Modern spacing methods like IUD, Pill and condom are available through both the government and private sectors. Government/municipal hospitals are the main source for female sterilization (82.3 percent) followed by community health centres or primary health centres (6.7 percent), private hospital (4.9 percent) and family planning camps or RCH camp (3.5 percent). For male sterilization as well, the aforesaid places except private hospital are the main sources. Among the IUD users, 40.9 percent reported the source as government/municipal hospital, 26.5 percent from private hospital, 12.3 percent from private doctor and 11 percent from the community health centres or primary health centres. It is found that the chemist is the main source for Pills (75.7 percent) and condom (85.8 percent).
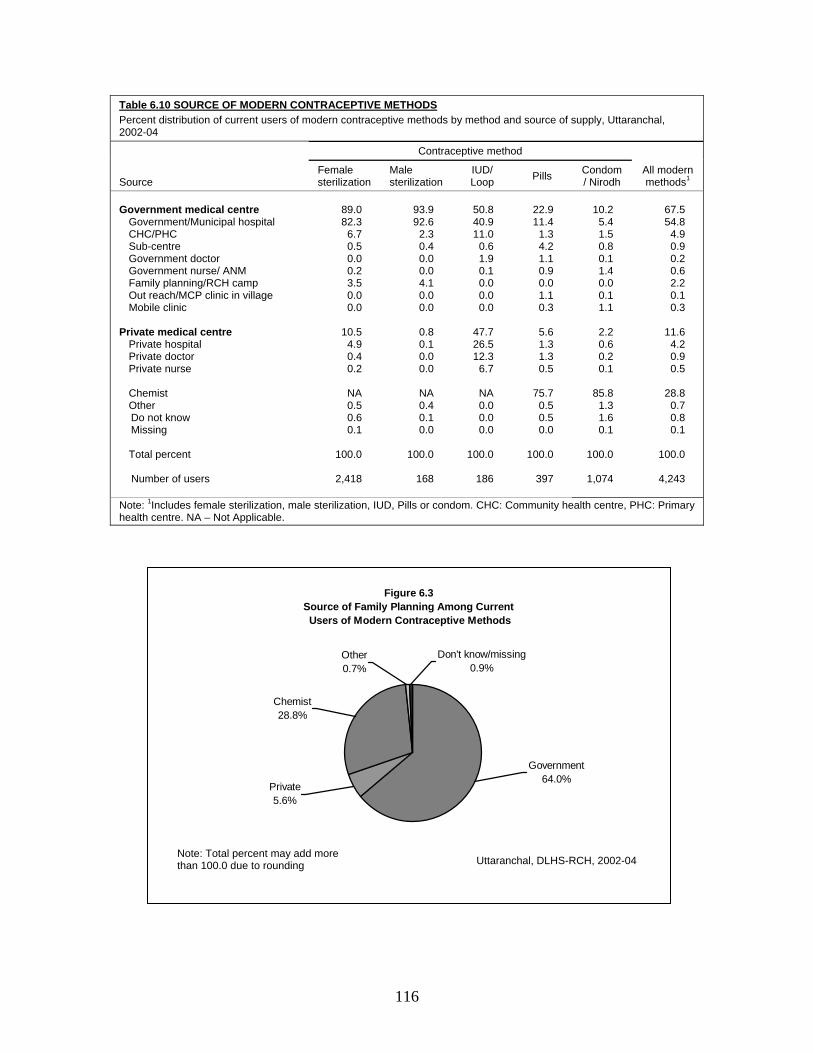
116
Table 6.10 SOURCE OF MODERN CONTRACEPTIVE METHODS Percent distribution of current users of modern contraceptive methods by method and source of supply, Uttaranchal, 2002-04
Source
Contraceptive method
All modern methods1
Female sterilization
Male sterilization
IUD/ Loop Pills Condom
/ Nirodh Government medical centre Government/Municipal hospital CHC/PHC Sub-centre Government doctor Government nurse/ ANM Family planning/RCH camp Out reach/MCP clinic in village Mobile clinic Private medical centre Private hospital Private doctor Private nurse Chemist Other Do not know Missing Total percent Number of users
89.0 82.3
6.7 0.5 0.0 0.2 3.5 0.0 0.0
10.5
4.9 0.4 0.2
NA 0.5 0.6 0.1
100.0
2,418
93.9 92.6
2.3 0.4 0.0 0.0 4.1 0.0 0.0
0.8 0.1 0.0 0.0
NA 0.4 0.1 0.0
100.0
168
50.8 40.9 11.0
0.6 1.9 0.1 0.0 0.0 0.0
47.7 26.5 12.3
6.7
NA 0.0 0.0 0.0
100.0
186
22.9 11.4
1.3 4.2 1.1 0.9 0.0 1.1 0.3
5.6 1.3 1.3 0.5
75.7
0.5 0.5 0.0
100.0
397
10.2
5.4 1.5 0.8 0.1 1.4 0.0 0.1 1.1
2.2 0.6 0.2 0.1
85.8
1.3 1.6 0.1
100.0
1,074
67.5 54.8
4.9 0.9 0.2 0.6 2.2 0.1 0.3
11.6
4.2 0.9 0.5
28.8
0.7 0.8 0.1
100.0
4,243
Note: 1Includes female sterilization, male sterilization, IUD, Pills or condom. CHC: Community health centre, PHC: Primary health centre. NA – Not Applicable.
Figure 6.3 Source of Family Planning Among Current Users of Modern Contraceptive Methods
Chemist28.8%
Private5.6%
Government64.0%
Other0.7%
Don't know/missing0.9%
Uttaranchal, DLHS-RCH, 2002-04 Note: Total percent may add more than 100.0 due to rounding
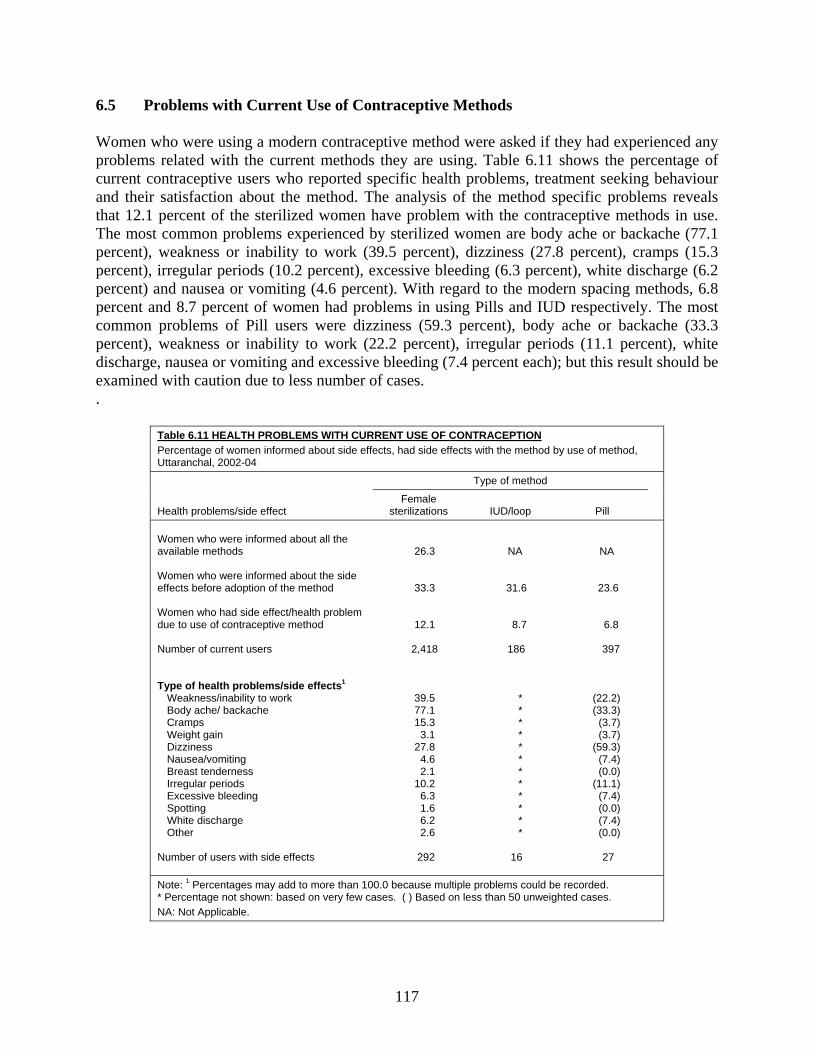
117
6.5 Problems with Current Use of Contraceptive Methods Women who were using a modern contraceptive method were asked if they had experienced any problems related with the current methods they are using. Table 6.11 shows the percentage of current contraceptive users who reported specific health problems, treatment seeking behaviour and their satisfaction about the method. The analysis of the method specific problems reveals that 12.1 percent of the sterilized women have problem with the contraceptive methods in use. The most common problems experienced by sterilized women are body ache or backache (77.1 percent), weakness or inability to work (39.5 percent), dizziness (27.8 percent), cramps (15.3 percent), irregular periods (10.2 percent), excessive bleeding (6.3 percent), white discharge (6.2 percent) and nausea or vomiting (4.6 percent). With regard to the modern spacing methods, 6.8 percent and 8.7 percent of women had problems in using Pills and IUD respectively. The most common problems of Pill users were dizziness (59.3 percent), body ache or backache (33.3 percent), weakness or inability to work (22.2 percent), irregular periods (11.1 percent), white discharge, nausea or vomiting and excessive bleeding (7.4 percent each); but this result should be examined with caution due to less number of cases. .
Table 6.11 HEALTH PROBLEMS WITH CURRENT USE OF CONTRACEPTION Percentage of women informed about side effects, had side effects with the method by use of method, Uttaranchal, 2002-04
Health problems/side effect
Type of method
Female sterilizations IUD/loop Pill
Women who were informed about all the available methods Women who were informed about the side effects before adoption of the method Women who had side effect/health problem due to use of contraceptive method Number of current users Type of health problems/side effects1 Weakness/inability to work Body ache/ backache Cramps Weight gain Dizziness Nausea/vomiting Breast tenderness Irregular periods Excessive bleeding Spotting White discharge Other Number of users with side effects
26.3
33.3
12.1
2,418
39.5 77.1 15.3
3.1 27.8
4.6 2.1
10.2 6.3 1.6 6.2 2.6
292
NA
31.6
8.7
186
* * * * * * * * * * * *
16
NA
23.6
6.8
397
(22.2) (33.3)
(3.7) (3.7)
(59.3) (7.4) (0.0)
(11.1) (7.4) (0.0) (7.4) (0.0)
27
Note: 1 Percentages may add to more than 100.0 because multiple problems could be recorded. * Percentage not shown: based on very few cases. ( ) Based on less than 50 unweighted cases. NA: Not Applicable.
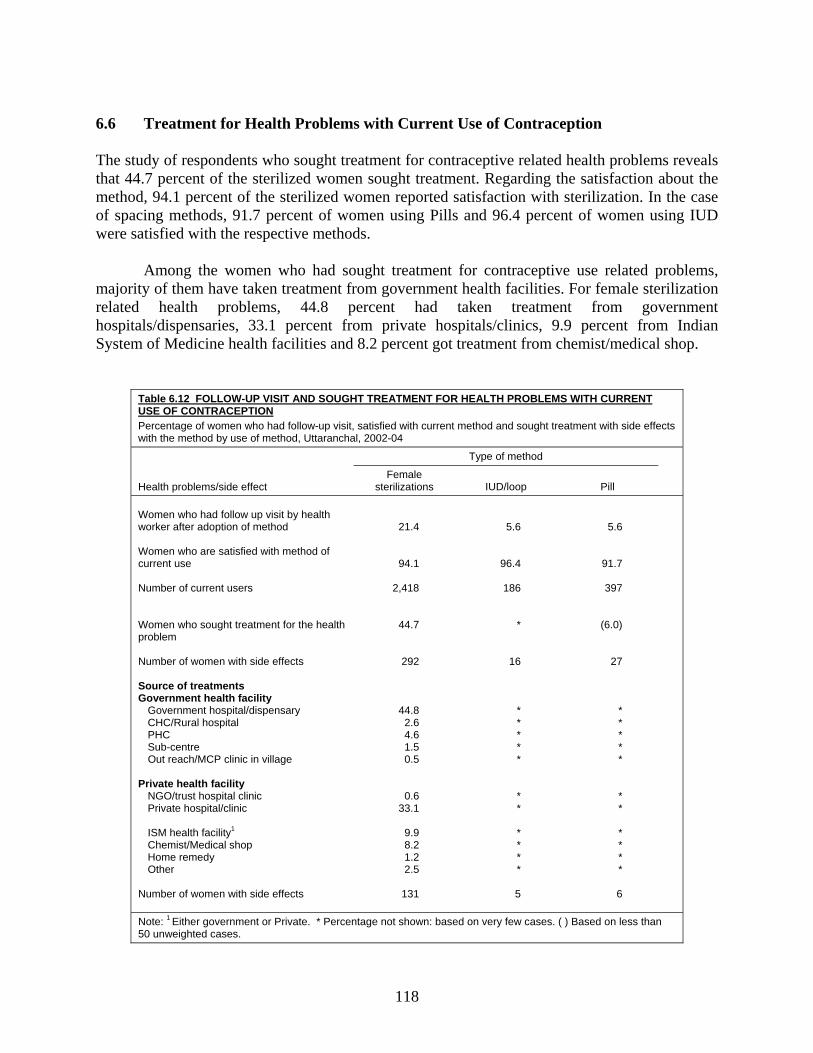
118
6.6 Treatment for Health Problems with Current Use of Contraception The study of respondents who sought treatment for contraceptive related health problems reveals that 44.7 percent of the sterilized women sought treatment. Regarding the satisfaction about the method, 94.1 percent of the sterilized women reported satisfaction with sterilization. In the case of spacing methods, 91.7 percent of women using Pills and 96.4 percent of women using IUD were satisfied with the respective methods.
Among the women who had sought treatment for contraceptive use related problems, majority of them have taken treatment from government health facilities. For female sterilization related health problems, 44.8 percent had taken treatment from government hospitals/dispensaries, 33.1 percent from private hospitals/clinics, 9.9 percent from Indian System of Medicine health facilities and 8.2 percent got treatment from chemist/medical shop.
Table 6.12 FOLLOW-UP VISIT AND SOUGHT TREATMENT FOR HEALTH PROBLEMS WITH CURRENT USE OF CONTRACEPTION Percentage of women who had follow-up visit, satisfied with current method and sought treatment with side effects with the method by use of method, Uttaranchal, 2002-04
Health problems/side effect
Type of method
Female sterilizations IUD/loop Pill
Women who had follow up visit by health worker after adoption of method Women who are satisfied with method of current use Number of current users Women who sought treatment for the health problem Number of women with side effects Source of treatments Government health facility
Government hospital/dispensary CHC/Rural hospital PHC Sub-centre Out reach/MCP clinic in village
Private health facility NGO/trust hospital clinic Private hospital/clinic ISM health facility1 Chemist/Medical shop Home remedy Other Number of women with side effects
21.4
94.1
2,418
44.7
292
44.8 2.6 4.6 1.5 0.5
0.6 33.1
9.9 8.2 1.2 2.5
131
5.6
96.4
186
*
16
* * * * *
* *
* * * *
5
5.6
91.7
397
(6.0)
27
* * * * *
* *
* * * *
6
Note: 1 Either government or Private. * Percentage not shown: based on very few cases. ( ) Based on less than 50 unweighted cases.
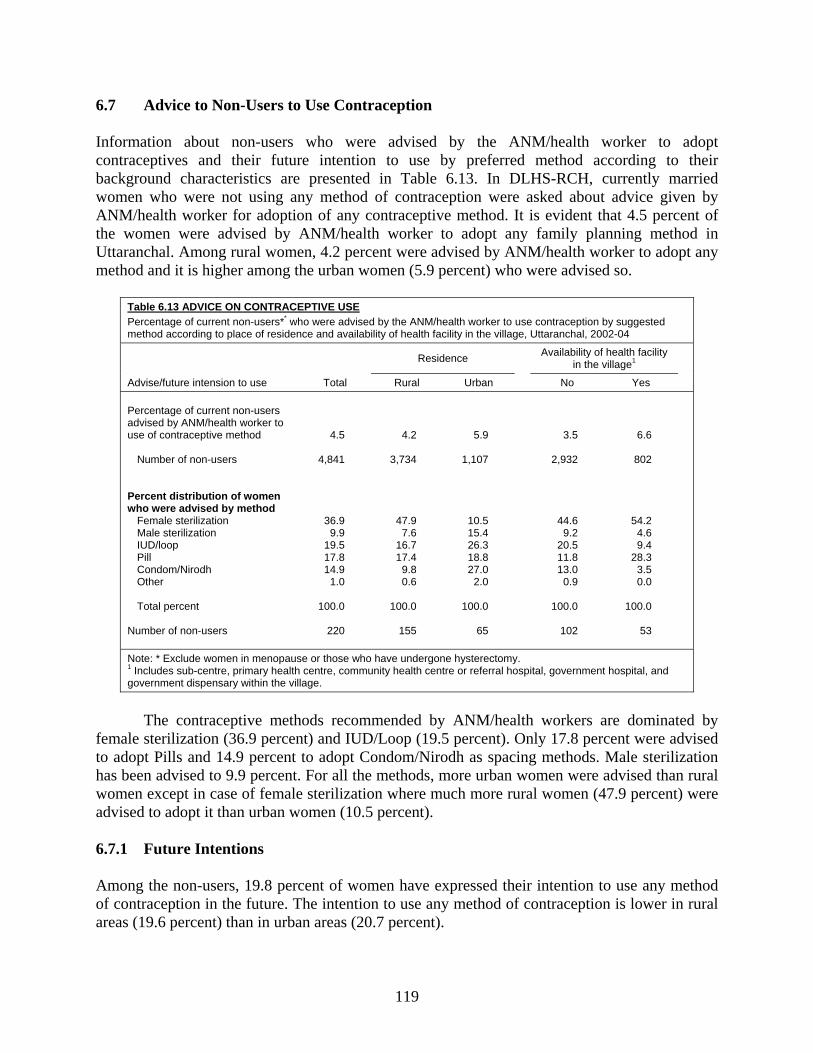
119
6.7 Advice to Non-Users to Use Contraception Information about non-users who were advised by the ANM/health worker to adopt contraceptives and their future intention to use by preferred method according to their background characteristics are presented in Table 6.13. In DLHS-RCH, currently married women who were not using any method of contraception were asked about advice given by ANM/health worker for adoption of any contraceptive method. It is evident that 4.5 percent of the women were advised by ANM/health worker to adopt any family planning method in Uttaranchal. Among rural women, 4.2 percent were advised by ANM/health worker to adopt any method and it is higher among the urban women (5.9 percent) who were advised so.
Table 6.13 ADVICE ON CONTRACEPTIVE USE Percentage of current non-users** who were advised by the ANM/health worker to use contraception by suggested method according to place of residence and availability of health facility in the village, Uttaranchal, 2002-04
Advise/future intension to use Total
Residence Availability of health facility
in the village1
Rural Urban No Yes Percentage of current non-users
advised by ANM/health worker to use of contraceptive method Number of non-users Percent distribution of women who were advised by method Female sterilization Male sterilization IUD/loop Pill Condom/Nirodh Other Total percent Number of non-users
4.5
4,841
36.9 9.9
19.5 17.8 14.9
1.0
100.0
220
4.2
3,734
47.9 7.6
16.7 17.4
9.8 0.6
100.0
155
5.9
1,107
10.5 15.4 26.3 18.8 27.0
2.0
100.0
65
3.5
2,932
44.6 9.2
20.5 11.8 13.0
0.9
100.0
102
6.6
802
54.2 4.6 9.4
28.3 3.5 0.0
100.0
53
Note: * Exclude women in menopause or those who have undergone hysterectomy. 1 Includes sub-centre, primary health centre, community health centre or referral hospital, government hospital, and government dispensary within the village.
The contraceptive methods recommended by ANM/health workers are dominated by
female sterilization (36.9 percent) and IUD/Loop (19.5 percent). Only 17.8 percent were advised to adopt Pills and 14.9 percent to adopt Condom/Nirodh as spacing methods. Male sterilization has been advised to 9.9 percent. For all the methods, more urban women were advised than rural women except in case of female sterilization where much more rural women (47.9 percent) were advised to adopt it than urban women (10.5 percent).
6.7.1 Future Intentions Among the non-users, 19.8 percent of women have expressed their intention to use any method of contraception in the future. The intention to use any method of contraception is lower in rural areas (19.6 percent) than in urban areas (20.7 percent).
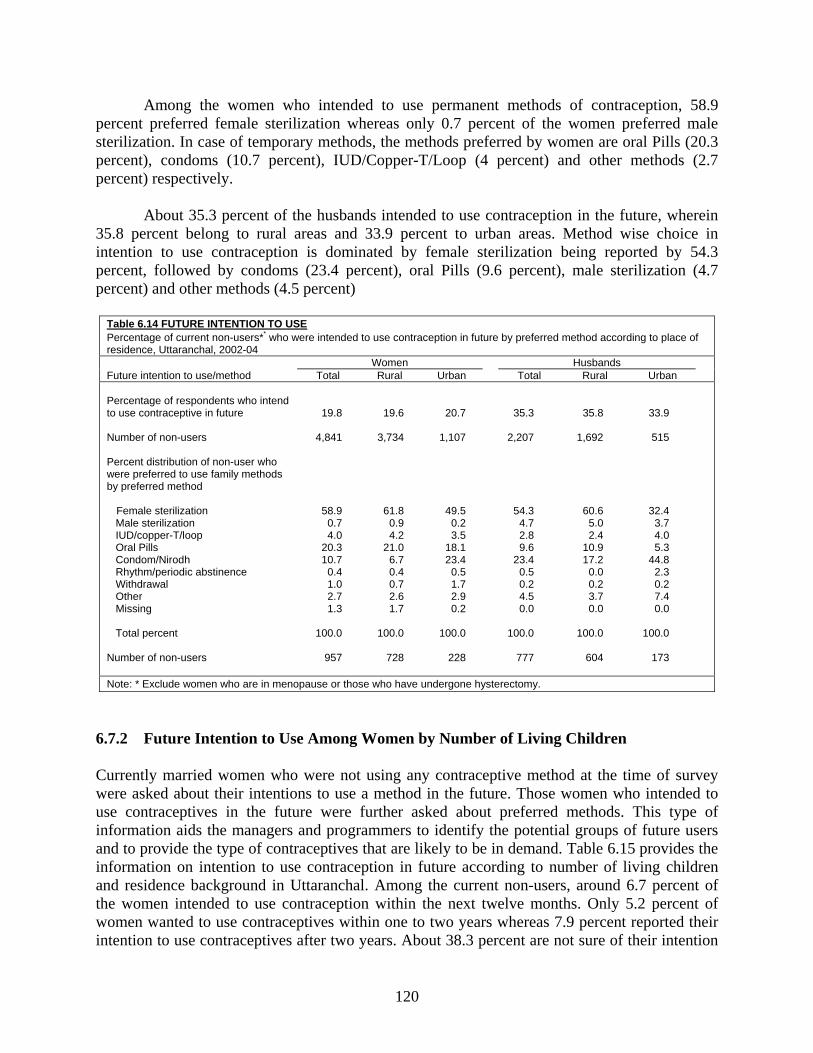
120
Among the women who intended to use permanent methods of contraception, 58.9 percent preferred female sterilization whereas only 0.7 percent of the women preferred male sterilization. In case of temporary methods, the methods preferred by women are oral Pills (20.3 percent), condoms (10.7 percent), IUD/Copper-T/Loop (4 percent) and other methods (2.7 percent) respectively.
About 35.3 percent of the husbands intended to use contraception in the future, wherein 35.8 percent belong to rural areas and 33.9 percent to urban areas. Method wise choice in intention to use contraception is dominated by female sterilization being reported by 54.3 percent, followed by condoms (23.4 percent), oral Pills (9.6 percent), male sterilization (4.7 percent) and other methods (4.5 percent)
Table 6.14 FUTURE INTENTION TO USE Percentage of current non-users** who were intended to use contraception in future by preferred method according to place of residence, Uttaranchal, 2002-04
Future intention to use/method Women Husbands
Total Rural Urban Total Rural Urban Percentage of respondents who intend to use contraceptive in future Number of non-users Percent distribution of non-user who were preferred to use family methods by preferred method Female sterilization Male sterilization IUD/copper-T/loop Oral Pills Condom/Nirodh Rhythm/periodic abstinence Withdrawal Other Missing Total percent Number of non-users
19.8
4,841
58.9 0.7 4.0
20.3 10.7
0.4 1.0 2.7 1.3
100.0
957
19.6
3,734
61.8 0.9 4.2
21.0 6.7 0.4 0.7 2.6 1.7
100.0
728
20.7
1,107
49.5 0.2 3.5
18.1 23.4
0.5 1.7 2.9 0.2
100.0
228
35.3
2,207
54.3 4.7 2.8 9.6
23.4 0.5 0.2 4.5 0.0
100.0
777
35.8
1,692
60.6 5.0 2.4
10.9 17.2
0.0 0.2 3.7 0.0
100.0
604
33.9
515
32.4 3.7 4.0 5.3
44.8 2.3 0.2 7.4 0.0
100.0
173
Note: * Exclude women who are in menopause or those who have undergone hysterectomy.
6.7.2 Future Intention to Use Among Women by Number of Living Children Currently married women who were not using any contraceptive method at the time of survey were asked about their intentions to use a method in the future. Those women who intended to use contraceptives in the future were further asked about preferred methods. This type of information aids the managers and programmers to identify the potential groups of future users and to provide the type of contraceptives that are likely to be in demand. Table 6.15 provides the information on intention to use contraception in future according to number of living children and residence background in Uttaranchal. Among the current non-users, around 6.7 percent of the women intended to use contraception within the next twelve months. Only 5.2 percent of women wanted to use contraceptives within one to two years whereas 7.9 percent reported their intention to use contraceptives after two years. About 38.3 percent are not sure of their intention
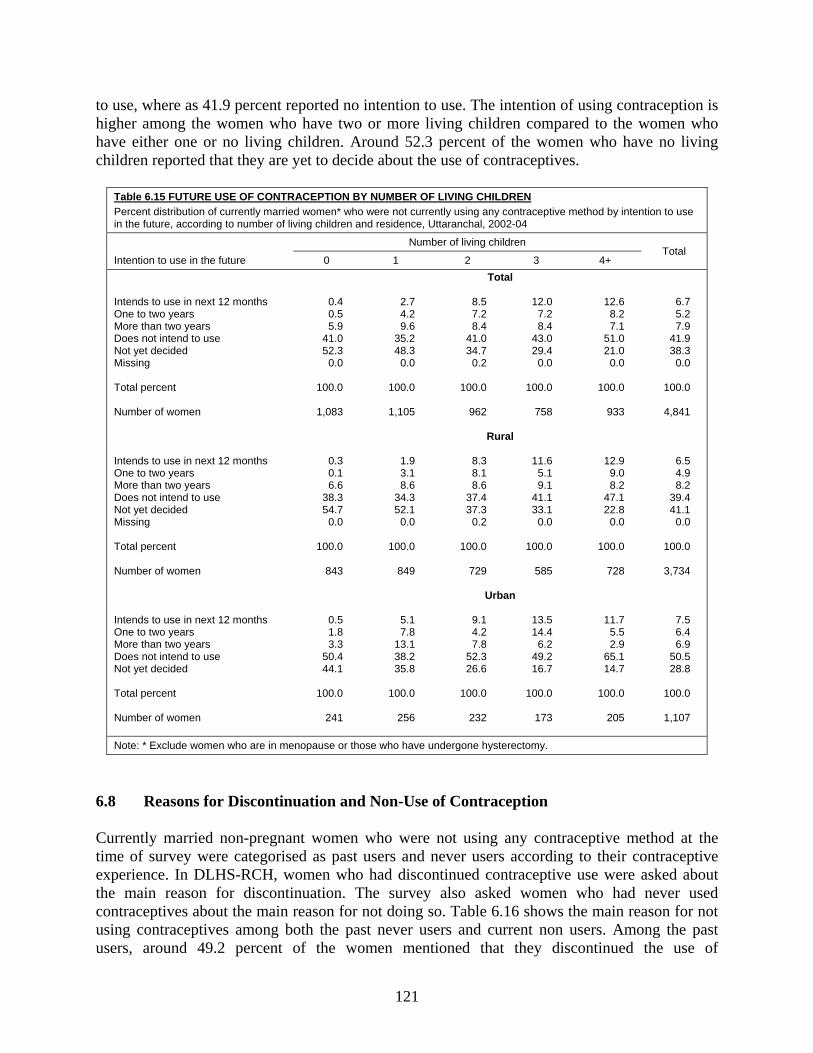
121
to use, where as 41.9 percent reported no intention to use. The intention of using contraception is higher among the women who have two or more living children compared to the women who have either one or no living children. Around 52.3 percent of the women who have no living children reported that they are yet to decide about the use of contraceptives.
Table 6.15 FUTURE USE OF CONTRACEPTION BY NUMBER OF LIVING CHILDREN Percent distribution of currently married women* who were not currently using any contraceptive method by intention to use in the future, according to number of living children and residence, Uttaranchal, 2002-04
Intention to use in the future
Number of living children Total
0 1 2 3 4+ Total Intends to use in next 12 months One to two years More than two years Does not intend to use Not yet decided Missing Total percent Number of women
0.4 0.5 5.9
41.0 52.3
0.0
100.0
1,083
2.7 4.2 9.6
35.2 48.3
0.0
100.0
1,105
8.5 7.2 8.4
41.0 34.7
0.2
100.0
962
12.0
7.2 8.4
43.0 29.4
0.0
100.0
758
12.6
8.2 7.1
51.0 21.0
0.0
100.0
933
6.7 5.2 7.9
41.9 38.3
0.0
100.0
4,841
Rural Intends to use in next 12 months One to two years More than two years Does not intend to use Not yet decided Missing Total percent Number of women
0.3 0.1 6.6
38.3 54.7
0.0
100.0
843
1.9 3.1 8.6
34.3 52.1
0.0
100.0
849
8.3 8.1 8.6
37.4 37.3
0.2
100.0
729
11.6
5.1 9.1
41.1 33.1
0.0
100.0
585
12.9
9.0 8.2
47.1 22.8
0.0
100.0
728
6.5 4.9 8.2
39.4 41.1
0.0
100.0
3,734
Urban Intends to use in next 12 months One to two years More than two years Does not intend to use Not yet decided Total percent Number of women
0.5 1.8 3.3
50.4 44.1
100.0
241
5.1 7.8
13.1 38.2 35.8
100.0
256
9.1 4.2 7.8
52.3 26.6
100.0
232
13.5 14.4
6.2 49.2 16.7
100.0
173
11.7
5.5 2.9
65.1 14.7
100.0
205
7.5 6.4 6.9
50.5 28.8
100.0
1,107
Note: * Exclude women who are in menopause or those who have undergone hysterectomy.
6.8 Reasons for Discontinuation and Non-Use of Contraception Currently married non-pregnant women who were not using any contraceptive method at the time of survey were categorised as past users and never users according to their contraceptive experience. In DLHS-RCH, women who had discontinued contraceptive use were asked about the main reason for discontinuation. The survey also asked women who had never used contraceptives about the main reason for not doing so. Table 6.16 shows the main reason for not using contraceptives among both the past never users and current non users. Among the past users, around 49.2 percent of the women mentioned that they discontinued the use of
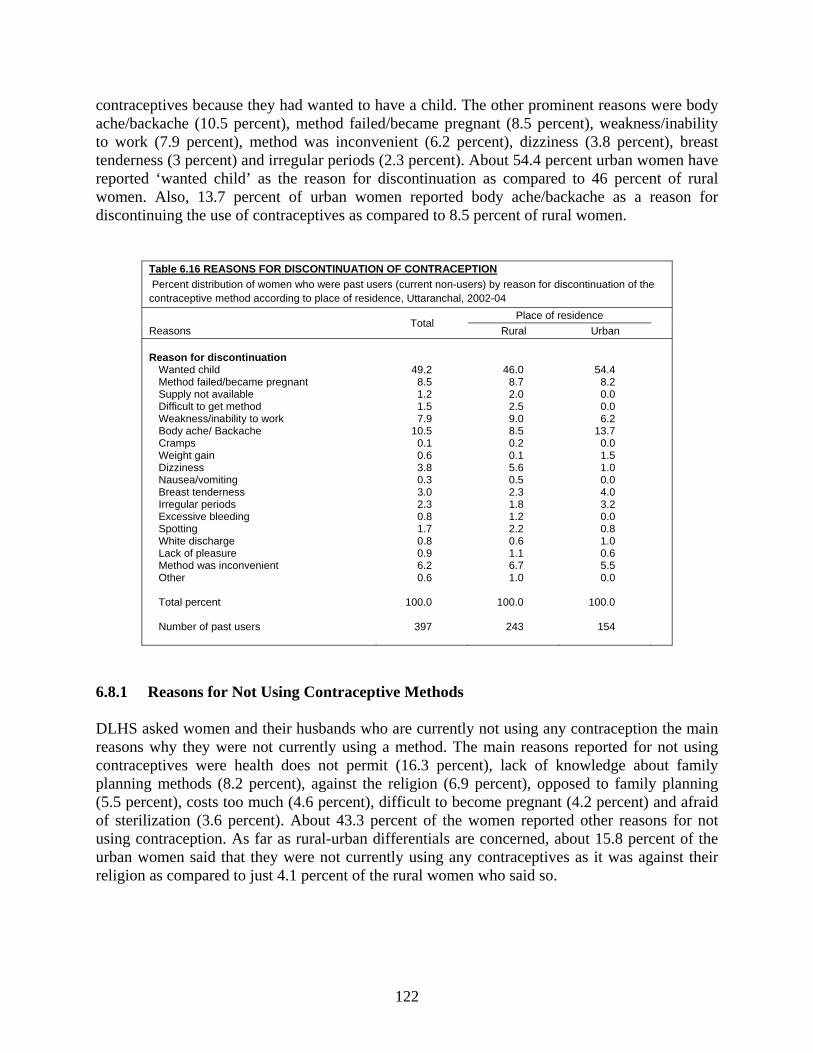
122
contraceptives because they had wanted to have a child. The other prominent reasons were body ache/backache (10.5 percent), method failed/became pregnant (8.5 percent), weakness/inability to work (7.9 percent), method was inconvenient (6.2 percent), dizziness (3.8 percent), breast tenderness (3 percent) and irregular periods (2.3 percent). About 54.4 percent urban women have reported ‘wanted child’ as the reason for discontinuation as compared to 46 percent of rural women. Also, 13.7 percent of urban women reported body ache/backache as a reason for discontinuing the use of contraceptives as compared to 8.5 percent of rural women.
Table 6.16 REASONS FOR DISCONTINUATION OF CONTRACEPTION Percent distribution of women who were past users (current non-users) by reason for discontinuation of the contraceptive method according to place of residence, Uttaranchal, 2002-04
Reasons Total
Place of residence Rural Urban
Reason for discontinuation Wanted child Method failed/became pregnant Supply not available Difficult to get method Weakness/inability to work Body ache/ Backache Cramps Weight gain Dizziness Nausea/vomiting Breast tenderness Irregular periods Excessive bleeding Spotting White discharge Lack of pleasure Method was inconvenient Other Total percent Number of past users
49.2 8.5 1.2 1.5 7.9
10.5 0.1 0.6 3.8 0.3 3.0 2.3 0.8 1.7 0.8 0.9 6.2 0.6
100.0
397
46.0 8.7 2.0 2.5 9.0 8.5 0.2 0.1 5.6 0.5 2.3 1.8 1.2 2.2 0.6 1.1 6.7 1.0
100.0
243
54.4 8.2 0.0 0.0 6.2
13.7 0.0 1.5 1.0 0.0 4.0 3.2 0.0 0.8 1.0 0.6 5.5 0.0
100.0
154
6.8.1 Reasons for Not Using Contraceptive Methods DLHS asked women and their husbands who are currently not using any contraception the main reasons why they were not currently using a method. The main reasons reported for not using contraceptives were health does not permit (16.3 percent), lack of knowledge about family planning methods (8.2 percent), against the religion (6.9 percent), opposed to family planning (5.5 percent), costs too much (4.6 percent), difficult to become pregnant (4.2 percent) and afraid of sterilization (3.6 percent). About 43.3 percent of the women reported other reasons for not using contraception. As far as rural-urban differentials are concerned, about 15.8 percent of the urban women said that they were not currently using any contraceptives as it was against their religion as compared to just 4.1 percent of the rural women who said so.
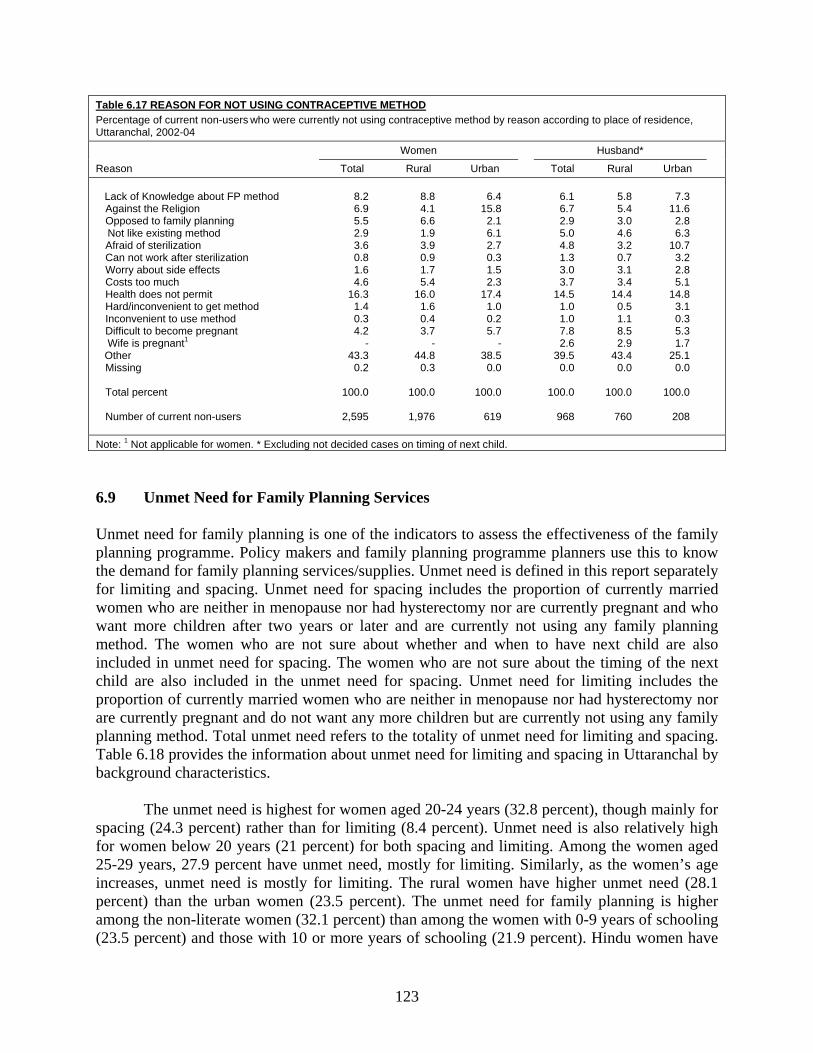
123
Table 6.17 REASON FOR NOT USING CONTRACEPTIVE METHOD Percentage of current non-users who were currently not using contraceptive method by reason according to place of residence, Uttaranchal, 2002-04
Reason
Women Husband*
Total Rural Urban Total Rural Urban Lack of Knowledge about FP method Against the Religion Opposed to family planning Not like existing method Afraid of sterilization Can not work after sterilization Worry about side effects Costs too much Health does not permit Hard/inconvenient to get method Inconvenient to use method Difficult to become pregnant Wife is pregnant1 Other Missing Total percent Number of current non-users
8.2 6.9 5.5 2.9 3.6 0.8 1.6 4.6
16.3 1.4 0.3 4.2
- 43.3
0.2
100.0
2,595
8.8 4.1 6.6 1.9 3.9 0.9 1.7 5.4
16.0 1.6 0.4 3.7
- 44.8
0.3
100.0
1,976
6.4
15.8 2.1 6.1 2.7 0.3 1.5 2.3
17.4 1.0 0.2 5.7
- 38.5
0.0
100.0
619
6.1 6.7 2.9 5.0 4.8 1.3 3.0 3.7
14.5 1.0 1.0 7.8 2.6
39.5 0.0
100.0
968
5.8 5.4 3.0 4.6 3.2 0.7 3.1 3.4
14.4 0.5 1.1 8.5 2.9
43.4 0.0
100.0
760
7.3
11.6 2.8 6.3
10.7 3.2 2.8 5.1
14.8 3.1 0.3 5.3 1.7
25.1 0.0
100.0
208
Note: 1 Not applicable for women. * Excluding not decided cases on timing of next child.
6.9 Unmet Need for Family Planning Services Unmet need for family planning is one of the indicators to assess the effectiveness of the family planning programme. Policy makers and family planning programme planners use this to know the demand for family planning services/supplies. Unmet need is defined in this report separately for limiting and spacing. Unmet need for spacing includes the proportion of currently married women who are neither in menopause nor had hysterectomy nor are currently pregnant and who want more children after two years or later and are currently not using any family planning method. The women who are not sure about whether and when to have next child are also included in unmet need for spacing. The women who are not sure about the timing of the next child are also included in the unmet need for spacing. Unmet need for limiting includes the proportion of currently married women who are neither in menopause nor had hysterectomy nor are currently pregnant and do not want any more children but are currently not using any family planning method. Total unmet need refers to the totality of unmet need for limiting and spacing. Table 6.18 provides the information about unmet need for limiting and spacing in Uttaranchal by background characteristics. The unmet need is highest for women aged 20-24 years (32.8 percent), though mainly for spacing (24.3 percent) rather than for limiting (8.4 percent). Unmet need is also relatively high for women below 20 years (21 percent) for both spacing and limiting. Among the women aged 25-29 years, 27.9 percent have unmet need, mostly for limiting. Similarly, as the women’s age increases, unmet need is mostly for limiting. The rural women have higher unmet need (28.1 percent) than the urban women (23.5 percent). The unmet need for family planning is higher among the non-literate women (32.1 percent) than among the women with 0-9 years of schooling (23.5 percent) and those with 10 or more years of schooling (21.9 percent). Hindu women have
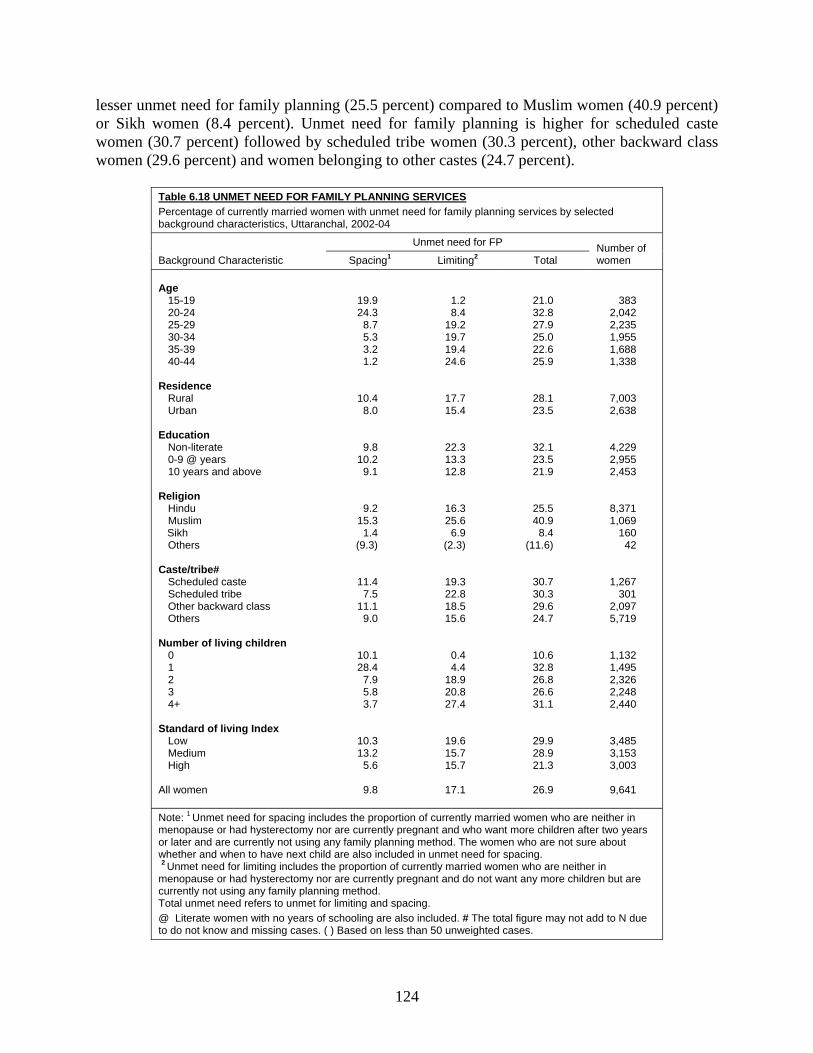
124
lesser unmet need for family planning (25.5 percent) compared to Muslim women (40.9 percent) or Sikh women (8.4 percent). Unmet need for family planning is higher for scheduled caste women (30.7 percent) followed by scheduled tribe women (30.3 percent), other backward class women (29.6 percent) and women belonging to other castes (24.7 percent).
Table 6.18 UNMET NEED FOR FAMILY PLANNING SERVICES Percentage of currently married women with unmet need for family planning services by selected background characteristics, Uttaranchal, 2002-04
Background Characteristic
Unmet need for FP Number of women Spacing1 Limiting2 Total
Age 15-19 20-24 25-29 30-34 35-39 40-44 Residence Rural Urban Education Non-literate 0-9 @ years 10 years and above Religion Hindu Muslim Sikh Others Caste/tribe# Scheduled caste Scheduled tribe Other backward class Others Number of living children 0 1 2 3 4+ Standard of living Index Low Medium High All women
19.9 24.3
8.7 5.3 3.2 1.2
10.4 8.0
9.8 10.2
9.1
9.2 15.3
1.4 (9.3)
11.4 7.5
11.1 9.0
10.1 28.4
7.9 5.8 3.7
10.3 13.2
5.6
9.8
1.2 8.4
19.2 19.7 19.4 24.6
17.7 15.4
22.3 13.3 12.8
16.3 25.6
6.9 (2.3)
19.3 22.8 18.5 15.6
0.4 4.4
18.9 20.8 27.4
19.6 15.7 15.7
17.1
21.0 32.8 27.9 25.0 22.6 25.9
28.1 23.5
32.1 23.5 21.9
25.5 40.9
8.4 (11.6)
30.7 30.3 29.6 24.7
10.6 32.8 26.8 26.6 31.1
29.9 28.9 21.3
26.9
383 2,042 2,235 1,955 1,688 1,338
7,003 2,638
4,229 2,955 2,453
8,371 1,069
160 42
1,267 301
2,097 5,719
1,132 1,495 2,326 2,248 2,440
3,485 3,153 3,003
9,641
Note: 1 Unmet need for spacing includes the proportion of currently married women who are neither in menopause or had hysterectomy nor are currently pregnant and who want more children after two years or later and are currently not using any family planning method. The women who are not sure about whether and when to have next child are also included in unmet need for spacing. 2 Unmet need for limiting includes the proportion of currently married women who are neither in menopause or had hysterectomy nor are currently pregnant and do not want any more children but are currently not using any family planning method. Total unmet need refers to unmet for limiting and spacing. @ Literate women with no years of schooling are also included. # The total figure may not add to N due to do not know and missing cases. ( ) Based on less than 50 unweighted cases.
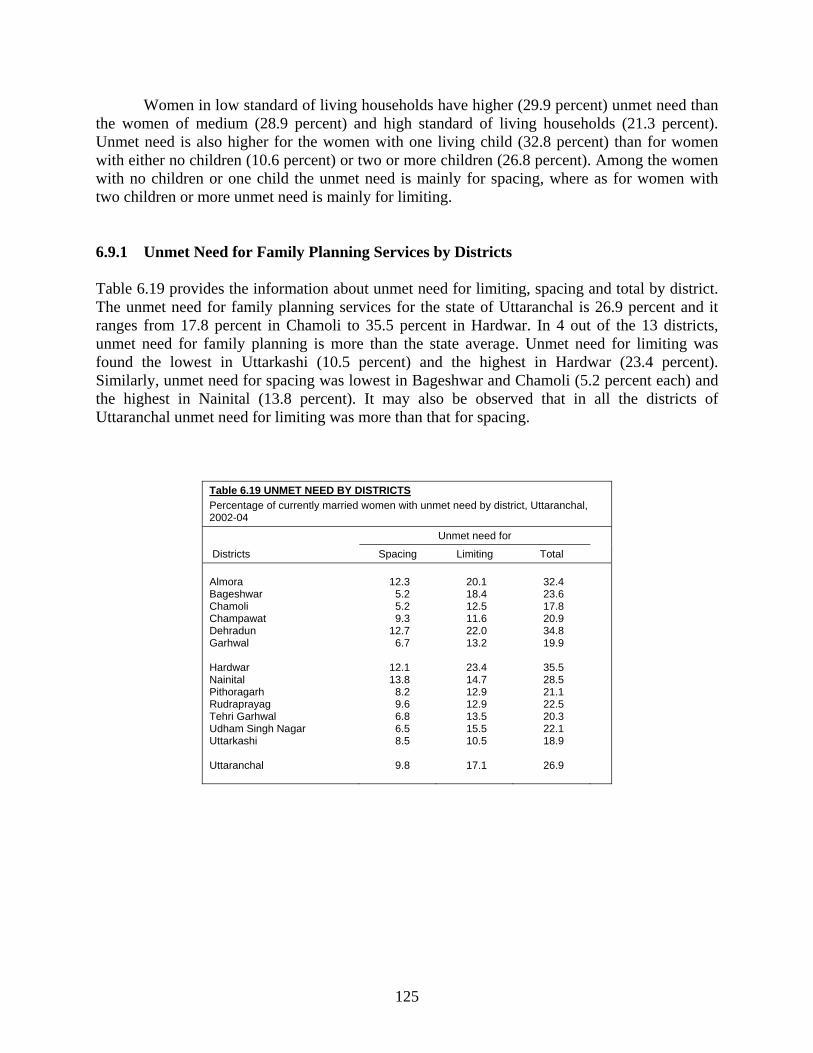
125
Women in low standard of living households have higher (29.9 percent) unmet need than the women of medium (28.9 percent) and high standard of living households (21.3 percent). Unmet need is also higher for the women with one living child (32.8 percent) than for women with either no children (10.6 percent) or two or more children (26.8 percent). Among the women with no children or one child the unmet need is mainly for spacing, where as for women with two children or more unmet need is mainly for limiting. 6.9.1 Unmet Need for Family Planning Services by Districts Table 6.19 provides the information about unmet need for limiting, spacing and total by district. The unmet need for family planning services for the state of Uttaranchal is 26.9 percent and it ranges from 17.8 percent in Chamoli to 35.5 percent in Hardwar. In 4 out of the 13 districts, unmet need for family planning is more than the state average. Unmet need for limiting was found the lowest in Uttarkashi (10.5 percent) and the highest in Hardwar (23.4 percent). Similarly, unmet need for spacing was lowest in Bageshwar and Chamoli (5.2 percent each) and the highest in Nainital (13.8 percent). It may also be observed that in all the districts of Uttaranchal unmet need for limiting was more than that for spacing.
Table 6.19 UNMET NEED BY DISTRICTS Percentage of currently married women with unmet need by district, Uttaranchal, 2002-04
Districts
Unmet need for
Spacing Limiting Total Almora Bageshwar Chamoli Champawat Dehradun Garhwal Hardwar Nainital Pithoragarh Rudraprayag Tehri Garhwal Udham Singh Nagar Uttarkashi Uttaranchal
12.3
5.2 5.2 9.3
12.7 6.7
12.1 13.8
8.2 9.6 6.8 6.5 8.5
9.8
20.1 18.4 12.5 11.6 22.0 13.2
23.4 14.7 12.9 12.9 13.5 15.5 10.5
17.1
32.4 23.6 17.8 20.9 34.8 19.9
35.5 28.5 21.1 22.5 20.3 22.1 18.9
26.9
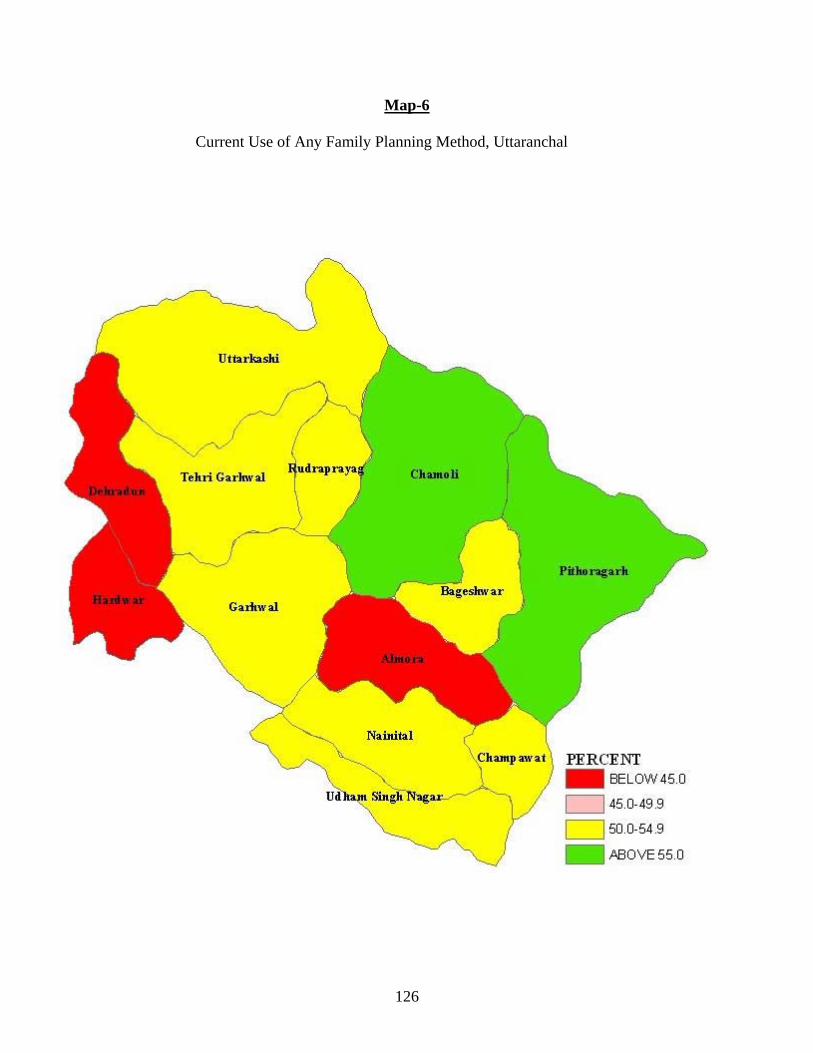
126
Map-6
Current Use of Any Family Planning Method, Uttaranchal
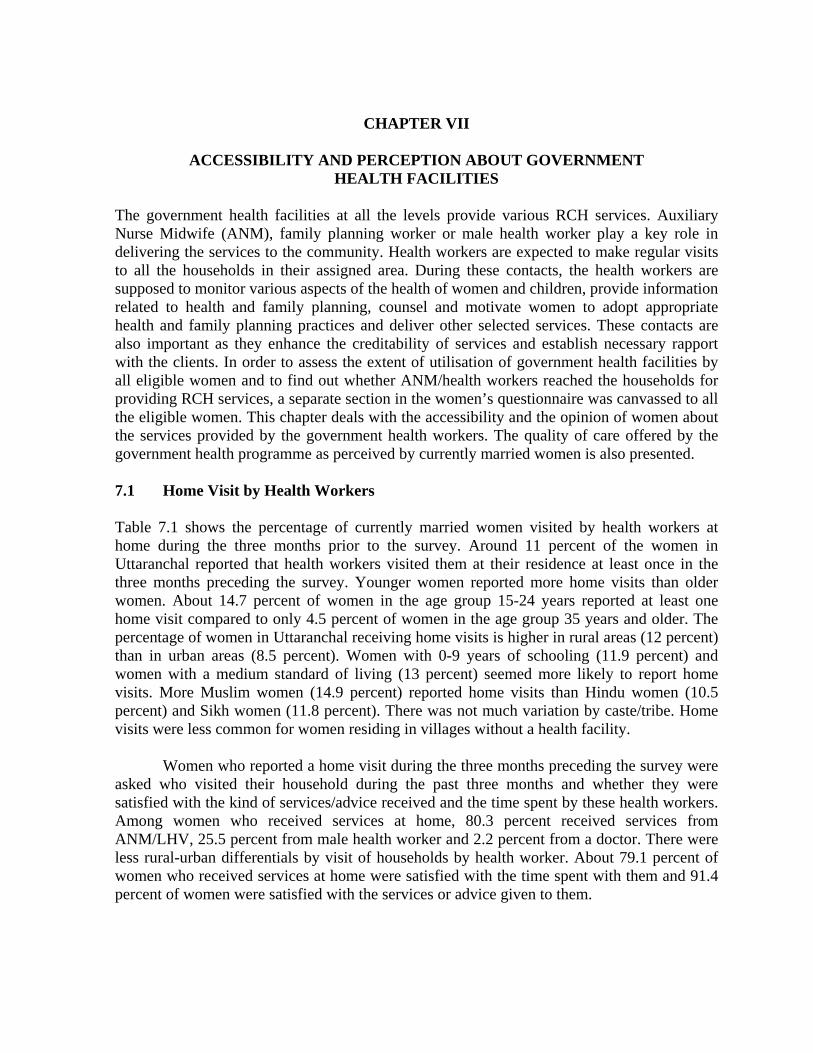
CHAPTER VII
ACCESSIBILITY AND PERCEPTION ABOUT GOVERNMENT
HEALTH FACILITIES
The government health facilities at all the levels provide various RCH services. Auxiliary Nurse Midwife (ANM), family planning worker or male health worker play a key role in delivering the services to the community. Health workers are expected to make regular visits to all the households in their assigned area. During these contacts, the health workers are supposed to monitor various aspects of the health of women and children, provide information related to health and family planning, counsel and motivate women to adopt appropriate health and family planning practices and deliver other selected services. These contacts are also important as they enhance the creditability of services and establish necessary rapport with the clients. In order to assess the extent of utilisation of government health facilities by all eligible women and to find out whether ANM/health workers reached the households for providing RCH services, a separate section in the women’s questionnaire was canvassed to all the eligible women. This chapter deals with the accessibility and the opinion of women about the services provided by the government health workers. The quality of care offered by the government health programme as perceived by currently married women is also presented. 7.1 Home Visit by Health Workers Table 7.1 shows the percentage of currently married women visited by health workers at home during the three months prior to the survey. Around 11 percent of the women in Uttaranchal reported that health workers visited them at their residence at least once in the three months preceding the survey. Younger women reported more home visits than older women. About 14.7 percent of women in the age group 15-24 years reported at least one home visit compared to only 4.5 percent of women in the age group 35 years and older. The percentage of women in Uttaranchal receiving home visits is higher in rural areas (12 percent) than in urban areas (8.5 percent). Women with 0-9 years of schooling (11.9 percent) and women with a medium standard of living (13 percent) seemed more likely to report home visits. More Muslim women (14.9 percent) reported home visits than Hindu women (10.5 percent) and Sikh women (11.8 percent). There was not much variation by caste/tribe. Home visits were less common for women residing in villages without a health facility. Women who reported a home visit during the three months preceding the survey were asked who visited their household during the past three months and whether they were satisfied with the kind of services/advice received and the time spent by these health workers. Among women who received services at home, 80.3 percent received services from ANM/LHV, 25.5 percent from male health worker and 2.2 percent from a doctor. There were less rural-urban differentials by visit of households by health worker. About 79.1 percent of women who received services at home were satisfied with the time spent with them and 91.4 percent of women were satisfied with the services or advice given to them.
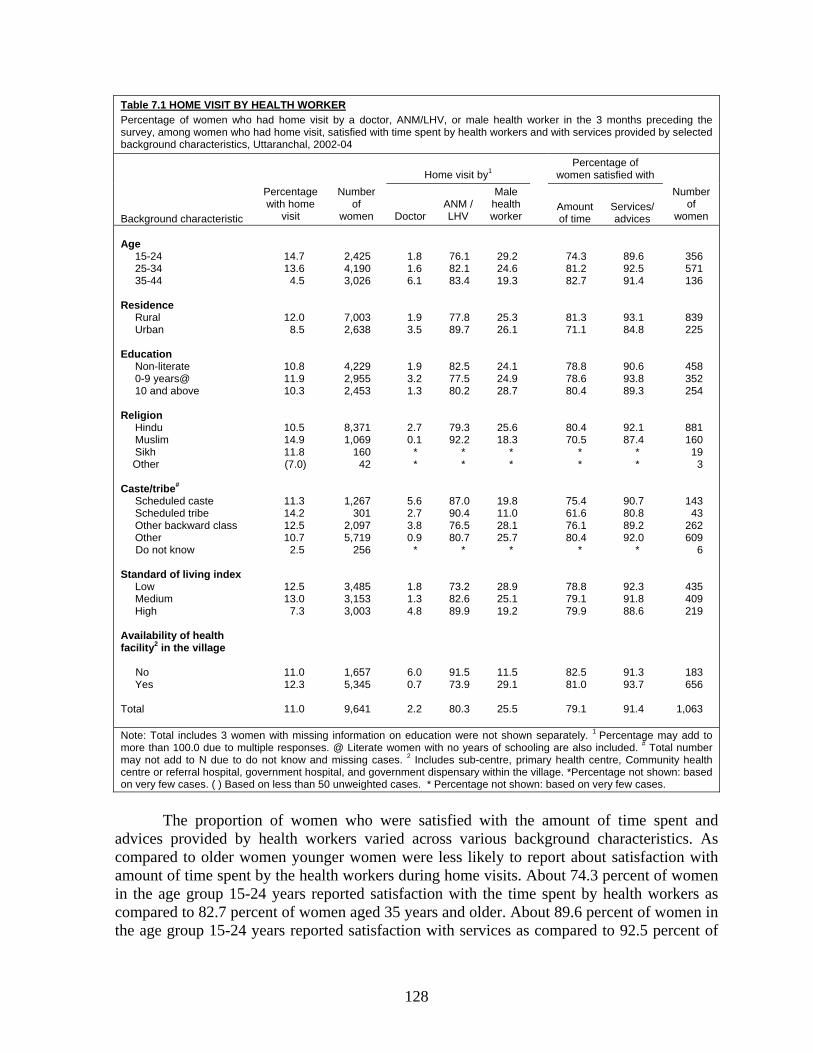
128
Table 7.1 HOME VISIT BY HEALTH WORKER Percentage of women who had home visit by a doctor, ANM/LHV, or male health worker in the 3 months preceding the survey, among women who had home visit, satisfied with time spent by health workers and with services provided by selected background characteristics, Uttaranchal, 2002-04
Background characteristic
Percentage with home
visit
Number of
women
Home visit by1 Percentage of
women satisfied with Number
of women Doctor
ANM / LHV
Male health worker
Amount of time
Services/ advices
Age 15-24 25-34 35-44 Residence Rural Urban Education Non-literate 0-9 years@ 10 and above Religion Hindu Muslim Sikh Other Caste/tribe# Scheduled caste Scheduled tribe Other backward class Other Do not know Standard of living index Low Medium High Availability of health facility2 in the village No Yes Total
14.7 13.6
4.5
12.0 8.5
10.8 11.9 10.3
10.5 14.9 11.8 (7.0)
11.3 14.2 12.5 10.7
2.5
12.5 13.0
7.3
11.0 12.3
11.0
2,425 4,190 3,026
7,003 2,638
4,229 2,955 2,453
8,371 1,069
160 42
1,267 301
2,097 5,719
256
3,485 3,153 3,003
1,657 5,345
9,641
1.8 1.6 6.1
1.9 3.5
1.9 3.2 1.3
2.7 0.1
* *
5.6 2.7 3.8 0.9
*
1.8 1.3 4.8
6.0 0.7
2.2
76.1 82.1 83.4
77.8 89.7
82.5 77.5 80.2
79.3 92.2
* *
87.0 90.4 76.5 80.7
*
73.2 82.6 89.9
91.5 73.9
80.3
29.2 24.6 19.3
25.3 26.1
24.1 24.9 28.7
25.6 18.3
* *
19.8 11.0 28.1 25.7
*
28.9 25.1 19.2
11.5 29.1
25.5
74.3 81.2 82.7
81.3 71.1
78.8 78.6 80.4
80.4 70.5
* *
75.4 61.6 76.1 80.4
*
78.8 79.1 79.9
82.5 81.0
79.1
89.6 92.5 91.4
93.1 84.8
90.6 93.8 89.3
92.1 87.4
* *
90.7 80.8 89.2 92.0
*
92.3 91.8 88.6
91.3 93.7
91.4
356 571 136
839 225
458 352 254
881 160
19 3
143 43
262 609
6
435 409 219
183 656
1,063
Note: Total includes 3 women with missing information on education were not shown separately. 1 Percentage may add to more than 100.0 due to multiple responses. @ Literate women with no years of schooling are also included. # Total number may not add to N due to do not know and missing cases. 2 Includes sub-centre, primary health centre, Community health centre or referral hospital, government hospital, and government dispensary within the village. *Percentage not shown: based on very few cases. ( ) Based on less than 50 unweighted cases. * Percentage not shown: based on very few cases.
The proportion of women who were satisfied with the amount of time spent and
advices provided by health workers varied across various background characteristics. As compared to older women younger women were less likely to report about satisfaction with amount of time spent by the health workers during home visits. About 74.3 percent of women in the age group 15-24 years reported satisfaction with the time spent by health workers as compared to 82.7 percent of women aged 35 years and older. About 89.6 percent of women in the age group 15-24 years reported satisfaction with services as compared to 92.5 percent of
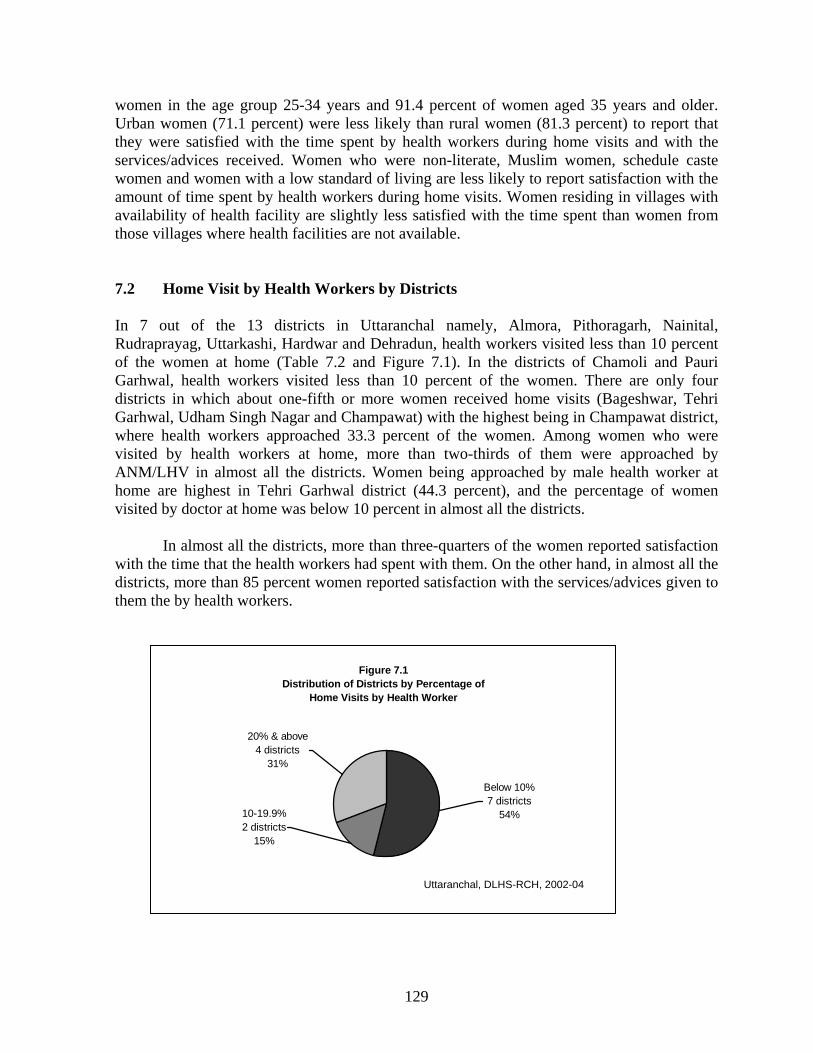
129
women in the age group 25-34 years and 91.4 percent of women aged 35 years and older. Urban women (71.1 percent) were less likely than rural women (81.3 percent) to report that they were satisfied with the time spent by health workers during home visits and with the services/advices received. Women who were non-literate, Muslim women, schedule caste women and women with a low standard of living are less likely to report satisfaction with the amount of time spent by health workers during home visits. Women residing in villages with availability of health facility are slightly less satisfied with the time spent than women from those villages where health facilities are not available. 7.2 Home Visit by Health Workers by Districts In 7 out of the 13 districts in Uttaranchal namely, Almora, Pithoragarh, Nainital, Rudraprayag, Uttarkashi, Hardwar and Dehradun, health workers visited less than 10 percent of the women at home (Table 7.2 and Figure 7.1). In the districts of Chamoli and Pauri Garhwal, health workers visited less than 10 percent of the women. There are only four districts in which about one-fifth or more women received home visits (Bageshwar, Tehri Garhwal, Udham Singh Nagar and Champawat) with the highest being in Champawat district, where health workers approached 33.3 percent of the women. Among women who were visited by health workers at home, more than two-thirds of them were approached by ANM/LHV in almost all the districts. Women being approached by male health worker at home are highest in Tehri Garhwal district (44.3 percent), and the percentage of women visited by doctor at home was below 10 percent in almost all the districts.
In almost all the districts, more than three-quarters of the women reported satisfaction with the time that the health workers had spent with them. On the other hand, in almost all the districts, more than 85 percent women reported satisfaction with the services/advices given to them the by health workers.
Figure 7.1Distribution of Districts by Percentage of
Home Visits by Health Worker
10-19.9%2 districts
15%
20% & above4 districts
31%
Below 10%7 districts
54%
Uttaranchal, DLHS-RCH, 2002-04
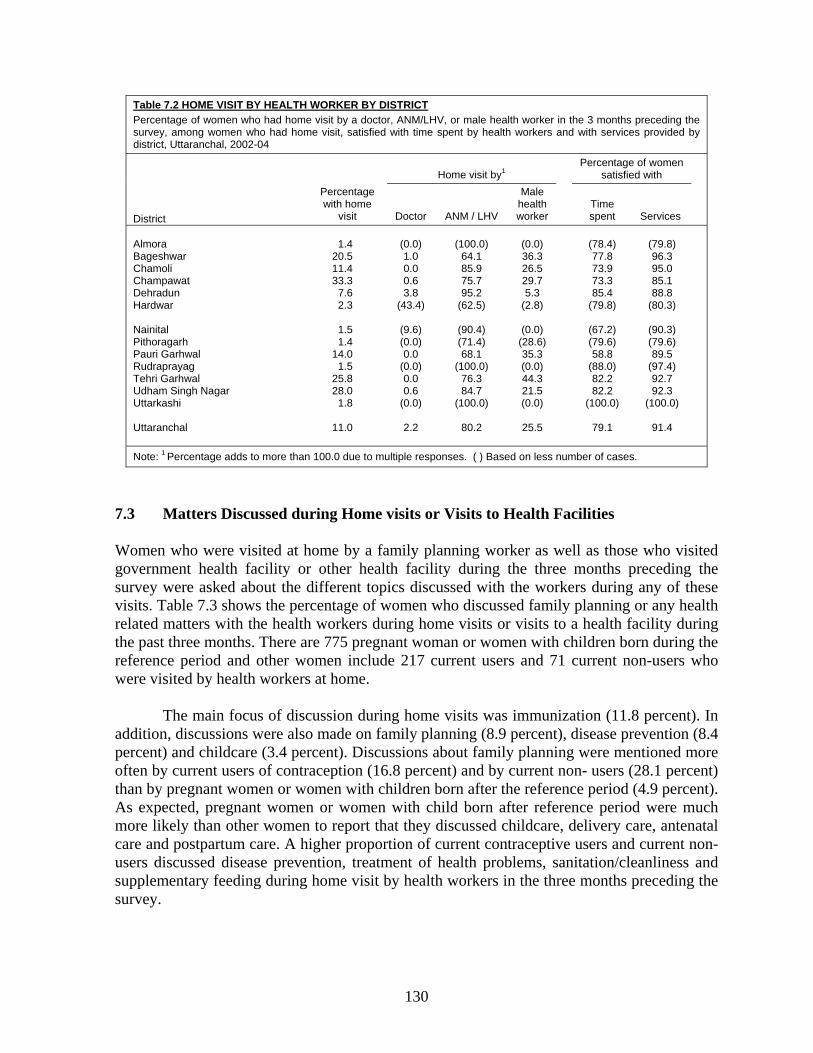
130
Table 7.2 HOME VISIT BY HEALTH WORKER BY DISTRICT Percentage of women who had home visit by a doctor, ANM/LHV, or male health worker in the 3 months preceding the survey, among women who had home visit, satisfied with time spent by health workers and with services provided by district, Uttaranchal, 2002-04
District
Percentage with home
visit
Home visit by1 Percentage of women
satisfied with
Doctor ANM / LHV
Male health worker
Time spent Services
Almora Bageshwar Chamoli Champawat Dehradun Hardwar Nainital Pithoragarh Pauri Garhwal Rudraprayag Tehri Garhwal Udham Singh Nagar Uttarkashi Uttaranchal
1.4
20.5 11.4 33.3
7.6 2.3
1.5 1.4
14.0 1.5
25.8 28.0
1.8
11.0
(0.0) 1.0 0.0 0.6 3.8
(43.4)
(9.6) (0.0) 0.0
(0.0) 0.0 0.6
(0.0)
2.2
(100.0)
64.1 85.9 75.7 95.2
(62.5)
(90.4) (71.4) 68.1
(100.0) 76.3 84.7
(100.0)
80.2
(0.0) 36.3 26.5 29.7 5.3
(2.8)
(0.0) (28.6) 35.3 (0.0) 44.3 21.5 (0.0)
25.5
(78.4) 77.8 73.9 73.3 85.4
(79.8)
(67.2) (79.6) 58.8
(88.0) 82.2 82.2
(100.0)
79.1
(79.8) 96.3 95.0 85.1 88.8
(80.3)
(90.3) (79.6) 89.5
(97.4) 92.7 92.3
(100.0)
91.4
Note: 1 Percentage adds to more than 100.0 due to multiple responses. ( ) Based on less number of cases.
7.3 Matters Discussed during Home visits or Visits to Health Facilities Women who were visited at home by a family planning worker as well as those who visited government health facility or other health facility during the three months preceding the survey were asked about the different topics discussed with the workers during any of these visits. Table 7.3 shows the percentage of women who discussed family planning or any health related matters with the health workers during home visits or visits to a health facility during the past three months. There are 775 pregnant woman or women with children born during the reference period and other women include 217 current users and 71 current non-users who were visited by health workers at home. The main focus of discussion during home visits was immunization (11.8 percent). In addition, discussions were also made on family planning (8.9 percent), disease prevention (8.4 percent) and childcare (3.4 percent). Discussions about family planning were mentioned more often by current users of contraception (16.8 percent) and by current non- users (28.1 percent) than by pregnant women or women with children born after the reference period (4.9 percent). As expected, pregnant women or women with child born after reference period were much more likely than other women to report that they discussed childcare, delivery care, antenatal care and postpartum care. A higher proportion of current contraceptive users and current non-users discussed disease prevention, treatment of health problems, sanitation/cleanliness and supplementary feeding during home visit by health workers in the three months preceding the survey.
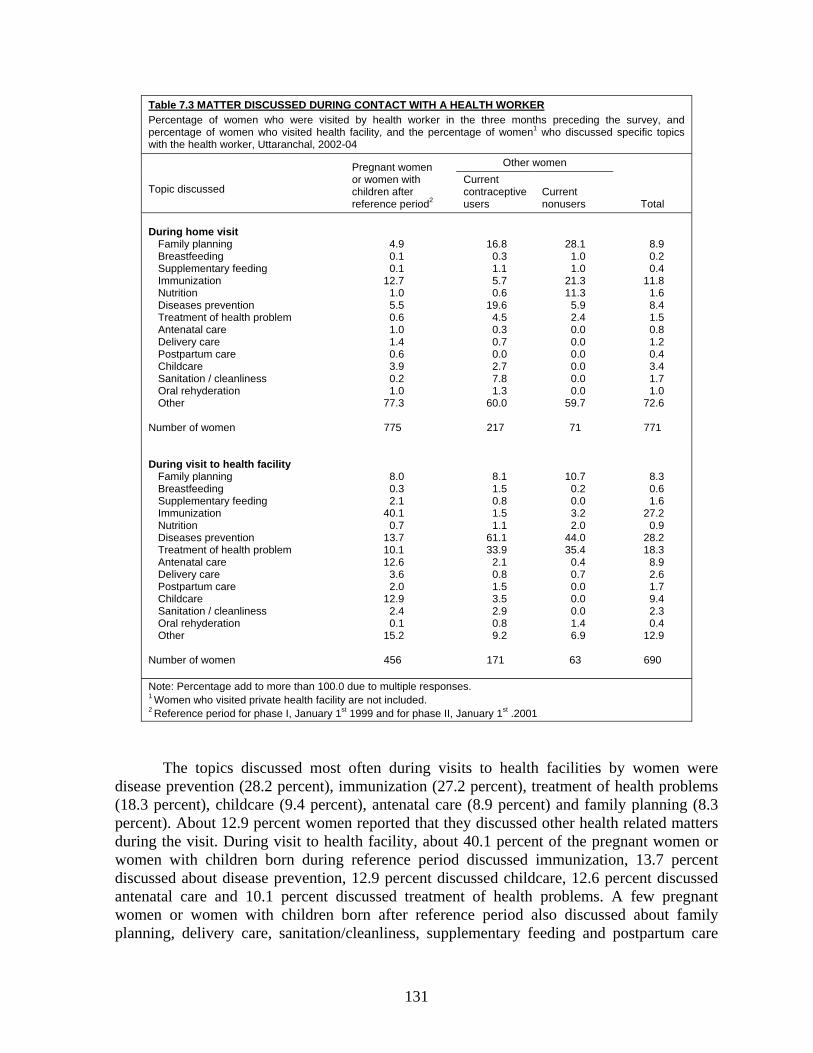
131
Table 7.3 MATTER DISCUSSED DURING CONTACT WITH A HEALTH WORKER Percentage of women who were visited by health worker in the three months preceding the survey, and percentage of women who visited health facility, and the percentage of women1 who discussed specific topics with the health worker, Uttaranchal, 2002-04
Topic discussed
Pregnant women or women with children after reference period2
Other women
Total
Current contraceptive users
Current nonusers
During home visit Family planning Breastfeeding Supplementary feeding Immunization Nutrition Diseases prevention Treatment of health problem Antenatal care Delivery care Postpartum care Childcare Sanitation / cleanliness Oral rehyderation Other Number of women
4.9 0.1 0.1
12.7 1.0 5.5 0.6 1.0 1.4 0.6 3.9 0.2 1.0
77.3
775
16.8 0.3 1.1 5.7 0.6
19.6 4.5 0.3 0.7 0.0 2.7 7.8 1.3
60.0
217
28.1 1.0 1.0
21.3 11.3
5.9 2.4 0.0 0.0 0.0 0.0 0.0 0.0
59.7
71
8.9 0.2 0.4
11.8 1.6 8.4 1.5 0.8 1.2 0.4 3.4 1.7 1.0
72.6
771 During visit to health facility Family planning Breastfeeding Supplementary feeding Immunization Nutrition Diseases prevention Treatment of health problem Antenatal care Delivery care Postpartum care Childcare Sanitation / cleanliness Oral rehyderation Other Number of women
8.0 0.3 2.1
40.1 0.7
13.7 10.1 12.6
3.6 2.0
12.9 2.4 0.1
15.2
456
8.1 1.5 0.8 1.5 1.1
61.1 33.9
2.1 0.8 1.5 3.5 2.9 0.8 9.2
171
10.7 0.2 0.0 3.2 2.0
44.0 35.4
0.4 0.7 0.0 0.0 0.0 1.4 6.9
63
8.3 0.6 1.6
27.2 0.9
28.2 18.3
8.9 2.6 1.7 9.4 2.3 0.4
12.9
690
Note: Percentage add to more than 100.0 due to multiple responses. 1 Women who visited private health facility are not included. 2 Reference period for phase I, January 1st 1999 and for phase II, January 1st .2001
The topics discussed most often during visits to health facilities by women were disease prevention (28.2 percent), immunization (27.2 percent), treatment of health problems (18.3 percent), childcare (9.4 percent), antenatal care (8.9 percent) and family planning (8.3 percent). About 12.9 percent women reported that they discussed other health related matters during the visit. During visit to health facility, about 40.1 percent of the pregnant women or women with children born during reference period discussed immunization, 13.7 percent discussed about disease prevention, 12.9 percent discussed childcare, 12.6 percent discussed antenatal care and 10.1 percent discussed treatment of health problems. A few pregnant women or women with children born after reference period also discussed about family planning, delivery care, sanitation/cleanliness, supplementary feeding and postpartum care
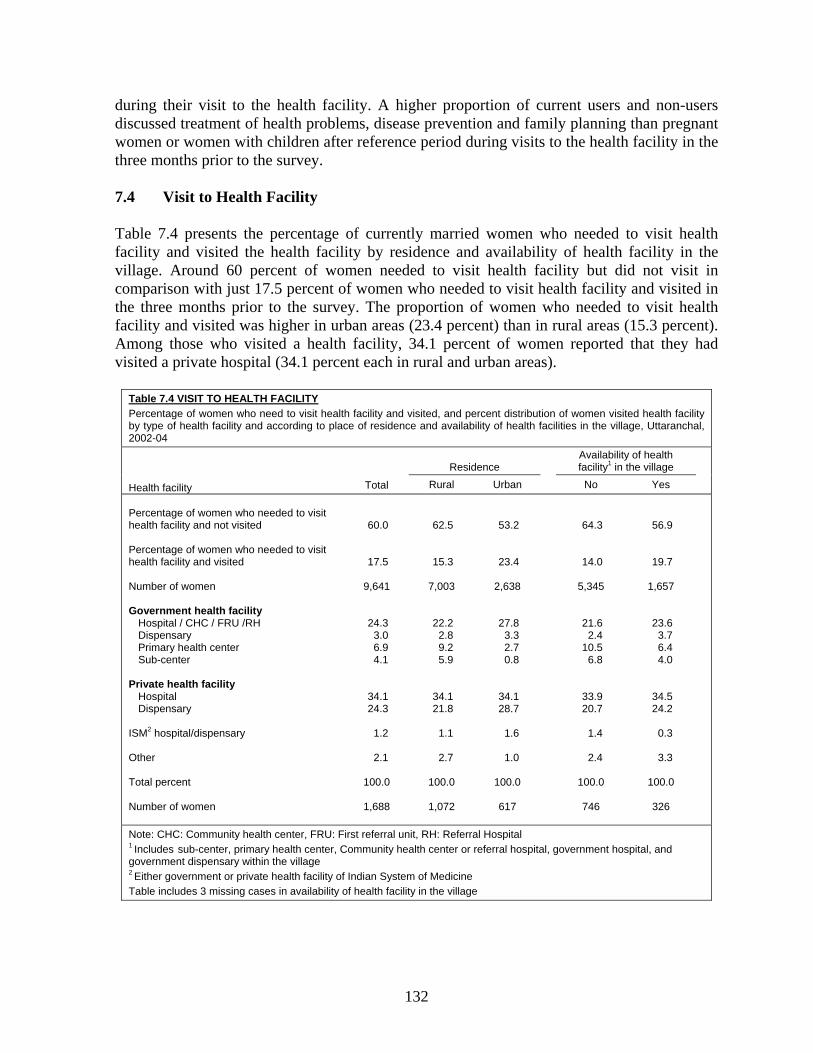
132
during their visit to the health facility. A higher proportion of current users and non-users discussed treatment of health problems, disease prevention and family planning than pregnant women or women with children after reference period during visits to the health facility in the three months prior to the survey. 7.4 Visit to Health Facility Table 7.4 presents the percentage of currently married women who needed to visit health facility and visited the health facility by residence and availability of health facility in the village. Around 60 percent of women needed to visit health facility but did not visit in comparison with just 17.5 percent of women who needed to visit health facility and visited in the three months prior to the survey. The proportion of women who needed to visit health facility and visited was higher in urban areas (23.4 percent) than in rural areas (15.3 percent). Among those who visited a health facility, 34.1 percent of women reported that they had visited a private hospital (34.1 percent each in rural and urban areas).
Table 7.4 VISIT TO HEALTH FACILITY Percentage of women who need to visit health facility and visited, and percent distribution of women visited health facility by type of health facility and according to place of residence and availability of health facilities in the village, Uttaranchal, 2002-04
Health facility Total
Residence Availability of health
facility1 in the village Rural Urban No Yes
Percentage of women who needed to visit health facility and not visited Percentage of women who needed to visit health facility and visited Number of women Government health facility Hospital / CHC / FRU /RH Dispensary Primary health center Sub-center Private health facility Hospital Dispensary ISM2 hospital/dispensary Other Total percent Number of women
60.0
17.5
9,641
24.3 3.0 6.9 4.1
34.1 24.3
1.2
2.1
100.0
1,688
62.5
15.3
7,003
22.2 2.8 9.2 5.9
34.1 21.8
1.1
2.7
100.0
1,072
53.2
23.4
2,638
27.8 3.3 2.7 0.8
34.1 28.7
1.6
1.0
100.0
617
64.3
14.0
5,345
21.6 2.4
10.5 6.8
33.9 20.7
1.4
2.4
100.0
746
56.9
19.7
1,657
23.6 3.7 6.4 4.0
34.5 24.2
0.3
3.3
100.0
326
Note: CHC: Community health center, FRU: First referral unit, RH: Referral Hospital 1 Includes sub-center, primary health center, Community health center or referral hospital, government hospital, and government dispensary within the village 2 Either government or private health facility of Indian System of Medicine Table includes 3 missing cases in availability of health facility in the village
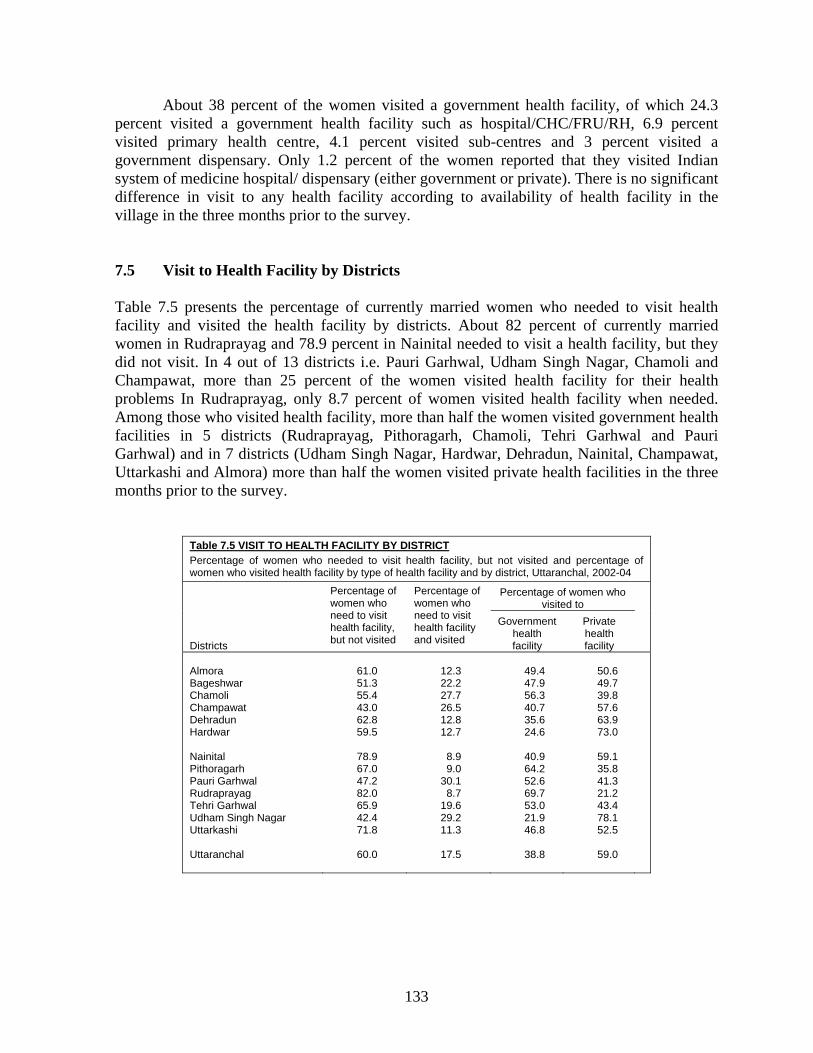
133
About 38 percent of the women visited a government health facility, of which 24.3 percent visited a government health facility such as hospital/CHC/FRU/RH, 6.9 percent visited primary health centre, 4.1 percent visited sub-centres and 3 percent visited a government dispensary. Only 1.2 percent of the women reported that they visited Indian system of medicine hospital/ dispensary (either government or private). There is no significant difference in visit to any health facility according to availability of health facility in the village in the three months prior to the survey. 7.5 Visit to Health Facility by Districts Table 7.5 presents the percentage of currently married women who needed to visit health facility and visited the health facility by districts. About 82 percent of currently married women in Rudraprayag and 78.9 percent in Nainital needed to visit a health facility, but they did not visit. In 4 out of 13 districts i.e. Pauri Garhwal, Udham Singh Nagar, Chamoli and Champawat, more than 25 percent of the women visited health facility for their health problems In Rudraprayag, only 8.7 percent of women visited health facility when needed. Among those who visited health facility, more than half the women visited government health facilities in 5 districts (Rudraprayag, Pithoragarh, Chamoli, Tehri Garhwal and Pauri Garhwal) and in 7 districts (Udham Singh Nagar, Hardwar, Dehradun, Nainital, Champawat, Uttarkashi and Almora) more than half the women visited private health facilities in the three months prior to the survey.
Table 7.5 VISIT TO HEALTH FACILITY BY DISTRICT Percentage of women who needed to visit health facility, but not visited and percentage of women who visited health facility by type of health facility and by district, Uttaranchal, 2002-04
Districts
Percentage of women who need to visit health facility, but not visited
Percentage of women who need to visit health facility and visited
Percentage of women who visited to
Government health facility
Private health facility
Almora Bageshwar Chamoli Champawat Dehradun Hardwar Nainital Pithoragarh Pauri Garhwal Rudraprayag Tehri Garhwal Udham Singh Nagar Uttarkashi Uttaranchal
61.0 51.3 55.4 43.0 62.8 59.5
78.9 67.0 47.2 82.0 65.9 42.4 71.8
60.0
12.3 22.2 27.7 26.5 12.8 12.7
8.9 9.0
30.1 8.7
19.6 29.2 11.3
17.5
49.4 47.9 56.3 40.7 35.6 24.6
40.9 64.2 52.6 69.7 53.0 21.9 46.8
38.8
50.6 49.7 39.8 57.6 63.9 73.0
59.1 35.8 41.3 21.2 43.4 78.1 52.5
59.0
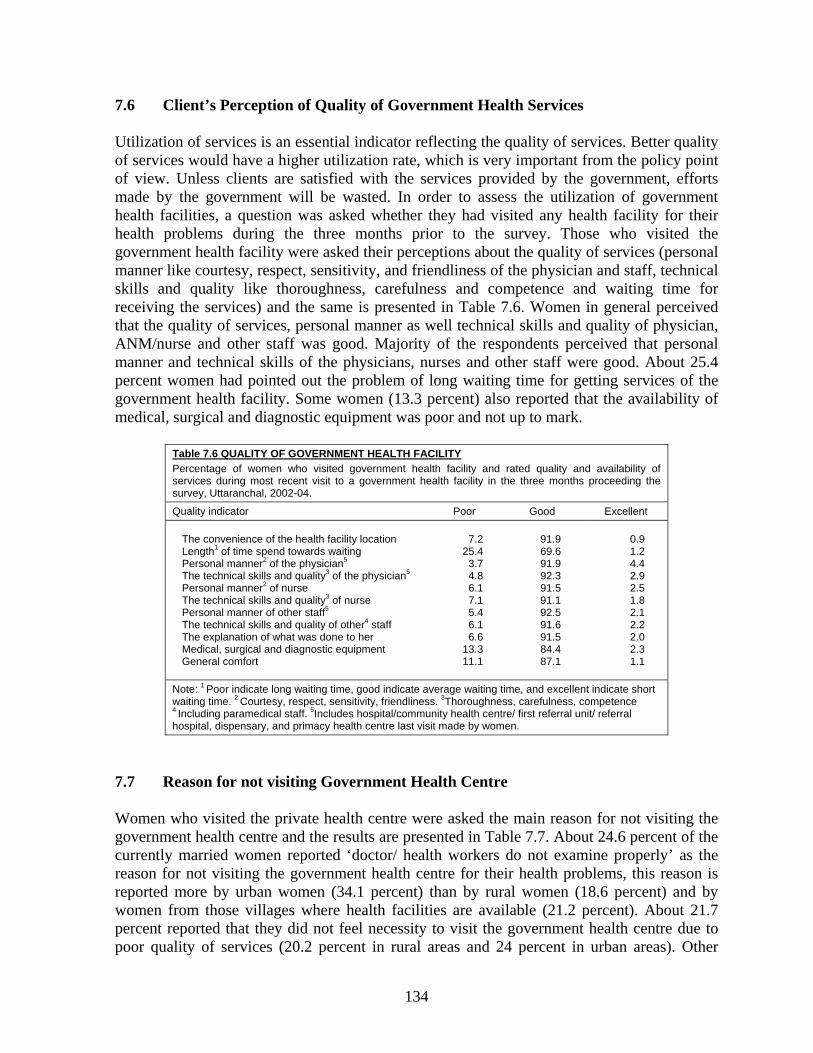
134
7.6 Client’s Perception of Quality of Government Health Services Utilization of services is an essential indicator reflecting the quality of services. Better quality of services would have a higher utilization rate, which is very important from the policy point of view. Unless clients are satisfied with the services provided by the government, efforts made by the government will be wasted. In order to assess the utilization of government health facilities, a question was asked whether they had visited any health facility for their health problems during the three months prior to the survey. Those who visited the government health facility were asked their perceptions about the quality of services (personal manner like courtesy, respect, sensitivity, and friendliness of the physician and staff, technical skills and quality like thoroughness, carefulness and competence and waiting time for receiving the services) and the same is presented in Table 7.6. Women in general perceived that the quality of services, personal manner as well technical skills and quality of physician, ANM/nurse and other staff was good. Majority of the respondents perceived that personal manner and technical skills of the physicians, nurses and other staff were good. About 25.4 percent women had pointed out the problem of long waiting time for getting services of the government health facility. Some women (13.3 percent) also reported that the availability of medical, surgical and diagnostic equipment was poor and not up to mark.
Table 7.6 QUALITY OF GOVERNMENT HEALTH FACILITY Percentage of women who visited government health facility and rated quality and availability of services during most recent visit to a government health facility in the three months proceeding the survey, Uttaranchal, 2002-04.
Quality indicator Poor Good Excellent The convenience of the health facility location Length1 of time spend towards waiting Personal manner2 of the physician5
The technical skills and quality3 of the physician5 Personal manner2 of nurse The technical skills and quality3 of nurse Personal manner of other staff5 The technical skills and quality of other4 staff The explanation of what was done to her Medical, surgical and diagnostic equipment General comfort
7.2
25.4 3.7 4.8 6.1 7.1 5.4 6.1 6.6
13.3 11.1
91.9 69.6 91.9 92.3 91.5 91.1 92.5 91.6 91.5 84.4 87.1
0.9 1.2 4.4 2.9 2.5 1.8 2.1 2.2 2.0 2.3 1.1
Note: 1 Poor indicate long waiting time, good indicate average waiting time, and excellent indicate short waiting time. 2 Courtesy, respect, sensitivity, friendliness. 3Thoroughness, carefulness, competence 4 Including paramedical staff. 5Includes hospital/community health centre/ first referral unit/ referral hospital, dispensary, and primacy health centre last visit made by women.
7.7 Reason for not visiting Government Health Centre Women who visited the private health centre were asked the main reason for not visiting the government health centre and the results are presented in Table 7.7. About 24.6 percent of the currently married women reported ‘doctor/ health workers do not examine properly’ as the reason for not visiting the government health centre for their health problems, this reason is reported more by urban women (34.1 percent) than by rural women (18.6 percent) and by women from those villages where health facilities are available (21.2 percent). About 21.7 percent reported that they did not feel necessity to visit the government health centre due to poor quality of services (20.2 percent in rural areas and 24 percent in urban areas). Other
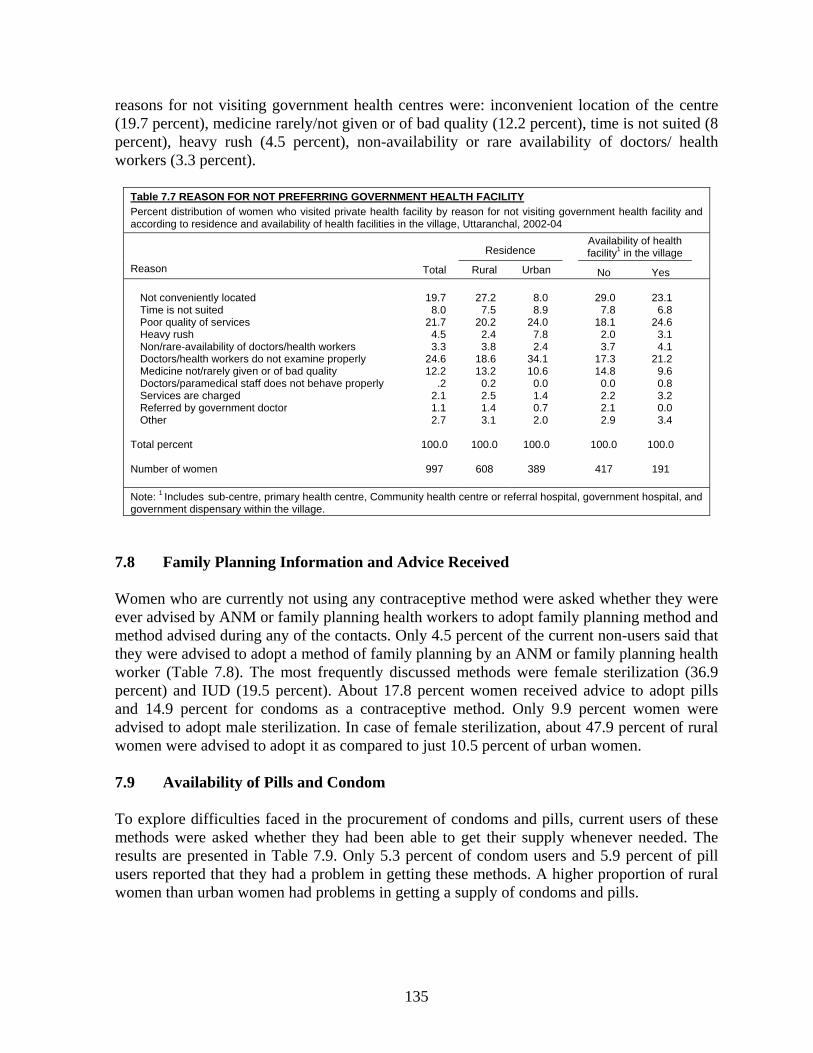
135
reasons for not visiting government health centres were: inconvenient location of the centre (19.7 percent), medicine rarely/not given or of bad quality (12.2 percent), time is not suited (8 percent), heavy rush (4.5 percent), non-availability or rare availability of doctors/ health workers (3.3 percent).
Table 7.7 REASON FOR NOT PREFERRING GOVERNMENT HEALTH FACILITY Percent distribution of women who visited private health facility by reason for not visiting government health facility and according to residence and availability of health facilities in the village, Uttaranchal, 2002-04
Reason Total
Residence Availability of health
facility1 in the village Rural Urban No Yes
Not conveniently located Time is not suited Poor quality of services Heavy rush Non/rare-availability of doctors/health workers Doctors/health workers do not examine properly Medicine not/rarely given or of bad quality Doctors/paramedical staff does not behave properly Services are charged Referred by government doctor Other Total percent Number of women
19.7
8.0 21.7
4.5 3.3
24.6 12.2
.2 2.1 1.1 2.7
100.0
997
27.2
7.5 20.2
2.4 3.8
18.6 13.2
0.2 2.5 1.4 3.1
100.0
608
8.0 8.9
24.0 7.8 2.4
34.1 10.6
0.0 1.4 0.7 2.0
100.0
389
29.0
7.8 18.1
2.0 3.7
17.3 14.8
0.0 2.2 2.1 2.9
100.0
417
23.1
6.8 24.6
3.1 4.1
21.2 9.6 0.8 3.2 0.0 3.4
100.0
191
Note: 1 Includes sub-centre, primary health centre, Community health centre or referral hospital, government hospital, and government dispensary within the village.
7.8 Family Planning Information and Advice Received Women who are currently not using any contraceptive method were asked whether they were ever advised by ANM or family planning health workers to adopt family planning method and method advised during any of the contacts. Only 4.5 percent of the current non-users said that they were advised to adopt a method of family planning by an ANM or family planning health worker (Table 7.8). The most frequently discussed methods were female sterilization (36.9 percent) and IUD (19.5 percent). About 17.8 percent women received advice to adopt pills and 14.9 percent for condoms as a contraceptive method. Only 9.9 percent women were advised to adopt male sterilization. In case of female sterilization, about 47.9 percent of rural women were advised to adopt it as compared to just 10.5 percent of urban women. 7.9 Availability of Pills and Condom To explore difficulties faced in the procurement of condoms and pills, current users of these methods were asked whether they had been able to get their supply whenever needed. The results are presented in Table 7.9. Only 5.3 percent of condom users and 5.9 percent of pill users reported that they had a problem in getting these methods. A higher proportion of rural women than urban women had problems in getting a supply of condoms and pills.
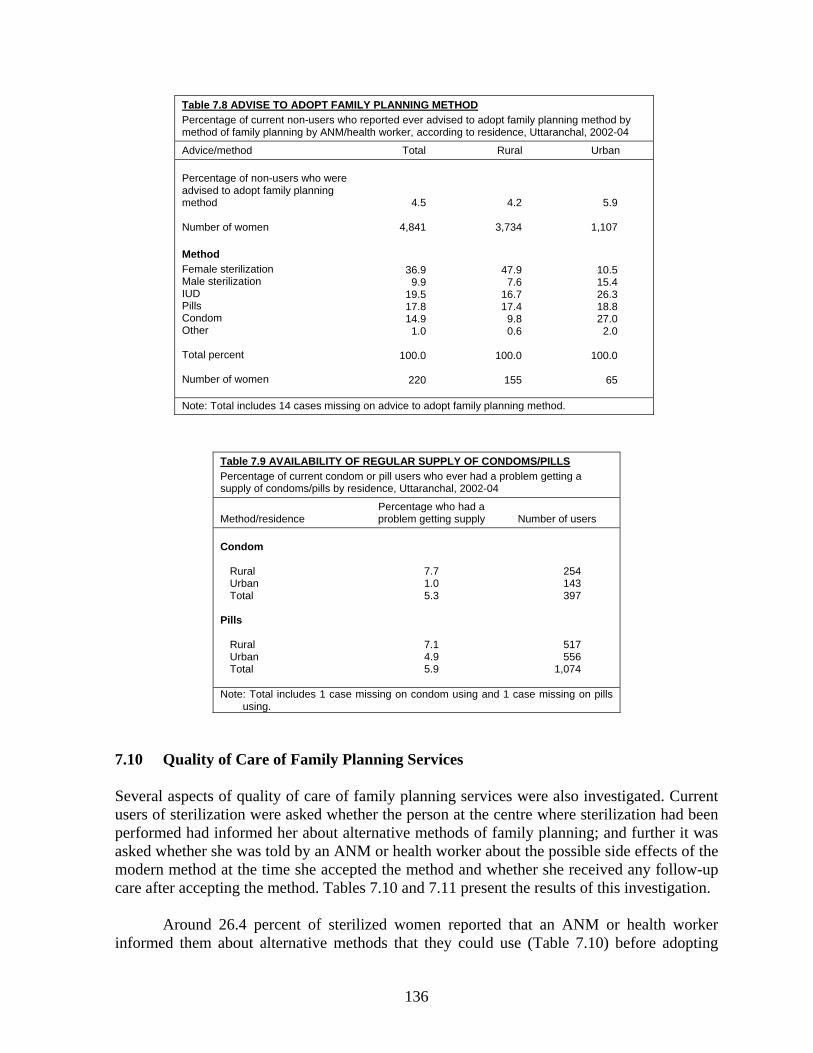
136
Table 7.8 ADVISE TO ADOPT FAMILY PLANNING METHOD Percentage of current non-users who reported ever advised to adopt family planning method by method of family planning by ANM/health worker, according to residence, Uttaranchal, 2002-04
Advice/method Total Rural Urban Percentage of non-users who were advised to adopt family planning method Number of women Method Female sterilization Male sterilization IUD Pills Condom Other Total percent Number of women
4.5
4,841
36.9 9.9
19.5 17.8 14.9
1.0
100.0
220
4.2
3,734
47.9 7.6
16.7 17.4
9.8 0.6
100.0
155
5.9
1,107
10.5 15.4 26.3 18.8 27.0
2.0
100.0
65
Note: Total includes 14 cases missing on advice to adopt family planning method.
Table 7.9 AVAILABILITY OF REGULAR SUPPLY OF CONDOMS/PILLS Percentage of current condom or pill users who ever had a problem getting a supply of condoms/pills by residence, Uttaranchal, 2002-04
Method/residence Percentage who had a problem getting supply Number of users
Condom Rural Urban Total Pills Rural Urban Total
7.7 1.0 5.3
7.1 4.9 5.9
254 143 397
517 556
1,074
Note: Total includes 1 case missing on condom using and 1 case missing on pills using.
7.10 Quality of Care of Family Planning Services Several aspects of quality of care of family planning services were also investigated. Current users of sterilization were asked whether the person at the centre where sterilization had been performed had informed her about alternative methods of family planning; and further it was asked whether she was told by an ANM or health worker about the possible side effects of the modern method at the time she accepted the method and whether she received any follow-up care after accepting the method. Tables 7.10 and 7.11 present the results of this investigation. Around 26.4 percent of sterilized women reported that an ANM or health worker informed them about alternative methods that they could use (Table 7.10) before adopting
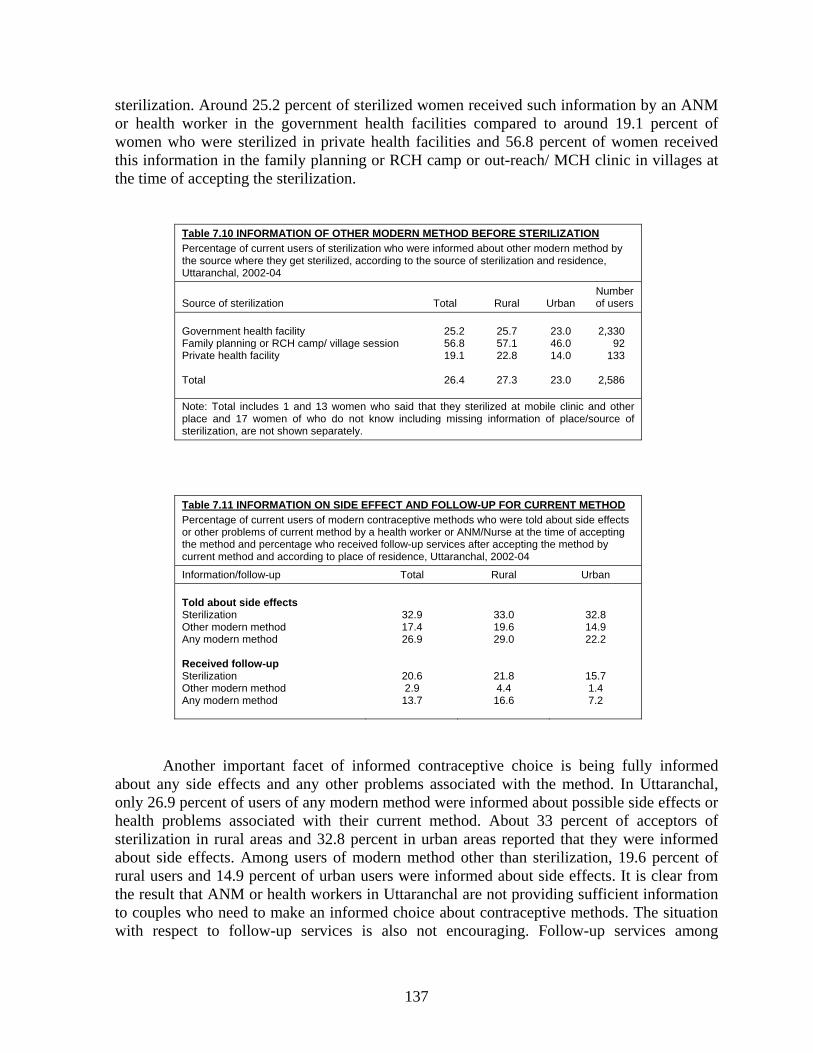
137
sterilization. Around 25.2 percent of sterilized women received such information by an ANM or health worker in the government health facilities compared to around 19.1 percent of women who were sterilized in private health facilities and 56.8 percent of women received this information in the family planning or RCH camp or out-reach/ MCH clinic in villages at the time of accepting the sterilization.
Table 7.10 INFORMATION OF OTHER MODERN METHOD BEFORE STERILIZATION Percentage of current users of sterilization who were informed about other modern method by the source where they get sterilized, according to the source of sterilization and residence, Uttaranchal, 2002-04
Source of sterilization Total Rural Urban Number of users
Government health facility Family planning or RCH camp/ village session Private health facility Total
25.2 56.8 19.1
26.4
25.7 57.1 22.8
27.3
23.0 46.0 14.0
23.0
2,330
92 133
2,586
Note: Total includes 1 and 13 women who said that they sterilized at mobile clinic and other place and 17 women of who do not know including missing information of place/source of sterilization, are not shown separately.
Table 7.11 INFORMATION ON SIDE EFFECT AND FOLLOW-UP FOR CURRENT METHOD Percentage of current users of modern contraceptive methods who were told about side effects or other problems of current method by a health worker or ANM/Nurse at the time of accepting the method and percentage who received follow-up services after accepting the method by current method and according to place of residence, Uttaranchal, 2002-04
Information/follow-up Total Rural Urban Told about side effects Sterilization Other modern method Any modern method Received follow-up Sterilization Other modern method Any modern method
32.9 17.4 26.9
20.6 2.9
13.7
33.0 19.6 29.0
21.8 4.4
16.6
32.8 14.9 22.2
15.7 1.4 7.2
Another important facet of informed contraceptive choice is being fully informed about any side effects and any other problems associated with the method. In Uttaranchal, only 26.9 percent of users of any modern method were informed about possible side effects or health problems associated with their current method. About 33 percent of acceptors of sterilization in rural areas and 32.8 percent in urban areas reported that they were informed about side effects. Among users of modern method other than sterilization, 19.6 percent of rural users and 14.9 percent of urban users were informed about side effects. It is clear from the result that ANM or health workers in Uttaranchal are not providing sufficient information to couples who need to make an informed choice about contraceptive methods. The situation with respect to follow-up services is also not encouraging. Follow-up services among
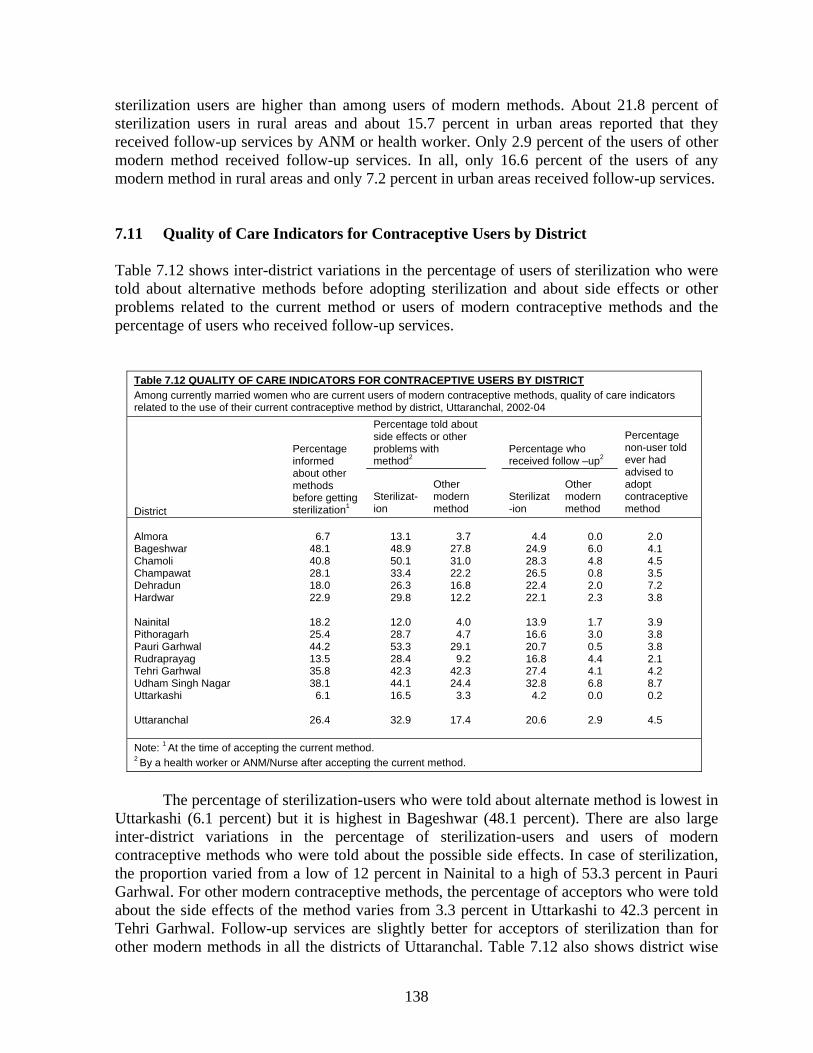
138
sterilization users are higher than among users of modern methods. About 21.8 percent of sterilization users in rural areas and about 15.7 percent in urban areas reported that they received follow-up services by ANM or health worker. Only 2.9 percent of the users of other modern method received follow-up services. In all, only 16.6 percent of the users of any modern method in rural areas and only 7.2 percent in urban areas received follow-up services. 7.11 Quality of Care Indicators for Contraceptive Users by District Table 7.12 shows inter-district variations in the percentage of users of sterilization who were told about alternative methods before adopting sterilization and about side effects or other problems related to the current method or users of modern contraceptive methods and the percentage of users who received follow-up services.
Table 7.12 QUALITY OF CARE INDICATORS FOR CONTRACEPTIVE USERS BY DISTRICT Among currently married women who are current users of modern contraceptive methods, quality of care indicators related to the use of their current contraceptive method by district, Uttaranchal, 2002-04
District
Percentage informed about other methods before getting sterilization1
Percentage told about side effects or other problems with method2
Percentage who received follow –up2
Percentage non-user told ever had advised to adopt contraceptive method
Sterilizat-ion
Other modern method
Sterilizat-ion
Other modern method
Almora Bageshwar Chamoli Champawat Dehradun Hardwar Nainital Pithoragarh Pauri Garhwal Rudraprayag Tehri Garhwal Udham Singh Nagar Uttarkashi Uttaranchal
6.7
48.1 40.8 28.1 18.0 22.9
18.2 25.4 44.2 13.5 35.8 38.1
6.1
26.4
13.1 48.9 50.1 33.4 26.3 29.8
12.0 28.7 53.3 28.4 42.3 44.1 16.5
32.9
3.7
27.8 31.0 22.2 16.8 12.2
4.0 4.7
29.1 9.2
42.3 24.4
3.3
17.4
4.4
24.9 28.3 26.5 22.4 22.1
13.9 16.6 20.7 16.8 27.4 32.8
4.2
20.6
0.0 6.0 4.8 0.8 2.0 2.3
1.7 3.0 0.5 4.4 4.1 6.8 0.0
2.9
2.0 4.1 4.5 3.5 7.2 3.8
3.9 3.8 3.8 2.1 4.2 8.7 0.2
4.5
Note: 1 At the time of accepting the current method. 2 By a health worker or ANM/Nurse after accepting the current method.
The percentage of sterilization-users who were told about alternate method is lowest in
Uttarkashi (6.1 percent) but it is highest in Bageshwar (48.1 percent). There are also large inter-district variations in the percentage of sterilization-users and users of modern contraceptive methods who were told about the possible side effects. In case of sterilization, the proportion varied from a low of 12 percent in Nainital to a high of 53.3 percent in Pauri Garhwal. For other modern contraceptive methods, the percentage of acceptors who were told about the side effects of the method varies from 3.3 percent in Uttarkashi to 42.3 percent in Tehri Garhwal. Follow-up services are slightly better for acceptors of sterilization than for other modern methods in all the districts of Uttaranchal. Table 7.12 also shows district wise
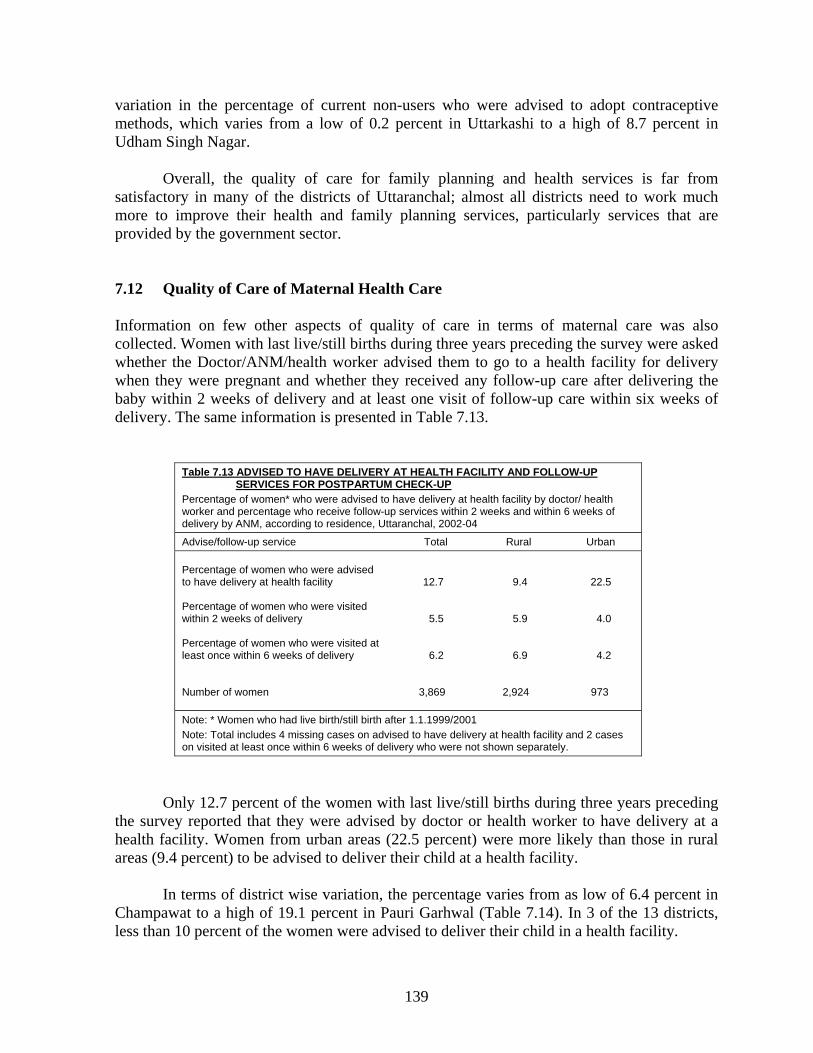
139
variation in the percentage of current non-users who were advised to adopt contraceptive methods, which varies from a low of 0.2 percent in Uttarkashi to a high of 8.7 percent in Udham Singh Nagar. Overall, the quality of care for family planning and health services is far from satisfactory in many of the districts of Uttaranchal; almost all districts need to work much more to improve their health and family planning services, particularly services that are provided by the government sector. 7.12 Quality of Care of Maternal Health Care Information on few other aspects of quality of care in terms of maternal care was also collected. Women with last live/still births during three years preceding the survey were asked whether the Doctor/ANM/health worker advised them to go to a health facility for delivery when they were pregnant and whether they received any follow-up care after delivering the baby within 2 weeks of delivery and at least one visit of follow-up care within six weeks of delivery. The same information is presented in Table 7.13.
Table 7.13 ADVISED TO HAVE DELIVERY AT HEALTH FACILITY AND FOLLOW-UP SERVICES FOR POSTPARTUM CHECK-UP Percentage of women* who were advised to have delivery at health facility by doctor/ health worker and percentage who receive follow-up services within 2 weeks and within 6 weeks of delivery by ANM, according to residence, Uttaranchal, 2002-04
Advise/follow-up service Total Rural Urban Percentage of women who were advised to have delivery at health facility Percentage of women who were visited within 2 weeks of delivery Percentage of women who were visited at least once within 6 weeks of delivery Number of women
12.7
5.5
6.2
3,869
9.4
5.9
6.9
2,924
22.5
4.0
4.2
973
Note: * Women who had live birth/still birth after 1.1.1999/2001 Note: Total includes 4 missing cases on advised to have delivery at health facility and 2 cases on visited at least once within 6 weeks of delivery who were not shown separately.
Only 12.7 percent of the women with last live/still births during three years preceding the survey reported that they were advised by doctor or health worker to have delivery at a health facility. Women from urban areas (22.5 percent) were more likely than those in rural areas (9.4 percent) to be advised to deliver their child at a health facility.
In terms of district wise variation, the percentage varies from as low of 6.4 percent in Champawat to a high of 19.1 percent in Pauri Garhwal (Table 7.14). In 3 of the 13 districts, less than 10 percent of the women were advised to deliver their child in a health facility.
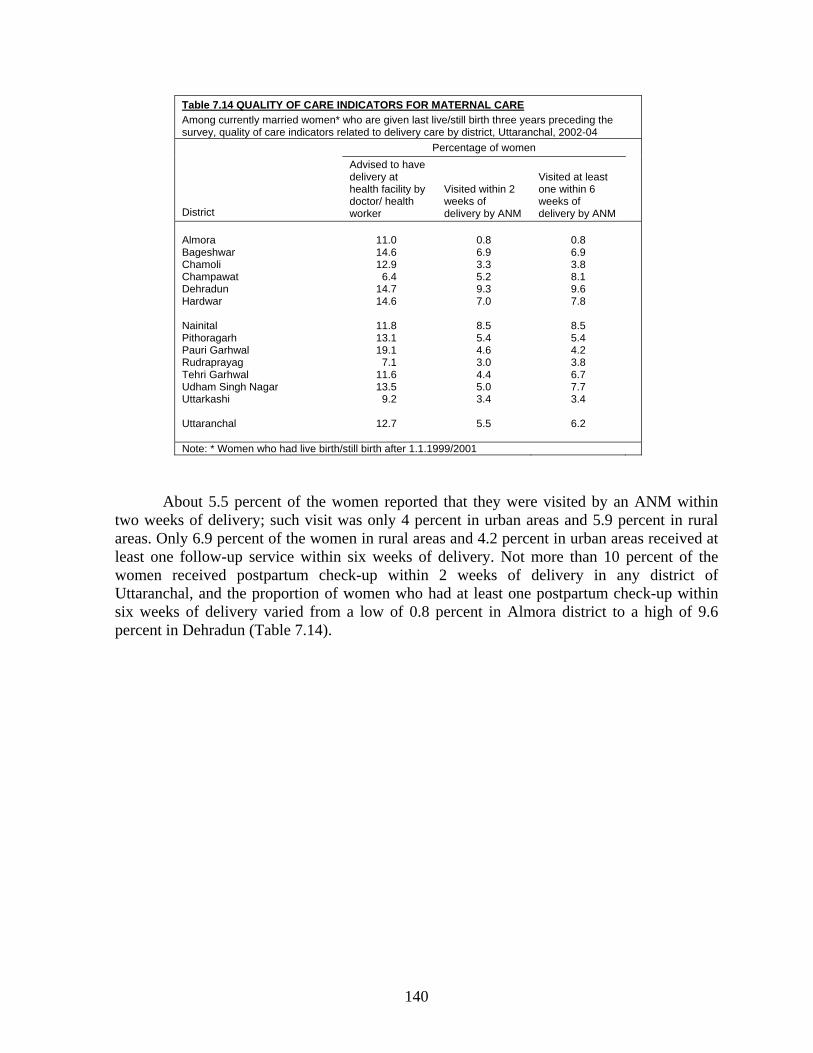
140
Table 7.14 QUALITY OF CARE INDICATORS FOR MATERNAL CARE Among currently married women* who are given last live/still birth three years preceding the survey, quality of care indicators related to delivery care by district, Uttaranchal, 2002-04
District
Percentage of women Advised to have delivery at health facility by doctor/ health worker
Visited within 2 weeks of delivery by ANM
Visited at least one within 6 weeks of delivery by ANM
Almora Bageshwar Chamoli Champawat Dehradun Hardwar Nainital Pithoragarh Pauri Garhwal Rudraprayag Tehri Garhwal Udham Singh Nagar Uttarkashi Uttaranchal
11.0 14.6 12.9
6.4 14.7 14.6
11.8 13.1 19.1
7.1 11.6 13.5
9.2
12.7
0.8 6.9 3.3 5.2 9.3 7.0
8.5 5.4 4.6 3.0 4.4 5.0 3.4
5.5
0.8 6.9 3.8 8.1 9.6 7.8
8.5 5.4 4.2 3.8 6.7 7.7 3.4
6.2
Note: * Women who had live birth/still birth after 1.1.1999/2001
About 5.5 percent of the women reported that they were visited by an ANM within two weeks of delivery; such visit was only 4 percent in urban areas and 5.9 percent in rural areas. Only 6.9 percent of the women in rural areas and 4.2 percent in urban areas received at least one follow-up service within six weeks of delivery. Not more than 10 percent of the women received postpartum check-up within 2 weeks of delivery in any district of Uttaranchal, and the proportion of women who had at least one postpartum check-up within six weeks of delivery varied from a low of 0.8 percent in Almora district to a high of 9.6 percent in Dehradun (Table 7.14).
CHAPTER – VIII
REPRODUCTIVE HEALTH PROBLEMS AND AWARENESS OF RTIs/STIs AND HIV/AIDS
One of the important components of the Reproductive and Child Health Programme is to have a healthy sexual life without any fear of contracting disease. With this approach, the RCH programme places a lot of emphasis on promoting and encouraging healthy sexual behaviour among couples through various Information, Education and Communication (IEC) activities. Health workers are also expected to educate women and men about Reproductive Tract Infections (RTIs) and Sexually Transmitted Infections (STIs) and motivate those people with RTI/STI problems to seek medical help. The DLHS-RCH has made an attempt to collect information on awareness and prevalence of RTI/STI. Apart from this, information on knowledge of HIV/AIDS, source of information and ways of avoiding AIDS were also collected. 8.1 Awareness of RTI/STI An attempt was made to assess whether couples were aware of RTI/STI. Currently married women and their husbands were asked about their awareness of RTI/STI and if they were aware, they were further questioned about the source of information and mode of transmission of the disease.
Table 8.1 shows the percentage of women aware of RTI/STI by background characteristics. About 28.9 percent of the women in Uttaranchal were aware of RTI/STI. The proportion of women who were aware of RTI/STI is higher in urban areas (32.7 percent) than in rural areas (27.5 percent) as shown in Figure 8.1. Awareness of RTI/STI is lower among younger women, non-literate women, women from Muslim religion, scheduled caste women and women from households with a low standard of living. Awareness of RTI/STI increases from 18.3 percent among non-literate women to 47.8 percent among women who have completed 10 or more years of schooling. The standard of living index shows a positive relationship with awareness of RTI/STI, ranging from 20.9 percent among women with a low standard of living to 38.5 percent among women with a high standard of living. Those women who had heard of RTI/STI were further asked about the source of information of RTI/STI, which is also presented in Table 8.1. About 52.3 percent of the women reported that they received information of RTI/STI from television and 48.2 percent from friends or relatives. Other sources of information of RTI/STI as reported by women were newspaper or books or magazines (32.4 percent), radio (13.4 percent), slogans or posters or pamphlets or wall hoardings (11.6 percent) and community meetings (10.3 percent). Only 9.3 percent of women received this information from doctors and 7 percent from health workers, and about 4.6 percent of the women reported that they had heard of RTI/STI from other sources.
Table 8.2 shows the percentage of husbands of currently married women who heard of RTI/STI by specific source of information according to some selected background characteristics. In Uttaranchal, the percentage of men who heard of RTI/STI is higher than that of women (Figure 8.1). Almost 40 percent of the men had heard of RTI/STI. Men from urban
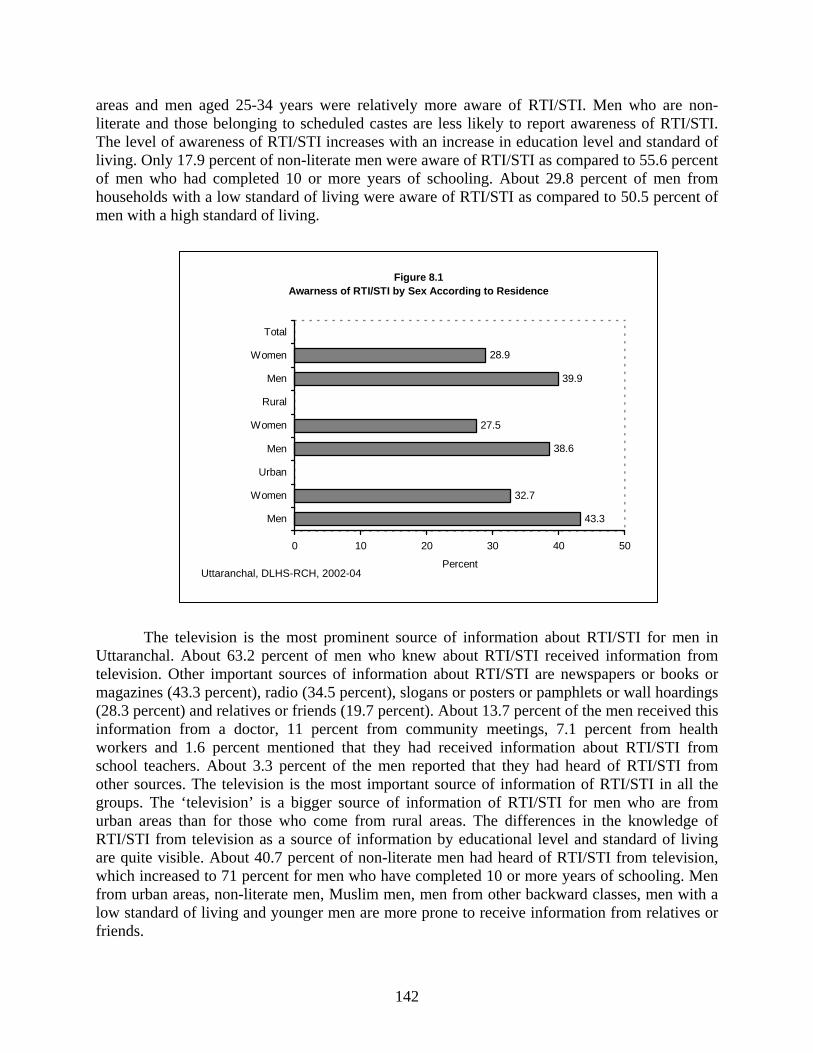
142
areas and men aged 25-34 years were relatively more aware of RTI/STI. Men who are non-literate and those belonging to scheduled castes are less likely to report awareness of RTI/STI. The level of awareness of RTI/STI increases with an increase in education level and standard of living. Only 17.9 percent of non-literate men were aware of RTI/STI as compared to 55.6 percent of men who had completed 10 or more years of schooling. About 29.8 percent of men from households with a low standard of living were aware of RTI/STI as compared to 50.5 percent of men with a high standard of living. The television is the most prominent source of information about RTI/STI for men in Uttaranchal. About 63.2 percent of men who knew about RTI/STI received information from television. Other important sources of information about RTI/STI are newspapers or books or magazines (43.3 percent), radio (34.5 percent), slogans or posters or pamphlets or wall hoardings (28.3 percent) and relatives or friends (19.7 percent). About 13.7 percent of the men received this information from a doctor, 11 percent from community meetings, 7.1 percent from health workers and 1.6 percent mentioned that they had received information about RTI/STI from school teachers. About 3.3 percent of the men reported that they had heard of RTI/STI from other sources. The television is the most important source of information of RTI/STI in all the groups. The ‘television’ is a bigger source of information of RTI/STI for men who are from urban areas than for those who come from rural areas. The differences in the knowledge of RTI/STI from television as a source of information by educational level and standard of living are quite visible. About 40.7 percent of non-literate men had heard of RTI/STI from television, which increased to 71 percent for men who have completed 10 or more years of schooling. Men from urban areas, non-literate men, Muslim men, men from other backward classes, men with a low standard of living and younger men are more prone to receive information from relatives or friends.
Figure 8.1 Awarness of RTI/STI by Sex According to Residence
43.3
32.7
38.6
27.5
39.9
28.9
0 10 20 30 40 50
Men
Women
Urban
Men
Women
Rural
Men
Women
Total
PercentUttaranchal, DLHS-RCH, 2002-04

143
Table 8.1 SOURCE OF KNOWLEDGE ABOUT RTI/STI AMONG WOMEN
Percentage of currently married women age 15 - 44 who have heard about RTI/STI and among women who have heard about RTI/STI, percentage who received information from specific sources by selected background characteristics, Uttaranchal, 2002-04.
Background Characteristic
Percentage who have
heard about RTI/STI
Number of
Women
Among those who have heard about RTI/STI, percentage who received information from ;
Number of women who have heard
about RTI/STI Radio Televis
ion
Newspaper/ Books/
Magazines
Slogan/ Pamphlets/
Posters/ Wall
Hoardings Doctor Health worker
School teacher
Community Meeting
Relative/ Friends Others
Age group (years) 15-19 20-24 25-29 30-34 35-39 40-44 Residence Rural Urban Education Non-literate 0-9@ years 10 and above Religion Hindu Muslim Sikh Other Caste/tribe# Scheduled caste Scheduled tribe Other backward class Other Standard of living index Low Medium
High Total
20.3 30.4 31.9 27.7 29.4 25.1
27.5 32.7
18.3 28.3 47.8
28.9 25.4 44.6
(67.4)
19.1 21.0 26.2 32.5
20.9 28.6 38.5
28.9
383 2,042 2,235 1,955 1,688 1,338
7,003 2,638
4,229 2,955 2,453
8,371 1,069
160 42
1,267
301 2,097 5,719
3,485 3,153 3,003
9,641
15.8 14.7 14.0 11.8 12.1 13.3
13.7 12.7
4.2
11.0 21.0
14.5 3.9
10.0 (17.2)
8.2
13.6 4.9
16.3
11.2 14.0 14.3
13.4
33.2 54.0 59.8 47.9 47.8 51.4
46.0 66.3
27.5 46.3 73.0
53.0 43.8 62.5
(58.6)
46.1 43.4 46.3 54.6
23.6 52.1 70.5
52.3
15.5 32.0 38.4 29.3 29.9 33.3
26.0 46.9
9.6
24.3 53.3
33.7 21.7 27.3
(51.7)
26.2 30.0 29.0 33.0
11.7 26.1 50.4
32.4
5.1 11.1 13.5 11.6 10.4 12.3
9.7
16.1
1.0 6.6
22.3
12.5 3.6
11.8 (24.1)
7.7 5.0 5.9
14.3
6.0 9.3
17.0
11.6
6.0 8.5
11.0 7.6
11.1 7.7
8.6
10.9
5.8 7.6
12.7
9.3 7.0
15.6 (13.8)
8.8 7.5 7.6
10.0
6.6 7.8
12.2
9.3
4.0 5.1 7.7 7.4 7.4 8.2
7.3 6.1
6.0 5.9 8.3
7.1 4.3
10.4 (10.3)
6.7 0.7 6.7 7.5
6.7 6.7 7.3
7.0
1.0 0.5 0.7 0.2 1.3 1.0
0.3 1.5
0.3 0.8 0.9
0.7 0.0 2.5
(0.0)
1.2 0.0 0.4 0.8
0.2 0.4 1.2
0.7
14.8 8.8 8.8 9.8
11.6 13.7
12.5
5.2
14.4 11.5
6.7
10.7 2.6
18.3 (27.6)
15.7 17.5
8.3 10.1
15.9 11.9
5.4
10.3
61.0 46.3 43.0 50.4 53.5 48.2
52.0 39.7
62.7 56.7 32.6
46.6 63.9 50.1
(31.0)
49.0 59.0 53.7 46.3
65.0 50.7 35.6
48.2
11.8 5.0 2.3 5.7 3.8 6.2
5.7 2.0
6.4 6.6 1.9
4.3 8.0 1.7
(0.0)
4.7 6.7 6.4 4.0
7.1 4.7 2.8
4.6
78 621 713 541 497 336
1,925
862
775 837
1,174
2,419 272
71 25
241
63 550
1,858
728 903
1,155
2,787
Note: Total includes 3 cases of missing information on education are not shown separately. #Total figure may not add to N due to do not know and missing cases. @ Literate women with no year of schooling are also included. ( ) Based on less than 50 unweighted cases
143
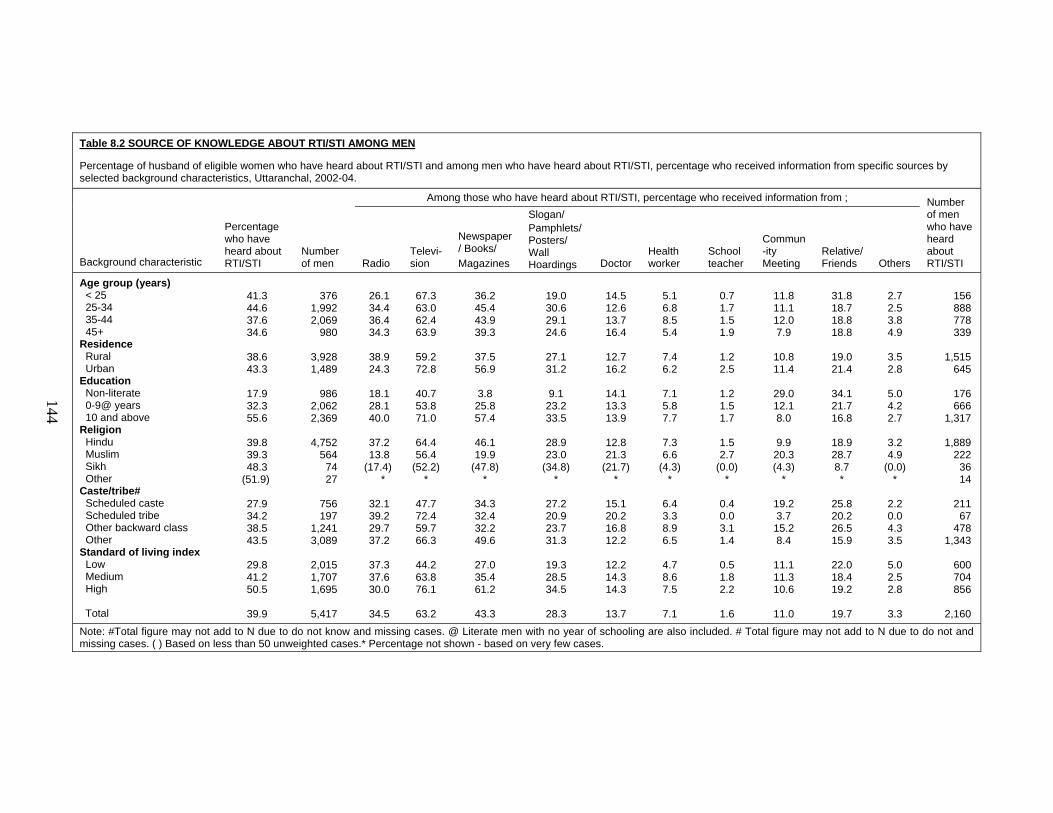
144
Table 8.2 SOURCE OF KNOWLEDGE ABOUT RTI/STI AMONG MEN
Percentage of husband of eligible women who have heard about RTI/STI and among men who have heard about RTI/STI, percentage who received information from specific sources by selected background characteristics, Uttaranchal, 2002-04.
Background characteristic
Percentage who have heard about RTI/STI
Number of men
Among those who have heard about RTI/STI, percentage who received information from ; Number of men who have heard about RTI/STI Radio
Televi-sion
Newspaper/ Books/ Magazines
Slogan/ Pamphlets/ Posters/ Wall Hoardings Doctor
Health worker
School teacher
Commun-ity Meeting
Relative/ Friends Others
Age group (years) < 25 25-34 35-44 45+ Residence Rural Urban Education Non-literate 0-9@ years 10 and above Religion Hindu Muslim Sikh Other Caste/tribe# Scheduled caste Scheduled tribe Other backward class Other Standard of living index Low Medium
High Total
41.3 44.6 37.6 34.6
38.6 43.3
17.9 32.3 55.6
39.8 39.3 48.3
(51.9)
27.9 34.2 38.5 43.5
29.8 41.2 50.5
39.9
376
1,992 2,069
980
3,928 1,489
986
2,062 2,369
4,752
564 74 27
756 197
1,241 3,089
2,015 1,707 1,695
5,417
26.1 34.4 36.4 34.3
38.9 24.3
18.1 28.1 40.0
37.2 13.8
(17.4) *
32.1 39.2 29.7 37.2
37.3 37.6 30.0
34.5
67.3 63.0 62.4 63.9
59.2 72.8
40.7 53.8 71.0
64.4 56.4
(52.2) *
47.7 72.4 59.7 66.3
44.2 63.8 76.1
63.2
36.2 45.4 43.9 39.3
37.5 56.9
3.8
25.8 57.4
46.1 19.9
(47.8) *
34.3 32.4 32.2 49.6
27.0 35.4 61.2
43.3
19.0 30.6 29.1 24.6
27.1 31.2
9.1
23.2 33.5
28.9 23.0
(34.8) *
27.2 20.9 23.7 31.3
19.3 28.5 34.5
28.3
14.5 12.6 13.7 16.4
12.7 16.2
14.1 13.3 13.9
12.8 21.3
(21.7) *
15.1 20.2 16.8 12.2
12.2 14.3 14.3
13.7
5.1 6.8 8.5 5.4
7.4 6.2
7.1 5.8 7.7
7.3 6.6
(4.3) *
6.4 3.3 8.9 6.5
4.7 8.6 7.5
7.1
0.7 1.7 1.5 1.9
1.2 2.5
1.2 1.5 1.7
1.5 2.7
(0.0) *
0.4 0.0 3.1 1.4
0.5 1.8 2.2
1.6
11.8 11.1 12.0 7.9
10.8 11.4
29.0 12.1 8.0
9.9
20.3 (4.3)
*
19.2 3.7
15.2 8.4
11.1 11.3 10.6
11.0
31.8 18.7 18.8 18.8
19.0 21.4
34.1 21.7 16.8
18.9 28.7 8.7 *
25.8 20.2 26.5 15.9
22.0 18.4 19.2
19.7
2.7 2.5 3.8 4.9
3.5 2.8
5.0 4.2 2.7
3.2 4.9
(0.0) *
2.2 0.0 4.3 3.5
5.0 2.5 2.8
3.3
156 888 778 339
1,515
645
176 666
1,317
1,889 222
36 14
211
67 478
1,343
600 704 856
2,160
Note: #Total figure may not add to N due to do not know and missing cases. @ Literate men with no year of schooling are also included. # Total figure may not add to N due to do not and missing cases. ( ) Based on less than 50 unweighted cases.* Percentage not shown - based on very few cases.
144
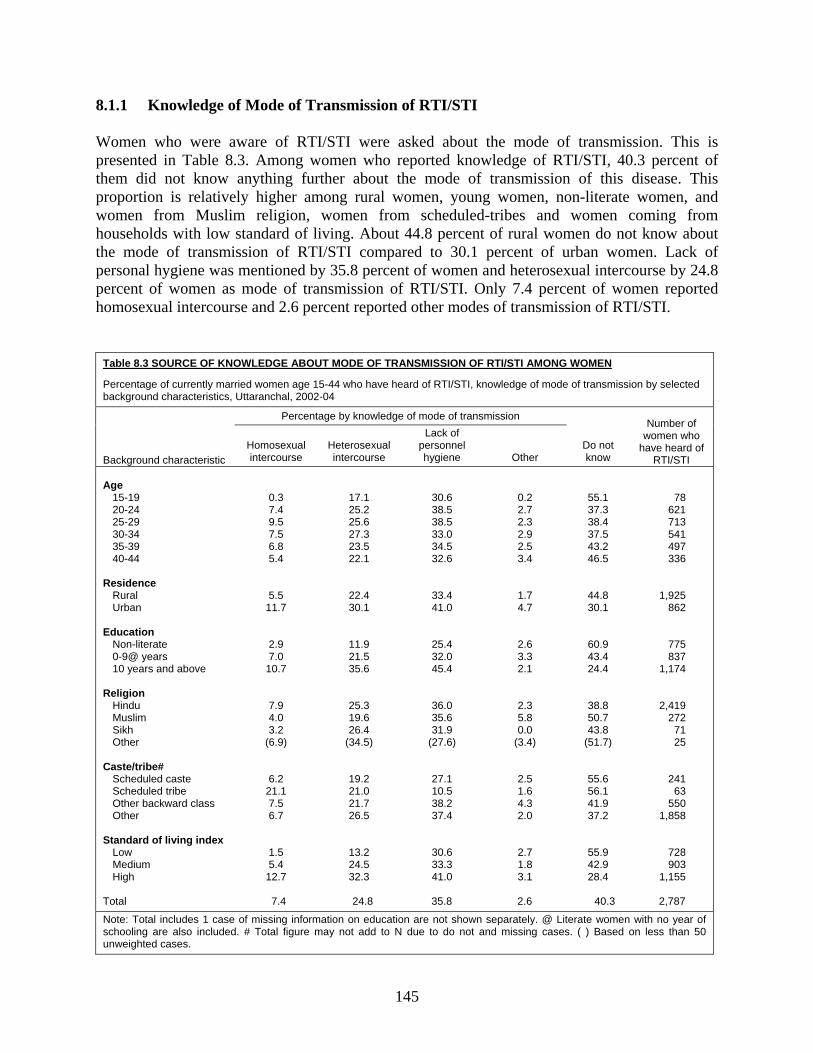
145
8.1.1 Knowledge of Mode of Transmission of RTI/STI Women who were aware of RTI/STI were asked about the mode of transmission. This is presented in Table 8.3. Among women who reported knowledge of RTI/STI, 40.3 percent of them did not know anything further about the mode of transmission of this disease. This proportion is relatively higher among rural women, young women, non-literate women, and women from Muslim religion, women from scheduled-tribes and women coming from households with low standard of living. About 44.8 percent of rural women do not know about the mode of transmission of RTI/STI compared to 30.1 percent of urban women. Lack of personal hygiene was mentioned by 35.8 percent of women and heterosexual intercourse by 24.8 percent of women as mode of transmission of RTI/STI. Only 7.4 percent of women reported homosexual intercourse and 2.6 percent reported other modes of transmission of RTI/STI.
Table 8.3 SOURCE OF KNOWLEDGE ABOUT MODE OF TRANSMISSION OF RTI/STI AMONG WOMEN
Percentage of currently married women age 15-44 who have heard of RTI/STI, knowledge of mode of transmission by selected background characteristics, Uttaranchal, 2002-04
Background characteristic
Percentage by knowledge of mode of transmission
Do not know
Number of women who
have heard of RTI/STI
Homosexual intercourse
Heterosexual intercourse
Lack of personnel hygiene Other
Age 15-19 20-24 25-29 30-34 35-39 40-44 Residence Rural Urban Education Non-literate 0-9@ years 10 years and above Religion Hindu Muslim Sikh Other Caste/tribe# Scheduled caste Scheduled tribe Other backward class Other Standard of living index Low Medium High Total
0.3 7.4 9.5 7.5 6.8 5.4
5.5 11.7
2.9 7.0
10.7
7.9 4.0 3.2
(6.9)
6.2 21.1 7.5 6.7
1.5 5.4
12.7
7.4
17.1 25.2 25.6 27.3 23.5 22.1
22.4 30.1
11.9 21.5 35.6
25.3 19.6 26.4
(34.5)
19.2 21.0 21.7 26.5
13.2 24.5 32.3
24.8
30.6 38.5 38.5 33.0 34.5 32.6
33.4 41.0
25.4 32.0 45.4
36.0 35.6 31.9
(27.6)
27.1 10.5 38.2 37.4
30.6 33.3 41.0
35.8
0.2 2.7 2.3 2.9 2.5 3.4
1.7 4.7
2.6 3.3 2.1
2.3 5.8 0.0
(3.4)
2.5 1.6 4.3 2.0
2.7 1.8 3.1
2.6
55.1 37.3 38.4 37.5 43.2 46.5
44.8 30.1
60.9 43.4 24.4
38.8 50.7 43.8
(51.7)
55.6 56.1 41.9 37.2
55.9 42.9 28.4
40.3
78 621 713 541 497 336
1,925 862
775 837
1,174
2,419 272
71 25
241 63
550 1,858
728 903
1,155
2,787
Note: Total includes 1 case of missing information on education are not shown separately. @ Literate women with no year of schooling are also included. # Total figure may not add to N due to do not and missing cases. ( ) Based on less than 50 unweighted cases.
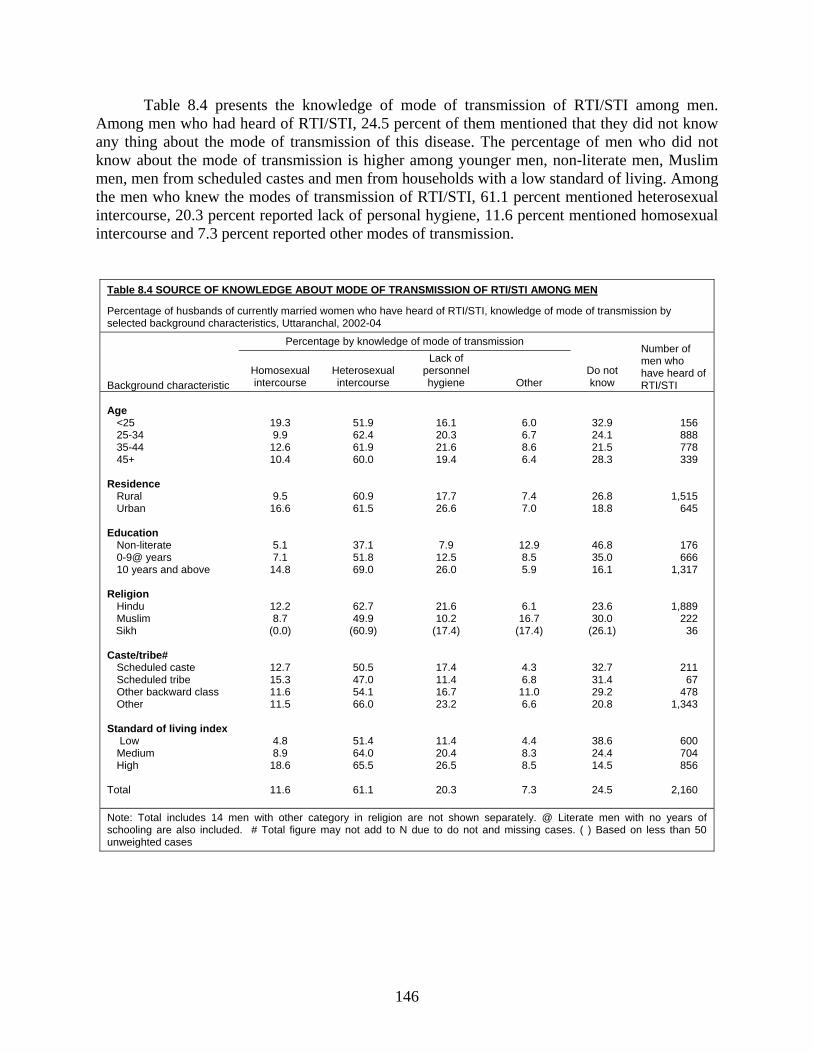
146
Table 8.4 presents the knowledge of mode of transmission of RTI/STI among men. Among men who had heard of RTI/STI, 24.5 percent of them mentioned that they did not know any thing about the mode of transmission of this disease. The percentage of men who did not know about the mode of transmission is higher among younger men, non-literate men, Muslim men, men from scheduled castes and men from households with a low standard of living. Among the men who knew the modes of transmission of RTI/STI, 61.1 percent mentioned heterosexual intercourse, 20.3 percent reported lack of personal hygiene, 11.6 percent mentioned homosexual intercourse and 7.3 percent reported other modes of transmission.
Table 8.4 SOURCE OF KNOWLEDGE ABOUT MODE OF TRANSMISSION OF RTI/STI AMONG MEN
Percentage of husbands of currently married women who have heard of RTI/STI, knowledge of mode of transmission by selected background characteristics, Uttaranchal, 2002-04
Background characteristic
Percentage by knowledge of mode of transmission
Do not know
Number of men who have heard of RTI/STI
Homosexual intercourse
Heterosexual intercourse
Lack of personnel hygiene Other
Age <25 25-34 35-44 45+ Residence Rural Urban Education Non-literate 0-9@ years 10 years and above Religion Hindu Muslim Sikh Caste/tribe# Scheduled caste Scheduled tribe Other backward class Other Standard of living index Low Medium High Total
19.3 9.9
12.6 10.4
9.5 16.6
5.1 7.1
14.8
12.2 8.7
(0.0)
12.7 15.3 11.6 11.5
4.8 8.9
18.6
11.6
51.9 62.4 61.9 60.0
60.9 61.5
37.1 51.8 69.0
62.7 49.9
(60.9)
50.5 47.0 54.1 66.0
51.4 64.0 65.5
61.1
16.1 20.3 21.6 19.4
17.7 26.6
7.9 12.5 26.0
21.6 10.2
(17.4)
17.4 11.4 16.7 23.2
11.4 20.4 26.5
20.3
6.0 6.7 8.6 6.4
7.4 7.0
12.9 8.5 5.9
6.1 16.7
(17.4)
4.3 6.8
11.0 6.6
4.4 8.3 8.5
7.3
32.9 24.1 21.5 28.3
26.8 18.8
46.8 35.0 16.1
23.6 30.0
(26.1)
32.7 31.4 29.2 20.8
38.6 24.4 14.5
24.5
156 888 778 339
1,515 645
176 666
1,317
1,889 222
36
211 67
478 1,343
600 704 856
2,160
Note: Total includes 14 men with other category in religion are not shown separately. @ Literate men with no years of schooling are also included. # Total figure may not add to N due to do not and missing cases. ( ) Based on less than 50 unweighted cases
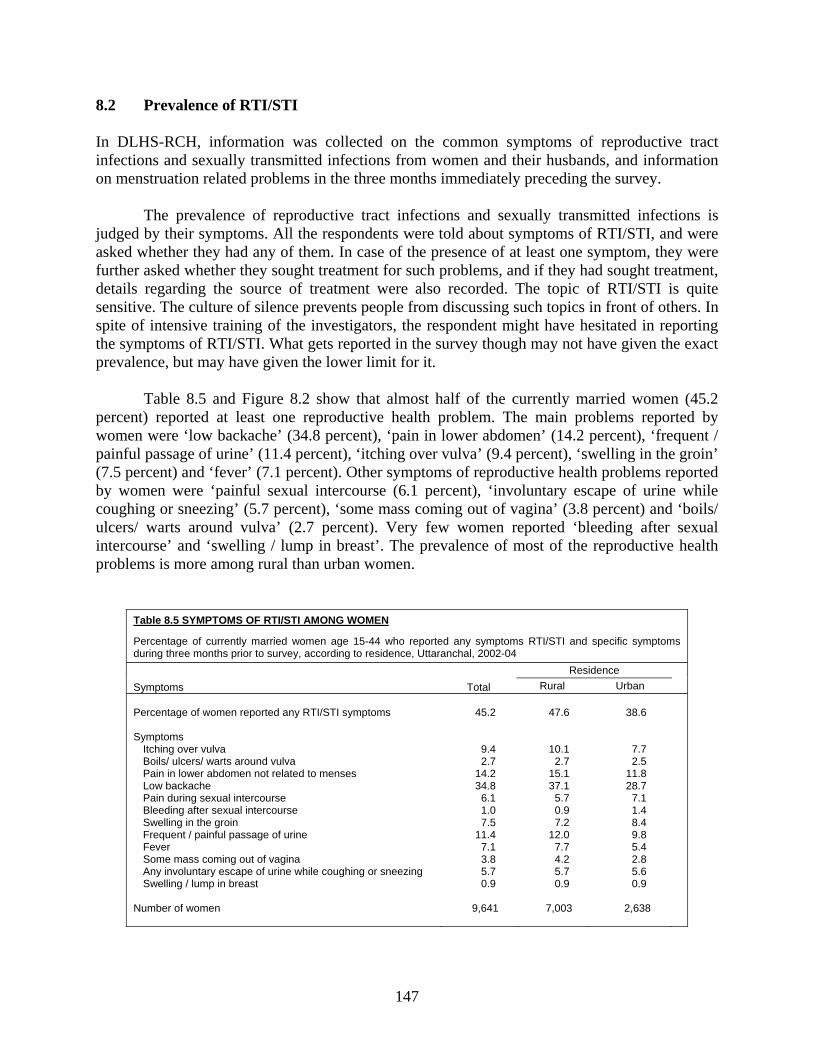
147
8.2 Prevalence of RTI/STI In DLHS-RCH, information was collected on the common symptoms of reproductive tract infections and sexually transmitted infections from women and their husbands, and information on menstruation related problems in the three months immediately preceding the survey.
The prevalence of reproductive tract infections and sexually transmitted infections is judged by their symptoms. All the respondents were told about symptoms of RTI/STI, and were asked whether they had any of them. In case of the presence of at least one symptom, they were further asked whether they sought treatment for such problems, and if they had sought treatment, details regarding the source of treatment were also recorded. The topic of RTI/STI is quite sensitive. The culture of silence prevents people from discussing such topics in front of others. In spite of intensive training of the investigators, the respondent might have hesitated in reporting the symptoms of RTI/STI. What gets reported in the survey though may not have given the exact prevalence, but may have given the lower limit for it. Table 8.5 and Figure 8.2 show that almost half of the currently married women (45.2 percent) reported at least one reproductive health problem. The main problems reported by women were ‘low backache’ (34.8 percent), ‘pain in lower abdomen’ (14.2 percent), ‘frequent / painful passage of urine’ (11.4 percent), ‘itching over vulva’ (9.4 percent), ‘swelling in the groin’ (7.5 percent) and ‘fever’ (7.1 percent). Other symptoms of reproductive health problems reported by women were ‘painful sexual intercourse (6.1 percent), ‘involuntary escape of urine while coughing or sneezing’ (5.7 percent), ‘some mass coming out of vagina’ (3.8 percent) and ‘boils/ ulcers/ warts around vulva’ (2.7 percent). Very few women reported ‘bleeding after sexual intercourse’ and ‘swelling / lump in breast’. The prevalence of most of the reproductive health problems is more among rural than urban women.
Table 8.5 SYMPTOMS OF RTI/STI AMONG WOMEN
Percentage of currently married women age 15-44 who reported any symptoms RTI/STI and specific symptoms during three months prior to survey, according to residence, Uttaranchal, 2002-04
Symptoms Total Residence
Rural Urban Percentage of women reported any RTI/STI symptoms Symptoms Itching over vulva Boils/ ulcers/ warts around vulva Pain in lower abdomen not related to menses Low backache Pain during sexual intercourse Bleeding after sexual intercourse Swelling in the groin Frequent / painful passage of urine Fever Some mass coming out of vagina Any involuntary escape of urine while coughing or sneezing Swelling / lump in breast Number of women
45.2
9.4 2.7
14.2 34.8
6.1 1.0 7.5
11.4 7.1 3.8 5.7 0.9
9,641
47.6
10.1 2.7
15.1 37.1
5.7 0.9 7.2
12.0 7.7 4.2 5.7 0.9
7,003
38.6
7.7 2.5
11.8 28.7
7.1 1.4 8.4 9.8 5.4 2.8 5.6 0.9
2,638
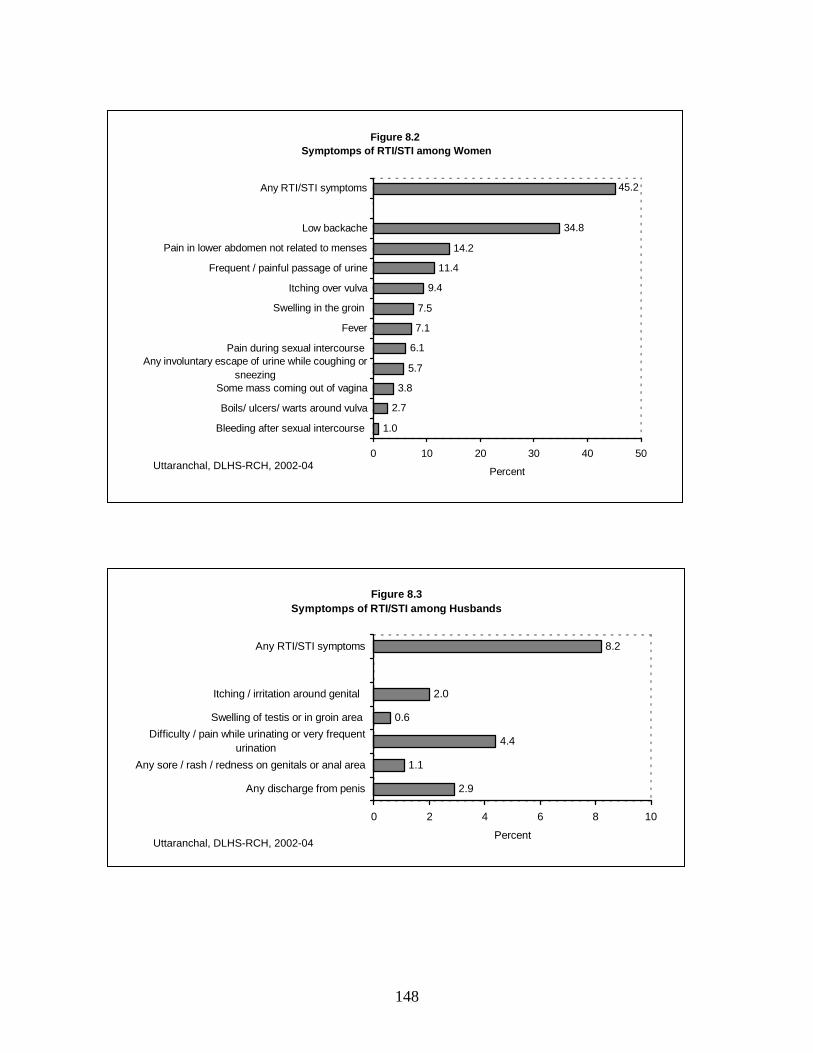
148
Figure 8.3 Symptomps of RTI/STI among Husbands
8.2
2.0
0.6
4.4
1.1
2.9
0 2 4 6 8 10
Any discharge from penis
Any sore / rash / redness on genitals or anal area
Difficulty / pain while urinating or very frequenturination
Swelling of testis or in groin area
Itching / irritation around genital
Any RTI/STI symptoms
PercentUttaranchal, DLHS-RCH, 2002-04
Figure 8.2 Symptomps of RTI/STI among Women
1.0
2.7
3.8
5.7
6.1
7.1
7.5
9.4
11.4
14.2
34.8
45.2
0 10 20 30 40 50
Bleeding after sexual intercourse
Boils/ ulcers/ warts around vulva
Some mass coming out of vagina
Any involuntary escape of urine while coughing orsneezing
Pain during sexual intercourse
Fever
Swelling in the groin
Itching over vulva
Frequent / painful passage of urine
Pain in lower abdomen not related to menses
Low backache
Any RTI/STI symptoms
PercentUttaranchal, DLHS-RCH, 2002-04
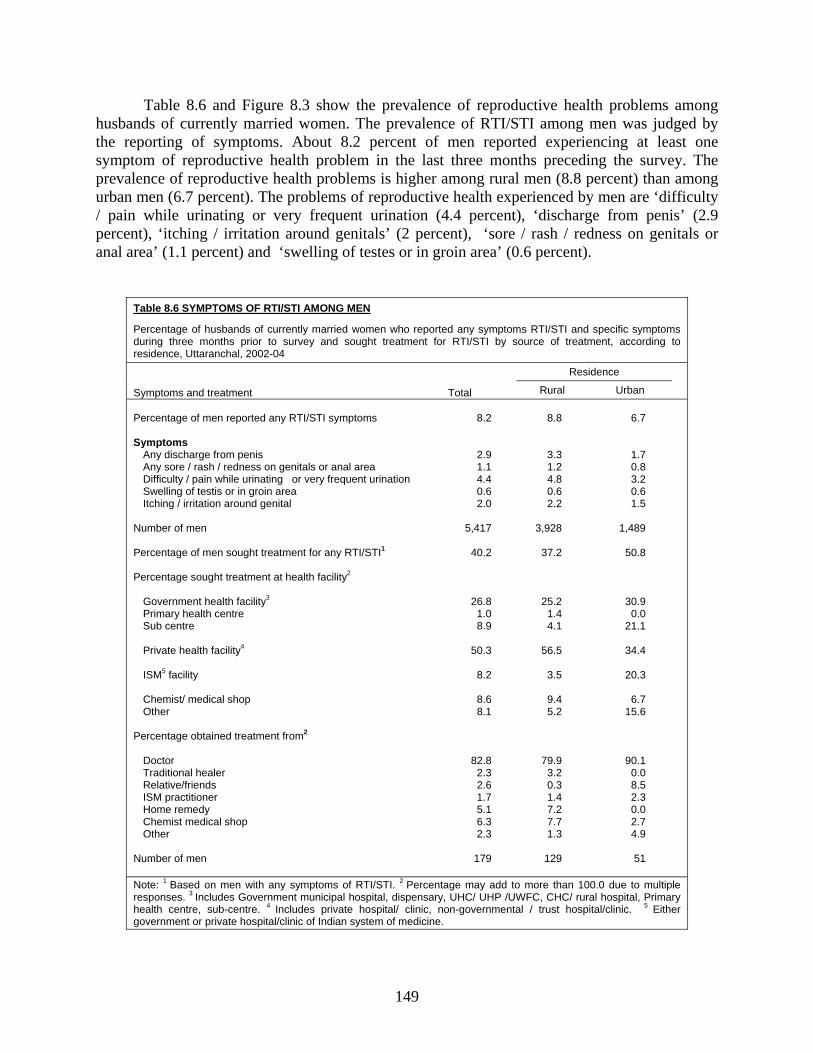
149
Table 8.6 and Figure 8.3 show the prevalence of reproductive health problems among husbands of currently married women. The prevalence of RTI/STI among men was judged by the reporting of symptoms. About 8.2 percent of men reported experiencing at least one symptom of reproductive health problem in the last three months preceding the survey. The prevalence of reproductive health problems is higher among rural men (8.8 percent) than among urban men (6.7 percent). The problems of reproductive health experienced by men are ‘difficulty / pain while urinating or very frequent urination (4.4 percent), ‘discharge from penis’ (2.9 percent), ‘itching / irritation around genitals’ (2 percent), ‘sore / rash / redness on genitals or anal area’ (1.1 percent) and ‘swelling of testes or in groin area’ (0.6 percent).
Table 8.6 SYMPTOMS OF RTI/STI AMONG MEN
Percentage of husbands of currently married women who reported any symptoms RTI/STI and specific symptoms during three months prior to survey and sought treatment for RTI/STI by source of treatment, according to residence, Uttaranchal, 2002-04
Symptoms and treatment Total
Residence
Rural Urban
Percentage of men reported any RTI/STI symptoms Symptoms Any discharge from penis Any sore / rash / redness on genitals or anal area Difficulty / pain while urinating or very frequent urination Swelling of testis or in groin area Itching / irritation around genital Number of men Percentage of men sought treatment for any RTI/STI1 Percentage sought treatment at health facility2 Government health facility3 Primary health centre Sub centre Private health facility4 ISM5 facility Chemist/ medical shop Other Percentage obtained treatment from2
Doctor Traditional healer Relative/friends ISM practitioner Home remedy Chemist medical shop Other Number of men
8.2
2.9 1.1 4.4 0.6 2.0
5,417
40.2
26.8 1.0 8.9
50.3
8.2
8.6 8.1
82.8 2.3 2.6 1.7 5.1 6.3 2.3
179
8.8
3.3 1.2 4.8 0.6 2.2
3,928
37.2
25.2 1.4 4.1
56.5
3.5
9.4 5.2
79.9 3.2 0.3 1.4 7.2 7.7 1.3
129
6.7
1.7 0.8 3.2 0.6 1.5
1,489
50.8
30.9 0.0
21.1
34.4
20.3
6.7 15.6
90.1 0.0 8.5 2.3 0.0 2.7 4.9
51
Note: 1 Based on men with any symptoms of RTI/STI. 2 Percentage may add to more than 100.0 due to multiple responses. 3 Includes Government municipal hospital, dispensary, UHC/ UHP /UWFC, CHC/ rural hospital, Primary health centre, sub-centre. 4 Includes private hospital/ clinic, non-governmental / trust hospital/clinic. 5 Either government or private hospital/clinic of Indian system of medicine.
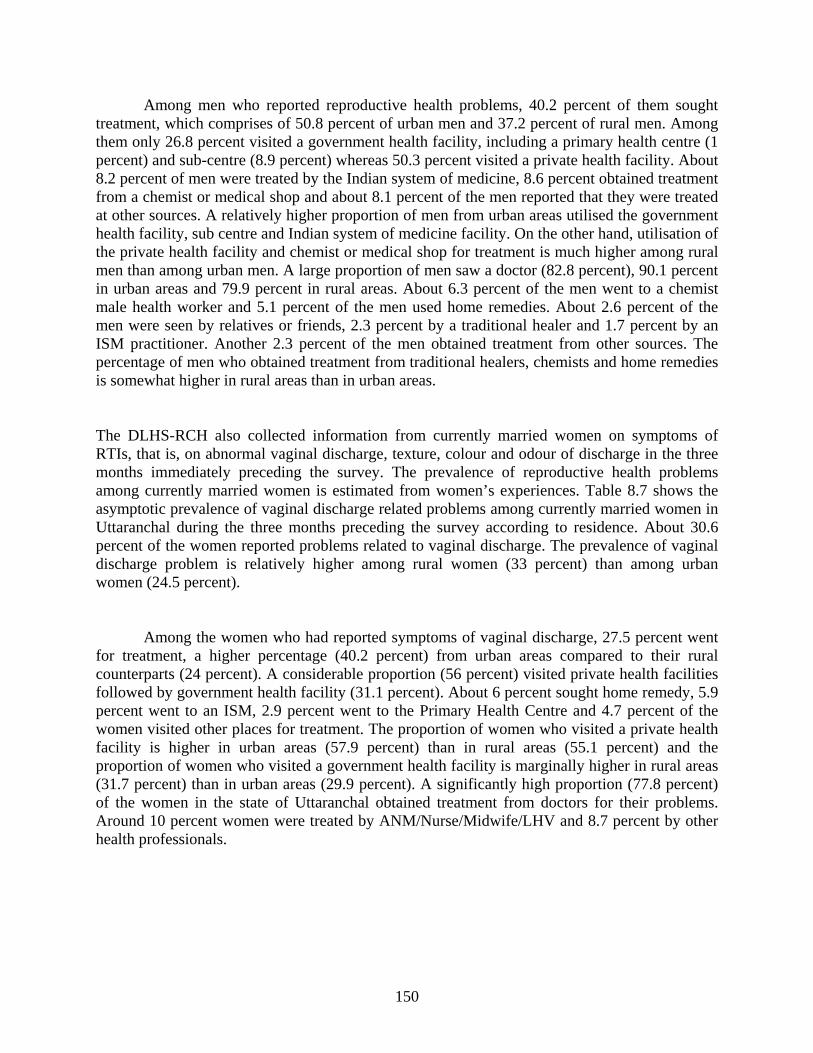
150
Among men who reported reproductive health problems, 40.2 percent of them sought treatment, which comprises of 50.8 percent of urban men and 37.2 percent of rural men. Among them only 26.8 percent visited a government health facility, including a primary health centre (1 percent) and sub-centre (8.9 percent) whereas 50.3 percent visited a private health facility. About 8.2 percent of men were treated by the Indian system of medicine, 8.6 percent obtained treatment from a chemist or medical shop and about 8.1 percent of the men reported that they were treated at other sources. A relatively higher proportion of men from urban areas utilised the government health facility, sub centre and Indian system of medicine facility. On the other hand, utilisation of the private health facility and chemist or medical shop for treatment is much higher among rural men than among urban men. A large proportion of men saw a doctor (82.8 percent), 90.1 percent in urban areas and 79.9 percent in rural areas. About 6.3 percent of the men went to a chemist male health worker and 5.1 percent of the men used home remedies. About 2.6 percent of the men were seen by relatives or friends, 2.3 percent by a traditional healer and 1.7 percent by an ISM practitioner. Another 2.3 percent of the men obtained treatment from other sources. The percentage of men who obtained treatment from traditional healers, chemists and home remedies is somewhat higher in rural areas than in urban areas. The DLHS-RCH also collected information from currently married women on symptoms of RTIs, that is, on abnormal vaginal discharge, texture, colour and odour of discharge in the three months immediately preceding the survey. The prevalence of reproductive health problems among currently married women is estimated from women’s experiences. Table 8.7 shows the asymptotic prevalence of vaginal discharge related problems among currently married women in Uttaranchal during the three months preceding the survey according to residence. About 30.6 percent of the women reported problems related to vaginal discharge. The prevalence of vaginal discharge problem is relatively higher among rural women (33 percent) than among urban women (24.5 percent).
Among the women who had reported symptoms of vaginal discharge, 27.5 percent went for treatment, a higher percentage (40.2 percent) from urban areas compared to their rural counterparts (24 percent). A considerable proportion (56 percent) visited private health facilities followed by government health facility (31.1 percent). About 6 percent sought home remedy, 5.9 percent went to an ISM, 2.9 percent went to the Primary Health Centre and 4.7 percent of the women visited other places for treatment. The proportion of women who visited a private health facility is higher in urban areas (57.9 percent) than in rural areas (55.1 percent) and the proportion of women who visited a government health facility is marginally higher in rural areas (31.7 percent) than in urban areas (29.9 percent). A significantly high proportion (77.8 percent) of the women in the state of Uttaranchal obtained treatment from doctors for their problems. Around 10 percent women were treated by ANM/Nurse/Midwife/LHV and 8.7 percent by other health professionals.
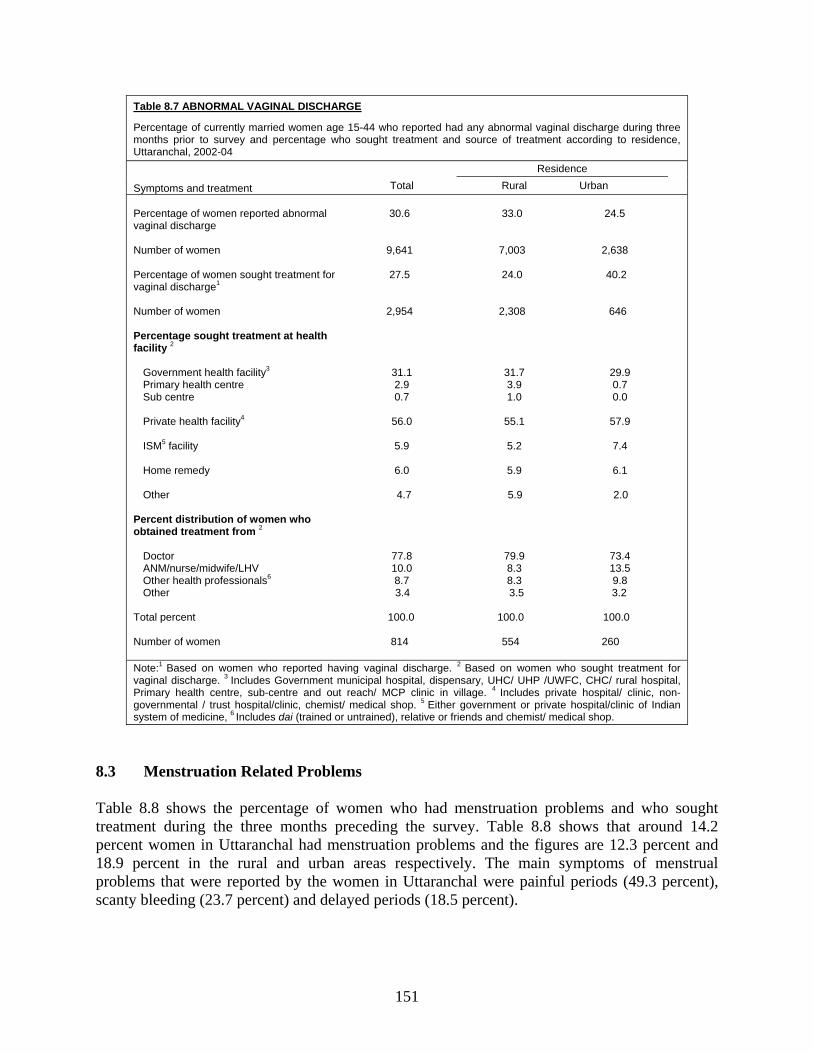
151
Table 8.7 ABNORMAL VAGINAL DISCHARGE
Percentage of currently married women age 15-44 who reported had any abnormal vaginal discharge during three months prior to survey and percentage who sought treatment and source of treatment according to residence, Uttaranchal, 2002-04
Symptoms and treatment Total Residence
Rural Urban Percentage of women reported abnormal vaginal discharge Number of women Percentage of women sought treatment for vaginal discharge1 Number of women Percentage sought treatment at health facility 2 Government health facility3 Primary health centre Sub centre Private health facility4 ISM5 facility Home remedy Other Percent distribution of women who obtained treatment from 2
Doctor ANM/nurse/midwife/LHV Other health professionals6 Other Total percent Number of women
30.6
9,641
27.5
2,954
31.1 2.9 0.7
56.0
5.9
6.0
4.7
77.8 10.0 8.7
3.4
100.0
814
33.0
7,003
24.0
2,308
31.7 3.9 1.0
55.1
5.2
5.9
5.9
79.9 8.3 8.3
3.5
100.0
554
24.5
2,638
40.2
646
29.9 0.7 0.0
57.9
7.4
6.1
2.0
73.4 13.5 9.8
3.2
100.0
260
Note:1 Based on women who reported having vaginal discharge. 2 Based on women who sought treatment for vaginal discharge. 3 Includes Government municipal hospital, dispensary, UHC/ UHP /UWFC, CHC/ rural hospital, Primary health centre, sub-centre and out reach/ MCP clinic in village. 4 Includes private hospital/ clinic, non-governmental / trust hospital/clinic, chemist/ medical shop. 5 Either government or private hospital/clinic of Indian system of medicine, 6 Includes dai (trained or untrained), relative or friends and chemist/ medical shop.
8.3 Menstruation Related Problems Table 8.8 shows the percentage of women who had menstruation problems and who sought treatment during the three months preceding the survey. Table 8.8 shows that around 14.2 percent women in Uttaranchal had menstruation problems and the figures are 12.3 percent and 18.9 percent in the rural and urban areas respectively. The main symptoms of menstrual problems that were reported by the women in Uttaranchal were painful periods (49.3 percent), scanty bleeding (23.7 percent) and delayed periods (18.5 percent).
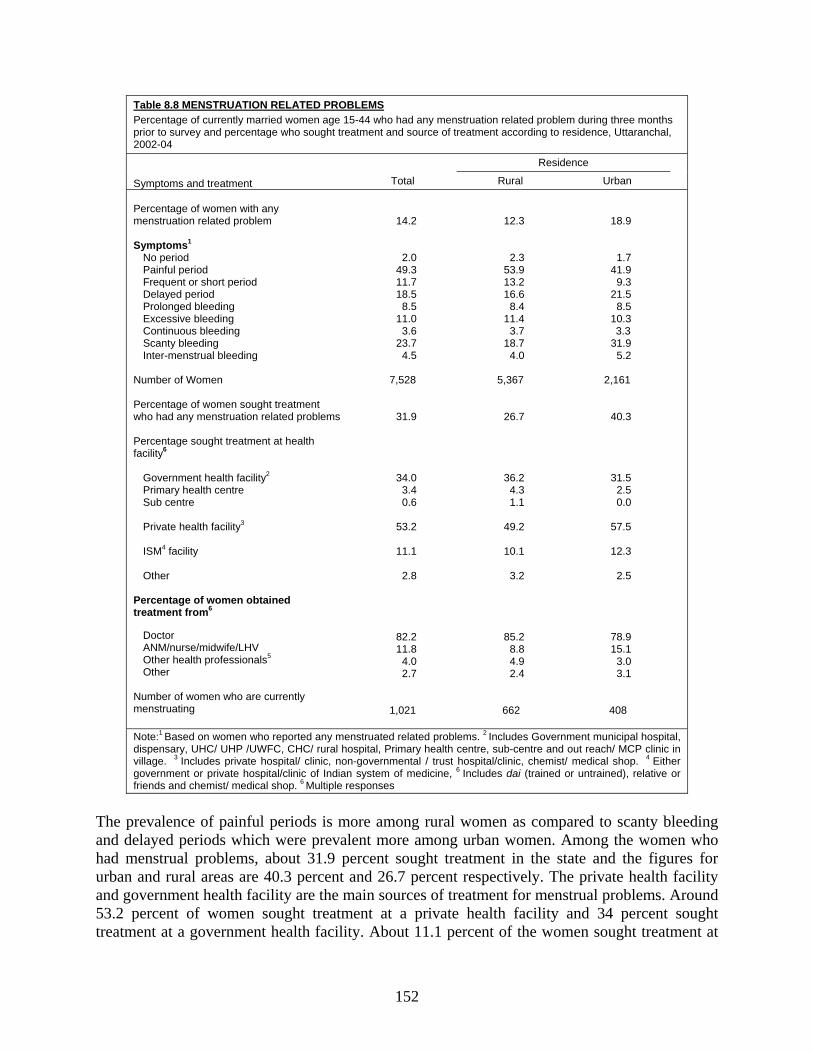
152
Table 8.8 MENSTRUATION RELATED PROBLEMS Percentage of currently married women age 15-44 who had any menstruation related problem during three months prior to survey and percentage who sought treatment and source of treatment according to residence, Uttaranchal, 2002-04
Symptoms and treatment Total
Residence
Rural Urban Percentage of women with any menstruation related problem Symptoms1 No period Painful period Frequent or short period Delayed period Prolonged bleeding Excessive bleeding Continuous bleeding Scanty bleeding Inter-menstrual bleeding Number of Women Percentage of women sought treatment who had any menstruation related problems Percentage sought treatment at health facility6 Government health facility2 Primary health centre Sub centre Private health facility3
ISM4 facility Other Percentage of women obtained treatment from6
Doctor ANM/nurse/midwife/LHV Other health professionals5 Other Number of women who are currently menstruating
14.2
2.0 49.3 11.7 18.5
8.5 11.0
3.6 23.7
4.5
7,528
31.9
34.0 3.4 0.6
53.2
11.1
2.8
82.2 11.8
4.0 2.7
1,021
12.3
2.3 53.9 13.2 16.6
8.4 11.4
3.7 18.7
4.0
5,367
26.7
36.2 4.3 1.1
49.2
10.1
3.2
85.2 8.8 4.9 2.4
662
18.9
1.7 41.9
9.3 21.5
8.5 10.3
3.3 31.9
5.2
2,161
40.3
31.5 2.5 0.0
57.5
12.3
2.5
78.9 15.1
3.0 3.1
408
Note:1 Based on women who reported any menstruated related problems. 2 Includes Government municipal hospital, dispensary, UHC/ UHP /UWFC, CHC/ rural hospital, Primary health centre, sub-centre and out reach/ MCP clinic in village. 3 Includes private hospital/ clinic, non-governmental / trust hospital/clinic, chemist/ medical shop. 4 Either government or private hospital/clinic of Indian system of medicine, 6 Includes dai (trained or untrained), relative or friends and chemist/ medical shop. 6 Multiple responses
The prevalence of painful periods is more among rural women as compared to scanty bleeding and delayed periods which were prevalent more among urban women. Among the women who had menstrual problems, about 31.9 percent sought treatment in the state and the figures for urban and rural areas are 40.3 percent and 26.7 percent respectively. The private health facility and government health facility are the main sources of treatment for menstrual problems. Around 53.2 percent of women sought treatment at a private health facility and 34 percent sought treatment at a government health facility. About 11.1 percent of the women sought treatment at
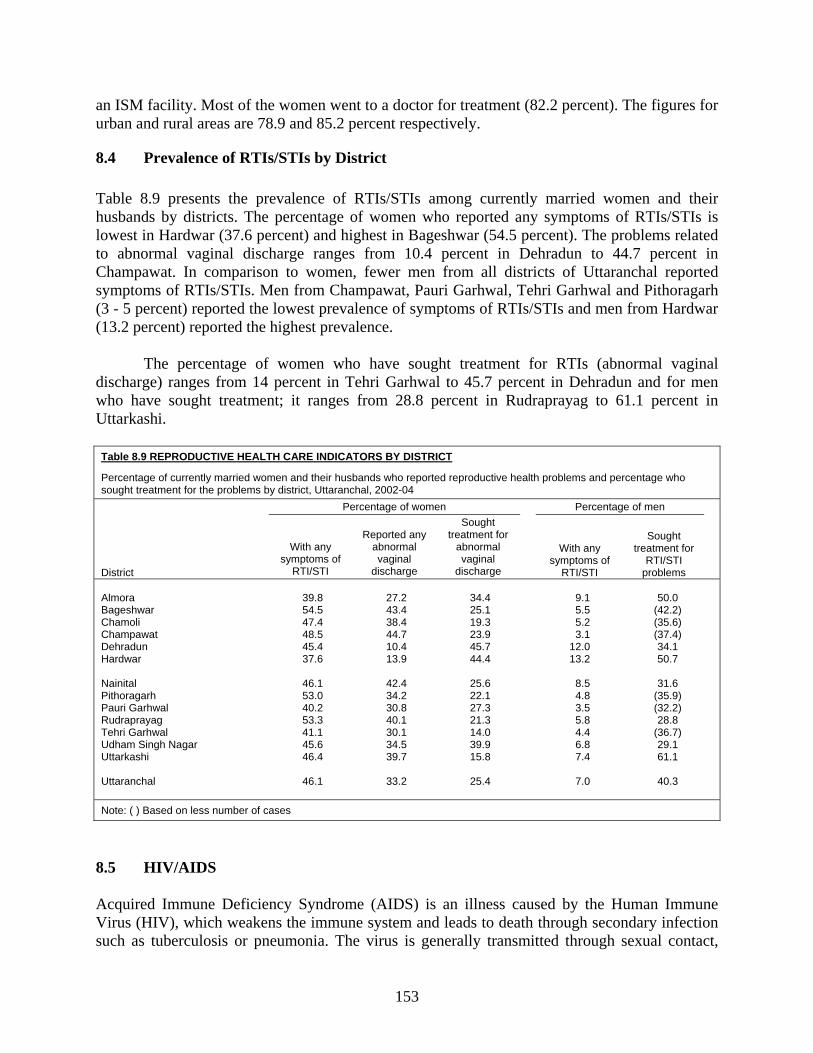
153
an ISM facility. Most of the women went to a doctor for treatment (82.2 percent). The figures for urban and rural areas are 78.9 and 85.2 percent respectively.
8.4 Prevalence of RTIs/STIs by District Table 8.9 presents the prevalence of RTIs/STIs among currently married women and their husbands by districts. The percentage of women who reported any symptoms of RTIs/STIs is lowest in Hardwar (37.6 percent) and highest in Bageshwar (54.5 percent). The problems related to abnormal vaginal discharge ranges from 10.4 percent in Dehradun to 44.7 percent in Champawat. In comparison to women, fewer men from all districts of Uttaranchal reported symptoms of RTIs/STIs. Men from Champawat, Pauri Garhwal, Tehri Garhwal and Pithoragarh (3 - 5 percent) reported the lowest prevalence of symptoms of RTIs/STIs and men from Hardwar (13.2 percent) reported the highest prevalence. The percentage of women who have sought treatment for RTIs (abnormal vaginal discharge) ranges from 14 percent in Tehri Garhwal to 45.7 percent in Dehradun and for men who have sought treatment; it ranges from 28.8 percent in Rudraprayag to 61.1 percent in Uttarkashi. Table 8.9 REPRODUCTIVE HEALTH CARE INDICATORS BY DISTRICT
Percentage of currently married women and their husbands who reported reproductive health problems and percentage who sought treatment for the problems by district, Uttaranchal, 2002-04
District
Percentage of women Percentage of men
With any symptoms of
RTI/STI
Reported any abnormal vaginal
discharge
Sought treatment for
abnormal vaginal
discharge
With any symptoms of
RTI/STI
Sought treatment for
RTI/STI problems
Almora Bageshwar Chamoli Champawat Dehradun Hardwar Nainital Pithoragarh Pauri Garhwal Rudraprayag Tehri Garhwal Udham Singh Nagar Uttarkashi Uttaranchal
39.8 54.5 47.4 48.5 45.4 37.6
46.1 53.0 40.2 53.3 41.1 45.6 46.4
46.1
27.2 43.4 38.4 44.7 10.4 13.9
42.4 34.2 30.8 40.1 30.1 34.5 39.7
33.2
34.4 25.1 19.3 23.9 45.7 44.4
25.6 22.1 27.3 21.3 14.0 39.9 15.8
25.4
9.1 5.5 5.2 3.1
12.0 13.2
8.5 4.8 3.5 5.8 4.4 6.8 7.4
7.0
50.0
(42.2) (35.6) (37.4) 34.1 50.7
31.6
(35.9) (32.2) 28.8
(36.7) 29.1 61.1
40.3
Note: ( ) Based on less number of cases
8.5 HIV/AIDS Acquired Immune Deficiency Syndrome (AIDS) is an illness caused by the Human Immune Virus (HIV), which weakens the immune system and leads to death through secondary infection such as tuberculosis or pneumonia. The virus is generally transmitted through sexual contact,
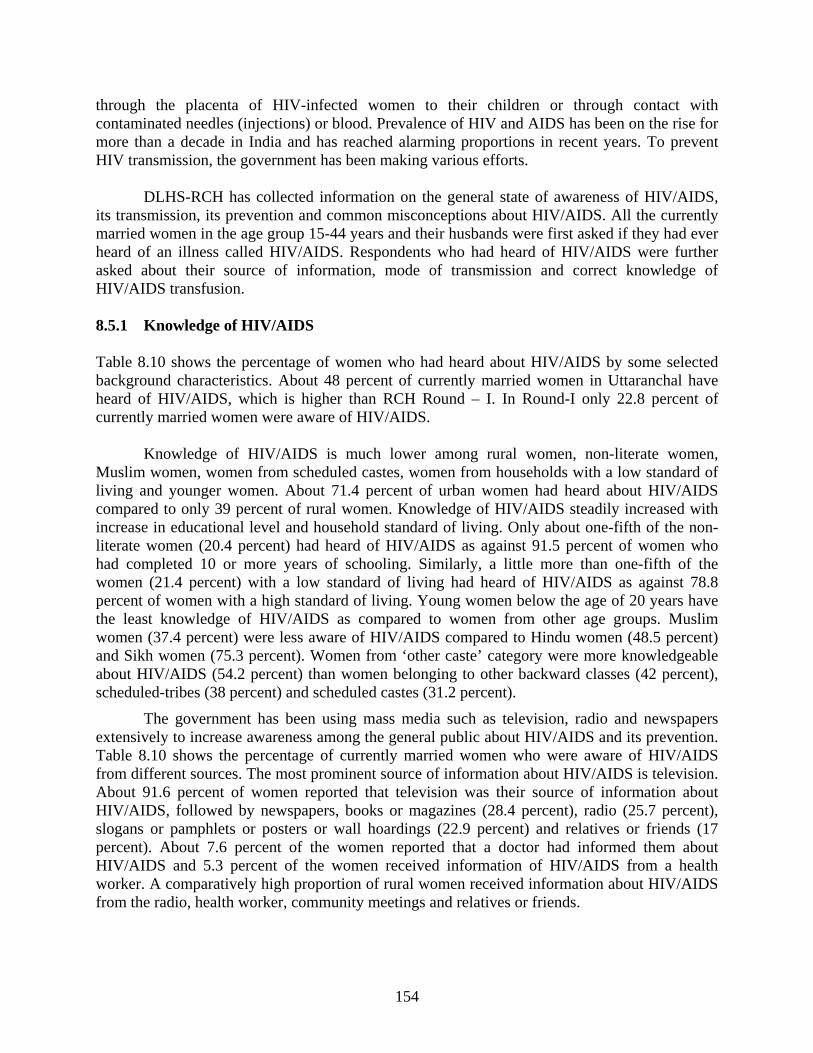
154
through the placenta of HIV-infected women to their children or through contact with contaminated needles (injections) or blood. Prevalence of HIV and AIDS has been on the rise for more than a decade in India and has reached alarming proportions in recent years. To prevent HIV transmission, the government has been making various efforts. DLHS-RCH has collected information on the general state of awareness of HIV/AIDS, its transmission, its prevention and common misconceptions about HIV/AIDS. All the currently married women in the age group 15-44 years and their husbands were first asked if they had ever heard of an illness called HIV/AIDS. Respondents who had heard of HIV/AIDS were further asked about their source of information, mode of transmission and correct knowledge of HIV/AIDS transfusion. 8.5.1 Knowledge of HIV/AIDS Table 8.10 shows the percentage of women who had heard about HIV/AIDS by some selected background characteristics. About 48 percent of currently married women in Uttaranchal have heard of HIV/AIDS, which is higher than RCH Round – I. In Round-I only 22.8 percent of currently married women were aware of HIV/AIDS. Knowledge of HIV/AIDS is much lower among rural women, non-literate women, Muslim women, women from scheduled castes, women from households with a low standard of living and younger women. About 71.4 percent of urban women had heard about HIV/AIDS compared to only 39 percent of rural women. Knowledge of HIV/AIDS steadily increased with increase in educational level and household standard of living. Only about one-fifth of the non-literate women (20.4 percent) had heard of HIV/AIDS as against 91.5 percent of women who had completed 10 or more years of schooling. Similarly, a little more than one-fifth of the women (21.4 percent) with a low standard of living had heard of HIV/AIDS as against 78.8 percent of women with a high standard of living. Young women below the age of 20 years have the least knowledge of HIV/AIDS as compared to women from other age groups. Muslim women (37.4 percent) were less aware of HIV/AIDS compared to Hindu women (48.5 percent) and Sikh women (75.3 percent). Women from ‘other caste’ category were more knowledgeable about HIV/AIDS (54.2 percent) than women belonging to other backward classes (42 percent), scheduled-tribes (38 percent) and scheduled castes (31.2 percent).
The government has been using mass media such as television, radio and newspapers extensively to increase awareness among the general public about HIV/AIDS and its prevention. Table 8.10 shows the percentage of currently married women who were aware of HIV/AIDS from different sources. The most prominent source of information about HIV/AIDS is television. About 91.6 percent of women reported that television was their source of information about HIV/AIDS, followed by newspapers, books or magazines (28.4 percent), radio (25.7 percent), slogans or pamphlets or posters or wall hoardings (22.9 percent) and relatives or friends (17 percent). About 7.6 percent of the women reported that a doctor had informed them about HIV/AIDS and 5.3 percent of the women received information of HIV/AIDS from a health worker. A comparatively high proportion of rural women received information about HIV/AIDS from the radio, health worker, community meetings and relatives or friends.
155
Table 8.10 SOURCE OF KNOWLEDGE ABOUT HIV/AIDS AMONG WOMEN
Percentage of currently married women age 15 - 44 who have heard about HIV/AIDS and among women who have heard about HIV/AIDS, percentage who received information from specific sources by selected background characteristics, Uttaranchal, 2002-04.
Background characteristic
Percentage who have
heard about HIV/AIDS
Number of
Women
Among those who have heard about HIV/AIDS, percentage who received information from. Number
of women who have
heard about
HIV/AIDS Radio Televi-
sion
Newspaper/ Books/
Magazines
Slogan/ Pamphlets/
Posters/ Wall
Hoardings Doctor Health worker
School teacher
Community
Meeting Relative/ Friends Others
Age group (years) 15-19 20-24 25-29 30-34 35-39 40-44 Residence Rural Urban Education Non-literate 0-9@ years 10 and above Religion Hindu Muslim Sikh Other Caste/tribe# Scheduled caste Scheduled tribe Other backward class Other Standard of living index Low Medium High
Total
37.1 51.7 53.4 46.6 43.5 43.1
39.0 71.4
20.4 50.9 91.5
48.5 37.4 75.3
(74.4)
31.2 38.0 42.0 54.2
21.4 47.6 78.8
48.0
383 2,042 2,235 1,955 1,688 1,338
7,003 2,638
4,229 2,955 2,453
8,371 1,069
160 42
1,267
301 2,097 5,719
3,485 3,153 3,003
9,641
26.5 30.0 24.5 25.6 25.0 21.0
30.4 18.8
13.7 23.5 31.8
26.9 14.8 15.5
(40.6)
17.1 24.1 16.8 29.8
31.7 26.8 23.1
25.7
87.9 91.1 90.7 91.9 89.5 97.0
86.9 98.4
87.2 88.4 95.4
91.2 93.6 94.0
(96.9)
90.4 90.8 93.8 90.9
72.4 90.7 98.1
91.6
15.8 23.9 30.8 30.2 27.6 33.2
23.1 36.1
1.5
13.3 48.9
29.1 14.4 41.3
(53.1)
12.9 23.6 16.6 33.8
12.6 16.8 40.7
28.4
20.2 22.5 23.5 22.5 22.9 23.5
19.2 28.1
1.9
13.5 37.2
23.7 12.2 26.2
(40.6)
11.2 13.1 16.5 26.7
13.5 17.2 29.4
22.9
1.7 6.4 9.4 7.0 9.5 6.2
7.1 8.4
4.3 5.0
10.6
7.8 4.7
12.1 (6.3)
3.9 9.2 5.2 8.9
4.4 5.1
10.3
7.6
2.1 3.6 6.6 4.5 7.9 4.6
6.2 4.2
5.3 3.7 6.5
5.5 3.3 7.3
(3.1)
4.5 0.4 5.0 5.9
8.1 4.4 5.1
5.3
1.6 1.0 1.4 0.4 1.8 1.6
0.8 1.8
0.1 0.7 2.0
1.3 0.2 1.1
(3.1)
0.8 0.4 0.6 1.5
1.4 0.6 1.6
1.2
2.5 4.2 5.2 2.8 4.8 3.9
5.5 2.2
4.0 4.9 3.7
4.3 0.5 9.0
(15.6)
4.5 7.6 1.4 4.8
6.3 5.6 2.6
4.2
18.2 18.1 16.4 15.2 20.2 14.6
18.1 15.3
15.6 18.6 16.4
17.4 14.4 10.8
(28.1)
17.5 18.8 17.4 17.2
22.6 19.3 13.7
17.0
1.2 1.0 0.7 0.6 0.7 0.6
0.9 0.4
0.5 1.0 0.7
0.8 0.2 1.1
(0.0)
0.1 0.0 1.0 0.8
0.8 0.9 0.6
0.7
142 1,057 1,193
911 734 577
2,730 1,883
862
1,504 2,245
4,061
400 121
32
395 115 881
3,097
746 1,501 2,367
4,614
Note: Total includes 3 cases of missing information on education are not shown separately. @ Literate women with no year of schooling are also included. # Total figure may not add to N due to do not know and missing cases. ( ) Based on less than 50 unweighted cases.
155
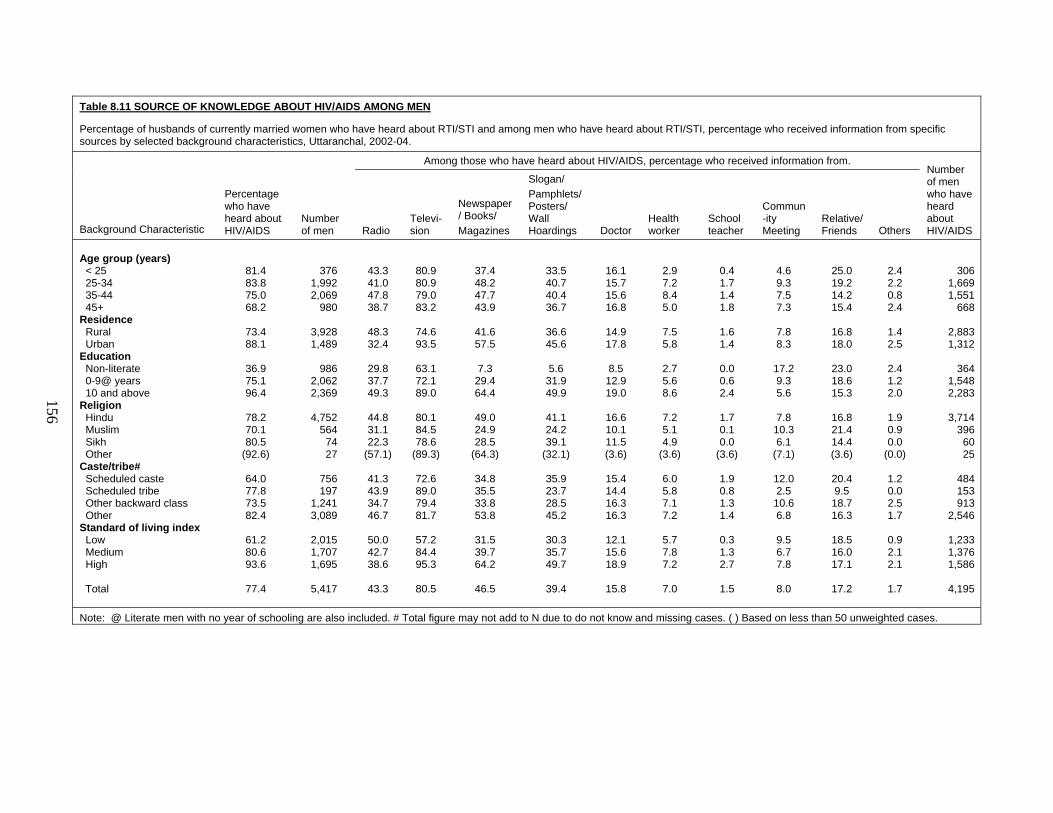
156
Table 8.11 SOURCE OF KNOWLEDGE ABOUT HIV/AIDS AMONG MEN
Percentage of husbands of currently married women who have heard about RTI/STI and among men who have heard about RTI/STI, percentage who received information from specific sources by selected background characteristics, Uttaranchal, 2002-04.
Background Characteristic
Percentage who have heard about HIV/AIDS
Number of men
Among those who have heard about HIV/AIDS, percentage who received information from. Number of men who have heard about HIV/AIDS Radio
Televi-sion
Newspaper/ Books/ Magazines
Slogan/ Pamphlets/ Posters/ Wall Hoardings Doctor
Health worker
School teacher
Commun-ity Meeting
Relative/ Friends Others
Age group (years) < 25 25-34 35-44 45+ Residence Rural Urban Education Non-literate 0-9@ years 10 and above Religion Hindu Muslim Sikh Other Caste/tribe# Scheduled caste Scheduled tribe Other backward class Other Standard of living index Low Medium
High Total
81.4 83.8 75.0 68.2
73.4 88.1
36.9 75.1 96.4
78.2 70.1 80.5
(92.6)
64.0 77.8 73.5 82.4
61.2 80.6 93.6
77.4
376 1,992 2,069
980
3,928 1,489
986
2,062 2,369
4,752
564 74 27
756 197
1,241 3,089
2,015 1,707 1,695
5,417
43.3 41.0 47.8 38.7
48.3 32.4
29.8 37.7 49.3
44.8 31.1 22.3
(57.1)
41.3 43.9 34.7 46.7
50.0 42.7 38.6
43.3
80.9 80.9 79.0 83.2
74.6 93.5
63.1 72.1 89.0
80.1 84.5 78.6
(89.3)
72.6 89.0 79.4 81.7
57.2 84.4 95.3
80.5
37.4 48.2 47.7 43.9
41.6 57.5
7.3
29.4 64.4
49.0 24.9 28.5
(64.3)
34.8 35.5 33.8 53.8
31.5 39.7 64.2
46.5
33.5 40.7 40.4 36.7
36.6 45.6
5.6
31.9 49.9
41.1 24.2 39.1
(32.1)
35.9 23.7 28.5 45.2
30.3 35.7 49.7
39.4
16.1 15.7 15.6 16.8
14.9 17.8
8.5
12.9 19.0
16.6 10.1 11.5 (3.6)
15.4 14.4 16.3 16.3
12.1 15.6 18.9
15.8
2.9 7.2 8.4 5.0
7.5 5.8
2.7 5.6 8.6
7.2 5.1 4.9
(3.6)
6.0 5.8 7.1 7.2
5.7 7.8 7.2
7.0
0.4 1.7 1.4 1.8
1.6 1.4
0.0 0.6 2.4
1.7 0.1 0.0
(3.6)
1.9 0.8 1.3 1.4
0.3 1.3 2.7
1.5
4.6 9.3 7.5 7.3
7.8 8.3
17.2 9.3 5.6
7.8
10.3 6.1
(7.1)
12.0 2.5
10.6 6.8
9.5 6.7 7.8
8.0
25.0 19.2 14.2 15.4
16.8 18.0
23.0 18.6 15.3
16.8 21.4 14.4 (3.6)
20.4 9.5
18.7 16.3
18.5 16.0 17.1
17.2
2.4 2.2 0.8 2.4
1.4 2.5
2.4 1.2 2.0
1.9 0.9 0.0
(0.0)
1.2 0.0 2.5 1.7
0.9 2.1 2.1
1.7
306 1,669 1,551
668
2,883 1,312
364
1,548 2,283
3,714
396 60 25
484 153 913
2,546
1,233 1,376 1,586
4,195
Note: @ Literate men with no year of schooling are also included. # Total figure may not add to N due to do not know and missing cases. ( ) Based on less than 50 unweighted cases.
156
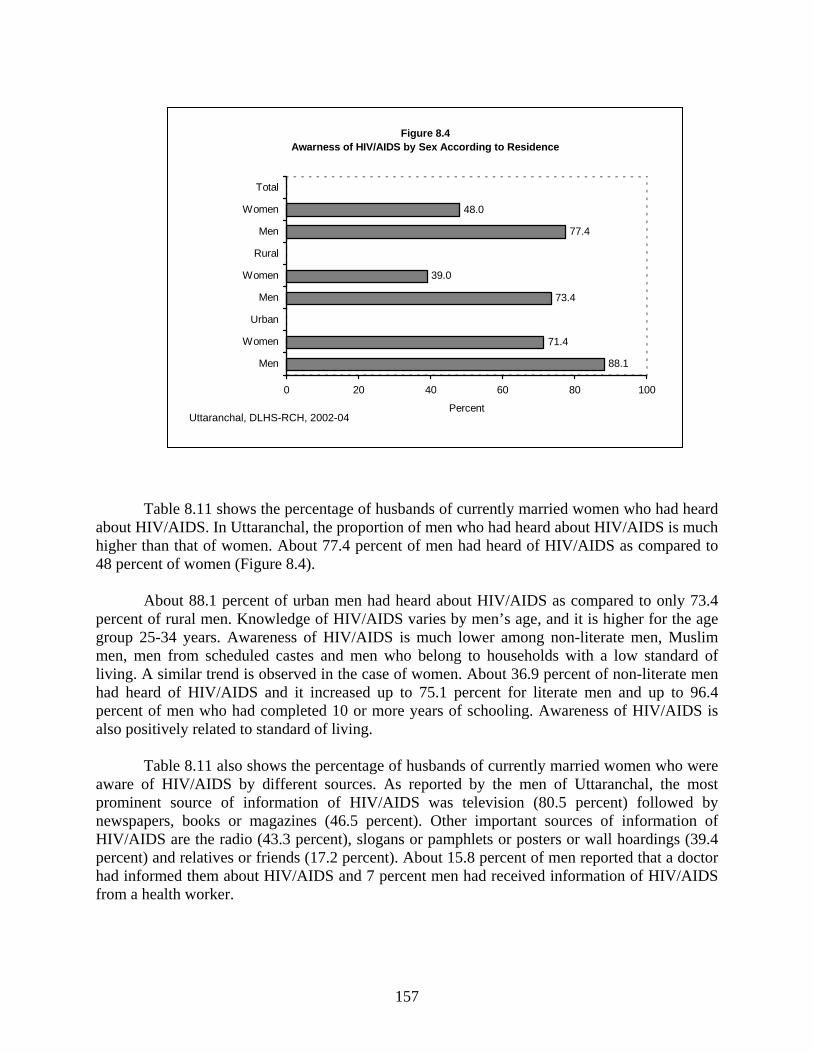
157
Table 8.11 shows the percentage of husbands of currently married women who had heard about HIV/AIDS. In Uttaranchal, the proportion of men who had heard about HIV/AIDS is much higher than that of women. About 77.4 percent of men had heard of HIV/AIDS as compared to 48 percent of women (Figure 8.4).
About 88.1 percent of urban men had heard about HIV/AIDS as compared to only 73.4
percent of rural men. Knowledge of HIV/AIDS varies by men’s age, and it is higher for the age group 25-34 years. Awareness of HIV/AIDS is much lower among non-literate men, Muslim men, men from scheduled castes and men who belong to households with a low standard of living. A similar trend is observed in the case of women. About 36.9 percent of non-literate men had heard of HIV/AIDS and it increased up to 75.1 percent for literate men and up to 96.4 percent of men who had completed 10 or more years of schooling. Awareness of HIV/AIDS is also positively related to standard of living.
Table 8.11 also shows the percentage of husbands of currently married women who were aware of HIV/AIDS by different sources. As reported by the men of Uttaranchal, the most prominent source of information of HIV/AIDS was television (80.5 percent) followed by newspapers, books or magazines (46.5 percent). Other important sources of information of HIV/AIDS are the radio (43.3 percent), slogans or pamphlets or posters or wall hoardings (39.4 percent) and relatives or friends (17.2 percent). About 15.8 percent of men reported that a doctor had informed them about HIV/AIDS and 7 percent men had received information of HIV/AIDS from a health worker.
Figure 8.4 Awarness of HIV/AIDS by Sex According to Residence
88.1
71.4
73.4
39.0
77.4
48.0
0 20 40 60 80 100
Men
Women
Urban
Men
Women
Rural
Men
Women
Total
PercentUttaranchal, DLHS-RCH, 2002-04
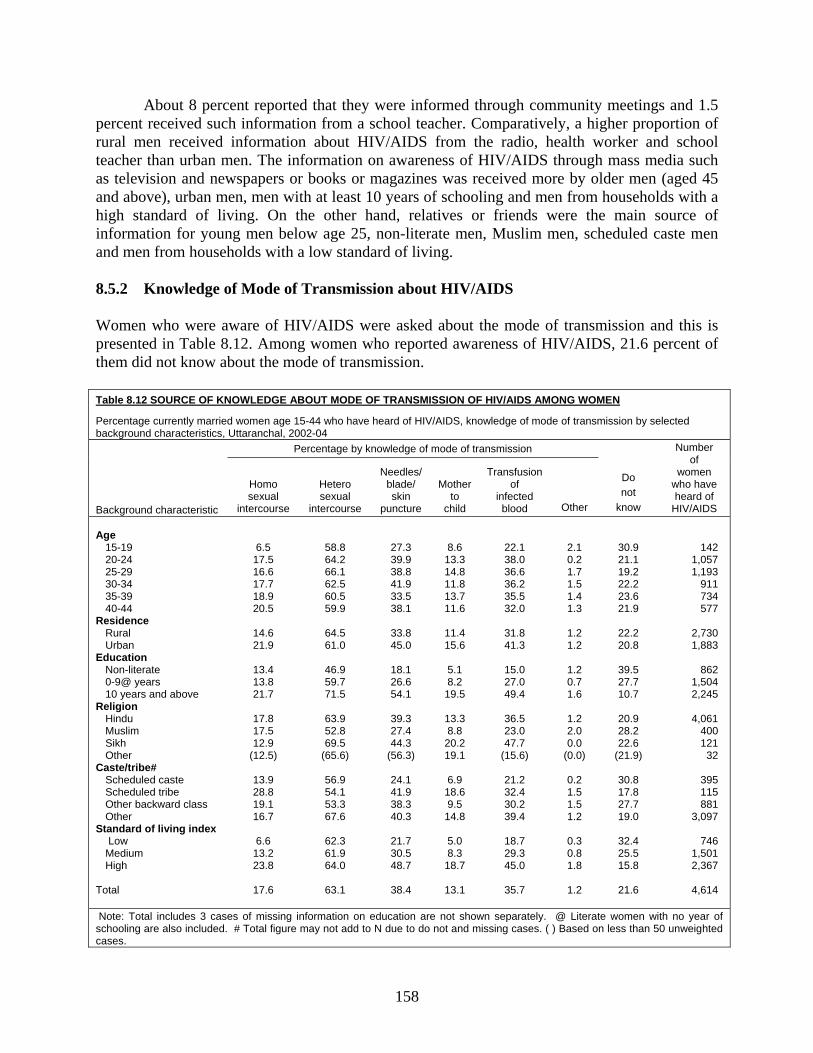
158
About 8 percent reported that they were informed through community meetings and 1.5 percent received such information from a school teacher. Comparatively, a higher proportion of rural men received information about HIV/AIDS from the radio, health worker and school teacher than urban men. The information on awareness of HIV/AIDS through mass media such as television and newspapers or books or magazines was received more by older men (aged 45 and above), urban men, men with at least 10 years of schooling and men from households with a high standard of living. On the other hand, relatives or friends were the main source of information for young men below age 25, non-literate men, Muslim men, scheduled caste men and men from households with a low standard of living.
8.5.2 Knowledge of Mode of Transmission about HIV/AIDS
Women who were aware of HIV/AIDS were asked about the mode of transmission and this is presented in Table 8.12. Among women who reported awareness of HIV/AIDS, 21.6 percent of them did not know about the mode of transmission.
Table 8.12 SOURCE OF KNOWLEDGE ABOUT MODE OF TRANSMISSION OF HIV/AIDS AMONG WOMEN
Percentage currently married women age 15-44 who have heard of HIV/AIDS, knowledge of mode of transmission by selected background characteristics, Uttaranchal, 2002-04
Background characteristic
Percentage by knowledge of mode of transmission
Do not
know
Number of
women who have heard of
HIV/AIDS
Homo sexual
intercourse
Hetero sexual
intercourse
Needles/ blade/ skin
puncture
Mother to
child
Transfusion of
infected blood Other
Age 15-19 20-24 25-29 30-34 35-39 40-44 Residence Rural Urban Education Non-literate 0-9@ years 10 years and above Religion Hindu Muslim Sikh Other Caste/tribe# Scheduled caste Scheduled tribe Other backward class Other Standard of living index Low Medium High Total
6.5 17.5 16.6 17.7 18.9 20.5
14.6 21.9
13.4 13.8 21.7
17.8 17.5 12.9
(12.5)
13.9 28.8 19.1 16.7
6.6
13.2 23.8
17.6
58.8 64.2 66.1 62.5 60.5 59.9
64.5 61.0
46.9 59.7 71.5
63.9 52.8 69.5
(65.6)
56.9 54.1 53.3 67.6
62.3 61.9 64.0
63.1
27.3 39.9 38.8 41.9 33.5 38.1
33.8 45.0
18.1 26.6 54.1
39.3 27.4 44.3
(56.3)
24.1 41.9 38.3 40.3
21.7 30.5 48.7
38.4
8.6 13.3 14.8 11.8 13.7 11.6
11.4 15.6
5.1 8.2
19.5
13.3 8.8
20.2 19.1
6.9
18.6 9.5
14.8
5.0 8.3
18.7
13.1
22.1 38.0 36.6 36.2 35.5 32.0
31.8 41.3
15.0 27.0 49.4
36.5 23.0 47.7
(15.6)
21.2 32.4 30.2 39.4
18.7 29.3 45.0
35.7
2.1 0.2 1.7 1.5 1.4 1.3
1.2 1.2
1.2 0.7 1.6
1.2 2.0 0.0
(0.0)
0.2 1.5 1.5 1.2
0.3 0.8 1.8
1.2
30.9 21.1 19.2 22.2 23.6 21.9
22.2 20.8
39.5 27.7 10.7
20.9 28.2 22.6
(21.9)
30.8 17.8 27.7 19.0
32.4 25.5 15.8
21.6
142 1,057 1,193
911 734 577
2,730 1,883
862
1,504 2,245
4,061
400 121
32
395 115 881
3,097
746 1,501 2,367
4,614
Note: Total includes 3 cases of missing information on education are not shown separately. @ Literate women with no year of schooling are also included. # Total figure may not add to N due to do not and missing cases. ( ) Based on less than 50 unweighted cases.
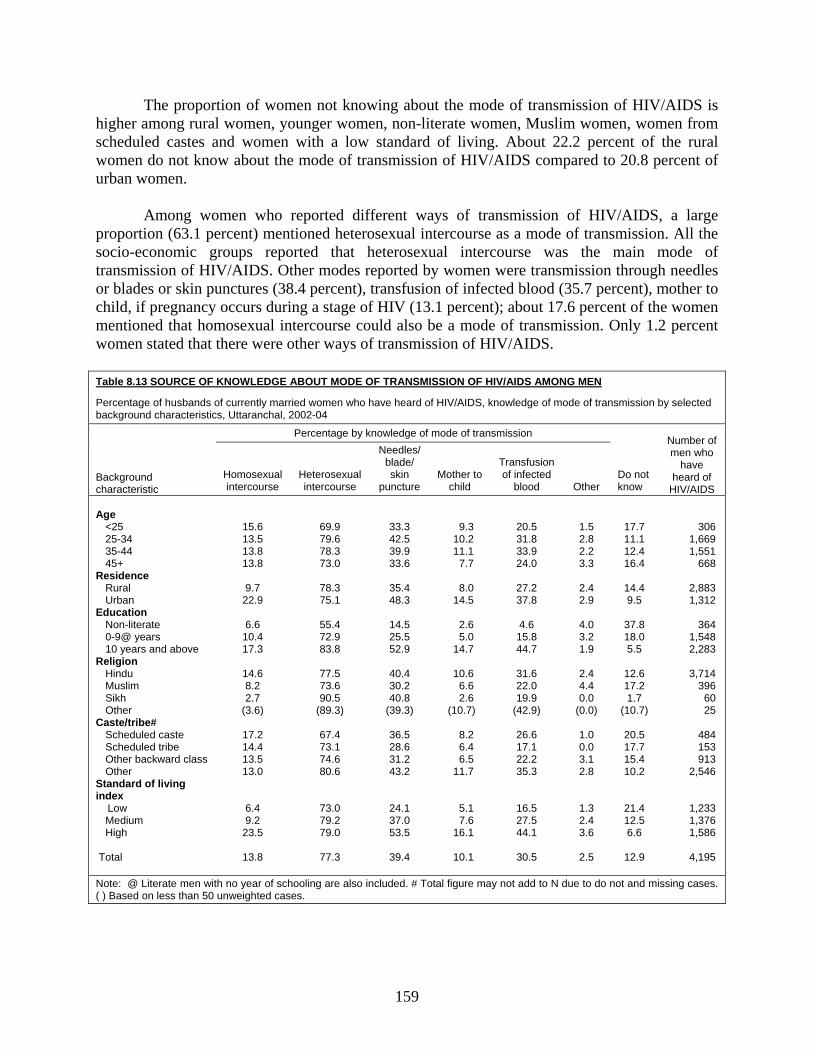
159
The proportion of women not knowing about the mode of transmission of HIV/AIDS is higher among rural women, younger women, non-literate women, Muslim women, women from scheduled castes and women with a low standard of living. About 22.2 percent of the rural women do not know about the mode of transmission of HIV/AIDS compared to 20.8 percent of urban women.
Among women who reported different ways of transmission of HIV/AIDS, a large proportion (63.1 percent) mentioned heterosexual intercourse as a mode of transmission. All the socio-economic groups reported that heterosexual intercourse was the main mode of transmission of HIV/AIDS. Other modes reported by women were transmission through needles or blades or skin punctures (38.4 percent), transfusion of infected blood (35.7 percent), mother to child, if pregnancy occurs during a stage of HIV (13.1 percent); about 17.6 percent of the women mentioned that homosexual intercourse could also be a mode of transmission. Only 1.2 percent women stated that there were other ways of transmission of HIV/AIDS. Table 8.13 SOURCE OF KNOWLEDGE ABOUT MODE OF TRANSMISSION OF HIV/AIDS AMONG MEN
Percentage of husbands of currently married women who have heard of HIV/AIDS, knowledge of mode of transmission by selected background characteristics, Uttaranchal, 2002-04
Background characteristic
Percentage by knowledge of mode of transmission
Do not know
Number of men who
have heard of
HIV/AIDS Homosexual intercourse
Heterosexual intercourse
Needles/ blade/ skin
puncture Mother to
child
Transfusion of infected
blood Other Age <25 25-34 35-44 45+ Residence Rural Urban Education Non-literate 0-9@ years 10 years and above Religion Hindu Muslim Sikh Other Caste/tribe# Scheduled caste Scheduled tribe Other backward class Other Standard of living index Low Medium High Total
15.6 13.5 13.8 13.8
9.7
22.9
6.6 10.4 17.3
14.6 8.2 2.7
(3.6)
17.2 14.4 13.5 13.0
6.4 9.2
23.5
13.8
69.9 79.6 78.3 73.0
78.3 75.1
55.4 72.9 83.8
77.5 73.6 90.5
(89.3)
67.4 73.1 74.6 80.6
73.0 79.2 79.0
77.3
33.3 42.5 39.9 33.6
35.4 48.3
14.5 25.5 52.9
40.4 30.2 40.8
(39.3)
36.5 28.6 31.2 43.2
24.1 37.0 53.5
39.4
9.3 10.2 11.1
7.7
8.0 14.5
2.6 5.0
14.7
10.6 6.6 2.6
(10.7)
8.2 6.4 6.5
11.7
5.1 7.6
16.1
10.1
20.5 31.8 33.9 24.0
27.2 37.8
4.6
15.8 44.7
31.6 22.0 19.9
(42.9)
26.6 17.1 22.2 35.3
16.5 27.5 44.1
30.5
1.5 2.8 2.2 3.3
2.4 2.9
4.0 3.2 1.9
2.4 4.4 0.0
(0.0)
1.0 0.0 3.1 2.8
1.3 2.4 3.6
2.5
17.7 11.1 12.4 16.4
14.4 9.5
37.8 18.0 5.5
12.6 17.2 1.7
(10.7)
20.5 17.7 15.4 10.2
21.4 12.5 6.6
12.9
306 1,669 1,551
668
2,883 1,312
364
1,548 2,283
3,714
396 60 25
484 153 913
2,546
1,233 1,376 1,586
4,195
Note: @ Literate men with no year of schooling are also included. # Total figure may not add to N due to do not and missing cases. ( ) Based on less than 50 unweighted cases.
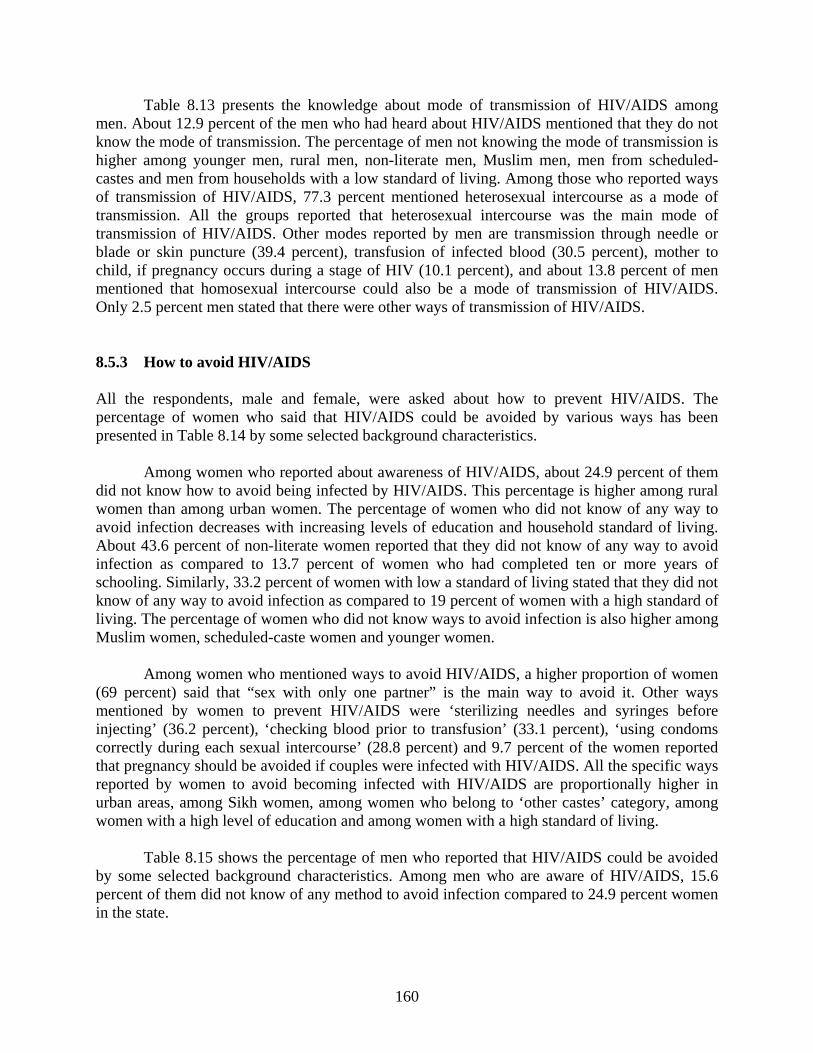
160
Table 8.13 presents the knowledge about mode of transmission of HIV/AIDS among men. About 12.9 percent of the men who had heard about HIV/AIDS mentioned that they do not know the mode of transmission. The percentage of men not knowing the mode of transmission is higher among younger men, rural men, non-literate men, Muslim men, men from scheduled-castes and men from households with a low standard of living. Among those who reported ways of transmission of HIV/AIDS, 77.3 percent mentioned heterosexual intercourse as a mode of transmission. All the groups reported that heterosexual intercourse was the main mode of transmission of HIV/AIDS. Other modes reported by men are transmission through needle or blade or skin puncture (39.4 percent), transfusion of infected blood (30.5 percent), mother to child, if pregnancy occurs during a stage of HIV (10.1 percent), and about 13.8 percent of men mentioned that homosexual intercourse could also be a mode of transmission of HIV/AIDS. Only 2.5 percent men stated that there were other ways of transmission of HIV/AIDS. 8.5.3 How to avoid HIV/AIDS All the respondents, male and female, were asked about how to prevent HIV/AIDS. The percentage of women who said that HIV/AIDS could be avoided by various ways has been presented in Table 8.14 by some selected background characteristics. Among women who reported about awareness of HIV/AIDS, about 24.9 percent of them did not know how to avoid being infected by HIV/AIDS. This percentage is higher among rural women than among urban women. The percentage of women who did not know of any way to avoid infection decreases with increasing levels of education and household standard of living. About 43.6 percent of non-literate women reported that they did not know of any way to avoid infection as compared to 13.7 percent of women who had completed ten or more years of schooling. Similarly, 33.2 percent of women with low a standard of living stated that they did not know of any way to avoid infection as compared to 19 percent of women with a high standard of living. The percentage of women who did not know ways to avoid infection is also higher among Muslim women, scheduled-caste women and younger women. Among women who mentioned ways to avoid HIV/AIDS, a higher proportion of women (69 percent) said that “sex with only one partner” is the main way to avoid it. Other ways mentioned by women to prevent HIV/AIDS were ‘sterilizing needles and syringes before injecting’ (36.2 percent), ‘checking blood prior to transfusion’ (33.1 percent), ‘using condoms correctly during each sexual intercourse’ (28.8 percent) and 9.7 percent of the women reported that pregnancy should be avoided if couples were infected with HIV/AIDS. All the specific ways reported by women to avoid becoming infected with HIV/AIDS are proportionally higher in urban areas, among Sikh women, among women who belong to ‘other castes’ category, among women with a high level of education and among women with a high standard of living.
Table 8.15 shows the percentage of men who reported that HIV/AIDS could be avoided by some selected background characteristics. Among men who are aware of HIV/AIDS, 15.6 percent of them did not know of any method to avoid infection compared to 24.9 percent women in the state.
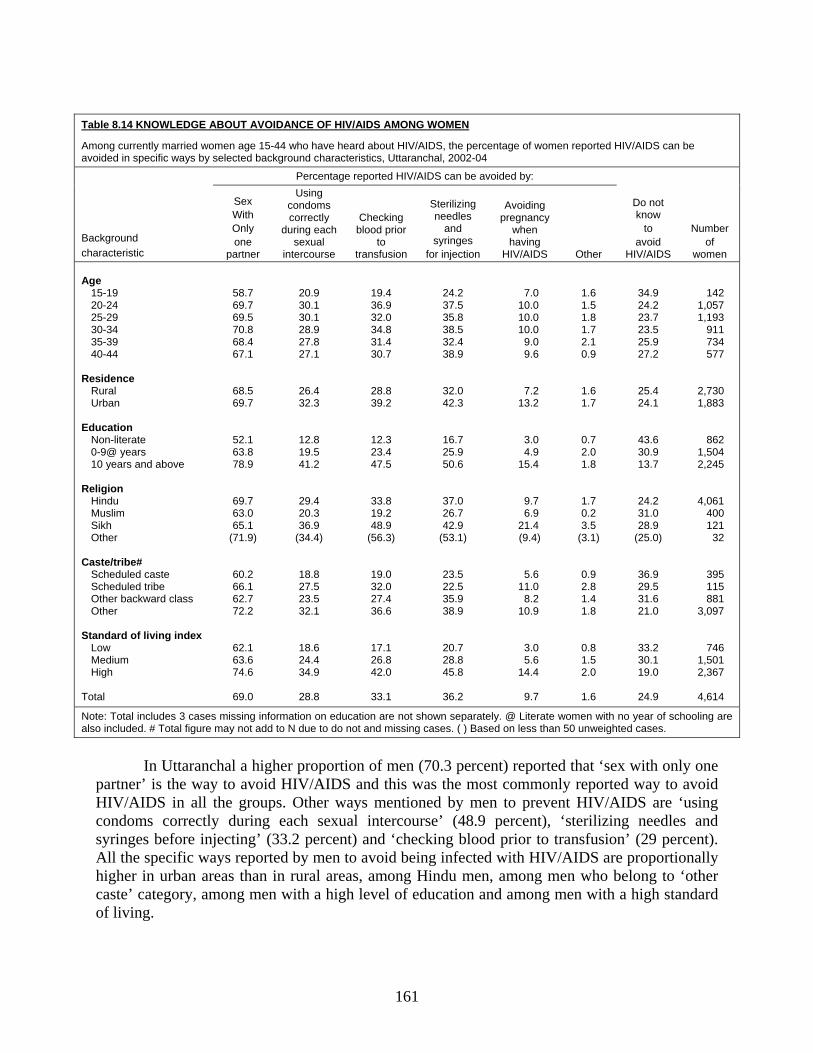
161
Table 8.14 KNOWLEDGE ABOUT AVOIDANCE OF HIV/AIDS AMONG WOMEN
Among currently married women age 15-44 who have heard about HIV/AIDS, the percentage of women reported HIV/AIDS can be avoided in specific ways by selected background characteristics, Uttaranchal, 2002-04
Background characteristic
Percentage reported HIV/AIDS can be avoided by:
Do not know
to avoid
HIV/AIDS
Number of
women
Sex With Only one
partner
Using condoms correctly
during each sexual
intercourse
Checking blood prior
to transfusion
Sterilizing needles
and syringes
for injection
Avoiding pregnancy
when having
HIV/AIDS Other Age 15-19 20-24 25-29 30-34 35-39 40-44 Residence Rural Urban Education Non-literate 0-9@ years 10 years and above Religion Hindu Muslim Sikh Other Caste/tribe# Scheduled caste Scheduled tribe Other backward class Other Standard of living index Low Medium High Total
58.7 69.7 69.5 70.8 68.4 67.1
68.5 69.7
52.1 63.8 78.9
69.7 63.0 65.1
(71.9)
60.2 66.1 62.7 72.2
62.1 63.6 74.6
69.0
20.9 30.1 30.1 28.9 27.8 27.1
26.4 32.3
12.8 19.5 41.2
29.4 20.3 36.9
(34.4)
18.8 27.5 23.5 32.1
18.6 24.4 34.9
28.8
19.4 36.9 32.0 34.8 31.4 30.7
28.8 39.2
12.3 23.4 47.5
33.8 19.2 48.9
(56.3)
19.0 32.0 27.4 36.6
17.1 26.8 42.0
33.1
24.2 37.5 35.8 38.5 32.4 38.9
32.0 42.3
16.7 25.9 50.6
37.0 26.7 42.9
(53.1)
23.5 22.5 35.9 38.9
20.7 28.8 45.8
36.2
7.0 10.0 10.0 10.0
9.0 9.6
7.2 13.2
3.0 4.9
15.4
9.7 6.9
21.4 (9.4)
5.6 11.0
8.2 10.9
3.0 5.6
14.4
9.7
1.6 1.5 1.8 1.7 2.1 0.9
1.6 1.7
0.7 2.0 1.8
1.7 0.2 3.5
(3.1)
0.9 2.8 1.4 1.8
0.8 1.5 2.0
1.6
34.9 24.2 23.7 23.5 25.9 27.2
25.4 24.1
43.6 30.9 13.7
24.2 31.0 28.9
(25.0)
36.9 29.5 31.6 21.0
33.2 30.1 19.0
24.9
142 1,057 1,193
911 734 577
2,730 1,883
862 1,504 2,245
4,061 400 121
32
395 115 881
3,097
746 1,501 2,367
4,614
Note: Total includes 3 cases missing information on education are not shown separately. @ Literate women with no year of schooling are also included. # Total figure may not add to N due to do not and missing cases. ( ) Based on less than 50 unweighted cases.
In Uttaranchal a higher proportion of men (70.3 percent) reported that ‘sex with only one
partner’ is the way to avoid HIV/AIDS and this was the most commonly reported way to avoid HIV/AIDS in all the groups. Other ways mentioned by men to prevent HIV/AIDS are ‘using condoms correctly during each sexual intercourse’ (48.9 percent), ‘sterilizing needles and syringes before injecting’ (33.2 percent) and ‘checking blood prior to transfusion’ (29 percent). All the specific ways reported by men to avoid being infected with HIV/AIDS are proportionally higher in urban areas than in rural areas, among Hindu men, among men who belong to ‘other caste’ category, among men with a high level of education and among men with a high standard of living.
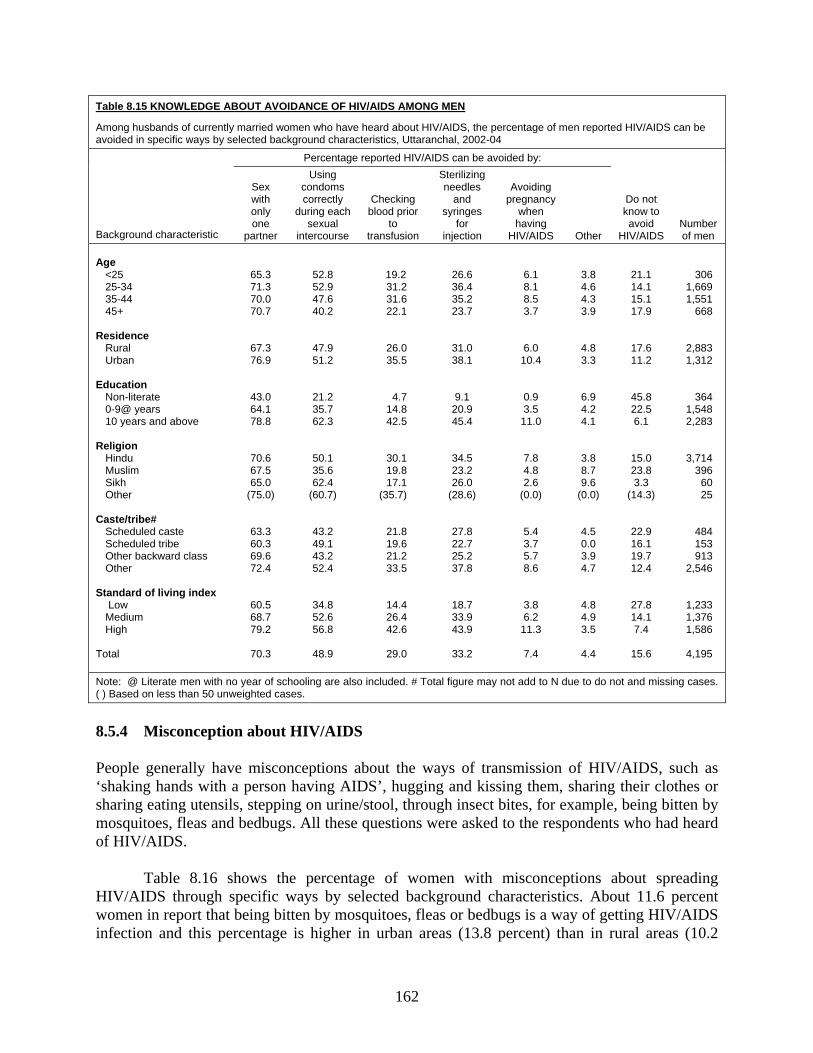
162
Table 8.15 KNOWLEDGE ABOUT AVOIDANCE OF HIV/AIDS AMONG MEN
Among husbands of currently married women who have heard about HIV/AIDS, the percentage of men reported HIV/AIDS can be avoided in specific ways by selected background characteristics, Uttaranchal, 2002-04
Background characteristic
Percentage reported HIV/AIDS can be avoided by:
Do not know to avoid
HIV/AIDS Number of men
Sex with only one
partner
Using condoms correctly
during each sexual
intercourse
Checking blood prior
to transfusion
Sterilizing needles
and syringes
for injection
Avoiding pregnancy
when having
HIV/AIDS Other Age <25 25-34 35-44 45+ Residence Rural Urban Education Non-literate 0-9@ years 10 years and above Religion Hindu Muslim Sikh Other Caste/tribe# Scheduled caste Scheduled tribe Other backward class Other Standard of living index Low Medium High Total
65.3 71.3 70.0 70.7
67.3 76.9
43.0 64.1 78.8
70.6 67.5 65.0
(75.0)
63.3 60.3 69.6 72.4
60.5 68.7 79.2
70.3
52.8 52.9 47.6 40.2
47.9 51.2
21.2 35.7 62.3
50.1 35.6 62.4
(60.7)
43.2 49.1 43.2 52.4
34.8 52.6 56.8
48.9
19.2 31.2 31.6 22.1
26.0 35.5
4.7 14.8 42.5
30.1 19.8 17.1
(35.7)
21.8 19.6 21.2 33.5
14.4 26.4 42.6
29.0
26.6 36.4 35.2 23.7
31.0 38.1
9.1 20.9 45.4
34.5 23.2 26.0
(28.6)
27.8 22.7 25.2 37.8
18.7 33.9 43.9
33.2
6.1 8.1 8.5 3.7
6.0 10.4
0.9 3.5
11.0
7.8 4.8 2.6
(0.0)
5.4 3.7 5.7 8.6
3.8 6.2
11.3
7.4
3.8 4.6 4.3 3.9
4.8 3.3
6.9 4.2 4.1
3.8 8.7 9.6
(0.0)
4.5 0.0 3.9 4.7
4.8 4.9 3.5
4.4
21.1 14.1 15.1 17.9
17.6 11.2
45.8 22.5 6.1
15.0 23.8 3.3
(14.3)
22.9 16.1 19.7 12.4
27.8 14.1 7.4
15.6
306 1,669 1,551
668
2,883 1,312
364 1,548 2,283
3,714 396
60 25
484 153 913
2,546
1,233 1,376 1,586
4,195
Note: @ Literate men with no year of schooling are also included. # Total figure may not add to N due to do not and missing cases. ( ) Based on less than 50 unweighted cases.
8.5.4 Misconception about HIV/AIDS People generally have misconceptions about the ways of transmission of HIV/AIDS, such as ‘shaking hands with a person having AIDS’, hugging and kissing them, sharing their clothes or sharing eating utensils, stepping on urine/stool, through insect bites, for example, being bitten by mosquitoes, fleas and bedbugs. All these questions were asked to the respondents who had heard of HIV/AIDS. Table 8.16 shows the percentage of women with misconceptions about spreading HIV/AIDS through specific ways by selected background characteristics. About 11.6 percent women in report that being bitten by mosquitoes, fleas or bedbugs is a way of getting HIV/AIDS infection and this percentage is higher in urban areas (13.8 percent) than in rural areas (10.2
163
percent). Non-literate women, women from households with a high standard of living, Muslim women and women from scheduled tribes mentioned this method of transmission more often. Other misconceptions about the spreading of HIV/AIDS were ‘sharing eating utensils’ (11.1 percent), ‘kissing’ (10.3 percent), ‘stepping on urine/stool’ (10.1 percent), ‘sharing clothes’ (10.1 percent), ‘hugging’ (7.8 percent), and ‘shaking hands’ (6.7 percent). Most of these misconceptions are reported by a higher proportion of urban women, Muslim women, non-literate women and women with a high standard of living.
Table 8.16 MISCONCEPTION ABOUT TRANSMISSION OF HIV/AIDS AMONG WOMEN
Among currently married women age 15-44 who have heard about HIV/AIDS, the percentage of women having misconception about the transmission of HIV/AIDS by selected background characteristics, Uttaranchal, 2002-04
Background characteristic
Percentage having misconception about the transmission of HIV/AIDS
Number of
women Shaking hands Hugging Kissing
Sharing clothes
Sharing eating
utensils
Stepping on
Urine / stool
Mosquito, flea, or bedbugs
biting Residence Rural Urban Education Non-literate 0-9@ years 10 years and above Religion Hindu Muslim Sikh Other Caste/tribe# Scheduled caste Scheduled tribe Other backward class Other Standard of living index Low Medium High Total
6.6 6.8
10.8 7.1 4.8
6.5 9.2 5.8
(3.1)
8.6 9.6 9.4 5.7
6.9 7.9 5.8
6.7
7.3 8.5
11.8 8.0 6.1
7.4 11.4
8.3 (3.1)
10.3 9.5
10.5 6.8
8.1 9.2 6.8
7.8
9.6 11.2
12.1 9.9 9.8
9.9 12.7 13.0 (9.4)
14.5 16.5 12.3
8.8
8.0 10.4 10.9
10.3
9.3 11.3
13.5 11.1
8.2
9.5 16.5
9.4 (9.4)
12.4 10.4 14.8
8.8
7.3 10.0 11.1
10.1
10.3 12.3
13.1 12.4
9.5
10.8 14.6 12.2 (9.4)
15.1 4.5
15.2 9.5
8.8 10.7 12.1
11.1
9.3 11.3
12.8 10.2
9.1
9.8 14.2 10.4 (6.3)
13.4 7.8
13.9 8.9
6.0 10.0 11.5
10.1
10.2 13.8
14.1 12.4 10.2
11.3 14.7 13.0
(15.6)
16.9 20.9 13.0
9.9
6.8 11.1 13.5
11.6
2,730 1,883
862 1,504 2,245
4,061 400 121
32
395 115 881
3,097
746 1,501 2,367
4,614
Note: Total includes 3 cases missing information on education are not shown separately. @ Literate women with no year of schooling are also included. # Total figure may not add to N due to do not and missing cases. ( ) Based on less than 50 unweighted cases.
Table 8.17 presents the percentage of men with misconceptions about the spreading of
HIV/AIDS through specific ways by selected background characteristics. Again, just like the women, men in most of the groups reported that HIV/AIDS is transmitted through the biting of mosquitoes, fleas or bedbugs. About 23.5 percent of the men felt so. The percentage who reported that HIV/AIDS could be transmitted through the biting of mosquitoes or fleas or bedbugs was much higher among urban men (25.1 percent) than among rural men (22.8 percent). Literate men who have completed nine years of schooling, men from households with a low standard of living, Muslim men, and scheduled caste men are of the impression that HIV/AIDS spreads when one is bitten by mosquitoes, fleas or bedbugs. Other misconceptions about the ways of spreading of HIV/AIDS are ‘kissing’ (19.4 percent), ‘sharing eating utensils’ (17.8
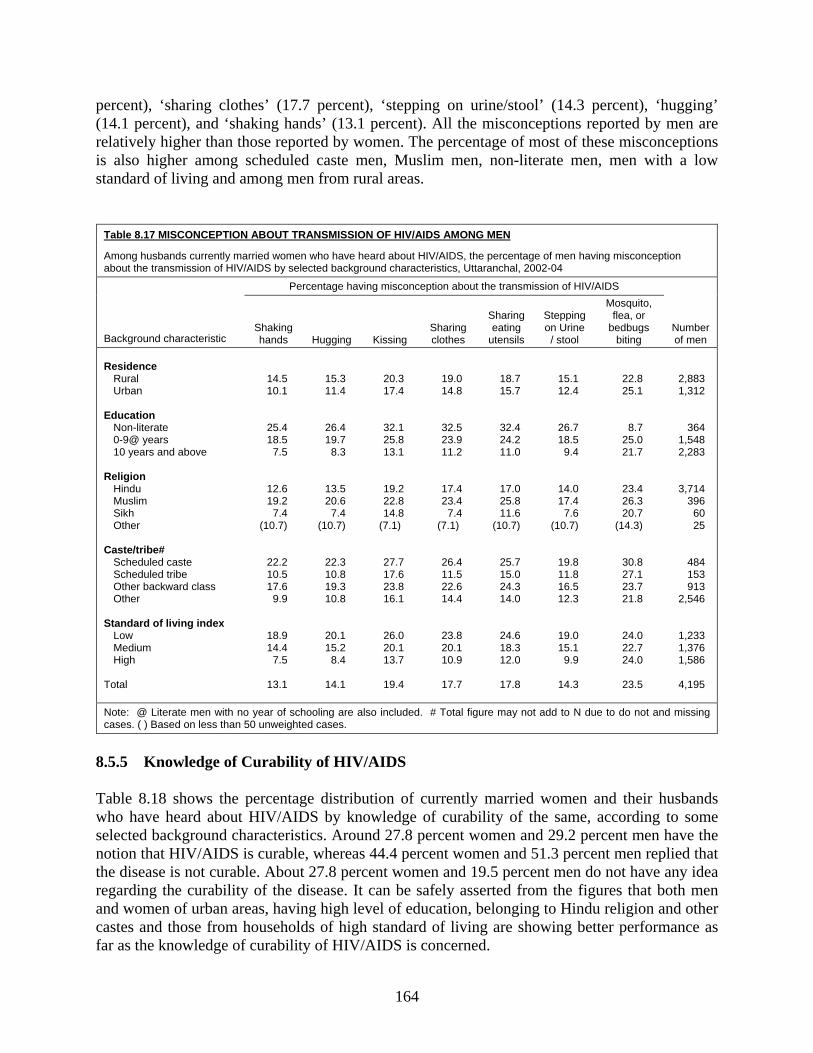
164
percent), ‘sharing clothes’ (17.7 percent), ‘stepping on urine/stool’ (14.3 percent), ‘hugging’ (14.1 percent), and ‘shaking hands’ (13.1 percent). All the misconceptions reported by men are relatively higher than those reported by women. The percentage of most of these misconceptions is also higher among scheduled caste men, Muslim men, non-literate men, men with a low standard of living and among men from rural areas.
Table 8.17 MISCONCEPTION ABOUT TRANSMISSION OF HIV/AIDS AMONG MEN
Among husbands currently married women who have heard about HIV/AIDS, the percentage of men having misconception about the transmission of HIV/AIDS by selected background characteristics, Uttaranchal, 2002-04
Background characteristic
Percentage having misconception about the transmission of HIV/AIDS
Number of men
Shaking hands Hugging Kissing
Sharing clothes
Sharing eating
utensils
Stepping on Urine
/ stool
Mosquito, flea, or
bedbugs biting
Residence Rural Urban Education Non-literate 0-9@ years 10 years and above Religion Hindu Muslim Sikh Other Caste/tribe# Scheduled caste Scheduled tribe Other backward class Other Standard of living index Low Medium High Total
14.5 10.1
25.4 18.5
7.5
12.6 19.2
7.4 (10.7)
22.2 10.5 17.6
9.9
18.9 14.4
7.5
13.1
15.3 11.4
26.4 19.7
8.3
13.5 20.6
7.4 (10.7)
22.3 10.8 19.3 10.8
20.1 15.2
8.4
14.1
20.3 17.4
32.1 25.8 13.1
19.2 22.8 14.8
(7.1)
27.7 17.6 23.8 16.1
26.0 20.1 13.7
19.4
19.0 14.8
32.5 23.9 11.2
17.4 23.4
7.4 (7.1)
26.4 11.5 22.6 14.4
23.8 20.1 10.9
17.7
18.7 15.7
32.4 24.2 11.0
17.0 25.8 11.6
(10.7)
25.7 15.0 24.3 14.0
24.6 18.3 12.0
17.8
15.1 12.4
26.7 18.5
9.4
14.0 17.4
7.6 (10.7)
19.8 11.8 16.5 12.3
19.0 15.1
9.9
14.3
22.8 25.1
8.7 25.0 21.7
23.4 26.3 20.7
(14.3)
30.8 27.1 23.7 21.8
24.0 22.7 24.0
23.5
2,883 1,312
364 1,548 2,283
3,714 396
60 25
484 153 913
2,546
1,233 1,376 1,586
4,195
Note: @ Literate men with no year of schooling are also included. # Total figure may not add to N due to do not and missing cases. ( ) Based on less than 50 unweighted cases.
8.5.5 Knowledge of Curability of HIV/AIDS Table 8.18 shows the percentage distribution of currently married women and their husbands who have heard about HIV/AIDS by knowledge of curability of the same, according to some selected background characteristics. Around 27.8 percent women and 29.2 percent men have the notion that HIV/AIDS is curable, whereas 44.4 percent women and 51.3 percent men replied that the disease is not curable. About 27.8 percent women and 19.5 percent men do not have any idea regarding the curability of the disease. It can be safely asserted from the figures that both men and women of urban areas, having high level of education, belonging to Hindu religion and other castes and those from households of high standard of living are showing better performance as far as the knowledge of curability of HIV/AIDS is concerned.
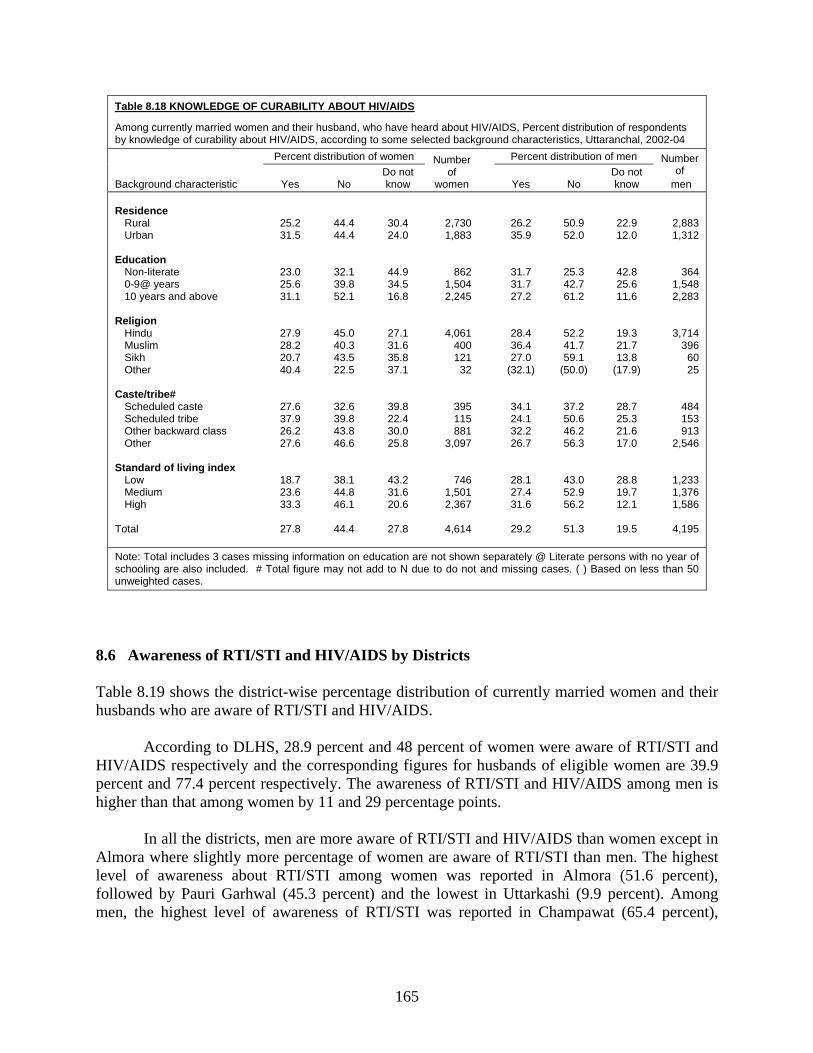
165
Table 8.18 KNOWLEDGE OF CURABILITY ABOUT HIV/AIDS
Among currently married women and their husband, who have heard about HIV/AIDS, Percent distribution of respondents by knowledge of curability about HIV/AIDS, according to some selected background characteristics, Uttaranchal, 2002-04
Background characteristic
Percent distribution of women Number of
women
Percent distribution of men Number of
men Yes No Do not know Yes No
Do not know
Residence Rural Urban Education Non-literate 0-9@ years 10 years and above Religion Hindu Muslim Sikh Other Caste/tribe# Scheduled caste Scheduled tribe Other backward class Other Standard of living index Low Medium High Total
25.2 31.5
23.0 25.6 31.1
27.9 28.2 20.7 40.4
27.6 37.9 26.2 27.6
18.7 23.6 33.3
27.8
44.4 44.4
32.1 39.8 52.1
45.0 40.3 43.5 22.5
32.6 39.8 43.8 46.6
38.1 44.8 46.1
44.4
30.4 24.0
44.9 34.5 16.8
27.1 31.6 35.8 37.1
39.8 22.4 30.0 25.8
43.2 31.6 20.6
27.8
2,730 1,883
862 1,504 2,245
4,061 400 121
32
395 115 881
3,097
746 1,501 2,367
4,614
26.2 35.9
31.7 31.7 27.2
28.4 36.4 27.0
(32.1)
34.1 24.1 32.2 26.7
28.1 27.4 31.6
29.2
50.9 52.0
25.3 42.7 61.2
52.2 41.7 59.1
(50.0)
37.2 50.6 46.2 56.3
43.0 52.9 56.2
51.3
22.9 12.0
42.8 25.6 11.6
19.3 21.7 13.8
(17.9)
28.7 25.3 21.6 17.0
28.8 19.7 12.1
19.5
2,883 1,312
364 1,548 2,283
3,714 396
60 25
484 153 913
2,546
1,233 1,376 1,586
4,195
Note: Total includes 3 cases missing information on education are not shown separately @ Literate persons with no year of schooling are also included. # Total figure may not add to N due to do not and missing cases. ( ) Based on less than 50 unweighted cases.
8.6 Awareness of RTI/STI and HIV/AIDS by Districts Table 8.19 shows the district-wise percentage distribution of currently married women and their husbands who are aware of RTI/STI and HIV/AIDS.
According to DLHS, 28.9 percent and 48 percent of women were aware of RTI/STI and HIV/AIDS respectively and the corresponding figures for husbands of eligible women are 39.9 percent and 77.4 percent respectively. The awareness of RTI/STI and HIV/AIDS among men is higher than that among women by 11 and 29 percentage points. In all the districts, men are more aware of RTI/STI and HIV/AIDS than women except in Almora where slightly more percentage of women are aware of RTI/STI than men. The highest level of awareness about RTI/STI among women was reported in Almora (51.6 percent), followed by Pauri Garhwal (45.3 percent) and the lowest in Uttarkashi (9.9 percent). Among men, the highest level of awareness of RTI/STI was reported in Champawat (65.4 percent),
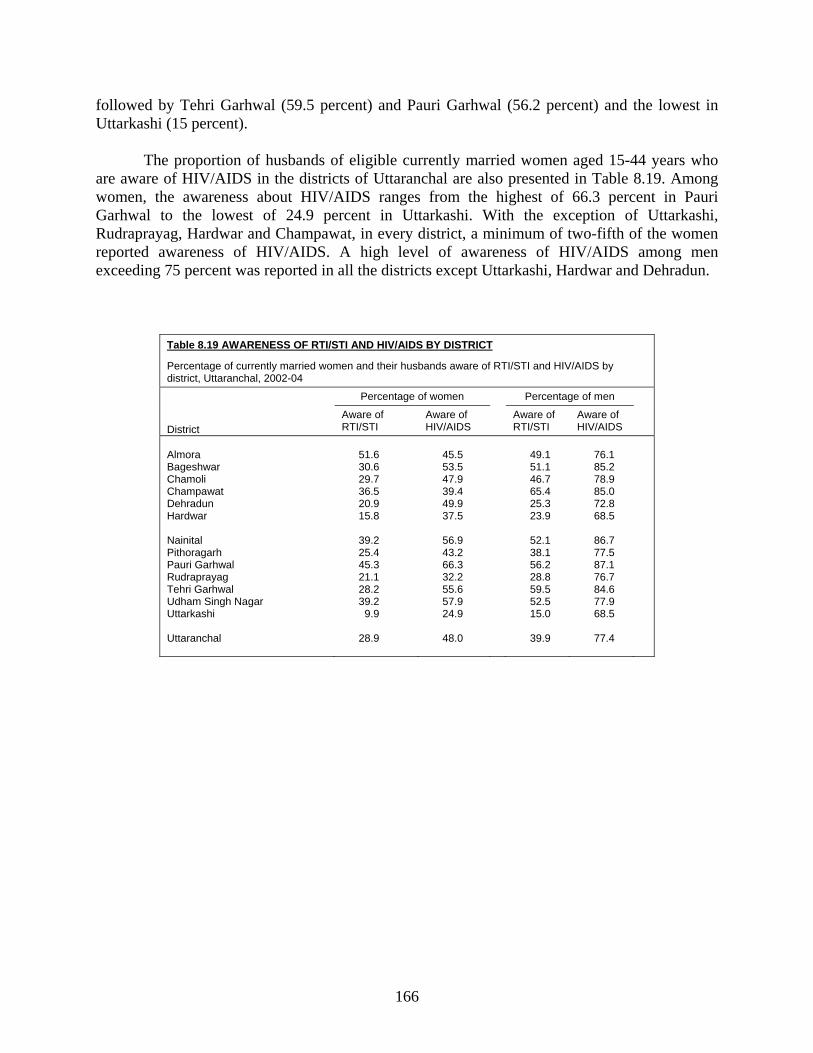
166
followed by Tehri Garhwal (59.5 percent) and Pauri Garhwal (56.2 percent) and the lowest in Uttarkashi (15 percent).
The proportion of husbands of eligible currently married women aged 15-44 years who are aware of HIV/AIDS in the districts of Uttaranchal are also presented in Table 8.19. Among women, the awareness about HIV/AIDS ranges from the highest of 66.3 percent in Pauri Garhwal to the lowest of 24.9 percent in Uttarkashi. With the exception of Uttarkashi, Rudraprayag, Hardwar and Champawat, in every district, a minimum of two-fifth of the women reported awareness of HIV/AIDS. A high level of awareness of HIV/AIDS among men exceeding 75 percent was reported in all the districts except Uttarkashi, Hardwar and Dehradun.
Table 8.19 AWARENESS OF RTI/STI AND HIV/AIDS BY DISTRICT
Percentage of currently married women and their husbands aware of RTI/STI and HIV/AIDS by district, Uttaranchal, 2002-04
District
Percentage of women Percentage of men
Aware of RTI/STI
Aware of HIV/AIDS
Aware of RTI/STI
Aware of HIV/AIDS
Almora Bageshwar Chamoli Champawat Dehradun Hardwar Nainital Pithoragarh Pauri Garhwal Rudraprayag Tehri Garhwal Udham Singh Nagar Uttarkashi Uttaranchal
51.6 30.6 29.7 36.5 20.9 15.8
39.2 25.4 45.3 21.1 28.2 39.2
9.9
28.9
45.5 53.5 47.9 39.4 49.9 37.5
56.9 43.2 66.3 32.2 55.6 57.9 24.9
48.0
49.1 51.1 46.7 65.4 25.3 23.9
52.1 38.1 56.2 28.8 59.5 52.5 15.0
39.9
76.1 85.2 78.9 85.0 72.8 68.5
86.7 77.5 87.1 76.7 84.6 77.9 68.5
77.4
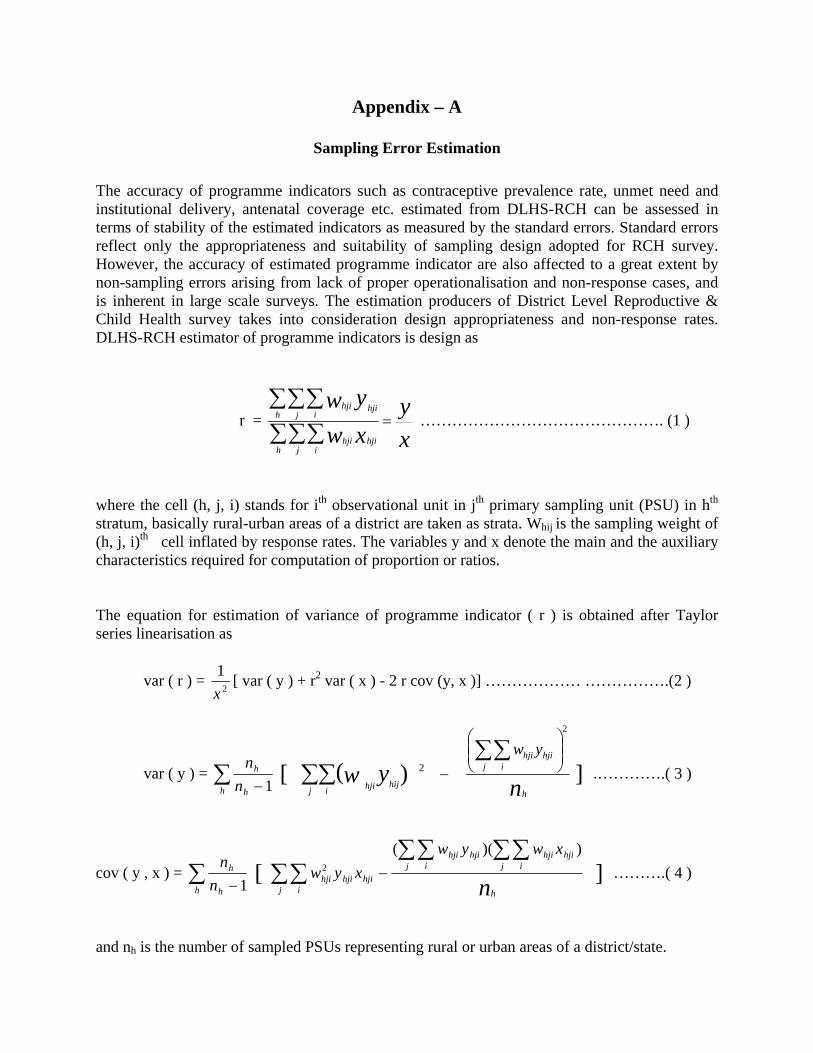
Appendix – A
Sampling Error Estimation
The accuracy of programme indicators such as contraceptive prevalence rate, unmet need and institutional delivery, antenatal coverage etc. estimated from DLHS-RCH can be assessed in terms of stability of the estimated indicators as measured by the standard errors. Standard errors reflect only the appropriateness and suitability of sampling design adopted for RCH survey. However, the accuracy of estimated programme indicator are also affected to a great extent by non-sampling errors arising from lack of proper operationalisation and non-response cases, and is inherent in large scale surveys. The estimation producers of District Level Reproductive & Child Health survey takes into consideration design appropriateness and non-response rates. DLHS-RCH estimator of programme indicators is design as
r = xy
xwyw
h j ihjihji
h j ihjihji
=∑∑∑∑∑∑
………………………………………. (1 )
where the cell (h, j, i) stands for ith observational unit in jth primary sampling unit (PSU) in hth stratum, basically rural-urban areas of a district are taken as strata. Whij is the sampling weight of (h, j, i)th cell inflated by response rates. The variables y and x denote the main and the auxiliary characteristics required for computation of proportion or ratios. The equation for estimation of variance of programme indicator ( r ) is obtained after Taylor series linearisation as
var ( r ) = 2
1x
[ var ( y ) + r2 var ( x ) - 2 r cov (y, x )] ……………… …………….(2 )
var ( y ) = ∑ −h h
h
nn
1 [ )(∑∑
j ihijhji
yw 2 – nh
j ihjihji yw
2
⎟⎟⎠
⎞⎜⎜⎝
⎛∑∑
] .………….( 3 )
cov ( y , x ) = ∑ −h h
h
nn
1 [
nh
j i j ihjihjihjihji
hjihjij i
hji
xwywxyw
∑∑ ∑∑∑∑ −
))((2 ] ……….( 4 )
and nh is the number of sampled PSUs representing rural or urban areas of a district/state.
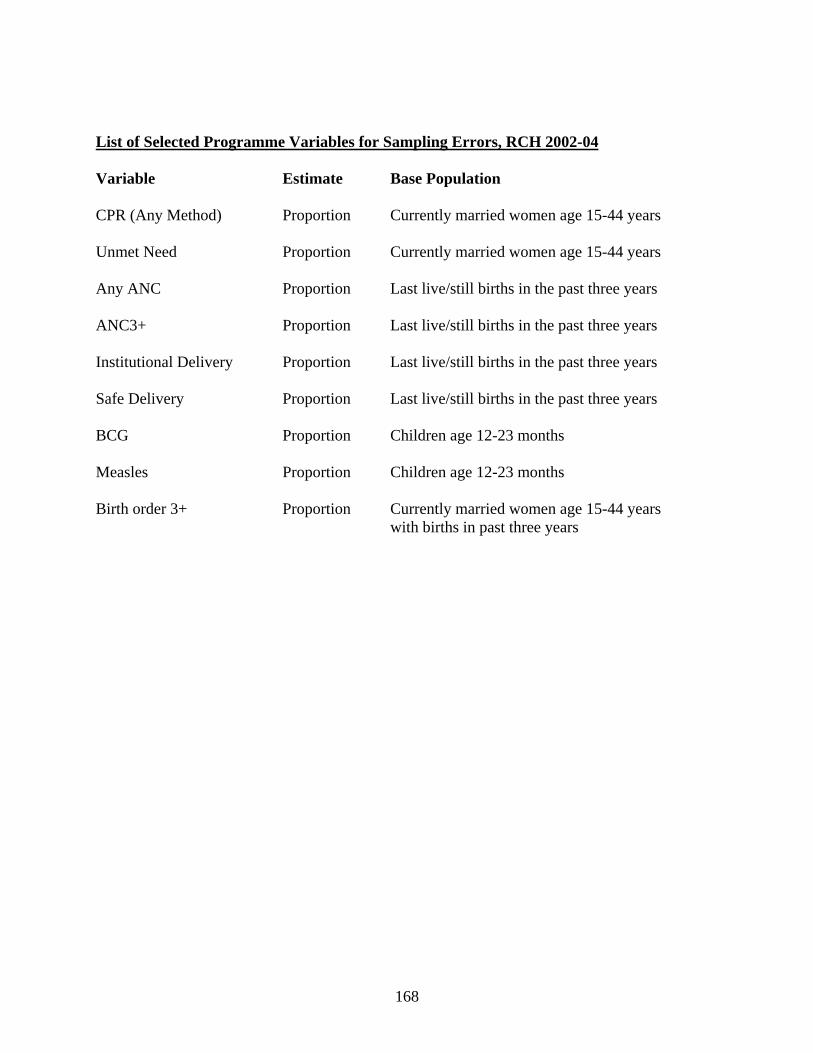
168
List of Selected Programme Variables for Sampling Errors, RCH 2002-04 Variable
Estimate Base Population
CPR (Any Method)
Proportion Currently married women age 15-44 years
Unmet Need
Proportion Currently married women age 15-44 years
Any ANC
Proportion Last live/still births in the past three years
ANC3+
Proportion Last live/still births in the past three years
Institutional Delivery
Proportion Last live/still births in the past three years
Safe Delivery
Proportion Last live/still births in the past three years
BCG
Proportion Children age 12-23 months
Measles
Proportion Children age 12-23 months
Birth order 3+
Proportion Currently married women age 15-44 years with births in past three years
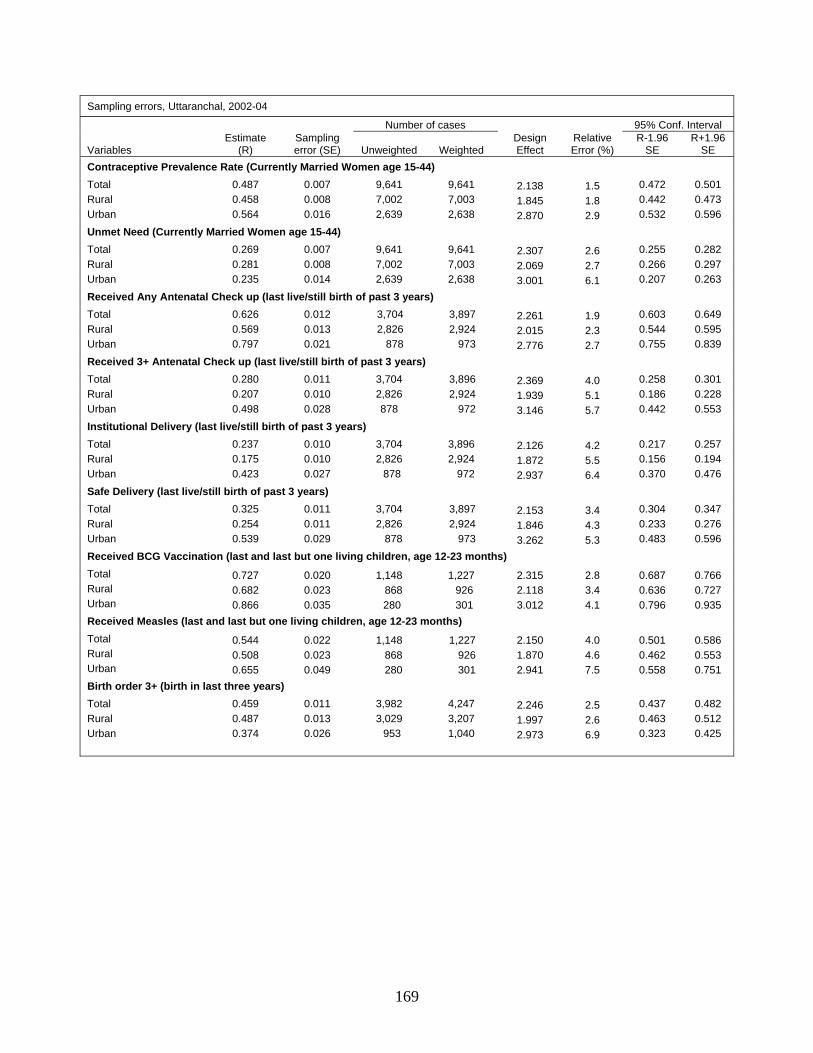
169
Sampling errors, Uttaranchal, 2002-04
Variables
Estimate (R)
Sampling error (SE)
Number of cases Design Effect
Relative Error (%)
95% Conf. Interval
Unweighted Weighted R-1.96
SE R+1.96
SE Contraceptive Prevalence Rate (Currently Married Women age 15-44) Total 0.487 0.007 9,641 9,641 2.138 1.5 0.472 0.501 Rural 0.458 0.008 7,002 7,003 1.845 1.8 0.442 0.473 Urban 0.564 0.016 2,639 2,638 2.870 2.9 0.532 0.596 Unmet Need (Currently Married Women age 15-44) Total 0.269 0.007 9,641 9,641 2.307 2.6 0.255 0.282 Rural 0.281 0.008 7,002 7,003 2.069 2.7 0.266 0.297 Urban 0.235 0.014 2,639 2,638 3.001 6.1 0.207 0.263 Received Any Antenatal Check up (last live/still birth of past 3 years) Total 0.626 0.012 3,704 3,897 2.261 1.9 0.603 0.649 Rural 0.569 0.013 2,826 2,924 2.015 2.3 0.544 0.595 Urban 0.797 0.021 878 973 2.776 2.7 0.755 0.839 Received 3+ Antenatal Check up (last live/still birth of past 3 years) Total 0.280 0.011 3,704 3,896 2.369 4.0 0.258 0.301 Rural 0.207 0.010 2,826 2,924 1.939 5.1 0.186 0.228 Urban 0.498 0.028 878 972 3.146 5.7 0.442 0.553 Institutional Delivery (last live/still birth of past 3 years) Total 0.237 0.010 3,704 3,896 2.126 4.2 0.217 0.257 Rural 0.175 0.010 2,826 2,924 1.872 5.5 0.156 0.194 Urban 0.423 0.027 878 972 2.937 6.4 0.370 0.476 Safe Delivery (last live/still birth of past 3 years) Total 0.325 0.011 3,704 3,897 2.153 3.4 0.304 0.347 Rural 0.254 0.011 2,826 2,924 1.846 4.3 0.233 0.276 Urban 0.539 0.029 878 973 3.262 5.3 0.483 0.596 Received BCG Vaccination (last and last but one living children, age 12-23 months) Total 0.727 0.020 1,148 1,227 2.315 2.8 0.687 0.766 Rural 0.682 0.023 868 926 2.118 3.4 0.636 0.727 Urban 0.866 0.035 280 301 3.012 4.1 0.796 0.935 Received Measles (last and last but one living children, age 12-23 months) Total 0.544 0.022 1,148 1,227 2.150 4.0 0.501 0.586 Rural 0.508 0.023 868 926 1.870 4.6 0.462 0.553 Urban 0.655 0.049 280 301 2.941 7.5 0.558 0.751 Birth order 3+ (birth in last three years) Total 0.459 0.011 3,982 4,247 2.246 2.5 0.437 0.482 Rural 0.487 0.013 3,029 3,207 1.997 2.6 0.463 0.512 Urban 0.374 0.026 953 1,040 2.973 6.9 0.323 0.425
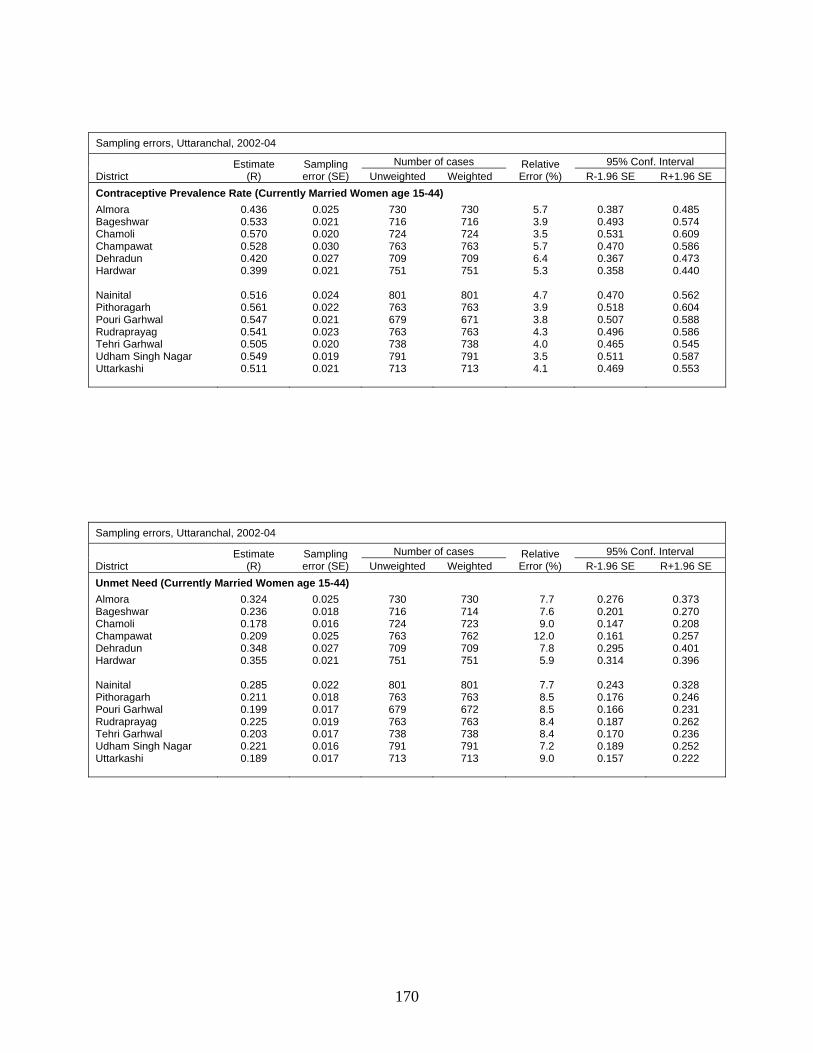
170
Sampling errors, Uttaranchal, 2002-04
District
Estimate (R)
Sampling error (SE)
Number of cases Relative Error (%)
95% Conf. Interval Unweighted Weighted R-1.96 SE R+1.96 SE
Unmet Need (Currently Married Women age 15-44) Almora Bageshwar Chamoli Champawat Dehradun Hardwar Nainital Pithoragarh Pouri Garhwal Rudraprayag Tehri Garhwal Udham Singh Nagar Uttarkashi
0.324 0.236 0.178 0.209 0.348 0.355
0.285 0.211 0.199 0.225 0.203 0.221 0.189
0.025 0.018 0.016 0.025 0.027 0.021
0.022 0.018 0.017 0.019 0.017 0.016 0.017
730 716 724 763 709 751
801 763 679 763 738 791 713
730 714 723 762 709 751
801 763 672 763 738 791 713
7.7 7.6 9.0
12.0 7.8 5.9
7.7 8.5 8.5 8.4 8.4 7.2 9.0
0.276 0.201 0.147 0.161 0.295 0.314
0.243 0.176 0.166 0.187 0.170 0.189 0.157
0.373 0.270 0.208 0.257 0.401 0.396
0.328 0.246 0.231 0.262 0.236 0.252 0.222
Sampling errors, Uttaranchal, 2002-04
District
Estimate (R)
Sampling error (SE)
Number of cases Relative Error (%)
95% Conf. Interval Unweighted Weighted R-1.96 SE R+1.96 SE
Contraceptive Prevalence Rate (Currently Married Women age 15-44) Almora Bageshwar Chamoli Champawat Dehradun Hardwar Nainital Pithoragarh Pouri Garhwal Rudraprayag Tehri Garhwal Udham Singh Nagar Uttarkashi
0.436 0.533 0.570 0.528 0.420 0.399
0.516 0.561 0.547 0.541 0.505 0.549 0.511
0.025 0.021 0.020 0.030 0.027 0.021
0.024 0.022 0.021 0.023 0.020 0.019 0.021
730 716 724 763 709 751
801 763 679 763 738 791 713
730 716 724 763 709 751
801 763 671 763 738 791 713
5.7 3.9 3.5 5.7 6.4 5.3
4.7 3.9 3.8 4.3 4.0 3.5 4.1
0.387 0.493 0.531 0.470 0.367 0.358
0.470 0.518 0.507 0.496 0.465 0.511 0.469
0.485 0.574 0.609 0.586 0.473 0.440
0.562 0.604 0.588 0.586 0.545 0.587 0.553
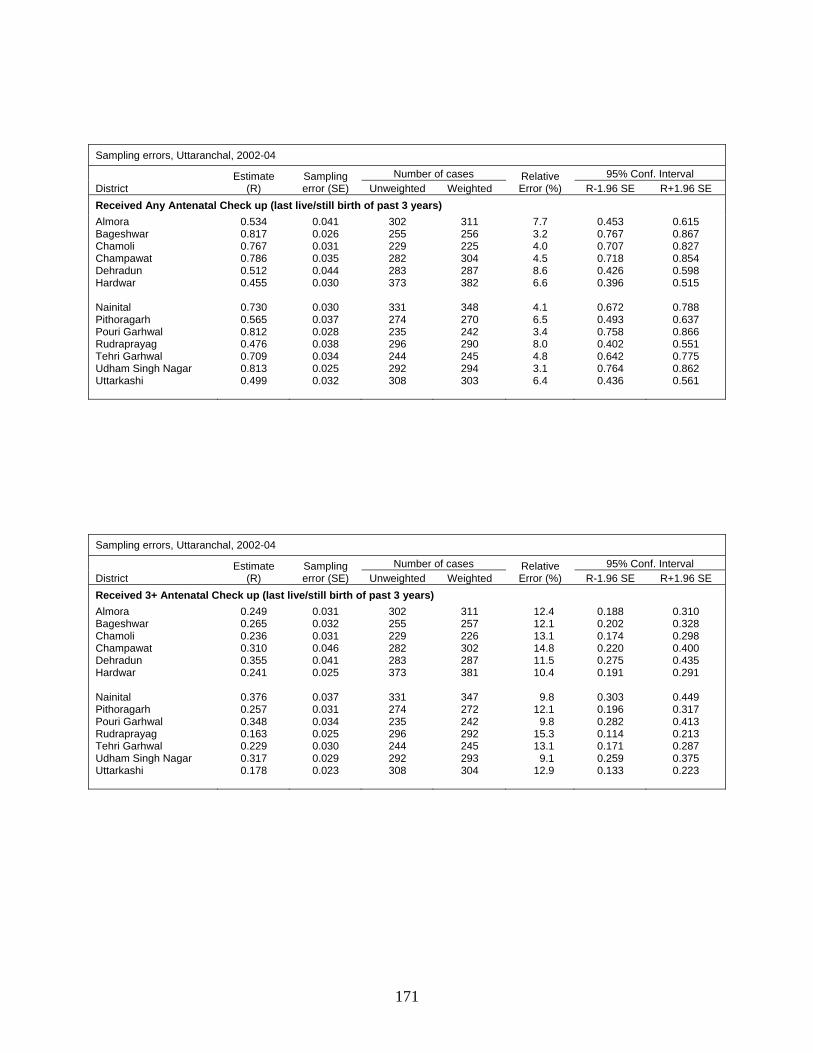
171
Sampling errors, Uttaranchal, 2002-04
District
Estimate (R)
Sampling error (SE)
Number of cases Relative Error (%)
95% Conf. Interval Unweighted Weighted R-1.96 SE R+1.96 SE
Received Any Antenatal Check up (last live/still birth of past 3 years) Almora Bageshwar Chamoli Champawat Dehradun Hardwar Nainital Pithoragarh Pouri Garhwal Rudraprayag Tehri Garhwal Udham Singh Nagar Uttarkashi
0.534 0.817 0.767 0.786 0.512 0.455
0.730 0.565 0.812 0.476 0.709 0.813 0.499
0.041 0.026 0.031 0.035 0.044 0.030
0.030 0.037 0.028 0.038 0.034 0.025 0.032
302 255 229 282 283 373
331 274 235 296 244 292 308
311 256 225 304 287 382
348 270 242 290 245 294 303
7.7 3.2 4.0 4.5 8.6 6.6
4.1 6.5 3.4 8.0 4.8 3.1 6.4
0.453 0.767 0.707 0.718 0.426 0.396
0.672 0.493 0.758 0.402 0.642 0.764 0.436
0.615 0.867 0.827 0.854 0.598 0.515
0.788 0.637 0.866 0.551 0.775 0.862 0.561
Sampling errors, Uttaranchal, 2002-04
District
Estimate (R)
Sampling error (SE)
Number of cases Relative Error (%)
95% Conf. Interval Unweighted Weighted R-1.96 SE R+1.96 SE
Received 3+ Antenatal Check up (last live/still birth of past 3 years) Almora Bageshwar Chamoli Champawat Dehradun Hardwar Nainital Pithoragarh Pouri Garhwal Rudraprayag Tehri Garhwal Udham Singh Nagar Uttarkashi
0.249 0.265 0.236 0.310 0.355 0.241
0.376 0.257 0.348 0.163 0.229 0.317 0.178
0.031 0.032 0.031 0.046 0.041 0.025
0.037 0.031 0.034 0.025 0.030 0.029 0.023
302 255 229 282 283 373
331 274 235 296 244 292 308
311 257 226 302 287 381
347 272 242 292 245 293 304
12.4 12.1 13.1 14.8 11.5 10.4
9.8
12.1 9.8
15.3 13.1
9.1 12.9
0.188 0.202 0.174 0.220 0.275 0.191
0.303 0.196 0.282 0.114 0.171 0.259 0.133
0.310 0.328 0.298 0.400 0.435 0.291
0.449 0.317 0.413 0.213 0.287 0.375 0.223
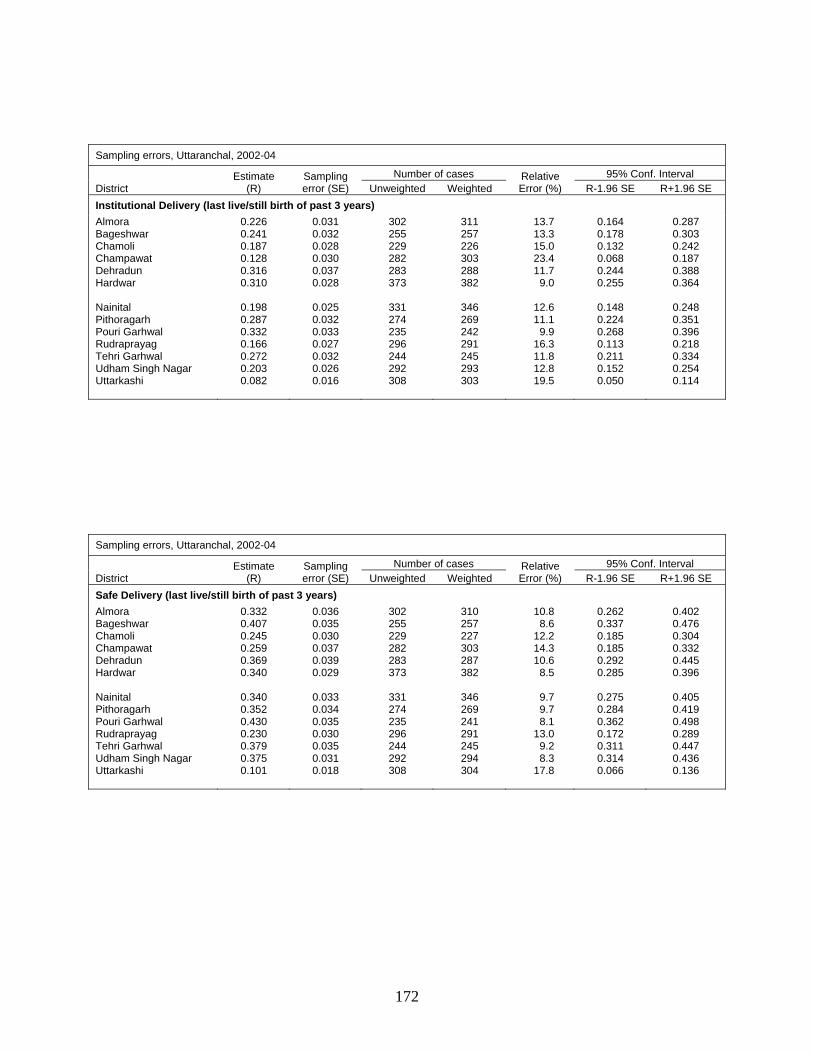
172
Sampling errors, Uttaranchal, 2002-04
District
Estimate (R)
Sampling error (SE)
Number of cases Relative Error (%)
95% Conf. Interval Unweighted Weighted R-1.96 SE R+1.96 SE
Institutional Delivery (last live/still birth of past 3 years) Almora Bageshwar Chamoli Champawat Dehradun Hardwar Nainital Pithoragarh Pouri Garhwal Rudraprayag Tehri Garhwal Udham Singh Nagar Uttarkashi
0.226 0.241 0.187 0.128 0.316 0.310
0.198 0.287 0.332 0.166 0.272 0.203 0.082
0.031 0.032 0.028 0.030 0.037 0.028
0.025 0.032 0.033 0.027 0.032 0.026 0.016
302 255 229 282 283 373
331 274 235 296 244 292 308
311 257 226 303 288 382
346 269 242 291 245 293 303
13.7 13.3 15.0 23.4 11.7
9.0
12.6 11.1
9.9 16.3 11.8 12.8 19.5
0.164 0.178 0.132 0.068 0.244 0.255
0.148 0.224 0.268 0.113 0.211 0.152 0.050
0.287 0.303 0.242 0.187 0.388 0.364
0.248 0.351 0.396 0.218 0.334 0.254 0.114
Sampling errors, Uttaranchal, 2002-04
District
Estimate (R)
Sampling error (SE)
Number of cases Relative Error (%)
95% Conf. Interval Unweighted Weighted R-1.96 SE R+1.96 SE
Safe Delivery (last live/still birth of past 3 years) Almora Bageshwar Chamoli Champawat Dehradun Hardwar Nainital Pithoragarh Pouri Garhwal Rudraprayag Tehri Garhwal Udham Singh Nagar Uttarkashi
0.332 0.407 0.245 0.259 0.369 0.340
0.340 0.352 0.430 0.230 0.379 0.375 0.101
0.036 0.035 0.030 0.037 0.039 0.029
0.033 0.034 0.035 0.030 0.035 0.031 0.018
302 255 229 282 283 373
331 274 235 296 244 292 308
310 257 227 303 287 382
346 269 241 291 245 294 304
10.8 8.6
12.2 14.3 10.6
8.5
9.7 9.7 8.1
13.0 9.2 8.3
17.8
0.262 0.337 0.185 0.185 0.292 0.285
0.275 0.284 0.362 0.172 0.311 0.314 0.066
0.402 0.476 0.304 0.332 0.445 0.396
0.405 0.419 0.498 0.289 0.447 0.436 0.136
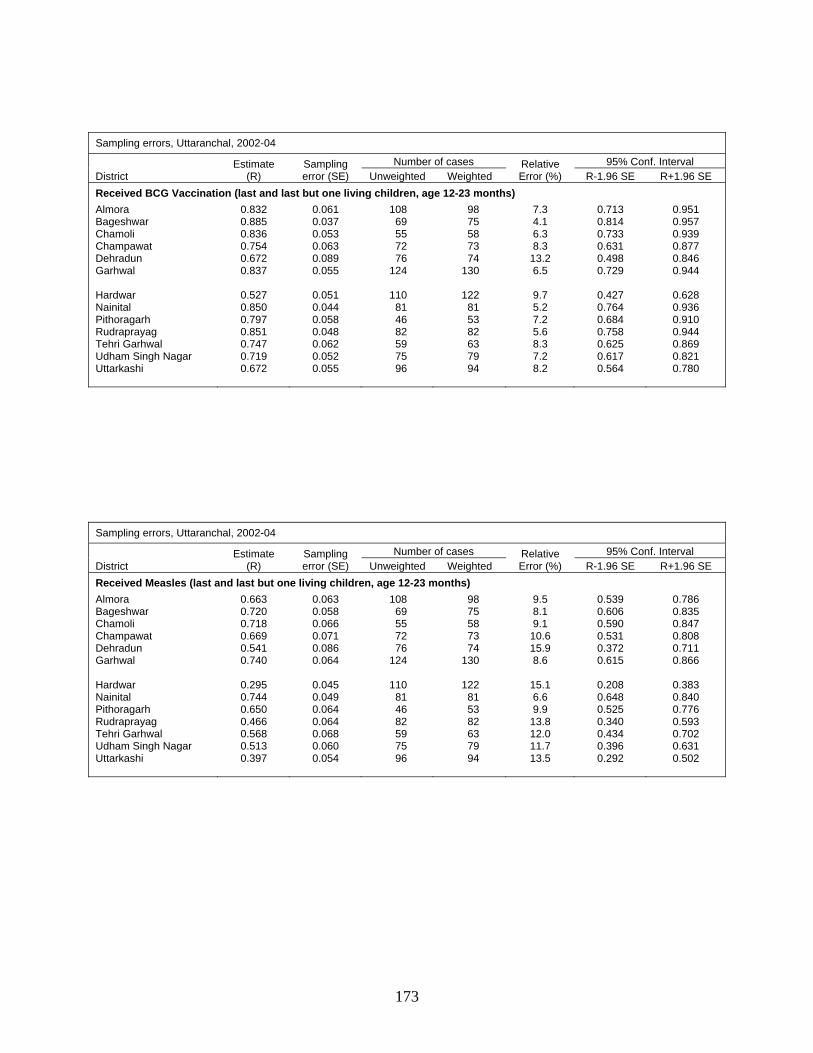
173
Sampling errors, Uttaranchal, 2002-04
District
Estimate (R)
Sampling error (SE)
Number of cases Relative Error (%)
95% Conf. Interval Unweighted Weighted R-1.96 SE R+1.96 SE
Received BCG Vaccination (last and last but one living children, age 12-23 months) Almora Bageshwar Chamoli Champawat Dehradun Garhwal Hardwar Nainital Pithoragarh Rudraprayag Tehri Garhwal Udham Singh Nagar Uttarkashi
0.832 0.885 0.836 0.754 0.672 0.837
0.527 0.850 0.797 0.851 0.747 0.719 0.672
0.061 0.037 0.053 0.063 0.089 0.055
0.051 0.044 0.058 0.048 0.062 0.052 0.055
108 69 55 72 76
124
110 81 46 82 59 75 96
98 75 58 73 74
130
122 81 53 82 63 79 94
7.3 4.1 6.3 8.3
13.2 6.5
9.7 5.2 7.2 5.6 8.3 7.2 8.2
0.713 0.814 0.733 0.631 0.498 0.729
0.427 0.764 0.684 0.758 0.625 0.617 0.564
0.951 0.957 0.939 0.877 0.846 0.944
0.628 0.936 0.910 0.944 0.869 0.821 0.780
Sampling errors, Uttaranchal, 2002-04
District
Estimate (R)
Sampling error (SE)
Number of cases Relative Error (%)
95% Conf. Interval Unweighted Weighted R-1.96 SE R+1.96 SE
Received Measles (last and last but one living children, age 12-23 months) Almora Bageshwar Chamoli Champawat Dehradun Garhwal Hardwar Nainital Pithoragarh Rudraprayag Tehri Garhwal Udham Singh Nagar Uttarkashi
0.663 0.720 0.718 0.669 0.541 0.740
0.295 0.744 0.650 0.466 0.568 0.513 0.397
0.063 0.058 0.066 0.071 0.086 0.064
0.045 0.049 0.064 0.064 0.068 0.060 0.054
108 69 55 72 76
124
110 81 46 82 59 75 96
98 75 58 73 74
130
122 81 53 82 63 79 94
9.5 8.1 9.1
10.6 15.9 8.6
15.1 6.6 9.9
13.8 12.0 11.7 13.5
0.539 0.606 0.590 0.531 0.372 0.615
0.208 0.648 0.525 0.340 0.434 0.396 0.292
0.786 0.835 0.847 0.808 0.711 0.866
0.383 0.840 0.776 0.593 0.702 0.631 0.502
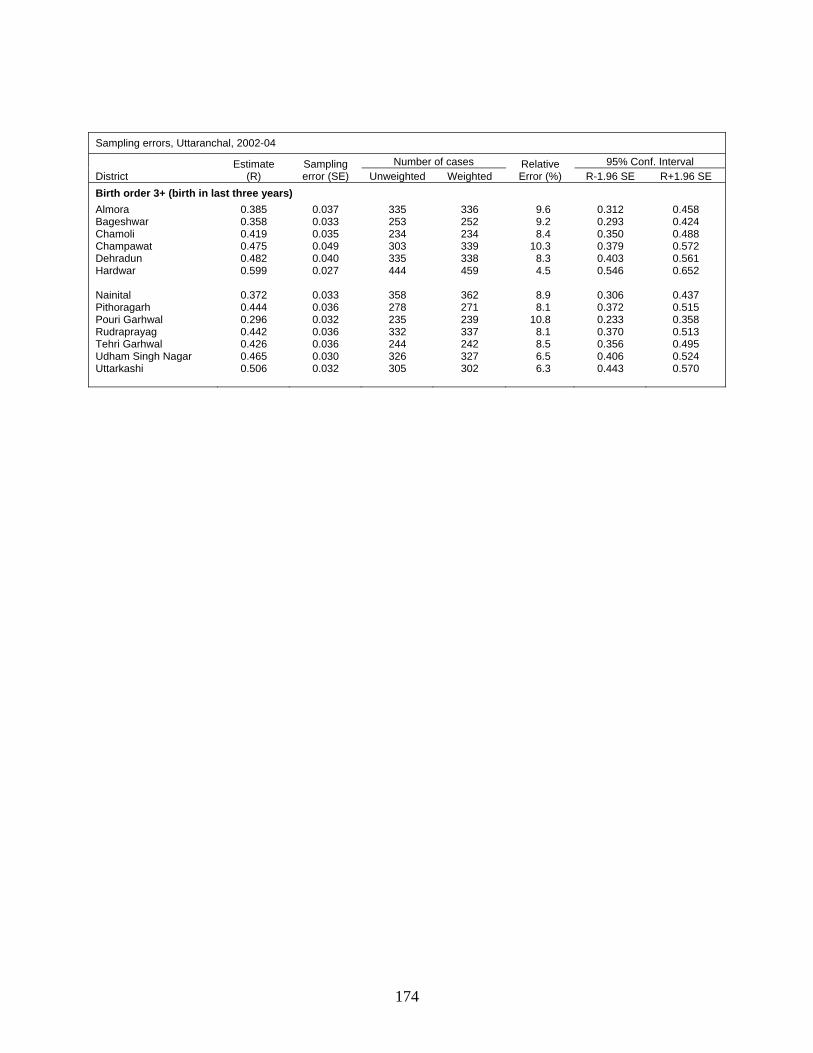
174
Sampling errors, Uttaranchal, 2002-04
District
Estimate (R)
Sampling error (SE)
Number of cases Relative Error (%)
95% Conf. Interval Unweighted Weighted R-1.96 SE R+1.96 SE
Birth order 3+ (birth in last three years) Almora Bageshwar Chamoli Champawat Dehradun Hardwar Nainital Pithoragarh Pouri Garhwal Rudraprayag Tehri Garhwal Udham Singh Nagar Uttarkashi
0.385 0.358 0.419 0.475 0.482 0.599
0.372 0.444 0.296 0.442 0.426 0.465 0.506
0.037 0.033 0.035 0.049 0.040 0.027
0.033 0.036 0.032 0.036 0.036 0.030 0.032
335 253 234 303 335 444
358 278 235 332 244 326 305
336 252 234 339 338 459
362 271 239 337 242 327 302
9.6 9.2 8.4
10.3 8.3 4.5
8.9 8.1
10.8 8.1 8.5 6.5 6.3
0.312 0.293 0.350 0.379 0.403 0.546
0.306 0.372 0.233 0.370 0.356 0.406 0.443
0.458 0.424 0.488 0.572 0.561 0.652
0.437 0.515 0.358 0.513 0.495 0.524 0.570
175
APPENDIX B
DLHS-RCH STAFF, UTTARANCHAL
Population Research Centre, Institute of Economic Growth, Delhi
Project Coordinators Project Officer
Prof. S.C. Gulati Prof. P.N. Mari Bhat Dr. Suresh Sharma
Ms. Raj Bala Singh Mr. Shujat Khan
Field Officer Mr. Shankar Kr. Shankar Mr. V.P. Singh
Team Supervisors
Mr. Amar Pal Singh Mr. Balvir Singh Mr. Kalam Khan Mr. Om Pal Singh
Ms. Chandni Kohli Ms. Neelam Rani
Field Editors
Mr. Satya Pal Singh Mr. Sukh Pal Mr. V.K. Sharma Mr. Veer Pal Singh Ms. Poonam Tomar
Health Investigators Mr. Manoj Kumar Mr. Javed Mr. Prem Raj Singh Mr. Praveen Sharma Mr. Aript Kumar Singh Mr. Amit Gupta
Mr. Sameer Sadan Mr. Devender Choudhary Mr. Vineyesh Kumar Sharma Mr. Pramod Singh Mr. Uttam Kumar
Interviewers Mr. Ashish Kr. Singh Mr. Ashok Kumar Mr. Ashwani Gupta Mr. Ayaz Ahmad Mr. Bhagwan Swarup Mr. Bheem Singh Mr. Dev Dutt Mr. Devesh Kumar Mr. Ishwar Chand Mr. Jagan Singh Mr. Kartik Kaushal Mr. Nitin Kumar
Ms. Harjeet Kaur Ms. Kusum Ms. Madhu Rani Ms. Mala Rani Ms. Mamta Verma Ms. Mintesh Rani Ms. Momina Khan Ms. Neelam Gautam Ms. Neelam Kohli Ms. Neeru Ms. Parveen Sharma Ms. Pawan Dai

176
Mr. Pramod Chauhan Mr. Prabhat Chauhan Mr. Raghu Raj Singh Mr. Ravindra Kumar Mr. Shiv Kr. Mishra Mr. Sohan Pal Singh Mr. Syed Asad Abbas Mr. Uday Pratap Singh Me. Uma Shankar Mr. Uttam Kumar Mr. Veer Pal Singh Ms. Asha Devi Ms. Anita Rastogi Ms. Anju Sharma Ms. Aliya Khan Ms. Hemlata
Ms. Rahila Khan Ms. Rama Choudhary Ms. Rekha Rani Ms. Rekha Rani Sharma Ms. Saba Khan Ms. Savita Ms. Seema Yasmin Ms. Shahanoor Ms. Shimla Rani Ms. Suman Verma Ms. Sunita Dubey Ms. Sunita John Ms. Tarannum Khan Ms. Tara Shishodiya Ms. Vimlesh
Household listing Supervisors Mr. Ajay Tripathi Mr. Arjun Prasad
Mr. Girish Chandra Joshi Mr. Rama Kant Shukla
Household Listers and Mappers Mr. Ambrish Kumar Mr. Amit Kumar Mr. Arun Mr. Brijendra Singh Mr. Chandra Pal Sharma Mr. Deen Dayal Mr. Ghanshyam Upadhyay Mr. Hari Ram Mr. Hemendra Kumar Upadhyay Mr. Jitender Raghav Mr. Kuldeep Singh Mr. Manjeet Mr. Neeraj Kumar Jain
Mr. Pankaj Kumar Mr. Rajeev Singh Mr. Rakesh Kumar Sharma Mr. Ravinder Mr. Sahab Singh Mr. Samim Ahmad Mr. Shatrughan Tiwari Mr. Sudhir Jha Mr. Trilok Bhandari Mr. Vinod Kumar Mr. Virendra Kumar Mr. Yogendra Tiwari
Office Editors Mr. Kr. Raghubansh Mani Singh Mr. Michael Jose
Ms. Sunita Ms. Swati Apan
Data Entry Operators Mr. Neeraj Kr. Pandey Mr. Rakesh Kumar Mr. S. Vinod Ms. Anita Bhardwaj
Ms. Ekta Gautam Ms. Gagandeep Kaur Ms. Parveen Kapoor Ms. Preeti Sharma
177
International Institute for Population Sciences, Mumbai
Project Coordinators Dr. F. Ram Dr. B. Paswan Dr. L. Ladu Singh
Senior Research Officers Mr. Rajiv Ranjan
Mr. K. C. Lakhara Mr. Nizamuddin Khan
Research Officers
Mr. M. Nagavara Prasad Mr. Akash N. Wankhede Mr. Uttam J Sonkamble Mr. Ashok Kumar Ms. Jigna Thacker Ms. Baishali Goswami Ms. Sancheeta Ghosh Ms. Kirti Mishra Ms. Sucharita Pujari Ms. Preeti Chauhan Mrs. Santhi N.S. Ms. Sanjeeta Gupta Ms. Reshmi R.S. Ms. Rinki Shah Mr. Arnendu Kumar Jha Mr. Atanu Ghosh Mr. Manas Pradhan
Mr. Suhas Narkhede Dr. Pramod Kumar Gupta Mr. Bipul Hazarika Dr. Manoj Alagarajan Dr. Kalyan Saha Dr. N Anbazhaham Dr. Saithya Susaman Mr. Manoj Kumar Mr. Dibya L Mohanta Mr. Mohan Tiwari Mr. Battala Madhusudana Mr. Bardanwala S.I. Mr. Jiten Kumar Singh Mr. Manoranjan Barik Mr. Laxmi Prasad Sonwani Mr. Nimakwala M. I.
Accounts and Administrative staff
Mr. Sunil Adavede (Sr. Accountant) Mr. Jeba Kumar (Data Entry Operator) Ms. Pratima P. Zore (Data Entry Operator) Ms. Preeti S. Kharat (Data Entry Operator) Ms. Sayali Shivalkar (Data Entry Operator)
Mrs. Seema V. Zagade (Office Assistant) Mrs. Deepa J. Nair (Office Assistant) Mr. Chandra D. Singh (Office Boy) Mr. Ravindra P. Gawade (Office Boy) Mr. Sanjay P. Kadam (Office Boy)
178
LIST OF CONTRIBUTORS
Dr. S.C. Gulati, Professor and Head, Population Research Centre, Institute of Economic Growth, Delhi University Enclave, Delhi – 110 007. Dr. P.N. Mari Bhat, Professor, Population Research Centre, Institute of Economic Growth, Delhi University Enclave, Delhi – 110 007. Dr. Suresh Sharma, Assistant Professor, Population Research Centre, Institute of Economic Growth, Delhi University Enclave, Delhi – 110 007. Dr. F. Ram, Professor and Head, Department of Fertility Studies, International Institute for Population Sciences, Govandi Station Road, Deonar, Mumbai – 400 088. Dr. B. Paswan, Reader, Department of Population Policies and Programmes, International Institute for Population Sciences, Govandi Station Road, Deonar, Mumbai – 400 088. Dr. L. Ladu Singh, Professor and Head, Department of Mathematical Demography and Statistics, International Institute for Population Sciences, Govandi Station Road, Deonar, Mumbai – 400 088. Mr. Rajiv Ranjan, Senior Research Officer, DLHS-RCH, International Institute for Population Sciences, Govandi Station Road, Deonar, Mumbai – 400 088. Mr. Ashok Kumar, Research Officer, DLHS-RCH, International Institute for Population Sciences, Govandi Station Road, Deonar, Mumbai – 400 088.

179
Appendix – C