Uttarakhand Open University, Haldwani
452
School of Management Studies and Commerce Research Methodology MS 110 Uttarakhand Open University, Haldwani Block I Introduction to Research Methodology Block II Methods of Data Collection
-
Upload
khangminh22 -
Category
Documents
-
view
0 -
download
0
Transcript of Uttarakhand Open University, Haldwani

School of Management Studies and Commerce
Research Methodology
MS 110
Uttarakhand Open University, Haldwani
Block I Introduction to Research Methodology
Block II Methods of Data Collection

MS 110
Research Methodology
Block – I
Block Title- Introduction to Research Methodology
Block – II
Block Title- Methods of Data Collection
UTTARAKHAND OPEN UNIVERSITY
SCHOOL OF MANAGEMENT STUDIES AND COMMERCE
University Road, Teenpani By pass, Behind Transport Nagar,
Haldwani- 263 139
Phone No: (05946)-261122, 261123, 286055
Toll Free No.: 1800 180 4025
Fax No.: (05946)-264232, e-mail: [email protected], [email protected]
Website:http://www.uou.ac.in
Blog Address: www.blogsomcuou.wordpress.com

Board of Studies
Professor Om Prakash Singh Negi
Vice-Chancellor,
Uttarakhand Open University
Haldwani
Professor R.C. Mishra (Convener)
Director, School of Management Studies and
Commerce, Uttarakhand Open University,
Haldwani
Professor Neeti Agarwal
Department of Management Studies
IGNOU, New Delhi
Professor Ashish Kumar Srivastava
Deen Dayal Upadhyaya,
Gorakhpur University, Gorakhpur
Dr. Gajendra Singh,
Department of Management Studies,
Doon University, Dehradun
Dr. Manjari Agarwal
Department of Management Studies
Uttarakhand Open University, Haldwani
Dr. Gagan Singh
Department of Commerce
Uttarakhand Open University, Haldwani
Dr. Sumit Prasad
Department of Management Studies
Uttarakhand Open University, Haldwani
Programme Coordinator
Dr. Manjari Agarwal
Assistant Professor,
Department of Management Studies
Uttarakhand Open University, Haldwani
Units Written by Unit No.
Dr. Hitesh Kumar Pant
Assistant Professor
Department of Management Studies
Kumaun University Campus Bhimtal- 263136
Bhimtal,Nainital
Dr. Vikas Deep
Assistant Professor (Management)
University School of Business Studies
Punjabi University, Talwandi Sabo -151302
Punjab
Professor S. P. Singh,
Former Professor
Faculty of Management Studies (FMS)
Gurukula Kangri Vishwavidyalaya, Haridwar
Dr. Namita Soni Sugandhi
Professor
Mahakal Institute of Management, Ujjain
1,2,6,8,9,11,
12 &13
3,4 &5
7
10

Cover Design
Cover Page Image & Design Dr. Manjari Agarwal
Cover Page Image
License: Creative Commons 3 - CC BY-
SA 3.0
Attribution: Alpha Stock Images -
http://alphastockimages.com/
Original Image:
http://www.picpedia.org/clipboard/researc
h.html/ last accessed 8/4/2020 5:00 p.m.
Original Author: Nick Youngson -
http://www.nyphotographic.com/
ISBN : 978-93-85740-16-9
Copyright : Uttarakhand Open University
Edition : 2020 (Restricted Circulation)
(Pre-Publication Copy; Subject to Changes before Final Version)
Published by : Uttarakhand Open University, Haldwani, Nainital – 263139
Printed at : (Name of the Printer)
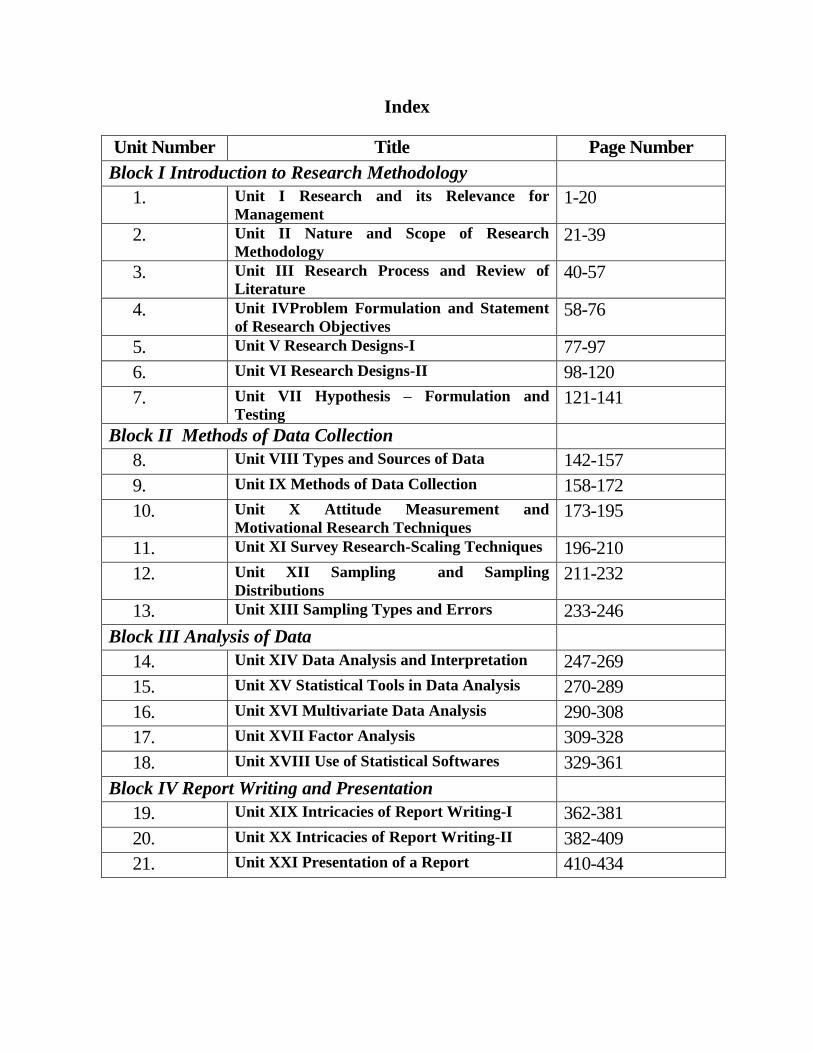
Course Contents Course Name: Research Methodology Course Code- MS 110
Course Objective: The objective of the course is to provide students the fundamentals of
research is business situation and its application. Also this course acquaints the students with
latest tools and techniques of analysis and its presentation.
Block I Introduction to Research Methodology Unit I Research and its Relevance for Management
Unit II Nature and Scope of Research Methodology
Unit III Research Process and Review of Literature
Unit IVProblem Formulation and Statement of Research Objectives
Unit V Research Designs-I
Unit VI Research Designs-II
Unit VII Hypothesis – Formulation and Testing
Block II Methods of Data Collection Unit VIII Types and Sources of Data
Unit IX Methods of Data Collection
Unit X Attitude Measurement and Motivational Research Techniques
Unit XI Survey Research-Scaling Techniques
Unit XII Sampling and Sampling Distributions
Unit XIII Sampling Types and Errors
Block III- Analysis of Data Unit XIV Data Analysis and Interpretation
Unit XV Statistical Tools in Data Analysis
Unit XVI Multivariate Data Analysis
Unit XVII Factor Analysis
Unit XVIII Use of Statistical Softwares
Block IV -Report Writing and Presentation Unit XIX Intricacies of Report Writing-I
Unit XX Intricacies of Report Writing-II
Unit XXI Presentation of a Report
Suggested Readings- 1. Donald R.Cooper and Ramcis S.Schindler, Business Research Methods, Tata McGraw
Hill Publishing CompanyLimited, New Delhi, 2000.
2. C.R.Kothari Research Methodology, Wishva Prakashan, New Delhi, 2001.
3. Uma Sekaran, Research Methods for Business, John Wiley and Sons Inc., New York,
2000.
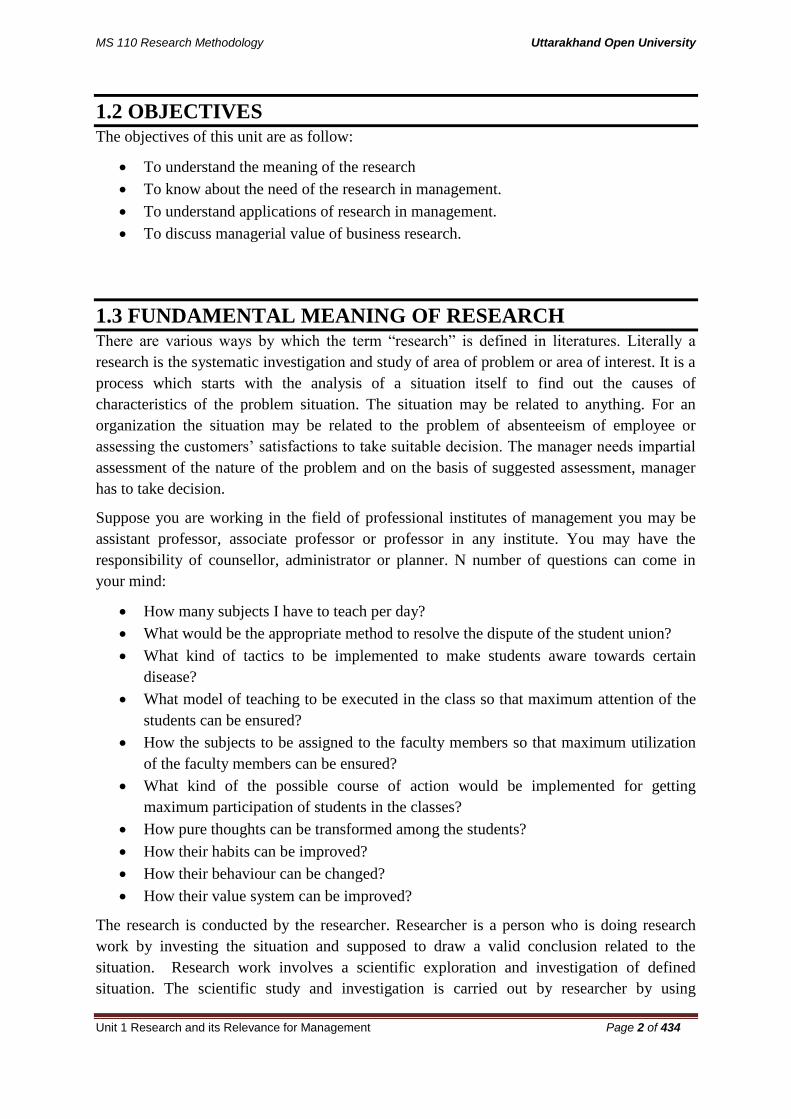
Index
Unit Number Title Page Number
Block I Introduction to Research Methodology
1. Unit I Research and its Relevance for
Management 1-20
2. Unit II Nature and Scope of Research
Methodology 21-39
3. Unit III Research Process and Review of
Literature 40-57
4. Unit IVProblem Formulation and Statement
of Research Objectives 58-76
5. Unit V Research Designs-I 77-97
6. Unit VI Research Designs-II 98-120
7. Unit VII Hypothesis – Formulation and
Testing 121-141
Block II Methods of Data Collection
8. Unit VIII Types and Sources of Data 142-157
9. Unit IX Methods of Data Collection 158-172
10. Unit X Attitude Measurement and
Motivational Research Techniques 173-195
11. Unit XI Survey Research-Scaling Techniques 196-210
12. Unit XII Sampling and Sampling
Distributions 211-232
13. Unit XIII Sampling Types and Errors 233-246
Block III Analysis of Data
14. Unit XIV Data Analysis and Interpretation 247-269
15. Unit XV Statistical Tools in Data Analysis 270-289
16. Unit XVI Multivariate Data Analysis 290-308
17. Unit XVII Factor Analysis 309-328
18. Unit XVIII Use of Statistical Softwares 329-361
Block IV Report Writing and Presentation
19. Unit XIX Intricacies of Report Writing-I 362-381
20. Unit XX Intricacies of Report Writing-II 382-409
21. Unit XXI Presentation of a Report 410-434

Block I
Introduction to Research Methodology

MS 110 Research Methodology Uttarakhand Open University
Unit 1 Research and its Relevance for Management Page 1 of 434
UNIT 1 RESEARCH AND IT’S RELEVANCE FOR
MANAGEMENT
1.1 Introduction
1.2 Objectives
1.3 Fundamental Meaning of Research
1.4 Meaning of Research Philosophy
1.5 Business Research Concept
1.6 Meaning and Purpose of Research
1.7 A Brief about Classification of Research
1.8 Need of Research Management
1.9 Managerial value of Business Research
1.10 Types of Research
1.11 Summary
1.12 Glossary
1.13 Answer to Check Your Progress
1.14 Reference/ Bibliography
1.15 Suggested Readings
1.16 Terminal & Model Questions
1.1 INTRODUCTION Research is the systematic manner of way of questioning. It’s the way of thinking what you
want to do. It does mean it’s the way of questioning what you want to do. We can say that
research is the systematic investigation to find out answers of your problems. Research is
undertaken in most of the professions. It has the wider scope. As far as management is
concerned research can be applied as service provider, as a manager/ planner, as a service
provider and as a professional. Research can be applied in any functional area of management
like marketing, Human Resource Management and Financial management etc. To conduct a
study in management there is always need of understanding the concept of 4Ps they are
respectively people, programme, problem and phenomenon. The first P stands for study
population and last three Ps indicate subject areas. In most of the studies in management there
is always a combination of more than two Ps.
MS 110 Research Methodology Uttarakhand Open University
Unit 1 Research and its Relevance for Management Page 2 of 434
1.2 OBJECTIVES The objectives of this unit are as follow:
To understand the meaning of the research
To know about the need of the research in management.
To understand applications of research in management.
To discuss managerial value of business research.
1.3 FUNDAMENTAL MEANING OF RESEARCH There are various ways by which the term “research” is defined in literatures. Literally a
research is the systematic investigation and study of area of problem or area of interest. It is a
process which starts with the analysis of a situation itself to find out the causes of
characteristics of the problem situation. The situation may be related to anything. For an
organization the situation may be related to the problem of absenteeism of employee or
assessing the customers’ satisfactions to take suitable decision. The manager needs impartial
assessment of the nature of the problem and on the basis of suggested assessment, manager
has to take decision.
Suppose you are working in the field of professional institutes of management you may be
assistant professor, associate professor or professor in any institute. You may have the
responsibility of counsellor, administrator or planner. N number of questions can come in
your mind:
How many subjects I have to teach per day?
What would be the appropriate method to resolve the dispute of the student union?
What kind of tactics to be implemented to make students aware towards certain
disease?
What model of teaching to be executed in the class so that maximum attention of the
students can be ensured?
How the subjects to be assigned to the faculty members so that maximum utilization
of the faculty members can be ensured?
What kind of the possible course of action would be implemented for getting
maximum participation of students in the classes?
How pure thoughts can be transformed among the students?
How their habits can be improved?
How their behaviour can be changed?
How their value system can be improved?
The research is conducted by the researcher. Researcher is a person who is doing research
work by investing the situation and supposed to draw a valid conclusion related to the
situation. Research work involves a scientific exploration and investigation of defined
situation. The scientific study and investigation is carried out by researcher by using

MS 110 Research Methodology Uttarakhand Open University
Unit 1 Research and its Relevance for Management Page 3 of 434
standardized tools and techniques as provided in the subject matter of “Research
Methodology”.
Research in common parlance refers to a search for knowledge. One can also define research
as a scientific and systematic search for pertinent information on a specific topic. In fact,
research is an art of scientific investigation. The Advanced Learner’s Dictionary of Current
English lays down the meaning of research as “a careful investigation or inquiry especially
through search for new facts in any branch of knowledge.” Redman and Mory define
research as a “systematized effort to gain new knowledge.”
Now you have understood the meaning of research. As the word “research” has been defined
from various perspectives it would be useful to interpret various definitions of research to
understand its characteristics from different perspectives. Some definitions of research are as
follow-
Research is a diligent and systematic inquiry or investigation into a subject in order
to discover facts or principles.
Research could also be defined as the scientific investigation of phenomena which
includes collection, analysis, interpretation and presentation of data according to
defined objectives to draw conclusions.
Research is a structured enquiry that utilizes acceptable scientific methodology to
solve problems and create new knowledge that is generally applicable.
1.4 MEANING OF RESEARCH PHILOSOPH The word research methodology is used to describe set of tools and techniques used in
research method(s). Methodology is a complete science of research method to be followed.
A research philosophy is a belief about the way in which data about a phenomenon should be
gathered, analysed and used. There are two terms that encompasses various philosophies of
research approach. These are
Epistemology: It deals with “what is known to be true”?
Doxology: It deals with “what is believed to be true”?
Two major research philosophies have been identified in the western tradition namely
positivist (sometimes called scientific) and interpretivist (also known as anti -positivist)
Positivism: Positivists believe that reality is stable and can be observed and described
from an objective viewpoint (Levin, 1988), i.e. without interfering with the
phenomena being studied. They contend that phenomena should be isolated and that
observations should be repeatable. This often involves manipulation of reality with
variations in only a single independent variable so as to identify regularities in, and to
form relationships between, some of the constituent elements of the social world.

MS 110 Research Methodology Uttarakhand Open University
Unit 1 Research and its Relevance for Management Page 4 of 434
Predictions can be made on the basis of the previously observed and explained
realities and their inter-relationships. "Positivism has a long and rich historical
tradition. It is so embedded in our society that knowledge claims not grounded in
positivist thought are simply dismissed as a scientific and therefore invalid"
(Hirschheim, 1985, p.33). This view is indirectly supported by Alavi and Carlson
(1992) who, in a review of 902 IS research articles; found that all the empirical
studies were positivist in approach. Positivism has also had a particularly successful
association with the physical and natural sciences.
There has, however, been much debate on the issue of whether or not this positivist
paradigm is entirely suitable for the social sciences (Hirschheim, 1985), many authors
calling for a more pluralistic attitude towards IS research methodologies (see e.g.
Kuhn, 1970; Bjørn-Andersen, 1985; Remenyi and Williams, 1996). While we shall
not elaborate on this debate further, it is germane to our study since it is also the case
that Information Systems, dealing as it does with the interaction of people and
technology, is considered to be of the social sciences rather than the physical sciences
(Hirschheim, 1985). Indeed, some of the difficulties experienced in IS research, such
as the apparent inconsistency of results, may be attributed to the inappropriateness of
the positivist paradigm for the domain. Likewise, some variables or constituent parts
of reality might have been previously thought unmeasurable under the positivist
paradigm - and hence went unresearched, (after Galliers, 1991).
Interpretivism: Interpretivists contend that only through the subjective interpretation
of and intervention in reality can that reality be fully understood. The study of
phenomena in their natural environment is key-factor to the interpretivist philosophy,
together with the acknowledgement that scientists cannot avoid affecting those
phenomena they study. They admit that there may be many interpretations of reality,
but maintain that these interpretations are in themselves a part of the scientific
knowledge they are pursuing. Interpretivism has a tradition that is no less glorious
than that of positivism, nor is it shorter Some perspectives which are associated with
research methodology are discussed in next section.
The word “research” refers to search of knowledge; a search for truth, a prolonged,
intensive and purposeful search. The goal of all research is progress. Research is largely a
matter of raising questions and then trying to find out the answer or solution to a problem.
RUSK writes,” research is point of view, an attitude of inquiry or a frame of mind. It
comprises defining and redefining the problems, formulating hypothesis or suggesting
solutions; collecting, organizing and evaluating data; making deductions and testing the
conclusions to determine whether they fit the formulated hypothesis”. Crawford writes,
“Research is a systematic and refined technique of thinking, employing specialized tools,
instruments and procedure in order to obtain a more adequate solution of a problem”.
Research is thus a systematic quest undiscovered truth.

MS 110 Research Methodology Uttarakhand Open University
Unit 1 Research and its Relevance for Management Page 5 of 434
Significance of Research
Research assumes significance in the context of the following:
(a) It enables to take decisions based on reliable and factual data.
(b) It is logical and objective.
(c) It foresee the implications of particular phenomenon.
(d) It promotes social welfare and scientific development (temper).
(e) It facilitates prediction and helps in planning.
(f) It enables the researchers to be systematic and organized.
Characteristics of Research
Research has even discrete characteristics which taken together, comprise the particular
approach to probing for truth which we call research. They are:
(a) Research begins with the question in the mind of the researcher.
(b) Research demands the identification of the problem stated in clear unambiguous
terms, which a researcher seeks to solve.
(c) Research requires a definite plan (quantification).
(d) Research deals with the main problem through appropriate sub-problems.
(e) Research seeks direction through appropriate hypothesis.
(f) Research deals with fact and their meaning (interpretation).
(g) Research is a cyclic process.
Tools of Research
The resources available to expedite the means by which a researcher endeavors to accomplish
the research objectives and commonly grouped into five categories. These are called as tool
of research. They are:
(a) Information sources
(b) Statistical tools
(c) Computers
(d) Measurement techniques (quantification)
(e) Languages

MS 110 Research Methodology Uttarakhand Open University
Unit 1 Research and its Relevance for Management Page 6 of 434
1.5 BUSINESS RESEARCH CONCEPT Research began with a question what researchers come across of pursuing a certain thing. It is
a documented text work. It means structured study of a topic based on borrowed materials
with proper acknowledgement and consultation in the key part of the paper.
By the way of research, one can innovate or discover a certain thing innovate is a Latin word.
Innovation is the new way of introducing something; whereas to discover is to be the first to
find out something unknown.
Management research broadly falls into the category of social science. Other different types
of research are under the purview of physical science research. Management, statistics,
commerce, economics, psychology etc. are the social science subjects, as here the study
reveals the need of the society based on certain trends.
It is important to begin with the understanding of research and its methodology. With
questions like what is research? What is the importance of research? What are the meaning
and benefits of research methodology? The study explains scientific methods and its basic
postulates, qualities of good research, steps in conducting a research, ethics involved in
research and types of research and research design.
Management research may be fundamental in nature, crucial to the development of a new
concept on any particular area. Here, we can study contradict, modify or alter for the
betterment of existing theories as well as practices.
For example, logistics has its focus on material handing stocks and movements in one part of
the supply chain or maximum to the movement from supplier to customer. Its aim is to
maximize cost and improve customer service for one actor in the chain. Supply chain is the
new concept of the logistics and has a broader view and focuses on the total value chain (say,
from seed to cotton, cotton to yarn ,yarn to fabrics, fabrics to ready to use products, ready to
use products to customer) and tries to optimize the total value added by the chain.
Here to be noted that there are also certain other disciplines of research where we can simply
develop ant theory or where we cannot put our contribution into the development of certain
basic concepts.
Research unless it is understood in its right spirit cannot be taken into account with success.
Research then becomes more of a passion to the researchers then just a mere source of career
growth.
It is observed that most of us are interested in research to fulfil our career progress. In this
manner, certain researches are carried out in a routine way. The research should have the
natural interest in work. A researcher is one who performs research, the search for the
knowledge sincerely and seriously or in general any systematic investigation to establish
facts.

MS 110 Research Methodology Uttarakhand Open University
Unit 1 Research and its Relevance for Management Page 7 of 434
1.6 MEANING AND PURPOSE OF RESEARCH The most quoted definition of paradigm is given by Thomas Kuhn's (1962, 1970) concept in
The Nature of Science Revolution. It is defined as the underlying assumptions and
intellectual structure upon which research and development in a field of inquiry is based.
According to Patton (1990) a paradigm is a world view, a general perspective, a way of
breaking down the complexity of the real world.
Paradigm is also considered as an interpretative framework, which is guided by "a set of
beliefs and feelings about the world and how it should be understood and studied." (Guba,
1990). Denzin and Lincoln (2001) listed three categories of those beliefs:
i. Ontology: In general, ontology refers to the study or concern about what kinds of
things exist within society.
ii. Epistemology: Epistemology deals with the issue of knowledge, and specifically,
who can be a ‘knower’. It describes the relationship between the inquirer and the
known. It is defined Gall, Borg, & Gall(1996) as the branch of philosophy that
studies the nature of knowledge and the process by which knowledge is acquired
and validated
iii. Methodology: It is concerned with “how do we know the world, or gain
knowledge of it”? Methodology is a series of choices that describes followings
Choices about what information and data to gather
Choices about how to analyze the information and data that you gather
Other methodological choices
When challenging the assumptions underlying positivism, Lincoln and Guba (2000) also
identified two more categories that will distinguish different paradigms, i.e. beliefs in
causality and oxiology. The assumptions of causality assert the position of the nature and
possibility of causal relationship; oxiology deals with the issues about value. Specific
assumptions about research include the role of value in research, how to avoid value from
influencing research, and how best to use research products (Baptiste, 2000).
Dill and Romiszowski (1997) stated the functions of paradigms as follows:
Define how the world works, how knowledge is extracted from this world, and
how one is to think, write, and talk about this knowledge
Define the types of questions to be asked and the methodologies to be used in
answering
Decide what is published and what is not published
Structure the world of the academic worker
Provide its meaning and its significance

MS 110 Research Methodology Uttarakhand Open University
Unit 1 Research and its Relevance for Management Page 8 of 434
Research has been defined in various ways by different authors. Like L.V Redman and
A.V.H Mory in their books ‘the Romance of Research’ explain research as “systematized
effort to gain new knowledge”.
D. Slesinger and M. Stephenson in ‘the Encyclopedia of Social Sciences’ describe research as
“management of things, concepts or symbols for the purpose of generalizing to enlarge,
correct and verify the knowledge, whether that knowledge aids in construction of theory in
the practice of an art”.
Research is an innovative contribution to existing basket of knowledge, making for its
improvement. It is the hunt of truth with the help of study, finding observation and
comparison experiment.
1.7 A BRIEF ABOUT CLASSIFICATION OF RESEARCH As there are many ways of classifying research. However, studying the various characteristics
of the different types of research helps us to identify and examine the similarities and
differences. Research can be classified according to the:
Purpose of the research – The reason why it was conducted.
Process of the research – The way in which the data were collected and analysed.
Logic of the research – Whether the research logic moves from the general to the
specific or vice versa.
Outcome of the research – Whether the expected outcome is the solution to a
particular problem or a more general contribution to knowledge. For example, the
aim of your research project might be to describe a particular business activity
(purpose) .
Types of Research Basis of Classification
Exploratory, descriptive, analytical
or Predictive Research
Purpose of the Research
Quantitative or Qualitative Research
Process of the Research
Applied or Basic research
Outcome of the Research
Deductive or Inductive research
Logic of the Research
MS 110 Research Methodology Uttarakhand Open University
Unit 1 Research and its Relevance for Management Page 9 of 434
1.8 NEED OF RESEARCH MANAGEMENT With the help of these headings we can define significance of research management under:
1) Nature of Research
2) Motivating factors of Research in Management
3) Difficulties of Research in Management
(1) Nature of research
In this regard a detailed discussion has already been made in above sections.
(2) Motivating factors of research management
a) Curiosity about unknown
Curiosity is a natural instinct in the human being. We always try to investigate about the
facts which are unknown to us and it leads to a research.
b) New product development
Every business organization strives for new product development or modification of
their existing products. This also resulted into result program me.
c) Desire to understand the cause and effect of the problem
More and more research is undertaken to dispel doubts and uncertainties which result
from inadequate conceptions of underlying factor shaping business processes. People
want not only an account of event but want to know how they happened.
d) Appearance of novel and unanticipated situations
Man is often faced with many acute and difficult social problems. An ordinary person
reacts emotionally to these, but scientist sets down dispassionately to find out there cause
and thus evolves a lasting solution to such intricate problems. In quite a large number of
cases such problems have inspired the scientist to go into their detail and study the basic
factors causing these problems.
e) Desire to discover and test old scientific procedure as an efficient way to gain
useful and fundamental knowledge
Such research is not in fact a research in social phenomena, but a research in techniques
or methods used in research. A number of such researches have been made to evolve
better and most refined techniques for dealing with problems. Later on there has been

MS 110 Research Methodology Uttarakhand Open University
Unit 1 Research and its Relevance for Management Page 10 of 434
growing emphasis upon the use of quantitative or statistical methods in the research in
order to make it more definite and mathematically precise.
f) Completion of degree
Management students undertake research for the completion of degree.
(3) Difficulties of Research in Management
a) Complexity of data
Human behavior is influenced by so many factors, physical, social, temperamental,
psychological that observes is simply confused at the complexity of data. It is difficult
for him to locate any order, sequence or law in such a confused any complex behavior.
b) Unpredictability
One of the characteristics of science is its predictability. In case of physical science, a
remarkable degree of predictability has been achieved. The laws of physical science are
true for all times under given circumstances. But it is not so in case of social phenomena.
Social behavior is sufficiently irregular and unpredictable. Personal moods and whims
dominate the actions of human beings that we can never be quite sure what they would
do under certain given circumstances.
c) Subjectivity and intangibility
Social phenomena are known only symbolically through words representing such
phenomena as traditions customs attitudes, values and the whole realm of so called
subjective world. Because of this lack of objectivity, the verification may visualize
abstract and subjective things like custom, attitude etc. in the same manner.
d) In capability of research
Results of the research are very much depends on the ability of the researcher. If result is
capable of being deal through empirical methods, it also affects the quality of the result.
e) Heterogeneity
It is generally argued that no two persons are alike and therefore the conclusions are
drawn from study of anyone case may not be applicable to other cases.
In this section we shall try to explain the practical uses of research in business and
commerce. Business environment needs careful study of the situation for taking
decision. Research can help in the effort to investigate a specific problem encountered in
the business and commerce to take rational decision for solving the problems. In other
area of study research could be used to update the existing knowledge of the subject
matter. Research is important in each and every field. Research helps us to know that

MS 110 Research Methodology Uttarakhand Open University
Unit 1 Research and its Relevance for Management Page 11 of 434
how our business is running and it also helps us to know that what all changes we have
to do in our business to earn more profit.
We can summarize the need of research as follow.
To improve quality of life by updating the existing knowledge of the area of
study
To help manager to take rational and good decision
Effective business plan for product launching
Getting feedback from customers for marketing planning
Research may be used in basic area of knowledge or in applied area of, depending upon
the purpose of the research. In basic area of study a research is oriented towards search
and validation of new concepts and theories to update the related knowledge. In case of
applied area research is used to solve specific business problem.
1.9 MANAGERIAL VALUE OF BUSINESS RESEARCH Research help managers determine if problems exist determine the root cause of those
problems; applied to scientifically proven solutions to commonly occurring problems and
finally determine the efficiency or effectiveness of the applied decisions and solutions.
Research inheritantly involves collecting data for a problem, analyzing the data scientifically
from being an art. Although management will always depend on the skill and experience of
the manager, using research based scientific methods makes it less so and makes decision
making more repeatable.
Whenever managers are faced with the responsibility of making decisions, they fall back on
their prior experience in similar situations or an advice from peers and seniors. Another good
source that can help mangers gets this advice or opportunity to learn more from others
experience in similar situations is published research. By using the results from applied
scientific research in a problem domain, a manger can take important and strategic decisions
with the satisfaction of knowing that the other people have done this earlier and it has been
proven to be scientifically correct. Similarly, reading published research and case studies,
managers can learn about, common mistakes and pitfalls that they would otherwise have had
to learn the hard way through making mistakes and gaining experience.
A good example of the above is in area of human resource management. Most of the large
companies now-a day’s employ well research models of measuring employee morale and job
satisfaction. This help companies get data backed information about what their employees
need, what is good about the companied personal policies and what is lacking. These methods

MS 110 Research Methodology Uttarakhand Open University
Unit 1 Research and its Relevance for Management Page 12 of 434
of judging employee morale and evaluating management effectiveness are well researched
and have been applied over again across the globe.
Another famous example of applied research is in the manufacturing industry. Toyota, the
famous Japanese car manufacturer, gave the world a well-researched model for managing the
manufacturing process called “Lean”. Toyota used data-backed metrics to reduce waste and
continuously improve the production flow. Later on this model was picked up and applied not
just by other car manufacturers across the world but by order completely unrelated industries,
such as the software industry.
“Lean”, however, also provides a good example of how research cannot be assumed to be a
silver bullet to all problems. The application of the lean method of management was found to
be a spectacular failure when applied to the London Heathrow Terminal.
This unit describes the meaning, concept and components of research. It covers the purpose
of research proposal along with the process of research. By developing the research questions
learners can be correlated answers of their questions into different types of state of natures.
Following diagram is being provided for your reference. The important considerations of the
diagram are as below:
Management Dilemma
Management Question
Research Question
Investigative Question
Measurement Question
Management Decision

MS 110 Research Methodology Uttarakhand Open University
Unit 1 Research and its Relevance for Management Page 13 of 434
Check Your Progress-A
Choose the correct alternative.
1. All Research process starts with;
a) Hypothesis
b) Experiments of test hypothesis
c) Observation
d) All of these
2. Which of the following is NOT the characteristic of a research?
a) Research is systematic.
b) Research is not passive.
c) Research is not a process.
d) Research is problem oriented.
3. Which of the following statement is correct?
a) Discoveries are researches
b) Researches lead to discovery
c) Invention and Research are related
d) None of the above
4. One of the following is not a quality of researcher:
a) Keenness in enquiry
b) She/ He must be of alert mind
c) His/ Her assertion to outstrip the evidence
d) Unison with that of which s/he is in search
5. Which of the following options are the main tasks of research in modern society?
a) to discover new things
b) to keep pace with the advancement in knowledge
c) to systematically examine and critically analyse the investigations/sources with
objectivity
d) All of the above

MS 110 Research Methodology Uttarakhand Open University
Unit 1 Research and its Relevance for Management Page 14 of 434
1.10 TYPES OF RESEARCH A brief categorization and detailed explanation of types of research with suitable examples is
being provided following manner:
Descriptive vs. Analytical: Descriptive research includes surveys and fact-finding enquiries
of different kinds. The major purpose of descriptive research is description of the state of
affairs as it exists at present. In social science and business research we quite often use the
term Ex post facto research for descriptive research studies. The main characteristic of this
method is that the researcher has no control over the variables; he can only report what has
happened or what is happening. Most ex post facto research projects are used for descriptive
studies in which the researcher seeks to measure such items as, for example, frequency of
shopping, preferences of people, or similar data. Ex post facto studies also include attempts
by researchers to discover causes even when they cannot control the variables. The methods
of research utilized in descriptive research are survey methods of all kinds, including
comparative and correlational methods. In analytical research, on the other hand, the
researcher has to use facts or information already available, and analyze these to make a
critical evaluation of the material.
(ii) Applied vs. Fundamental: Research can either be applied (or action) research or
fundamental (to basic or pure) research. Applied research aims at finding a solution for an
immediate problem facing a society or an industrial/business organisation, whereas
fundamental research is mainly concerned with generalisations and with the formulation of a
theory. Research concerning some natural phenomenon or relating to pure mathematics are
examples of fundamental research. Similarly, research studies, concerning human behaviour
carried on with a view to make generalisations about human behaviour, are also examples of
fundamental research, but research aimed at certain conclusions facing a concrete social or
business problem is an example of applied research. Thus, the central aim of applied research
is to discover a solution for some pressing practical problem, whereas basic research is
directed towards finding information that has a broad base of applications and thus, adds to
the already existing organized body of scientific knowledge.
(iii) Quantitative vs. Qualitative: Quantitative research is based on the measurement of
quantity or amount. It is applicable to phenomena that can be expressed in terms of quantity.
Qualitative research, on the other hand, is concerned with qualitative phenomenon, i.e.,
phenomena relating to or involving quality or kind. For instance, when we are interested in
investigating the reasons for human behaviour (i.e., why people think or do certain things),
we quite often talk of ‘Motivation Research’, an important type of qualitative research. This
type of research aims at discovering the underlying motives and desires, using in depth

MS 110 Research Methodology Uttarakhand Open University
Unit 1 Research and its Relevance for Management Page 15 of 434
interviews for the purpose. Attitude or opinion research i.e., research designed to find out
how people feel or what they think about a particular subject or institution is also qualitative
research. Qualitative research is especially important in the behavioural sciences where the
aim is to discover the underlying motives of human behaviour. Through such research we can
analyse the various factors which motivate people to behave in a particular manner or which
make people like or dislike a particular thing.
(iv) Conceptual vs. Empirical: Conceptual research is that related to some abstract idea(s) or
theory. It is generally used by philosophers and thinkers to develop new concepts or to
reinterpret existing ones. On the other hand, empirical research relies on experience or
observation alone, often without due regard for system and theory. It is data-based research,
coming up with conclusions which are capable of being verified by observation or
experiment. We can also call it as experimental type of research. In such a research it is
necessary to get at facts first-hand, at their source, and actively to go about doing certain
things to stimulate the production of desired information. In such a research, the researcher
must first provide himself with a working hypothesis or guess as to the probable results. He
then works to get enough facts (data) to prove or disprove his hypothesis. He then sets up
experimental designs which he thinks will manipulate the persons or the materials concerned
so as to bring forth the desired information. Such research is thus characterized by the
experimenter’s control over the variables under study and his deliberate manipulation of one
of them to study its effects. Empirical research is appropriate when proof is sought that
certain variables affect other variables in some way. Evidence gathered through experiments
or empirical studies is today considered to be the most powerful support possible for a given
hypothesis.
Besides these there are other types of specific researches, based on either the purpose of
research, or the time required to accomplish research, on the environment in which research
is done, or on the basis of some other similar factor. Form the point of view of time, we can
think of research either as one-time research or longitudinal research. In the former case the
research is confined to a single time-period, whereas in the latter case the research is carried
on over several time-periods. Research can be field-setting research or laboratory research or
simulation research, depending upon the environment in which it is to be carried out.
Research can as well be understood as clinical or diagnostic research. Such research follows
case-study methods or in-depth approaches to reach the basic causal relations. Such studies
usually go deep into the causes of things or events that interest us, using very small samples
and very deep probing data gathering devices. The research may be exploratory or it may be
formalized. The objective of exploratory research is the development of hypotheses rather
than their testing, whereas formalized research studies are those with substantial structure and
with specific hypotheses to be tested. Historical research is that which utilizes historical
sources like documents, remains, etc. to study events or ideas of the past, including the
philosophy of persons and groups at any remote point of time. Research can also be classified

MS 110 Research Methodology Uttarakhand Open University
Unit 1 Research and its Relevance for Management Page 16 of 434
as conclusion-oriented and decision-oriented. While doing conclusion oriented research, a
researcher is free to pick up a problem, redesign the enquiry as he proceeds and is prepared to
conceptualize as he wishes. Decision-oriented research is always for the need of a decision
maker and the researcher in this case is not free to embark upon research according to his
own inclination. Operations research is an example of decision oriented research since it is a
scientific method of providing executive departments with a quantitative basis for decisions
regarding operations under their control.
After defining research from different perspectives and understanding the stages you have to
understand the characteristics of research and research methodology. Remember, while we
are describing characteristics of the research, we have considered research as a process that
involves various interconnected sequential activities. In day to day environment there are
various other activities that compel the individual (manager or researcher) to take decision.
Various activities would be considered as research only when it fulfills certain requirements.
We have identified these requirements of research by examining the definitions of research
presented in previous section. Now we can list the basic requirement of the investigation and
study as follow.
Research is a systematic process of investigation and study.
Research is universal in nature and it is used in all discipline of study.
Research involves collection and analysis of data.
Research involves scientific logics and reasoning in drawing inferences and
conclusion.
Research is a cyclic process as end of a research leaves scope for further research.
Research uses proven and standardised tools for data collection and analysis.
Research is normally conclusive in nature.
As said earlier, research is a process and a process involves set of interconnected and
sequential activities. Every activity could not be considered as research. There are certain
characteristics of the activities associated with the research;
Activities must be systematic: It implies that a set of logical sequences for activities
are followed in research.
Activities must be controlled: It indicates that the factors and variables under study
are properly manipulated to infer the cause-effect relations between two variables. It
also explains that the researcher set up his research study in such a way that
minimizes the effects of other factors affecting the relationship between variables.
Activities must be valid: It implies that the purpose for which the activities and
processes related to a specific research is carried out; those are able to do so.

MS 110 Research Methodology Uttarakhand Open University
Unit 1 Research and its Relevance for Management Page 17 of 434
Activities must be verifiable: This concept implies that whatever a researcher
conclude on the basis of his/her findings can be verified by you and others
Activities must be rigorous: It means researcher must be scrupulous in ensuring that
the procedures followed to find answers to questions are relevant, appropriate and
justified. Although degree of rigor varies markedly for different types of research.
1.11 SUMMARY In this unit learners will be able to understand fundamental meaning of research, how the
research methodology would be helping and guiding the students of management and other
streams. Further an attempt has been made for explaining business research concept.
Afterwards a discussion is being made to classification of research. By considering different
school of thoughts an effort was made to classify the research. One of the most important
aspects of the research methodology that is need of research management and managerial
value of business research is discussed in detail.
1.12 GLOSSARY
Concept- A concept is a generally accepted collection of meanings or characteristics
associated with certain events, objects, conditions, situations, and behaviors.
Theory: A theory is a set of systematically interrelated concepts.
Model: A Research Model refers to the design of research to be tested and assumptions of
complex relationships among the variables which are to be investigated.
Hypothesis: An assumption about certain characteristic of population to be tested
statistically.
Empirical: Originating in or based on observation or experience.
Ontology: In general, ontology refers to the study or concern about what kinds of things
exist within society
Paradigm: It refers to the school of thought which are followed to carry out the research
Epistemology: Epistemology deals with the issue of knowledge, and specifically, who can be
a ‘knower.

MS 110 Research Methodology Uttarakhand Open University
Unit 1 Research and its Relevance for Management Page 18 of 434
1.13 ANSWER TO CHECK YOUR PROGRESS
Choose the correct alternative
1. (c)
2. (c)
3. (b)
4. (c)
5. (d)
1.14 REFERENCES
Neogi U. K “Research Methodology Tools and Techniques” Variety Book
Publication.
Kumar Ranjeet “Research Methodology” Pearson Education.
Young V. Pauline, “Scientific Social Surveys and Research”.
Gopal, M.H. “An Introduction to Research Procedure in Social Sciences”.
Michacl, V. P. “Research Methods in Management’. Himalaya Publishing
House.
Kothari C.R. “Research Methodology” Vikas Publication.
Gode and Hatt. “Methods in Social Research”. Tata Mc Graw Hill, New Delhi.
Kothari, C R (2008), Research Methodology & Techniques, New Age
Publication, Delhi
Bajpai, Naval (2012) Business Research Methods, Pearson, Delhi
Schiendler & Cooper(2009) : Business Research Methods, TMH, New Delhi
Cresswell, John, W.,(2008). Research Design; Qualitative, Quantitative and
Mixed Methods Approaches. Newbury Park, CA: Sage Publication.
Marczyk, G.R, DeMatteo, D. & Festinger D., (2005). Essentials of Research
Design and methodology, New York City, NY: Wiley.
Ethridge, Don E., (2004). Research Methodology in Applied Economics.
Daryaganj, ND: Wiley – Blackwell,
Bergh, D. and Ketchen, D. (2009) Research Methodology in Strategy and
Management. Binglay, UK: Emarald Group Publishing.

MS 110 Research Methodology Uttarakhand Open University
Unit 1 Research and its Relevance for Management Page 19 of 434
1.15 SUGGESTED READINGS
1. Donald R.Cooper and Ramcis S.Schindler, Business Research Methods, Tata
McGraw Hill Publishing CompanyLimited, New Delhi, 2000.
2. C.R.Kothari Research Methodology, Wishva Prakashan, New Delhi, 2001.
3. Uma Sekaran, Research Methods for Business, John Wiley and Sons Inc., New
York, 2000.
4. Research Methodology: C R Kothari (New Age)
5. Marketing Research : N K Malhotra (Pearsons)
6. Research Methodology: Kumar Ranjeet: Pearson Education.
7. Business Research Methods, Schiendler & Cooper(2009) : TMH, New Delhi
1.16 TERMINAL QUESTIONS
Q1. Explain how research helps in making better decision in the following areas:
(a) Marketing Research
(b) Solving business and industry related operational problems
(c) Motivational Research
(d) Government policy and economic decision.
Q2. Define various objectives of research methodology.
Q3. What are the qualities of good researchers?
Q4. Write a short note on significance of research in management.
Q5. Discuss about the nature of research in management.
Q6. Define various motivating factors of research in management.
Q7. Write various difficulties and limitations of research in management.
Q8. Explain the principles of a good research

MS 110 Research Methodology Uttarakhand Open University
Unit 1 Research and its Relevance for Management Page 20 of 434
Q9. Define the meaning of Research Methodology.
Q10. What do you mean by scientific thinking? Why scientific thinking is required for
a good research?
Q11. What is the scope of research in the present context of opening of national
economy and globalization of markets?

MS 110 Research Methodology Uttarakhand Open University
Unit 2 Nature and Scope of Research Methodology Page 21 of 434
UNIT 2 NATURE AND SCOPE OF RESEARCH
METHODOLOGY
2.1 Introduction
2.2 Objectives
2.3 Nature of Research
2.4 Outlook of Research
2.5 Relevance of the Research
2.6 Steps in Research Process
2.7 Significance of Research
2.8 Formulation of Research Questions
2.9 Characteristics of an Ideal Research
2.10 Uncontrollable Problems in Research
2.11 Scope of Research Problems in Management
2.12 Summary
2.13 Glossary
2.14 Answer to Check Your Progress
2.15 Reference/ Bibliography
2.16 Suggested Readings
2.17 Terminal & Model Questions
2.1 INTRODUCTION
Various discipline of study requires updating in its existing knowledge with latest facts and
theories. To achieve this it is suggested to research the existing knowledge related to the
specific area of study. The word research is in use since immemorial and considered as an
important tool for updating the existing knowledge with latest facts. For the student of
commerce and business management, research methodology is an important subject of study.
Understanding of this subject helps the students in developing problem solving skills and
logical thinking to look into required aspects of the phenomena or situation to come out with
optimum and logical solution. This unit of research methodology explained the fundamental
concepts and approaches of research methods. This unit definitely will be helping to the
students of management to enhance the understanding of the processes and characteristics of
the research methodology.

MS 110 Research Methodology Uttarakhand Open University
Unit 2 Nature and Scope of Research Methodology Page 22 of 434
2.2 OBJECTIVES
After studying this unit, the learners will have deep understanding of the following topics:
To understand the concept and meaning of research
To understand the need of research
To understand the process of formulation of research problem
To understand the importance of scientific thinking in research
2.3 NATURE OF RESEARCH
Nature of research is the way we do things. Nature of research is the way of life we take
important decisions. Without it we are deluged with information. Now a day there is always a
significance of causal research. As far as causal researches are concerned there is great
implementation of non-experimental kind of studies in management.
Systematic and scientific investigation may either be innovation or a discovery or an enquiry.
For launching a product or presenting new ideas or exploring market or developing certain
areas, a descriptive study of its operation is needed. Studies are done with the help of the past
data, experiments, journals, magazines, website, CD-ROM, video etc.
Nature of research is the very characteristics of collection of extensive information and
modifying or transforming new ideas into reality. Each day of our life is research oriented
and calls for an introspection of events for betterment. The studies may be in various fields
e.g.; business, industries, human life etc.
Research can be undertaken within most of the professions. It can be explained by following
example. A professor comes to the department, once he /she is in the department he or she
may have several questions in his or her mind. How many classes I have to take? Are really
my students were satisfied by the lecture? What would be the best method to deliver my
lecture? How class can be made effective? What kind of skills is required to make students
creative? Many other questions can be incorporated in this example. A professor is able to
identify the answers of these questions he or she would be considered a good researcher.
This kind of way of questioning would also be made for other examples or disciplines.
Formal academic research differs from experimental research and may be more investigative
in nature. For instance, it may require us to learn about an area where we have little
knowledge or learning to learn. It may be library oriented or field oriented or laboratory
oriented, depending on the nature of research.
MS 110 Research Methodology Uttarakhand Open University
Unit 2 Nature and Scope of Research Methodology Page 23 of 434
(a) Systematic way
Research is a way of systematically solving the research problem. In management
research, a Researcher always plans his/her step in systematic manner.
(b) Scientific method
Research, in management, serves as a scientific basis for solving new facts.
Researchers attempt to achieve this by experimentation, observation, logical
argumentation and combination of three in different proportions.
(c) Verifiability
Conclusion of management drawn through a scientific method is subject to
verification at any time. Verifiability refers that the phenomena must be capable of
being observed and measured.
(d) Tools for new product development
Research is a management tool for new product development and modification of
existing products.
(e) Definiteness
Conclusion is arrived at as results of research are helpful in prediction and serve as an
aid for decision making.
(f) Objectivity
In research all things have to be objective and based on facts and internal conditions.
There is no space for subjectivity.
(g) Helpful in prediction
Conclusions that are drawn as a result of research are helpful in prediction and serve
as an aid for decision making.
(h) Basis for management principle
Research serves as basis for the development of new management techniques and
principles.
(i) Aid in decision making
Research helps managers in decision making under different circumstances.
(j) Relies on empirical evidence
Every research is composed of two parts – (1) technical aspects and (2) logical aspects.
First one deals with the collection of information and second comes at the time of
generalization on the basis of collected information.

MS 110 Research Methodology Uttarakhand Open University
Unit 2 Nature and Scope of Research Methodology Page 24 of 434
2.4 OUTLOOK OF RESEARCH
The first step to research is the investigation and making comprehension of the problem or
situation for study and exploration. After that the researcher tries to find out the causes for
that problem. Hence a research is a two stage processes involving following stages.
Stage 1: Analysis and understanding of characteristics of phenomena under study
Stage 2: Analysis and understanding of reasons for those characteristics
Research is also defined from different viewpoints. These viewpoints are as follow
Model: It refers to the different school of thoughts which are followed to carry out the
research
Access: It is all about the appropriate path a researcher can find answers of the research
questions to achieve the destination of the research journey.
Tools: It refers to the appropriate procedure, scientific techniques and tools and methods used
in research journey.
2.5 RELEVANCE OF RESEARCH
The relevance of the research depends upon the way you are carrying out your study. You
should have sound knowledge of about the subject area. You need to improve expertise
towards research methodology. Further whatever the research questions you framed for your
research enquiry then you must have precise kind of methodology to find answer of your
research questions.
The objectives of research can be understood by following manner:
To understand the subject area clearly so that new insights can be obtained for the
phenomena.
To enhance the understanding with regard to individuals, groups, organizations,
society, community etc so that they can be included into the study for generalizing the
findings of the study.
To know about associated variables which can influence the outcome of the study.
To establish the relationship between or among the variables and to ascertain the
direction of the variables.
2.6 STEPS IN RESEARCH PROCESS
In order to understand the research process a very simple model is taken into the
consideration. This model is associated to the blueprint of the research so long as we
understand it research journey.

MS 110 Research Methodology Uttarakhand Open University
Unit 2 Nature and Scope of Research Methodology Page 25 of 434
Fig 2.1 Steps in Research Process
Step 1: Decide the subject area pursuant to your interest
Step 2: Develop the path for selected topic of subject area then make proper assessment of
your topic.
Step 3: Raise the research questions and formulate the objectives of your study
Step 4: Develop the methods for collecting the required Information.
Step 5: Compiling and organizing the information.
Step 6: Analysing the information by employing appropriate kind of statistical tools and
techniques.
Step 7: Drawing inferences and conclusion.
Step 8: Communicate the conclusion and findings.
2.7 SIGNIFICANCE OF THE RESEARCH
As In this section we shall try to explain the practical uses of research in business and
commerce. Business environment needs careful study of the situation for taking decision.
Research can help in the effort to investigate a specific problem encountered in the business
and commerce to take rational decision for solving the problems. In other area of study
research could be used to update the existing knowledge of the subject matter. Research has
more applications. It cannot be confined only towards the management but it has to be used

MS 110 Research Methodology Uttarakhand Open University
Unit 2 Nature and Scope of Research Methodology Page 26 of 434
not only business studies, humanities, social sciences, physical sciences but also in daily
professional lives. We can summarize the significance of research as follow.
To improve quality of life by updating the existing knowledge of the area of study
To help manager to take rational and good decision
Effective business plan for product launching
Getting feedback from customers for marketing planning
Research may be used in basic area of knowledge or in applied area of, depending upon the
purpose of the research. In basic area of study a research is oriented towards search and
validation of new concepts and theories to update the related knowledge. In case of applied
area research is used to solve specific business problem.
2.8 FORMULATION OF RESEARCH QUESTIONS
Let us now understand the steps of research process. The first step is always to the select
broader area of the study as per your interest. As far as the management students are
concerned they have plenty of scope to carry out their studies in major functional areas of
management like marketing, human resource management, financial management and many
others. Once the broader area of the subject is identified then it is required to dissect the
broader areas into the several sub areas then that sub area of the subject topic would be
selected in which researchers and students of research methodology have understanding ,
information, knowledge. As a researcher if you are creating a path for your research journey
you are supposed to have very specific towards the selected topic. Then you are required to
raise and formulate the research questions. Research Question is a specific question about a
part of the research problem that will be investigated and answered by the researcher. A
researcher might have several questions about the problem. Among various questions, one
specific question from the interest is to be selected as research problem and can be answered
through systematic investigation, based on the fundamental principles of research.
The following points should be kept in mind while defining a research question:
1) The research question must be clear and there is no place for ambiguity.
2) The research question must be defined properly.
3) The research objectives are based on whatever the research question you have
developed. In order to achieve the objectives there is always requirement of proper
kind of exploration.
4) The researcher must ensure that sufficient data would be available for investigation
related to different areas of research question.
5) Proper scientific and statistical tools must be available to analyse the data related to
the research question.

MS 110 Research Methodology Uttarakhand Open University
Unit 2 Nature and Scope of Research Methodology Page 27 of 434
In order to develop a research question, a research interacts extensively with the decision
maker or users of the outcome of the research. The purposes of interactions are just to
validate the definitions of research problem and exploring various issues from broad research
problem. Among various research issues one specific issue is selected for defining the
research question. For example a manager is facing problem of decreased sales of the product
of his company. This is known as managerial problem to be addressed by the manger. The
concerning manager may be interested to explore the reasons for this problem. When the
manager interacts with a researcher, the researcher will try to understand the problem from
various perspectives such as
What are the symptoms that considered by manager as “declining sales”
What are the characteristics natures of the symptoms related to declining sales i.e
seasonal, erratic or continuous
The researcher may ask to the manager to be specific about the mode of investigation
to know the reasons for declining sales.
Although it is advisable that the research problem as well as research question must be
properly understood and defined by the research as well as the decision makers.
2.9 CHARACTERISTICS OF AN IDEAL RESEARCH
Researchers are advised to inculcate following characteristics in their minds:
Research should be precise and efficient
Research should have authority
Research must have the potency
Rigorousness,
Logicality,
Critical thought,
Objectivity and
Degree of Accuracy.
Some important terms defining the characteristics are explained here-
Systematic: The research should use valid procedures and principles.
Reproducibility: The design should be valid with clear procedures so that others can
test the findings
Controlled: It refers to how variables are manipulated and controlled
MS 110 Research Methodology Uttarakhand Open University
Unit 2 Nature and Scope of Research Methodology Page 28 of 434
Empirical and objective: It should be based on primary findings and direct
observations
Analytical and critical: Refers to valid logic and reasoning
Degree of Accuracy: The findings must be valid and data must be accurate without
any manipulations
Originality: Contribute significantly by innovative and new thoughts.
Prerequisites of Selecting a Good Research Problem
Following points must be taken into the consideration before selecting a good research
problem:
Interest: interest is the prime factor which can influence the quality of the
research. If the researcher holds interest towards any subject area it does mean
more than 50% research problem can be solved. This is one of the significant
incentive through which a research problem can be made possible.
Magnitude: Researcher must know the significance of the study. Accordingly
they are required to manage the financial, human resource and time constraint
to get the favourable consequences.
Measurement of concepts: You must be aware about the parameters, their
indicators and their measurement so that meaningful type of results can be
established.
Level of expertise: As a researcher you must have skill, experience and you
are supposed to have expertise about the subject matter.
Relevance: Whatever the study you are carrying out, whatever the results you
drawn they must have relevance in the real life system.
Availability of data: Once the research problem is selected then immediately
it is required to know about the sources of the data. If the study is based on the
secondary data it is important to know about the source and format of the data.
Ethical issues: To carrying .out any study ethical issues are taken into the
consideration. Whatever the efforts you are making further they are subject to
Validity, reliability and authenticity.
2.10: UNCONTROLLABLE PROBLEMS IN RESEARCH With the time the research become applied in nature as the developed theories and construct
are helpful in explaining the existing phenomena. Now a day, the quality of research is going
down as most of the researches are being deviated from the criteria of a good research. This is

MS 110 Research Methodology Uttarakhand Open University
Unit 2 Nature and Scope of Research Methodology Page 29 of 434
leading to problems with the research in current scenario. Some problems which are
associated with the research are listed here.
- Accuracy and Reliability of data are questionable.
- Biasness of the researcher.
- Scientific collection of data is questionable.
- Misinterpretation of data
- Time consuming
- Not in the interest of the person
- Lack of clarity of data
- Lack of valid and objective conclusion
- Lack of knowledge
- High cost
- Quantity of data
- Improper sampling and its size
- Source of data is questionable
- Lack of information
Above problems relating to substandard research and compromises in quality of research.
With the advent of internet and communication technology theft of research data (conducted
by other researcher) is a major problem of research leading to ethical issues.
In order to improve the degree of precision and to minimise the error which are mostly
uncontrollable. Following school of thoughts and basic guidelines must be taken into the
consideration.
According to Schieldler & Cooper, research involves a lot of reasoning and a researcher must
develop a habit of sound reasoning for finding correct premises, testing the connection
between facts and assumptions and making claims based on adequate evidences. Scientific
thinking refers to the thought processes that are used in science, including the cognitive
processes involved in theory generation, experiment design, hypothesis testing, data
interpretation, and scientific discovery. Many of these aspects of scientific thinking involve
cognitive processes that have been investigated in their own right, such as induction,
deduction, analogy, expertise, and problem solving. In research scientific thinking is
extensively required to maintain the quality and objectivity in the research. Next section
discusses on the specific terms associated scientific thinking in the research.
When we do research, we seek to know what is in order to understand, explain, and predict
phenomena. The phenomena are to be defined and explained. In this regard various terms are
used.

MS 110 Research Methodology Uttarakhand Open University
Unit 2 Nature and Scope of Research Methodology Page 30 of 434
Concept- A concept is a generally accepted collection of meanings or characteristics
associated with certain events, objects, conditions, situations, and behaviors. Classifying and
categorizing objects or events that have common characteristics beyond any single
observation creates concepts. We use numerous concepts daily in our thinking, conversing,
and other activities. In research, special problems grow out of the need for concept precision
and inventiveness. We design hypotheses using concepts. We devise measurement concepts
by which to test these hypothetical statements. We gather data using these measurement
concepts. The success of research hinges on
(1) How clearly we conceptualize and
(2) How well others understand the concepts we use.
For example, when we survey people on the question of customer loyalty, the questions we
use need to tap faithfully the attitudes of the participants. Attitudes are abstract, yet we must
attempt to measure those using carefully selected concepts. The challenge is to develop
concepts that others will clearly understand. We might, for example, ask participants for an
estimate of their family’s total income. This may seem to be a simple, unambiguous concept,
but we will receive varying and confusing answers unless we restrict or narrow the concept
by specifying:
• Time period, such as weekly, monthly, or annually.
• Before or after income taxes.
• For head of family only or for all family members.
• For salary and wages only or also for dividends, interest, and capital gains.
• Income in kind, such as free rent, employee discounts, or food stamps
Constructs- Concepts have progressive levels of abstraction, that is, the degree to which the
concept does or does not have something objective to refer to. An abstraction like personality
is much more difficult to visualize. Such abstract concepts are often called constructs. A
construct is an image or abstract idea specifically invented for a given research and/or theory-
building purpose. We build constructs by combining the simpler, more concrete concepts,
especially when the idea or image we intend to convey is not subject to direct observation.
Concepts and constructs are easily confused.
Definitions- Confusion about the meaning of concepts can destroy a research study’s value
without the researcher or client even knowing it. If words have different meanings to the
stakeholders involved, then the parties are not communicating well. Definitions are one way
to reduce this danger. Researchers struggle with two types of definitions: dictionary
definition and operational definitions. In the more familiar dictionary definition, a concept is
defined with a synonym. An operational definition is a definition stated in terms of specific
criteria for testing or measurement. These terms must refer to empirical standards (i.e., we
must be able to count, measure, or in some other way gather the information through our
senses). Whether the object to be defined is physical (e.g., a can of soup) or highly abstract
(e.g., achievement motivation), the definition must specify the characteristics and how they

MS 110 Research Methodology Uttarakhand Open University
Unit 2 Nature and Scope of Research Methodology Page 31 of 434
are to be observed. The specifications and procedures must be so clear that any competent
person using them would classify the object in the same way. Operational definitions may
vary, depending on your purpose and the way you choose to measure them. Here are two
different situations requiring different definitions of the same concepts:
Variables- In practice, the term variable is used as a synonym for construct, or the property
being studied. In this context, a variable is a symbol of an event, act, characteristic, trait, or
attribute that can be measured and to which we assign categorical values. There are various
types of variables broadly classified as dependent and independent. Schiendler and coopers
described the characteristics of these as follow.
Many textbooks use the term predictor variable as a synonym for independent variable (IV).
This variable is manipulated by the researcher, and the manipulation causes an effect on the
dependent variable. We recognize that there are often several independent variables and that
they are probably at least somewhat “correlated” and therefore not independent among
themselves. Similarly, the term criterion variables used synonymously with dependent
variable (DV). This variable is measured, predicted, or otherwise monitored and is expected
to be affected by manipulation of an independent variable.
Proposition and Hypothesis- We define a proposition as a statement about observable
phenomena (concepts) that may be judged as true or false. When a proposition is formulated
for empirical testing, we call it a hypothesis. As a declarative statement about the
relationship between two or more variables, a hypothesis is of a tentative and conjectural
nature. Hypotheses have also been described as statements in which we assign variables to
cases. A case is defined in this sense as the entity or thing the hypothesis talks about. The
variable is the characteristic, trait, or attributes that, in the hypothesis, is imputed to the case.
Theory: A theory is a set of systematically interrelated concepts, definitions, and
propositions that are advanced to explain and predict phenomena (facts). In this sense, we
have many theories and use them continually to explain or predict what goes on around us.
To the degree that our theories are sound and fit the situation, we are successful in our
explanations and predictions. In marketing, the product life cycle describes the stages that a
product category goes through in the marketplace.

MS 110 Research Methodology Uttarakhand Open University
Unit 2 Nature and Scope of Research Methodology Page 32 of 434
2.11 SCOPE OF RESEARCH PROBLES IN MANAGEMENT
Business executive in each of the functional areas of management, viz, marketing,
production, finance, and personnel are confronted with several interacting decision-making
problems in their day to day operation. Many of these problems demand a systematic
research which will aid the executive to take optional and effective decisions.
Marketing
Different research topics studied under Marketing Management are:
Product identification
Demand estimation
Demand –supply analysis
Product development
Market segmentation
Media mix
Sales promotion programme
Product Launching
Design of distribution channel
Pricing
Marketing strategy formulation
Product differentiation and product positioning
Packaging
Design of advertisements
Planning sales force
Buying behavior
Production
Different research topics studied under Production Management are:
Forecasting
Capacity planning
Plant location
Plant layout
Line balancing

MS 110 Research Methodology Uttarakhand Open University
Unit 2 Nature and Scope of Research Methodology Page 33 of 434
Line of balance
Inventory control
Aggregate planning
Master production scheduling
Materials requirements planning
Single-machine scheduling
Flow-shop scheduling
Project management
Maintenance management
Quality control
Work design
Modern production system design, like JIT, computer integrated manufacturing,
flexible manufacturing, agile manufacturing, logistics management, total quality
management, etc.
Finance
Different research topics studied under finance management are:
Models for break-even analysis of multi-product
Economic evaluation of alternatives
Study of financial parameters of organizations
Capital budgeting
Ratio analysis
Portfolio managements
Primary market study
Secondary market study
Balance of payment
Inflation
Deflation
Economic growth model
Personnel
Different research topics studied under Personnel Management are:
Manpower planning

MS 110 Research Methodology Uttarakhand Open University
Unit 2 Nature and Scope of Research Methodology Page 34 of 434
Performance appraisal system
Conflict management
Study of organizational climate
Design of incentive plans
Leadership style
Training methods
Change management
Negotiation and wage settlement
Labour welfare study
The primary purpose of research is to gather information which will allow your company or
organization to make better, more improved decision. Management research is closely linked
to management concepts and different activities of the organization. Hence, the options of the
employees and customers are highly valued and useful aid in management research.
Importance and scope of research in management can be studied under three groups:
1) Environmental Research
2) Organizational Research
3) Market Research
(1) Environmental Research
For the success of the organizational environmental research is an inevitable step. For
organization it is very important to find out new ways for facing the environmental fears.
Under environmental research we can cover following areas of research:
(a) Competitive advantage
Organization generally conduct research for finding out different ways through
which they have competitive advantage over the competitors.
(b) Technical innovations
Another area of research is technological innovations. Organizations always strive
for usage of new technologies, processes and equipment.
(c) Industrial fears
Every industry faces some fears which affect the existence of industry. All the
organizations conduct research for finding out ways in order to mitigate fear.
(d) Quality issues
MS 110 Research Methodology Uttarakhand Open University
Unit 2 Nature and Scope of Research Methodology Page 35 of 434
Another field which calls for research is quality. There is always a scope of quality
improvement and any organization which has better quality can change premium.
(e) New product development, also calls for research
(2) Organizational research
Second broad area of research in management is organizational research. It covers following
areas of research.
(a) Organizational effectiveness
In order to make more effective organizational structure design and control
organizations conduct research work on periodic basis.
(b) Operations
Organizations opt for research work in order to improve their work processes and
work sequences.
(c) Human resource management
Improvement in abilities and skills of employees, employee satisfaction, motivation,
etc. calls for the need of research in business/organizations
(3) Marketing research
Marketing research covers all aspects of marketing of goods and services. It is an activity
which links to customers to the market through information. Information used to define
marketing opportunities to generate refine and evaluate marketing actions and to improve
understanding of marketing as a process. There are various ways of classifying marketing
aspects into categories according to the activity involved such as:
(a) Product research
It deals with the design, development of new product, the viability of existing
products and estimating the demand in relation to ‘customers’ future preferences in
relation to style, product performance and competition.
(b) Sales research
It involves an examination of company’s selling activities. This is usually held by
sales outlet or marketing zones and is analyzed over a specified time period to enable
direct comparisons over time.
(c) Customer research
It deals with buyer’s behavior researching the economic, social and psychological
factors affecting decisions under different buying situations at the customer, trade or
industrial level. Such research covers the customer’s attitudes and perceptions and
impact of different marketing tactics that an organization may adopt in market.

MS 110 Research Methodology Uttarakhand Open University
Unit 2 Nature and Scope of Research Methodology Page 36 of 434
(d) Pricing research
It deals with decisions about the cost to the buyer of goods and services.
(e) Price research
It deals with the judgment of price changes, effectiveness of relative positioning and
to estimate demand in competitive market.
(f) Promotional research
It is concerned with testing and evaluating the effectiveness of the various methods
used in developing and promoting a company’s product service.
Marketing research provides decision maker with information that allows the
reduction of uncertainty surrounding business decision.
Check Your Progress-A
Choose the correct alternative.
1. The main purpose of research in education is to __________
a) Help in the personal growth of an individual.
b) Help the candidate become an eminent educationist.
c) Increase job prospects of an individual.
d) Increase social status of an individual
2. A hypothesis is;
a) A statement which serves as the basis for further investigation.
b) The methodical evaluation of research evidence.
c) A statement of the aims of an investigation.
d) All of these.
3. Randomized assignment is:
a) Sometimes done to data to allow cause and effect to be analyzed.
b) Applied to data to control for a confounding variable.
c) Applied to participant groups to control for a confounding variable.
d) Applied to participant groups to keep similar participants grouped together.
4. _______________________ is a statistical index which describes the degree and
direction of the relationship between two characteristics or variables.

MS 110 Research Methodology Uttarakhand Open University
Unit 2 Nature and Scope of Research Methodology Page 37 of 434
a) Correlation
b) T-test
c) Mean
d) Probability
2.12 SUMMARY
In this unit we have discussed about fundamental concept of research and research
methodology. Various terms associated with research methodology are discussed in this unit
so that the students can develop a solid foundation is self-paced learning. Research has been
defined as a process of systematic data collection and analysis to get new insight into the
problem. A brief introduction was also made regarding steps in research process, formulation
of research questions. An effort has also been to made purpose, nature, relevance and
significance of the study. In next unit we will discuss about types of data and data collection
in detail.
2.13 GLOSSARY
Tactics: The art or skill of employing available means to accomplish an end.
Premium: Something given as a reward, prize, or incentive.
Introspection: The examination or observation of one's own mental and emotional
processes.
2.14 ANSWER TO CHECK YOUR PROGRESS
Choose the correct alternative.
1. (b)
2. (a)
3. (c)
4. (a)
MS 110 Research Methodology Uttarakhand Open University
Unit 2 Nature and Scope of Research Methodology Page 38 of 434
2.15 REFERENCES
Neogi U. K “Research Methodology Tools and Techniques” Variety Book
Publication.
Kumar Ranjeet “Research Methodology” Pearson Education.
Young V. Pauline, “Scientific Social Surveys and Research”.
Gopal, M.H. “An Introduction to Research Procedure in Social Sciences”.
Michacl, V. P. “Research Methods in Management’. Himalaya Publishing
House.
Kothari C.R. “Research Methodology” Vikas Publication.
Gode and Hatt. “Methods in Social Research”. Tata Mc Graw Hill, New Delhi.
Kothari, C R (2008), Research Methodology & Techniques, New Age
Publication, Delhi
Bajpai, Naval (2012) Business Research Methods, Pearson, Delhi
Schiendler & Cooper(2009) : Business Research Methods, TMH, New Delhi
Cresswell, John, W.,(2008). Research Design; Qualitative, Quantitative and
Mixed Methods Approaches. Newbury Park, CA: Sage Publication.
Marczyk, G.R, DeMatteo, D. & Festinger D., (2005). Essentials of Research
Design and methodology, New York City, NY: Wiley.
Ethridge, Don E., (2004). Research Methodology in Applied Economics.
Daryaganj, ND: Wiley – Blackwell,
Bergh, D. and Ketchen, D. (2009) Research Methodology in Strategy and
Mangement. Binglay, UK: Emarald Group Publishing.
2.16 SUGGESTED READINGS
1. Donald R.Cooper and Ramcis S.Schindler, Business Research Methods, Tata
McGraw Hill Publishing CompanyLimited, New Delhi, 2000.
2. C.R.Kothari Research Methodology, Wishva Prakashan, New Delhi, 2001.
3. Uma Sekaran, Research Methods for Business, John Wiley and Sons Inc., New
York, 2000.
4. Neogi U. K “Research Methodology Tools and Techniques” Variety Book
Publication.
MS 110 Research Methodology Uttarakhand Open University
Unit 2 Nature and Scope of Research Methodology Page 39 of 434
5. Kumar Ranjeet “Research Methodology” Pearson Education.
6. Young V. Pauline, “Scientific Social Surveys and Research”.
7. Gopal, M.H. “An Introduction to Research Procedure in Social Sciences”.
8. Michacl, V. P. “Research Methods in Management’. Himalaya Publishing
House.
9. Gode and Hatt. “Methods in Social Research”. Tata Mc Graw Hill, New Delhi.
2.17 TERMINAL QUESTIONS
1. What is Marketing Research?
2. What is the Importance of Research Methodology?
3. Discuss the scope of Research Methodology.
4. . Define the following terms:
i. Research
ii. Research Problems
iii. Research Methods
iv. Research Methodology
5. Distinguish between Research Methods and Research Methodology.
6. What are the characteristics of a research? Explain its significance in modern
times?
7. Discuss the factors motivating research.
8. Explain the principles of a good research
9. What is the scope of research in the present context of opening of national
economy and globalization of markets?
10. Explain the problem and limitations faced in conduct of research.
11. What do you mean by Model in a research? What are the types of research model?
12. What do you mean by Exploratory and Descriptive Research?
13. What do you mean by scientific thinking? Why scientific thinking is required for a
good research?
14. What do you mean by deductive and inductive reasoning? What is the importance
of these concepts in research?

MS 110 Research Methodology Uttarakhand Open University
Unit 3 Research Process and Review of Literature Page 40 of 434
UNIT 3 RESEARCH PROCESS AND REVIEW OF
LITERATURE
3.1 Introduction
3.2 Objectives
3.3. Meaning of Research
3.4 Research Process
3.5 Review of Literature
3.6 Summary
3.7 Glossary
3.8 Answer to Check Your Progress
3.9 References
3.10 Suggested Readings
3.11 Terminal & Model Questions
3.1 INTRODUCTION "Knowledge" basically pertains to facts based on objective insights and study findings
processed by the human brain. It can be acquired through various ways, such as reading
books and online articles written by educators, listening to experts, watching documentaries
or investigative shows, conducting scientific experiments, and interaction with other people,
among others. These facts can be checked to ensure truthfulness and accuracy by conducting
research. This unit will throw light on two very important concepts of research i.e. Research
Process and Review of Literature. The topics taught in this unit are relevant for students,
academicians as well as professionals.
3.2 OBJECTIVES After studying this unit, the students will have deep understanding of the following topics:
Meaning, Objectives and Kinds of Research
The Research Process
The Review of Literature and Sources of Review of Literature
3.3 MEANING OF RESEARCH Research is one of the ways to find answers to the problems. Research is a science and
systematic search for relevant data on a particular subject. Research is, in reality, an art of
MS 110 Research Methodology Uttarakhand Open University
Unit 3 Research Process and Review of Literature Page 41 of 434
scientific research. Research is therefore an initial contribution to its development to the
current inventory of understanding. It is the pursuit of reality by studying, observing,
comparing, and experimenting with it. In short, Research is the quest for understanding by
means of an objective and systematic technique of solving the issue. The word ' research'
therefore relates to the systematic technique of expressing the issue, formulating a hypothesis,
gathering facts or information, analyzing the facts and achieving certain generalizations for
some theoretical formulation.
According to The Advanced Learner’s Dictionary of Current English “Research is a
careful investigation or inquiry especially through search for new facts in any branch of
knowledge.”
According to Clifford Woody research comprises defining and redefining problems,
formulating hypothesis or suggested solutions; collecting, organizing and evaluating data;
making deductions and reaching conclusions; and at last carefully testing the conclusions to
determine whether they fit the formulating hypothesis.
According to D. Slesinger and M. Stephenson Research is “the manipulation of things,
concepts or symbols for the purpose of generalizing to extend, correct or verify knowledge,
whether that knowledge aids in construction of theory or in the practice of an art.” The
Research has following characteristics:
It gathers from main or first-hand sources fresh understanding or information.
The discovery of general principles is stressed.
It's a precise and systematic inquiry.
Uses certain valid equipment for information collection.
It's objective and logical.
The investigator eliminates private and preferential emotions.
It aims at quantitatively organizing information.
It is patient and unhurried activity.
Research is documented and reported closely.
Careful and cautious conclusions and generalizations are reached.
3.3.1 OBJECTIVES OF RESEARCH
Research aims at finding responses to issues by applying science processes. Research's
primary goal is to find out the hidden reality that has not yet been found. While each research
study has its own specific goal, research goals may be considered to fall within a number of
wide groups:
1. To become aware of the phenomenon or fresh insights into the phenomena.
2. To properly describe a specific person, situation or group's features.
3. To find out the frequency with which something happens or with which something else is
linked.

MS 110 Research Methodology Uttarakhand Open University
Unit 3 Research Process and Review of Literature Page 42 of 434
4. Testing a causal relationship hypothesis between factors.
3.3.2 RESEARCH METHODOLOGY
Research methodology is a way to address the research problem systematically. It's a science
of learning how scientifically research is accomplished. We study the different measures that
a researcher usually accepts in studying his/her research problem together with the logic
behind them. Knowing not only the research methods / techniques, but also the methodology
is essential for the researcher. Researchers need not only to understand how to create certain
indices or tests, how to calculate the mean, mode, average or standard deviation or chi-
square, how to apply specific study techniques, but also to understand which of these
methods or techniques are applicable and which are not, what they would mean and specify
and why.
Researchers also need to understand the hypotheses underlying different methods and they
need to know the criteria by which they can decide that certain methods and processes will
apply to certain issues and others will not. All this implies that the investigator needs to
design his/her methodology for his/her issue because the same can be different from issue to
issue.
3.3.3 KINDS OF RESEARCH
The Research is broadly classified into two categories:
1. Basic Research: Basic research is an inquiry into fundamental values and reasons for
a case or process or phenomenon to occur. It is also known as theoretical research.
Studying or investigating some natural or pure scientific phenomenon is called
fundamental research. Basic research may not lead to instant use or implementation at
times. It is not worried with solving any instant practical issues. It offers a systematic
and profound insight into the issue and facilitates the extraction and conclusion on it
of science and logical explanation. It enables to construct fresh knowledge
boundaries. Basic research has following features:
Seeks generalization
Aims at basic processes
Attempts to explain why things happen
Tries to get all the facts
Reports in technical language of the topic
2. Applied Research: In an applied research one solves certain problems employing
well known and accepted theories and principles. Most of the experimental research,
case studies and inter-disciplinary research are essentially applied research. Applied
research is helpful for basic research. A study whose result is immediately
MS 110 Research Methodology Uttarakhand Open University
Unit 3 Research Process and Review of Literature Page 43 of 434
implemented is also referred to as applied research. Such study is useful for present
activity in practice. Applied research has following features:
Studies individual or specific cases without the objective to generalize
Aims at any variable which makes the desired difference
Tries to say how things can be changed
Tries to correct the facts which are problematic
Reports in common language
Basic and Applied researches are further divided into three types of research:
1. Quantitative research: It is numerical, non-descriptive, utilizes numbers and applies
statistics or mathematics. It is an iterative method that evaluates proof. In tables and
graphs, the outcomes are often provided. It's definitive. It explores the decision-
making what, where and when.
2. Qualitative research: It is non-numerical, descriptive, applies reasoning and uses
words. Its aim is to get the meaning, feeling and describe the situation. Qualitative
data cannot be graphed. It is exploratory. It investigates the why and how of decision
making.
3. Other types of Research
Exploratory Research: Exploratory research is used to investigate the problem
which has not been clearly defined. It involves a literature search or conducting focus
group interviews. The exploration of new phenomena in this way may help the
researcher’s need for better understanding, may test the feasibility of a more extensive
study, or determine the best methods to be used in a subsequent study. The purpose of
exploratory research is to identify key issues and key variables.
Descriptive research: Descriptive research involves various types of surveys and
fact-finding inquiries. The main aim of descriptive research is to describe the current
state of affairs. A descriptive research is directed toward studying “what” and how
many off this “what”. Thus, it is directed toward answering questions such as, “What
is this?”.
Explanatory research: The primary goal of this research is to understand or to
explain relationships. It uses correlations to study relationships between dimensions
or characteristics off individuals, groups, situations, or events. Explanatory research
explains (How the parts of a phenomenon are related to each other). It asks the “Why”
question.
Longitudinal Research: Research carried out longitudinally involves data collection
of same variables at multiple points in time. Longitudinal studies may take the form
of:
Trend study- looks at population characteristics over time, e.g. organizational
absenteeism rates during the course of a year

MS 110 Research Methodology Uttarakhand Open University
Unit 3 Research Process and Review of Literature Page 44 of 434
Cohort study- traces a sub-population over time, e.g. absenteeism rates for the sales
department;
Panel study- traces the same sample over time, e.g. graduate career tracks over the
period 1990 – 2000 for the same starting cohort.
While longitudinal studies will often be more time consuming and expensive than cross-
sectional studies, they are more likely to identify causal relationships between variables.
Cross-sectional Research: One-shot or cross-sectional studies are those in which
data is gathered once, during a period of days, weeks or months. Many cross-sectional
studies are exploratory or descriptive in purpose. They are designed to look at how
things are now, without any sense of whether there is a history or trend at work.
Action research: This sort of research focuses on results of facts to enhance the
social world's quality of action.
Classification research: It aims at categorization of units in to groups and to
demonstrate differences and to explain relationships between them.
Comparative research: The objective of this type of research to identify similarities
and differences between units at all levels.
Causal research: It aims at establishing cause and effect relationship among variable.
3.4 RESEARCH PROCESS 1. Identifying and Defining the Research Problem: The initial step in the research process
is the identification of the problem. The best way to identify the issue is to talk to one's own
peers or those with some knowledge in the matter. The investigator can seek assistance from
a guide in an academic institution that is generally an experienced person and has several
study issues in mind. The guide often raises the issue in general terms and it is up to the
scientist to narrow it down and sentence it in practical terms. The issue is generally identified
in private business units or in governmental organizations by the administrative agencies with
whom the investigator can discuss how the issue initially occurred and what factors might be
involved in their feasible solutions. Developing a research problem is primarily about
deciding what you want to find out.
It is very important to evaluate the research problem in the light of the financial resources at
the disposal of the researcher, the time available, and the expertise and knowledge of the
guide of the researcher in the field of study. Identifying any knowledge gaps in appropriate
fields, such as statistics needed for assessment, is similarly crucial.
Once the problem is clearly defined, it becomes necessary to determine the objectives of the
research. The objectives of the research should be specified in a formal research statement.
The statement of objectives should be as exact as possible. Objectives act as guidelines for
various steps in the research process, and therefore, they have to be prepared by analyzing the

MS 110 Research Methodology Uttarakhand Open University
Unit 3 Research Process and Review of Literature Page 45 of 434
purpose of the research thoroughly. The objectives of the research must be brief and specific;
also, it is preferable to limit the number of objectives.
2. Extensive Review of Literature: After the selection of research problem, the second step
is extensive review of literature related with the problem under consideration. The
availability of the literature may bring ease in the research. For this purpose, academic
journals, books, research papers and government reports must be studied. The studies already
conducted in that field must be studied thoroughly. They can be guiding light for the
research.
3. Formulation of Hypothesis: Researchers should state the working hypothesis or
hypotheses in clear terms after comprehensive literature study. Working hypothesis is a
tentative assumption to draw and test its logical or empirical implications. As such, the way
study hypotheses are formed is especially crucial as they provide the focus for studies. They
also influence the way experiments are performed in data analysis and indirectly the quality
of information needed for assessment. Developing the working hypothesis plays a significant
part in most kinds of studies. Hypothesis should be very specific and limited to the piece of
research in hand because it has to be tested. The hypothesis ' function is to guide the scientist
by defining the study region and keeping him on the correct track. It sharpens his thinking
and focuses attention on the problem's most significant facets. It also shows the sort of
information needed and the sort of data analysis techniques to be used.
4. Planning a Research Design
After the identification and definition of problem, the process of research design begins.
Planning the research design is a crucial step-in the research design process. A research
design is the actual framework of a research that provides specific details regarding the
process to be followed in conducting the research. The research is designed based on the
objectives formulated during the initial phases of the research. The research design includes
all the details regarding the research such as where the information should be obtained from,
the time and budget allotted for conducting the research, the appropriate measurement
techniques and the sampling process. Factors like the research objective, the importance of
the decision, costs involved in conducting the research and the availability of data sources
determine the selection of an appropriate research design. There are several designs for
studies, such as experimental and non-experimental testing of hypothesis. Experimental
designs can be either casual designs (such as before - and-after uncontrolled, after-controlled,
before-and-after controlled) or official designs (such as fully randomized designs,
randomized block designs, Latin square designs, easy and complicated factor designs) from
which the researcher must select the one for his project.
5. Selecting the Sampling Design: The accuracy of the findings largely depends upon the
way the sample is selected. The basic goal of any sampling design is to minimize the gap
between the values obtained from your sample and those prevalent in the study population
within the limitation of cost. The underlying premise in sampling is that a relatively small
number of units, if selected in a manner that they genuinely represent the study population,

MS 110 Research Methodology Uttarakhand Open University
Unit 3 Research Process and Review of Literature Page 46 of 434
can provide – with a sufficiently high degree of probability – a fairly true reflection of the
sampling population that is being studied.
The researcher must decide how to select a sample or what is commonly referred to as the
layout of the sample. In other words, a sample design is a definite plan determined to obtain a
sample from a specified population before any information is actually obtained. Sampling can
be either probability sampling or non-probability sampling. With probability samples each
element has a known probability of being included in the sample but the non-probability
samples do not allow the researcher to determine this probability. Probability samples are
those based on simple random sampling, systematic sampling, stratified sampling, cluster,
area sampling whereas non-probability samples are those based on convenience sampling,
judgment sampling and quota sampling techniques. A brief mention of the important sample
designs is as follows:
Probability Sampling Techniques
(a) Simple random sampling: This type of sampling is also referred to as chance sampling
or probability sampling where each and every item in the population has an equal chance of
being included in the sample and each of the possible samples has the same probability of
being selected in the case of a finite universe. This method provides an equal chance of being
chosen for each item. The selection of each item in a random sample is controlled by the
same probability in the case of an infinite population and that successive selections are
independent of each other.
(b) Systematic sampling: In some cases, the best way to sample is to pick from a list every
20th name, every 10th house on one side of the road, and so on. This sort of sampling is
referred to as systematic sampling. An element of randomness is usually introduced into this
kind of sampling by using random numbers to pick up the unit with which to start. This
method is helpful when a sampling frame in the form of a list is accessible. In such a model,
the selection method begins by selecting a certain random point in the list and selecting each
nth element until the required amount is guaranteed.
(c) Stratified sampling: If the population from which sample is to be drawn is not
homogeneous, then stratified sampling method is implemented to acquire a representative
sample. This method stratifies the population into a number of non-overlapping sub-
populations or strata and selects sample objects from each stratum. If the items chosen from
each stratum are based on simple random sampling of the whole operation, stratification is
known as stratified random sampling, first and then easy random sampling.
(d) Cluster sampling: Cluster sampling is described as a sampling method where various
clusters of individuals are formed from a population where they are indicative of
homogeneous features and have equal opportunities to be component of the sample. A simple
random sample is developed from the various clusters in the population in this sampling
method. However, the clustering strategy can comparatively simplify the sampling procedure
and boost the effectiveness of field work, particularly in the event of private interviews.

MS 110 Research Methodology Uttarakhand Open University
Unit 3 Research Process and Review of Literature Page 47 of 434
(e)Area sampling: Under area sampling, we first split the complete region into a number of
smaller non-overlapping areas, usually called geographic clusters, then randomly select a
number of these smaller fields and include all units in the sample in these small areas. Area
sampling is particularly helpful if we don't have the relevant population list. It also makes the
field of interviewing more effective as interviewees at each place can do many interviews.
Non- Probability Sampling Techniques
(a) Convenience sampling: A convenience sample is a type of non-probability sampling
method where the sample is taken from a group of people easy to contact or to reach. For
example, standing at a mall or a grocery store and asking people to answer questions would
be an example of a convenience sample. There are no other criteria to the sampling method
except that people be available and willing to participate. In addition, this type of sampling
method does not require that a Simple Random sample is generated, since the only criteria is
whether the participants agree to participate.
(b) Judgment sampling: It is a sort of random sample chosen on the basis of an expert's
view. Results acquired from a sample of assessment are subject to some degree of bias owing
to lack of identical frame and population. The frame is a list of all the units, items, people,
etc. that define the study population. Sampling of judgments is noble enough to provide
comprehensive data on the problems in obtaining the random sample. A random sample
would provide less bias, but potentially less raw information. The downfalls of this system
are significant as any non-random sample brings bias into question, which limits the types of
statistical analyzes you may reasonably perform, and there are considerable limits to an
expert's ability to choose a good sample.
(c)Quota sampling: The cost of taking random samples from individual strata is often so
costly in stratified sampling that interviewees are simply given quota to be filled from distinct
strata, the real choice of sample products is left to the judgment of the interviewer. This is
called sampling of the quota. The quota size for each stratum is usually proportionate to the
population size of that stratum. Quota sampling is therefore a significant type of sampling
that is not likely to occur. Quota samples are usually samples of judgment instead of random
samples.
(d) Snowball sampling: Snowball sampling can be described as a method for collecting
study participants by identifying an original topic used to give other respondents ' names.
6. Data Collection: After deciding a suitable sample, the researcher collects the data from the
units in this sample. As there are several research techniques, there are a number of data
collection methods as well. Primary data can be collected by asking the respondents to fill out
a questionnaire administered to them, by observation technique, the respondents are just
observed without their direct participation in the research or by direct interviews of the
respondents. Secondary data can be collected by review of literature, government reports,
journals, company’s reports etc. Whatever the method used to collect the data; it is very
important that the data are collected without any errors. Errors may creep in during the data
collection process in several forms. Potential data collection errors may arise if the

MS 110 Research Methodology Uttarakhand Open University
Unit 3 Research Process and Review of Literature Page 48 of 434
respondent does not understand the question or if the survey or records the answers
inaccurately.
Data collection is done in two stages—pilot study and the main study. Pilot study
involves collecting data from a small subsample to test whether the data collection plan for
the main study is appropriate. This helps the researchers to minimize any potential errors that
may crop up during the main study. The pilot study results may also be used to decide on a
way of tabulating the collected data. If the results of a pilot study are not appropriate for
decision-making, then the researcher may consider altering the research design.
7. Evaluation of Data: Once the information is obtained, evaluation of the information is the
next significant stage in the research process. The reason for analyzing the data is to obtain
research results and to prepare the research report. Several mathematical and statistical
models are used to evaluate the data. Evaluation of data normally starts with editing and
coding of the data. Editing is undertaken to verify the data and check for any potential errors
or for any inconsistencies and so on. Another task of editing is to remove any errors that may
have cropped up during the interview such as recording the answers under the wrong columns
of a questionnaire and so on. Coding is a process of assigning different symbols to different
sets of responses. The coding process is done so that the data can be fed in and interpreted
easily using computers. These days, technological advances have made it possible for data to
be collected and directly fed into computers, removing the possibility of human error.
8. Analyzing the Data: Next step in the research process is analysis of data. The analysis of
data may range from computation of various percentages, coefficients to complicated
multivariate analysis by using various statistical formulas.
In the process of analysis, relationships or distinctions that support or conflict with initial or
new hypotheses should be subject to meaningful trials to determine with what validity
information to indicate any conclusion(s) may be used. After Data Analysis, the researcher
puts the hypotheses to testing. The testing of hypotheses can be done by applying various
tests such as, Chi-square test, T-test, F-test, Factor Analysis etc. The tests are applied
according to the nature of problem under consideration. The outcome of tests will lead to
acceptance or rejection of hypotheses.
9. Preparing the Report: The researcher should prepare the report with care and diligence.
The research reports can be presented either in oral or in written format. The research report
should contain a brief description of the objectives of the research, a summary of the research
design adopted, a summary of the major findings and conclude with the limitations and
recommendations.
The report should have the following layout:
The preliminary pages: This portion should include name and date followed by
recognition and foreword. Then a table of contents should be followed by a list of
tables and, if any, a list of graphs and charts given in the report.
The main text: This part should contain the introduction of the problem, summary,
main report (in a logical sequence) and the conclusion.

MS 110 Research Methodology Uttarakhand Open University
Unit 3 Research Process and Review of Literature Page 49 of 434
The end section: This section should contain the bibliography, glossary etc.
Report should be written in a concise and objective style, avoiding vague phrases like ' it
seems, ' ' there may be, ' and the like. Charts and illustrations should only be used if the data
is presented more obviously and forcefully in the primary document.
3.5 REVIEW OF LITERATURE The phrase ‘review of literature’ consists of two words: Review and Literature. In Research
Methodology, the term literature refers to the knowledge of a particular area of enquiry of
any discipline which includes theoretical, practical and its research studies.
The term ‘review’ means to organize the knowledge of the specific area of research to
develop a
Bundle of knowledge to show that his/her study would be an addition to this field. The job of
review of literature is highly creative and tedious because researcher has to blend the
available knowledge of the field in a unique way to provide the rationale for his/her study.
The researcher does much more than review already published material, s/he seeks to
discover and to integrate new information which has never been reported and never
considered.
According to W.R. Borg “The literature in any field forms the foundation upon which all
future work will be built. If we fail to build the foundation of knowledge provided by the
review of literature our work is likely to be shallow and naive and will often duplicate work
that has already been done better by someone else.”
According to Charter V. Good “The keys to the vast storehouse of published literature may
open doors to sources of significant problems and explanatory hypotheses and provide
helpful orientation for definition of the problem, background for selection of procedure, and
comparative data for interpretation of results. In order to be creative and original, one must
read extensively and critically as a stimulus to thinking.”
3.5.1 OBJECTIVES OF REVIEW OF LITERATURE
The review of literature has following objectives:
Provides theories, thoughts, explanations or hypotheses that may be helpful in
formulating a fresh issue. It demonstrates whether the available proof properly solves
the issue without further enquiry.
It prevents the replication.
It contributes in the development of hypotheses. The researcher can develop research
hypothesis on the basis of available studies.

MS 110 Research Methodology Uttarakhand Open University
Unit 3 Research Process and Review of Literature Page 50 of 434
It proposes the suitable technique, procedure, information sources and statistical
methods to solve the issue.
It helps to discover new variables.
It determines the meanings, relevance of the study and relationship with the study and
its deviation from the available studies.
3.5.2 SOURCES OF REVIEW OF LITERATURE
There are various sources of literature. These sources can be broadly classified into following
categories: (1) Books and Text-Books material. (2) The Periodical Literature, and (3) General
References.
1. Books and Text books Material
The most useful list of books published in the English language is the Cumulative Book
Index and Book Review Index, Books Review Digest, Subject Guide to Books indicates that
books are in print or press or forthcoming books. National Union Catalogue is also useful for
this purpose. There are a number of publications that locate specific references that cover
particular area of knowledge. The Cumulative Book Index is published monthly to provide
the references, all books published in the English Language. Sources of Information in the
social sciences ‘organized’ by subject area and indexed by author and title, this work contains
comprehensive list of reference books and monographs.
2. Periodicals and Journals
A newspaper is described as a journal that is published in consecutive sections, generally at
periodic intervals, and designed to continue forever. These include Yearbook, Documents,
Almanacs, The Cumulative Book Index, International Abstracts, Journals, Newspapers,
Magazines, International Index to Periodicals. Periodicals are generally placed in open
shelves in the Periodical room. Their effective use is predicted on the use of an index to
identify the articles on subject matter under the study. A journal is a scientific publication that
contains papers published by scientists, teachers, and other professionals. Journals
concentrate on a particular discipline or study area. Journals are designed for an academic or
technical audience, not general readers, as opposed to newspapers and magazines. Journals
are regularly released (monthly, quarterly, etc.) and are numbered sequentially.
3. Abstracts
Another type of reference guide is the abstract or review. It includes a summary of contents
in addition to providing a systematized list of reference sources. Usually the brief summaries
of research studies are given in the form of abstract. Education Abstracts, psychological
Abstracts and Sociological Abstracts. A wide variety of indexes and general references can
be found to cover almost any area in which the modern researcher might be interested.

MS 110 Research Methodology Uttarakhand Open University
Unit 3 Research Process and Review of Literature Page 51 of 434
4. Encyclopaedias
Encyclopaedias provide concise information on a number of subjects written by specialists.
They provide a convenient source of information, and often include illustrations and
bibliographies. Only specialized encyclopaedias deal with restricted areas of knowledge.
5. Almanacs, Handbooks, Yearbooks and Guides
This general category of references includes those publications that present rather detailed
up-to-date information on number of subjects which are planned around a given theme. These
types of references are consulted to find particular information.
6. Specialized Dictionaries
There are specialized dictionaries of education which includes terms, words and their
meanings. ‘Dictionary of Education,’ New York: This educational dictionary covers technical
and professional terms. Foreign educational terms used in comparative education writings are
also included. Government of India has also prepared a ‘Dictionary of Education’ which
includes technical and professional terms from English to Hindi.
7. Dissertations and Theses
The thesis and dissertations which contain a bulk of presenting educational research, are
usually housed by the institutions and universities that award the authors their advanced
degrees. Sometimes these studies are published in whole or in part in educational journals.
The related dissertations and thesis are the main sources of review of literature.
Check Your Progress-A
Choose the correct alternative.
1. Basic Research means:
a) solving certain problems by employing theories and principles
b) investigating the basic principles and reasons for the occurrence of particular event,
process or phenomena
c) understanding or explaining relationships.
d) investigating the problem which has not been clearly defined.
2. Simple Random Sampling means:
a) to select a sample is to select every 20th name on a list, every 10th house on one side of a
street and so on.
b) the population is stratified into a number of non-overlapping sub-populations or strata and
sample items are selected from each stratum.

MS 110 Research Methodology Uttarakhand Open University
Unit 3 Research Process and Review of Literature Page 52 of 434
c) multiple clusters of people are created from a population where they are indicative of
homogeneous characteristics and have an equal chance of being a part of the sample.
d) where each and every item in the population has an equal chance of being included in the
sample.
3. The basic objective of Review of Literature is to:
a) to provide theories, ideas, explanations or hypothesis which may prove useful in the
formulation of a new problem.
b) to show whether the evidence already available solves the problem adequately without
requiring further enquiry.
c) to prevent the replication.
d) All of the above
4. The Research Report should contain:
a) Preliminary Pages
b )Main text
c) End section
d) All of the above
3.5.3 FUNCTIONS OF REVIEW OF LITERATURE
There are five functions of review of literature:
1. Conceptual Frame of Reference: The first function, provides the conceptual framework
of research which involves both conceptual and research literature. The most direct way of
doing this is to read the basic writings in the field as well as the recent writings of key
thinkers. The researcher must feel fully satisfied when he has completed this phase of his/her
review that s/he is aware of all the information in the field and particularly that s/he has
devoted himself diligently to learning about the points of view which differ from or are
opposite to his/her own. The first function of review of literature provides the sound
conceptual framework of the research problem. S/He should feel that, in a debate or seminar,
s/he is able to represent any point of view fully, in the sense that he has come to understand
the arguments for that point of view.
2. Status of Research: The second function of the review of the literature is to provide an
understanding of the status of research in the field. This comes from reviewing the research
literature. This phase has several specific sub-functions which can be described in terms of
the questions: what, when, who and how. These four words provide the basic information
which reveals the status of the research in hand. First, through the review of literature, the
researcher acquires what researches have already been undertaken and completed in the
problem area and the outcomes of those researches. The unnecessary repetition can be

MS 110 Research Methodology Uttarakhand Open University
Unit 3 Research Process and Review of Literature Page 53 of 434
avoided. Learning about research in progress is difficult to locate. After acute review of
conceptual and research literature in such an area, a researcher may develop confidence about
his/her problem under study. In addition to learning what has been done, the researcher seeks
to identify when the research has been done, specifically how current research has been done,
specifically how current research in the problem area is. There are periods of time in which a
great deal of research is done in the problem area. Learning when previous research has been
conducted has several meanings for researcher:
It will determine how far back his/her literature review will follow chronologically.
When the issue region is full of latest studies.
When a latest absence of interest in the sector has occurred, s/he will have to go back
further until he gets to the studies.
Replication is reasonable when a research study gave rise to some present conviction
that the results still hold true.
3. Research Approach, Method, Instrumentation and Data Analysis: This review
function will serve the third function to provide methodology and instrumentation hints. In
particular, the investigator will want to know to what extent the historical survey or
experimental method has been used by prior studies in the issue region, as this will assist
guide his/her own study strategy. For the same reason, s/he will want to define the research
methods that were used to assist him/her select his/her own. Finally, s/he seeks to familiarize
himself/herself with the data collection tools that have been used so that if a current tool is
suitable, it can be used intact or adjusted for his own studies. In addition, s/he should also be
interested in what alternative approaches techniques and tools have been considered and/or
tested and why they have been dismissed.
4. Probability of Success and Significance of Findings: With the complete body of the
prior studies being reviewed, the investigator is in a situation to assess the achievement of
other researchers in the issue region and the usefulness of their results. If others have been
effective and results are helpful, then the prognosis for his/her own studies is good, and it is
evident and easy to create the choice to continue the study. However, if others have been
unsuccessful and produced inconclusive research or research of little value, then the research
era more difficult to make decision. S/he must ask himself/herself whether there are specific
reasons to believe that s/he can succeed where all others have failed. If the researcher has
some new idea, some new method, some new instrument, which leads him/her to believe s/he
will succeed where all others failed, then he has every right to proceed.
5. Definitions, Assumptions, Limitations, and Hypotheses: The Researcher will use the
literature material as the grounds for his/her definitions, hypotheses, constraints, and
hypotheses. Having read the works presenting view and theory in the issue region and having
also checked the appropriate studies, the investigator should be fully acquainted with how
terms were used, both in the theoretical sense in the conceptual literature and in the more
functional sense in the literature of the studies. Thus, s/he should be able to formulate the
MS 110 Research Methodology Uttarakhand Open University
Unit 3 Research Process and Review of Literature Page 54 of 434
definitions for his/her contemplated project, where necessary. However, s/he is free to adapt
previous definitions or formulate new ones. The essential point is that this be a knowledge
decision made with full awareness of how key terms have been used previously. The
Literature is also used to form certain assumptions for the research.
3.6 SUMMARY Research's primary goal is to find out the hidden reality that has not yet been found. The
Research Process starts with the identification and formulation of the problem followed by
extensive review of literature. When the research problem has been specified, the researcher
should take stock of his/her reading to date, particularly reviewing its importance in the light
of the newly specified research problem. S/he will want to ascertain whether the conceptual
literature already reviewed provides a thorough conceptual framework for the specific
problem that s/he has new decided upon, or whether further work is needed in the conceptual
literature. The review of literature helps in the formulation of hypothesis. Next step is to plan
the research design and select a sampling design. Data evaluation and analysis is performed
to determine the study outcomes. A good researcher must have the quality to become friendly
with respondents. If the people are not co-operating to give correct data, the researcher should
not be discouraged and face the difficulties, it would be called a good researcher. He should
not have prejudice or bias study about a problematic situation but s/he should be capable of
providing clear information. S/he should have the capacity to collect more and more
information in little time.
3.7 GLOSSARY
Research: It is a science and systematic search for relevant data on a particular subject. In
fact, it is an art of scientific investigation.
Research methodology: It is a way to address the research problem systematically. It's a
science of learning how scientifically research is accomplished.
Basic Research: It is an inquiry into fundamental values and reasons for a case or process or
phenomenon to occur.
Applied research: In an applied research one solves certain problems employing well known
and accepted theories and principles.
Quantitative research: It is numerical, non-descriptive, utilizes numbers and applies
statistics or mathematics.
Qualitative research: It is non-numerical, descriptive, applies reasoning and uses words. Its
aim is to get the meaning, feeling and describe the situation.
Exploratory Research: It is used to investigate the problem which has not been clearly
defined. It involves a literature search or conducting focus group interviews

MS 110 Research Methodology Uttarakhand Open University
Unit 3 Research Process and Review of Literature Page 55 of 434
Descriptive research: It involves various types of surveys and fact-finding inquiries. The
main aim of descriptive research is to describe the current state of affairs.
Explanatory research: The primary goal of this research is to understand or to explain
relationships. It uses correlations to study relationships between dimensions or characteristics
off individuals, groups, situations, or events.
Longitudinal Research: Research carried out longitudinally involves data collection of same
variables at multiple points in time.
Cross-sectional Research: One-shot or cross-sectional studies are those in which data is
gathered once, during a period of days, weeks or months. Many cross-sectional studies are
exploratory or descriptive in purpose.
Action research: This sort of research focuses on results of facts to enhance the social
world's quality of action.
Classification research: It aims at categorization of units in to groups and to demonstrate
differences and to explain relationships between them.
Comparative research: The objective of this type of research to identify similarities and
differences between units at all levels.
Causal research: It aims at establishing cause and effect relationship among variable.
Simple random sampling: This type of sampling is also referred to as chance sampling or
probability sampling where each and every item in the population has an equal chance of
being included in the sample and each of the possible samples has the same probability of
being selected in the case of a finite universe.
Systematic sampling: In some cases, the best way to sample is to pick from a list every 20th
name, every 10th house on one side of the road, and so on.
Stratified sampling: If the population from which the sample is to be drawn is not
homogeneous, then stratified sampling method is implemented to acquire a representative
sample.
Cluster sampling: It is described as a sampling method where various clusters of individuals
are formed from a population where they are indicative of homogeneous features and have
equal opportunities to be component of the sample.
Area sampling: Under area sampling, we first split the complete region into a number of
smaller non-overlapping areas, usually called geographic clusters, then randomly select a
number of these smaller fields and include all units in the sample in these small areas.
Convenience sampling: A convenience sample is a type of non-probability sampling method
where the sample is taken from a group of people easy to contact or to reach.

MS 110 Research Methodology Uttarakhand Open University
Unit 3 Research Process and Review of Literature Page 56 of 434
Judgment sampling: It is a sort of random sample chosen on the basis of an expert's view.
Results acquired from a sample of assessment are subject to some degree of bias owing to
lack of identical frame and population.
Quota sampling: The cost of taking random samples from individual strata is often so costly
in stratified sampling that interviewees are simply given quota to be filled from distinct strata,
the real choice of sample products is left to the judgment of the interviewer. This is called
sampling of the quota.
Snowball sampling: Snowball sampling can be described as a method for collecting study
participants by identifying an original topic used to give other respondents ' names.
Literature: It refers to the knowledge of a particular area of enquiry of any discipline which
includes theoretical, practical and its research studies.
Review: It means to organize the knowledge of the specific area of research to develop a
bundle of knowledge to show that his study would be an addition to this field.
3.8 ANSWERS TO CHECK YOUR PROGRESS
Check your progress-A
Choose the correct alternative.
1. (b)
2. (d)
3. (d)
4. (d)
3.9 REFERENCES
Kumar Ranjit, Research Methodology: a step-by-step guide for beginners. Sage
Publications, Third edition, 2011.
Singh K. Yogesh, Fundamentals of Research Methodology and Statistics. New
Age International (P) Ltd. Publishers, 2006.
Kothari R. C., Research Methodology: Methods and Techniques. New Age
International (P) Ltd. Publishers, Second Revised Edition, 2004.
MS 110 Research Methodology Uttarakhand Open University
Unit 3 Research Process and Review of Literature Page 57 of 434
http://www.studylecturenotes.com/social-research-methodology/10-steps-in
research-process
3.10 SUGGESTED READINGS
1. Zikmund G. William, Business Research Methods. Thomson South western
Publication,2003.
2. Cooper R. Donald, Schindler S. Palmer, Business Research Methods. The McGraw-
Hill/ Irwin,Twelfth Edition, 2011.
3.https://www.wisdomjobs.com/e-university/research-methodology-tutorial-
355/research-process-in research-methodology-11340.html
4.https://owlcation.com/academia/Why-Research-is-Important-Within-and-Beyond-
the-Academe
3.11 TERMINAL QUESTIONS
1. What is the meaning of Research? Discuss its objectives?
2. Explain the various kinds of Research?
3. Describe in detail the Process of Research?
4. What is the meaning of Review of Literature?
5. What are the various sources of review of literature?
6. What are the functions of review of literature?

MS 110 Research Methodology Uttarakhand Open University
Unit 4 Problem Formulation and Statement of Research Objectives Page 58 of 434
UNIT 4 PROBLEM FORMULATION AND
STATEMENT OF RESEARCH OBJECTIVES
4.1 Introduction
4.2 Objectives
4.3 Formulating of Research Problem
4.4 Statement of Research Problem
4.5 Concepts of Formulating and Statement of Research Problem
4.6 Importance of Formulating and Statement of Research Problem
4.7 Basic Process of Formulation of Research Problem
4.8 Summary
4.9 Glossary
4.10 Answer to Check Your Progress
4.11 References
4.12 Suggested Readings
4.13 Terminal & Model Questions
4.14 Case Lets/Cases
4.1 INTRODUCTION “A research problem is a definite or clear expression [statement] about an area of concern,
a condition to be improved upon, a difficulty to be eliminated, or a troubling question that
exists in scholarly literature, in theory, or within existing practice that points to a need for
meaningful understanding and deliberate investigation. A research problem does not state
how to do something, offer a vague or broad proposition, or present a value question.” Alan
Byrman
In this unit you will learn about the most pivotal research problem of formulation and
statement of research objectives. The starting stage of the study company is identification and
problem formulation. Its importance cannot be sufficiently emphasized, because a study
enterprise's success depends on the choice of a suitable issue and its correct formulation.
While a defective choice may fail to maintain the interest of the researcher in the research, a
deficient wording may land the researcher at subsequent phases in unexpected problems.
MS 110 Research Methodology Uttarakhand Open University
Unit 4 Problem Formulation and Statement of Research Objectives Page 59 of 434
It's a difficult and time consuming job for the same reason. Darwin, took years to find and
formulate his problem. Impatience in this respect does not pay. Though patience need not be
mistaken here for complacence which is what may happen in many cases. Merton, a known
sociologist observes "It is often harder to discover and formulate an issue than to fix it."
Indeed, this is a job that deserves severe attention and tremendous patience. The problem of
research is a question a researcher would like to reply or an issue a researcher would like to
fix. The first stage in the study phase is to identify and formulate a research problem
declaration. However, it is regarded to be one of any study project's challenging and hard
stage. Selecting a successful research problem is thought to be a discovery in itself. Research
problem selection relies on several variables such as the abilities of the researcher,
knowledge, interest, competence, motivation, creativity with regard to the topic of
investigation. There is nothing but wisdom in the saying – “If you start from nowhere you
will generally reach there.”
Once the overall subject or issue has been recognized, it should be indicated as a definite
research problem, i.e. taken from a declaration about a issue scenario to a clearly specified
researchable problem that defines the problems you are attempting to tackle.
Formulating the research problem merely and obviously is not always simple. The researcher
may spend years in researching and exploring in some fields of social science or scientific
research before they are clear on what studies questions they are trying to answer. Many
subjects may prove too broad to be a searchable issue. The problem is too wide to be
addressed by one researcher. Time and resources would render this unfeasible, resulting in a
lack of depth and concentrate on the outcomes of such a research. A problem in plain words
is some difficulty in a theoretical or practical scenario encountered by the researcher. The job
of research is to solve this difficulty.
4.2 OBJECTIVES After study of this unit you will understand the following:
To understand the difficulties that scientists face when formulating a searchable
issue.
To learn the distinction between a searchable issue.
To implement the principles learned by formulating a real research problem.
4.3 FORMULATING OF RESEARCH PROBLEM “A problem is an interrogative sentence or statement that asks what relation exists between
two or more variables.” (Kerlinger)
The problem clearly defines the researcher's goal. It is evident that the investigation would
only become a pointless exercise in the lack of a problem. Goal-driven research like any other
human activity one of the most significant components of the study is an appropriate
declaration of the study problem. Various researchers are likely to raise variety of research

MS 110 Research Methodology Uttarakhand Open University
Unit 4 Problem Formulation and Statement of Research Objectives Page 60 of 434
issues from the on-going scenario as there are many problems that may emerge from a
particular issue. Only one of your studies can be pursued in depth. To be efficient in planning
applied research, a problem statement should have the following features.
1. The problem reflects felt requirements.
2. The problem is not hypothetical, i.e. it must have factual proof.
3. It should suggest significant and testable hypotheses-to prevent responses that are of no use
in the alleviation of the problem.
4. The problems should be manageable and relevant.
Figure 4.1 Problem Statement
Formulating the research issue enables you to clarify the objective of your studies to both
yourself and the reader. Subsequent method development should be geared towards offering
data to tackle this issue. Therefore, the problem declaration is a very significant tool to keep
your research on track. It is also one way to evaluate your research-does the study tackle the
research problem as stated like in Figure 1.
4.4 STATEMENT OF RESEARCH PROBLEM Formulating the research problem is, in itself, a BIG problem. (Gladys Cruz)
“The problem statement actually articulates the problems to be addressed and indicates the
need for a study through the development of an argument, in other words, the problem
statement present the topic under study, provides a rational for the choice of topic, represents
a synthesis of fact and theory and direct the selection of design”. (R.S. Woodworth)
There are various sources and aspects of research problems like People, programs,
phenomenon and other problems. These are discussed briefly through picture:
Introducing the significance of studying a
particular problem
Placing the problem into a particular context which
reflects the element needed to investigate
Providing information about the tools required and the way in which study will
present the required information

MS 110 Research Methodology Uttarakhand Open University
Unit 4 Problem Formulation and Statement of Research Objectives Page 61 of 434
Table 4.2 Aspects of Study
4.5 CONCEPTS OF FORMULATING AND STATEMENT OF
RESEARCH PROBLEM
4.5.1. TYPES OF RESEARCH PROBLEM
There are different types of social science study problems that differ in the type, content, and
mode of verification which are explain as:
1. Empirical Problems: These are articulated as empirical problems when researchers
answer questions or problems based on what they learn through their sensory organs.
To confirm, approve or dismiss the theory, researchers base their conclusions and
findings on what they perceive or observe or sense.
2. Analytical Problems: Analytical problems dissect into the causing variables, the
impact of these variables, the variables offering a solution, the effectiveness of these
variables, etc.
3. Normative Problems: normative problems are problems that mainly rely on value
judgments for their responses. Value judgments are declarations of what is desirable,
preferable, moral or obligatory.
4. Theoretical Research Problem: This type of research problem explains the only
theory to the problem. So, this type of problem has no hypothesis or verification
involvement.
5. Action Research Problem: The problem of action studies is one that requires the
instant solution. It has millions of worldwide problems that sort of studies is ongoing
and requires fast emergency-based solution.

MS 110 Research Methodology Uttarakhand Open University
Unit 4 Problem Formulation and Statement of Research Objectives Page 62 of 434
4.5.2. CHARACTERISTICS OF GOOD RESEARCH QUESTION
“The most successful research topics are narrowly focused and carefully defined but are
important parts of a broad-ranging, complex problem.”
A good research is represented by acronym FINERMAPS;
Feasible
Interesting
Novel
Ethical
Relevant
Manageable
Appropriate
Potential value and publish-ability
Systematic.
Feasible
Feasibility implies it is within the investigator's capacity to perform. It should be
supported by an adequate amount of research topics, methodology, time and resources
to achieve findings. The range and scale of the project need to be realistic and have
access to individuals, records, statistics, etc. The ideas of the research question should
be able to be related to the observations, phenomena, indices, variables that researcher
can access. It should be evident that information collection and project proceedings can
be finished within the researcher's restricted moment and resources. Sometimes, a
research questions seems feasible, but it demonstrates otherwise when fieldwork or
research is began. In this scenario, writing up the research problems honestly and
reflecting on what has been learned is very essential.
Interesting
This is vital to have a true grounded interest in study issues and can be explored and
backed up by scholarly and intellectual discussion. Interest in research will motivate
one to pursue gaps and questions of particular studies.
Novel
The problem of research should not just copy questions that other employees are
investigating, but should have scope for investigation. It may strive to confirm or refute
the results already developed, identify fresh facts, or identify fresh elements of the facts
developed. It should be showing the researcher's imagination. The issue must be, above
all, easy and clear. A question's complexity can often conceal uncertain ideas and lead
to a confused method of studies. A very elaborate research question, or a issue not
distinguished into distinct components, may conceal contradictory or irrelevant ideas.
This must be evident and free from vagueness. The study will also be guided by one
main issue with several subcomponents.
Ethical

MS 110 Research Methodology Uttarakhand Open University
Unit 4 Problem Formulation and Statement of Research Objectives Page 63 of 434
This is the primary requirement for any study questions and it is compulsory to obtain
clearance from suitable officials prior to saying research into the subject. In addition,
study topics should be such that they minimize the danger of damage to research
participants, safeguard privacy and preserve confidentiality, and give members the right
to withdraw from study. It should also guide the avoidance of deceptive study methods.
Relevant
The issue in the field you have selected to study should be of scholarly and intellectual
concern to individuals. Preferably, the issue should emerge from problems that occur in
the present scenario, literature, or in practice. In regards to the selected sector, it should
set a clear objective for studies. Some of the appropriate study issues include, for
instance, filling a knowledge gap, analyzing scholarly assumptions or professional
practice, tracking a growth in practice, comparing distinct methods, or testing theories
within a particular population.
Manageable
It should have similar essence as of feasibility but most importantly that the following
research can be managed by the researcher.
Appropriate
Research questions should be appropriate, logical and scientific for the community,
organization, government and other institutions.
Potential value and publish-ability:
In community practices, the research can have a important health effect. Therefore, to
decrease unnecessary or excessive expenses, study should strive for significant
economic impact. In addition, the suggested research should exist within a framework
of clinical, consumer, or policy making that is likely to alter on the basis of evidence.
Above all, a good research question must tackle a subject that has clear consequences
for addressing significant dilemmas in choices taken by one or more stakeholder
organizations in health and health care.
4.5.3. DEFINING A RESEARCH PROBLEM
Formulating the study issue starts during the scientific process's first steps. For instance,
a review of literature and a survey of prior experiments and studies could give rise to
some vague fields of concern. Many science scientists are looking at an region where
some interesting findings were produced by a past investigator, but never followed up.
It could be an exciting study area that has not been fully investigated by anyone else. A
scientist may even review a good experiment, disagree with the outcomes, the tests
used, or the methodology, and decide to refine the method of studies and re-test the
hypothesis. This is called the conceptual definition, and is an overall view of the
problem. A science report will generally begin with an overview of the previous
research and real-world observations. The researcher will then state how this led to
defining a research problem.
Other characteristics are:

MS 110 Research Methodology Uttarakhand Open University
Unit 4 Problem Formulation and Statement of Research Objectives Page 64 of 434
Relevant: The problem will be of scholarly and intellectual concern as a result of
problems raised in literature and/or exercise.
Manageable: Researcher must be able to access your information sources (be they
documents or individuals) and answer your query in a complete and nuanced manner.
Substantial and original: The question should highlight researcher’s creative skills,
however far it may be in current literature.
Fit for evaluation: Distinctly recall, the learning outcomes of researcher’s course must
be satisfied. The research problem must be open and interesting for evaluation.
Clear and straightforward: As the research study advances, a clear and easy study
question will become more complicated. Start with an unbroken question then starting
the reading and writing.
Interesting: Making research question interesting and trying to avoid questions which
are convenient or flashy. Remember, researcher will be thinking about this question for
an entire year.
4.5.4. CONCEPTUALIZATIONS OF A RESEARCH PROBLEM:
1. Casuist Research Problem: This type of problem is related in determining what is
right and wrong in questions of conduct by analyzing moral dilemmas with the help of
application of general norms and the careful selection of some special research
problem.
2. Difference Research Problem: Typically asks, "Is there a differentiation between
two or more treatments or groups?" When the researcher compares or contrasts two or
more phenomena, this sort of issue declaration is used. In clinical social sciences or
behavioral sciences, this is a popular approach to identifying a problem.
3. Descriptive Research Problem: Typically asks, "what is ...?" with the underlying
purpose of describing the meaning of a particular phenomenon's situation, state, or
existence. This research problem is often connected with revealing problems that are
hidden or understood.
4. Relational Research Problem: Suggests a association of some kind to be explored
between two or more variables. The underlying aim is to explore particular features or
qualities that may be linked in some measured way.
4.5.5. SOURCES OF PROBLEMS FOR INVESTIGATION
Identifying a problem to study can be challenging, not because there is a shortage of
problems that could be explored, but because of the challenge of formulating a distinctive
academically appropriate and researchable issue that does not simply duplicate others ' job.
Consider these sources of inspiration to facilitate how you can select a problem from which
to develop a research study:

MS 110 Research Methodology Uttarakhand Open University
Unit 4 Problem Formulation and Statement of Research Objectives Page 65 of 434
Deductions from Theory
It refers to deductions that the researcher is acquainted with from social philosophy or
generalizations embodied in life and society. Through studies, these deductions from
human conduct are then put within an empirical reference frame. From a theory, in
certain empirical circumstances, the researcher can formulate a research problem or
hypothesis indicating the intended results. The study asks: "What connection will be
observed between variables if theory summarizes the state of affairs
appropriately?"One can then design and conduct a systematic investigation to
evaluate whether the hypothesis and hence the theory is confirmed or rejected by
empirical information.
Interdisciplinary Perspectives
Identifying a problem that forms the basis for a research study can come from
academic movements and scholarship originating in disciplines outside of your
primary area of study. This can be an intellectually stimulating exercise. A review of
pertinent literature should include examining research from related disciplines that
can reveal new avenues of exploration and analysis. An interdisciplinary approach to
selecting a research problem offers an opportunity to construct a more comprehensive
understanding of a very complex issue that any single discipline may be able to
provide.
Interviewing Practitioners
Identifying research problems on specific subjects can result from formal interviews
or informal conversations with professionals that provide insight into fresh directions
for future studies and how to make research results more practical. Discussions with
field specialists, such as educators, social workers, health care providers, attorneys,
company leaders, etc., provide an opportunity to recognize practical, "true world"
problems that can be understood or ignored in scholarly circles. This strategy also
offers some practical understanding that can assist in the design and conduct of your
research method.
Personal Experience
Do not underestimate daily experiences or encounters as worthwhile investigative
issues. Thinking critically about one's experiences and/or frustrations with a social,
community, neighbourhood, family, or private problem. For example, this can be
derived from deliberate observations of certain relationships for which there is no
clear explanation or evidence of an event that appears harmful to a person or group or
is out of the ordinary.
Relevant Literature
The ultimate decision of a study issue can be obtained from a thorough analysis of
relevant studies related to your general interest region. This may show where there are
gaps in understanding a subject or an understood problem.

MS 110 Research Methodology Uttarakhand Open University
Unit 4 Problem Formulation and Statement of Research Objectives Page 66 of 434
4.5.6. WHAT IS THE NECESSITY OF DEFINING THE RESEARCH
PROBLEM?
We all hear quite often that a obviously stated problem is a half-solved problem. This
declaration means that a research problem needs to be defined. The issue to be explored must
be described unambiguously in order to assist the irrelevant information to be discriminated
against. A adequate definition of research problem will allow the researcher to be on the line,
whereas hurdles may be created by an ill-defined issue. Questions such as: What information
should be gathered? What information features are important and need to be studied? What
relationships to explore. What are the methods to use for this purpose? And comparable
issues arise in the researcher's mind, who can plan well defined. In reality, it is often more
vital to formulate a problem than to solve it. Only by carefully detailing the research problem
can we work out the design of the research and can carry out all the consequential measures
engaged in the research smoothly.
4.6 IMPORTANCE OF FORMULATING AND STATEMENT
OF RESEARCH PROBLEM The proper and clear definition of a research problem is a vital component of a research study
and must not be achieved hastily in any situation. However, this is often ignored in practice,
which later creates a lot of issues. It is therefore necessary to define the research problem in a
systematic way, providing due weighting to all related points.
1. Formulation of research problem is first and foremost step in the research process.
2. It is more like identifying the destination before undertaking a journey.
3. In the absence of a clear research problem, a clear and economical plan is impossible.
4. Research problem is like foundation of a building on which the type of research and design
are dependent.
5. If the foundation is well designed and strong one can expect building to be strong as well.
6. Controversial research topic should not be the decision of researcher in order to well define
the problem.
Check Your Progress-A
Choose the correct option for the Multiple Choice Questions out of the given options for
each question:
1. Which of the following is the first step in starting the research process?
a. Searching sources of information to locate problem.

MS 110 Research Methodology Uttarakhand Open University
Unit 4 Problem Formulation and Statement of Research Objectives Page 67 of 434
b. Survey of related literature.
c. Identification of problem.
d. Searching for solutions to the problem.
2. The statement of purpose in a research study should:
a. Identify the design of the study.
b. Identify the intent or objective of the study.
c. Specify the type of people to be used in the study.
d. Describe the study.
3. Sources of researchable problems can include:
a. Researchers’ own experiences as educators.
b. Practical issues that require solutions.
c. Theory and past research.
d. All of the above
4. Which of the following is a criterion for a good research question?
a. Questions should be long and use complex terms.
b. Questions should show where my research biases are.
c. Questions should sound contemporary.
d. Questions should connect with established theory and research.
4.7 PROCESS OF FORMULATION OF RESEARCH
PROBLEM The methods engaged in identifying a research issue are a vital component of a research
study and must not be achieved hastily in any situation. However, this is often ignored in
practice, which later creates a lot of issues. It is therefore necessary to define the research
problem in a systematic way, providing due weighting to all related points. The method for
formulating research problem is usually includes taking the following steps one by one which
are explained in detail in Figure 2.
The analytical points to be focused while addressing the research problem is:
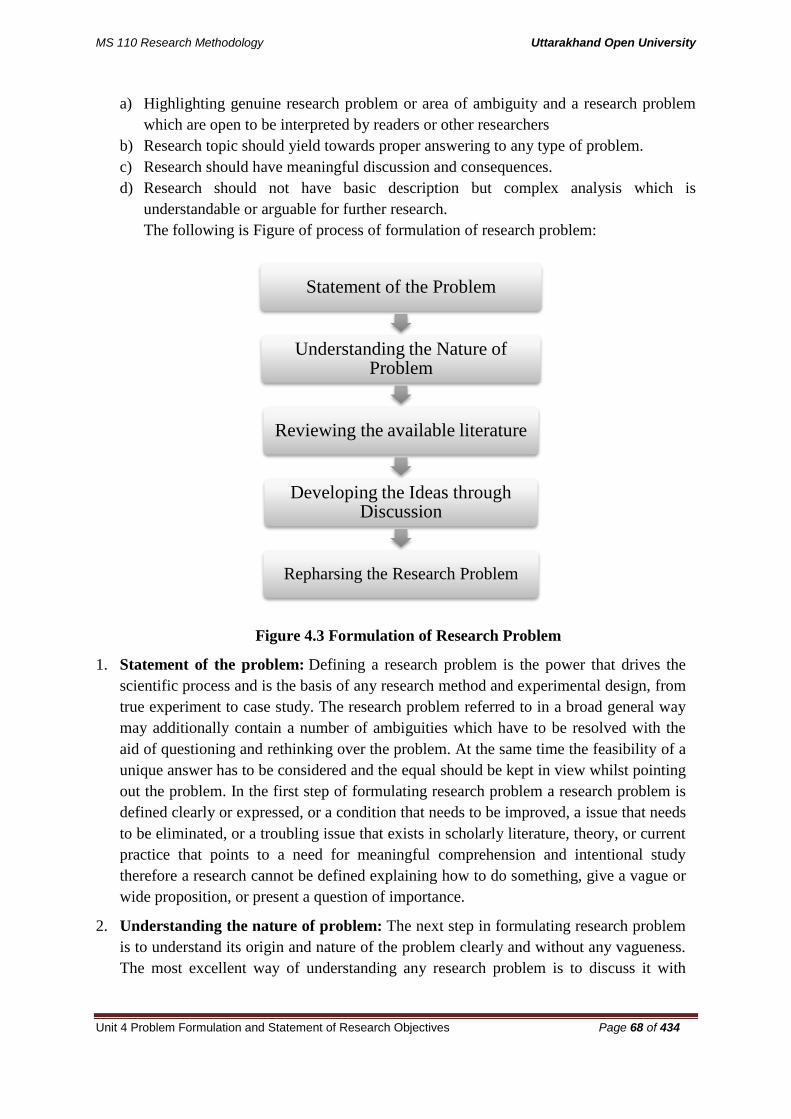
MS 110 Research Methodology Uttarakhand Open University
Unit 4 Problem Formulation and Statement of Research Objectives Page 68 of 434
a) Highlighting genuine research problem or area of ambiguity and a research problem
which are open to be interpreted by readers or other researchers
b) Research topic should yield towards proper answering to any type of problem.
c) Research should have meaningful discussion and consequences.
d) Research should not have basic description but complex analysis which is
understandable or arguable for further research.
The following is Figure of process of formulation of research problem:
Figure 4.3 Formulation of Research Problem
1. Statement of the problem: Defining a research problem is the power that drives the
scientific process and is the basis of any research method and experimental design, from
true experiment to case study. The research problem referred to in a broad general way
may additionally contain a number of ambiguities which have to be resolved with the
aid of questioning and rethinking over the problem. At the same time the feasibility of a
unique answer has to be considered and the equal should be kept in view whilst pointing
out the problem. In the first step of formulating research problem a research problem is
defined clearly or expressed, or a condition that needs to be improved, a issue that needs
to be eliminated, or a troubling issue that exists in scholarly literature, theory, or current
practice that points to a need for meaningful comprehension and intentional study
therefore a research cannot be defined explaining how to do something, give a vague or
wide proposition, or present a question of importance.
2. Understanding the nature of problem: The next step in formulating research problem
is to understand its origin and nature of the problem clearly and without any vagueness.
The most excellent way of understanding any research problem is to discuss it with
Statement of the Problem
Understanding the Nature of Problem
Reviewing the available literature
Developing the Ideas through Discussion
Repharsing the Research Problem

MS 110 Research Methodology Uttarakhand Open University
Unit 4 Problem Formulation and Statement of Research Objectives Page 69 of 434
those who first raised it in order to find out how the problem originally came about and
with what objectives in view i.e. by reviewing the existing research papers or going
through case studies. If the researcher has stated the problem herself/himself, she/he
should consider once again all those points that induced her/him to make a general
statement concerning the problem. The researcher should also keep in view the
environment within which the problem is to be studied and understood. In this step the
nature of research problem should be understood precisely and in detail.
3. Reviewing the available literature: All existing literature on the problem at hand must
necessarily be examined and examined before defining the study problem. This implies
that, like all other relevant literature, the researcher must be familiar with appropriate
theories in the domain, reports and documents. The researcher must spend adequate
time to review research on associated problems that has already been conducted. This is
performed to find out what information and other equipment for operational reasons are
accessible, if applicable on any. In this step researcher would come to know if there is
any gap in the studies or theories, or whether the existing theories are applicable to the
problem or whether the findings of the different studies follows a desired pattern or not.
All this will allow a researcher to take fresh steps for knowledge advancement in the
sector. Studies on associated problems are helpful to indicate the sort of difficulties that
may be experienced in this research as well as possible analytical weaknesses. Such
studies may also sometimes suggest useful and even new approach lines to the present
issue.
The most important feature of reviewing literature reviews are:
a) Give a fresh interpretation of existing content or combine new with old
ideas,
b) Tracing the research study progress, including significant discussions.
c) Assess the sources and advise the researcher on the most appropriate studies.
d) Recognizing where there are gaps in how a research problem has been
investigated.
4. Developing the ideas through discussions: Discussion about an problem often
generates helpful data. Through debates, various fresh concepts can be created. A
researcher must therefore address the issue with peers and others who have sufficient
expertise in the same region. This is often referred to as a study of experiences. People
with a good amount of experience are able to educate the researcher on various elements
of her/his proposed research and their suggestions and remarks are generally invaluable
to the researcher. They aid her/him sharpen his/her focus on particular field elements.
Discussions with these people should not be restricted solely to formulating the
particular problem at hand, but should also be concerned with the general approach to
the given problem, techniques that might be used properly and also have possible
solutions.
5. Rephrasing the research problem: Finally in the last step of research formulation, the
researcher has to sit down to rephrase the problem of studies into a working proposal.

MS 110 Research Methodology Uttarakhand Open University
Unit 4 Problem Formulation and Statement of Research Objectives Page 70 of 434
Once the nature of the problem has been clearly understood, the environment (wherein
the problem has to be studied) has been defined, discussions have taken place over the
problem and the available literature has been reviewed and examined, rephrasing the
problem in analytical or operational terms is not a difficult task. The researcher
rephrases the research problem in as particular terms as possible so that it can become
operationally feasible and assist develop working hypotheses.
4.7.1. HOW TO ASSESS WHETHER THE DEFINED RESEARCH
PROBLEM IS A GOOD RESEARCH PROBLEM?
A research problem may not be desirable in its first definition. To make it useful, it may
demand redefinition. It can be rendered to fulfil the requirements of a successful research
problem by properly re-wording or re-formulating the selected research problem. This is also
essential in order to effectively solve the problem. A researcher can ask a set of questions
about the present research problem for this purpose. For example:
(1) Is the research problem really interesting to the scientific community?
(2) Is the research problem significant to the present status of the study?
(3) Is there sufficient supervision/guidance?
(4) Can the research problem be solved in the required time frame?
(5) If there are necessary equipments, adequate library and computational facilities, etc.
available?
If the answers to these questions are satisfactory, the researcher will be able to start work on
the selected problem. Additionally, discuss the issue with present learners and researchers to
gain the extent of the research problem and other associated elements.

MS 110 Research Methodology Uttarakhand Open University
Unit 4 Problem Formulation and Statement of Research Objectives Page 71 of 434
Table 4.4 Examples of Bad Research Questions and Good Research Questions
4.8 SUMMARY Defining the issue or chance is the first step in any business research project. To prevent
receiving the correct response to the incorrect issues, decision makers must communicate
their goals to scientists.
It is often difficult to define the issue in that parts of the issue can be concealed from
perspective. Research must assist in isolating management and identifying the issue to
guarantee that the true issue is investigated rather than a symptom.
A variable is something that changes the value. Variables may be constant or categorical. One
aspect of problem definition is the identification of the key dependent variables and the key
independent variables. Questions and hypotheses of studies are translations of the company
issue into terms of business research. A hypothesis is an unproven proposal or a feasible
problem-solving solution. Hypotheses state relationships that can be empirically tested
between variables. The research goals indicate the requirements for data. The research must
be indicated in terms of clear and accurate study goals in order to be effective in the research
project.

MS 110 Research Methodology Uttarakhand Open University
Unit 4 Problem Formulation and Statement of Research Objectives Page 72 of 434
The research proposal is a written research design statement that makes the research method
operational for the particular issue. The research proposal enables managers to assess the
information of the suggested research and determine whether changes are necessary. The
chapter below will include most study proposals. Research purpose, research design, sample
design, methods for information collection and/ or field job, information handling and
analysis, budget and timetable.
4.9 GLOSSARY Bias: Any influence that distorts the results of a research study (see
ascertainment bias, recall bias, non-response bias, observer expectation bias, participant
expectation bias, selection bias, information bias, allocation concealment, blinding,
randomization).
Closed question: It is a question to which individuals are required to give one of several
answers specified in advance by investigators. Questionnaires usually involve mostly closed
questions, but these types of question are not suitable for qualitative research e.g. an in depth
interview.
Control: Processes employed to hold the conditions under which an investigation is carried
out uniform or constant. In a true experimental design, the control group is the group that
does not receive the intervention or treatment under investigation. The scores on the outcome
for the control and the experimental groups are used to evaluate the effect of the independent
variable. In other experimental designs, this group may be referred to as the comparison
group (see also control group).
Helsinki (declaration of): A declaration designed to ensure that research is conducted
ethically
Literature review: A narrative describing an appraisal of previous research or literature on a
subject
Methodology (or Research Methods): A particular procedure or set of procedures. These
may include the methods, techniques and instruments used in a research experiment.
Open-ended: A type of question (also known as an open question) where it is left up to the
respondent to volunteer an answer.
Population: the target group under investigation. The population is the entire set under
consideration. Samples are drawn from populations.
Reliability: The degree to which scores obtained with an instrument are consistent measures
of whatever the instrument measures.
Research process: The process undertaken by researchers to answer research
questions/hypotheses.

MS 110 Research Methodology Uttarakhand Open University
Unit 4 Problem Formulation and Statement of Research Objectives Page 73 of 434
Research question: A clear statement in the form of a question of the specific issue that a
researcher wishes to answer in order to address a research problem. A research problem is an
issue that lends itself to systematic investigation through research.
Research proposal: A detailed description of a piece of research that a researcher or
researchers propose to carry out
Response bias: A type of bias seen in epidemiological studies where the responses of the
participant may be influenced by the researchers or interviewers; i.e. when their responses
differ from their actual beliefs.
Research problem: A problem that someone would like to research; it is the focus of a
research investigation.
Research proposal: A detailed description of a proposed study designed to investigate a
given problem.
Research report: A description of how a study was conducted, including results and
conclusions.
Research: The formal, systematic application of scholarship, disciplined inquiry, and most
often the scientific method to the study of problems. R
Researcher bias: A situation in which the researcher's hopes or expectations concerning the
outcomes of the study actually contribute to producing various outcomes, thereby creating a
threat to internal validity.
Validity: The degree to which data and results are accurate reflections of reality. Validity
refers to the concepts that are investigated, the people or objects that are studied; the methods
by which data are collected; and the findings that are produced.
4.10 ANSWERS TO CHECK YOUR PROGRESS:
Check your progress--A
Choose the Correct alternative
Ans: 1. d.
2. b.
3. d.
4. d.

MS 110 Research Methodology Uttarakhand Open University
Unit 4 Problem Formulation and Statement of Research Objectives Page 74 of 434
4.11 REFERENCES
Ahuja, M. K., Chudoba, K. M., Kacmar, C. J., McKnight, D. H., & George, J. F.
(2007). IT road warriors: Balancing work-family conflict, job autonomy, and
work overload to mitigate turnover intentions. Mis Quarterly, 1-17.
Chawla, D., &Sodhi, N. (2011). Research methodology: Concepts and cases.
Vikas Publishing House.
Grinnell Jr, R. M., &Unrau, Y. (2005). Social work research and evaluation:
Quantitative and qualitative approaches. Cengage Learning.
Kerlinger, F. N. (1966). Foundations of behavioral research.
Zikmund, W. G., Babin, B. J., Carr, J. C., & Griffin, M. (2013). Business research
methods. Cengage Learning.
4.12 SUGGESTED READINGS
1. Fred N. Kerlinger. Foundations of Behavioural Research, Surjeet Publications,
Delhi.
2. O.R.KrishnaSwamy. Methodology of Research in Social Sciences, Himalaya
Publishing House, Mumbai.
3. T.S.Wilkinson&P.L.Bhandarkar. Methodology and Techniques of Social Research,
Himalaya Publishing House, Mumbai.
4. C.R.Kothari. Research Methodology, Wiley Eastern, New Delhi.
5. V.P.Michael. Research Methodology in Management, Himalaya Publishing House,
Mumbai.
4.13 TERMINAL QUESTIONS
1. What is a research problem? Explain the sources of research problems.
2. What are the different stages in a formulating research problem?

MS 110 Research Methodology Uttarakhand Open University
Unit 4 Problem Formulation and Statement of Research Objectives Page 75 of 434
3. What do you mean by a problem? Explain the various points to be considered while
selecting a problem.
4. What are the characteristics and importance of formulating and statement of
research problem?
5. What are the various sources for investigating the problem of research.
4.14 CASE LETS/CASES Online Booking- Has the time come?
The day is not very far when the Indian travelers can crisscross the globe with just a few
clicks. Taking e-commerce and information technology services a step further, the Indian
travel industry is composing itself to usher in the era of e-ticketing.
On-line booking involves pursuing of available information on travel websites and then
making a reservation. However, if you are not the kind who prefers a particular airline, then
you can check out travel sites, which collate flights details of all airlines, and are the apt place
to book or bid for air tickets. Travel portals, such as, travelguru.com, arzoo.com, yatra.com,
indiatimes.com, rediff.com, makemytrip.com, and cleartrip.com, would provide you all
details of flights along with their fares In an ascending order, i.e., the lowest priced, ticket is
featured first, on its web page.
The number of consumers who book travel tickets online is growing. But a switch from
offline environment to online environment creates certain doubts in the minds of consumers.
Such doubts have been termed as perceived risks in literature.
Also, the Internet revolution has brought about significant changes in market transparency,
defined as the availability and accessibility of information to market participants. For
example, air travelers can use online travel agencies to browse through hundreds of travel
offers to their destination, compared to typically few offers from a traditional travel agent or
airline prior to the Internet era.
Generally, market transparency seems to benefit consumers because they are able to better
discern the product that best fits their needs at a better price. However, there still is a large
percentage of population who get their tickets booked through the traditional queuing system.
The advent of e-ticket booking over the past couple of years has led to the mushrooming of
online travel agencies. These online service providers have in fact come up with a wide
variety of services for faster and more convenient mode of ticket booking. They offer a host
of services starting from booking something as mundane as a train or flight ticket to
something as exotic as a holiday. They offer various packages which have the entire itinerary
for the proposed holiday. They even offer a convenient pick-up and drop service. With such a
range of services being offered at your fingertips, expectations are that more and more

MS 110 Research Methodology Uttarakhand Open University
Unit 4 Problem Formulation and Statement of Research Objectives Page 76 of 434
number of travelers would start using such easy, fast and convenient services as compared to
the conventional booking process across a reservation counter. Yet, we still observe long
queues at the various reservation counters. And, we also know that there are a number of
people who use the online services available to book their travel than through traditional
travel booking counters.
Srininandan Rao, CEO of Ghoom.com, a travel portal that has been in existence for the past
three years wondered whether he can look at a bigger customer base for his travel booking
business or look at an alternative e-business.
Questions:
1. What is the kind of research study that you can undertake for Mr Rao?
2. Formulate the research problem and the objectives of your study. Can you suggest an
alternative research approach that you can take?
3. Develop a working hypothesis for your study.
MS 110 Research Methodology Uttarakhand Open University
Unit 5 Research Designs-I Page 77 of 434
UNIT 5 RESEARCH DESIGNS-I
5.1 Introduction
5.2 Objectives
5.3 Meaning of Research Design
5.4 Description of Research Design
5.5 Characteristics of Good Research Design
5.6 Classification of Good Research Design
5.7 Importance of Research Design
5.8 Need of Research Design
5.9 Advantages of Research Design
5.10 Concept Relating to Research Design
5.11 Comparison of Research Designs
5.12 Exploratory Research Designs
5.13 Descriptive Research Design
5.14 Procedures for Descriptive Research Designs
5.15 Causal / Experimental Research
5.16 Relationship between Exploratory, Descriptive and Causal Research
5.17 Sources of Error
5.18 Summary
5.19 Glossary
5.20 References
5.21 Suggested Readings
5.22 Terminal and Model Questions
5.23 Case Study
5.1 INTRODUCTION
As the research proposal is prepared, the researcher then tries to work out on the details
regarding what have to be done, when have to be done and why have to be done? S/he has to
conduct out a various research designs to be matched with the problem, considering a sample,
the method of arranging and collecting the data. Therefore, a research design can be
described as planning done for the conduct of investigation. The researcher should give
sufficient time and energy in developing a research design. The current unit will discuss why
the research designs need to be developed and methods of developing so.

MS 110 Research Methodology Uttarakhand Open University
Unit 5 Research Designs-I Page 78 of 434
5.2 OBJECTIVES
In this unit you will be able to;
learn concept relating to Research Design.
classify Research Design.
know sources of errors
5.3 MEANING OF RESEARCH DESIGN
A research design is a systematic plan developed to study the research problem. It includes
planning about the research, considering the collection, measurement and analysing the data.
William Zikmund has described research design as a master plan specifying the methods and
procedures for collecting and analysing the needed information. The research usually
considers the following questions are as follows:
a) Why is the study been conducted?
b) What is the kind of data required?
c) Where is the required data available?
d) What method will be used for sampling?
e) What method would be used for results?
Moreover, research design generally includes the following tasks:
1. Define the information to be needed for which design is to be drawn.
2. Designing of methods of research i:e whether exploratory, descriptive or casual.
3. Prescribe the measurement and scaling procedures.
4. Developing of questionnaire.
5. Lay down the process of sampling and its size.
6. Define the plan for data analysis.
Once the problem is known to the researcher, s/he must develop a research design
accordingly. The designs related to marketing research projects must be reliable and valid.
The designs so developed must be able to tackle the problems that may arise in future.
A functional design must include these:
a) The sampling design- it considers method of selecting and defining the sampling
units.
b) The observational design- defines the conditions under which data has to be collected.
c) The statistical design- it describes analysis procedure of data collection and in turn
how many units have to be observed.
d) The operational design- it trades the techniques using the above specified procedures
in sampling, statistical and observational design can be carried out.

MS 110 Research Methodology Uttarakhand Open University
Unit 5 Research Designs-I Page 79 of 434
As given by E.A Schuman “Research design is not a highly specific play to be followed
without deviations but rather a series of guide posts to keep one-headed in the right
direction.”
5.4 DESCRIPTIONS OF RESEARCH DESIGN
CATEGORY OPTIONS
Degree to which research questions has been
formalised
Exploratory/ formal study.
Purpose of the research Descriptive/ casual study.
Control over variables Experimental/ ex-post facto study.
Time involved Cross-sectional/ longitudinal study.
Degree for Formalisation of Research Questions:
A study can be exploratory or descriptive depending on the nature and objectives of the
study. In exploratory study we need to develop a hypothesis and as this study is over we need
to describe the procedures for conducting and determining our research objectives. The basic
goal of formal research design is testing of the hypothesis and answering of the questions so
proposed.
Purpose of the Research
The basic difference between descriptive and causal researches it about their objectives and
the structure of the research. Basically descriptive research is concerned about finding when,
where and how of the problem and causal research considers about learning that is why one
variable influences the other variables.
Control over Variables
Here, the researcher tries to manipulate the variables of interest in experimental study. This
research is suited when the objective is to find out whether certain variables produce effects
in other variables whereas in ex-post the researcher lacks the ability of manipulating the
variables.
Time Involved
Cross-sectional studies are conducted ones for over a long period of time whereas when
studies repeated over a period of time are considered as longitudinal studies.

MS 110 Research Methodology Uttarakhand Open University
Unit 5 Research Designs-I Page 80 of 434
5.5 CHARACTERSTICS OF GOOD RESEARCH DESIGN
1. Objectivity: The design so developed should be free from biasness and there should
be no partially on any side.
2. Reliability: it considers that results given overtime should be consistent whenever the
design is repeated.
3. Validity: the results given should be accurate. It must focus on collection and tends to
measure what it is supposed to.
4. Generalization: it considers the results collected under this design, holding true for
the sample study must also hold true for the entire population.
5.6 CLASSIFICATION OF RESEARCH DESIGNS
Fig 5.1 Research design
5.7 IMPORTANCE OF RESEARCH DESIGN
As stated by Wilkinson & Bhandakar. “If we anticipate before we conduct a research inquiry,
the various difficulties that may have to be encountered in the course and decide what to do
RESEARCH DESIGN
EXPLORATORY CONCLUSIVE
DESCRIPTIVE CAUSAL
CROSS-SECTIONAL LONGITUDINAL
SINGLE CROSS-
SECTIONAL
MULTIPLE CROSS-
SECTIONAL

MS 110 Research Methodology Uttarakhand Open University
Unit 5 Research Designs-I Page 81 of 434
about these, then, we increase to that extent our chances of rationality, controlling the
research procedure and forestalling the possibilities of failure.
Thus the importance of research design is as follows:
It gives direction to the research study because without design it would be ideal.
It defines the accuracy required in the research.
Differentiates between the relevant and irrelevant factors.
Provides a better way for inquiring the problems.
Lastly, it provides some concepts for evaluating the projected study.
5.8 NEED FOR THE RESEARCH DESIGN
It reduces inaccuracy;
Helps to get maximum efficiency and reliability;
Eliminates bias and marginal errors;
Minimizes wastage of time;
Helpful for collecting research materials;
Helpful for testing of hypothesis;
Gives an idea regarding the type of resources required in terms of money, manpower,
time, and efforts;
Provides an overview to other experts;
Guides the research in the right direction.
5.9 ADVANTAGES OF RESEARCH DESIGN 1. Consumes less time.
2. Ensures project time schedule.
3. Helps researcher to prepare himself/herself to carry out research in a proper and a
systematic way.
4. Better documentation of the various activities while the project work is going on.
5. Helps in proper planning of the resources and their procurement in right time.
6. Provides satisfaction and confidence, accompanied with a sense of success from the
beginning of the work of the research project.
MS 110 Research Methodology Uttarakhand Open University
Unit 5 Research Designs-I Page 82 of 434
5.10 CONCEPTS RELATING TO RESEARCH DESIGN 1. Variables: variables are those which can take quantitative value for measuring the
factors. The variables can be classified as:
a) Independent variables: The variable that is stable and unaffected by some other
variables that one intends to measure. Here, we can manipulate the price levels and
measure the change in quantity demanded due to different price levels.
b) Dependent variables: When one variable is dependent on other is called dependent
variable. The variable that depends on other factors that are measured. For example
behavioural changes occurring due to environment manipulations.
c) Discrete variables: The variables that can presented only in integer values.
d) Extraneous variables: the variables taken by the researcher are not related to the
purpose of the study are extraneous variables.
2. Confounded relationship: When the dependent variable is not free from the influence
of extraneous variable, the relationship between the dependent and independent
variables is said to be confounded by an extraneous variable.
3. Experiment: it defines the process of testing the statistical hypothesis for eg. To
examine the teaching methods we need to calculate the performance of the students.
4. Control: One aspect of a good research design is to reduce the effect of extraneous
variable. Control is used to design the study reducing the effects of extraneous
independent variables.
5. Experimental group/ control group: In an experimental hypothesis-testing when a
group is opened to ongoing conditions, it is control group, but when the group is opened
to some special condition, it is an experimental group.
6. Treatments: The conditions under which experimental and control groups are put are
termed as treatments.
7. Research hypothesis: When a predicted relationship is to be tested by scientific
methods, it is known as research hypothesis. The research hypothesis is a predictive
statement that relates an independent variable to a dependent variable.
State Problems versus Process Problems:
A difference can be made among state problems and process problems. State problems
tend to answer what is the situation at given point of time, while process problems deal
with the change of phenomena over time. Examples of state problems are the level of
mathematical skills of sixteen-year-old children or the level, computer skills of the
elderly, the depression level of a person, etc. Examples of process problems are the
development of mathematical skills from puberty to adulthood, the change in computer
skills when people get older and how depression symptoms change during therapy.
State problems are easier to measure than process problems. State problems just require
one measurement of the phenomena of interest, while process problems always require

MS 110 Research Methodology Uttarakhand Open University
Unit 5 Research Designs-I Page 83 of 434
multiple measurements. Research designs such as repeated measurements and
longitudinal study are needed to address process problems.
5.11 COMPARISON OF RESEARCH DESIGNS
PARTICULARS EXPLORATAR
Y
DESCRIPITIVE EXPERIMENTAL
OBJECTIVE To develop new
ideas
To define the
functions of the
market.
To establish cause and
effect relationship
between the variables.
CHARATERSTICS Fluid and
unformed
Pre-planning, well
developed structured
Involves manipulation
of one or the other
variables.
METHODOLOGY Secondary
data
Expert
survey
Pilot
survey
Qualitative
research
Secondary data
Surveys
Panels
observations
Casual
Check Your Progress-A
Q1. What do you mean by Research Design?
--------------------------------------------------------------------------------------------------
--------------------------------------------------------------------------------------------------
--------------------------------------------------------------------------------------------------
--------------------------------------------------------------------------------------------------
--------------------------------------------------------------------------------------------------
Q2. What are the advantages of Research Design?
--------------------------------------------------------------------------------------------------
--------------------------------------------------------------------------------------------------
--------------------------------------------------------------------------------------------------
--------------------------------------------------------------------------------------------------

MS 110 Research Methodology Uttarakhand Open University
Unit 5 Research Designs-I Page 84 of 434
Q3. What are the various types of Variable?
--------------------------------------------------------------------------------------------------
--------------------------------------------------------------------------------------------------
--------------------------------------------------------------------------------------------------
--------------------------------------------------------------------------------------------------
5.12 EXPLORATORY RESEARCH DESIGN Exploratory research studies are also called formulative research designs. The objective
behind this study is to formulate a problem for more precise investigation or in view of
developing the working hypotheses. The major concern is on the discovery of ideas and
insights into the problem. The design so developed must be elastic as it must provide
opportunities for predicting the problems under study. The design should be so developed
that there may be possibility of necessary changes when as needed according to the research
objective and the problem. It generally takes place when the solution for the problem is not in
hand as there are not past insights. Here preliminary work needs to be done in order to gain
familiarity and according to that we need to develop a model defining the process so that
investigation can be done accordingly.
Exploratory research can be used for any of the following purposes:
a) Formulating a problem.
b) Identify alternative courses of action.
c) To develop a hypothesis.
d) To identify the important variables and the relationship between them.
e) Perception of problem.
f) To develop priorities for future research.
Moreover we can say exploratory research is of extensive use as the researcher has to find
solutions to the problems first hand and once the direction to the problem is found s/he can
work upon that whereas it may provide directions to the researcher for future use.
Methods used for exploratory research:
A) Analyse the secondary data.
B) Expert survey.
C) Pilot survey.
D) Qualitative research.
Secondary data- As understood by its name secondary means second hand. The literature
which is already published as reviewed by them for their respective studies. The researcher
may study that literature as to obtain hypothesis. The data can be bibliographies on the
journals magazines, newspapers etc. The data can also be available online from their
respective sites as maintained by the organizations. By studying the past, the researcher

MS 110 Research Methodology Uttarakhand Open University
Unit 5 Research Designs-I Page 85 of 434
would able to know the areas which have been less focussed and hence study can be
conducted on them in future.
Expert survey- In Expert Survey, experts means experience persons. The persons who have
thorough knowledge of that respective area as they may have done research in the past
relating to that and hence it would be valuable source of information for the researcher.
Since, the researcher is looking for new ideas s/he must choose his/her expert thoroughly as
per his/her need. Because the person chosen must have full insight into the research and have
wide experience.
An expert would be good source of hypothesis, about modus operandi of conducting
research; source of problem; and possible problem that may came in the study.
Analysis of ‘insight-stimulating’ examples is also a fruitful method for suggesting hypotheses
for research. It is particularly suitable in areas where there is little experience to serve as a
guide. This method consists of the intensive study of selected instances of the phenomenon.
Here existing records are examined, the unstructured interviewing may take place, or some
other approach may be adopted. Attitude of the investigator, the intensity of the study and the
ability of the researcher are drawn together to get vast amount of information.
Here, the objectives of the research can be accomplished either from qualitative or
quantitative research. But this research focuses more on qualitative research.
Fig 5.2 Qualitative Research
Under the disguised qualitative research, the true objective of research is not known to the
respondent. He may get the idea from the questions been asked to him.
Focus group interview: when interview conducted by the experienced person on the small
group of people to know about the target market. It is free flow discussion when in end the
researcher tends to gain useful information.
Depth-interview: when the interview is held on the single respondent to know the areas of
interest overtime. This interview is conducted by the person having full knowledge in the
respective field.
Qualitative Research
techniques
Disguised Non- disguised
Projective Technique Focus groups Depth interview

MS 110 Research Methodology Uttarakhand Open University
Unit 5 Research Designs-I Page 86 of 434
Projective technique: It involves an unstructured questioning that focus on motivations,
attitudes and behavior. This research underlines to know to behavior of others rather than the
respondent behavior.
Thus, an exploratory research study leads to insights or hypotheses, whatever method or
research design outlined above is adopted, the only thing essential is that it must continue to
remain flexible so that many different facets of a problem may be considered as and when
they arise and come to the notice of the researcher.
5.13 DESCRIPTIVE RESEARCH DESIGN Those studies that tends describe the characteristics of a particular individual, a group,
whereas classic studies determine the frequency with which something occurs. The studies
concerning whether certain variables are associated are examples of diagnostic research
studies. Studies related to specific predictions, with narration of facts and characteristics
concerning individual, group or situation are all examples of descriptive research studies.
Many, social research studies are covered here. In descriptive as well as in diagnostic studies,
the researcher is able to define clearly, what s/he wants to measure and able to find adequate
methods for measuring the variables needed for the study. Since the aim is to obtain
complete and accurate information. The design so developed must be protective against
biasness and must maximize reliability, with due concern for the economical completion of
the research study. The design followed here should be rigid and not flexible and must focus
attention on the following:
What the study is about and why is it being made?
What techniques of gathering data will be adopted?
How much material will be needed?
Where can the required data be found and with what time period should the data be
related?
Processing and analyzing the data.
Reporting the findings.
The reasons why descriptive research study is conducted:
a) To define the characteristics of the group.
b) To know the units of the population.
c) To determine the perception of the consumers regarding the product.
d) To study the degree of the variables.
e) Establish the relationship between two or more variables.

MS 110 Research Methodology Uttarakhand Open University
Unit 5 Research Designs-I Page 87 of 434
Descriptive research clearly focuses on the objective, content and the purpose of the study.
Here, the researcher must minimize the biasness and maximize the reliability of the data.
The design used for descriptive studies is also called survey designs because the data so far
collected is based on the survey. It includes:
a) Clear definition of the problem: The problem under study should be clearly defined
otherwise data so collected should be waste.
b) Methods of data collection: Appropriate method must be used for collecting the data
based on the research objective. Various survey methods like questionnaire,
interview must be critically examined beforehand.
c) Preparation of instruments: This includes the method by which respondents will be
approached whether through mail, or through interview procedure.
d) Sampling design: The method used for sampling should represent the entire
population. Among various probability and non-probability sampling techniques the
researcher must choose the one that fits to his/her design.
e) Data collection and analysis technique: The design should state the control that
researcher would be supervising his/her field workers while they are collecting the
data.
Examples of descriptive research design are:
1. The studies describing market size, buying power of the consumers are termed as
market studies.
2. The studies defining sales area, customer and region are termed as sales analysis.
3. Investors investing in different investment products overtime.
4. Changes in range and frequency of the prices.
5. Analyzing the perception of the companies towards their company products.
Further the descriptive research design can be classified as:
Cross-sectional designs: This includes collecting of information only once from the entire
population. They are further termed as single cross-sectional and multiple cross-sectional
designs. In single cross-sectional, only once sample is drawn from the entire population and
study is further conducted on that basis whereas in multiple cross-sectional, there are two or
more samples and hence information is obtained from them only once. Here, the criteria
behind multiple cross-sectional are comparison can be made for the study over the years.
Longitudinal designs: This includes collecting of information repeatedly from the same
population. This design is different from the above mentioned design as the study is done
over and over the same population which means the sample for the study remains the same.
This study provides in-depth interview because it is done over and time again so the

MS 110 Research Methodology Uttarakhand Open University
Unit 5 Research Designs-I Page 88 of 434
researcher tends to become familiar. The term panel may also be used in relation to
longitudinal studies because it generally includes sample of respondents including
households which agreed to provide information at specific intervals over a long period of
time.
Performance Chart for Cross-Sectional and Longitudinal Studies:
CRITERIA LONGITUDINAL CROSS-
SECTIONAL
ACCURACY Poor results Good results
RESPONSE BIAS Good Poor
REPRENSTATIVE
SAMPLING
Good Poor
FINDING CHANGES Poor Good
5.14 PROCEDURE FOR DESCRIPTIVE RESEARCH DESIGN
Fig 5.3 Survey Methods
Survey methods: It considers giving to respondents a structured questionnaire and then
eliciting needed information from those responses. It includes:
a) Telephone methods- It involves collecting information from the respondents
on the phone which are decided in advance by the researcher. Namely
SURVEY METHODS
Telephone
methods
Personal
methods Mail methods Electronic
methods

MS 110 Research Methodology Uttarakhand Open University
Unit 5 Research Designs-I Page 89 of 434
computer-assisted telephone interviews and traditional telephone interviewing
methods have been used.
b) Personal methods- It includes personally visiting the respondents in order to
get their response. The series of questions decided in advance would be asked
from the respondent. Namely mall interview, in-home interview and
computer-assisted interview tends to be used.
c) Mail methods- here, no face to face interaction takes place between the
researcher and the respondent. The questionnaire is mailed to respondent or
sent post in order to get his/her response. Namely mail interviews and mail
panels tend to be used.
d) Electronic methods- Here physical questionnaire is not prepared by the
respondent hence a computerised questionnaire tends to get prepared and then
mailed to the respondents. Namely E-mails and internet interviews tend to be
used.
Fig 5.4 Observational Methods
Observational methods: It includes recording of a behavioural pattern of study relating to
people, objects in systematic manner in order to get information about the necessary area of
interest. It includes:
a) Personal observations- when the researcher himself/herself observes the respondents
and records the desired behaviour as per his/her need.
b) Mechanical observations- Here, in place of person, a mechanical is installed in order
to record the performance.
c) Audit- Here, the researcher collects data through examining the records himself.
d) Content analysis- when some part of the information is to be reviewed instead of total
than content analysis is done
e) Trace analysis- Data collected on the basis of past studies which may be exhibited
intentionally or unintentionally by the respondents.
OBSERVATIONAL METHODS
Personal
observations
Mechanical
observations
Audit Content analysis Trace analysis

MS 110 Research Methodology Uttarakhand Open University
Unit 5 Research Designs-I Page 90 of 434
Lastly research design among the two can be summarised in tabular form as:
RESEARCH DESIGN EXPLORATARY DESCRIPTIVE
OVERALL DESIGN Flexible Rigid
Sampling design Non-probability design Probability design
Statistical design No pre-planning Pre-planned in advance
Observational design Unstructured Structured
Operational design No-fixed decisions Advanced decisions
5.15 CAUSAL/ EXPERIMENTAL RESEARCH DESIGN This research is designed to identify the cause and effect relationship between the variables.
Such studies require well defined process to reduce biasness and increase reliability of the
data, but would tend to draw inferences about causality. Beginning of such designs was made
by Professor R.A. Fisher’s when he was working at Rothamsted Experimental Station (Centre
for Agricultural Research in England). Professor Fisher found that by dividing agricultural
fields or plots into different blocks and then by conducting experiments in each of these
blocks, whatever information is collected and inferences drawn from them, happens to be
more reliable. Nowadays, the experimental designs are used by the researches relating to
phenomena of several disciplines. Following steps are involved in conducting a experimental
study.
a) Defining of the problem.
b) Hypothesis formed.
c) Experimental design needs to be developed concerning:
1. Sample subjects to be chosen.
2. Grouping of the subjects.
3. Identifying of the factors.
4. Constructing an instrument to measure such variables.
5. Defining of time and place were study would be conducted.
d) Experiment to be conducted.
e) Testing of hypothesis by analysing the data.
f) Reporting of findings.
As the experimental designs mainly focuses on controlling extraneous variables because
further they would provide some problems in the results. So it is necessary to control
variables in time as to know the accurate results.

MS 110 Research Methodology Uttarakhand Open University
Unit 5 Research Designs-I Page 91 of 434
1. Randomization- it involves randomly assigning of units to the two
groups to know the test results. When these variables are to be tested
on students the factors like IQ level, age, sex must be randomly
distributed.
2. Matching- this involves knowing in advance the variables that would
affect the performance. So they have to be advanced in match to avoid
any disturbance in the test results.
3. Statistical control- it involves making of adjustments to control the
extraneous variables by using ANOVA, ANCOVA.
Principles of Experimental Design
There are three principles namely principle of replication, principle of randomization,
principle of local control.
a. Principle of replication. As per its name, it means repeatedly testing of data again and
again over a period of time. It enhances the chances of effectiveness of test results
b. Principle of randomization. Randomization generally includes distributing of tests
units randomly among the different groups as to minimize the errors and increase the
reliability of the data.
c. Principle of local control. Here, to measure the effect of extraneous variables they are
distributed over a large size of population so the variables hindering the results would
be eliminated in time as to get effectiveness.
Types of Experimental Design
Fig 5.5 Experimental Research Design
Pre-experimental design: These experiments do not include a control group. It
follows:
a) One-shot case study- This is followed when the researcher attempts to
explain a consequence by the antecedent. This study is also called after-only
design.
X O
EXPERIMENTAL
DESIGNS
Pre-
experimental
True-experimental Quasi-
experimental
Statistical

MS 110 Research Methodology Uttarakhand Open University
Unit 5 Research Designs-I Page 92 of 434
In this a single group is exposed to treatment X and effect of the dependent
variable O is measured.
b) One group pre-test-post test study- This study is improvement over the
earlier study because the pre-test scores are taken into consideration.
O1 X O2
c) Static group design- It considers control group for measuring the effect of
respective variables,
True-experimental designs: these experiments follow principle of randomization. It
follows:
a) Pre-test post test experimental control group designs- the researcher has to
carefully check the effect of control variables as the units are assigned among
different group of individuals as following the principle of randomization.
b) Post-test only control group design- Here post test scores are recorded. Each
group is randomly measured and there results are administered on the
experimental groups.
c) Solomon four group design- This design follows the principles of post test
control groups and it aims to reduce the affect of pre testing designs.
Quasi-experimental designs: These designs are reliable and cheap as they do not
involve principle of randomization. It follows:
a) Time-series designs- Design so developed should work for long term as the
effects of pre and post testing designs have been eliminated.
b) Multiple time series- Here, a control group and experimental groups are
introduced as to reduce biasness and hence treatment test scores are taken
from both groups.
Statistical design: The researcher tends to introduce the blocking factor in order to
maximize the effect of extraneous variables. It follows:
a) Completely randomized design- In this design two principles i:e principle of
randomization and replication is followed. This design is adopted when the
dependent variable is influenced by one independent variable. It includes:
1. Two group simple randomized design- it includes selection of test units
among the two groups that is experimental and control groups
randomly.
2. Random replication design- here, the treatment is randomly assigned
among the test units. This design manages to control not only the
differential effect of extraneous independent variables but consider the
individual differences among the people which are involved in the
study.
b) Randomized block design- here, homogeneous blocks are selected to apply the
principle of local control. The extraneous variables do effect the part of the study
rather they are not been considered.
MS 110 Research Methodology Uttarakhand Open University
Unit 5 Research Designs-I Page 93 of 434
c) Latin square design- in this design equal treatment is done on two extraneous variables i
any position respective to their rows and columns. The major behind this method is that it
does not interaction between the treatment and blocking factors.
d) Factorial design- here factors are used by the researcher to measure the effect of one
independent variable on the other dependent variables. Further they are of two types:
1. Simple factorial design: this design is 2X2 where the effect of two factors on the dependent
variables is measured. Here, the relation between the treatment and level can be measured
and be known whether they are independent or not.
2. Complex factorial design: it involves studying of more than one factor at a time where two
experimental, two levels and one variable is assumed. As the number of variables for the
study tends to increase the greater would be interaction between the variables.
Causal Research Design
This research is conducted to determine or defining the relationship between the variables.
The purpose of causal research is:
1. To determine the cause and effect variables this tends to differentiate between the
dependent and independent variables.
2. To define the relationship between the variables this needs to be predicted for the
study.
Procedure for Causal Research
This research determines the cause and effect relationship where causation means change in
one variable leads to change in other respective variables. There are three conditions which
need to be satisfied before testing any relationship between the variables. These are; time
occurrence of variables, concomitant variation and elimination of other possible causal
factors.
Check Your Progress-B
Q1. What is Descriptive Research Design?
--------------------------------------------------------------------------------------------------
--------------------------------------------------------------------------------------------------
--------------------------------------------------------------------------------------------------
--------------------------------------------------------------------------------------------------
--------------------------------------------------------------------------------------------------

MS 110 Research Methodology Uttarakhand Open University
Unit 5 Research Designs-I Page 94 of 434
Q2. What do you mean by Experimental Research Design?
--------------------------------------------------------------------------------------------------
--------------------------------------------------------------------------------------------------
--------------------------------------------------------------------------------------------------
--------------------------------------------------------------------------------------------------
--------------------------------------------------------------------------------------------------
Q3. List various types of Experimental Research Design?
--------------------------------------------------------------------------------------------------
--------------------------------------------------------------------------------------------------
--------------------------------------------------------------------------------------------------
--------------------------------------------------------------------------------------------------
--------------------------------------------------------------------------------------------------
5.16 RELATIONSHIP BETWEEN EXPLORATORY,
DESCRIPTIVE AND CAUSAL RESEARCH DESIGN 1. Firstly, the researcher needs to explore the data precisely and be inhabited with problems
s/he is facing.
2. The researcher must consider alternative courses of action to solve the problem and acquire
the one which suites to his/her research objective.
3. In case the researcher is well-equipped with research problem than s/he must define the
procedure and methods to be used for testing the results.
4. Hypothesis must be build if necessary according to research objective.
5. The relationship between the variables that is cause and effect relationship.
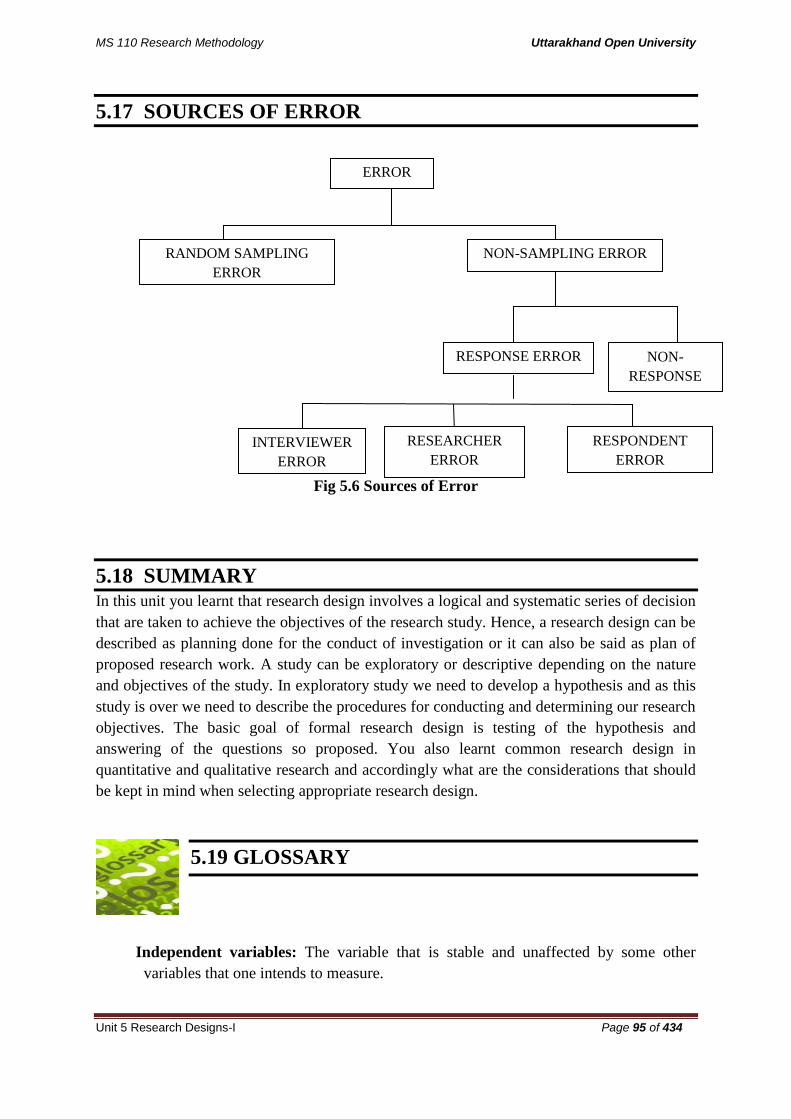
MS 110 Research Methodology Uttarakhand Open University
Unit 5 Research Designs-I Page 95 of 434
5.17 SOURCES OF ERROR
Fig 5.6 Sources of Error
5.18 SUMMARY In this unit you learnt that research design involves a logical and systematic series of decision
that are taken to achieve the objectives of the research study. Hence, a research design can be
described as planning done for the conduct of investigation or it can also be said as plan of
proposed research work. A study can be exploratory or descriptive depending on the nature
and objectives of the study. In exploratory study we need to develop a hypothesis and as this
study is over we need to describe the procedures for conducting and determining our research
objectives. The basic goal of formal research design is testing of the hypothesis and
answering of the questions so proposed. You also learnt common research design in
quantitative and qualitative research and accordingly what are the considerations that should
be kept in mind when selecting appropriate research design.
5.19 GLOSSARY
Independent variables: The variable that is stable and unaffected by some other
variables that one intends to measure.
ERROR
RANDOM SAMPLING
ERROR
NON-SAMPLING ERROR
RESPONSE ERROR NON-
RESPONSE
ERROR
INTERVIEWER
ERROR
RESEARCHER
ERROR
RESPONDENT
ERROR
MS 110 Research Methodology Uttarakhand Open University
Unit 5 Research Designs-I Page 96 of 434
Dependent variables: when one variable is dependent on other is called dependent
variable.
Confounded relationship: When the dependent variable is not free from the influence
of extraneous variable, the relationship between the dependent and independent
variables is said to be confounded by an extraneous variable.
Causal Research Design: This research is conducted to determine or defining the
relationship between the variables.
5.20 REFERENCES
Navdeep Aggarwal, Mohit Gupta, Research Methodology and Statistical
Technique, Kalyani Publishers, Second Edition 2015.
Sunil Gupta, S.P Bansal, O.P Verma, Marketing Research, Kalyani Publishers.
Shashi K Gupta, Praneet Rangi, Research Methodology and Statistical
Technique, Kalyani Publishers, Second Edition 2017.
Zikmund, Babin, Carr, Adhikari, Griffin, Business Research Methods, Edition
2010.
Priti R. Majhi, Prafull K. Khatua, Research Methodology, Himalaya Publishing
House Pvt. Limited, Edition 2015.
https://en.m.wikipedia.org
https://ww.investopedia.com
https://repository.up.ac.za/bit
https://www.ukessays.com
https://nscpoltekssby.ac.id
https://www.managementstudy.com
5.21 SUGGESTED READINGS
1. Donald R.Cooper and Ramcis S.Schindler, Business Research Methods, Tata
McGraw Hill Publishing CompanyLimited, New Delhi, 2000.
2. C.R.Kothari Research Methodology, Wishva Prakashan, New Delhi, 2001.
3. Uma Sekaran, Research Methods for Business, John Wiley and Sons Inc., New
York, 2000.

MS 110 Research Methodology Uttarakhand Open University
Unit 5 Research Designs-I Page 97 of 434
5.22 TERMINAL AND MODEL QUESTIONS
Q1. Define different types of experimental designs?
Q2. Differentiate between exploratory, descriptive and conclusive research design?
Q3. Describe the features, need and advantages of the research design?
Q4. Discuss the major sources of error for research design?
5.23 CASE STUDY
Chetan was 41 year old boy working professionally inherited in team of five people. He had
been in his position for five years. Chetan was a nice guy who often did enough to get by and
avoid serious complaints. When he wanted, he performs very well. This was relatively rare.
Too-often his work was insufficient- lack of follow-up with customers, computational errors,
being somewhat rude with others, missing deadlines.
When asked how he was doing, he emphasised his accomplishments and compliments he had
received. If asked about sub-standard work, he was very skilful at avoiding responsibility. He
saw himself as better than average employee who deserves recognition and good raises. His
previous had not addressed the performance issues, which reinforced Chetan’s opinion of him
and made the job much more difficult.
As his boss, could have done nothing since there were a lot of bills in the organization and
the related manager was not concerned. In fact, he was more concerned about having
unhappy employees than having high productivity. Still, decided to see how Chetan
performance could be improved. The other employee’s performance on the team was
consistently better than his, though not so much that it was point of contention. The other
employees wanted to keep the peace and not deal with chetan’s issue. He did not hesitate to
confront others and so worked for him also.
Questions:
1. Evaluate the research design in this case?
2. What changes if any, can be made in the observation form?

MS 110 Research Methodology Uttarakhand Open University
Unit 6 Research Design II Page 98 of 434
UNIT 6 RESEARCH DESIGN
6.1 Introduction
6.2 Objectives
6.3 Research Design: A Blueprint of Research
6.4 Parameters for an Ideal Research Design
6.5 Standards of Categorising Research Design
6.6 Types of Research Design: An Overview
6.7 Case Studies: A Fundamental Aspect of Research
6.8 Relevance of Case Studies in the Field of Research
6.9 A Glimpse of Business Cases
6.10 Problems Based Learning (PBL)
6.11The Meaningful Significance of Case Study Analysis
6.12 Basic Guidelines to be used in Research Design
6.13 Summary
6.14 Glossary
6.15 References
6.16 Suggested Readings
6.17 Terminal & Model Questions
6.1 INTRODUCTION In previous unit you have learnt about various research designs. In this unit we will discuss
the specific approaches for design a research. As the research has different interpretations and
connotations for different people, the work of researchers occurs through research methods,
selected by the researcher in research design.
In the most elementary sense, the research design is a logical sequence of activities related to
research process. It starts with conceptualization of research problem and ends with findings
and conclusions. Yin (1994) specified that a research design is a blueprint of research,
dealing with the followings.
• What questions to study?

MS 110 Research Methodology Uttarakhand Open University
Unit 6 Research Design II Page 99 of 434
• What data are relevant?
• What data to collect?
• How to analyse the results?
Research design is much more than a work plan because the main purpose is to help to avoid
the situation in which the evidence does not address the initial research questions. Hence the
research design deals with a logical problem and also specifies how the investigator will
address the critical issues. Designs in research describe the data collection method or research
approach that is used in a study. It defines the various ways by which information is gathered
for evaluation or assessment. There are various designs in research, and each is used for a
different purpose. It is not uncommon to use a mix of two or more research designs in certain
studies.
6.2 OBJECTIVES After reading this unit students would be able
To understand about different research designs.
To understand the relevance of case studies in the field of research.
To enhance the knowledge about parameters for an ideal research design
To know about the basic criteria of research design
6.3 RESEARCH DESGN: A BLUEPRINT OF RESEARCH Research design is an essential part of the research. In order to make a valid and reliable
study the design of the study must be prominent and meaningful. Research design was be
associated with the foundation of the building. If the foundation of the building will be
strong, the building will definitely be strong. There is a famous saying in computer that
garbage in, garbage out. Whatever the information, data we will be incorporating accordingly
we will get the result or output.
There are many definitions of research design, but no one definition covers the full range of
important aspects. Some definitions for research design are by different authors are quoted
here.
According to David J Luck and Ronald S Rubin, “A research design is the determination and
statement of the general research approach or strategy adopted for the particular research
project”.
Kerlinger defines research design as “the plan, structure and strategy of investigation
conceived so as to obtain answers to research questions and to control variance”.

MS 110 Research Methodology Uttarakhand Open University
Unit 6 Research Design II Page 100 of 434
According to Green and Tull, “A research design is the specification of methods and
procedures for acquiring the information needed”.
Cooper & Schindler say that “the research design constitutes the blueprint for the collection,
measurement, and analysis of data”
Green defines research design as “the specification of methods and procedures for acquiring
the information needed. It is the overall operational pattern of framework of the project that
stipulates what information is to be collected from which sources by what procedures”.
Research design could be described as the plan and structure of investigation so conceived as
to obtain answers to research questions. The plan is the overall scheme or program of the
research. It includes an outline of what the investigator will do from writing hypotheses and
their operational implications to the final analysis of data. A structure is the framework to
organize the research process and configurations of the research. A good research design will
ensure that the information obtained is relevant to the research questions and that it was
collected by objective and economical procedure. Specifically a research design could be
described as the overall plan for connecting the conceptual research problems to the pertinent
(and achievable) empirical research. It articulates what data is required, what methods are
going to be used to collect and analyse this data, and how all of this is going to answer your
research question. Different design logics are used for different types of study.
The research design also reflects the purpose of the inquiry, which can be characterized as
Exploration, Description, Explanation, Prediction, Evaluation, and History. The table below
summaries the types of questions addressed in different groups.
6.4 PARAMETERS FOR AN IDEAL RESEARCH DESIGN According to Chawla & Sondhi( 2011) a research design must endure following basic
doctrine.
Able to convert research question and the stated assumptions / hypothesis into
operational variables that can be measured.
Must specify the process that would be followed to complete the above task, as
efficiently and economically as possible.
Specify the control mechanism that would be used to ensure that the effect of other
variables that could not impact the outcome of the study has been controlled.
On the basis of above discussions, we can now summarise the criteria for a good research
design as follows.
Simplicity: A research design should be easy to understand and simple to functioning.
MS 110 Research Methodology Uttarakhand Open University
Unit 6 Research Design II Page 101 of 434
Economical: Research design must be economical. The technique selected must be
cost effective and less time-consuming and minimising the human resource.
Reliability: A good research design must ensure to reduce the possibilities of various
errors. This should have the minimum bias and have the reliability of data collected
and analysed.
Workability: A good research design must be workable, pragmatic and practicable.
Flexibility: A good research design must be flexible enough to accommodate the
consideration of many different aspects of research problem and phenomena that may
appear during research process.
Degree of Accuracy: A good research design must lead to high degree of accuracy
and objective results to draw valid conclusions.
6.5 STANDARDS OF CATEGORISING THE RESEARCH
DESIGN There are lot of benchmarks through the research designs can be categorised. Some important
yardsticks are given below:
The degree to which the research question has been taken shape- On the basis of
degree exploratory and formal studies can be taken into the consideration.
The method of data collection- On the basis of method of data collection (primary
method, secondary method) this manner of classifying is to be known as Monitoring
and Communication Study.
On the basis of variables taken under study- Under this category the research
design are classified as Experimental and Ex post facto.
• The purpose of the study- This basis leads to categories the research design as
Reporting, Descriptive, Causal-Explanatory, Causal-Predictive
• The time dimension- On time dimension the research designs are classified as Cross-
sectional and Longitudinal
• The topical scope, breadth and depth of the study- On the basis of this we can
classify the research design as Case study and Statistical study
• The research environment- The research environment basis of classification defines
research design as Field setting, Laboratory research, Simulation

MS 110 Research Methodology Uttarakhand Open University
Unit 6 Research Design II Page 102 of 434
• The participants’ exposure and interpretations about awareness of the research
activity- It classifies the research designs as Actual routine research design and
Modified routine research design.
Malhotra in his book marketing research developed the relationships among different types of
research design Figure on right side depicts the classification and relationships of various
research design
6.6 TYPES OF RESEARCH DESIGN: AN OVERVIEW There are so many ways to classify the research design. Among them an easy way has been
taken into the consideration to classify the research design. A very simple approach has been
discussed below:
1. Exploratory research design
2. Descriptive research design
3. Causal research design
Further a detailed and comprehensive explanation has been made below:
6.6.1 EXPLORATORY RESEARCH DESIGN
Exploratory research is unstructured, informal research undertaken to gain background
information about the general nature of the research problem. The main purpose of the
exploratory research is to get the insights. This type of research design is specifically suitable
when the research objective is to provide insights into
Identifying the problems or opportunities in very systematic manner.
Defining the problem more clearly, systematically and precisely.
Getting deeper insights into the variables operating in a situation

MS 110 Research Methodology Uttarakhand Open University
Unit 6 Research Design II Page 103 of 434
Identifying relevant courses of action pursuant to associated available state off
nature.
Now a day’s most of the researcher is carrying out their research exploratory. More research
work has been of an exploratory nature; emphasizing on finding practices or policies that
needed changing and on developing possible alternatives. Exploratory research could also be
used in conjunction with other research. As mentioned below, since it is used as a first step in
the research process, defining the problem, other designs will be used later as steps to solve
the problem. For instance, it could be used in situations when a firm finds the going gets
tough in terms of sales volume, the researcher may develop use exploratory research to
develop probable explanations. Analysis of data generated using exploratory research.
On examination of the objectives of exploratory research, it is well understood that it could
be used at the initial stages of the decision making process. It allows the marketer to gain a
greater understanding of something that the researcher doesn’t know enough about. This
helps the decision maker and the researcher in situations when they have inadequate
knowledge of the problem situation and/or alternative courses of action. In short, exploratory
research is used in the absence of tried models and definite concepts.
Exploratory research could also be used in conjunction with other research. As mentioned
below, since it is used as a first step in the research process, defining the problem, other
designs will be used later as steps to solve the problem. For instance, it could be used in
situations when a firm finds the going gets tough in terms of sales volume, the researcher
may develop use exploratory research to develop probable explanations. Analysis of data
generated using exploratory research is essentially abstraction and generalization.
Abstraction refers to translation of the empirical observations, measurements etc. into
concepts; generalization means arranging the material so that it focuses on those structures
that are common to all or most of the cases. The exploratory research design is best
characterized by its flexibility and versatility. This is so, because of the absence of the non-
imperativeness of a structure in its design. It predominantly involves imagination, creativity,
and ingenuity of the researcher.
Exploratory research are conducted by following methods
• Secondary data analysis: Secondary data refers to the process of searching for and
interpreting existing info relevant to the research problem (e.g., census data, articles in
journals, newspapers, etc.).
• Experience (Expert) surveys: Refers to gathering info from those thought to be
knowledgeable on the issues relevant to the problem (i.e., ask experts).
• Case Analysis: Uses past situations that are similar to the present research problem.
• Focus groups: Involves small (8-12) groups of people brought together and guided by
a moderator through unstructured, spontaneous discussion.
Some of the more popular methods of exploratory research include literature searches, depth
interviews, focus groups, and case analyses.

MS 110 Research Methodology Uttarakhand Open University
Unit 6 Research Design II Page 104 of 434
Literature Search One of the quickest and least costly ways to discover hypotheses is to
conduct a literature search. Almost all marketing research projects should start here. There
is an incredible amount of information available in libraries, through online sources, in
commercial data bases, and so on. The literature search may involve popular press
(newspapers, magazines, etc.), trade literature, academic literature, or published statistics
from research firms or governmental agencies.
Depth interviews are used to tap the knowledge and experience of those with information
relevant to the problem or opportunity at hand. Anyone with relevant information is a
potential candidate for a depth interview, including current customers, members of the target
market, executives and managers of the client organization, sales representatives,
wholesalers, retailers, and so on. For example, a children’s book publisher gained valuable
information about a sales decline by talking with librarians and schoolteachers who indicated
that more and more people were using library facilities . . . and presumably buying fewer
books for their children
Focus group interviews are among the most often used techniques in marketing research.
Some would argue that they are among the most overused and misused techniques as well, a
point we’ll return to later. In a focus group, a small number of individuals (e.g., 8–12) are
brought together to talk about some topic of interest to the focus group sponsor. The
discussion is directed by a moderator who is in the room with the focus group participants;
managers, ad agency representatives, and/or others often watch the session from outside the
room via a two-way mirror or video link. The moderator attempts to follow a rough outline of
issues while simultaneously having the comments made by each person considered in group
discussion. Participants are thus exposed to the ideas of others and can respond to those ideas
with their own.
Group interaction is the key aspect that distinguishes focus group interviews from depth
interviews, which are conducted with one respondent at a time. It is also the primary
advantage of the focus group over most other exploratory techniques. Because of their
interactive nature, ideas sometimes drop “out of the blue” during a focus group discussion. In
addition, there is a snowballing effect: A comment by one individual can trigger a chain of
responses from others. As a result, responses are often more spontaneous and less
conventional than they might be in a depth interview.
Case Analyses is Intensive study of selected examples of the phenomenon of interest Often,
researchers can learn a lot about a situation by studying carefully selected examples or cases
of the phenomenon. This is the essence of case analysis, another form of exploratory
research. As a researcher, you might examine existing records, observe the phenomenon as it
occurs, conduct unstructured interviews, or use any one of a variety of other approaches to
analyze what is happening in a given situation.

MS 110 Research Methodology Uttarakhand Open University
Unit 6 Research Design II Page 105 of 434
Case analyses can be performed in lots of different ways. Sometimes internal records are
reviewed, sometimes individuals are interviewed, and sometimes situations or people are
observed carefully. Several years ago, a company decided to improve the productivity of its
sales force. A researcher carefully observed several of the company’s best salespeople in the
field and compared them to several of the worst. It turned out that the best salespeople were
checking the stock of retailers and pointing out items on which they were low; the low
performers were not taking the time to do this. Without being in the field with the sales force,
this insight probably wouldn’t have been uncovered.
Practically exploratory research design could be used for following purposes.(Malhotra,
2001)
Formulate a problem more precisely
Identify alternative course of action means strategies
Develop a hypothesis
Isolate key variables and relationships for further examination
Gain insights for developing an approach to the problem
Establish priorities for further research
6.6.2: DESCRIPTIVE RESEARCH DESIGN
Descriptive research provides answers to the questions of who, what, when, where, and how.
It is important to note here that we cannot conclusively ascertain answers to WHY using
descriptive studies.

MS 110 Research Methodology Uttarakhand Open University
Unit 6 Research Design II Page 106 of 434
As the name suggests, descriptive study involves describing some event or phenomena on
investigation and study under research. For example a descriptive research design for market
conditions may consider following situations for descriptions under who, what, when, where,
and how.
Characteristics or functions
Estimate the percentage of customers in a particular group exhibiting the same
purchase behaviour;
Perceptions of product characteristics; and
To predict the pattern of behaviour of characteristic versus the other
In descriptive research, the data is collected for a specific and definite purpose and involves
analysis and interpretation by the researcher. The major difference between exploratory and
descriptive research are as follows
Descriptive research is characterized by the formulation of specific objectives.
Descriptive studies restrict flexibility and versatility as compared to exploratory
research.
It involves a higher degree of formal design specifying the methods for selecting the
sources of information and for collecting data from those sources.
Formal design is required in order to ensure that the description covers all phases desired. It
is also required to restrain collection of unnecessary data
While designing a descriptive research, the researcher should also have sufficient knowledge
on the nature and type of statistical techniques he/she is going to use. This will greatly help to
have the right design in place. Mostly descriptive studies are conducted using questionnaire,
structured interviews and observations. The results of descriptive studies are directly used for
managerial decisions
Descriptive research design could be classified in to broad categories as follow.
– Cross-sectional descriptive research design
– Longitudinal descriptive research design
Longitudinal research relies on panel data and panel methods. It involves fixing a panel
consisting of fixed sample of subjects that are measured repeatedly. The panel members are
those who have agreed to provide information at a specific intervals over an extended period.
For example, data obtained from panels formed to provide information on market shares are
based on an extended period of time, but also allow the researcher to examine changes in
market share over time. New members may be included in the panel as an when there is a
dropout of the existing members or to maintain representativeness. Panel data is analytical
and possess advantages with respect to the information collected in the study. They are also
considered to be more accurate than cross sectional data because panel data better handle the
problem associated with the errors that arise in reporting past behaviour and the errors that
MS 110 Research Methodology Uttarakhand Open University
Unit 6 Research Design II Page 107 of 434
arise because of the necessary interaction between interviewer and respondent. Some
examples of descriptive research are as follow
• Study Measuring Various Attributes of Salespeople, a Training Program, or a
Retailing Situation
• Measuring how salespeople or customers behaved, as well as what happened to sales
volume
• Learn about characteristics of people shopping at a particular store
• Satisfaction Study taken at multiple times throughout the year
Cross-sectional research is the most predominantly and frequently used descriptive research
design in marketing. It involves a sample of elements from the population of interest. The
sample elements are ensured on a number of characteristics. There are two types of cross-
sectional studies
Field studies and
Surveys
It may appear that field studies and surveys are no different but the same. However, for
practical reasons, they are classified into two categories cross sectional research. The
fundamental difference lies in the depth of what these research cover. While survey has a
larger scope, field study has greater depth. Survey attempts to be representative of some
known universe and filed study is less concerned with the generation of large representative
samples and is more concerned with the in-depth study of a few typical situations. Cross
sectional design may be either single or multiple cross sectional design depending on the
number of samples drawn from a population. In single cross sectional design, only one
sample respondents are drawn whereas in multiple cross sectional designs, there are two or
more samples of respondents. A type of multiple cross sectional design of special interest is
Cohort analysis.
Descriptive research does not fit neatly into the definition of either quantitative or qualitative
research methodologies, but instead it can utilize elements of both, often within the same
study. The term descriptive research refers to the type of research question, design, and data
analysis that will be applied to a given topic. Descriptive statistics tell what is, while
inferential statistics try to determine cause and effect.
The type of question asked by the researcher will ultimately determine the type of approach
necessary to complete an accurate assessment of the topic at hand. Descriptive studies,
primarily concerned with finding out "what is," might be applied to investigate the following
questions: Descriptive research can be either quantitative or qualitative. It can involve
collections of quantitative information that can be tabulated along a continuum in numerical
form, such as scores on a test or the number of times a person chooses to use a-certain feature
of a multimedia program, or it can describe categories of information such as gender or
patterns of interaction when using technology in a group situation. Descriptive research
involves gathering data that describe events and then organizes, tabulates, depicts, and

MS 110 Research Methodology Uttarakhand Open University
Unit 6 Research Design II Page 108 of 434
describes the data collection (Glass & Hopkins, 1984). It often uses visual aids such as graphs
and charts to aid the reader in understanding the data distribution. Because the human mind
cannot extract the full import of a large mass of raw data, descriptive statistics are very
important in reducing the data to manageable form. When in-depth, narrative descriptions of
small numbers of cases are involved, the research uses description as a tool to organize data
into patterns that emerge during analysis. Those patterns aid the mind in comprehending a
qualitative study and its implications.
Descriptive research design could be classified as follow
Above exhibit is an overview of various types of descriptive studies. The basic distinction is
between cross- sectional designs, which traditionally have been the most common, and
longitudinal designs. Typically, a cross-sectional study involves drawing a sample of
elements from the population of interest. Characteristics of the elements, or sample members,
are measured only once. A longitudinal study, on the other hand, involves a panel, which is
a fixed sample of elements. The elements may be stores, dealers, individuals, or other
entities. The panel, or sample, remains relatively constant through time, although members
may be added to replace dropouts or to keep it representative. The sample members in a panel
are measured repeatedly over time, in contrast with the one-time measurement in a cross-
sectional study.
6.6.3: CAUSAL RESEARCH DESIGN
Sometimes managers need stronger evidence that a particular action is likely to produce a
particular outcome. For example, if you were considering a change in product packaging, you
might want to test this hypothesis: “A redesign of the cereal package so that it is shorter and
less likely to tip over will improve consumer attitudes toward the product.” For really
important decisions, sometimes we need stronger evidence than we can get with descriptive

MS 110 Research Methodology Uttarakhand Open University
Unit 6 Research Design II Page 109 of 434
research. (Using descriptive research, we might have learned that there was a negative
correlation between consumer ratings of likelihood of tipping over and attitude toward the
product, but not a lot more.) Descriptive research is fi ne for testing hypotheses about
relationships between variables, but we need causal designs for testing cause-and-effect
relationships
Concept of Causality: Everyone is familiar with the general notion of causality, the idea that
one thing leads to the occurrence of another. The scientific notion of causality is quite
complex, however; scientists tell us that it is impossible to prove that one thing causes
another. Establishing that variable X causes variable Y requires meeting a number of
conditions, one of which (the elimination of all other possible causes of Y) we can never
know for certain no matter how carefully we have planned and conducted our research.
Causal research designs work toward establishing possible causal relationships through the
use of experiments.
Experiments as Causal Research: An experiment can provide more convincing evidence
of causal relationships because of the control it gives investigators. In an experiment, a
researcher manipulates, or sets the levels of, one or more causal variables (independent
variables) to examine the effect on one or more outcome variables (dependent variables)
while attempting to account for the effects of all other possible causal variables, usually by
holding them constant. Sometimes we conduct experiments in “fake” or “sterile”
environments so that we can carefully control exactly what research participants (called
experimental subjects) see and experience. This allows us to observe the effect of the
manipulated variables while the effect of other factors is minimized. The experiments could
be conducted as laboratory experiments or field experiment:
Laboratory experiments allow us to be almost certain that the variables we manipulate
produce the outcomes we observe because we can hold all other factors constant.
A field experiment is a research study conducted in a realistic or natural situation. Just like
lab experiments, one or more variables are manipulated to see their effect on an outcome
variable. Because it’s conducted in the field, you won’t have the same degree of control as
with a lab study, but you’ll attempt to control as much as possible
Example: The researchers studying consumer preferences for clustered (versus no clustered)
trip chains also conducted a fi eld experiment. In this case, the experiment was conducted
with residents who actually lived in the area that had been mapped for subjects in the lab
experiment. For the field study, however, researchers used a telephone survey and based the
study on the subjects’ home address and actual locations of retailers who were known to the
subjects. They asked them to imagine that they needed to make trips to the two kinds of
retailers and then presented them with two alternative routes (one that was clustered and one
that was no clustered). As in the laboratory experiment, subjects expressed a preference for
the clustered trip chain compared with the no clustered trip chain even though the overall
travel distance was about the same.

MS 110 Research Methodology Uttarakhand Open University
Unit 6 Research Design II Page 110 of 434
Check Your Progress-A
Q1. List the various Study Designs based on the nature of the Investigation?
----------------------------------------------------------------------------------------------------------------
----------------------------------------------------------------------------------------------------------------
----------------------------------------------------------------------------------------------------------------
----------------------------------------------------------------------------------------------------------------
Q2. Give examples of research studies where case study method can be adopted ?
----------------------------------------------------------------------------------------------------------------
----------------------------------------------------------------------------------------------------------------
----------------------------------------------------------------------------------------------------------------
----------------------------------------------------------------------------------------------------------------
Q3. What do you mean by causal research design?
----------------------------------------------------------------------------------------------------------------
----------------------------------------------------------------------------------------------------------------
----------------------------------------------------------------------------------------------------------------
----------------------------------------------------------------------------------------------------------------
Q4. What is Descriptive Research Design?
----------------------------------------------------------------------------------------------------------------
----------------------------------------------------------------------------------------------------------------
----------------------------------------------------------------------------------------------------------------
----------------------------------------------------------------------------------------------------------------
Q5. What is Exploratory Research Design?
----------------------------------------------------------------------------------------------------------------
----------------------------------------------------------------------------------------------------------------
----------------------------------------------------------------------------------------------------------------
----------------------------------------------------------------------------------------------------------------

MS 110 Research Methodology Uttarakhand Open University
Unit 6 Research Design II Page 111 of 434
6.7 CASE STUDIES: A FUNDAMENTAL ASPECT OF
RESEARCH There is a crucial role played by the case studies in research. Here an attempt is being
made to understand the intricacies of the case studies.
Case studies are descriptions of real or hypothetical business problems. Candidates
are expected to understand, analyze, and recommend solutions to these problems.
The case method is a teaching approach that consists in presenting the students with a
case, putting them in the role of a decision maker facing a problem.
A detailed analysis of a person or group.
Case studies recount real life business or management situations that present business
executives with a dilemma or uncertain outcome. The case describes the scenario in
the context of the events, people and factors that influence it and enables students to
identify closely with those involved.
A careful study of some social unit that attempts to determine what factors led to its success
or failure.
6.8 RELEVANCE OF CASE STUDIES IN THE FIELD OF
RESEARCH The relevance, purpose and importance of the case studies in the field of research can be
explained into following manner:
Case study is the acknowledged approach to the teaching of management.
It gives the lesson first and the learning later. Theory often fails to drive home and
does not get internalized. The case method stimulates the real life situation and places
the student in the position of the business manager required to make a set of decisions.
With the case method, the process of arriving at an answer is more important than the
answer itself. in the process one can learn the process of decision making.
Supporting the decision with appropriate analysis and communicate ideas both orally
and in writing. The method of teaching thus shifts much of the responsibility to the
student. The method shifts from the Instructor Led Teaching (ILT) to a Student Pull
Learning (SPL).
Studying through the case method result in development of skills, in critical thinking,
reasoning and communication. When the viewpoint is challenged and conflicting
views surface, the student develops a greater awareness of the complexities of
managerial decision making.
With significant participation from the class, the classroom becomes an exciting and
inviting place and learning becomes fun.
MS 110 Research Methodology Uttarakhand Open University
Unit 6 Research Design II Page 112 of 434
Set in a stimulated real life environment, the learning becomes internalized. Clearly,
the case method of teaching is a more effective way of teaching most management
topics.
While we all appreciate the need for using the case method, not many of us are adept
at the same.
There are three clear requirements of effective teaching using the case method.
Identifying the most effective cases for the topic covered in the course.
6.9 A GLIMPSE OF BUSINESS CASES
When the Harvard Business School was started, the faculty quickly realized that there
were no textbooks suitable to a graduate programme in business. their first solution to
this problem was to interview leading practitioners of business and to write detailed
accounts of what these managers were doing.
Harvard Business School in 1920 has developed the use of business cases. Cases
generally involve both qualitative and quantitative data what the student must analyze
to determine suitable alternatives and solutions.
Cases are generally written by business school faculty with particular learning
objectives and are refined in the classroom before publication.
6.10 PROBLEM BASED LEARNING (PBL) The problem-based learning (PBL) movement is such an example of case study.
Case study is the way of revealing students to the decision-making process. It
represents in-depth descriptions or reports of business problems.
Once you are comfortable with the information, begin the step-by-step instructions
offered below to write a case study analysis.
Cases help out to bridge the gap between classroom education and the so called real
world of marketing management. It provides an opportunity to develop, expand and
test methodical skills at assessing situations sorting out and organizing key
information: asking the right questions, defining opportunities and problems,
identifying and evaluating alternative courses of action, interpreting data evaluating
the results of past strategies, developing and defending new strategies, interacting
with other managers, making decisions under conditions of uncertainty, critically
evaluating the work of others, responding to criticism.
Once you are comfortable with the information, begin the step-by-step instructions offered
below to write a case study analysis. Cases help out to bridge the gap between classroom
MS 110 Research Methodology Uttarakhand Open University
Unit 6 Research Design II Page 113 of 434
education and the so called real world of marketing management. It provides an opportunity
to develop, expand and test methodical skills.
Assessing situations
Sorting out and organizing key information
Asking the right questions
Defining opportunities and problems
Identifying and evaluating alternative courses of action
Interpreting data
Evaluating the results of past strategies
Here's How:
Developing and defending new strategies
Interacting with other managers
Making decisions under conditions of uncertainty
Critically evaluating the work of others
Responding to criticism
6.11 THE MEANINGFUL SIGNIFICANCE OF CASE STUDY
ANALYSIS Case studies are often used to not only illustrate what a student has learned and retained in
class, but also to provide students with valuable hands-on experience.
When analyzing a case study, you will have an opportunity to learn about the types of
problems that many companies and industries encounter. you will also have an opportunity to
analyze the steps that other managers have taken to current specific problems and concerns.
This will put your problem solving skills to the test and align you to engage in exciting
discussions with your classmates and professors.
6.12 BASIC GUIDELINES TO BE USED IN RESEARCH
DESIGN It expedient and necessary to be followed the guidelines in research design. Here an effort has
been made to discuss these guidelines in the form of cyclic processes. Learners are required
to make the depth understanding of following discussed guidelines to make your study
effective and reliable.
The steps for formulating the research design are cyclic processes. These processes are
interrelated in such a way that the feedback of one is required for correcting the previous one.
The research design formulation sometimes used interchangeably with designing the research

MS 110 Research Methodology Uttarakhand Open University
Unit 6 Research Design II Page 114 of 434
processes, which is not true. Research design for each research process is unique and it
requires concrete focus of specifications of the tasks to be carried out in term of why, how
and when.
The research design formulation starts with specifying the objectives and scope of the
research. The researcher has to select the mode of inquiry that defines what kind of
knowledge is possible and legitimate. A large number of different terms have been used to
refer to designing in research and these terms are often used synonymously as methodologies,
approaches, perspectives, and philosophies as if they are all comparable , but they are
different.
The mode of inquiry and investigation of research problem defines epistemological position
of a researcher. Epistemology deals with the basic issue on knowledge exploration as “how
knowledge is derived and it should be tested and validated”. There are three suggested
modes of inquiry in research which guides the research design.
1. Positivistic – In this mode the empirical and scientific investigation is carried out. It
requires control and statistical mode of analysis
2. Constructivists- It emphasizes on qualitative mode of investigation and argues that it
is the best choice for research in social science as compared to quantitative method
3. Triangulation – It suggests simultaneous and sequential uses of qualitative and
quantitative methods of investigation
After selection of epistemological position from any one of the above stated approach, the
research questions are subjected to thorough and comprehensive theoretical review. It helps
the researcher to develop a practical and manageable perspective for the research question
and method of investigation.
After this step a conceptual research design is developed by the researcher in which variables
of study are identified and mode of study and analysis are selected.
After above discussions now you are able to understand about the aspects of research design.
More specifically a research design consists of following generic steps.
1. Selection and Definition of a problem: The problem selected for study should be
defined clearly in operational terms so that researcher knows positively what facts he
is looking for and hat is relevant to the study.
2. Source of Data: Once the problem is selected it is the duty of the researcher to state
clearly the various sources of information such as library, personal documents, field
work, a particular residential group etc.
3. Nature of Study: The research design should be expressed in relation to the nature of
study to be undertaken. The choice of the statistical, experimental or comparative type
of study should be made at this stage so that the following steps in planning may have
relevance to the proposed problem.

MS 110 Research Methodology Uttarakhand Open University
Unit 6 Research Design II Page 115 of 434
4. Object of Study: Whether the design aims at theoretical understanding or
presupposes a welfare notion must be explicit at this point. Stating the object of the
study helps not only in clarity of the design but also in a sincere response from the
respondents.
5. Social-Cultural Context: The research design must be set in the social-cultural
context. For example in a study of the fertility rate in a people of „backward‟ class the
context of the so-called backward class of people and the conceptual reference must
be made clear. Unless the meaning of the term is clearly defined there tends to be a
large variation in the study because the term backward could have religious, economic
and political connotations.
6. Temporal context: The geographical limit of the design should also be referred to at
this stage that research related to be hypothesis is applicable to particular social group
only.
7. Dimension: It is physically impossible to analyze the data collected from a large
universe. Hence the selection of an adequate and representative sample is a by-word
in any research.
8. Basis of Selection: The mechanics of drawing a random, stratified, and purposive,
double cluster or quota sample when followed carefully with produce a scientifically
valid sample in an unbiased manner.
9. Technique of Data Collection: relevant to the study design a suitable technique has
to be adopted for the collection of required data. The relative merit of observation,
interview and questionnaire, when studied together will help in the choice of suitable
technique. Once the collecting of data is complete, analysis, coding and presentation
of the report naturally follow. Schieldler and Cooper presented the steps of research
design in following models;

MS 110 Research Methodology Uttarakhand Open University
Unit 6 Research Design II Page 116 of 434
MS 110 Research Methodology Uttarakhand Open University
Unit 6 Research Design II Page 117 of 434
Check Your Progress-B
Q1. Give examples of research studies where case study method can be adopted ?
----------------------------------------------------------------------------------------------------------------
----------------------------------------------------------------------------------------------------------------
----------------------------------------------------------------------------------------------------------------
----------------------------------------------------------------------------------------------------------------
Q2. Discuss the history of Case study.
----------------------------------------------------------------------------------------------------------------
----------------------------------------------------------------------------------------------------------------
----------------------------------------------------------------------------------------------------------------
----------------------------------------------------------------------------------------------------------------
Q3.What is the ‘placebo’ design?
----------------------------------------------------------------------------------------------------------------
----------------------------------------------------------------------------------------------------------------
----------------------------------------------------------------------------------------------------------------
----------------------------------------------------------------------------------------------------------------
Q5. What are the basic guidelines to be used in research design?
----------------------------------------------------------------------------------------------------------------
----------------------------------------------------------------------------------------------------------------
----------------------------------------------------------------------------------------------------------------
----------------------------------------------------------------------------------------------------------------
6.10 SUMMARY In this unit we learned about the concept of research design. Various types of research design
were also studied. The criteria of a good research design and types of variables also
discussed. An effort has been made to explain the experimental, non- experimental and quasi
experimental research designs.

MS 110 Research Methodology Uttarakhand Open University
Unit 6 Research Design II Page 118 of 434
6.11 GLOSSARY
Phenomenon: a fact or situation that is observed to exist or happen.
Comparative Design: With a comparative design, as with most other designs, a study can
be carried out either as an experiment or as a non-experiment.
Placebo Study: A placebo study involves two or three groups, depending on whether or
not the researcher wants to have a control group If the researcher decides to have a control
group, the first group receives the treatment, the second receives the placebo treatment and
the third – the control group – receives nothing.
6.12 REFERENCES
Neogi U. K “Research Methodology Tools and Techniques” Variety Book
Publication.
Kumar Ranjeet “Research Methodology” Pearson Education.
Young V. Pauline, “Scientific Social Surveys and Research”.
Gopal, M.H. “An Introduction to Research Procedure in Social Sciences”.
Michacl, V. P. “Research Methods in Management’. Himalaya Publishing
House.
Kothari C.R. “Research Methodology” Vikas Publication.
Gode and Hatt. “Methods in Social Research”. Tata Mc Graw Hill, New Delhi.
OTAGO POLYTECHNIC Case study analysis skills available at op.ac.nz/
assets/ Student-Hub-Learning- Support/ aecaf9b1ca/ Case-study-analysis-
skills.pdf last accessed on 21 March, 2019.
9+ Case Analysis Examples-PDF, Word available at examples.com/ business/
case-analysis-examples-pdf.html last accessed on 21March, 2019.
Guidelines for Business Case Analysis by Prof. Dr. Christoph Rasche, Dr.
Achim Seisreiner University of Potsdam Adopted from Harvard Business School
and adjusted to the European diction of strategic management available at uni-
potsdam.de/ fileadmin01/ projects/ professional-services/ downloads/ skripte-ss/
Anleitung_case_studies.pdf last accessed on 21 March, 2019.
MS 110 Research Methodology Uttarakhand Open University
Unit 6 Research Design II Page 119 of 434
Cresswell, John, W.,(2008). Research Design; Qualitative, Quantitative and
Mixed Methods Approaches. Newbury Park, CA: Sage Publication.
Marczyk, G.R, DeMatteo, D. & Festinger D., (2005). Essentials of Research
Design and methodology, New York City, NY: Wiley.
Ethridge, Don E., (2004). Research Methodology in Applied Economics.
Daryaganj, ND: Wiley – Blackwell,
Bergh, D. and Ketchen, D. (2009) Research Methodology in Strategy and
Management. Binglay, UK: Emarald Group Publishing.
Kothari, C R (2008), Research Methodology & Techniques, New Age
Publication, Delhi
Bajpai, Naval (2012) Business Research Methods, Pearson, Delhi
Schiendler & Cooper(2009) : Business Research Methods, TMH, New Delhi
6.13 SUGGESTED READINGS
1. Donald R.Cooper and Ramcis S.Schindler, Business Research Methods, Tata
McGraw Hill Publishing CompanyLimited, New Delhi, 2000.
2. C.R.Kothari Research Methodology, Wishva Prakashan, New Delhi, 2001.
3. Uma Sekaran, Research Methods for Business, John Wiley and Sons Inc., New
York, 2000.
4. Neogi U. K “Research Methodology Tools and Techniques” Variety Book
Publication.
5. Kumar Ranjeet “Research Methodology” Pearson Education.
6. Young V. Pauline, “Scientific Social Surveys and Research”.
7. Gopal, M.H. “An Introduction to Research Procedure in Social Sciences”.

MS 110 Research Methodology Uttarakhand Open University
Unit 6 Research Design II Page 120 of 434
6.14 TERMINAL QUESTIONS
Q1. In which research studies Problem Based Learning can be adopted by a
Researcher?
Q2. Discuss the History of Case Study Method?
Q3. What are the benefits of Case Study Method?

MS 110 Research Methodology Uttarakhand Open University
Unit 7 Hypothesis – Formulation and Testing Page 121 of 434
UNIT 7 HYPOTHESIS – FORMULATION AND
TESTING
7.1 Introduction
7.2 Objectives
7.3. Hypothesis
7.4 Statistical Significance
7.5 One and Two-Tailed Tests
7.6 Type I And Type II Error
7.7 Testing of Hypothesis
7.8 Procedure Test Statistic for Testing Hypothesis
7.9 Summary
7.10 Glossary
7.11 Answers to Check Your Progress
7.12 References
7.13 Suggested Readings
7.14 Terminal & Model Questions
7.1 INTRODUCTION Having formulated the research problem, the researcher advances to develop the hypotheses
based on the facts already known. In the absence of hypotheses the researcher finds it
difficult to go ahead with the examination of his problem. Thus, the hypotheses provide
direction to the researcher through a complexity of facts to see and choose only those that are
relevant to the problem under investigation.
7.2 OBJECTIVES
After studying this unit, you shall be able to:
Know the tests and errors
Understand the steps in testing of hypotheses
Comprehend the test statistics

MS 110 Research Methodology Uttarakhand Open University
Unit 7 Hypothesis – Formulation and Testing Page 122 of 434
Know the meaning of hypothesis
Understand the types of hypothesis
Comprehend the sources of hypothesis
Understand the characteristics of a good hypothesis
Become aware of the testing of hypotheses
7.3 HYPOTHESIS Hypothesis is an assumption about a population. The research hypothesis is an assumption
made on the probable direction of the results attained on accomplishment of the research
process. The statement thus formulated can lend to empirical examination. Kerlinger (1986)
defined a hypothesis as a statement involving conjecture of the association between two or
greater than two variables. The formulation of a hypothesis should be in plain,
unambiguous and emphatic form. A broad hypothesis might not be empirically tested.
Thus, the hypothesis must be made single dimensional and test only one relationship
between only two variables at a time.
Consider, a study relating to buyers behavior. Some sample hypotheses are given below:
1. Mean purchases by females (µ1) is more than or equal to the mean purchases by
males ( µ2) in a cloth store ( µ1 ≥ µ2)
2. Mean age of females (µ1) is equal to or less than the mean age of males ( µ2) in
a book exhibition ( µ1 ≤ µ2)
3. Mean monthly income of buyers in a shop (µ1) is more than or equal to. 10,000
( µ ≥ 10,000 )
4. The mean stay over time of customers (µ) in a shop is at most 45 minutes (µ≤
45)
The hypothesis validation would essentially consist of testing the statistical
significance of the hypothesized relationship.
7.3.1 TYPES OF HYPOTHESES
The hypotheses could be of two types:
a) Descriptive hypotheses
The propositions that characteristically express the existence, size, form, or
distribution of some variable are known as descriptive hypotheses. They simply
state the magnitude, trend or behavior of a population being studied. Based on past
records, the researcher presumes about the variable under study. For example: The
literacy rate in a state is 95 percent.
Researchers often utilize a research question preferably to a descriptive hypothesis.

MS 110 Research Methodology Uttarakhand Open University
Unit 7 Hypothesis – Formulation and Testing Page 123 of 434
b) Relational hypotheses
Relational hypotheses are statements about the anticipated relationship between
two variables. For example: Indian customers perceive foreign cars better than
domestic cars. The relationship states that the variables move together in some
particular manner without stating causal relationship.
7.3.2 SOURCES OF HYPOTHESIS.
Some important sources of hypothesis are discussed here:
a) History of Science
The history of science offers effective evidence to the fact that personal and
idiosyncratic experience of the scientist contributed a lot to the type of form of
Questions as also to the kinds of tentative answers to such questions (hypotheses)
that. Some scientists may perceive an interesting pattern in what may seem a
jumble of facts to a common man. The history of science provides enough
discoveries made just because the ‘right’ person made the ‘right’ observation.
Personal life-histories determine the kind of perception which provides direction a
person towards certain hypotheses.
b) Analogies
Often useful hypotheses emerge from analogies. In sociology, a society is
compared to a biological organism, the natural law, to the social law and
thermodynamics to social dynamics, etc. Such analogies give valuable insights.
The communication models speak of the importance of analogies as sources of
useful hypotheses. Analogy may suggest hypothesis but the research must be
careful not to accept models from other disciplines only after a careful scrutiny of
the concepts in terms of their applicability to the new frame of reference in which
they are to be used.
c) Results of other studies
Hypotheses may be drawn from the findings of other studies. Based on the findings
of other studies hypotheses may be formulated assuming that similar relationship
between certain variables may exist in the present study also. Commonly
researchers design their study for replicating another study performed in a different
context.
d) Body of theory
A hypothesis may also come up from a body of theory through logical deduction,
may take to the prediction that if definite situations are in place reliable results are
probably to ensue. A theory presents evident knowledge; logical deduction from
this type of hypotheses to be true if the theory is true.
e) Value orientation of the culture
The value orientation of the culture rests in a science which presents various
fundamental hypotheses. Certain hypotheses that engage the attention of scientists
MS 110 Research Methodology Uttarakhand Open University
Unit 7 Hypothesis – Formulation and Testing Page 124 of 434
in particular societies or cultures may get the credit to the cultural emphases. Folk-
wisdom present in the culture also serves as a pertinent source of hypotheses.
7.3.3 FEATURES OF A GOOD HYPOTHESIS
The criteria for evaluating the worth of the hypotheses are the performance to carry
out their functions vis-à-vis research as well as the growth of knowledge. Hence a
good hypothesis must have the following characteristics:
a) Empirically testable
A hypothesis should possess the feature of being empirically testable. Logical
inferences are possibly drawn which in turn may be evaluated by field observation.
The hypotheses should have empirical referents. The concepts contained in the
hypothesis must have empirical correspondence. For example, ‘Bad parents beget
bad children’. This statement hardly qualifies as a usable hypothesis.
b) Closest to things observable
Hypotheses should be closest to objects that are observable. Failing this, it would
be complex to assess their harmony with empirical body of facts. The formulation
of a hypothesis must be such that deductions can be drawn and a decision is arrived
at to determine the explanation of the thought about facts.
c) Conceptually clear
The conceptual clarity must be inherent in a hypothesis. Formal definition of the
concepts will make a particular concept clear, while the operational definition
clarifies the empirical evidence of the concept in the field. The concepts contained
in the hypotheses are generally approved and transferable. This would assure
continuity in researches resulting in development of scientific knowledge.
d) Hypothesis must be specific
Often the researchers are tempted to state their hypotheses in such general terms
and with so widely elaborated a scope that they are simply not testable. The
concepts lacking tangible indexes are better avoided by the researchers in their
hypotheses. A hypothesis should have a clear statement of indexes to be tested.
Specific formulations of hypotheses ensure the practicability and importance of
research. It increases the validity of the results.
e) Hypothesis must be related with a theory
The hypothesis should possess theoretical orientation. This characteristic is related
with the theoretic reasons of a hypothesis. If the hypothesis is concerned to the
theory, research will make competent, support, correct or refute the theory.
7.3.4 FORMULATION OF RESEARCH HYPOTHESIS
The formulation of a hypothesis involves the following essential steps.
Formulation of Alternative Hypothesis

MS 110 Research Methodology Uttarakhand Open University
Unit 7 Hypothesis – Formulation and Testing Page 125 of 434
A researcher should begin with attempting to establish all the alternative solutions of his
research problem. The researcher will decide which of the different options of action is
creating the direct effect in terms of a certain criteria. If a problem whose solution depends
on definite forecasts and the investigator understands that that there are three theories which
are concerned to the problem. If one of the three alternative theories is in a position to
predict events more exactly than the other two, it is indeed the most efficient resolution of
the issue. The alternative hypotheses that the investigator presents to formulate are
articulated states in respect of each of the substitute means under which terms, it can be
thought the most efficient. Thus, the alternative hypotheses are acceptance conditions stated
for the different course of action.
In all research, different courses of action, conditions for acceptance and hypotheses
formulated need be expressed clearly. No scientific method of choosing one of the
alternative hypotheses exists unless there is no index of efficiency to be used to each of the
other courses of action. The suitability of the effect of efficiency relies on definite
conditions held. For example, of the alternative techniques of teaching, the application of
examination score as an effect of efficiency may be appropriate only if each subject is
permitted an equal time to accomplish the common test. These conditions make the terms
of accord among the hypotheses. Such points of accord among the hypotheses must be
explicit or valid. If the investigator designs two hypotheses, at least one issue of acceptance
and one of disagreement must exist among them.
In case of rejection of null hypothesis the opposite of the null hypothesis must be true. The
hypothesis representing the opposite of the null hypothesis is known as alternative
hypothesis.
These substitute hypotheses is denoted by (H1) as under:
H1: MN (M and N to be true)
H2 MN’ M to be true but denies N
For example, if the null hypothesis is:
H0 : µ ≥5
The alternative hypothesis:
(a) If the mean number of defects per sub-assembly in the sample is greater than
or equal to the critical value, then the null hypothesis (H0) is accepted and the
alternative hypothesis (H1) is rejected.
(b) If the null hypothesis (H0) is rejected, the alternative hypothesis is accepted.
The alternative hypothesis for sub-assembly is :
H1: The mean number of defects per sub-assembly in the sample is more than
5.
H1: µ> 5
If the mean number of defects per sub-assembly is equal to or less than the
critical value, the alternate hypothesis is rejected and the null hypothesis
accepted.
MS 110 Research Methodology Uttarakhand Open University
Unit 7 Hypothesis – Formulation and Testing Page 126 of 434
Formulation of Null Hypothesis
The two hypotheses- alternative hypothesis as well as the null hypothesis jointly
represents a method for hypotheses testing. Null hypothesis in its understandable
form states that no variance exists between two populations in regard to some
characteristic and that the variance noticed between the samples taken from these
populations is by chance only and not significant.
A null hypothesis states that the results of research do not have significant
difference from the findings anticipated on a probability basis or specified in
terms of certain theory. For example, a null hypothesis may state that:
HO: The males and females do not significantly differ in respect of the frequency
of visiting cinema.
Commonly, a null hypothesis is higher valuable as compared to other hypotheses
as it is definite, easier to reject the opposite of a hypothesis than accept it with
certainty. Hence, the concept of null hypothesis is more useful. In addition, the
statistical techniques are better suited to test a null hypothesis.
Let us consider a particular sub-assembly of fuel pump received from a vendor for
use in the assembly of motor cycle in an automobile company. The sample of
defects while inspecting the number of defects found in each assembly is taken for
the purpose of controlling the quality of the sub-assemblies. The number of
defects per sub-assembly follows normal distribution with mean µ and variance
σ2.
The claim of the vendor is that the mean number of defects found in the shipments
of fuel pumps is confined to 5. Then, the inspection draws a sample and inspects
all the pumps to identify the number of defects in each pump.
On the basis of the critical value, the researcher decides either to approve or
discard the null hypothesis. A possible null hypothesis the investigator makes
concerning the population from which the sample is drawn is H0:The mean defects
per assembly in the population is more than or equal to 5:
µ ≥ 5
Check Your Progress-A
Q1. What are various types of Hypothesis?
----------------------------------------------------------------------------------------------------------------
----------------------------------------------------------------------------------------------------------------
----------------------------------------------------------------------------------------------------------------
----------------------------------------------------------------------------------------------------------------
MS 110 Research Methodology Uttarakhand Open University
Unit 7 Hypothesis – Formulation and Testing Page 127 of 434
Q2. List the features of a Good Hypothesis.
----------------------------------------------------------------------------------------------------------------
----------------------------------------------------------------------------------------------------------------
----------------------------------------------------------------------------------------------------------------
----------------------------------------------------------------------------------------------------------------
Q3. What do you mean by Null Hypothesis?
----------------------------------------------------------------------------------------------------------------
----------------------------------------------------------------------------------------------------------------
----------------------------------------------------------------------------------------------------------------
----------------------------------------------------------------------------------------------------------------
Q4. What is the Procedure for Hypothesis Testing?
----------------------------------------------------------------------------------------------------------------
----------------------------------------------------------------------------------------------------------------
----------------------------------------------------------------------------------------------------------------
----------------------------------------------------------------------------------------------------------------
7.4 STATISTICAL SIGNIFICANCE Adopting the sampling approach, we either reject a hypothesis or accept it based on the
information of sampling. Since any sample tends to differ somewhat from its universe, it
needs to be judged if such variances are statistically significant. A difference is statistically
significant if there is a cause to accept the difference is not due to random sampling
fluctuations merely.
In tests of significance, we use two kinds of hypothesis. The null hypothesis is used for the
purposes of testing. It specifies that no difference exist between the parameter and the
statistic under comparison. The researchers often attempts to establish if there is a
difference. The testing hypothesis is not expressed in a positive form. This positive form of
hypothesis is difficult to be tested accurately. The available body of facts consistent with a
hypothesis expressed in a positive form can rarely be taken as decisive base for agreeing to
the hypothesis. A result consistent with this kind of hypothesis might be in consonance with
other sorts of hypothesis also, and thus does not exhibit the true nature of a particular
hypothesis.
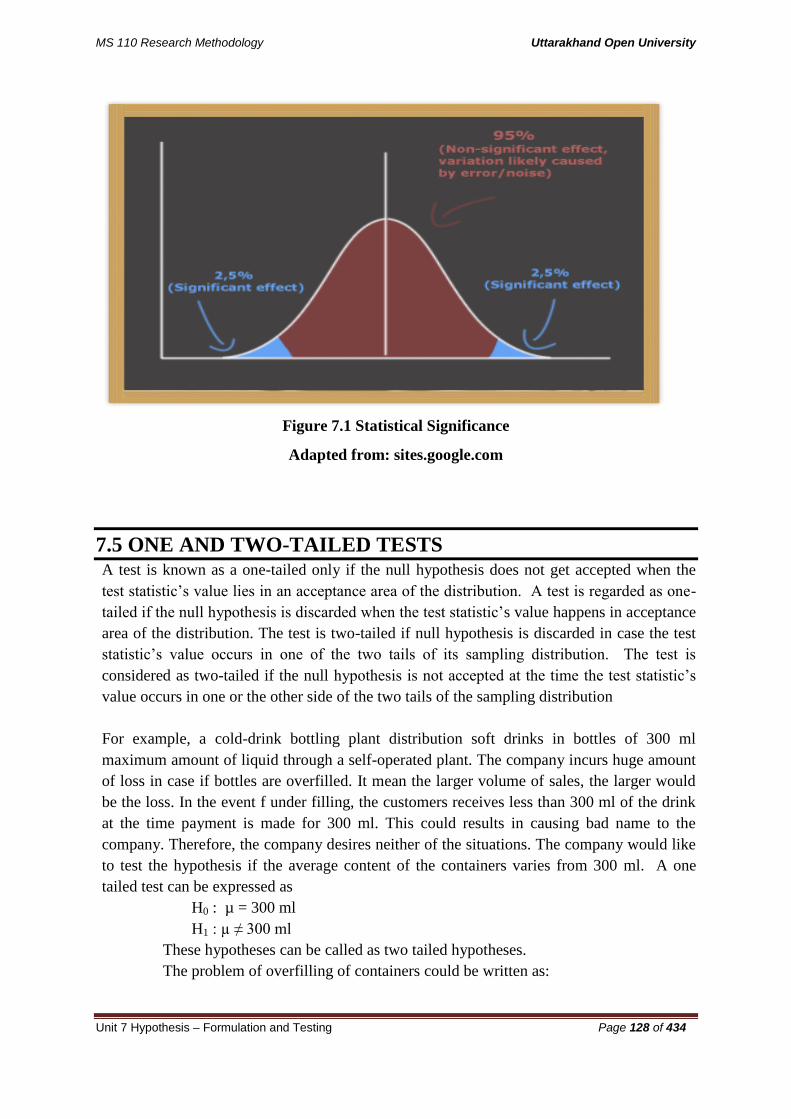
MS 110 Research Methodology Uttarakhand Open University
Unit 7 Hypothesis – Formulation and Testing Page 128 of 434
Figure 7.1 Statistical Significance
Adapted from: sites.google.com
7.5 ONE AND TWO-TAILED TESTS A test is known as a one-tailed only if the null hypothesis does not get accepted when the
test statistic’s value lies in an acceptance area of the distribution. A test is regarded as one-
tailed if the null hypothesis is discarded when the test statistic’s value happens in acceptance
area of the distribution. The test is two-tailed if null hypothesis is discarded in case the test
statistic’s value occurs in one of the two tails of its sampling distribution. The test is
considered as two-tailed if the null hypothesis is not accepted at the time the test statistic’s
value occurs in one or the other side of the two tails of the sampling distribution
For example, a cold-drink bottling plant distribution soft drinks in bottles of 300 ml
maximum amount of liquid through a self-operated plant. The company incurs huge amount
of loss in case if bottles are overfilled. It mean the larger volume of sales, the larger would
be the loss. In the event f under filling, the customers receives less than 300 ml of the drink
at the time payment is made for 300 ml. This could results in causing bad name to the
company. Therefore, the company desires neither of the situations. The company would like
to test the hypothesis if the average content of the containers varies from 300 ml. A one
tailed test can be expressed as
H0 : µ = 300 ml
H1 : µ ≠ 300 ml
These hypotheses can be called as two tailed hypotheses.
The problem of overfilling of containers could be written as:

MS 110 Research Methodology Uttarakhand Open University
Unit 7 Hypothesis – Formulation and Testing Page 129 of 434
H = µ = 300 ml
H1 = µ > 300 ml
These hypotheses are known as one tailed hypothesis. Here the analyst would be
concerned in the higher portion of the distribution of sampling. However, if the
issue is under-filling of the containers, the hypotheses may be stated as:
H0 = µ = 300 ml
H1 = µ < 300 ml is of the distribution
The descriptive and relational hypotheses have to be reduced to a statistical H0 also
the corresponding alternative hypotheses as H1.
7.6 TYPE I AND TYPE II ERROR The rejection and acceptance of a hypothesis relies upon the same results. A chance ever
exists that the population is not accurately represented in the sample. Therefore, errors may
occur and the drawn results could be erroneous. This could be represented as in Fig.6.1.
i
Figure 7.2 –Type of errors
Figure 7.3 Type of errors

MS 110 Research Methodology Uttarakhand Open University
Unit 7 Hypothesis – Formulation and Testing Page 130 of 434
If null hypothesis being true is accepted or the null hypothesis being false is rejected, the
decision is appropriate. However, if the hypothesis being really true, is rejected, Type I error
is made. The symbol alpha (α) represents the Type I error. Similarly, if the null hypothesis is
accepted, when actually it is false the researcher commits type II error. The symbol beta (β)
represents the probability of doing a second type of error which is called the power of test.
7.7 TESTING OF HYPOTHESIS PROCEDURE The following main steps are involved in testing of a hypothesis as shown in Fig.6.2.
7.7.1 ESTABLISHING A HYPOTHESIS
The initial step in hypothesis testing is to set a hypothesis concerning a population
parameter. The traditional approach to hypothesis testing is not to build a single hypothesis,
but to establish two varying hypotheses. The null hypothesis, H0, and the alternative
hypothesis Ha are stated, the setting up alternative hypothesis demonstrates what the
researcher attempts to prove. The null hypothesis demonstrates the denial of what the
researcher is attempting to prove.
Fig 7.4 Procedure of testing of Hypothesis
7.7.2 LEVEL OF SIGNIFICANCE
The function of hypothesis testing requires choice of a significance level. The level of
significance (α) is selected before sample selection. The significance level represents that
the researcher either accepts or rejects the null hypothesis at the time it is in fact true. The

MS 110 Research Methodology Uttarakhand Open University
Unit 7 Hypothesis – Formulation and Testing Page 131 of 434
value of the level of significance varies from issue to issue but frequently it is taken as
either 5 per cent or 1 percent. A five per cent level of significance is understood that there
would be 5 chances out of one hundred that a null hypothesis is discarded while it is to be
accepted. This implies that the researcher is 95 percent sure that a correct decision has been
made. So it is found that the confidence level with which a researcher rejects or accepts a
null hypothesis depends upon the level of significance. When the null hypothesis gets
rejected at a specific level, the result is considered to be significant. A hypothesis rejected
at 1 per cent level of significance, also need to be rejected at 5 per cent level of significance
7.7.3 DECISION ON A TEST STATISTICS
The further stage in testing of hypotheses is to establish a test criterion of selection of a
suitable probability distribution for a particular test, i.e. a probability distribution that can
appropriately be relevant. Probability distributions commonly used in testing procedures are
t, F . Test criteria must use a relevant probability distribution; for example, if only small
sample is available, the use of the normal distribution would not be correct. Different test
statistics include t, Z, X2 or F, relying upon various assumptions.
7.7.4 CRITICAL REGION DETERMINATION
Before drawing a sample from the population, it is crucial to explicitly determine the values
of test statistic which may result in rejection or acceptance of the null hypothesis. The
critical region makes the null hypothesis rejected. With a particular level of significance, α is
the optimal critical region for a two-tailed test having α/2 per cent area in the right tail of the
distribution plus α/2 per cent in the left tail of the sampling distribution in the case of
rejection of null hypotheses? Therefore, determining a critical region is similar deciding a
100 (1-α) per cent confidence interval.
Figure 7.4 Critical Region
Adapted from cma.cmappers.net
7.7.5 DETERMINING VALUE OF TEST-STATISTICS
The value of the test statistic relies upon the random sample of size n. Once the computation
of the value of test statistic is done, the analyst must verify if the sample results happen in the
region of criticality or the acceptance region.

MS 110 Research Methodology Uttarakhand Open University
Unit 7 Hypothesis – Formulation and Testing Page 132 of 434
7.7.6 DECISION
There may be two possible alternatives. The hypothesis either is rejected or is accepted on the
basis of test statistic’s value occurring in the discard region or the approval region. The
decision depends upon the statistical decision for rejecting or accepting the null hypothesis.
If the researcher examines the hypothesis at 5 per cent level of significance, it would be
rejected if the observed results have a probability of less than 5 per cent. In such a case, the
degree of contrast of the sample statistic and the population parameter is considered to be
significant. On the other hand, the acceptance of the hypothesis indicates that the deviation
between the sample statistic and the population parameter is not significant. This difference
may take place due to chance.
7.7.7 STANDARD ERROR AND SAMPLING DISTRIBUTION
Standard deviation of the sampling distribution is known as the standard error. It gauges the
sampling variation due to chance or random pressures. The selection of a number of
independent random samples of a specific size from a given population takes place and some
statistic is computed as the mean or standard deviation, from each sample, a series of values
of these statistics are obtained. Such values received from the various samples can be
expressed in the shape of a frequency distribution. The distribution thus formed of all
probable values of a statistic is known as the sampling distribution or the probability
distribution of a statistic. The symbols S and Ⱦ are represented as the standard deviation and
the mean of the sampling distribution.
Check Your Progress-B
Fill in the Blanks
1. A test is known as a ________________________ only if the null hypothesis does
not get accepted when the test statistic’s value lies in an acceptance area of the
distribution.
2. An error caused by rejecting a null hypothesis which is true is called
as_________________
3. The second type of error that can be made in significance testing is failing to
reject a false null hypothesis. This kind of error is called a ________________.
4. The __________________level represents that the researcher either accepts or
rejects the null hypothesis at the time it is in fact true.

MS 110 Research Methodology Uttarakhand Open University
Unit 7 Hypothesis – Formulation and Testing Page 133 of 434
7.8 PROCEDURE TEST STATISTIC FOR TESTING
HYPOTHESIS
For testing of hypothesis, it is appropriate to use a relevant test statistic. If the size of the
sample is (n>30), Z statistic could be appropriate. For the small samples (n<30), when the
population standard deviation is known z statistic can be employed. However, if the standard
deviation (δ) is unavailable and is evaluated using sample data, a t test with an appropriate
degree of freedom is applied with the presumption that the sample is taken from a normal
population.
Size of sample Population Standard Deviation (δ)
Known Not known
Large (n>30) Z Z
Small (n<30) Z t
Testing of Hypothesis
Test concerning Mean- Single Population
(a) Sample > 30
For either large sample, or tiny sample (< 30) if the standard deviation concerning
population is known, Z test is suitable. The two-tailed tests together with one-tailed
tests of hypothesis can occur
If Null hypothesis H0: µ = µ0, Z test statistic can be used:
The test statistic is:
µ
σ
Where
= Sample mean
σ = Population standard deviation
µHo = Value of µ assuming the null hypothesis to be true
n = Size of sample
In case the standard deviation relating to population is not clearly recognized, the
sample standard deviation
s= 1/n-1∑( -Ⱦ) 2
is used as an estimate of σ.
Example.6.1: A company draws a sample of 200 bulbs with a lifetime mean of
1540 hours and a standard deviation of 42 hours. Has the sample been drawn from
a population having a mean life time of 1540 hrs. 5 per cent level of significance is
used.
Solution: In this example, n=200, sample mean = 1540 hours and the sample
standard deviation s(42) hours.

MS 110 Research Methodology Uttarakhand Open University
Unit 7 Hypothesis – Formulation and Testing Page 134 of 434
The null and alternative hypotheses can be stated as:
H0: µ = 1500 hrs
H1:≠ µ 1500 hrs
It is an example of two tailed test at0.05 level of significance. Since n > 30, though
population standard deviation σ is not known Z test can be applied. The test
statistics is:
Z =
Where,
µH0 = Value of µ with the assumption of null hypothesis being true
σ/x = Estimated standard error of mean
µH0 = 1500, σ/x = σ/ = s/ = 42/ = 2.97
= 1540-1500/2.97= 50/2,97= 13.47
The value of α= 0.05. Since it is a two tailed test, the critical value of Z is given by
Zα/2 and –Zα/2 obtainable from the standard normal table.
Since the calculated value of Z = 13.47 which lies in the region of rejection, the
null hypothesis is rejected. It is, therefore, concluded that that mean life of the bulb
is significantly different from 1500 hours.
b) Sample < 30
For small samples (n 30) taken from a population with a normal distribution and
the standard deviation relating to population is not clearly recognized (α), a t test is
appropriate to conduct the hypothesis for the test of mean. The t is a symmetrical
distribution similar to the normal one. However, t distribution takes place
comparatively lower at the peak and higher at the tail. The t distribution is to a
more extent flat in comparison to the normal distribution. With the increase in the
size of sample and the degrees of freedom, t distribution reaches the normal
distribution when n > 30.
The procedure for testing of a mean is similar to the case of large sample. The test
statistic used in this case is
t n-1 Ⱦ
σ Ⱦ
Where σ = s/ (s = Sample standard deviation)
n-1 = degrees of freedom.
Example 6.2
From graduate engineering students a sample of 16 students was taken. The
information about their initial salary was obtained. The average monthly beginning
salary was found to be Rs.30200 with a standard deviation of Rs.960. The
historical data on beginning salary gave a mean value of Rs.30000. At 5 per cent
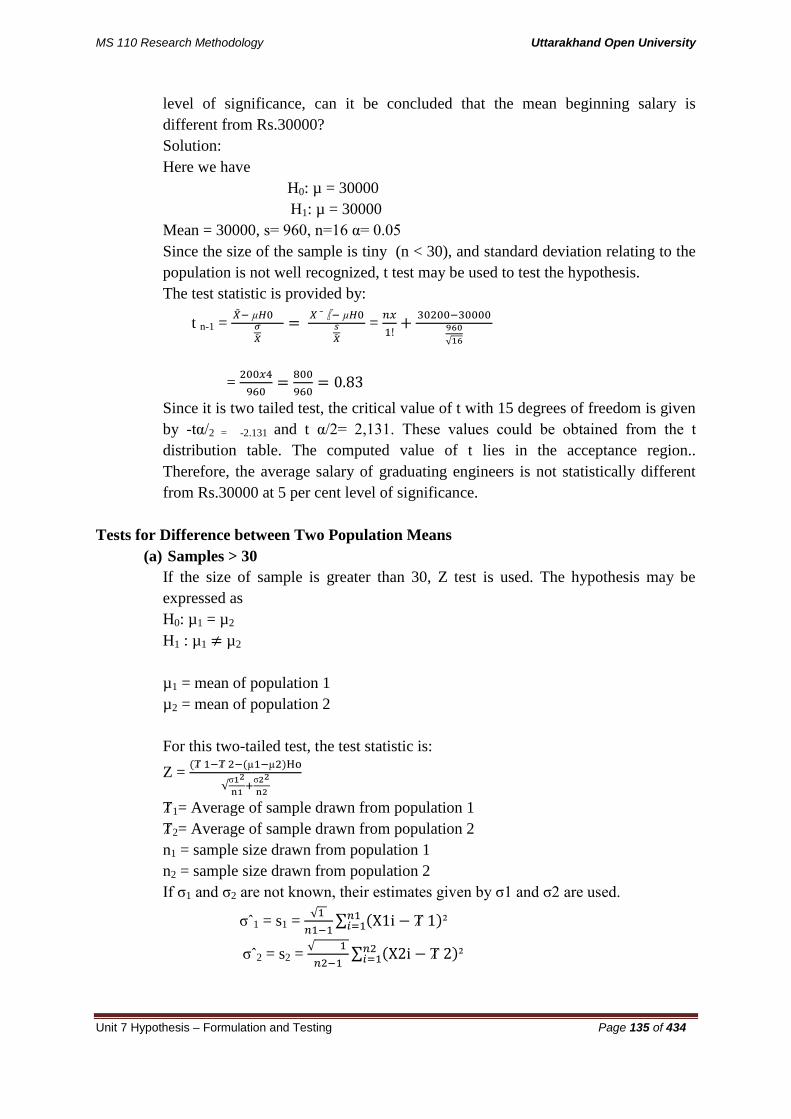
MS 110 Research Methodology Uttarakhand Open University
Unit 7 Hypothesis – Formulation and Testing Page 135 of 434
level of significance, can it be concluded that the mean beginning salary is
different from Rs.30000?
Solution:
Here we have
H0: µ = 30000
H1: µ = 30000
Mean = 30000, s= 960, n=16 α= 0.05
Since the size of the sample is tiny (n < 30), and standard deviation relating to the
population is not well recognized, t test may be used to test the hypothesis.
The test statistic is provided by:
t n-1 =
=
=
Since it is two tailed test, the critical value of t with 15 degrees of freedom is given
by -tα/2 = -2.131 and t α/2= 2,131. These values could be obtained from the t
distribution table. The computed value of t lies in the acceptance region..
Therefore, the average salary of graduating engineers is not statistically different
from Rs.30000 at 5 per cent level of significance.
Tests for Difference between Two Population Means
(a) Samples > 30
If the size of sample is greater than 30, Z test is used. The hypothesis may be
expressed as
H0: µ1 = µ2
H1 : µ1 µ2
µ1 = mean of population 1
µ2 = mean of population 2
For this two-tailed test, the test statistic is:
Z = Ⱦ Ⱦ µ µ
σ
σ
Ⱦ1= Average of sample drawn from population 1
Ⱦ2= Average of sample drawn from population 2
n1 = sample size drawn from population 1
n2 = sample size drawn from population 2
If σ1 and σ2 are not known, their estimates given by σ1 and σ2 are used.
σ 1 = s1 =
Ⱦ
σ 2 = s2 =
Ⱦ

MS 110 Research Methodology Uttarakhand Open University
Unit 7 Hypothesis – Formulation and Testing Page 136 of 434
The Z estimate can be computed applying the formula and tallied with the table
value to accept or reject the hypothesis.
Example 6.3
A study is conducted to determine the equality of mean hourly wages of the
unskilled workers in the two locations. The sample hourly earnings of the two
locations is taken using random sampling technique and the following results are
obtained:
Location Mean hourly
earnings
Standard deviation
of sample
Sample size
A .95 ( 1) 0.40 (s1) 200 (n1)
B 9.10 ( 1) 0.60 (s1) 175 (n2)
Using a 5 per cent level of significance, the hypothesis of no difference in the
mean wages of unskilled workers in the two locations is tested.
Solution:
H0: µ1= µ2 µ1- µ2 = 0
H1: µ2= µ2 µ1 -µ2 = 0
The following information is given:
1 = 8.95, 2 = 9.10, s1 = 0.40, s2 0.60, n1 = 200, n2 = 175, α= 0.05
The sample being large and the sample standard deviations being clearly
recognized, a Z test can be applied.
The test statistics is provided by:
Z = µ
As the sample standard deviations are unknown, their estimates would be used,
s1 = s 2 = σ2
As here is the question of two tailed test, the critical value of Z at 5 per cent level
of significance are given by – Zα/2= -1.96 and Zα/2= 1.96. The sample value of Z
= -2.83 lies in the rejection region. It is therefore, concluded that a difference exists
in the mean wages of unskilled workers in the two locations.
(b) For Sample < 30
In case both the samples are (< 30 ) and the population standard deviation is not
known, the procedure to discuss the equality of two population means would not
be used in the sense that a t test would be applicable under the assumptions:
(a) The two population variances are same
(b) Two population variances are not same
If Population variances are equal

MS 110 Research Methodology Uttarakhand Open University
Unit 7 Hypothesis – Formulation and Testing Page 137 of 434
In case the two population variances are same, their respective unbiased estimates
are also same. The formula can be written as:
=
=
(An assumption of σˆ1² = σˆ2² is made)
For obtaining an estimate of σ2, a weighted average of s
21 s
22 is usable where the
weights represent degrees of freedom for every sample. The weighted average is an
accumulated estimate of σ2. The estimate is given by the following equation:
σ
The following the procedure for testing:
H0: µ1=µ2 µ1- µ2=0
H 1: µ1 ≠µ2 µ1≠µ2 =0
Once the calculation of t statistic from the sample data is made, its value is
compared with the table value at the selected level of significance for acceptance
or rejection of hypothesis.
Example 6.3
Two different companies manufactured two drugs for curing arthritis. The
information relating to the administration of the first drug to a group of 12 patients
was Fthat it produced a mean of 8.5 hours of relief with a standard deviation of 1.8
hours. On a sample of 8 patients , the test of second drug was made which
produced an average of 7.9 hours of relief. For testing the hypothesis 5 per cent
level of significance may be used.
Solution:
H0: µ1= µ2 µ1- µ2 = 0
H1: µ2= µ2 µ1 -µ2 = 0
The information made available is
1 = .5, 2 = 7.9, s1 = 1.8, s2 = 2.1, n1 = 12, n2 = , α= 0.05
Since both the samples are small and the standard deviations are not known, we
can use a t test with the degrees of freedom = n1 + n2 = 12+8- 2 = 18 d.f.
tn1+n2-2 = µ
=
=
=
= = 1.92

MS 110 Research Methodology Uttarakhand Open University
Unit 7 Hypothesis – Formulation and Testing Page 138 of 434
T =
= 0.6/1.92
=
=
= 0.865
The critical value of t at 18 degrees of freedom at 5 per cent level of significance is
1.734.. The sample value of t = 0.685 which lies in the acceptance region.
The null hypothesis is, therefore, accepted. It can be concluded that the first drug is
not significantly more effective than the second drug.
(c) Paired sample (dependent sample)
For dependent samples (paired sample), two observations each respondent
provides two observations one before administering the treatment and the other
after the administration of the treatment. For example, a part of customers
articulate their impression concerning a product and later on, they view a television
commercial about the same product. After seeing the advertisement, they are again
questioned about their perception on the product. This sample is termed as
dependent or paired sample as the same respondent provides two observations. The
objective could be to investigate a change in perception and the direction after the
respondents saw the advertisement,
The application of dependent sample performs a more precise analysis as it
controls the extraneous variables. The difference is that the problem is converted
from two samples to a one-sample score the management trainees obtain divided
randomly into two equal sizes, one taught by each method. After obtaining the
scores by two methods, the null hypothesis of average scores being equal by two
methods is written as:
H0: µ1 = µ2
H1: µ1 = µ2
Let µd = µ1- µ2
Since the pair sample observations are taken, the hypothesis is converted to:
H0: µd = 0
H1: µd ≠ 0
We intend to test that the average difference in score is zero against the alternative
hypothesis. Here, d represents the variance in scores by two methods.
The test statistic in such a case,
t= ď/s
A t distribution with n-1 degrees of freedom is followed
Where ď = Mean of difference = ∑di/n
s= standard deviation of differences =
n= number of paired observations concerned with the sample

MS 110 Research Methodology Uttarakhand Open University
Unit 7 Hypothesis – Formulation and Testing Page 139 of 434
For a specific level of α, the estimated t statistic is compared with the tabulated t
with n-1 degrees of freedom for the acceptance or rejection of hypothesis.
7.9 SUMMARY Once the research problem is formulated, the investigator proceeds to formulate the
hypotheses for testing. A hypothesis is a statement involving conjecture of the association
between two or more variables articulated in a way that can prove or disprove it with the
valid and reliable data. There are two types of hypotheses- Descriptive hypotheses and
relational hypotheses. A good hypothesis must be empirically testable, closest to things
observable. A hypothesis testing involves a number of steps including formulation of a
hypothesis, set up a suitable significance level, choose a test criterion, compute the statistic
and make decision.
The major research objective of inferential statistics is testing of research hypothesis through
statistical hypotheses. A test is called one-tailed only if the null hypothesis gets rejected when
the test statistic’s value occurs in acceptance region of the distribution.
The acceptance and rejection of a hypothesis depends upon the similar results. There is ever a
chance of the sample not representing the population and therefore, resulting in errors and
the results drawn could be faulty. In testing of a hypothesis, major steps are the setting up of
a hypothesis, deciding the level of significance, decision on a test statistics, the determination
of a critical region, computing the value of test statistics and making-decision. The standard
deviation related to the sampling distribution is called the standard error. If the size of the
sample is (n>30), Z statistic could be appropriate. For the small samples (n<30), on the
availability of the standard deviation related to the population, z statistic can be used.
However, if the standard deviation (δ) is not known and is assessed using sample data, a t test
with suitable degree of freedom is applied under the presumption that the sample is drawn
from a normal population. In case of large sample, or small sample if the population standard
deviation are known Z test is applicable. In case the standard deviation of the population is
not recognized, the sample standard deviation is applicable as an estimate of σ .= In case of
small samples (n 30) drawn from a population with a normal distribution and the population
standard deviation is not known (α), a t test is applicable to perform the hypothesis for the
test of mean.
In case of tests for difference between two populations means where the sample size more
than 30, Z test is applicable. In case both the samples are (< 30 ) and the standard deviation
concerning population is not recognized, the procedure to discuss the equality of two
population means would not be applicable in the sense that a t test would be applicable. If the
two population variances are equal, their respective unbiased estimates are also equal.

MS 110 Research Methodology Uttarakhand Open University
Unit 7 Hypothesis – Formulation and Testing Page 140 of 434
7.10 GLOSSARY
Hypothesis: Hypothesis is an assumption done on the probable direction of the results that
might be obtained on completion of the research process.
Level of Significance: The significance level represents when the researcher either accepts
or discards the null hypothesis at the time it is actually true.
Standard Error: The standard deviation related to the sampling distribution is known as the
standard error.
7.11 ANSWERS TO CHECK YOUR PROGRESS
Check Your Progress-B
Fill in the Blanks
1. one-tailed
2. Type I error
3. Type II error
4. Significance
7.12 REFERENCES
Ary Donald, et.al. 2010, Introduction to Research in Education, Eighth Edition.
Cengage Learning Products, USA; Wadsworth Belmont.
Guy. 2006. Educational Research; Competencies for Analysis and Application, 8th
edition. ; Pearson Education, Inc. New Jersey
Kerlinger, Fred N.2000. Foundations of Behavioral Research, University Books,
New Delhi.
Singh, Kumar. 2006. Fundamental of Research Methodology and Statistics; New
Age International (p) limited, New Delhi.
Singh, S.P.2009, Marketing Research Text and Cases, Wisdom Publications, Delhi.

MS 110 Research Methodology Uttarakhand Open University
Unit 7 Hypothesis – Formulation and Testing Page 141 of 434
7.13 SUGGESTED READINGS
1. Donald R.Cooper and Ramcis S.Schindler, Business Research Methods, Tata
McGraw Hill Publishing CompanyLimited, New Delhi, 2000.
2. C.R.Kothari Research Methodology, Wishva Prakashan, New Delhi, 2001.
3. Uma Sekaran, Research Methods for Business, John Wiley and Sons Inc., New
York, 2000.
4. Ary Donald, et.al. 2010, Introduction to Research in Education, Eighth Edition.
Cengage Learning Products, USA; Wadsworth Belmont.
5. Guy. 2006. Educational Research; Competencies for Analysis and Application, 8th
edition. ; Pearson Education, Inc. New Jersey
6. Kerlinger, Fred N.2000. Foundations of Behavioral Research, University Books,
New Delhi.
7. Singh, Kumar. 2006. Fundamental of Research Methodology and Statistics; New
Age International (p) limited, New Delhi.
8. Singh, S.P.2009, Marketing Research Text and Cases, Wisdom Publications,
Delhi.
7.14 TERMINAL QUESTIONS
Q1. What is Hypothesis? Discuss the types of Hypothesis.
Q2. What are the sources of a hypothesis? What are features of a good hypothesis?
Q3. Explain the process of formulation of research hypothesis.
Q4. What are one tailed and two tailed tests?
Q5. What are the test statistics for testing hypothesis?
Applied Questions:
Q6. The company ABC manufacturing tube lights hypothesizes that life of its tube
lights is 145 hours with a known standard deviation of 210 hours. A random sample
of 25 tube lights gives a mean life of 130 hours. Using a 0.05 level of significance,
can the company conclude that the mean life of tube lights is less than the 145 hours.

Block II
Methods of Data Collection

MS 110 Research Methodology Uttarakhand Open University
Unit 8 Types and Sources of Data Page 142 of 434
UNIT 8 TYPES AND SOURCES OF DATA
8.1 Introduction
8.2 Objectives
8.3 Data Types
8.4 Classification of Data
8.5 Qualitative Data and Types
8.6 Quantitative Data and Types
8.7 Basis of Data Classification
8.8 Primary and Secondary Data
8.9 Research Applications of Secondary Data
8.10 Summary
8.11 Glossary
8.12 Answers to Check Your Progress
8.13 References
8.14 Suggested Readings
8.15 Terminal & Model Questions
8.1 INTRODUCTION Research data may be collected in various ways. Some of these methods depend on the
methodology and the theoretical assumptions used in the research. “ Triangulation”- a notion
introduced from military studies by Denzin (1978) (as quoted by Tomkin & Groves, 1983),
has been suggested as a way to make research studies more robust and rigorous by verifying
results through different methods, thus ensuring that the results are not a function of the
research method.
There are two types of data used in research
1. Primary Data
2. Secondary Data
Data that are observed or collected directly from first-hand experience are called as primary
data. Data already collected by different authorities and the data already available in
different mediums will be considered the secondary data. As far as the sources of
secondary data is concerned different government and non-government agencies are
frequently gathering the required information. Following are the most popular organizations
which frequently try to get the information:
Marketing Research Team (MART)
Census
Indian Market research Bureau (IMRB)
National Council of Applied Economic Research (NCAER)
Insurance Regulatory Development Authority (IRDA) Etc.

MS 110 Research Methodology Uttarakhand Open University
Unit 8 Types and Sources of Data Page 143 of 434
8.2 OBJECTIVES After going through this unit, you'll be able:
To understand the purpose of collecting primary and secondary data
To acquaint about the different methods of collecting primary information.
To get the knowledge about the secondary source of information.
To know about the classification of data.
To acquaint about significance of tabulation and classification of the data.
8.3 DATA TYPES In order to analyses and interpreted the information to draw the valid results or inferences
there is always need of the required information mostly known as the data. The type of data
depends upon the nature of the study. Mostly studies are descriptive, exploratory and causal
or combination of two of these. If the purpose of the study is to describe the phenomenon,
problem, an issue, a situation without quantifying the extent of variation into the
phenomenon, problem, an issue, situation qualitative information is necessary. For example
how the non-financial motivational factors can influence the job performance of the
employees in any organization. In order to get the required information firstly there is always
need to define the operational definition of non-financial motivational factors. Then there is
need to define the employees. Once the operational definition of the subject matter is defined.
Then only the information can be collected from the respondents through focus group
interviews, by questionnaire etc. Although the nature of the data is primary but as per the
need of the subject matter that data would be considered as the qualitative data. Whatever the
information will be received from the respondents further it would be complied analysed and
interpreted. This will be the manner to describe the phenomenon by using the qualitative data.
If the purpose of the study is quantify the extent of the variation in the phenomenon and both
the variables are quantified definitely the data would be quantitative in nature. The
significance of the quantitative data can be understood better by the following example:
Suppose as a student of research methodology wants to know about the impact of
advertisement on the sales of mobile phones. In this regard the following data for last five
year was obtained:
Advertising
Expense
(Rs.in lakhs )
20 30 40 50 60
Sales (in Rs
in lakhs)
100 200 300 400 500
It is clearly to be understood here that both the variables are measureable in the above
example. Therefore, it is expedient and necessary to quantify the variation in the

MS 110 Research Methodology Uttarakhand Open University
Unit 8 Types and Sources of Data Page 144 of 434
phenomenon. Once the relationship will be established between the variables then only it
would be possible and feasible to quantify the variation between the variables.
Under this stage, the relevant data are collected from various sources, Primary or secondary.
Data are said to be primary when these are collected originally by an investigator or agency.
Data are said to be secondary when these are collected from published or unpublished data
which have already been collected and processed by some other agency or person.
8.4 CLASSIFICATION OF DATA To understand the multitude of choices available to a researcher for collecting the project/
study-specific information, one needs to be fully cognizant of the resources available for the
study and the level of accuracy required. To appreciate the truth of this statement, one D.1
fferent.1 ate between needs to examine the gamut of methods available to the researcher. The
data sources could primary and. secondary be either contextual and primary or historical and
secondary 1n nature (Figure 5.1).
Primary data is the original data to which an investigator or the researcher has to collect as
per the requirement of the study. There are several ways to collect the original or the first
hand enquiry like observation techniques can be employed, interview schedules can be
organized and questionnaire techniques can be used. The authenticity and relevance of
primary data is reasonably high. The monetary and resource implications of this are quite
high and sometimes a researcher might not have the resources or the time or both to go ahead
with this method. In this case, the researcher can look at alternative sources of data which are
economical and authentic enough to take the study forward. These include the second
category of data sources-namely the secondary data.
Secondary data as the name implies is that information which is not topical or research
specific and has been collected and some other researcher or investigative body. The said
information is recorded and published in a structured format, and thus, is quicker to access
and manage. Secondly, in most instances unless it is a data product, it not too expensive to
collect.
Common sources of secondary data for include censuses, organizational records and data
collected through qualitative methodologies or qualitative research. Primary data, by contrast,
are collected by the investigator conducting the research.
8.5 QUANTITATIVE DATA AND TYPES That type of information which is subject to quantification. As far as quantitative data is
concerned it can be easily understood by very simple examples like height of the student,
weight of a teacher, income of a family, temperature in Haldwani during the month of May,
age of a person. In order to quantify them we always have some scale or measurement scales.
Height can be measured in meter or centimetre or inches etc. Similarly weight can be
measured in kilogram, gram, pounds etc. Similarly age can be measured in terms of years,
months and days. Temperature can be measured in degree Celsius or degree Fahrenheit. In

MS 110 Research Methodology Uttarakhand Open University
Unit 8 Types and Sources of Data Page 145 of 434
terms of research methodology those variable which can be measured in ratio and interval
scale are known as the quantitative variables. Here it would be expedient and necessary to
discuss about interval scale and ratio scale. Interval scale is relative in nature, it does mean
that it has the arbitrary starting and arbitrary finishing point it implies that arbitrary freezing
point and arbitrary boiling point. Hence this scale cannot be used for mathematical
operations. For example in a particular day the temperature of the Haldwani city was found to
be 40 degree Celsius during the month of June and very next day in same month the
temperature was found to be 20 degree Celsius. It cannot be conclude that the next day
temperature of Haldwani city in the month of June was just half of the previous day’s
temperature. Because measuring the quantitative data by the method of interval scale is only
relative.
By the following example it can also be made very clear and meaningful:
Suppose the age of X is 40 years and the age of Y is 80 years. It cannot be concluded that the
age of Y is just double of age of X. Because this scale has not the fixed starting point.
However, following kind of interpretation can be made:
Suppose the difference between the ages of A and B was found to be 30 years and the
difference between the ages of C and D was found to be 60 years. So it can be conclude that
the difference between the ages of C and D was just double to the difference between the
ages of A and B.
Quantitative data can be used for individual series, discrete series and continuous series.
They can be made more meaningful, more relevant and more significant by following
examples.
In individual series items, students, families, persons etc can be taken into the consideration.
e.g. Average marks obtained by 6 students in the class. Average monthly income of 10
families in Haldwani. Most likely wages of 8 workers in a factory etc.
in individual series the frequency is normally small and that frequency can easily be counted.
In discrete data in variables are always along with their corresponding frequencies.
It can also be understood by the following example:
Suppose there are 180 students in the class the marks of the students are varying from 5 to 55
in the subject of research methodology by the following manner the distribution of marks of
the students can be depicted into the discrete series:
Marks (Variable) Number of Students (Frequency)
05 10
15 20

MS 110 Research Methodology Uttarakhand Open University
Unit 8 Types and Sources of Data Page 146 of 434
25 30
35 30
45 40
55 50
In this example marks are the variable and number of the associated students is the frequency.
Similarly the concept of the continuous series can also be understood.
A continuous variable is the one that can assume any value between any two points on a line
segment, thus representing an interval of values , the values are quite precise and close to
each other , yet distinguishable different. Age, height, weight etc are the examples of the
continuous variables. Age can be measured in years, months and days. Similarly weight can
be measured in kilogram and gram and height can be measured in inches and centimetre etc.
Variable like weight, height, marks, income etc. are absolute in nature. They would be
measured in ratio scale. They have the fixed starting point. This is the reason they can be
used for mathematical operations.
Above example can also be presented in continuous series:
Suppose there are 180 students in the class the marks of the students are varying from 5 to 55
in the subject of research methodology by the following manner the distribution of marks of
the students can be depicted into the continuous series:
Marks (Variable) Number of Students
(Frequency)
0-10 10
10-20 20
20-30 30
30-40 30
40-50 40
50-60 50
In continuous series variable would be in equal class width (class interval) along with their
corresponding frequencies.

MS 110 Research Methodology Uttarakhand Open University
Unit 8 Types and Sources of Data Page 147 of 434
8.6 QUALITATIVE DATA AND TYPES There is a great significance of qualitative data in the field of management, social sciences,
and humanities. By making use of the qualitative data quantification is not possible. It can be
understood by the following example suppose an organization has a team of hard working
employees, honest employees, dedicated employees, sincere employees etc. If any
organization holds these types of attributes among the employees certainly it is an asset for
the organization. However these attributes cannot be measured in monetary terms. Although
these have the great significance. Honesty, intelligence quotient, emotional quotient,
hardworking, beauty is to be considered as qualitative variables.
These variables are measured either nominal scales or ordinal scales. By making use of these
scales either modal vale or median or rank correlation method can be used.
It can be explained by considering following example:
Suppose a beauty contest was organized by an organization for their female employees. In
order to minimize the biasness two experts are called for the event. In the final round out of
50 female employees only five were nominated. With regard to the beauty contest judges
ranked participants in the following manner:
Rank given by Judge 1 Rank given by Judge 2
1 5
2 4
3 3
4 2
5 1
This is the simple way for understanding the measurement of qualitative data.
The above data types/classification enables us to notice the following:
a. That quantitative data (both continuous and discrete) possess the characteristic of
being numerically expressed to a marked degree of precision. They represent the
value associated with the measurements of variables.
b. That qualitative data (nominal and rank) refer to variable which do not give rise to
numerical value in the same way as quantitative variables. These are the result of a
process of observing a variable with respect to a certain quality characteristics or an
attribute.

MS 110 Research Methodology Uttarakhand Open University
Unit 8 Types and Sources of Data Page 148 of 434
8.7 BASIS OF DATA CLASSIFICATION Generally data are classified on the basis of the following four bases:
1. Qualitative classification:
It refers to classification of data made according to some attribute or quality such as size,
literacy, religion etc. for example, classification of population of a city according to sex,
literacy and employment is given below
Literates Attribute
Males
Females
Illiterates total
Employed 75,000 1,75,000 2,50,000 35,000 80,000 1,15,000
Unemployed 45,000 1,25,000 1,70,000 25,000 70,000 95,000
Total 1,20,000 3,00,000 4,20,000 60,000 1,50,000 2,10,000
2. Quantitative classification:
It refers to the classification of data according to some characteristics that can be
measured such as marks of students, height, weight, age, etc. under this classification;
data are classified by assigning by arbitrary limits called class-limits. For example weight
in kg or height in inches.
DISCRETE SERIES CONTINOUS SERIES
No. of students Marks in
statistics
No. of students Marks in statistics
5 10 0-10 10
15 20 10-20 20
25 30 20-30 30
35 50 30-40 50
45 40 40-50 40
55 30 50-60 30
Total 180 Total 180

MS 110 Research Methodology Uttarakhand Open University
Unit 8 Types and Sources of Data Page 149 of 434
3. Geographical classification:
In geographical classification, data are classified on the basis of geographical or location
differences – such as cities, districts, tehsils, blocks, or villages -between various
elements of the data set.
The following is an example of a geographical distribution.
4. Chronological classification:
When data are classified on the basis of time, the classification is known as chronological
classification. Such classification is also called time series because data are listed in
chronological order starting with the earliest period. The following example would give an
idea.
Advantages of Classification:
Classification of data helps in organizing row data into smaller group. It has the following
advantages:
It condenses the data and ignores unnecessary details.
It facilitates comparison of data.
It helps in studying the relationship between several characteristics.
It facilitates further statistical treatment.
Primary Rules to Be Followed While Classifying:
Primary rules that should be observed while classifying data are as follows:
Unambiguously defined the classes should be unambiguously defined.
Exhaustive- the classes should be exhaustive. In other words, every observation must
get classified into a class.
Equal width- as far a possible, the classes should be equal width.
Neither too large nor too small – the number of classes should neither be too large
nor too small.
City Dehradun Haridwar Rudrapur Haldwani
Population (per
– square km)
584 634 481 421
Year
1941 1951 1961 1971 1981 1991 2001 2011
Population
(crore)
31.9 36.9 45.9 54.7 75.6 85.9 98.6 126
MS 110 Research Methodology Uttarakhand Open University
Unit 8 Types and Sources of Data Page 150 of 434
Width of class interval is decided first by fixing the number of class interval and then
dividing the total range into those many classes.
Class width =
8.8 PRIMARY AND SECONDARY DATA When you undertake a research study, in most situations, you need to collect the required
information; however sometimes the information required is already available and need only
be extracted. Based upon these broad approaches to information gathering, data can be
categorized as;
i. Primary data
ii. Secondary data.
Example of primary source include funding out the first hand attributes of a community
toward health service, ascertaining the health needs of a community, evaluating a social
programmer, determining the job satisfaction of the employees of an organization and
ascertaining the quality of service provided by worker. On the other hand, extracting data
from a concuss to obtain information on the age-sex structure of a population, the use of
hospital records to find out the morbidity and mortality patterns in a community, the use of a
organization’s record to ascertain its activities and the collection of data from sources such as
article, journals, magazines, books and periodicals to obtain historical and other types of
information, all are classified as information obtained from secondary sources.
None of the method of data collection provides 100% accurate and reliable information. The
quality of data gathered is dependent upon a number of other factors, which we will identify
as we discussed each method.

MS 110 Research Methodology Uttarakhand Open University
Unit 8 Types and Sources of Data Page 151 of 434
Figure8.1 Show the various methods of data collection.
There are times when the method most appropriate to achieve the objectives of a study cannot
be used because of constraints such as a lack of resources and required skills. In such
situations you should be aware of the problems these limitations impose on the quality of the
data.
In selecting a method of data collection the socioeconomic demographic characteristics of the
study population play an important role. You should know as much as possible about
characteristics such as educational level, age structure, socioeconomic status and ethnic
background. If possible, it is helpful to know the study population’s interest in, and attitude
toward participation in the study. Some population for a number of reasons, may not feel
either at ease with a particular method of data collection (such as being interviewed) or
comfortable to express opinion in a questionnaire. Furthermore, people with little education
may respond differently to certain method of data collection compared to people with more
education.
Another important determinant of the quality of your data is the way of purpose and
relevance of the study is explained to potential respondents. Whatever method of data
collection is used, make sure that the respondent clearly understand the purpose and
relevance of the study. This is particularly important when you use a questionnaire to collect
data because in an interview situation you can answer a respondent’s question but in
questionnaire you will not have this opportunity.
METHODS OF DATA
COLLECTION
Secondary
sources
Primary
sources
Questionnai
re
Interviewin
g
Observatio
n
Document
s
Mailed
Questionnaire
Collective
Questionnaire
Online
Questionn
aire
Govt.
publication
Earlier
research
Census
Clint
history
Service
record
Structured
unstructured
Participati
ng
Non-
participati
ng

MS 110 Research Methodology Uttarakhand Open University
Unit 8 Types and Sources of Data Page 152 of 434
In the following situation each method of data collection is discussed from the point of view
of its applicability and suitability to a situation and the problems and limitation associated
with it.
Check Your Progress-A
Fill in the blank
1. Primary data are generally used in case of some………………….
2. A person giving data about the information is called ………………….
3. ......................................refers to classification of data made according to literacy level
in the City.
4. In ...................................... survey the questionnaire appears on a webpage or link is
provided as pop up or crawl-in link.
8.9 RESEARCH APPLICATION OF SECONDARY DATA Secondary data can be used in multiple stages during the course of a business Research study:
Problem identification and formulation stage: Existing information on the topic under
study is useful in giving a conceptual framework for the investigation. For example, jf a
researcher is interested in investigating the investor's perception of market risk, and he tracks
investment behavior of different quarters, alongside with political, economic and social
occurrences, he would be in a position to isolate the predictive variables he might wish to
study.
Hypotheses designing: Previous research studies done research studies done in the area as
well as the industry trends and market facts could help in speculating on the expected
directions of the
study results. For example, the researcher in the above example might predict a positive,
linear relationship between economic parameters like GDP and GNP and the choice of
investment instruments and a linear negative relation between inflation rate and investment
behavior.
Sampling considerations: There might be respondent related databases available to seek
respondent statistics and relevant contact details. These would assist as the sampling frame
for collection of primary information. For example, in the investment study, let us say the
researcher wants to conduct study amongst upper income class individuals. He can then
collect information on the size and spread through suitable census data.

MS 110 Research Methodology Uttarakhand Open University
Unit 8 Types and Sources of Data Page 153 of 434
Primary base: The secondary information collected can be adequately used to design the
primary data collection instruments, in order to phrase and design appropriate queries.
Sometimes, the past studies done on the subject make the current study simpler, as the
researcher can make use of the previously designed questionnaires. These have been
standardized and validated earlier, thus the level of confidence and accuracy would be higher
as compared to a new instrument.
Validation and authentication board: Earlier records and studies as well as data pools can
also be used to support or validate the information collected through primary sources. Before
we examine the wide range of the secondary sources available to the business researcher, it is
essential that one is aware of the merits and demerits of using secondary sources.
Benefits and Drawbacks of Secondary Data
Benefits
As we can observe the usage secondary data offers numerous advantages over primary data.
makes their inc1usion in a research study almost mandatory. There are multiple reasons why
we staunchly advocate their usage.
Resource advantage: The predominant and most important argument in support is the
resource advantage. Any research or survey that is making use of secondary information will
be able to save immensely in terms of both cost and time (Ghouri and Gronhaugh,
2002).VCare is a house maintenance company, located at Jaya Nagar, Bengaluru, and wants
to assess the customer acceptance in the neighboring areas. For this it wants to know: How
many people reside in own houses/ apartments? How many have double income households?
And how many are in the income bracket of l lakh+ per month?
Thus, the latest city census data available can be accessed to arrive at these figures.
Therefore, it is advocated that the investigator must first find out about the availability of
probable, previously collected data, before venturing into primary data collection. Toe time
saved in collecting information can be gainfully used for analyzing and interpreting the data.
Accessibility of data: The other major advantage of secondary sources is that, once the
information has been collected and compiled in a structured manner as a publication,
accessing it for one's individual research purpose becomes much easier than collecting it for a
singular study. Census data as the one mentioned above is generally available through a
government source and is usually free of charge. However, m case VCare wants .market data,
in terms of size, players and volume-one might need to go to the commercial data sources
which might be available for a cost, depending on the sample size and research agency
repute, However, even when the data is purchased, the cost of the information would be much
less compared to collecting it on one's own.
Accuracy and stability of data: As stated in the above case, data that is collected by
recognized bodies_ and on a large scale has the additional advantage of accuracy and
reliability (Steward and Kamins, 1993). Thus, any interpretation of primary findings or
supportive logic for an implementation decision would be more precise. Moreover, since the

MS 110 Research Methodology Uttarakhand Open University
Unit 8 Types and Sources of Data Page 154 of 434
data is collected and compiled by an outside body, it can be readily and easily accessed by
other researcher as well (Denscombe, 1998).
Assessment of data: Another plus point of collecting secondary data is that the information
can be used to compare and support the primary research findings of the investigators. In case
the study was conducted on a representative sample of the population, the findings could be
used to estimate the applicability on a larger population. Even if the findings of the earlier
collected information are in contrast with the current findings, it is still useful as it might
reveal the presence of certain moderator variables which might be operating in the two
research conditions.
However, there is need for caution as well because in using secondary data, there might be
some constraints and disadvantages as well.
Disadvantages
Applicability of data As a result of this, the information might not be applicable o~ relevant
for the current objective. (Denscombe, 1998). The typical differences that emerge in such
cases are with relation to the variables and the units being used to measure it. For example,
market optimism or buoyancy by one researcher might be reflected by the consumer's
spending in that quarter; while one might be interested. in measuring buoyancy in terms of
the investment in equity and growth funds.
Time Period: Another significant difference is in terms of the time period. The information
that one might be using for the current research might have been collected in a different time
coordinate or in a different environment. The implication of this divergence in the research
base is that there might be multiple modifying variables, which might not be apparent like the
socio-cultural environment, climatic effects and political factors. However, these might be
responsible for skewing the direction of the findings.
Accuracy of data: While application of the data might be an issue, there is a sincere concern
before one relies on the information gathered by another source-that is the level of trust one
can have on the same. The concerns are three: Who, Why and How?
The first level of accuracy depends upon who was the investigator or the investigative
agency. The reputation of the organization/person becomes extremely critical in establishing
the truth of the findings as well as believing the inferences drawn in the quoted research. The
second is the reason for collecting the data. For example, if a certain political party collects
information on the potential voters and an independent market research agency collects
information on the potential voters and an .independent market research agency collects
information on the spread of the opinions- positive and negative-- towards various political
parties, one is 1nore likely to rely on the second source. The reliability would be higher due
to the reasons given below:

MS 110 Research Methodology Uttarakhand Open University
Unit 8 Types and Sources of Data Page 155 of 434
Since the agency specializes in conducting opinion polls and. has vast experience as
well as a respondent base, the chances of error would be minimized
The political party might have a hidden agenda of securing the campaign
sponsorship through the survey conducted, while the independent body would be free
from this bias.
Last but not the least is the data collection process of the study in terms of sample selection
and sampling used to identify the respondent data population. This is very important as this
would be a indicator of the applicability of the results when extrapolating to the larger
population.
8.10 SUMMARY Research data may be collected in various ways. Some of these methods depend on the
methodology and the theoretical assumptions used in the research. “ Triangulation”- a notion
introduced from military studies by Denzin (1978) (as quoted by Tomkin & Groves, 1983),
has been suggested as a way to make research studies more robust and rigorous by verifying
results through different methods, thus ensuring that the results are not a function of the
research method. There are two types of data used in research;
1. Primary Data
2. Secondary Data
Data that are observed or collected directly from first-hand experience are called as primary
data. Data which is already available in different forms is known as the secondary data.
Government records, Journals, Marketing agencies MART, IMRB etc are the sources of the
secondary data.
8.11 GLOSSARY
Phenomenon: A fact or situation that is observed to exist or happen.
Emanate: Originate from; be produced by.
Demographic: The statistical characteristics of human populations (such as age or income)
used especially to identify markets.

MS 110 Research Methodology Uttarakhand Open University
Unit 8 Types and Sources of Data Page 156 of 434
8.12 KEY TO CHECK YOUR PROGRESS
Check your Progress- A
1. Original, problem- or project-specific problem.
2. Respondents
3. Nominal data
4. Qualitative data
5. Qualitative classification
6. Internet
8.13 REFERENCES
Neogi U. K “Research Methodology Tools and Techniques” Variety Book
Publication.
Kumar Ranjeet “Research Methodology” Pearson Education.
Young V. Pauline, “Scientific Social Surveys and Research”.
Gopal, M.H. “An Introduction to Research Procedure in Social Sciences”.
Michacl, V. P. “Research Methods in Management’. Himalaya Publishing
House.
Kothari C.R. “Research Methodology” Vikas Publication.
Gode and Hatt. “Methods in Social Research”. Tata Mc Graw Hill, New Delhi.
Introduction, An Introduction to Business Statistics; Department Of Business
Studies: An Introduction To Business Statistics available at
emaxdbs.blogspot.com/2016/09/ an-introduction-to-business-statistics.html last
accessed on 27 March, 2019.
Cresswell, John, W.,(2008). Research Design; Qualitative, Quantitative and
Mixed Methods Approaches. Newbury Park, CA: Sage Publication.
Marczyk, G.R, DeMatteo, D. & Festinger D., (2005). Essentials of Research
Design and methodology, New York City, NY: Wiley.
Ethridge, Don E., (2004). Research Methodology in Applied Economics.
Daryaganj, ND: Wiley – Blackwell,
Bergh, D. and Ketchen, D. (2009) Research Methodology in Strategy and
Management. Binglay, UK: Emarald Group Publishing.

MS 110 Research Methodology Uttarakhand Open University
Unit 8 Types and Sources of Data Page 157 of 434
Kothari, C R (2008), Research Methodology & Techniques, New Age
Publication, Delhi
Bajpai, Naval (2012) Business Research Methods, Pearson, Delhi
Schiendler & Cooper(2009) : Business Research Methods, TMH, New Delhi
8.14 SUGGESTED READINGS
1. Research Methodology: C R Kothari (New Age)
2. Marketing Research : N K Malhotra (Pearsons)
3. Kumar Ranjeet: Research Methodology Pearson Education.
8.15 TERMINAL QUESTIONS
Q1.What is the difference between Qualitative and Quantitative Data types?
Q2. What is the difference between Primary and Secondary source of data?
Q3. Discuss research applications of quantitative data.
Q4. Discuss research applications of the secondary data.
Q5. Explain the basis through which a data van be classified.
Q6. Write a detailed note on types and sources of the data.
Q7. Give a detailed note on discrete and continuous kind of data.

MS 110 Research Methodology Uttarakhand Open University
Unit 9 Methods of Data Collection Page 158 of 434
UNIT 9 METHODS OF DATA COLLECTION
9.1 Introduction
9.2 Objectives
9.3 Types of Data
9.4 Selection of Data Collection Methods
9.5 Collection of Primary Data
9.6 Collection and Meaning of Secondary Data
9.7 Source of Secondary Data
9.8 Questionnaire Design Introduction
9.9 Questionnaire Design Process
9.10 Types of Questionnaire
9.11 Summary
9.12 Glossary
9.13 Answer to Check Your Progress
9.14 References
9.15 Suggested Readings
9.16 Terminal & Model Questions
9.1 INTRODUCTION
In dealing with any real life problem it is often found that data at hand are inadequate, and
hence, it becomes necessary to collect data that are appropriate. There are several ways of
collecting the appropriate data.
The task of data collection begins after a research problem has been defined and research
design/ plan chalked out. While deciding about the method of data collection to be used for
the study, the researcher should keep in mind two types of data viz. primary and secondary.
9.2 OBJECTIVES
After reading this unit students would be able to understand;
To know about the different sources of primary data.
To understand the different sources of secondary data.

MS 110 Research Methodology Uttarakhand Open University
Unit 9 Methods of Data Collection Page 159 of 434
To know about the questionnaire design introduction.
To understand questionnaire design process.
9.3 TYPES OF DATA
There are two types of data:
(i)Primary data
Data that are observed or collected directly from first-hand experience are called as
primary data.
(ii) Secondary data
Published data and the data collected in the past or other parties are called secondary data.
Common sources of secondary data for include censuses, organisational records and data
collected through qualitative methodologies or qualitative research. Primary data, by
contrast, are collected by the investigator conducting the research.
The researcher would have to decide which start of data he would be using for his study
and accordingly he will have to select one or the other method of data collection.
9.4 SELECTION OF DATA COLLECTION METHOD
Selection of data collection method depends on the following factors:
(i) Purpose, Relevance and significance of the study
(ii) Objectives of the study
(iii) The surrounding and environment in which the researcher is carrying out the
study.
(iv) Time constraints, financial constraints and human resource constraints
(v) Degree of accuracy and degree of precision
(vi) Interest and perception of researcher
9.5 COLLECTION OF PRIMARY DATA
Meaning of primary data
Those which are collected a fresh and for a first time and thus happen to be original in nature.
We collect primary data during the course of doing experiments in an experimental research
but in case we do research of the descriptive type and perform surveys, and then we can
obtain primary data either through observation or through direct communication with
respondent.
There are several methods of collecting primary data:
MS 110 Research Methodology Uttarakhand Open University
Unit 9 Methods of Data Collection Page 160 of 434
Questionnaires and the survey method:
Questionnaires have, according to Sharp & Howard (1996, p 145), “over the past century,
become a common method of gathering information.” It can be defined as “a pre-formulated
written set of questions to which participants record their answers, usually within largely
closely defined alternatives.” (Sekaran, 1992, p 200). Survey is a method where questionnaire
is used to collect data. Creswell (1994) define a survey as “the data collection process of
asking questions, provides a quantitative or numeric description of some fraction of the
population i.e. a sample which can be in turn generalised to the population from which the
sample was drawn.”
Interviews:
Nachmias & Nachmias (1996,) defines an interview as a “face-to-face, interpersonal role
situation in which an interviewer asks participants questions designed to elicit answers
pertinent to the research hypotheses”. However, Sekaran (1992) reminds us that interviews
need not be face-to-face as it can be conducted through the telephone or can even be
computer assisted. Interview could be classified as as structured or unstructured (or non-
directive interview) although Nachmias & Nachmias (1996) identifies a third category- the
focused interview , which is a variation of the structured interview.
In the structured interview, the format is more rigid and assumes that the researcher knows
exactly what information is needed and has a list of pre-determined questions he intends to
ask of the participants. The same questions are administered to every interviewee, although in
certain cases depending on the circumstances or participants’ answers, the researcher may
elicit additional information by asking additional questions not on his schedule. “Through
this process new factors might be identified and a deeper understanding might result”
(Sekaran 1992)
In the Unstructured or non-directive interview, the researcher does not have a schedule
listing a set of pre-specified questions, nor are the questions asked in a specific order. The
researcher does not direct the interviewee and thus the interviewee is encouraged to relate his
or her experiences and to reveal their attitudes and perceptions on the topic of interest. In this
method, the interviewer has an opportunity to probe various areas and to raise specific
queries during the interviews.
Observation:
Observation is way of gathering data by watching behavior, events, or noting physical
characteristics in their natural setting. Observations can be overt (everyone knows they are
being observed) or covert (no one knows they are being observed and the observer is
concealed). The benefit of covert observation is that people are more likely to behave
naturally if they do not know they are being observed. However, you will typically need to
conduct overt observations because of ethical problems related to concealing your
observation. Observations can also be either direct or indirect. Direct observation is when you

MS 110 Research Methodology Uttarakhand Open University
Unit 9 Methods of Data Collection Page 161 of 434
watch interactions, processes, or behaviors as they occur; for example, observing a teacher
teaching a lesson from a written curriculum to determine whether they are delivering it with
fidelity. Indirect observations are when you watch the results of interactions, processes, or
behaviors; for example, measuring the amount of plate waste left by students in a school
cafeteria to determine whether a new food is acceptable to them.
(i) Other methods
(A) Distributor audit
(B) Using mechanical device
(C) Depth interview etc.
9.6 COLLECTION AND MEANING OF SECONDARY DATA
Published data and the data collected in the past or other parties are called secondary data.
Common sources of secondary data for include censuses, organisational records and data
collected through qualitative methodologies or qualitative research. Primary data, by
contrast, are collected by the investigator conducting the research.
9.7 SOURCES OF SECONDARY DATA
(a) Internal Sources
It includes company profit-loss statements, balance sheets, sales figures, sales-call
reports, invoices, inventory record, and prior research reports.
(b) Government publications
(i) Statistical abstract of the United States
(ii) Country and city Data Book
(iii) Industrial Outlook
(iv) Marketing Information Guide
(v) Other government publications include the Annual Survey of manufacturers;
business trade, and selected service industries; census of transportation;
Federal Reserve bulletin; monthly labor review; survey of current business;
and vital statistics report.
(c) Periodicals and Books
(i) Business Periodicals index
(ii) Standard and Poor’s industry
(iii) Moody’s Manuals
(iv) Encyclopedia of Associations

MS 110 Research Methodology Uttarakhand Open University
Unit 9 Methods of Data Collection Page 162 of 434
(v) Marketing journals include the Journal of Marketing, Journal of Marketing
Research and Journal of Consumer Research.
(vi) Useful trade magazines include Advertising Age, Chain Store Age,
Progressive Grocer, Sales and Marketing Management, and Stores.
(vii) Useful general business magazines include Business Week, Fortune, Forbes,
The Economist and Harvard Business Reviews.
(d) Commercial Data
(i) Nielsen Company
Data on products and brands sold through retail outlets (Retail Index
Services), supermarket scanner data (Scan track), data on television audiences
(Media Research Services), Magazines circulation data (Neodata Services,
Inc.) and others.
(ii) MRCA Information Services
Data on weekly family purchases of consumer products (National Consumer
Panel) and data on home food consumption (National Menu Census).
(iii) Information Resources, Inc.
Supermarket scanner data (Info Scan) and data on the impact of super market
promotions (Promotion Scan).
(iv) SAMI/Burke
Reports on warehouse withdrawals to food stores in selected market areas
(SAMI reports) and super market scanner data (Sam scam).
(v) Simmons Market Research Bureau (MRB Group)
Annual reports covering television markets, sporting goods, and proprietary
drugs, with demographic data by sex, income, age and brand preferences
(selective markets and media reaching them).
(vi) Other commercial research houses selling data to subscribers include the Audit
Bureau of Circulation; Arbitron, Audits and Surveys; Dun & Bradstreet’s;
National Family Opinion; and Standard Rate and Data Service.

MS 110 Research Methodology Uttarakhand Open University
Unit 9 Methods of Data Collection Page 163 of 434
Types of Secondary Data
Fig 9.1 Secondary Data
9.8 QUESTIONNAIRE DESIGN INTRODUCTION
Questionnaire is a general term to include to all techniques of data collection in which each
person is asked to respond to the same set of questions in a predetermined order. It therefore,
includes structured interviews and telephone questionnaires as well as those in which
questions are answered without an interviewer being present.
The questionnaire must be designed on the basis of the purpose of the study. Whenever we
are administrating the questionnaire it requires series of questions. Questions would be
framed pursuant to the objectives of the study. If the study population is scattered
geographically or study population is literate questionnaire is the best medium to get the first
hand information from the study population. Questions should be framed in a very simple
language so that every respondent is able to understand the question and able to response
properly. There is no place for ambiguity in the questions. If confusion will occur it will have
adverse effect in response of the question. In order to enhance the response rate of the
respondents the layout of the questionnaire should be framed in such a manner that it reflects
someone is talking to the respondents. In questionnaire questions can be asked in Likert
Scale, dichotomous questions can also be asked or multiple types of questions can also be
asked. Most of the time researcher or investigators are supposed to develop their own
schedule as per the need, significance and relevance of the study. Here it will be imperative
and necessary to distinguish between questionnaire and schedule. Schedule is the research
instrument or research tool while questionnaire is the method of data collection.
Secondary Data
Documentary
Written Materials
Non Written Material
Multiple Ware
Area Based
Time Series Data
Survey
Census Continuou
s and Regluar Survey
Scientific
Survey

MS 110 Research Methodology Uttarakhand Open University
Unit 9 Methods of Data Collection Page 164 of 434
Questionnaire is the most popular method of data collection. It has several advantages like it
is cost effective and it saves time. It has some disadvantages also response rate is poor and
there is always the possibility of biasness.s
Check Your Progress-A
Choose the correct alternative.
1. According to the text, questionnaires can address events and characteristics
taking place when?
a. In the past (retrospective questions)
b. In the present (current time questions)
c. In the future (prospective questions)
d. All of the above
2. Which of the following are principles of questionnaire construction?
a. Consider using multiple methods when measuring abstract constructs
b. Use multiple items to measure abstract constructs
c. Avoid double-barreled questions
d. All of the above
e. Only b and c
3. Which of these is not a method of data collection?
a. Questionnaires
b. Interviews
c. Experiments
d. Observations
4. Secondary/existing data may include which of the following?
a. Official documents
b. Personal documents
c. Archived research data
d. All of the above
5. An item that directs participants to different follow-up questions depending on
their response is called a ____________.
a. Response set
b. Probe
c. Semantic differential
d. Contingency question

MS 110 Research Methodology Uttarakhand Open University
Unit 9 Methods of Data Collection Page 165 of 434
6. Which of the following terms best describes data that were originally collected at
an earlier time by a different person for a different purpose?
a. Primary data
b. Secondary data
c. Experimental data
d. Field notes
7. Researchers use both open-ended and closed-ended questions to collect data.
Which of the following statements is true?
a. Open-ended questions directly provide quantitative data based on the researcher’s
predetermined response categories
b. Closed-ended questions provide quantitative data in the participant’s own words
c. Open-ended questions provide qualitative data in the participant’s own words
d. Closed-ended questions directly provide qualitative data in the participants’ own
words
9.9 QUESTIONNAIRE DESIGN PROCESS
The process of designing questionnaire is often long, complex and involved. Many authors
suggest that the process is sequential, that stages follow on from one another. While there is
some truth to this, in the opinion of authors, most questionnaire design exercises are iterative
with constant movement between the different stages of the process. Proctor (1997) states
that questionnaire design encompasses eight different stages as follows:
(a) Identification and specification of the research problem/research objectives
In the first stage, the researcher should consider question such as ‘what is the
management problem’? And ‘what is the marketing research question’? An example
of marketing problem could be to determine whether a previous advertising campaign
had been effective.
(b) Selection of the population to be studied
It is imperative that the researcher determines who the sample will be since particular
question may be more or less appropriate for different populations and for different
segments within populations.
(c) Choice of data collection
What interviewing method should the survey makes use of? Previous selection of this
chapter should have made clear how important a consideration this is on the process
of questionnaire design.
MS 110 Research Methodology Uttarakhand Open University
Unit 9 Methods of Data Collection Page 166 of 434
(d) Ordering of the topics to be addressed
A questionnaire should be structured such that the questionnaire is logical and should
usually proceed from general information (e.g., introductory questions) to specific
information (such as respondent geographic). This technique is called laddering.
(e) Establishing the cross-tabulation that will be required
Where a survey is attempting to perform a particular function, and/or identify the
relationship between certain variables, it is important to determine whether cross-
tabulation is possible between questions and answers. Since different types of cross-
tabulation techniques are possible, it is important to identify what type of data should
be collected. For instance, if the researcher wishes to use the Chi-square statistical test
the researchers need to design questions that obtain categorical (nominal) data. This
type of data is best collected using multiple fixed- response questions. Designing the
questionnaire according to which data analysis techniques are going to be used
requires answer to be in a specific format. A full discussion of this topic is outside the
scope of the book and, interestingly, is seldom covered in other major marketing
research texts. An example might be if a marketing researcher wished to provide a
client with information on competitors’ product positioning. This might make use of
the multi-dimensional scaling statistical technique and, correspondingly, would need
respondents to evaluate competitors’ products on a number of different dimensions.
Usually, this is achieved by asking respondents rating scale questions.
(f) Deciding how the topics will be covered and how they will be preceded
This section determines the types of questions that should be used and relevant coding
procedures. Decision encompasses whether or not to use open-ended or closed
questions, dichotomous, multiple-fixed response and rating and ranking scale
questions.
(g) Questionnaire layout and design of supporting material
The questionnaire should be presented in such a manner that responding to questions
is simplified as far as possible. Prompt cards should also be designed for personal
interviews. This allows respondents to view all possible answers to a multiple-
response question without forgetting any. Other material may also need to be
designed to accompany surveys, such as photos or advertisement stills, etc.
(h) Pre-testing of the questionnaire
Questionnaire should be formally pre-tested on the small section of the survey
population. This helps to ensure that questions are not misunderstood and that the
researcher does not assume certain knowledge about the sample. If the researcher has
little knowledge of the population, pilot testing the questionnaire may be more
sensible option, where the survey is completed among a small section of the
population first and is modified for a larger survey for a late date. This is different
from pre-test since it involves larger samples.

MS 110 Research Methodology Uttarakhand Open University
Unit 9 Methods of Data Collection Page 167 of 434
Factors Affecting questionnaire Design
Your choice of questionnaire will be influenced by a variety of factors related to your
research question(s) and objectives, and in particular the:
a) Characteristics of the respondents from whom you wish to collect data.
b) Importance of reaching a particular person as respondent.
c) Importance of respondents’ answers not being contaminated or distorted.
d) Types of question you need to ask your analysis, taking into account the likely
response rate.
e) Types of question you need to ask to collect your data.
Real Life Example for Designing Questionnaire
Suppose you are conducting a study on the topic of Job Motivation among the employees.
In this regard you framed a research question what are the factors influencing the job
motivation of the employees. You tried to define the operational definition of the subject
are and the study population. In this regard you studied several literature and you bring the
clarity about the phenomenon. You find out the gap between your study and previous
studies. Finally you made the objective of your study: To identify the factors influencing
the work motivation of the employees. As far as the work motivation is concerned both
financial and non-financial factors would be influencing the work motivation of the
employees. Financial factors include salary, bonus and compensation. While non- financial
factors will include work environment, recognition, promotion, training and development,
sense of belongingness, sense of responsibility ect. In order to achieve a valid results and
questions inference you required to develop a research instruments. You may develop a
series of questions on the basis of the objectives and above quoted parameters definitely be
included in the schedule thereafter questionnaire would be distributed among the
respondents then only the valid kind of the results are expected.
9.9.1MERITS OF QUESTIONNAIRE
A questionnaire has following merits.
It saves time, money and manpower of the researcher and investigators. It is very
convenient method of the data collection. In questionnaire method there is no direct
contact between the researcher and the respondents so researcher biasness cannot be
imposed on the responses.
If the study is based in a very sensitive issue like street crime, child sexual abuse and
others. Questionnaire method of data collection would be more appropriate than

MS 110 Research Methodology Uttarakhand Open University
Unit 9 Methods of Data Collection Page 168 of 434
conducting interviews. In questionnaire it is not mandatory to provide your personal
details because there is no direct link between investigator and the respondent.
9.9.2 DEMERITS OF A QUESTIONNAIRE
However this method is cost effective, time saving, and does not require strong
manpower apart from that it has many more demerits.
This method of data collection can only be used among those respondents who are
literate. Those who can read and write. If the respondents are illiterate this method
of primary data collection cannot be used. Its applicability is confined to only
literate person.
Response obtained from questionnaire is always low. Most of the time
respondents don’t response properly. There are several reasons for this.
Respondents are not able to understand the questions properly, due to lake of time
they are not able to respondent, they may not be self-disciplined, they may not be
motivated and many others. If the response rate is poor findings of the study
cannot be generalised.
Those respondents who are highly motivated, self -disciplined will definitely
response and those who are not they will not respondent. This will certainly affect
the outcome of the study population.
If the respondents are getting confused in some questions whenever they are
filling the questionnaire. In questionnaire there is no possibility to eliminate their
confusion because of there is no direct contact between investigator or researcher
and the respondents. That confusion may influence the response of the respondent.
If the study requires prompt responses of the questions. By using the questionnaire
method immediate and prompt responses cannot be obtained. This is one of the
greater limitations of the questionnaire method.
If we talk about systematic and scientific investigation in most of the studies if the
study permits the responses through the questionnaire method. Questions are
arranged in such a manner that one question is linked another question. If the
respondents don’t able to understand the particular question, then rest of questions
could not be answered by them. This will definitely influence the response rate.
So better inferences cannot be drawn.
In questionnaire there is no direct interaction between investigator and the
respondents. Therefore, there is always an opportunity for respondents to discuss
the question to someone. If it happens result would always be biased. So there is
no place for biasness in research.
The major demerits of questionnaire are that if the response is obtained through
questionnaire unlike other methods it cannot be supplemented.
MS 110 Research Methodology Uttarakhand Open University
Unit 9 Methods of Data Collection Page 169 of 434
9.10 TYPES OF QUESTIONNAIRE
There are two categories of the questionnaire:
Open-ended questions
Closed ended questions
Open-ended questions:
If we talk about open-ended questions they have their importance. The selection of the
open-ended questions depends upon the purpose, relevance, significance and
objectives of the study. In open-ended questions there is always an opportunity for
respondents to express their feelings, ideas, expressions towards the phenomenon.
The main advantage of this type of questionnaire reflects your agreement or
disagreement freely towards the subject matter. This type of questionnaire mostly
used when qualitative kind of the studies are taken into the considerations.
The major disadvantage of this questionnaire is to perform the analysis part. It is easy
to answer freely but how cans the content analysis will be performed? In order to
analyze open-ended questions there is always need of content analysis.
Close ended questions:
In close ended questions as respondents you have an opportunity to get some choices
for associated questions for the study. Further close ended questions can be
segregated either dichotomous questions or multiple choice questions. In dichotomous
questions two outcomes are possible. For example good or bad, day or night, happy or
unhappy so on.
If we talk about multiple choice questions, from the view point of the research it can
be explained by taking the example of Likert Scale. This scale is more prevalent in
research methodology. Basically it is the five point scale having two extremes. The
value of this scale moves from extreme left to extreme right.
For example attitude of the students towards the delivery of the lecture, in order to
know about the responses of the students firstly we need to define the operational
definition of the subject matter. Suppose content of the lecture, structure,
communication, style of delivering the lecture, knowledge of the subject etc will
constitute the parameters of the subject matter. Further the responses of the students
can be gathered from 1 to 5 points.
1- Highly dissatisfied
2-Dissatisfied
3-Indifferent
4-Satisfied
5- Strongly satisfied
Smaller value in response higher the disagreement and higher value in response higher the
agreement.

MS 110 Research Methodology Uttarakhand Open University
Unit 9 Methods of Data Collection Page 170 of 434
9.11 SUMMARY
Data collection method is an integral part of any research design. We learned about two
sources of the data collection i.e. Primary and Secondary sources of information. In this unit a
detailed description was made with regard to questionnaire design introduction and
questionnaire design process. In next unit an effort has been made to understand attitude
measurement and motivational research techniques.
9.12 GLOSSARY
Linguistic: Relating to language or linguistics.
Encompass: Surround and have or hold within.
Repercussion: An unintended consequence occurring sometime after an event or action,
especially an unwelcome one.
Dichotomous: Dividing into two parts or relating to, involving, or proceeding from
dichotomy.
9.13 KEY TO CHECK YOUR PROGRESS
Check your progress-A
Choose the correct alternative
1) (d)
2) (d)
3) (c)
4) (d)
5) (d)
6) (b)
7) (c)
MS 110 Research Methodology Uttarakhand Open University
Unit 9 Methods of Data Collection Page 171 of 434
9.14 REFERENCES
Neogi U. K “Research Methodology Tools And Techniques” Variety Book
Publication.
Kumar Ranjeet “Research Methodology” Pearson Education.
Young V. Pauline, “Scientific Social Surveys And Research”.
Gopal, M.H. “An Introduction To Research Procedure In Social Sciences”.
Michacl, V. P. “Research Methods In Management’. Himalaya Publishing
House.
Kothari C.R. “Research Methodology” Vikas Publication.
Gode And Hatt. “Methods In Social Research”. Tata Mc Graw Hill, New Delhi.
Methods Of Data Collection By P. Priyanga M.Sc, M.Phil Research Scholar
Tbak College For Women Kilakarai Available At Slideshare .Net/ Priyansakthi/
Methods-Of-Data Collection-16037781 Last Accessed On 20 March, 2019.
International Institute of Professional Studies, Presentation On Methods Of Data
Collection & Their Advantages And Disadvantages Submitted To: Dr. Anil
Goray Available At Authorstream.Com/ Presentation / Veerkushwah-1223775-
Data-Collection-Method Accessed On 20 March, 2019.
Kothari, C R (2008), Research Methodology & Techniques, New Age
Publication, Delhi
Bajpai, Naval (2012) Business Research Methods, Pearson, Delhi
Schiendler & Cooper(2009) : Business Research Methods, TMH, New Delhi
Cresswell, John, W.,(2008). Research Design; Qualitative, Quantitative and
Mixed Methods Approaches. Newbury Park, CA: Sage Publication.
Marczyk, G.R, DeMatteo, D. & Festinger D., (2005). Essentials of Research
Design and methodology, New York City, NY: Wiley.
Ethridge, Don E., (2004). Research Methodology in Applied Economics.
Daryaganj, ND: Wiley – Blackwell,
Bergh, D. and Ketchen, D. (2009) Research Methodology in Strategy and
Management. Binglay, UK: Emarald Group Publishing.
MS 110 Research Methodology Uttarakhand Open University
Unit 9 Methods of Data Collection Page 172 of 434
9.15 SUGGESTED READINGS
1. Research Methodology: C R Kothari (New Age)
2. Marketing Research : N K Malhotra (Pearsons)
3. Kumar Ranjeet: Research Methodology Pearson Education.
9.16 TERMINAL QUESTIONS
Q1. What is questionnaire? Explain the process considering in the design of
questionnaire.
Q2. Define various factors that affect questionnaire design.
Q3. State the type of questionnaire.
Q4. Define advantage and limitation of questionnaire method.
Q5. Define various kinds of observations and their advantages and disadvantages.
Q6. Explain different types of questionnaire.
Q7. Write a note on introduction to questionnaire design.
Q8. What do you understand by questionnaire design process?
Q9. List out the possible sources of secondary data.
Q10. Give a detailed essay for methods of data collection.

MS 110 Research Methodology Uttarakhand Open University
Unit 10 Attitude Measurement and Motivational Research Techniques Page 173 of 434
UNIT 10 ATTITUDE MEASUREMENT AND
MOTIVATIONAL RESEARCH TECHNIQUE
10.1 Introduction
10.2 Objectives
10.3. Measurement and Types of Measurement Scale
10.4 Attitude and Components of Attitude
10.5 Advantages and Limitations of Attitude Measurement
10.6 Techniques of Attitude Measurement
10.7 Physiological Measure of Attitude
10.8 Attitude Measurement Scale
10.9 Motivational Research Techniques
10.10 Summary
10.11 Glossary
10.12 Answer to Check Your Progress
10.13 Reference/ Bibliography
10.14 Suggested Readings
10.15 Terminal & Model Questions
10.1 INTRODUCTION In the previous unit you learnt about the methods of data collection in detail. A research
design is a conceptual structure for doing any research. Research design helps the researcher
in finding out answers to questions like what, why, where, when, how much, it also help in
identifying the techniques or ways for conducting research. Here, in this unit we will discuss
attitude measurement and motivational research techniques that are particularly important in
behavioural research. Here, we will discuss about the methods used to measure attitude such
as ranking, rating, sorting, and choice techniques. In this unit we will discuss all the attitude
measurement techniques in detail. The attitude measurement is rigorously used in business
setting where the customer attitude measurement serves as the base for designing the
products and services according to their requirements. Similarly motivational research
techniques are also used to understand the hidden motives of the customers which help the
marketer in serving their target audience well.

MS 110 Research Methodology Uttarakhand Open University
Unit 10 Attitude Measurement and Motivational Research Techniques Page 174 of 434
10.2 OBJECTIVES After reading this unit the learning will be:
-Understanding the meaning of measurement and the measurement scale
-Define attitude and its components
- Learn about the advantage and disadvantage of attitude measurement
- Discuss the techniques used for measurement of attitude
- Know about the motivational research techniques used in research
10.3 MEASUREMENT & TYPES OF MEASURMENT SCALES The term measurement means assigning numbers or some other symbols to the characteristics
of certain objects. As the research is empirical in nature it means that it is based on hard facts
and figures, thus for the purpose of making the research more reliable, numbers are assigned
to the variables in research. Researchers assign numbers to the observations, these assigned
numbers gives an accurate description of the variable.
When the research is conducted it’s not the object that is measured but the perception,
attitude and other relevant characteristics of the population is measured. The basic objective
with which numbers are assigned is firstly to ensure that statistical analysis of the data
collected by the researcher and secondly the research result that are obtained are reliable and
can conveniently be communicated.
For the purpose of measurement the data is put on a scale, measurement is the actual number
assigned and scaling is process of placing the observation on a continuum. The four
measurement scale generally used while conducting research are – nominal scale, ordinal
scale, interval scale and ratio scale. The choice of measurement scale will depend on the kind
of data collected and the statistical analysis that will be executed in turn depends on the scale
that is used for data measurement.
Nominal scales put the data on categories based on their characteristics; ordinal scales
provide order or sequence to the data; interval scales put the data on a continuum and ratio
scales provide that data in absolute point.
1. Nominal Scale
Nominal scale allows the researcher in categorization of responses into a number of mutually
exclusive categories. The numbers assigned in the nominal scale are just for the sake of
putting the data into categories, it does not allow any mathematical calculation on the data.
The numbers assigned in a Nominal Scale are just for the purpose of identification these are
no more than labels. Such as number that are assigned as bank account number, product
identification number, car registration number etc,

MS 110 Research Methodology Uttarakhand Open University
Unit 10 Attitude Measurement and Motivational Research Techniques Page 175 of 434
Example of nominal scale
What is your gender?
[ ] Male
[ ] Female
Male may be assigned number ‘1’ and the female may be given number ‘2’ for the purpose of
identification. Any number higher than the other number does not signify superiority to the
lower number. These are just for ‘namesake’.
Tick on the food items you buy every month (at least once)
1. Rice
2. Chicken
3. Milk
4. Groundnut oil
5. Peppers
Here also, rice may be assigned number 1, chicken may be assigned number 2 and so on.
These assigned numbers have no mathematical properties which mean these numbers cannot
be added, subtracted, multiplied or divided. Only statistical measure that can be used on such
data is mode as it allows carrying count of each category. One can also use chi-square test
which will help in determining the association of two or more variables and also to determine
how strongly these variables are associated.
2. Ordinal Scale
This is the next higher level of measurement than the nominal scale measurement. The
ordinal scale, allows the respondents to rank an object by some common variable, which help
the researcher in identifying whether an object has more or less characteristics than some
other object. In an ordinal scales individuals, attitude of people, items are ranked on
continuum. An illustration of ordinal scale would be the ranking given by the customer to
three brands of packaged milk on the basis of their perceived quality.
Example of ordinal scale
Rank the following brands of television in order of your preference considering 1 as the most
preferred brand
1. Sony
2. LG
3. Videocon
4. Samsung
5. Onida

MS 110 Research Methodology Uttarakhand Open University
Unit 10 Attitude Measurement and Motivational Research Techniques Page 176 of 434
In the above example the respondent rank the most preferred brand as 1 and the least
preferred brand as 5.
Rank the following attribute while choosing a soap. Most important attribute is given number
1, next as number 2 and so on.
Attributes Rank
Lather
Fragrance
Moisturizing
Mildness
Shrinkage
The ordinal scale help the researcher to know the order of preference but it does not help in
finding level of preference i.e. how much more one brand or an attribute is preferred to
another. Median, percentile, quartile are the statistical techniques used for the purpose of
analyzing the ordinal data. The ranked data can also be statistically analyzed through rank
order correlation coefficient, sign test.
3. Interval Scale
In the interval scale the responses are acquired on a continuum scale. The scale starts from an
arbitrary point with numbers placed at equal intervals. This scale takes care of the limitations
of nominal as well as ordinal scale. Unlike nominal scale where the number are just for the
purpose of identification and ordinal scale where the objects are place only in order the
interval scale ensure meaningful interpretation of the observations, it clearly states the
magnitude of difference among the attitude, preference that is being observed. Thermometer
is one of the classic example of interval Scale.
Example of Interval Scale
How will you rate your present refrigerator on the following stated attributes?
Company
Name
Low
Popularity
1 2 3 4 5 High Popularity
Functionality Few 1 2 3 4 5 Many
Price Low 1 2 3 4 5 High
Product Design Poor 1 2 3 4 5 Good
Utility Low
Utility
1 2 3 4 5 High Utility

MS 110 Research Methodology Uttarakhand Open University
Unit 10 Attitude Measurement and Motivational Research Techniques Page 177 of 434
The respondents are asked to put his response on the above scale of 1 to 5.
How do you rate the customer care department of the Lotus electronic store?
Very Good Good Neither Good
nor Bad
Bad Very Bad
5 4 3 2 1
The numbers obtained on the scale can be added, subtracted, multiplied, or divided. Data
acquired on the interval scale can be statistically analyzed through arithmetic mean, standard
deviation, correlation coefficient. T-test, z-test, regression analysis and factor analysis can be
conducted on interval data.
4. Ratio Scale
This is the highest level of measurement. Ratio Scales are not commonly used in market
research, it is used just in case where the variables are available for absolute comparison.
There exists a natural zero point in the ratio scale and the responses obtained is in absolute
form rather than relative quantities. Few examples of ratio scales are measurement of
physical quantities like - length, weight, age etc.
Example of Ratio Scale
Q1. What is your age? ______
Q 2. What is the yearly sales of the company? ______
Q 3. What is the Distance of your school from your house ? ______ Km
The responses of such questions always have a starting point of zero. All mathematical
operations can be carried out on the ratio scale data. All the statistical techniques that are
used to analyze nominal scale data and ordinal scale data, interval scale data can be applied to
the ratio scale also. One can also compute coefficient of variation, geometric mean, harmonic
mean on the ratio scale data.
10.4 ATTITUDE & COMPONENTS OF ATTITUDE An attitude is a mental state, it involves feelings, values, believes and characteristics of an
individual to react in a certain manner. It is more or less a stable disposition to respond
consistently in a given way to various aspects of the world, including persons, event, and
objects. Companies in marketing research study the attitude of customers as it serves as the

MS 110 Research Methodology Uttarakhand Open University
Unit 10 Attitude Measurement and Motivational Research Techniques Page 178 of 434
base for creating customers and retaining them. A company is able to earn profitability only
when its customers have a positive attitude towards the products and services of the
company. Attitude can be classified into affective, cognitive, and behavioral component.
Affective component of attitude reflects individuals’ general feelings or emotions towards an
object, event or a person. The few example of affective component of attitude could be ‘I
love Coca-cola’, ‘McBurger is very tasty’, ‘I love my job’. When the customer is asked to
rank the products according to his liking such as ranking the most preferred soft drink out of
Pepsi, Coca-cola, Limca and Sprite is an example of affective component.
Cognitive Component forms the base for the affective component of attitude as one’s
knowledge, beliefs and cognition leads to the feeling and emotions he/she carries. The
cognitive component represents one’s awareness and knowledge about the objects. A person
may like a product because he/she believes that he/she is getting a qualitative product at a
good price. In a survey when a respondent is asked to name the companies that manufacture
air conditioners, some respondents may remember names like Haier, Voltas, Daikin,
Panasonic this is an example of cognitive component. When on the basis of his past
experience a person states that Voltas AC consumes less electricity, or Tata cars gives great
mileage are the examples of the beliefs these individuals possess.
Behavioral component reflects a predisposition to an action; it is an intention of an individual
for buying. In the behavioural component the customers set expectation towards a product
he/she is about to buy. Intentions are the willingness of an individual to pay for the product
but it may not always convert into buying.
In business research attitude measurement forms the base for understanding the customers
well so that they can be served in the best possible manner and ultimately the firm can earn
profitability. In current times creating and retaining customers is the biggest challenge and
the companies are thoroughly studying the customers’ attitude to create a positive attitude for
their products and services and secondly motivating them for converting their intentions into
real purchases.
10.5 ADVANTAGES AND LIMITATIONS OF ATTITUDE
MEASUREMENT Attitudes are mental processes within and individual’s mind which helps in determining the
actual as well as the potential response of person in a social world. Companies are
continuously in search of information about their customers and attitude measurement plays a
prominent role in finding out the characteristics of the customers that help companies in
creating and retaining the customers. Following are the advantages and limitation of attitude
measurement -

MS 110 Research Methodology Uttarakhand Open University
Unit 10 Attitude Measurement and Motivational Research Techniques Page 179 of 434
Advantages of Attitude Measurement
With the knowledge of the customers’ attitude the companies are able to make
strategies according to their requirement and successfully implementing these
strategies.
The study of customer attitude helps the companies in classifying the ‘types of
consumers’ based on their attitude. Companies plan their products and services
according to these categories.
Attitude measurement reduces uncertainty, more predictable the customer response
and behavior is, it becomes easier to control marketing conditions.
The practical importance of attitude cannot be underestimated. More a company and
his salesman know about his customers’ attitude better would be the ways in which
they will be able to serve them.
Limitations of Attitude Measurement
Measuring attitude is hypothetical construct, as attitude is not a directly observable
phenomenon but it is measured through indirect indicators, such as verbal expression
or overt behavior.
As the consumer attitude is influenced by various factors it is a complex affair. Thus
an individuals’ response cannot be predicted and the reliability of the responses
collected cannot be estimated in advance.
It is difficult to say which is the most appropriate scale for measuring attitude, the
choice of scale normally depends on the judgment of the researcher.
10.6 TECHNIQUES FOR ATTITUDE MEASUREMENT Attitude and its measurement is a most worked topic in business setting, variety of techniques
have been devised for measuring attitude. The components of attitude that is affective,
cognitive and behavioral component can be measured in different ways. For the purpose of
measuring the affective component mechanical devices such as pupilometer can be used, but
for the purpose of measuring the behavioral component verbal statements concerning beliefs,
or behavior are used for measuring the behavioral intentions.
While acquiring the response from the respondents generally they have to rank, rate, sort, or
make a choice or have to compare.

MS 110 Research Methodology Uttarakhand Open University
Unit 10 Attitude Measurement and Motivational Research Techniques Page 180 of 434
Ranking requires that respondents give order i.e. provide rank to the objects or attributes on
the basis of preference, liking, or any other characteristics. In it the respondents put all the
items in ascending or a descending order. Rating requires the respondents put their responses
on a scale, it states the magnitude of an attribute or quality that an object has. These scores
help in identifying the strength of the attitude and beliefs of the respondent. The response is
gathered by obtaining the rating of the object of study on a stated continuum (scale).
Sorting require the respondent to arrange the items or the object in a systematic manner so as
to ensure that the items or objects with similar characteristics fall into similar categories. In
the choice technique the respondents are asked to make choices among the available
alternatives. When the respondent choose a product or a service above the other stated
product or service the researcher assumes the reasons for the same.
Normally for measuring the attitude two major types of scales are used - single item scales
and multi-item scales. Single item scale where respondent have to only measure one item on
a given construct, for example when a respondent is asked to answer the following question;
Convey your satisfaction level towards your current car’s performance?
Very dissatisfied
Dissatisfied
Neutral
Satisfied
Very Satisfied
One of the problems with the above scale is that the researcher is unable to find out that
out of many features like price, after sales service, reliability, mileage the customer
satisfied with which specific features.
So the researcher use multi-item scale, which helps the researcher in finding out every
aspect of the item or the object that is being researched, for example the researcher may
ask the respondent following questions;
How satisfied you are with the mileage of the car?
Very dissatisfied
Dissatisfied
Neutral
Satisfied
Very Satisfied
How satisfied you are with the price of the car?
Very dissatisfied

MS 110 Research Methodology Uttarakhand Open University
Unit 10 Attitude Measurement and Motivational Research Techniques Page 181 of 434
Dissatisfied
Neutral
Satisfied
Very Satisfied
In the next portion of the unit we will discuss about the popular techniques used for
measuring attitude.
Check Your Progress-A
Q1. What is measurement in research?
-------------------------------------------------------------------------------------------------------------
-------------------------------------------------------------------------------------------------------------
--------------------------------------------------------------------------------------------------------------
Q2. Which scales are used for attitude measurement in research?
-------------------------------------------------------------------------------------------------------------
-------------------------------------------------------------------------------------------------------------
--------------------------------------------------------------------------------------------------------------
Q3. Define attitude. Discuss the three components of attitude.
-------------------------------------------------------------------------------------------------------------
-------------------------------------------------------------------------------------------------------------
-------------------------------------------------------------------------------------------------------------
Q4. State true or false
i. In nominal scale only numbers are assigned for identification. Alphabets or
symbols cannot be assigned. (False)
ii. When the perception, attitude, and preference of consumers are measured, we are
measuring the object of relevant characteristics.
iii. In ranking the respondents are required to put their responses on a scale. (False)
iv. Ratios or differences between scale values are permissible in ration scale. (True)

MS 110 Research Methodology Uttarakhand Open University
Unit 10 Attitude Measurement and Motivational Research Techniques Page 182 of 434
10.7 PHYSIOLOGICAL MEASURES OF ATTITUDE The physiological scales allow the researcher to collect the data regarding the affective
component of attitude without the help of verbal questioning. As the verbal questioning may
lead to chances of wrong or fake responses thus physiological devices are used to collect the
data related with the attitude of people.
In this technique mechanical devices are used by the researcher use for measuring
physiological reaction of individuals. Devices such as pupilometer, eye tracking monitors,
psycho-galvanometer helps in measuring the attitude of respondents.
1. Eye tracking monitors measures the unconscious eye movements of the respondents.
The device measures the eye movements and focal points of the respondents which
depicts the interests and attitude of the respondents. For example a marketer is
interested in finding placement of various components in an advertisement so that he
can place important components accordingly he has to track the pattern of eye
movement of customers while watching a print advertisement.
2. Pupilometer helps the researcher in observing and recording the changes in the
diameter of eye pupils. The researcher records the respondents eye pupil size, an
increased pupil size reflects that the respondent is interested in the phenomenon and is
having positive attitude toward it and vice-versa.
3. Psycho-galvanometer is a device that measures the galvanic skin response of the
respondents, through this device the researcher measures body excitement that had
occurred as a result of some visual stimulus. The researcher while using the device
presumes that excitement increases the perspiration rate of the body, which increases
the electrical resistance of the respondent. The researchers normally use it to find out
the positive attitude and interest of respondent towards product packaging, price
offers, advertisement etc.
10.8ATTITUDE MEASURMENT SCALES
When a researcher is able to explore, measure, determine the intensity and combine attitudes
towards different aspects related to a product or service, the marketer can come up with an
indicator which reflects the overall attitude of consumers. For measuring the attitude and
interest of respondents towards various aspects of business, variety of attitude measurement
scales are used, following are the different attitude measurement scale used in research;

MS 110 Research Methodology Uttarakhand Open University
Unit 10 Attitude Measurement and Motivational Research Techniques Page 183 of 434
1. Simple attitude scale
It is the simplest scale used for measurement of attitude, in this a respondent is required to
answer a single question or he/she have state his/her agreement or disagreement with the
statement. For example a respondent is asked to answer the following question;
Do you like or dislike McDonald BigMac Buger?
Like
Dislike
The simple rating scale helps in classifying respondents into one or two categories thus we
can say that the data is collected on a nominal scale. Thus the nominal attitudinal data
collected through simple rating scale limits the mathematical analysis used for analyzing the
data.
2. Category Scales
The researchers who work on attitude of customers generally believe that attitude cannot
really be measured in single word or agreement or disagreement, as attitude should always be
measured on a continuum. For the same category rating scale is developed. In this scale the
respondent are given more flexibility while rating, they have to choose their response from
the given categories. For example a respondent is asked to answer the following question;
How often you buy your grocery from Big Bazar?
Never
Rarely
Sometimes
Often
Very Often
The category scale allows the researcher to gather more information regarding the attitude of
the respondent. The respondents have more choices to put his attitude on a continuum
through which the researcher can measure the intensity of attitude.
3. Summated Rating Scale
The summated rating method was developed by Rensis Likert and thus is also known as
Likert Scale. It is a popular attitudinal scale used by the business researchers. The researcher
carefully constructs statements that are favorable or unfavorable to the object which can be a
product or service provided by the company. The respondents have to express their attitude
towards the given object from five or seven alternatives available to them on each of the
given statement. The alternatives generally are strongly agree, agree, neutral, disagree,
strongly disagree, the number of alternatives may range from three to nine. For example
I
n
q
u
a
n
t
i
t
a
t
i
v
e
r
e
s
e
a
r
c
h
y
o
u
a
r
e
a
b
l
e
t
o
e
x
p
I
n
q
u
a
n
t
i
t
a
t
i
v
e
r
e
s
e
a
r
c
h
y
o
u
a
r
e
a
b
l
e
t
o
e
x
p
l
I
n
q
u
a
n
t
i
t
a
t
i
v
e
r
e
s
e
a
r
c
h
y
o
u
I
n
q
u
a
n
t
i
t
a
t
i
v
e
r
e
s
e
a
r
c
h
y
o
u
(1)
I
n
q
u
a
n
t
i
t
a
t
i
v
e
r
e
s
e
a
r
c
h
I
n
q
u
a
n
t
i
t
a
t
i
v
e
r
e
s
e
a
r
c

MS 110 Research Methodology Uttarakhand Open University
Unit 10 Attitude Measurement and Motivational Research Techniques Page 184 of 434
consider the following question; the respondents have to rate their attitude towards mileage of
the car;
One of the most important features the Indian customer is looking for while he is buying a car
is mileage.
Strongly Disagree Uncertain Agree Strongly
Disagree Agree
(1) (2) (3) (4) (5)
For measuring the attitude researcher assign scores to the alternative responses provided by
the respondents. Numerical scores are assigned to each response, then the total of the
obtained scores is calculated which represents respondent’s attitude. The score of an
individual respondent helps the researcher in identifying his/her favourable-unfavourable
attitude towards the studied issue. The obtained score provide an empirical evidence that can
be used for comparison with other respondents.
Example of a Summated Scale
A super market is interested in studying the customer attitude on various favorable and
unfavorable statements;
Customer Attitude toward a Super Market
Strongly Strongly
Disagree Disagree Neutral Agree Agree
1. Clerk’s at the store’s
check-out are friendly. ______ _______ ____ ______ _______
2. Checkout lines at the store
move slowly. ______ _______ ____ ______ _______
3. Prices are reasonable at the store _ __ ___ ___ .
4. Store is filled with
variety of products _ __ ___ ___ .
5. Store’s serving
hours are inconvenient _ __ ___ ___ .
6. Stores layout is
confusing . _ __ ___ ___ .

MS 110 Research Methodology Uttarakhand Open University
Unit 10 Attitude Measurement and Motivational Research Techniques Page 185 of 434
Scores are given to each point present on the scale. Least score is given to the least
favourable attitude (say 1), highest score is given to the most favourable attitude (say 5). In
the Likert scale every response is assigned a score and every statement is scored individually.
These values indicate the scoring pattern for mathematical analysis. The gathered scores are
then totalled by the researcher; this calculated score finally communicate respondent’s
favourableness toward the object. If there are 20 statements in an instrument, following score
values would show;
20 × 5 = 100 Most Favourable Attitude
20 × 4 = 80 A Favourable attitude
20 × 3 = 60 A neutral attitude
20 × 2 = 40 An unfavourable attitude
20 × 1 = 20 Most unfavourable attitude.
The scores of individuals will fall between 20-100. If the score is above 60, it shows
favourable attitude and a score below 60 would mean unfavourable attitude. The scores of
various respondents can be compared to find out the comparable attitude of individuals. A
person who ticks ‘strongly agree’ has the most positive attitude compared with all of the
others with different responses.
Steps in developing a Summated scale;
(i) Identify a huge bulk of favourable and unfavourable statements related to the
attitude toward an object are identified.
(ii) A pilot survey is conducted on the gathered statements where a small group of
respondent state their responses on a five point or a seven point scale.
(iii) The responses to various statements are scored on the basis of the score values
assigned by the researcher. Highest score is given to the most favourable attitude
and lowest score is given to unfavourable attitude.
(iv) Then the acquired scores are added to come up with a single figure which shows
the positive or negative attitude of the respondent.
(v) Then the statements which constantly correlate with low favourability or with
high favourability with the total test are selected and the other statements that lack
clarity and elicit mixed response are discarded.
One of disadvantage of the scale is that a total score on the basis of which two respondents
attitude are compared are not really comparable as there exists many pattern of response that
can lead to a similar score. Thus an identical score may reflect different attitude as the
respondent may endorse a different combination of statements.
4. Semantic Differential Scale
This scale was developed by Charles E. Osgood, G.J. Suci and P.H. Tannenbaum in 1957. It
is a scale commonly used for comparing the image of companies, brands providing

MS 110 Research Methodology Uttarakhand Open University
Unit 10 Attitude Measurement and Motivational Research Techniques Page 186 of 434
competitive products or services. This scale is applied for measuring the psychological
significance an individual assign to an object under study. The respondents have to respond
on a seven or a five point bipolar rating scale. The bipolar scale uses adjectives at the both the
ends such as ‘Good and Bad’, ‘Clean and Dirty’, ‘Courteous – Non-courteous’, of an object.
For example, the following are the Semantic Differential scale items for analyzing the
attitude of customers towards two banks; the customers are asked to mark their attitude
towards each bank on the below stated bipolar statements;
Service is : : : : : : : Service is
discourteous courteous
Location is : : : : : : : Location is
inconvenient convenient
Hours are : : : : : : : Hours are
inconvenient convenient
Loan interest : : : : : : : Loan interest
rates are high rates are low
The points on the scale can be numbered as 1, 2, 3,4,5,6,7 or -3, -2, -1, 0, 1,2,3, it completely
depends on the discretion of the researcher. After the responses are administered the scores
values are assigned to each statement. Then the mean value of all the responses received from
every single respondent is calculated and is charted in a pictorial form so as to facilitate
comparison.
Service is : : : : : : : Service is
discourteous courteous
Location is : : : : : : : Location is
inconvenient convenient
Hours are : : : : : : : Hours are
inconvenient convenient
Loan interest : : : : : : : Loan interest
rates are high rates are low
Bank A________________, Bank B_ _ _ _ _ _ _ _ _ _ _ _

MS 110 Research Methodology Uttarakhand Open University
Unit 10 Attitude Measurement and Motivational Research Techniques Page 187 of 434
The above pictorial form shows that Bank B have more courteous staff as compared to Bank
A, Bank A location is more convenient as compared to Bank B, Bank B’s working hour are
more inconvenient as compared to Bank A, the loan rates of Bank B is high as compared to
Bank A.
Semantic Differential Scale is one of the efficient ways to collect the data related to an object
from a large number of respondents. The scale helps in collecting data in terms of the
direction as well as the magnitude. The overall response of all the respondents can easily help
in getting a comprehensive picture of the object under study. The results can be seen in both
comparative as well as absolute terms.
5. Stapel Scale
The stapel scale helps in measuring the intensity and the direction of an attitude at the same
time. The semantic differential scale measures the attitude on a bipolar adjective which might
sometimes be difficult to find out the intensity of a particular attribute. The stapel scale places
a single adjective in the center and then the respondent is asked to check the response from
+3 to -3 or +5 to – 5, the scale does not have a neutral point and is usually presented in a
vertical form. For example, a stapel scale for measuring the attitude of customers towards a
restaurant food quality and service quality
Restaurant
+ 5 +5
+ 4 +4
+ 3 +3
+ 2 +2
+ 1 +2
Food Quality Service Quality
- 1 -1
- 2 -2
- 3 -3
- 4 -4
- 5 -5
The respondent describes his attitude in the form of a numerical response. If the respondent is
selecting a positive higher number it means that the respondent is having favorable attitude.
The advantage of the stapel scale is that it is easy to construct the scale and is also easier to
administer it.

MS 110 Research Methodology Uttarakhand Open University
Unit 10 Attitude Measurement and Motivational Research Techniques Page 188 of 434
6. Constant-Sum Scale
In the constant sum rating scale the respondent have to allocate a steady (constant) sum of
units that is total of 100 points between various objects or brands. In this scale the
respondents have to divide a steady(constant) sum among the available attributes on the basis
of relative importance they give to these attributes. The respondents have to score the
attributes of a product or service towards which the attitude of respondents is being
measured. This scale allows the respondent to distribute the total of 100 among the features
of the specific brand or a product. The constant sum scale allows the respondents to assign
zero to the unimportant feature and also a double scores if that feature is considered twice as
important. One important aspect is that the total sum of all such points should always be 100.
For example the below table show the score assigned by the respondents when they are asked
to rate the importance of bathing soap attributes using a constant cum scale;
Attributes Soap of Segment I Soap of Segment II Soap of Segment III Lather 8 2 4 Mildness 2 4 17 Shrinkage 3 9 4 Fragrance 53 17 9 Price 9 0 19 Packaging 7 5 9 Cleansing Power 5 3 20 Moisturizing 13 60 15
Total Score 100 100 100
In the above table when the respondent gives 0 score to an attribute it means that attribute
does not have any importance to him, and the score of 60 shows that the most important
attribute for the respondent is moisturizing while considering the segment II soap. Constant
sum scale is extensively employed for allocating importance to various attributes of the
product based on the customers' attitude.
7. Thurstone’s equal-appearing scale
Louis Thurstone in 1927 developed the equal-appearing interval scale using consensus scale
approach. In the scale the items are selected by the panel of judges, these judges evaluate the
items on the basis of their relevance with the topic and then they assign values to attitudinal
statements. Later the respondents are asked to respond to the attitudinal statements.
Initially the researcher who is an expert in the field of study collects huge number of
statements that express the composite attitude of the respondents towards an object. Then a
panel of judge is selected; each of whom arranges these statements in eleven piles. These
statements are piled in manner that these range from one extreme to another. In the first pile
MS 110 Research Methodology Uttarakhand Open University
Unit 10 Attitude Measurement and Motivational Research Techniques Page 189 of 434
are the statements those are considered most unfavorable, in the second pile are the
statements which are considered as next most unfavorable and so on. In the eleventh pile the
most favorable statements are included. Final statements are selected on the basis of the
evenly spread median values from one extreme to another.
Then the respondents are asked to select the statements with which they agree in the scale.
The attitude towards an object under study is measured by calculating the median value of the
responses on the statements. The Thurstone method is reliable method for measuring single
attitude. This scale is not frequently used by business researcher as it requires a lot of efforts
and cost to develop the scale. One of the limitation of the scale is that it is affected by the bias
of the judges who develop the scale.
8. Guttman Scales
Guttman’s scale also known as cumulative scale includes a series of statement. The
respondents are asked to expresses their agreement or disagreement on those statements. The
scale is comprised of related statements. The responses received forms a cumulative series.
Assume that researcher is conducting an opinion survey regarding a new style of sports
shoes; the researcher developed a scale of four items;
1. The Nike shoes are very comfortable
2. I will again buy Nike shoes next time because it is very comfortable.
3. The comfort of Nike shoes is very acceptable to me.
4. I prefer the Nike shoes comfort to other shoes.
The respondent indicates whether they agree or disagree. These statement forms a uni-
dimensional scale. An individual respondent, who replies in favor for item No. 4, will also
reply in favor for item No. 3, 2 and 1 and so on.
When the respondents answer favorably to all the items, he/she will have a positive attitude
and his/her cumulative score would be high, and his/her attitude is negative when he/she
answer unfavorably to all the items. The score of the respondents’ is calculated by totaling
the points of the statements answered by him/her favorably that is the cumulative score.
We have discussed number of different attitude measurement techniques through which the
researcher can measure attitude. Every technique has some strength and some weaknesses.
Any technique can be used for attitude measurement, but for different purpose different
technique is chosen by the researcher. Generally scales like Thurstone's scale, Semantic
differential scale are used for preliminary investigation. For the purpose of item analysis
Likert scale is appropriate, for measuring the importance of attributes constant sum scale will
be appropriate and so on. The researchers choose the scale depending on his/her skills.
MS 110 Research Methodology Uttarakhand Open University
Unit 10 Attitude Measurement and Motivational Research Techniques Page 190 of 434
10.9 MOTIVATION RESEARCH TECHNIQUES
Motivational research is conducted with the objective of identifying and understanding the
hidden motives that influence consumer behaviour. These are the researches undertaken with
the purpose of identifying social, cultural, and other environmental forces that consciously or
unconsciously influence the consumers’ behaviour. Learning about these overt and covert
motives of customers helps the marketer in better understanding their target audience and
finding out ways to influence them and motivate them for buying the products and services
offered by the companies.
The motivational research provides valuable information regarding underlying motives that
influence the consumers’ behavior. For example a motivational research may be conducted to
find out why do women tend to spend more on cosmetics and clothing as they approach the
45- 55 age group? There might be several reasons for the same such as fear of losing their
husbands' love as they consider themselves as less beautiful than before. One of reasons
could be having more disposable income as the children are leaving the family for their
career, or any other motives which are affecting their purchase behaviour. There are various
techniques that can be used by the marketer for studying motivation among consumers, in the
following paragraph various motivational research techniques are stated.
Major Motivational Researchers Techniques
Major motivational research techniques that marketing researchers regularly uses for
conducting research studies are observation, focus groups, and depth interviews.
1. Observation
Observation method can be used to collect information related to various kinds of research
such as knowing the purchase motives, purchase intentions, purchase behaviour, real time
buying preferences etc. of a consumer that s/he express. This technique was developed by
anthropologists who used to live with the natives of a particular place to understand their
behaviour. The similar approach is used by the marketing researchers for understanding the
consumer behaviour.
The observation also helps in gathering the data that normally the customer might not state
correctly in person or hesitate is expressing. The process of observation can be conducted
directly by the observer or it could also be done with the help of video recording. Generally,
video cameras are less invasive than an in-person observation but finding out an appropriate
place for capturing the representative population is a difficult task. But, observation does not
always answer all the questions. So other techniques should be applied simultaneously.

MS 110 Research Methodology Uttarakhand Open University
Unit 10 Attitude Measurement and Motivational Research Techniques Page 191 of 434
The Focus Group
Focus group research is a research that involves a group interview of approximately six to
twelve people who are brought together at a place for a discussion on the topic of interest.
The discussion is held in the presence of an experienced and trained moderator, who is
responsible for guiding the discussion. Participants express their experiences and ideas in
great detail on the topic of discussion so as to create a complete understanding of the topic of
discussion or the problem situation. The focus group interviews ensure collection of high
quality data from an honest and guided discussion held among the participants for around one
and a half hour to two hours.
Here the participants interact with each other and explore and state in-depth information on
perceptions, insights, attitudes, experiences, or beliefs on topics such as nutrition, mental
health, rise in population, political issue etc. The moderator plays an important role in
obtaining good and accurate information from the focus groups.
The Depth Interview
One-to-one, personal interview conducted directly by the marketing researcher is one of the
most important factors for motivational research. Depth interview is a lengthy process in
which the respondent thoroughly expresses his/her feelings and thoughts without fear of
discomfort or rejection. The researcher creates an environment of trust, and understanding so
that the respondent can convey his feeling and his opinions on the subject matter.
The motivational researcher during the depth interview can either use nondirective
interviewing technique in which the researcher does not ask direct question to the
respondents, the objective is to let the respondent talk freely. Another technique can be
projective techniques in which the respondents are either asked to tell a story, or to draw a
picture/drawing, or to complete a sentence, or to associate words with a stimulus so as to find
out association of various aspects under study.
The major idea of conducting motivational research is to collect the information regarding
dimensions of business environment, such as the competitive environment and the
competitors, perception of customer towards the brand, brand image among customers,
comparative market share of the company and the competitors, the role of advertising, trends
in the marketplace etc. Business researcher interprets the research results and identifies
consumer motives, perception, attitude, competitive status of competitors etc. that help the
marketers in earning profits.

MS 110 Research Methodology Uttarakhand Open University
Unit 10 Attitude Measurement and Motivational Research Techniques Page 192 of 434
Check Your Progress-B
Q1. Write a short note on Likert scale.
-------------------------------------------------------------------------------------------------------------
-------------------------------------------------------------------------------------------------------------
--------------------------------------------------------------------------------------------------------------
Q2. What is the difference between semantic differential scale and stapel scale?
-------------------------------------------------------------------------------------------------------------
-------------------------------------------------------------------------------------------------------------
-------------------------------------------------------------------------------------------------------------
Q3. Discuss the advantages of using Constant sum scale.
------------------------------------------------------------------------------------------------------------
------------------------------------------------------------------------------------------------------------
-------------------------------------------------------------------------------------------------------------
-------------------------------------------------------------------------------------------------------------
Q4.Discuss the motivational research technique used in business setting.
------------------------------------------------------------------------------------------------------------
------------------------------------------------------------------------------------------------------------
-------------------------------------------------------------------------------------------------------------
Q5. State true or false
a) In constant sum scaling, if an attribute is having double the importance as compared
to some other attribute it receives twice as many points.
b) The Likert scale is a balanced rating scale with an odd number of categories and a
neutral point.
c) The stapel scale is usually presented horizontally.
d) A total score can be calculated for each respondent by summing across his score for
all the items.

MS 110 Research Methodology Uttarakhand Open University
Unit 10 Attitude Measurement and Motivational Research Techniques Page 193 of 434
10.10 SUMMARY
In this unit you learnt about attitude measurement and motivational research a technique that
is important in behavioural research. Here, you learnt about the methods used to measure
attitude such as ranking, rating, sorting, and choice techniques. As the research is empirical in
nature it means that it is based on hard facts and figures, thus for the purpose of making the
research more reliable, numbers are assigned to the variables in research. The attitude
measurement is rigorously used in business setting where the customer attitude measurement
serves as the base for designing the products and services according to their requirements. In
this unit, you learn methods of collection of statistical data.
10.11 GLOSSARY
Attitude Measurement- It is process of measuring the attitude with the help of a survey
conducted with the purpose collecting the data related to the attitude of specific
population towards an object or an issue.
Scale – It is a measurement tool used to measure the data collected for the research so
that data could be analyzed and results can be obtained.
Ordinal Scale – it is scale used for measuring ordinal data, the data which placed the data
in ascending and descending order.
Attitude scales - Attitude scales is an attitude measurement scale used to score
individuals attitude on a continuum to find out the dimension and intensity of attitude
towards an object or issue.
Motivational Research – it is a research conducted by the marketing researcher to find
out the overt and covert motives behind consumer behaviour.
10.12 ANSWERS TO CHECK YOUR PROGRESS
Check Your Progress –B
Fill in the Blanks
a) (True)
b) (True)
c) (False)

MS 110 Research Methodology Uttarakhand Open University
Unit 10 Attitude Measurement and Motivational Research Techniques Page 194 of 434
10.13 REFERENCES
Beri Govind Chand, (2013), ‘Marketing Research’, Tata McGraw-Hill Publishing
Company Limited, New Delhi.
Boyd; H.W. , Westfall; R. and Stasch; S.F., (2002) ‘Marketing Research, Text and
Cases’, Richard D. Irwin , Inc. Homewood, Illinois, All India Traveller Boolkseller,
New Delhi
Chawla; D and Sondhi; (2011) N, ‘Research Methodology, Concepts and Cases’,
Vikas Publishing Hose Pvt. Ltd, New Delhi.
Cooper; D.R and Schindler; P.S (2007), ‘Marketing Research, Concepts and Cases’,
Tata McGraw-Hill Publishing Company Limited, New Delhi.
Ekka Rajesh, Research Methodology and Data Analysis in Humanities & Social
Sciences, Lulu.com, ISBN 1312760125, 9781312760127
Hair; J.F., Bush; R.P., Ortinau; D.J.(2003), ‘Marketing Research, Within Changing
Information Environment’, Tata McGraw-Hill Publishing Company Limited, New
Delhi.
Kerlinger, Fred N., (1983), ‘Foundations of Behavioural Research’, Surjeet
Publications, (Second India Reprint), Delhi.
Kothari; C.R. (2009), ‘Research Methodology, Methods and Techniques’, New Age
International Publishers, New Delhi
Luck; D.J. and Rubin; R.S., (2007), ‘Marketing Research’, Prentice Hall
International, Inc., Englewood Cliffs, Published by Prentice-Hall of India Private
Ltd, New Delhi
Mehra S, Scaling techniques of attitude measurement, (2017), International Journal
of Advanced Education and Research ISSN: 2455-5746, Impact Factor: RJIF 5.34
Volume 2; Issue 2; March 2017; Page No. 41-50
Nayak J.K. & Singh P, (2015), Fundamentals of Research Methodology, Problems
and Prospects, SSDN Publishers & Distributors, New Delhi
Singh Kultar , (2007), Quantitative Social Research Methods, SAGE.
Tull D. S. Tull and Hawkins D. I. (2008) "Marketing Research: Measurement &
Methods" (Twelfth Edition), PHI Pvt. Ltd., New Delhi.
Tripathi, PC, (2007), ‘A Textbook of Research Methodology in Social Sciences’,
Sultan Chand & Sons, New Delhi
Victor L. D'Amico, (1957), ‘Marketing Research’, Tata McGraw-Hill Education
Zikmund. William G., (1997), ‘Business Research Methods’, 5th
edition. Dryden
Press, Harcourt Brace College Publishers.
MS 110 Research Methodology Uttarakhand Open University
Unit 10 Attitude Measurement and Motivational Research Techniques Page 195 of 434
10.14 SUGGESTED READINGS
1. Bhattacharya;D.K., (2006), ‘Research Methodology’, Excel Book, New Delhi.
2. Easwaran, Sunanda and Singh, (2006), ‘Marketing Research – Concepts, Practices
and Cases’, Oxford Universiy Press, New Delhi.
3. Malhotra Naresh K.,(2002) ‘Marketing Research- An Applied Orientation’, 3rd
edition, Pearson Education, New Delhi.
4. Kothari; C.R. (2009), ‘Research Methodology, Methods and Techniques’, New Age
International Publishers, New Delhi
10.15 TERMINAL QUESTIONS
Q1. Suppose Indigo Airways wants to ascertain the image it has in the mind of
customers. Construct a seven item Likert scale to measure the perceived image of
customers towards the airlines.
Q2. Develop a semantic differential scale to measure the image of two coffee joint –
Barista and Café Coffee day.
Q3. Develop a Semantic Differential Scale to measure the difference among the
perception of restaurant customer towards the concept of home delivery.
Q4. A researcher is interested in comparing two hotels on the following attributes:
convenience of location, friendly personnel, and value of money;
a. Design a Likert scale to accomplish this task.
b. Design a semantic differential to accomplish this task

MS 110 Research Methodology Uttarakhand Open University
Unit 11 Survey Research-Scaling Techniques Page 196 of 434
UNIT 11 SURVEY RESEARCH- SCALING
TECHNIQUES
11.1 Introduction
11.2 Objectives
11.3 Concept of Measurement
11.4 Types of Measurement
11.5 Measuring Scale Types
11.6 An Introduction about Scaling Techniques
11.7 An Overview about Scaling
11.8 Statistical Analysis
11.9 Likert Scale
11.10 Thurstone Scale
11.11 Test Retest Reliability
11.12 Sensitivity of Scales
11.13 Summary
11.14 Glossary
11.15 Answer to Check Your Progress
11.16 References
11.17 Suggested Readings
11.18 Terminal & Model Questions
11.1 INTRODUCTION The numbers convey information about the property being measured. In this way we are able
to quantify the qualitative aspects of the attributes of a variable. When numbers are used, the
researcher must have a rule for assigning a number to an observation in a way that provides
an accurate description. It is to be noted here that what we measure in research is not the
object rather the characteristics of that object.
The basic question arises, how to measure? In order to measure the attributes of a variable we
need suitable scale. The scales are created specifically in business research for measurement.
The process of creation of scale for measurement is called scaling. Scale is a device providing
a range of values that correspond to different values in a concept being measured.

MS 110 Research Methodology Uttarakhand Open University
Unit 11 Survey Research-Scaling Techniques Page 197 of 434
Correspondence rules indicate the way that a certain value on a scale corresponds to some
true value of a concept.
Measurement can also be illustrated by thinking about the way instructors assign students’
grades. A grade represents a student’s performance in a class. Students with higher
performance should receive a different grade than do students with lower performance.
As stated earlier, to make the measurement process effective, the relationships existing
among the objects or events in the empirical system should directly correspond to the rules of
the number system. However, the definition of measurement imposes certain restrictions on
the type of numerical manipulations admissible. The further sections of this unit explain the
types and methods of measurements.
11.2 OBJECTIVES After reading this unit students would be able to:
To understand the concept of Measurement in research
To understand the types of measurement scales
To understand the process of development of scale
To understand the criteria for a good measurement scale
11.3 CONCEPT OF MEASUREMENT Measurement is the task of numerals to represent the magnitude of an attribute of a
phenomenon.
Measurement is conveying of numbers to phenomena in a systematic way as a means of
representing attributes of the phenomena.
Phenomenon: A thing or an event of interest namely, a table, a performance, an exam, a
football team.
Attribute: A characteristic or a quality of the phenomenon to be measured; namely length,
quality, correct answers.
Magnitude: The extent to which the phenomenon has the attribute; namely, 5 feet long,
excellent, 80%.
Numerals: The measure must produce a numerical result.
Direct results: Often we cannot directly measure the attribute of interest; we need to find the
substitute
Indirect measures: Consider the questions. How tolerant of ambiguity are students? What is
the phenomenon?

MS 110 Research Methodology Uttarakhand Open University
Unit 11 Survey Research-Scaling Techniques Page 198 of 434
What is the attribute?
Can we measure the attribute directly?
Attitude scales.
11.4 TYPES OF MEASUREMENT The following are two types of measurements:
1. Vectors (have a magnitude/amount and a direction)-e.g.-velocity, weight etc.
2. Scalars (have a magnitude but no direction)-e.g.-speed, mass etc.
11.5 MEASURING SCALE AND TYPES Scaling is a technique of changing attitude (qualitative elements) to a variable (quantitative
element)
This can be classified into any of the above measures.
As far as measurement of scales are concerned they can be understood by the following
manner
1. Nominal scale or Categorical scale
2. Ordinal scale or Ranking scale
3. Interval scale
4. Ratio scale
Brief description of different types of scales
1. Nominal scale or Categorical scale: In nominal measurement, the numerical values
simply name the attribute uniquely. No ordering of cases is implied. For example, Sachin
Tendulkar with jersey number 9is not more than a player Raina with number 3.
This scale classifies individuals into two or more categories, the members of which differ
with respect to the specific characteristic. However the categories have no rank order, e.g.,
Hindus and non-Hindus, males and females and the like. The normal scale is often called a
classificatory scale.
The rules of assigning numerals (numbers) in nominal measurement are simple. More
examples are:
(a) All males will be assigned the same numeral 1 and all females will be assigned numeral 2.

MS 110 Research Methodology Uttarakhand Open University
Unit 11 Survey Research-Scaling Techniques Page 199 of 434
(b) All illiterate will be assigned numeral 1, all less educated (primary and middle pass)
numeral 2, all moderately educated (secondary and higher education) numeral 3 and all
highly educated (graduated and post graduates) numeral 4.
Here numbers have therefore o meaning. They cannot be ranked; they cannot be added. It is
therefore said by some experts that this (nominal is not measurement).they therefore talk of
only three types (and not four types) of measurement. However since the members of the
labeled sets can be counted and compared, it indicates that nominal measurement is
measurement.
2. Ordinal scale or Ranking scale: In ordinal measurement, the attributes can be rank –
ordered. Here distances between attributes do not have any meaning. For example, on a
survey of 10 MBA students, we find age less than 20 is 1, less than 22 is 2, less than 25 is 3
and less than 27 is 4. In this measure higher numbers means more age. Is distance between 0
to 20 same as 3 to 4? It is of course not. The interval between values is not interpretable in an
ordinal measure.
More precisely, we can say that this scale ranks individuals along the continuum of the
characteristic being scaled, say, from highest to lowest, greatest to least, first to last, and so
on.
For more examples
Asking a young girl to rate three boys P,Q, AND R on their suitability (as bad, good, better,
best, and undecided)as her would be husband on scale of 1 to 10(by circling one number).
P-1, 2,3,4,5,6,7,8,9,10
Q-1, 2,3,4,5,6,7,8,9,10
R-1, 2,3,4,5,6,7,8,9,10
Suppose the girl is to rate the suitability of boy as her marriage partner on the basis of five
different criteria, viz, physical attractiveness ,education, occupation, income ,and number of
unmarried and married brothers and sisters .she will give different rates on scales to these
series of the questions. By summing up all the five scores, the final score will be measured.
This type of scale is called a summated rating scale.
Similarly in another study, suppose all the given questions require answer as agree(1) or
disagree(0)a person who agrees with all the questions make a maximum score on the scale
and the person who disagree with all the questions makes a score of zero(0)
The ordinal scale thus provides a rank order of categories and arranges objects according to
their magnitude in an ordered relationship. However, it does not describe the distance or
interval between the elements /individuals. For example, there are three students; one having
secured 46 percent marks. The ordinal scale will only describe first student as third

MS 110 Research Methodology Uttarakhand Open University
Unit 11 Survey Research-Scaling Techniques Page 200 of 434
divisioner, second student as second divisioner and third student as first divisioner, but it will
not give the difference in the marks of these three students.
In business research, the ordinal scale asks respondent to rate the commodity /product as
excellent, good, fair or poor. We know that ‘excellent’ is higher than ‘good ’but we do not
know by how much. Ordinal scales are sometimes referred to as ranking scales or rank order
scales.
It is to be noted that it is not quantities or amounts that are added or subtracted, but it is
intervals or 1distances.
4. Ratio scale- In ratio measurement, there is always a meaningful absolute zero. It has
always the fixed starting point. By the help of this scale mathematical operation can be
performed. Height, age, income weight etc are the examples of the ratio scales.
In research most count variables are ratio, for example, the number of clients in the first one
year. There must not be zero clients and because it is meaningful to say, there are twice as
many clients in the past one year as in the previous one year.
This is the scale which has no absolute zero point of origin and which explains proportion of
one value to another. For other examples, the ratio of female crime to male crime is 1:20, i.e,
for every five female criminals, there are 100 male criminals. The ratio of salary of newly
appointed lecturer and professor is 1:1.5, i.e., when a lecturer gets Rs.30000 per month, a
professor gets Rs 40000.
Ratio scales are sometimes referred to as absolute scales.
Practical consideration in use of scales:
What type of scales is used in Behavioral research? Mostly nominal and ordinal scale is used
in social sciences and business research. Whatever variables are involved (male-female,
married-single, old young, and so on), measurement is nominal. Or whenever variables are
converted to attributes (high-low, great-small), we have ordinal measurement. But
intelligence, aptitude, and personality test scores are basically ordinal. They indicate not the
amount of intelligence and personality test of individuals but rather the rank order positions
of the individuals.
11.6 AN INTRODUCTION ABOUT SCALING TECHNIQUES This section continues our discussion of how scales are developed and how some of the more
common scaling techniques and models can be used. It focuses on broad concepts of attitude
scaling—the study of scaling for the measurement of managerial and consumer or buyer
perception, preference, and motivation. All attitude (and other psychological) measurement
procedures are concerned with people i.e consumers, purchasing agents, marketing managers,
or whomever respond to certain stimuli according to specified sets of instructions. The

MS 110 Research Methodology Uttarakhand Open University
Unit 11 Survey Research-Scaling Techniques Page 201 of 434
stimuli may be alternative products or services, advertising copy themes, package designs,
brand names, sales presentations, and so on. The response may involve which copy theme is
more pleasing than another, which package design is more appealing than another, what do
each of the brand names mean, which adjectives best describe each salesperson, and so on.
Scaling procedures can be classified in terms of the measurement properties of the final scale
(nominal, ordinal, interval, or ratio), the task that the subject is asked to perform, or in still
other ways, such as whether the emphasis is to be placed on subject, stimuli, or both.
A well-designed research problem constitutes a well- designed measurement process. The
process of measurement is a fundamental aspect of any research. This is the step where you
actually try to find out the reality by measuring it. Decision makers are more interested as the
steps prior to this step are purely descriptive, and, this is the step where actual quantification
happens. The measures should be devoid of measurement errors. There may be disastrous
situations where the marketer may be confused with the findings of the data. If he is well
aware of the confounding results, then he may discard the findings that emerge from the data
analysis. This requires lot of wisdom and knowledge in identifying if the data that resulted
from the measurement is consistent, unambiguous etc., but unfortunately, marketers may not
be interested in knowing or rather would not know the type of scales used to measure the
aspects involved in the marketing problem. Any decision made based on the findings would
lot of negative implications on the organisation. Hence, it is very imperative that the
researcher is wise enough to develop measurement scales that capture the right property with
appropriately.
The scaling techniques employed in research could be broadly classified into comparative
and non-comparative scale. Comparative scales as its name indicate derive their name from
the fact that all ratings are comparisons involving relative judgements. It involves direct
comparison of stimulus objects. It contains only ordinal or rank order properties. It is also
otherwise called non-metric scales in that it does not allow any numerical operations on it
against all that could be applied on interval and ratio scales. Comparative scales involve the
direct comparison of stimulus objects.
11.7 AN OVERVIEW ABOUT SCALING Scaling is a process of creating a continuum on which the characteristics of measured objects
are located. Researchers measure concepts through a process known as operationalization.
This process involves identifying scales that correspond to variance in the concept. Scales
provide a range of values that correspond to different values in the concept being measured.
In other words, scales provide correspondence rules. For example, a scaling technique might
involve estimating individuals' levels of extraversion, or the perceived quality of products.
Certain methods of scaling permit estimation of magnitudes on a continuum, while other
methods provide only for relative ordering of the entities.
The steps which are to be followed for developing the scale are:

MS 110 Research Methodology Uttarakhand Open University
Unit 11 Survey Research-Scaling Techniques Page 202 of 434
1. Definition of the concept or concepts to be measured;
2. Identification of the components of the concept;
3. Specification of a sample of observable and measurable items (indicators or proxy
variables) that represent the components of the concept;
4. Selection of the appropriate scales to measure the concept;
5. Combination of the items into a composite scale, referred to as an instrument, which
in turn serves as a means of measuring the concept.
6. Administer the instrument to a sample and assess respondent understanding
7. Assess reliability and validity.
8. Revise instrument as needed.
Fig 11.1 Scaling Techniques
11.8 STATISTICAL ANALYSIS OF SCALES This type of scale used in research will determine the form of the statistical analysis .for
example, mean can be calculated only if the scale is of an interval or ratio type but not in
nominal or ordinal scales.

MS 110 Research Methodology Uttarakhand Open University
Unit 11 Survey Research-Scaling Techniques Page 203 of 434
Appropriate descriptive statistics for different types of scales:
Type of scale Range Central tendency
Nominal no. of categories
(Male/ female; illiterate/less educated mode
/moderately educated/ highly educated.)
Ordinal No. of scalar positions median
High/moderate/low/
Heavy/average/light
Interval or ratio top score minus bottom score mean
For nominal scale, the most sophisticated form of statistical analysis is counting .the numbers
are used merely for classification purposes; they have no quantitative ,meaning .The
researcher only counts the frequency in each category and describes which category contains
the highest number .Calculating ‘mode’, therefore, is more appropriate for nominal scale.
Example:
Fast - - - - - - - Slow (Only direction)
Fast - - - - - - - Slow (Direction and intensity)
3 2 1 0 1 2 3
Here
3 intensifies extremely
2 intensifies quite
1 intensifies slightly
0 intensifies neutral
The concept profile uses EPA (Evaluation, potency and activity) dimensions for variability
and reliability.
Evaluation uses adjectives like good-bad, nice-awful, sweet-sour, helpful-unhelpful etc.

MS 110 Research Methodology Uttarakhand Open University
Unit 11 Survey Research-Scaling Techniques Page 204 of 434
Potency uses adjectives like powerful-powerless, big little, strong-weak, deep-shallow etc.
Fig 11.2 Semantic Scale
Activity uses adjectives like fast- slow, alive- dead, noisy-quite, young-old etc. This is very
simple and economical tool for market research.
Mathematical and Statistical Analysis on the data of different Scales
Sl No Scales Basic
Characteristics
Examples Permitted Statistics
Descriptive Inferential
1 Nominal Numbers identify
and classify
objects
Types of
store, Yes or
no choice,
gender
Percentage,
Mode
Chi Square,
Binomial test
2 Ordinal Numbers indicates
the relative
positions of the
objects but not the
Preference
ranking,
Quality
Ranking
Percentile,
Median
Rank Order,
Correlation,
ANOVA
MS 110 Research Methodology Uttarakhand Open University
Unit 11 Survey Research-Scaling Techniques Page 205 of 434
magnitude of
difference between
them
3 Interval Difference
between objects
can be compared;
Zero point is
arbitrary
Attitude,
Opinions,
Index
Numbers
Range, Mean,
Standard
Deviation
Moment,
Correlation, t-
test, ANOVA,
regression and
factor analysis
4 Ratio Zero Point is
fixed; ratios of
scale values can be
computed
Age, Income,
Costs, Sales,
Market
Shares
Geometric
Mean,
harmonic
mean
Coefficient of
variation
11.9 LIKERT SCALE Likert scale is a multi-point (generally 5- 7) psychometric rating scale. It is also called a
summative scale. The likert items are given specific counts on the basis of the level of
agreement or disagreement on the statement. The five point likert scale is as follows:
Strongly Agree nor Neither agree Disagree
Strongly disagree
Agree disagree
Very interested Somewhat Neutral Not very Not at all
Interested interested interested
5 4 3 2 1
Very like me Somewhat Neutral Not Very like Not at all
like
Like me Me
Me
5 4 3 2 1

MS 110 Research Methodology Uttarakhand Open University
Unit 11 Survey Research-Scaling Techniques Page 206 of 434
Very happy Somewhat happy Neutral Not very happy Not at all
happy
5 4 3 2 1
Very always Sometimes Every once in Rarely Never
happy
A while
5 4 3 2 1
11.10 THURSTON SCALE
Thurston scale is an 11-point attitude scale used to measure the favorability or unfavorability
of an issue in question e.g. Attitude towards drop among college students. A group of experts
are asked to rate a collection of statement ranging from 1-11.1 is assigned for the statement if
the expert feel the statement is extremely favorable to an issue and 11 is assigned if the expert
feel the statement is extremely unfavorable to given issue. The weights given to each
statement is the average of all the numbers assigned to the statement by each judge.
Check Your Progress-A
Choose the correct alternative
1. Which of the following orders of scale represents increasing complexity?
a) Ordinal, Nominal, Interval, Ratio
b) Nominal, Ordinal, Interval, Ratio
c) Interval, Nominal, Ordinal, Ratio
d) Ratio, Ordinal, Interval, Nominal
2. Which of the following is/are the measurable concept in business research?
a) Satisfaction level

MS 110 Research Methodology Uttarakhand Open University
Unit 11 Survey Research-Scaling Techniques Page 207 of 434
b) Attitude
c) Both
d) None of these
3. All psychological variables like attitude, belief, satisfaction levels are?
a) Unipolar
b) Bipolar
c) Neutral
d) None of These
11.11 TEST –RETEST RELIABILITY This means administrating the same scale or measure to the same respondent at two separate
times to test for stability. If the measures stable over time, the reported test administered
under conditions similar to the first should obtain similar results. For instance, in the above
mentioned example of doctor’s commitment in a given hospital, in first test 75 percent
doctors are found committed and 25 percent non- committed. In nominal terms, this means
that there are two types of doctors; committed. In ordinal terms, the number of committed
doctors is high and of non-committed doctors is low. In interval terms, the number of
committed doctors is three times higher than non-committed doctors is 3:1.With same
questions asked from same doctors is found only 60 percent. As such, the researchers should
know that his measures are not reliable.
There are some limitations in the test-retest reliability. One, the first measures may so
sensitize the respondent to their participation in the research that it may influence the results
of the second measure. At the retest, respondents may remember their first answers and
deliberately give the same answer, even when they may want to change their answer. Two,
the respondents may think afresh on the questions between the two measures is very long,
some changes might take place in the situation which may affect the responses. Thus, low or
moderate correlation between the two tests may be explained in terms of change over time
rather than a lack of reliability. In these circumstances, the test and retest scores are not
exactly comparable.
Internal Consistency Reliability
This refers to asking similar questions or presenting same scale items.
Split-Half Reliability
According to this, response to the items of an instrument is divided and the scores correlated.
The degree of correlation indicates the degree of reliability of measurement. The test could
alternatively be divided into more parts-thirds, quarters, etc, provided all the items are
comparable. The correlation is then corrected to give stepped-up reliability of the whole test.

MS 110 Research Methodology Uttarakhand Open University
Unit 11 Survey Research-Scaling Techniques Page 208 of 434
Equivalent from Reliability
It is utilized when two alternative instrument are designed to be as equivalent as possible.
Each of the two measurement scales is administered to the same group of subjects. If there is
high correlation between the two forms, the researcher assumes that the scale is reliable.
Non-complainant type
Non-sociability
By assigning one mark to each of the 12 indicators, we can find out the high average,
and low degrees of social and emotional adjustment. Getting 8-9 marks in each type
of adjustment will be assumed to have high level of social adjustment; one getting 12
marks will be taken as having low level of adjustment and only 5-6 marks as having
average level of adjustment
11.12 SENSITIVITY
A dichotomous response category such as ‘agree or disagree’ does not reflect attitude
changes. A more sensitive measure with numerous items on the scale may be needed. For
example, 5 points scale (strongly agree, neither agree nor disagree, disagree and strongly
disagree) increases a scale’s sensitivity. By assigning ‘zero’ (0) to third type of answer (i.e.
neither agree nor disagree) and +2 to strongly agree, +1 to agree,-1 to disagree and -2 to
strongly disagree, we can calculate the plus and minus marks achieved and thus measures the
attitude.
With numerous items on the scale may be needed. For example, 5 point scale (strongly
agrees, agree, neither agree, nor agree, disagree and strongly disagree) increases a scale
sensitivity. By assuming’ zero’ to third type answer (neither agree nor disagree) and +2 to
strongly agree,
+1 to agree, -1 to disagree and -2 to strongly disagree; we can calculate the plus and minus
marks achieved and thus measure the attitude.
11.13 SUMMARY In this unit we have learned the concept of measurement and scaling. It is important to
understand that measurement is assigning numerical values to variables or psychological
constructs to quantify the decisions. Various levels of measurement scales are nominal,
ordinal, ratio and interval. Some standard measurement scales are developed like Likert scale,

MS 110 Research Methodology Uttarakhand Open University
Unit 11 Survey Research-Scaling Techniques Page 209 of 434
Thurston scale, Semantic differential etc. In next unit there is an attempt to discuss about
sampling and sampling distribution.
11.14 GLOSSARY
Measurement: A process of assigning numbers to a concept of variable in scientific way.
Construct: An operationally defined concept to be measured.
Variables: Any construct which varies in research design.
Scaling: Scaling is a process of creating a continuum on which the characteristics of
measured objects are located.
Validity: A measure of good scale to ensure “measures what is intended to measure”.
11.15 KEY TO CHECK YOUR PROGRESS
1) (a)
2) (a)
3) (b)
11.16 REFERENCES
Kumar Ranjeet “Research Methodology” Pearson Education.
Young V. Pauline, “Scientific Social Surveys and Research”.
Gopal, M.H. “An Introduction to Research Procedure in Social Sciences”.
Michacl, V. P. “Research Methods in Management’. Himalaya Publishing
House.
Kothari C.R. “Research Methodology” Vikas Publication.
Gode and Hatt. “Methods in Social Research”. Tata Mc Graw Hill, New Delhi.
Cresswell, John, W.,(2008). Research Design; Qualitative, Quantitative and
Mixed Methods Approaches. Newbury Park, CA: Sage Publication.

MS 110 Research Methodology Uttarakhand Open University
Unit 11 Survey Research-Scaling Techniques Page 210 of 434
Marczyk, G.R, DeMatteo, D. & Festinger D., (2005). Essentials of Research
Design and methodology, New York City, NY: Wiley.
Ethridge, Don E., (2004). Research Methodology in Applied Economics.
Daryaganj, ND: Wiley – Blackwell,
Bergh, D. and Ketchen, D. (2009) Research Methodology in Strategy and
Management. Binglay, UK: Emarald Group Publishing.
Kothari, C R (2008), Research Methodology & Techniques, New Age
Publication, Delhi
Bajpai, Naval (2012) Business Research Methods, Pearson, Delhi
Schiendler & Cooper(2009) : Business Research Methods, TMH, New Delhi
11.17 SUGGESTED READINGS
1. Cooper And Schiendlers : Business Research Methods, Tmh
2. C R Kothari : Research Methodology (New Age)
3. Kumar Ranjeet: Research Methodology Pearson Education.
4. Young V. Pauline: Scientific Social Surveys And Research.
11.18TERMINAL QUESTIONS
Q1. Discuss the concept of measurement.
Q2.Illustrate the various types of measuring scales.
Q3. Explain the construction of Likert scale for measuring the consumption pattern of
cornflakes.
Q4. Explain the aspect of a good measurement.
Q5. What is cumulative scale? Identify the steps in construction of the scale.

MS 110 Research Methodology Uttarakhand Open University
Unit 12 Sampling and Sampling Distributions Page 211 of 434
UNIT 12 SAMPLING AND SAMPLING
DISTRIBUTION
12.1 Introduction
12.2 Objectives
12.3 Fundamental aspect of Sampling
12.4 Ideal Methods for Executing the Sampling
12.5 Fundamental Meaning of Sampling Distribution
12.6 Sampling Distribution of a Statistic
12.7 Relevance of Associated Laws in Sampling Distribution
12.8 Definition of Sampling Unit
12.9 Qualities of a Good Unit
12.10 Qualities of a Usable Source List
12.11 Characteristics of a Good Sample Design
12.12 Types of Sampling Techniques
12.13 Summary
12.14 Glossary
12.15 Answer to Check Your Progress
12.16 References
12.17 Suggested Readings
12.18 Terminal & Model Questions
12.1 INTRODUCTION
By making the comprehensive study of this unit learners shall be able to know about sampling
types and errors. Further they may be able to understand about error is biased or unbiased.
That error is relative or absolute in nature. How any error can occur through manipulation? In
order to minimize the error and better inferences what should be the sample size? All these
aspects are discussed in this unit briefly.

MS 110 Research Methodology Uttarakhand Open University
Unit 12 Sampling and Sampling Distributions Page 212 of 434
12.2 OBJECTIVES
After reading this unit students would be able:
To understand the fundamental aspect of sampling
To enhance the understanding of sampling and sampling distribution
To know about the probability and non- probability sampling designs
To know about the good characteristics of the sampling design
12.3 FUNDAMENTAL ASPECT OF SAMPLING
Before you make a detailed study the all aspects of sampling, you should understand
some basic concepts related to them, which are as follows:
Universe or Study population: In statistics, universe or study population means an
aggregate of items about which you obtain information. A universe or study
population means the entire field under investigation about which knowledge is
sought. For example, if you want to collect information about the average monthly
expenditure of all the 2,000 students of a college, then the entire kinds (i) Finite and
(ii) Infinite. In a finite population, number of items is definite such as, number of
students or teachers in a college. On the other hand, an infinite population has infinite
number of items e.g., number of stars in the sky, number of water drops in an ocean,
number of leaves on a tree or number of hairs on the head.
Sample: A small part of population is called sample. In other words, selected or
sorted units from a population are known as sample. In fact, a sample is that part of
the population which you select for the purpose of investigation. For example, if an
investigator selects 200 students from 2000 students of a college who represent all of
them, then these 200 students will be termed as a sample. Thus, sample means some
units selected out of a population which represent it.
12.4 IDEAL METHODS FOR EXECUTING THE SAMPLING
There are two statistical methods to execute for sampling. An effort has been made to
describe them along with their merits and demerits. A detailed discussion is given
below:
12.4.1CENSUS METHOD
Census method is that method in which information or data is collected from each and
every unit of the population relating to the problem under investigation and

MS 110 Research Methodology Uttarakhand Open University
Unit 12 Sampling and Sampling Distributions Page 213 of 434
conclusions are drawn on their basis. This method is also called as Complete
Enumeration Method. For example, some information (like Monthly Expenditure,
Average Height, Average Weight, etc.) is to be collected regarding 2000 students of a
college. For that purpose, if you collect data by inquiring each and every student of
the college then this method will be called as census method. In this example, the
whole college i.e., all 2000 students will be considered as a population and every
student as an individual will be called the unit of the population. Population in India is
conducted after every ten years by using census method.
Merits of Census Method
(i) Reliable and Accurate Data: Data obtained by census method have more
reliability and accuracy because in this method data are collected by
contacting each and every unit of the universe.
(ii) Extensive Information: This method gives detailed information about each
unit of the universe. For example, Indian population census does not only
provide the knowledge about the number of persons but also information
about their age, occupation, income, education, marital status, etc.
(iii) Suitability: This method is more suitable for the population with limited
scope and diverse characteristics. Use of this method is also appropriate where
intensive study is desired.
Demerits of Census Method
(i) More Expensive: Census method is an expensive one. More money is needed
for it as information is collected from each unit of the population. This is why
this method is used by Government mostly for very important issues like
Census, etc.
(ii) Time consuming: This method involves much time for data collection
because data are collected from each and every unit of the population. This
results in delay in making statistical inferences.
(iii) More Labour: This method of data collection also involves very much
labour. For this the enumerators in a large number are required.
(iv) Not Suitable for Specific Problems: This method is not suitable relating to
certain specific problem and infinite population. For example, if the
population is infinite or items of the population are perishable or very complex
in nature, then the census method is not suitable.
12.4.4 SAMPLING METHOD
Sampling method is that method in which data is collected from the sample of items
selected from population and conclusions are drawn from them. For example, if a
study is to be made regarding monthly expenditure of 2000 students of a college, then
instead of collecting information from each students of the college, if you collect
information by selecting some students like 100, then this will be called Sampling
Method. On the basis of sampling method, it is possible to study the monthly

MS 110 Research Methodology Uttarakhand Open University
Unit 12 Sampling and Sampling Distributions Page 214 of 434
expenditure of all the students of the college. Sampling method has three main stages
(i) to select a sample (ii) to collect information from it and (iii) to make inferences
regarding the population.
Merits of Sampling Method
(i) Less Expensive: Sampling method is less expensive. It saves money and
labour because only a few units of the population are studied.
(ii) Time Saving: In sampling method, data can be collected more quickly as
these are obtained from some items of the universe. Thus much time is saved.
(iii) Intensive Study: As numbers of items are less in sampling method, they can
be intensively studied.
(iv) Organizational Convenience: In this method, research work can be
organized and executed more conveniently. More skilled and competent
investigators can be appointed.
(v) More Reliable Results: If sample is selected in such a manner as it represents
totally the universe, then the results derived from it will be more accurate and
reliable.
(vi) More Scientific: Sampling method is more scientific because data can be
inquired with other samples.
(vii) Only Method: In some fields where inquiry by census method is impossible,
then in such situation sampling method alone is more appropriate. If the
population is infinite or too widespread or of perishable nature, then only
sampling method is used in such cases.
Demerits of Sampling Method
(i) Less Accurate: Sampling method has less accuracy because rather than
making inquiry about each unit of the universe, partial inquiry relating to some
selected units only is made.
(ii) Wrong Conclusions: If method of selecting a sample is not unbiased or
proper caution has not been taken, then results are definitely misleading.
(iii) Less Reliable: Compared to census method, there is more likelihood of the
bias of the investigator, which makes the results less reliable.
(iv) Need of Specified Knowledge: This is a complex method as specialized
knowledge is required to select a sample.
(v) Lack of Suitability: The sampling method is not suitable in case of
heterogeneity among the units of a population.
12.4.3DIFFERENCE BETWEEN CENSUS AND SAMPLE METHOD
The main differences between the census method and the sampling method are as
follows:
(i) Scope: In census method, all items relating to a universe are investigated
whereas in sampling method only a few items are inquired.

MS 110 Research Methodology Uttarakhand Open University
Unit 12 Sampling and Sampling Distributions Page 215 of 434
(ii) Cost: Census method is expensive from the point of view of time, money and
labour whereas sampling method economizes on them.
(iii) Field of Investigation: Census method issued in investigation with limited
field whereas sampling method is used for investigations with large field.
(iv) Homogeneity: Census method is useful where units of the population are
heterogeneous whereas sampling method proves more useful where population
units are homogenous.
(v) Type of Universe: In such fields where study of each and every unit of the
universe is necessary, census method is more appropriate. On the contrary,
when population is infinite or vast or liable to be destroyed as a result of
complete enumeration, then sampling method is considered to be more
appropriate.
12.5 FUNDAMENTAL MEANING OF SAMPLING
DISTRIBUTION
To enhance the clarity an effort has been made to explain the fundamental meaning
of sampling distribution. It can be meaningful by knowing the following terms:
Sampling Distribution: The purpose of selecting and studying a sample from the
population is to estimate or make inference about some population characteristics. In
this process, the knowledge of the sampling distribution is of vital importance.
Parameter (s): Any statistical measures computed from the population data is known
as parameter. Thus, population mean, population standard deviation, population
variance, population proportion, etc., are all parameters; parameters are denoted by
the Greek letter such as µ, σ, σ2 and P, respectively.
Statistic (s): Any statistical measure computed from sample data is known as statistic.
Thus, sample mean, sample standard deviation, sample variance, sample proportion,
etc., are all statistics; statistics are denoted by Roman letters such as , s, s2 and p,
respectively.
Sampling with and without replacement: Sample is a procedure of selecting a
sample from the population. Sampling may be done with or without replacement.
Sampling where each unit of a population may be chosen more than once is called
sampling with replacement. If each unit cannot be chosen more than once, it is called
sampling without replacement. In case of sampling with replacement, the total
number of possible samples each of size n drawn from a population of size N is Nn.
but if the sampling is without replacement, the total number of possible samples will
be NCn = m (say).

MS 110 Research Methodology Uttarakhand Open University
Unit 12 Sampling and Sampling Distributions Page 216 of 434
or in the study population is called the sampling frame. If all elements in a sampling
population cannot be individually identified, you cannot have a sampling frame for
that study population.
Your findings based on the information obtained from your respondents (sample) are
called sample statistics. Examples of this information are the average age of students
(calculated from the information obtained from those students who responded to your
question on age); the average income of a family (calculated from the relevant
information obtained from those families who participated in your study); and the
expected outcome (predicted on the basis of the information obtained from the who
expressed their intention in voting). Your sample statistics become the basis of
estimating the prevalence of the above characteristics in the study population.
Your main aim is to find answers to your research questions in the study population,
not in the sample you collected information from. In the examples we have been
talking about, our aims are to find out the average age of students in a class, the
average income of family living in a city and the expected outcome of the election
respectively From sample statistics we make an estimate of the answers to our
research questions in the study population. The estimates arrived at from sample
statistics are called population parameters or the population mean.
As mentioned_ earlier, _in qualitative research, when you reach a stage where no new
information is coming from your respondents, this is called saturation point.
12.6 SAMPLING DISTRIBUTION OF A STATISTIC
Sampling distribution constitutes the theoretical basis of statistical inference and is of
considerable importance in business decision making. Sampling distribution of a statistic is
the frequency distribution which is formed with various values of a statistic computed from
different samples of the same size drawn from the same population. Suppose you draw all
possible samples of size n from the population (N) with or without replacement. For each
possible sample drawn from the population, you compute a statistic such as mean, median,
standard deviation, variance, etc. The set of all possible values of a statistic is then classified
and grouped into a frequency distribution (or probability distribution). The distribution so
obtained is called the sampling distribution of a statistic. You could have various sampling
distributions depending upon the nature of the statistic you have computed, e.g., if the
particular statistic computed is the sample mean then the distribution is called sampling
distribution of mean. If you compute variance of each sample then it is called the sampling
distribution of variance. Similarly, you could have sampling distributions of proportion,
median, standard deviation, etc.
An important property of the sampling distribution of a statistic is that if random samples of
large size (n>30) are taken from a population which may be normally distributed or not, then
the sampling distribution of the statistic will approach to normal distribution.
MS 110 Research Methodology Uttarakhand Open University
Unit 12 Sampling and Sampling Distributions Page 217 of 434
12.6.1 FACTORS AFFECTING THE INFERENCES DRAWN FROM A
SAMPLE
The above principles suggest that two factors may influence the degree of certainty about the
inferences drawn from a sample:
1. The size of the sample – Findings based upon larger samples have more certainty than
those based on smaller ones. As a rule, the larger the sample size, the more accurate the
findings will be.
2. The extent of variation in the sampling population – The greater the variation in the study
population with respect to the characteristics under study, for a given sample size, the greater
the uncertainty. (If a population is homogeneous (uniform or similar) with respect to the
characteristics under study, a small sample can provide a reasonably good estimate, but if it is
heterogeneous (dissimilar or diversified), you need to select a larger sample to obtain the
same level of accuracy. Of course, if all the elements in a population are identical, then the
selection of even one will provide an absolutely accurate estimate. As a rule, the higher the
variation with respect to the characteristics under study in the study population, the greater
the uncertainty for a given sample size
12.7 RELEVANCE OF ASSOCIATED LAWS IN SAMPLING
DISTRIBUTION
Law of Large Numbers and the Central Limit Theorem both serve the basis for the
development of sampling distribution of a statistic.
Law of Large Numbers: The law of large numbers states that as the sample size increases,
the sample mean would be closer and closer to the population mean. It does not guarantee
that if the sample size is increased sufficiently, the sample mean will be equal to the
population mean. There are two implications of the law of large numbers (i) the difference
between sample mean and population mean can be reduced by increasing the sample size,
and (ii) variation from one sample mean to another sample mean (of the same size) also
decreases as the size of the sample increases.
Central Limit Theorem: It is widely used in the field of estimation and inference. This
theorem states that if you select random sample of large size n from any population with
mean μ and standard deviation σ and compute the mean of each sample, then the sampling
distribution of mean approaches normal distribution with mean μ and standard deviation
. This is true even if the population itself is not normal. The utility of this theorem is that it
requires virtually no conditions on the distribution pattern of the population.

MS 110 Research Methodology Uttarakhand Open University
Unit 12 Sampling and Sampling Distributions Page 218 of 434
12.8 DEFINITION OF SAMPLING UNIT
Before drawing a sample, we have to decide the unit of sample. What shall we select- a
house, a family, an individual or a group. According to Parten, "Surveyors have fallen into
the error of thinking that as long as they are dealing with human population, the individual
persons are the sampling unit. Actually, however, relatively few studies have used people as
sampling units.
Following are the main types of sampling units:
(a) Geographical units- e.g. a state, district, city, ward, region or locality.
(b) Structural units- e.g. a house, a flat etc.
(c) Social group units-e.g. a family, a school, a club, a church.
(d) Individuals
The house or a residential dwelling is generally considered as the best unit in the sense that it
can be easily located.
12.9 QUALITIES OF A GOOD UNIT
Following are the main qualities of a good sampling unit:
i. The unit should be clear, unambiguous and definite. It should be capable of being
objectively ascertained and easily located. Thus, for example, an honest man is not a
fit unit as it is difficult to be ascertained.
ii. The unit of sample should be suitable for the problem under study. Thus, in study of
the influence of joint family system, family will be the most suitable unit.
iii. The unit selected should be standardized if possible. If an entirely new unit has been
used, its meaning and significance should be explained clearly.
iv. The unit should be easily ascertainable. Thus, if an individual is to be selected as unit
is difficult to find the names of all the individuals concerned and even if they are
known it is very difficult to find them unless their names are accompanied with their
addresses.
Source List
The list which contains the names of the units of universe from which the sample is to be
selected is technically known as source list. A source list may be already in existence or it
may have to be prepared. For example, names of all the house owners, car owners, telephone
owners etc. can be seen from the list maintained by respective departments but the list of
tenants occupying particular area of houses has to be prepared. Sometimes the list may be
available in parts and may have to be consolidated. At other times the list may be exhaustive
and relevant universe may have to be sorted out.

MS 110 Research Methodology Uttarakhand Open University
Unit 12 Sampling and Sampling Distributions Page 219 of 434
12.10 QUALITIES OF A USABLE SOURCE LIST
The following points are worth nothing before using the source list:
a) The list should be exhaustive. The entire universe to be studied must be contained in
the source list.
b) The list should be up to date and valid. It should not contain dead names and must
include the latest additions.
c) The list should contain the full information about the units that the sample may be
drawn on stratified basis. It should contain the addresses also so that it may be
possible to contact the units selected.
d) The names should not be repeated in the list. For example, if any family has been
selected as unit, the list containing individual’s names for house members would be of
no value.
e) The source list should be suitable for the unit of study. For example, if any family has
been selected as unit, the list containing individual’s names for house members would
be of no value.
f) Source list must be reliable. It must be maintained by an authority that can be relied
upon.
g) Source list must be within reach of the researcher. Thus, for example, the government
may maintain a list of history shelters but it may not be open to the researcher to be
consulted by him. Similarly, a bank, although, maintaining a list of depositors may
refuse to reply if to the researcher. Such lists are to be deemed as practically
nonexistent except when a survey is to be conducted by the same department or under
the authority of government.
12.11CHARACTERISTICS OF A GOOD SAMPLE DESIGN
Kish mentioned that a good sample design requires the judicious goal orientation,
measurability, practicality and economy.
a) Goal orientation
This suggests that a sample design should be oriented to the research objective,
tailored to the survey design, and fit to survey conditions, if this is the measurement
as also the procedure of choosing a sample.
b) Measurability
A sample design should enable the computation of valid estimates of its sampling
variability.
c) Variability
Normally, this variability is expressed in the form of standard errors in survey, as
envisage earlier. It is necessity that the complete, correct, practical and clear

MS 110 Research Methodology Uttarakhand Open University
Unit 12 Sampling and Sampling Distributions Page 220 of 434
instruction should be given to the interviewer so that no mistakes are made in the
selection of sampling units and final selection in the field selection in the field is not
different from the original sample design. Practically also refers to simplicity of the
design, i.e. it should be capable of being understood and following in actual operation
of the field work.
d) Economy
Survey objectives are generally spelt out in term of precision i.e. the survey estimate.
For a given degree of precision sample design should be given the minimum cost.
Alternatively, for a given per unit cost, the sample design should achieve maximum
precision (minimum variance) it may be pointed out that these for criteria come into
conflict with each other in most of the cases, and the researcher should carefully
balance the conflicting criteria so that he is able to select a really good sample design.
As there is no unique methods or procedure by which one can select a good sample
one has to weigh the pros and cons, the strong and weak points of various sample
design in respect of these four criteria, before selecting the best possible one.
12.12 TYPES OF SAMPLING TECHNIQUES
The method of selecting a sample out of a given population is called sampling. In other
words, sampling denotes the selection of a part of the aggregate statistical material with a
view of obtaining information about the whole. Now a day, there are various methods of
selecting sample from a population in accordance with various needs.
There are various types of sampling methods suitable for various situations. Some important
types are given below:
Probability/ Random Sampling Methods:
1. Simple Random Sampling
2. Stratified Random Sampling
Techniques of Sampling
Probability Sampling
Non Probability Sampling
MS 110 Research Methodology Uttarakhand Open University
Unit 12 Sampling and Sampling Distributions Page 221 of 434
3. Systematic Random Sampling.
4. Multistage Random Sampling
5. Cluster Sampling
Non-Probability/ Non- Random Sampling Methods:
1. Judgment Sampling / Purposive Sampling
2. Quota Sampling
3. Convenience Sampling
4. Extensive Sampling
12.12.1PROBABILITY SAMPLE METHODS
There are various variants of probability sampling methods, which are given below:
1) Simple Random Sampling
According to Parten," Random sampling is the form applied when the method of selection
assures each individual or element in universe an equal chance of being chosen. "Random
sampling is not the same as chance selection. Thus, entire sampling process is conducted in a
single stage, with each subject selected independently of the other population members.
Which item will include in the sample and which not, such decision is not made by an
investigator on his/her will but selection of the units is left on chance. According to random
sampling, there are two methods of selecting a random sample:
Method of selecting random sampling are Lottery Method, Selecting from sequential list-
every 10th, Grid System-map of entire area screen with sequence is projected, use of random
number tables-telephone number etc. computer can generate. The most adopted and basic
method in this type of sampling is lottery method.
(a) Lottery Method: In this method, each unit of the population is named or numbered
which is marked on separate piece of paper. Such chits are folded and put into some urn or
bag. Thereafter as many chits are made selected by some person as many units are to be
included in a sample.
(b) Tables of Random Numbers: Some experts have constructed random number tables.
These tables help in selection of a sample. Of all such various tables, Tippett’s Tables are
most famous and are in use. Tippett has constructed a four-digit table of 10,400 numbers by
using numbers as many as 41,600. In this method, first of all, all the items of a population are
written serially. Thereafter by making use of Tippett’s tables, in accordance with the size of
the sample, numbers are selected. The selection of a sample with the help of Tippett’s table
can be made clear by an example:
An Extract of Tippett’s Table
2952 6641 3992 9792 7979 5911
3170 5224 4167 9525 1545 1396

MS 110 Research Methodology Uttarakhand Open University
Unit 12 Sampling and Sampling Distributions Page 222 of 434
7203 4356 1300 2693 2370 7483
3408 2762 3563 6107 6913 7691
0560 5246 1112 9025 6008 8127
For example, suppose 12 units are to be chosen out of 5000 units. With Tippett’s table, to
decide such units, firstly 5000 units will be serially ordered from 1 to 5000 and then from
Tippett’s table, 12 numbers will be chosen from the beginning which will be less than 5000.
These 12 numbers are follows:
2952 4167 4356 2370
3992 1545 1300 3408
3170 1396 2693 2762
The items of such serial numbers will be included in the sample. If units of the population are
less than 100, then 4 digit random numbers will be made compact into two digit numbers, and
then such two digit numbers will be selected. Like as to select 6 units out of 60 units, the
units with serial numbers 29, 39, 31, 41, 15 and 13 will be included in the sample.
Merits
(i) There is no possibility of personal prejudice in this method. In other words,
this method is free from personal bias.
(ii) Under this method, every units of the universe gets the equal chance of being
selected.
(iii) The use of this method saves time, money and labour.
Demerits
(i) If sample size is small, then sample is not adequately represented.
(ii) If universe is very small, then this method is not suitable.
(iii) If some items of the universe are so important that their inclusion in the
sample is very essential, then this method will not be appropriate.
(iv) This method will not be appropriate when population has units with diverse
characteristics.
2) Stratified Random Sampling
This method is used when units of the universe are heterogeneous rather than homogeneous.
Under this method, this method makes an attempt to divide the whole study population into
different groups say them strata. Every group or strata must have the homogeneity once the
homogeneity is ensured then by making use of any method of simple random sampling
required sample would be selected. For example, if 150 students are to be selected out of

MS 110 Research Methodology Uttarakhand Open University
Unit 12 Sampling and Sampling Distributions Page 223 of 434
1500 students of a college, then firstly the college students will be divided into three groups
on the basis of Arts, Commerce and Science. Suppose there are 500, 700, 300 students
respectively in three faculties and 10 per cent sample is to be taken, then on the basis of
random sampling 50, 70 and 30 students, respectively will be selected by using random
sampling. Thus, this method assumes equal representation to each class or group and all the
units of the universe get equal chance of being selected in the sample.
Merits
(i) There is more likelihood of representation of units in this method.
(ii) Comparative study on the basis of facts at different strata is possible under this
method.
(iii) This method has more accuracy.
Demerits
(i) This method has limited scope because this method can be adopted only when
the population and its different strata are known.
(ii) There can be the possibility of prejudice if the population is not properly
stratified.
(iii) If the population is too small in size, it is difficult to stratify it.
Process of Stratifying The success of stratified sampling depends upon formation of
strata of groups. If a correct stratification has been made, even a smaller number of units will
form a representative sample. Following points may be kept in mind while constructing
strata.
(i) First of all we should note the different variables involved in the study of the
problem. The common variables used for stratification are generally region, income,
tax, the universe is first divided into these groups and then the required units are
selected at random from each group. In selection the variables care should be taken to
see that they are related to study.
(ii) Stratification should be so conducted that there should be perfect homogeneity in
the different units of strata. The items in one stratum should be similar to reach other
but they should differ significantly from the units of other strata.
(iii) The strata should be clear cut and free from overlapping so that every unit find a
place in some stratum or other and no unit should be placed in more than one stratum.
The total number of units in different strata should be equal to total number of units in
universe.

MS 110 Research Methodology Uttarakhand Open University
Unit 12 Sampling and Sampling Distributions Page 224 of 434
Kinds of Stratified Sampling- Stratified sampling itself are of the following three
types.
i. Proportional stratified sample
In this method the number of units to be drawn from each stratum is in the same
proportion as they stand in the universe. It has already been explained above.
ii. Disproportional stratified sample
According to this method an equal number of cases are taken. Numbers of cases
are taken from each stratum regardless of the size of strata in proportion to
universe. It is also known as controlled sampling because it permits inter-strata
comparison.
iii. Stratified weight sample
The method aims at removing the defects of disproportionate sample and
combine the advantage of the two stratified sample stated earlier.
Select the quota from the stratum according to their will. To take an example
suppose a sample of 500 families is to be selected first and the field workers will
be asked to select one family from each house at their will.
Merits
(i) There is more likelihood of representation of units in this method.
(ii) Comparative study on the basis of facts at different strata is possible under this
method.
(iii) This method has more accuracy.
Demerits
(i) This method has limited scope because this method can be adopted only when
the population and its different strata are known.
(ii) There can be the possibility of prejudice if the population is not properly
stratified.
(iii) If the population is too small in size, it is difficult to stratify it.
3) Systematic Random Sampling
Systematic sampling is a variation of random sampling. It requires the universe or a list of its
unit may be ordered in such a way that each elements of the universe can be uniquely
identified by its order. A voter list, a telephone directory, a card index system would
generally satisfy this condition. In this method, all the items of the universe are systematically
arranged and numbered and then sample units are selected at equal intervals. For example, if
5 out of 50 students are to be selected for a sample, then 50 students would be numbered and
systematically arranged. One item of the first 10 would be selected at random. Subsequently,
every 10th
item from the selected number will be selected to frame a sample. If the first
selected number is 5th
item, then the subsequent numbers would be 15th
, 25th
, 35th
and 45
th.
MS 110 Research Methodology Uttarakhand Open University
Unit 12 Sampling and Sampling Distributions Page 225 of 434
Merits
(i) It is a simple method. Samples can be easily obtained by it.
(ii) This method involves very little time in sample selection and results are
almost accurate.
Demerits
(i) In this method, each unit does not stand the equal chances of being selected
because only the first unit is selected on random sampling basis.
(ii) If all the units are different in characteristics, then results will not be
appropriate.
4) Multistage Sampling
When sampling procedure passes through many stages, then it is known as multi-stage
sampling. In this method, firstly the entire universe or population is divided into stages or
sub-stages. At each stage some units are selected on random sampling basis. Thereafter these
units are sub-divided and on the basis of random sampling again some sub-units are selected.
Thus, this goes on with sub-division further and selection on. For example, for the purpose of
a study regarding Adult Education in a State, first some districts will be selected on random
basis. Thereafter out of the selected districts, some tehsils and out of tehsils, some wards and
out of the wards, some households will be selected from whom the inquiry will be made
concerning the problem at hand.
This method is generally used in selecting a sample from a very large area. Under this
method the selection of the sample is made in different stages. For example, the following
procedures would be adopted to select a sample of few hundred houses from large city.
i. Divide the whole city into homogeneous regions. Care should be taken to see that
each region is approximately equal in size and there is similarity among the
people of one region at least regarding the aspect that is being studied.
ii. Select two primary sample areas from each region on random sampling method.
iii. Select one block cluster (group of houses) from each primary sample area.
iv. Select some houses from each block cluster on random sampling basis.
Thus, we see that the selection of final sample units is made in a number of stages. The
method is thus a combination of random sampling and stratified sampling, and if conducted
judiciously it possesses the advantage of both the types. Greatest representation can be
achieved in shortest possible numbers and representation of every area is secured.
Merits
(i) This is the best method of studying a universe or population on regional basis.
(ii) This method is suitable for those problems where decisions on the basis of
sample alone can’t be taken.
MS 110 Research Methodology Uttarakhand Open University
Unit 12 Sampling and Sampling Distributions Page 226 of 434
Demerits
(i) This method requires many tests to correctly estimate the level of accuracy
which involves a lot of time and labour.
(ii) In this method, level of estimated accuracy level is pre-decided which does not
seem logical.
5) Cluster Sampling: In this method, simply the universe is divided into many groups
called cluster and out of which a few clusters are selected on random basis and then the
clusters are complete enumerated. This method is usually applied in industries, e.g., in
pharmaceutical industry, a machine produces medicines tablets in the batches of hundred
each, then for quality inspection, a few randomly selected batches are examined.
12.12.2 NON-PROBABILITY SAMPLING METHODS
Non-probability sampling methods are those methods in which selection of units is made on
the basis of convenience or judgment of the investigator rather than on the basis of
probability or chance. In such methods, selection of units is made in accordance with the
specific objectives and convenience of the investigator.
1) Purposive Sampling
Purposive sampling, also known as judgmental, selective, or subjective sampling, is a form of
non-probability sampling in which researchers rely on their own judgement when choosing
members of the population to participate in their study.
Purposive sampling mostly used in those circumstances where limited resources are available
to the researcher and the universe or the study population is not defined properly. For
example if the researcher wants to know about buying habits of the students in the different
departments of the Kumaun University. Suppose there are more than 5000 students in the
different departments of the University. Due to constraints it would not be suitable and
feasible to make each and every student of the University. By own judgement of the
researcher 500 students can be selected as a sample which can represent the entire universe.
Merits
(i) This method is less expensive.
(ii) This method is very simple and easy.
(iii) This method is useful in those fields where almost similar units exist or some
units are too important to be left out of the sample.
Demerits
(i) There is greater chance of the investigator’s own prejudice in this method.
(ii) This method is not very accurate and reliable.

MS 110 Research Methodology Uttarakhand Open University
Unit 12 Sampling and Sampling Distributions Page 227 of 434
2) Convenience Sampling
It is generally called as unsystematic, careless, accidental or opportunistic sample. According
to this system, a sample is selected according to convenience of the sampler. This
convenience may be in respect of availability of source list, accessibility of the units etc.
Although the method is most unscientific, yet quite a large number of samples are selected
according to this method. A convenience sample may be used in any or more of the following
cases:
i. When the universe is not clearly defined.
ii. A complete source list is not available.
iii. Sampling unit is not clear.
Thus the selection of names from telephone directory, contacting anyone who may chance to
be easily available will come under this type of sampling. In this type of non-probability
sampling, the choice of the sample is left completely to the convenience of the investigator.
The investigator obtains a sample according of the list of the teachers from the college
prospectus and gets feedback from them regarding his/her publication. This method is less
expensive and simple but, is unscientific and unreliable. This method results in more
dependence on the enumerators. This method is appropriate for sample selection where the
universe or population is not clearly defined or list of the units is not available or sample
units are not clear in themselves.
3) Quota Sampling
In this method, the investigators are assigned definite quotas according to some criteria.
They are instructed to obtain the required number to fill in each quota. The investigators
select the individuals (i.e., sample items) to collect information on their personal judgements
within the quotas. When all or a part of the whole quota is not available or approachable, the
quota is completed by supplementing new respondents. Quota sampling is a type of
judgement sampling.
Merits
(i) In this method, there is greater chance of important units being included.
(ii) Statistical inquiry is more organized in this method on account of the units of
the quotas being fixed.
Demerits
(i) Possibility of prejudice shall remain.
(ii) There is greater likelihood of sampling error in this method.

MS 110 Research Methodology Uttarakhand Open University
Unit 12 Sampling and Sampling Distributions Page 228 of 434
4) Extensive Sampling
In this method, sample size is taken almost as big as the population itself e.g., 90 per
cent of the population. Only those units are left out for which data collection is very
difficult or almost impossible. Due to very large sample size, the method has greater
level of accuracy. Intensive study of the problem becomes possible but this method
involves heavy resources at disposal.
Check Your Progress-A
Choose the correct aleternative.
1) Quota sampling, judgment sampling and convenience sampling are classified as
types of;
a) Random sampling
b) Non random sampling
c) Direct sampling
d) Indirect sampling
2) Cluster sampling, stratified sampling and systematic sampling are types of;
a) Direct sampling
b) Indirect sampling
c) Random sampling
d) Non random sampling
3) Type of sampling In which each element of population has equally likely chance
of occurrence in a random sample is classified as;
a) Regular and irregular sampling
b) Error free sampling
c) Inertia sampling
d) Simple random sampling
Summary of Sampling Technique
Type of Sampling Brief description Merits Demerits
Random sampling Assign to each
population member a
unique member
1. Required
minimum knowledge
of population and
1. Does not make use
of knowledge of
population which the

MS 110 Research Methodology Uttarakhand Open University
Unit 12 Sampling and Sampling Distributions Page 229 of 434
select sample items
by use.
advance.
2. Free of possible
classification errors.
3. Easy to analyze
data and compute
error.
researcher may have.
2. Larger errors for
sample than in
stratified sampling.
(i) Stratified
proportionate
sampling
Select from every
sampling unit at
other than the last
stage a random
sample proportionate
to size sampling unit.
1. Assures
representative with
respect to property
which forms basis of
classify unit,
therefore yields less
variability than
simple random
sampling and
multistage random
sampling.
2. Decreases chance
of failing to include
members of
population because
of classification
process.
3. Characteristics of
each stratum can be
easily estimated and
thus comparison can
be made.
1. It requires accurate
information on
proportion in each
stratum, otherwise
increase error.
2. if information for
satisfaction is not
available, then it may
be costly to prepare
the list, possibility of
defective
classification and
hence increase in
variability.
(ii) Stratified
optimum allocation
Same as in stratified
proportionate
sampling except
Less variability for
same size than
proportionate
Requires knowledge
of variability of
pertinent
Cluster sampling Select sampling units
be some form of
1. If clusters are
geographically
1. Larger errors for
comparable size then

MS 110 Research Methodology Uttarakhand Open University
Unit 12 Sampling and Sampling Distributions Page 230 of 434
random sampling;
ultimate units are
grouped; select these
at random and take a
complete count of
each
defined, yields lowest
field costs.
2. Required listing
only individuals in
selected clusters.
3. Characteristics of
clusters as well as
those of population
can be estimated.
4. It can be used for
subsequent sample,
since cluster are
selected not
individuals and
substitutions of
individuals may be
permissible.
other probability
sample, and
2. Required ability to
assign each members
of population
uniquely to a cluster,
inability to do so
may result in
duplication or
omission of
individuals.
Stratified cluster
sampling
Select clusters at
random from every
sampling unit
Reduce variability of
plain cluster
sampling
1. Demerits of
stratified sampling
added to those of
cluster sampling.
2. Since cluster
properties may
change, advantage of
stratification may be
reduced and make
sample unusable for
later research.
Judgement Select a subgroup of
the population which
on the basis of
available information
can be judge to be
representative of the
total population, take
a complete count or
sub-sample of this
group.
Reduce cost of
preparing sample and
field work, since
ultimate units can be
selected so that they
are close together.
1. Variability bias of
estimates cannot be
measured or
controlled and
2. Requires strong
assumptions or
considerable
knowledge of
population and
subgroup selected
MS 110 Research Methodology Uttarakhand Open University
Unit 12 Sampling and Sampling Distributions Page 231 of 434
12.13 SUMMARY
In this unit an attempt has been made with regard to sampling types and error. A brief
discussion is made for sampling and non-sampling errors. Further errors are categorized in
absolute and relative and biased and unbiased kinds of errors are also discussed. Higher the
sample size better inferences can be drawn. Formula for calculation of sample size is also
discussed. In next unit students will get an opportunity to understand data analysis and
interpretation.
12.14 GLOSSARY
Systematic sampling: It requires the universe or a list of its unit may be ordered in such a
way that each elements of the universe can be uniquely identified by its order.
Proportional Stratified Sample: In this method the number of units to be drawn from each
stratum is in the same proportion as they stand in the universe.
Convenience Sampling: It is generally called as unsystematic, careless,
accidental or opportunistic sample. According to this system, a sample is
selected according to convenience of the sampler.
12.15 KEY TO CHECK YOUR PROGRESS
Check your Progress-A
1) (b)
2) (c)
3) (a)
12.16 REFERENCES
Neogi U. K “Research Methodology Tools and Techniques” Variety Book
Publication.
Kumar Ranjeet “Research Methodology” Pearson Education.
Young V. Pauline, “Scientific Social Surveys and Research”.

MS 110 Research Methodology Uttarakhand Open University
Unit 12 Sampling and Sampling Distributions Page 232 of 434
Gopal, M.H. “An Introduction to Research Procedure in Social Sciences”.
Michacl, V. P. “Research Methods in Management’. Himalaya Publishing
House.
Kothari C.R. “Research Methodology” Vikas Publication.
Gode and Hatt. “Methods in Social Research”. Tata Mc Graw Hill, New Delhi.
BMS.co.in Characteristics of a Good Sample Design-BMS/ Bachelor of
Management Studies available at bms.co.in/ characteristics-of –a good-sample-
design accessed on 18 March, 2019.
Sampling Techniques MCQs Quiz online, Sampling Techniques-Quiz Questions
Answers-Business Statistics MCQs available at mcqslearn.com/ business-
statistics/ sampling-technique. php accessed on18 March, 2019.
Full text of “Ranjit Kumar Research Methodology A Step by Step G” available
at archive.org/ stream/ Ranjit_Kumar-Research_Methodology-A_Step-by-
Step_G_djvu.txt.
12.17 SUGGESTED READINGS
1. Cooper and Schiendlers : Business Research Methods, TMH
2. C R Kothari : Research Methodology, (New Age)
3. Kumar Ranjeet: Research Methodology, Pearson Education.
4. Young V. Pauline:Scientific Social Surveys and Research.
12.18 TERMINAL QUESTIONS
Q1. What are the various types of sampling design?
Q2. Write about following
1. Random Sampling
2. Purposive Selection
3. Stratified Sampling
4. Quota Sampling
Q3. What are the advantages of a good sample design?
Q4. Distinguish between census and sampling method.
Q5. Give a brief note on sampling and sampling distribution.
Q6. How many types of laws can be studied under sampling distribution?

MS 110 Research Methodology Uttarakhand Open University
Unit 13 Sampling Types and Errors Page 233 of 434
UNIT 13 SAMPLING TYPES AND ERRORS
13.1 Introduction
13.2 Objectives
13.3 Editing Errors
13.4 Sources of Errors
13.5 Measurement of Errors
13.6 Kinds of Errors
13.7 Standard Error of Statistic
13.8 The Calculation of Sample size
13.9 Sampling Distribution of Means
13.10 Sampling and Non-sampling Errors
13.11 Illustration for Population Mean, Population Variance and Standard Error
13.12 Summary
13.13 Glossary
13.14 Key to Check Your Progress
13.15 Terminal questions
13.16 Suggested Readings
13.17 References
13.1 INTRODUCTION In this unit an effort has been made to provide the detailed information about sampling
errors so that the students can enhance their comprehension. An explanation is also made to
understand the different sources of the errors and different kinds of the errors. The main
emphasis of this unit is to calculate the sample size and some illustrations are also discussed.
These contents will definitely be helping the students of the research methodology.
13.2 OBJECTIVES After reading this unit students would be able:
To understand the meaning of sampling error
To inculcate the sources and types of errors
To enhance the importance of the calculation of sample size
To know the meaning of sampling and non- sampling errors

MS 110 Research Methodology Uttarakhand Open University
Unit 13 Sampling Types and Errors Page 234 of 434
13.3 EDITING ERRORS The word error is used in technical sense in statistics. It does not mean the same thing as
mistake. Mistakes in statistics mean a wrong calculation or use of inappropriate method in the
collection or analysis of data. According to L.R Connor, “an error in the statistical sense is
merely a difference between an estimate and the true value or ideal value which it may be
impossible to determine exactly”. According to Boddington, ‘the error does not imply an
arithmetic miscalculation, but arises simply because in collecting data perfect coverage is
impossible as with sampling.” Here Boddington has pointed out the sampling error or the
difference that may be possible due to sampling.
In real terms, sampling is not the only cause of the error, there are other causes; also, e.g., in
accurate reporting or use of estimates where counting is not possible. The main difference
between error and mistake is that while mistake is caused due to ignorance, negligence or
deliberate misinterpretation of data, on the other hand error is inadequacy or inaccuracy of
tools and the nature of phenomena under investigation. Thus mistakes can be avoided since
they are inherent in the nature of phenomena, unless there is an improvement in the
methodology and technique. In short, errors cannot be avoided; at best they can be estimated
and they can be kept in mind while drawing inferences.
13.4 SOURCE OF ERRORS Statistic errors arise due to large no. of factors such as:
i. Errors of origin
Errors of origin may occur because of a lack of proper definition of the subject-
matter, bias of the investigator or the inherent instability of the collected data.
ii. Errors of manipulation
Statistical errors are also caused at the time of analysis of data. These errors generally
arise due to classification, use if statistical methods, e.g. Percentages, averages etc.
Thus, unconscious errors in measuring, counting, classification etc. are known as
errors of manipulation
iii. Error of inadequacy
If may arise due to the use of incomplete or unrepresentative character of data. The
small number of the items included in the sample way not throw light on the
characteristics of the population from which it has been drawn.
13.5 MEASUREMENT OF ERRORS Statistical errors can be measured in two ways:
Absolute
Relative

MS 110 Research Methodology Uttarakhand Open University
Unit 13 Sampling Types and Errors Page 235 of 434
Absolute errors- The simple difference between the true value and the estimated value is
known as absolute error.
Absolute error=true value-estimated value
Relative errors- The relation of the absolute error to the estimated value is the relative error,
Relative error=Absolute error/Estimated value
An error may be positive or negative. It is said to be positive when the true value exceeds
estimated value and negative where the reverse is the case.
13.6 KINDS OF ERRORS The error may be of two types:
I. Biased
II. Unbiased
Biased Errors: Biased errors arise as a result some bias or prejudice or defect in the
informants, enumerators or measuring instruments. These are errors which tend, to
accumulate or pile up. Biased errors are also known as ‘systematic errors’, ‘constant errors’,
‘persistent errors’ or ‘cumulative errors’.
Unbiased errors: Unbiased errors are those which arise just on account of chance. They are
encounter balance, compensating and non-cumulative in nature. Such errors arise
automatically without any motive, e.g., during the population census some persons may be
counted twice whereas few might be left totally out of count. Such errors tend to offset each
other and have little or negligible effect on the final result. The law of statistical regularity
applies here and since errors are both positive and negative, they generally cancel each other
The main distinguishing feature between biased and unbiased errors is that while unbiased
errors are compensatory and tend to cancel out each other, the biased errors are cumulative in
nature.
Biased errors arise due to the following four reasons:
a. Bias of the sample
b. Bias of the informants
c. Bias of the schedule, and
d. Bias of the unit of measurement
13.7 STANDARD ERROR OF A STATISTIC The standard deviation of the sampling distribution of a statistic is known as the
standard error (S. E.) of a statistic. As there are various types of sampling
distributions, you could have various types of standard errors depending on the nature
of sampling distribution. The standard deviation instead of using the term standard
deviation for measuring variation, you may use a new term called standard error of

MS 110 Research Methodology Uttarakhand Open University
Unit 13 Sampling Types and Errors Page 236 of 434
mean. The standard error of mean measure the extent to which the sample mean differ
from the population mean. Thus, the basic difference between the standard deviation
and standard error of mean is that the first measures the extent to which the individual
items differ from the central value and the last measures the extent to which
individual sample mean differ from the population mean. Like the standard error of
the means, you could have standard error of the median, standard deviation,
proportion, variance, etc.
The standard error is used in a large number of problems which are discussed as
follows:
(i) Reliability of a sample: The standard error gives an idea about the reliability
and precision of a sample. That is, it indicates how much the estimated value differs
from the observed values. The greater the standard error, the greater is the deviation
between the estimated and observed values and lesser is the reliability of a sample.
The smaller the standard error, the smaller is the deviation between the estimated and
observed values and greater is the reliability of a sample.
(ii) Tests of significance: The standard error is also used to test the significance
of the various results obtained from small and large samples. In case of large sample,
if the difference between the observed and the expected value is greater than 1.96 S.E.
then you reject the hypothesis at 5% and conclude that sample differs widely from the
population. But if the difference between the observed and the expected value is
greater than 2.58 S.E. then you reject the null hypothesis at 1% and conclude that the
sample differs widely from the population.
(iii) To determine the confidence limits of the unknown population mean: The
standard error enables us in determining the confidence limits within which a
population parameter is expected to lie with a certain degree of confidence. The
confidence limits of the unknown population mean are given by.
13.8 THE CALCULATION OF SAMPLE SIZE ‘How big a sample should I select?’ ‘What should be my sample size?’ and ‘How many cases
do I need?’ These are the most common questions asked. Basically, it depends on what you
want to do with the findings and what type of relationships you want to establish. Your
purpose in undertaking research is the main determinant of the level of accuracy required in
the results, and this level of accuracy is an important determinant of sample size. However, in
qualitative research, as the main focus is to explore or describe a situation, issue, process or
MS 110 Research Methodology Uttarakhand Open University
Unit 13 Sampling Types and Errors Page 237 of 434
phenomenon, the question of sample size is less important. You usually collect data till you
think you have reached saturation point in terms of discovering new information. Once you
think you are not getting much new data from your respondents, you stop collecting further
information. Of course, the diversity or heterogeneity in what you are trying to find out about
plays an important role in how fast you will reach saturation point. And remember: the
greater the heterogeneity or diversity in what you are trying to find out about, the greater the
number of respondents you need to contact to reach saturation point. In determining the size
of your sample for quantitative studies and in particular for cause-and-effect studies, you
need to consider the following:
At what level of confidence do you want to test your results, findings or hypotheses?
With what degree of accuracy do you wish to estimate the population parameters?
What is the estimated level of variation (standard deviation), with respect to the main
variable you are studying, in the study population?
Answering these questions is necessary regardless of whether you intend to determine the
sample size yourself or have an expert do it for you. The size of the sample is important for
testing a hypothesis or establishing an association, but for other studies the general rule is: the
larger the sample size, the more accurate your estimates. In practice, your budget determines
the size of your sample. Your skills in selecting a sample, within the constraints of your
budget, lie in the way you select your elements so that they effectively and adequately
represent your sampling population.
To illustrate this procedure let us take the example of a class. Suppose you want to find out
the average age of the students within an accuracy of 0.5 of a year; that is, you can tolerate an
error of half a year on either side of the true average age. Let us also assume that you want to
find the average age within half a year of accuracy at the 95 per cent confidence level; that is,
you want to be 95 per cent confident about your findings.
The formula (from statistics) for determining the confidence limits is;
=
Where,
x= estimated value of the population mean
_
x= average age calculated from the sample
t0.05 = value of t at 95 per cent confidence level
σ/√η = standard error
σ = standard deviation
η = sample size
√ = square root
If we decide to tolerate an error of half a year, that means;

MS 110 Research Methodology Uttarakhand Open University
Unit 13 Sampling Types and Errors Page 238 of 434
=0.5
=
*t-value from the following table
Level 0.02 0.10 0.05 0.02 0.01 0.001
T-value 1.282 1.645 1.960 2.236 2.576 3.291
There is only one unknown quantity in the above equation, that is σ.
Now the main problem is to find the value of σ without having to collect data. This is the
biggest problem in estimating the sample size. Because of this it is important to know as
much as possible about the study population.
The value of σ can be found by one of the following:
1. guessing;
2. consulting an expert;
3. obtaining the value of σ from previous comparable studies; or
4. carrying out a pilot study to calculate the value.
Let us assume that σ is 1 year. Then
Therefore, =
=3.92
=n=15.37, say,16
Hence, to determine the average age of the class at a level of 95 per cent accuracy (assuming
σ = 1 year) with half a year of error, a sample of at least 16 students is necessary.
Now assume that, instead of 95 per cent, you want to be 99 per cent confident about the
estimated age, tolerating an error of half a year. Then
=
=5.15
Therefore, n=26.54, say, 27
Hence, if you want to be 99 per cent confident and are willing to tolerate an error of half a
year, you need to select a sample of 27 students. Similarly, you can calculate the sample size
with varying values of σ. Remember the golden rule: the greater is the sample size, the more
accurately your findings will reflect the ‘true’ picture.
13.9 SAMPLING DISTRIBUTION OF MEANS It is an important to note that sampling distribution is widely used in the sampling
theory. Draw all possible samples of size n with or without replacement from
population of size N with mean and variance . For each possible sample drawn
from the population, you compute the mean of each sample. The mean will vary
MS 110 Research Methodology Uttarakhand Open University
Unit 13 Sampling Types and Errors Page 239 of 434
from sample to sample. The set of all possible means obtained from different samples
are called the sampling distribution of means.
The following are the important properties of the sampling distribution of means:
(i) The mean of the sampling distribution of means is equal to the population
mean ( ).
Symbolically, or
This property can be proved as follows:
Let present a random sample (with replacement) of size n from a finite
population of size N having its mean and variance , then
Thus, the mean of the sampling distribution of means is equal to the population mean.
(ii) The standard error of the sampling distribution of means is obtained as:
This property can be proved as follows:
Where, is the population variance, is the sample size
Because, n , obviously,
Population variance.

MS 110 Research Methodology Uttarakhand Open University
Unit 13 Sampling Types and Errors Page 240 of 434
This formula holds only when sampling is with replacement.
Note: When the population is finite and the samples are drawn without replacement
then is obtained as:
(iii) The sampling distribution of means is approximately a normal distribution
with mean and variance , provided the sample is large (n>30).
(iv) The following formula is used to find the probability of the sampling
distribution of means.
Illustration 1.1: Consider a population consisting of three values: 2, 5 and 8. Draw all
possible samples of size 2 with replacement from the population. Construct sampling
distribution of means. Also find the mean and standard error of the distribution.
Solution: The population consists of three values. The total number of possible samples of
size 2 drawn with replacement are Nn=3
2=9. All possible random samples and their sample
mean are shown is the following table:
Sample
No.
Sample Values Sample Mean
1.
2.
3.
4.
5.
6.

MS 110 Research Methodology Uttarakhand Open University
Unit 13 Sampling Types and Errors Page 241 of 434
7.
8.
9.
On the basis of the means of all the 6 possible samples, the sampling distribution of
means is given below:
Sample
Means
2 1 2 -3 9 9
3.5 2 7 -1.5 2.25 4.50
5.0 3 15 0 0 0
6.5 2 13 1.5 2.25 4.50
8.0 1 8 +3 9.0 9.0
Mean of the Sampling Distribution of Means
Variance of the Sampling Distribution of Means
Hence,
13.10 SAMPLING AND NON-SAMPLING ERRORS The choice of a sample though may be made with utmost care, involves certain errors
which may be classified into two types: (i) Sampling Errors, and (ii) Non-Sampling
Errors. These errors may occur in the collection, processing and analysis of data.
13.10.1 SAMPLING ERRORS
Sampling errors are those which arise due to the method of sampling. Sampling errors
arise primarily due to the following reasons:

MS 110 Research Methodology Uttarakhand Open University
Unit 13 Sampling Types and Errors Page 242 of 434
1. Faulty selection of the sampling method.
2. Substituting one sample for the sample due to the difficulties in collecting the
sample.
3. Faulty demarcation of sampling units.
4. Variability of the population which has different characteristics.
13.10.2 NON-SAMPLING ERRORS
Non-sampling errors are those which occur due to human factors which always vary
from one investigator to another. These arise due to any of the following factors:
(i) Faulty planning.
(ii) Faulty selection of the sample units.
(iii) Lack of trained and experienced staff which collect the data.
(iv) Negligence and non-response on the part of the respondent.
(v) Errors in compilation.
(vi) Errors due to wrong statistical measures.
(vii) Framing of a wrong questionnaire.
(viii) Incomplete investigation of the sample survey
Check Your Progress-A
Choose the alternative
1. Non Sampling error is reduced by;
a) Increasing Sample Size
b) Decreasing Sample Size
c) Reducing Amount of Data
d) None of these
2. Any numerical value calculated from sample data is called as ;
a) Error
b) Statistic
c) Bias
d) Mean
e) Standard Deviation
3. Standard deviation of sampling distribution of any statistic is called;
a) Sampling Error

MS 110 Research Methodology Uttarakhand Open University
Unit 13 Sampling Types and Errors Page 243 of 434
b) Type- I Error
c) Non Sampling Error
d) Standard Deviation
e) Standard Error
4. Any numerical value computed from population is called as;
a) Statistic
b) Bias
c) Sampling Error
d) Error
e) Parameter
5. In random sampling, the probability of selecting an item from the population is;
a) Unknown
b) Known
c) Undecided
d) One
e) Zero
13.11 ILLUSTRATION FOR POPULATION MEAN,
POPULATION VARIANCE AND STANDARD ERROR Illustration 1.2: A population consists of four elements: 3, 7, 11 and 15. Consider all
possible samples of size two which can be drawn with replacement from this population find
(i) the population mean μ (ii) the population variance σ2 (iii) the mean of the sampling
distribution of means (iv) standard error (or S.D.) of the sampling distribution of means.
Verify (iii) and (iv) by using (i) and (ii) and by use of suitable formula.
Solution: (i) population mean
(ii) population variance
(iii) All possible random sample of size two with replacement is
and their sample means are shown in the following table:
Sample
No.
Sample
Values
Sample
Mean
Sample
No.
Sample
Values
Sample
Mean

MS 110 Research Methodology Uttarakhand Open University
Unit 13 Sampling Types and Errors Page 244 of 434
1 3 9 7
2 5 10 9
3 7 11 11
4 9 12 13
5 5 13 9
6 7 14 11
7 9 15 13
8 11 16 15
On the basis of the means of all the 16 samples without replacement, the sampling
distribution of can be written as:
Sampling Distribution of Means without Replacement
Sample
Means
3 1 3 -6 36 36
5 2 10 -4 16 32
7 3 21 -2 4 12
9 4 36 0 0 0
11 3 33 +2 4 12
13 2 26 +4 16 32
15 1 15 +6 36 36
Mean of the Sampling Distribution of Means
Variance of the Sampling Distribution of Means
Hence,

MS 110 Research Methodology Uttarakhand Open University
Unit 13 Sampling Types and Errors Page 245 of 434
Using the formula, and
, you get the mean of the sampling
distribution of means and variance of the sampling distribution of means
2
.
Hence, the results of (iii) and (iv) are verified by using the results of (i) and (ii).
13.12 SUMMARY In this unit an attempt has been made with regard to sampling types and error. A brief
discussion is made for sampling and non-sampling errors. Further errors are categorized in
absolute and relative and biased and unbiased kinds of errors are also discussed. Higher the
sample size better inferences can be drawn. Formula for calculation of sample size is also
discussed. Some illustrations are also to be taken into the consideration with regard to
population mean, population standard deviation, population variance and standard error. In
next unit students will get an opportunity to understand data analysis and interpretation.
13.13 GLOSSARY
Distinctive: Characteristic of one person or thing, and so serving to distinguish it from
others.
Haphazard: Lacking any obvious principle of organization.
Univariate: Involving one variate or variable quantity.
13.14 KEY TO CHECK YOUR PROGRESS
Choose the correct alternative
1) (d)
2) (b)
3) (e)
4) (e)
5) (b)
13.15 REFERENCES
Neogi U. K “Research Methodology Tools and Techniques” Variety Book
Publication.

MS 110 Research Methodology Uttarakhand Open University
Unit 13 Sampling Types and Errors Page 246 of 434
Kumar Ranjeet “Research Methodology” Pearson Education.
Young V. Pauline, “Scientific Social Surveys and Research”.
Gopal, M.H. “An Introduction to Research Procedure in Social Sciences”.
Michacl, V. P. “Research Methods in Management’. Himalaya Publishing House.
Kothari C.R. “Research Methodology” Vikas Publication.
Gode and Hatt. “Methods in Social Research”. Tata Mc Graw Hill, New Delhi.
Gode and Hatt. “Methods in Social Research”. Tata Mc Graw Hill, New Delhi.
Kothari, C R (2008), Research Methodology & Techniques, New Age Publication,
Delhi
Bajpai, Naval (2012) Business Research Methods, Pearson, Delhi
Schiendler & Cooper(2009) : Business Research Methods, TMH, New Delhi
Cresswell, John, W.,(2008). Research Design; Qualitative, Quantitative and
Mixed Methods Approaches. Newbury Park, CA: Sage Publication.
Marczyk, G.R, DeMatteo, D. & Festinger D., (2005). Essentials of Research
Design and methodology, New York City, NY: Wiley.
Ethridge, Don E., (2004). Research Methodology in Applied Economics.
Daryaganj, ND: Wiley – Blackwell,
Bergh, D. and Ketchen, D. (2009) Research Methodology in Strategy and
Management. Binglay, UK: Emarald Group Publishing
13.16 SUGGESTED READINGS
1. Donald R.Cooper and Ramcis S.Schindler, Business Research Methods, Tata
McGraw Hill Publishing CompanyLimited, New Delhi, 2000.
2. C.R.Kothari Research Methodology, Wishva Prakashan, New Delhi, 2001.
3. Uma Sekaran, Research Methods for Business, John Wiley and Sons Inc., New
York, 2000.
4. Marketing Research : N K Malhotra (Pearsons Education)
13.17 TERMINAL QUESTIONS
Q1. Define the meaning and nature of sampling.
Q2. Define steps involved in sampling design.
Q3. What are the advantages and limitations of sampling?
Q4. Define various steps which account in selecting the sampling.

Research Methodology
MS 110
Department of Management Studies
Uttarakhand Open University University Road, Teenpani By pass, Behind Transport Nagar, Haldwani- 263 139
Phone No: (05946)-261122, 261123, 286055
Toll Free No.: 1800 180 4025
Fax No.: (05946)-264232, e-mail: [email protected], [email protected]
Website:http://www.uou.ac.in
Blog Address: www.blogsomcuou.wordpress.com
ISBN:
978-93-85740-16-9

School of Management Studies and Commerce
Research Methodology
MS 110
Uttarakhand Open University, Haldwani
Block III Analysis of Data
Block IV Report Writing and Presentation
MS 110
Research Methodology
Block – III
Block Title- Analysis of Data
Block – IV
Block Title- Report Writing and Presentation
UTTARAKHAND OPEN UNIVERSITY
SCHOOL OF MANAGEMENT STUDIES AND COMMERCE
University Road, Teenpani By pass, Behind Transport Nagar,
Haldwani- 263 139
Phone No: (05946)-261122, 261123, 286055
Toll Free No.: 1800 180 4025
Fax No.: (05946)-264232, e-mail: [email protected], [email protected]
Website:http://www.uou.ac.in
Blog Address: www.blogsomcuou.wordpress.com

Board of Studies
Professor Om Prakash Singh Negi
Vice-Chancellor,
Uttarakhand Open University
Haldwani
Professor R.C. Mishra (Convener)
Director, School of Management Studies and
Commerce, Uttarakhand Open University,
Haldwani
Professor Neeti Agarwal
Department of Management Studies
IGNOU, New Delhi
Professor Ashish Kumar Srivastava
Deen Dayal Upadhyaya,
Gorakhpur University, Gorakhpur
Dr. Gajendra Singh,
Department of Management Studies,
Doon University, Dehradun
Dr. Manjari Agarwal
Department of Management Studies
Uttarakhand Open University, Haldwani
Dr. Gagan Singh
Department of Commerce
Uttarakhand Open University, Haldwani
Dr. Sumit Prasad
Department of Management Studies
Uttarakhand Open University, Haldwani
Programme Coordinator
Dr. Manjari Agarwal
Assistant Professor, Department of Management Studies
Uttarakhand Open University, Haldwani
Units Written by Unit No.
Dr. Hitesh Kumar Pant 14, 15
Assistant Professor
Department of Management Studies
Kumaun University Campus Bhimtal- 263136
Bhimtal, Nainital
Professor S. P. Singh,
Former Dean and Head
Faculty of Management Studies (FMS)
Gurukula Kangri Vishwavidyalaya, Haridwar
Dr. Shefali Tiwari,
Professor,
SRGP Gujarati Professional Institute, Indore
16 &17
18,19,
20&21

Cover Design
Cover Page Image & Design Dr. Manjari Agarwal
Cover Page Image
License: Creative Commons 3 - CC BY-
SA 3.0
Attribution: Alpha Stock Images -
http://alphastockimages.com/
Original Image:
http://www.picpedia.org/clipboard/researc
h.html/ last accessed 8/4/2020 5:00 p.m.
Original Author: Nick Youngson -
http://www.nyphotographic.com/
ISBN : 978-93-85740-16-9
Copyright : Uttarakhand Open University
Edition : 2020 (Restricted Circulation)
(Pre-Publication Copy; Subject to Changes before Final Version)
Published by : Uttarakhand Open University, Haldwani, Nainital – 263 139
Printed at : (Name of the Printer)

Course Contents Course Name: Research Methodology Course Code- MS 110
Course Objective: The objective of the course is to provide students the fundamentals of
research is business situation and its application. Also this course acquaints the students with
latest tools and techniques of analysis and its presentation.
Block I Introduction to Research Methodology Unit I Research and its Relevance for Management
Unit II Nature and Scope of Research Methodology
Unit III Research Process and Review of Literature
Unit IVProblem Formulation and Statement of Research Objectives
Unit V Research Designs-I
Unit VI Research Designs-II
Unit VII Hypothesis – Formulation and Testing
Block II Methods of Data Collection Unit VIII Types and Sources of Data
Unit IX Methods of Data Collection
Unit X Attitude Measurement and Motivational Research Techniques
Unit XI Survey Research-Scaling Techniques
Unit XII Sampling and Sampling Distributions
Unit XIII Sampling Types and Errors
Block III- Analysis of Data Unit XIV Data Analysis and Interpretation
Unit XV Statistical Tools in Data Analysis
Unit XVI Multivariate Data Analysis
Unit XVII Factor Analysis
Unit XVIII Use of Statistical Softwares
Block IV -Report Writing and Presentation Unit XIX Intricacies of Report Writing-I
Unit XX Intricacies of Report Writing-II
Unit XXI Presentation of a Report
Suggested Readings- 1. Donald R.Cooper and Ramcis S.Schindler, Business Research Methods, Tata McGraw
Hill Publishing CompanyLimited, New Delhi, 2000.
2. C.R.Kothari Research Methodology, Wishva Prakashan, New Delhi, 2001.
3. Uma Sekaran, Research Methods for Business, John Wiley and Sons Inc., New York,
2000.

Index
Unit Number Title Page Number
Block I Introduction to Research Methodology
1. Unit I Research and its Relevance for
Management 1-20
2. Unit II Nature and Scope of Research
Methodology 21-39
3. Unit III Research Process and Review of
Literature 40-57
4. Unit IVProblem Formulation and Statement
of Research Objectives 58-76
5. Unit V Research Designs-I 77-97
6. Unit VI Research Designs-II 98-120
7. Unit VII Hypothesis – Formulation and
Testing 121-141
Block II Methods of Data Collection
8. Unit VIII Types and Sources of Data 142-157
9. Unit IX Methods of Data Collection 158-172
10. Unit X Attitude Measurement and
Motivational Research Techniques 173-195
11. Unit XI Survey Research-Scaling Techniques 196-210
12. Unit XII Sampling and Sampling
Distributions 211-232
13. Unit XIII Sampling Types and Errors 233-246
Block III Analysis of Data
14. Unit XIV Data Analysis and Interpretation 247-269
15. Unit XV Statistical Tools in Data Analysis 270-289
16. Unit XVI Multivariate Data Analysis 290-308
17. Unit XVII Factor Analysis 309-328
18. Unit XVIII Use of Statistical Softwares 329-361
Block IV Report Writing and Presentation
19. Unit XIX Intricacies of Report Writing-I 362-381
20. Unit XX Intricacies of Report Writing-II 382-409
21. Unit XXI Presentation of a Report 410-434

Block III
Analysis of Data

MS 110 Research Methodology Uttarakhand Open University
Unit 14 Data Analysis and Interpretation Page 247 of 434
UNIT 14 DATA ANALYSIS AND INTERPRETATION
14.1 Introduction
14.2 Objectives
14.3 Procedure for Testing of Hypothesis
14.4 Student's T – Distribution
14.5 Chi- Square Test
14.6 One Way ANOVA
14.7 Analytical Evaluation of Non-parametric Test
14.8 Wilcoxon’s Matched Pair Signed Rank Test
14.9 Mann Whitney U-Test
14.10 Krushal-Wallis One Way Analysis Of Variance by Ranks
14.11 Summary
14.12 Glossary
14.13 Key to Check Your Progress
14.14 References
14.15 Suggested Readings
14.16 Terminal Questions
14.1 INTRODUCTION As you know that various statistical tools are applied for testing of hypotheses. These
statistical tests can be categorized into two different groups—parametric tests and non -
parametric tests. Parametric tests are those tests which are based on parameters of population.
To apply parametric tests, it is necessary that certain assumptions regarding population
distribution must be fulfilled. It becomes a limitation for implementation of these tests. To
avoid these limitations, we may use another category of tests which are known as non-
parametric tests.
In this unit, you will study about different parametric and non -parametric tests. Among them,
Student’s t-test, chi-square test, one way analysis of variance, Wilconxon’s matched pair
signed rank test, Mann Whitney U-test, Krushal-Wallis one way analysis of variance by ranks
are the most popular form of parametric and non -parametric tests but it can also be used as a
parametric test. In this unit you will study in detail about the theoretical concept and various
uses and applications of these tests.
MS 110 Research Methodology Uttarakhand Open University
Unit 14 Data Analysis and Interpretation Page 248 of 434
14.2 OBJECTIVES After studying this unit, students will be able to understand:
To understand the basic concept of parametric tests.
To enhance the knowledge about the uses of parametric tests.
To know about the fundamental concept of non- parametric tests.
To understand the uses and applications of the non-parametric tests.
14.3 PROCEDURE FOR TESTING OF HYPOTHESIS In order to test any assumption following procedure must be followed.
1. Setting up the null hypothesis
The hypothesis which is being tested for possible rejection is the null hypothesis. The
null hypothesis may be that
a. The parameter is equal to a given value )( 0
b. The parameters for the two population are equal. )( 21
c. The difference is insignificant (not significant)
d. The distribution is a good fit.
e. The attributes are independent, and so on.
2. Setting up the alternative hypothesis
The hypothesis which is to be accepted when the null hypothesis is rejected is the
alternative hypothesis. It may be that
a. The parameter is not equal to the given value )( 0
b. The parameter is greater than the given value )( 0
c. The parameter for the two populations are not equal )( 21
d. The parameter for the first population is lesser than the parameter for the second
population )( 21
e. The difference is significant
f. The distribution is not a good fit.
g. The attributes are dependent (not independent) and so on.
3. Identifying the test statistic and its null distribution
The test statistic is the statistic based on whose distribution the test is conducted. The
statistical distribution of the test statistic under 0H is called null distribution.
For testing )(: 000 toeuqualismeanH , the test statistic is x the sample
mean. Under 0H the distribution of x is )/( 2
,0 nN This is the null distribution

MS 110 Research Methodology Uttarakhand Open University
Unit 14 Data Analysis and Interpretation Page 249 of 434
of x However for convenience, the standardized form n
xZ
0 may be
considered in which case, the null distribution is N (0,1)
4. Identifying the critical region.
The set of those values of the test statistic which lead of the rejection for the null
hypothesis is called critical Region (Rejection Region). The set of those values of the
test statistic which lead to the acceptance of the null hypothesis is called acceptance
region.
The demarcation limits of the critical region are called Critical values.
The critical region is so formed that when 0H true the probability of its rejection is a
small is pre-decided value. This pre-decided value is called level of significance.
Fig 14.1 Identifying the critical region.
Level of Significance is a pre-decided upper limit for the probability of rejection of the null
hypothesis when it is actually true. The level of significance is denoted by . Usually, the
pre-decided value would be 0.05 or 0.01. In other words, it would be 5% or
1%.Depending on the nature of the test and also on the nature of the alternative hypothesis,
the critical region may have one part or it may have two parts. If the critical region has one
part, the test is called one-sided test (one –tailed test). If the critical region has two parts, the
test is called two-sided test (two tailed test).
5. Drawing a random sample and actually conducting the test
A random sample of size n is drawn from the population. The value of the test
statistic is calculated from the sample value. If the calculated value (observed
value) belongs to the critical region, 0H is rejected in favour of 1H . On the
other hand, if the calculated value belongs to the acceptance region, 0H is
accepted.
6. Making the decision (Giving the inference)
The final decision (inference, conclusion) is announced. The decision may be
a. The new medicine is more effective than the old one
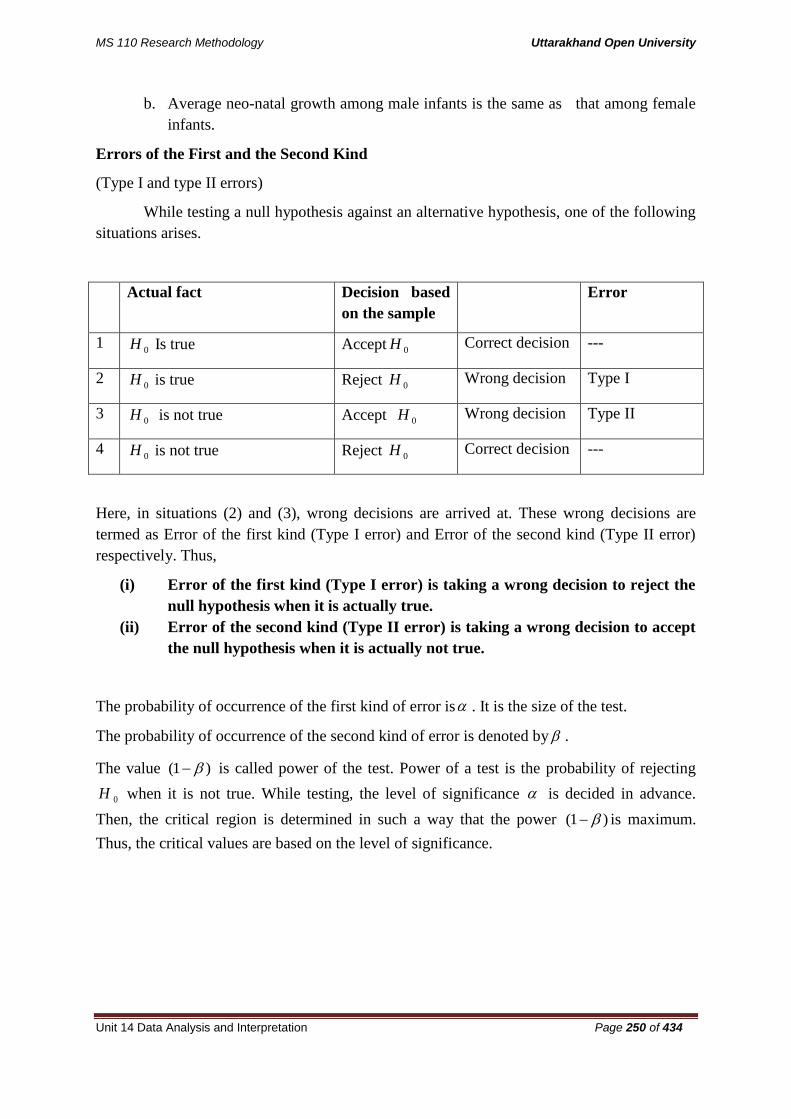
MS 110 Research Methodology Uttarakhand Open University
Unit 14 Data Analysis and Interpretation Page 250 of 434
b. Average neo-natal growth among male infants is the same as that among female
infants.
Errors of the First and the Second Kind
(Type I and type II errors)
While testing a null hypothesis against an alternative hypothesis, one of the following
situations arises.
Actual fact Decision based
on the sample
Error
1 0H Is true Accept 0H Correct decision ---
2 0H is true Reject 0H Wrong decision Type I
3 0H is not true Accept 0H Wrong decision Type II
4 0H is not true Reject 0H Correct decision ---
Here, in situations (2) and (3), wrong decisions are arrived at. These wrong decisions are
termed as Error of the first kind (Type I error) and Error of the second kind (Type II error)
respectively. Thus,
(i) Error of the first kind (Type I error) is taking a wrong decision to reject the
null hypothesis when it is actually true.
(ii) Error of the second kind (Type II error) is taking a wrong decision to accept
the null hypothesis when it is actually not true.
The probability of occurrence of the first kind of error is . It is the size of the test.
The probability of occurrence of the second kind of error is denoted by .
The value )1( is called power of the test. Power of a test is the probability of rejecting
0H when it is not true. While testing, the level of significance is decided in advance.
Then, the critical region is determined in such a way that the power )1( is maximum.
Thus, the critical values are based on the level of significance.
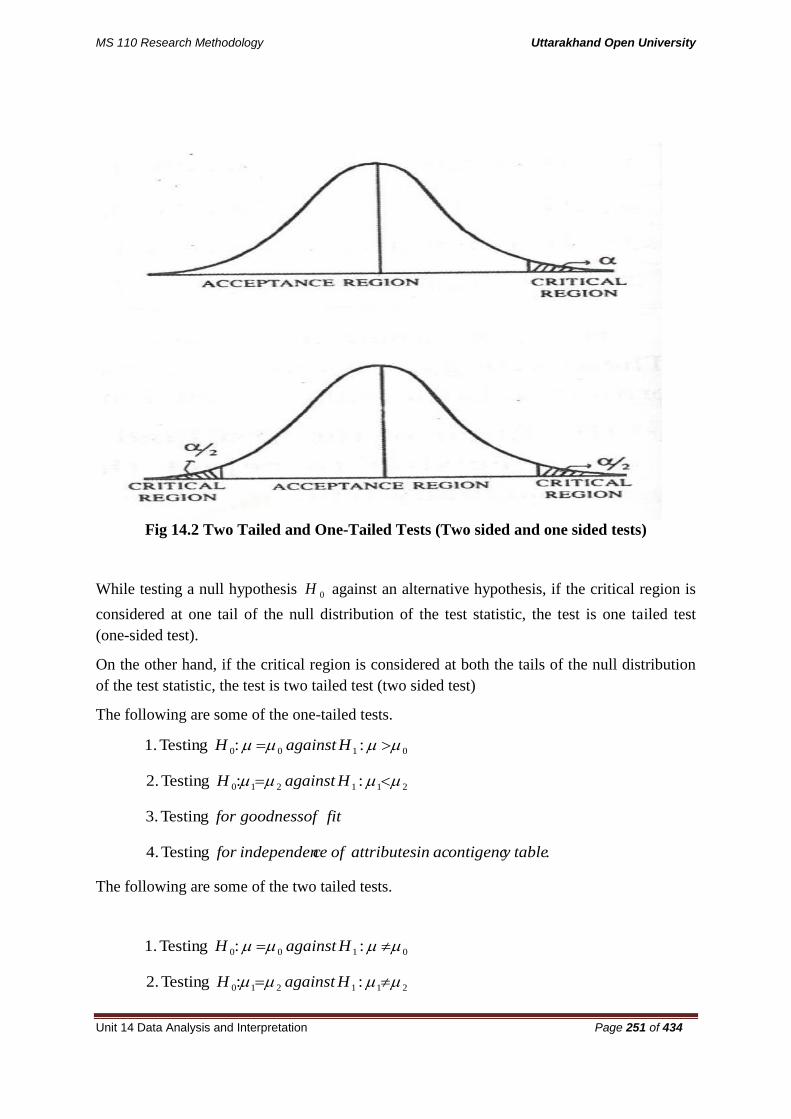
MS 110 Research Methodology Uttarakhand Open University
Unit 14 Data Analysis and Interpretation Page 251 of 434
Fig 14.2 Two Tailed and One-Tailed Tests (Two sided and one sided tests)
While testing a null hypothesis 0H against an alternative hypothesis, if the critical region is
considered at one tail of the null distribution of the test statistic, the test is one tailed test
(one-sided test).
On the other hand, if the critical region is considered at both the tails of the null distribution
of the test statistic, the test is two tailed test (two sided test)
The following are some of the one-tailed tests.
0100 ::Testing1. HagainstH
211210 ::Testing2. HagainstH
fitofgoodnessforTesting3.
.Testing4. tableyacontigencinattributesofceindependenfor
The following are some of the two tailed tests.
0100 ::Testing1. HagainstH
211210 ::Testing2. HagainstH

MS 110 Research Methodology Uttarakhand Open University
Unit 14 Data Analysis and Interpretation Page 252 of 434
0100 ::Testing3. HagainstH
14.4 STUDENT’S T-DISTRIBUTION (T-TEST) Theoretical work on t-distribution was done by W.S. Cosset (1876-1937). In the year 1900
Gosset was employed by the Guinnes and Son, a Dublin brewery, Ireland which did not
permit employees to publish research finding under their own names. So Gosset adopted the
pen name "student" and published his finding under this name. Thereafter, the f-distribution
is commonly called Student's f-distribution or simply Student's distribution.
14.4.1 APPLICATION OF THE T-DISTRIBUTION
The following are some of the examples to illustrate the way in which the 'Student'
distribution is generally used to test the significance of the various results obtained from
small samples.
1. To test the significance of the mean of a random sample
In determining whether the mean of a sample drawn from a normal population
deviates significantly from a stated value (the hypothetical value of the population mean),
when variance of population is unknown, we calculate the statistic.
t=
Where, x=the mean of the sample
µ=the actually or hypothetical mean of population
Example: The life time of electric bulbs for a random sample of 6 from consignment given in
the following data:
Data 1 2 3 4 5 6
Lifts in
months
24 26 30 20 20 18
Can we accept the hypothesis the average life of the bulbs is 25 months? {t 0.0 1=4.032}
when v=5}
Solution: Let us known the hypothesis that there is no significant difference in the
means life of bulbs in the sample and that of the population.
Appling t test:
t=
Calculation of X bar and S
X X=(X-X bar) X2
MS 110 Research Methodology Uttarakhand Open University
Unit 14 Data Analysis and Interpretation Page 253 of 434
24 +1 1
26 -3 9
30 +7 49
20 -3 9
20 -3 9
18 -5 25
∑X = 138 ∑×2 = 138
Ẋ=
=23
Actual mean of second sample
The degree of freedom (v) = ( + - 2)
When we are given the number of observations and standard deviation of the two
samples, the pooled estimate of standard can be obtained as follows:
S=
Interpretation
If the calculated value of t be> ( ) the difference between the sample means is said to
be significances otherwise the data are said to be consistent with the hypothesis.
the mean of the two batches do not differ significantly.
Example: A drug is given to 10 patients, and the increments in their blood pressure were
recorded to be 3,6,-2,4,-3,4,6,0,0,2. Is it reasonable to believe that drug has no effect on
change of blood pressure? (5% value of t for 9d.f. = 2.26)
Solution: Let us take the hypothesis that the drug has no effect on change of blood pressure.
Applying the difference test:
t=
d d2
3 9
6 36
-2 4
4 16
-3 9

MS 110 Research Methodology Uttarakhand Open University
Unit 14 Data Analysis and Interpretation Page 254 of 434
4 16
6 63
0 0
0 0 =3.162
∑d = 20 ∑ 130
d=
=20/10 = 2
s=
= 3.162
v=n-1 =10-1=9; t0.05=2.26
The calculated value of t is less than the table value. The hypothesis is accepted. Hence, it is
reasonable to believe that the drug has no effect on change of blood pressure.
14.5 CHI- SQUARE TEST The chi-square test is perhaps the most important of all the tests of significance used in
Statics. Chi-square measures the extent to which the observed frequencies deviate from the
corresponding expected frequencies. In other words, Chi-square is a measure of actual
difference between the expected and observed frequencies, and as such if there is no
difference between actual and observed frequencies, the value of chi-square is zero. The
formula used is:
=∑[
= ∑{
Where,
= chi-square
= observed or actual frequency and
= expected frequency
can also be determined with the help of the following formula:
=∑(
)-N

MS 110 Research Methodology Uttarakhand Open University
Unit 14 Data Analysis and Interpretation Page 255 of 434
N=total of frequencies
Degree of freedom
The number of independent variables is generally called the number of degrees of freedom or
simply the number of freedoms. In other words, the term 'degree of freedom' refers to the
number of independent constraints' in asset of data.
Where,
d= degree of freedom
c= number of columns
r= number of rows
Conditions for the application of - test.
The following conditions should be satisfied before the -test can be applied:
(i) The number of observation must be reasonably large, say no more than 50.
(ii) No theoretical cell frequency should be small, say less than 5. In case where the new
frequencies become greater than 5.
(iii) All the individuals in the sample must be independent or if constraints are there, they
must be linear.
Use of - test
Chi-square test may be used under any of the following conditions:
1. When degree of association between two or more attributes is to be determined.
(a) In the case of two-fold table, -test is used as an alternative to Yule's
coefficient of association.
(b) In the case of manifold table, a coefficient of contingency is calculated.
C=
Where, N = total frequency, C lies between 0 and 1 is used like Yule's coefficient of
association.
2. For comparison of a number of frequency distributions e.g., for the
Then, = ∑
Where NI and N2 are the two totals and need not be equal. and are the
frequencies in one corresponding group in the two distributions.
3. Chi-square is also used as a test of the "goodness of fit". In fact - test is also known
as a test of goodness of fit because by its application we can easily find out as to how
well the normal curve or some other curves that we have fitted to the data fits to the
observed facts.

MS 110 Research Methodology Uttarakhand Open University
Unit 14 Data Analysis and Interpretation Page 256 of 434
Additive property of chi-square
If the independent variables of x and y conform to the distribution with and degrees
of freedom respectively, then x+y is distributed like with and degree of freedom.
Example: In a recent diet survey the following results were found in an Indian city:
Number of Hindus Muslims
Families taking tea 1236 164
Families not taking tea 564 36
Discuss whether there is any significant difference between the two communities in the
matter of tea taking.
Solution: Let us suppose that there is no difference in two communities in respect of tea
taking, i.e., both the attributes are independent. If that is so, expected frequencies would be:
Number of Hindus Muslims
Families taking tea 1236 140
Families not taking tea 540 60
Substituting the observed and expected frequencies in the formula,
= ∑{
C-1(y – 1) =(2-1) (2-1)=1
Degree of Freedom
For 1 degree of freedom at 5% level the table value of X2 is 3.841. The calculated value of X
2
is greater than the table value. Hence, the hypothesis which er assumed that there is no
difference in the two communities in respect of tea taking is not correct. There is very
significant difference between the two communities in respect of tea taking.
A random sample 200 employees of the Central Government was taken and was classified
according to their salaries (as high and low salaried employees) and their reactions (as
favourable and unfavourable) to a new formula for determining the amount of dearness pay
as follows.

MS 110 Research Methodology Uttarakhand Open University
Unit 14 Data Analysis and Interpretation Page 257 of 434
Examine if there is any statistical evidence to show that there was an association between the
salaries of employees and their reactions for answering this questions. The employees and
their reactions about the new formula for determining the amount of dearness pay.
Use t-test for answering this question.
EXTRACT FROM X2
TABLE
Solution: Assumed a null hypothesis
Ho= Salaries of the employees and their reactions are different observed frequencies can be
calculated as follows:
Nature of
reaction
Salary TOTAL
Low High
Favourable 51 30 90
Unfavourable 69 50 110
Total 120 80 200
Expected frequencies can be calculated as:
Nature of
reaction
Salary TOTAL
Low High
Favourable 54 36 90
Unfavorable 66 44 110
Total 120 80 200
Degree of
freedom
3 2 3 4 5
X2(0.05) 3,841 5.991 7.815 9.488 11.017
MS 110 Research Methodology Uttarakhand Open University
Unit 14 Data Analysis and Interpretation Page 258 of 434
X2
can be calculated by the following table:
S.N. O1 E1 (O1-E1) (O1-E1)2 (01-E1)
2/E1
1 31 54 -3 9 0.167
2 39 36 3 9 0.250
3 69 66 3 9 0.136
4 41 44 -3 9 0.205
0.758
Since calculated value of X2=.758<X2
2(0.5) =7.815.So, we accept H0 at 5%level X
2
significance and conclude that salary income and reaction are independent.
Example: The following table shows price increase and decrease in market where credit
squeeze in operation and where it is not in operation.
Credit square in
operation
Price decrease
862
Price increase
10
Total
872
Not in operation 583 17 600
Total 1414 28 1472
Find whether the credit squeeze has been effective in check price increase.
Solution: let us take the hypothesis that there is no association between credit squeeze and
price increase, i.e. they are independent attributes. On the basis of the hypothesis the expected
frequencies will be:
Credit square in
operation
Price increase
872
Price increase
16.6
Total
872
1472
Not in operation 588.6 11.4 600
Total 1414 28 1472
We know that
C2=
=
+
+
+
0.050+0.074+2.624+3.820=6.568

MS 110 Research Methodology Uttarakhand Open University
Unit 14 Data Analysis and Interpretation Page 259 of 434
=6.57(approx.)
Degree of freedom=(Y-1) (C-1) = (2-1) (2-1) =1
For 1 degree of freedom at 5 % level the table value of X2
is 3.841
The calculated value of X2
is greater than the table value. Hence, the assumed hypothesis is
doubtful and the conclusion is that there is association between credit squeeze and price
increase, i.e. credit squeeze has been effective in checking price increase.
14.6 ONE WAY ANOVA The statistical method for testing the null hypothesis that the mean for several populations are
equal in analysis of variance (ANOVA) one way analysis of variance is described in this
section. It is used in single factor, fixed assets model to compare the effects of one factor
(brands of coffee, varieties of residential housing, types of retail stores) on a continuous
dependent variable. In affixed effect model, the level of the factor is established in advance,
and the results are not generalizable to other levels of treatment. For example, if coffee were
Jamaican grown, Colombian grown, and Honduran grown, we could not extend our
inferences to coffee grown in Guatemala or, Mexico.
To use ANOVA, certain conditions must be met. The samples must be randomly selected
from normal populations, and the populations should have equal variances. In addition, the
distance from one value to its group’s mean should be independent of error. ANOVA is
reasonably robust, and minor variations from normality and equal variance are tolerable.
Analysis of variance, as the name implies, breaks down or partitions total variability into
component parts. Unlike the test, which uses the sample standard deviations of the variance
so computation of distances of the individual data points from their own mean or from the
grand mean can be summed (recall that standard deviations sum to zero).
In an ANOVA model, each group has its own mean and values that deviate from that mean.
Similarly, all data points from all of the groups produce an overall grand mean. The total
deviation is the sum of the squared differences between each data point and the overall grand
mean.
The total deviation of any particular data point may be partitioned into between groups’
variance and within group variance. The between-variance represents the effect of the
treatment or factor. The difference of between-group means imply that each group was
treated differently and the treatment will appear as deviations of the sample means from the
grand mean. Even if this were not so, there would still be some natural variability among
subjects and some variability attributable to sampling. The within groups variance describes
the deviations of the data point within each group from the sample mean. This results from
variability among subjects and from random variation. It is often called error.
Intuitively, we might conclude that when the variability attributable to the treatment exceeds
the variability arising from error and random fluctuations, the viability of the null hypothesis

MS 110 Research Methodology Uttarakhand Open University
Unit 14 Data Analysis and Interpretation Page 260 of 434
begins to diminish. And this is exactly the way the test statistics for analysis of variance
works.
The test statistic for ANOVA is the F ratio. It compares the variance from the last two
sources:
F=
=
=
=
To compute the F ratio, the sum of the squared deviations for the numerator and denominator
are divided by their respective degree of freedom. By dividing, we are computing the
variance as an average or mean, thus the term mean square .the degrees of freedom for the
numerator, the mean square between groups are one less then number of groups (k-1).the
degree of freedom for the denominator, the mean square within groups, is the total number of
observations minus the number of groups (n-k).
If the null hypothesis is true, there should be no difference between the populations, and the
ratio should be close to 1.if the populations means are not equal, the numerator should
manifest this difference, and the F ratio should be greater than1.the f distribution determines
the size of ratio necessary to reject the null hypothesis for a particular samples size and level
of significance.
When we compute a t-test, it is not difficult to discover the reasons why the null is rejected.
But with one-way ANOVA, how do we determine which pairs are not equal? We could
calculate a series of t-tests, but they would not be independent of each other and the resulting
TYPE 1 error would increase substantially. Obviously, this is not recommended. If we
decided in advance that a comparison of specific.
F=
The denominator, the within-groups mean square, is the same as the error term of the one
way’ F ratio (recorded in the summary table, Table 2).We have previously referred to
denominator of the F ratio as the error variance estimator. The numerator of the contrast test
is defined as:
MSCON=SSCON=

MS 110 Research Methodology Uttarakhand Open University
Unit 14 Data Analysis and Interpretation Page 261 of 434
Where,
Is the contrast coefficient for the group j.
Is the number of observations recorded for the group j.
A contrast is useful for experimental and quasi-experimental designs when the researcher is
interesting in answering specific question about a subset of the factor.
For example, in a comparison of coffee products, are meaningfully ordered assume we are
particularly interested in two Central American grown blends and one Colombian blend.
Rather than looking at all possible combinations, we can channel the power of the test into
fewer degrees of freedom by stating the comparisons of interest. This increases our likelihood
of detecting differences if they really exist.
Multiple Comparison Tests
For the probabilities associated with the contrast test to be properly used in the report of our
findings, it is important that the contrast strategy be devised ahead of the testing. In the airline
study, we had no theoretical reason for a priori contrast. However, examining the means table
(table 2) revealed that the airline means was quite disparate. Comparisons after the results are
compared tests or multiple comparison procedures. Multiple comparison tests use group
means and incorporate the MS error term of the F ratio. Together they produce confidence
intervals for the population means and a criterion score. Differences between the mean values
may be compared.
There are roughly a dozen such tests with different optimization goals: maximum number of
comparisons, unequal cell size compensation, cell homogeneity, α and β error reduction, and
so forth. The example in table 2 is Scheffer’s S. It is a conservative test that is robus/ to
violations of assumptions. The computer calculated the critical difference criterion as 11.4;
all the differences between the pairs of means exceed this. The null hypothesis for the
Scheffer was tested at the level. Therefore, conclude that all combinations of flight service
mean scores differ from each other.
While the table provides information for understanding the rejection of the one-way null
hypothesis and the Scheffer’s null, the means plot shows relative differences among the three
levels lower variability in the opinions recorded by the hypothetical Delta and the KLM
passengers. Nevertheless, these two groups are sharply divided on the quality of in-flight
service, and that is apparent in the upper plot.
Exploring the finding with Two-way ANOVA
Is the airline on which the passengers travelled the only factor influencing perceptions of in-
flight service? By extending the one-way ANOVA, we can learn more about the service
ratings. There are many possible explanations .we have chosen to look at the fare class of the
travellers in the interest of brevity.

MS 110 Research Methodology Uttarakhand Open University
Unit 14 Data Analysis and Interpretation Page 262 of 434
Recall that in Table 1, data were entered for the variable fare class: economy and business
class travellers. Adding this factor to the model, we have a two-way analysis of variance.
Now three questions may be considered with one model:
1. Are differences in flight service rating attributable to airline?
2. Are differences in flight service rating attributable to fare class?
3. Do the airline and the fare class interact with respect to flight service rating?
The third question reveals a distinct advantage of the two-way model. A separate one-way
model on airlines averages out the effects of class. Similarly, a single factor test of class
average out the effects of the airline, but an interaction test of airline by class considers them
jointly.
Table 3 reports a test of hypothesis for these three questions. The significance level was
established at the .01 level. We first inspect the interaction effect, airline by class, since the
individual main effects cannot be considered separately if factors operate jointly. The
interaction was not significant at the.01 level, and the null is accepted .now the separate main
effects, airline and class, can be verified. As with the one-way ANOVA, the null for the
airline factor was rejected, and class was also found significant at .0001.
We note a band of similar deviation for economy-class travelers and a band of lower
variability for business-class with the exception of one carrier. The plot of cell means
confirms visually what we already know from the summary table: there is no interaction
between airline and class (p=185).if an interaction had occurred, the lines connecting the cell
means would have crossed rather than displaying a parallel pattern.
Analysis of variance is an extremely versatile and powerful method that may be adapted to a
wide range of testing applications. Discussion of further extensions in n-way and
experimental designs may be found in the list of suggested reading.
14.7 ANALYTICAL EVALUATION OF NON-PARAMETRIC
TEST For testing of hypotheses, we have two types of tests—parametric tests and non-parametric
tests. We should definitely choose a parametric test if we are sure that our data are sampled
from a population that follows a normal distribution. But many times, we have to deal with
such cases where various assumptions required for standard tests of significance, such as that
population is normal, samples are independent; standard deviation is known etc. cannot be
met, and then we can use non-parametric methods. We should definitely select a non-
parametric test in following three situations:
The outcome is a rank or a score and the population is clearly not normal.
Some values are “off the scale”, i.e. too high or too low to measure. Even if the
population is normal, it is impossible to analyze such data with a parametric test since
we don’t know all of the values. A non-parametric test is easy to use with these data.
MS 110 Research Methodology Uttarakhand Open University
Unit 14 Data Analysis and Interpretation Page 263 of 434
The data is measured on an ordinal scale, and the population is not distributed in a
Gaussian manner.
Non-parametric tests have many advantages over parametric tests. The biggest advantage of
non-parametric tests is its versatility. These tests can be used for all kinds of data, whether the
population is normal or non-normal, quantitative or qualitative. It is most suitable for ranked
data. When we deal with such data which can be ranked according to respondents’ preference
but their exact quantification is not possible; then we have the only option of non-parametric
tests. Similarly, it is also the best option to deal with categorical or nominal data. Sometimes,
we work with such data which is obtained through samples belonging to different
populations. In these circumstances, we have to make some unrealistic assumptions to apply
parametric tests. But there is no such problem in applying non-parametric tests. When sample
size is small or only few observations are available then also only non-parametric tests should
be applied. The main reason for popularity of non-parametric tests is their easy calculations
in comparison to parametric tests. Since, non-parametric tests are easy to understand, simple
to calculate, applicable to all kinds of data and less time consuming, hence, they are liked by
researchers.
Although, non-parametric tests have so many advantages but it also has some disadvantages
because of which first preference is always given to parametric tests. Non-parametric tests are
less powerful than parametric tests because they are not based on many assumptions. Lack of
assumptions limits the scope of making inferences. Thus, if the sampled data fulfills all
desired assumptions, or the data is measured at interval or ratio scale, then it is always
considered better to use parametric tests than non-parametric tests. Similarly, if the size of
sample is large then calculations involved in non-parametric tests become too lengthy. Hence,
in case of large samples, non-parametric tests should be avoided. Another problem with
implementation of non-parametric tests is availability of critical value tables. In order to
arrive at significant decisions, critical values are required. However, some of these values
have yet not been compiled in relevant tables and existing tables are always, also not easily
available.
14.8 WILCOXON’S MATCHED PAIR SIGNED RANK TEST
Social perceptiveness scores of nursery school and home children
Social
perceptiveness
scores of-twin
in nursery
school
Social
perceptiveness
scores of-twin
in home
children
d Rank of d Ranks with
least
frequency
sign
a) 82 63 19 7
b) 69 42 27 8
MS 110 Research Methodology Uttarakhand Open University
Unit 14 Data Analysis and Interpretation Page 264 of 434
c) 73 74 -1 -1 1
d) 13 37 6 4 13
e) 58 51 7 5
f) 56 43 13 6
g) 76 80 -4 -3 3
h) 65 82 3 2
T=4
The procedure for the determining the significance of the observed value of T depends on the
size of N i.e., is the no of observations.
Note: If the observed value of T is equal to or less than given in table for a particular
significance level and particular N, H0 may be rejected at the level of significance.
Here N=8, observed value of T is 4, N=8 at 0.5 probability for one tailed test value of T is
1.860, so H0 will be accepted. It means that social perceptiveness scores of “nursery school”
and “home children” are same.
14.9 MANN WHITNEY U-TEST
E SCORES 9 11 15 -
C SCORES 6 8 10 13
Let n1=the no. of cases in the smaller group
Let n2=the no. of cases in the larger group
To find the U, we first rank these scores in order of increasing order. Being careful to retain
each score’s identity as either in C or E.
6 8 9 10 11 13 15
C C E C E C E
Now consider the control group, and count the no. of E scores that precedes each score in the
control group, for C score of 6, no E scores preeceds. This is also true for the C score of 8.for
the next C score (10), one E score preeceds. And for the final C score (13), two E scores
preeceds .Thus U=0+0+1+2=3.so U=3

MS 110 Research Methodology Uttarakhand Open University
Unit 14 Data Analysis and Interpretation Page 265 of 434
In this U=3, n1=3, n2=4.the suitable for n2=4 in table shows that U=3 has the probability of
occurrence under H0 of P=.200
Check Your Progress-A
Choose the correct alternative;
Q1. In testing of hypothesis, type II error is represented by β and the power of the test is
1 − β then
a) The probability of rejecting H0 when H1 is true
b) The probability of failing to reject H0 when H1 is true
c) The probability of failing to reject H0 when H0 is true
d) The probability of rejecting H0 when H0 is true
e) The probability of failing to reject H0.
Q2. In statistical testing of hypothesis, what happens to the region of rejection when the
level of significance α is reduced?
a) The answer depends on the value of β
b) The rejection region is reduced in size
c) The rejection region is increased in size
d) The rejection region is unaltered
e) The answer depends on the form of the alternative hypothesis
Q3. Which of the following is NOT correct?
a) The probability of a type I error is controlled by the selection of the level of
significance α
b) The probability of a type II error is controlled by the sample size (n)
c) The power of a test depends upon the sample size and the distance between the null
hypothesis and the alternative hypothesis
d) The p-value measures the probability that the null hypothesis is true
e) The rejection region is controlled by the α and the alternative hypothesis.

MS 110 Research Methodology Uttarakhand Open University
Unit 14 Data Analysis and Interpretation Page 266 of 434
14.10 KRUSHAL-WALLIS ONE WAY ANALYSIS OF
VARIANCE BY RANKS The Krushal-Wallis technique tests the null-hypothesis that that k samples come from the
same population or identical populations with respect to averages. The test assumes that the
variable under study has an underlying continuous distribution. It requires at least ordinal
measurement of that variable.
Each of the N observation is replaced by ranks. All of the scores from all of the k samples
combined are ranked in single series. The smallest score is replaced by rank 1 and next
smallest is replaced by 2 and the largest by rank N.
N=total no. of independent observations in k samples.
Teaching oriented
teachers
Administration oriented
teachers
Administration
96 82 115
128 124 149
83 132 166
61 135 147
101 109
Where k=no. of samples
nj =number of classes in the jth
sample
N=∑nj, the number of cases in all samples combined
Rj =sum of ranks in jth
sample k
∑Rj directs one to sum over the k samples.
i=!
Authoritarianism scores of three groups of educators
Teacher oriented teachers Administer oriented
problems
Administers
96 82 115
128 124 149
83 130 166
61 133 167
301 109

MS 110 Research Methodology Uttarakhand Open University
Unit 14 Data Analysis and Interpretation Page 267 of 434
If Scores 14 f scores to these three groups.
Teacher oriented teachers Administer oriented
problems
Administers
4 2 3
0 8 13
3 10 14
1 11 12
5 6
R3=22 R2=37 R3=46
=12/14(14+1) {(22)2/5+ (37)
2/5+ (46)
2/4}-3(14+1) =6.4
References of table discloses that when the n1 are 5,5and 4 H=6.4Has probability of
occurrence under the null hypothesis of p=0.49, since this probability is smaller than α=.05, it
means reject the null hypothesis.
ONE SAMPLE RUN TEST
Run is defined as repetition of identical symbols that are succeeded or preceded by other or
no symbol.
Ex: suppose a series of symbol (plus and minus) occur in the following manner
++----+----++----+
We can group these 7 runs @as:
r=7
The total number of runs in a sample (of any size) indicates whether or not the given sample
is random. In case of very few runs e.g, r=2…may conclude lack of independence in sample
i.e. lack of randomness. E.g. r=20 when N=20
In case of too many run use may conclude lack of independence or fairness of randomness
Suppose use have a series
++++++---------- r=2 N=12
+-+-+-+-+-+-+-+- r=12 N=
Lack of randomness
It is way important to note that here the order of occur of events are taken into consideration
and not the freq. of event.

MS 110 Research Methodology Uttarakhand Open University
Unit 14 Data Analysis and Interpretation Page 268 of 434
Critical value: (Fc) is obtained from the table for a given value of n (no of and a desired level
of significance (α)
Decision Rule: if rc
Accept H0
H0: Samples are random
H1: Samples are not random
14.11 SUMMARY In this unit an attempt has been made to explain the parametric tests like student’s t-test,
analysis of variance (ANOVA) etc with the help of several examples. In addition to that an
effort has made to explain the circumstances and situations in which parametric and non-
parametric tests would be used. A detailed description is also to be made with regard to the
different types of non- parametric tests like Chi-square test, Wilconxon’s matched pair signed
rank test, Mann Whitney U-test, Krushal-Wallis one-way analysis of variance by ranks.
Among these non- parametric tests Chi-square test is the most popular non-parametric test. If
the sample is drawn from study population with the help of non-random sampling distribution
techniques like convenience and judgmental sampling then to know about the discrepancy
between observed and expected frequencies only Chi-square test would be used. In next unit
students will be able to know about the intricacies of statistical tools in data analysis.
14.12 GLOSSARY
Histogram: a graphical representation of data using bars of different heights.
Chi-square: Chi Squares measures the extent to which the observed frequencies deviate from
the corresponding expected frequencies
14.13 KEY TO CHECK YOUR PROGRESS
Check your progress A
1) (a)
2) (b)
3) (d)

MS 110 Research Methodology Uttarakhand Open University
Unit 14 Data Analysis and Interpretation Page 269 of 434
14.14 REFERENCES
Neogi U. K “Research Methodology Tools and Techniques” Variety Book
Publication.
Kumar Ranjeet “Research Methodology” Pearson Education.
Young V. Pauline, “Scientific Social Surveys and Research”.
Gopal, M.H. “An Introduction to Research Procedure in Social Sciences”.
Michacl, V. P. “Research Methods in Management’. Himalaya Publishing
House.
Kothari C.R. “Research Methodology” Vikas Publication.
Gode and Hatt. “Methods in Social Research”. Tata Mc Graw Hill, New Delhi.
Gode and Hatt. “Methods in Social Research”. Tata Mc Graw Hill, New Delhi.
Kothari, C R (2008), Research Methodology & Techniques, New Age
Publication, Delhi
Schiendler & Cooper(2009) : Business Research Methods, TMH, New Delhi
14.15 SUGGESTED READINGS
1. Cooper and Schiendlers : Business Research Methods, TMH
2. C R Kothari : Research Methodology, (New Age)
3. Marketing Research : N K Malhotra (Pearsons)
14.16 TERMINAL QUESTIONS
Q1. Write a short note on:
a) Parametric and non-parametric tests
b) Student’s T-distribution (t-test)
c) Chi-square test
Q2. Write a brief note on One-way ANOVA.
Q3. Define the characteristics of non-parametric test.
Q4. Explain Man-Whitney test.
MS 110 Research Methodology Uttarakhand Open University
Unit 15 Statistical Tools in Data Analysis Page 270 of 434
UNIT 15 STATISTICAL TOOLS IN DATA ANALYSIS
15.1 Introduction
15.2 Objectives
15.3 Multidimensional Scaling-A Mapping Technique
15.4 Usage of the Multidimensional Scaling
15.5 Creating Spatial Maps Using Multidimensional Scaling
15.6 Conducting MDS with Similarity Data
15.7 Identifying the Number of Dimensions
15.8 Important Terms for Multivariate Analysis
15.9 Multiple Regression Analysis
15.10 Discriminant Variables
15.11 Conjoint Analysis
15.12 Factor Analysis
15.13 Cluster Analysis
15.14 Multidimensional Scaling
15.15 Summary
15.16 Glossary
15.17 Answer to Check Your Progress
15.18 References
15.19 Suggested Readings
15.20 Terminal Questions
15.1 INTRODUCTION Multiple regressions are also an extension of technique of simple regression under which you
will study the interrelationship between three or more variables. It is also used to estimate the
most probable value of the dependent variable for given values of the independent variables.
In the previous units, you have studied about different types of parametric and non-
parametric tests. These tests deal with such data which are based on a single factor or at the
most two factors. But in real life, we have to deal with many such a phenomenon which is

MS 110 Research Methodology Uttarakhand Open University
Unit 15 Statistical Tools in Data Analysis Page 271 of 434
simultaneously affected by more than one factor. In case of such complex phenomenon,
univariate and bivariate techniques are not helpful for analyzing them.
Thus, multivariate analysis techniques help to understand and interpret various relationships
among variables.
In this unit, you will study about some commonly used multivariate analysis techniques like
factor analysis, multiple regression, cluster analysis, MDS, conjoint analysis, etc.
15.2OBJECTIVES
After studying this unit, students shall be able:
To understand basic concepts of multivariate analysis
To know about classification of multivariate techniques
To acquaint about application of multivariate techniques
To define the concept of multiple regression;
To prepare Multiple Regression Equation using Normal Equations;
To prepare Multiple Regression Equation in terms of Simple Correlation Coefficients;
To understand the concept of standard error of estimate for multiple regression
15.3 MULTIDIMENSIONAL SCALING—A MAPPING
TECHNIQUE The underlying presumptions that one makes while creating an MDS are:
• The individual tries to group objects together.
• The grouped objects are usually evaluated and compared with each other so that they can
coexist on a spatial map.
• The basis of evaluation is not unidimensional and the user is at all times (consciously or
unconsciously) using an underlying multidimensional space to evaluate the objects.
MDS essentially plots visually the perceptions and preferences of individuals singly and as a
group, regarding a group of objects, individuals or both; even when the information about the
dimensions or bases of evaluations is minimal.
Thus, the technique uses powerful mathematical tools in order to condense the data by
creating visual representations based on the similarities or dissimilarities of data on a spatial
map (Schiffman, et al. 1981). The map dimensions are hypothesized to be the attributes or
features that the person uses to form certain impressions about the object. One of the most

MS 110 Research Methodology Uttarakhand Open University
Unit 15 Statistical Tools in Data Analysis Page 272 of 434
widely used mathematical methods to create the maps is based on Kruskal's (1964) stress
calculations ( to be discussed further in the chapter).
MDS, as stated earlier, usually involves a comparison of sorts to create a relative position
MOS, as stated earlier, usually involves a comparison of sorts to create a relative position of
the considered objects. The comparison could be made on defined dimensions, or the
apparent basis of comparison, as was the case with the premium charged by the insurance
service providers in the illustration used by Prof. Krishna However, more often than not,
people make use of their own peculiar and sometimes subjective or perceived dimensions to
make the comparison. For example, it could be the trust or faith in the service provider in
handling the insured person's problems effectively. Thus, two objects or brands with the same
defined dimensions might be perceived very differently by the person because:
• The evaluations might not be solely based on defined or observed parameters.
• The subjective and the objective dimensions might be absolutely unrelated.
To simplify the process further, the technique presents the dependent variable ( which might
be a similarity or dissimilarity between the object or preferences) and then tries to figure out
what were the underlying independents or antecedents that led to the obtained map. Toe
advantage of this method is that the researcher's influence where he/she attempts to provide
the dimensions of comparison gets minimized._ The disadvantage, however, would be to
clearly figure out the dimension the respondents might have used for the comparison.
Thus, the researcher needs to be fairly well versed with the probable parameters that a person
might use for comparison. These perceived parameters might emerge from a quantitative
analysis of the respondents' decision process or through the researcher’s decision process or
through the researcher’s review of the secondary literature about the product. The inputs
obtained would have to be objectively—without any element of personal bias-assessed to
comprehend the defined or apparently and the hidden or subjective dimensions being used.
MDS is only one of the wide array of statistical techniques available for obtaining the object
map. The whole range of these methods grouped together is termed as perceptual mapping
techniques.
Before discussing the process of conducting the MDS, let us briefly attempt to understand the
underlying algorithm.
• The inputs obtained by the respondents could be in terms of objects, individuals, brands,
corporations or countries.
• The comparison could be in terms of similarities/dissimilarities, _e.~. how similar is Delhi
to Mumbai on a 7-point scale ranging from the most_diss1milar to the most similar, or
preferences, e.g. out of the five listed brands, indicate the one you prefer the most to the one
that is least preferred.
• As you can observe, the respondent is NOT given any dimension to measure similarity or
dissimilarity.

MS 110 Research Methodology Uttarakhand Open University
Unit 15 Statistical Tools in Data Analysis Page 273 of 434
15.4 USAGE OF MULTIDIMENSIONAL SCALING The MDS technique has multiple uses for the decision-maker in the business world.
However, the prime use of the technique is in the discipline of marketing.
Scale construction: Using the similarity or the preference data the researcher could attempt
to convert the comparisons into probable dimensions used for comparison and then reproduce
them as attributes in a structured-attribute-based questionnaire to validate the existence of the
parameters of comparison. For example, the respondents could be given two dimensions of
city culture and job opportunities as the two criteria to evaluate cities/ metros in India. The
values obtained in this objective evaluation can then be tested against the arbitrary
comparison of the cities to validate the results.
Brand image analysis: Many marketers use the technique to measure the possible gaps
between a company's or a brand's positioning with the consumer's brand image perception.
New product development: MDS is one of the most powerful tools to be used at the idea
generation or concept testing stage. It helps us identify quadrants that are less crowded and
where a clear product launch opportunity exists. Also if the product team has come up with
more than one probable concept, the preference of the consumers regarding these could be
tested by placing the preference on a spatial map to see which concept finds higher
acceptability on multiple dimensions.
Pricing studies: The marketer can use subjective maps to assess whether price is making a
difference to the preference or demand of the brand by measuring a spatial map of the
competing brand with and without the criteria of price to assess whether the positioning of
the brand is affected by price or not.
Assessing communication effectiveness: The brand manager could design a 'before' and
'after' study to assess the placement of the brand before and after a specific repositioning or a
new advertising campaign to see the impact of the same on the brand perception.
In fact, the MDS finds wide usage in the discipline of marketing, as the input data required is
easy to comprehend by the respondent and not too tedious in terms of assessing the same ·
with multiple variables. Secondly, with the availability of numerous computer programs,
perceptual maps can be easily drawn. And lastly, in a cluttered marketplace; a brand uses
subjective and psychological perceptions to create a brand image that stands out and is also
difficult to clone and copy by the competitor. The consumer respondent tries to make some
semblance of order in a world bombarded with brands and particularly associates one image
with one brand only.
15.5 CREATING SPATIAL MAPS USING
MULIDIMENSIONAL SCALING
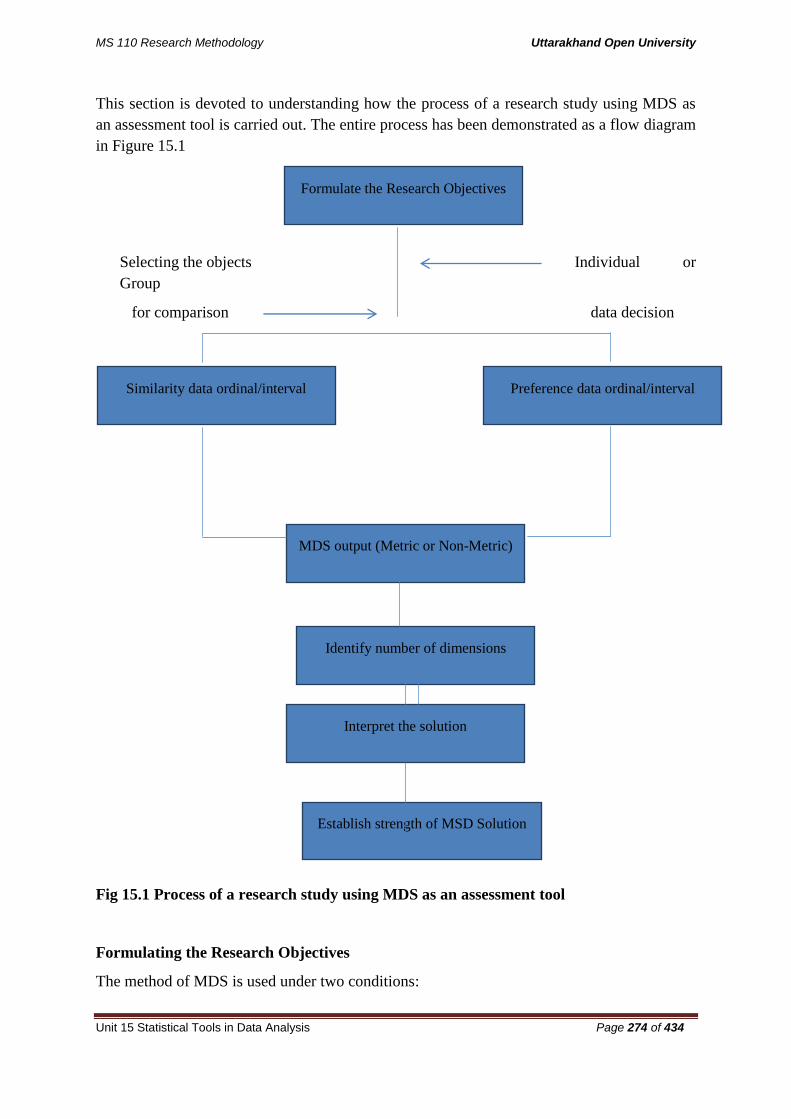
MS 110 Research Methodology Uttarakhand Open University
Unit 15 Statistical Tools in Data Analysis Page 274 of 434
This section is devoted to understanding how the process of a research study using MDS as
an assessment tool is carried out. The entire process has been demonstrated as a flow diagram
in Figure 15.1
Selecting the objects Individual or
Group
for comparison data decision
Fig 15.1 Process of a research study using MDS as an assessment tool
Formulating the Research Objectives
The method of MDS is used under two conditions:
Formulate the Research Objectives
Similarity data ordinal/interval Preference data ordinal/interval
MDS output (Metric or Non-Metric)
Identify number of dimensions
Interpret the solution
Establish strength of MSD Solution

MS 110 Research Methodology Uttarakhand Open University
Unit 15 Statistical Tools in Data Analysis Page 275 of 434
1. In case the researcher is carrying out an exploratory study in order to decipher the
probable underlying attributes or the causes of certain observed patterns of behavior.
2. It can also be used in descriptive research studies when the causal variables are not
defined and the objective is simply to present the comparative evaluations of objects,
individuals or brands in the consumer's mind space.
Thus, in both cases, the diffused approach to addressing the research topic is a common
factor. The strength of the technique is the ability of being able to present a probable spatial
map of respondent choices even without any stated attributes of comparison. Thus, the onus
to improve the solution obtained by the technique depends on the researcher's skill and
knowledge of the topic under study as he/she should be able to identify the possible·
dimensions used accurately. In order to correctly arrive at the decisions the researcher needs
to decide on the following:
The unit of analysis, i.e. would the comparison be for individuals, the subgroups, clusters or
for the entire sample under study?
Secondly, _the objects, brands or elements to be compared have to be carefully
selected.
Lastly, the decision on whether the study requires the respondent to identify:
the placement of the selected objects in the individual's mental map. Thus, the
distance, or similarities, between the objects needs to be ascertained.
whether the objective is to measure the order of preference amongst the
objects/brands.
Establishing individual or grouped data decision
The advantage of MDS is also that it can present the placement of objects in a unique
configuration for each individual as well as for the entire group. In case of multiple individual
maps, however, the researcher will constantly need to figure out the commonality of
placement to make any targeted decision.
However, in case the objective is to customize offerings-like holiday packages or event
planning· -then individual maps would be the ones to be considered. Also, when the sample
under study is very small-for example, a panel of judges measuring advertising effectiveness
or measuring the impact of different repositioning alternatives, these are situations that might
warrant the use of individual maps.
There are also situations ~hen the placement of objects at the macro or group level needs to
be assessed as the objective is to design strategies focused on a targeted population. In case
the population is not homogenous in composition and exists as small, more distinctly
homogenous clusters, then the researcher might look at the subgroup or clustered plots to
assess which is the segment in which the object/brand is valued more or less as compared to
the category leader. Also, the subgroup plots might identify new product opportunities in

MS 110 Research Methodology Uttarakhand Open University
Unit 15 Statistical Tools in Data Analysis Page 276 of 434
some clusters because when we look at the existing map of the objects in that duster, the
options being considered are too few and there is ample opportunity to enter the zone.
Selecting the objects for comparison
Once the research objective has been established and the decision on the unit of analysis has
been made, the next decision is ~o identify the objects that need to be compared for the
analysis. For example, in the study on cities the difficulty encountered was that the number of
cities was not sufficient to cover the spectrum on the probable dimensions. Thus, the
selection of cities that have a more rigid city culture or are more cosmopolitan and also which
vary in the kind of occupational opportunities available there was too small. Thus, we cannot
state with certainty whether the dimensions identified were the ones that were at the back of
the respondent's mind when the comparative evaluations were made.
Secondly, the objects to be considered must have some underlying dimension of an
observable or a subjective characteristic because sometimes, including an object or two
which are· oddities in the group might not do justice to the spatial representation. For
example, if we give the consumer a list of small cars like Alto, Santro, i10, Zen, Beat, Spark
and include in the comparison Reva, which is an electric car, or Beetle, which is a collector's
item. We are creating a dilemma in the consumer's mind and here, the perception will be very
different for a person who is unconsciously using environment-friendly as the basis and
another who is using mileage and engine power as the dimensions for evaluation.
Lastly, the researcher also needs to take care not to use very few or too many objects. If the
number is less, it becomes difficult to ascertain the dimensions used and too many would be
bothersome for the respondent, who would need to compare or rank too many objects or the
combination of objects. Even though there are no hard and fast rules, it is advisable to have a
minimum of eight objects and going beyond 25 objects is usually to be avoided. Another way
to select the number of objects is based on the number of desired or perceived dimensions of
comparison. Generally, as a thumb rule, we select objects in a 4: I ratio of the dimensions
desired. Thus, for a one-dimensional solution, we pick up at least four objects and at least
eight for a two- and 12 for a three-dimensional solution.
To illustrate the technique we are taking eight business and general interest magazines
namely- India Today, Outlook, Open, Frontline, Business India, Business world, Investor and
Society. The objective of the business development manager of a popular publication house
was to see whether a new magazine could be launched, and if so, how should he compose and
position the magazine. A study of 100 readers in North India, where the magazine would be
launched, was carried out to see what their perception about these magazines was and which
ones were the preferred magazines.
Thus, as we can see that the unit of analysis is the reader residing in North India who is aware
of all the eight magazines. This takes us to the question of scale construction to obtain the

MS 110 Research Methodology Uttarakhand Open University
Unit 15 Statistical Tools in Data Analysis Page 277 of 434
respondents input On the basis of the listed objectives, here, the data obtained should be on
the basis of similarity and secondly, on the basis of preference.
15.6 CONDUCTING MDS WITH SIMILARITY DATA When the objective is to determine the grouping of objects then the intention is to see the
plotting of the. Objects in an imaginary space on the basis of whether they seem close to or
far apart as compared to each other. Thus, to measure similarity, we use a Likert scale
question · as follows:
Given below are sets of magazines that you know of /have read. You are requested evaluate
them on whether you think they are similar or different when compared to each other.
Thus, all the possible pairs (n (n - 1)/2, where n is the number of stimuli) are given to the
respondent to evaluate. The idea being that the individual will use his/her own judgment to
evaluate the similarities between the magazines. The method of comparison would be as
follows:
Here, the data obtained is metric or on an interval scale. It is also possible to get non metric
or ordinal scale data, where paired magazines are given to the respondent and he/ she is asked
to rank them from the most similar pair to the most dissimilar pair. However, there is no
problem of analysis as most software programs are able to conduct the analysis on both the
metric as well as the non-metric data
Obtaining the data output for conducting MDS
Once the :data from all respondents has been gathered, it is collated to represent the aggregate
(group, plots were to be computed) dissimilarities between the brands and we get a matrix
that looks as given in Table l5.2. This, as we can see, is an 8 x 8 data matrix, where the rows
and columns are mirror images and reflect the magazines we were evaluating
Obtaining the MDS Solution
The MDS solution to get the spatial map of the consumer's perception can be obtained by
using any of the software as listed earlier. The nature of the input data-that is, metric or non-
metric- will determine the next step. For non-metric data, the software will produce or create
distances in a given dimensionality. The rank order of the estimated distances (distances
would be based on derived distances as explained earlier) would try to match the 'actual
(respondent's)' ranked data as far as possible.
On the other hand, in case the data is metric and intervally placed, as in our example, the
match between the output ( which is metric Euclidean distances) and the input ( that is
interval data) is stronger. However, in most instances, the results from metric and nonmetric
inputs are comparable and both can be used with equal ease .and reliability.
Thus, from the composite input data of Table 19.l different spatial maps were obtained for the
data. These maps were obtained from a unidimensional to a three-dimensional solution.

MS 110 Research Methodology Uttarakhand Open University
Unit 15 Statistical Tools in Data Analysis Page 278 of 434
15.7 IDENTIFYING THE NUMBER OF DIMENSIONS As stated in the earlier sections, usually, as the number of probable dimensions increases the
interpretation of the respondent's mental map of the objects improves. However, too many
dimensions can make a map tedious to interpret. Thus, one needs to balance the number of
cfunensions with the magnitude of stress measure that is acceptable to the researcher. In
practice, there are some rules that are used to assist in this decision. :
• Subject knowledge or familiarity with the product category might be used by the
researcher very often to figure out the underlying dimensions. However, this method needs to
be used with caution, as it requires a complete objective approach and minimization of the
researcher's own evaluative criteria and ·bias .
• Reader's comprehension: Even though multiple dimensions might be more accurate, for
the reader comprehending configurations' beyond a two-dimensional map is often not easy.
Thus, if the stress score is manageable and R-square value is 0.6 or above the researcher
might go along with a two-dimensional map only.
• Scree plots: As stated earlier, another way of ascertaining the optimal balance between
accuracy and dimensions is to use the scree plot. The stress scores obtained are plotted
against the number of dimensions and wherever the rate of change is negligible and the
plotted line becomes almost parallel to the X-axis is the point at which one decides to stop
and accept the solution.
For the above example, we made use of the ALSCAL process in SPSS and obtained three
spatial maps for three-, two-, and one-dimensional solutions. The obtained stress scores were
plotted against the corresponding dimensions and we obtained the plot shown in Figure 19.5.
As we can see, the elbow is lying somewhere between a two- and a three-dimensional
solution.
• R-square value: Another criterion that the researcher might like to use is the R-square
value. In case the R-square value is 0.6 or above, the solution is acceptable. As we can see
from Table 19.2, the two-dimensional solution is an acceptable one .
15.8 IMPORTANT TERMS FOR MULTIVARIATE ANALYSIS You must be familiar with most of the terms which are used in the context of multivariate
analysis because these same terms are used in univariate and bivariate analysis. But there are
some additional terms also which are frequently used in this context and you should be aware
of their meanings to properly understand the concept of multivariate analysis and these terms
are explained below:
Variate—A variate is a linear combination of variables with empirically determined weights.
The variables are specified by the researcher, whereas the weights are determined by the

MS 110 Research Methodology Uttarakhand Open University
Unit 15 Statistical Tools in Data Analysis Page 279 of 434
multivariate technique to meet a specific objective. Mathematically, it can be expressed as
follows:
Variate value = w1X1 + w2X2 + w3X3 + ………………….+ wnXn
Where Xn is the observed variable and wn is the weight determined by the multivariate
technique. Thus, the entire combination of the set is represented by a single value known as
variate value.
Metric and Non-metric variables—Metric variables refer to those data or variables which
are measured on an interval or ratio scale like age, weight, etc. Non-metric variables refer to
those data or variables which are measured on a nominal or ordinal scale like name, sex,
religion, etc.
Dependence and Interdependence techniques—When there are one or more variables that
are dependent on independent variables then dependence techniques are used. If the
classification of variables into dependent and independent categories is not possible and there
is mutual dependence between variables then interdependence techniques are used.
Explanatory and Criterion variables—The variable which causes change in the value of
another variable is known as independent or explanatory or exogenous variable. On the
contrary, the variable whose value is changed due to the effect of another variable is known
as dependent or criterion or endogenous variable.
Observable and Latent variables—Explanatory variable can be segregated into two
groups—observable and latent variable. If the explanatory variable can be directly observed
then it is known as observable variable and if it cannot be directly observed then it is known
as latent variable.
Dummy variable—It is also known as pseudo variable. This term is used in a technical sense
and is useful in algebraic manipulations in the context of multivariate analysis. Xi (i = 1,
2,…..m) is called a dummy variable if only one of Xi is 1 and the others are all zero.
Residuals—The residual represents the unexplained portion of the dependent variable. It is
that part of the dependent or endogenous variable which is not explained by a multivariate
technique. It can be used to identify unspecified relations or problems in estimation
technique.
Co-linearity—It expresses the relationship between two or more independent variable. If any
single independent variable is highly correlated with a set of other independent variables then
it is known as multi co-linearity.
15.9 MULTIPLE REGRESSION ANALYSIS In multiple regression we deal with one dependent response variable and many independent
explanatory variable.
Dependent variable (response variables)

MS 110 Research Methodology Uttarakhand Open University
Unit 15 Statistical Tools in Data Analysis Page 280 of 434
Independent variables (predictors/ explanatory variables).
What are dependent and independent variables?
DEPENDENT VARIABLE INDEPENDENT VARIABLE
Crop yield Rainfall, temperature, fertilizer
Scores IQ, number of hours studied
Girl’ marriage age Education level, parents education, parents
annual income
In multiple regression we seek to explain variation in one dependent variable in terms of
other independent variables which we can be observed.
For application of multiple regression techniques a random sample from some well-defined
population is observed for both dependent and independent variables.
The dependent variable should be measured on the interval of continuous scale.
The independent variable should be measured on an interval scale.
The relationship between the dependent variable and the independent variable should be
linear, although the independent variables can be correlated yet there must be no perfect
correlation among them, a situation called multi- collinearity.
The multiple regressions Model
Let X1, X2…XK denote k predictors (explanatory) variables to be investigated for their
relationship with a response variable Y.
Y=
Check Your Progress-A
State True/False against the following;
1. Metric variables are measured on nominal scale.
2. Hotelling’ T is a variation of MANOVA.
3. Varimax and Quartimax rotation are types of oblique rotation.
4. Canonical Correlation Analysis was propounded by Spearman.
5. Rows are cases and columns are variables in R-type factor analysis.
6. Co-linearity expresses the relationship between two dependent variables.

MS 110 Research Methodology Uttarakhand Open University
Unit 15 Statistical Tools in Data Analysis Page 281 of 434
15.10 DISCRIMINANT VARIABLES Multiple Discriminant analysis is such a method in the category of dependence methods
which is used in that case when the dependent or criterion variable is measured at nominal
level and independent or predictor variable is measured at interval or ratio scale. It is
particularly useful in that situation when individuals or objects can be classified into one of
two or more mutually exclusive and exhaustive groups on the basis of a set of independent
variables. The main purpose of this technique is to predict an object’s likelihood of belonging
to a particular group based on several independent variables. It is used for various purposes
like classification of objects into different categories or to examine any significant difference
between groups or to develop such discriminant function that discriminates between the
different groups or evaluation of accuracy of classification, etc.
Multiple Discriminant analysis is very useful in real life situations involving one non-
metric dependent variable and several metric independent variables. For example, suppose
we have to find out brand preference for two different brands, viz. A and B in relation to
individual’s income, age and education. In this case, regression analysis cannot be applied
because the dependent variable (brand preference) cannot be measured at interval or ratio
scale. Here, Discriminant analysis would be appropriate.
If the dependent variable can be classified into only two groups then the term ‘two
group Discriminant analysis’ or simply ‘Discriminant analysis’ is used. On the other hand,
when more than two groups can be formed out of dependent variable, then the term ‘Multiple
Discriminant Analysis’ is used.
Assumptions
There are some assumptions which must be fulfilled for the application of
Discriminant analysis which are as follows:
There should be mutually exclusive groups. Thus, each item or object should belong
to only one group and there should not be any confusion about its classification.
All cases must be independent.
There should not be much difference in the sizes of groups of dependent variable.
Independent variables should be measured at interval scale.
There should not be multi collinearity.
15.11 CONJOINT ANALYSIS The name conjoint analysis implies the study of the joint effects. In marketing application we
study the join effects of multiple product attributes on product choice. It is a versatile
marketing research technique that can provide valuable information for new product
development and forecasting, market segmentation and pricing decisions and can be answer
to a wide number of questions.

MS 110 Research Methodology Uttarakhand Open University
Unit 15 Statistical Tools in Data Analysis Page 282 of 434
Conjoint analysis is an advanced market research technique that gets under the skin of how
people make decisions and what they really value in products and services.
Conjoint analysis is perfect for answering questions such as what should we do? Build in
more features, or being our prices down or “which of these changes will hurt our competitors
most?”
15.12 FACTOR ANALYSIS Factor analysis is the most popular multivariate technique in the category of interdependence
methods. It is mainly used in those circumstances when there is clear interdependence among
variables and we want to find out latent or hidden factors which create this commonality. It
tries to represent a set of observed variables in terms of a number of common factors plus a
factor which is unique to each variable. In other words, factor analysis is a set of procedures
which is applied to resolve a large set of measured variables in terms of relatively few
categories, known as factors.
For example, we are interested in observing the set of attributes that car buyers
consider while purchasing a car. After consulting experts, we have identified a set of 11
features in a car on which consumers base their choice of car. These features are: Price of the
car (X1), Interior of the car (X2), Air-conditioning (X3), Fuel Economy (X4), Engine Power
(X5), Seating capacity (X6), Exterior (X7), Availability of loan (X9), Resale value of the car
(X10) and Safety (X11). If you carefully observe these variables then you can expect that many
of the attributes may be correlated. For example, a person who is sensitive towards the price
of a car would also be sensitive towards the fuel economy of the car and also about the
availability of convenient loan facility. This means that we can reduce the above set of
variables into factors which are highly correlated to one another. If we can summarize a large
number of measurements with a smaller number of factors without losing too much
information, we have achieved some economy of description, which is one of the goals of
scientific investigation.
In factor analysis, on the basis of correlation between variables, a large number of
variables are grouped into a smaller number of factors and the value of these factors or new
variables or latent variables is found out by adding up the values of the original variables.
These factors are linear combinations of data and factor loading representing the correlation
between the particular variable and factor is usually shown in the form of a data matrix. The
factor analysis model can be shown in the form of following data matrix or score matrix of n
objects with k measures or variables:

MS 110 Research Methodology Uttarakhand Open University
Unit 15 Statistical Tools in Data Analysis Page 283 of 434
Variables
a b c k
1
Objects 2 baaa
3
-
- ---
-
n
In this matrix, a1 shows the score of 1st object on variable a and so on. Scores on each
measure are standardized using the following formula:
xi =
Hence, the sum of scores in any column of matrix is 0 and the variance of scores in any
column is 1.0
Objectives
Factor analysis can be carried out for fulfilling different purposes, main of them are as
follows:
It can be used as an explanatory technique to summarize variables and identify
commonalities through the use of correlation between variables.
Through factor analysis, large volume of data can be maximally represented through
simplification. Thus, data reduction is a main objective of factor analysis.
Factor analysis allows us to test theories involving variables which are hard to measure
directly.
It also helps us in finding out the relative weight of each factor.
Assumptions
Factor analysis is based on following three basic assumptions:
The data should be metric. In case of non-metric data, dummy variables need to be used.
The sample size must be sufficient so that true structures can be identified. Generally, it
should vary from 5 to 20.
The variables should be correlated to each other.
a1 b1 c1 k1
a2 b2 c2 k2
a3 b3 c3 k3
- - - -
- - - -
- - - -
an bn cn kn

MS 110 Research Methodology Uttarakhand Open University
Unit 15 Statistical Tools in Data Analysis Page 284 of 434
15.13 CLUSTER ANALYSIS Let us first understand what is cluster?
Cluster is a group of relatively homogenous cases or observations. Objects in a cluster are
similar to each other. They are also dissimilar to objects outside the cluster, particular
objects in other cluster.
What is cluster analysis?
Cluster analysis is a classification method that is used to arrange a set of objects into
clusters.
The cluster analysis is an exploratory data analysis which aims at sorting different
objects into groups in a way that the degrees of association between two objects is
maximum if they belong to the same group or minimal otherwise.
Clustering techniques have been applied to a wide variety of research problem in the
field of medicine, archaeology, biology and social science.
FACTOR
VARIABLES
FACTOR
VARIABLES
Fig 15.2 Cluster Analysis Example
SIZE
HEIGHT
WEIGHT
SOCIAL
STATUS
OCCUPATI
ON
EDUCATIO
N
SOURCES
OF INCOME

MS 110 Research Methodology Uttarakhand Open University
Unit 15 Statistical Tools in Data Analysis Page 285 of 434
15.14 MULTIDIMENSIONAL SCALING Multidimensional scaling consists of multivariate techniques, used to measure human
perceptions and preferences towards some stimuli (object) like products, organization, places,
events, and brands and positioning them in a perceptual space.
Multidimensional scaling uncovers underlying dimensions based on a series of similarity or
distance judgment by subject. That is MDS may be thought of as a way of representing
subjective attributes in objective scales. A type of perceptual mapping of the central MDS
output takes the form of a set of scatter plots (perceptual maps)in which the axes are the
underlying dimensions and the points are the products, candidate, opinion and other objects
of comparison.
The objective of MDS is to array points in multidimensional space such that the distance
separating points physically on the scatter plot reflect as closely as possible the subjective
distance obtained by surveying subjects.
Metric and non-metric multidimensional scaling
The scale value of each stimulus may be either metric or non-metric. The metric data are
interval scaled or ration or ration scaled whereas non metric data are ordinal scaled.
For a set of observed similarities(or distance)between every pair of N items the problem is to
find out the representation of the item in few dimensions such that inter item proximities
nearly’ the original similarities(or distance).
The numerical measure of closeness is called the stress.
It is possible to arrange the N items in low dimensional coordinates system using only the
rank orders of the N (N-1)/2 original similarities and not their magnitudes.
When only this ordinal information is used to obtain a geometric representation in q-
dimension (q<N-1) the process is called is called metric multidimensional scaling.
Multivariate analysis of variance (MANOVA)
This technique examines the relationship between several categorical independent variables
and two or more metric dependent variables. Whereas analysis of variance (ANOVA) assess
the difference between groups (by using t test for 2means and f test between 3 or more
means), MANOVA examines the dependence relationship between a set of dependent
measures across a set of groups. Typically this analysis is used in experimental design, and
usually a hypothesized relationship between dependent measures is used. This technique is
slightly different in that independent variables are categorical and the dependent variable is
metric.
Canonical Analysis
The most flexible of the multivariate techniques, canonical correlation simultaneously
correlates several dependent variables. This powerful technique utilizes metric independent
variables unlike MANOVA, such as sales, satisfaction levels and usage levels. It can also

MS 110 Research Methodology Uttarakhand Open University
Unit 15 Statistical Tools in Data Analysis Page 286 of 434
utilize non metric categorical variables. This techniques has the fewest restrictions of any of
the multivariate techniques so the results should be interpreted with caution due to the relaxed
assumptions often the dependent variables are related and the independent variables are
related so finding a relationship is difficult without a techniques like canonical correlation.
Technique Purpose No of
depende
nt
No. of
independe
nt
Types of Measurement
Dependent Independent
Multiple
Regression
to simultaneously
investigate effects of
several independent
variables on a
dependent variable.
1 2 or more interval or
ratio
interval or
ratio
Discriminant
Analysis
To predict the
probability that an
object or individual
will belong in one or
two or more Mutually
Exclusive Categories
based on Several
Independent
Variables
1 2 or more nominal interval or
ratio
Canonical
Analysis
To determine Degree
of linear association
between two sets of
variables of each
consisting of several
variables
2 or more 2 or more interval or
ratio
interval or
ratio
MANOVA To determine if
statistically
significant difference
of means of several
variables occurs
simultaneously
between two level of
a variables.
2 or more 1 interval or
ratio
nominal
Table 15.3 Summary of multivariate techniques for the analysis of dependence
MS 110 Research Methodology Uttarakhand Open University
Unit 15 Statistical Tools in Data Analysis Page 287 of 434
15.15 SUMMARY In total, multiple regression is an extension of technique of simple regression under which
the interrelationship between three or more variables are studied and to estimate the most
probable value of the dependent variable for given values of the independent variables. The
multiple regression equations can be worked out by ways of multiple regression equation
using normal equation and multiple regression equation in terms of simple correlation
coefficient. Further, the standard error of estimate measures the reliability of the estimates
given by the multiple regression equation. It shows to what extent the estimated valued
given by the regression equations are closer to the actual values. As far as coefficient of
determination in multiple regression ( ) is concerned, it represents the proportion
(fraction) of the total variation in the dependent variable that has been explained by the
independent variables in the multiple regression equation.
Multivariate analysis refers to all statistical methods that simultaneously analyze multiple
measurements on each individual or object under investigation. Multivariate analysis
originated from univariate and bivariate statistics. Multivariate techniques can be classified
on the basis of three factors: (i) grouping of variables into dependent and independent
variables, (ii) number of dependent variables treated in a single analysis, (iii) the scale of
measurement of the variables. Multivariate analysis has primarily been classified into two
groups, dependence and interdependence technique, based on the relationship they examine.
In this unit, you have studied about the concept of some popular multivariate techniques.
Multiple regression analysis is a measure of relationship involving a single dependent
variable and two or more independent variables. Multiple Discriminant analysis is used
when dependent variable is nominally scaled and independent variable is interval or ratio
scaled. Multivariate analysis of variance or MANOVA analyses significant differences
between means for more than one metric dependent variable at a time. Canonical correlation
analysis is used to predict a set of dependent variables from their joint covariance with a set
of explanatory variables. Conjoint analysis is a decompositional method used to evaluate
objects presented as a combination of attributes. All these techniques belong to the category
of dependence methods.
Factor analysis, Cluster analysis, Multidimensional scaling and Latent structure analysis are
included in the category of interdependence methods. Factor analysis is set of procedures
used for data reduction and summarizing data. Two important methods of factor analysis are
centroid method and principal component analysis method. Cluster analysis is used for
combining observations into homogeneous groups. Multidimensional scaling is a data
reduction technique whose main objective is to uncover hidden structure of a data set.

MS 110 Research Methodology Uttarakhand Open University
Unit 15 Statistical Tools in Data Analysis Page 288 of 434
15.16 GLOSSARY
Stimulus: a thing or event that evokes a specific functional reaction in an organ or tissue.
Forecast: a prediction or estimate of future events, especially coming weather or a financial
trend.
Homogenous: consisting of parts all of the same kind.
15.17 ANSWER TO CHECK YOUR PROGRESS
Check Your Progress- A
1) False
2) True
3) False
4) False
5) True
6) False
15.18 REFERENCES
Neogi U. K “Research Methodology Tools and Techniques” Variety Book
Publication.
Kumar Ranjeet “Research Methodology” Pearson Education.
Young V. Pauline, “Scientific Social Surveys and Research”.
Gopal, M.H. “An Introduction to Research Procedure in Social Sciences”.
Michacl, V. P. “Research Methods in Management’. Himalaya Publishing
House.
Kothari C.R. “Research Methodology” Vikas Publication.
Gode and Hatt. “Methods in Social Research”. Tata Mc Graw Hill, New Delhi.

MS 110 Research Methodology Uttarakhand Open University
Unit 15 Statistical Tools in Data Analysis Page 289 of 434
15.19 SUGGESTED READINGS
1. Roy Ramendu & Banerjee Subhojit, ‘Fundamentals of Research Methodology’
Kitab Mahal, Allahabad
2. Kothari C. R., ‘Research Methodology: Methods & Techniques’, New Age
International Publishers, New Delhi
3. Gupta Shashi K. & Rangi Praneet, ‘Research Methodology (Methods, Tools and
Techniques)’, Kalyani Publishers, New Delhi
15.20 TERMINAL QUESTIONS
Q1. Analyze the discriminant analysis with the help of an example.
Q2. Explain conjoint analysis with the help of an example.
Q3. What is factor analysis?
Q4. Define Cluster analysis with an example.

MS 110 Research Methodology Uttarakhand Open University
Unit 16 Multivariate Analysis Page 290 of 434
UNIT 16 MULTIVARIATE ANALYSIS
16.1 Introduction
16.2 Objectives
16.3 About Multivariate Analysis
16.4 Objectives of Multivariate Analysis
16.5 Advantages and Disadvantages of Multivariate Analysis
16.6 Applications of Multivariate Analysis
16.7 Major Techniques of Multivariate Analysis
16.8 Summary
16.9 Glossary
16.10 Answers to Check Your Progress
16.11References
16.12 Suggested Readings
16.13 Terminal Questions
16.1 INTRODUCTION
Multivariate analysis is an ordinary term used to divide a family of analytic methods featured
by the simultaneous analysis of k independent variables and m dependent variables. If an
analysis involves, for instance, four independent variables and two dependent variables, deal
with simultaneously, it is a multivariate analysis.
16.2 OBJECTIVES After studying this Unit, you shall be in a position to
Comprehend the nature of Multivariate Analysis
Know the objectives of Multivariate Analysis
Comprehend the advantages and disadvantages of multivariate analysis
Understand the applications of Multivariate Analysis
Know about major technique of Multivariate Analysis

MS 110 Research Methodology Uttarakhand Open University
Unit 16 Multivariate Analysis Page 291 of 434
16.3 ABOUT MULTIVARIATE ANALYSIS Multivariate analysis may be expressed as a group of methods for analysis of data in which
various independent observations represent a dependent variable convenient to define such
relationship. The techniques that consider different relationships among variables are known
as multivariate analysis. According to Zikmund (2003), multivariate analysis entails
statistical methods that permit the investigation of more than two variables at the same time.
Of all analytical methods, multivariate techniques are the most forceful and suitable for all
sorts of research including behavioral, scientific and educational.
According to Kerlinger, multivariate techniques are largely logical extensions of uni-variate
techniques. Multiple regression analysis is a technique of analyzing the contribution of
multiple independent variables to single dependent variable. It is the most applicable and
forceful method that can treat a number of independent variables, continuous and categorical,
through the number of variables.is restricted by practical issues.
Canonical correlation is a logical extension of multiple regressions. Indeed it is a multiple
regression method making addition of greater than single dependent variable to the multiple
regression models. It treats the relations between sets of independent variables and sets of
dependent variables. As such, it is a theoretically powerful analytical technique. Its
constraints, however, limit its utility, particularly in the interpretation of the results. There is
also a close relationship between discriminant analysis and multiple regressions. Based on the
sets of measures, discriminant analysis discriminates groups from one another and assigns
individuals to groups on the basis of their test scores.
However, factor analysis is essentially unlike in kind and purpose from the other multivariate
methods. It helps the researcher uncover and identify the unities or dimensions, known as
factors, behind many measures.
16.4 OBJECTIVES OF MULTIVARIATE ANALYSIS Multivariate analysis has the following main objectives:
Transform large number of observations into smaller composite scores
Predicting the variance in the dependent variable on the basis of its covariance
with all the independent variables.
Classify persons or objects into one of the two or greater than two jointly
exclusive and exhausting groups based on groups of independent variables.
Assists in pattern recognition by giving an understanding of the crucial
patterns & relationships underlying in data
Facilitate deeper insights into data permitting the researcher to model and see
complex data for deeper analysis
MS 110 Research Methodology Uttarakhand Open University
Unit 16 Multivariate Analysis Page 292 of 434
Helps in predicting behavior and bring improvements in forecasting of similar
outcomes applying predictive tools
16.5 ADVANTAGES AND DISADVANTAGES OF
MULTIVARIATE ANALYSIS The chief advantage of multivariate analysis is that since it considers greater than
one factor of independent variables that exercise impact on the variability of
dependent variable, the conclusion is more exact and close to the real life position.
Multivariate techniques permit researchers to look at relationships among
variables in an encompassing way and to express relationship in quantitative
manner between variables. They can manage association between variables by
employing techniques such as correlation and multiple regression as well as cross
tabulation, They also bring into focus other variables to establish the relationships
of the dependent and independent variables or to stipulate the situations under
which the association occurs. Advantages of multivariate analysis consist of an
ability to have a view of a more rational picture than looking at a single variable.
Moreover, these techniques furnish a forceful test of significance in comparison to
uni-variate techniques.
Multivariate techniques are complex involving high level of mathematical
computations that require a statistical program for data analysis. These statistical
programs can be costly for a person to get.
Multivariate analysis technique is limited in the respect that students find it uneasy
to interpret the results of statistical modelling. Multivariate techniques need large
sample of data in order to provide applicable results otherwise; the findings are
useless because of standard errors of high level. Standard errors decide how
confident the investigator can be of the findings. However, they are greater
confident of the results obtained from a large sample. Conducting statistical
programs is straightforward but needs statistical training to draw meaning from
the data.
16.6 APPLICATIONS OF MULTIVARIATE ANALYSIS The techniques of multivariate analysis are successfully employed in the following
areas:
1. The multivariate analysis is applied in Econometrics or decision-making in
Economics relating are issues such as impact of inflation, money circulation,
lowering of tariffs, etc. on price rise
2. The multivariate analysis is also used in sociological decision-making such as
divorce rates, and their cause-effect relationship, with marriage, social
demographics and income levels.

MS 110 Research Methodology Uttarakhand Open University
Unit 16 Multivariate Analysis Page 293 of 434
3. Several agrarian predictions such as impacts of rain, fertilizers and
mechanization on agricultural yields per acre are made based on multivariate
analysis.
4. Analysis of Drug testing such as impact of new drugs on the main disease and
other side effects is carried out by multivariate analysis
5. The multivariate analysis helps State fiscal decision making such as impact of
tax structure, duties, penalty rates etc, on the government revenue.
6. The multivariate analysis helps in industrial decision-making such as plant
location which depends on infrastructure, availability of raw material,
distribution channels etc.
Check Your Progress-A
Q1. Define Multivariate Analysis.
--------------------------------------------------------------------------------------------------------
--------------------------------------------------------------------------------------------------------
--------------------------------------------------------------------------------------------------------
Q2. List the advantages and disadvantages of Multivariate Analysis.
--------------------------------------------------------------------------------------------------------
--------------------------------------------------------------------------------------------------------
--------------------------------------------------------------------------------------------------------
16.7 MAJOR TECHNIQUES OF MULTIVARIATE ANALYSIS Important methods of multivariate analysis are;
16.7.1 FACTOR ANALYSIS
Factor analysis is a most preferred ‘analysis of interdependence’ technique. In
interdependence studies, all the variables are on the same level, and the analysis is related
with the entire group of relationship among the variables that feature the objects. The
following picture gives an idea of the factor analysis.

MS 110 Research Methodology Uttarakhand Open University
Unit 16 Multivariate Analysis Page 294 of 434
Figure 16.1 Factor Analysis (Adapted from prompted.com)
Different from regression or discriminate analysis, factor analysis concentrates on the entire
group of interrelationships the variables exhibit. At the level of conception, a factor is a
qualitative aspect of the data that tries to portray the way in which entities vary, much as the
length of an object or the flavor of product expresses a qualitative aspect on which objects
may or may not vary. Factor analysis is a process that considers different variables or objects
and recognize factor in common which exhibit their inter-correlation. For example, high
correlation can be attributed to association between grades in computer course to the factor of
intelligence or the association between certain attributes of coffee and factor of acidity.
The main purpose of Factor analysis is data reduction, identification of structure and scaling.
Factor analysis is employed for making smaller in size a lot of data to a level where the
analyst is able to deal with it. For example, a researcher has collected data on 40 attributes of
a brand. The data may be such that the researcher finds it difficult to deal with it. The factor
analysis of data may prove helpful in curtailing 40 attributes to 10-15 attributes.
Factor analysis has been employed to remove inferior substance from original sets of scale
items by separating items not revealing a common core as well as to name the dimension a
measure captures. It is also utilized in the understanding of lifestyles and psychographic
research issues in which it is used to formulate consumer profiles that express different things
such people attitudes, activities, interests, opinions, perceptions and performances, so as to
better anticipate their consumption and purchase patterns. One of the major motivations for
lifestyles and psychographic studies has been the usually insufficient nature of market
segments defined using customary demographic measures.
In order to understand the foundation structure underlying a set of measures, the factor
analysis may also be helpful. For example, the 40 attributes may be curtailed to tend factors
the research identified. Useful in predicating a response variable will be numerous. The
difficulties of too many independent variables can be avoided by using factor analysis.

MS 110 Research Methodology Uttarakhand Open University
Unit 16 Multivariate Analysis Page 295 of 434
Import methods of factor analysis are principle components and centroid method. The
principle components method include the conventional method and an alternative method..
The centroid method maximizes the sum of absolute loadings of each factor.
In real life situations, the quantity of independent variables is numerous. For example, the
marketing manager of a two-wheeler company designed a questionnaire to study the
customers; feedback about its two wheeler and is curious to know the factors of his study. He
identified six variables:
1. Efficiency in Fuel (X1)
2. Life time of the two wheeler (X2)
3. Convenience in handling (X3)
4. Level of quality of genuine spares (X4 )
5. Frequency of breakdown (X5)
6. Price of two wheeler (X6)
The application of factor analysis categorizes these factors in to three factors:
X1, X2, X4 and X5 – Factor 1
X6 – Factor 2
X3 –Factor 3
If all the factors identified are significant, they are retained for further analysis. This grouping
of variables in to factors reveals that these factors can be named as
Factor 1 – Technical factor
Factor 2- Price factor
Factor 3- Personal factor.
In any other study, opinion of the customers can be obtained on these three
factors.
The factor analysis has certain limitations as the statistical methods do not support factor
analysis. A research may obtain different results by using loading factors in different ways.
Moreover, a large number of attributes are needed to study factor analysis. In some cases,
complex factors are employed which respondents find complex to comprehend.
16.7.2 CLUSTER ANALYSIS
The Cluster Analysis is an explorative analysis attempting to identify structures within the
data. Its name is also segmentation analysis. It particularly identifies identical groups of
cases. It identifies groups of cases if the grouping is not earlier known. Since it is explorative
in nature it does not distinguish between dependent and independent variables. The several
cluster analysis techniques that SPSS offers can deal with binary, nominal, ordinal, and scale
data.

MS 110 Research Methodology Uttarakhand Open University
Unit 16 Multivariate Analysis Page 296 of 434
Figure 16.2 Cluster (adapted from training research.rockstar.com)
In most of analyses a discriminate analysis pursues a cluster analysis as the cluster analysis
doesn't hold any measures of goodness of work or significance tests. The discriminate
analysis is the foundation for cluster analysis to investigate if the groups are statistically
significant and if the variables are in a position to significantly discriminate.
An example of cluster analysis is shown in table 15.1
System Objects/Persons Variables/Attributes
Educational System Faculty
Students
Electives taken
Specialization
Finance System Companies
Branches
Financial performance
variables
Services rendered
Personnel System Employees Skills
Demographic factors
Production System Components
Machines
Machines
Components
Marketing System Customers
Customers
Buying behavior
Demographic data
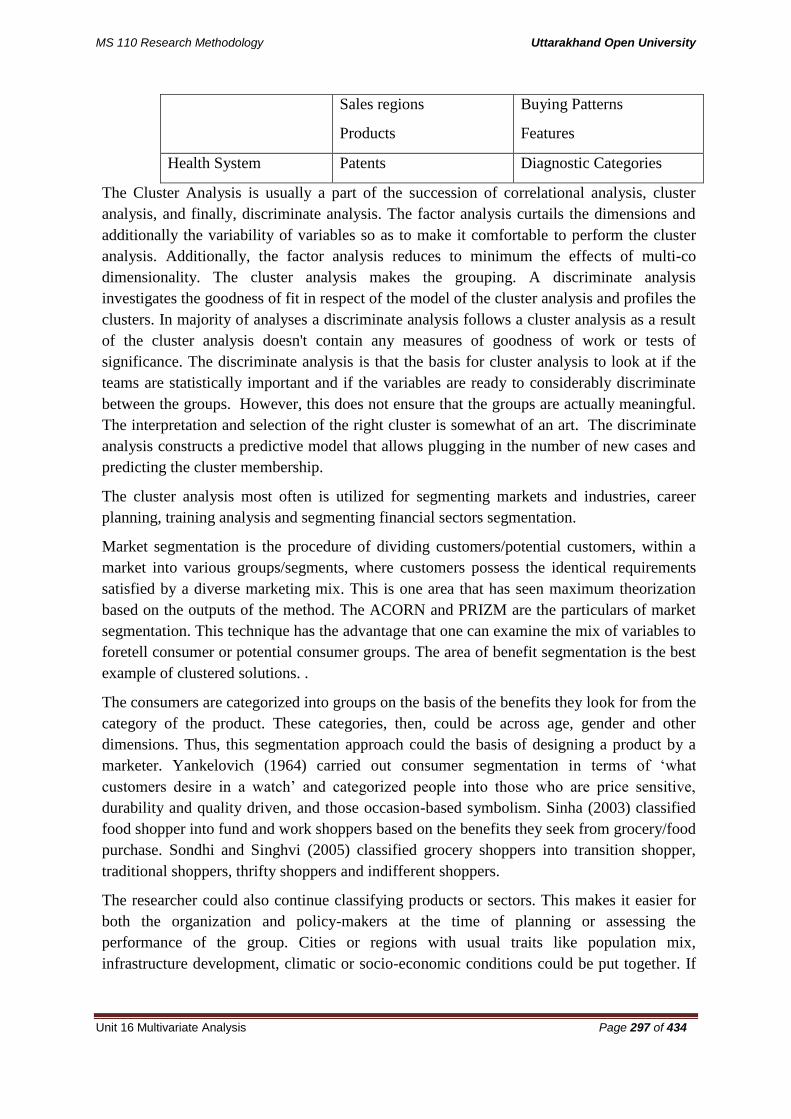
MS 110 Research Methodology Uttarakhand Open University
Unit 16 Multivariate Analysis Page 297 of 434
Sales regions
Products
Buying Patterns
Features
Health System Patents Diagnostic Categories
The Cluster Analysis is usually a part of the succession of correlational analysis, cluster
analysis, and finally, discriminate analysis. The factor analysis curtails the dimensions and
additionally the variability of variables so as to make it comfortable to perform the cluster
analysis. Additionally, the factor analysis reduces to minimum the effects of multi-co
dimensionality. The cluster analysis makes the grouping. A discriminate analysis
investigates the goodness of fit in respect of the model of the cluster analysis and profiles the
clusters. In majority of analyses a discriminate analysis follows a cluster analysis as a result
of the cluster analysis doesn't contain any measures of goodness of work or tests of
significance. The discriminate analysis is that the basis for cluster analysis to look at if the
teams are statistically important and if the variables are ready to considerably discriminate
between the groups. However, this does not ensure that the groups are actually meaningful.
The interpretation and selection of the right cluster is somewhat of an art. The discriminate
analysis constructs a predictive model that allows plugging in the number of new cases and
predicting the cluster membership.
The cluster analysis most often is utilized for segmenting markets and industries, career
planning, training analysis and segmenting financial sectors segmentation.
Market segmentation is the procedure of dividing customers/potential customers, within a
market into various groups/segments, where customers possess the identical requirements
satisfied by a diverse marketing mix. This is one area that has seen maximum theorization
based on the outputs of the method. The ACORN and PRIZM are the particulars of market
segmentation. This technique has the advantage that one can examine the mix of variables to
foretell consumer or potential consumer groups. The area of benefit segmentation is the best
example of clustered solutions. .
The consumers are categorized into groups on the basis of the benefits they look for from the
category of the product. These categories, then, could be across age, gender and other
dimensions. Thus, this segmentation approach could the basis of designing a product by a
marketer. Yankelovich (1964) carried out consumer segmentation in terms of ‘what
customers desire in a watch’ and categorized people into those who are price sensitive,
durability and quality driven, and those occasion-based symbolism. Sinha (2003) classified
food shopper into fund and work shoppers based on the benefits they seek from grocery/food
purchase. Sondhi and Singhvi (2005) classified grocery shoppers into transition shopper,
traditional shoppers, thrifty shoppers and indifferent shoppers.
The researcher could also continue classifying products or sectors. This makes it easier for
both the organization and policy-makers at the time of planning or assessing the
performance of the group. Cities or regions with usual traits like population mix,
infrastructure development, climatic or socio-economic conditions could be put together. If

MS 110 Research Methodology Uttarakhand Open University
Unit 16 Multivariate Analysis Page 298 of 434
one city in Kerala and another in Andhra Pradesh are in one cluster, then the organization is
in a position to plan and conduct an identical business approach in the two localities..
In the space of human resources the technique may be applied to group individuals into
clusters on the premise of their instructional qualifications, experience, ability and
aspiration. This cluster will assist the Human Resource division to effectively manage
training and human resource development for the members of various clusters purposefully.
In segmenting money sectors various factors like material value, money allocation,
seasonality and alternative factors area utilized to cluster sectors along to understand the
performance and growth of a group of industries. This additionally assists the policy
designers and the money analysts in evaluating the financial consequence. A variety of
researchers utilize grouping principles to cluster customers and their investment patterns on
the premise of the mix of various variables and advantages sought-after.
Whenever a researcher wants to manage the data and perceives that there could be multiple
factors involved, cluster analysis is the best classification technique at his disposal.
The clustering techniques can be grouped into hierarchical clustering techniques and non-
hierarchical techniques. The hierarchical clustering techniques consist of agglomerative and
divisive method. In non-hierarchical clustering technique, an object of one cluster is made
using agglomerative and divisive methods.
16.7.3 DISCRIMINANT ANALYSIS
Discriminant analysis is suitable for a nominal dependent variable and interval independent
variables. Nominal dependent variables are very usual in marketing. For example, a
contented customer, service seeking customer or non-service seeking customer. This is the
why discriminate analysis has obtained large application in marketing research.
The main objectives of discriminate analysis are:
To obtain a linear mix of variables discriminating between classes of
dependent variable in the optimum manner.
To get independent variables comparatively better for discriminating
among groups,
To establish the statistical significance of the discriminate function and
identifies statistical difference among groups as predictors.
To grow the procedure for assigning new objects, firms or individuals
whose profile are available to one of the two groups.
To assess the exactness of categorization of customers,
The central idea is to recognize the linear existence of the independent variables that
create the mean scores across groups of the dependent variables on this linear
combination maximally different. This linear combination is known as the discriminate
function. It can be expressed in the form:

MS 110 Research Methodology Uttarakhand Open University
Unit 16 Multivariate Analysis Page 299 of 434
DF = V1X1+V2X2+…………VmXm
The criterion applied to determine when group means are maximally different is
the familiar ANOVA (f-Test) for the different among them, the V’s are derived
such that
F = SS between /SS within, is maximized
Confusion matrix for customer satisfaction is
Predicted category
Actual category Satisfied Unsatisfied
Satisfied 400 20
Unsatisfied 30 50
The output of discriminate analysis consisting of the values of the V’s plus is called a
confusion matrix. The matrix compares the group of the dependent variable
discriminating functions foretell with the category involved in it.
Discriminate analysis has been used quite extensively in marketing Discriminate analysis
can study identification of new buyer group, consumer behavior toward new products or
brands, study on brand loyalty, relationship between variables and checklist of properties
of new products.
The Scale construction, segment discrimination and perceptual mapping are the specific
uses of discriminate analysis.
Discriminate analysis is employed to spot the discriminating statements to which
individuals having numerous views can respond in different manner. For instance, just in
case one needs to assess individuals who confide that corporate governance is that the
responsibility of policy-makers against those that suppose it has to be self-driven or
individual central, one might generate variety of statements and then conduct a pilot
study and choose solely those statements regarding which two groups vary considerably.
Most business managers acknowledge that the population being considered will never be
entirely homogeneous in composition. Therefore, to know what the key variables on
which are two or greater than two groups vary from each other, this method is very
purposeful.
This technique is also applied largely to make attribute-based maps describing of the
respondents’ mental positioning of brands. The technique has the advantage of
presenting brands or objects and the attributes on the same map. Therefore, the business
manager can decide unique attribute selling proposition of which brand and which are
the attributes valued by the respondent but there is absence of brand that currently fulfills
that need.
The following are the steps applied to two-group discriminant analysis
1. Input the data. Let the predictor variables represent the two factors X1 and X2.
MS 110 Research Methodology Uttarakhand Open University
Unit 16 Multivariate Analysis Page 300 of 434
2. Classify the data into two mutually exclusive and collectively exhaustive
groups say G1 and G2.
3. Find the mean of X1 and X2 in each group. Also find the grand mean of X1
and X2.
4. In each group, find Σ X2
1, ΣX2
2, and ΣX1 X2
5. Define the linear composite as Y = aX1 + bX2
6. Find the values of a and b by solving the normal equations
7. In each group, find the discriminant score for each combination of the
variables X1 and X2 . Then find the average of the discriminant score of each
group and also the grand mean of the discriminant scores for the entire
problems.
8. Find the variability between groups (VBG )
9. Find the variability within groups (VBG)
10. Find the discriminant ratio and identify the predictor variables which have
more importance when compared to the other predictor variables.
11. Validate the discriminant function using the given data sets by forming groups
based on the critical discriminant score. If the discriminant score of a data set
is less than the critical discriminant score, then include the member of the
entity representing that data set in the ‘Below’ category; otherwise, include it
in the ‘Above’ category.
16.7.4 CONJOINT ANALYSIS
The conjoint analysis was developed in the seventies. This technique facilitates
businesses to figure out and quantify the secret rules people utilize to trade-offs between
totally different merchandise and services and to gauge the values of various options or
parts of the offer. By knowing exactly the way people decide and what they give
importance to in merchandise and services, the marker will establish the sweet spot or
optimum level of options and services that equalize importance to the client against value
to the corporate and foretell potential demand or market share in an increasingly
competitive market situation.
Conjoint analysis is a method which measures the customer satisfaction. It is related with
the estimation of a mixture of two or greater than two attributes that are necessary in
marketing decision from customers’ viewpoint. In conjoint analysis, market research
advises a new combination based on the present characteristics. For example, a bank
would really like to grasp the fascinating combination of attributes to regular borrowers -
rate of interest, amount of installment and date of payment.
Let the number of factors influencing the preference of a product be m and ni be the levels
of the ith factors where i varies from 1 to me. Then the total number of product profiles or
product concepts will be as follows:
N1 x n2 x n3…..x nm

MS 110 Research Methodology Uttarakhand Open University
Unit 16 Multivariate Analysis Page 301 of 434
Think of a state-of-the art computer in PC range. The customer preference of the product
is assumed to be affected by the price, clock speed and disk capacity.
Further, the number of levels of each of the factors be:
Price (Rs.35000, Rs.40,000 and Rs.50,000)
Clock Speed (1 GHz, 2 GHz, 3 GHz)
Hard disk capacity (20 GB, 40 GB)
The complete factorial combinations of the product profiles of the factors and respective
level are:
Profile a: Price Rs.35000, Speed= 1 GHz, Disk Capacity = 20 GB
Profile b: Price Rs.35000, Speed= 1 GHz, Disk Capacity= 40 GB
Profile c: Price Rs.35000, Speed = 2 GHz, Disk Capacity = 20GB
Profile d: Price Rs.35000, Speed = 2 GHz, Disk Capacity = 40 GB
The value for each of the levels of different factors can be computed applying conjoint
analysis. The most attractive product profile is the mix of levels by choosing one from
each of the factors such that each level included in the profile holds the maximum utility
within the respective factor.
Conjoint analysis is helpful for products which may be offered in several combinations
for which the consumer has to trade-off. Therefore, it is more useful for products that
need a more buying process for consumers. The attributes for which the various levels
are to be tested, might not be the ones that the consumer think useful while making a
selection. It is not forever right to increase the utility scores across respondents unless
the investigator is certain about the homogeneity of the group.
There are two approaches for conjoint analysis- one is two factor evaluation approach
and the other is multi-factor evaluation approach. The multi-factor approach is like
complete factorial design. It is the most ideal approach in terms of integrity in thinking
while customers express their preferences. With the increase in the number of factors,
the customers will have difficulty in integration of the levels of various factors. The
multi factor evaluation approach defines different product profiles considering all the
factors altogether.
The number of factors being very high, it is not likely to be straightforward for the
respondents to integrated idea about a product profile and express his/her rating in terms
of preference value or rank of that product profile. In such circumstances, one would
prefer to use two factor evaluation.
The two factor approach follows the following steps:
1. Decide the number of two factor tables for the given number of factors.
2. Administer all n(n-1)/2 two factor tables one by one to the respondent and
obtain his or her ranks for different cells in that table. In each two-factor table,
rank 1 is the highest and the lowest rank if equal to the total number of cells in
it.

MS 110 Research Methodology Uttarakhand Open University
Unit 16 Multivariate Analysis Page 302 of 434
3. Get utility weights of the levels of each factor such that the estimated ranks of
the cells of each two factor table using these part worth correlated highly with
the original ranks of the cells of the respective two factor table.
4. Get the estimated ranks of each cells in each of the two factor tables using the
respective row and column part-worths. The estimated rank of a cell in a two
factor table is the sum of the part –worths values of the corresponding level of
the cell.
5. Repeat step 2 through step 4 for necessary number of respondents.
6. By comparing the estimated ranks of al the two factor tables of various
respondents, identify possible market segments.
16.7.5 MULTIPLE REGRESSION ANALYSIS
Multiple regression analysis is the most frequently used multivariate technique. It
investigates the relation of two or more than two metric independent variables and. one
metric dependent variable. This method depends upon deciding the linear relationship
with the minimum sum of various response of squared variances. The normality,
linearity, and equal variance assumption receive more observation. The beta coefficients
are the marginal effects of each variable. The weight size is explained directly. Multiple
regression analysis is often used as a predicting tool.
There are at least two independent variables in a multiple regression model. A linear
multiple regression model with two independent variables may be expressed as:
Y = b0+ b1 X1 + b2 X2 + U
In this model, there are three parameters b0, b1 and b2. For the estimation of the multiple
regression, one of the very important assumptions is that no perfect or positive or
negative correlation exits between independent variables X1 and X2. In the event of
perfect positive or negative correlation between independent variables, the model can be
estimated because of the problem of multi-collinearity. In that situation, the estimation is
conducted using the OLS estimates, where the total of the squared residuals is bought
2to minimum. This takes the form of three normal equations:
ΣY = nb0B+ b1ΣX1+ ΣX2
ΣX1Y = b0X1+ b1ΣX1+ ΣX1X2
ΣX2Y = b0 ΣX2 + b1ΣX1X2+ b2ΣX2
2
These equations can be solved simultaneously to obtain the estimated values of b0, b1
and b2.
16.7.6 LOGISTIC REGRESSION ANALYSIS
The Logistic Regression Analysis refers to a specific version of multiple regression
analysis that permits the forecast of an event. It is permissible to use nonmetric
dependent variables, as the purpose is to reach at a probabilistic evaluation of a binary
selection. The independent variables can have either discrete or continuous form. A
contingency table is constructed, which demonstrates the categorization of

MS 110 Research Methodology Uttarakhand Open University
Unit 16 Multivariate Analysis Page 303 of 434
observations into observed and predicted events. The sum of events predicted to take
place which really happened and the events foretold not to occur which in fact did not
take place, the total number of events divided, is a measurement the model
effectiveness. The technique assists to foretell the selection consumers might take
when presented with options.
16.7.7 MULTIVARIATE ANALYSIS OF VARIANCE
This technique investigates the relationship between different certain independent
variables and two or greater than two metric dependent variables. The analysis of
variance evaluates the differences among groups. MANOVA investigates the
dependence relationship between a group of dependent variables across a set of groups.
Usually this analysis is utilized in experimental design, and often a relationship
assumed between dependent measures is applied. This method differs in that the
variables are definite and firm, the dependent variable is metric. However, with too
many observations the technique loses its practical value. This technique requires that
the dependent variables must be normal. If the means differ significantly, the null
hypothesis is rejected.
16.7.8 MULTIDIMENSIONAL SCALING (MDS)
Multidimensional scaling is an extension of multivariate techniques for gauging human
preference and perceptions. It deals with respondents’ judgments about the degree of
similarity of pairs of stimuli. The resemblance+ may be expressed as the extent of
similarity between pairs of stimuli on similarity basis or distance basis.
Multidimensional scaling is used to measure human perceptions and preferences
towards some stimuli like products, organizations, places, events and brands, etc. and
positioning them in a perceptual space.
The objective of MDS is to change consumer decisions of similarity into distances
articulated in multidimensional space. The approach is de-compositional that uses
continuous mapping to put forward the dimensions. Like an exploratory technique, it is
helpful in investigating unidentified dimensions about products and in revealing
relative assessment of products at the time comparison ground is not accepted.
Normally there must be minimum four times as many object under evaluation as
dimensions. Kruskal’s Stress is a bad fit measure; a stress with 0 percentage represents
a excellent fit, and greater than 20% indicates a poor fit. The aspects can be explained
either subjectively by permitting the respondents recognize the dimensions or the
researcher identifies them objectively.
Multidimensional scaling involves the following steps:
1. Determination of the dimensions of the perceptual space on which customers
perceive objects.
2. The respondents judged values of perception/preference of the objects serve as
inputs into MDS package.

MS 110 Research Methodology Uttarakhand Open University
Unit 16 Multivariate Analysis Page 304 of 434
3. Positioning of the objects on the perceptual space. The perceptual map
consisting of the locations of the objects in the output of multidimensional
scaling.
Physical distances are known as actual distances, in reality as proximities. The judgments of
a set of respondents about the proximities between different pairs of location of tourist spots
will be obtained based on their knowledge and awareness about them. The distances are
called psychological distances.
An important job of the multidimensional scaling is to determine the number of dimensions
of the perceptual space where the configuration of plots of the derived data of objects can be
made. The difficulty in making inference of the results of MDS directly increases with the
increase in the number of dimensions.
Another important task of the technique is to name each and every dimension meaningfully.
The correlation between each of the dimensions and attribute ratings can be studied and
accordingly the dimensions can be named.
Multidimensional scaling can be applied for the following issues:
1. Product positioning
2. Organization positioning
3. Group technology machine groups formation
4. Technology positions
Product position is the job of subdividing the given set of products in a study. Such study will
provide better insight into existing product groups in finding a relevant product group to
concentrate in order to bring out a new product with relevant marketing strategy in
conjunction with competing products. This will help the organization formulate suitable
marketing strategies in relation to the competing products.
Group technology is a system of layout to combine the advantages of process layout and
product layout.
Technology positioning is the keenness of customers in choosing energy alternative for home
appliances with appropriate technology subject to price, handling conveniences, ecological
issues of energy sources, service life of gadgets, etc. For example, in the case of water heater
the energy alternatives are electric current, petroleum gas, gobar gas, solar energy, kerosene,
firewood and rice husk.

MS 110 Research Methodology Uttarakhand Open University
Unit 16 Multivariate Analysis Page 305 of 434
Check Your Progress-B
Fill in the Blanks
1. The ________________ is an explorative analysis attempting to identify structures
within the data.
2. ____________________ is suitable for a nominal dependent variable and interval
independent variables.
3. The __________________ was developed in the seventies facilitates businesses to
figure out and quantify the secret rules people utilize to trade-offs between totally
different merchandise and services and to gauge the values of various options or parts
of the offer.
4. ______________________is the most frequently used multivariate technique. It
investigates the relation of two or more than two metric independent variables and. one
metric dependent variable.
5. _________________ is an extension of multivariate techniques for gauging human
preference and perceptions.
16.7.9 CORRESPONDENCE ANALYSIS
This technique facilitates reduction of dimensions of object ratings on a group of attributes,
leading to a sensory activity map of the ratings. Different from MDS, independent variables
and dependent variables area examined simultaneously. This system is more near to factor
analysis. The technique is integrative and beneficial when there are several attributes and lots
of firms. It's most frequently utilized in evaluating the advertising campaigns in terms of their
effectiveness. It's conjointly used once the attributes area identical for factor analysis to be
important. The crucial approach is the structural design of a contingency table. This implies
that the shape of the variables ought to be nonmetric. The model is often evaluated by
investigating the model’s Chi-square value. This analysis is troublesome to interpret, because
the dimensions are a mixture of independent and dependent variables.
16.7.10 CANONICAL CORRELATION
The most versatile of the variable techniques, canonical correlation at the same time
correlates many independent variables and several other dependent variables. This forceful
technique uses metric independent variables, in contrast to MANOVA, for example, sales,
satisfaction and usage levels. It also can employ nonmetric categorical variables. This system
has the fewest limitations of any of the variable techniques. Therefore the results ought to be
taken with care because of the relaxed assumptions. Quite often, there is a connection among

MS 110 Research Methodology Uttarakhand Open University
Unit 16 Multivariate Analysis Page 306 of 434
dependent variables, and also the independent variables connected; therefore finding a
relationship is complex without a method like canonical correlation.
16.7.11 STRUCTURAL EQUATION MODELING
Different from the other multivariate techniques, structural equation modeling (SEM)
investigates multiple relationships between groups of variables at the same. This acts on
behalf of a family of techniques, consisting of LISREL, latent variable analysis, as well as
confirmatory factor analysis. SEM may have hidden variables, that cannot be measured for
the purposes of analysis directly-oneself against this attempt, one may utilize at least two
different techniques.
The analyst should use the present time relationship involved in the structural and functional
multivariate analysis methods. He should substantiate a number of judgments which he has to
make with structural multivariate analysis of data. For example, it is advisable to use cluster
analysis first to specify mutually exclusive groups before using a multiple discriminate
analysis.
16.8 SUMMARY Multivariate analysis is a usual term use to divide a family of analytic methods featured by
the analysis of k independent variables and m dependent variables at the same time. If an
analysis consists, for instance, four independent variables and two dependent variables,
treated simultaneously, it is a multivariate analysis. The root objectives of multivariate
analysis are to curtail large number of observations into smaller composite scores, to
anticipate the variance in the dependent variable due to its covariance together with the entire
group of independent variables and to categorize persons or objects into one of the two or
greater than two jointly exclusive and exhausting groups based on a set of independent
variables.
The main advantage of multivariate analysis includes that since it considers more than one
factor of independent variables that affect the variability of dependent variable, the
conclusion drawn is more accurate. The conclusions are more realistic and close to the real
life situation. The techniques of multivariate analysis are employed with success in the
decision making in economics, sociological decision making, agrarian predictions, drug
testing, state financial decision making and industrial decision making. Major techniques of
multivariate analysis consists of factor analysis, discriminant analysis, cluster analysis and
conjoint analysis among others.
16.9 GLOSSARY
Multivariate analysis is a collection of methods for analysis of data in which a several
independent number of observations represent a dependent variable available to define
such relationship.

MS 110 Research Methodology Uttarakhand Open University
Unit 16 Multivariate Analysis Page 307 of 434
Discriminant analysis discriminates groups from one another on the basis of sets of
measures. It is also useful in assigning individuals to groups on the ground of their test
scores.
Cluster Analysis is a technique to explore or identify structures within the data.
Multidimensional Scaling is a unique multivariate technique that does not identify the
variables but attempts to measure their impact. It begins with the ultimate result and
attempts to identify the unique variables that resulted in the composition.
16.10 ANSWERS TO CHECK YOUR PROGRESS
Check Your Progress-B
1. Cluster Analysis
2. Discriminant analysis
3. conjoint analysis
4. Multiple regression analysis
5. Multidimensional scaling
16.11 REFERENCES:
Pannerselvam, R. (2011) Research Methodology, 9th
Edition, PHI, New Delhi.
Chawla, Deepak & Sondhi, Neena,. (2011) Research Methodology, Ist Edition,
Vikas Publishing House Pvt.Ltd., New Delhi.
Cooper, Donald, (2006), Business Research Methods, Tata McGraw Hill Publishing
Company, New Delhi.
Michael, V.P.(2000), Research Methodology in Management, Himalaya Publishing
House, Mumbai.
16.12 SUGGESTED READINGS
1. Pannerselvam, R. (2011) Research Methodology, 9th
Edition, PHI, New Delhi.

MS 110 Research Methodology Uttarakhand Open University
Unit 16 Multivariate Analysis Page 308 of 434
2. Chawla, Deepak & Sondhi, Neena,. (2011) Research Methodology, Ist Edition,
Vikas Publishing House Pvt.Ltd., New Delhi.
3. Cooper, Donald, (2006), Business Research Methods, Tata McGraw Hill
Publishing Company, New Delhi.
4. Michael, V.P.(2000), Research Methodology in Management, Himalaya
Publishing House, Mumbai.
16.13 TERMINAL QUESTIONS
1. Define the following terms:
(i) Eigenvalue (ii) Inner product (iii) scree plot (iv) Normalizing
2. Define multivariate analysis. Give any four examples.
3. Define discriminant analysis. What are the types of evaluation criterion used in
discriminant analysis?
4. Discuss multidimensional scaling (MDS).
5. What is the difference between principal components and factor analysis?
6. Discuss the differences between the various levels of measurement. How do they
relate to measures of association and to different types of normalization?
7. What are the areas of applications of cluster analysis?
8. Explain the following:
a) Correlation coefficient matrix
b) Factor loadings
c) Communality
d) Eigen value
e) Factor rotation
f) Minimum eigen value criterion
g) Scree plot criterion
h) Factor scores
9. The director of a management school wants to do discriminant analysis concerning
the effect of two factors, namely, the yearly spending on infrastructures of the school
(X1) and the yearly spending on interface events of the school (X2) on the grading of the
school by an inspection team. He has collected the data for the past 12 years and
submitted to the inspection team. Based on the data, the committee has awarded one of
the following grades for each year.
(a) Design the discriminant function, Y = aX1 + bX2
(b) Compute the discriminant ratio, K and identify the variable which is more important
in relation to the other variable.
(c) Validate the discriminant function using the given data by forming groups based on
the critical discriminant score.
(d) Test whether the group mean are equal in importance at a significance level of 0.05.

MS 110 Research Methodology Uttarakhand Open University
Unit 17 Factor Analysis Page 309 of 434
UNIT 17 FACTOR ANALYSIS
17.1 Introduction
17.2 Objectives
17.3 Concepts of Factor Analysis
17.4 Conditions for a Factor Analysis
17.5 Steps in Factor Analysis
17.6 Methods of Factor Analysis
17.7 Summary
17.8 Glossary
17.9 References
17.10 Suggested Readings
17.11 Terminal Questions
17.1 INTRODUCTION Factor analysis determines the number and nature of underlying factors in order to curtail
larger number of variables into smaller numbers of factors. It is a method for deciding k
underlying variables from n sets of measures, k being less than n.
A factor is an idea, an assumed entity underlying tests, scales, items, and measures of any
sort. For example, a number of factors may underlie intelligence: verbal ability, numerical
ability, abstract reasoning, spatial reasoning memory and others. Factor analysis is usually
an exploratory method needing many subjective judgments a user has to make. The factor
analysis is widely used. Factor analysis can be subjected to a long public debate concerning
factor analysis can take place as the models, methods, and subjectivity is quite elastic.
The method is comparable to principal components though, factor analysis is more detailed
of the two methods. In a way, factor analysis is an opposite of principal parts. In factor
analysis, the variables determined as constant change functions of the factors are designed
into a model. In principal components new variables creating linear combinations of the
ascertained variables is produced. However, in each aspect of the data are reduced.
In PCA explanation of principal components is commonly not quite clear. At times, a
particular variable could provide considerably to larger than one in all the parts. In a perfect
state of affairs every variable contributes considerably to just one element is most liked. For
that objective the method of factor rotation is applied. Physiology, health, intelligence,
sociology, and generally ecology and others are the disciplines during which factor analysis
is concerned.

MS 110 Research Methodology Uttarakhand Open University
Unit 17 Factor Analysis Page 310 of 434
17.2OBJECTIVES After studying this unit, you shall be in a position to:
Know the factor analysis
List the conditions for Factor Analysis
Comprehend the uses of Factor Analysis
Understand the methods of Factor Analysis
17.3 CONCEPTS OF FACTOR ANALYSIS Factor analysis involves various concepts which are presented below:
Correlation coefficient matrix
CCM is the matrix of correlation coefficients of the original observations between different
parts of input variables. H2
1
Factor loadings
Factor loadings present a matrix representing the correlation between different combinations
of variables factors. Li (j) represents the factor loading of the variable j on the factor I, where
I = 1, 2, 3,…, n and j = 1, 2, 3, …, n.
Communality, h2
i is the squares aggregate of factor loadings of the variable I on all factors.
Eigenvalue is the total of squares of the factor loadings of all variables on a factor
Eigen value of the factor
Rotation:
The researcher examines whether the factor loading matrix possesses simple structure. If a
factor loading matrix has a simple structure, it is easy to make interpretations about the
factors. In the absence of simple structure, the n-dimension space of the factors should be
rotated by an angle that the factor loadings are revised to have a simple structure and simply
the process of interpretation of the factors.
Factor score:
The factor score is also known as the component score. The score consists of all row and
columns, used as an index of all variables and can be applied for further analysis. Factor
score can be standardized by multiplying a common term. While using this factor score, for
whatever analysis, it is assumed that all variables will perform as factor scores.
Criteria for fixing the number of factors:
Kaiser Criterion states that eigenvalues is a good criteria for factor determination. If
Eigenvalues are greater than one, we should consider that a factor and if Eigenvalues is less

MS 110 Research Methodology Uttarakhand Open University
Unit 17 Factor Analysis Page 311 of 434
than one, a factor should not be considered. According to the variance extraction rule
requires that it should be more than 0.7. A factor should not be considered if variance is less
than 0.7.
Latent variable
A variable not directly measureable or observable is usually considered a latent variable. For
example, a person’s neurosis level and conscientiousness are all latent variables. These
underlying variables cannot be easily seen. However, they can exercise influence on
experimental results but they can cause effects in our experimental results.
Assumptions:
No outlier: It is assumed that outliers do not exist in data.
Adequate sample size: The variable must be more than the factor.
No perfect multi-collinearity: Factor analysis functions on the assumption of absence
of multicollinearity. There need not be perfect multicollinearity between the
variables.
Homoscedasticity: The factor analysis being a linear function of measured variables,
it does not need homoscedasticity among the variables.
Linearity: Factor analysis is also grounded on linearity assumption. Though non-
linear variables can also be used. After transfer, however, it converts into linear
variable.
Interval Data: The analysis required interval data.
17.3.1 USES OF FACTOR ANALYSIS
The method of factor analysis has various uses:
Figure 17.1Uses of Factor Analysis
a) Scale construction
Scale construction
Establish antecedents
Psychographic profiling
Segmention analysis
Marketing studies

MS 110 Research Methodology Uttarakhand Open University
Unit 17 Factor Analysis Page 312 of 434
Factor analysis can be applied to design precise multiple item scales for measuring
different constructs. Attitude Measurement and Scaling the process of developing a
multiple item scale usually begins creating a big set of items concerning to the attitude
under measurement. This is carried out as part of exploratory research. Factor analysis
can reduce the set of statements to a precise instrument and at the same time ensure that
the statements retained are representative enough of the crucial aspects of the constructs
being measured. Suppose we desire to prepare a multiple item scale for measuring the
job satisfaction of skilled workers in an organization. Initially, we would a large number
of statements are created, numbering say 100 or so as part of exploratory research.
These statements could be subjected to factor analysis and let us assume that we get
three factors out of it. Now, if we want to construct a 15-item scale to measure job
satisfaction, what is to be carried out to separate five items in each of the factors having
the highest factor loading?
b) Establish antecedents
This technique brings down multiple input variables into classified factors. Thus, the
independent variables will be classified into broad factors. As an example, all the
variables measuring the safety clauses in a mutual fund may be brought down to an
element referred to as safety cause. Thus, the corporate might understand the broad
profit that an investor looks for in a fund.
c) Psychographic profiling
Various independent variables are classified to measure independent factors. These
are then applied for identifying types of personality. One of the most well reputed
inventories based on this method is known as the 16 PF inventory.
d) Segmentation analysis
Factor analysis can also be employed for segmentation analysis. For example, there
could be various sets of two-wheelers-customers having two wheelers because of
varying significance awarded to dimensions like image, economy and functional
features.
e) Marketing studies
Marketing studies also widely used in marketing and can be successfully applied for
new product development; product acceptance, advertising copy development,
pricing and branding studies. For example the factor analysis can be utilized to:
Determine the attributes of brands that affect consumers’ choice
Obtain an insight into the media habits of different consumers;
Know the features of price-sensitive customers.
17.4 CONDITIONS FOR A FACTOR ANALYSIS Certain conditions must be satisfied before the technique of factor analysis is used. These
conditions are exhibited in the following diagram.

MS 110 Research Methodology Uttarakhand Open University
Unit 17 Factor Analysis Page 313 of 434
Figure17. 2Conditions for Factor Analysis
a) Metric Data
Factor analysis exercise requires metric data. either on interval or ratio scale. The
exploratory research determines the variables for factor analysis. The review of
literature concerning the subject, previous researches, and informal interviews of
knowledgeable person’s qualitative analysis like focus group discussions held with a
small sample of the respondent population, analysis of case studies and judgment of
the researcher, may perform this exploratory research. Generally in a survey research,
a five or seven point Likert scale or any other interval scales may be utilized
b) Standardization
As the responses to different statement are obtained with the help of different scales,
all the responses are needed to be standardized. The standardization enables
comparison of various responses from different scales. The act of standardizing the
statements is performed with the assistance of the following formulae
Standard score of the respondent on a statement =
c) Size of the sample
Metric data
Standardization
Size of the sample
Correlation
Test of Spherecity
Kaiser-Meyer Ohkin Statistics
MS 110 Research Methodology Uttarakhand Open University
Unit 17 Factor Analysis Page 314 of 434
The appropriate size of the sample respondents ought to be at the minimum ranging
from four to five multi more than the number of variables (number of statements).
d) Correlation
The assumption that the initial set of variables has a high correlation is the basis of the
application of factor analysis. The existence of small correlation coefficients between
all the variables indicates the factor analysis may not be a suitable method. A
correlation matrix of the variables could be computed and tested for its statistical
significance. The testing of hypothesis may be expressed as:
H0: Correlation matrix is insignificant, i.e., correlation matrix is an identify
matrix where diagonal elements are one and off diagonal elements are zero.
H1: Correlation matrix is significant.
e) Test of Spherecity
The test is carried out by using a Barttlet test of sphericity, taking into consideration
the determinant of the correlation matrix. The test changes it in to a chi-square
statistics with degrees of freedom equal to [(k (k-1))/2], where k indicates the quantity
of variables on which factor analysis is used. The significance of the correlation
matrix makes sure that a factor analysis exercise could be conducted.
f) Kaiser-Meyer –Ohkin Statistics
The Kaiser-MeyerOlkin statistics considers a value between 0 and 1. For the
utilization of factor analysis, the value of KMO statistics needs to be greater than 0.5.
The KMO statistics makes comparison of the magnitude of observed correlation
coefficients with the magnitude of partial correlation coefficients. A small value of
KMO indicates that the other variables find it difficult to explain the correlation
between variables.
17.5 STEPS IN FACTOR ANALYSIS Fundamentally, in a factor analysis consists of two major steps:
a) Extraction of factors
The first step in factor analysis is to establish the quantity of factors to be extracted
from the given set of data. The Centroid Method, the principal component method and
the maximum likelihood method could accomplish this.
b) Rotation of factors
The rotation of initial factor solutions is another step involved in the exercise of factor
analysis. The reason is that the initial factors are very complex for interpretation.
Therefore the rotation of initial solution provides a solution that yields to
interpretation. If a test measures one factor only, it is considered be factorally pure.
To the extent that a test measures a factor, it is considered to be loaded on the factor.
A test is stated to be factorally complex if it has more than one factor. It is important

MS 110 Research Methodology Uttarakhand Open University
Unit 17 Factor Analysis Page 315 of 434
to decide the quantity of factors the test is loaded on and extent of the loadings. The
following figure explains the factor loading.
Figure 3 Factor loading
As a result of the factor analysis, a factor matrix is available. A factor matrix is a table of
coefficients indicating relations between the tests and the underlying factors. Table 1 shows
the factor matrix:
Table 1
Tests A B h²
V .81 .01 .66
R .78 .11 .61
S .69 .10 .48
N .10 .69 .48
AS .11 .78 .63
AT .01 .81 .70
The entries in the table are called Factor loadings are the entries in the table shown above.
They can be indicated aij, meaning the loading of test i on factor j.
Similar to correlation coefficients, factor loadings have values that range from -1.00 through
0 to +1 and have same interpretation. They indicate the correlations between the tests and the
factors. For example, test V has the correlations with factor A and B, respectively .81 and .01.
Clearly, test S has high loading on a, but no loading on B Tests NAS and AT are loaded on B
but not on A. All the tests are pure.
Factorially pure
Loaded on the factor
Factorially complex
Determine the number
of factor

MS 110 Research Methodology Uttarakhand Open University
Unit 17 Factor Analysis Page 316 of 434
The factor loading could be utilized to compute eigenvalue for each actor. The eigenvalue of
a factor is the total of squares of the factor loadings. The eigen value for a factor greater than
one is significant. The percentage of variance each factor explains of the factor can be
computed using the eigenvalues. The values each of the factors explains are subjected to
computation as:
Percentage of variance a factor explains =
Varimax Method of Factor Rotation
On getting factor loadings with the help of any one of the methods, the researcher should
investigate the factor loading matrix for the simple structure. A factor loading matrix having
a simple structure makes it easy to interpret the factors. In the absence of simple structure, the
factor axes have to be rotated by an angle such that the factor loadings are revised to obtain a
simple structure and simplify the interpretation of factors. The communalities of each
variable before and after factor rotation are found to be same.
The procedure of varimax factor rotation
The marimax factor rotation involves the following steps:
1. The factor loading matrix is input. Number of variables = n. Number of principal
components = 2. Angle of rotation = θ
2. The factor loadings on a two-dimensional space are plotted. F1-F2 plane, where F1 and
F2 are Factor-1 and F-2 respectively. Let θ be the angle between the nearest axis (F1
and F2) and each vector of factor loadings.
3. The F1 – F2 plane is rotated by an angle that the factor loadings are revised to get a
simple structure.
4. Set variable Number, i=1.
5. Ai and bi be the factor loadings of the variable I on F1 and F2 respectively. Then the
magnitude of the vector Ci of the factor loadings of the variable is obtained using the
formula:
Ci= (a2
i + b2i)
0.5
The angle of the vector of factor loadings with the nearest part of F1 axis be α.
6. Cos θ is obtained and treated as the factor loadings on the nearest axis. Fix the sign of
revised loading depending on the side of factor.
7. Find cos θ and treat it as the factor loading on the other axis. Fix the sign of the
revised loading depending on the side of the factor.
8. I = I + 1
9. If I ≤ n, then need to go to step -5; otherwise to step -10
10. Print the revised factor loading matrix
11. Variables are grouped into factors and draw inferences;
i. Communality:
The entries shown in the above table in the column h² are communalities. It shows the
amount of each variable accounts for by the underlying factors considered as one.
Communality is a measure of the percentage of variable’s variation the factors explain.
MS 110 Research Methodology Uttarakhand Open University
Unit 17 Factor Analysis Page 317 of 434
Comparatively high communality indicates that the variable not to an appreciable
extent remains after whatever the factors represent are taken into consideration. They
are sums of squares of the factor loadings of a test or variable. For example, the
communality of test S is .48. The communality of a test or variable is its common
factor variance n. For example, the communality for variable V can be calculated as
(.81)²+ (.01)² = .66
ii. Independence of extracted factors
The two factors should have statistical independence. This implies that there should
be no correlation coefficient between the two factor scores.
iii. Naming the factors
As there are no particular rules for the naming of factor, it is more of an art, except
giving names optimally representing the variables within the factors.
iv. Data Reduction
Factor analysis is a technique of data reduction. This function is performed by
looking for underlying latent variables reflected in the observed variables. There are
several methods utilized to conduct a factor analysis including unweighted least
squares, principal axis factor, generalized least squares and maximum likelihood,
There are also several kinds of rotations performed after the start of extraction of
factors, comprising orthogonal rotations, as varimax and equimax, putting the
limitation of non-correlation of factors, and oblique rotations, such as promax
permitting the factors to be mutually correlated. The quantity of factors to be drawn
has also to be determined. With the given quantity of factor analytic methods and
options, different analysts could approach at varied results for the analysis of same set
of data. Though, all analysts desire for simple structure consisting of system of
findings such that each variable puts quantity highly on one factor.
v. Combination of Two Variable
A scatter plot can simply represent the correlation between the two variables. The
scholar can then fit a regression line which represents the short account of the
relationship linear in nature between the two variables. A variable can be expressed as
that would near the regression line in such scatter plot and captures most of the most
important characteristic of the two objects. The scores on that new factor represented
by the regression line could then be applied for further data analyses. Thus, two
variables can be reduced to one factor. The new factor is in fact a linear mix of the
two variables.
MS 110 Research Methodology Uttarakhand Open University
Unit 17 Factor Analysis Page 318 of 434
Check Your Progress-A
Q1. What are the conditions for Factor Analysis?
-------------------------------------------------------------------------------------------------------
-------------------------------------------------------------------------------------------------------
-------------------------------------------------------------------------------------------------------
-------------------------------------------------------------------------------------------------------
-------------------------------------------------------------------------------------------------------
-------------------------------------------------------------------------------------------------------
Q2. List the steps that are followed for Factor Analysis?
-------------------------------------------------------------------------------------------------------
-------------------------------------------------------------------------------------------------------
-------------------------------------------------------------------------------------------------------
-------------------------------------------------------------------------------------------------------
-------------------------------------------------------------------------------------------------------
-------------------------------------------------------------------------------------------------------
Q3. What is Test of Spherecity in Factor Analysis?
-------------------------------------------------------------------------------------------------------
-------------------------------------------------------------------------------------------------------
-------------------------------------------------------------------------------------------------------
-------------------------------------------------------------------------------------------------------
-------------------------------------------------------------------------------------------------------
-------------------------------------------------------------------------------------------------------
17.6 METHODS OF FACTOR ANALYSIS A number of methods of factor analysis are: principal factors, centroid, diagonal,
maximum likelihood, multiple groups, image, alpha, and so on. The most prevalent
method is principal components method.
a) Centroid Method
The centroid method maximizes the sum of absolute loadings of each factor. The
coefficients of the terms in the linear composite of each factor will be either +1 or -1.
Centroid method is comparatively less complex to other techniques. This technique
has the steps as below:
1. Input the data matrix of m x n size, where m represents the observations and n
represents the factors (F).

MS 110 Research Methodology Uttarakhand Open University
Unit 17 Factor Analysis Page 319 of 434
2. Identify n x n correlation coefficient matrix (Rf, R1), summing up the correlation
coefficient for every pair of the variables. Assume the diagonal value of the
correlation coefficient matrix as 1, as the individual variable is correlation to
itself.
3. Perform reflections, if necessary.
4. Determine the first centroid factor.
5. Increment the current factor number by 1 (f = f+1).
6. Determine the fth centroid factor
7. Proceed to step-5, if the current factor number, (f) is shorter to the aggregate
quantity of factors considered.
8. Arrange the loadings of F factors.
9. Assign each variable to a factor having the maximum absolute loading.
10. Find the aggregate of squares of the loadings in each row known as communality
(h2) and sum of squares of the loadings in each column.
b) Principal Factors Analysis
The principal factors method is persuasive as it gives mathematically a unique
solution for problem concerning factors. Perhaps its major solution feature is that it
extracts a maximum amount of variance as each factor is calculated. The first factor
extracts the most variance, the second the next most variance, and so on in decreasing
order. The principal factor method is not feasible with much mathematical
calculation. The tests or variables can be perceived as points in m-dimensional space.
The highly and positively correlated variables should be near each other and away
from variables having no correlation. There would be collection of points in space.
Each of these points can be located in the space if suitable axes are inserted into the
space, one axis for each dimension of the m dimension.
Let the number of input variables be n, the total number of observations for the
variables be n, the sum of number of factor is equal the number of variables; Xj, the
input variable j, j = 1, 2, 3,….n; aij the ith original observations for the jth input
variable j , the mean of the original observations of the variable j; and zij be the
standard normal value of the ith observation of the jth variable given by the following
formula;
zij =
If Fk be the linear composite of the principal component k, k actor is given by the
expression:
Fk= w1kX1 + w2kX2 + w3kX3 +…+ wikXi + ….+ wnkXn=
for k = 1, 2, 3,…, n, where wik is the weight of the variable Xi in the linear composite of
the factor k.
This formula for Fk can be applied to identify the standard score of each group of
observations for the factor k by replacing the values of i, 1, 2, 3, …,n in it.

MS 110 Research Methodology Uttarakhand Open University
Unit 17 Factor Analysis Page 320 of 434
Wik represents the weight the application of principal component procedure determines
which are used to decide the unstandardized factor score. A mix of wik values for I = 1, 2,
3…..,n and k = 1, 2, 3,….,n give the unstandardized score of the complete group of
observation which has maximal variance.
The choice of weights in the principal components must satisfy the following requirements:
1. The eigen values of the principal components are in the order of decrement from the
principal components-1 to PC n.
2. There is no correlation in the values of the factor loadings of the principal components.
3. The summation of the squares of the weighted in the principal components is 1.
By the help of the formula the scores of various groups of observation on different factor is
possible to be obtained.
[fij]m x n = [zij] m x n x [wij] n x n
Where,
[fij] is the matrix of unstandardized factor scores,
[fij] is the unstandardized factor score of the ith set of standardized observation on the
factor j.
[zij] is the standardized values of the original sets of observations of the variables,
[wij] s the matrix of weights of variables in different factors.
The correlation coefficients between the values in different pairs of columns of matrix
[zij] m x n x [fij] can help in find the loadings of the variables on the factors.
The formula below can help in getting the standardized factor scores:
I=1,2,3, …, m, j = 1, 2, 3,…,n
Where,
Sij is the standardized factor score of the ith group of observations on the factor j;
Mj, is the mean of the unstandardized factor scores of the factor j;n
sj the standard deviation of the unstandardized factor scores of the factor j.
Using the following formula the original standardized observations (Zij) can be
predicted.
[Zij] m x n = [Sij] m x n x [Lij] n x n
Steps Involved in Principal Component Method
The following steps are involved in the principal component method:
MS 110 Research Methodology Uttarakhand Open University
Unit 17 Factor Analysis Page 321 of 434
1. The original groups of observation (aij); I = 1, 2, 3,…, m and j = 1, 2,3,….n used
as input.
2. The standardized groups of observations (Zij ) from ( aij) are found using the
formula
; I = 1, 2, 3, …, m, j = 1, 2, 3, …., n
Where,
zij is the standardized groups of observations of the ith original observations
under the variable j;
aij represents the ith original observation of the jth variable;
j expresses the mean of the original observations of j;
σj represents the standard deviation of the original observations of j
3. Decide the weights of variable in various linear composites of factors (wij) in
order to make the variance as great in amount as the unstandardized factor score
of the complete group of observations.
4. Using the formula the unstandardized factor score is identified:
[fij] m x n = [zij] m x n x [wij] n x n
5. The loadings of the variable on the factors (Lij) are found. Lij represents the
correlation coefficient between zij and fij for I = 1, 2, 3, …n and j= 1,2, 3,,,n,
6. Using the formula the standardized factor scores are obtained:
; I = 1, 2,3 ,…, m, j = 1, 2, 3,…n
7. The prediction of the standardized original observations are obtained with the help
of the following formula:
[Zij] m x n = [Sij] m x n x [Lij] n x n
8. The summation of squares of loadings of each column j(the eigen value of the
column) is found out.
9. The principal component with less than 1 eigen value are dropped being
insignificant.
10. The rotation of the retained principal components is performed to enable a better
interpretation using either varimax rotation method or promax rotation method.
11. Assign each variable to the principal component factor, with which it has the
maximum absolute loading. H2
1
12. The total of squares of loadings for each variable is obtained denoted by h2
1. The
common variance is also obtained using the formula:
Common variance = h2
1
13. Where X is the number of retained principal components,
14. Identify and state the inferences for each retained principal component.

MS 110 Research Methodology Uttarakhand Open University
Unit 17 Factor Analysis Page 322 of 434
Hierarchical Factor Analysis
Thompson (1951), Schmid and Leiman (1957) put forward a method applied in place of
calculating loadings for generally complex to interpret implied factors. This method first
determines the clusters of items which rotate the axes and then compute the correlation
coefficients between those factors. To a greater extent factor analysis of the correlation
matrix of indirect factors is carried out to determine a set of orthogonal factors serving to
divide the variability in the objects into that due to common variance and unique variance
because of the groups of similar items in the analysis... A hierarchical analysis might provide
the factor loadings: An investigation of these loadings is likely to take to these decisions:
1.A general satisfaction factor probably impact all types of satisfaction the items gauged ;
2.Satisfaction with work and satisfaction with life in home can be two primary unique areas
of satisfaction.
3.The more complex is the appropriate extraction method. Principal Components (PCA) is
the standard extraction method. It extracts uncorrelated linear combinations of the
variables. The initial factor has maximum variance and all following factors explain lesser
portions of the variance and are all uncorrelated with each other. It is quite similar
to Canonical Correlation Analysis. Principal Component Method can be utilized in case of
a singular correlation matrix.
4.The second most common analysis is principal axis factoring, also called principal factor
analysis. It is very similar to principal components it is interpreted as that principal axis
that determines the latent constructs behind the observations, whereas principal component
identifies similar groups of variables.
5.Usually, principal component is preferred when using factor analysis in causal modeling,
and principal factor is applied when using the factor analysis for data reduction.
6.The next step is to choose a rotation method. After extracting the factors, SPSS can
perform the function of rotating the factors to better fit the data. The most usually applied
method is Varimax which is an orthogonal rotation method creating independent that
minimizes the number of variables having high loadings on each factor. This method
facilitates the interpretation of the factors.
Confirmatory Factor Analysis
Over the past two decades confirmatory methods have become more popular. In general,
guidelines of factor loadings for a specific number of orthogonal or oblique factors can be
specified, and then examined if looked at correlation matrix can be recreated within
specifications. Structural Equation Modeling can assist in the performance of confirmatory
factor analysis
Factor Scores

MS 110 Research Methodology Uttarakhand Open University
Unit 17 Factor Analysis Page 323 of 434
The researcher can estimate the real values of the individual cases for the factors. These
factor scores are especially useful for further analyses involving the factors identified in the
factor analysis.
Reproduced and Residual Correlations
Verification for the suitability of the specific number of factors drawn is to compute the
correlation matrix helping to see if those were really the lone factors. This matrix is known as
the correlation matrix reproduced. To investigate the extent of deviation of this matrix from
the observed correlation matrix, the difference between the two matrices can be computed;
that matrix is understood as the matrix of remaining correlations. This residual matrix may
indicate correlation coefficients that the current number of factors cannot reproduce
appropriately.
Matrix III-Conditioning
If the correlation matrix contains completely redundant variables inverse of the matrix is
difficult to be computed. For instance, if a variable is the aggregate of two other variables
chosen for the analysis, the correlation matrix of such variables is difficult to be inverted, and
the factor analysis is cannot be performed. In practice, this take place at the time of
attempting to factor-analyze a group of highly inter-correlated variables, as it occurs in
correlation research with questionnaires. All correlations in the matrix of correlation are
artificially brought down by making an addition of a small constant to the matrix diagonal
followed by its re-standardization. This procedure yields a matrix invertible and thus factor-
analyzed; moreover, this procedure should not affect the factor patterns.
Interpretation of the factors
Once the number of factors is determined you can repeat the analysis can be repeated using
the maximum likelihood method. Thereafter, the loading pattern is examined to determine the
factor with greatest power on each variable. Loadings near to -1 or 1 exhibit the factor
strongly influencing the variable. Loadings close to 0 reveal that the factor has a feeble
impact on the variable. Certain variables may exert high loadings on multiple factors.
Usually it is not easy to interpret unrotated factor loadings. Factor rotation converts the
complex structure into simple structure, enabling simpler explanation of the loadings on the
factor. However, one method of rotation is not cure-all. The researcher may attempt multiple
rotations and apply the one that creates the highest most explainable results. The rotated
loadings can also be sorted for more clear assessment of the loadings within a factor.
Rotated Factor Loadings together with Communalities Using Varimax
Rotation
Variables Factor Factor Factor Factor Communality

MS 110 Research Methodology Uttarakhand Open University
Unit 17 Factor Analysis Page 324 of 434
1 2 3 4
Academic
record
0.480 0.511 0.87 0.187 0.535
Appearance 0.141 0.731 0.320 0.176 0.684
Communication 0.204 0.279 0.801 0.180 0.796
Company fit 0.779 0.164 0.446 0.190 0.867
Experience 0.473 0;396 0.113 0.402 0.552
Job fit 0.845 0.210 0.306 0.216 0.894
Letter 0.220 0.053 0.218 0.948 0.995
Likeability 0.262 0.616 0.322 0.209 0.594
Organization 0.218 0.296 0.890 0.087 0.927
Potential 0.645 0.491 0.120 0.201 0.715
Resume 0.215 0.366 0.114 0.790 0.813
Self
Confidence
0.240 0.744 0.248 0.093 0.680
Variance 2.5254 2.4881 2.0864 1.9595 9.0492
% Var 0.211 0.208 0.175 0.164 0.754
Key Results: Loadings, communality, Loading Plot
A varimax rotation was conducted on the data in these results. Using the rotated factor
loadings, the factors can be interpreted as follows:
The factors such as Job Fit (0.844), Company Fit (0.778), and Potential (0.645) possess large
positive loadings on factor 1. Factor 1, therefore, relates employee fit and growth potential in
the company. The factors Appearance (0.730), Self-confidence (0.743) and Likeability
(0.615), exhibit greater positive loadings on factor 2. Factor 2 describes personal qualities.
Factor 3 describes work skills consisting of Communication (0.802) and Organization (0.889)
having large positive loadings on factor 3.
For 4 illustrates writing skills with Letter (0.947) and Resume (0.789) having large positive
loadings on it.
Taken together, all four factors explain 75.4% of the variation in the data.
Carrying out factor analysis in SPSS
Go to

MS 110 Research Methodology Uttarakhand Open University
Unit 17 Factor Analysis Page 325 of 434
– Analyze
– Data Reduction
– Factor
– Choose the variables, factor analysis is to be based on and drag these to the
box for the variables.
– In the window for description, choose KMO and Bartlett’s test.
KMO is a statistic which says if items for each factor are enough. It should be over 0.7.
Bartlett’s test is applied to verify that the original variables possess positive correlation
If the test comes out significant if (p < 0.05) — if not, factor analysis will be inappropriate.
Continue.
–Extraction window, select the extraction method to be applied. Under
Analyze make sure that Correlation Matrix is opted. The default extracts
eigenvalues greater than 1 but if a specific number of factors are to be
extracted this has to be specified. Then, Click on Continue.
– At the Rotation window select your rotation method as Varimax. SPSS is
given command to show the rotated solution. After this selection, Continue is
clicked.
–The Scores window requires specifying to save factor scores for all
observations Under Method choose Regression. Require SPSS to shows the
factor score coefficients. After Continue is clicked...
– OK
17.7 SUMMARY Factor Analysis determines the number and nature of underlying variables among larger
number of measures. It is a method for determining k underlying variables from n sets of
measures, k being less than n. A factor is a construct, a hypothetical entity that is assumed to
underlie tests, scales, items, and indeed measures of almost any kind.
The technique of factor analysis is often used for scale construction, establishing antecedents,
psychographic profiling, segmentation analysis, and marketing studies
Factor analysis requires some specific conditions that must be ensured before executing the
technique including requirement for metric data, standardization, size of the sample,
correlation, test of sphericity, KMO statistics.
There are certain steps involved in a factor analysis: extraction of factors and factor loadings,
interpretation of communality, interdependence of extracted factors, rotation of factors and
naming of factors
MS 110 Research Methodology Uttarakhand Open University
Unit 17 Factor Analysis Page 326 of 434
Factor analysis is a data reduction and combining two variables into a single factor
technique. It performs this by looking for underlying unobservable (latent) variables
reflected in the observed variables.
A scatter plot can simply represent the correlation between the two variables. The scholar can
then fit a regression line which represents the short explanation of the linear relationship of
the two variables. A variable can be expressed as that would near the regression line in such
scatter plot and summarizes most of the important characteristics of the two items. The scores
on that new factor represented by the regression line could then be applied for further data
analyses. Thus, two variables can be reduced to one factor. The new factor is in fact a linear
mix of the two variables.
There are a number of methods of factor analysis: principal factors, centroid, diagonal,
maximum likelihood, multiple groups, image, alpha, and so on. The most commonly used
method is principal components method.
17.8 GLOSSARY
Multivariate analysis is a collection of methods for analysis of data in which a several
independent number of observations represent a dependent variable available to define such
relationship.
Discriminant analysis discriminates groups from one another on the basis of sets of
measures. It is also useful in assigning individuals to groups on the basis of their scores on
tests.
Cluster Analysis is a technique to explore or identify structures within the data.
Factor loading, Li (j) is a matrix representing the correlation between different
combinations of variables and factors, Li(j) is the factor loading of the variable j on the
factor I, here I = 1,2,3,..n and j = 1, 2, 3,….,n.
Communality h2
i is the aggregate of squares related to the factor loadings of the variable i
on all factors.
Eigenvalue is the sum of squares of the factor loadings of all variables on a factor.
17.9 REFERENCES
Pannerselvam, R. (2011) Research Methodology, 9th Edition, PHI, New Delhi.
Chawla, Deepak & Sondhi, Neena, (2011) Research Methodology, Ist Edition,
Vikas Publishing House Pvt.Ltd., New Delhi.
Cooper, Donald, (2006), Business Research Methods, Tata McGraw Hill
Publishing Company, New Delhi.
MS 110 Research Methodology Uttarakhand Open University
Unit 17 Factor Analysis Page 327 of 434
Michael, V.P. (2000), Research Methodology in Management, Himalaya
Publishing House, Mumbai.
Bryant, F. B., & Yarnold, P. R. (1995). Principal components analysis and
exploratory and confirmatory factor analysis’ Washington, DC: American
Psychological Association.
Dunteman, G. H. (1989). Principal components analysis. Newbury Park, CA:
Sage Publications.
Gorsuch, R. L. (1983). Factor Analysis. Hillsdale, NJ: Lawrence Erlbaum
Associates.
Hair, J. F., Jr., Anderson, R. E., Tatham, R. L., & Black, W. C. (1995).
‘Multivariate data analysis with readings’ Prentice-Hall. NJ:
Kim, J. -O., & Mueller, C. W. (1978b). Factor Analysis: Statistical methods
and practical issues. Newbury Park, CA: Sage Publications.
Lawley, D. N., & Maxwell, A. E. (1962). Factor analysis -a statistical method.
The Statistician, 12(3), 209-229.
17.10 SUGGESTED READINGS
1. Donald R.Cooper and Ramcis S.Schindler, Business Research Methods, Tata
McGraw Hill Publishing CompanyLimited, New Delhi, 2000.
2. C.R.Kothari Research Methodology, Wishva Prakashan, New Delhi, 2001.
3. Uma Sekaran, Research Methods for Business, John Wiley and Sons Inc., New
York, 2000.
4. Pannerselvam, R. (2011) Research Methodology, 9th Edition, PHI, New Delhi.
5. Chawla, Deepak & Sondhi, Neena, (2011) Research Methodology, Ist Edition,
Vikas Publishing House Pvt.Ltd., New Delhi.
6. Cooper, Donald, (2006), Business Research Methods, Tata McGraw Hill
Publishing Company, New Delhi.
7. Michael, V.P. (2000), Research Methodology in Management, Himalaya
Publishing House, Mumbai.
8. Bryant, F. B., & Yarnold, P. R. (1995). Principal components analysis and
exploratory and confirmatory factor analysis’ Washington, DC: American
Psychological Association.

MS 110 Research Methodology Uttarakhand Open University
Unit 17 Factor Analysis Page 328 of 434
17.11 TERMINAL QUESTIONS
Q1. What is Factor Analysis? What are uses of Factor Analysis?
Q2. Describe the essential conditions for factor analysis?
Q3. Explain the steps involved in Factor Analysis.
Q4. Describe the methods of Factor Analysis.
Q5. What is factor loading matrix? How is it obtained?
Q6. Explain the concept of Kaiser Method in determining the quantity of factors to be
obtained.
Q7. Why is varimax rotation method used instead of the principal components
method?

MS 110 Research Methodology Uttarakhand Open University
Unit 18 Use of Statistical Softwares Page 329 of 434
UNIT 18 USE OF STATISTICAL SOFTWARES
18.1 Introduction
18.2 Objectives
18.3 Significant Features of Statistical Software
18.4 Advantages Offered By Statistical Software
18.5 Common Statistical Software and Their Application To Data Analysis
18.6 About R
18.7 Statistical Package for the Social Sciences (SPSS)
18.8 Statistical Analysis System (SAS)
18.9 MS-Excel
18.10 STATA
18.11 Eviews
18.12 Summary
18.13 Glossary
18.14 Answers to Check Your Progress
18.15 References
18.16 Suggested Readings
18.17 Terminal Questions
18.1 INTRODUCTION The actual purpose of research in management is to assist managers and business in effective
decision making. Software enhances the capability of executing work at a very high speed. It
also has inbuilt memory that has the ability to retain and recall facts entered and saved.
Software can handle a large volume of data, analyze it, tabulate it and present it at a fast
speed and a good extent of accuracy. Thus, the use of software can enhance research
capability and provide better, more efficient and effective results and decisions. Software has
made it possible to apply complicated techniques for analysis and investigation. These are in
the form of packaged programs capable of doing extensive examination of data. In research
projects based on survey of large number of samples and respondents and for measuring
multiple variables, there are just too many respondents to be handled and too many variables
for the analysis to be done manually. Most multivariate methods require complex
calculations, which can be performed only by using computers and software. Multivariate
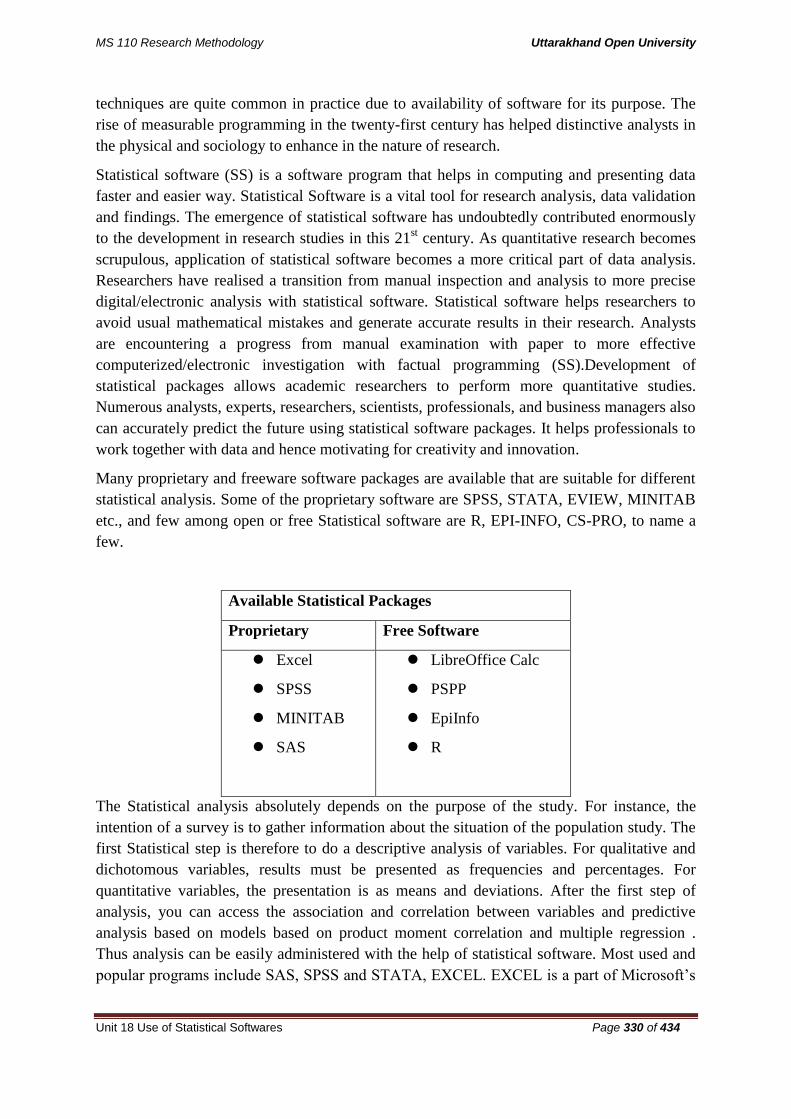
MS 110 Research Methodology Uttarakhand Open University
Unit 18 Use of Statistical Softwares Page 330 of 434
techniques are quite common in practice due to availability of software for its purpose. The
rise of measurable programming in the twenty-first century has helped distinctive analysts in
the physical and sociology to enhance in the nature of research.
Statistical software (SS) is a software program that helps in computing and presenting data
faster and easier way. Statistical Software is a vital tool for research analysis, data validation
and findings. The emergence of statistical software has undoubtedly contributed enormously
to the development in research studies in this 21st century. As quantitative research becomes
scrupulous, application of statistical software becomes a more critical part of data analysis.
Researchers have realised a transition from manual inspection and analysis to more precise
digital/electronic analysis with statistical software. Statistical software helps researchers to
avoid usual mathematical mistakes and generate accurate results in their research. Analysts
are encountering a progress from manual examination with paper to more effective
computerized/electronic investigation with factual programming (SS).Development of
statistical packages allows academic researchers to perform more quantitative studies.
Numerous analysts, experts, researchers, scientists, professionals, and business managers also
can accurately predict the future using statistical software packages. It helps professionals to
work together with data and hence motivating for creativity and innovation.
Many proprietary and freeware software packages are available that are suitable for different
statistical analysis. Some of the proprietary software are SPSS, STATA, EVIEW, MINITAB
etc., and few among open or free Statistical software are R, EPI-INFO, CS-PRO, to name a
few.
Available Statistical Packages
Proprietary Free Software
Excel
SPSS
MINITAB
SAS
LibreOffice Calc
PSPP
EpiInfo
R
The Statistical analysis absolutely depends on the purpose of the study. For instance, the
intention of a survey is to gather information about the situation of the population study. The
first Statistical step is therefore to do a descriptive analysis of variables. For qualitative and
dichotomous variables, results must be presented as frequencies and percentages. For
quantitative variables, the presentation is as means and deviations. After the first step of
analysis, you can access the association and correlation between variables and predictive
analysis based on models based on product moment correlation and multiple regression .
Thus analysis can be easily administered with the help of statistical software. Most used and
popular programs include SAS, SPSS and STATA, EXCEL. EXCEL is a part of Microsoft’s
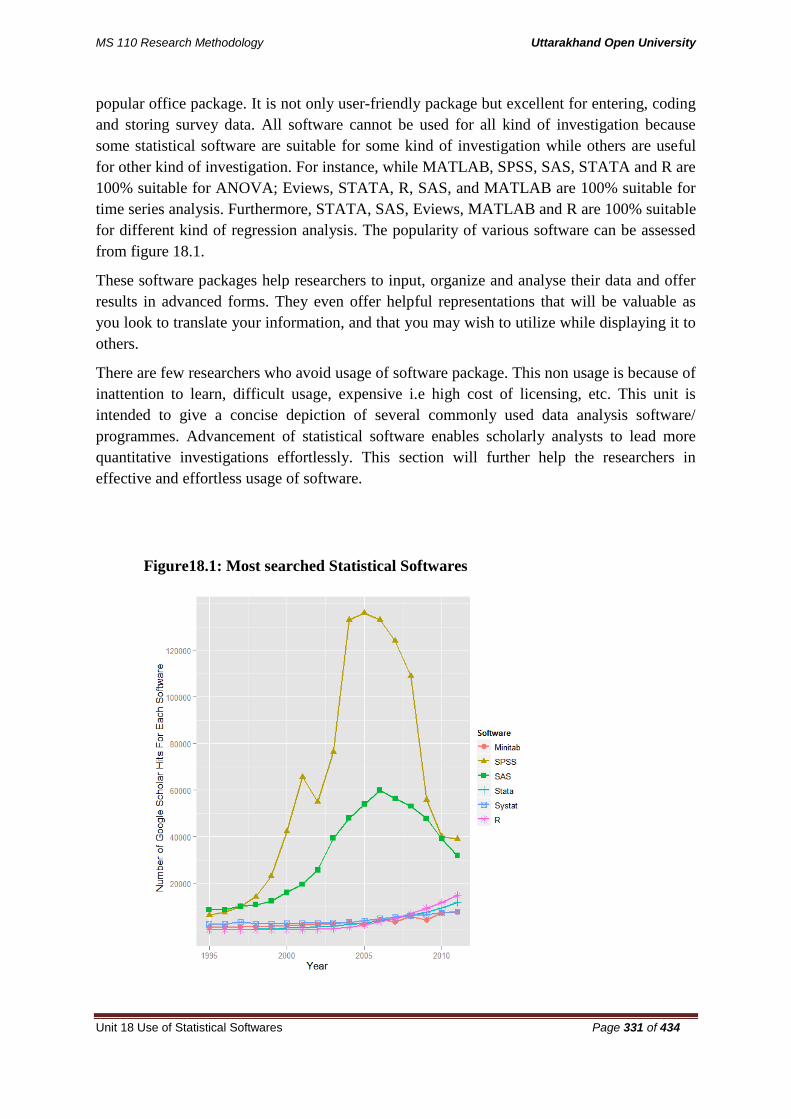
MS 110 Research Methodology Uttarakhand Open University
Unit 18 Use of Statistical Softwares Page 331 of 434
popular office package. It is not only user-friendly package but excellent for entering, coding
and storing survey data. All software cannot be used for all kind of investigation because
some statistical software are suitable for some kind of investigation while others are useful
for other kind of investigation. For instance, while MATLAB, SPSS, SAS, STATA and R are
100% suitable for ANOVA; Eviews, STATA, R, SAS, and MATLAB are 100% suitable for
time series analysis. Furthermore, STATA, SAS, Eviews, MATLAB and R are 100% suitable
for different kind of regression analysis. The popularity of various software can be assessed
from figure 18.1.
These software packages help researchers to input, organize and analyse their data and offer
results in advanced forms. They even offer helpful representations that will be valuable as
you look to translate your information, and that you may wish to utilize while displaying it to
others.
There are few researchers who avoid usage of software package. This non usage is because of
inattention to learn, difficult usage, expensive i.e high cost of licensing, etc. This unit is
intended to give a concise depiction of several commonly used data analysis software/
programmes. Advancement of statistical software enables scholarly analysts to lead more
quantitative investigations effortlessly. This section will further help the researchers in
effective and effortless usage of software.
Figure18.1: Most searched Statistical Softwares

MS 110 Research Methodology Uttarakhand Open University
Unit 18 Use of Statistical Softwares Page 332 of 434
18.2 OBJECTIVES After reading this chapter you will be able to:
Understand about statistical software and its purpose
Comprehend advantages and disadvantages of statistical software
Understand the meaning and importance of R software in data analysis
Understand the meaning and purpose and significance of SPSS and reasons for its
popularity.
Understand the technicalities, meaning and significance of SAS in data analysis.
Plan and organize the use of MS-Excel for data handling and analysis.
Learn ways to present data analysis effectively by using STATA.
Understand the meaning and significance of E-Views software in data analysis.
Learn ways to graphically represent data and results using various statistical software.
18.3 SIGNIFICANT FEATURES OF STATISTICAL
SOFTWARE Statistical software packages have some common characteristics that make it popular,
dependable and suitable for data analysis:
Data editor is in rows and columns which make it simple and easy to enter numeric
information/ data.
There is availability and accessibility of menu bar which comprises drop-down menu,
quick analysis as well as precise user manual.
Statistical level of estimation is put into consideration in data entry.
They follow the preliminary steps in research project:
(a) Getting your information/data ready to enter into the software.
(b) Defining and naming variable.
(c) Entering data accurately with each row containing each case and each column as variable.
(d) Data verification and cleaning is doable.
(e) All data ought to be quantitative. This can be achieved by recoding the letter or word
(string data) into desirable numeric codes and labelled fittingly.
(f) Data investigation can be done to check for errors and other precision.
(g)The statistical level of significance for rejecting null hypothesis (Ho) is when your p-value
significance is less than 0.05 and accepting is when your p-value significance is more than
0.05.

MS 110 Research Methodology Uttarakhand Open University
Unit 18 Use of Statistical Softwares Page 333 of 434
18.4 ADVANTAGES OFFERED BY STATISTICAL
SOFTWARES Some of the vital benefits offered by statistical software in analysis and investigation are:
The data analysis time is cut down significantly, while the examination is comprehensive.
Reliability and dependability of the outcome is enhanced as the data analyst has complete
control over the process.
Combining distinctive calculations and algorithms into a single program can do
sophisticated and in-depth analysis.
Statistical packages influence research to work strong and quicker.
Cost of data handling, processing and investigation is impressively decreased while the
data analysis is more efficient.
Once the training sessions are attended, statistical software offers easy usage, simple
utilization and appropriateness for many statistical analyses.
Staff requirement and expenses are significantly diminished without influencing
reliability.
Fetch jobs easily for learners. Refer figure 18.2 to see maximum job fetching software.
Figure18.2: Jobs Fetched by Data Analysis Software

MS 110 Research Methodology Uttarakhand Open University
Unit 18 Use of Statistical Softwares Page 334 of 434
18.5 COMMON STATISTICAL SOFTWARE AND THEIR
APPLICATION TO DATA ANALYSIS Some of the packages are prepared to meet the prerequisites of a variety of researches and
sprouting researchers. Different popular, easy to understand and user friendly used statistical
software programs are SPSS, MINITAB, Eviews, SAS, STATA, MATLAB, MS EXCEL.
There are a few standard statistical packages which may be utilised to build the speed and
efficiency of data handling, processing and analysis. But it is important to warrant that
suitable software package is chosen for best outcomes. For picking the well-suited statistical
software, familiarity of the various types of software and their usage is required. It is prudent
to pick amongst the ready-made software packages available as it would take time and would
involve heavy cost in developing specialized software.
Check Your Progress-A
Q1. What is a statistical software?
-------------------------------------------------------------------------------------------------------------
-------------------------------------------------------------------------------------------------------------
-------------------------------------------------------------------------------------------------------------
Q2. Name a few proprietary and freeware software?
-------------------------------------------------------------------------------------------------------------
-------------------------------------------------------------------------------------------------------------
-------------------------------------------------------------------------------------------------------------
Q3. What are the reasons for non usage of statistical software?
-------------------------------------------------------------------------------------------------------------
-------------------------------------------------------------------------------------------------------------
-------------------------------------------------------------------------------------------------------------
Q4. Give common features of statistical software.
-------------------------------------------------------------------------------------------------------------
-------------------------------------------------------------------------------------------------------------
-------------------------------------------------------------------------------------------------------------

MS 110 Research Methodology Uttarakhand Open University
Unit 18 Use of Statistical Softwares Page 335 of 434
Q5. What are the benefits derived from using statistical software in analysis and
investigation?
-------------------------------------------------------------------------------------------------------------
-------------------------------------------------------------------------------------------------------------
-------------------------------------------------------------------------------------------------------------
Q6. Fill in the blanks:
i. Statistical Software is a …………… tool for research analysis, data validation and
findings.
ii. The Statistical analysis depends on the ……………of the study.
iii. After the first step of analysis, you can access the ……………and
……………between variables and predictive analysis based on correlation and
multiple regression models.
iv. A spread sheet program is …………….
v. There are a few standard statistical packages which may be utilised to build the speed
and efficiency of …................................ and.................................
18.6 ABOUT R R is a language for processing data statistically, computing and graphic illustration. R is
an open source programming language that is supported by the R Foundation for Statistical
Computing. R is free as well as liberating. It is not tied down to any specific discipline or
industry affiliation. It is easily modified, adjusted, expanded, and upgraded. In short, R is
there to do with what you want statistically, and the potential outcomes are endless. You will
take more about your data, your models, about insights and about statistics, by programming
in R.
R is an implementation of the S programming language along with lexical
scoping semantics. S was designed by John Chambers at Bell Labs (some time ago known
as AT&T, now Lucent Technologies). Ross Ihaka and Robert Gentleman developed R at
the University of Auckland, New Zealand, and is currently developed by the R Development
Core Team.
R is a GNU package. R is freely accessible under the GNU General Public License. The
copyright is held by The R Foundation for Statistical Computing. It has pre-gathered binary
versions that are provided for various operating systems. While R has a command line
interface, there are several graphical front-ends available.

MS 110 Research Methodology Uttarakhand Open University
Unit 18 Use of Statistical Softwares Page 336 of 434
18.6.1 CHARACTERISTICS OF R
R uses a wide variety of graphical and statistical techniques. These methods and
techniques include traditional statistical tests, linear and nonlinear modelling, time-series
analysis, clustering and categorization.
R is extensible through functions and extensions.
A number of R's standard functions are developed in R itself, which makes it easy and
uncomplicated for users to follow the algorithmic options made. For analytically and
computationally thorough tasks, C, C++, and Fortran code can be joined and called at run
time.
R is highly conservatory through the use of user-submitted packages for overt functions or
specific areas of study.
R has strong object-oriented programming functions than most statistical computing
languages.
Stationary graphics are strength of R, which can construct quality graphs, including
mathematical symbols. Additional packages provide active and interactive graphics.
R is available as Free Software under the terms of the Free Software Foundation’s GNU
General Public License. It gathers and runs on a wide-ranging variety of UNIX platforms,
FreeBSD Linux, Windows and MacOS. A number of packages available implement a
graphical user interface (GUI).
Such packages (e.g. R Commander) remove some of the hassle from learning R, while
letting the user explore more alternatives.
R has approximately 4800 packages specializing in topics like econometrics, spatial
analysis, data mining, and bio-informatics.
R is cross-platform.
R runs on a number of different operating systems and multiple hardware. It is popularly
used on GNU/Linux, Macintosh, and Microsoft Windows, running on both 32 and 64 bit
processors.
R has Rd which is its own documentation format. It is used to supply comprehensive
documentation, both on-line and in hard copy.
R is an integrated collection of software services for data manipulation, computation and
graphical display. It includes:
• A well-organized data handling and effective storage facility,
• A convenient set of operators for calculations on arrays,
• A large, rational, integrated collection of transitional tools for data analysis,
• Graphical amenities for data analysis and presentation either on-screen or on hardcopy,
and

MS 110 Research Methodology Uttarakhand Open University
Unit 18 Use of Statistical Softwares Page 337 of 434
• A well-classified, straightforward, simple and effective programming language which
encompass conditionals, loops, user-defined recursive functions and input and output
facilities.
• As "languages" they allow you to put across any idea.
R and MATLAB are the wealthiest statistical systems till now. They contain a remarkable
amount of libraries, which is day by day growing. R libraries are richer than those of
MATLAB, in terms of modern functional statistics tools. Also R is free software. On the
other side, MATLAB has much better graphics.
MATLAB and R perform most general statistical analyses (regression, logistic regression,
analysis of variance, factor analysis, multivariate analysis). The greatest strengths of both are
probably in its ANOVA, mixed model analysis and users innovative freedom in analysis.
Many analysts consider R as a statistics system but actually it is an environment within which
statistical techniques are put into action. About eight packages are supplied with the R
distribution and many other are available through the CRAN family of Internet sites covering
a very wide range of modern statistics.
Figure18.3: R Graphics
18.6.2 ADVANTAGES OF R
R is the most inclusive statistical analysis package.
It includes all standard statistical tests, models, and analyses, as well as provides an
inclusive language for managing data. New technology and ideas often appear first in R.

MS 110 Research Methodology Uttarakhand Open University
Unit 18 Use of Statistical Softwares Page 338 of 434
R despite of being a programming language provides an environment developed for
statistical analysis by practising statisticians and researchers.
It replicates well on a very proficient community of statisticians.
The graphical functions of R are outstanding.
The validity of the R software is ensured through openly validated
and inclusive governance.
Since R is an open source it can be and has been reviewed by many internationally
prominent statisticians and computational scientists.
R is free and open source software so anyone can use as well as amend it.
R has no license restrictions (other than ensuring our freedom to use it at our own
discretion), and so we can run it anywhere and at any time, and even sell it under the
conditions of the license.
Possible to install on any operating system.
Possible to install on removable media like USB, therefore can be run on any computer.
R mingles well with many other tools and importing data, for example, from SPSS, CSV,
and SAS, or directly from Microsoft Excel, Oracle, Microsoft Access, MySQL, and
SQLite. It can also produce graphics output in JPG, PDF, SVG and PNG formats, and
table output for LATEX and HTML.
R has active user groups where questions can be asked and are often quickly responded to,
often by the very core developers who developed the environment.
18.6.3 DISADVANTAGES OF R
There are numerous simple-to use graphical user interfaces (GUIs) for R that include point
and-click interfaces, but they generally do not have the polish of the commercial offerings.
Documentation is sometimes erratic and snappy. However, some very high-standard
books are continuously increasingly plugging the documentation gaps.
Many R commands consume a lot of available memory. This can be a restraint when
doing data mining.
18.7 STATISTICAL PACKAGE FOR THE SOCIAL SCIENCES
(SPSS) SPSS- (Statistical Package for the Social Sciences now Statistical products and Solution
services) is most extensively used in social science stream. SPSS is the oldest software out of
all available programs. It was developed and made publicly available in 1960s and has been
redeveloped continuously over the years. It was initially produced by SPSS Inc., and later
was acquired by IBM in 2009. Hence the current versions are officially named IBM SPSS
Statistics. SPSS was primarily developed as a statistical package for the social sciences;
however, over the years its capability has grown. Amenities available include OLAP cubes,
descriptive, tabulations, a number of parametric and non-parametric tests, regression
techniques (including general linear, mixed-effects, logistic, ordinal, log-linear), multivariate
analyses (including cluster, discriminant, principal components, confirmatory analysis and

MS 110 Research Methodology Uttarakhand Open University
Unit 18 Use of Statistical Softwares Page 339 of 434
scaling analysis), and survival analysis (including Cox proportional hazards with time
dependent and without time dependent variables). SPSS has a "point and click" interface that
assists you to use bring down menus to opt for commands that you wish to carry out. There
are slight variations in the different version of SPSS e.g. version 10, 11, 12, 13, 14, 15, 16,
etc. SPSS Statistics set off V25, the latest version, on August 08, 2017. V25 includes
new Bayesian Statistics functions, a method of statistical inference and publication ready
charts, such as powerful new charting capabilities, including new default templates and the
ability to share with Microsoft Office applications.
Most of the psychologists, sociologists, social workers as well as corporate for market
research, use this program to feed their research data and formulate results. It is also used by
health researchers, survey companies, government, education researchers, marketing
organizations, and data miners. It is one of the broadly used software as users find it easy to
navigate with SPSS. SPSS market research solutions can help you:
Understand the market perception of your brand.
Conduct effective category management.
Confidently Develop Product feature.
Perform competitive analysis.
Some of the industries which are using SPSS in research for better decision making include –
Education Industry
Retail Industry
Healthcare Industry
Manufacturing Industry
Government
Insurance Sector
SPSS supports the user in presenting and describing data, analysing data, testing hypotheses
and checking for a correlation or relationship between one or more variables. Hence, SPSS is
very apt for:
Descriptive statistics: Cross tabulation, Frequency Distribution, Descriptives, Explore,
Descriptive Ratio Statistics
Bivariate statistics: t-test, ANOVA, Correlation (bivariate, partial, distances),
Nonparametric tests
Prediction for numerical outcomes: Linear regression
Prediction for identifying homogenous groups: Factor analysis, cluster analysis (two-
steps, K-means, hierarchical), Discriminant analysis
SPSS datasets have a two-dimensional table configuration, where the rows represent cases for
instance respondents or households and the columns represent measurements/variables for
instance gender, age, income, educational qualification etc. Only two data types are defined:
numeric and text (or "string"). All data dispensation takes place sequentially case-by-case

MS 110 Research Methodology Uttarakhand Open University
Unit 18 Use of Statistical Softwares Page 340 of 434
through the file /dataset. Files can be matched one-to-one and one-to-many, but not many-to-
many. The graphical user interface has two views which can be buttoned by clicking on one
of the two tabs in the bottom left of the SPSS Statistics window. First, the 'Data View' shows
a spreadsheet view of the cases (rows) and variables (columns). Unlike spreadsheets, the data
cells can only contain numbers or text and formulas cannot be stored in these cells. The
second, 'Variable View' displays the metadata dictionary where each row represents a
variable and shows the variable name, variable label, value, label(s), print width,
measurement type, and a number of other features. Cells in both views can be manually
edited, defining the file structure and allowing data entry without using command syntax.
Figure 18.4: View of SPSS Screen
This may be adequate for small datasets. Larger datasets are often created in data
entry software, or entered during computer-assisted personal interviewing, by scanning and
using optical character recognition and optical mark recognition software, or by direct
capture from online questionnaires. These datasets are then read into SPSS.
Statistical output of analysis is in the form of a proprietary file format (*.spv file). The
proprietary output can be exported to text or Microsoft Word, PDF, Excel, and other formats.
On the other hand, output can also be saved as data (using the OMS command), as text, tab-
delimited text, PDF, XLS, HTML, XML, SPSS dataset or a variety of graphic image formats
(JPEG, PNG, BMP and EMF). SPSS Statistics has three significant windows, plus a menu
bar at the top. These allow you to (1) see your data, (2) see your statistical output, and (3) see
any programming commands you have written. Each window corresponds to a separate type
of SPSS file.

MS 110 Research Methodology Uttarakhand Open University
Unit 18 Use of Statistical Softwares Page 341 of 434
Data Editor (.sav files)
The Data Editor helps you see and manipulate your data. In any case you will always have at
least one Data Editor open (even if you have not yet opened a data set). A working copy of
your data is visible when you open an SPSS data file. Changes you make to your data are
permanent only when you save them (click File - Save or Save As). Data files are saved with
a file type of .sav, a file type that most other software cannot work with. You are able to shut
down SPSS when you close your last Data Editor. You will also be prompted to save all
unsaved files.
Figure 18.5: Variable View in SPSS
To open a different and new data set, click File - Open - Data. (It is also possible to open
some non SPSS data files by this method, such as Excel, STATA, or SAS files.) Many data
sets open simultaneously with help of SPSS. A tiny red "plus" sign on the title bar indicates
active data set i.e. the data set that you are currently working with.
Output Viewer (.spv files)
SPSS carries out various computations and other tasks and the results are shown up in a
variety of places. New data values are shown up in the Data Editor. Statistical results will
show up in the Output Viewer.
Statistical output and any graphs that you create are shown in the Output Viewer. By default it
also shows you the programming language for the commands that you issued (called syntax in
SPSS jargon), and also most of the error messages also appear here. You can edit and print
your results from the the Output Viewer. The tables of the Output Viewer are saved (click File
- Save or Save As) with a file extension of .spv, which can only be opened with SPSS
software. It is possible to open more than one Output Viewer at the same time to look at more

MS 110 Research Methodology Uttarakhand Open University
Unit 18 Use of Statistical Softwares Page 342 of 434
than one output file. A tiny blue plus sign indicates the active viewer. This active output
viewer will receive the results of any commands that you issue. If you shut down all the
Output Viewers and then issue a new command then a fresh Output Viewer is started to
receive the command.
SPSS is appropriate for most regression analysis and different kinds of ANOVA (regression,
logistic regression, survival analysis, analysis of variance, factor analysis, multivariate
analysis but not appropriate for time series analysis and multilevel regression analysis). SPSS
is highly useful for those involved in market research. SPSS supports the resourceful
gathering of market information/data through a variety of methods (like questionnaire,
survey) and make it easier to analyze the information and interpret the results and provide it
to decision makers for necessary decisions.
Figure 18.6: Output File in SPSS
SPSS provides a number of functions for data manipulation, permitting a variety of data
conversions and restricting to be simply performed. It also supports to import data from, and
export results to a variety of different file formats like Microsoft Excel and Microsoft Access,
Microsoft Word. A number of functions to make graph and chart are provided. A variety of
tools exist to allow output/results in formats customized for specific user requirements. A
graphical user interface is provided allowing users to perform logical batched and non-
batched analyses from menu options and dialogue boxes. With available menus and dialogue
boxes, you can perform analyses without having to prescribe and write command syntax.
Additionally, SPSS provides syntax and scripting facilities so that analyses can be
programmed for future re-use and documentation.
SPSS is the most accepted quantitative analysis software program used by social scientists.
Made and sold by IBM, it is inclusive, flexible, and can be used with almost any type of data
file. However, it is especially useful for analyzing large-scale survey data , for instance
forecasting election results. It has its utility to generate tabulated reports, charts, and plots of

MS 110 Research Methodology Uttarakhand Open University
Unit 18 Use of Statistical Softwares Page 343 of 434
distributions and trends, as well as produce descriptive statistics like mode, mean, median and
frequency distribution. It has advance use to more complex statistical analyses like regression
models. SPSS provides its user’s an edge that makes it insightful for all levels of users.
Programs can be run interactively or unattended, using the supplied Production Job Facility.
In addition to statistical analysis, data management (case selection, file reshaping, creating
derived data) and data documentation (a metadata dictionary was stored in the data file) are
features of the base software.
18.7.1 ADVANTAGES OF SPSS:
More powerful than Minitab
Most widely used and popular statistical packages in academia and industry
There is command line interface in addition to menu driven user interface
One of the most powerful and also easy to use statistical package
18.7.2 DISADVANTAGES OF SPSS:
There are a very few quirks here and there.
There is a limitation on the number of cases you can analyze.
It is also difficult to report for weights, strata and group effects with SPSS.
Non-scary to only those who are familiar with Excel.
Can be a bit firm with regards to advanced options for tests sometimes.
Lacking some of the complex statistical procedures and data handling capabilities of the
more advanced programmes.
Not adequate for modelling and cutting edge statistical analysis
18.7.3 KEY TO USE SPSS
Click on the "variable view" tab on the bottom of the page. SPSS has two Excel-style
sheets, one for naming variables and one for entering data. Name your variables in a
recognizable manner. These are the variables you will be analyzing later on.
Enter the correct parameters for each variable. You will have several options and the
parameters will depend on your study hypothesis, type of data and intended analysis.
Click on the "data view" tab on the bottom of the page. Enter you data under each
respective variable. The variables will appear at top of the page, and data is entered in
columns under each variable.
Analyze your data. The data-analysis possibilities are seemingly endless and determined
by your study outcome. Click on the "analyze" tab at the top of the page and explore the
options. Click on the "descriptive statistics" tab if you want a simple display of central
tendencies. To examine the variance between two groups of data click on the "compare
means" tab.
Examine you data. When you have chosen the desired statistical procedure and clicked
on the "OK" button, SPSS will produce an output sheet displaying all of the analyses.
Be sure to save this sheet.
MS 110 Research Methodology Uttarakhand Open University
Unit 18 Use of Statistical Softwares Page 344 of 434
Check Your Progress-B
Q1. “R is a better software than MATLAB”. Do you agree? Give reasons.
-------------------------------------------------------------------------------------------------------------
-------------------------------------------------------------------------------------------------------------
-------------------------------------------------------------------------------------------------------------
Q2. How does SPSS help the researchers?
-------------------------------------------------------------------------------------------------------------
-------------------------------------------------------------------------------------------------------------
-------------------------------------------------------------------------------------------------------------
Q3. Which industries are using SPSS extensively?
-------------------------------------------------------------------------------------------------------------
-------------------------------------------------------------------------------------------------------------
-------------------------------------------------------------------------------------------------------------
Q4. Fill in the blanks:
i. R is an................................................................ and................................ for
statistical processing, computing, illustration and graphics.
ii. R is an execution of the................................ joined with lexical scoping semantics
inspired by Scheme.
iii. ................................are strength of R, which can construct quality graphs,
including mathematical symbols.
iv. 9.The abbreviation SPSS stands for
...........................................................................................
v. SPSS has a ............................... interface that allows you to use bring down menus
to opt for commands.
vi. SPSS supports the user in……………. and……………. data, ……………. data,
testing hypotheses.
vii. Statistical output of analysis in SPSS is in the form of a proprietary file
format ……………..

MS 110 Research Methodology Uttarakhand Open University
Unit 18 Use of Statistical Softwares Page 345 of 434
18.8 STATISTICAL ANALYSIS SYSTEM (SAS) SAS (previously known as Statistical Analysis System) is a software created by SAS
Institute, for detailed advanced analytics, multivariate analyses, business intelligence, data
management, and predictive analytics.SAS was created and developed at North Carolina
State University from 1966 until 1976. SAS was further improved and developed in the
1980s and 1990s with the addition of new statistical procedures and packages, additional
components and the introduction of JMP. A point-and-click interface was added to enhance
version 9 in 2004. Further a ‘social media analytics’ feature and product was added in 2010.
Version of SAS, produced and developed in December 2011 is a package that many "power
users" appreciate and like because of its power and programming ability.
Text Miner Software was introduced in 2002. Text data like emails are analysed by Text
Miner for patterns in Business Intelligence Applications. In 2004, SAS Version 9.0 was
released, which was nicknamed "Project Mercury" and was designed to make SAS accessible
to a broader range of business users. Version 9.0 added custom user interfaces based on the
user's role and established the point-and-click user interface of SAS Enterprise Guide as the
software's primary graphical user interface (GUI). The Customer Relationship
Management (CRM) features were improved in 2004 with SAS Interaction Management. In
2008 SAS announced Project Unity, designed to integrate data quality, data integration and
master data management.A free version was introduced for students in 2010. SAS Social
Media Analytics, a tool for social media monitoring, engagement and sentiment analysis, was
also released. SAS Rapid Predictive Modeler (RPM), which creates basic analytical models
using Microsoft Excel, was introduced that same year. JMP 9 in 2010 added a new interface
for using the R programming language from JMP and an add-in for Excel. The company
introduced 27 data management products from October 2013 to October 2014 and updates to
160 others. As of 2011 SAS's largest set of products is its line for customer intelligence.
Numerous SAS modules for web, social media and marketing analytics may be used to
profile customers and prospects, predict their behaviours and manage and optimize
communications. SAS also provides the SAS Fraud Framework. The framework's primary
functionality is to monitor transactions across different applications, networks and partners
and use analytics to identify anomalies that are indicative of fraud. SAS Enterprise GRC
(Governance, Risk and Compliance) provides risk modelling, scenario analysis and other
functions in order to manage and visualize risk, compliance and corporate policies. There is
also a SAS Enterprise Risk Management product-set designed primarily for banks and
financial services organizations.
SAS is a software set that can “RAMM data” i.e. recover, amend, mine, and manage data
from a variety of sources and perform statistical analysis on the “RAMMed data”. The
analysis is made easy for non-technical users as SAS provides a graphical point-and-click
user/consumer interface and more advanced options through the SAS language. To start with
SAS, data should be compulsorily in a spreadsheet table format or SAS format. The DATA
step of SAS programs are able to retrieve and manipulate data by creating a SAS data set.
Data sets are filled into tables with rows named "observations" and columns named

MS 110 Research Methodology Uttarakhand Open University
Unit 18 Use of Statistical Softwares Page 346 of 434
"variables". Additionally, each piece of data holds a descriptor and a value. A series of
statements are there in each step. The data is analysed at the PROC step of the program. The
DATA step has executable statements which make the software to take an action. Declarative
statements provide instructions and make the software to read a data set or revise the data's
appearance. Hence, the DATA step has two phases namely, compilation and execution. In the
compilation phase, declarative statements are processed and syntax errors are documented.
Later, the execution phase sequentially processes each executable statement.
The PROC step consists of PROC statements that call upon named procedures. Procedures
perform analysis and report the results on data sets to produce statistics and graphics. There
are more than 300 procedures and each procedure contains a sizeable body of programming
and statistical work. Apart from displaying results, PROC statements can also sort data or
perform other operations. SAS Macros are pieces of code or variables that are coded once and
referenced to execute recurring tasks.
HTML, PDF, Excel and other formats can be used to publish SAS data, using the Output
Delivery System (which was first introduced in 2007). The SAS Enterprise Guide is SAS'
point-and-click interface. This guide details codes to manipulate data or perform analysis
automatically and thus non technical users do not require SAS programming experience to
use.
SAS can work with many data files at once SAS can handle enormous data files up to 32,768
variables and the number of records is generally limited to the size of your hard disk. SAS
performs most general statistical analyses (regression, logistic regression, survival analysis,
analysis of variance, factor analysis, multivariate analysis). The greatest strengths of SAS are
probably in its ANOVA, mixed model analysis and multivariate analysis, while it is probably
weakest in ordinal and multinomial logistic regression (because these commands are
particularly difficult), and robust systems (it is difficult to carry out robust regression, or
other kinds of robust methods- ATS Ucla Edu(2014). Although there are some supports for
the analysis of investigation data, they are quite limited as compared to STATA.
SAS, short for Statistical Analysis System, is also used by many businesses; in addition to
statistical analysis, it also allows programmers to perform report writing, graphics, business
planning, forecasting, quality improvement, project management and more. SAS is an
extensive program for the intermediate and advanced user because it is very powerful; it can
be used with extremely large data sets and can perform complex and advanced analyses.SAS
has different products featured for different areas.SAS' products for monitoring and
managing the operations of IT systems are collectively referred to as SAS IT Management
Solutions. SAS collects data from various IT assets on performance and utilization, and then
creates reports and analyses. SAS' Performance Management products consolidate and
provide graphical displays for key performance indicators (KPIs) at the employee,
department and organizational level. The SAS Supply Chain Intelligence product suite is
offered for supply chain needs, such as forecasting product demand, managing distribution
and inventory and optimizing pricing. There is also a "SAS for Sustainability Management"
set of software to forecast environmental, social and economic effects and identify causal

MS 110 Research Methodology Uttarakhand Open University
Unit 18 Use of Statistical Softwares Page 347 of 434
relationships between operations and an impact on the environment or ecosystem. SAS has
product sets for specific industries, such as government, retail, telecommunications and
aerospace and for marketing optimization or high-performance computing. SAS is used for
data analyses in health service research also.
It is said that SAS is the largest market-share holder in "advanced analytics". It is the fifth
largest market-share holder for business intelligence (BI) software and the largest
independent vendor. It competes in the Business Intelligence market against conglomerates,
such as SAP Business Objects, IBM Cognos, SPSS Modeler, Oracle Hyperion, and Microsoft
BI. SAS is good for analyses that require you to take into account weights, strata or groups.
Unlike SPSS and STATA, SAS is run largely by programming syntax rather than point-and-
click menus, so some knowledge of the programming language is required.
Figure 18.7: SAS Windows
18.8.1 ADVANTAGES OF SAS:
Wide acceptance as the leader in statistical analysis and modelling
Pretty much industry standard.
Widely used in medical research and pharmaceutical industry
Widely used in industry and academia
Well supported by the consulting biostatisticians.

MS 110 Research Methodology Uttarakhand Open University
Unit 18 Use of Statistical Softwares Page 348 of 434
Is very skilful at data manipulation as well as analysis.
Large range of procedures like from descriptive statistics to simple analysis and on to
complex analysis.
Usually good tutorials with many worked examples available .
Can write programmes to automate some time-consuming processes.
You save your analysis scriptless to keep track of what analysis you actually did so that
you can amend it or re-run it later on.
For those who are aversive to text-based programming, there are some graphical user
interfaces
18.8.2 DISADVANTAGES OF SAS:
Very expensive
SAS is a script-based programming system
There is a steep learning curve at the start, even for very simple analyses
Essentially a programming language can be tricky to get your head around, and seems
intimidating when you start using it
Relatively poor graphics capabilities
18.9 MS-EXCEL Microsoft Excel is a very popular software application and is part of the Microsoft Office
2010 productivity suite. Microsoft Excel is a powerful spreadsheet package available for
Microsoft Windows. Spreadsheet software is used to store information in columns and rows
which can then be further processed and explored. Spreadsheets are designed to work well
with numbers but also include text. Excel is majorly used to analyze data, for instance it is
used in accounts, budgets, billing, statistics and many other significant areas. In Excel you
can explore the menu bar and perform different tasks. You can work on spreadsheets doing
basic math, adding and deleting columns and rows, and preparing the worksheet for printing.
You can explore your data to show trends, patterns and comparisons between the data in a
chart, table or other template. This includes organizing data, i.e. basic data management,
tabulation and graphics. Excel can perform most of the general statistical analyses but it is
weak in regression, logistic regression, survival analysis, analysis of variance, factor analysis,
multivariate analysis. But once you have performed basic analyses you can import
spreadsheets in SPSS for advanced analyses.

MS 110 Research Methodology Uttarakhand Open University
Unit 18 Use of Statistical Softwares Page 349 of 434
18.9.1 THE EXCEL SCREEN
Figure 18.8: The Excel Screen with Tool Bar
18.9.2 WORKBOOKS AND WORKSHEETS:
When you start Excel, a blank worksheet opens on the screen which consists of a multiple
grid of cells with numbered rows down the page and alphabetically-titled columns across the
page. Each cell is named or referenced by column alphabet and row number i.e each cell is
referenced by its coordinates for example, A3 is used to refer to the cell in column A and row
3; B10:B20 is used to refer to the range of cells in column B and rows 10 through 20).
Excel saves files that it calls workbooks. A workbook is a collection of worksheets and
chartsheets. It presents charts separately from the worksheet data on which they are based.
Each workbook may contain several worksheets and/or charts - the current worksheet is
called the active sheet. You have to click the appropriate Sheet Tab to view a different
worksheet in a workbook. When you click, save an excel file, you save a workbook with
either the .xlsx or .xls file format.
You can access and execute commands directly from the main menu or you can point to one
of the toolbar buttons (the display box that appears below the button, when you place the
cursor over it, indicates the name/action of the button) and click once. Excel is capable to
organize your work into workbooks. Excel is available on all public-access PCs (i.e., those,
e.g., in the Library and PC Labs). It can be accessed either by selecting Start - Programs -
Microsoft Excel or by clicking on the Excel Short Cut which is either on your desktop, or on
any PC, or on the Office Tool bar.

MS 110 Research Methodology Uttarakhand Open University
Unit 18 Use of Statistical Softwares Page 350 of 434
Figure 18.9: MS Excel file with Tool Bar, Data and Graph
18.9.3 ADVANTAGES OF MS EXCEL:
Can be installed on most of the computers.
Most computer users have at least some experience with Excel.
It is very easy and convenient to use for data entry and data storage.
Fairly easy to use for basic descriptive statistics.
It has some basic tools for analysis built in e.g. t-tests, correlation, chi-square test.
Access database features are able to prevent some data storage and access issues.
Access has forms that can be set up for easy and consistent data entry.
18.9.4 DISADVANTAGES OF MS EXCEL:
Any type of data can be stored in Excel (e.g. can enter dates inconsistently across entire
dataset).
There is no simple way (in Excel) to include or exclude particular cases from an analysis
without either deleting the data or making a copy of the numbers (both bad practices,
making it hard to review your work later on).
Excel allows multiple user-errors to slip through the gaps.
Access can be difficult to learn, particularly the way in which queries work.
Access also lacks facilities for calculating some simple descriptive statistics (e.g. median,
quartiles).
Statistical analysis in Excel is usually accessed through the Tools menu option, under Data
Analysis. If this last option is not visible, you can add this option by going to Tools,

MS 110 Research Methodology Uttarakhand Open University
Unit 18 Use of Statistical Softwares Page 351 of 434
selecting the Add-Ins option, and then ticking the boxes that have Analysis Toolpak in the
title.
18.10 STATA A statistical software package with general-purpose , “STATA” was created in 1985 by
StataCorp. Latest version of STATA was developed in June 24, 2013 which is an extremely
rapid and easy to use data management package. The name STATA is an abbreviation which
has been taken from two words ‘statistics’ and ‘data’. STATA is a leading statistical package
with well turned-out data-management services, a wide group of statistical techniques, and an
outstanding system for producing quality graphs. STATA is suitable and available for
Windows, UNIX, and Mac computers. The standard version of STATA is called STATA/IC
where IC stands for Intercooled STATA. It is capable to hold up to 2,047 variables. There is
another unbeatable unique edition called STATA/SE that can hold up to 32,766 variables. It
also allows longer string variables and larger matrices. STATA performs most popularly used
statistical analyses (regression, logistic regression, ANOVA, factor analysis, multivariate
analysis and time series analysis). STATA has multidisciplinary use in the fields such
as economics, sociology, political science, biomedicine and epidemiology. STATA's
proficient in many fields. To name a few, statistical analysis, data mining /management,
graphics, regression, simulations, and custom programming. It also permits a system to
circulate user-written programs that lets it cultivate and develop continuously. There are four
major varieties of each version of STATA:
STATA /MP for multiprocessor computers
STATA /SE for large databases
STATA /IC, which is the standard version called intercooled STATA
Numerics by STATA, is suitable for any of the data sizes
User-written commands are allowed by STATA; shared out as so-called ado-files;
downloaded from the internet which is then not possible to tell apart to the user from the
built-in commands. STATA is an interactive data analysis program. It is useful for simple as
well as complex statistical analyses. It is easy and simple to produce graphs and plots of data
and results. It is easy to use STATA as it has a point-and-click interface as well as command
syntax. Analysis in STATA is conducted through four windows:
the command window,
review window,
result window and
variable window
Command window is used for entering commands for analysis. Recording of those
commands takes place in review window. Listing of variables takes place in the variables

MS 110 Research Methodology Uttarakhand Open University
Unit 18 Use of Statistical Softwares Page 352 of 434
window. It lists the variables that are offered by the current data set along with the variable
labels, and finally the results appear in the results window.
18.10.1 ADVANTAGES OF STATA:
Executes a large number of statistical analyses
Easier to get to grips than SAS in first instance
Has some quick to use commands that give results for simple questions quickly (usually
take 1 minute to run whereas it takes 5 minutes to set up in SAS).
Has a large amount of example data for tutorials available within the package, as well as
online.
There is availability of large number of downloadable extensions that can be used to do
more complex analysis/data presentation.
18.10.2 DISADVANTAGES OF STATA:
Unable to face SPSS dominance
Orientated to writing syntax/code
Pull-down windows is always debated
Before version 8, limited graphics
Now, complex graphics
Variable labelling
Editing of output difficult
Check Your Progress-C
Q1. Write a brief note on SAS.
-------------------------------------------------------------------------------------------------------------
-------------------------------------------------------------------------------------------------------------
-------------------------------------------------------------------------------------------------------------
Q2. What are additional uses of SAS other than statistical analysis?
-------------------------------------------------------------------------------------------------------------
-------------------------------------------------------------------------------------------------------------
-------------------------------------------------------------------------------------------------------------

MS 110 Research Methodology Uttarakhand Open University
Unit 18 Use of Statistical Softwares Page 353 of 434
Q3. Why is MS EXCEL extensively used in businesses?
-------------------------------------------------------------------------------------------------------------
-------------------------------------------------------------------------------------------------------------
-------------------------------------------------------------------------------------------------------------
Q4. Explain superiority of STATA over other contemporary software.
-------------------------------------------------------------------------------------------------------------
-------------------------------------------------------------------------------------------------------------
-------------------------------------------------------------------------------------------------------------
Q5. Discuss the major forms of STATA.
-------------------------------------------------------------------------------------------------------------
-------------------------------------------------------------------------------------------------------------
-------------------------------------------------------------------------------------------------------------
Q4. Fill in the blanks:
i. The abbreviation SAS stands
for.............................................................................. .
ii. SAS's largest set of products is its line for................................ .
iii. Once we have performed basic analyses we can ................................in SPSS
for advanced analyses.
iv. Excel saves files that it calls……………..
v. A workbook is a collection of ……………. and………………..
vi. You have to click the appropriate…………….. to view a different worksheet
in a workbook
vii. The name STATA is an abbreviation which has been taken from two
words ……………. and……………..
viii. Analysis in STATA is conducted through four windows namely, ……………. ,
……………. and the……………….
18.11 EVIEWS EViews is a new edition of a group of tools for manoeuvring time series data originally
developed in the Time Series Processor software for large computers. EViews is a software
system that comprises a refined data management system, persuasive batch programming and
matrix languages, and presentation quality graph and table creation tools to sustain your
entire work process. EViews offers candidness and extensibility.
EViews is one of the largely accepted econometric packages around. It contains a host of up-
to-date econometric features and is exceptionally painless to use. In addition to the menu
driven object oriented user interface, it is also possible to write simple programs in EViews

MS 110 Research Methodology Uttarakhand Open University
Unit 18 Use of Statistical Softwares Page 354 of 434
programming language. Though EViews was developed by economists and most of its uses
are in economics, there is nothing in its design that limits its worth to economic time series.
Even quite large cross – section projects can be handled in EViews.
E-views is a spreadsheet software used for a range of data analysis. It has some resemblance
to the commonly used Microsoft Excel and does support this type of files. EViews offers
refined data analysis, regression, and predicting tools on Windows based computers. It
facilitates you to do traditional Excel analysis for instance descriptive statistics as well
simultaneously allows more advanced calculations, regressions and simulations, which you
won’t find in Excel. Besides its amplified functionality, it also operates at a much faster pace,
both in terms of calculation time and in terms of ease of use. Especially EViews data series
analysis functions are advanced and superior to many of its competitors.
The EViews program is designed around the concept of ‘objects’. ‘Objects’ are collections of
related information and operations that are grouped together in an easy-to-use unit. Virtually
all of your work in EViews will involve using and manipulating various ‘objects’. Imagine an
object as a filing cabinet or organizer for the item with which you are working. The most
important ‘object’ in EViews is the ‘workfile’ and your first step in any project will be to
create a new workfile or to load an existing workfile into memory. Each ‘object’ consists of a
bundle of information related to a particular area of analysis. Objects associated with a
particular concept are said to be given type, where the type name is used to identify the
subject of analysis. Associated with each type of ‘object’ is a set of views and procedures
which can be used in association with the information contained in the object. For example:
A ‘series object’ is a set of information related to a set of observations on a particular
variable. ‘An equation object’ is a set of information related to the relationship between a
group of variables. Since an equation object contains all of the information pertinent to an
estimated relationship, you can move freely between a variety of equation specifications
simplify by choosing to work with a different equation object.
You can scan results, perform hypothesis and specification tests, or generate forecasts at any
time. Managing your work is simplified since only a single object is used to work with an
entire collection of data and results. EViews organizes data, graphs, output, and so forth, as
objects. Each of these objects can be copied, saved, cut-and-pasted into other Windows
programs, or used for further analysis. A collection of objects can be saved together in a
workfile. Since EViews creates new objects with everything you do, it makes sense to delete
unimportant intermediate results to avoid a messy workfile.
At the moment EViews only exists for Windows operation system. Mac and Linux users need
to install a version of Windows (XP, Vista, 7 all work) to be able to run the application. The
system requirements are quite modest. A full version of EViews 6.0/7.0 is currently installed
on the student computer labs PCs. EViews has the bare interface at a first glance. But its
potency lies not in its appearance, but in its ease of use, which despite the uncomplicated user
interface, is very accessible. At this point the interface only comprises areas of importance.

MS 110 Research Methodology Uttarakhand Open University
Unit 18 Use of Statistical Softwares Page 355 of 434
In the figure 18.2 below, at point 1 is the traditional tool bar, which includes the different
tools. The content of these diverse dropdown menus depends on which EViews window you
select beforehand. For instance not selecting a data set and clicking the proc button gives you
no options at all, while the same click gives manifold different opportunities after selecting a
window containing data.
In the figure 18.10 below, at point 2 is the coding area/prompt. This area allows you to affect
different text based commands, which is used for data manipulation as well as a potential
shortcut for making different regressions. The grey area below the coding line is alike to the
desktop of your PC to some extent. It can include numerous windows, including data
spreadsheets, regression results, graphs and numerous different outputs.
Figure 18.10: Empty Interface of EViews at a First Glance
Data can be typed into EViews as soon as you have a workfile opened. Using the menu items
Quick/Empty Group (Edit Series) will give you a spreadsheet window. At the top of the
window you will see an Edit+/button. This locks or unlocks the spreadsheet for editing. Once
unlocked for editing you simply type in the data. As Excel is commonly used for data storage,
therefore most of the time, data is imported from an Excel worksheet into EViews. The most
straightforward way of doing this is using Copy and Paste. To begin with, you will be
working relatively small datasets comprising only a few series and a few observations, so cut
and paste will be the fastest way to load data into EViews.
Like Excel, EViews can import data from different types of text files. The process is very
similar to the one used in Excel. It is how-ever very important to be aware that to import text
files (.txt), you must still use the : file/open/Foreign data or work file process and not the
file/open/text file, since this will not lead to EViews treating the content of the file as data,
but as plain text. EViews automatically detects the structure of the file, but will let you
preview the result before the final import. In some more advanced cases, the text file importer
of Excel may be considered superior – and hence import of the text file first in Excel is
possible, and then import the resulting Excel file in EViews.
For importing Excel files with large datasets and large series, one can simply drag-and-drop
the Excel file to the EViews window. This will automatically open the file and show the
included variables. Just in case you have an Excel file which does not have the support

MS 110 Research Methodology Uttarakhand Open University
Unit 18 Use of Statistical Softwares Page 356 of 434
structure, you must manually adjust the structure. Remove graphs and all non-observation
within the Excel file, save the file and try to import it again. The alternative to the drag and
drop option is going: file/open/Foreign data or work file and then browsing your way to the
Excel file. When you save in Excel, it is important that you choose "save as ..." and then
"Excel 97-2003 Workbook". EViews will have problems if you import a 2007 file.
Importing data sets of the SPSS, file format .sav will result in problems from time to time.
One common problem is that EViews reads all the variables within the SPSS file to be
nominal instead of ratio scaled. This can be solved within EViews, but takes a very long time,
and is beyond the scope of this text. In general you must make the necessary adjustments
within SPSS before trying to import the file to EViews. To import the SPSS files: file /open
/Foreign data or work file.
The EViews program make available regression and forecasting tools on Windows
computers. With EViews you can develop a statistical relation from your data and then use
the relation to forecast potential future values of the data. Areas where EViews can be useful
include:
Sales Forecasting
Cost analysis and forecasting
Financial Analysis
Macroeconomic forecasting
Simulation
Scientific data analysis and evaluation
EViews uses the visual features of modern Windows software. You can use your mouse to
guide the operation with standard Windows menus and dialogues. Results appear in windows
and can be manipulated with standard windows techniques. Alternatively, you may use
EViews’ powerful command language. You can enter and edit commands in the command
window. You can create and store the commands for a complete research project.
Some of the important basic capabilities of EViews are:
Entering, extending and correcting time series data.
Computing a new series, based on a formula of any complexity.
Plots of series on your screen or printer, scatter diagrams, bar graphs, and pie charts.
Ordinary least squares (multiple regression), least squares with autoregressive correction
and two-stage least squares.
Nonlinear least squares.
Probit and logit estimation of binary choice models.
Linear and nonlinear estimation of systems of equations.
Pooled cross section-time series estimation and forecasting.
ARCH-GARCH estimation and forecasting.
Estimation and analysis of vector autoregressive systems.

MS 110 Research Methodology Uttarakhand Open University
Unit 18 Use of Statistical Softwares Page 357 of 434
Descriptive statistics:correlations,covariances,autocorrelations,cross-correlations, and
histograms.
Seasonal autoregressive and moving error processes.
Polynomial distributed lags.
Forecasts based on regression.
Solution of simultaneous models.
Time-series database management.
Reading and writing of data files in standard spreadsheet formats.
EViews is a simple and easy to use statistical, econometric, and economic modelling
package. There are three ways to work in EViews:
Graphical user interface(using mouse and menus/dialogues)
Single commands(using the command window)
Program files(commands assembled in a script executed in batch mode)
EViews is a simple and easy-to-use, Windows based statistical analysis package in use
worldwide by economists, financial analysts and consultants, market researchers, and policy
analysts and makers. EViews shores up these researchers in a wide range of tasks, from
analyzing economic and financial data, building models and “what if” situations, to
conducting research and teaching econometrics, and estimating the impact of new policies
and developments or major investment changes.
EViews offers many features which support commonly executed tasks. For example
forecasting, multiple equation simulation. EViews provides inert and dynamic forecasting,
forecast evaluation and averaging, stochastic simulation and forward solution for
expectations, as well as forecast standard error computation; model fit diagnostics, and
automatic handling of dependent variable transformations. EViews even embraces automatic
ARIMA forecasting. EViews also provides refined scenario management tools that allow you
to compare results for various add factor, variable exclusion, and override options. And in
typical fashion, EViews even updates your models automatically when the results of linked
equations are refreshed as new data arrive or specifications are altered.
18.12 SUMMARY It fully depends on the scope of the analysis in hand. For some analyses using just one
software is sufficient, while others may be analysed using some other specialized software.
Or else any one of the software with which a researcher is at no difficulty is good. Each of the
major statistical software packages (SAS, R, SPSS, STATA) are pragmatically pretty equal
with regard to functionality. Specific facets of one program may be better than another (e.g.,
graphics), but overall, these software packages were designed to fundamentally do the same
thing: manage and analyze data. Some of the software needs high proficiencies and skills
because they work via coding language. The non-code programs such as SPSS, have
disadvantages because their graphical outputs are not improving and model intervention is
MS 110 Research Methodology Uttarakhand Open University
Unit 18 Use of Statistical Softwares Page 358 of 434
limited. For these few reasons, using the program working with code such as SAS, R,
MATLAB is very efficient for scientific studies. R is free statistical software and it has many
alternatives about data analysis. It is promoted by not only statistical packages but also other
packages such as psychological and social approaches. SAS is an added choice but it is not a
free source. Both of these software are reinforced and differentiated from other choices via
packages and macros. SPSS has a very powerful proprietary command syntax language.
Projects can be prepared with both SAS and STATA and have no problems in re-creating in
SPSS. R seems to be the most accepted and popular one these days as it is open source and
also sophisticated as any of the other programs available, including SPSS.SPSS is a brilliant
piece of software if you want to use predefined statistical test and you don’t want to spend a
lot of time preparing code and data sets. R on the other hand lets a far wider scope of
statistical evaluation. It also permits you to propose and code your own test which in
fundamental nature allows you to create your own tailor made statistical package for your
project. In terms of, which statistical software is better, depends on your project. Although,
SPSS is still the top software in the social sciences. But at doctoral level researches and
above in the physical sciences and engineering researches should be using R. The learning
curve in R is less semantic (as with other scripting languages) than conceptual. And learning
the concepts involved in R can actually give you a much deeper insight of statistics than most
point and click stats programs can. Statistical analysis is an integral and inseparable part of
any study and publication. While commercial statistical software may cost an arm and a leg,
free alternatives are available. While some free alternatives don’t measure up, others are
growing and spending rapidly and may overtake commercial software in features and
popularity.
18.13 GLOSSARY Statistical software (SS): Statistical software (SS) is a software program that
makes the working out and presentation of data/statistics relatively fast, simple and easy.
Statistical Software is a vital tool for research analysis, data validation and findings.
R: R is an open source programming language and programming condition for statistical
computing and graphics. R is a language and condition for statistical processing, computing,
illustration and graphics.
SPSS: SPSS- (Statistical Package for the Social Sciences now Statistical products and
Solution services) is most extensively used in social science stream. SPSS is the oldest
software out of all available programs. Most of the psychologists, sociologists, social workers
as well as corporate for market research, use this program to feed their research data and
formulate results.
SAS: SAS is a software set that can “RAMM data” i.e. recover, amend, mine, and manage
data from a variety of sources and perform statistical analysis on the “RAMMed data”.
MS 110 Research Methodology Uttarakhand Open University
Unit 18 Use of Statistical Softwares Page 359 of 434
SAS is a software created by SAS Institute, for detailed advanced analytics, multivariate
analyses, business intelligence, data management, and predictive analytics.
MS Excel: Microsoft Excel is a powerful spreadsheet package available for Microsoft
Windows. Spreadsheet software is used to store information in columns and rows which can
then be further processed and explored. Excel is majorly used to analyze data, for instance it
is used in accounts, budgets, billing, statistics and many other significant areas. In Excel you
can explore the menu bar and perform different tasks.
STATA: The name STATA is an abbreviation which has been taken from two
words ‘statistics’ and ‘data’. STATA is a leading statistical package with well turned-out
data-management services, a wide group of statistical techniques, and an outstanding system
for producing quality graphs.
18.14 ANSWERS TO CHECK YOUR PROGRESS
Check Your Progress –A
Fill in the blanks:
i. 1.vital
ii. 2. aim
iii. 3.association, correlation
iv. 4. MS EXCEL
v. 5.data handling, processing and analysis.
Check Your Progress –B
Fill in the blanks:
i. open source programming language, programming condition
ii. S programming language
iii. Stationary graphics
iv. Statistical Package For The Social Sciences
v. "point and click"
vi. presenting, describing, analysing
vii. *.spv file
Check Your Progress –C
Fill in the blanks:
i. Statistical Analysis System (SAS)
ii. customer intelligence
iii. import spreadsheets
iv. workbooks
MS 110 Research Methodology Uttarakhand Open University
Unit 18 Use of Statistical Softwares Page 360 of 434
v. worksheets , chartsheets
vi. Sheet Tab
vii. ‘statistics’ and ‘data’
viii. command window, review window, result window and variable window
18.15 REFERENCES
Acock, Alan C.(2005), "SAS, STATA, SPSS: A Comparison", Journal of
Marriage and Famil, Volume 67 ,No.4 November, pp- 1093–1095.
Agun, I., Gusti Ngurah (2011), Time Series Data Analysis Using EViews, John
Wiley & Sons, ISBN 978-1-118-17630-6.
Books
Chawla D., Sondhi N. (2011), Research Methodology: Concepts and Cases, Vikas
Publishing House Pvt. Ltd.,Noida
Cotton R. (2013), Learning R: Step by Step Function Guide to Data Analysis,
Publisher O’Reilly Media, Inc.
George D., Mallery Routledge P., IBM SPSS Statistics 23 Step by Step: A Simple
Guide and Reference, 14th
edition, Taylor & Francis Publications, New York and
London
Levesque, R. (2007), SPSS Programming and Data Management: A Guide for
SPSS and SAS Users , (4th ed.), Chicago, Illinois: SPSS Inc. ISBN 1-56827-390-8.
McCullough, B.D. (1999), "Econometric Software Reliability: EViews, LIMDEP,
SHAZAM and TSP", Journal of Applied Econometrics Vol.14 No.2, pp-191–202.
Ms. Xiaoping Zhu and Dr. Ognjen Kuljaca (2005), A Short Preview of Free
Statistical Software Packages for Teaching Statistics to Industrial Technology
Majors, Journal of Industrial technology, vol. 21, no. 2.
N. Jyoti Bass; K. Madhavi Lata(2007) Base SAS Programming Black Book, 2007
Edition, Dreamtech Press ISBN 978-81-7722-769-7.
Pinzon, Enrique (2015), Thirty Years with STATA: A Retrospective. College
Station, Texas: Stata Press. ISBN 978-1-59718-172-3.
Ramon C., Littell Goerge A., Milliken, Walter W. Stroup, Russell D., Wolfingers,
Oliver Schabennerger (2013), SAS for Mixed Models,2nd
edition, Published by SAS
Institute INC. Carry, MC, USA
Rudasa I., Berzina L.(2012), Statistical Software for Statistics Teaching and Data
Analyzing: Improving the Teaching and Learning of Mathematics and Informatics,
Kaunas, Lithuania Kaunas: Aleksandro Stulginskio university, pp-24-26.

MS 110 Research Methodology Uttarakhand Open University
Unit 18 Use of Statistical Softwares Page 361 of 434
Wellman, B. (1998), "Doing It Ourselves: The SPSS Manual as Sociology's Most
Influential Recent Book", University of Massachusetts Press, ISBN 978-1-55849-
153-3.
18.16 SUGGESTED READINGS
1. Nourse, E. Shepley, Greenberg, Bernard G., Cox, Gertrude M., Mason, David D.,
Grizzle, James E., Johnson, Norman L., Jones, Lyle V., Monroe, John, Simons,
Gordon D. (1978), "Statistical Training and Research: The University of North
Carolina System", International Statistical Review, Vol. 46 No.2 , pp-
171. ISSN 0306-7734. JSTOR 1402812.
2. Susan J. Slaughter (2012), The Little SAS Book: A Primer : A Programming
Approach, SAS Institute, ISBN 978-1-61290-400-9.
3. Zhu, Xiaoping, Kuljaca, Ognjen (2005), "A Short Preview of Free Statistical
Software Packages for Teaching Statistics to Industrial Technology
Majors", Journal of Industrial Technology, November,Vol. 21No.2.
18.17 TERMINAL QUESTIONS
Q1.Discuss characteristics of R in brief
Q2.Compare advantages and disadvantages of R and SPSS.
Q3.Explain the graphical user interface of SPSS.
Q4.Why is SPSS most accepted software program?
Q5.Explain the MS EXCEL screen.
Q6.Give a brief note of STATA
Q7.Mention the prominent areas where Eviews is practically in use.
Q8. Explain the term ‘Objects’ in EViews.
Q9.Which capabilities make Eviews superior to other software programs

Block IV
Report Writing and Presentation

MS 110 Research Methodology Uttarakhand Open University
Unit 19 Intricacies of Report Writing-I Page 362 of 434
UNIT 19 INTRICACIES OF REPORT WRITING –I
19.1 Introduction
19.2 Objectives
19.3 Features of Research Report
19.4 Characteristics of Research Report
19.5 Functions of Research Report
19.6 Types of Reports
19.7 Principles of Report Writing
19.8 Significance of Report Writing
19.9 Stages in Report Writing
19.10 Technicalities of Report Writing
19.11 Interpretation of Data and Report Writing
19.12 Summary
19.13 Glossary
19.14 Answers to Check Your Progress
19.15 References
19.16 Suggested Readings
19.17 Terminal Questions
19.1 INTRODUCTION The intention of a research is to draw inferences and come out with solutions. Therefore the
product and findings of the research should be well documented in the form of a report for
practical application of results and future use. Reporting of research findings is the oral or
written presentation of evidence and the findings in such a way that it is readily and easily
understood and assessed by the reader and facilitates him to verify the reliability and validity
of the conclusions. It is “a written document or oral presentation that communicates the
purpose, scope, objective(s), hypotheses, methodology, findings, limitations and finally,
recommendations of a research task to others”. Therefore, a report is a statement of the
results of an investigation on which definite information is required. A report is a clearly
structured document in which the researcher identifies and examines issues, events, or
findings of a research.
Report writing is the end product of research activity. It is highly skilled work. Writing a
research report is a technical activity that demands all the skills and patience of the
MS 110 Research Methodology Uttarakhand Open University
Unit 19 Intricacies of Report Writing-I Page 363 of 434
researcher. It requires continuous thought process, effort, patience and penetration and an
overall approach to the problem, data and analysis. Also needed is firm control over language
and great objectivity. A vast amount of planning and preparation is necessary for organising
and writing the report. Perfection in a research report is achieved by continuous thought and
creative and intelligent writing. Only hard and patient work on the facts, careful and critical
assessment and intelligent planning in organising the report can facilitate effective
communication.
19.2 OBJECTIVES After reading this lesson you must be able to:
Comprehend the meaning of research report and its purpose
Explicate the characteristics of research report
Comprehend the significance of a research report
Classify various types of reports
Understand the stages of report writing
Understand contents of a research project report
Understand the technicalities of research report
Plan and organize an academic report
19.3 FEATURES OF RESEARCH REPORT The three mandatory features that characterize report writing are: a predefined structure,
independent sections, and reaching unbiased conclusions.
Predefined structure: These are broadly the headings which indicate sections within a report,
such as an introduction, literature review, discussion, and conclusion.
Independent sections: Each section in a report is typically written as an autonomous piece,
so the reader can selectively identify the report sections they are interested in, rather than
reading the whole report through in one go from start to finish.
Unbiased conclusions: A third unavoidable element of report writing is that it is an unbiased
and objective form of writing.
19.4 CHARACTERISTICS OF RESEARCH REPORT Characteristics feature is a vital element of the report. There is no rigid rule for preparing a
research report. The research report will differ based on the need of the specific managers
using the report. The report also depends on the convictions of the researcher.
Example: A report planned for the use of a government institution like RBI, will be different
from the one prepared for a private organization.
MS 110 Research Methodology Uttarakhand Open University
Unit 19 Intricacies of Report Writing-I Page 364 of 434
There are definite features which the report should incorporate and include, if it is to be
effectively communicated. These characteristics can be classified as:
i. Substantive characteristics
ii. Semantic characteristics
19.4.1 SUBSTANTIVE CHARACTERISTICS
Substantive characteristics are:
Accuracy
Currency
Sufficiency
Availability
Relevancy
Higher percentage of the above characteristics enhances the report’s practical value in
decision making.
Accuracy: Accuracy refers to the level to which information reproduces actuality. Research
report have got to be accurately (without any manipulation) present research procedure as
well as research results. Even if the research results are against the expected results of the
management, it is the researcher’s ethical/professional responsibility to present the findings
accurately and objectively.
Currency: Currency refers to the period between completion of the research project and
staging of the research report to management. If the research report is presented too late, the
results become obsolete and are no longer valid due to environmental changes, and then the
report loses its applicability for decision making. Currency is one of the reasons for orally or
informally communicating preliminary research results to the management to ensure timely
decision making.
Sufficiency: The research report must have sufficient details, so that important and valid
decisions can be made. Sometimes the sample size may be insufficient; sample
representativeness may act as a constraint for sufficient details not being available. For
example data required by the management, say segment wise market, whereas overall market
data is available. A research report must document methodology and techniques used so that
an assessment can be made regarding validity, reliability and generalizability and
standardisation. Therefore, sufficiency refers to whether enough information is present in the
research report to enable the manager to take valid decision. A researcher should include in a
report only that information, which is necessary to convey complete perspective of the
research project.
Availability: The fourth important characteristic of research report is that, it is available to the
appropriate decision maker when they need it. Availability refers to the communication
process between researcher and the decision maker. The word 'appropriate decision maker'
means "who should or who should not have access to the report". This decision is made by
the management, and it is the duty of the researcher to implement this decision. Most reports

MS 110 Research Methodology Uttarakhand Open University
Unit 19 Intricacies of Report Writing-I Page 365 of 434
carry confidential information. Therefore, it is necessary to restrict the report availability, to
individuals as well as outside of an organization to prevent the competitor from having access
to it.
Relevancy: The research report should be confined to the issue researched. Sometimes the
researcher might include some information, which s/he thinks is interesting, but may not have
any relevance. This type of information should not be included in the report. For example a
researcher may be preparing a report on the audience perception of RJs (Radio Jockeys). This
may be done with a view to recruit them based on the perception. In this context, a lengthy
commentary on relative audience appeal of each radio station is included. This type of data
may be readily available from some research agency, who is selling commercial data.
Therefore, incorporating this type of information may not be necessary.
19.4.2 SEMANTIC CHARACTERISTICS
Semantic characteristics equally important as substantive characteristics in report. The report
should be grammatically correct. Spelling and typing errors must be avoided by applying
spell check. This will ensure that there is no lack of clarity or misunderstanding. Help from a
proof reader must be taken to identify errors and eliminate them. Caution must be taken for
following semantic characteristics:
i. Expressions in the form of superlatives, similes should be avoided.
ii. The report should be concise.
iii. Jargons should be avoided.
iv. Words with dual or multiple meaning should be avoided.
v. Simple and understandable language must be used.
vi. The report should be impersonal therefore one must avoid using 'I' 'we'.
vii. Sometimes, the current research uses the data of research conducted in the past. Hence, it
is better to use past tense than present tense.
The following are the hindrances for clarity of any research report.
Ambiguity
Jargon
Incorrect spelling
Excessive prediction
Improper punctuations
Unfamiliar words
Some of the common errors that can cause inaccuracy in report writing are given below:
Addition/subtraction error: Suppose a survey was conducted to ascertain the income of
various strata of population in a city. And it is found that 15% belong to super rich, 18%
belong to rich class, and 61% belong to middle class. Due to oversight the total is recorded as
(15+61+18) which is not equal to hundred percent. This error can be corrected easily by the
MS 110 Research Methodology Uttarakhand Open University
Unit 19 Intricacies of Report Writing-I Page 366 of 434
researcher. This type of error leads to confusion because the reader or decision maker does
not know which categories are left out.
Confusion between percentage and percentage points: Assume that the report indicates that
raw material cost of a product as a percentage of total cost increased from 10 percentage
points in 2004 to 12 percentage points in 2009. Therefore, the raw material cost has increased
by only 2 percentage points in 5 years. The real increase has to be reported as 2 percentage
points or 25 percent not 2 percent.
Wrong conclusion: Mr. Tiwari’s annual commission has increased from 20,000 to 40,000 in
5 years. It implies that since income has doubled, the purchasing power also has doubled.
Practically this does not hold true because due to inflation in 5 years, purchasing power might
come down deterioration of money value of rupee.
Check Your Progress-A
Fill in the blanks:
1. The research report are differentiated on the basis of the …………of the particular
managers using the report.
2. Accuracy refers to the extent to which information reflects……………..
3. Availability refers to the communication process between researcher and
the………………..
4. …………….refers to the duration between completion of the research project and
presentation of the research report to management
19.5 FUNCTIONS OF RESEARCH REPORT A perfectly written research report performs varied functions:
a) It serves as a means for presenting the problems/situations studied, methods and techniques
used for collecting and analyzing data, the findings, conclusions, suggestions and
implications in an organized and systematic manner.
b) It serves as a reference for future scope/studies in developing research proposals in the
same or related area.
c) A report serves as a indicator for judging the quality of the completed research work.
d) It is a means for evaluating the researcher’s potential and competence to do research.

MS 110 Research Methodology Uttarakhand Open University
Unit 19 Intricacies of Report Writing-I Page 367 of 434
e) It provides realistic data for formulating policies and strategies relating to the research
subject studied.
f) It provides organised and methodical knowledge on problems and issues analysed and
studied.
g) It serves as historical record of the project.
h) It serves as a guide to management decisions.
19.6 TYPES OF REPORTS The results of analysis of research can be expressed in a number of ways. The form and
structure of the research report depends upon the purpose for which it has been designed.
There are broadly two types of reports (1) Oral report (2) Written report.
19.6.1 ORAL REPORT
When the researchers’ are asked to make an oral presentation, an oral report is required.
Making an oral presentation is comparatively difficult as compared to the written report. This
is because in an oral report the reporter has to interact directly one to one with the audience.
Any hesitation during an oral presentation can leave a poor and negative impression on the
listeners. In an oral presentation communication skills play a big role. A lot of planning and
preparation is required to decide 'What to say', 'How to say', 'How much to say'. Also, the
presenter has to be prepared to face a series of questions from the audience. The broad
characteristics of an oral presentation are as follows:
Nature of an Oral Presentation
Opening: A brief statement is needed to tell on what the discussion will follow. The opening
statements should explain the nature of the study in brief. How it came about and how the
problem was addressed.
Finding/Conclusion: Each conclusion may be supported by findings.
Recommendation: Each recommendation must have the support of conclusion. At the end of
the presentation, question-answer session is followed from the audience.
Method of presentation: Visuals like graphs, maps can be used. The use of tabular form for
statistical information would help the audience to understand the report.
Points to remember in oral presentation:
Language used must be simple and understandable.
Time Management should be adhered.
Use of charts, graph, etc., will enhance understanding by the audience.
PowerPoint presentation may be used and the slides may be printed and circulated to the
audience so that their ability to comprehend increases.
The presenter should know his/her target audience well in advance.

MS 110 Research Methodology Uttarakhand Open University
Unit 19 Intricacies of Report Writing-I Page 368 of 434
The presenter should know the purpose of report such as “Is it for making a decision”, “Is
it for the sake of information" or “Is it for academic purpose”.
19.6.2 WRITTEN REPORT
Following are the various Types of Written Reports:
Reports can be classified based on the length such as:
Brief Reports
These kinds of reports are unstructured and are generally short. The information provided is
of a limited scope and is prepared either for immediate usage or as a preface to the formal
structured report that would subsequently follow. These reports could be designed in several
ways. Working papers or basic reports are written for the purpose of collating the process
carried out in terms of scope and framework of the study, the methodology followed and
instrument designed. The results and findings are also mentioned here. The study background
might be missing, as the focus is more on the present study. These reports are significant
because they serve as a reference point while preparing the final report.
Survey reports focus to communicate findings in easy-to-comprehend format that includes
figures and tables. The reader can then study the patterns in findings to arrive at appropriate
conclusions, beneficial for resolving the business dilemma. The advantage of these reports is
that they are simple and easy to understand and present the findings in a clear and
spontaneous usable format.
Detailed Reports
These are more formal and sophistic in their structure and are essentially academic, technical
or business reports. Sometimes, the researcher may prepare both kinds-for an academic as
well as for a business purpose. The language, presentation and format of the two kinds of
reports would be entirely different as they would need to be prepared for the understanding of
the reader’s capabilities and intentions.
Reports can be classified based on technicality such as:
Technical Report
A technical report is written for fellow researchers and therefore should be organised on a
different pattern altogether. In such a report, the researcher is expected to give a detailed
account of the technical aspects, both in the sampling methods and the subject matter. The
readers are more concerned about the methods employed. In fact, the value of the findings
depends on the techniques adopted. The conceptual and analytical framework sample design
should be sufficiently explained. These are major documents and would include all elements
of the basic research report, as well as the interpretations and conclusions, as related to the
obtained results. This would have a complete background of the problem and any additional
past data/records that are essential for understanding and interpreting the study output. All the
sources of data, sampling plan, data collection instruments, data analysis outputs would be
formally and sequentially organised.
MS 110 Research Methodology Uttarakhand Open University
Unit 19 Intricacies of Report Writing-I Page 369 of 434
Popular Report
This stresses on simplicity and attractiveness. Its writing is clear, with very less statistical
details and much use of visual aids like charts and diagrams. It has an attractive layout, large
print size, many sub-headings. It may even have some visuals like cartoons also. It only
emphasises on the practical aspects and policy implications. The following is the general
outline of a popular report:
Major findings and conclusions
Follow-up action
Objectives of the study
Methodology
Results
Appendices
A popular report emphasises on policy implications and simplicity from the operational point
of view, avoiding technical details and technical jargons.
Reports can be classified based on the Purpose such as:
General Reports
General reports are often related to popular policy issues and social issues like proportion of
girl child to male child. These reports are generally simple, less technical and therefore good
use of tables and charts is made. Mostly they follow the journalistic style. Example for this
type of report is the “Best B-Schools Survey in Business Magazines”. The outline of these
reports is as follows:
Major Findings and their Practical Implications
Recommendations for Action
Objectives of the Study
Methods and Sources employed for data collection
Findings and Results
Specific Reports
This report is usually requested by people who need the information for a specific purpose
and their request may be written in terms of reference or the brief. It is important to look at
the instruction for what it is wanted. Specific report differs from an essay in that it is designed
to provide information which will be acted on, rather than to be read by people interested in
the ideas for their own sake. Due to this nature specific report has a different structure and
layout.

MS 110 Research Methodology Uttarakhand Open University
Unit 19 Intricacies of Report Writing-I Page 370 of 434
Reports can be classified based on the Nature such as:
Formal Reports
Formal reports are carefully drafted and structured. They emphasise on neutrality and
organisation, contain much elaboration and detail, and are written in a way that tends to do
away with elements as personal pronouns.
Example: The report drafted by the finance manager to be submitted to the Vice- President
(Finance) on quarterly profit and loss statement, report prepared by the marketing manager to
be submitted to the Vice- President (Marketing) on test marketing.
Informal report
Informal reports are by and large short messages with simple and uncomplicated and casual
use of language. The internal memorandum, the report prepared by the supervisor by way of
filling the shift log book, to be used by his/her colleagues and partners, are examples of
informal report.
19.6.3 DIFFERENCE BETWEEN ORAL AND WRITTEN REPORT
Oral report Written report
No rigid, fixed and standard format
prescribed.
Standard format can be adopted and
implemented.
It is hard to remember all that is said is.
This is because the presenter cannot be
interrupted frequently for clarification.
This can be read a number of times and
explanation can be demanded whenever the
reader chooses.
Tone, voice modulation, unambiguousness,
comprehensibility and several other
communication factors play an important
Free from presentation hurdles and problems.
MS 110 Research Methodology Uttarakhand Open University
Unit 19 Intricacies of Report Writing-I Page 371 of 434
role.
It is hard to correct mistakes during
presentation.
It is possible to indicate mistakes, if any, and
corrected.
The audience has no control over the speed
or other things of presentation.
Not applicable.
The audience does not have the choice of
picking and choosing from the presentation.
The reader can pick and choose what he thinks
is relevant to him. For instance, the need for
information is different for technical and
nontechnical persons.
19.7 PRINCIPLES OF REPORT WRITING Following principles of report writing have been developed. These are of considerable help to
check and evaluate own report.
Consistency: There should be consistency and uniformity: (i) in the objectives of the
research stated in the introduction, results acquired and inferences/conclusions drawn in the
last chapter; (ii) in the location typing and format of titles for tables and figures; (iii) in the
referencing format in use in the text; (iv) in the structure of each reference under books,
reports and journals in bibliography; and (v) in the indentation used in each chapter.
Connectivity: The text of the report should not begin suddenly and ended abruptly. The
changeover from section to section and chapter to chapter should be logical. Connecting
sentences relationally have to be developed. This is harmonizing to the principle of
indentation and helps to keep up continuity in the report.
Indentation: The report should be aligned, indented or cut into sensible chapters and sections
depending upon the structure and content of the various aspects of presentation. This
indentation can be attempted at the outline stage to facilitate clear organization of the material
into sensible and meaningful groups. This will assist in writing the report in a prescribed way.
Continuity: The flow of ideas, facts and thoughts in each portion and section or paragraph
should be cautiously maintained so that it becomes one continuous rational bit of
presentation, logically and suitably linked to the next.
Highlighting: It is indispensable for the researcher to emphasise, reinforce and highlight the
major portions or points that are significant in his/her work. The minor or less significant
ones should be toned down. This should be followed while introducing the problem, or
discussing its utility, while observations are made on literature, while presenting results and
asserting contributions. This gives a proper point of view to his/her work. The most important
objective should be dwelt upon in enormous detail, likewise the most important result.
MS 110 Research Methodology Uttarakhand Open University
Unit 19 Intricacies of Report Writing-I Page 372 of 434
Openness: Every research has constraints and errors. An inherent appreciation of this is a
frank and open approach to putting down the mistakes and limitations in data, in method and
even in the tools used. Paucity of sample size and tentativeness or weakness of results should
also be mentioned.
Clarity: In a report, the researcher is trying to converse, and not impress and influence, or
confuse the reader. Simple language, concise and direct statements should be used.
Ambiguous and confusing words, phrases, and sentences should be avoided. The most
significant portions of the thesis, like statement of hypothesis, validation and assertions of the
result, should be monitored for clarity.
Asserting: When assertions are made, specifically when they are strong, the researcher
should pronounce the support of past research for such assertions or of the facts attained from
analysis made in the research work. Assertions without necessary support are highly
damaging.
Ordering: While mentioning objectives, variables and results, it is required that different
objectives, variables, and results are ordered and sequenced in the same way (even if they are
chronologically different). This makes the presentation and communication between
researcher and reader more orderly.
Compatibility (Boundedness): In the discussion part of results or presenting conclusion, it is
vital that the results are restricted to the data. In other words, conclusions and inference must
be attuned and in line with the data and techniques of analysis, and must not contravene them.
The results are acquired through the tools and techniques of statistics, or otherwise. However,
they are not bounded by techniques.
Jargon: Every discipline has its own particular and unique words, modes of expression, and
terminology/terms. The researcher would do well to use them, that is, the jargon of the
discipline, to let the reader/client know of his knowledge-area in the subject matter.
Elaboration/brevity: One of the most complicated things while writing a report is to decide
where and at what point in the report the researcher has to condense a considerable amount of
research material, and where there is a scope to elaborate. The researcher should be able to
discriminate in this regard. Thumb rule is that, “detailed treatment of features close to the
report and concise/brief outlining of the distant ones and to the point treatment of what is
already known, and elaboration of what is new”.
Self-sufficiency: Whenever visual aids/tools like tables, graphs, figures, and illustrations are
presented in the manuscript, they must be made as simple, self explanatory and easy to
understand as possible.
Enrichment: Usually the researcher collects wider and irrelevant information than is
necessary to address the research questions. Once the main objective of the report is decided,
the researcher should explore the opportunity of enriching his/her work by presenting by-
products and related results from any additional data or information not directly applicable to
the objective, but which would boost knowledge and information. This is especially

MS 110 Research Methodology Uttarakhand Open University
Unit 19 Intricacies of Report Writing-I Page 373 of 434
important if the additional effort required is marginal. For example, some supplementary
hypothesis not examined critically in the report may be enunciated as future scope of the
study.
Synthesis-analysis-synthesis: Get a broad idea and outline of the report (synthesis).Organise
the parts (analysis) methodically and investigate into the details. Then get an overview by
standing away and looking at the manuscript totally (synthesis). Many flaws, insufficiencies
and incongruence’s will surface and will be identified in such an approach. In writing the
report, the end result is to utilize synthetic and analytic approaches.
19.8 SIGNIFICANCE OF REPORT WRITING Preparation and presentation of a research report are most significant parts of the research
process. Hypothesis, research design, analysis etc. of the study are of slight importance unless
documented and communicated effectively to the world in the form of a research report.
Moreover, if the report is confusing or poorly written, the time and effort invested on
gathering and analysing data would be wasted. It is hence, essential to recapitulate and
communicate the result to the management in the form of a presentable, understandable and
logical research report.
Research report is a major constituent of the research study. The research work remains
incomplete till the report has been written and presented. Even the most brilliant hypothesis,
perfectly designed, conducted, organised, research study, most striking generalizations made
and findings are of little worth unless they are effectively communicated to others. The
rationale of research is very well provided only when the findings are made known and
visible to others. This justifies the importance of writing research report. The presentation of
research results in the form of report is an indispensable division and section of the research
project. Writing of report is the final step in a research study and requires a logical set of
skills which are different from those needed for in respect of the previous stages of research.
This task should be accomplished by the researcher with extreme care; s/he may look for the
assistance and guidance of specialists for the same.
Check Your Progress-B
Fill in the blanks:
1. In an oral presentation, ……………….plays a significant role.
2. ………….report presents the results and outcome of the research in detail.
3. The …………….statement should give explanation of the nature of the project, how it
came about and what was attempted.
MS 110 Research Methodology Uttarakhand Open University
Unit 19 Intricacies of Report Writing-I Page 374 of 434
State whether the following statements are true or false:
1. Research report is a way for communicating research know-how to others.
2. The aim of the research report is to communicate to interested persons the methodology
and the results of the study.
3. Research report is a narrative and authoritative document.
19.9 STAGES IN REPORT WRITING Final step in a research study is the ‘report writing’. Report writing is not easy and simple as
it requires a set of skills. Writing an accurate and flawless report is painstaking and a slow
process. A researcher involves lot of efforts, patience, concentration, diligence for report
writing. In report writing the researcher tries to effectively communicate with the readers and
convey the results efficiently. And communication has to be done not only with a selected
group of readers and users but can also be generalised.
Report writing involves following stages:
19.9.1 JUDICIOUS ANALYSIS OF THE SUBJECT MATTER
The first step of report writing is to develop a subject coherently. The logical development is
made on the basis of relational associations between one concept/theory/model and another
by means of statistical testing. Logical treatment often extends the material from the simple
structure to the most complex structures. Chronological development is sequencing
arrangement of data or information according to time or occurrence.
19.9.2 PREPARATION OF THE FINAL OUTLINE
After developing the topic, the final outline must be put in order to develop a conceptual
framework. Outlines are the framework, design and guidelines upon which written works are
planned and structured. They are a help to the logical and sequential arrangement of the
material and a reminder of the points to be given much needed importance and highlighted in
the report.
19.9.3 PREPARATION OF THE ROUGH AND TEMPORARY DRAFT
(PRELIMINARY DRAFT)
Preparation of the rough draft is of great importance as the researcher is now ready to initiate
writing what s/he has done till now in his research work. She/He will write down the
complete procedure adopted by him in
assembling the data,
collecting the material for his study along with various limitations,
restrictions and difficulties faced by him,
the technique and tools of analysis adopted by him,
the broad findings ,

MS 110 Research Methodology Uttarakhand Open University
Unit 19 Intricacies of Report Writing-I Page 375 of 434
discussions,
generalisations and
the various recommendations he wants to offer regarding the problem studied.
The rough draft is reached at the end of several versions, each and every improvement of the
preceding one. The researcher should try to start writing the first rough version of the draft
immediately after finishing the outline while the ideas/thoughts are still fresh in his mind.
The first version should be written as quickly as possible keeping focal point on ‘what the
researcher aims to say’ rather than ‘how to say it’. She/He should keep writing down the
thoughts and views as they generate and flow into his/her mind, following the research
outline. Going back over what he has written should be avoided until s/he has completed
writing.
19.9.4 REWRITING AND IMPROVISING OF THE ROUGH DRAFT
This is the most difficult and sensitive section of all formal writing which requires more and
more time than the writing of the preliminary/rough draft. A cautious revision of the rough
draft is needed for a good piece of writing. During this course of revision the researcher
should check the report for weaknesses in logical development or rational presentation. The
researcher should also see whether the matter presented has uniformity and cohesion; does
the report demonstrate a definite pattern or does it resemble an old study. The researcher
should give consideration to the fact that in his rough draft he has maintained consistency or
not. He/she should check the technicalities of writing-grammar, spelling and usage of
language. Then re-examine this version-but only for its technical content. Sometimes writing
the first version exhibits some unexpected problems and mistakes that require an amendment
in the outline. In the second version of the rough draft, writing style is given significant
importance. The researcher should always keep in mind the reader. She/He should never
leave behind that the purpose in writing the report is proper and accurate communication of
the information needed to support his/her conclusions. To ensure that the readers understand
his conclusions, s/he must transmit his/her information clearly, logically, concisely, honestly,
and tactfully. The last and final stage of report preparation, rough-draft revision, is just as
important as the previous stages. Revising a draft is as good as painting a house: the
appearance is improved without manipulating the structure. But a report's “appearance"
(readability) may determine whether it should be read or not. At least one colleague must
read the report just before the final revision. Sentences that seem crystal clear to the reader
may prove quite confusing to other people; a connection that had seemed self evident may
strike others as a ‘non-sequitur’. A friendly critic, by pointing out passages that seem unclear
or illogical, and perhaps putting forward ways of remedying the difficulties, can be an
invaluable support in achieving the goal of adequate communication.
19.9.5 PREPARATION OF THE FINAL REFERENCE/BIBLIOGRAPHY
The next stage is to prepare the final references or bibliography which is the list of sources
either referred to or taken help while writing and drafting the report. There are no absolute
rules in referencing but bibliography should follow a logical preparation in alphabetical order
MS 110 Research Methodology Uttarakhand Open University
Unit 19 Intricacies of Report Writing-I Page 376 of 434
and may be divided into two sections; the first section may contain the names of books and
pamphlets, and the second section may contain the names of magazine and newspaper
articles.
19.9.6 WRITING THE FINAL DRAFT
The last step in report writing is writing the final draft which is done in a crisp and objective
style using simple language. Vague expressions such as "I suppose", "there may be", and
“like” are avoided. Abstract terminology and technical jargon are also avoided to facilitate
easy understanding by any reader. Illustrations and examples must be incorporated as self
explanatory tool in the final draft. They most effectively communicate the research findings
to others. A research report should not be sluggish. It should encourage interest in readers and
further maintain interest and must show originality. Every report should attempt to solve
some rational problem and must contribute to the solution of a problem. It must improve the
acquaintance of both the researcher and the reader.
19.10 TECHNICALITIES OF REPORT WRITING Definite and set guidelines should be followed in the actual preparation of the research report.
Once techniques are finally decided, they should be meticulously adhered to. Following
technicalities of writing a report are of utter concern:
Size and physical design: The script should be written on plain, unruled paper 8 ½˝ x 11˝ in
size. If it is handwritten then make use of black or blue-black ink. A margin of at least 1½˝
should be allowed at the left hand and at least ½˝ at the right hand of the paper. There should
also be 1˝margins left on top and bottom. The paper should be neat, not crumbled and
readable. If the script is to be typed, then all typing should be on one side of the page only
with double-spaced. The type of font and font size should be consistent throughout the report.
Procedure: Various pre prescribed steps in writing the report should be strictly adhered to
and followed.
Layout: Keeping in view the objective and nature of the problem, the layout of the report
should be thought of and decided and accordingly adopted.
Treatment of quotations: Quotations are inseparable part of the text and should be placed in
quotation marks and double spaced. But if the quotation is of a considerable length (more
than four or five typed written lines) then it should be single-spaced and indented at least half
an inch to the right of the normal text margin.
Footnotes: Footnotes are placed at the bottom of the page. They should be numbered one
after the other in a row and should always be typed in single space though they are divided
from one another by double space. The footnote reference to any given work should be
complete and give all the essential facts about the edition used.
Punctuations and Abbreviations: Certain abbreviations are commonly used in
bibliographies and footnotes to avoid tedious repetition.

MS 110 Research Methodology Uttarakhand Open University
Unit 19 Intricacies of Report Writing-I Page 377 of 434
Use of statistics, graphs and charts: Statistics are usually presented in the form of tables,
charts, bars, histograms, line-graphs and pictographs in a clear, neat, methodical and
attractive manner.
The final draft: The final draft should be prepared after careful revising and rewriting of the
rough draft.
Bibliography: Bibliography should be prepared and appended (attached) to the research
report.
Preparation of the index: An index should be given at the end of the report to act as a good
ready to use list.
The steps and mechanics of report writing are guidelines to produce a report which can be
easily understood by the readers. The above mentioned procedure and technicalities should
be adhered to in order to evade communication gap between the reader and the writer.
Effective communication is possible only when the report is prepared with great caution.
Skill combined with caution will facilitate a researcher in preparing a report with minimum
flaws.
19.11 INTERPRETATION OF DATA AND REPORT WRITING The data which has been collected, classified and analyzed is to be interpreted for further
report writing. This task has to be done very cautiously; otherwise a wrong interpretation may
diminish the research purpose completely. Interpretation may be for testing some hypothesis
which if proved (accept/reject), may lead to some generalizations.
19.11.1 MEANING OF INTERPRETATION
Interpretation means drawing conclusions or inferences from the collected facts or data after
an analytical and / or experimental study. Inferences may be of two types – inductive and
deductive.
Fig 19.2 Inferences
An inference is the process of forming judgment or opinion based on the other judgments or
on the facts of observation.
Induction: It is a process of reasoning or determining from particular cases to a whole group
of ideas, phenomenon or situations e.g. Exploration of standardization/generalization from
observed data is induction.
INFERENCES
Inductive Deductive
MS 110 Research Methodology Uttarakhand Open University
Unit 19 Intricacies of Report Writing-I Page 378 of 434
Deduction: It is a process of reasoning or determining from given premises to a necessary
conclusion. For example: all mathematical reasoning is deductive. It is the process of
applying general truths to practical instances.
19.11.2 IMPORTANCE OF INTERPRETATION
The use of research is only possible if the results are interpreted accurately. Following
reasons emerge out its importance –
(i) With the help of interpretation the researcher is able to link the results of research to
other studies in the related field.
(ii) Interpretation assists to establish new concepts which will guide future research.
(iii) Interpretation makes researcher’s research significant.
(iv) The interpretation of the findings of exploratory research leads to creating of hypothesis
which results in scope for further research.
PRECAUTIONS TO BE TAKEN DURING INTERPRETATION
The data which is going to be interpreted must be appropriate, reliable and adequate. Suitable
statistical tools must be used to analyse the data.
The researcher must avoid errors in interpretation which may lead to false
standardizations/generalizations.
The relationship between analysis and interpretation must not be undermined as the correct
interpretation will depend upon a proper analysis of the data.
While interpreting the results the researcher must keep in mind the relation that binds the
hypothesis to the observations and finally to the interpretations.
Check Your Progress-C
Fill in the blanks:
1. . ………………means bringing out the meaning of data.
2. Successful interpretation depends on how accurately the data is……………...
3. In the ………………method, one starts study from observed data and then
generalisation is done.
19.12 SUMMARY Finally, we come to a wrapping up of our exercise of familiarising you with the art of
planning and organising a research report by telling various stages. A research report is a
formal statement of the research process and its results. The objective of a research report is
to converse to the readers the methodology and the results of the study in such a manner as to

MS 110 Research Methodology Uttarakhand Open University
Unit 19 Intricacies of Report Writing-I Page 379 of 434
facilitate them to understand the research process and to determine the validity of the
conclusions. The aim of the report is to convince the reader of what was done, why it was
done, and what was its outcome. Therefore, important aspects to be considered while writing
report are accuracy and clarity. There are various types of reports categorised on the basis of
various criteria like technical reports, specific reports, and general reports etc. Proper
planning is required in writing a report. Every report has well defined and illustrated contents.
Keep the purpose of each chapter, section and paragraph in mind. Do no struggle for words
and phrases. Give appropriate and well suited headings to chapters, sections and paragraphs.
Ensure the correctness of facts and citations. The most important aspect to be kept in mind
while developing a research report is the communication with the audience. Report should be
able to draw the interest of the readers. Therefore, report should be reader centric.
19.13 GLOSSARY
Accuracy: Accuracy refers to the degree to which information reflects actuality.
Availability: Research report must be available to the appropriate decision maker when they
need it.
Brief Reports: These kinds of reports are unstructured and are generally short. These are
produced when the problem is very well defined and if the scope is limited.
Currency: Currency refers to the time span between completion of the research project and
presentation of the research report to management.
Detailed Reports: These reports are more formal and sophistic in their structure and are
essentially academic, technical or business reports.
Formal Reports: These reports are carefully drafted and structured. They emphasise on
objectivity.
Informal Report: Informal reports are usually short messages with simple and casual use of
language.
Relevancy: Confined information to the issue in research report.
Research Reporting: It is culmination of research investigation
Research Report: It is a formal statement of the research process and its results. It narrates
the problem studied, methods used for studying it, and the findings and conclusions of the
study.
Specific Reports: This report is usually requested by people who need the information for a
specific purpose and their request may be written in terms of reference or the brief.
Sufficiency: The research report must have sufficient details, so that important and valid
decisions can be made.

MS 110 Research Methodology Uttarakhand Open University
Unit 19 Intricacies of Report Writing-I Page 380 of 434
Technical Report: It is a report in which the researcher is expected to give a detailed account
of the technical aspects, both in the sampling methods and the subject matter.
19.14 ANSWERS TO CHECK YOUR PROGRESS
Check Your Progress-A
1. need
2. reality
3. decision maker
4. Currency
Check Your Progress-B
Fill in the Blanks
1. communication
2. Long
3. Opening
True or False
1.True
2.True
3.True
Check Your Progress-C
1. Interpretation
2. analysed
3. induction
19.15 REFERENCES
Chawla D., Sondhi N. (2011), Research Methodology: Concepts and Cases, Vikas
Publishing House Pvt. Ltd.,Noida
Krishnaswamy K.N., Sinakumar A.I., Mathirayan M. (2006), Management
Research Methodology Integration of Principles, Methods and Techniques,
Dorling Kindersley (India) Pvt. Ltd.,Delhi

MS 110 Research Methodology Uttarakhand Open University
Unit 19 Intricacies of Report Writing-I Page 381 of 434
Malhotra N., Dash S., (2011), Marketing Research: An Applied Orientation,
Dorling Kindersley (India) Pvt. Ltd.,Noida
Rai U., Rai S.M. (2009), Business Communication, Himalaya Publishing House,
Mumbai
Saunders M., Lewis P., Thornhill A. (2005), Research Methods for Business
Students, Pearson Education, Delhi
19.16 SUGGESTED READINGS
1. Day, R., (1995), How to write and Scientific Paper (4th
edn), Cambridge
University Press.
2. Griffith, J.W., (1978), Library Theft : A Problem That Won’t Go Away, American
Libraries 9 (April) : pp – 224-227
3. Smith, C.B., (1991), A Guide to Business Research, Chicago, II, Nelson-Hall.
Chapters 7-10 provide an excellent introduction to writing for business and
management researchers.
4. Abrams, M.A., (1951), Social Surveys and Social Action, London: Heinemann.
5. Chase, S.,(1958), The Proper Study of Mankind: An Inquiry into the Science of
Human Relations, New York, Harper and Row Publishers.
6. S. N. Murthy and U. Bhojanna, Business Research Methods, Excel Books.
19.17 TERMINAL QUESTIONS
Q 1. Define Research Report .Explain various types of research report in detail.
Q 2. What are the characteristics of report?
Q 3. Explain the criterion for an oral report?
Q 4. What are the various criteria and basis used for classification of written report?
Q 5. Describe the stages of report preparation
Q 6. Discuss the principles of report writing.
Q 7. What technicalities should be kept in mind while report writing?
Q 8. Why is Report noteworthy in every discipline?
Q 9. Elaborate the process of research report formulation.
Q 10.What do you mean by interpretation of data?
Q 11. What are the main type of inferences?

MS 110 Research Methodology Uttarakhand Open University
Unit 20 Intricacies of Report Writing-II Page 382 of 434
UNIT 20 INTRICACIES OF REPORT WRITING –II
20.1 Introduction
20.2 Objectives
20.3 Elements of a Report
20.4 Referencing In the Text
20.5 Footnotes
20.6 Style of Report Writing
20.7 Layout of the Report
20.8 Guidelines for Effective Documentation
20.9 Organization of a Research Report
20.10 Acronyms to Ease Out Report Writing
20.11 Precautions in Preparing Report
20.12 Ethical Issues in Research Report
20.13 Summary
20.14 Glossary
20.15 Answers to Check Your Progress
20.16 References
20.17Suggested Readings
20.18 Terminal Questions
20.19 Case
20.1 INTRODUCTION A research report is one of the most important elements of the research study. Even the
brightest of the research studies are of nano value unless they are effectively presented and
communicated to others. All this elucidates the significance of writing research report. It
should be noted that reports are considered to be legal documents in the workplace and, thus,
they need to be precise, accurate and correctly evaluated and interpreted. The basic aim of
‘Reports’ is to form the basis of crucial decision making. Inaccurate, incomplete and poorly
written reports fail to achieve their purpose and reflect on the decision, which will ultimately
be made. Excessively long, jargonistic and/ or structureless reports also fail the purpose. The
essential purpose of the report is:
To put across the objectives of the work done.
MS 110 Research Methodology Uttarakhand Open University
Unit 20 Intricacies of Report Writing-II Page 383 of 434
To communicate findings, analyses of findings, interpretations, conclusions and
suggestions.
To emphasise the research process
It gives the readers certain inputs about the research and its background
Improves interpretation and evaluation skills
Written reports give scope for future references
20.2 OBJECTIVES After going through this unit, you should be able to:
Map and organize an academic report.
Analyze the elements/components of a good report.
Understand the process of report writing.
Be able to present references, citations etc used in the research.
Understand the essential features of report formatting.
Describe the techniques and precaution of interpretation.
Discuss the blueprint/layout of report.
Discuss the precautions in report writing.
20.3 ELEMENTS OF A REPORT Once the type of report needed is finalised, the next step is report preparation. The format of
a research report is mentioned as below:
(A) The Preliminary Pages
(B) The Main Text
(C) The End Matter
20.3.1 THE PRELIMINARY PAGES
The following subjects should be highlighted in the preliminary or first part of the research
report:
Title of the report.
Acknowledgement
Preface
Foreword
Table of Contents
List of tables and illustrations
The Abstract

MS 110 Research Methodology Uttarakhand Open University
Unit 20 Intricacies of Report Writing-II Page 384 of 434
The Title Page: Title Page should point towards the topic on which the report is prepared. It
should embrace the name of the person or agency who has prepared the report. If the report is
for academic purpose then other than the title of the report, the author’s name, guide’s name,
course, year or duration of course and affiliations (like name of university or college) should
be mentioned.
Acknowledgement: Everybody those who helped in running the project should be
acknowledged in this segment. For example the help may come from librarians, technicians
or computer centre staff persons, parents, partner, etc.
Preface: Preface is a one or two pages write up by the author of the report expressing
circumstances under which the present work is undertaken, importance of the present work,
major dimensions and variables examined and intended audience or reader for the given
work. The author gives his/her signature and address at the bottom of the page along with
date and year of the work.
Foreword: Foreword is generally one page write up or a citation about the work by any
eminent and popular personality or a renowned specialist in the given field of study. The
write up includes a brief background on the contemporary issues and suitability of the present
subject and its timeliness, key highlights of the present work, brief background of the author
etc. The writer of the foreword generally gives the ‘Foreword’ on his letter head.
Table of Contents: This should include all the main sections of the report according to
sequence with the page numbers they begin on and may be ends on. The table of contents
should indicate the various sections of the report. It should also indicate the chapter headings
along with the page number. A format for Table of Contents is prescribed below in table
20.1:
Table 20.1: Table of Contents
Chapter no. Title of the chapter Page no.
Declaration
Certificates
Acknowledgement
Executive summary
1 Introduction to the project
2 Research design and methodology
3 Theoretical perspective of the study
4 Company and industry profile
5 Data analysis and interpretation
6 Summary of findings, suggestions and conclusions

MS 110 Research Methodology Uttarakhand Open University
Unit 20 Intricacies of Report Writing-II Page 385 of 434
Bibliography
Appendix
List of Tables and Illustrations: If there are charts, diagrams or tables mentioned in the
report, they should be listed separately under a title such as ‘List of Tables, List of Figures,
List of Charts, List of Graphs’ together with the page numbers on which they appear.
The Abstract: This is the most important part of the report because it will be the only part
that someone will read. It is a brief summary of the complete project report. This enables the
reader to decide whether they should read the complete report or not. For those who intend to
read the whole report, the abstract prepares them for what is to come in the entire report. An
abstract should contain few short paragraphs with the answers to the following questions:
• What are my research questions and what is their importance?
• How did I proceed about answering the research question(s)?
• What were the findings?
• What conclusions do I draw for my research question(s)?
20.3.2THE MAIN TEXT
The main text is comprised of following titles in the form of chapters:
Introduction
Literature review
Methodology
Analysis of data
Results
Interpretations and Discussion
Conclusions
Introduction: The introduction must explain clearly the research problems and research
objectives and decision problems. Proper information should be provided on the products and
services provided by the organisation which are covered under the investigation (Also called
Background or Context). In this section you have to elucidate the rationale for undertaking
the study reported on, including what you have chosen to do, the reasons for doing it and the
background to the study. It should be written in an explanatory style. State what the report is
about - what is the research question you are trying to attend to? If it is a specific report
written for a specific reader for instance a feasibility report on a construction project for a
client, then say who they are. Describe your opening point and the background to the topic,
for instance: what are the significant themes and issues; what is the contemporary need to
investigate it now? Explain how you are going to accomplish the brief introduction. Include a
brief outline of your method of enquiry. State the limits of your research and reasons for
them. ‘Introduction’ is presented as Chapter 1 in the report which is further divided into
subsections as under mentioned:

MS 110 Research Methodology Uttarakhand Open University
Unit 20 Intricacies of Report Writing-II Page 386 of 434
Chapter 1: Introduction
1.1.1. Introduction of the Study
1.1.2. Theoretical/Conceptual Framework
1.1.3. Industry/Company Profile
1.1.4. Problem Formulation
1.1.5. Objectives of the Study
Literature Review: Revealing of what research has already been done is a Literature Survey
or Literature Review. This is mentioned as chapter 2 in the report. This chapter mentions a
brief outline of previous researches or studies. It is a review of publications for e.g. books,
journals, authoritative websites, conference papers, working papers, articles in newspaper. It
is coverage work that has already been done on the topic of your report. It should only
include studies that have direct relevance to your research. A literature survey should be
written like an essay in a discursive style. Introduce your review by explaining how you went
about finding your materials, and any clear trends in research that have emerged. Group your
review in themes. Write about each theme as a separate section, giving a critical summary of
each composition and showing its relevance to your research. Conclude with how the review
has helped your research in finding research gaps which you’ll be filling through your
research.
Methodology: This section is mentioned as chapter 3 and it talks about the research
methodology adopted for the research. In this section one should state how the enquiry was
carried out. What form did the study take? How was the data collected? What were the
measurement tools or scales used? What was the sample design? What were the hypotheses?
All such and other information related to the methodology should be logically and concisely
presented. This section details the method and procedures and also discusses the reasons for
choosing your methods and procedures. It addresses to the following questions:
What is its basic design?
Rationale for methodology adopted
What are the methods adopted to collect data?
How is the study carried out?
Is it an experimental/descriptive/survey/cross sectional study?
If the study is an experimental one, what are the experimental manipulations?
Hypotheses
Description of study area
Description of methods and procedures for gathering data
What type of questionnaire/interview/observations is used (structured or unstructured)?
Who are the respondents?

MS 110 Research Methodology Uttarakhand Open University
Unit 20 Intricacies of Report Writing-II Page 387 of 434
Demographic descriptive of study population
Criteria of respondents’ selection?
Are the research instruments statistically reliable?
Do the research instruments have validity?
Description of types of data and sources
Description of methods and procedures of data analysis
Reasons for choosing the methods and procedures of data analysis
Therefore, the subsections of this section are as follows:
Chapter 3: Research Methodology
3.1.1 Scope of the Study
3.1.2 Research Title
3.1.3 Objectives of the Study
3.1.4 Research Design
3.1.5 Sampling Design
3.1.6 Tools for Data Analysis
3.1.7 Demographic Profile of the Respondents
Analysis of Data: Here, the researcher has to display the type of statistical analysis adopted
to analyse the data. The analysis can range from simple descriptive analysis to complex
multivariate analysis.
Results: This section gives details of the results and findings of the study. It provides
explanation of results and accept or reject hypotheses if you have any. The results can be
presented in a number of ways like; Tables; Graphs; Pie charts; Bar charts; and Diagrams. All
the results should be presented logically. They should be splitted and sequentially arranged
into readily identifiable sections. All the results of the report must be aligned with the
research problems mentioned earlier in the report, showing whether the results support or
reject the hypothesis.
Interpretations and Discussion: This is the longest segment and longest time is spent on
this section. This section centralises the other sections together, showing how your findings
respond to description given in your introduction and the literature survey. It should be
brought on paper in a discursive style. Discursive style means you need to discuss the results
and also tell why you got such results. To justify your results back up your explanations by
using evidence from previous research. The main purpose of interpretation is to reveal the
essence of the findings. A researcher should explain why the findings are so. He can make
reasonable prediction. On the basis of interpretation of an exploratory study, new
hypothesis/hypotheses can be formulated for experimental research. Details of interpretation
are discussed in chapter 19. During discussion, unconnected, isolated facts should not be
ignored, but should be explained properly. Interpretation and discussion leads to the

MS 110 Research Methodology Uttarakhand Open University
Unit 20 Intricacies of Report Writing-II Page 388 of 434
establishment of some explanatory notes and concepts arising out of the connection between
the underlying processes and principles, and the observed facts from a working model. A
researcher’s aim is to identify and disengage such principles and processes. Discussion may
also bring about a theoretical conception, which can be the basis of further researches and
new knowledge. Thus, continuity in research can be established and the quest for knowing
the unknown can be sustained. Thus this section addresses following issues
Give a logical justification about what your results mean.
Give evidence to illustrate and support your argument from previous researches.
Conclusion and Suggestions
This forms the last but most important element of the research report. Arguments or
evidences are not needed for this section. Conclusions, recommendations and suggestions
form the basis of any decisions taken. It highlights the following points:
It restates the research problem
Gives a brief statement of main findings and their significance.
Gives limitations of the research
Scope for future research
Chapter 6: Conclusion and Recommendations
6.1.1 Recommendations
6.1.2 Conclusion
6.1.3 Limitations of the Study
Check Your Progress-A
Fill in the blanks:
1. …………………is regarded as a major component of the research study
2.Writing of report is the ………..stage in a research study and requires a bunch of skills
somewhat different from those called for in respect of the former stages of research.
20.3.3THE END MATTER
References
Appendices
Endnotes
20.3.3.1References (Also called Reference List or Bibliography)

MS 110 Research Methodology Uttarakhand Open University
Unit 20 Intricacies of Report Writing-II Page 389 of 434
The reference material has to be mentioned and listed at the end of the research report. An
index has to be put in order in which alphabetical listing of names, places and topics along
with the page numbers in the book or report in which they are published are to be mentioned.
The format of references can be classified differently for journals, books, magazines,
newspapers, research studies, etc. References should be listed in alphabetical order of the
authors’ names. The prescribed formats are given below:
Journal articles: The articles which are referred from journals should be included in the
reference list as per the following format.
Author(s), Year of publication, Title of the article, Name of the journal, Volume of the
journal, Issue number of the volume, page numbers (pp, from – to) of the article.
For example:
Tiwari, S., (1991) “New Metastatic Dimensions for Work Life Balancing”, International
Journal of Management and Systems, Vol. 9, No. I, pp. 25-35.
If the number of authors is more than two then do not mention all, it is prescribed to use et al.
after the first author.
Tiwari, S. et al., (1993) “New Metastatic Dimensions for Work Life Balancing”,
International Journal of Management and Systems, Vol. 9, No. I, pp. 25-35.
Books: If some parts of the report are referred from a book, then following format is used
Author(s), Title of the book (in italics), Name of the publisher, Place of publication, Year of
publication For example:
Tiwari, S., Materials Management: An Integrated Approach, Prentice- Hall of India, New
Delhi, 1979.
Articles in a Book: The prescribed format of an article in a book is as given below:
Name of the author(s), Title of the article(in italics), Title of the book, Name of the Editor,
Name of the publisher, Pages, Year of publication
For example:
Tiwari, S., ‘Integrated Approach of Management towards Supply Chain Management’,
Supply Chain Management, Sahay, B.S. (Ed.), Macmillan India Limited, pp. 326-336, 1997
Government Publications
Ministry of Finance, Government of India, The Copyright Act, 14 of 1957, Delhi, The
Manager’ of Publications, 1962, p. 10.
Conference Articles: The prescribed format of an article in a conference proceeding is given
below:
Name of the author(s), Title of the article (in italics), Name of conference proceedings, Place
of the conference, Dates-month-year of the conference, Pages if applicable

MS 110 Research Methodology Uttarakhand Open University
Unit 20 Intricacies of Report Writing-II Page 390 of 434
In some conferences, if only abstracts of the articles are published then pages are not to be
mentioned.
1. Pandey, S.R. et al., ‘Measuring Bank performance’, Proceedings of the Twelfth Annual
Conference of the Paradigm Shift in the Market, POM-2009, Mumbai, March 30-April 2,
2009.
Articles in Newspapers:Name of the author,last name first,Title of the article,Name of
the periodical (in italics), the volume and number, the date of the issue, the pagination
Sharma, P., ‘Super development of India’, The Hindu, Vol. 128, No. 198,December 1, 2017,
p.10.
More than one item of author(s)
Tiwari, S. (1993) “New Metastatic Dimensions for Work Life Balancing”, International
Journal of Management and Systems, Vol. 9, No. I, pp. 25-35.
Materials Management: An Integrated Approach, Prentice- Hall of India, New Delhi , 1963.
Research Studies
Narayanan, S., ‘Development of New Efficient and Metastatic Ways of Work Life Balancing,
Unpublished Ph. D. Thesis, School of Management, Devi Ahilya University, Indore,
November, 2017.
20.3.3.2 Appendices: The appendices are to support the main body of your text and provide
additional information that may be of interest to the reader or important information to the
reader. All information such as questionnaires, sample information, raw data, respondent list,
derivations etc. form the appendices. An appendix contains additional information related to
the report/research. Appendices can be referred if required but the report does not depend on
this. There is no special heading for the Appendices. You simply need to include each
appendix, starting on a new page, numbered, using capital letters, and headed with a centrally
aligned brief descriptive title. For example: Appendix C: List of Respondents.
Appendices will include
Questionnaires/Data collection forms
Raw Data Tables
Calculations
20.3.3.3Endnotes:
Any extra/ additional information is given here, like
Glossary- This includes a list of special terms used in the research report along-with their
definitions or meanings
Subject Index- Sometimes a subject index is given. But it is not a obligatory section. It is
given alphabetically and works as a guide to the reader for the contents of the report.

MS 110 Research Methodology Uttarakhand Open University
Unit 20 Intricacies of Report Writing-II Page 391 of 434
20.4 REFERENCING IN THE TEXT The Harvard system is intended for referencing in the text. It uses the author’s name and Year
of publication to identify cited documents within the text. For example:
It has been discussed that… (Saunders, 1999).
When referring to work by different authors on the same subject, then place the authors in
alphabetical order: (Bath, 1991; Louis, 1991; Taurus, 1993).
When referring to dual authors: (Saunders and Caliper, 1999).
When there are more than two authors: (Bais et al., 1999).
For corporate authors, for example a company report: (Ernst and Young P Ltd., 2017).
For publications with no obvious author; for example employment news: (Employment
Gazette, 2017).
When referring to number of publications by the same author, the works have to be
arranged chronologically in ascending order: (Lewis, 1989, 1991).
To differentiate between number of publications by the same author as well as in the same
year, use a, b, c etc., (Fredrick, 2015a). This type of referencing must be consistent
throughout the report and must correspond with the bibliography.
To reference an author referred to by another author where the original publication has not
been referred: (Tiwari, 2006, cited by Saunders, 2009). In this case the author who cites
and the original document’s author should both be mentioned in the bibliography.
20.5FOOTNOTES Researchers / writers have to insert footnotes in the appropriate places. These meet your two
purposes:
Credentials of materials used in quotations in the report.
The footnotes add supplementary worth to the main body of the text.
With the help of footnotes’ description, one can easily refer the cross references, citation of
authorities and sources, acknowledgement and explanation of a particular point.
Check Your Progress-B
State whether the following statements are true or false:
(i) In case the study hypotheses are rejected one need not write the research report.

MS 110 Research Methodology Uttarakhand Open University
Unit 20 Intricacies of Report Writing-II Page 392 of 434
(ii) Executive summary of the report presents a short description of the drive behind the
study.
(iii) Survey reports do not utilize secondary data.
(iv) Technical reports are meant for technical heads in an organization.
(v) The major prominence in a working paper is on the methodology of the study.
(vi) Endnotes comprise all the supportive documents used to prepare the report.
(vii) Selected bibliography refers to the referred or used articles which are from selective
and prestigious journals and sources.
(viii) In a bibliography give the name of the person first, followed by the surname.
(ix) In the footnote give the name of the person first, followed by the surname.
20.6 STYLE OF REPORT WRITING The reader is shortage of time and has many other urgent works demanding his or her
attention. He is not knowledgeable about the 'research jargon'.
Therefore, the rules are:
Simplify: Keep to the essentials in a simple way.
Justify: Make no statements or arguments that are not based on facts and data.
Quantify: Quantify the data when you have the data to do so. Avoid large, small, instead,
use 50%, one in three.
Precise: Be accurate and specific in your phrasing of findings.
Candid: Inform truthfully, not impress. Avoid exaggeration.
Use short and understandable sentences.
Use adverbs and adjectives cautiously.
Try to use active voice
Do not make repeated use of information, it makes dull reading.
Aim to be logically organised and systematic in your written presentation.
Special attention is to be given in the use of tenses (past or present tense).
20.7 LAYOUT OF THE REPORT
A good physical layout is helpful to your report in making a good initial impression,
encouraging and motivating the readers, and giving them an idea of how the sections have
been organised so that the reader can make a quick decision of what he should read first. To
achieve this particular attention should be paid to make sure there is:
i. An attractive and formatted layout for the title page and a clear table of contents.
ii. Consistency in margins and spacing. The manuscript should be typed or printed on un-
ruled white paper, leaving one-and-a-half-inch margins on both the right and left sides of the
paper. A one-inch margin should be left on top and bottom (vertical margin/header and
footer). The paper should be printed in double-spaced lines, preferably in the Times New

MS 110 Research Methodology Uttarakhand Open University
Unit 20 Intricacies of Report Writing-II Page 393 of 434
Roman font with 12 point letter size. The physical arrangement of the paper gives a better
appearance, which brings forth more interest among readers.
iii. Uniformity and consistency in headings and subheadings, for example, for headings of
chapters , font size 16 or 18 bold; for subheadings of major sections , font size 14 bold; for
headings of subsections , font size 12 bold.
iv. Good quality of printing and photocopying. Correct drafts with correctly spelled content
as well as critical reading for clarity by other subject experts or other team members and your
facilitator.
v. Numbering of figures and tables, clear headings for rows and columns and clearly
mentioned titles for tables and figures.
vi. Accuracy and consistency in quotations and references.
For appealing layout formatting guidelines are mentioned in the box.
Formatting Guidelines
1. Page Size: A -4
2. Front Page- As prescribed by the University/ Client
3. Font: Times New Roman
4. Same font should be used in one report/thesis/research paper.
5. Font Size:
a. Main Headings: 16 pt- (Title Case)
b. Sub Headings: 14 pt – (Title Case)
c. All Other Headings: 12 pt – (Title Case)
d. Main Text: 12 pt – (Normal/Sentence Case)
6. No Page Borders until specifically prescribed
7. Text Colour: Automatic for text but diagrams may be coloured.
8. Paragraph Alignment: Justified
9. Line Spacing: 1.5 line spacing throughout the report
10. Margins: 1" on top and bottom and 1.25" margin on the left and right side.
11. Underlining of the text is not allowed.
12. Text should be free from hyperlinks or unusual formatting.
13. Do not use table format for the content page
14. Take caution to not break table or diagram in two pages. If a table is too large follow:
a. Break the table and write at the bottom of the table (where you break the table) –

MS 110 Research Methodology Uttarakhand Open University
Unit 20 Intricacies of Report Writing-II Page 394 of 434
“continued to next page”
b. Font size of matter in the table should not be less than 9 pt.
15. Divide the text in sections and present them with points.
Check Your Progress-C
Fill in the blanks:
1. The ………………..should specify the different parts or sections of the report.
2. . …………..Page should point out the topic on which the report is prepared.
3. A selected bibliography lists the items which the author thinks are of
………….interest to the reader.
4. In a report there must be …………….in margins and spacing.
5. Aim must be logical and ……………in the report presentation
20.8 GUIDELINES FOR EFFECTIVE DOCUMENTATION Formatting guidelines make the layout of text attractive. Other than formatting guidelines
there are few guidelines for effective documentation which includes guidelines for visual
representations like, tables, graphs and maps.
20.8.1 GUIDELINES FOR PRESENTING TABULAR DATA (TABLES)
Most of the research studies involve numerical data. This data can be discussed in the text by
representing it in tabular form. The statistical tables help in presenting the data in a concise
and numeral form. The tables make quantitative analysis and comparisons easier. The
mechanics of creating a table are very simple and are illustrated below with an example in
table 20.2.
Table Recognition Details: The table must have a little (1 a) and a recognition number (1 b).
The table title has to be short, specific and concise referring to the population or parameter
being studied. It should not include any verbs or articles. It only refers to the population or
parameter being studied. The numbering of tables is usually in a series.
Data arrays or arrangement of data: The arrangement of data in a table is generally done
in an ascending manner. This could be in terms of time, as mentioned in table 20.2 (column-
wise) or according to sectors or categories (row-wise) or regions, e.g., north, south, east, west
and central. Sometimes there may be subcategories to the main categories; for example,
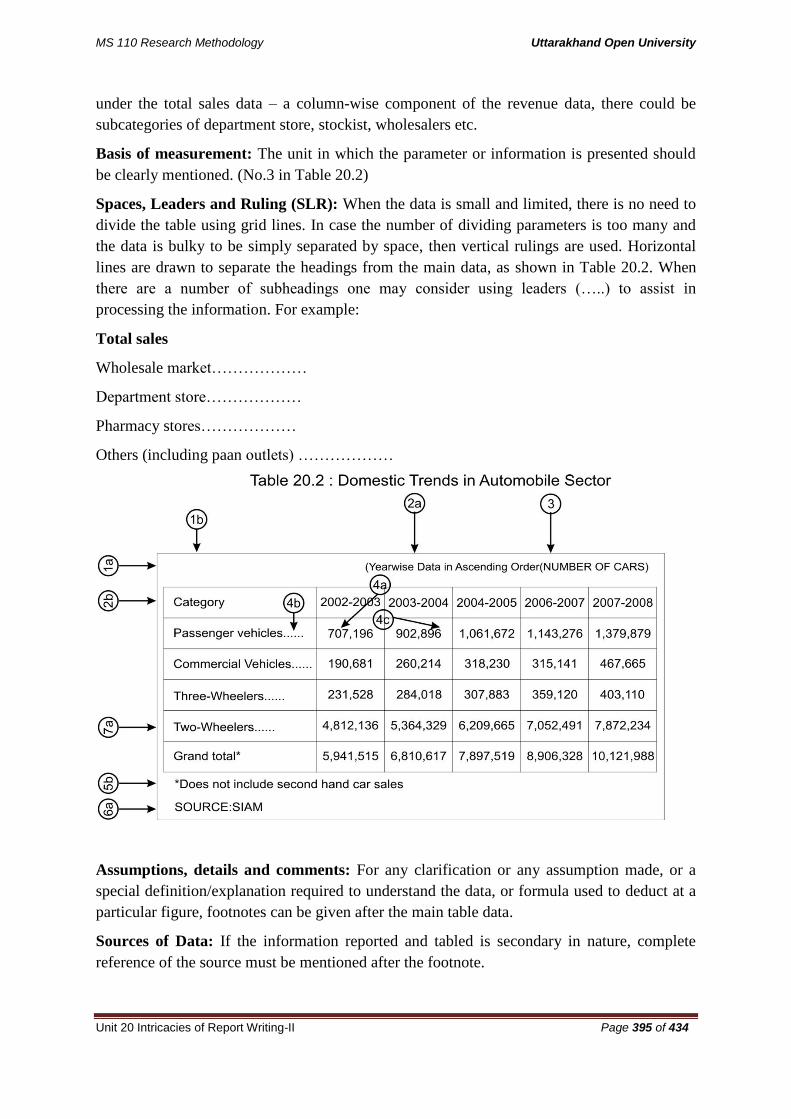
MS 110 Research Methodology Uttarakhand Open University
Unit 20 Intricacies of Report Writing-II Page 395 of 434
under the total sales data – a column-wise component of the revenue data, there could be
subcategories of department store, stockist, wholesalers etc.
Basis of measurement: The unit in which the parameter or information is presented should
be clearly mentioned. (No.3 in Table 20.2)
Spaces, Leaders and Ruling (SLR): When the data is small and limited, there is no need to
divide the table using grid lines. In case the number of dividing parameters is too many and
the data is bulky to be simply separated by space, then vertical rulings are used. Horizontal
lines are drawn to separate the headings from the main data, as shown in Table 20.2. When
there are a number of subheadings one may consider using leaders (…..) to assist in
processing the information. For example:
Total sales
Wholesale market………………
Department store………………
Pharmacy stores………………
Others (including paan outlets) ………………
Assumptions, details and comments: For any clarification or any assumption made, or a
special definition/explanation required to understand the data, or formula used to deduct at a
particular figure, footnotes can be given after the main table data.
Sources of Data: If the information reported and tabled is secondary in nature, complete
reference of the source must be mentioned after the footnote.

MS 110 Research Methodology Uttarakhand Open University
Unit 20 Intricacies of Report Writing-II Page 396 of 434
Special Notes: In case some information or figure is significant and the reader should not
miss it, the number of figure can be bold or can be highlighted to enhance the focus.
Points to be remembered for preparing tables:
Every table should have a title.
Each table column should be labelled.
All tables should be added vertically and horizontally to assure accuracy. Totals and
subtotals should be footnoted if they do not add.
Indicate the source of the data. The source should be mentioned at the bottom of the table.
Functions of Tables
Organize and represent data, especially exact numbers, more clearly and precisely than
that can be done with words
Condense or summarize large amounts of data, complex data or detailed data
20.8.2 GUIDELINES FOR GRAPHS
Similar to the data represented in the form of tables, the data can also be presented through
visual representations such as graphs. The representation of the data in the form of lines or
boxes and bars relative to a number line is easy to figure out and interpret. Graphical display
of information can effectively complement the text and tables to increase clarity of
communication and impact. There are computer programs like MS Excel and SPSS, where
the quantitative data can be converted easily into graphical form. Therefore, this section
focuses on the diverse types of graphical aids. We illustrate several of these using the
comparative analysis of vehicles based on features preferred by consumers.
(a) Line and Curve graph: When the purpose is to demonstrate trends and some sort of
pattern in the data, a line chart is the best option to the researcher as the line is able to clearly
portray any change in pattern during a particular time period. On the same graph, it is also
possible to show patterns of growth of different sectors or industries during the same time
period. Comparison between the change in the studied variable across different organizations
or brands in the same industry can be easily done (refer figure 20.1). Certain points to be kept
in mind while formulating line and curve graphs include:
The time units or the casual variable under the study are to be put on the
X-axis, or the horizontal axis.
If different series are compared on the same chart, the lines should be of different colours
or forms.
An ideal number of lines in the graph would be five or less than five lines.
Zero baselines must be taken carefully other-wise the data would mislead.

MS 110 Research Methodology Uttarakhand Open University
Unit 20 Intricacies of Report Writing-II Page 397 of 434
Stratum charts: Area charts are employed to demonstrate changes in a pattern over a period
of time. Here there are multiple lines that are essentially components of the original data.
Here the change in each of the components is individually shown on the same chart and each
of them is stacked one above the other. The areas/distance between the various lines indicates
the scale or volume of the relevant factors/categories (refer figure 20.2).
Pie charts: Another way of demonstrating the sectional/segment representation is through
the pie charts. The essential difference between a line and pie chart is that the pie chart cannot
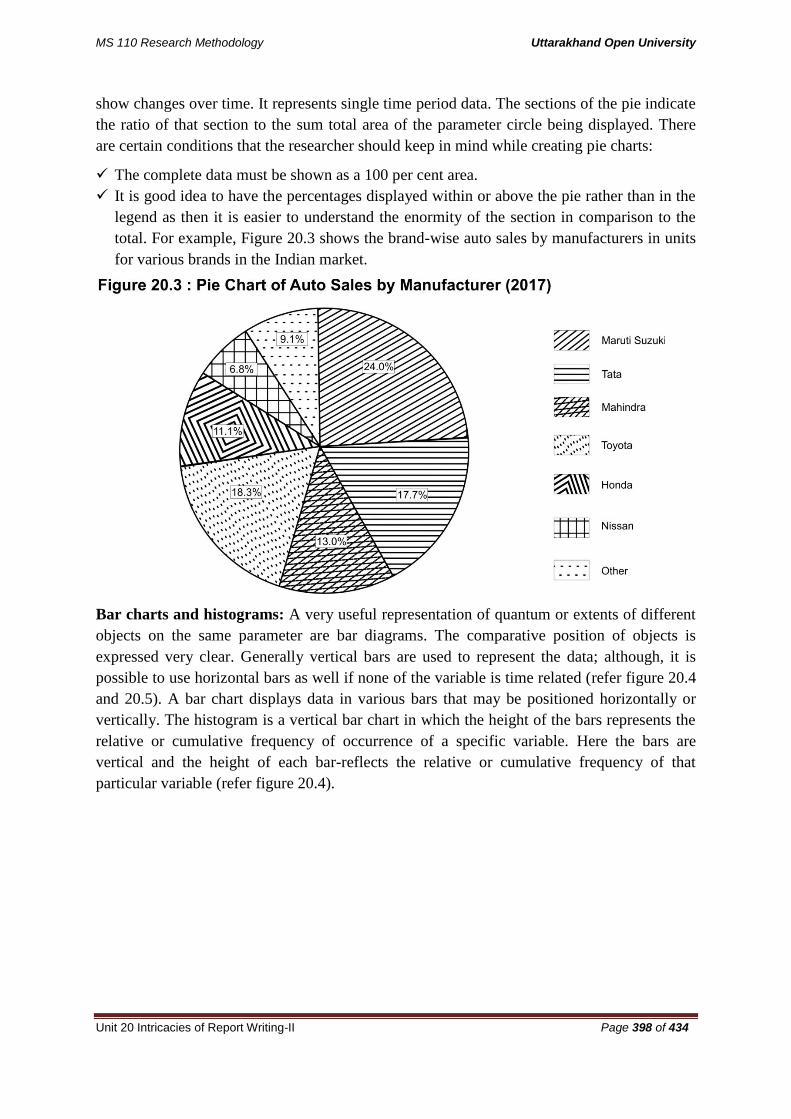
MS 110 Research Methodology Uttarakhand Open University
Unit 20 Intricacies of Report Writing-II Page 398 of 434
show changes over time. It represents single time period data. The sections of the pie indicate
the ratio of that section to the sum total area of the parameter circle being displayed. There
are certain conditions that the researcher should keep in mind while creating pie charts:
The complete data must be shown as a 100 per cent area.
It is good idea to have the percentages displayed within or above the pie rather than in the
legend as then it is easier to understand the enormity of the section in comparison to the
total. For example, Figure 20.3 shows the brand-wise auto sales by manufacturers in units
for various brands in the Indian market.
Bar charts and histograms: A very useful representation of quantum or extents of different
objects on the same parameter are bar diagrams. The comparative position of objects is
expressed very clear. Generally vertical bars are used to represent the data; although, it is
possible to use horizontal bars as well if none of the variable is time related (refer figure 20.4
and 20.5). A bar chart displays data in various bars that may be positioned horizontally or
vertically. The histogram is a vertical bar chart in which the height of the bars represents the
relative or cumulative frequency of occurrence of a specific variable. Here the bars are
vertical and the height of each bar-reflects the relative or cumulative frequency of that
particular variable (refer figure 20.4).

MS 110 Research Methodology Uttarakhand Open University
Unit 20 Intricacies of Report Writing-II Page 399 of 434
Horizontal bars are especially useful when both positive and negative patterns are displayed
on the same graph (Figure 20.5). These are called bilateral bar charts and are especially
useful to represent the objects or segments showing a varied pattern on the studied parameter
(refer figure 20.6). These days, it is easy to generate bar graphs with computer programs and
the distance between the bars can be extremely precise as compared to those created by hand.

MS 110 Research Methodology Uttarakhand Open University
Unit 20 Intricacies of Report Writing-II Page 400 of 434
Pictograph: A pictograph displays graphical representation of data. Pictographs are mostly
used in popular and general reading materials such as in magazines and newspapers, as they
are attention-grabbing and easy to comprehend by one and all. They are not a very accurate
representation of the actual data and, thus should be used prudently in an academic or
technical report. Example of auto sales for 2017 as pictograph is given in figure: 20.7)
Points to be remembered for preparing graphs:
The simplest graphs are the most effective documentation.

MS 110 Research Methodology Uttarakhand Open University
Unit 20 Intricacies of Report Writing-II Page 401 of 434
Each and every graph should be self-explanatory.
All graphs must have a title and the title should be positioned at the top of the graph and
centrally aligned.
Label the scales on both the horizontal and vertical axis. Also, a subject for these scales is
needed to identify the unit of value and/or periods of time.
In case of more than one variable in a graph, each should be clearly differentiated by
means of legends or keys.
No more coordinate lines should be shown than are necessary and each line should be
labelled.
When shading is used, a key or legend should be placed on the chart.
Scale divisions should be clearly indicated as well as the units into which the scale is
divided.
The source of the data should be clearly specified generally at the bottom of the chart, if
data is secondary.
20.8.2 GUIDELINES FOR MAPS
Geographic and other maps, such as product-positioning maps, can convey relative location
and other comparative information. Geographic maps pertain to regions like countries, states,
country sales, territories, and other divisions. For example, marketing manager is asked to
present information on the relative number of Coca-Cola Company bottlers versus the
bottlers for PepsiCo and other competitors for each and every state in the United States. This
information could be effectively corresponded in a map in which each state was divided into
three areas, proportionate to the number of Coca-Cola, PepsiCo, and other bottlers, with each
area in a different colour. Figure 20.8 exhibits examples of product-positioning maps derived
by using Multi Dimensional Scaling procedures.
Points to be remembered for preparing Maps:
Every map should have a short and simple title.

MS 110 Research Methodology Uttarakhand Open University
Unit 20 Intricacies of Report Writing-II Page 402 of 434
A map legend should be placed on the right bottom corner of each map.
Map legends should be clearly labelled and shaded to represent data range presented.
The source of the secondary data must be clearly indicated.
The source of data must be indicated at the bottom left of the map.
Check Your Progress-D
State whether the following statements are true or false:
a) The arrangement of data in a table is usually done in descending order.
b) SLR refers to the lens of the device used to make graphs and charts.
c) While making a graph, care must be taken to put the casual variable on the X-axis.
d) The ideal number of lines in a chart is 10.
e) The area between the lines in a stratum chart represents the volume of the factors
represented there.
f) Histograms show both positive and negative patterns on the same graph in the shape of
bars.
20.9 ORGANIZATION OF A RESEARCH REPORT A report does not require elegant word usage and allusion. It just needs a plain
communication with accuracy, clarity, coherence, conciseness and readability. This can be
achieved by writing the report in three draft stages:
First Draft:
While writing the first draft following points are to be kept in mind:
Remember that you are writing for communicating with the target audience.
Keep the purpose of each chapter, section and paragraph in mind.
Prepare an outline and put all ideas that occur on paper.
Always start writing in any order all those sections of your total work that come raw in
your mind.
Do not struggle for words and phrases.
When there is vacuum for any idea, word or phrase in the mind, leave it blank. It will
easily come on revision.
Do not copy the tables on the text. Just place them in the appropriate places.
Give appropriate headings to chapters, sections and paragraphs.
Verify the correctness of facts and citations.
Revisions (Second Draft):
The following points must be kept in mind.
Don’t forget the basic requirements of a research report

MS 110 Research Methodology Uttarakhand Open University
Unit 20 Intricacies of Report Writing-II Page 403 of 434
Fill in the spaces left with appropriate ideas, words or phrases.
Reorganize paragraphs wherever necessary.
Maintain continuity and eliminate unclear statements.
Simplify sentences and enhance their effectiveness.
Avoid repetitions.
Improve the clarity of the writing to improve uderstandability.
Check the grammatical and spelling errors.
Make a critical evaluation of the draft.
Last and Final Draft:
Following points are to be borne in the mind:
Does the report fulfil the purposes of the Study?
Is the title relevant to the problem under the study?
Are the hypotheses operational, specific and clear?
Is the chapter scheme and sequence relevant to the objectives of the study?
Are the hypothesis tested statistically appropriately and adequately?
Are the findings and interpretations clear and supported by data evidences?
Are the findings and arguments concise?
Are the conclusions based on the findings and are logical?
Are the recommendations specific practically applicable?
20.10 ACRONYMS TO EASE OUT REPORT WRITING Report: The guidelines for report writing may be expressed by the acronym
• Readers: written for specific readers
• Easy to follow
• Presentable and professional appearance
• Objectives oriented
• Reinforce document with tables and graphs
Tables: The guidelines for creating tables may be described by the acronyms
• Title and number
• Arrangement of data items
• Basis of measurement
• Leaders, ruling, spaces
• Explanations and comments: headings, stubs, and footnotes
• Sources of data
Graphs: The guidelines for drawing graphs may be described by the acronyms
• Geographic and other maps
• Round pie chart
• Assembly or line charts

MS 110 Research Methodology Uttarakhand Open University
Unit 20 Intricacies of Report Writing-II Page 404 of 434
• Pictographs
• Histograms and bar charts
• Schematic figures and flowcharts
20.11 PRECAUTIONS IN PREPARING REPORT
A report is a useful way of communicating findings of research to others. A good research
report is able to communicate efficiently and effectively. Hence, the following precautions
must be taken while preparing it:
The length of the report should be long enough as well as short enough. Long enough
means to cover the objectives of the study but short enough infers to maintain interest
of the reader.
Abstract terminologies and technical jargons ought to be avoided. The report should
be able to communicate the subject as simply as possible. This means that reports
have to be written in an objective and purposive style in simple and understandable
language. Usage of probable language i.e. expressions such as ‘it seems’; ‘there may
be’ must be avoided.
Most of the readers are interested in knowing the main findings and therefore the
report must make the findings readily accessible. For this purpose effective
documentation tools like charts, graphs and statistical tables may be used for
displaying various results in the main report.
The layout of the research should be according to the guidelines prescribed. It must be
suitable and synchronised with the objective/objectives of the research problem. The
report should be grammatically correct.
Punctuations must be used appropriately and according to the rules of composition of
research reports. The report must present analysis of the subject matter logically and
sequentially.
A research report should show originality and should contribute to the solution of a
problem.
Towards the end, the report must also state the implications of the problem under the
study.
It is considered desirable for a report to make probable forecast of the subject
concerned and indicate the gaps or areas of research that still needs to be done in that
particular field.
Appendices should be included for all the technical data in the report.
Properly formatted bibliography of sources referred is a must for a good report.
An index is also considered a significant element of a good report and must be
prepared and appended at the end.
The report must be attractive in appearance. It should be neat and clean and well
organised, whether typed or printed.
Calculated confidence limits must be mentioned.

MS 110 Research Methodology Uttarakhand Open University
Unit 20 Intricacies of Report Writing-II Page 405 of 434
Various constraints experienced in conducting the research study must be
acknowledged.
The objective of the study, the nature of the problem, the methods employed and the
technique of analysis implemented must all be mentioned at the beginning of the
report in the form of an executive summary. This would help the reader decide
whether he should read the report or not.
The inclusion of conflicting, careless, or inaccurate data must be avoided.
The inclusion of irrelevant and outdated data must be avoided.
Too much emphasis on layout and appearance and too less on content must be
avoided.
20.12 ETHICAL ISSUES IN RESEARCH REPORT Existence of Previous Work: Whenever research is being planned and conducted, it is vital
that researcher consult other work that has been completed in the past in the target area.
Ethically if you acknowledge the past studies it helps in telling whether your subject is an
overdone subject and perhaps there is no need for this type of study in your community at this
time.
Citing References Appropriately: In case of specific research events, you must recognize
the contributions of others; otherwise you will be termed guilty of plagiarism. This applies to
a study published locally as a report as well as to more widely distributed publications.
Confidentially of Results: You also need to preserve confidentially when writing and
sharing the report. Subjects’ identities should not be disclosed without their permission.
Confidentially may be problematic in qualitative reports with extensive quotes that
inadvertently reveal the subject’s identity.
Bias against Certain Groups: Do not let biasness dominate you so exclude biases in the
writing that tend to stereotype groups. You have to be cautious towards human diversity
issues throughout the research process. Then you must ensure that the data are accurately
presented and equitably and non-judgmentally discussed.
Exclusive Language: The issue of exclusive language involves acknowledging our
differences and avoiding bigotry. The predominant use of the male pronoun as a generic
pronoun is less acceptable, we do need to ensure that non-sexist terms are employed
consistently. This engages not only the appropriate use of male, female, and plural pronouns
but also make use of terms that are gender neutral, such as chair instead of chairman. We also
need to be vigilant while using terms and ensure that they do not reflect ethnic or cultural
biases or a lack of sensitivity to human diversity. Use a descriptor of a cultural group that is
recognized by the group itself. For example, using the term ‘Gujjus’ could be offensive to
some individuals who are Gujarati and belong to state of Gujarat.

MS 110 Research Methodology Uttarakhand Open University
Unit 20 Intricacies of Report Writing-II Page 406 of 434
Disseminating the Results to the Participants: The final question is that who should
receive the results. There is a growing argument in favour of giving the findings to the
participants included in the research rather than just to the practitioners and other researchers.
This is critical when conducting participatory or action research. This does not necessarily
necessitate making the entire research report available to the participants, particularly if it is
extensive or excessively technical, instead, a smaller report can be written specifically for
those participating in the programme evaluation, in which the results could potentially
influence an entire community.
20.13 SUMMARY
Writing is a powerful way of expressing your thinking. Writing is a creative process, which
needs several guidelines and right conditions if it is to produce successful results. Your
project report should have a clear layout and structure that enables you to develop a clear
storyline. Your report should be laid out in such a way that your reader finds all the
information readily accessible. You should always try to develop a clear, organised and
simple writing style that will make reading the report an easy and enjoyed experience. For
effective documentation spelling and grammatical errors should be avoided. Do not consider
your first draft as your last. Be prepared to rewrite your several drafts of your report until you
think it is the best you can do.
20.14 GLOSSARY Abstract: It is a brief summary of the complete project report. It is the only part
that someone will read initially.
Appendix: An appendix contains additional information related to the report/research. All
information such as questionnaires, sample information, raw data, respondent list, derivations
etc. form the appendices.
Foreword: Foreword is generally one page write up or a citation about the work by any
eminent and popular personality or a renowned specialist in the given field of study.
Glossary: This includes a list of special terms used in the research report along-with their
definitions or meanings.
Preface: Preface is a one or two pages write up by the author/writer of the report expressing
circumstances under which the present work is undertaken, importance of the present work,
major dimensions and variables examined and intended audience or reader for the given
work.
References: Known as reference list or bibliography

MS 110 Research Methodology Uttarakhand Open University
Unit 20 Intricacies of Report Writing-II Page 407 of 434
Subject Index: Sometimes a subject index is given. But it is not a mandatory portion. It is
given alphabetically and works as a guide to the reader for the contents of the report.
20.15ANSWER TO CHECK YOUR PROGRESS
Check Your Progress A
1. Research report
2. Final
Check Your Progress B
(i) False
(ii) False
(iii) True
(iv) False
(v) True
(vi) False
(vii) True
(viii) True
(ix) False
Check Your Progress C
1. table of contents
2. Title
3. primary
4. Consistency
5. systematic
Check Your Progress-D
a) False
b) False
c) True
d) False
e) True
f) False
20.16 REFERENCES
Beri G.C. (2000), Marketing Research, Tata Mc Grawhill Publishing Company
Limited
MS 110 Research Methodology Uttarakhand Open University
Unit 20 Intricacies of Report Writing-II Page 408 of 434
Kothari C.R. (2009), Research Methodology: Methods and Techniques, New Age
International (P) Limited, New Delhi
Mehta J.D., Gupta U., (2008-09), Research Methods in Management, Ramesh Book
Depot, Jaipur-, New Delhi
Singh S. Agrawal N. (2013), Research Methodology, Thakur Publishers, Bhopal
Vishwanathan R. (2010), Business Communication, Himalaya Publishing House,
Mumbai
20.17 SUGGESTED READINGS
1. Arthur, M., (1943), Philosophy of Scientific Investigation, Baltimore: John
Hopkins University Press.
2. Becker, H., (1986), Writing for Social Scientists, Chicago, IL, University of
Chicago Press.
3. Bommer M., and Ford, B. ,(1974), A Cost Benefit Analysis for Determining the
Value of an Electronic Security System, College and Research Libraries 35
(July): pp – 270-279
20.18 TERMINAL QUESTIONS Q1. Discuss the necessary guidelines for preparing good research report.
Q2. What are the components of research report? Explain in detail the body of the
report.
Q3. What is meant by "consider the audience" when writing a research report.
Q4. Write a detailed note on layout and significance of research report in details.
Q5. What ethical concerns arise when you prepare a research report in detail.
Q6. Explain in two to three sentence s, the following parts of a report
(a) Bibliography
(b) Appendix.
Q7. How should the data item be arranged in a table?
Q8. Describe the role of pictographs. What is the relationship between bar charts and
histograms?
20.19 CASE
SUBARU OF AMERICA– A REPORT ON REPORTING
MS 110 Research Methodology Uttarakhand Open University
Unit 20 Intricacies of Report Writing-II Page 409 of 434
Tomohiko Suzuki, Chairman, President, and CEO of Subaru of America, Inc., know that
customer loyalty is an essential part of the automotive industry today, and Subaru has for
long known this fact. Subaru, in the past, depended on the traditional, paper-based customer
response surveys. Brief, follow-up purchase experience surveys and post purchase service
experience surveys were mailed to customers within 7 to 15 days post purchase. These
surveys were comprised of both multiple-choice questions and open-ended questions. The
percentage of response through mail ranged from 30 to 45 per cent. After all the data were
collected from the mailings, dealerships received a Subaru Owner Loyalty or (SOLI) rating
quarterly report. These reports provided priceless information to the dealers, but they used to
receive this information only four times a year (being quarterly). Upon receipt of this report
dealers came to know about customers complaints. But it was usually too late to resolve the
problems. To look into situation, the answer for Tomohiko Suzuki was the internet, which
would provide speedily and swiftly, more flexible service and information to dealers, field
staff, and management team. Subaru hired Data Recognition Corporation (DRC), to set-up
the programme design and provide the ongoing service. They scanned the responses from
customer survey forms. Customer comments are recorded and categorized. Entire survey
information is electronically added to the appropriate dealer’s database using customized
software developed by DRC. This entire process was outsourced and hence managed by
DRC. Thus, Subaru may concentrate on selling cars.
The online reports give field managers an opportunity to see what is happening at their
allocated dealership. They can access every minute reports on a specific dealership before
meeting with the dealer. This works well because the managers are able to fetch this
information from anywhere as long as they can tap into the internet.
Dealers are able to use the information/reports site to stay on top of where they are in terms
of customer satisfaction. They can see their quality scores and monitor and troubleshoot on a
particular salesperson’s performance. Dealers are able to take prompt action because of this
new technology. This allows for better management and better performance from all
employees. As dealers became more comfortable with the web format, they began to demand
more detailed and timely reports. Due to this demand of dealers, Subaru has recently begun to
develop a series of reports called (JIT-Reports) ‘Just-in-Time Reports’. This report provides
immediate access to current performance rankings apart from the quarterly rankings. This has
become another tool for Subaru to help to heighten their sales and performance.
Questions:
Q.1) While Subaru’s management finds the report very useful; the dealers have a slightly
different opinion. What changes should be made to the report to improve its usefulness
to the dealers?
Q.2) Discuss the role of the type of report you recommend in enabling Tomohiko Suzuki to
make the dealer sales effort more effective.
MS 110 Research Methodology Uttarakhand Open University
Unit 21 Presentation of a Report Page 410 of 434
UNIT 21PRESENTATION OF REPORT
21.1 Introduction
21.3 Objectives
21.3 Stages in Presentation
21.4 Key to an Effective Presentation
21.5 Profile of a Good Speaker
21.6 Format of an Oral Presentation
21.7 Use of Software Package for Presentation: Ms PowerPoint
21.8 Points to Be Remembered During PowerPoint Slide Preparation and Presentation
21.9 Summary
21.10 Glossary
21.11Answers to Check Your Progress
21.12 References
21.13 Suggested Readings
21.14 Terminal Questions
21.1 INTRODUCTION Once the last draft of the research report is prepared and documented, the final stage is
sharing the findings and practical implications of research with the client or interested
audience. This sharing is called presentation. An oral presentation is a short talk on a set topic
given to a group or audience. In an oral presentation one (or more) presenters give a talk to a
tutorial group and present views on a topic based on their readings or research. The rest of the
group members then joins/connects in a discussion of the topic. The research project should
be presented to the management or to the client. These presentations facilitate management
understand and accept the written report. Any preliminary questions or doubts that the
management may have may be addressed in the presentation. Since many executives form
their first and lasting impression about the project based on the presentation, its importance
cannot be exaggerated.
Presentation is usually done orally and with the assistance of visual aids. The presentation
could be detailed one if it is focused for researcher’s team members or for an academic
audience. If the presentation is for a client (customer) or for a business audience, conciseness
and focal point of the presentation is critical.

MS 110 Research Methodology Uttarakhand Open University
Unit 21 Presentation of a Report Page 411 of 434
21.2 OBJECTIVES After reading this chapter you must be able to:
Understand the meaning of presentation and its purpose
Explain the stages of presentation
Understand the significance of a presentation
Understand the format of presentation
Understand the technicalities of presentation
Plan and organize a presentation
Learn ways to present effectively
21.3 STAGES IN PRESENTATION Presentation is a useful and indispensable skill in the today’s world. You will always want to
discover the best way to put up your material, considering your audiences/addressees and
your presentation's point. From there, work on constructing your slides and materials.
Accumulate information in a logical and sequential order that best demonstrates your point.
Practice your presentation regularly and thoroughly before delivering it. This can help you
figure out any information that should be removed, cut or restructured. Therefore presentation
is structures under following stages:
21.3.1 PLANNING
a. Plan about the environment
b. Decide the purpose of your presentation
c. Identify your best supporting information
21.3.2 PREPARATION
a. Introduction
b. Body of the presentation
c. Employ linking statements to make your points clear
d. Make use of visual aids
21.3.3 CONCLUDE YOUR PRESENTATION
21.3.4 PRACTICE YOUR PRESENTATION
21.3.1 PLANNING
It is very well said ‘Failing to prepare is preparing to fail’. You will be forgiven any
inadequacies if they are from inexperience, but they will be not forgiven if they are out of
little attention to preparation. So very well planned presentations are the necessity. All
presentations should have crystal clear aims and objectives. Your aim should be to give the
audiences’ an overview of your report in such a way that it will capture their interest as well
as make them understand what you have done. Keep it brief, clear and simple. Your
objectives are more precise. The objectives should start you thinking about the concerns of

MS 110 Research Methodology Uttarakhand Open University
Unit 21 Presentation of a Report Page 412 of 434
your audience. These should be phrased in terms of what it is you want your audiences’ to
understand from your presentation. It is good idea to share the objectives with your audience
members so they know about the journey on which they are being taken. Thus the aims and
objectives of presentation must be planned seriously. Following things have to be planned
(a) Plan about the environment
The environment embraces the venue, the event, the organizers, the available time, other
presenters and speakers (if any), the audience and your own circumstances in relation to the
audience.
The venue: You must ensure the room and all necessitated equipments a few minutes before
the presentation. If it is completely new place, you must reach there earlier/some time in
advance, to get familiar with the room, the seating plan, the speaker’s location. Is there a
stage/? How will it be arranged or placed? Is there a mike? Is there a podium? Is your height
comfortable with the mike? Test out the visual aid equipments cautiously. Note its position
and the projection.
It is difficult to always have charge over the environment when you do a presentation. There
may be ways you can make changes to the environment so that it is comfortable for both, you
and the audience members. Other than above mentioned points few courses of action to help
you become aware of environmental features that can affect the deliverance of your
presentation are:
Ensure that the lighting arrangement is adequate (nor too much nor too less).
Find the temperature controls of air conditioner and regulate the temperature if necessary.
If it is too warm or too cold, audience will shift their focus on their discomfort rather than
on your presentation.
Perform a test of any audiovisual equipment to certify it is in working order. Have a
standby plan in place if present setup goes wrong.
Make adjustments to the setup of the room to make certain everyone in the audience will
be able to see you. Make sure that everyone can see the visuals also you plan to use.
If possible, rehearse your talk in the setting where you are scheduled to deliver. This will
make you feel more comfortable as well as help you determine what other aspects you
might have to overcome. If practicing in the room isn't possible at least try to visit it prior
to your presentation so you know what to expect.
Try to eliminate obstructions between you and the spectators. These kinds of barriers
include tables, or audiovisual equipment.
The event: Is it a business meeting or a conference or a seminar?
The organizers: Find out the whole thing possible about the organizers; the given name of
the organizers, names and identities of the important persons in the organization.
Time available: Check well in advance, the time allotted to you. Preparation work depends
on the allotted time. You have to strictly adhere to the allotted time.
MS 110 Research Methodology Uttarakhand Open University
Unit 21 Presentation of a Report Page 413 of 434
The audience/listeners: The presentation must go well with the needs and interests of the
audience/listeners. Your audience will come into the presentation with certain expected
answers. Know well about your audience, their background, and their beliefs. The substance
of the presentation depends on the nature of the audience. This will assist you structure your
presentation stand around audience needs. Take prudence while choosing words and phrases
in the presentation; do not mention anything that might be unsuitable; age group of the
audience/listeners is to be taken into account. You have to keep two questions in mind:
First, “How much the audience/listeners already know about this topic? And for which facts
they are unaware?” You need to be able to bridge those gaps for the audience, so keep in
mind what your audience/listeners may not know.
Second, what do your audience/listeners expect from the presentation? Are you trying to
advertise them a product, introduce them to a new concept, or change their way of thinking?
Think about the kind of people in your audience. Do you have a tougher crowd, or do you
have a group of keen people excited about what you're going to say?
Status: Status here infers to what is the educational and economic status of the
audience/listeners? Highly educated audiences/listeners of any age group are more crucial.
Relationship with audience/listeners: Consider your own association to the
audience/listeners. Do they assume of you as an expert on the topic, as colleague sharing
experience, as a role model or as a company representative wanting to sell ideas?
(b)Decide the goal of your presentation.
You should all the time begin with the end in mind when it comes to planning a presentation.
Think about the objective you are trying to communicate, and the best ways to do so in the
allotted time you have. For this, try jotting down your value points. Presentations involve
sharing information. So plan what facts to be shared with audience/listeners with facts. What
do these facts do? What better point are you making with the information you have?
(c)Find your best supporting information.
Scrutinize through the research you are presenting. Search for your strongest supporting
information. This piece of information should be such that will really get the
audience/listeners thinking, and can inspire change. Supporting information should do three
things:
It should add clarity to your findings and point of view i.e. it will explain anything and
everything the audience/listeners may not understand.
Information should also add authority. You should make your findings logically associated
with existing research studies, and information.
Information should add tint to your argument. No one likes to attend a presentation which is
just like a monotonous lecture. Hence, try incorporating visuals, like pictures, cartoons,
graphs and videos. (Refer figure 21.1)

MS 110 Research Methodology Uttarakhand Open University
Unit 21 Presentation of a Report Page 414 of 434
Check Your Progress-A
Q1.What is Oral Presentation?
-------------------------------------------------------------------------------------------------------------
-------------------------------------------------------------------------------------------------------------
Q2.How can you take the command of environment of the venue?
-------------------------------------------------------------------------------------------------------------
-------------------------------------------------------------------------------------------------------------
Q3.Why do the audience play most important role in structuring of presentation?
-------------------------------------------------------------------------------------------------------------
-------------------------------------------------------------------------------------------------------------
Q4.What is the role of supporting information?
-------------------------------------------------------------------------------------------------------------
-------------------------------------------------------------------------------------------------------------
-------------------------------------------------------------------------------------------------------------
21.3.2 PREPARATION
Janner (1984) has correctly said ‘Confidence comes with preparation, practice and training’.
Without some nervous tension before your presentation it is doubtful you will do yourself
justice. Be positive about your presentation and your report. Trial your presentation on a
friend to ensure that it flows logically and smoothly and that you can deliver it in the allotted
time. In our experience most presenters put too much material in their presentations. It is
important that your presentation has a clear structure. The structure must be based on ‘the
three-step rule’, given by (Parry, 1991). This rule says, ‘First convey them what are you
going to say, then say it, and then tell them what you’ve said’. You need almost one hour of
preparation for every minute of your talk. The most important thing is to decide exactly what
to say, find out the required information, and give it a proper shape. It must be sequentially
logical and have a smooth flow from one section/point to the next. A well prepared
presentation leaves no room for anxiety and nervousness. Therefore, lot of time must be
given for following sections of presentation:
(a)Introduction: Once you have gathered your key informations, you can initiate outlining
your presentation. A presentation must start with a solid introduction that captures the
audience’s mind. An introduction is like a google map that tells your audience the direction
your presentation will take. A good introduction will arrest an audience’s attention.

MS 110 Research Methodology Uttarakhand Open University
Unit 21 Presentation of a Report Page 415 of 434
First introduce yourself by including brief basics of yourself. This must be concise. You
get about 10 seconds to make a perfect positive impression. Create (write it down) a good,
strong, solid introduction, and rehearse it till it comes in a natural way. Mention your
name even though you have been introduced; it reinforces your presence, and helps people
to remember you. You can introduce by saying something like, "I am Shefali Tiwari from
Aquasafe, and I would like to address your company today."
An opening lines of presentation begins by addressing the audience. A formal style is:
Good morning, Ladies and Gentlemen, If there is Chairperson, he/she must be addressed:
Madam Chairperson, Ladies and Gentlemen….. A presentation does not have an elaborate
address style. Good evening, Ladies and Gentlemen, as – have already said, I am – from -;
and I am here to share with you the findings of my research/study. Good morning to all of
you. I am - , and I intend to share with you the information I have gathered and further
findings on the topic of “Barriers to E- Learning”.
The introductory remarks must build affinity and attention of the audience must be
centralised towards you. It gives the audience sufficient time to adjust to your personality;
they try to assess the speaker while the introductory sentences are being spoken.
State your topic and acquaint the audience what your presentation will cover.
Outline the main points.
Questions can also be employed in introduction in different ways. For example, “What is
the average noise level in Indore? And what is the tolerable limit?
The opening lines of introduction can also be statement of facts and figures. For example,
the employees at the lowest level in an organization get only 20% of the information in the
organization as 80% is lost on the way downward.
You can also use an apt quotation or proverb as opening lines. For example, ‘a man is
known by the company he keeps. A company is known by the customers it keeps’.
(b)Body of the presentation: Your presentation’s body should make up about 60 to 70% of
your presentation, so put all your best points here. Think of your body as the path to your
findings. What statements, facts, and tips best illustrate the theme of your presentation? These
should be included in the body of your presentation. So, find a way to present the information
in a logical and cohesive manner. For example, you are trying to get your company to alter
their waste recycling program:
Start by stating the facts pertaining to the vast amount of corporate pollution in the world.
Explain the cost of this level of corporate pollution.
Show how this pollution adds to climate change and global warming.
Then, show your company what they can do.
Outline ways they can change their waste recycling policies.
Also state the positive impact those changes could have like recycling the waste can help
the company save money,
You have given a clear picture here.
In this way you started by explaining the problem, moved on to the problem's
consequences, and then offered a solution.
(c)Use linking statements to make your points clear: Linking statements are mediating
statements that help bridge the gap between ideas. This indicates to your audience that you

MS 110 Research Methodology Uttarakhand Open University
Unit 21 Presentation of a Report Page 416 of 434
are going to switch points, so your presentation doesn't get perplexing. For example,
“Another important aspect...”, “Based on this data analysis, you can now see...”, “I have
presented you the ill effects of corporate pollution, and this brings me to my main point.
What can you do to avoid it?”
(d)Make use of visual aids: Visual aids are illustrations in tabular, graphic, schematic, or
pictorial form. They are used to compress, shorten and clarify lengthy verbal descriptions and
to emphasize key points. Visuals focus audience / listeners attention. Your audience may get
turn off interest with just the data and lecturing. They help both, the presenter and the
audience/ listener. The speaker has them for orderly presentation of points, to exemplify with
a diagram, to exhibit data. The audience/ listeners get a back up through the eyes for what
they hear, and can see a visual summary of points. Visual aids can assist you lay stress on
main ideas, illustrate a concept, or stimulate the interest of your listeners. You can use any
one or more of the following visual aids:
Posters can be demonstrated almost anywhere in the presentation venue. Posters make the
audience/ listeners aware of the topic of presentation. Thus it is a method to empathise the
listener. With this method the presenter does not surprise the audience with his/her topic or
title of study.
Flip chart Flip charts are large pads/notebook of blank paper mounted on an easel or stand.
Visuals are drawn on the pages in advance, and the speaker turns over through the pages
during the presentation. It is most functional for interactive and participative presentations.
You can put up on it ideas that come from the audience/ listeners. And work on it with
audience participation. People in the audience love to see and feel proud that their ideas were
written up during the presentation.
Chalkboards facilitate the researcher to manoeuvre numbers. They are particularly useful in
communicating responses to technical questions. Although, magnetic boards and felt boards
follow for speedy and swift presentation of previously prepared material.
Computer Generated Slides Computer projectors are attached to personal computers, which
display the monitor image onto the screens. They can be used for making computer-
controlled presentations or for presenting technical information, computer-generated slides,
and three-dimensional effects. They can present simple graphs and charts as well as complex
overlays produced by the addition of new images to the screen. Several computer programs
and software are available for producing attractive presentations. Blue-ray and DVD players
and large-screen projectors are particularly effective in presenting focus groups and other
aspects of field work that are dynamic in nature. Power point, R and other software are very
useful for making a visual presentation.
Overhead slides A simple set of overhead slides will execute exactly the same function as a
set of notes, in that it will make sure that you do not forget key points, and will help you to
keep your presentation on track.
Tables They are commonly used to present/exhibit detailed, specific information concisely.
Graphs and Diagrams/Pictures It's a good idea to introduce graphics to your slides to shake
things up. If you have any graphs or diagrams that will help explain and illustrate your point,

MS 110 Research Methodology Uttarakhand Open University
Unit 21 Presentation of a Report Page 417 of 434
use them. Physically seeing data can help make your point more clear and explainable. The
skilled report writer knows graphics to use and when to use them. When people read about
number relationships and ratios, they comprehend better when they have visualized in their
minds what is involved. Line, bar, and pie charts are commonly used to demonstrate trends
and numerals relationships. Pie charts are used to indicate distribution; and flowcharts
illustrate a series of events. Each slide must have a picture related to the topic at hand. This
visualization is made easy when tables and graphs complement the written words.
Video A short video may also help. You should also see if there are any videos you can
include. A brief video of someone concisely explaining an issue can shake things.
Points to be remembered while using visuals:
Utilize visual aids to highlight important points and create interest to your presentation —
don't put every word of your entire presentation on them.
Employ suitable visual aid for the environment. It may be possible to pass on visuals
around to a small audience but in large groups you'll need to project them.
Give the visuals a consistent appearance and layout regarding colour, font size of text and
spacing. Start the text at the same place on each visual.
Try to follow the seven by seven thumb rule: on an overhead slide have no more than
seven lines and seven words per line. Similar rules would also pertain to flip charts,
PowerPoint and other computer generated slides, and posters.
Make use of a simple typeface or font. Don't use more than two different typefaces, if
possible.
Make sure the text (font size-20 and 48 points or zoom) is large enough for people to read
till back of the room to read. Letters on a flipchart should be at least 3 inches in height.
Avoid using visuals that conflict with what you're saying — this includes demonstrating
them once you've moved beyond their content.
Don't just read the text that’s on the visual, but do reword and add to it. (Refer figure 21.1)
21.3.3 CONCLUDE YOUR PRESENTATION:
A conclusion should be an educational speech giving a concise summary of the main points.
It should consume only 5 to 10% of your presentation, so keep it brief and precise. You
should make only one slide of conclusion. Begin with something like, “As you can see...” and
then repeat your main point with brevity. A visual can help as well. Try adding one last visual
aid that sums up your point. A ray diagram would work well here. The concluding sentences
should never be hauled; they should be energetic and concise. For example
Thank you for being patient listeners.
I thank you for the interest and attention you have shown in …..
In the concluding session it is important to invite questions from the audience/ listeners.
Introduce the ‘Questions Session’ nicely so that people are motivated to ask questions.
For example say:

MS 110 Research Methodology Uttarakhand Open University
Unit 21 Presentation of a Report Page 418 of 434
I have gathered a feeling that you have enjoyed this presentation. The intensity with which
you have been listening certainly made me enjoy sharing my ideas with you. I guess you
have a lot of questions to ask, and I’ll be happy to respond and answer your queries.
Thank you for giving me your valuable time and attention. Any questions?
“I’ll be glad to address your any questions.” (Refer figure 21.1)
21.3.4 PRACTICE YOUR PRESENTATION
Note down the whole speech, including the address, the opening lines/sentences and the
ending sentences. Then practice, review, edit and correct it till you get a good presentation
to fit within the time. While practicing the presenter must keep the following points in
mind:
Length: Be careful about the length of your presentation. A 10-minute presentation, for
example, should include not more than 3 points. The average speed of presentation is 100
words per minute; find out your own speed by “delivering” a speech. A four to five minute
presentation is 400 to 500 words. In name of slides, attempt for 1 to 2 minutes of talking per
slide. Time yourself as you practice continuously. Going over 1 to 2 minutes per slide can
bore your audience. If you're taking too long, discount some information out. You do not
want to talk fast or rush in your talk to include all information, as this can make a mess and
audience will find it difficult to understand. Do not speak too fast or too slow. Make sure
you can fit in all information talking at a normal rate in your regular voice.
Style: While practicing, take caution that the presentation sounds like a conversation. Use
short sentences to enable the audience/listener to grasp and comprehend. Handling of the
words and terms must be suitable for your audience/listener. Only specialists in your own
field will be able to comprehend the technical terms, but other commoner audience will not.
Pay attention to the style and keep it formal. There is a formality in official speaking unlike
from social or personal style of speaking.
Humour: Ensure that you are humorous and witty without being nervous or looking silly.
Humour should be natural, light, enjoyable, and relevant to the topic. It should not
embarrass or hurt the feelings of any listener by being personal.
Listen to yourself presenting: Record yourself while presenting and then play the recording
back. Keenly listen to you presenting in the recording to see where you need an
enhancement or a change. Observe that while presenting you should sound enthusiastic.
You should talk without hesitance. Observe that you don’t use a lot of “ums” in your
presentation. Also make sure that you are utilising relating or connecting sentences. While
switching between two different topics you should say lines like, “And this brings me to the
following...” rather than hopping abruptly between topics. Also observe the total time you
are consuming and make sure your presentation is not taking too long.
Practice until you have little need for your notes: One should avoid reading directly from a
script during a presentation. While a small key card with key points jotted down can help
you to minimize your need for notes. Keep practicing until you can carry your presentation
smoothly without fumbling with your notes. (Refer figure 21.1)

MS 110 Research Methodology Uttarakhand Open University
Unit 21 Presentation of a Report Page 419 of 434
Check Your Progress-B
Q1. When is the introduction of presentation termed to be good?
-------------------------------------------------------------------------------------------------------------
-------------------------------------------------------------------------------------------------------------
-------------------------------------------------------------------------------------------------------------
-------------------------------------------------------------------------------------------------------------
Q2. What opening lines a speaker should use for an introduction?
-------------------------------------------------------------------------------------------------------------
-------------------------------------------------------------------------------------------------------------
-------------------------------------------------------------------------------------------------------------
-------------------------------------------------------------------------------------------------------------
Q3. What are the constituents of ‘body of presentation’?
-------------------------------------------------------------------------------------------------------------
-------------------------------------------------------------------------------------------------------------

MS 110 Research Methodology Uttarakhand Open University
Unit 21 Presentation of a Report Page 420 of 434
-------------------------------------------------------------------------------------------------------------
-------------------------------------------------------------------------------------------------------------
Q4. List down the visual aids that can be used in presentation?
-------------------------------------------------------------------------------------------------------------
-------------------------------------------------------------------------------------------------------------
-------------------------------------------------------------------------------------------------------------
-------------------------------------------------------------------------------------------------------------
Q5. What points should be mentioned in conclusion of presentation?
-------------------------------------------------------------------------------------------------------------
-------------------------------------------------------------------------------------------------------------
-------------------------------------------------------------------------------------------------------------
-------------------------------------------------------------------------------------------------------------
21.4 KEY TO AN EFFECTIVE PRESENTATION The key to an effective presentation lies in paying attention to few points while it’s
preparation. They are:
a) Audience Must Be Focal Point: For this purpose the researcher and presenter should
determine their backgrounds, interests and engagement in the project, as well as the
extent to which they are likely to be affected by it. The presentation should be made
interesting and worth watching with the use of suitable stories, examples, incidences,
experiences and quotations. Filler words, such as “uh” “y” “know” and “all right”
should not be used. All these words spoil the body language as well as content santity.
b) Study background: This should be essentially 10-15 per cent of the entire
presentation. It should briefly justify the impetus behind the study with suitable
significance of the study.
c) Study Implications: In case it was a business presentation and implications were
agreed upon between the researcher and the client or was specified as a study
objective by the researcher, this section would be the last section of the presentation.
The relationship between what was found after analysis and what is suggested must
be clear to the audience. As supportive material the researcher can make use of:
Handouts: These could be in the form of the primary questionnaire designed for the study
or company brochures and other related secondary material. This could be printout of

MS 110 Research Methodology Uttarakhand Open University
Unit 21 Presentation of a Report Page 421 of 434
PowerPoint presentation. They should be distributed to the audience in advance when
presenter is referring to them.
Slides: These are created now a day with the help of computer programs and software.
The designing and creation of the slides must be done skilfully to ensure that the
presentation style should be supportive for an effective delivery and not merely a
showcase of the computer graphics that the researcher is well versed with. Too much
mess of text and graphics should be avoided. Animation of the data in harmonization with
the vocal delivery makes the presentation more effective and forceful.
Chalkboard and flipcharts: These are additional and traditional visual aids for effective
presentation. They could be kept as standby for the question-and-answer session when an
idea might have to be explained and emphasised. They could be used to demonstrate in
the response of some query raised by the audience/ listener. The presenter should keep in
mind that use of these means during an active presentation should be avoided as they call
for the presenter to be engaged with the medium and losing contact with the listener.
Overhead slides: A set of overhead slides will perform the same function as a set of
notes. Overhead slides are a great help in such a way that you will know the material so
well that a key point noted on the slide will be enough to prompt your thought process
and focus the attention of the audience. Key points will also make sure that you are not
lured to simply read a script for your presentation.
Power Point Presentation: The use of Microsoft Power Point has revolutionized the
preparation of presentation slides with new graphics and visuals. It is now easy to
produce a highly professional presentation, which can incorporate simple illustrations,
tables, graphs, smart-charts, videos, audios, and pictures to reinforce and emphasize a
point or add a little humour. You may have the facility to project the slides direct to a
screen using a computer, which clearly adds to the degree of professionalism. This helps
you to make known each point as you talk about it while concealing forthcoming points.
Also print miniature versions of your Power Point slides as handouts, which is a very
helpful for the audience/listener.
White Board: You may want to supplement your prepared slides with the use of the
white-board. This may be functional for explaining points in relation to question you are
asked.
Keep your information relevant to the theme: As you go through your
presentation, lookout for irrelevant information. There may be few points and facts
that are interesting, but they may be not related and close to the topic. So cut down
information that does not relate to your theme.
Your Appearance, Voice and Posture While Presentation: Your physical
appearance and personality make an important impact on effective presentation.
Appearance and Gestures: Dress up formally. Make sure you are well groomed and are
neat and tidy from head to toe. Audience observes your body language before you begin to
speak. Presenters often communicate with their audience using various gestures and other

MS 110 Research Methodology Uttarakhand Open University
Unit 21 Presentation of a Report Page 422 of 434
physical behaviours or body language (either intentionally or unintentionally). Therefore
few guidelines to benefit you from gestures are:
Practice to stand comfortably and firmly. Stand being still and quiet, without being
shaky. Do not put your hands again and again in the pockets to hide your nervousness.
Holding a paper with key points, a bunch of cards, and/or a pencil may be helpful.
Don’t let your anxiety and nervousness overcome you and reflect on your face. Be
composed and relax your face.
Eye contact is very important. Radiate your eyes over the entire audience in five seconds.
Take in everyone in your glance.
Feel relaxed and smile naturally.
Keep movements and gestures to the minimum. Move only as much as needed for setting
up lively empathy with the audience and for handling visual aids. Too much movement
or walking around continuously distracts the audience’s interest.
Use positive facial expressions such as smiles, communicative eyes, and looks of
empathy and encouragement.
Stand with your feet spread slightly apart and arms relaxed at your sides.
Use quick and energetic movements of your hands and arms to add additional expression
to your talk. Maintain the attention of the audience by making your movements
unpredictable.
Voice: Employing your voice modulations effectively can have a great impact on your
delivery of presentation. The best speaking voice is conversational, normal, and
enthusiastic. Use the following guidelines to make your presentation effective by speaking:
Vary the pitch (high and low) of your voice to so that you do not sound monotonous.
Don't alter the pitch too much and too frequently, because this may make you sound
unnatural. It means that you have to make a balance using your own instinct.
Speak loud enough to be audible to those sitting at the back. A very loud or very soft
voice makes the spectators inattentive. But vary the volume of your voice to maintain
interest and emphasize key points.
Give voice stress to those words that need to add emphasis.
Vary the rate at which you speak to maintain rapport and interest and add emphasis.
Give a pause after important points/ideas, to allow the audience to grasp them. A pause
after making an important point gives the listeners’ sufficient time to absorb it.
The voice should have variations and modulations in terms of pitch (high/low), pace
(slow/fast/pause), to suit the matter and content of the speech.
Use pauses when too many sentences or ideas are given at the same time. Otherwise
Listeners’ get overloaded.
A breather/pause is also useful to regain the attention of any distracted persons in the
audience.
A short silence or a temporary halt before making an important point emphasizes it.
d) Principles for Effective Structuring of Presentation: The “Tell Em” &“KISS
Em” principle are effective for structuring a presentation. The “Tell ‘Em” rule says:

MS 110 Research Methodology Uttarakhand Open University
Unit 21 Presentation of a Report Page 423 of 434
(i) Tell ‘em : First tell them what you are actually going to say (tell ‘em),
(ii) Tell ‘em : then say it, means narrate it / tell ‘em and
(iii) Tell ‘em : then tell them what you’ve said’/what you’ve told ‘em.
Another useful principle is the “KISS ‘Em” principle. This principle states: Keep It Simple
and Straight forward (hence the acronym is KISS).
e) Health: Take good care of your health. If you are in good health you will be
energetic, enthusiastic and self-assured. Besides, the state of health affects the throat,
the tongue and the entire speaking system.
Tips for Effective Presentation
The guidelines for making a presentation effective can be expressed by the acronym
Preparation
Rehearse your presentation
Eye contact
Stories, experiences, examples, and quotations
Equipment: multimedia
No filler words
Tell ‘Em principle
Audience with a strong closing
Talk loud enough to be audible
Interact with the audience
Outline or script should be prepared
Number one level manager should sponsor it
Check Your Progress-C
Q1. What should be the length and speed of your presentation?
-------------------------------------------------------------------------------------------------------------
-------------------------------------------------------------------------------------------------------------
-------------------------------------------------------------------------------------------------------------
-------------------------------------------------------------------------------------------------------------
Q2. Discuss the points to be remembered for effective presentation?
-------------------------------------------------------------------------------------------------------------
-------------------------------------------------------------------------------------------------------------
-------------------------------------------------------------------------------------------------------------

MS 110 Research Methodology Uttarakhand Open University
Unit 21 Presentation of a Report Page 424 of 434
-------------------------------------------------------------------------------------------------------------
21.5 PROFILE OF A GOOD SPEAKER/PRESENTER A good speaker/presenter –
is dynamic, enthusiastic, engrossed in the topic and so speaks with zeal and zest;
has a sense of responsibility and accountability towards the audience/listeners and tries to
say something that will be worth the listeners’ time;
has sense of responsibility towards the topic; does not speak on something that is not related
to topic; justify the topic genuinely
has a suitable leadership style, makes eye contact, speaks sense and with authority, is
positive, friendly, straightforward;
keeps head on shoulders; does not let confidence turn into over-confidence or under-
confidence.
can accept feedback and make necessary changes to benefit by it.
21.5 FORMAT OF AN ORAL PRESENTATION
• Describes significant aspects of the research
– Give details of the research problem/s and its importance
– Explain the research setting
– Explain what you did and why
– Explain the findings
–Discuss the findings and give recommendations
– Conclude
• You may only be able to present a small portion of your research so
– It needs to be written the way that you would talk (Approximately 7 pages double
spaced = 15 minutes)
• Sometimes you are able to provide one or two illustrations of your findings
•Last your presentation for 15 minutes with 5 minutes for questions/discussion
• Allow sufficient time for discussion
•Doesn’t work if you are nervous and can’t think of what to say
• It must generate audience interest

MS 110 Research Methodology Uttarakhand Open University
Unit 21 Presentation of a Report Page 425 of 434
21.7 USE OF SOFTWARE PACKAGE FOR PRESENTATION:
MS POWERPOINT There are a number of software packages that enable presenters to boost their visual aids. One
of the most popular among presenters is PowerPoint. PowerPoint’s popularity is due to
following reasons :
It’s user-friendliness, availability of basic templates to design basic slides.
It is re-useable and it saves presenters’ time who employ other visual aids or other tools
like overhead projection transparencies, white boards and flipcharts.
Because of its user friendliness, it gives less experienced presenters the confidence to
present. The information and data that they want to present is clearly visible to themselves
as well as to the audience.
How do you use PowerPoint to reflect the overall structure of your presentation? It is useful
to use a more creative approach to structure your presentation. Come up with all the ideas
you want to express. Use a brain map to assemble your ideas into a framework. Then behave
selectively. Discard all the ideas and concepts that are not relevant to your topic and to your
audience/listeners. And also make sure that there is a coherent and rational structure before
you go to PowerPoint. So don’t start designing your presentation by opening PowerPoint and
typing onto the very first slide. There are some suggestions for doing effective PowerPoint
presentations.
21.7.1 AVOID USING POWERPOINT AS A SCRIPT
The important thing is how we insert text into the slides. Presenters often use PowerPoint
slides as a script, a guide for what they are going to say and where they're going. When we
design visual aids we need to think of our audience’s needs and comprehension. This often
results in the slide being burdened with text. For readability, ideally the font size must be 24
points. Then the audience can read faster than you can speak. They will be ahead of you if
you put lot of text. So when you are preparing your slides you need to think about what you
are saying and how you aim the audience to use your slides. As you’re presenting, draw their
attention to relevant information so that they can follow your presentation and the visual aids.
It is embarrassing to have slides with really conspicuous errors. So make sure that you proof-
read your slides to avoid spelling mistakes, grammatical mistakes, to avoid omissions.
21.7.2 FONT AND TRANSITION
Text size is very important for readability and visibility. If you use a font size that is too
small your audience won't be able to read it. It is also not sensible to capitalise the entire text.
Capitalise only when it is necessary because it is difficult to read.
The next point is to take care of the type of font. Do not use a complicated font. It is difficult
to read from a distance. Stick to most popularly used Times New Roman, Verdana, Arial,
Tahoma; those that don't have wiggle bits on.
Also avoid using complicated or distracting transition. The fundamental rule when you are
using the slide transitions that PowerPoint offers is to think about what is the purpose of the

MS 110 Research Methodology Uttarakhand Open University
Unit 21 Presentation of a Report Page 426 of 434
slide. If, for example you are asking the audience a question and you don't want to disclose
the answer until they have answered, then it is wise to use a transition. Sometimes transitions
are used to make lines enter one by one so that entire information is given one by one. While
sometimes you will bring all the information up at once.
21.7.3 USING COLOUR
Using a font colour that does not contrast with the background, for example, white on yellow
makes it difficult and strenuous to read. It is also advised not to use colour for decoration. It
is distracting and frustrating. It has no purpose to use pink and green in the text lines of slide.
Using a different colour for each point and using a different colour for secondary points is
also unnecessary and irrelevant. Trying to be creative by being multicoloured in a single line
is also not advised.
21.7.4 IMAGES
‘Pictures and Images’ are an excellent way of arousing the audience's feelings and emotions.
They help the audience to make links between their previous experiences, their perceptions,
and what you're saying, and a good way of encouraging discussion. But, you need to take
caution about which images you use. If you use an arbitrary (random) image that has no
relationship with what you are saying the audience will find it distracting. You also need to
think clearly about whether it is important to have sound effects. They might be also
distracting.
21.7.5 BACKGROUND
Avoid backgrounds that are distracting and which make it difficult to read the text from. Also
always be consistent with the background that you use. Don’t change the background for
different slides. If you have an organisational background with the logo of the institution that
you work at or study at, then use it in the background. That gives a nice consistent
background.
21.7.6 SMALL AND INTRICATE DIAGRAMS
PowerPoint slide is not the best way to present very small and intricate kind of image. It
would be better to give the diagrams as a handout.
21.7.7 REFERENCES
You need to present references in a PowerPoint presentation, in the same way as you would
in a written report. For this you need to make last slide of reference. Or you may give
references as a handout. This not only shows that you researched properly and referenced
correctly, it also means that if the audience is particularly interested in an aspect of your
presentation, they can take the full references and they can go off and find them successfully.
21.7.8 NOTES
You might like to use the functionality in PowerPoint to help you to prepare and practise your
presentation. For example, if you open up PowerPoint, below the slide, at the bottom of the
screen, there is a section that enables you to add your own notes, whether by typing them in

MS 110 Research Methodology Uttarakhand Open University
Unit 21 Presentation of a Report Page 427 of 434
or by copying and pasting. So here you can put in additional notes that relates to your slide;
points of what you would like to say when the slide is showing. If you then open up the print
dialogue box and choose the option ‘Print what’ and then select ‘Notes’ pages it enables you
to print. The print has the picture of your slide at the top and the text as notes that you have
typed in this rectangular box below. So everything you want to say about that slide is on one
piece of paper. Notes are ideal for practising and memorising significant points.
21.8 POINTS TO BE REMEMBERED DURING POWERPOINT
SLIDE PREPARATION AND PRESENTATION The preparation has been done carefully but presentation should also be done very cautiously.
So effective delivery of PowerPoint Presentation is equally important. For this few
unavoidable points have to be kept in mind. They are:
The way you position yourself is very important. Don’t stand directly in front of your
visual aid, which will obscure the view of your audience. Check whether all audience
members can see your visual aid. So either position yourself left or right to your visual aid.
You should avoid reading directly from the slide. It conveys message that you are nervous
as well as audience is unable to make eye contact with you. If you do so your voice also
doesn't project well, because it is forced towards the screen.
The third point is to make and use index cards to make very concise notes to remind and
prompt you. For example, statistics, dates, names that you might easily forget and that will
really affect the credibility of what you are saying.
It is really important to interact with the information on your slides. This will help the
listeners to relate between what you are saying and what the visual aid is displaying. A
harmony between the two is mandatory.
If you are going to use handouts and the audience needs them while you are presenting, to
refer to, and then give them out at the appropriate time (may be in advance). If they are
only a reference tool for the audience then keep them until the end because handing them
out during your presentation may mean that the audience is reading them, rather than
listening to you.
To meet out unavoidable circumstances, use a memory stick and also have a backup on a
CD or e-mail (e-mail it to yourself) so that in case there is a technical failure you can
download it and continue your presentation.
Do not rely on using the internet for showing the audience a website. Last minute the
internet connectivity may fail. Use screen captures. You can do that by pressing the print
screen button on the top right hand corner of your keyboard and then pasting it into
PowerPoint.
Make sure that you know to use the equipment and that all the software and hardware that
you might need to use is available to you.
MS 110 Research Methodology Uttarakhand Open University
Unit 21 Presentation of a Report Page 428 of 434
The final caution is for those who use Apple/ Mac to design their PowerPoint
presentations. It is not always compatible with the Microsoft operating system. So make
sure that you have got sufficient time to make adjustments to the slides, if necessary.
21.9 SUMMARY Failing to prepare for your oral presentation is preparing to fail because the skills required
here are quite different from those required for writing the report. Presentation is as much an
art as a science. What should be presented to different audiences must be clearly understood.
Visual aids will augment the comprehension of your audience and also give your presentation
professionalism. Three-step rule must be remembered: tell them what you going to say, say it,
them what you’ve said. The Presentation should clearly state the objectives and purpose of
the project. Presenter should stand out the key points; must be fluent in delivering it ; must be
focused on the audience. Speed, gestures, pauses, clarity, voice do play a part in holding the
interest of the audience. A good rule for oral presentation is to sequentially fix the main
points in the mind and keep some cards or notes. To be effective, the presentation requires
good planning and practice. It is essential to maintain eye contact and communicate with the
audience during the presentation. Body language also plays significant role. The speaker
should vary the volume, pitch, voice quality, articulation, and rate while speaking. The
presentation should terminate with a strong closing. Adequate opportunity should be provided
for questions, both during and after the presentation. If it is required necessary corrections
can be made in the report after feedback from audience/client. The entire process of report
preparation and presentation is represented below in figure 21.2.

MS 110 Research Methodology Uttarakhand Open University
Unit 21 Presentation of a Report Page 429 of 434
21.10 GLOSSARY
Audience: listeners’
Environment (here): The environment embraces the venue, the event, the organizers, the
time available, other speakers (if any), the audience and your own situation in relation to the
audience.
Linking statements: Linking statements are intermediary statements that help bridge the gap
between ideas.
MS PowerPoint: the most popular software packages among presenters that enable
presenters to augment their visual aids.
Oral Presentation: An oral presentation is a short talk on a set topic given to a group or
audience.
Slides: These are created now days with the help of computer programs and software.
Status (here): It refers to what is the educational and economic status of the audience?
MS 110 Research Methodology Uttarakhand Open University
Unit 21 Presentation of a Report Page 430 of 434
21.11 ANSWERS TO CHECK YOUR PROGRESS
Check Your Progress-A
Answer 1: An oral presentation is a short talk on a set topic given to a group or
audience. In an oral presentation one (or more) presenters give a talk to a tutorial
group and present views on a topic based on their readings or research. The rest of the
group members then joins in a discussion of the topic.
Answer 2: You must check the room and all needed equipments in advance. If it is
absolutely new place, you must reach there sufficient time earlier to get familiar with
the room, the seating arrangement, the speaker’s position. Is there a stage? How will it
be arranged? Will there be others sitting on the platform while you speak? Is there a
mike? Is there a podium? Is your height apt with the height of mike? Check the visual
aid equipments cautiously and keep standby options for everything. Note its position
and the projection. There may be ways you can amend the environment so that it is
comfortable for both, you and the audience members.
Answer 3: The presentation must go well with the expectations, needs and interests of
the audience. Your audience will come into the presentation with certain hopes. Know
well about your audience, their background, and their beliefs and their mental
framework. The content of the presentation depends on the nature of the audience.
This will help you structure your presentation based around audience needs. Take
caution while choosing words and phrases in the presentation; do not refer to anything
that might be unsuitable and have double meaning; age group of the audience is to be
taken into account.
Answer 4: Supporting information should do three things:
It should add clarity to your point of view i.e. it will explain anything and
everything the audience may not understand.
Information should also add authority. You should make logical relationships
with existing research studies, and information.
Information should add tint to your argument. No one likes to sit through a
monotonous lecture. Try incorporating visuals, like pictures, cartoons, graphs and
videos.
Check Your Progress-B
Answer 1: An introduction is like a road map that tells your audience the direction
your presentation will take. A good introduction will capture an audience’s attention.
First introduce yourself by including basics of introducing yourself. This must be
brief. You get about 10 seconds to make a good impact and impression. Create
(write it down) a good, strong, solid introduction, and rehearse it till it comes
naturally. State your name even though you have been introduced; it reinforces
your presence, and helps people to remember you. You can introduce by saying

MS 110 Research Methodology Uttarakhand Open University
Unit 21 Presentation of a Report Page 431 of 434
something like, "I am Shefali Tiwari from Aquasafe, and I would like to address
your company today."
A presentation begins by addressing the audience. A formal style is: Good
morning, Ladies and Gentlemen, If there is Chairperson, he/she must be addressed:
Madam Chairperson, Ladies and Gentlemen. A presentation does not have an
elaborate address style. Good evening, Ladies and Gentlemen, As – has already
said, I am – from -; and I am here to share with you the results of my
research/study. Good morning to all of you. I am - , and I intend to share with you
the information I have gathered on the topic of “Barriers to E- Learning”.
The introductory remarks must build affinity and focus attention of the audience. It
gives the audience the time to adjust to your personality; they assess the speaker
while the introductory sentences are being spoken.
State your topic and tell the audience what your presentation will cover.
Outline the main points.
Questions can also be used in introduction in different ways. For example, “What
is the average noise level in Indore? And what is the tolerable limit?
The opening lines of introduction can also be statement of facts and figures. For
example, the employees at the lowest level in an organization get only 20% of the
information in the organization as 80% is lost on the way downward.
You can also use an apt quotation or proverb as opening lines.
Answer 2: A presentation begins by addressing the audience. You can introduce by
saying something like, "I am Shefali Tiwari from Aquasafe, and I would like to
address your company today."A formal style is: Good morning, Ladies and
Gentlemen, If there is Chairperson, he/she must be addressed: Madam Chairperson,
Ladies and Gentlemen. A presentation does not have an elaborate address style. Good
evening, Ladies and Gentlemen, As – has already said, I am – from -; and I am here to
share with you the results of my research/study. Good morning to all of you. I am - ,
and I intend to share with you the information I have gathered on the topic of
“Barriers to E- Learning”.
Answer 3: Presentation’s body should make up about 60 to 70% of your presentation.
So you must put all your best points here. Think of ‘body of presentation’ as the path
to your findings. What statements, facts, and tips best illustrate the theme of your
presentation? These should be included in the body of your presentation. So, find a
way to present the information in a logical and cohesive manner.
Answer 4: The visual aids that can be used in presentation are:
Posters
Flip chart
Chalkboards
Computer generated Slides
Overhead slides
Tables
Graphs and Diagrams/Pictures

MS 110 Research Methodology Uttarakhand Open University
Unit 21 Presentation of a Report Page 432 of 434
Video
Answer 5: A conclusion should be an educational speech giving a short summary of
the main points. It should leave your audience considering the topic you presented. It
should consume only 5 to 10% of your presentation, so keep it brief and precise. You
should make only one slide. Begin with something like, "As you can see..." and then
repeat your main point with brevity. A visual can help as well. Try adding one last
visual aid that sums up your point. A ray diagram would work well here. The
concluding sentences should never be hauled; they should be energetic and
businesslike. For example
Thank you for listening to me.
I thank you for the interest and attention you have shown in …..
In the end it is important to invite questions from the audience. Introduce the
Questions Session nicely so that people are motivated to ask questions.
For example say:
I have gathered a feeling that you have enjoyed this presentation. The keenness
with which you have been listening certainly made me enjoy sharing my ideas with
you. I am sure you have a lot of questions to ask, and I’ll be happy to try to answer
your queries.
Thank you for giving me your time and attention. Any questions?
“I’ll be glad to answer any questions.”
Check Your Progress-C
Answer 1: A 10-minute presentation, for example, should include no more than 3
points. The average speed of presentation is 100 words per minute; find out your own
speed by “delivering” a speech. A four to five minute presentation is 400 to 500
words. In terms of slides, strive for 1 to 2 minutes of talking per slide. Time yourself
as you practice. Going over 1 to 2 minutes per slide can bore your audience. If you're
taking longer, cut some information out. You do not want to talk fast or rush in your
talk to include all information, as this can make you difficult to understand. Do not
speak too fast or too slow. Make sure you can fit in all information talking at a normal
rate in your regular voice.
Answer 2: The key to effective presentation are:
Audience Must Be Focal Point
For this purpose the researcher and presenter should determine their backgrounds,
interests and engagement in the project, as well as the extent to which they are likely
to be affected by it.
Study background
This should be essentially 10-15 per cent of the entire presentation. It should briefly
justify the impetus behind the study with suitable significance of the study.
Study Implications

MS 110 Research Methodology Uttarakhand Open University
Unit 21 Presentation of a Report Page 433 of 434
In case it was a business presentation and implications were agreed upon between the
researcher and the client or was specified as a study objective by the researcher, this
section would be the last section of the presentation.
Keep your information relevant to the theme: As you go through your
presentation, lookout for irrelevant information. There may be few facts that are
interesting, but they may be not related to the topic. So cut down information that
does not relate to your theme.
Appearance and Gestures: Be formally dressed. Make sure you are well groomed
from head to toe. Audience notices your body language before you begin to speak.
Presenters often communicate with their audience using gestures and other physical
behaviours or body language (either intentionally or unintentionally).
Voice: Using your voice effectively can have a great impact on your delivery of
presentation. The best speaking voice is conversational, normal, and enthusiastic.
Principles for Effective Structuring of Presentation: The “Tell ‘Em” and “KISS
‘Em” principle are effective for structuring a presentation.
Health: Take good care of your health. If you are in good health you will be
energetic, enthusiastic and self-assured. Besides, the state of health affects the throat,
the tongue and the entire speaking system.
21.12 REFERENCES
Janner,G.(1984),Janner on Presentations ,Business Books Ltd. ,London
Parry, H. (1991), Successful Business Presentations, Croner,Kingston upon
Thames
Raimond, P.(1993),Management Projects:Design,Research and
Presentation,Chapman & Hall, London
Rawlins, K.(1993),Presentation and Communication Skills: A Handbook for
Practitioners, Emap Healthcare Ltd.,London
Smith, C.B.(1991), A Guide to Business Research,Nelson-Hall,Chicago
21.13 SUGGESTED READINGS
1. Becker, H. (1986),Writing for Social Scientists, University of Chicago
Press,Chicago II.
MS 110 Research Methodology Uttarakhand Open University
Unit 21 Presentation of a Report Page 434 of 434
2. Bernal, J.D., (1939), The Social Function of Science, George Routledge and Sons,
London
3. Day, R.(1995), How to Write and Publish a Scientific Paper, Cambridge
University Press,Cambridge
4. Knight, N.H., (1976), Theft Detection System – A Survey, Library Technology
Report 12 (November), pp – 575-690
21.14 TERMINAL QUESTIONS Q1.Prepare a good self introduction to be used when you have to make a presentation.
Q2.Prepare a concluding paragraph of 2 to 3 sentences which you can use for any
presentation.
Q3.What is the purpose of an oral presentation? What guidelines should be followed
in an oral presentation?
Q4. Write opening paragraph of formal presentation on the topic of “How extra-
curricular activities contribute to your personally development.”
Q5. Describe the “Tell ‘EM “ and “Kiss ‘EM” principles.
Q6. Make five-minute presentations on ‘Using visual aids in a presentation’.
Q7.What qualities are needed for being a good speaker?
Q8.What points should be remembered during PowerPoint slide presentation?

Research Methodology
MS 110
Department of Management Studies
Uttarakhand Open University University Road, Teenpani By pass, Behind Transport Nagar, Haldwani- 263 139
Phone No: (05946)-261122, 261123, 286055
Toll Free No.: 1800 180 4025
Fax No.: (05946)-264232, e-mail: [email protected], [email protected]
Website:http://www.uou.ac.in
Blog Address: www.blogsomcuou.wordpress.com
ISBN:
978-93-85740-16-9