Phytosanitary problems detected in truffle cultivation in ... - Dialnet

Utility of Host Markers Detected in QuantiferonSupernatants for the Diagnosis of Tuberculosis inChildren in a High-Burden SettingNovel N. Chegou1*, Anne K. Detjen2,3, Lani Thiart1, Elisabetta Walters2, Anna M. Mandalakas4,
Anneke C. Hesseling2, Gerhard Walzl1
1DST/NRF Centre of Excellence for Biomedical Tuberculosis Research and MRC Centre for Molecular and Cellular Biology, Division of Molecular Biology and Human
Genetics, Department of Biomedical Sciences, Faculty of Medicine and Health Sciences, Stellenbosch University, Tygerberg, South Africa, 2Desmond Tutu TB Centre,
Department of Paediatrics and Child Health, Faculty of Medicine and Health Sciences, Stellenbosch University, Tygerberg, South Africa, 3 The International Union Against
Tuberculosis and Lung Disease, North America Office, International Union Against Tuberculosis and Lung Disease, New York, New York, United States of America,
4 Section on Retrovirology and Global Health, Department of Pediatrics, Baylor College of Medicine, Houston, Texas, United States of America
Abstract
Background: The diagnosis of childhood tuberculosis (TB) disease remains a challenge especially in young and HIV-infectedchildren. Recent studies have identified potential host markers which, when measured in Quantiferon (QFT-IT) supernatants,show promise in discriminating between Mycobacterium tuberculosis (M.tb) infection states. In this study, the utility of suchmarkers was investigated in children screened for TB in a setting with high TB incidence.
Methodology and Principal Findings: 76 children (29% HIV-infected) with or without active TB provided blood specimenscollected directly into QFT-IT tubes. After overnight incubation, culture supernatants were harvested, aliquoted and frozenfor future immunological research purposes. Subsequently, the levels of 12 host markers previously identified as potentialTB diagnostic markers were evaluated in these supernatants for their ability to discriminate between M.tb infection anddisease states using the Luminex platform. Of the 76 children included, 19 (25%) had culture confirmed TB disease; 26 (46%)of the 57 without TB had positive markers of M.tb infection defined by a positive QFT-IT test. The potentially most usefulanalytes for diagnosing TB disease included IFN-a2, IL-1Ra, sCD40L and VEGF and the most useful markers for discriminatingbetween QFT-IT positive children as TB or latent infection included IL-1Ra, IP-10 and VEGF. When markers were used incombinations of four, 84% of all children were accurately classified into their respective groups (TB disease or no TB), afterleave-one-out cross validation.
Conclusions: Measurement of the levels of IFN-a2, IL-1Ra, sCD40L, IP-10 and VEGF in QFT-IT supernatants may be a usefulmethod for diagnosing TB disease and differentiating between active TB disease and M.tb infection in children. Ourobservations warrant further investigation in larger well-characterized clinical cohorts.
Citation: Chegou NN, Detjen AK, Thiart L, Walters E, Mandalakas AM, et al. (2013) Utility of Host Markers Detected in Quantiferon Supernatants for the Diagnosisof Tuberculosis in Children in a High-Burden Setting. PLoS ONE 8(5): e64226. doi:10.1371/journal.pone.0064226
Editor: Madhukar Pai, McGill University, Canada
Received February 5, 2013; Accepted April 10, 2013; Published May 15, 2013
Copyright: � 2013 Chegou et al. This is an open-access article distributed under the terms of the Creative Commons Attribution License, which permitsunrestricted use, distribution, and reproduction in any medium, provided the original author and source are credited.
Funding: This study was supported by the EDCTP, grant number IP_2009_32040. N.N. Chegou received financial assistance from the Claude Leon Foundationand the South African MRC. A.K. Detjen received funding from the Alexander von Humboldt Foundation (Feodor Lynen Fellowship). A.C. Hesseling receivedfunding from the Norwegian Cooperation for Higher Education (NUFU). The funders had no role in study design, data collection and analysis, decision to publish,or preparation of the manuscript.
Competing Interests: The authors have declared that no competing interests exist.
* E-mail: [email protected]
Introduction
Tuberculosis (TB) remains a global health problem and the
diagnosis remains challenging especially in children, who typically
develop paucibacillary disease [1]. The introduction of the
XpertMTB/RIF assay (Cepheid Inc., CA, USA) into routine
clinical practice [2] is a significant improvement especially in high-
burden settings since diagnosis of pulmonary TB is now possible
within 2 hours, coupled with the detection of rifampicine
resistance [3]. However, many limitations including the high
operating costs [4] are major impediments to large-scale roll-out of
such tests in resource-limited settings. Furthermore, sputum based
tests have limitations for the detection of Mycobacterium tuberculosis
(M.tb) in children, both due to the low organism yield, and limited
tussive force. In children hospitalized for suspected pulmonary TB
and with radiological evidence of disease on chest radiograph, only
30–40% are culture-confirmed if sampled repeatedly by gastric
aspiration, nasopharyngeal aspiration or sputum induction [5].
Furthermore, culture is costly and results may take up to 6 weeks
[6]. There is a need for new, rapid and accurate diagnostic tools
more effective in detecting paucibacillary TB in young children.
Ideally, such methods should be coupled with the development of
suitable platforms for detection such as incorporation of validated
markers into rapid point-of-care tests that are feasible to use in
resource-limited settings. Such tests would ideally use readily
PLOS ONE | www.plosone.org 1 May 2013 | Volume 8 | Issue 5 | e64226

obtainable paediatric specimens including small volumes of whole
blood, serum/plasma, saliva, stool or urine.
Commercial Interferon gamma (IFN-c) release assays (IGRAs)
such as the ELISA-based Quantiferon TB Gold In-Tube assay
(QFT-IT; Qiagen, Germany), and the ELISPOT-based T
SPOT.TB (Oxford Immunotec, UK), are widely used especially
in high income, low burden settings for the diagnosis of M.tb
infection and for research in high-burden TB settings. These
assays have proven to be useful to accurately detect M.tb infection
in adults and children [7–10], but are unable to discriminate
between M.tb infection and active TB disease [11]. Investigations
aiming at identifying other potentially useful M.tb diagnostic
antigens are on-going [12–15]. At the same time, the identification
of additional host markers in supernatants upon stimulation with
the widely investigated ESAT-6/CFP-10/TB7.7 (the latter only in
QFT-IT assays) may be advantageous since new assays based on
such markers could build on this existing well-developed platform
[14,16–19,19–26]. Studies investigating such markers of infection
have identified interferon inducing protein (IP)-10, macrophage
chemotactic protein (MCP)-1, MCP-2, Interleukin (IL)-2, inter-
leukin-1 receptor antagonist (IL-1Ra) and tumour necrosis factor
(TNF)-a, amongst others, as potential alternative markers to IFN-c[18,21–23,25,27]. Other studies have indicated that epidermal
growth factor (EGF), macrophage inflammatory protein (MIP)-1b,IL-1a, transforming growth factor (TGF)-a, soluble CD40 ligand
(sCD40L), vascular endothelial growth factor (VEGF), IP-10,
TNF-a, IL-12(p40), might discriminate between active TB and
infection [16,19,20,28]. The available data on the potential utility
of these markers, especially in discriminating between TB disease
and infection are limited, conflicting and the studies conducted to
date have used highly heterogeneous methodology. In the present
study, we investigated the utility of 13 markers previously reported
[16,18–23,25,27,28] to be potentially useful in the diagnosis of
M.tb infection or TB disease in children from a setting with high
burden of TB and HIV.
Materials and Methods
Ethics StatementThe children included in this study were enrolled as part of two
larger paediatric studies. Upon completion of initial sample
collection, frozen aliquots of QFT-IT supernatants were thawed
and used for the Luminex experiments presented in this report.
The larger studies were approved by the Health Research Ethics
Committee of Stellenbosch University (project numbers N07/08/
180 and N08/08/207). Parents gave written consent for study
participation, including for HIV testing and storage of blood
samples for future TB diagnostic research.
Study Participants and SettingThe two larger paediatric studies that contributed participants
for this study were conducted in 2008 in Cape Town, Western
Cape Province, South Africa. In Cape Town, the TB notification
rate among children aged 0–13 years was 620/100 000 in 2008
[29]. BCG vaccination (Danish strain, 1331, Statens Serum
Institute, Copenhagen, Denmark) is routinely administered at
birth (99% coverage). Study 1 aimed to assess the value of
commercial IGRAs for the diagnosis of active TB in hospitalized
children with different spectrum and severity of disease (Table 1)
and contributed all the 19 TB cases included in this sub-study.
Study 2 was a paediatric household contact study which aimed to
investigate markers of TB infection in recently TB-exposed
children. All 57 children without active TB disease were recruited
from study 2.
Study 1 (disease group) included children with symptoms and
signs suggestive of TB recruited at Tygerberg Children’s Hospital;
study 2 (no-disease group) enrolled children exposed to an adult
with smear or culture confirmed pulmonary TB in the household.
Participants in both parent studies were aged 3 months to 5 years.
Children were excluded if weighing ,2.5 kg and if they had
received antituberculosis therapy for .1 month (disease group) or
were on any antituberculosis therapy (no-disease group).
All children were systematically screened for TB through
history, clinical examination, Mantoux tuberculin skin test [TST;
2 tuberculin units of purified protein derivative (PPD RT23), SSI,
Denmark], chest radiography (read by two blinded experts using a
standardized reporting form) [30], and liquid mycobacterial
culture (MGIT system, Beckton-Dickinson, USA) of minimum 2
respiratory samples (typically gastric aspirates) and of any other
clinically relevant specimens. Positive cultures were speciated using
line probe assay (GenoTypeH MTBDRplus, Hain Lifescience
GmbH, Nehren, Germany). HIV infection status was determined
in all children (HIV DNA PCR if ,=18 months and HIV ELISA
if .18 months of age). All participants provided a 3 ml whole
blood sample that was collected directly into three QFT-IT tubes
(Nil, mitogen and TB antigen tubes) as recommended by the
manufacturer (Qiagen, Germany). The tubes were transported at
room temperature to the research laboratory within 2 hours of
collection and incubated (37uC, 20–24 hours); thereafter, super-
natants were harvested, aliquoted and frozen at 280uC for the
immunological assays described below.
Confirmed TB disease was defined as bacteriological identifi-
cation of M.tb from any sample, in the presence of clinical and
radiological signs and symptoms. TB was excluded (‘‘unlikely’’ or
‘‘not’’ TB) [31] if the child was asymptomatic (study 1), with a
chest radiograph not suggestive of TB, and negative mycobacterial
cultures. Children with probable or possible TB disease were
excluded from this study. Children with confirmed TB disease
with available frozen QFT-IT supernatants (Study 1) were age-
matched to controls without TB (Study 2), with or without M.tb
infection, and with available supernatants.
For the purpose of this sub study,M.tb infection was defined as a
positive QFT-IT result, in the absence of any other clinical or
radiological signs and symptoms suggestive of TB or positive
MGIT cultures. Laboratory analysis was blinded to all clinical
data including TB infection or disease status and the clinical team
was blinded to QFT-IT results.
ImmunoassaysIFN-c responses in culture supernatants were determined using
the Quantiferon TB Gold ELISA kit and the results were
interpreted for M.tb infection using the analysis software provided
by the manufacturer (Qiagen, Germany) as previously described
[32]. Frozen aliquots of each participant’s unstimulated (nil) and
TB antigen-stimulated supernatants were thawed and the levels of
12 host markers (EGF, IFN-a2, IL-1Ra, IL-1a, IP-10, MCP-3,
MIP-1b, sCD40L, TGF-a, TNF-a, VEGF and IFN-c) evaluatedusing customized Milliplex kits (Merck Millipore, St. Charles,
Missouri, USA) on the Bio Plex platform (Bio PlexTM, Bio Rad
Laboratories) as previously described [20]. Prior to the assay, all
supernatants were diluted 1:1 with the kit serum matrix to ensure
accurate measurement of chemokine levels following previous
optimization experiments [20]. The concentration of IP-10 in TB
antigen stimulated supernatants, however, remained above the
range of the standard curve in 14/19 (74%) TB cases and 31/
57(54%) non TB cases; IP-10 TB antigen data was therefore
excluded from further analysis. Samples were evaluated blinded to
QFT-IT status. All analyte levels in the two quality control
Markers for Diagnosis of TB Disease in Children
PLOS ONE | www.plosone.org 2 May 2013 | Volume 8 | Issue 5 | e64226
reagents supplied by the manufacturer were within the expected
ranges. Marker concentrations detected in the different superna-
tants were automatically multiplied by 2 (to correct for the
dilution) by the software used for bead acquisition and analysis, the
Bio Plex manager software, version 4.1.1. The standard curve for
all biomarkers ranged from 3.2–10000 pg/ml.
Statistical AnalysisDifferences between the comparison groups (e.g. TB disease and
no TB) were determined using the Mann–Whitney U test for non-
parametric data analysis. Optimal cut-off levels for differentiating
between groups were determined by receiver operator character-
istics (ROC) curve analysis, based on the highest likelihood ratio.
The predictive abilities of combinations of analytes for the
different M.tb infection and disease states were estimated by
performing best subsets general discriminant analysis (GDA), with
leave-one-out cross validation [20]. Differences between groups
were considered significant if p values were #0.05. The data were
analysed using the Statistica software (Statsoft, Ohio, USA) and
GraphPad Prism, version 5.00 for Windows (GraphPad Software,
San Diego, CA, USA).
Results
A total of 76 children, 19 with culture confirmed TB disease and
57 without were included. Using the manufacturer’s recommend-
ed definition for QFT-IT, with a cut-off value of 0.35 IU/ml, 15/
19 (78.9%) of the children with TB and 26/57 (45.6%) of those
without TB were positive for M.tb infection. The mean age (6SD)
of study participants was 37.6633.1 months; 22 (29%) were HIV-
infected. The clinical and demographic characteristics of study
participants are shown in Table 1.
Utility of Host Markers in the Diagnosis of TB DiseaseThe concentrations of the markers in the supernatants harvested
from the unstimulated (nil) and the TB-specific antigen QFT-IT
tubes from children with culture confirmed TB disease (n = 19)
were compared with the levels in the 57 without TB disease
(45.6% of whom were infected). The unstimulated (N), antigen
stimulated (Ag) and the antigen specific responses of each marker,
obtained by subtraction of the unstimulated levels from the antigen
stimulated responses (Ag-N, with the exception of IP-10), were
analysed as separate variables in order to evaluate the contribution
of unstimulated marker levels to the diagnosis of disease.
Unstimulated IP-10 responses were also included in the analysis
as these levels were within the measurable range of the standard
curve (up to 20000 pg/ml taking into account the dilution factor)
in all study participants. Of the 12 markers evaluated, the median
unstimulated, antigen stimulated, or antigen-specific levels of seven
(IFN-a2, IL-1Ra, IP-10, sCD40L, VEGF, MCP-3, IFN-c) wereeither significantly different between the two groups or showed
trends (Table 2): the unstimulated levels of IFN-a2 and IL-1Ra
were significantly higher (p,0.05) in children without TB disease,
while the median unstimulated levels of IP-10 and sCD40L were
significantly higher in those with disease, with the difference in the
unstimulated levels of VEGF (higher in TB) and MCP-3 (higher in
non-TB) showing a trend towards significance (p = 0.06 and 0.07
respectively) (Table 2). When the TB antigen-specific marker
responses were calculated by subtraction of the respective
unstimulated control levels, only the median levels of VEGF and
IFN-c were significantly different between the TB and non-TB
groups, with the levels of sCD40L showing a trend towards
significance (0.05,p#0.08) (Table 2). The median levels of all the
markers investigated, in the children with TB disease, those with
QFT-IT positive results but without TB disease, and the M.tb
uninfected children is shown in Table S1.
When the diagnostic accuracy of the markers was investigated
by receiver operator characteristics (ROC) curve analysis, the
markers that showed promise as diagnostic candidates as
determined by area under the ROC curve (AUC) $0.70
[20,33], included the unstimulated levels of IFN-a2, the
unstimulated levels of IL-1Ra, the unstimulated levels of sCD40L,
the antigen stimulated levels of sCD40L, VEGF, and the antigen-
specific levels of VEGF (Table 2). When the cut-off value with the
highest likelihood ratio was selected, the sensitivity of IFN-a2 (N),
VEGF (Ag) and VEGF (Ag-N) were all $84.0%, while specificity
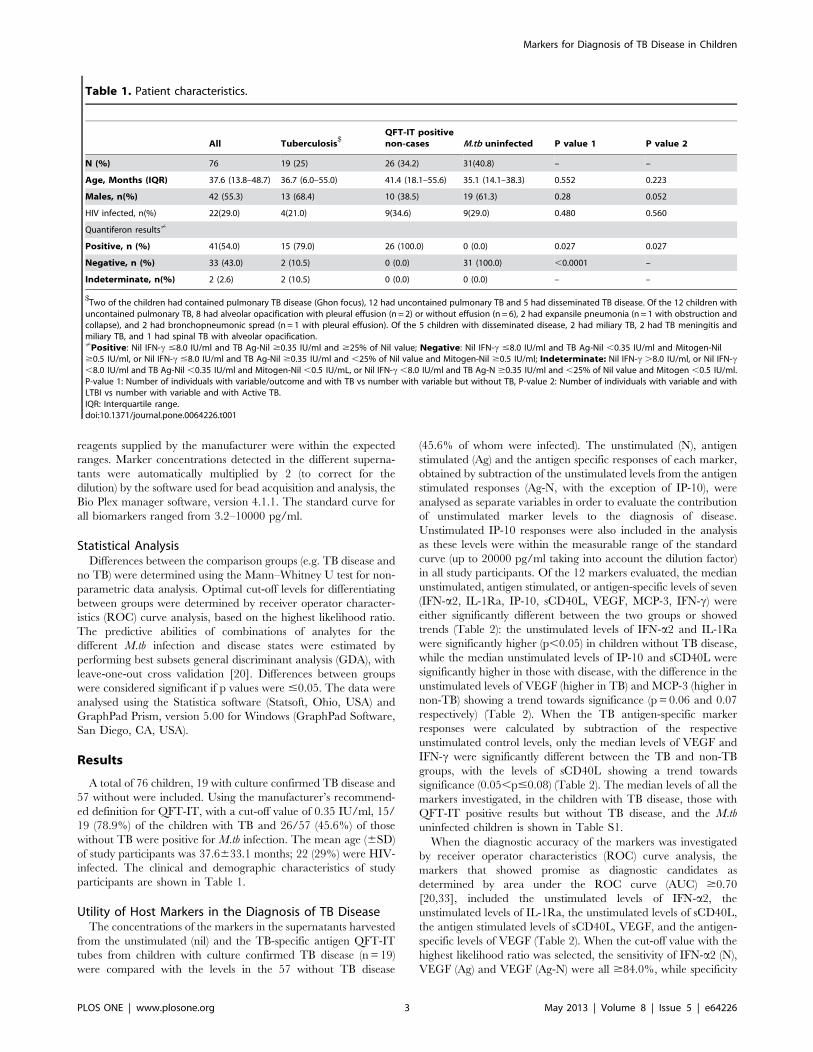
Table 1. Patient characteristics.
All Tuberculosis$
QFT-IT positivenon-cases M.tb uninfected P value 1 P value 2
N (%) 76 19 (25) 26 (34.2) 31(40.8) – –
Age, Months (IQR) 37.6 (13.8–48.7) 36.7 (6.0–55.0) 41.4 (18.1–55.6) 35.1 (14.1–38.3) 0.552 0.223
Males, n(%) 42 (55.3) 13 (68.4) 10 (38.5) 19 (61.3) 0.28 0.052
HIV infected, n(%) 22(29.0) 4(21.0) 9(34.6) 9(29.0) 0.480 0.560
Quantiferon results?
Positive, n (%) 41(54.0) 15 (79.0) 26 (100.0) 0 (0.0) 0.027 0.027
Negative, n (%) 33 (43.0) 2 (10.5) 0 (0.0) 31 (100.0) ,0.0001 –
Indeterminate, n(%) 2 (2.6) 2 (10.5) 0 (0.0) 0 (0.0) – –
$Two of the children had contained pulmonary TB disease (Ghon focus), 12 had uncontained pulmonary TB and 5 had disseminated TB disease. Of the 12 children withuncontained pulmonary TB, 8 had alveolar opacification with pleural effusion (n = 2) or without effusion (n = 6), 2 had expansile pneumonia (n = 1 with obstruction andcollapse), and 2 had bronchopneumonic spread (n = 1 with pleural effusion). Of the 5 children with disseminated disease, 2 had miliary TB, 2 had TB meningitis andmiliary TB, and 1 had spinal TB with alveolar opacification.?Positive: Nil IFN-c #8.0 IU/ml and TB Ag-Nil $0.35 IU/ml and $25% of Nil value; Negative: Nil IFN-c #8.0 IU/ml and TB Ag-Nil ,0.35 IU/ml and Mitogen-Nil$0.5 IU/ml, or Nil IFN-c #8.0 IU/ml and TB Ag-Nil $0.35 IU/ml and ,25% of Nil value and Mitogen-Nil $0.5 IU/ml; Indeterminate: Nil IFN-c .8.0 IU/ml, or Nil IFN-c,8.0 IU/ml and TB Ag-Nil ,0.35 IU/ml and Mitogen-Nil ,0.5 IU/mL, or Nil IFN-c ,8.0 IU/ml and TB Ag-N $0.35 IU/ml and ,25% of Nil value and Mitogen ,0.5 IU/ml.P-value 1: Number of individuals with variable/outcome and with TB vs number with variable but without TB, P-value 2: Number of individuals with variable and withLTBI vs number with variable and with Active TB.IQR: Interquartile range.doi:10.1371/journal.pone.0064226.t001
Markers for Diagnosis of TB Disease in Children
PLOS ONE | www.plosone.org 3 May 2013 | Volume 8 | Issue 5 | e64226

was only between 52.6% and 68.4%. IL-1Ra (N), sCD40L (N) and
sCD40L (Ag) all predicted TB disease with sensitivity #53% but
with specificity $93.0% (Table 2).
When the median levels of markers obtained in the children
with TB disease were compared to levels obtained in non-diseased
children but restricting the analysis to HIV-uninfected children (15
children with TB disease and 39 without TB disease), significant
differences or trends were observed for the unstimulated, antigen
stimulated or antigen-specific levels of eight of the 12 markers
investigated (IFN-a2, IL-1Ra, IP-10, sCD40L, VEGF, IFN-c,EGF and IL-1a) (Table S2). After ROC analysis, AUC was $0.70
for IFN-a2 (N), IFN-a2 (Ag), IL-1Ra (N), VEGF (N), VEGF (Ag),
VEGF (Ag-N) and IFN-c (Ag-N) (Table S2). Although these
markers detected TB disease with sensitivity up to 88.0% and
specificity up to 97% at the cut-off values with the highest
likelihood ratio, only VEGF (N, Ag and Ag-N) ascertained TB
disease with both sensitivity and specificity .75% (Table S2).
To investigate whether the diagnostic accuracy of the markers
could be improved if used in combination, data for all participants
(irrespective of HIV status) were fitted into general discriminant
analysis (GDA) models. Similarly to the univariate analysis, the
unstimulated (N), antigen stimulated (Ag) and the antigen-specific
responses (Ag-N) of all markers were considered as separate
variables, to determine the contribution of unstimulated marker
levels in models. Optimal prediction of TB or no TB disease was
achieved when analytes were used in combinations of four
(Table 3). Although 86% of the non TB cases could be accurately
predicted when IP-10 (N), MCP-3 (Ag), sCD40L(Ag) and IFN-c(Ag-N) responses were combined, only 68% of the TB cases could
be accurately predicted by combining any four markers after
leave-one-out cross validation (Table 3). When the data was
trimmed using a statistical procedure in which the influence of
outliers on the data is scaled down, before analysis, there was an
increase in the predictive abilities of the 4-analyte models (Table
S3), with the three most accurate models comprising of four-
analyte combinations between IL-1Ra (N), IL-1a (N), IP-10(N),
sCD40L(Ag), TNF-a(N), TGF-a (Ag-N) and IFN-a2 (Ag),
accurately predicting up to 84% (48/57) of the non TB cases
and up to 84.2% (16/19) of the TB cases after leave-one-out cross
validation (Table S3). The most frequently occurring analytes in
the top 20 GDA models that accurately classified participants as
TB disease or no TB disease in the raw untrimmed data included
IP-10 (N), sCD40L (Ag) and IFN-c (Ag-N), while the most
frequent analytes in the top 20 models generated from the
trimmed data included IL-1Ra (N), IP-10 (N) and sCD40L (Ag)
(Figure 1).
Utility of the Markers Investigated in Discriminatingbetween LTBI and Active TB Disease in QuantiferonPositive ChildrenSome of the markers investigated in this study such as EGF,
MIP-1b, IL-1a, TGF-a, sCD40L and VEGF, were shown to have
potential in discriminating between M.tb infection and active TB
disease in adults in a previous study conducted in the same setting
[20]. To investigate the potential utility of these markers in
children, the levels obtained in QFT-IT positive non TB cases
(N= 26) were compared to the levels in the QFT-IT positive
children with TB disease (N= 15), regardless of HIV status. When
analysis was performed in all the 41 QFT-IT positive study
participants, the Mann Whitney U test showed significant
differences or trends for the unstimulated, antigen stimulated or
antigen-specific levels of six of the 12 markers evaluated, namely
Table 2. Median levels of analytes (pg/ml) and ranges (in parenthesis), and accuracies in the diagnosis of TB disease in all studyparticipants.
Marker$
No TB (n=57) TB disease (n =19) P-value AUC (95% CI)Cut-offvalue
Sensitivity, %(95% CI)
Specificity,% (95%CI)
IFN-a2N 5.8 (0.0–299.4) 0.0 (0.0–109.8) 0.005 0.70 (0.57–0.83) ,5.0 89.5 (66.9–98.7) 52.6 (39.0–66.0)
IFN-a2Ag 5.8 (0.0–269.4) 0.0 (0.0–133.2) 0.012 0.68 (0.55–0.81) ,4.7 84.2 (60.4–96.6) 52.6 (39.0–66.0)
IL-1raN 187.9 (0.0–4991.4) 63.4 (0.0–717.0) 0.01 0.70 (0.55–0.84) ,11.8 26.3 (9.1–51.2) 98.2 (90.6–99.9)
IP-10N 3967.0 (474.6–.20000)
7613.0 (1075.0–.20000) 0.03 0.66 (0.52–0.80) .6906 63.2 (38.4–83.7) 75.4 (62.2–85.9)
sCD40LN 4722.2 (1296.0–.20000)
7858.2 (1177.2–.20000)
0.0095 0.70 (0.55–0.84) .10877 42.1 (20.3–66.5) 93.0 (83.0–98.0)
sCD40LAg 3917.3 (1135.0–.20000)
9769.3 (1296.0–.20000)
0.0028 0.73 (0.58–0.89) .9671 52.6 (28.9–75.6) 93.0 (83.0–98.0)
VEGFAg 542.5 (0.0–4134.0) 963.7 (325.4–2637.2) 0.0056 0.71 (0.60–0.82) .809.3 84.2 (60.4–96.6) 66.7 (52.9–78.6)
VEGFAg-N 0.0 (0.0–3721.4) 302.4 (0–2000.0) 0.0065 0.71 (0.59–0.83) .32.0 84.2 (60.4–96.2) 68.4 (54.8–80.1)
IFN-gAg-N¡ 13.1 (0–8774.9) 170.4 (0.0–9383.4) 0.02 0.68 (0.55–0.81) .2587 26.3 (9.1–51.2) 98.3 (90.6–99.9)
MCP-3N 3185.0 (258.3–.20000)
2085.0 (319.8–.20000) 0.08 0.63 (0.49–0.78) ,640.9 26.3 (9.1–51.2) 94.7 (85.4–98.9)
sCD40LAg-N 0.0 (0.0–50.5) 1147.2 (0.0–9699.6) 0.08 0.63 (0.46–0.81) .2977 36.8 (16.3–61.6) 94.7 (85.4–98.9)
VEGFN 458.2 (0.0–3966.4) 727.5 (0.0–1011.7) 0.06 0.65 (0.52–0.77) .625.2 83.3 (58.6–96.4) 61.4(47.6–74.0)
IFN-gAg 32.8 (0.0–8774.9) 170.4 (0.0–9383.4) 0.08 63 (0.48–0.78) .2623 26.3 (9.1–51.2) 98.3 (90.6–99.9)
Participants were not stratified according to Quantiferon results or HIV status prior to analysis. All analytes that showed significant differences (P,0.05) or trendsaccording to the Mann Whitney U test are shown. Analytes that discriminated between TB disease and no TB disease with AUC $0.70 after ROC analysis are highlightedin bold. Cut-off values were determined based on the highest likelihood ratio. Sensitivity and specificity are expressed as a percentage. AUC=Area under the ROC curve,95% CI = 95% confidence interval.$N=unstimulated marker levels, Ag =Antigen stimulated levels, Ag-N = the difference between the antigen stimulated and the unstimulated responses; ¡At the cut-offvalue used in the QFT-IT test (0.35 IU/ml = 14 pg/ml [60]), the sensitivity of IFN-c for TB disease was 79.0 (54.4–93.9) and specificity was 50.9 (37.3–64.4).doi:10.1371/journal.pone.0064226.t002
Markers for Diagnosis of TB Disease in Children
PLOS ONE | www.plosone.org 4 May 2013 | Volume 8 | Issue 5 | e64226

EGF, IFN-a2, IL-1Ra, IP-10, sCD40L and VEGF. The median
unstimulated levels of IL-1Ra were significantly higher in the M.tb
infected children while the median unstimulated levels of IP-10
(N), EGF (Ag) and VEGF (Ag-N) were significantly higher in the
TB cases (Table 4). After ROC analysis, AUC was $0.70 only for
IL-1Ra (N), IP-10 (N) and VEGF (Ag-N) levels (Table 4). With the
exception of IL-1Ra (N) levels, all the markers with AUC $0.70
discriminated between M.tb infection and active TB disease with
both sensitivity and specificity $73.0% using the cut-off values
selected according to the highest likelihood ratio (Table 4). The
median levels of all the markers investigated, in the children with
TB disease, those with LTBI and the M.tb un-infected children is
shown in Table S1.
When the accuracies of the markers in discriminating between
TB disease and infection was assessed only in HIV-uninfected
children (17 QFT-IT positive children without disease and 12
QFT-IT positive children with disease), the unstimulated, antigen
stimulated or antigen-specific levels of 5 markers (IFN-a2, IL-1Ra,VEGF, IP-10 and IFN-c) showed significant differences or trends
between the two groups (Table S4). IFN-a2 (N) and IL-1Ra (N)
levels were significantly higher in children with TB infection,
whereas IFN-c (N), IP-10 (N), VEGF (N, Ag and Ag-N) levels were
significantly higher in the children with TB disease (Table S4).
After ROC analysis, AUC was $0.72 for all the markers with
significant Mann Whitney U test p values between groups.
Although VEGF (N) levels discriminated between TB disease and
LTBI with a sensitivity of 100%, specificity was only 77% at the
selected cut-off value and only IP-10(N), VEGF(N), VEGF(Ag) and
VEGF(Ag-N) discriminated between TB disease andM.tb infection
with both sensitivity and specificity $70.0% (Table S4).
When the predictive abilities of combinations of analytes for
discriminating between TB disease and M.tb infection were
assessed by GDA, different 5-analyte combinations predicted up
to 81% (21/26) of theM.tb infected cases and up to 80% (12/15) of
the children with active TB disease after leave-one-out cross
validation (Table 5). The predictive accuracy of the marker models
increased by using the data trimming procedure for outliers.
Different 5-analyte combinations of EGF (Ag), IL-1Ra (N), IP-10
(N), TGF-a (Ag), IL-1a (N), sCD40L (Ag) and IFN-a2 (Ag-N),
accurately predicted up to 84.6% (22/26) of the latently infected
children and up to 86.7% (13/15) of the QFT-IT positive children
with TB disease after leave-one-out cross validation (Table S5).
The most frequently occurring analytes in the top 20 GDA models
that best predicted infection or TB disease using the raw
untrimmed data included IP-10 (N), TNF-a (N) and EGF (Ag)
while the most frequently occurring analytes in the top 20 models
generated with the trimmed data included IL-1Ra (N), IP-10(N),
EGF (Ag) and sCD40L (Ag) (Figure 2).
Figure 1. Frequency of analytes in the top 20 GDA models that most accurately classified all study participants into respectivegroups. Participants were not stratified according to HIV infection status or Quantiferon results prior to analysis of the data. The columns representthe number of times each analyte was included into the top 20 discriminatory models. A = frequency of analytes in the models generated with rawuntrimmed data, B = frequency of analytes in models generated after data was trimmed to scale-down the influence of outliers.doi:10.1371/journal.pone.0064226.g001
Markers for Diagnosis of TB Disease in Children
PLOS ONE | www.plosone.org 5 May 2013 | Volume 8 | Issue 5 | e64226
Discussion
We investigated the diagnostic potential of 12 host markers,
detectable in stimulated and unstimulated QFT-IT supernatants,
for the diagnosis of TB disease and for discriminating between
M.tb infection and active TB in 76 children, 22 (29.0%) of whom
were HIV-infected. The most promising markers for discriminat-
ing between TB disease and no disease in all study participants,
regardless of HIV infection status, included IFN-a2 (N and Ag),
IL-1Ra (N), sCD40L (N and Ag) and VEGF (N, Ag and Ag-N),
whereas IL-1Ra (N), IP-10 (N), and VEGF(Ag-N), showed the
most potential in discriminating between M.tb infection and active
TB. The diagnostic accuracy of the markers increased when
markers were used in combinations.
IFN-c is essential for the control of intracellular pathogens
including M.tb [34] and it is therefore one of the first markers
investigated in most T cell based studies. Although IFN-c based
assays (IGRAs) are now standard for diagnosing M.tb infection in
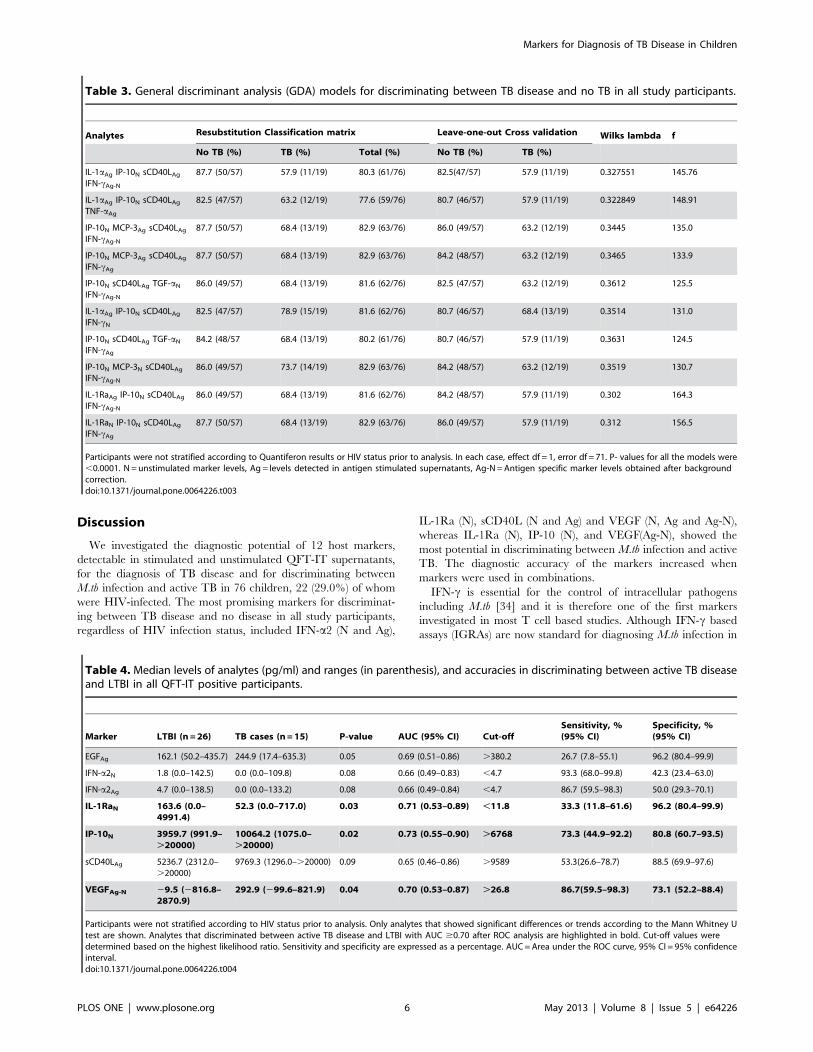
Table 3. General discriminant analysis (GDA) models for discriminating between TB disease and no TB in all study participants.
Analytes Resubstitution Classification matrix Leave-one-out Cross validation Wilks lambda f
No TB (%) TB (%) Total (%) No TB (%) TB (%)
IL-1aAg IP-10N sCD40LAgIFN-cAg-N
87.7 (50/57) 57.9 (11/19) 80.3 (61/76) 82.5(47/57) 57.9 (11/19) 0.327551 145.76
IL-1aAg IP-10N sCD40LAgTNF-aAg
82.5 (47/57) 63.2 (12/19) 77.6 (59/76) 80.7 (46/57) 57.9 (11/19) 0.322849 148.91
IP-10N MCP-3Ag sCD40LAgIFN-cAg-N
87.7 (50/57) 68.4 (13/19) 82.9 (63/76) 86.0 (49/57) 63.2 (12/19) 0.3445 135.0
IP-10N MCP-3Ag sCD40LAgIFN-cAg
87.7 (50/57) 68.4 (13/19) 82.9 (63/76) 84.2 (48/57) 63.2 (12/19) 0.3465 133.9
IP-10N sCD40LAg TGF-aNIFN-cAg-N
86.0 (49/57) 68.4 (13/19) 81.6 (62/76) 82.5 (47/57) 63.2 (12/19) 0.3612 125.5
IL-1aAg IP-10N sCD40LAgIFN-cN
82.5 (47/57) 78.9 (15/19) 81.6 (62/76) 80.7 (46/57) 68.4 (13/19) 0.3514 131.0
IP-10N sCD40LAg TGF-aNIFN-cAg
84.2 (48/57 68.4 (13/19) 80.2 (61/76) 80.7 (46/57) 57.9 (11/19) 0.3631 124.5
IP-10N MCP-3N sCD40LAgIFN-cAg-N
86.0 (49/57) 73.7 (14/19) 82.9 (63/76) 84.2 (48/57) 63.2 (12/19) 0.3519 130.7
IL-1RaAg IP-10N sCD40LAgIFN-cAg-N
86.0 (49/57) 68.4 (13/19) 81.6 (62/76) 84.2 (48/57) 57.9 (11/19) 0.302 164.3
IL-1RaN IP-10N sCD40LAgIFN-cAg
87.7 (50/57) 68.4 (13/19) 82.9 (63/76) 86.0 (49/57) 57.9 (11/19) 0.312 156.5
Participants were not stratified according to Quantiferon results or HIV status prior to analysis. In each case, effect df = 1, error df = 71. P- values for all the models were,0.0001. N =unstimulated marker levels, Ag = levels detected in antigen stimulated supernatants, Ag-N=Antigen specific marker levels obtained after backgroundcorrection.doi:10.1371/journal.pone.0064226.t003
Table 4. Median levels of analytes (pg/ml) and ranges (in parenthesis), and accuracies in discriminating between active TB diseaseand LTBI in all QFT-IT positive participants.
Marker LTBI (n =26) TB cases (n=15) P-value AUC (95% CI) Cut-offSensitivity, %(95% CI)
Specificity, %(95% CI)
EGFAg 162.1 (50.2–435.7) 244.9 (17.4–635.3) 0.05 0.69 (0.51–0.86) .380.2 26.7 (7.8–55.1) 96.2 (80.4–99.9)
IFN-a2N 1.8 (0.0–142.5) 0.0 (0.0–109.8) 0.08 0.66 (0.49–0.83) ,4.7 93.3 (68.0–99.8) 42.3 (23.4–63.0)
IFN-a2Ag 4.7 (0.0–138.5) 0.0 (0.0–133.2) 0.08 0.66 (0.49–0.84) ,4.7 86.7 (59.5–98.3) 50.0 (29.3–70.1)
IL-1RaN 163.6 (0.0–4991.4)
52.3 (0.0–717.0) 0.03 0.71 (0.53–0.89) ,11.8 33.3 (11.8–61.6) 96.2 (80.4–99.9)
IP-10N 3959.7 (991.9–.20000)
10064.2 (1075.0–.20000)
0.02 0.73 (0.55–0.90) .6768 73.3 (44.9–92.2) 80.8 (60.7–93.5)
sCD40LAg 5236.7 (2312.0–.20000)
9769.3 (1296.0–.20000) 0.09 0.65 (0.46–0.86) .9589 53.3(26.6–78.7) 88.5 (69.9–97.6)
VEGFAg-N 29.5 (2816.8–2870.9)
292.9 (299.6–821.9) 0.04 0.70 (0.53–0.87) .26.8 86.7(59.5–98.3) 73.1 (52.2–88.4)
Participants were not stratified according to HIV status prior to analysis. Only analytes that showed significant differences or trends according to the Mann Whitney Utest are shown. Analytes that discriminated between active TB disease and LTBI with AUC $0.70 after ROC analysis are highlighted in bold. Cut-off values weredetermined based on the highest likelihood ratio. Sensitivity and specificity are expressed as a percentage. AUC=Area under the ROC curve, 95% CI = 95% confidenceinterval.doi:10.1371/journal.pone.0064226.t004
Markers for Diagnosis of TB Disease in Children
PLOS ONE | www.plosone.org 6 May 2013 | Volume 8 | Issue 5 | e64226

some settings [10], these assays do not discriminate between active
TB disease and M.tb infection [11]. However, ESAT-6 and CFP-
10, the main antigens used in these tests, are among the most
immunogenic and specific M.tb antigens known, even though they
are also expressed in some non-tuberculous mycobacteria [35].
The high immunogenicity and relatively high specificity of these
Figure 2. Frequency of analytes in the top 20 GDA models that most accurately classified the Quantiferon positive participants asTB disease (n=15) or LTBI (n=39). Participants were not stratified according to HIV infection status prior to analysis of the data. The columnsrepresent the number of times each analyte was included into the top 20 discriminatory models. A = frequency of analytes in the models generatedwith raw untrimmed data, B = frequency of analytes in models generated after data was trimmed to scale-down the influence of outliers.doi:10.1371/journal.pone.0064226.g002
Table 5. General discriminant analysis (GDA) models for discriminating between LTBI and active TB disease.
Analytes Resubstitution Classification matrix Leave-one-out Cross validation Wilks lambda f
No TB (%) TB (%) Total (%) No TB (%) TB (%)
EGFAg IL-1RaN IP-10N MCP-3N TNF-aN 80.8 (21/26) 80.0 (12/15) 80.5 (33/41) 80.8 (21/26) 80.0 (12/15) 0.319 74.5
EGFAg IL-1aN IP-10N MCP-3N TNF-aN 88.5 (23/26) 80.0 (12/15) 85.4 (35/41) 80.8 (21/26) 73.3 (11/15) 0.316 75.9
EGFN IL-1aN IP-10N MCP-3N TNF-aN 80.8 (21/26) 86.7 (13/15) 82.9 (34/41) 80.8 (21/26) 80.0 (12/15) 0.364 61.0
EGFAg IP-10N sCD40LN TNF-aNTGF-aN
76.9 (20/26) 80.0 (12/15) 78.0 (32/41) 73.1 (19/26) 73.3 (11/15) 0.355 63.4
EGFAg IL-1aN IP-10N TGF-aN TNF-aN 80.8 (21/26) 86.7 (13/15) 82.9 (34/41) 76.9 (20/26) 80.0 (12/15) 0.350 64.9
EGFAg IL-1aN IP-10N TNF-aN IFN-cN 92.3 (24/26) 73.3 (11/15) 85.4 (35/41) 76.9 (20/26) 73.3 (11/15) 0.317 75.4
EGFN IL-1RaN IP-10N TNF-aN MCP-3N 76.9 (20/26) 86.7(13/15) 80.5 (33/41) 76.9 (20/26) 73.3 (11/15) 0.378 57.6
Participants were not stratified according to HIV status prior to data analysis. In each case, effect df = 1, error df = 32. P- values for all the models were ,0.0001.N = unstimulated marker levels, Ag = levels detected in antigen stimulated supernatant, Ag-N =Antigen specific marker levels obtained after background correction.doi:10.1371/journal.pone.0064226.t005
Markers for Diagnosis of TB Disease in Children
PLOS ONE | www.plosone.org 7 May 2013 | Volume 8 | Issue 5 | e64226
antigens for M.tb, coupled with the well-established IGRA
(especially QFT-IT) platform have contributed to the recent focus
on identifying host markers other than IFN-c, which could
discriminate between different M.tb infection states in supernatants
after stimulation with these antigens. Our work so far indicates
that such discriminatory markers may not only be detectable in
antigen stimulated, but also in unstimulated supernatants.
The unstimulated, antigen stimulated or antigen-specific levels
of 8 of the 12 markers evaluated in the current study (IFN-a2, IL-1Ra, IP-10, sCD40L, IFN-c, VEGF, TGF-a and EGF), were
different between children with TB disease and those without
disease, and/or between the QFT-IT positive children with
disease and those without, irrespective of HIV infection. IFN-a2 is
an inflammatory protein that is induced in dendritic cells and
monocytes upon infection with M.tb [36] and is released by the
host as a danger signal, thereby favouring the differentiation of
monocytes into dendritic cells [37]. It enhances the production of
IP-10, a key chemokine involved in the trafficking of effector TH1
cells to inflammatory sites in vivo [38], by antigen presenting cells
[36]. IL-1Ra is an anti-inflammatory protein secreted by various
immune cell types including epithelial cells, adipocytes, stromal
cells, keratinocytes and hepatocytes. Its levels are elevated in many
inflammatory and infectious diseases including TB, and serum
levels decline with treatment [39]; its main role is the competitive
inhibition of the inflammatory effects of IL-1a and IL-1b [40,41].
EGF, VEGF and TGF-a are growth factors abundant in
pulmonary TB granulomas, including areas of caseous necrosis,
and provide good growth environments for mycobacteria [42,43].
VEGF has been associated with disease activity in both pleural TB
and TB meningitis [44,45] and levels decline after successful TB
treatment [46]. CD40L is a co-stimulatory molecule that is
expressed on activated CD4+ T cells, and is involved in their
activation and development of effector functions [47]. Higher
plasma levels of sCD40L have been observed in patients with
cavitary TB lesions compared to those without such lesions [48]
and the interaction of the CD40-CD40L axis with IFN-c is
important in the generation of giant cells needed for protection in
TB and sarcoidosis [49]. All these host markers have previously
been evaluated in QFT-IT supernatants and shown to be
potentially useful for use singly or in combination with IFN-c for
diagnosing M.tb infection (especially IP-10 and TNF-a)[17,18,27,50,51], or for discriminating between TB disease and
LTBI (IP-10, TNF-a, EGF, TGF-a, and VEGF) [16,19,20,28].
Although our findings agree with some of these previous
observations, direct comparison of the performances of markers
between studies remains difficult because of the different
combinations investigated in different studies. In addition, most
published studies involved adult participants, and study designs
and populations are highly variable.
Kellar et al [18] observed high antigen-specific levels of IFN-c,IP-10, TNF-a, MIP-1b, MCP-1, IL-2, IL-6 and IL-8 in QFT-IT
supernatants from culture confirmed TB cases compared to
controls at low risk of infection. The study did not discriminate
between TB disease and LTBI. We also observed higher levels of
IFN-c, IP-10 and TNF-a in children with TB disease in the
present study; the levels of IL-2, IL-6, IL-8 and MCP-1 were not
investigated. There were no significant differences in the levels of
MIP-1b and TNF-a between children with TB disease and those
without active TB disease (LTBI and uninfected children
combined), or between latent M.tb infection and active TB disease
in this study. However, significant differences were observed when
the antigen-specific levels of MIP-1b obtained in the children with
active disease or LTBI, were compared to the levels obtained in
the uninfected children, therefore agreeing with the observations
of Kellar et al for MIP-1b. Although IL-15 and MCP-1 together
were the most useful markers for discriminating between TB
disease and LTBI, in a study conducted by Frahm et al [17], other
markers (IL-1Ra, IFN-a, and IL-4) also showed differences
between groups but had limited clinical utility. We found IL-
1Ra and IFN-a2 to be amongst the most potentially useful
markers for ascertaining TB disease and discriminating between
M.tb infection and active TB, with higher levels in the children
without active TB disease. These observations agree with the study
by Frahm et al [17]. Our study population consisted of young
children and comparison with adult studies might not be
appropriate given that the levels of biomarkers in QFT-IT
supernatants have been shown to be different even amongst
children of different age groups within the same cohorts [52] and
there are vast differences in the immune responses between
children and adults. For paediatric studies in which the levels of
multiple host markers in QFT-IT supernatants were investigated,
similar variations in results have been obtained as observed in
adults.
All the markers investigated in the present study were amongst
the 29 host markers previously evaluated in QFT-IT supernatants
from children in a low TB endemic environment [52]. The one
marker that showed differences between LTBI and active TB, IL-
2, was not available in the panel investigated in our study. Among
the common markers between the current and adult studies
conducted in the same community [20,33], only sCD40L and
VEGF responses were promising in univariate analysis in this
study (AUC$0.70), together with novel markers (IFN-a2, IL-
1Ra). However, TGF-a, TNF-a and IL-1a each featured in at
least one of the top 20 GDA models that accurately classified
$80% of all enrolled. Larger studies may help to better
understand the significance of these markers in children, and
explain the differences observed compared to adults. For example,
age-related developmental changes in the immune system may
play a role and can only be explored in large paediatric studies
encompassing a wide age-range. In addition, we did not examine
disease severity as a covariate given our limited sample size. The
influence of disease severity and other factors which might
contribute to findings and which were not investigated in this
preliminary study, including the nutritional status of the infant, the
timing of presentation and the age of the child should be taken into
account in future, larger studies.
Of the 76 children included in our study, 29% were HIV
infected. Some of the markers that showed potential in HIV-
uninfected adults (EGF and IL-1a) [20], showed similar differences
only when analysis was performed in HIV-uninfected children.
This might suggest that the performance of at least EGF and IL-1amight be influenced by HIV co-infection. However, because only
4 of the 19 children with TB disease were co-infected witih HIV in
this study, we cannot draw strong conclusions on the possible
influence of HIV on the performance of the markers. HIV co-
infection is common among TB cases in our setting and may
complicate diagnosis. It will be important to investigate the
influence of HIV on the performance of the markers in future
larger studies, especially if the promising accuracy of these markers
is maintained in validation studies. More data on the potential
markers identified in QFT-IT supernatants to date, especially in
children of different age-groups and with different spectrum of
disease, is necessary, as there is an urgent need for diagnostic tests
tailored for use in this high-risk and diverse patient group. New
studies may also help make sense of the inconsistent results
obtained in the studies published so far, given the large numbers of
markers that are often evaluated and the small study participant
numbers.
Markers for Diagnosis of TB Disease in Children
PLOS ONE | www.plosone.org 8 May 2013 | Volume 8 | Issue 5 | e64226
IGRAs remain well-established for the diagnosis of M.tb
infection. There is evidence that IP-10 measurement in QFT-IT
supernatants may perform similarly or even better [50,53].
However, diagnostic tests which can discriminate accurately
between LTBI and active TB will be valuable in settings with a
high proportion of latently infected individuals and limited
resources [54]. Novel markers with discriminatory potential
between M.tb infection and disease could be investigated directly
in culture supernatants after overnight incubation of QFT-IT
tubes, or used as a rule-in test after IFN-c or IP-10 detection. In
the present study, unstimulated IP-10 levels showed potential in
discriminating between active TB and latent infection. We could
not assess antigen-specific IP-10 levels because the levels of IP-10
elicited upon stimulation with antigen were above the range of
detection of the standard curve in most of the study participants.
However other investigators have shown that antigen-specific
levels of IP-10 (Ag-N) are not useful in discriminating between
M.tb infection and active disease both in adults [20,55,56] and
children [27,51]. In the present study, higher unstimulated levels
of IP-10 were observed in the children with TB disease and this is
contrary to what was observed for instance, in the studies by
Whittaker et al. [27] and Wang et al. [57]. The reasons for this
discrepancy in background levels is unknown, but at least, 25% of
the TB cases elicited IP-10 levels which were in the detectable
range of the standard curve, compared to the LTBI cases in whom
antigen stimulated levels were above the range of the curve in 92%
(24/26) of the children investigated (Table S1). This might suggest
that the IP-10Ag and IP-10Ag-N levels obtained in this study
might have indeed been higher in the LTBI cases as observed in
these previous studies.
The most accurate single marker for discriminating between TB
disease and no disease or M.tb infection and active disease in this
study (VEGF), has previously been shown to be potentially useful
in serum samples [46]. Future studies should investigate models
based on unstimulated, antigen stimulated or antigen-specific
responses to determine the best marker/model and under what
stimulation condition (unstimulated, antigen stimulated (Ag) or
antigen-specific responses (Ag-N)) might be most useful. Any
unstimulated marker levels shown to be useful for diagnostic
purposes either singly or in combination with other markers or
clinical information could be measured directly in serum or
plasma, but studies comparing the levels of the marker in these
sample types would have to be performed first. Ultimately,
immunological biomarker tests will have greatest impact if
incorporated into rapid, easy-to-use test platforms such as the
lateral flow technology.
The main limitations of our study include the relatively small
sample size and the case-control design. It is possible that we might
have reported a significant finding which occurred by chance,
given that 12 host markers were evaluated. Such a risk occurs in all
large biomarker discovery studies regardless of the discovery
platform used. A corrective measure that is usually employed
during statistical analysis to limit this risk is the correction for
multiple comparisons. The main analytical procedure employed in
this study was ROC analysis, a method in which no hypothesis
testing is done, and decisions resulting from likelihood ratios [58].
Not correcting for multiple comparisons however, may be a
concern in GDA as the best subsets method (used in evaluating
marker combinations in this study) does generate different analyte
combinations. This also, is not a major concern as the focus of this
manuscript was not on p-values for a specific combination of
analytes but on which analytes occurred most frequently in the
multi-marker models.
Future studies should evaluate the host markers in children and
adults who are immuno-compromised, in extrapulmonary TB
cases, and also in individuals with other lung diseases [59].
ConclusionsOur findings indicate that multiple host markers detected in
QFT-IT supernatants, especially IFN-a2, IL-1Ra, sCD40L, IP-10
and VEGF, have potential to support the diagnosis of TB disease
or the discrimination between TB disease and LTBI in children.
Our results also indicate that unstimulated host marker levels
might be useful and warrant further investigation in larger
prospective studies.
Supporting Information
Table S1 Median levels (pg/ml) of all host markers(Inter-quartile ranges in parenthesis) in all childrenwith TB diseases, latent M.tb infection or no M.tbinfection and p-values for differences between thegroups. Significant p-values are highlighted in bold. Nd=not
determined, N=unstimulated marker levels, Ag= levels detected
in antigen stimulated supernatant, Ag-N=Antigen-specific marker
levels obtained after background correction.
(DOCX)
Table S2 Median levels of analytes (pg/ml) and ranges(in parenthesis), and accuracies in the diagnosis of TBdisease in HIV uninfected children. Only analytes that
showed significant differences or trends according to the Mann
Whitney U test are shown. Analytes that discriminated between
TB disease and no TB with AUC $0.70 after ROC analysis are
highlighted in bold. Cut-off values were determined based on the
highest likelihood ratio. Sensitivity and specificity are expressed as
a percentage. AUC=Area under the ROC curve, 95% CI= 95%
confidence interval.
(DOCX)
Table S3 General discriminant analysis (GDA) modelsfor discriminating between TB disease and no TB. Theinfluence of outliers was scaled down by trimming the data and the
GDA analysis done in all study participants, regardless of HIV
infection or QFT-IT results. In each case, effect df = 1, error
df = 70. P- values for all the models were ,0.0001. N=un-
stimulated marker levels, Ag= levels detected in antigen stimulated
supernatant, Ag-N=Antigen specific marker levels obtained after
background correction.
(DOCX)
Table S4 Median levels of analytes (pg/ml) and ranges(in parenthesis), and abilities to discriminate betweenTB disease and LTBI in HIV uninfected QFT-IT positivechildren. Only analytes that showed significant differences or
trends according to the Mann Whitney U test are shown. Cut-off
values were determined based on the highest likelihood ratio.
Sensitivity and specificity are expressed as a percentage.
AUC=Area under the ROC curve, 95% CI=95% confidence
interval.
(DOCX)
Table S5 General discriminant analysis (GDA) modelsfor discriminating between TB disease and latent M.tbinfection. The top 20 GDA models after the influence of outliers
was scaled down by trimming of data in all QFT-IT positive study
participants, regardless of HIV infection status are shown. In each
case, effect df = 1, error df = 36. P- values for all the models were
,0.0001, otherwise stated. N=unstimulated marker levels,
Markers for Diagnosis of TB Disease in Children
PLOS ONE | www.plosone.org 9 May 2013 | Volume 8 | Issue 5 | e64226
Ag= levels detected in antigen stimulated supernatant, Ag-
N=Antigen specific marker levels obtained after background
correction, ¡=p value for model was 0.524.
(DOCX)
Acknowledgments
We are grateful to Mrs Belinda Kriel and Miss Angela Menezes for
assistance in performing the QFT-IT experiments.
Author Contributions
Conceived and designed the experiments: NC AD LT AM AH GW.
Performed the experiments: NC LT. Analyzed the data: NC AD LT EW
AM AH GW. Contributed reagents/materials/analysis tools: NC AD AH
GW. Wrote the paper: NC AD LT EW AM AH GW. Approved the final
version: NC AD LT EW AM AH GW.
References
1. Zar HJ, Hanslo D, Apolles P, Swingler G, Hussey G (2005) Induced sputum
versus gastric lavage for microbiological confirmation of pulmonary tuberculosis
in infants and young children: a prospective study. Lancet 365: 130–134.
2. WHO (2011) Automated Real-time Nucleic Acid Amplification Technology for
Rapid and Simultaneous Detection of Tuberculosis and Rifampicin Resistance:
Xpert MTB/RIF System Policy Statement.
3. Nicol MP, Workman L, Isaacs W, Munro J, Black F, et al. (2011) Accuracy of
the Xpert MTB/RIF test for the diagnosis of pulmonary tuberculosis in children
admitted to hospital in Cape Town, South Africa: a descriptive study. Lancet
Infect Dis 11: 819–824.
4. Trebucq A, Enarson DA, Chiang CY, Van DA, Harries AD, et al. (2011)
Xpert((R)) MTB/RIF for national tuberculosis programmes in low-income
countries: when, where and how? Int J Tuberc Lung Dis 15: 1567–1572.
5. Marais BJ, Hesseling AC, Gie RP, Schaaf HS, Enarson DA, et al. (2006) The
bacteriologic yield in children with intrathoracic tuberculosis. Clin Infect Dis 42:
e69–e71.
6. Marais BJ, Rabie H, Cotton MF (2011) TB and HIV in children - advances in
prevention and management. Paediatr Respir Rev 12: 39–45.
7. Hesseling AC, Mandalakas AM, Kirchner HL, Chegou NN, Marais BJ, et al.
(2009) Highly discordant T cell responses in individuals with recent exposure to
household tuberculosis. Thorax 64: 840–846.
8. Mandalakas AM, Hesseling AC, Chegou NN, Kirchner HL, Zhu X, et al. (2008)
High level of discordant IGRA results in HIV-infected adults and children.
Int J Tuberc Lung Dis 12: 417–423.
9. Diel R, Goletti D, Ferrara G, Bothamley G, Cirillo D, et al. (2011) Interferon-
gamma release assays for the diagnosis of latent Mycobacterium tuberculosis
infection: a systematic review and meta-analysis. Eur Respir J 37: 88–99.
10. Mandalakas AM, Detjen AK, Hesseling AC, Benedetti A, Menzies D (2011)
Interferon-gamma release assays and childhood tuberculosis: systematic review
and meta-analysis. Int J Tuberc Lung Dis 15: 1018–1032.
11. World Health Organization and the International Union Against Tuberculosis
and Lung Disease (2010) Guidance for national tuberculosis and HIV
programmes on the management of tuberculosis in HIV-infected children:
Recommendations for a public health approach.
12. Ahmed RK, Rohava Z, Balaji KN, Hoffner SE, Gaines H, et al. (2012) Pattern
recognition and cellular immune responses to novel Mycobacterium tuberculosis-
antigens in individuals from Belarus. BMC Infect Dis 12: 41.
13. Chegou NN, Black GF, Loxton AG, Stanley K, Essone PN, et al. (2012)
Potential of novel Mycobacterium tuberculosis infection phase-dependent antigens in
the diagnosis of TB disease in a high burden setting. BMC Infect Dis 12: 10.
14. Goletti D, Raja A, Syed Ahamed KB, Rodrigues C, Sodha A, et al. (2010) Is IP-
10 an accurate marker for detecting M. tuberculosis-specific response in HIV-
infected persons? PLoS ONE 5: e12577.
15. Sartain MJ, Slayden RA, Singh KK, Laal S, Belisle JT (2006) Disease state
differentiation and identification of tuberculosis biomarkers via native antigen
array profiling. Mol Cell Proteomics 5: 2102–2113.
16. Lu C, Wu J, Wang H, Wang S, Diao N, et al. (2011) Novel biomarkers
distinguishing active tuberculosis from latent infection identified by gene
expression profile of peripheral blood mononuclear cells. PLoS ONE 6: e24290.
17. Frahm M, Goswami ND, Owzar K, Hecker E, Mosher A, et al. (2011)
Discriminating between latent and active tuberculosis with multiple biomarker
responses. Tuberculosis (Edinb ) 91: 250–256.
18. Kellar KL, Gehrke J, Weis SE, Mahmutovic-Mayhew A, Davila B, et al. (2011)
Multiple cytokines are released when blood from patients with tuberculosis is
stimulated with Mycobacterium tuberculosis antigens. PLoS ONE 6: e26545.
19. Sutherland JS, de Jong BC, Jeffries DJ, Adetifa IM, Ota MO (2010) Production
of TNF-alpha, IL-12(p40) and IL-17 can discriminate between active TB disease
and latent infection in a West African cohort. PLoS ONE 5: e12365.
20. Chegou NN, Black GF, Kidd M, van Helden PD, Walzl G (2009) Host markers
in Quantiferon supernatants differentiate active TB from latent TB infection :
preliminary report. BMC Pulm Med 9: 21.
21. Ruhwald M, Bjerregaard-Andersen M, Rabna P, Kofoed K, Eugen-Olsen J, et
al. (2007) CXCL10/IP-10 release is induced by incubation of whole blood from
tuberculosis patients with ESAT-6, CFP10 and TB7.7. Microbes Infect 9: 806–
812.
22. Ruhwald M, Petersen J, Kofoed K, Nakoaka H, Cuevas LE, et al. (2008)
Improving T-Cell Assays for the Diagnosis of Latent TB Infection: Potential of a
diagnostic Test Based on IP-10. Plos One 3: e2858.
23. Ruhwald M, Bodmer T, Maier C, Jepsen M, Haaland MB, et al. (2008)
Evaluating the potential of IP-10 and MCP-2 as biomarkers for the diagnosis oftuberculosis. Eur Respir J 32: 1607–1615.
24. Tanaka T, Sakurada S, Kano K, Takahashi E, Yasuda K, et al. (2011)Identification of tuberculosis-associated proteins in whole blood supernatant.
BMC Infect Dis 11: 71.
25. Rubbo PA, Nagot N, Le Moing V, Brabet M, Bourdin A et al. (2012) Multi-
cytokine detection improves latent tuberculosis diagnosis in healthcare workers. JClin Microbiol. In press.
26. Jones GJ, Pirson C, Hewinson RG, Vordermeier HM (2010) Simultaneousmeasurement of antigen-stimulated interleukin-1 beta and gamma interferon
production enhances test sensitivity for the detection of Mycobacterium bovis
infection in cattle. Clin Vaccine Immunol 17: 1946–1951.
27. Whittaker E, Gordon A, Kampmann B (2008) Is IP-10 a better biomarker for
active and latent tuberculosis in children than IFNgamma? PLoS ONE 3: e3901.
28. Harari A, Rozot V, Enders FB, Perreau M, Stalder JM, et al. (2011) Dominant
TNF-alpha+ Mycobacterium tuberculosis-specific CD4+ T cell responses discrimi-nate between latent infection and active disease. Nat Med 17: 372–376.
29. Webb EA, Hesseling AC, Schaaf HS, Gie RP, Lombard CJ, et al. (2009) Highprevalence of Mycobacterium tuberculosis infection and disease in children and
adolescents with type 1 diabetes mellitus. Int J Tuberc Lung Dis 13: 868–874.
30. Marais BJ, Gie RP, Schaaf HS, Starke JR, Hesseling AC, et al. (2004) A
proposed radiological classification of childhood intra-thoracic tuberculosis.Pediatr Radiol 34: 886–894.
31. Graham SM, Ahmed T, Amanullah F, Browning R, Cardenas V, et al. (2012)Evaluation of tuberculosis diagnostics in children: 1. Proposed clinical case
definitions for classification of intrathoracic tuberculosis disease. Consensus from
an expert panel. J Infect Dis 205 Suppl 2: S199–S208.
32. Detjen AK, Loebenberg L, Grewal HM, Stanley K, Gutschmidt A, et al. (2009)
Short-term reproducibility of a commercial interferon gamma release assay. ClinVaccine Immunol 16: 1170–1175.
33. Chegou NN, Essone PN, Loxton AG, Stanley K, Black GF, et al. (2012)Potential of host markers produced by infection phase-dependent antigen-
stimulated cells for the diagnosis of tuberculosis in a highly endemic area. PLoSONE 7: e38501.
34. Schoenborn JR, Wilson CB (2007) Regulation of interferon-gamma duringinnate and adaptive immune responses. Adv Immunol 96: 41–101.
35. van IJ, de ZR, Dekhuijzen R, Boeree M, van SD (2009) Region of difference 1 innontuberculous Mycobacterium species adds a phylogenetic and taxonomical
character. J Bacteriol 191: 5865–5867.
36. Prabhakar S, Qiao Y, Hoshino Y, Weiden M, Canova A, et al. (2003) Inhibition
of response to alpha interferon by Mycobacterium tuberculosis. Infect Immun 71:
2487–2497.
37. Mariotti S, Teloni R, Iona E, Fattorini L, Romagnoli G, et al. (2004)
Mycobacterium tuberculosis diverts alpha interferon-induced monocyte differentia-tion from dendritic cells into immunoprivileged macrophage-like host cells.
Infect Immun 72: 4385–4392.
38. Dufour JH, Dziejman M, Liu MT, Leung JH, Lane TE, et al. (2002) IFN-
gamma-inducible protein 10 (IP-10; CXCL10)-deficient mice reveal a role forIP-10 in effector T cell generation and trafficking. J Immunol 168: 3195–3204.
39. Juffermans NP, Verbon A, van Deventer SJ, van DH, Speelman P, et al. (1998)Tumor necrosis factor and interleukin-1 inhibitors as markers of disease activity
of tuberculosis. Am J Respir Crit Care Med 157: 1328–1331.
40. Arend WP (2002) The balance between IL-1 and IL-1Ra in disease. Cytokine
Growth Factor Rev 13: 323–340.
41. Perrier S, Darakhshan F, Hajduch E (2006) IL-1 receptor antagonist in
metabolic diseases: Dr Jekyll or Mr Hyde? FEBS Lett 580: 6289–6294.
42. Bermudez LE, Petrofsky M, Shelton K (1996) Epidermal growth factor-binding
protein in Mycobacterium avium and Mycobacterium tuberculosis: a possible role in
the mechanism of infection. Infect Immun 64: 2917–2922.
43. Parker AE, Bermudez LE (2000) Sequence and characterization of the
glyceraldehyde-3-phosphate dehydrogenase of Mycobacterium avium: correlationwith an epidermal growth factor binding protein. Microb Pathog 28: 135–144.
44. Husain N, Awasthi S, Haris M, Gupta RK, Husain M (2008) Vascularendothelial growth factor as a marker of disease activity in neurotuberculosis.
J Infect 56: 114–119.
45. Kiropoulos TS, Kostikas K, Gourgoulianis KI (2005) Vascular endothelial
growth factor levels in pleural fluid and serum of patients with tuberculouspleural effusions. Chest 128: 468–469.
Markers for Diagnosis of TB Disease in Children
PLOS ONE | www.plosone.org 10 May 2013 | Volume 8 | Issue 5 | e64226

46. Alatas F, Alatas O, Metintas M, Ozarslan A, Erginel S, et al. (2004) Vascular
endothelial growth factor levels in active pulmonary tuberculosis. Chest 125:2156–2159.
47. Schoenberger SP, Toes RE, van der Voort EI, Offringa R, Melief CJ (1998) T-
cell help for cytotoxic T lymphocytes is mediated by CD40-CD40L interactions.Nature 393: 480–483.
48. Mizusawa M, Kawamura M, Takamori M, Kashiyama T, Fujita A, et al. (2008)Increased synthesis of anti-tuberculous glycolipid immunoglobulin G (IgG) and
IgA with cavity formation in patients with pulmonary tuberculosis. Clin Vaccine
Immunol 15: 544–548.49. Sakai H, Okafuji I, Nishikomori R, Abe J, Izawa K, et al. (2012) The CD40-
CD40L axis and IFN-gamma play critical roles in Langhans giant cell formation.Int Immunol 24: 5–15.
50. Ruhwald M, Aabye MG, Ravn P (2012) IP-10 release assays in the diagnosis oftuberculosis infection: current status and future directions. Expert Rev Mol
Diagn 12: 175–187.
51. Alsleben N, Ruhwald M, Russmann H, Marx FM, Wahn U, et al. (2012)Interferon-gamma inducible protein 10 as a biomarker for active tuberculosis
and latent tuberculosis infection in children: a case-control study. Scand J InfectDis 44: 256–262.
52. Lighter-Fisher J, Peng CH, Tse DB (2010) Cytokine responses to QuantiFER-
ON(R) peptides, purified protein derivative and recombinant ESAT-6 inchildren with tuberculosis. Int J Tuberc Lung Dis 14: 1548–1555.
53. Kabeer BS, Sikhamani R, Raja A (2010) Comparison of interferon gamma and
interferon gamma-inducible protein-10 secretion in HIV-tuberculosis patients.
AIDS 24: 323–325.
54. World Health Organisation (2011) Use of tuberculosis interferon-gamma release
assays (IGRAs) in low- and middle-income countries: policy statement.
55. Syed Ahamed KB, Sikhamani R, Swaminathan S, Perumal V, Paramasivam P,
et al. (2009) Role of interferon gamma release assay in active TB diagnosis
among HIV infected individuals. PLoS ONE 4: e5718.
56. Syed Ahamed KB, Raman B, Thomas A, Perumal V, Raja A (2010) Role of
QuantiFERON-TB gold, interferon gamma inducible protein-10 and tuberculin
skin test in active tuberculosis diagnosis. PLoS ONE 5: e9051.
57. Wang S, Diao N, Lu C, Wu J, Gao Y, et al. (2012) Evaluation of the diagnostic
potential of IP-10 and IL-2 as biomarkers for the diagnosis of active and latent
tuberculosis in a BCG-vaccinated population. PLoS ONE 7: e51338.
58. Goin JE (1982) ROC curve estimation and hypothesis testing: applications to
breast cancer detection. Pattern Recognition 15: 263–269.
59. Su WL, Perng WC, Huang CH, Yang CY, Wu CP, et al. (2010) Identification of
cytokines in whole blood for differential diagnosis of tuberculosis versus
pneumonia. Clin Vaccine Immunol 17: 771–777.
60. Desem N, Jones SL (1998) Development of a human gamma interferon enzyme
immunoassay and comparison with tuberculin skin testing for detection of
Mycobacterium tuberculosis infection. Clin Diagn Lab Immunol 5: 531–536.
Markers for Diagnosis of TB Disease in Children
PLOS ONE | www.plosone.org 11 May 2013 | Volume 8 | Issue 5 | e64226
Copyright © 2022 FDOKUMEN