Where to Stay • Where to Eat • Where to Play • Where to Shop

Using time-to-event analysis to complement hierarchical
methodswhen assessing determinants of photographic
detectability during camera trapping
RichardBischof1*, ShoaibHameed2, HussainAli2, MuhammadKabir2, MuhammadYounas2,
KursheedA. Shah2, Jaffar U. Din2 andMuhammadA. Nawaz2,3
1Department of Ecology andNatural ResourceManagement, NorwegianUniversity of Life Sciences, P.O. Box 5003,
NO-1432�As, Norway; 2SnowLeopard Foundation, 17-Service RoadNorth, I-8/3, Islamabad, Pakistan; and 3Department of
Animal Sciences, Quaid-i-AzamUniversity, Islamabad 45320, Pakistan
Summary
1. Camera trapping, paired with analytical methods for estimating occupancy, abundance and other ecological
parameters, can yield information with direct consequences for wildlife management and conservation.
Although ecological information is the primary target of most camera trap studies, detectability influences every
aspect from design to interpretation.
2. Concepts and methods of time-to-event analysis are directly applicable to camera trapping, yet this statistical
field has thus far been ignored as a way to analyse photographic capture data. To illustrate the use of time-to-
event statistics and to better understand how photographic evidence accumulates, we explored patterns in two
related measures of detectability: detection probability and time to detection. We analysed camera trap data for
three sympatric carnivores (snow leopard, red fox and stone marten) in the mountains of northern Pakistan and
tested predictions about patterns in detectability across species, sites and time.
3. We found species-specific differences in the magnitude of detectability and the factors influencing it, reinforc-
ing the need to consider determinants of detectability in study design and to account for them during analysis.
Photographic detectability of snow leopard was noticeably lower than that of red fox, but comparable to detect-
ability of stone marten. Site-specific attributes such as the presence of carnivore sign (snow leopard), terrain
(snow leopard and red fox) and application of lures (red fox) influenced detectability. For the most part, detec-
tion probability was constant over time.
4. Species-specific differences in factors determining detectability make camera trap studies targeting multiple
species particularly vulnerable to misinterpretation if the hierarchical origin of the data is ignored. Investigators
should consider not only themagnitude of detectability, but also the shape of the curve describing the cumulative
process of photographic detection, as this has consequences for both determining survey effort and the selection
of analyticalmodels.Weighted time-to-event analysis can complement occupancy analysis and other hierarchical
methods by providing additional tools for exploring camera trap data and testing hypotheses regarding the tem-
poral aspect of photographic evidence accumulation.
Key-words: Cox proportional hazards model, cumulative incidence,Martes foina, Panthera uncia,
survival analysis,Vulpes vulpes, weighted observations
Introduction
Camera trapping has become an important tool in ecological
research, especially for monitoring rare and elusive species,
because it can provide detailed visual information without
requiring on-site human observers or physical capture. Devel-
opments and adaptations in analytical fields allow us to extract
from photographic capture data information about activity
patterns and behaviour (Maffei et al. 2005), species diversity/
inventory (Tobler et al. 2008), occupancy (Linkie et al. 2007),
abundance and density (Karanth & Nichols 1998), as well as
vital rates such as survival and fecundity (Gardner et al. 2010).
Like other evidence placing organisms in time and space, cam-
era trap data originate from two processes: the ecological
mechanisms determining abundance/occupancy and the pro-
cess of observation determining our ability to detect an organ-
ism when it is present (K�ery 2011). Although ecological
parameters are typically the focus, detectability permeates
every aspect of camera trap studies and most other surveys of
fauna and flora. Knowledge about detectability can help opti-
mize study design (MacKenzie & Royle 2005), and detectabil-
ity must be accounted for analytically to estimate the
ecological parameter of interest (K�ery & Schaub 2012). In*Correspondence author. E-mail: [email protected]
© 2013 The Authors. Methods in Ecology and Evolution © 2013 British Ecological Society
This is an open access article under the terms of the Creative Commons Attribution-NonCommercial-NoDerivs License,
which permits use and distribution in any medium, provided the original work is properly cited, the use is non-commercial and
no modifications or adaptations are made.
Methods in Ecology and Evolution 2013 doi: 10.1111/2041-210X.12115
addition, most studies strive towards achieving high detectabil-
ity because this increases cost efficiency, improves the precision
of the ecological parameter estimates and, in the presence of
latent heterogeneity in detection probability, also reduces bias
in the estimates (Lukacs&Burnham 2005).
We can express detectability (i) as the probability of making
a detection in a given time period (e.g. 1 day) or (ii) as the time
until a detection is made, both conditional on presence of the
focal individual or species. Although these two measures are
manifestations of the same binomial process, they provide dif-
ferent perspectives on detectability. Camera trapping typically
involves periods of inactivity, interrupted by photographic
captures of wildlife. An expansive statistical field, time-to-event
analysis, more commonly referred to as survival analysis, deals
with such situations. As the name suggests, the measure of
interest is the time until some event occurs. In the case of
camera trap studies, it is the time until a photographic capture
is made, and we illustrate the use of this concept to gain addi-
tional insights about detectability during multispecies camera
trap studies.
Using both occupancy analysis and time-to-event analysis,
we explored empirical patterns in photographic detectability
over species, sites and time for three sympatric carnivore
species (snow leopard Panthera uncia, red fox Vulpes vulpes
and stone martenMartes foina). We asked the following ques-
tions to guide our analysis:
Q1.How do the three carnivore species differ in their photo-
graphic detectability? We predict that widespread species
known to be tolerant of human activity and environmental dis-
turbance, such as red fox and stone marten (Adkins & Stott
1998; Herr et al. 2010), are more easily detected than the snow
leopard with its reputation for being elusive (Jane�cka et al.
2011).
Q2. What are the determinants of detectability? Site selec-
tion is a key factor during camera trapping studies targeted at
carnivores, and we expect species-specific responses of detect-
ability to site covariates, such as terrain, habitat type and the
presence/absence of carnivore sign in the area. We predict that
the presence of carnivore sign and application of scent lures at
camera traps improve detectability (higher detection probabil-
ity, shorter time to detection).
Q3. How does photographic detection proceed over time?
We predict that disturbances associated with placing camera
traps in the environment, as well as changes in the potency of
olfactory attractants due to scent dissipation, may lead to non-
constant detectability over time.
Q4. What is the quantitative effect of longer survey dura-
tion on the probability of detecting a focal species at least
once at a site if it is present? Hamel et al. (2012)
recommended a 30-day survey duration when multiple spe-
cies are targeted in one study to allow reliable parameter
estimates (conditional on the number of sites surveyed). This
would entail a two- to three-fold increase compared with the
camera trapping duration in our study (10–14 days), which
we anticipate would substantially boost the proportion of
cameras with at least one detection and consequently
increase the sample size.
We discuss implications of our findings for camera trap
study design and data analysis and illustrate for the first time
the utility of time-to-event analysis for complementing
information about detectability gained from hierarchical
models based on camera trap data.
Materials andmethods
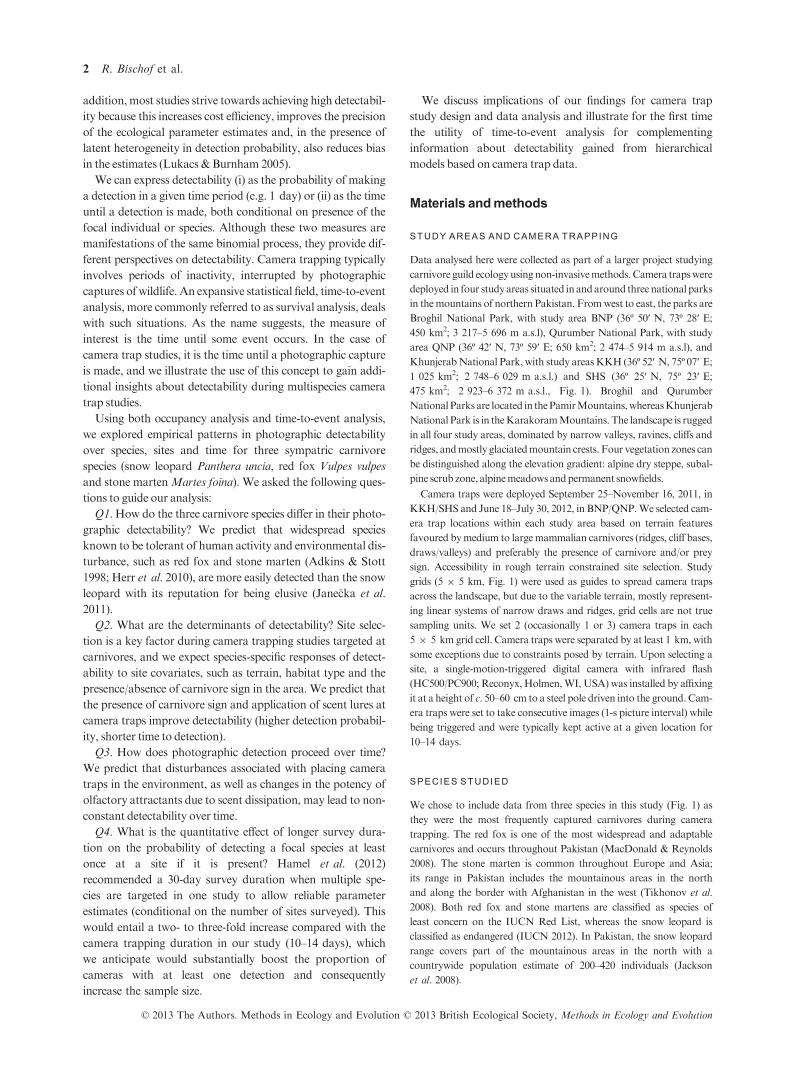
STUDY AREAS AND CAMERA TRAPPING
Data analysed here were collected as part of a larger project studying
carnivore guild ecologyusingnon-invasivemethods.Camera trapswere
deployed in four studyareas situated in andaround three national parks
in themountains of northern Pakistan. Fromwest to east, the parks are
Broghil National Park, with study area BNP (36º 50′ N, 73º 28′ E;
450 km2; 3 217–5 696 m a.s.l), Qurumber National Park, with study
area QNP (36º 42′ N, 73º 59′ E; 650 km2; 2 474–5 914 m a.s.l), and
KhunjerabNational Park, with study areasKKH (36º 52′ N, 75º 07′ E;
1 025 km2; 2 748–6 029 m a.s.l.) and SHS (36º 25′ N, 75º 23′ E;
475 km2; 2 923–6 372 m a.s.l., Fig. 1). Broghil and Qurumber
NationalParks are located in thePamirMountains,whereasKhunjerab
National Park is in theKarakoramMountains. The landscape is rugged
in all four study areas, dominated by narrow valleys, ravines, cliffs and
ridges, andmostly glaciatedmountain crests. Four vegetation zones can
be distinguished along the elevation gradient: alpine dry steppe, subal-
pine scrub zone, alpinemeadowsandpermanent snowfields.
Camera traps were deployed September 25–November 16, 2011, in
KKH/SHS and June 18–July 30, 2012, in BNP/QNP.We selected cam-
era trap locations within each study area based on terrain features
favoured bymedium to largemammalian carnivores (ridges, cliff bases,
draws/valleys) and preferably the presence of carnivore and/or prey
sign. Accessibility in rough terrain constrained site selection. Study
grids (5 9 5 km, Fig. 1) were used as guides to spread camera traps
across the landscape, but due to the variable terrain, mostly represent-
ing linear systems of narrow draws and ridges, grid cells are not true
sampling units. We set 2 (occasionally 1 or 3) camera traps in each
5 9 5 km grid cell. Camera traps were separated by at least 1 km, with
some exceptions due to constraints posed by terrain. Upon selecting a
site, a single-motion-triggered digital camera with infrared flash
(HC500/PC900; Reconyx, Holmen,WI, USA) was installed by affixing
it at a height of c. 50–60 cm to a steel pole driven into the ground. Cam-
era traps were set to take consecutive images (1-s picture interval) while
being triggered and were typically kept active at a given location for
10–14 days.
SPECIES STUDIED
We chose to include data from three species in this study (Fig. 1) as
they were the most frequently captured carnivores during camera
trapping. The red fox is one of the most widespread and adaptable
carnivores and occurs throughout Pakistan (MacDonald & Reynolds
2008). The stone marten is common throughout Europe and Asia;
its range in Pakistan includes the mountainous areas in the north
and along the border with Afghanistan in the west (Tikhonov et al.
2008). Both red fox and stone martens are classified as species of
least concern on the IUCN Red List, whereas the snow leopard is
classified as endangered (IUCN 2012). In Pakistan, the snow leopard
range covers part of the mountainous areas in the north with a
countrywide population estimate of 200–420 individuals (Jackson
et al. 2008).
© 2013 The Authors. Methods in Ecology and Evolution © 2013 British Ecological Society, Methods in Ecology and Evolution
2 R. Bischof et al.

COVARIATES
At each camera trap location, we recorded elevation, terrain feature
(cliff base, ridge/slope, valley/draw), habitat type (barren, forest/scrub,
pasture/grassland) and any potential carnivore sign (e.g. tracks, faeces,
scrapes) found in its vicinity. Study area (BNP, QNP, KKH and SHS)
was used as an additional predictor in the analysis to control for the col-
lection of characteristics that separated survey bouts spatially and in
time. Differences between survey years and seasons did not allow a reli-
able spatial comparison between SHS/KNP and BNP/QNP. Because
snow leopard was only photo-captured at a single camera trap station
in QNP and not at all in BNP, we only analysed data from KKH and
SHS for this species.
To evaluate whether olfactory attractants boost detectability, cam-
era traps were randomly assigned to one of three treatments: (i) castor-
based scent lure (containing beaver Castor canadensis castoreum; Eva-
nesce Lure, Kaatz Bros, Savanna, IL, USA), (ii) skunk-based scent lure
(skunk Mephitis mephitis anal scent gland; Magnum-Call Lure, Blac-
kie’s Blend, Glenmont, OH, USA) and (iii) no lures/attractants (con-
trol). We used commercial scent lures manufactured for North
American trappers targeting carnivores. At camera trap sites desig-
nated for lure application, a plaster tablet (diameter: 16 mm; thickness:
6 mm; USDA-Pocatello Supply Depot, Pocatello, ID, USA) soaked in
fish oil was placed in the centre of a cleared area (c. 75 cm diameter)
and lightly covered with loose soil or sand to reduce the chance of
detection and removal by birds. Plaster tablets were added as a short
range attractant to draw potentially reluctant carnivores into the view
of the camera. The designated scent lure (c. 3–5 mL) was applied as a
long-range attractant to vegetation or rock adjacent to the cleared area
at a height between 30 and 50 cm above the ground.
DEFIN IT IONS
Before proceeding with the description of the analytical approach, we
define the following variables:
• P = detection probability, the daily probability of photo-graphic detection of the focal species at a camera trap station
at least once, conditional on the species being present.
• T = time to detection, the time (e.g. in hours or days) untilthe first photographic detection of the focal species at a cam-
era trap station, conditional on the species being present.
• t0�5 = median time to detection, the time by which 50% ofcamera trap stations with the focal species present have
made a photographic capture of that species.
• Pt = the probability of at least one photographic detectionof the focal species by a given time t after camera activation,
(a) (b) (c)
Fig. 1. Shaded relief map (top) showing four camera trap study areas (sectioned into 5 9 5 km grids) in relation to three national parks (solid
boundaries) in northern Pakistan. The images below the map are examples of camera trap photographs of the three species included in the analysis:
snow leopard (a), red fox (b) and stonemarten (c).
© 2013 The Authors. Methods in Ecology and Evolution © 2013 British Ecological Society, Methods in Ecology and Evolution
Time-to-event analysis of camera trap data 3
conditional on the species being present. Alternatively, Pt
is the proportion of stations with at least one detection bytime t.
DETECTION PROBABIL ITY
We used single-species, single-season occupancy models to estimate
detection probability P (Q1) and the effect of site covariates (MacKen-
zie 2006; Q2). After constructing species-specific detection histories
based on daily detection/non-detection at each camera trap (Fig. 2), we
used function ‘occu’ in the R package unmarked (Fiske & Chandler
2011; RDevelopment Core Team 2012) to fit separate occupancymod-
els for each of the three focal species. We considered lure treatment,
elevation, study area, terrain feature, habitat type and the presence/
absence of potential sign of the focal species as covariates on P. The
same covariates, except lure type, were also considered as predictors of
occupancy (w). The need to set camera traps at locations that (i) were
likely places for carnivores to visit and (ii) were accessible on foot,
meant that the spatial distribution of camera traps was neither random
nor systematic. The objective of the present analysis was to obtain con-
ditional estimates of detectability and not to produce and compare
absolute occupancy or abundance estimates, for which spatially explicit
hierarchical models may be a more robust option (Royle et al. 2007).
However, to partially account for the likely non-independence in occu-
pancy between camera traps in each other’s vicinity, we considered as
an additional predictor onoccupancy the distance to the nearest camera
trap stationwith at least onedetectionof the focal species. Bothdistance
to the nearest camera trap with confirmed photographic capture and
elevation were standardized (mean = 0, SD = 1) and modelled using
smoothing splines with 2 d.f. (function ‘ns’ in R package ‘splines’),
because preliminary analysis suggested nonlinear relationships between
these variables and real parameters. We used AIC for model selection,
considering all possible combinations of terms, but limiting the maxi-
mum number of predictors on either real parameters to three. In cases
where several models were within ΔAIC 2 of the top model, we selected
the model with the fewest parameters for inference. We performed
goodness-of-fit tests with a parametric bootstrap and a chi-squared sta-
tistic followingMacKenzie (2006) andFiske&Chandler (2011).
TIME TO DETECTION
Concepts and methods associated with time-to-event analysis are
directly applicable to camera trapping. The measure of interest is the
time until some event (also referred to as ‘failure’ or ‘death’) occurs to
an individual. In our analysis, the individual for which the event occurs
is a camera trap station, and the event is the first photographic capture
of the focal species at that station. The follow-up period is the duration
of time for which individuals are monitored, that is, the time from cam-
era activation until takedown/deactivation. Censoring is an essential
concept in time-to-event analysis; when monitoring ceases of an indi-
vidual without having observed an event, we right-censor. Right-cen-
soring allows for the inclusion of data from camera traps that did not
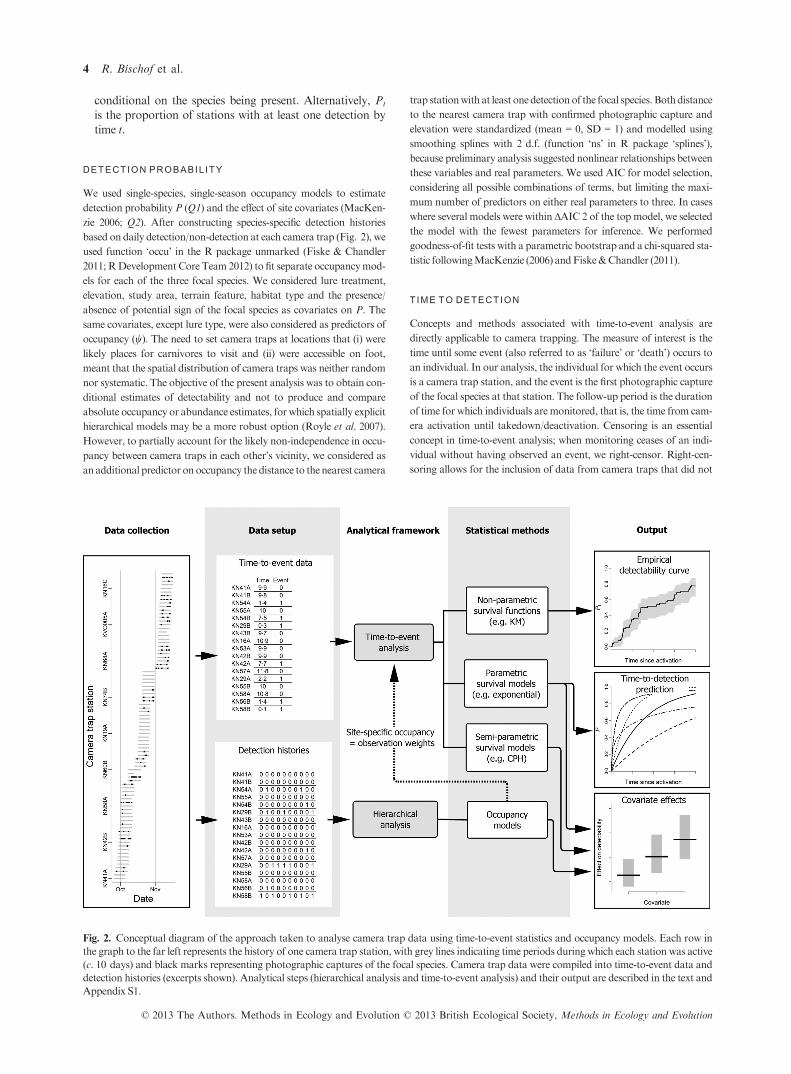
Fig. 2. Conceptual diagram of the approach taken to analyse camera trap data using time-to-event statistics and occupancy models. Each row in
the graph to the far left represents the history of one camera trap station, with grey lines indicating time periods during which each station was active
(c. 10 days) and black marks representing photographic captures of the focal species. Camera trap data were compiled into time-to-event data and
detection histories (excerpts shown). Analytical steps (hierarchical analysis and time-to-event analysis) and their output are described in the text and
Appendix S1.
© 2013 The Authors. Methods in Ecology and Evolution © 2013 British Ecological Society, Methods in Ecology and Evolution
4 R. Bischof et al.

detect the focal species by considering the time such camera traps were
available formaking a photographic detection.
We used Cox proportional hazards (CPH) models to confirm
empirically that patterns in time to detection matched patterns in
detection probability in terms of covariate effects (Q2). CPH models
estimate the multiplicative effect of covariates on the baseline hazard
(the instantaneous potential of detection), assuming only that hazards
are proportional, but without having to specify the shape of the under-
lying cumulative distribution function (Cox 1972; Venables & Ripley
2002; Appendix S1). However, simply using the time until the first
photo-capture of the focal species as the response and censoring all
sites without captures ignore the fact that there are two possible causes
for non-detection: the species either was present but missed, or was
not detected because it was truly absent. From the top occupancy
model that emerged during occupancy model fitting, we derived
empirical Bayes estimates of site-specific occupancy at each camera
trap location with functions ‘ranef’ and ‘bup’ in the R package
unmarked (Fiske & Chandler 2011). We then proceeded to use these
occupancy values (>0–1) as observation weights in the CPH regres-
sion, implemented through the ‘weights’ argument of the ‘coxph’ func-
tion in the R survival package (Therneau 2012). Covariate effects
estimates derived from the weighted CPH model can be interpreted as
effects on detectability conditional on presence, because sites less likely
to be occupied have a correspondingly smaller contribution during fit-
ting and hence smaller impact on the regression estimates. We used
simulations to confirm that the weighted CPH approach reliably esti-
mates conditional hazard ratios of detectability both qualitatively and
quantitatively under an occupancy scenario (Fig. S1, Appendix S2).
We fit species-specific CPH models using the same covariates identi-
fied in the top occupancy models (on detectability). Model diagnostics
were performed following Fox (2002), including tests for proportional-
ity of hazards using the ‘cox.zph’ function in the R survival package.
We used three steps to assess how the accumulation of photographic
evidence proceeded in time:
Step 1: We constructed empirical detectability curves (DC) to
visualize cumulative detection over time (Q3). Empirical DCs give
the probability that the first photo-capture of a focal species
occurs sometimes before t (time after camera activation) and are
equivalent to what are termed ‘cumulative incidence curves’ in
time-to-event analysis. In the absence of competing risks, that is,
when multiple events (photographic captures of different species)
are not mutually exclusive, empirical DCs are complements of
Kaplan–Meier (KM) survival curves. The latter are nonparamet-
ric maximum-likelihood estimates of survival over time (S(t);
Kaplan & Meier 1958; Venables & Ripley 2002; Appendix S1),
that is, the probability that the event of interest has not yet
occurred by time t, which can be calculated with the ‘survfit’ func-
tion in the R survival package. To construct empirical DCs that
were conditional on presence at a site, we included site-specific
occupancy estimates as observation weights during the calcula-
tion.
Step 2: We fit parametric survival models to the time to first detec-
tion to determine whether there was evidence for non-constant
detectability over time (Q3). We quantitatively compared the per-
formance (AIC) of the model assuming constant detection over
time (exponential cumulative distribution function) with models
representing four alternative cumulative distribution function
shapes that allow for non-constant detectability: Weibull (with
scale parameter 6¼ 1), Gaussian, log and log-logistic. All survival
models were fitted with the function ‘survreg’ in the R survival
package, with site-specific occupancy estimates as observation
weights. In addition to AIC-based model comparison, we visually
compared empirical DC (Step 1) with predictions from the model
assuming constant detectability over time (exponential DC).
Step 3: We used parametric survival models to a) estimate t0�5 as analternative means to compare detectability among species (Q1) and
b) predict Pt if we extended the camera trapping duration to
30 days (Q4). Both t0�5 and Pt assuming a 30-day camera trapping
duration were estimated using the exponential survival model fitted
separately to each species’ time-to-detection data (‘survreg’ func-
tion inR survival package).
Additional details about the analytical approach are provided in
Appendix S1 and an overview in Fig. 2. We again used simulations to
confirm that detectability, conditional on presence, was correctly repre-
sented by DCs constructed from observations weighted according to
their site-specific occupancy estimates (Fig. S2).
Results
We set 198 separate camera traps (BNP: 31, QNP: 47, KKH:
85; SHS: 35) for a total of 2 287 camera trap days. Of the three
focal species, red fox was the most frequently captured species
(8�6 capture trap days per 100 trap days and 2 055 photo-
graphs at 93 camera traps), followed by stone marten (2�6 cap-ture trap days per 100 trap days and 520 photographs at 36
camera traps) and snow leopard (1�3 capture trap days per 100
trap days and 1 093 photographs at 23 camera traps).
DETECTION PROBABIL ITY
Occupancy analysis revealed species-specific differences in
detection probability and the covariates affecting detectability
(Table 1, Fig. 3).
Q1. In the areas where we photographically captured all
three species, P for snow leopard was noticeably lower than
that for red fox, but comparable in magnitude to P for stone
marten (Table 1).
Q2. For snow leopard, the strongest determinant of photo-
graphic detectability was the presence of potential sign indicat-
ing activity in the vicinity of the camera trap prior to set-up
(9�3 times greater odds, 95% CI: 2�2–39�9). Skunk-based lures
had a positive effect on P of red fox (2�6 times greater odds,
95% CI: 1�7–4�1), and castor-based lures were intermediate in
their effect (Fig. 3). Both snow leopard and red fox had lower
Table 1. Estimates of daily detection probability (P; from occupancy
models) and median time to first detection (t0�5; from survival models)
by species and study area (95%CI limits in parentheses)
Study
area Snow leopard Red fox Stonemarten
Detection probabilityP
KKH 0�037 (0�032–0�047) 0�163 (0�152–0�179) 0�048 (0�047–0�055)SHS 0�036 (0�029–0�049) 0�181 (0�161–0�209) 0�032 (0�031–0�05)BNP – 0�131 (0�116–0�154) 0�136 (0�127–0�153)QNP – 0�072 (0�065–0�084) 0�099 (0�095–0�107)
Median time to first detection t0�5 (in days)KKH 19�89 (11�99–32�99) 4�65 (3�43–6�32) 13�39 (6�97–25�73)SHS 23�27 (10�46–51�8) 4�43 (2�79–7�03) 16�57 (5�34–51�38)BNP – 7�18 (4�33–11�91) 5�19 (2�6–10�38)QNP – 9�79 (6�17–15�54) 5�43 (3�33–8�87)
© 2013 The Authors. Methods in Ecology and Evolution © 2013 British Ecological Society, Methods in Ecology and Evolution
Time-to-event analysis of camera trap data 5

odds of being detected by camera traps set on ridges/plateaus
than by camera traps set along the bases of cliffs; odds of sta-
tions set in draws/valleys were intermediate (Fig. 3). Study
area affected P of red fox and stone marten. Effects of predic-
tors retained in each species’ top occupancy model are shown
in Fig. 3, and results of model selection, in Table S1.
Hierarchical modelling also yielded species-specific esti-
mates of w and associated covariate effects. Although occu-
pancy itself was not the focus of the present study, site-specific
occupancy estimates were used as observation weights during
the time-to-event analysis and are shown in Fig. S3. Overall
occupancy estimates (Table S2) should be interpreted with
caution (e.g. as site/area use, rather than as occupation) due
to violation of closure assumptions caused by the likely obser-
vation of individuals with large home ranges at multiple sites.
TIME TO DETECTION
Q1. Patterns in median time to detection were consistent with
patterns in detection probability across species and study
areas: low P was associated with long t0�5 and vice versa
(Table 1). Species-specific DCs predicted with parametric sur-
vivalmodels trackedDCs based on estimates ofPobtained from
occupancymodels (Appendix S1), which is further empirical evi-
dence of the connection between the twomeasures of detection.
Q2. The results from the weighted CPH regressions closely
matched those from the occupancy analysis (Fig. 3), and simu-
lations confirmed that using occupancy estimates as observa-
tion weights in CPH regression led to reliable estimates of
covariate effects on hazards, conditional on presence (Fig. S1).
Q3. Comparison of empirical DCs (black lines, Fig. 4) with
DCs assuming an exponential survival model (red lines, Fig. 4)
gave little indication of systematic deviations from constant
detectability over time. In one case (red fox in BNP), the Wei-
bull cumulative distribution function resulted in a better fit
(DAIC = �4) than the exponential one. Simulations con-
firmed that empirical DCs constructed using occupancy esti-
mates as observation weights matched the DCs constructed
using perfect knowledge about occupancy (Fig. S2).
Q4.The proportion of stations that would detect a focal spe-
cies at least once during a 30-day camera trap period varied
dependent on the pattern in species- and area-specific detect-
ability. For example, for snow leopard, the species with the
lowest detection probability increasing the camera trapping
duration from 10 to 30 days in KKH would result in a pre-
dicted increase in Pt from 0�29 to 0�65, whereas for red fox and
stone marten, a corresponding extension of camera trapping
duration would lead to an increase in Pt from 0�78 to 0�99 and0�4 to 0�79, respectively (Fig. 4).
Discussion
SPECIES-SPECIF IC DIFFERENCES IN DETECTABIL ITY
(Q1 )
Our results confirm the need to account for imperfect and
variable detectability when analysing camera trap and other
observation data (see also K�ery & Schaub 2012). It is tempting
to analyse camera trap data by comparing photographic cap-
ture rates and ignoring the hierarchical origin of the data.
However, comparisons of rates could be deceiving because sys-
tematic variation in detection probability will result in biased
estimates of differences (K�ery 2011). In our study, detection
probability varied between species and over several of the site
covariates that we evaluated (Fig. 3). Because occupancy var-
ied as well, models ignoring the hierarchical process would
have led to potentially erroneous predictions (Figs S1 and S2).
SITE SELECTION AND ATTRACTANTS AS
DETERMINANTS OF DETECTABIL ITY (Q2 )
Many species with the greatest conservation need are difficult
to detect and monitor. The key factor in determining detect-
ability in most field studies remains location; for carnivores,
this means selection of sites that lie along possible movement
paths, are near preferred terrain/habitat features and ideally
contain signs of use by carnivores or their prey. Determinants
of snow leopard detectability, the presence of sign and terrain
feature, are particularly noteworthy in the light of the interna-
tional interest in snow leopard monitoring and conservation
and the species’ notoriety for elusiveness (Jane�cka et al. 2011).
The nine-fold greater odds of photo-capturing snow leopards
at stations with snow leopard sign than without may seem triv-
ial in the context of occupancy studies (i.e. why not just use sign
data for determining occupancy in the first place), but are rele-
vant for photographic mark–recapture studies that distinguish
between individuals.
During camera trapping, enticements such as lures and baits
can boost the probability of a visit and thereby detectability.
We found that red foxes were more likely to be detected at
camera trap stations treated with lures. Lures can increase
detectability, but might also lead to a change in spatial sam-
pling units (by drawing animals in from a wider area) and to
non-constant detection probability over time (e.g. through ini-
tial attraction, followed by scent dissipation). During a camera
trap study ofMalagasy civets Fossa fossana, Gerber, Karpanty
& Kelly (2012) found that the application of lures did not bias
density estimation through effects on immigration and emigra-
tion; instead, it led to an increase in precision of the estimates
by increasing the number of recaptures. In addition to the ben-
efits of a larger sample size, more frequent and potentially
longer visits increase the chance ofmaking an individual identi-
fication, observing behaviour and reproductive status, and
provide greater opportunity to collect genetic samples at the
site. Furthermore, by shortening the time to first detection,
lures can help reduce survey durations and thereby help meet
closure assumptions and reduce costs.
DETECTION PROCESS OVER TIME (Q3 ) AND CAMERA
TRAPPING DURATION (Q4 )
Time to detection in our study showed little systematic devia-
tion from the exponential cumulative distribution function (i.e.
constant detectability), with the exception of red fox in BNP.
© 2013 The Authors. Methods in Ecology and Evolution © 2013 British Ecological Society, Methods in Ecology and Evolution
6 R. Bischof et al.

Regardless of this finding, we encourage investigators to check
their camera trap data for non-constant detection probability
over time, because the shape of the DC could influence selec-
tion of the appropriate model for analysis as well as decisions
about effective survey length. For example, when hazards are
initially low due to avoidance, but then increase as the target
species becomes accustomed to the camera trap or, when
human scent has dissipated, lengthening the camera trapping
duration to include the period of elevated detection will
increase the average daily probability of detection during the
survey.
The duration forwhich a camera trap is kept active at a given
site is an important consideration when planning camera trap
studies (Hamel et al. 2012). Resource limitations (available
staff, time, camera traps) and analytical assumptions (e.g.
demographic closure in capture–recapture studies; Karanth,
Nichols &Kumar 2011) may favour shorter overall study peri-
ods, whereas the need to increase Pt and thereby the accuracy
and precision of parameter estimates may require longer cam-
era trapping durations (Hamel et al. 2012). Survival functions
and their complements constructed from camera trap data can
provide an analytical and visual tool to help with decisions
Fig. 3. Predictions for covariate effects on detectability estimated from top occupancy models (left column) and Cox proportional hazards regres-
sion (right column) for three carnivore species (grey bars: 95% CI). Panels in the left column show covariate effects on daily detection probability.
Panels in the right column show covariate effects on the log hazard ratio. For predictions of a given covariate effect, all remaining covariates are held
either at themean (continuous variables) or at an arbitrary level (categorical variables). The focus is on the relative position of the estimates, not their
absolute value. Vertical dashed lines in the study area effect plots indicate that surveys were implemented in different seasons and years in KKH/
SHS vs. BNP/QNP.
© 2013 The Authors. Methods in Ecology and Evolution © 2013 British Ecological Society, Methods in Ecology and Evolution
Time-to-event analysis of camera trap data 7

Fig. 4. Detectability curves (DC) for three carnivore species in four study areas, showing the probabilityPt of at least one photographic detection by
a given time t, conditional on presence. Empirical DCs (solid back lines, with 95% confidence bands in grey) were estimated as the complement of
Kaplan–Meier survival curves, with camera trapsweighted according to their site-specific occupancy estimates. Bold red lines areDCs predictedwith
parametric survival models assuming constant detectability over time. Red arrows indicate the median time to detection (t0�5, pointing down) andPt
assuming 30 days of camera trapping (pointing left).
© 2013 The Authors. Methods in Ecology and Evolution © 2013 British Ecological Society, Methods in Ecology and Evolution
8 R. Bischof et al.

about camera trappingduration consistentwith the recommen-
dation by Garrard et al. (2008) to use detectability curves for
determining effort needed during floral surveys. Hamel et al.
(2012) recommended a 30-day camera trapping duration at a
site when multiple species are targeted in one study, which
depending on the study area would lead to projected Pt
between 0�59 and 0�65 for snow leopard, 0�88 and 0�99 for redfox and 0�72 and 0�98 for stone marten. Survival functions can
also help view the effect of covariates from a different perspec-
tive: for example, the median time to first detection of red fox
depends on the application of olfactory attractants, with direct
consequences for survey efficiency (Fig. 5).
ANALYTICAL CONSIDERATIONS
Important concepts and methods in time-to-event analysis,
such as survival functions, hazards and censoring, find direct
application during the analysis of camera trap data. Using a
Bayesian approach, Garrard et al. (2008) andMcCarthy et al.
(2013) combined an exponential failure time model with a
binomial component to account for the time to detection con-
ditional on presence, as well as non-detection due to true
absence during floral and faunal surveys. As an alternative
approach for modelling time to first detection conditional on
presence, we have weighted observations according to their
site-specific occupancy estimates during time-to-event analysis.
Although there are inherent benefits in integrating all compo-
nents of an analysis within a single framework/paradigm as
done by Garrard et al. (2008) and McCarthy et al. (2013),
there are several advantages associated with our approach.
These include the benefits of using nonparametric and semi-
parametric models that do not require that the shape of the
cumulative distribution function be specified, as well as access
to the built in functionality of the R survival package
(Therneau 2012). In addition, our approach is more accessible
for investigators who rely on frequentist methods for inference.
As our validation has shown, weighted DC construction and
CPH regression resulted in reliable conditional parameter esti-
mates, apparently unbiased with respect to the true parameter
and estimates obtained assuming perfect knowledge about
occupancy (Figs S1 and S2). Furthermore, predictions of
covariate effects (CPH models) and species-specific time to
detection (parametric survival models) showed strong corre-
spondence with results obtained from occupancy analysis.
Time-to-event analysis of camera trap data as described here
considers the first detection at each camera, whereas occu-
pancy or other forms of mark–recapture analysis use also sub-
sequent captures (albeit pooled into discrete occasions).
Recurrent event survival analysis (Cook & Lawless 2007), may
present a solution where this is a concern because it allows for
events that can occurmore than once.
Because the sample size available for analysis is directly
related to the magnitude of the real parameters (w and P), so is
our ability to detect and/or reliably quantify covariate effects.
The relationship between the magnitude of the real parameters
and statistical power should be considered when comparing
patterns in covariate effects between species, especially because
the absence of evidence of a significant effect cannot be taken
as evidence for the absence of an effect. Ironically, we can
expect to obtain less reliable and less detailed information on
factors influencing detection probability for rare and elusive
species where we could potentially gain the most from under-
standing and manipulating detectability (such as through site
selection or the use of attractants). In the extreme, we have to
accept that photographic captures of some species may be too
scarce to allow parameter estimation with useful precision.
Even if parameter estimation seems feasible, covariate effects
or potential deviations from model assumptions may be diffi-
cult to detect when sample sizes are low. For example, the com-
paratively small number of photographic captures of snow
leopard and stonemarten is a cause for cautionwhen interpret-
ing tests of proportionality of hazards (CPHmodels) or devia-
tions from the exponential cumulative distribution function
(parametric survival functions).
Conclusions
The technical developments and growing popularity of camera
traps have brought about an unprecedented amount of
detailed visual information about wildlife (O’Connell, Nichols
& Karanth 2011). Detectability, although a so-called nuisance
parameter, is nonetheless of considerable importance when it
comes to designing, analysing and interpreting camera trap
studies. Combining analytical tools that target different expres-
sions of detectability – detection probability and time to detec-
tion – can give a comprehensive picture of how photographic
evidence accumulates during camera trap studies and the fac-
tors determining detection. As a follow-up to our study, we
Fig. 5. Parametric detectability curves showingPt for red fox as a func-
tion of camera trapping duration. Predictions assuming constant
detectability over time were made for three different lure treatments.
Dashed vertical lines indicate the predicted median time to event (i.e.
foxes are detected at 50% of the stations at which they are present)
together with 95%CIs (shaded horizontal bars).
© 2013 The Authors. Methods in Ecology and Evolution © 2013 British Ecological Society, Methods in Ecology and Evolution
Time-to-event analysis of camera trap data 9

suggest investigations that search for variation in the shape of
cumulative incidence of detection over time and evaluate its
implications for the design and analysis of camera trap data.
Acknowledgements
We are grateful for the support from Khunjerab National Park (KNP) adminis-
tration and wildlife rangers, Khunjerab Villagers Organization, Shimshal Nature
Trust, theGovernments of Gilgit-Baltistan andKhyber Pakhtunkhwa, Panthera,
Snow Leopard Trust, Wildlife Conservation Society and WWF (Pakistan). E.
Hussain and M. Ali helped with field work. We thank T. Haugaasen, L.E. Loe,
V. Vazquez and 2 anonymous reviewers for manuscript review andD.Nawaz for
producing maps used in the field.We thankM.K�ery for constructive criticism on
an earlier version of the manuscript and A. Royle for helpful discussion. Main
funding for this study came from the Research Council of Norway (Grant
204202/F20) and SnowLeopard Trust.
References
Adkins, C.A. & Stott, P. (1998) Home ranges, movements and habitat
associations of red foxesVulpes vulpes in suburban Toronto, Ontario, Canada.
Journal of Zoology, 244, 335–346.Cook, R.J. & Lawless, J.F. (2007) The Statistical Analysis of Recurrent Events.
Springer, NewYork.
Cox, D.R. (1972) Regression models and life tables (with discussion). Journal of
theRoyal Statistical Society. Series B, 34, 187–220.Fiske, I.J. &Chandler, R.B. (2011)Unmarked: anR package for fitting hierarchi-
cal models of wildlife occurrence and abundance. Journal of Statistical
Software, 43, 1–23.Fox, J. (2002) Cox proportional-hazards regression for survival data (Appendix).
An R and S-Plus Companion to Applied Regression, pp. 18. Sage Publications,
ThousandOaks, California, USA.
Gardner, B., Reppucci, J., Lucherini, M. & Royle, J.A. (2010) Spatially explicit
inference for open populations: estimating demographic parameters from
camera-trap studies.Ecology, 91, 3376–3383.Garrard,G.E., Bekessy, S.A.,McCarthy,M.A.&Wintle, B.A. (2008)When have
we looked hard enough? A novel method for setting minimum survey effort
protocols for flora surveys.Austral Ecology, 33, 986–998.Gerber, B., Karpanty, S. & Kelly, M. (2012) Evaluating the potential biases in
carnivore capture–recapture studies associated with the use of lure and varyingdensity estimation techniques using photographic-sampling data of the
Malagasy civet.Population Ecology, 54, 43–54.Hamel, S., Killengreen, S.T., Henden, J.-A., Eide, N.E., Roed-Eriksen, L., Ims,
R.A. & Yoccoz, N.G. (2012) Towards good practice guidance in using cam-
era-traps in ecology: influence of sampling design on validity of ecological
inferences.Methods in Ecology and Evolution, 4, 105–113.Herr, J., Schley, L., Engel, E. & Roper, T.J. (2010) Den preferences and denning
behaviour in urban stone martens (Martes foina). Mammalian Biology, 75,
138–145.IUCN. (2012) The IUCNRed List of Threatened Species. Version 2012.2. http://
www.iucnredlist.org.
Jackson, R., Mallon, D., McCarthy, T., Chundaway, R.A. & Habib, B. (2008)
Panthera uncia. In: IUCN 2012. IUCN Red List of Threatened Species.
Version 2012.2. www.iucnredlist.org.Downloaded on 10 January 2013.
Jane�cka, J.E., Munkhtsog, B., Jackson, R.M., Naranbaatar, G., Mallon, D.P.
& Murphy, W.J. (2011) Comparison of noninvasive genetic and cam-
era-trapping techniques for surveying snow leopards. Journal of Mammal-
ogy, 92, 771–783.Kaplan, E.L. & Meier, P. (1958) Nonparametric-estimation from incomplete
observations. Journal of theAmerican Statistical Association, 53, 457–481.Karanth, K.U., Nichols, J.D. &Kumar, N.S. (2011) Estimating tiger abundances
from camera trap data: field surveys and analytical issues. Camera Traps in
Ecology. Methods and Analysis (eds A.F. O’Connell, J.D. Nichols & K.U.
Karanth), pp. 97–117. Springer, Tokyo.Karanth, K.U. &Nichols, J.D. (1998) Estimation of tiger densities in India using
photographic captures and recaptures.Ecology, 79, 2852–2862.K�ery, M. (2011) Species richness and community dynamics: a conceptual frame-
work. Camera Traps in Ecology. Methods and Analysis (eds A.F. O’Connell,
J.D.Nichols &K.U.Karanth), pp. 207–231. Springer, Tokyo.K�ery, M. & Schaub, M. (2012) Bayesian Population Analysis usingWinBUGS: A
Hierarchical Perspective. Academic Press,Waltham,Massachusetts, USA.
Linkie,M., Dinata, Y., Nugroho, A. &Haidir, I.A. (2007) Estimating occupancy
of a data deficient mammalian species living in tropical rainforests: sun bears
in theKerinci Seblat region, Sumatra.Biological Conservation, 137, 20–27.Lukacs, P.M. & Burnham, K.P. (2005) Review of capture-recapture methods
applicable to noninvasive genetic sampling.Molecular Ecology, 14, 3909–3919.MacDonald,D.W.&Reynolds, J.C. (2008)Vulpes vulpes. In: IUCN2012. IUCN
Red List of Threatened Species. Version 2012.2. www.iucnredlist.org. Down-
loaded on 10 January 2013.
MacKenzie, D.I. (2006) Occupancy Estimation and Modeling: Inferring Patterns
andDynamics of Species. Elsevier, Amsterdam.
MacKenzie, D.I. & Royle, J.A. (2005) Designing occupancy studies: general
advice and allocating survey effort. Journal of Applied Ecology, 42, 1105–1114.Maffei, L., Noss, A.J., Cuellar, E. & Rumiz, D.I. (2005) Ocelot (Felis pardalis)
population densities, activity, and ranging behaviour in the dry forests of east-
ern Bolivia: data from camera trapping. Journal of Tropical Ecology, 21,
349–353.McCarthy,M.A.,Moore, J.L.,Morris,W.K., Parris,K.M.,Garrard,G.E., Vesk,
P.A. et al. (2013) The influence of abundance on detectability. Oikos, 122,
717–726.O’Connell, A.F., Nichols, J.D. & Karanth, K.U. (2011) Camera Traps in Animal
Ecology:Methods and Analyses, pp. XIV, 271. Springer, Tokyo.
R Development Core Team. (2012) R: A Language and Environment for Statisti-
cal Computing. R Foundation for Statistical Computing, Vienna, Austria.
ISBN3-900051-07-0, http://www.R-project.org.
Royle, J.A., Kery,M., Gautier, R. & Schmid,H. (2007)Hierarchical spatial mod-
els of abundance and occurrence from imperfect survey data.EcologicalMono-
graphs, 77, 465–481.Therneau, T. (2012) A Package for Survival Analysis in S. R package version
2.36-14. CRAN.R-project.org/package=survival.
Tikhonov, A., Cavallini, P., Maran, T., Krantz, A., Herrero, J., Giannatos, G.
et al. (2008) Martes foina. In: IUCN 2012. IUCN Red List of Threatened
Species. Version 2012.2. www.iucnredlist.org. Downloaded on 10 January
2013.
Tobler,M.W., Carrillo-Percastegui, S.E., Pitman, R.L.,Mares, R. & Powell, G.
(2008) An evaluation of camera traps for inventorying large- and medium-
sized terrestrial rainforest mammals.Animal Conservation, 11, 169–178.Venables,W.N. &Ripley, B.D. (2002)Modern Applied StatisticsWith S, 4th edn.
Springer, NewYork.
Received 13 February 2013; accepted 1 September 2013
Handling Editor:Nigel Yoccoz
Supporting Information
Additional Supporting Information may be found in the online version
of this article.
Appendix S1.Details of applying time-to-event analysis to camera trap
data.
Appendix S2. R code for simulating occupancy data with exponential
time to detection and conducting occupancy and weighted time-to-
event analysis.
Fig. S1. Validation of weighted Cox proportional hazards regression
predictions for photographic detection, conditional on presence.
Fig. S2. Validation of cumulative incidence curves for detection, con-
structed from observations weighted according to site-specific occu-
pancy estimates.
Fig. S3. Map of site-specific occupancy estimates at camera trap loca-
tions.
Table S1.Model selection results from occupancy analysis.
Table S2.Overall occupancy estimates by species and study area.
© 2013 The Authors. Methods in Ecology and Evolution © 2013 British Ecological Society, Methods in Ecology and Evolution
10 R. Bischof et al.
Copyright © 2022 FDOKUMEN