Using WBLCA to Reduce Embodied Carbon within LEED and ...
94
Embodied Carbon Network | 2019 Webinar Series EMBODIED CARBON IN THE BUILT ENVIRONMENT: SESSION 5 – Using WBLCA to Reduce Embodied Carbon within LEED and Beyond November 8, 2019
-
Upload
khangminh22 -
Category
Documents
-
view
1 -
download
0
Transcript of Using WBLCA to Reduce Embodied Carbon within LEED and ...
Embodied Carbon Network | 2019 Webinar Series
EMBODIED CARBON IN THE BUILT ENVIRONMENT: SESSION 5 – Using WBLCA to Reduce Embodied Carbon within LEED and BeyondNovember 8, 2019
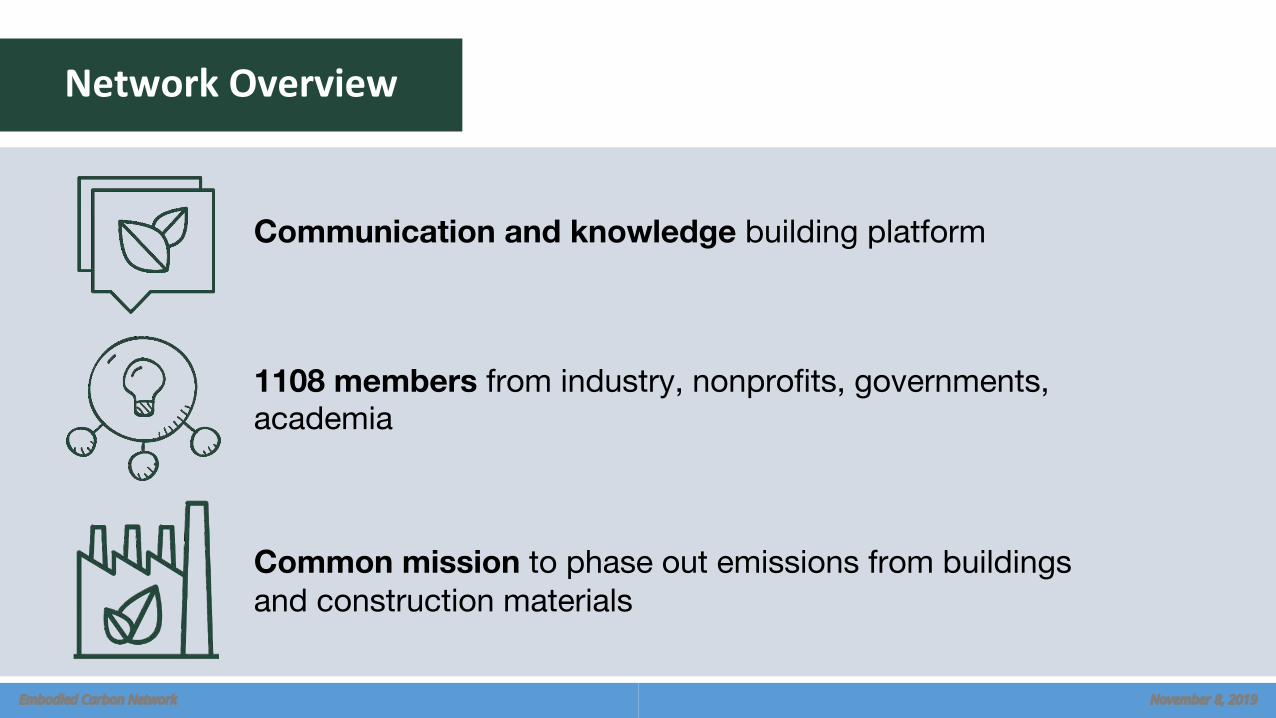
Network Overview
Communication and knowledge building platform
1108 members from industry, nonprofits, governments, academia
Common mission to phase out emissions from buildingsand construction materials
Embodied Carbon Network November 8, 2019
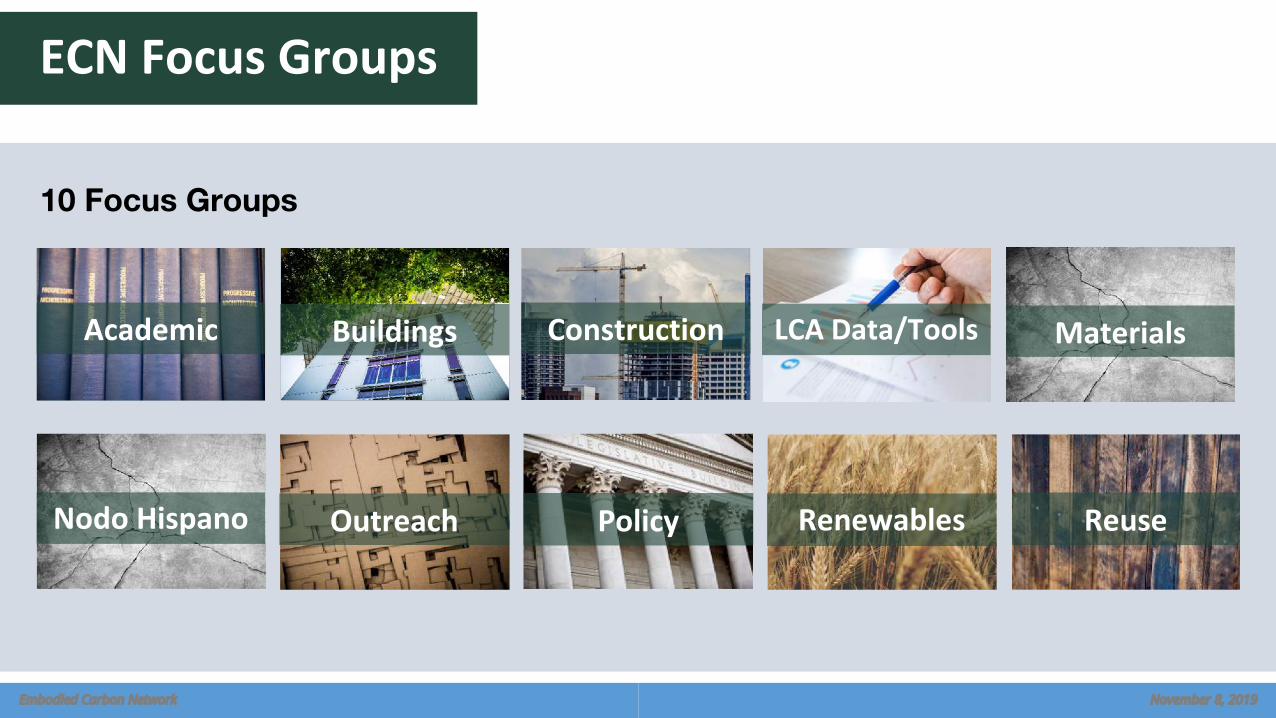
ECN Focus Groups
10 Focus Groups
Academic Buildings Construction LCA Data/Tools Materials
Outreach Policy Renewables ReuseNodo Hispano
Embodied Carbon Network November 8, 2019
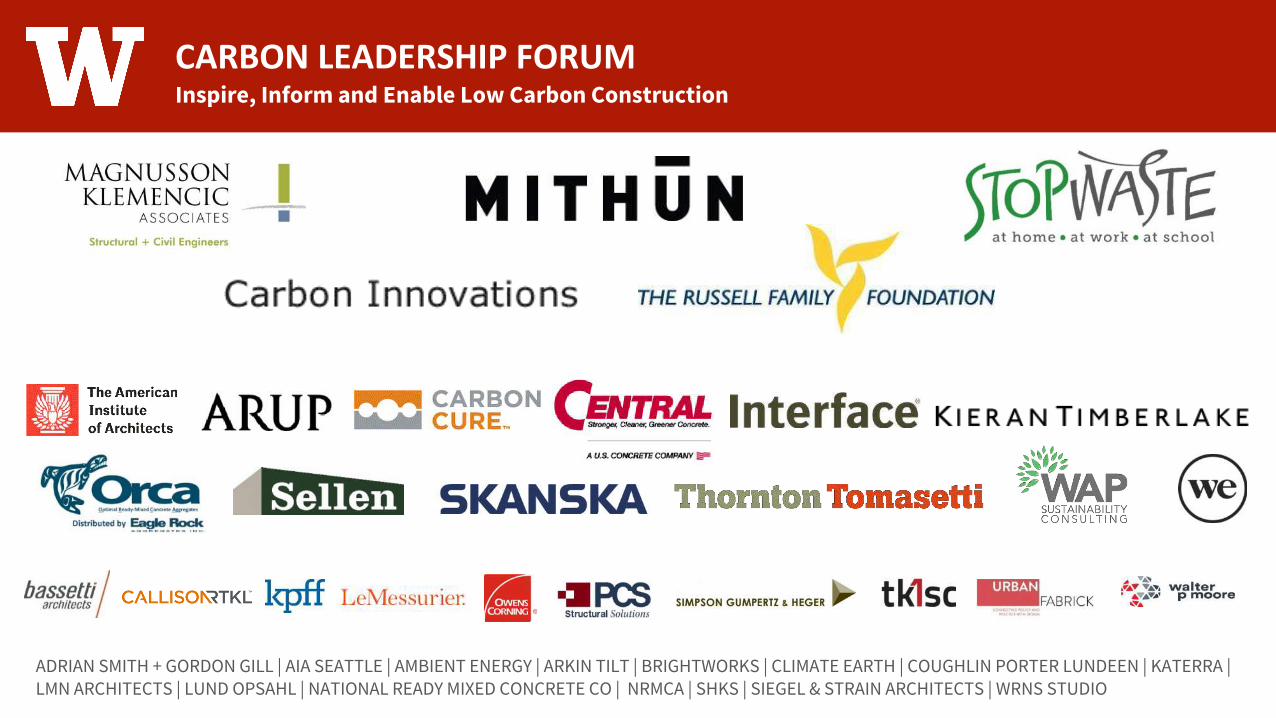
Inspire, Inform and Enable Low Carbon ConstructionCARBON LEADERSHIP FORUM
ADRIAN SMITH + GORDON GILL | AIA SEATTLE | AMBIENT ENERGY | ARKIN TILT | BRIGHTWORKS | CLIMATE EARTH | COUGHLIN PORTER LUNDEEN | KATERRA | LMN ARCHITECTS | LUND OPSAHL | NATIONAL READY MIXED CONCRETE CO | NRMCA | SHKS | SIEGEL & STRAIN ARCHITECTS | WRNS STUDIO
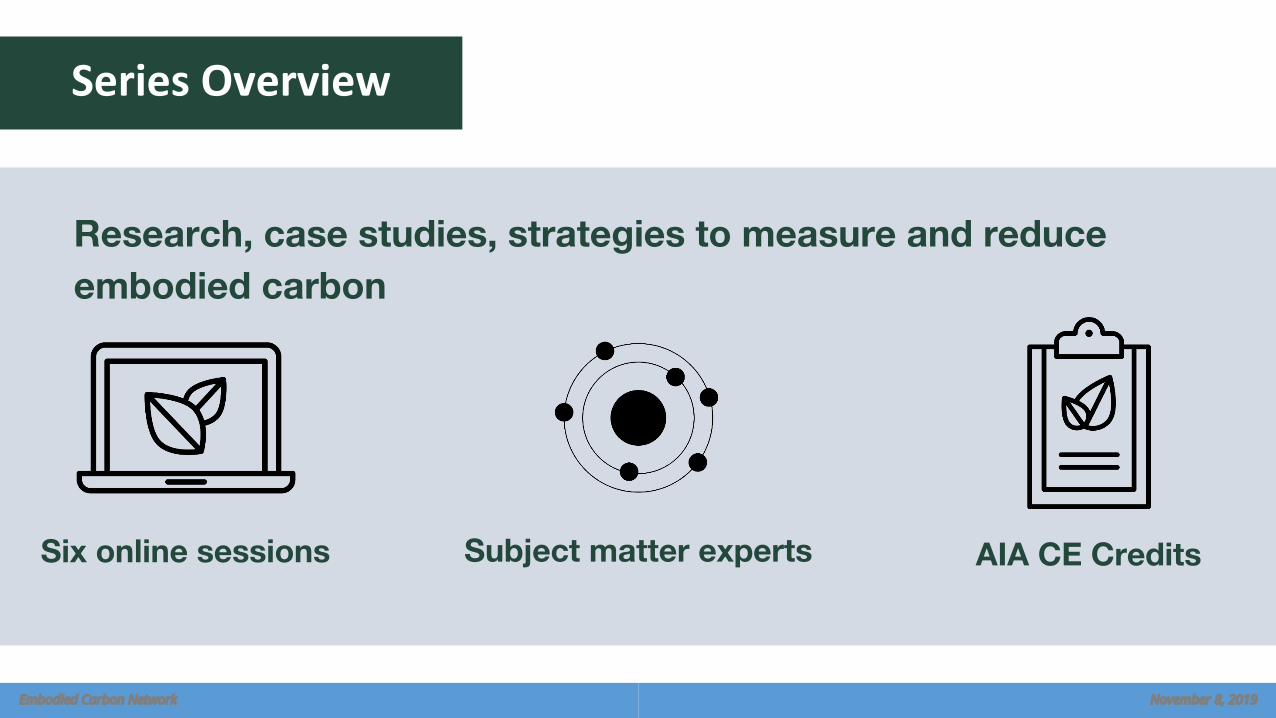
Series Overview
Research, case studies, strategies to measure and reduce embodied carbon
Six online sessions Subject matter experts AIA CE Credits
Embodied Carbon Network November 8, 2019
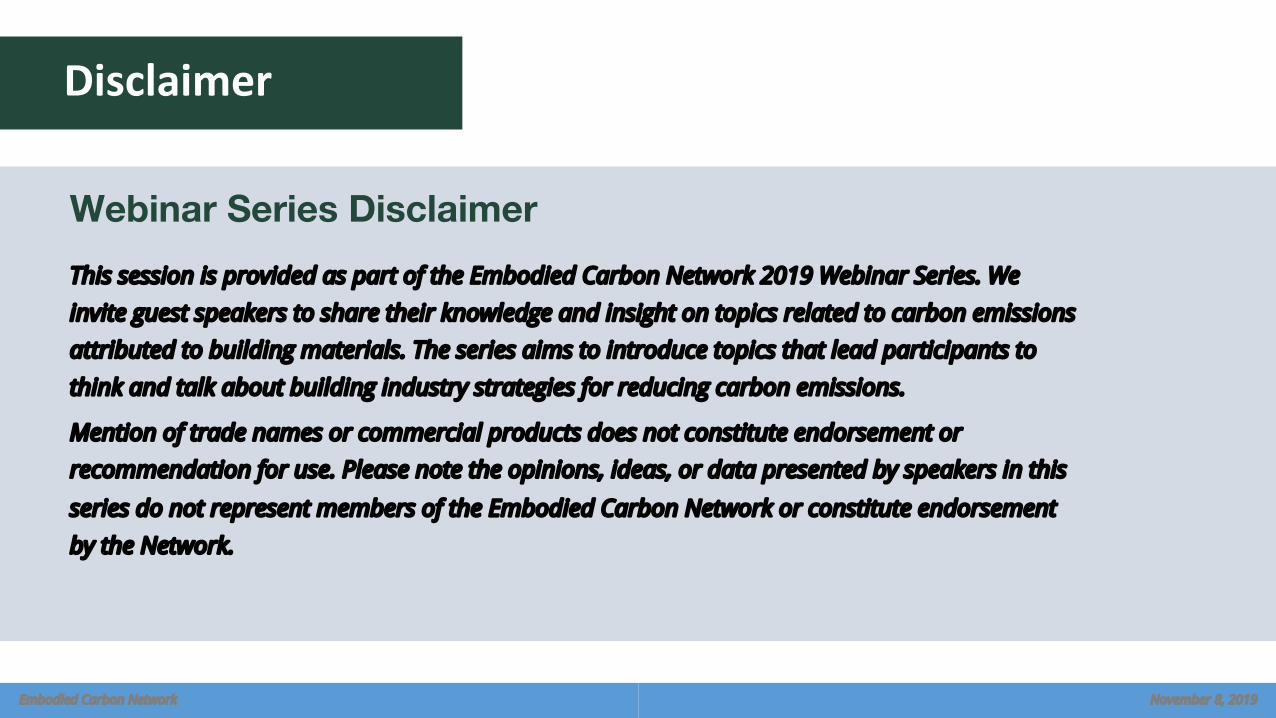
Disclaimer
Webinar Series DisclaimerThis session is provided as part of the Embodied Carbon Network 2019 Webinar Series. We invite guest speakers to share their knowledge and insight on topics related to carbon emissions attributed to building materials. The series aims to introduce topics that lead participants to think and talk about building industry strategies for reducing carbon emissions.
Mention of trade names or commercial products does not constitute endorsement or recommendation for use. Please note the opinions, ideas, or data presented by speakers in this
series do not represent members of the Embodied Carbon Network or constitute endorsement by the Network.
Embodied Carbon Network November 8, 2019

Logistics
▪ 15-minute Q&A session after presentations
▪ To receive AIA continuing education credit: send your AIA member number to [email protected]
▪ To access past webinar recordings, visit: www.embodiedcarbonnetwork.org/resources
▪ Save the Date!
○ Upcoming Materials Focus Group call - Dec 6th at 9am PST
○ Upcoming webinar: Session 6 - LCA Data and Tools – Dec 13th at 9am PST
Embodied Carbon Network November 8, 2019
Webinar Overview
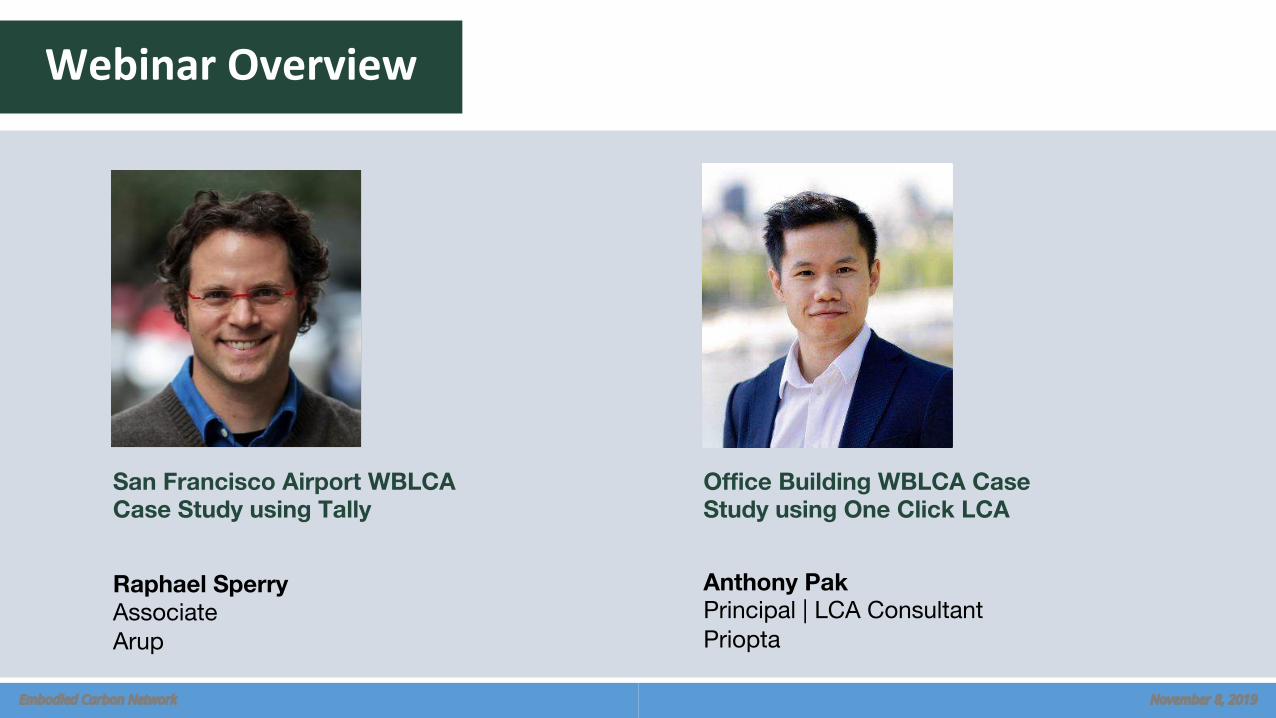
Raphael SperryAssociateArup
San Francisco Airport WBLCA Case Study using Tally
[Placeholder for speaker headshot]
Embodied Carbon Network November 8, 2019
[Placeholder for speaker headshot]
Anthony Pak Principal | LCA ConsultantPriopta
Office Building WBLCA Case Study using One Click LCA
Webinar Overview
[Placeholder for speaker headshot]
Embodied Carbon Network November 8, 2019
[Placeholder for speaker headshot]
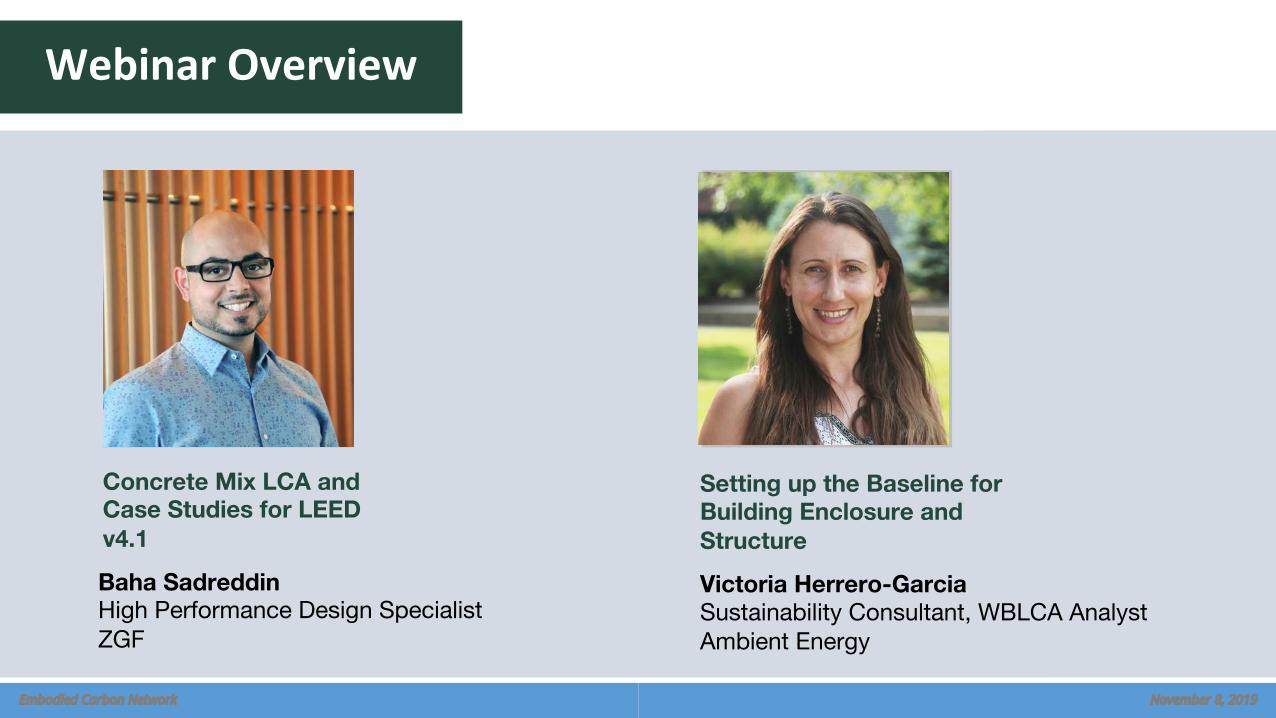
Baha SadreddinHigh Performance Design SpecialistZGF
Concrete Mix LCA and Case Studies for LEED v4.1
Victoria Herrero-GarciaSustainability Consultant, WBLCA AnalystAmbient Energy
Setting up the Baseline for Building Enclosure and Structure
SFO Boarding Area B – Whole Building LCA
Raphael Sperry, AIA, LEED AP BD&C ID&C, WELL APAssociate | SustainabilityArup | San Francisco
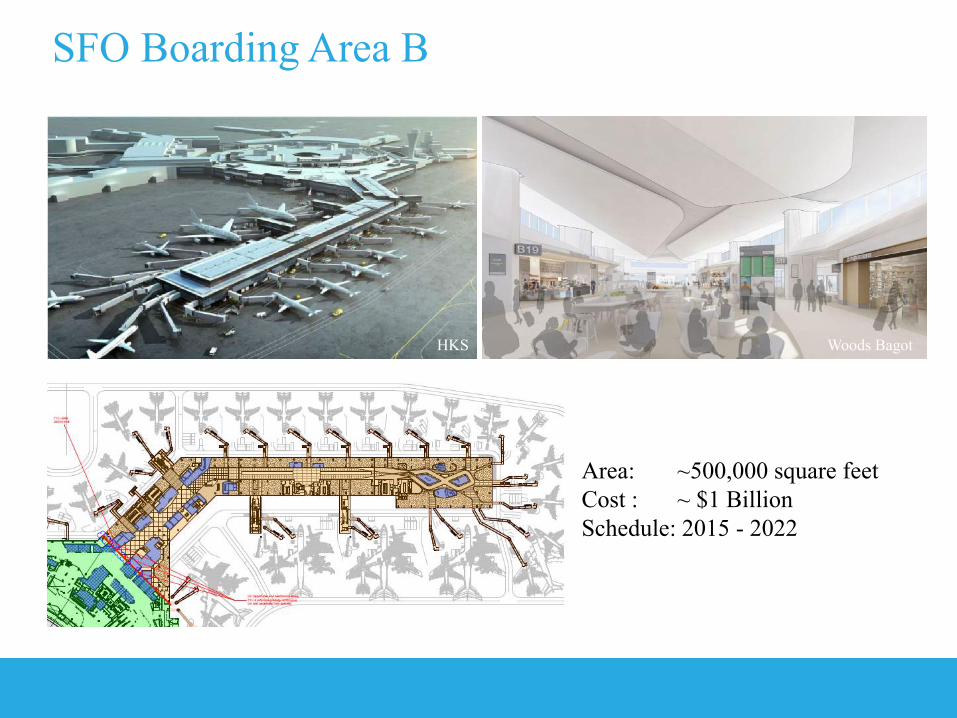
SFO Boarding Area B
HKS Woods Bagot
Area: ~500,000 square feetCost : ~ $1 BillionSchedule: 2015 - 2022
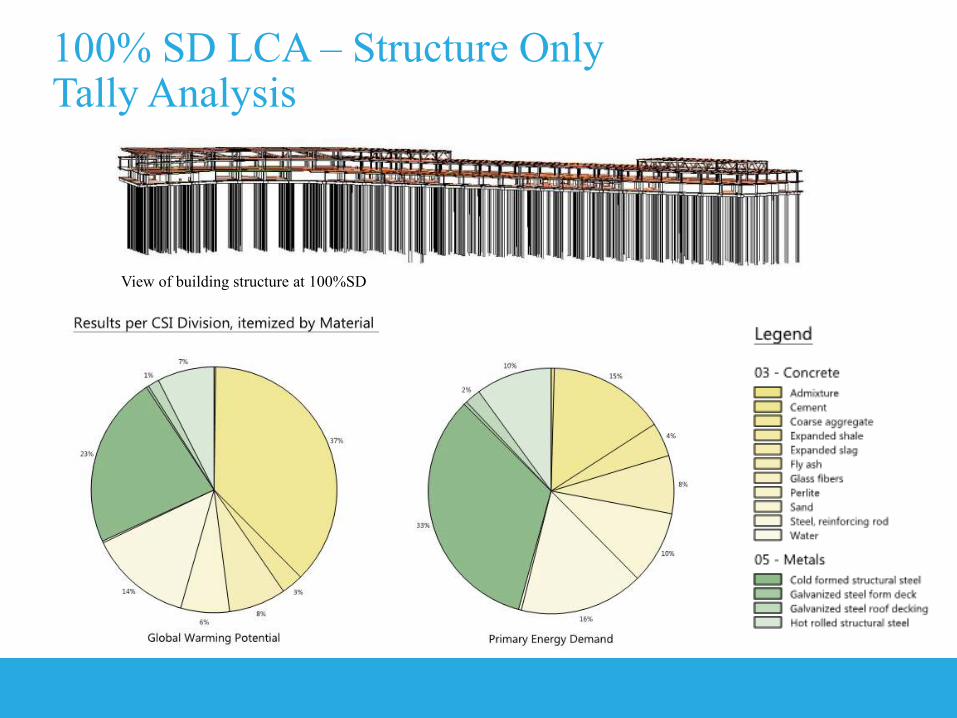
100% SD LCA – Structure OnlyTally Analysis
View of building structure at 100%SD
4
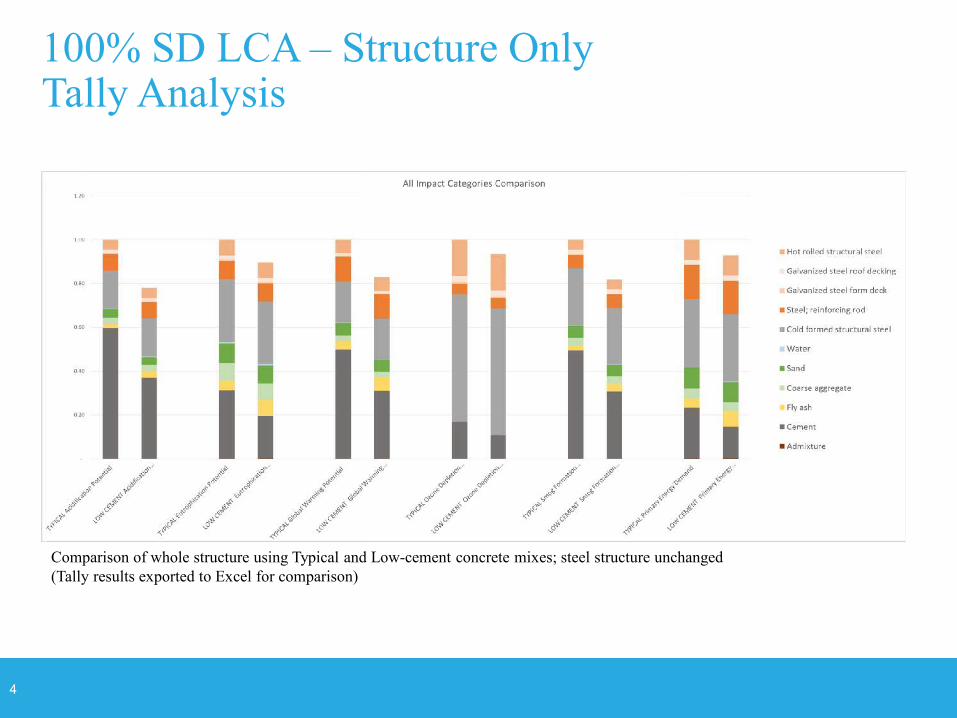
100% SD LCA – Structure OnlyTally Analysis
Comparison of whole structure using Typical and Low-cement concrete mixes; steel structure unchanged(Tally results exported to Excel for comparison)
5
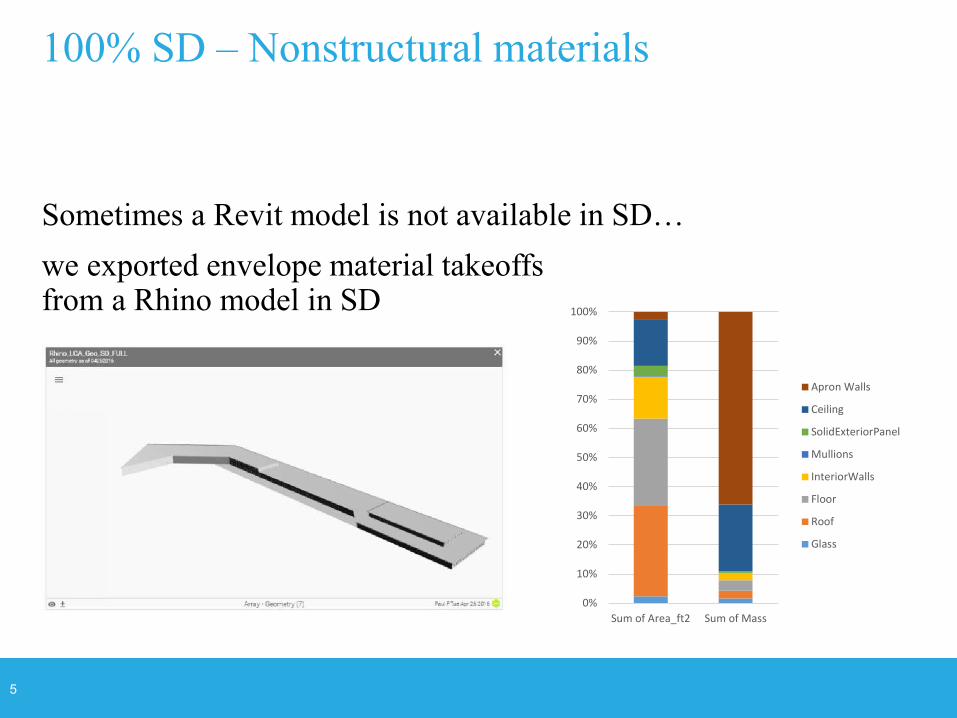
Sometimes a Revit model is not available in SD…we exported envelope material takeoffsfrom a Rhino model in SD
100% SD – Nonstructural materials
0%
10%
20%
30%
40%
50%
60%
70%
80%
90%
100%
Sum of Area_ft2 Sum of Mass
Apron Walls
Ceiling
SolidExteriorPanel
Mullions
InteriorWalls
Floor
Roof
Glass
6
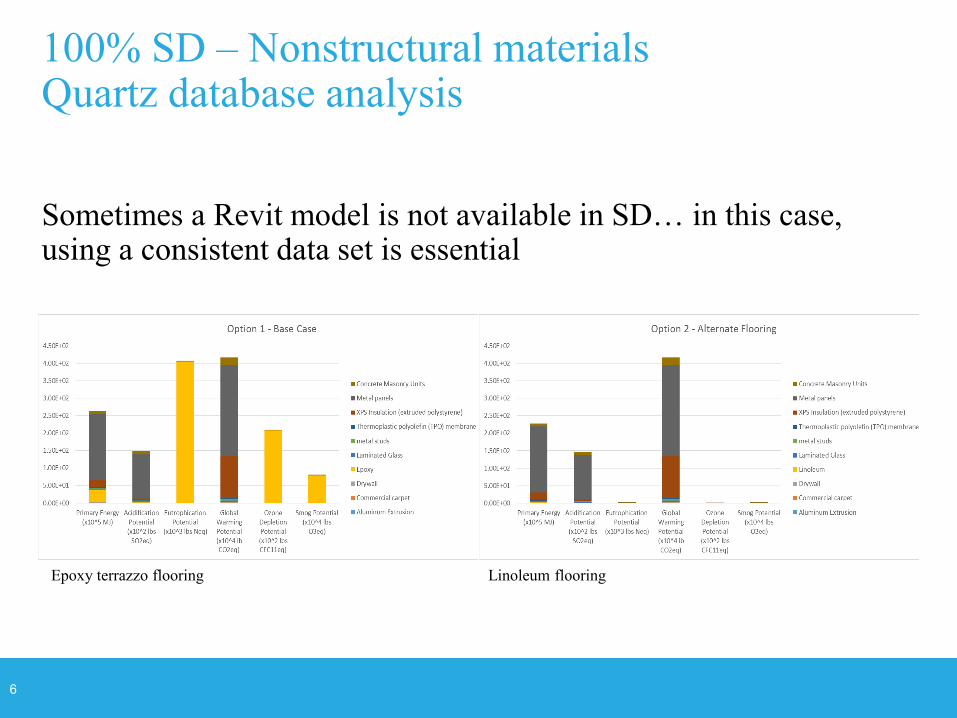
Sometimes a Revit model is not available in SD… in this case, using a consistent data set is essential
100% SD – Nonstructural materialsQuartz database analysis
Epoxy terrazzo flooring Linoleum flooring
7
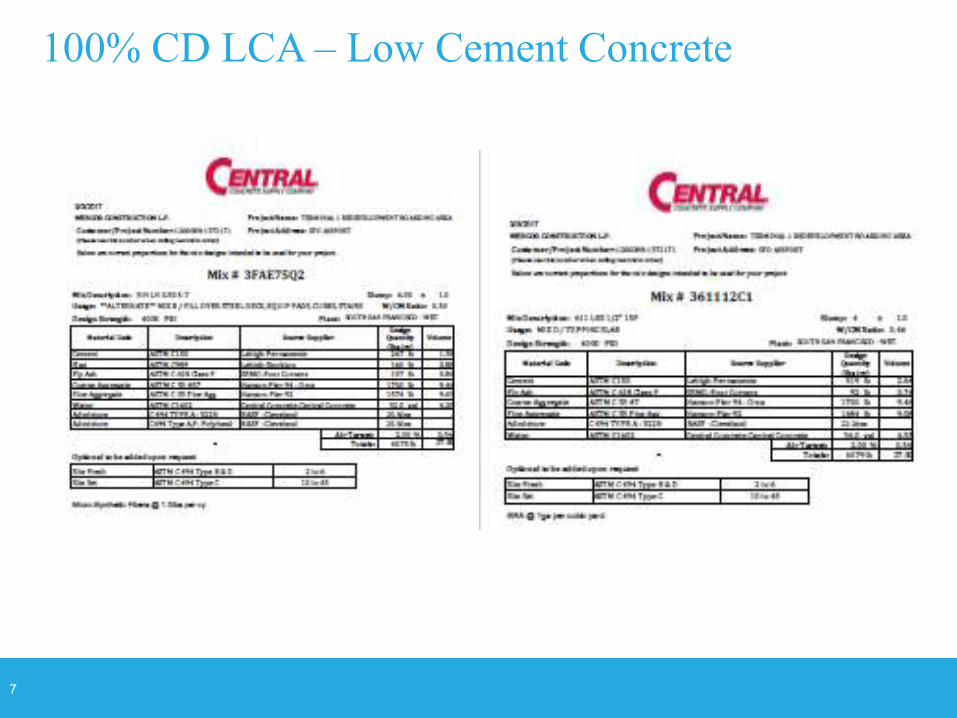
100% CD LCA – Low Cement Concrete
8
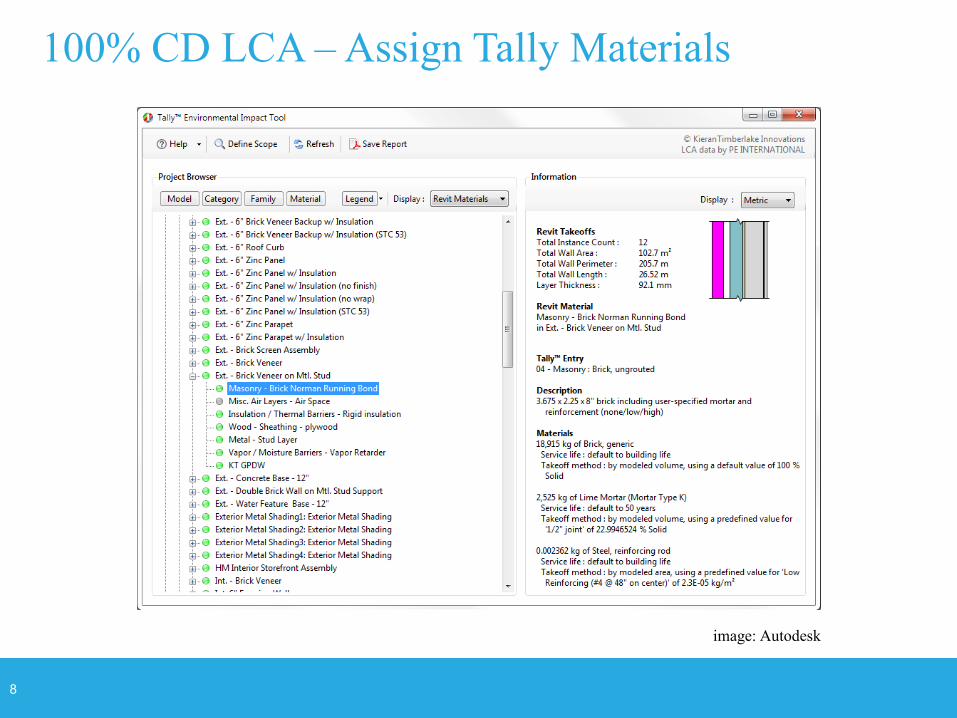
100% CD LCA – Assign Tally Materials
image: Autodesk
9
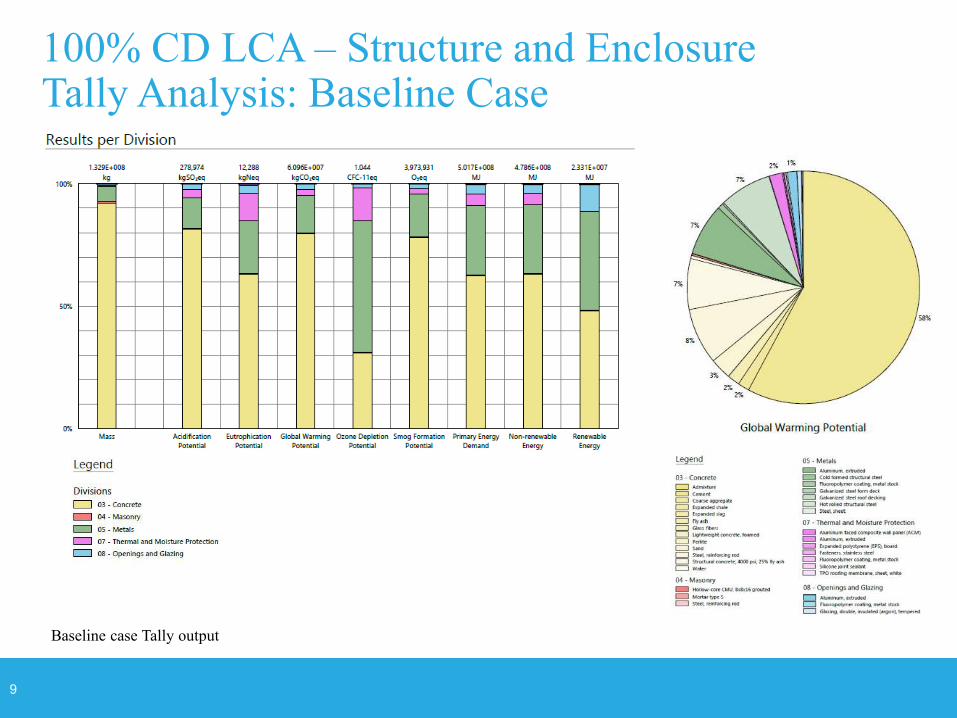
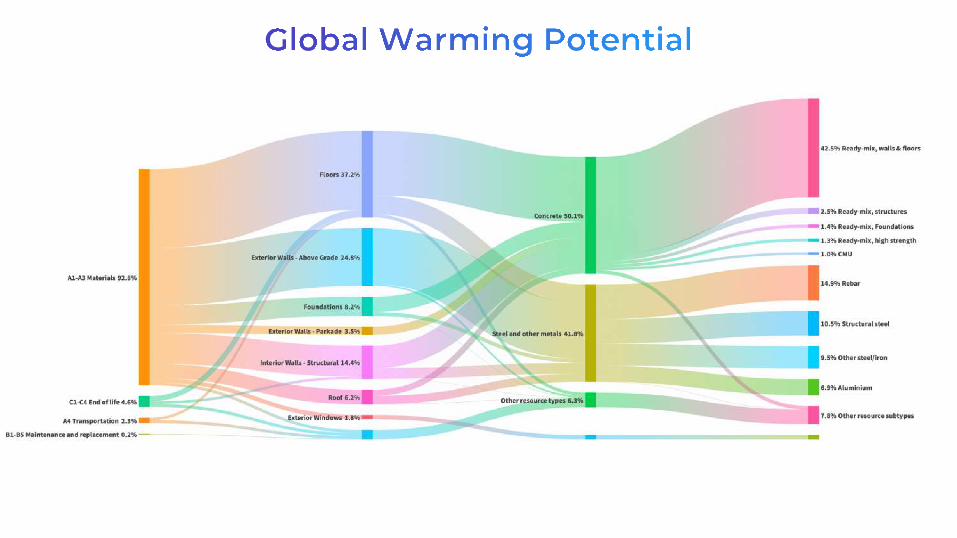
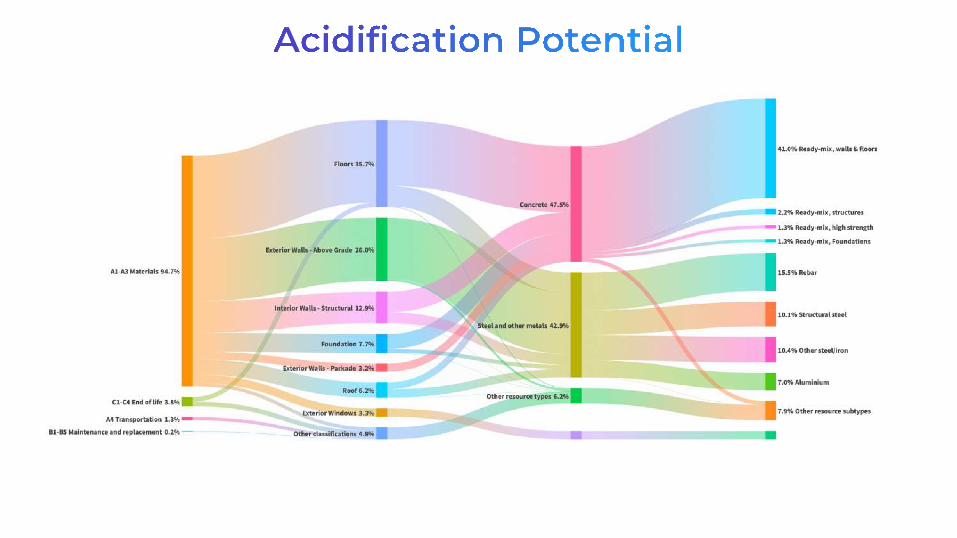
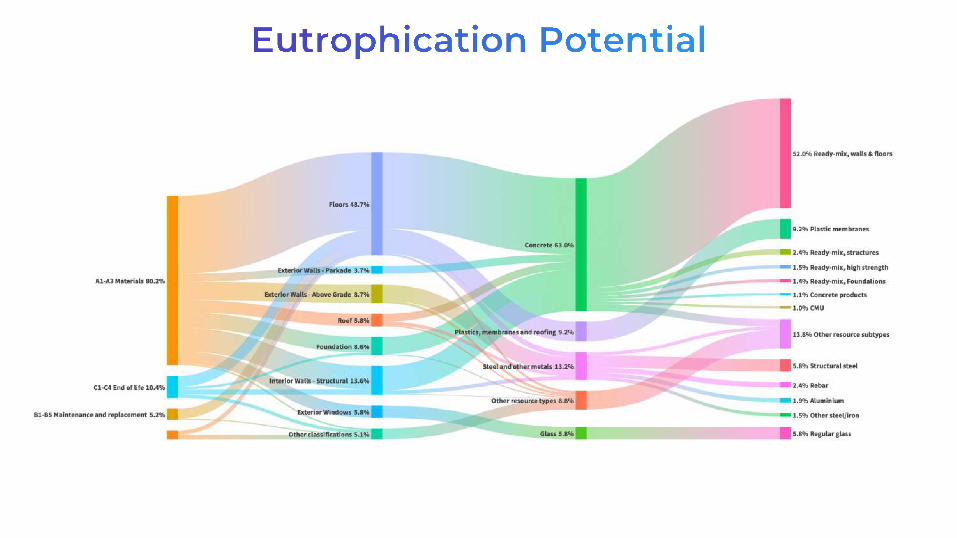
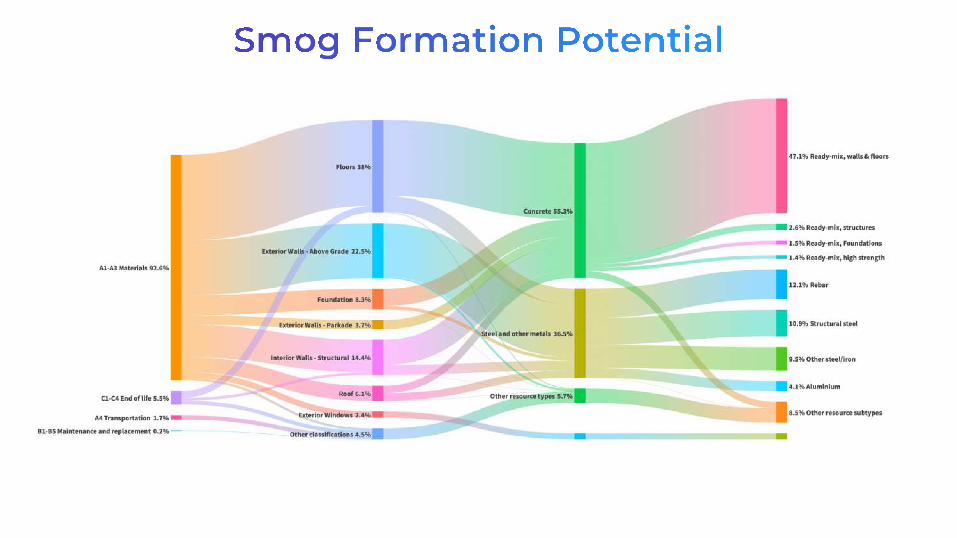
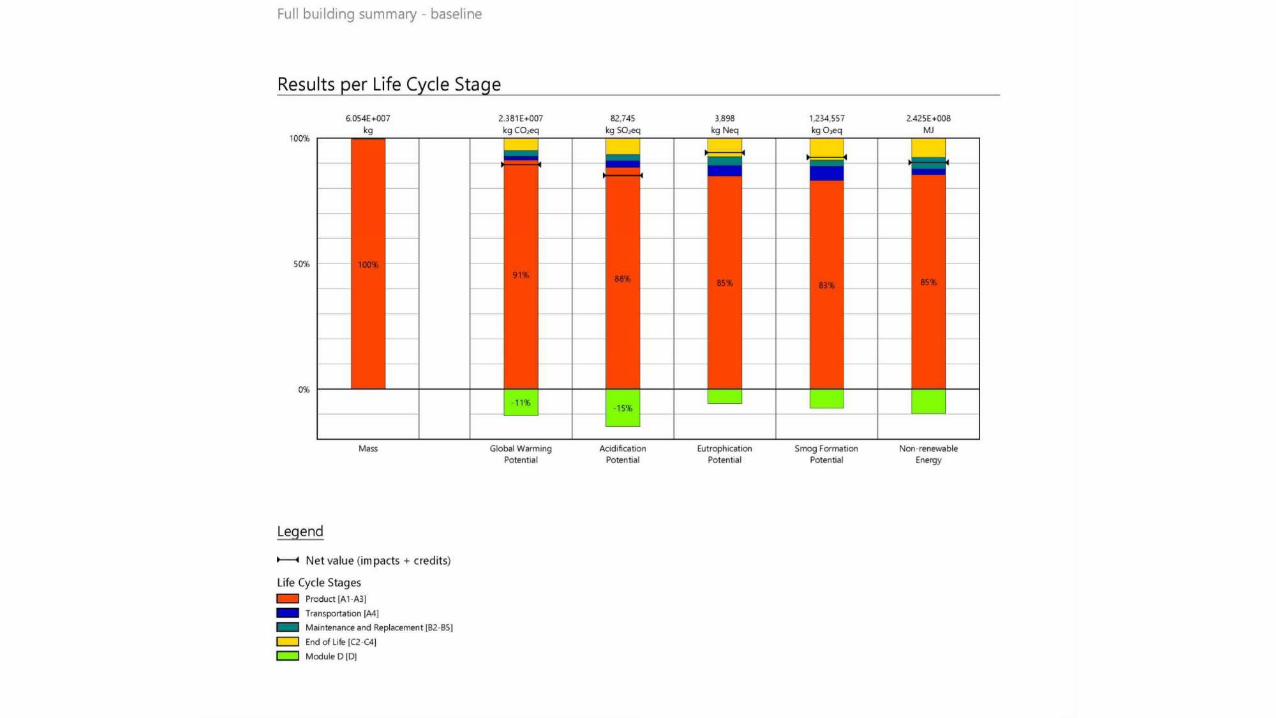
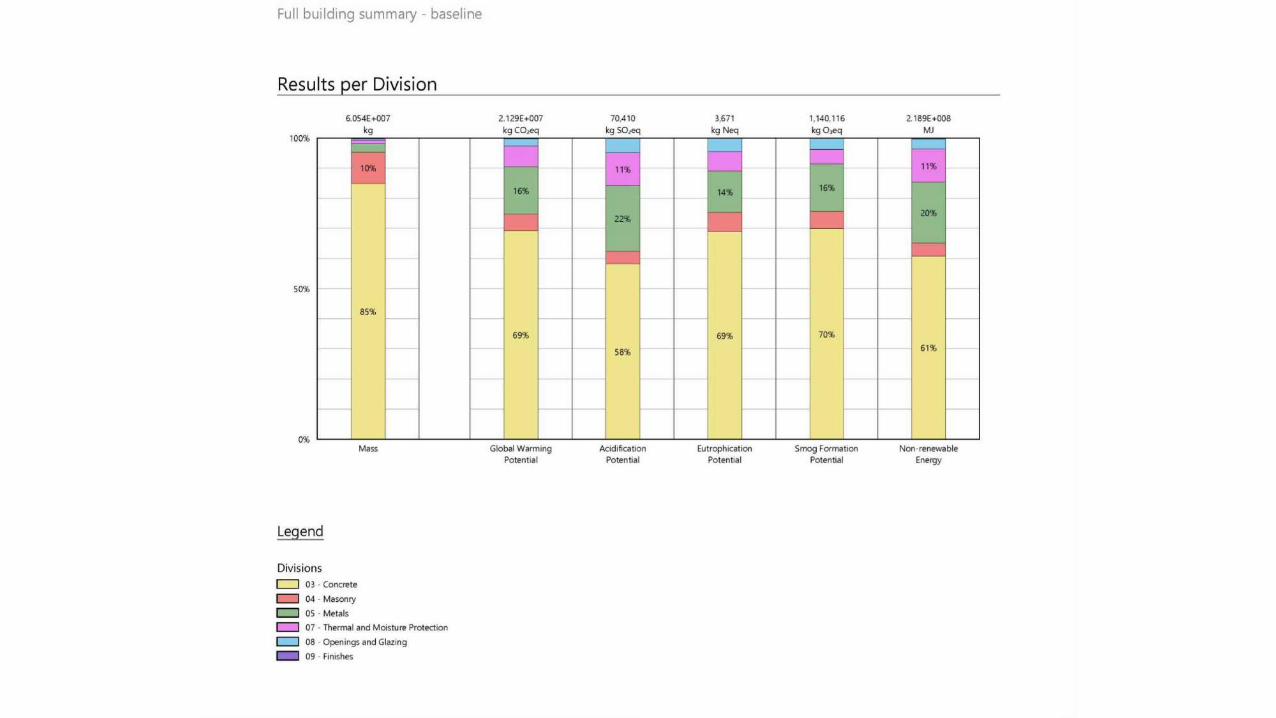
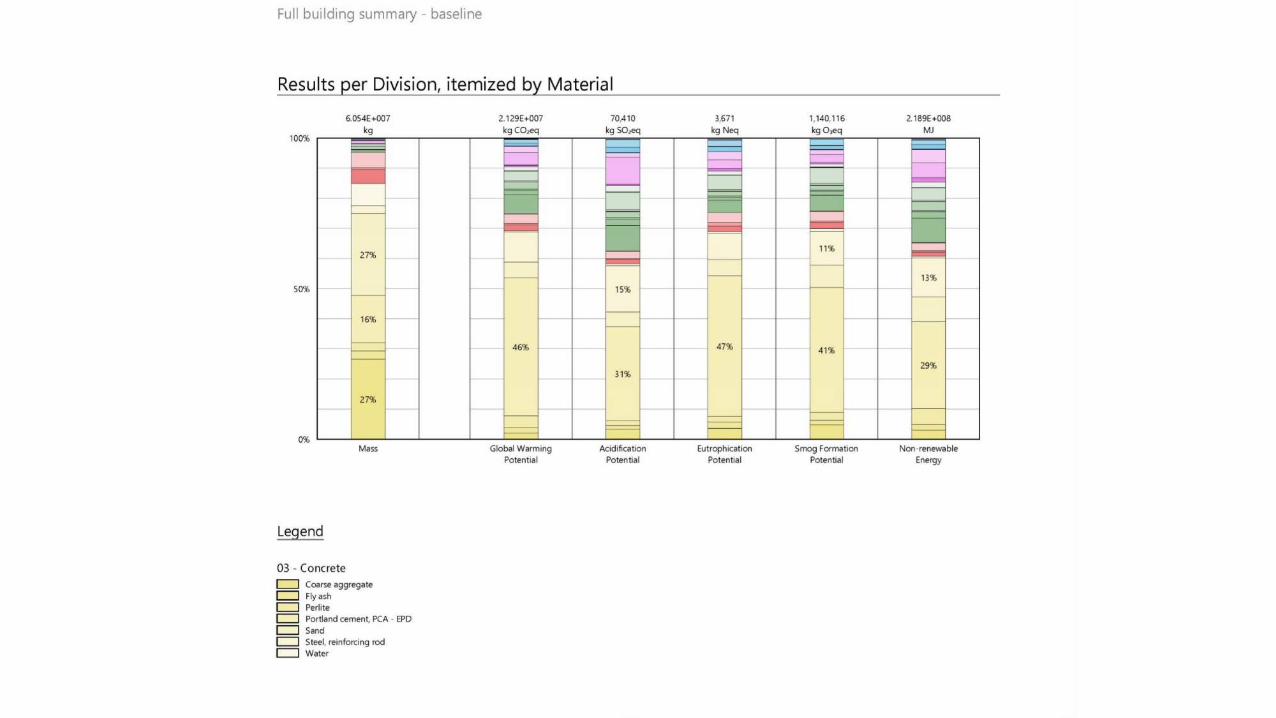
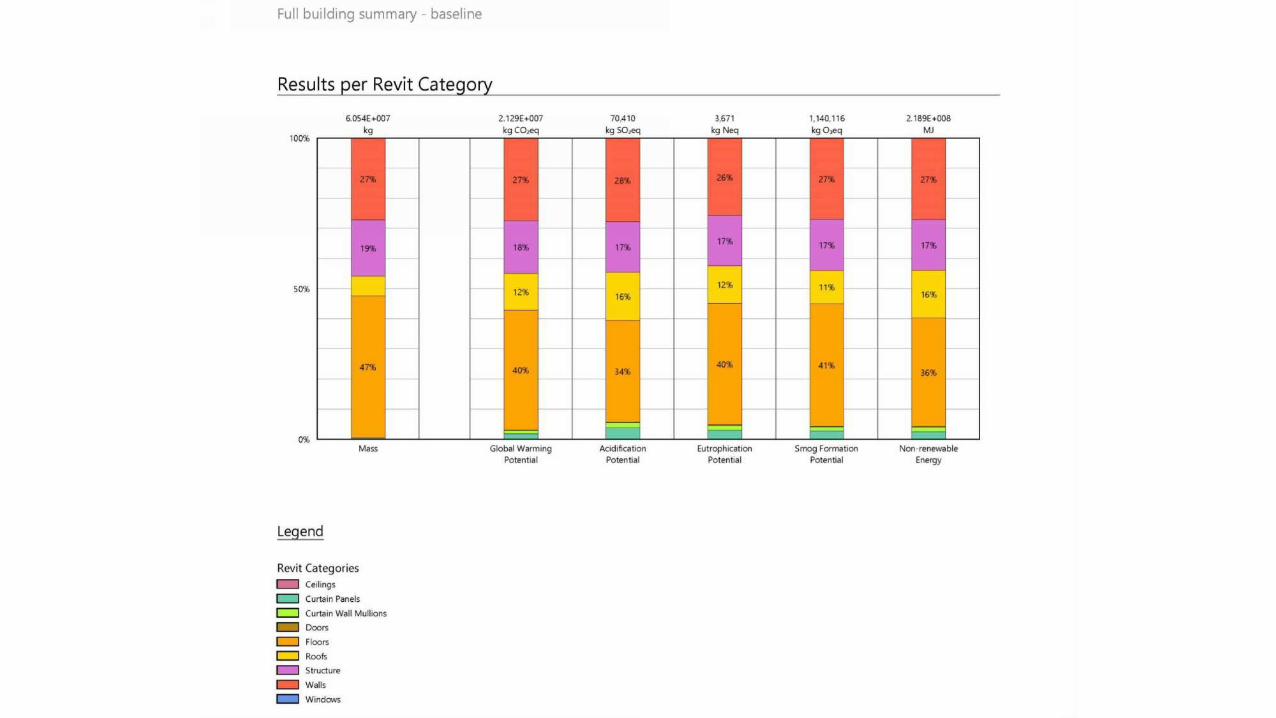
100% CD LCA – Structure and EnclosureTally Analysis: Baseline Case
Baseline case Tally output
10
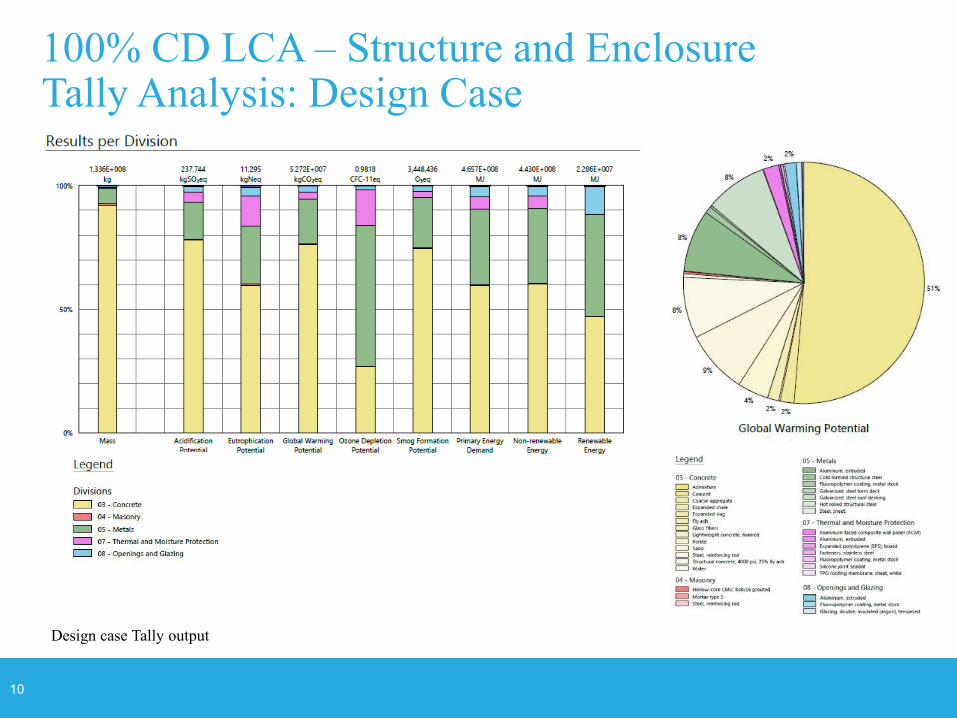
100% CD LCA – Structure and EnclosureTally Analysis: Design Case
Design case Tally output
11
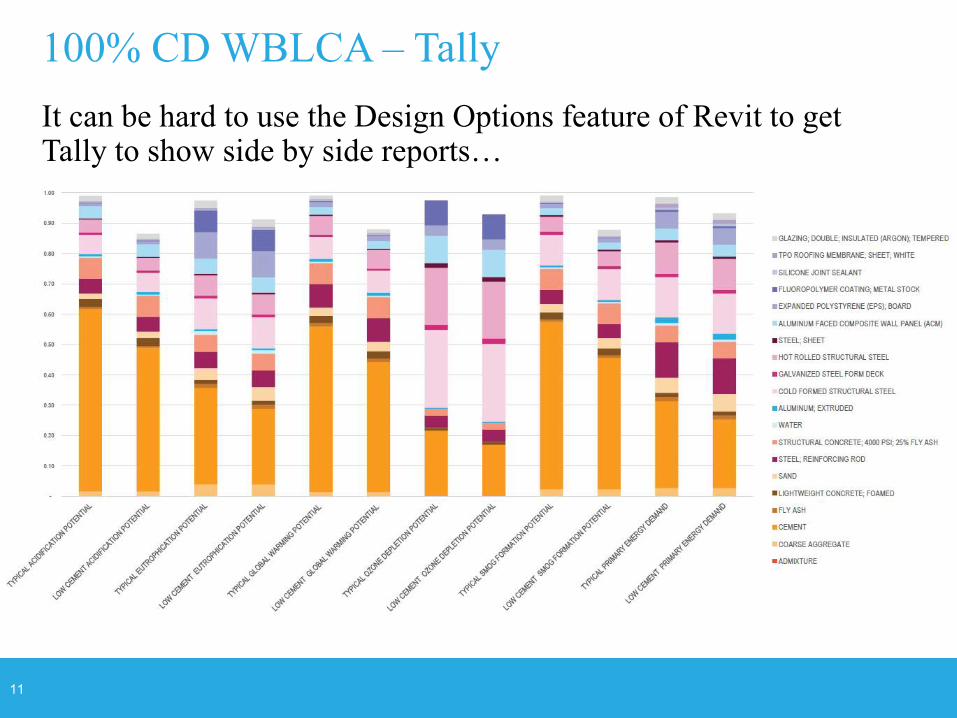
It can be hard to use the Design Options feature of Revit to get Tally to show side by side reports…
100% CD WBLCA – Tally
12
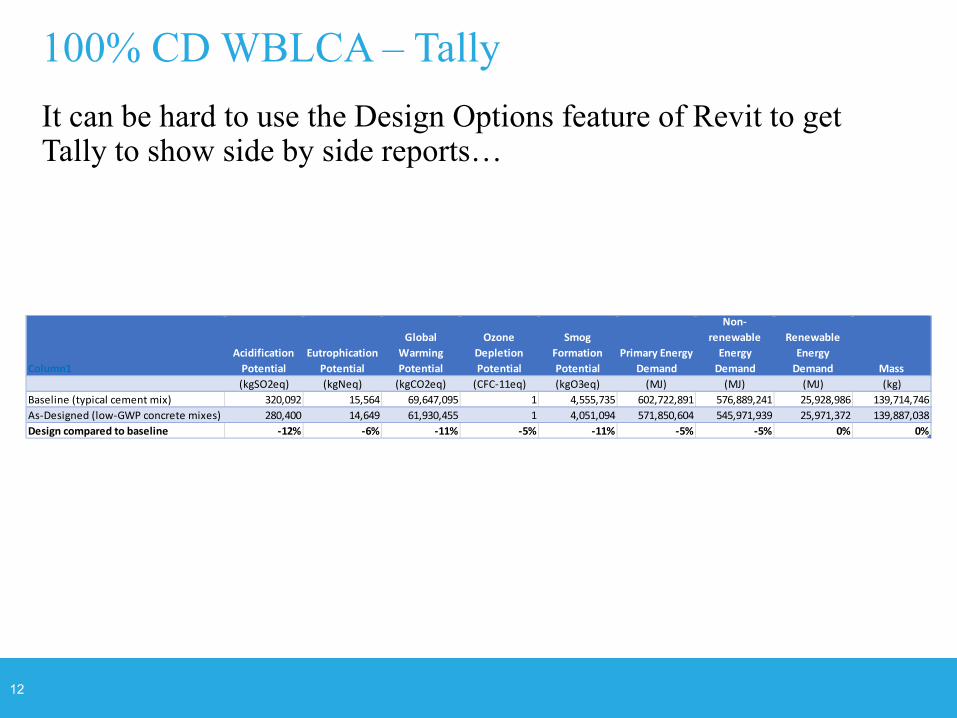
It can be hard to use the Design Options feature of Revit to get Tally to show side by side reports…
100% CD WBLCA – Tally
Column1Acidification
PotentialEutrophication
Potential
Global Warming Potential
Ozone Depletion Potential
Smog Formation Potential
Primary Energy Demand
Non-renewable
Energy Demand
Renewable Energy
Demand Mass(kgSO2eq) (kgNeq) (kgCO2eq) (CFC-11eq) (kgO3eq) (MJ) (MJ) (MJ) (kg)
Baseline (typical cement mix) 320,092 15,564 69,647,095 1 4,555,735 602,722,891 576,889,241 25,928,986 139,714,746As-Designed (low-GWP concrete mixes) 280,400 14,649 61,930,455 1 4,051,094 571,850,604 545,971,939 25,971,372 139,887,038Design compared to baseline -12% -6% -11% -5% -11% -5% -5% 0% 0%
Thank you!
Raphael Sperry, AIA, LEED AP BD&C ID&C, WELL APAssociate | SustainabilityArup | San Francisco
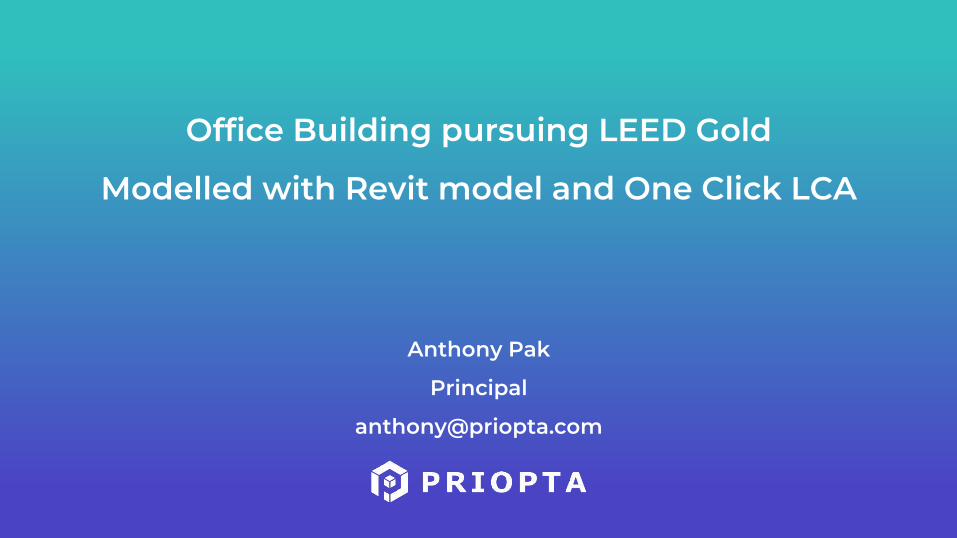
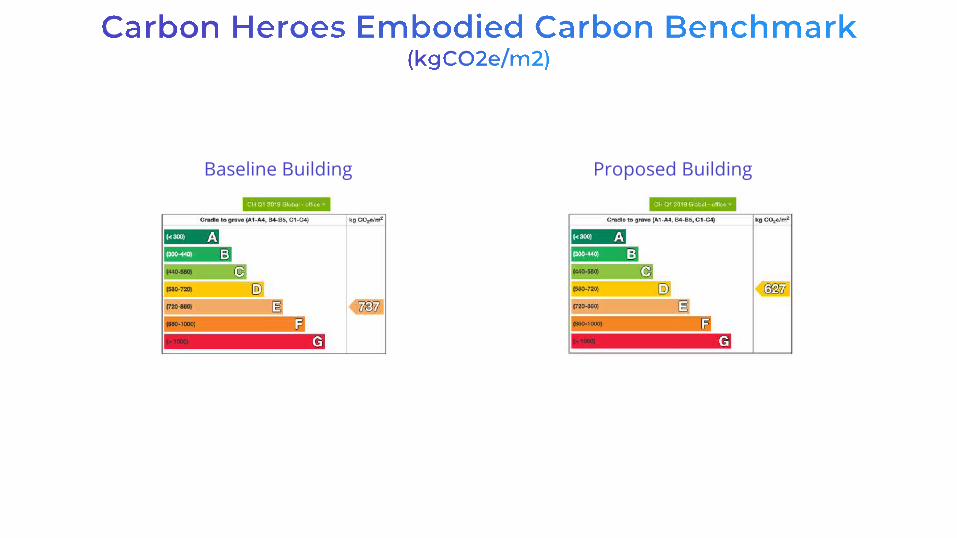
Office Building pursuing LEED Gold
Modelled with Revit model and One Click LCA
Anthony Pak
Principal
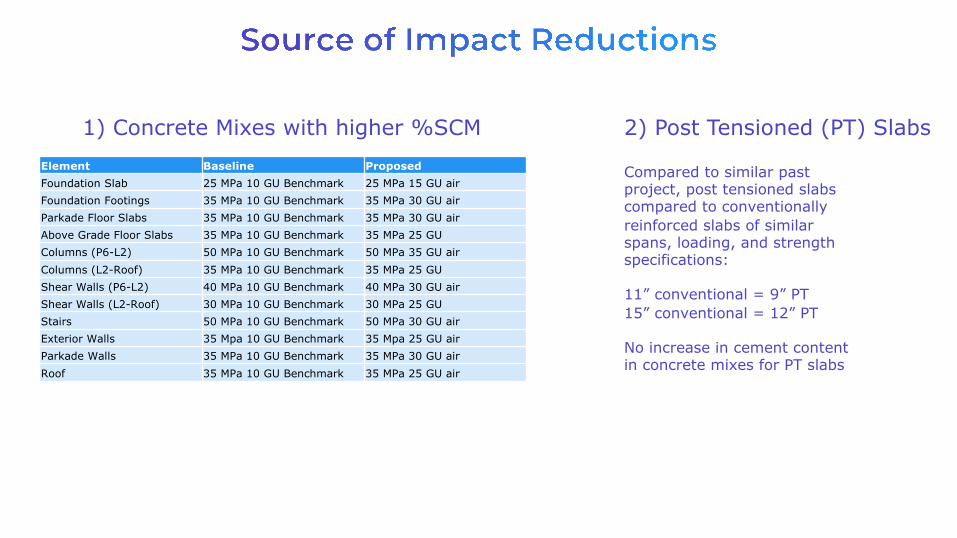
Element Baseline ProposedFoundation Slab 25 MPa 10 GU Benchmark 25 MPa 15 GU airFoundation Footings 35 MPa 10 GU Benchmark 35 MPa 30 GU airParkade Floor Slabs 35 MPa 10 GU Benchmark 35 MPa 30 GU airAbove Grade Floor Slabs 35 MPa 10 GU Benchmark 35 MPa 25 GUColumns (P6-L2) 50 MPa 10 GU Benchmark 50 MPa 35 GU airColumns (L2-Roof) 35 MPa 10 GU Benchmark 35 MPa 25 GUShear Walls (P6-L2) 40 MPa 10 GU Benchmark 40 MPa 30 GU airShear Walls (L2-Roof) 30 MPa 10 GU Benchmark 30 MPa 25 GUStairs 50 MPa 10 GU Benchmark 50 MPa 30 GU airExterior Walls 35 Mpa 10 GU Benchmark 35 Mpa 25 GU airParkade Walls 35 MPa 10 GU Benchmark 35 MPa 30 GU airRoof 35 MPa 10 GU Benchmark 35 MPa 25 GU air
1) Concrete Mixes with higher %SCM 2) Post Tensioned (PT) Slabs
Compared to similar past project, post tensioned slabs compared to conventionally reinforced slabs of similar spans, loading, and strength specifications:
11” conventional = 9” PT15” conventional = 12” PT
No increase in cement content in concrete mixes for PT slabs
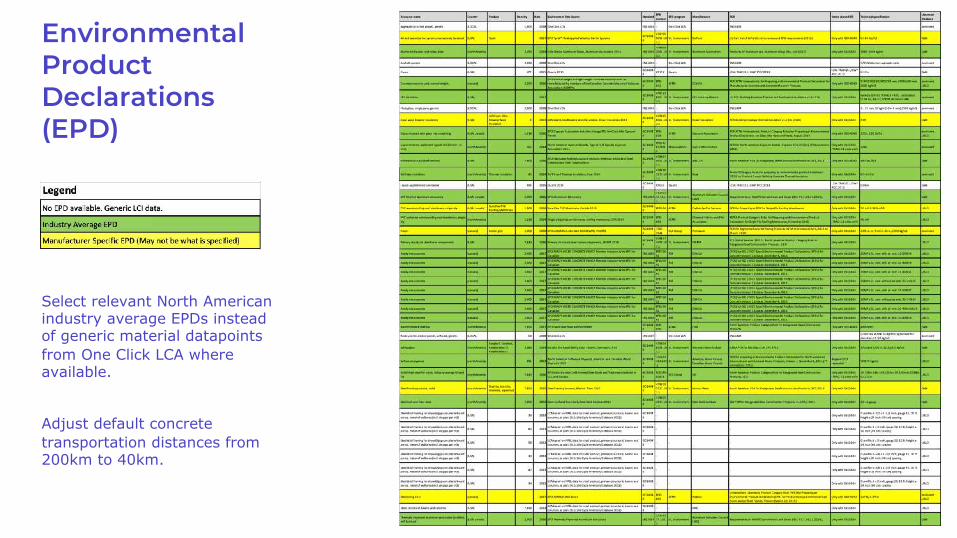
Environmental Product Declarations (EPD)
Select relevant North American industry average EPDs instead of generic material datapoints from One Click LCA where available.
Adjust default concrete transportation distances from 200km to 40km.

14.9%
12.3%
14.3%
0.0%
13.6%
11.2%
0%
2%
4%
6%
8%
10%
12%
14%
16%
Global warming(kg CO2e)
Acidification(kg SO2e)
Eutrophication(kg Ne)
Ozone Depletion(kg CFC11e)
Formation oftropospheric
ozone(kg O3e)
Depletion ofnonrenewable
energy(MJ)
Proposed BuildingBaseline Building
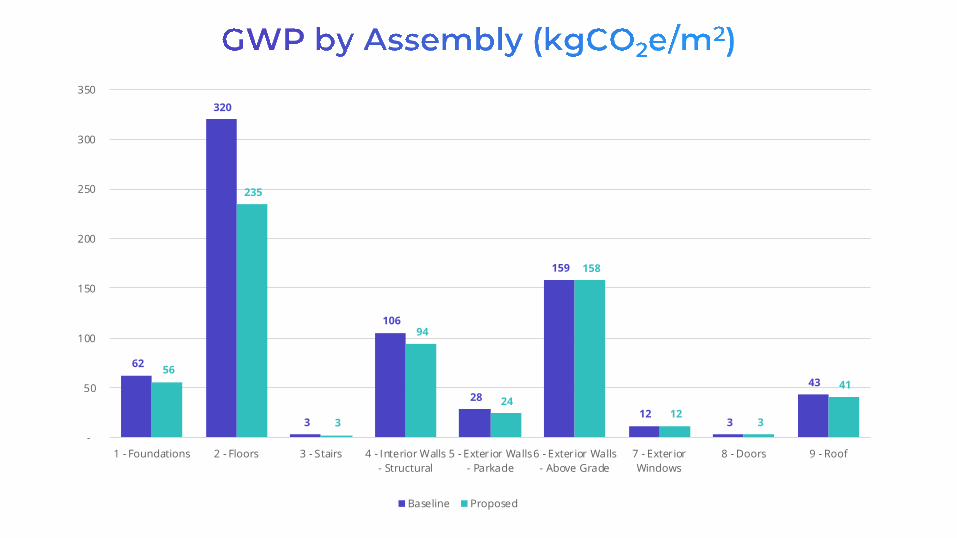
62
320
3
106
28
159
12 3
43 56
235
3
94
24
158
12 3
41
-
50
100
150
200
250
300
350
1 - Foundations 2 - Floors 3 - Stairs 4 - Interior Walls- Structural
5 - Exterior Walls- Parkade
6 - Exterior Walls- Above Grade
7 - ExteriorWindows
8 - Doors 9 - Roof
Baseline Proposed
0.8%
11.6% 0.0%
1.6% 0.1%0.5% 0.0% 0.0% 0.3%
-14.9%
Foun
datio
ns
Floor
s
Stair
sIn
terio
r Wall
s -St
ruct
ural
Exte
rior W
alls -
Abov
e Gra
deEx
terio
r Wall
s -Pa
rkad
e
Exte
rior W
indo
ws
Door
s
Roof
Tota
l Red
uctio
n
0.0%
2.0%
4.0%
6.0%
8.0%
10.0%
12.0%
14.0%
16.0%
WBLCA Workflow and Concrete
Baha Sadreddin
High-Performance Design Specialist
ZGF Architects
Why LCA?
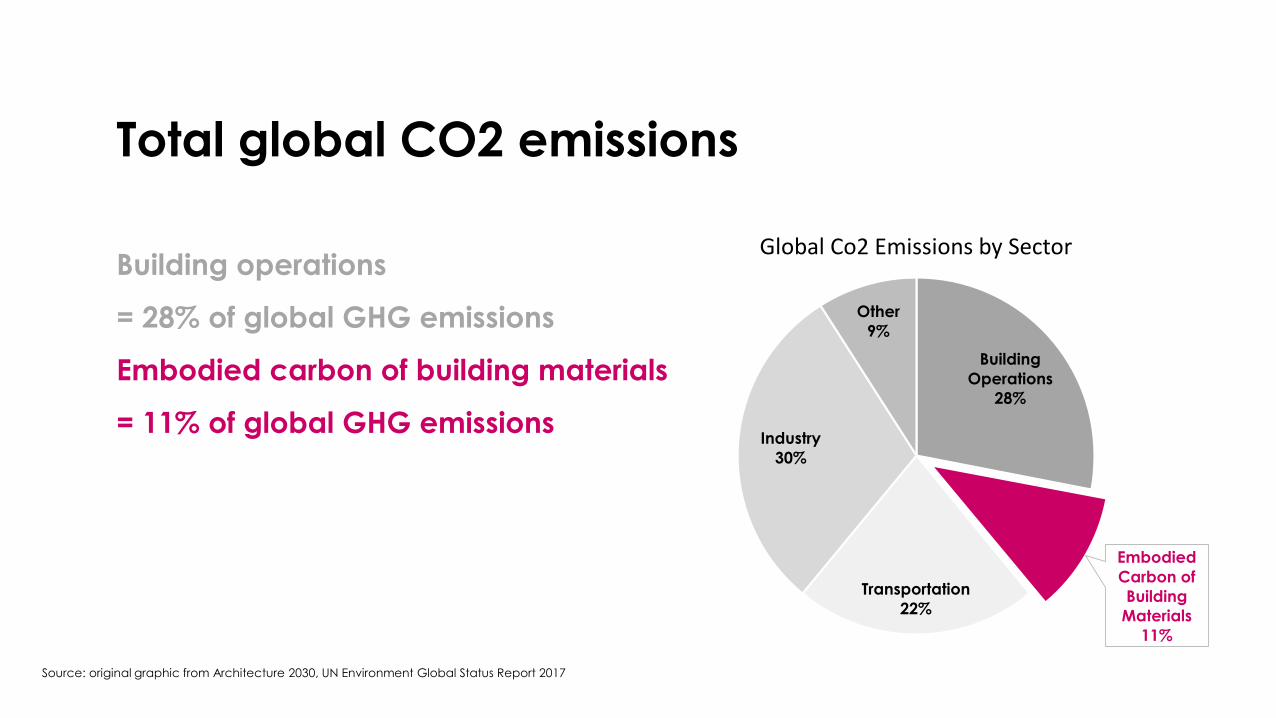
Total global CO2 emissions
Building operations
= 28% of global GHG emissions
Embodied carbon of building materials
= 11% of global GHG emissions
Source: original graphic from Architecture 2030, UN Environment Global Status Report 2017
Building Operations
28%
Embodied Carbon of Building
Materials11%
Transportation22%
Industry30%
Other9%
Global Co2 Emissions by Sector
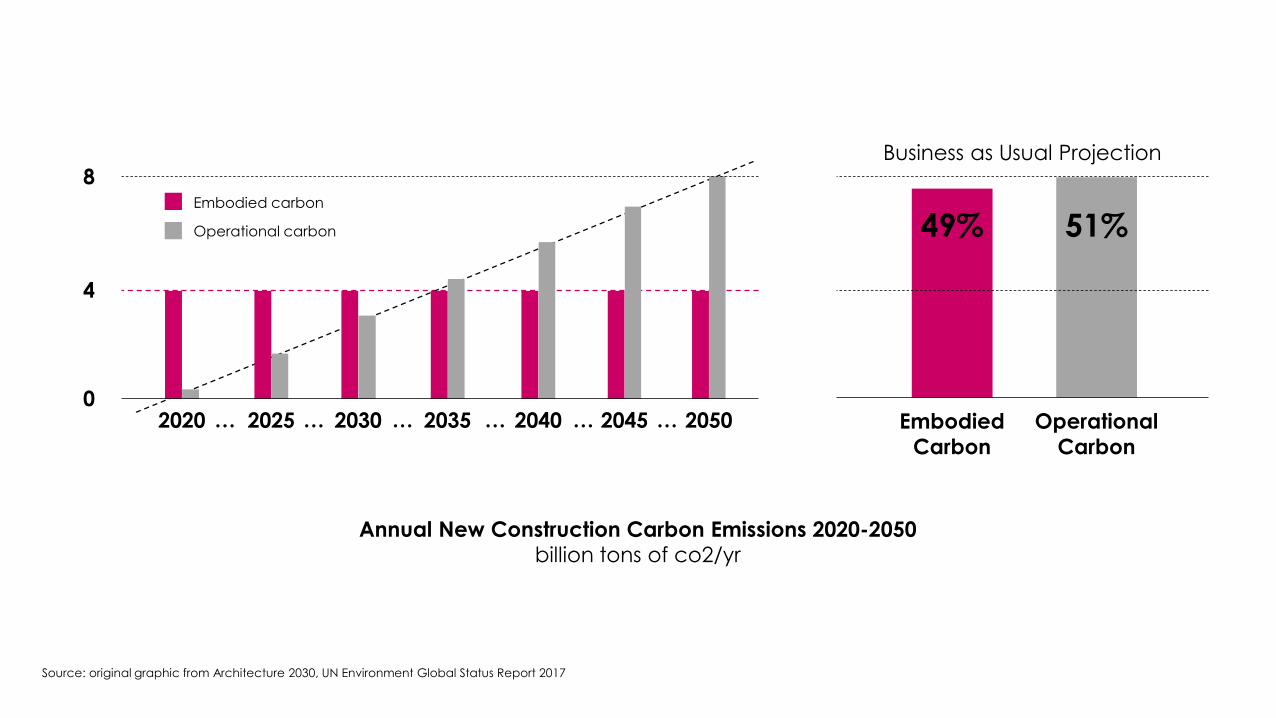
2020 2025 2030 2035 2040 2045 2050
Annual New Construction Carbon Emissions 2020-2050billion tons of co2/yr
0
4
8
Source: original graphic from Architecture 2030, UN Environment Global Status Report 2017
Embodied carbon
Operational carbon
… … … … … …
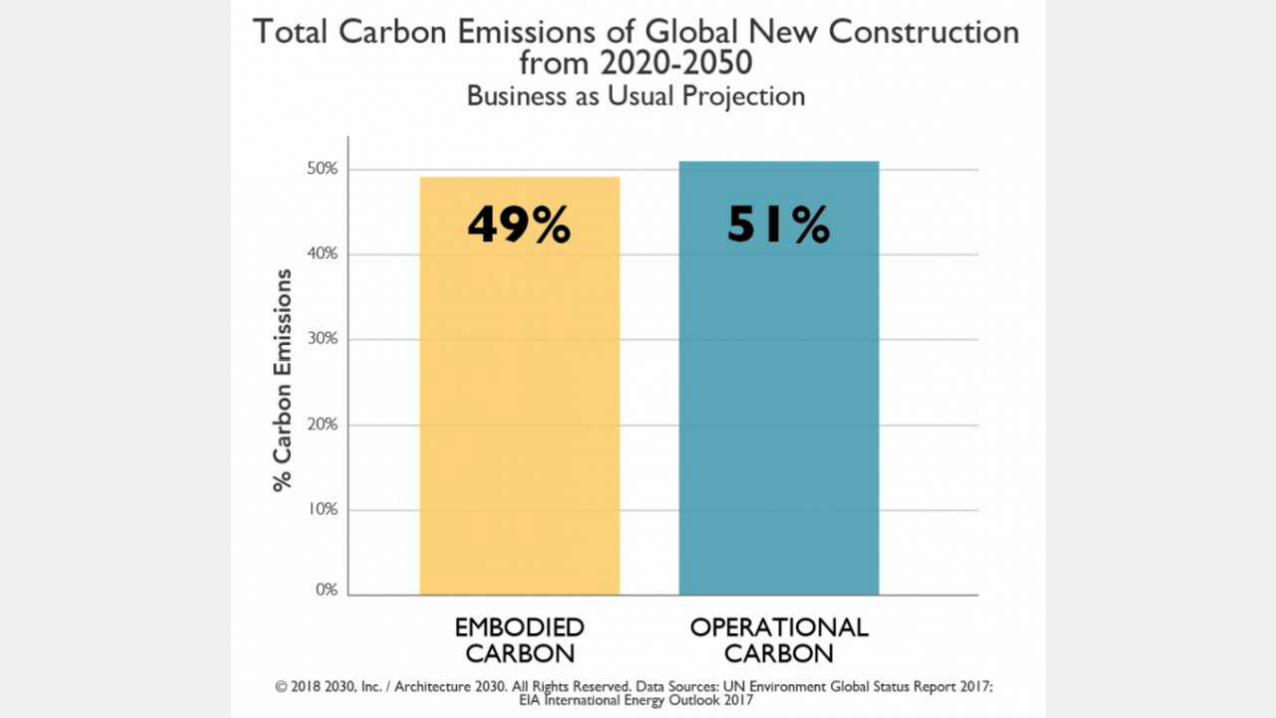
49%
EmbodiedCarbon
51%
OperationalCarbon
Business as Usual Projection
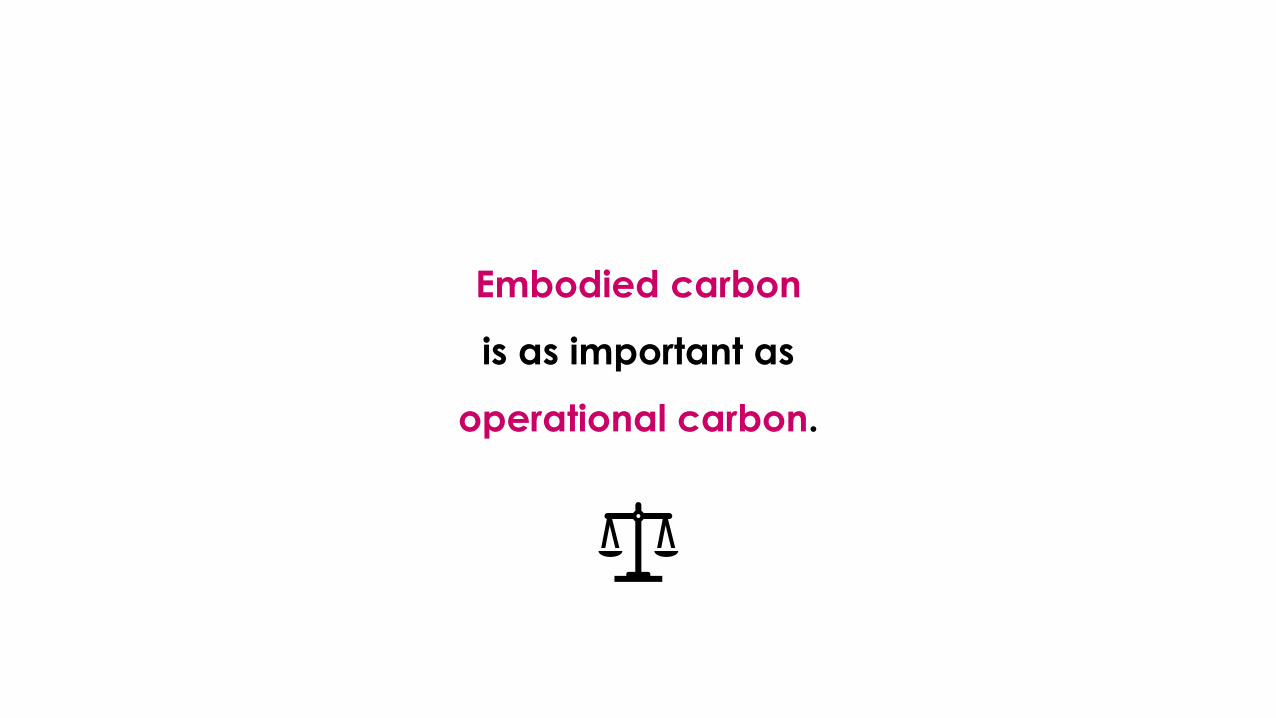
Embodied carbon
is as important as
operational carbon.
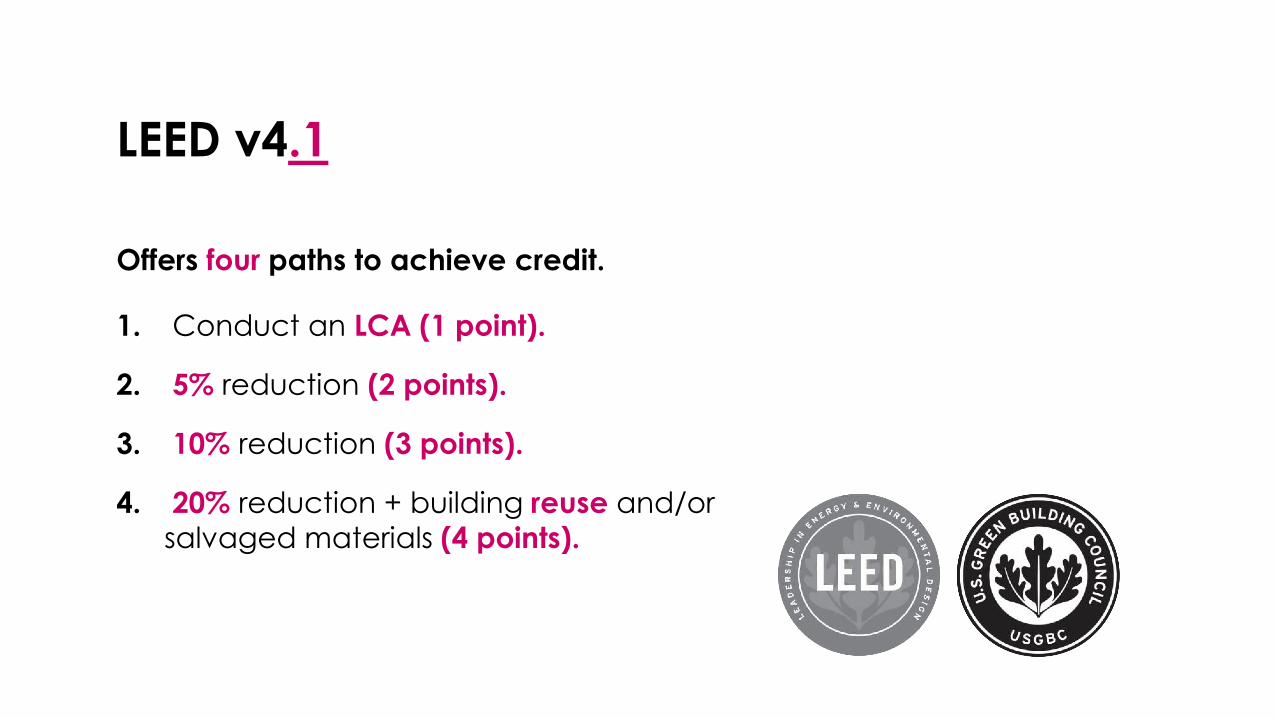
LEED v4.1
Offers four paths to achieve credit.
1. Conduct an LCA (1 point).
2. 5% reduction (2 points).
3. 10% reduction (3 points).
4. 20% reduction + building reuse and/or salvaged materials (4 points).

Workflow through case studies
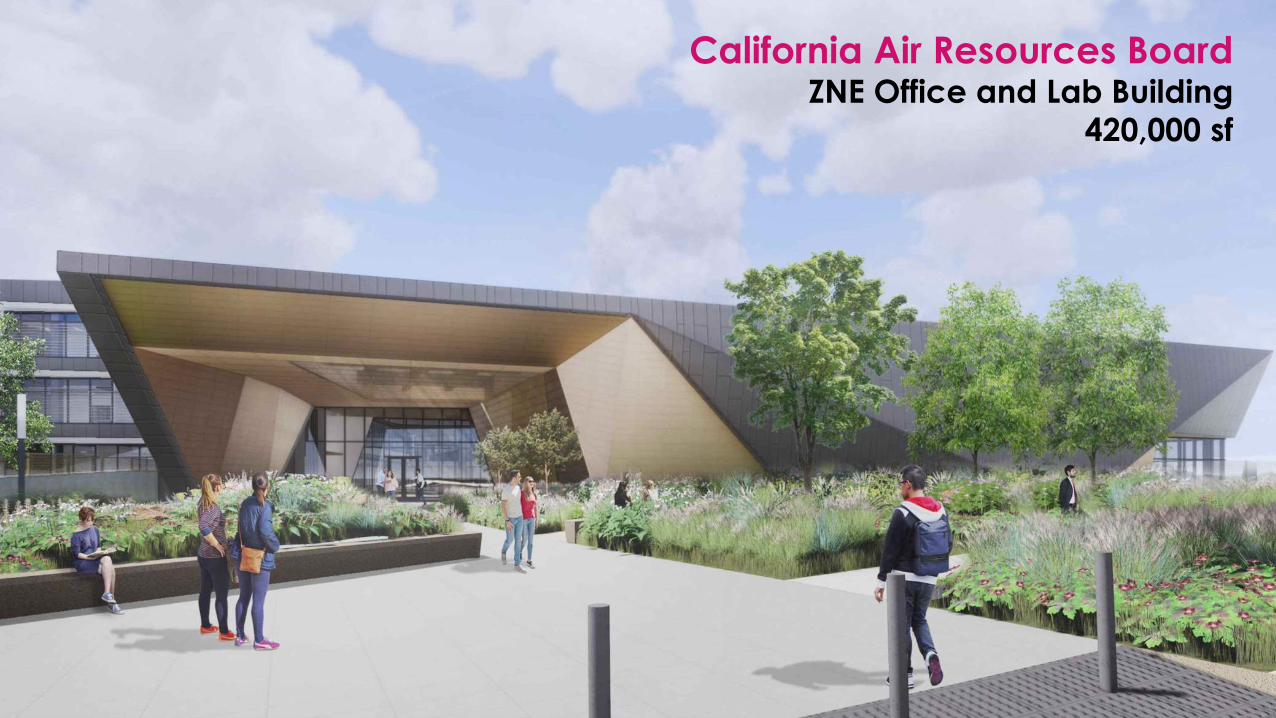
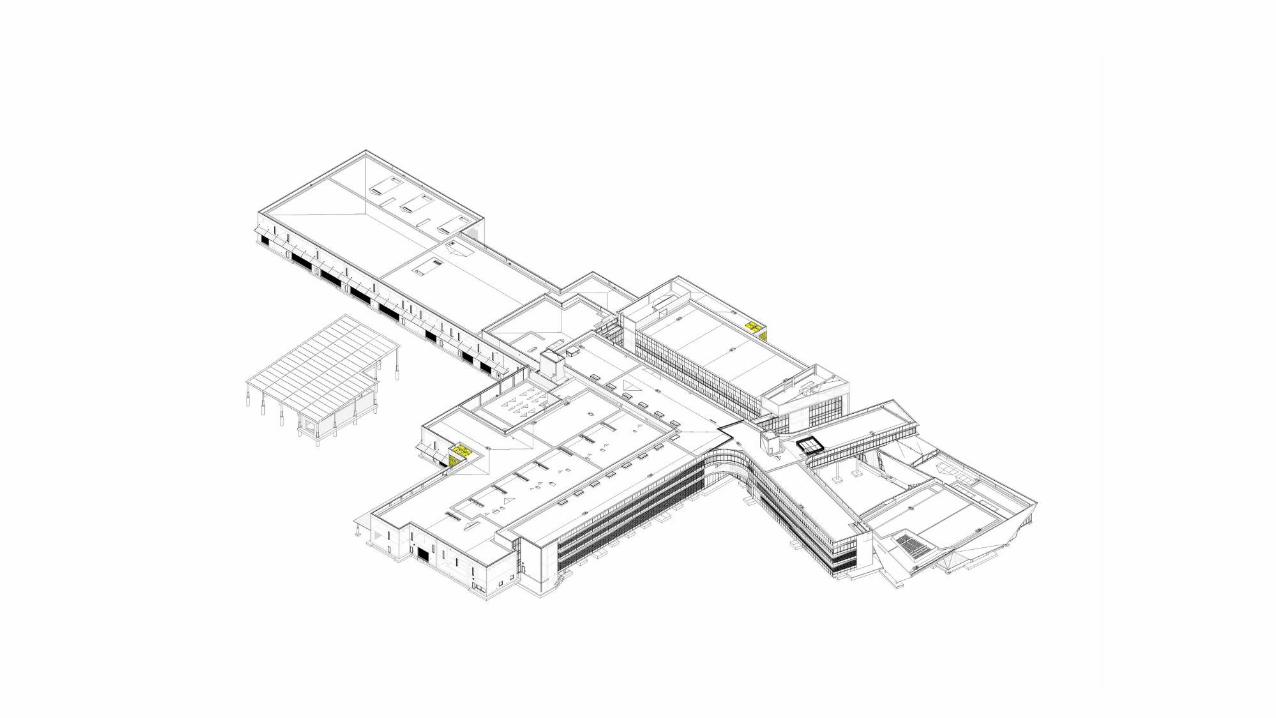
California Air Resources BoardZNE Office and Lab Building
420,000 sf
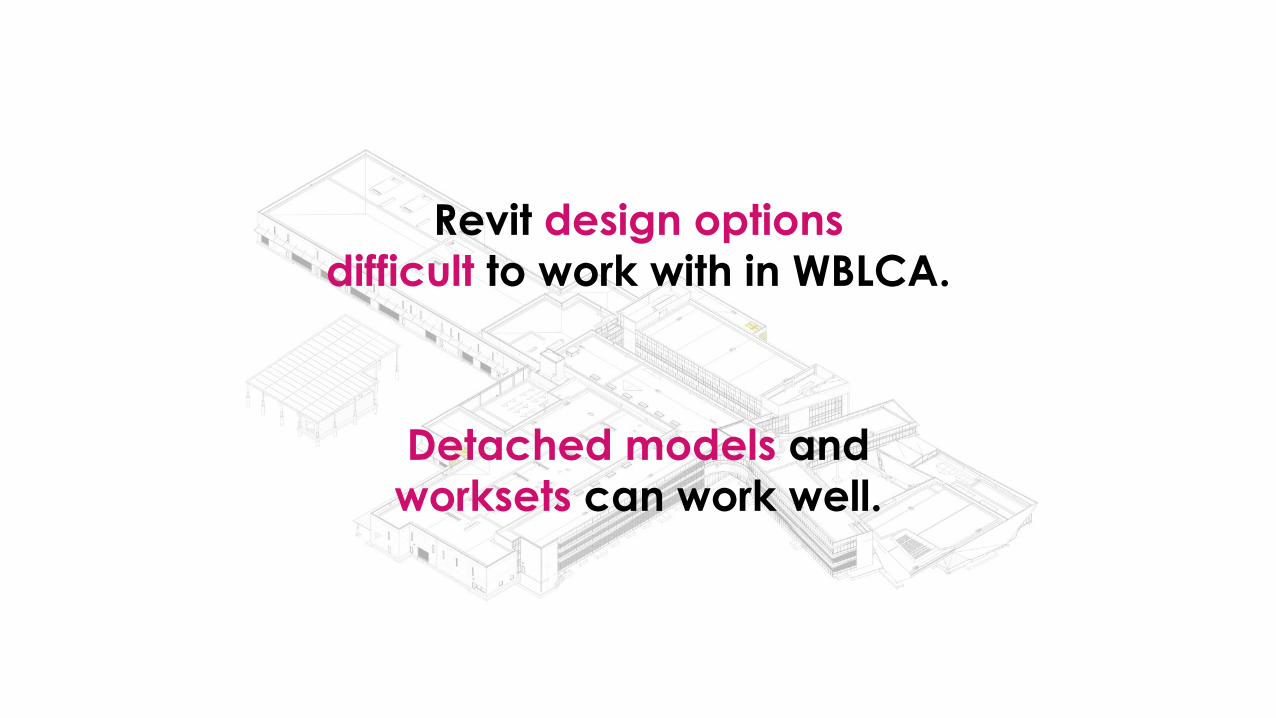
Revit design optionsdifficult to work with in WBLCA.
Detached models andworksets can work well.
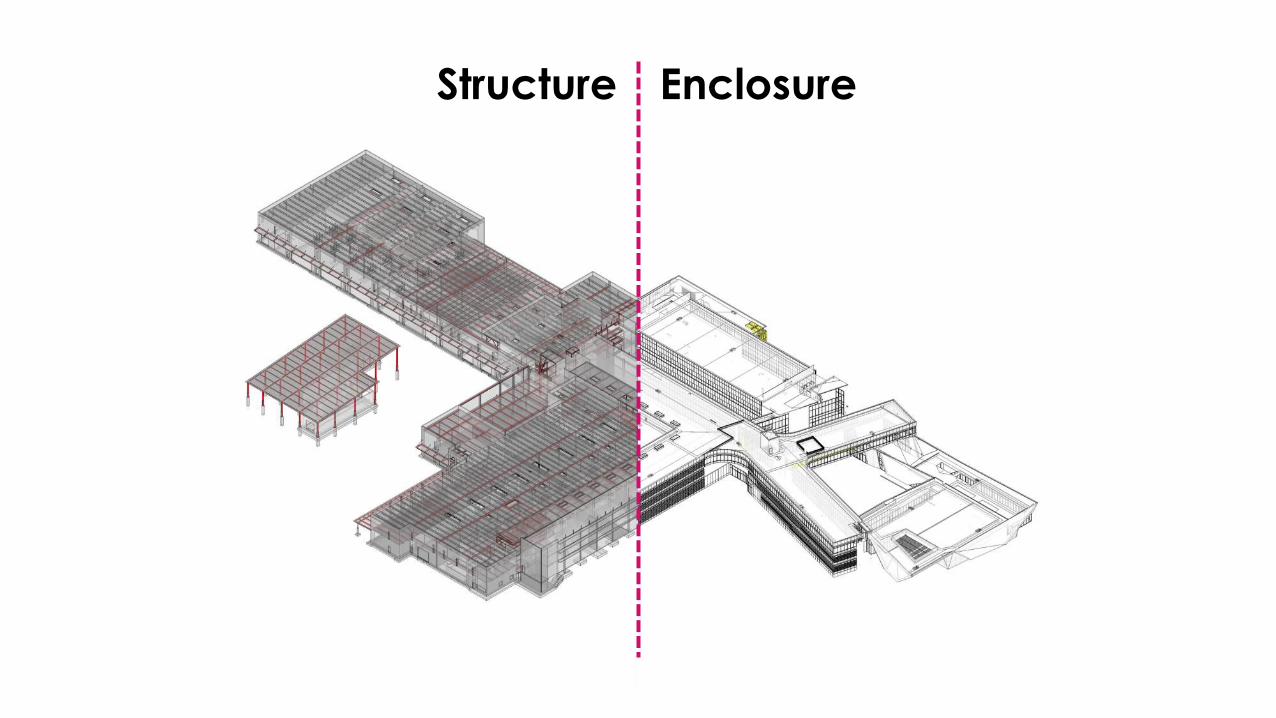
Structure Enclosure
Proposed StructureModel
Baseline StructureModel
Structure
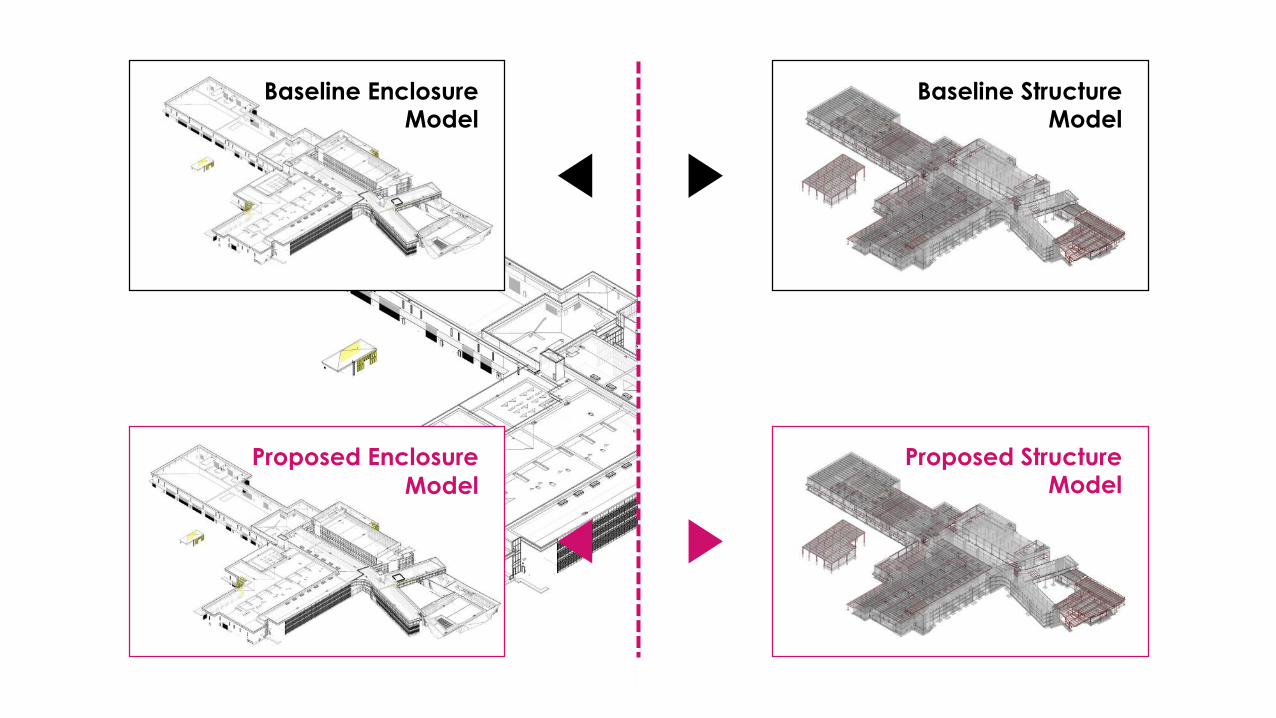
Baseline StructureModel
Proposed StructureModel
Proposed EnclosureModel
Baseline EnclosureModel
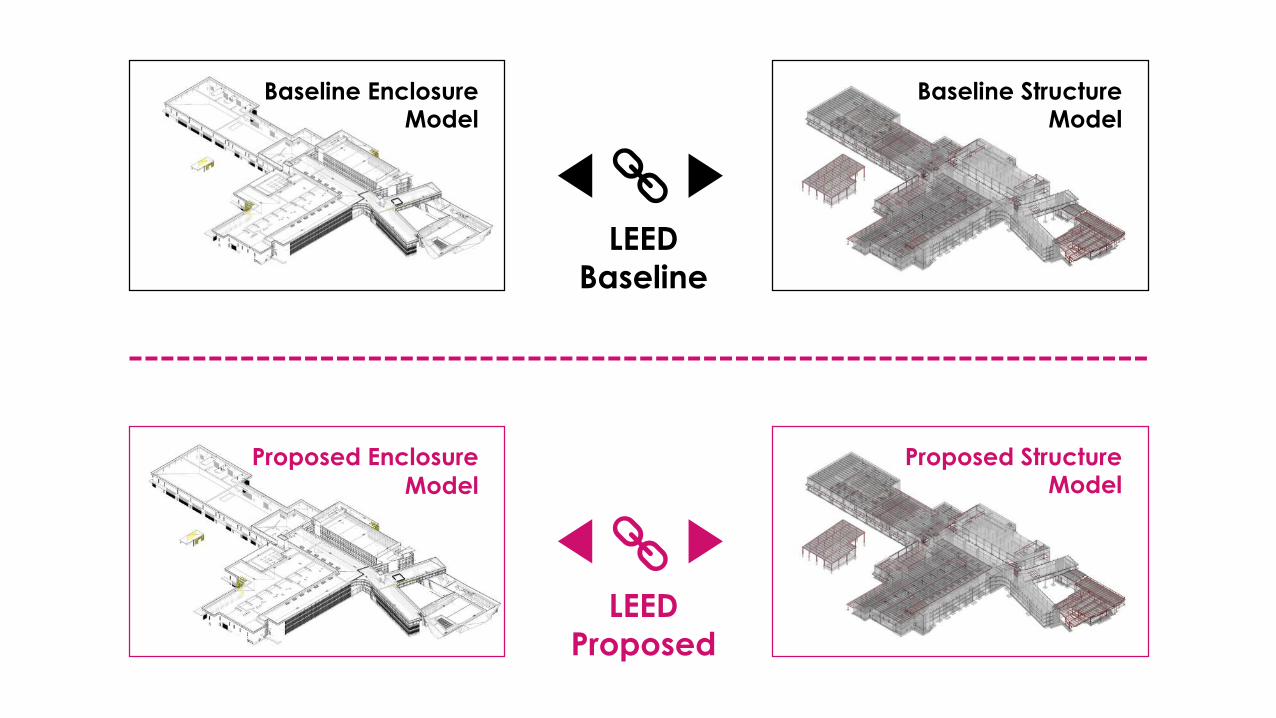
Baseline StructureModel
Proposed StructureModel
LEEDProposed
LEEDBaseline
Proposed EnclosureModel
Baseline EnclosureModel
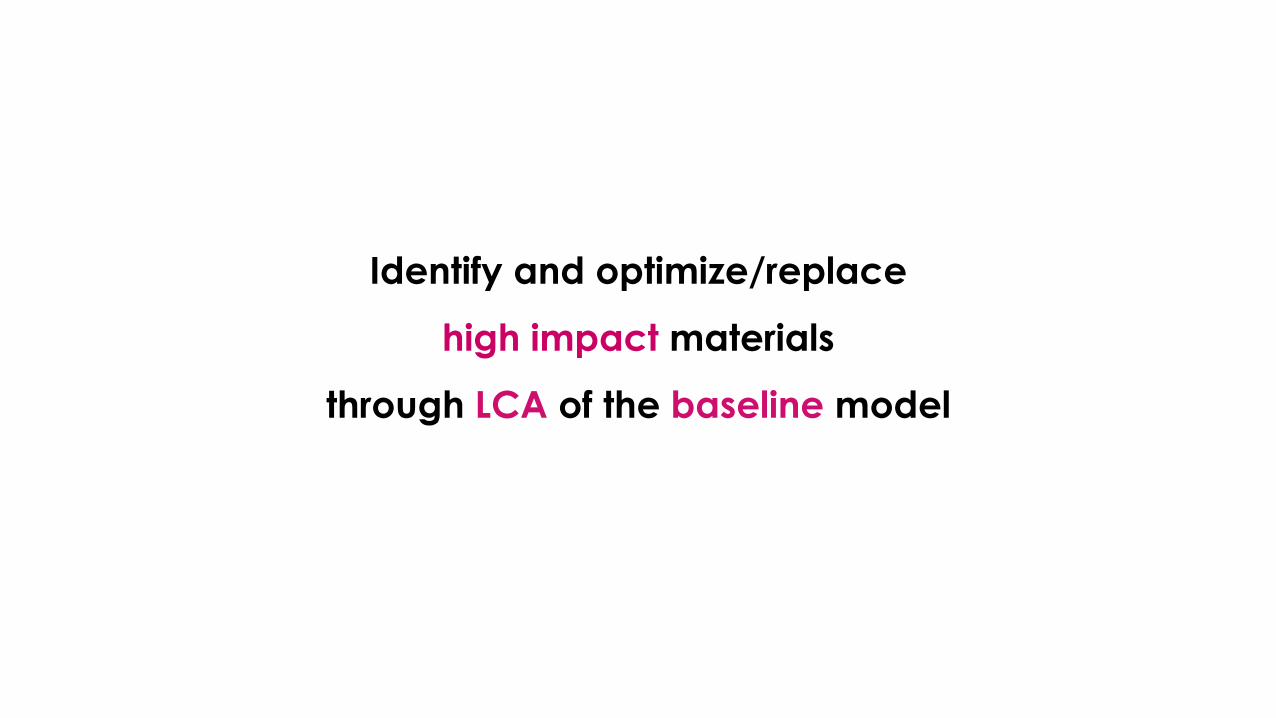
Identify and optimize/replace
high impact materials
through LCA of the baseline model
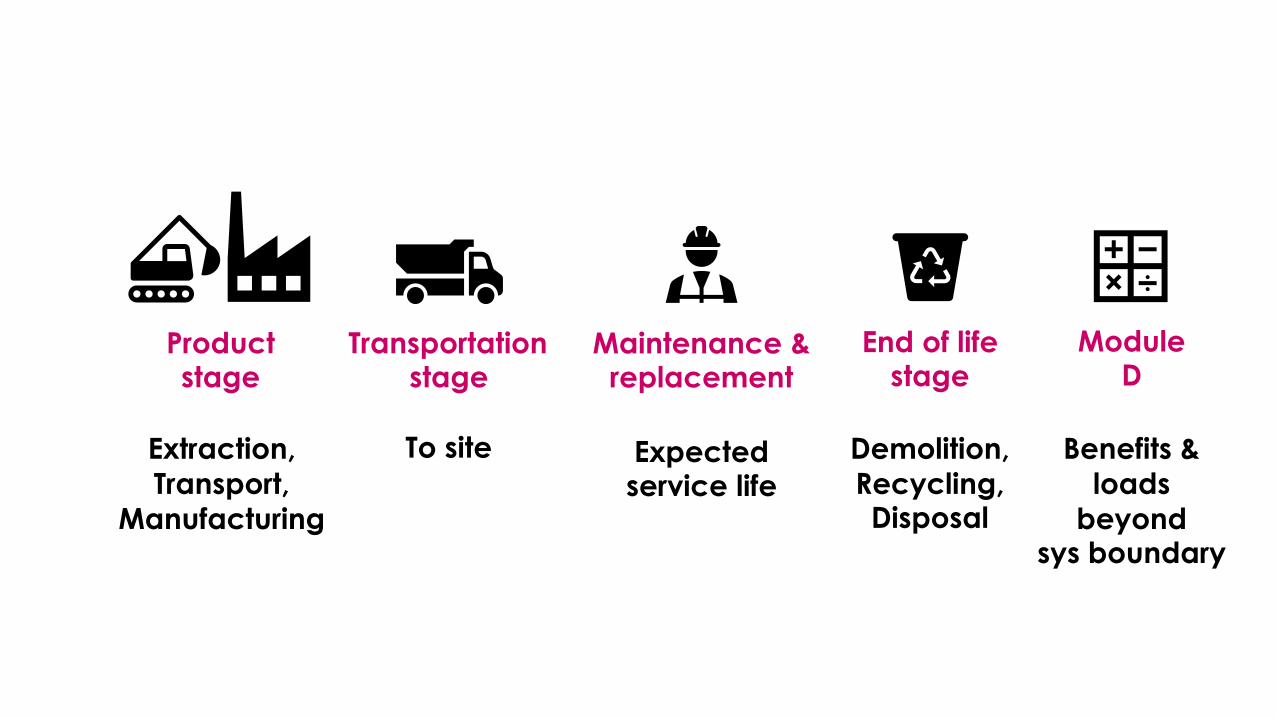
Productstage
Extraction,Transport,
Manufacturing
Transportationstage
To site
Maintenance &replacement
Expectedservice life
End of lifestage
Demolition,Recycling,Disposal
ModuleD
Benefits &loads
beyondsys boundary
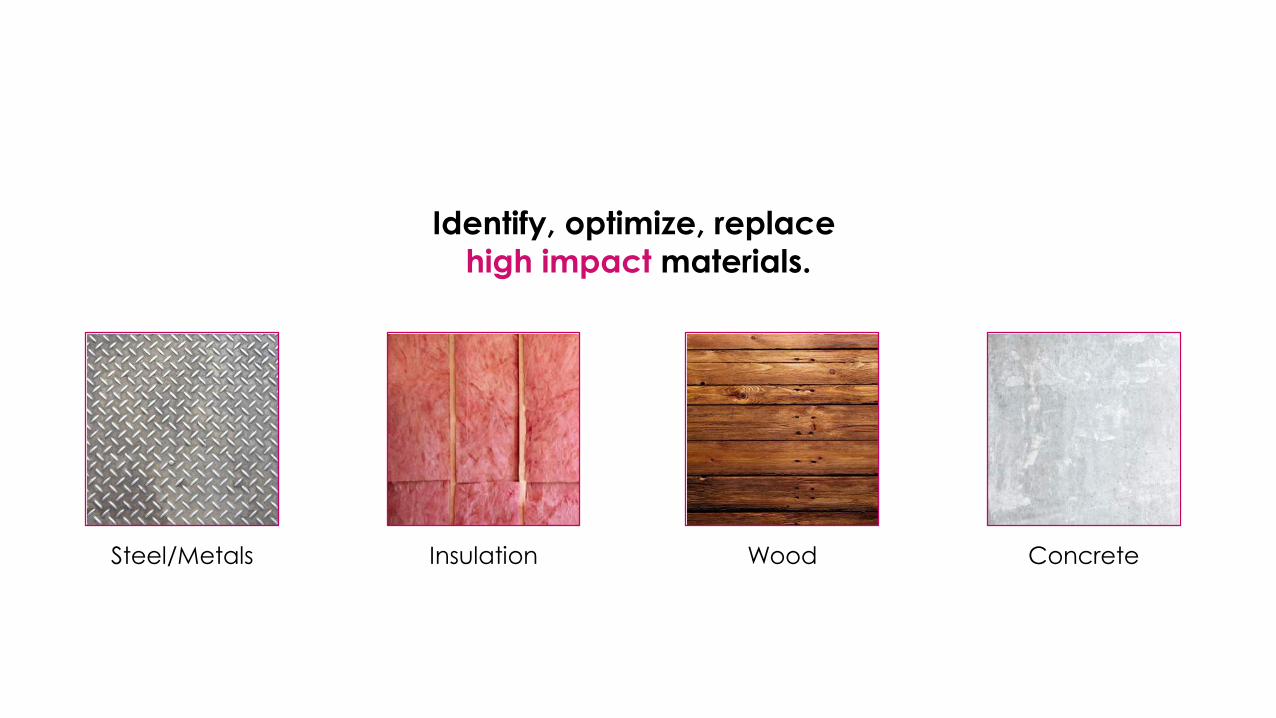
ConcreteWoodInsulationSteel/Metals
Identify, optimize, replace.high impact materials.
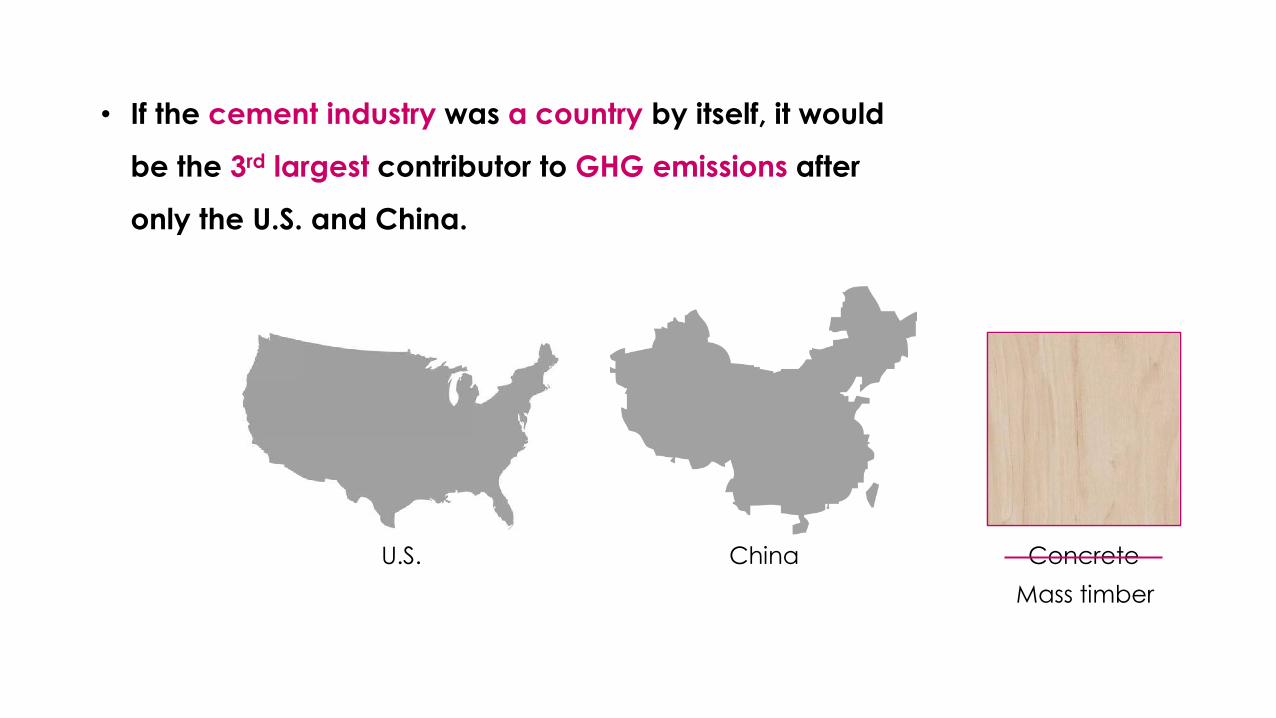
Concrete
• If the cement industry was a country by itself, it would
be the 3rd largest contributor to GHG emissions after
only the U.S. and China.
ChinaU.S.Mass timber
Concrete
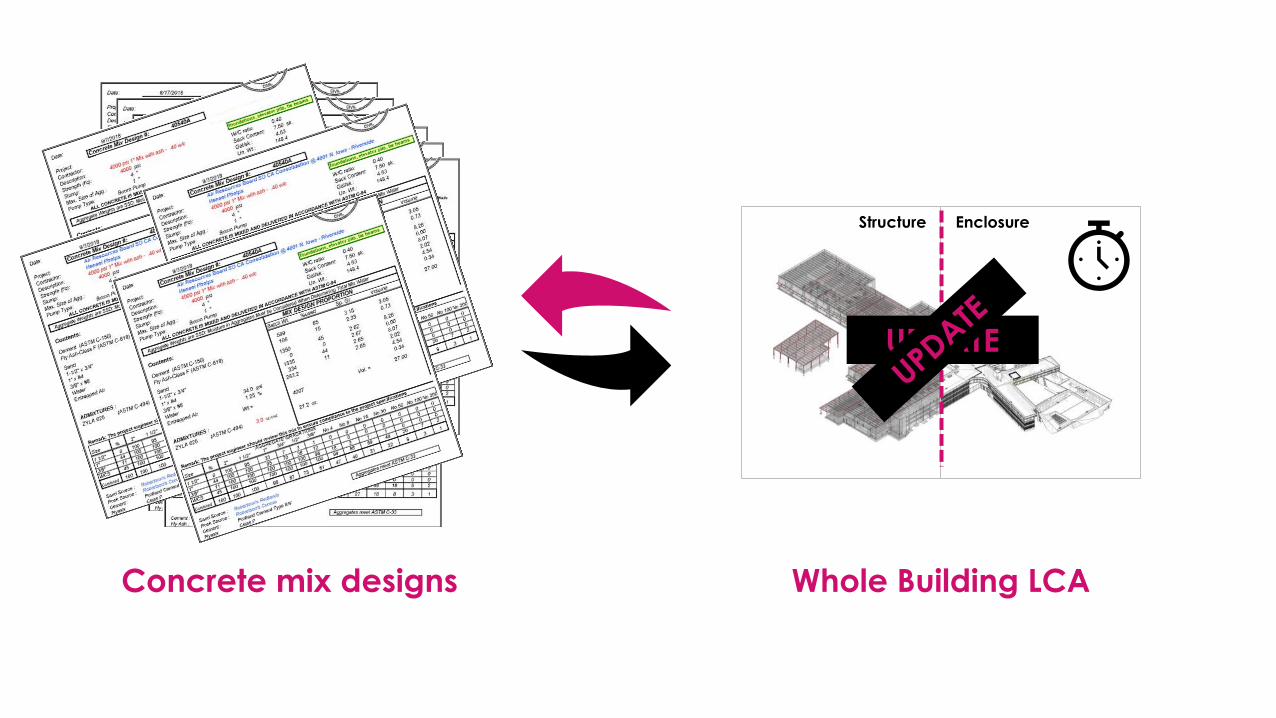
Structure Enclosure
Whole Building LCAConcrete mix designs
UPDATE
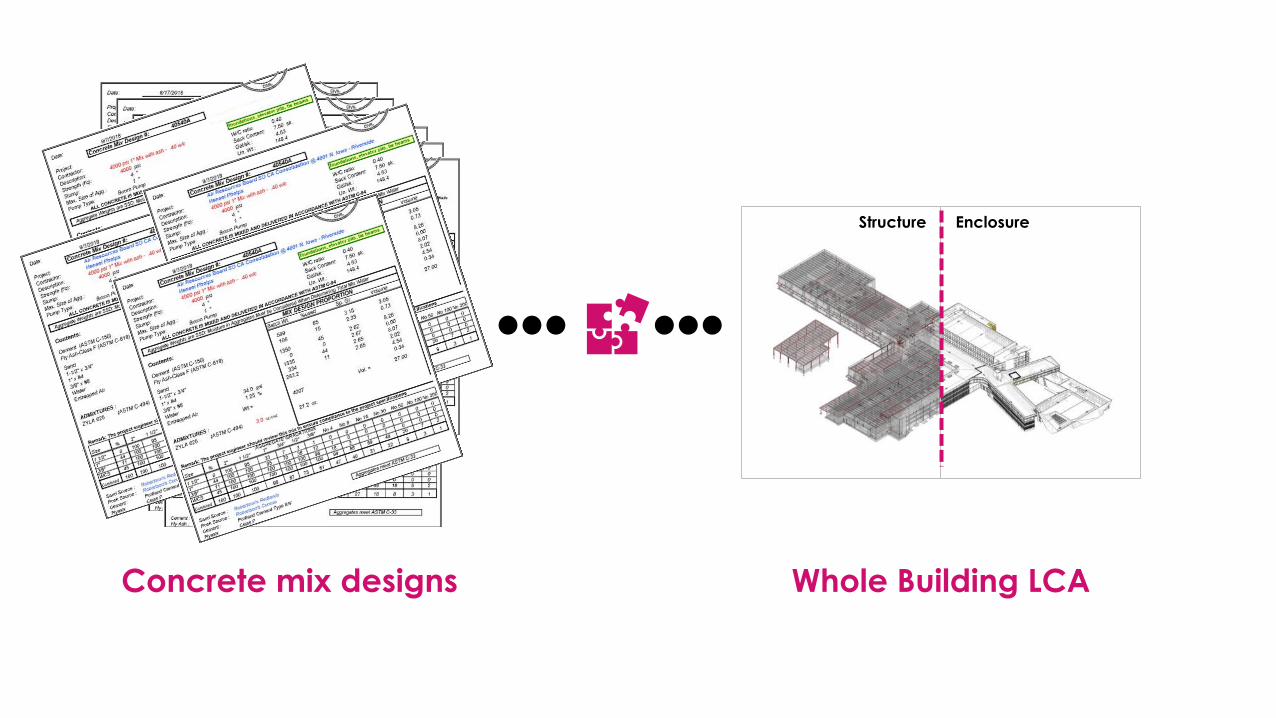
Concrete mix designs
Structure Enclosure
Whole Building LCA
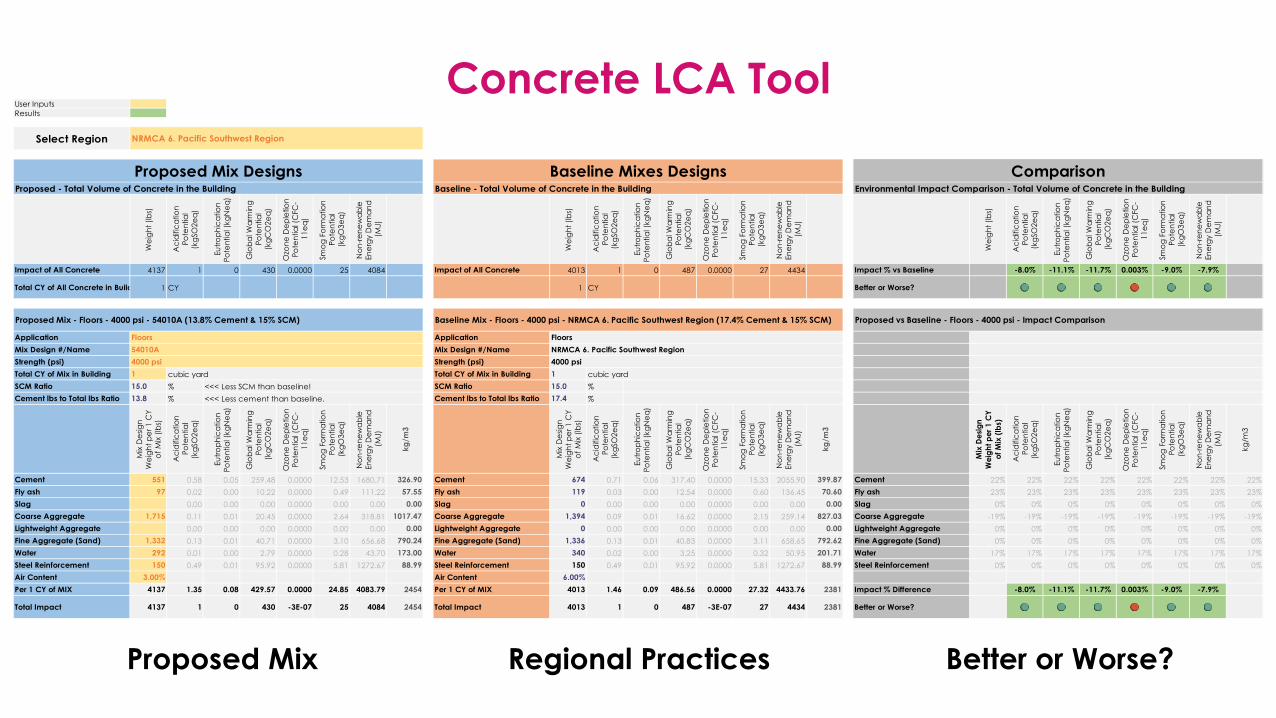
Concrete LCA ToolUser InputsResults
Select Region
Proposed - Total Volume of Concrete in the Building
Wei
ght (
lbs)
Aci
dific
atio
n Po
tent
ial
(kgS
O2e
q)
Eutro
phic
atio
n Po
tent
ial (
kgN
eq)
Glo
bal W
arm
ing
Pote
ntia
l (k
gCO
2eq)
Ozo
ne D
eple
tion
Pote
ntia
l (C
FC-
11eq
)
Smog
For
mat
ion
Pote
ntia
l (k
gO3e
q)
Non
-rene
wab
le
Ener
gy D
eman
d (M
J)
Impact of All Concrete 4137 1 0 430 0.0000 25 4084
Total CY of All Concrete in Build 1 CY
Proposed Mix - Floors - 4000 psi - 54010A (13.8% Cement & 15% SCM)
Application FloorsMix Design #/Name 54010A Strength (psi) Total CY of Mix in Building 1 cubic yard SCM Ratio 15.0 % <<< Less SCM than baseline! Cement lbs to Total lbs Ratio 13.8 % <<< Less cement than baseline.
Mix
Des
ign
Wei
ght p
er 1
CY
of M
ix (lb
s)
Aci
dific
atio
n Po
tent
ial
(kgS
O2e
q)
Eutro
phic
atio
n Po
tent
ial (
kgN
eq)
Glo
bal W
arm
ing
Pote
ntia
l (k
gCO
2eq)
Ozo
ne D
eple
tion
Pote
ntia
l (C
FC-
11eq
)
Smog
For
mat
ion
Pote
ntia
l (k
gO3e
q)
Non
-rene
wab
le
Ener
gy D
eman
d (M
J)
kg/m
3
Cement 551 0.58 0.05 259.48 0.0000 12.53 1680.71 326.90Fly ash 97 0.02 0.00 10.22 0.0000 0.49 111.22 57.55 Slag 0.00 0.00 0.00 0.0000 0.00 0.00 0.00Coarse Aggregate 1,715 0.11 0.01 20.45 0.0000 2.64 318.81 1017.47 Lightweight Aggregate 0.00 0.00 0.00 0.0000 0.00 0.00 0.00 Fine Aggregate (Sand) 1,332 0.13 0.01 40.71 0.0000 3.10 656.68 790.24 Water 292 0.01 0.00 2.79 0.0000 0.28 43.70 173.00Steel Reinforcement 150 0.49 0.01 95.92 0.0000 5.81 1272.67 88.99 Air Content 3.00% Per 1 CY of MIX 4137 1.35 0.08 429.57 0.0000 24.85 4083.79 2454
Total Impact 4137 1 0 430 -3E-07 25 4084 2454
NRMCA 6. Pacific Southwest Region
4000 psi
Proposed Mix Designs
Proposed Mix
Baseline - Total Volume of Concrete in the Building
Wei
ght (
lbs)
Aci
dific
atio
n Po
tent
ial
(kgS
O2e
q)
Eutro
phic
atio
n Po
tent
ial (
kgN
eq)
Glo
bal W
arm
ing
Pote
ntia
l (k
gCO
2eq)
Ozo
ne D
eple
tion
Pote
ntia
l (C
FC-
11eq
)
Smog
For
mat
ion
Pote
ntia
l (k
gO3e
q)
Non
-rene
wab
le
Ener
gy D
eman
d (M
J)
Impact of All Concrete 4013 1 0 487 0.0000 27 4434
1 CY
Baseline Mix - Floors - 4000 psi - NRMCA 6. Pacific Southwest Region (17.4% Cement & 15% SCM)
Application Floors Mix Design #/Name NRMCA 6. Pacific Southwest Region
Strength (psi) Total CY of Mix in Building 1 cubic yard SCM Ratio 15.0 %
Cement lbs to Total lbs Ratio 17.4 %
Mix
Des
ign
Wei
ght p
er 1
CY
of M
ix (lb
s)
Aci
dific
atio
n Po
tent
ial
(kgS
O2e
q)
Eutro
phic
atio
n Po
tent
ial (
kgN
eq)
Glo
bal W
arm
ing
Pote
ntia
l (k
gCO
2eq)
Ozo
ne D
eple
tion
Pote
ntia
l (C
FC-
11eq
)
Smog
For
mat
ion
Pote
ntia
l (k
gO3e
q)
Non
-rene
wab
le
Ener
gy D
eman
d (M
J)
kg/m
3
Cement 674 0.71 0.06 317.40 0.0000 15.33 2055.90 399.87 Fly ash 119 0.03 0.00 12.54 0.0000 0.60 136.45 70.60
Slag 0 0.00 0.00 0.00 0.0000 0.00 0.00 0.00 Coarse Aggregate 1,394 0.09 0.01 16.62 0.0000 2.15 259.14 827.03
Lightweight Aggregate 0 0.00 0.00 0.00 0.0000 0.00 0.00 0.00 Fine Aggregate (Sand) 1,336 0.13 0.01 40.83 0.0000 3.11 658.65 792.62
Water 340 0.02 0.00 3.25 0.0000 0.32 50.95 201.71 Steel Reinforcement 150 0.49 0.01 95.92 0.0000 5.81 1272.67 88.99
Air Content 6.00% Per 1 CY of MIX 4013 1.46 0.09 486.56 0.0000 27.32 4433.76 2381
Total Impact 4013 1 0 487 -3E-07 27 4434 2381
4000 psi
Baseline Mixes Designs
Regional Practices
Environmental Impact Comparison - Total Volume of Concrete in the Building
Wei
ght (
lbs)
Aci
dific
atio
n Po
tent
ial
(kgS
O2e
q)
Eutro
phic
atio
n Po
tent
ial (
kgN
eq)
Glo
bal W
arm
ing
Pote
ntia
l (k
gCO
2eq)
Ozo
ne D
eple
tion
Pote
ntia
l (C
FC-
11eq
)
Smog
For
mat
ion
Pote
ntia
l (k
gO3e
q)
Non
-rene
wab
le
Ener
gy D
eman
d (M
J)
Impact % vs Baseline -8.0% -11.1% -11.7% 0.003% -9.0% -7.9%
Better or Worse?
Proposed vs Baseline - Floors - 4000 psi - Impact Comparison
Mix
Des
ign
Wei
ght p
er 1
CY
of M
ix (l
bs)
Aci
dific
atio
n Po
tent
ial
(kgS
O2e
q)
Eutro
phic
atio
n Po
tent
ial (
kgN
eq)
Glo
bal W
arm
ing
Pote
ntia
l (k
gCO
2eq)
Ozo
ne D
eple
tion
Pote
ntia
l (C
FC-
11eq
)
Smog
For
mat
ion
Pote
ntia
l (k
gO3e
q)
Non
-rene
wab
le
Ener
gy D
eman
d (M
J)
kg/m
3
Cement 22% 22% 22% 22% 22% 22% 22% 22% Fly ash 23% 23% 23% 23% 23% 23% 23% 23%
Slag 0% 0% 0% 0% 0% 0% 0% 0% Coarse Aggregate -19% -19% -19% -19% -19% -19% -19% -19%
Lightweight Aggregate 0% 0% 0% 0% 0% 0% 0% 0% Fine Aggregate (Sand) 0% 0% 0% 0% 0% 0% 0% 0%
Water 17% 17% 17% 17% 17% 17% 17% 17% Steel Reinforcement 0% 0% 0% 0% 0% 0% 0% 0%
Impact % Difference -8.0% -11.1% -11.7% 0.003% -9.0% -7.9%
Better or Worse?
Comparison
Better or Worse?
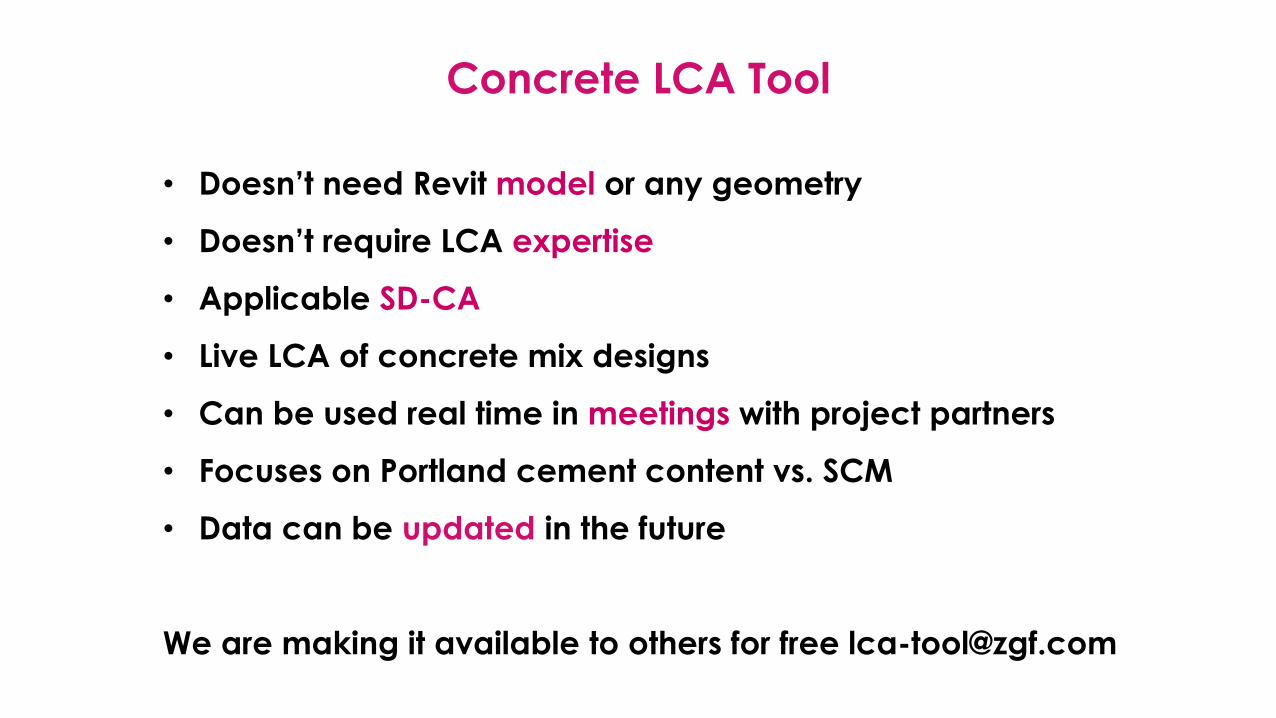
• Doesn’t need Revit model or any geometry
• Doesn’t require LCA expertise
• Applicable SD-CA
• Live LCA of concrete mix designs
• Can be used real time in meetings with project partners
• Focuses on Portland cement content vs. SCM
• Data can be updated in the future
We are making it available to others for free [email protected]
Concrete LCA Tool
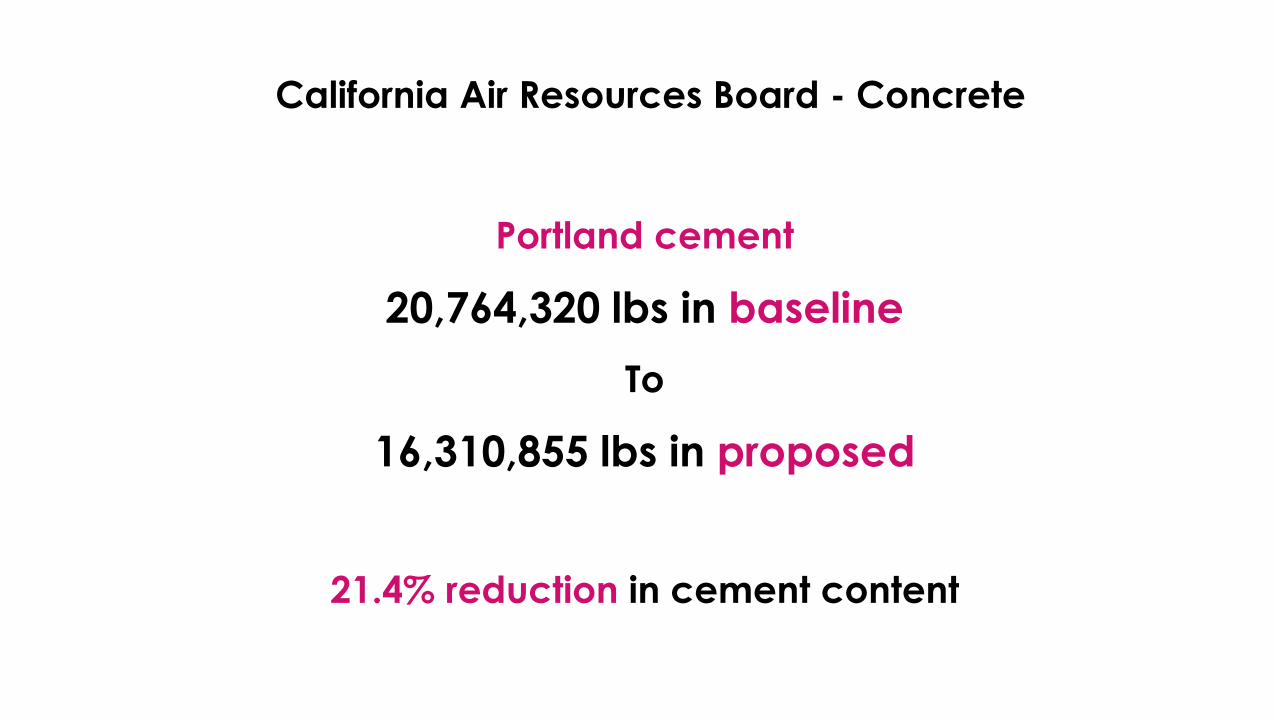
Portland cement
20,764,320 lbs in baselineTo
16,310,855 lbs in proposed
21.4% reduction in cement content
California Air Resources Board - Concrete
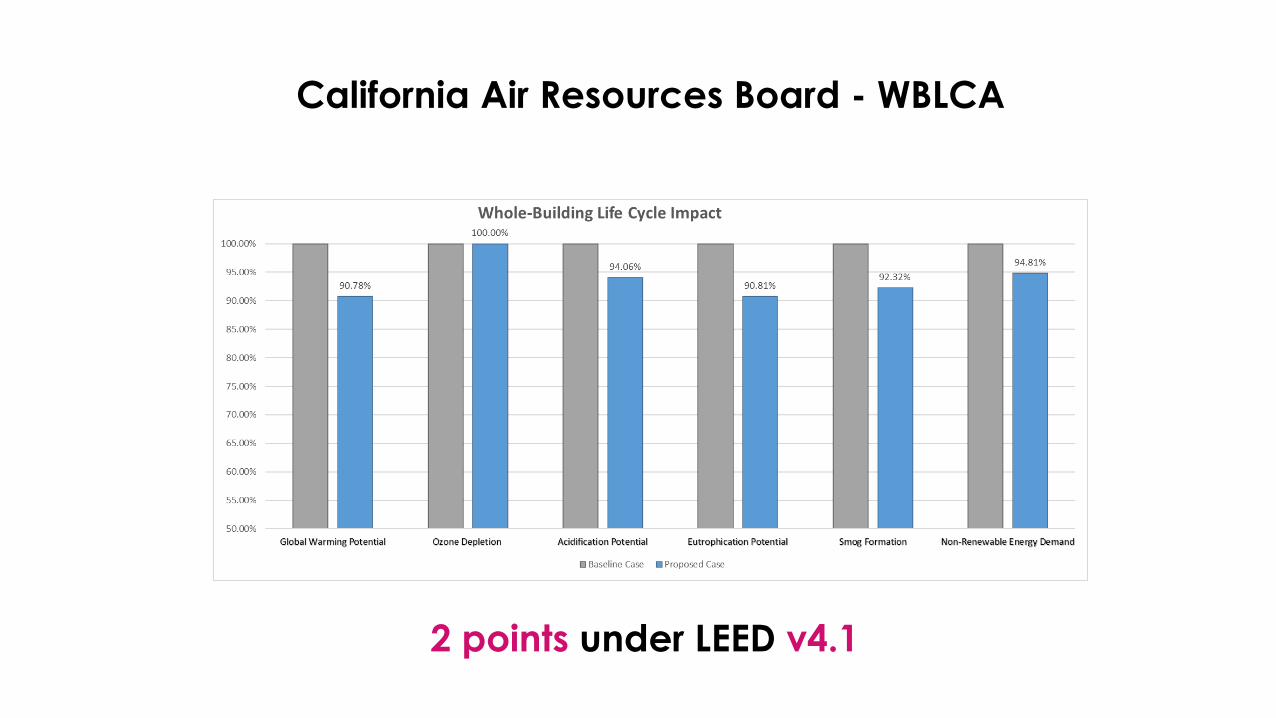
California Air Resources Board - WBLCA
2 points under LEED v4.1
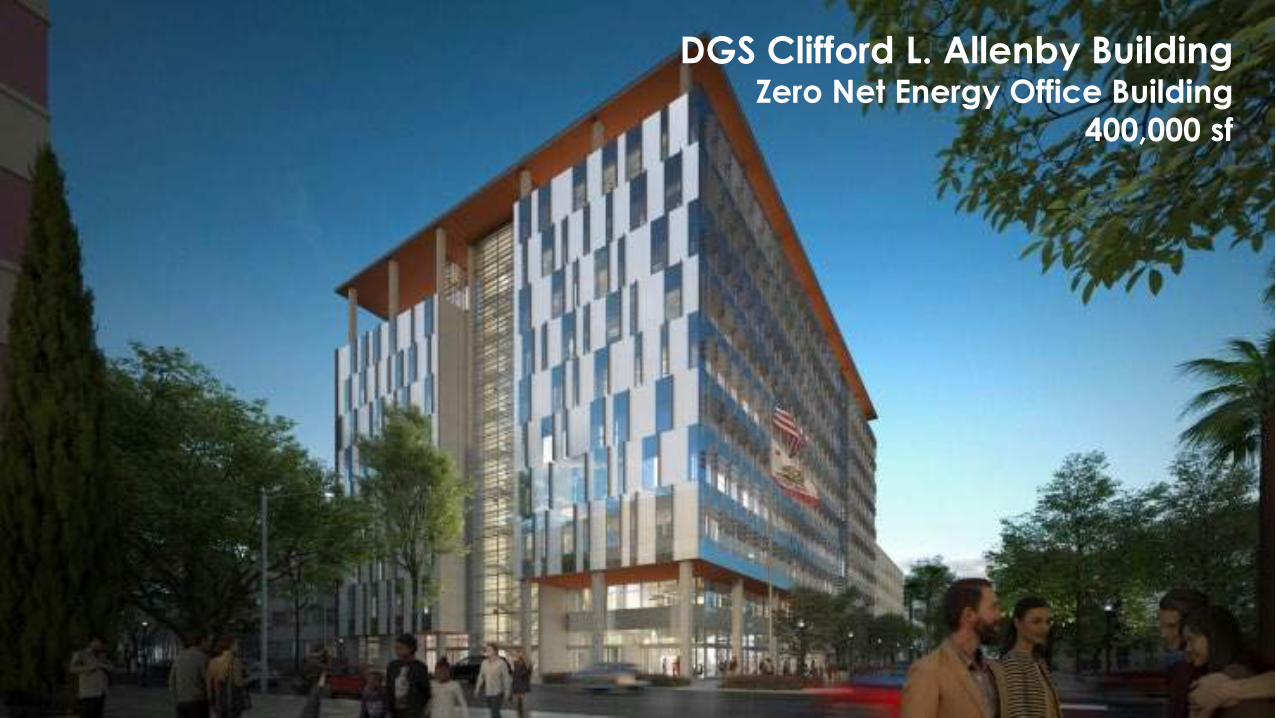
DGS Clifford L. Allenby BuildingZero Net Energy Office Building
400,000 sf
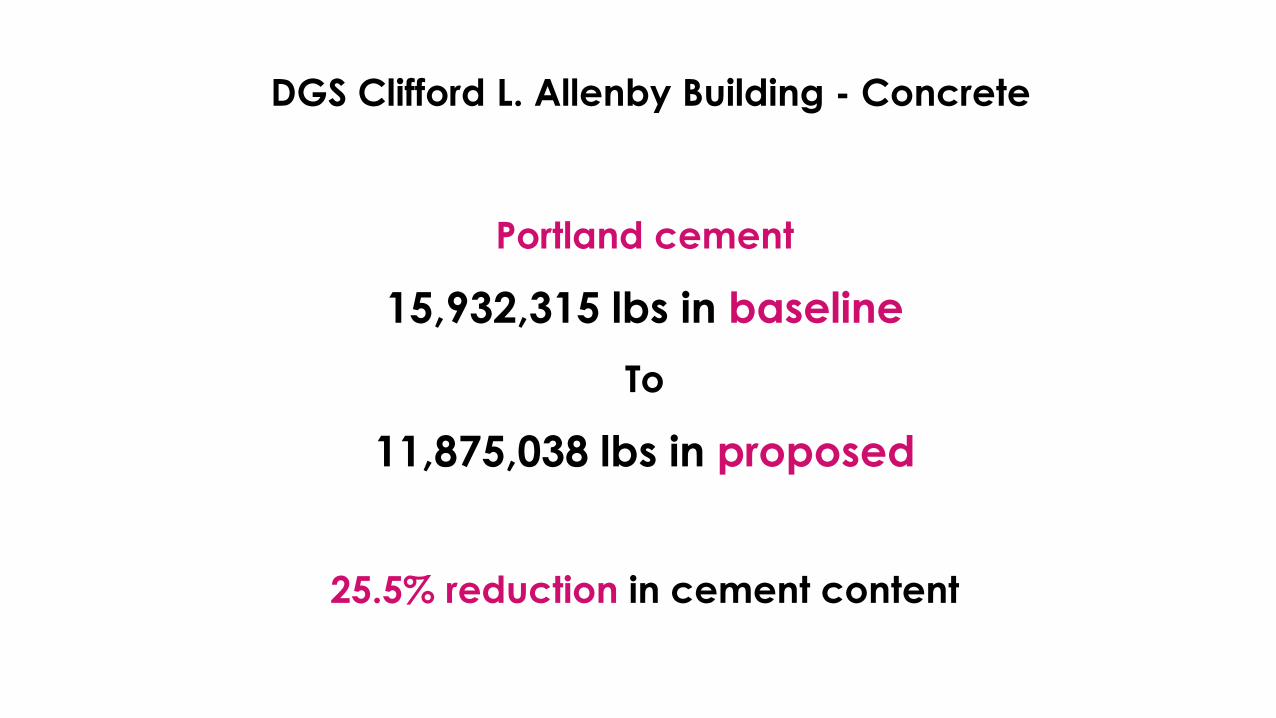
Portland cement
15,932,315 lbs in baselineTo
11,875,038 lbs in proposed
25.5% reduction in cement content
DGS Clifford L. Allenby Building - Concrete
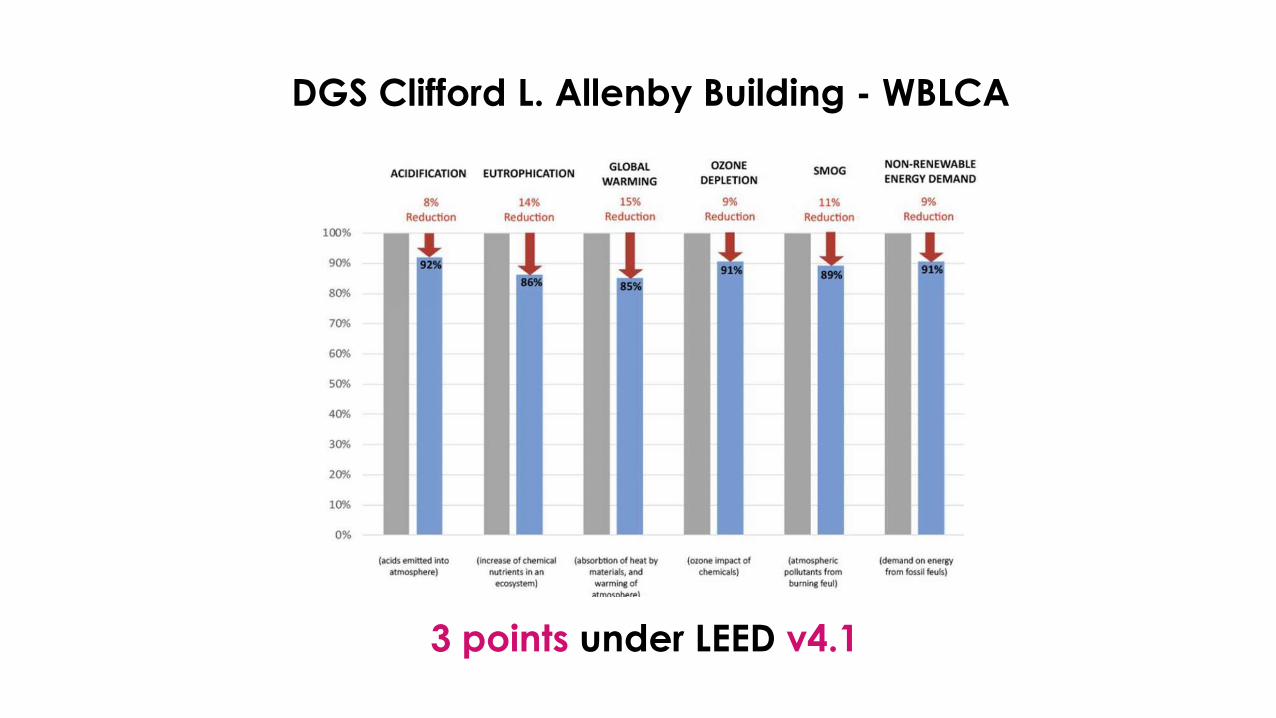
DGS Clifford L. Allenby Building - WBLCA
3 points under LEED v4.1
To get a free copy of the ZGF Concrete LCA tool email
Baha Sadreddin
High-Performance Design Specialist
ZGF Architects
ambient energy
Commissioning | Sustainability | Building Performance
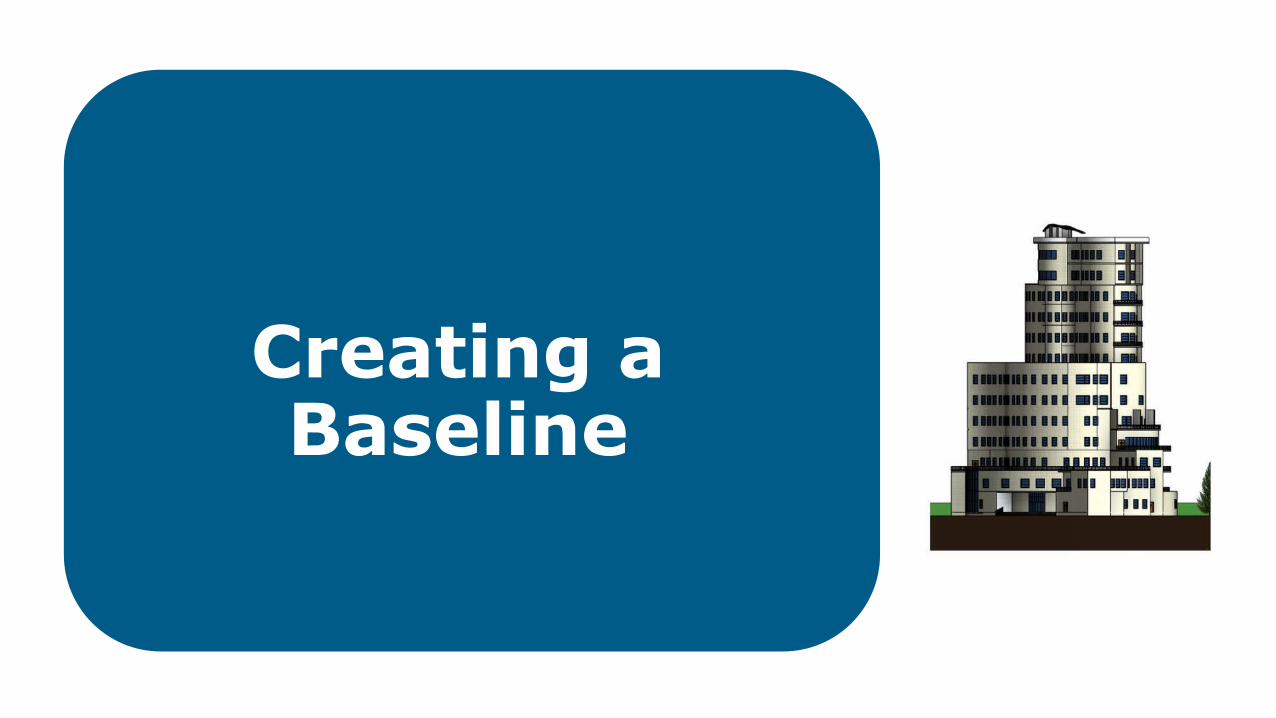
ECN Webinar 5Creating a WBLCA
Baseline
Victoria Herrero-GarciaSustainability Consultant, Daylight & WBLCA Analyst
ambient energy
Building Stock Market
Predictions
ambient energy
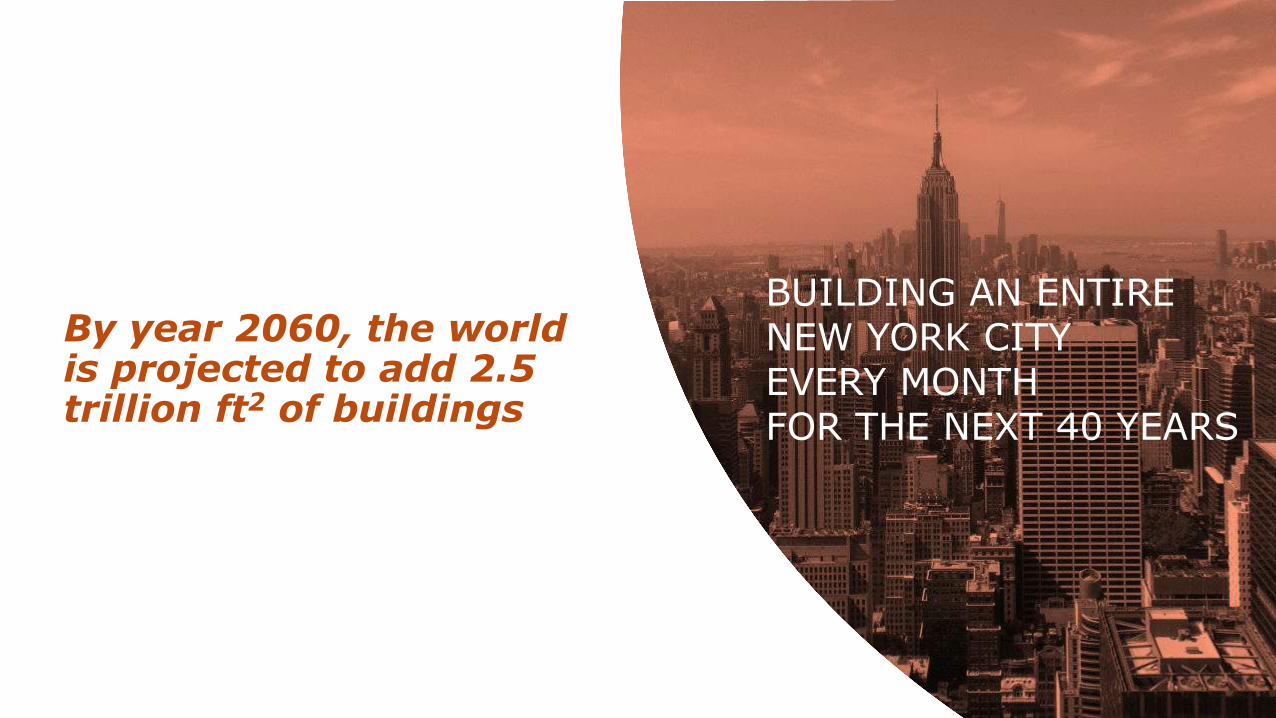
BUILDING AN ENTIRE NEW YORK CITY EVERY MONTH FOR THE NEXT 40 YEARS
By year 2060, the world is projected to add 2.5 trillion ft2 of buildings
ambient energy
Life Cycle Assessment
ambient energy
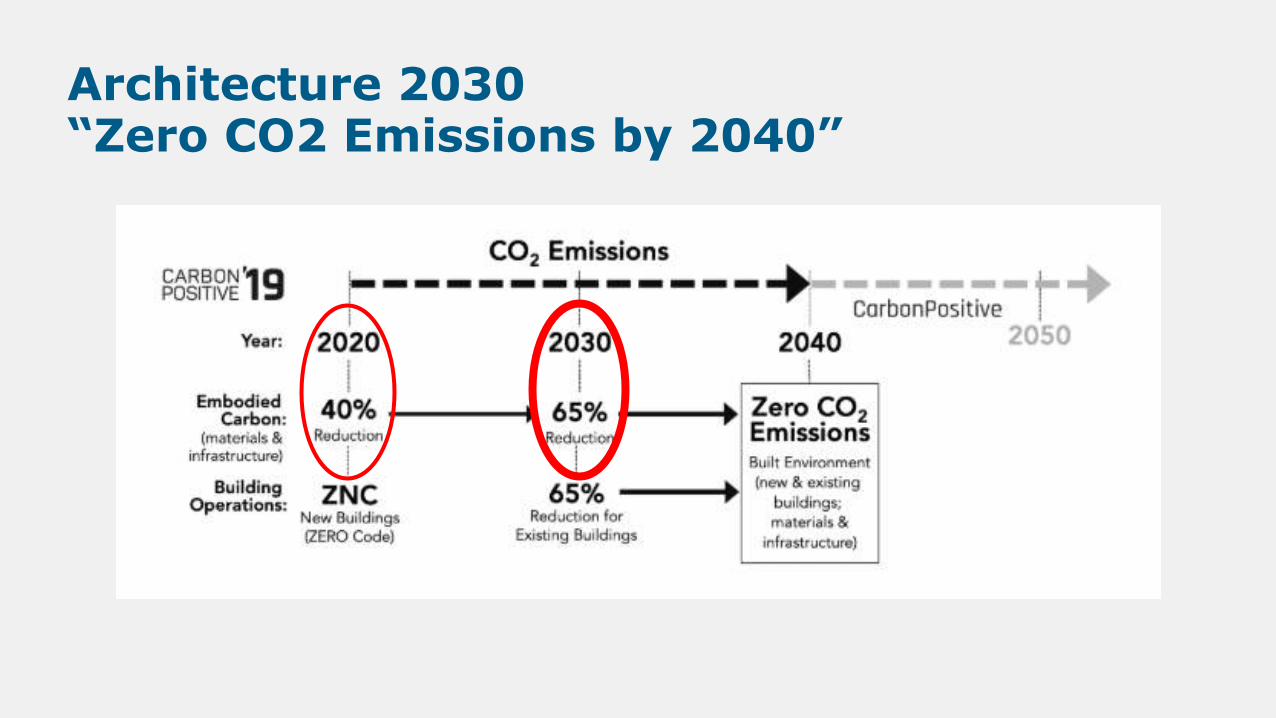
Architecture 2030 “Zero CO2 Emissions by 2040”
ambient energy
ambient energy
Creating a Baseline
ambient energy
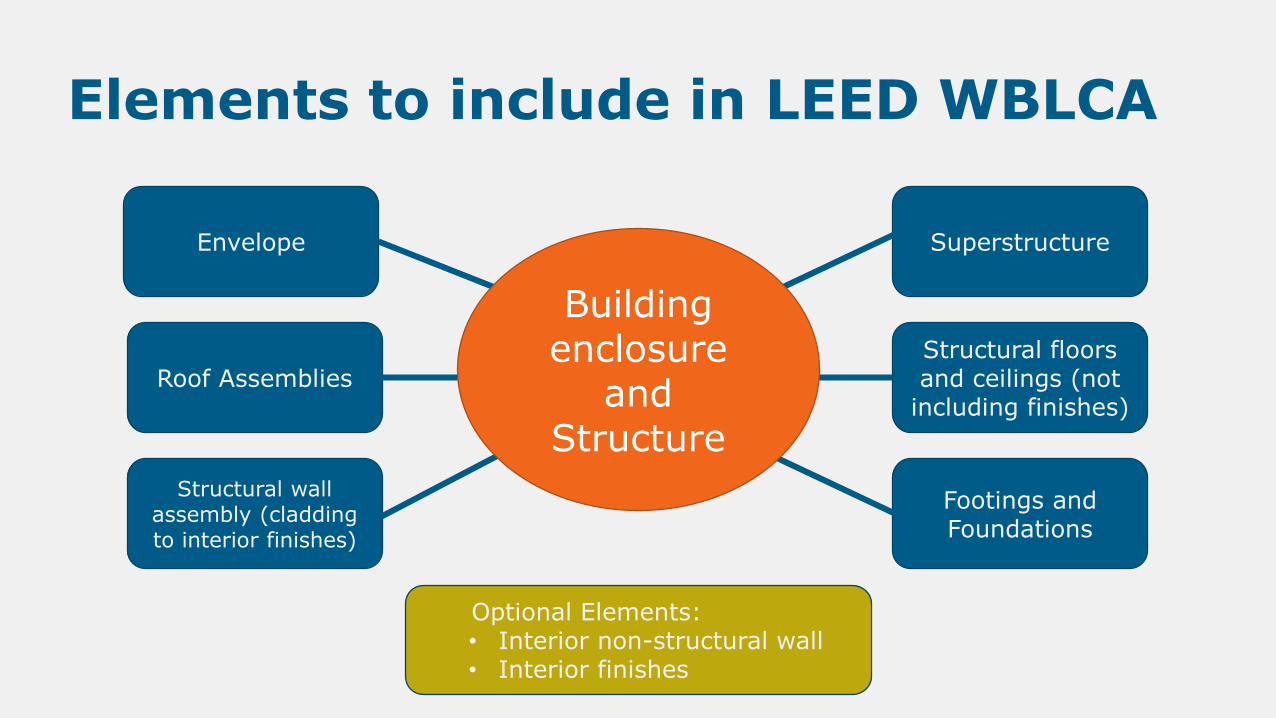
Elements to include in LEED WBLCA
Footings and Foundations
Envelope
Structural wall assembly (cladding to interior finishes)
Structural floors and ceilings (not
including finishes)Roof Assemblies
Superstructure
Building enclosure
and Structure
Elements to include in LEED WBLCA
Optional Elements:• Interior non-structural wall• Interior finishes
ambient energy
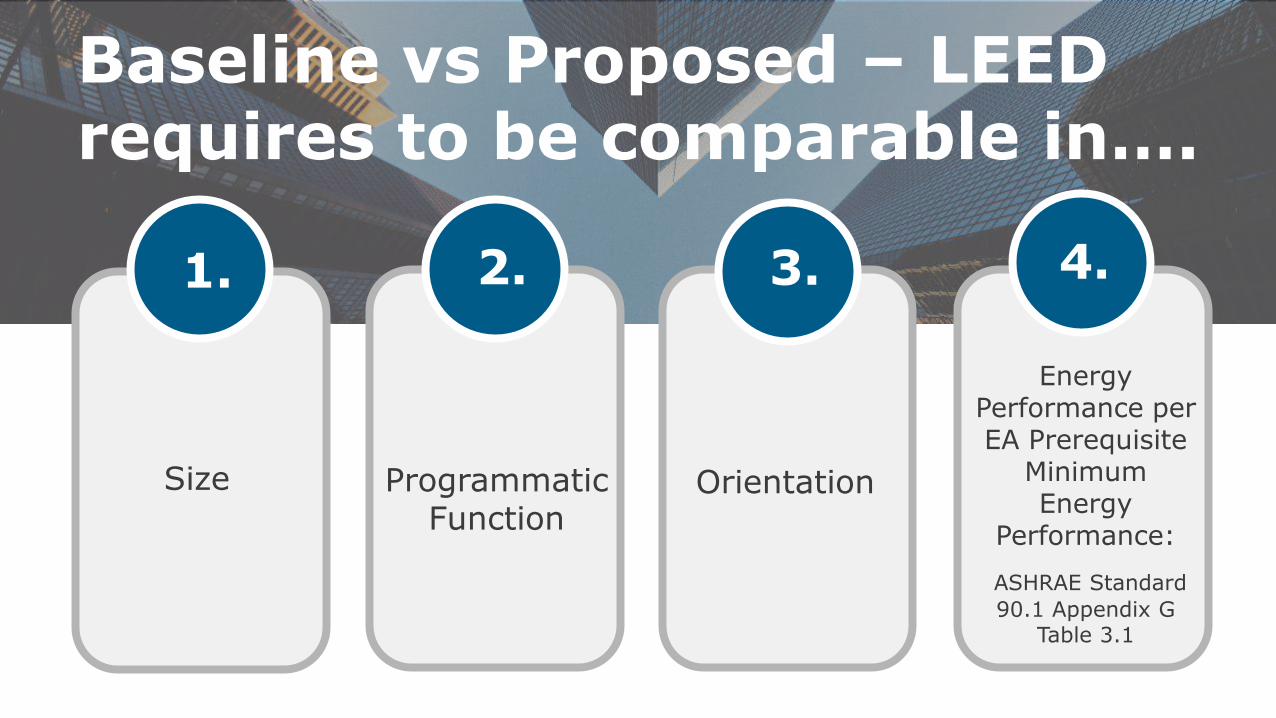
2. 3. 4.
Baseline vs Proposed – LEED requires to be comparable in….
1.
OrientationProgrammatic Function
Energy Performance per EA Prerequisite
Minimum Energy
Performance:
ASHRAE Standard 90.1 Appendix G
Table 3.1
Size
ambient energy
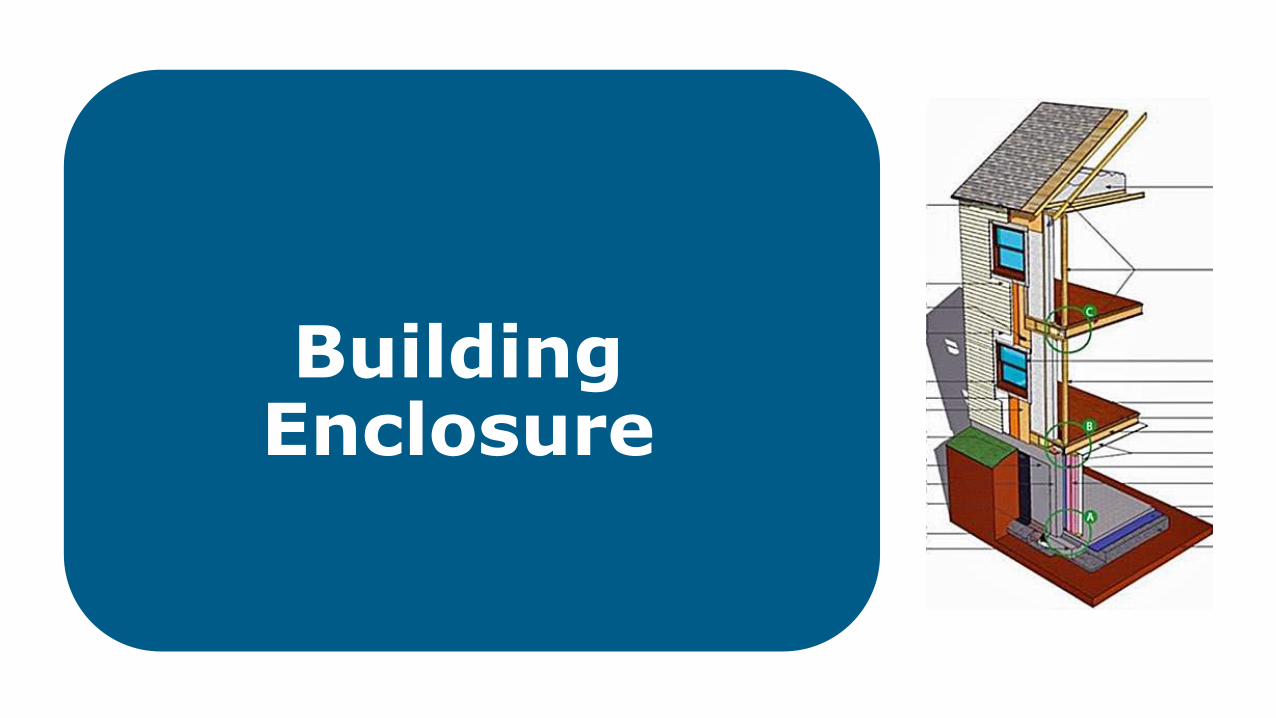
Building Enclosure
ambient energy
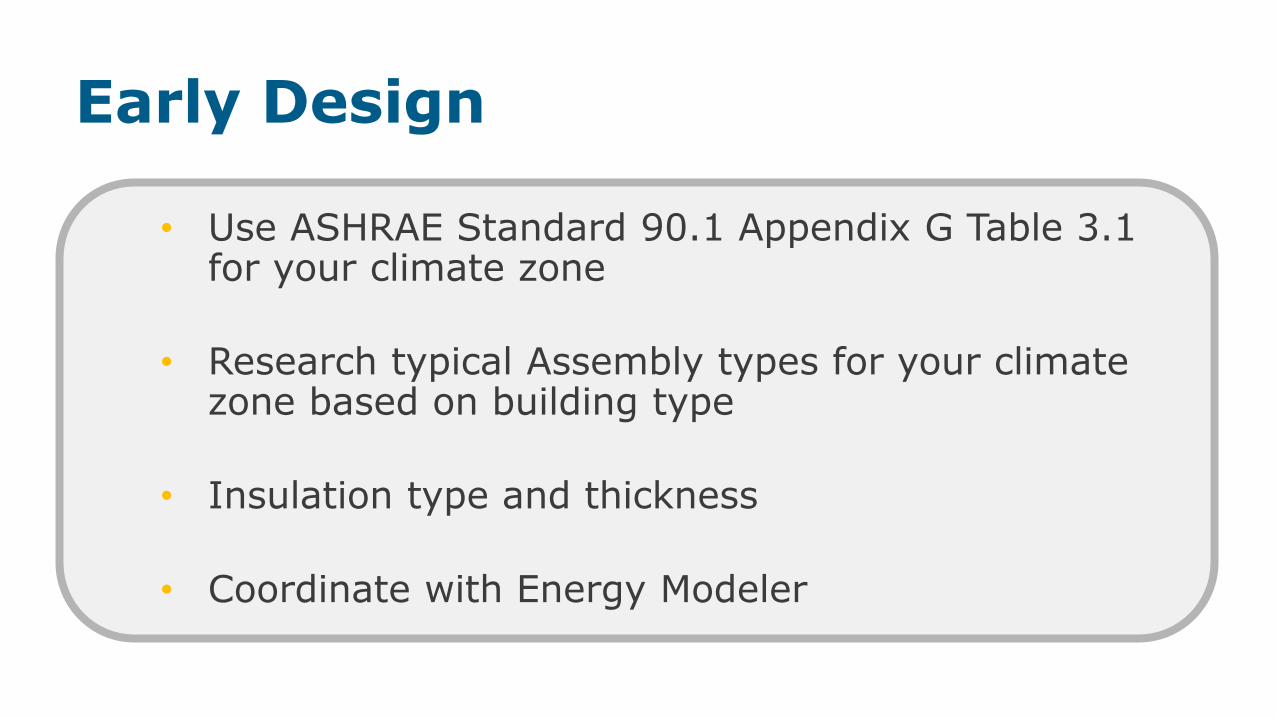
• Use ASHRAE Standard 90.1 Appendix G Table 3.1 for your climate zone
• Research typical Assembly types for your climate zone based on building type
• Insulation type and thickness
• Coordinate with Energy Modeler
Early Design

ambient energy
ASHRAE 90.1 - 2010 Prescriptive Enclosure Requirements
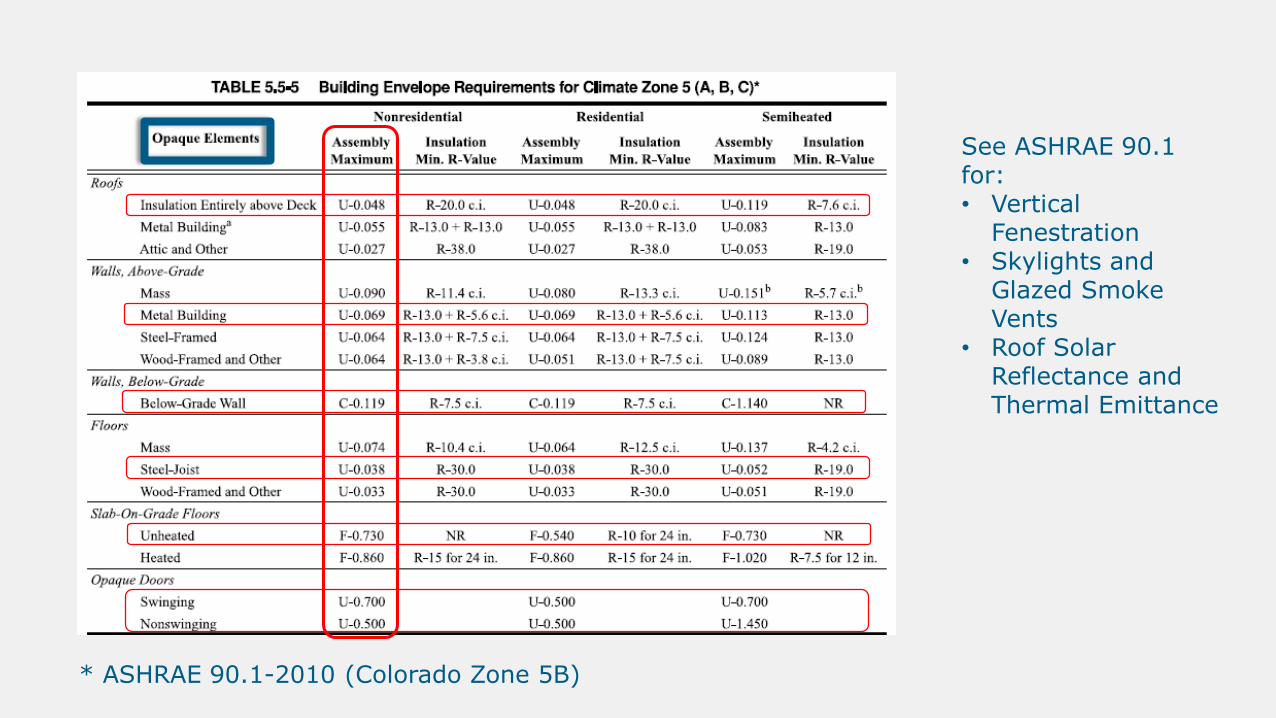
ambient energy* ASHRAE 90.1-2010 (Colorado Zone 5B)
See ASHRAE 90.1 for:• Vertical
Fenestration• Skylights and
Glazed Smoke Vents
• Roof Solar Reflectance and Thermal Emittance
ambient energy
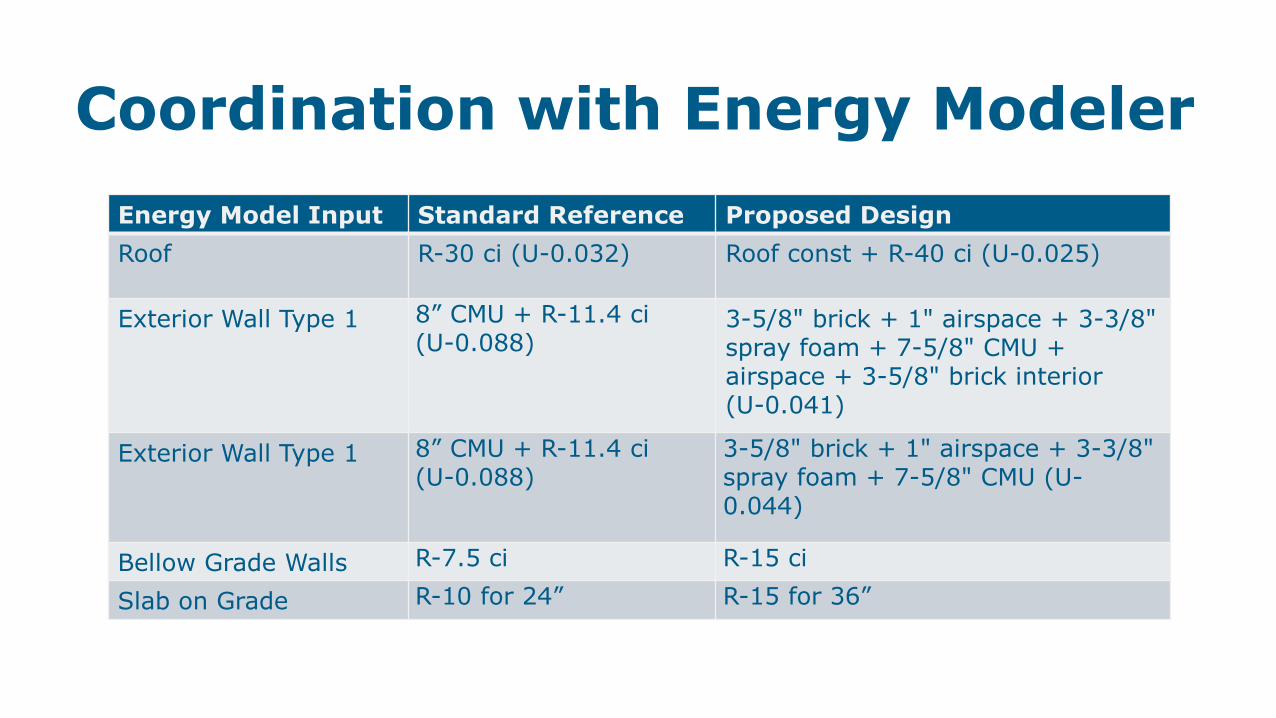
Coordination with Energy ModelerEnergy Model Input Standard Reference Proposed DesignRoof R-30 ci (U-0.032) Roof const + R-40 ci (U-0.025)
Exterior Wall Type 1 8” CMU + R-11.4 ci (U-0.088)
3-5/8" brick + 1" airspace + 3-3/8" spray foam + 7-5/8" CMU + airspace + 3-5/8" brick interior (U-0.041)
Exterior Wall Type 1 8” CMU + R-11.4 ci (U-0.088)
3-5/8" brick + 1" airspace + 3-3/8" spray foam + 7-5/8" CMU (U-0.044)
Bellow Grade Walls R-7.5 ci R-15 ci
Slab on Grade R-10 for 24” R-15 for 36”
ambient energy
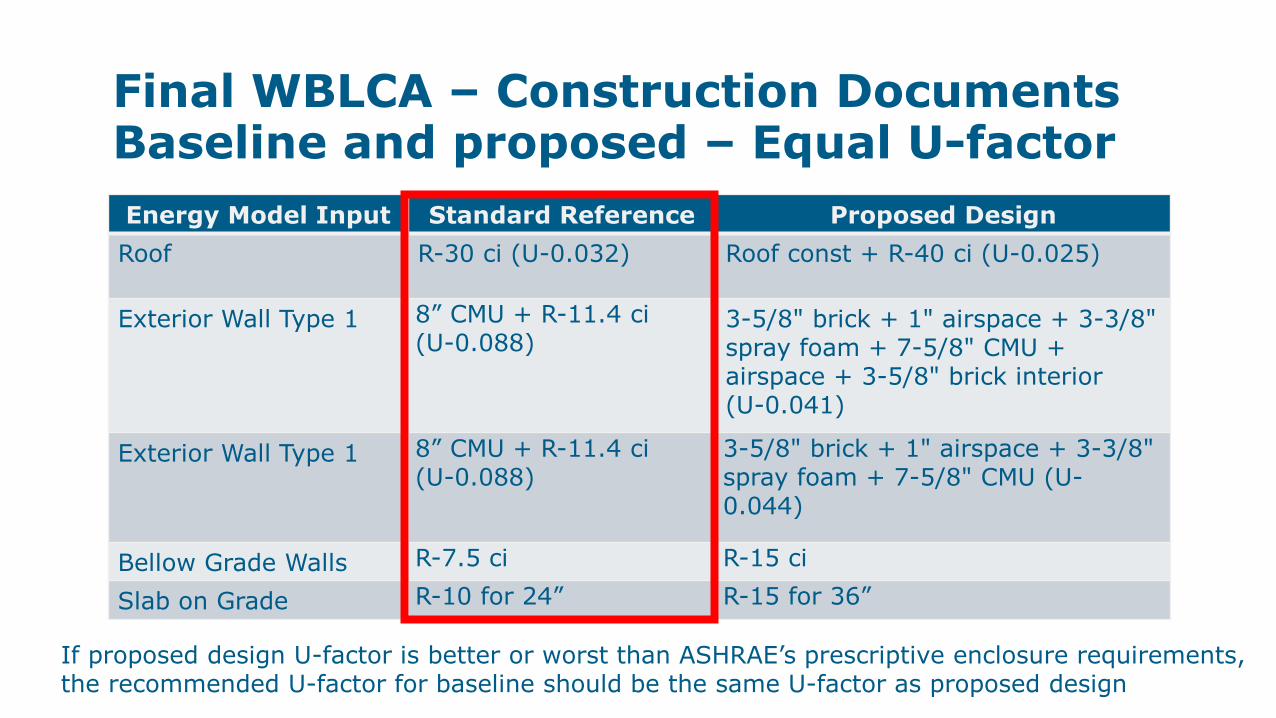
Final WBLCA – Construction DocumentsBaseline and proposed – Equal U-factorEnergy Model Input Standard Reference Proposed DesignRoof R-30 ci (U-0.032) Roof const + R-40 ci (U-0.025)
Exterior Wall Type 1 8” CMU + R-11.4 ci (U-0.088)
3-5/8" brick + 1" airspace + 3-3/8" spray foam + 7-5/8" CMU + airspace + 3-5/8" brick interior (U-0.041)
Exterior Wall Type 1 8” CMU + R-11.4 ci (U-0.088)
3-5/8" brick + 1" airspace + 3-3/8" spray foam + 7-5/8" CMU (U-0.044)
Bellow Grade Walls R-7.5 ci R-15 ci
Slab on Grade R-10 for 24” R-15 for 36”
If proposed design U-factor is better or worst than ASHRAE’s prescriptive enclosure requirements, the recommended U-factor for baseline should be the same U-factor as proposed design
ambient energy
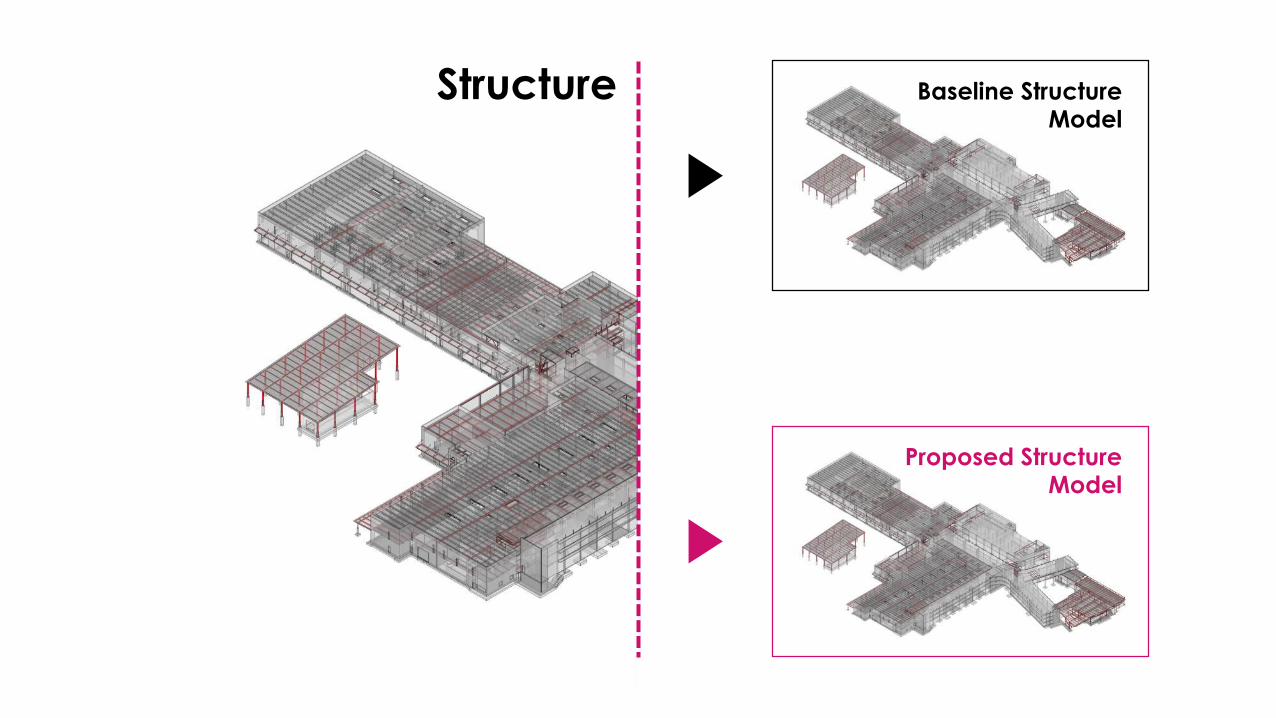
Structure
ambient energy
ambient energy
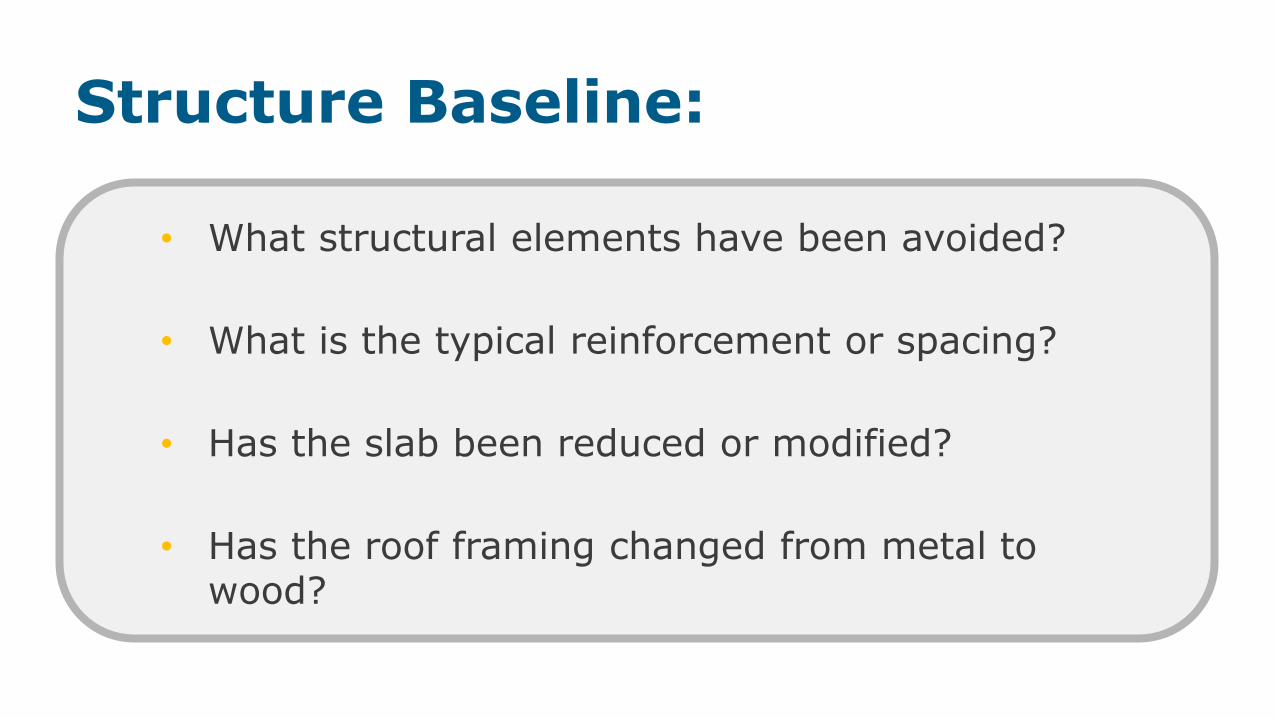
• What structural elements have been avoided?
• What is the typical reinforcement or spacing?
• Has the slab been reduced or modified?
• Has the roof framing changed from metal to wood?
Structure Baseline:
ambient energy
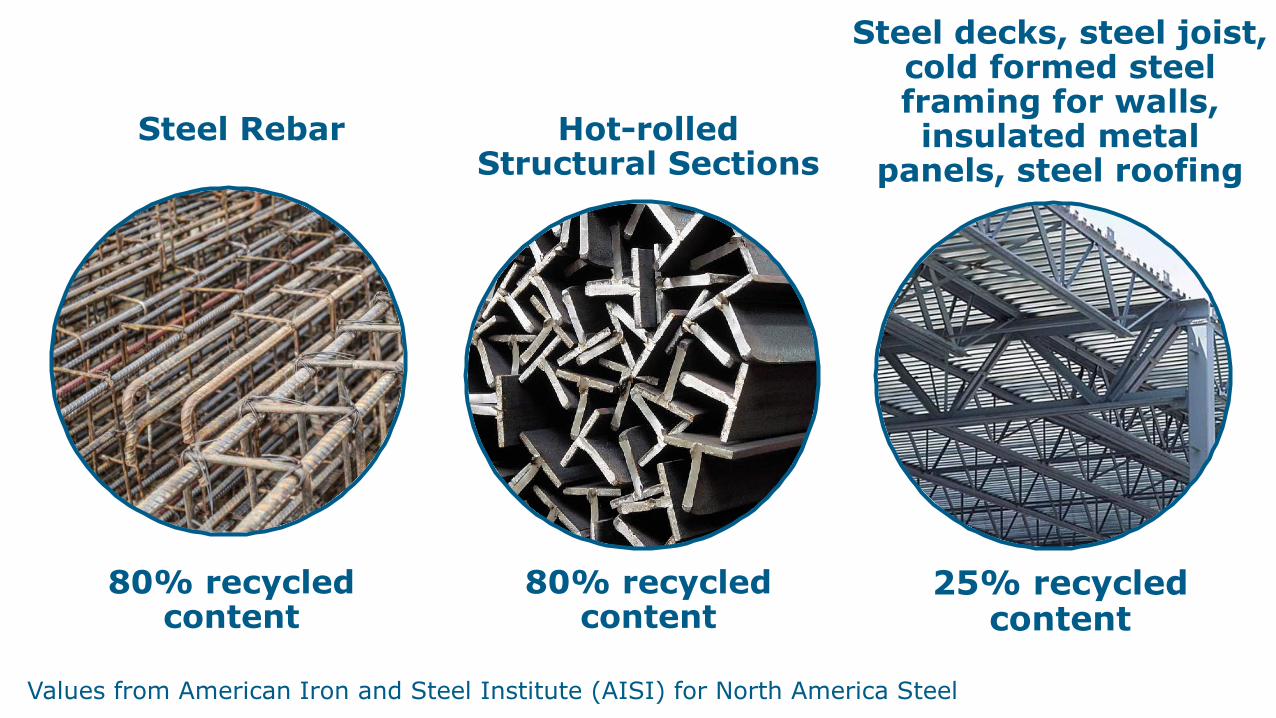
80% recycled content
80% recycled content
25% recycled content
Values from American Iron and Steel Institute (AISI) for North America Steel
Hot-rolled Structural Sections
Steel Rebar
Steel decks, steel joist, cold formed steel framing for walls, insulated metal
panels, steel roofing
ambient energy
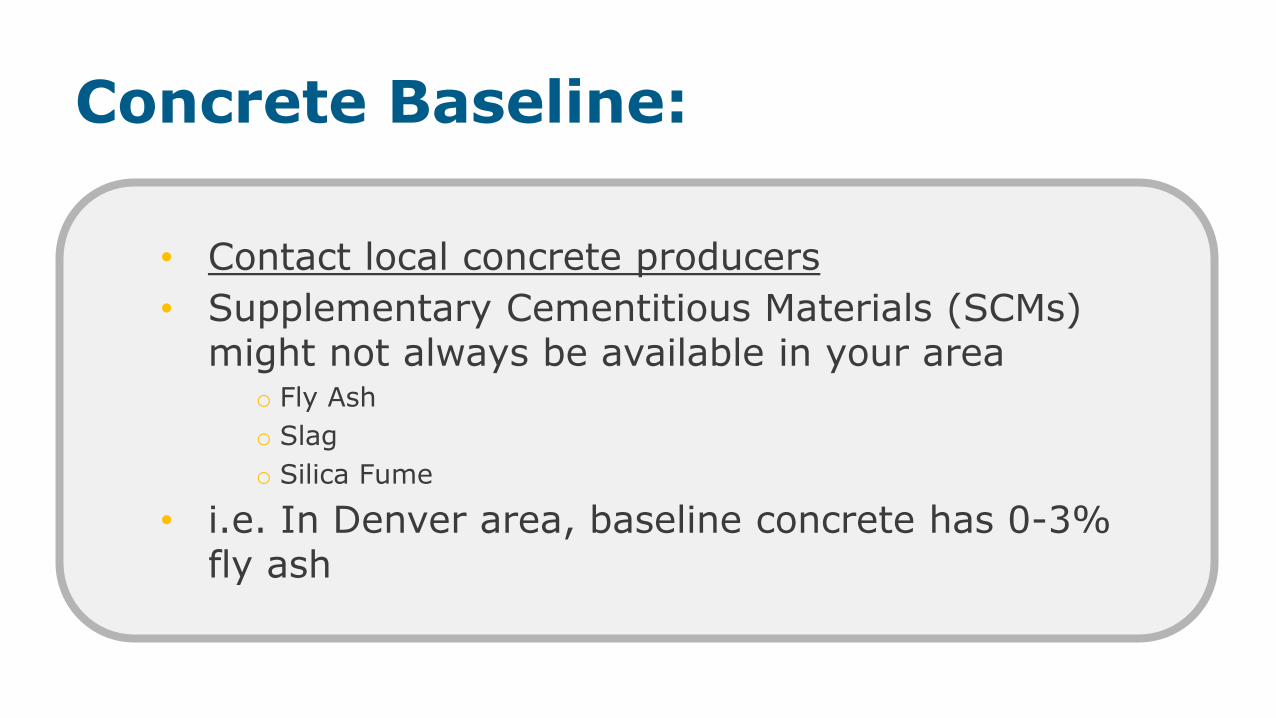
• Contact local concrete producers• Supplementary Cementitious Materials (SCMs)
might not always be available in your areao Fly Asho Slago Silica Fume
• i.e. In Denver area, baseline concrete has 0-3% fly ash
Concrete Baseline:

ambient energy
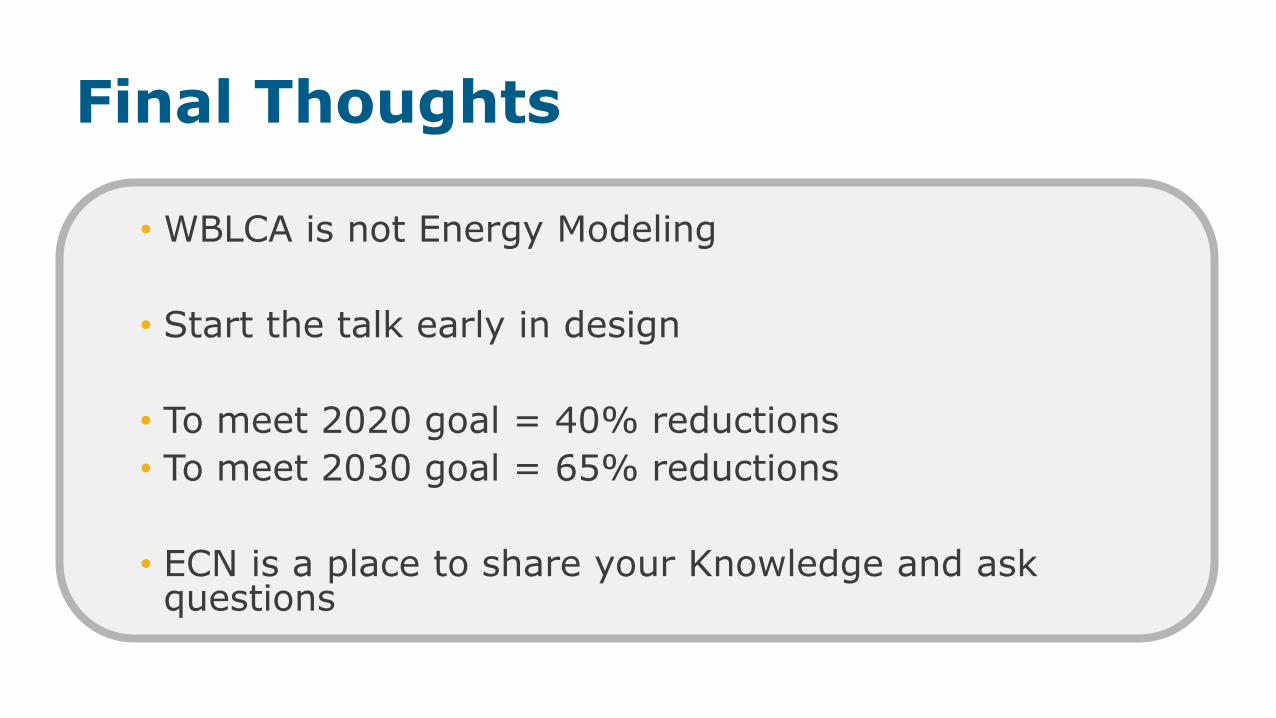
Final Thoughts
ambient energy
• WBLCA is not Energy Modeling
• Start the talk early in design
• To meet 2020 goal = 40% reductions• To meet 2030 goal = 65% reductions
• ECN is a place to share your Knowledge and ask questions
Final Thoughts
ambient energy
Denver ● San Francisco
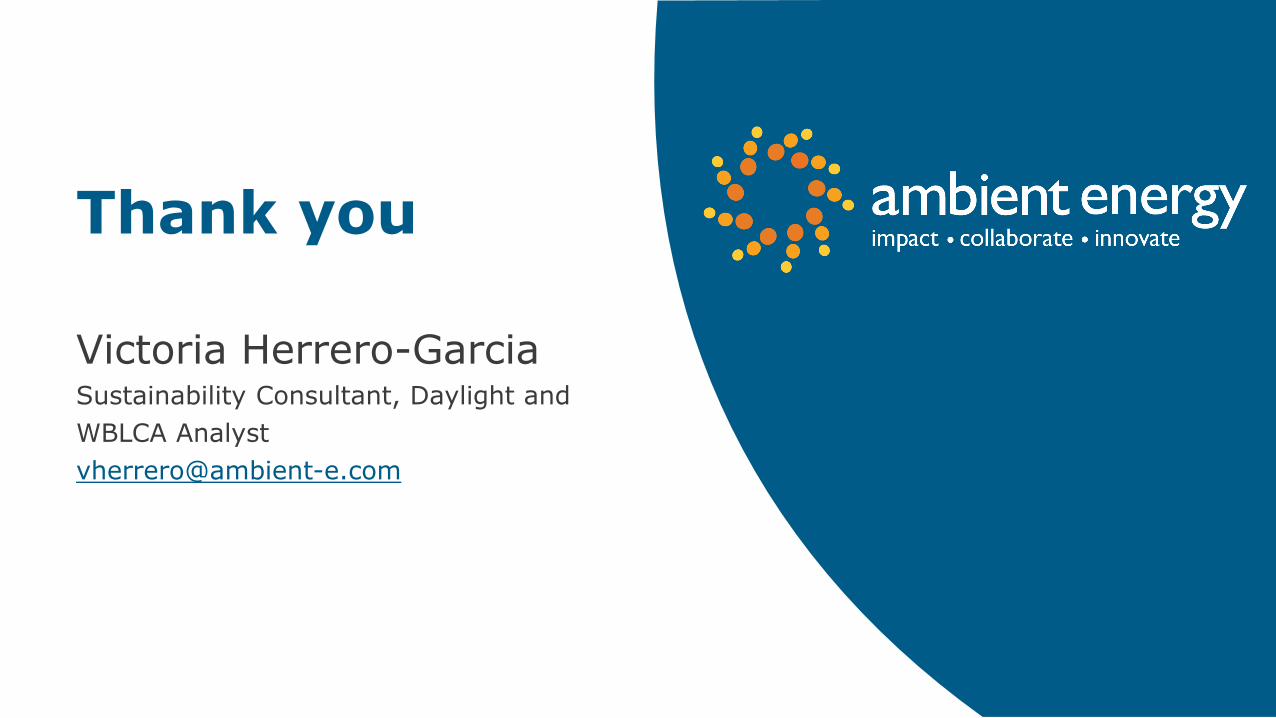
Thank you
Victoria Herrero-GarciaSustainability Consultant, Daylight and WBLCA [email protected]

Q&A
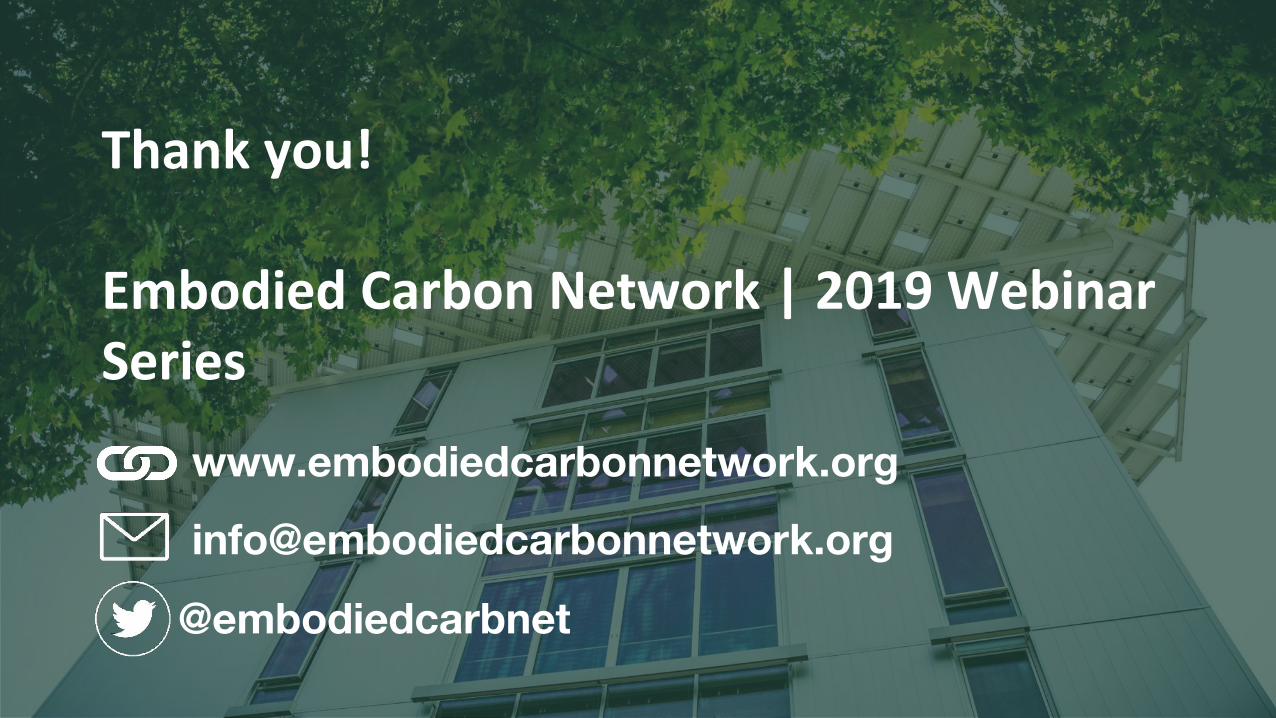
Thank you!
Embodied Carbon Network | 2019 Webinar Series
www.embodiedcarbonnetwork.org
@embodiedcarbnet