
Using OPM to manage performance in a datawarehouse ...
56
IBM ® DB2 ® for Linux, UNIX, and Windows ���® Best practices Managing data warehouse performance with IBM InfoSphere Optim Performance Manager Garrett Fitzsimons Data Warehousing Specialist, IBM Dublin Lab Gary Murtagh DB2 Data Warehouse QA Specialist, IBM Dublin Lab Issued: September 2012
-
Upload
khangminh22 -
Category
Documents
-
view
3 -
download
0
Transcript of Using OPM to manage performance in a datawarehouse ...
IBM® DB2® for Linux, UNIX, and Windows
���®
Best practices Managing data warehouse
performance with IBM InfoSphere Optim Performance Manager
Garrett Fitzsimons Data Warehousing Specialist, IBM Dublin Lab
Gary Murtagh DB2 Data Warehouse QA Specialist, IBM Dublin Lab
Issued: September 2012
Table of contents Managing data warehouse performance with IBM InfoSphere Optim Performance Manager ......................................................................................... 1
Table of contents .................................................................................................. 2
Executive summary ............................................................................................. 4
Introduction .......................................................................................................... 5
Getting started with OPM .................................................................................. 6
OPM configuration on IBM Smart Analytics System ............................... 6
Starting and stopping OPM.......................................................................... 7
Planning to use OPM to monitor your data warehouse .......................... 8
OPM monitoring profiles and system templates ...................................... 8
Data collection, aggregation, and retention ............................................. 10
Monitoring performance metrics..................................................................... 15
Reviewing database connections and activity ......................................... 16
Identifying skew in data or query performance...................................... 18
Monitoring DB2 network activity and performance .............................. 20
Using locking metrics to identify bottlenecks.......................................... 20
Monitoring utilities ...................................................................................... 21
Monitoring exceptions by using alert thresholds.......................................... 23
Using OPM to enable, configure and monitor DB2 WLM workloads ....... 27
Using DB2 WLM features within OPM .................................................... 27
Creating a new application workload through OPM............................. 27
Monitoring OPM workload activity.......................................................... 30
Introducing a new application workload................................................. 31
Monitoring an ETL application workload...................................................... 36
Creating an alternative OPM web console user ............................................ 39
Creating an administrative user for the monitored database................ 39
Creating a new OPM web console user for non‐administrative users ...... 41
Managing data warehouse performance with Optim Performance Manager Page 2 of 56

Creating a non‐administrative user for the monitored database.......... 41
Maintenance and troubleshooting................................................................... 43
Using Extended Insight to collect, monitor and analyze performance...... 45
Configuring workload groups for individual applications................... 46
Setting response time alerts........................................................................ 47
OPM integration with IBM Data Studio v3.1................................................. 50
Tuning SQL statements............................................................................... 50
Conclusion .......................................................................................................... 51
Appendix A. Creating a dedicated 32 kb table space for event monitors . 52
Further reading................................................................................................... 53
Contributors.................................................................................................. 54
Notices ................................................................................................................. 55
Trademarks ................................................................................................... 56
Managing data warehouse performance with Optim Performance Manager Page 3 of 56

Executive summary This paper is targeted at those who are involved in implementing IBM InfoSphere Optim Performance Manager (OPM) 5.1 in a data warehouse environment that is based on DB2® for Linux, UNIX, and Windows V9.7 (DB2 9.7) software. In particular, this paper focuses on the IBM ®Smart Analytics System environment with configurations that are based on System x® and Power Systems™ servers. This paper describes an OPM monitoring configuration that takes advantage of the in‐memory metrics that were released in DB2 9.7.
The goal of an OPM implementation in a warehouse environment is to identify which database operations and application workloads are consuming resources on individual database partitions and across the entire database. Identifying the appropriate indicators and workloads to monitor in your environment is a key step in measuring the performance of your database workloads against your service level objectives.
To diagnose possible performance bottlenecks and trends in database workload behavior, you can use dashboards and reports in OPM. In particular, you can use the dashboards and reports to help perform root cause analysis for locking conflicts, deadlocks, timeouts, log performance problems, resource shortages, and sorting problems.
The IBM Smart Analytics System product incorporates best practices guidelines for a stable and high‐performance data warehouse environment and is based on a shared‐nothing architecture. This paper builds on that approach by recommending how you can use OPM to monitor database performance and identify deviations in behavior across the database.
Managing data warehouse performance with Optim Performance Manager Page 4 of 56
Introduction
OPM is a highly configurable application that you can use to monitor the health and performance of a database. Follow the recommendations in this paper to help you optimize the configuration of OPM to efficiently monitor and manage data queries, data loads, and administrative operations with OPM’s diagnostic dashboards and reports. You can use these dashboards and reports to diagnose possible performance bottlenecks and trends in database workload behavior. In particular, you can use the dashboards and reports to help determine the cause of locking conflicts, deadlocks, timeouts, log performance problems, resource shortages, and sorting problems.
The first part of the paper describes how OPM is installed and configured in IBM Smart Analytics System 7700 R1 environment and how you can modify the configuration to suit your needs.
After the installation and configuration steps, the paper describes how to use OPM to monitor performance metrics in a data warehouse environment. You will also learn how you can configure alert thresholds to align them with service level objectives and to notify you of any exceptions.
Finally, you will learn how you can use OPM with DB2 Workload Manager (DB2 WLM) best practices to monitor metrics by application workload.
Publications that explain how the product is installed, set up, and used in various environments are referenced in the “Further reading” section. This paper complements these publications and focuses on warehousing environments in general and the IBM Smart Analytics System in particular.
Managing data warehouse performance with Optim Performance Manager Page 5 of 56

Getting started with OPM In OPM, performance metrics and health details are collected from the monitored database and stored in an OPM repository database. You can switch between a real‐time and historical analysis of the collected data. You can enter the start and end times for the period you wish to monitor, or choose start and end times from a drop down list. For the historical time period analysis, you can also choose the time period by using a slider bar on the web console.
The following sections describe the default installation and configuration of OPM on IBM Smart Analytics System 7700 R1 2.0.5.0 and how you should plan for using OPM to monitor your database. Previous versions of the IBM Smart Analytics System might have Performance Expert installed. Work with your IBM contacts if you want to upgrade to OPM.
OPM configuration on IBM Smart Analytics System On IBM Smart Analytics System, OPM is installed on the management module and monitors the partitioned data warehouse database on each administration and data node. All data that OPM collects is stored in the OPM repository database on the management node. OPM creates and uses event monitors on the monitored database, in addition to in‐memory table functions and admin views, to collect data.
To access OPM, go to the OPM URL, for example: https://management_node:55001/console/main/index.jsp. The port might be different on your installation, and you should check the /etc/services file on the management node to verify which port to use.
A single user ID, bcupe, owns the OPM binary files, the OPM repository server processes, and the OPM repository database, which is a DB2 database on the management node.
The default configuration of OPM on IBM Smart Analytics System uses the DB2 instance owner to connect to the monitored database, for example, bcuaix. If your security policy indicates that a user ID other than the instance owner is to be used to access the OPM web console or to connect to the monitored database, you can create a separate user ID. The steps for completing this task are detailed later in this paper.
If a standby module is configured, use the dynamic service IP address to connect to the monitored database. Use the lssam command to identify the IP address. For example, on the administration node of an IBM Smart Analytics system, as user root, issue the following command:
lssam | grep db2ip
If a standby module is configured, use the dynamic service IP address for the administration node when configuring a connection for the monitored database.
Managing data warehouse performance with Optim Performance Manager Page 6 of 56

Starting and stopping OPM Command line scripts are provided to stop and start OPM:
To start all OPM repository server processes, including data collection, event monitoring, and OPM repository database, use the OPMstart.sh script in the /opt/IBM/OPM directory.
To stop all OPM repository server services, including data collection, and event monitoring, use the OPMstop.sh script in the /opt/IBM/OPM directory. This script does not stop the OPM repository database; you must stop the database manually if needed.
Use the OPMstart.sh and OPMstop.sh scripts in the /opt/IBM/OPM directory to start and stop OPM repository server services.
You can use the OPMstatus.sh script in the /opt/IBM/OPM directory to determine the status of the OPM processes.
To enable and disable individual OPM features, including performance, health, and WLM data collection, use the OPM web console; accessed by default using the bcupe user ID.
To enable or disable performance or health monitoring data collection for a particular database, on the Databases dashboard, click Configure Monitoring, and then select the Activate Monitoring check box.
To enable or disable the collection of data for the Health dashboard, on the Health Alerts Configuration tab, click Monitor database health.
If you disable the collection of performance or health data by using the web console, the real‐time monitoring process is not disabled. To stop all OPM processes, you must run the OPMstop.sh script.
Managing data warehouse performance with Optim Performance Manager Page 7 of 56

Planning to use OPM to monitor your data warehouse Consider the following points when planning to use OPM in your environment:
What applications exist in your environment? Have you implemented DB2 WLM to isolate the workload for each database application so that you can monitor individual application workloads and compare performance metrics across database applications?
What service level objectives exist for your application workloads? How is your configuration of OPM aligned with collecting data that you can use to measure performance against these objectives?
What metrics do you need to use, or currently use, to react to performance and capacity issues and to proactively manage potential performance and capacity issues in the future?
Using OPM, you can analyze real‐time performance to understand how individual application workloads are currently behaving. You can also use OPM to analyze how the system performed historically over a particular period of hours, days, weeks, or years. You can determine whether an application workload or the database in general was operating at low usage, normal usage, or peak usage.
While OPM provides rich functionality in monitoring all areas of database performance and health, it is important that you seek to collect only the data you need and at the appropriate time intervals to meet your monitoring needs. In this way, you can effectively manage the monitoring component of your database.
In a production environment, look to collect only the data you need to monitor the service level objectives to be supported; additional metrics can be collected as the situation demands.
Performance metrics and health information is presented on various dashboards in OPM. Consider which dashboards you intend to use and then align these needs with the monitoring profiles you enable.
OPM monitoring profiles and system templates
Monitoring profiles specify which metrics are collected, for example locking or I/O. Pre‐defined system templates that combine monitoring profiles and data retention settings are available for selection in the Edit Monitoring Configuration wizard. For best results, you should begin monitoring your data warehouse by choosing one of the two BI templates that are provided:
“BI Production system with low overhead”
This template is the default for IBM Smart Analytics System. Use this template under normal operating conditions to collect metrics for the SQL Statement, Connection, I/O and Extended Insight (EI) dashboards. This template has a minimal effect in terms of network traffic and database operations on the
Managing data warehouse performance with Optim Performance Manager Page 8 of 56

database that you are monitoring and on the amount of space that is required to retain the collected data.
Data not collected by default includes locking metrics, detailed metrics for the EI dashboard, table space and container metrics, and WLM statistics and configuration metrics. The EI “Collect statement and transaction metrics on client” option is the only option that enables an event monitor. You can manually change the default configuration to add additional metrics, if needed, by using Step 2 of the Edit Monitoring Configuration wizard.
“BI Production system with all details”
If you are introducing changes to the monitored database, you can use this template to collect additional data for a more detailed analysis of how the changes might have affected performance. This template requires more resources and collects more data than the default template. You should use the “BI Production system with all details” template for a defined period during which you are monitoring the effects of the changes.
Additional event monitors are enabled when you use this template. When enabling this template, consider creating a dedicated 32 K table space, as described in Appendix A, for the tables for these event monitors..
Use the BI system templates that are provided. Use the “BI Production system with low overhead” template under normal operating conditions. Use the “BI Production system with all details” template when you are introducing a change such as a new application.
Be familiar with the installed configuration and how data is collected and aggregated before making any changes to the monitoring profiles. For a complete list of templates and details of the data collected through each, see the “Further reading” section.
Changing the default OPM monitoring configuration When changing the default monitoring configuration for the database, first understand why you are changing the monitoring configuration and what results you expect. For example, consider the following points:
When you add additional monitoring profiles, the volume of collected metrics increases. Monitor file system usage, for example /db2pe/bcupe/NODE0000/, on the OPM repository server to help ensure that it does not become full.
Collecting additional metrics requires more system resources on the monitored database. You should monitor the resources used and refine which monitoring profiles are running and at what intervals.
Disabling the collection of metrics affects any alert thresholds (described later in this paper) that depend on that data. Ensure that any alert threshold settings are not inadvertently disabled.
Collect additional metrics when you are managing a specific performance issue. For example, you might need additional metrics when monitoring a locking issue or
Managing data warehouse performance with Optim Performance Manager Page 9 of 56
introducing a new application to your environment. Revert back to the “BI Production system with low overhead” system template configuration after addressing the performance issue has been addressed.
Change the default configuration only for specific performance monitoring needs. Revert to the recommended system template configuration after monitoring is completed.
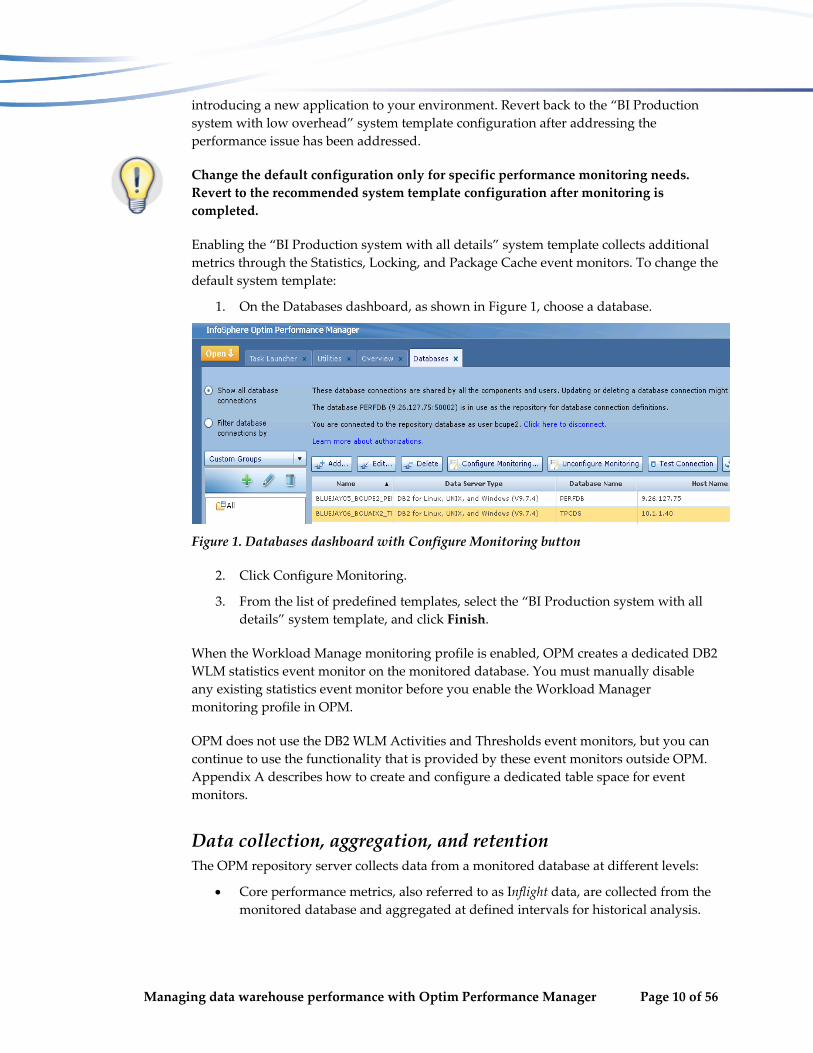
Enabling the “BI Production system with all details” system template collects additional metrics through the Statistics, Locking, and Package Cache event monitors. To change the default system template:
1. On the Databases dashboard, as shown in Figure 1, choose a database.
Figure 1. Databases dashboard with Configure Monitoring button
2. Click Configure Monitoring.
3. From the list of predefined templates, select the “BI Production system with all details” system template, and click Finish.
When the Workload Manage monitoring profile is enabled, OPM creates a dedicated DB2 WLM statistics event monitor on the monitored database. You must manually disable any existing statistics event monitor before you enable the Workload Manager monitoring profile in OPM.
OPM does not use the DB2 WLM Activities and Thresholds event monitors, but you can continue to use the functionality that is provided by these event monitors outside OPM. Appendix A describes how to create and configure a dedicated table space for event monitors.
Data collection, aggregation, and retention The OPM repository server collects data from a monitored database at different levels:
Core performance metrics, also referred to as Inflight data, are collected from the monitored database and aggregated at defined intervals for historical analysis.
Managing data warehouse performance with Optim Performance Manager Page 10 of 56

In real time, performance metrics are collected at a defined interval or on demand, but they are not written to the repository database or aggregated.
The EI dashboard collects performance metrics from the monitored database and configured applications for historical and real‐time analysis at a fixed 1‐minute interval.
The Health Summary feature collects specific health data from the monitored database at defined intervals.
The WLM configuration monitoring profile enables the collection of WLM configuration data and sampling metrics at defined intervals.
Figure 2 shows the Retention times and sampling intervals tab in the Edit Monitoring Configuration wizard. Use of the recommended settings in this figure enables data to be collected from the monitored database every minute and aggregated for up to two years before being automatically removed. The sampling rates for EI, WLM, and health monitoring are not governed by these settings.
Figure 2. Default sampling rate and data aggregation settings
Altering the settings in Figure 1 affects the volume of data that is collected. Consider the effect of this on the monitored database and on the space that is required in the OPM repository database.
Managing data warehouse performance with Optim Performance Manager Page 11 of 56
The “Sampling rate in minutes” setting determines how often data is collected through DB2 in‐memory metrics and snapshot table functions.
The “Aggregation level” setting determines when data is written to the OPM repository database to support the historical analysis of data. When data ages, it is aggregated into a table that reflects the time period of the aggregation. The value for aggregation level 1 always matches the value of the sampling rate.
The “Storage period” setting determines the retention period for aggregated data. When data ages past aggregation level 4, it is removed.
The OPM repository database is located on the /db2pe file system on the management node. In IBM Smart Analytics System 7700 R1, 278 GB of disk space is available to collect performance data. Where storage capacity becomes an issue, you can reduce the volume of data in the OPM repository database by reducing the Storage period from 2 years.
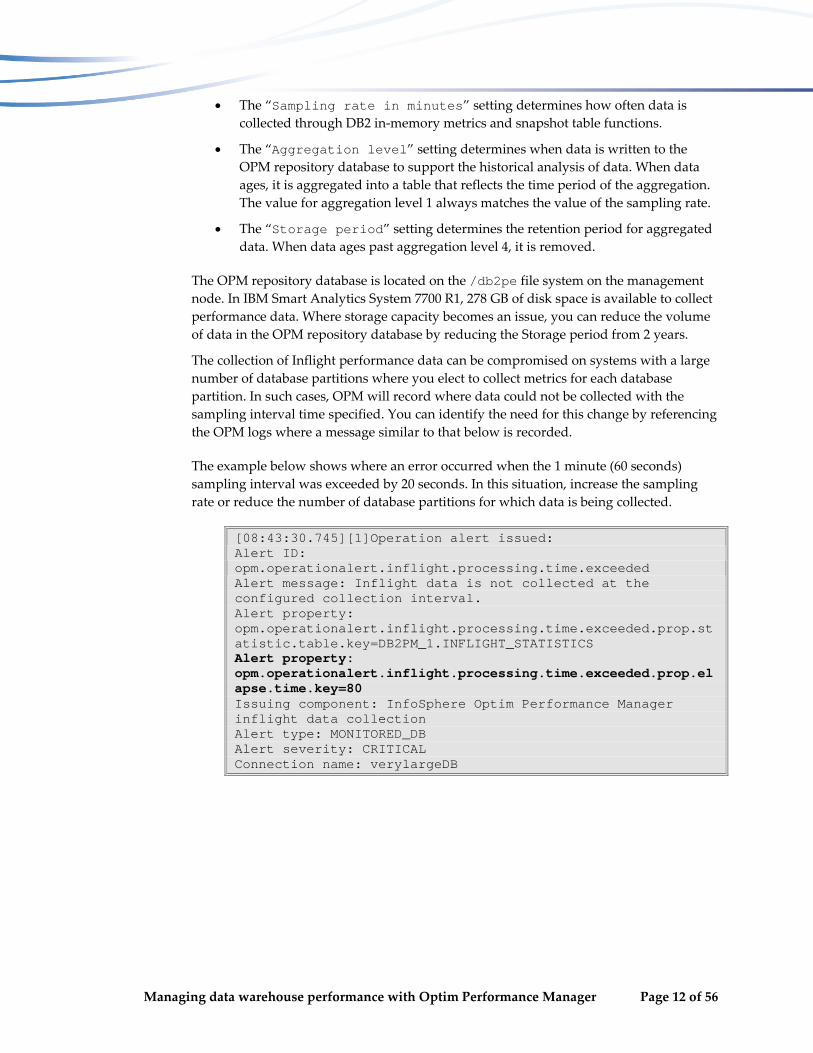
The collection of Inflight performance data can be compromised on systems with a large number of database partitions where you elect to collect metrics for each database partition. In such cases, OPM will record where data could not be collected with the sampling interval time specified. You can identify the need for this change by referencing the OPM logs where a message similar to that below is recorded.
The example below shows where an error occurred when the 1 minute (60 seconds) sampling interval was exceeded by 20 seconds. In this situation, increase the sampling rate or reduce the number of database partitions for which data is being collected.
[08:43:30.745][1]Operation alert issued:Alert ID: opm.operationalert.inflight.processing.time.exceededAlert message: Inflight data is not collected at theconfigured collection interval.Alert property:opm.operationalert.inflight.processing.time.exceeded.prop.statistic.table.key=DB2PM_1.INFLIGHT_STATISTICSAlert property:opm.operationalert.inflight.processing.time.exceeded.prop.elapse.time.key=80Issuing component: InfoSphere Optim Performance Managerinflight data collectionAlert type: MONITORED_DBAlert severity: CRITICALConnection name: verylargeDB
Managing data warehouse performance with Optim Performance Manager Page 12 of 56

Creating partition sets A partition set is used to group database partitions for the purpose of data collection. In the default configuration, as illustrated in Figure 3, the “All partitions” partition set is used:
Figure 3. Default configuration of partition sets
In an environment with a large number of database partitions, you might want to restrict the number of database partitions for which monitoring data is collected. Base your decision on the effect that monitoring all database partitions has on resources and the volume of data that you want to display on OPM dashboards, screens, charts, and reports.
For example, in a database with 64 database partitions, 64 individual backup operations, one for each database partition would be displayed.
In large database environments, create a custom partition set that collects data for one database partition per data node and for all database partitions that are associated with each unique generation of IBM Smart Analytics System module.
When you want to deviate from the default of collecting data for all database partitions, you should create a custom partition set, as shown in Figure 4, that includes the following database partitions:
The coordinator partition
The first database partition for each data module
For one data node, all database partitions that represent a unique type or generation of data module
Managing data warehouse performance with Optim Performance Manager Page 13 of 56
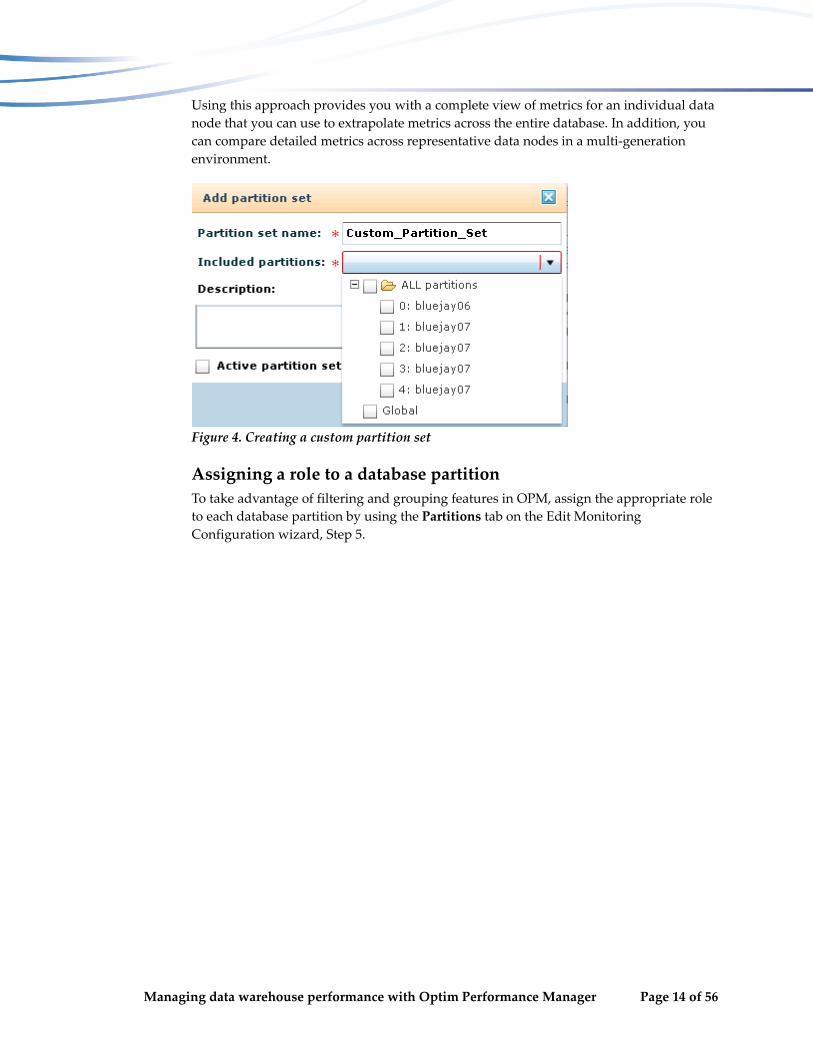
Using this approach provides you with a complete view of metrics for an individual data node that you can use to extrapolate metrics across the entire database. In addition, you can compare detailed metrics across representative data nodes in a multi‐generation environment.
Figure 4. Creating a custom partition set
Assigning a role to a database partition To take advantage of filtering and grouping features in OPM, assign the appropriate role to each database partition by using the Partitions tab on the Edit Monitoring Configuration wizard, Step 5.
Managing data warehouse performance with Optim Performance Manager Page 14 of 56
Monitoring performance metrics You can use the OPM web console to switch between real‐time and historical analysis views. The web console provides the option to automatically refresh data. To use OPM effectively, first decide whether you want to monitor real‐time activity or perform a historical analysis of performance metrics. Using the time slider control on each dashboard, select the duration for which you want to view data and click to disable the Automatic Refresh checkbox when you want to take some time to review the data that is displayed.
In most dashboards where a data grid is displayed, to specify which columns you want to display and remove those that you do not need, click Choose Columns. The configuration of chosen columns is associated and saved with each OPM web console user ID. If you allow a business user to access OPM to monitor the progress of that user’s workload, you should create a separate user ID with minimum administrative privileges and customized columns. The steps to create a business user ID are outlined in a later section of this paper.
In a partitioned database environment, by default, data is displayed as an average across all database partitions for which data is being collected. When this data includes data for the coordinator partition, the metrics might appear skewed. To restrict the data to just database partitions (or members), from the Partition Role list above the data grid, select option Role: Data Partition
To view information by individual database partition, above the data grid, click Members, where available. Where charts are displayed, to view the source data that is
used by the chart, click the Grid or Open details icon
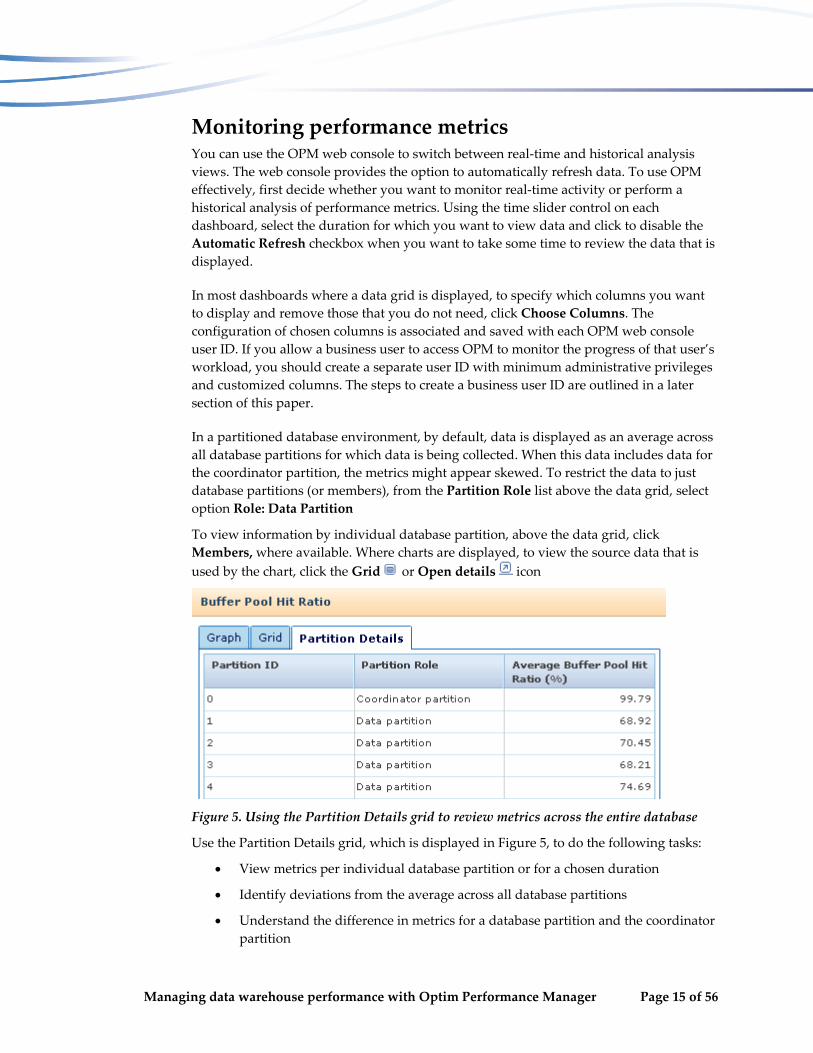
Figure 5. Using the Partition Details grid to review metrics across the entire database
Use the Partition Details grid, which is displayed in Figure 5, to do the following tasks:
View metrics per individual database partition or for a chosen duration
Identify deviations from the average across all database partitions
Understand the difference in metrics for a database partition and the coordinator partition
Managing data warehouse performance with Optim Performance Manager Page 15 of 56
To compare and analyze metrics for a specific member or partition role, use the Members list, where available on a dashboard.
Knowing the context in which you are interpreting metrics helps you determine whether a perceived performance issue is isolated to an individual query or whether a performance issue occurs in a particular set of circumstances. You should answer the following questions:
Have database applications been added or modified?
Aligning each database application workload with a WLM workload object allows you to immediately identify which applications are active and to isolate any connections from new or unidentified workloads.
Have there been changes to how the maintenance utilities operate?
You should use a unique user ID to perform maintenance operations so that you can filter and monitor utility connections and performance through OPM.
Have any hardware or software configuration changes been made to the system or database?
To review any changes to configuration parameters, use the Database Configuration report.
The following sections describe how you can use OPM to monitor and analyze different aspects of data warehouse activity and trends.
Reviewing database connections and activity
A good starting point in identifying abnormal activity is to know what connections were open and active at the time and what activities were being performed by application workloads. To view the average number of open and active connections and the average number of rows that were read per rows returned in the result set for a selected time period, use the Overview dashboard. Filter these metrics for individual users or applications, and compare this data with data for a prior period to understand usage trends over time.
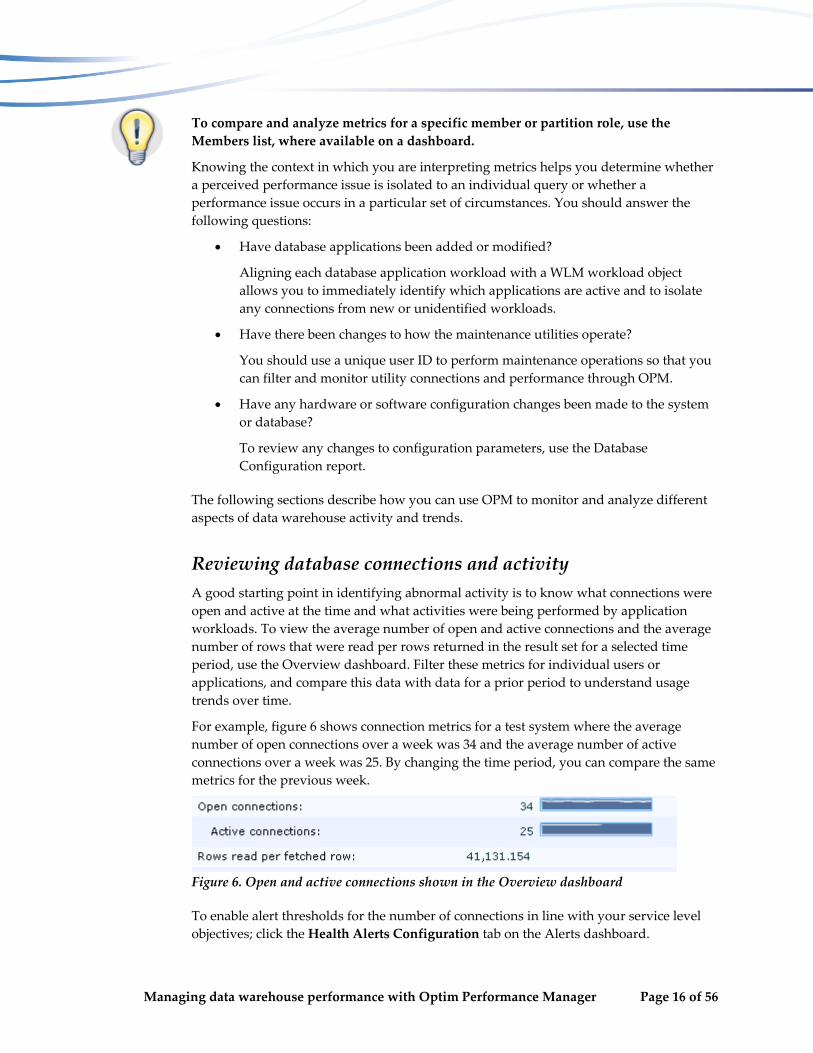
For example, figure 6 shows connection metrics for a test system where the average number of open connections over a week was 34 and the average number of active connections over a week was 25. By changing the time period, you can compare the same metrics for the previous week.
Figure 6. Open and active connections shown in the Overview dashboard
To enable alert thresholds for the number of connections in line with your service level objectives; click the Health Alerts Configuration tab on the Alerts dashboard.
Managing data warehouse performance with Optim Performance Manager Page 16 of 56
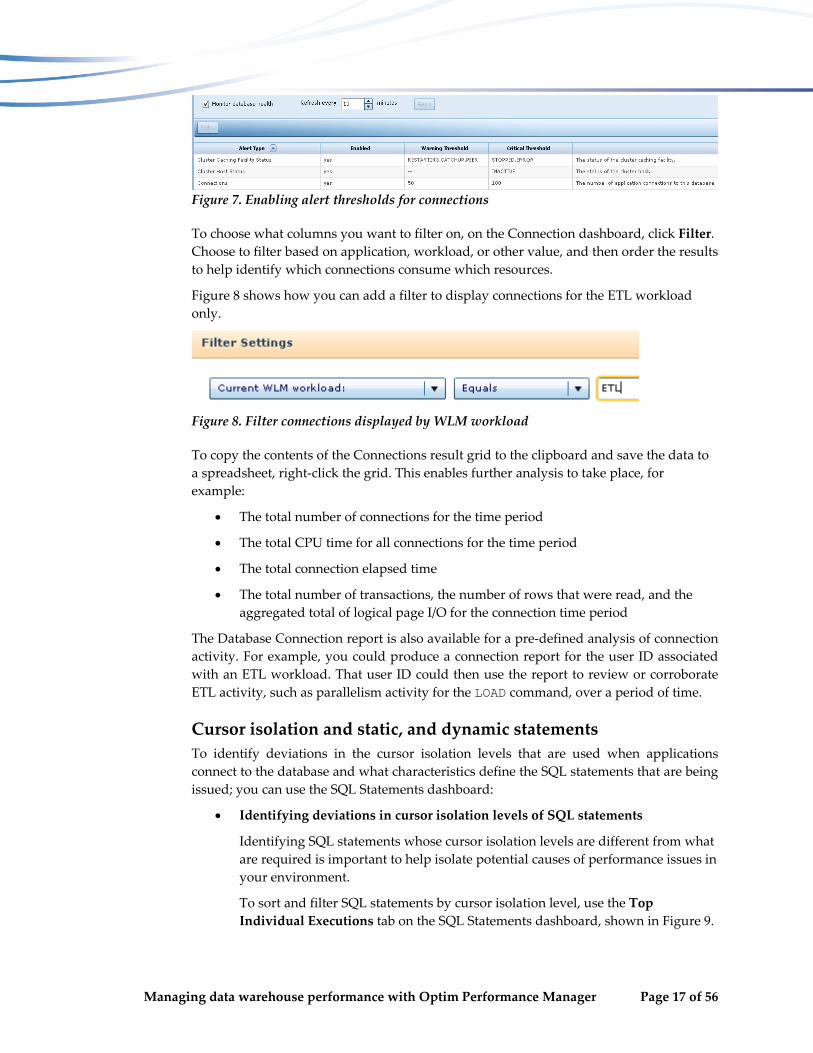
Figure 7. Enabling alert thresholds for connections
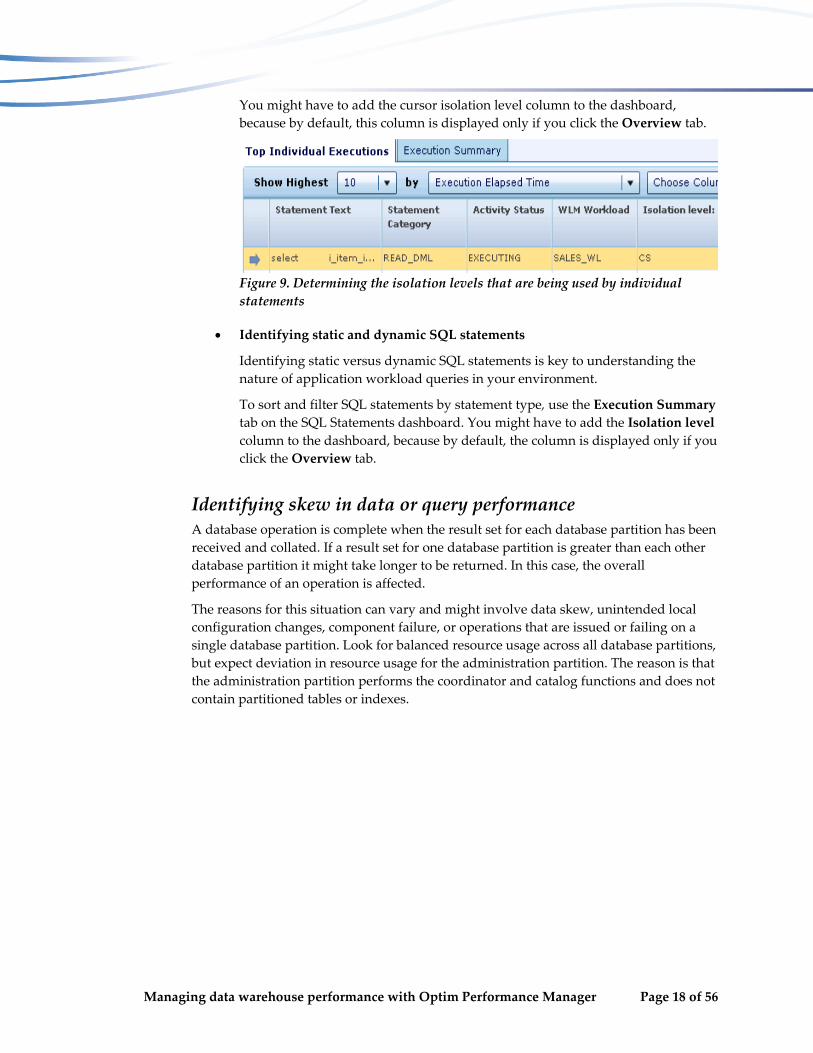
To choose what columns you want to filter on, on the Connection dashboard, click Filter. Choose to filter based on application, workload, or other value, and then order the results to help identify which connections consume which resources.
Figure 8 shows how you can add a filter to display connections for the ETL workload only.
Figure 8. Filter connections displayed by WLM workload
To copy the contents of the Connections result grid to the clipboard and save the data to a spreadsheet, right‐click the grid. This enables further analysis to take place, for example:
The total number of connections for the time period
The total CPU time for all connections for the time period
The total connection elapsed time
The total number of transactions, the number of rows that were read, and the aggregated total of logical page I/O for the connection time period
The Database Connection report is also available for a pre‐defined analysis of connection activity. For example, you could produce a connection report for the user ID associated with an ETL workload. That user ID could then use the report to review or corroborate ETL activity, such as parallelism activity for the LOAD command, over a period of time.
Cursor isolation and static, and dynamic statements To identify deviations in the cursor isolation levels that are used when applications connect to the database and what characteristics define the SQL statements that are being issued; you can use the SQL Statements dashboard:
Identifying deviations in cursor isolation levels of SQL statements
Identifying SQL statements whose cursor isolation levels are different from what are required is important to help isolate potential causes of performance issues in your environment.
To sort and filter SQL statements by cursor isolation level, use the Top Individual Executions tab on the SQL Statements dashboard, shown in Figure 9.
Managing data warehouse performance with Optim Performance Manager Page 17 of 56
You might have to add the cursor isolation level column to the dashboard, because by default, this column is displayed only if you click the Overview tab.
Figure 9. Determining the isolation levels that are being used by individual statements
Identifying static and dynamic SQL statements
Identifying static versus dynamic SQL statements is key to understanding the nature of application workload queries in your environment.
To sort and filter SQL statements by statement type, use the Execution Summary tab on the SQL Statements dashboard. You might have to add the Isolation level column to the dashboard, because by default, the column is displayed only if you click the Overview tab.
Identifying skew in data or query performance A database operation is complete when the result set for each database partition has been received and collated. If a result set for one database partition is greater than each other database partition it might take longer to be returned. In this case, the overall performance of an operation is affected.
The reasons for this situation can vary and might involve data skew, unintended local configuration changes, component failure, or operations that are issued or failing on a single database partition. Look for balanced resource usage across all database partitions, but expect deviation in resource usage for the administration partition. The reason is that the administration partition performs the coordinator and catalog functions and does not contain partitioned tables or indexes.
Managing data warehouse performance with Optim Performance Manager Page 18 of 56
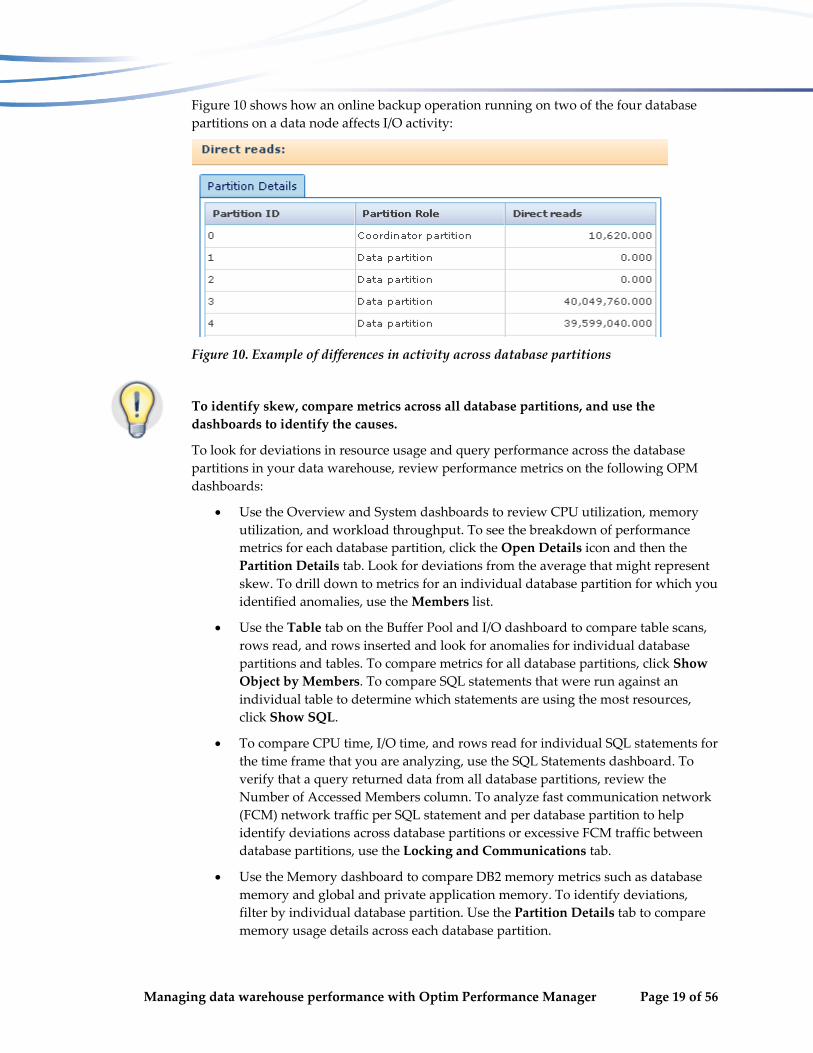
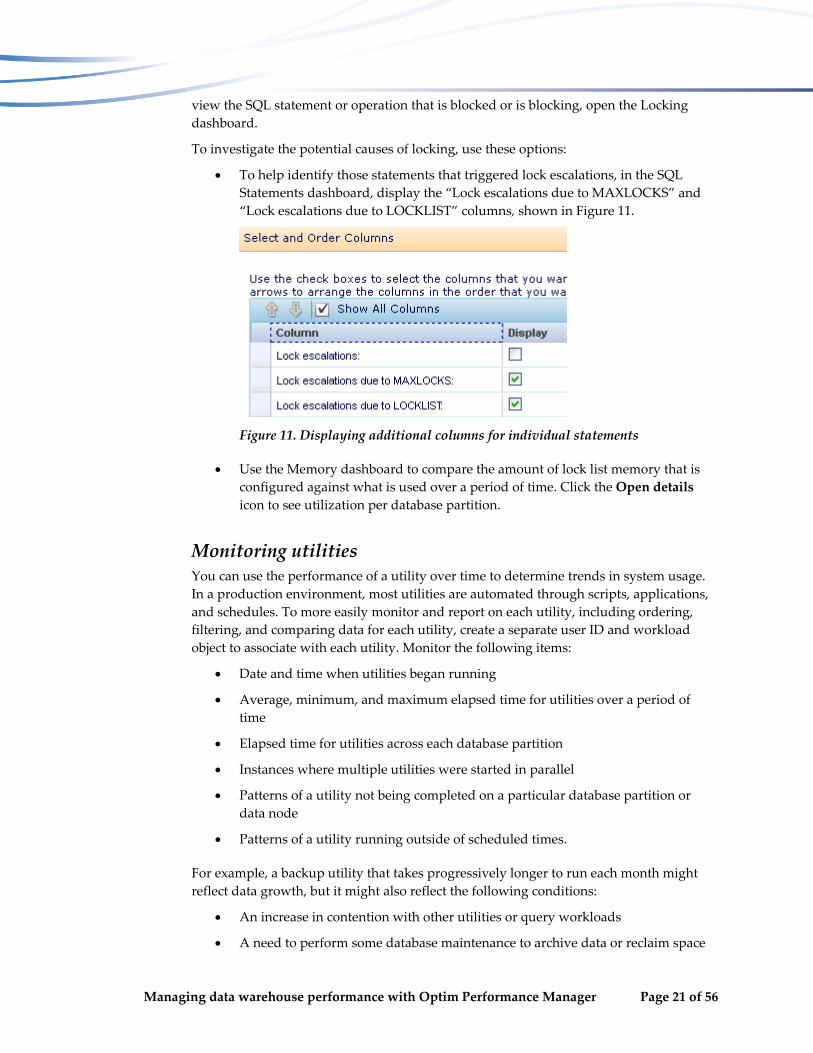
Figure 10 shows how an online backup operation running on two of the four database partitions on a data node affects I/O activity:
Figure 10. Example of differences in activity across database partitions
To identify skew, compare metrics across all database partitions, and use the dashboards to identify the causes.
To look for deviations in resource usage and query performance across the database partitions in your data warehouse, review performance metrics on the following OPM dashboards:
Use the Overview and System dashboards to review CPU utilization, memory utilization, and workload throughput. To see the breakdown of performance metrics for each database partition, click the Open Details icon and then the Partition Details tab. Look for deviations from the average that might represent skew. To drill down to metrics for an individual database partition for which you identified anomalies, use the Members list.
Use the Table tab on the Buffer Pool and I/O dashboard to compare table scans, rows read, and rows inserted and look for anomalies for individual database partitions and tables. To compare metrics for all database partitions, click Show Object by Members. To compare SQL statements that were run against an individual table to determine which statements are using the most resources, click Show SQL.
To compare CPU time, I/O time, and rows read for individual SQL statements for the time frame that you are analyzing, use the SQL Statements dashboard. To verify that a query returned data from all database partitions, review the Number of Accessed Members column. To analyze fast communication network (FCM) network traffic per SQL statement and per database partition to help identify deviations across database partitions or excessive FCM traffic between database partitions, use the Locking and Communications tab.
Use the Memory dashboard to compare DB2 memory metrics such as database memory and global and private application memory. To identify deviations, filter by individual database partition. Use the Partition Details tab to compare memory usage details across each database partition.
Managing data warehouse performance with Optim Performance Manager Page 19 of 56

Address the reasons for data or performance skew in the following ways:
By redefining the distribution key
By tuning the SQL statement
By replicating dimension tables to enable a collocated query
By coordinating utility execution to minimize the effect on other workloads
Refer to the Query Optimization paper in the “Further Reading” section for details on optimizing individual query performance.
Monitoring DB2 network activity and performance
The coordinator node retrieves data from each database partition. Although not desirable, data might need to be broadcast from one database partition to another database partition where a collocated query is not possible.
To facilitate the exchange of data between database partitions, the FCM is allocated 32 MB of memory by default on each database partition through the fcm_num_buffers database configuration parameter. Additional memory is allocated automatically and consumed as needed.
To review FCM memory allocation and usage across the partitioned database, both on average and per database partition use the Memory dashboard. To identify the SQL statements that are generating the most FCM traffic, switch to the SQL Statements dashboard, and use the FCM Total Send Volume and FCM Total Received Volume columns.
The memory allocation can grow when the volume of FCM traffic grows. An increase in memory allocation can affect other operations that require memory resources. Additional FCM buffer allocation might be required when the number of concurrent queries and volumes of rows read increase. An increase in traffic between database partitions rather than through the administration node might indicate an uneven distribution of data. This increase might also indicate the need to replicate a non‐partitioned frequently used lookup table.
Using locking metrics to identify bottlenecks
In a data warehouse environment, it is useful to monitor locking during periods where DB2 utilities and ETL processes are concurrently in operation. Know when DB2 utilities and ETL processes are scheduled so that you can note the specific time period during which locking issues might occur.
ETL processes and DB2 utilities are the most likely source of locking issues that drive the need to change the locking application or increase the values of lock‐related database configuration parameters. Compare locking metrics over a period of time to identify trends in lock behavior. Address issues through changes in the application, schedule, or database configuration.
Use the Overview dashboard to identify any deadlock, lock escalation, or lock wait activity in your database in real time. To view and act on any active lock issues and to
Managing data warehouse performance with Optim Performance Manager Page 20 of 56
view the SQL statement or operation that is blocked or is blocking, open the Locking dashboard.
To investigate the potential causes of locking, use these options:
To help identify those statements that triggered lock escalations, in the SQL Statements dashboard, display the “Lock escalations due to MAXLOCKS” and “Lock escalations due to LOCKLIST” columns, shown in Figure 11.
Figure 11. Displaying additional columns for individual statements
Use the Memory dashboard to compare the amount of lock list memory that is configured against what is used over a period of time. Click the Open details icon to see utilization per database partition.
Monitoring utilities You can use the performance of a utility over time to determine trends in system usage. In a production environment, most utilities are automated through scripts, applications, and schedules. To more easily monitor and report on each utility, including ordering, filtering, and comparing data for each utility, create a separate user ID and workload object to associate with each utility. Monitor the following items:
Date and time when utilities began running
Average, minimum, and maximum elapsed time for utilities over a period of time
Elapsed time for utilities across each database partition
Instances where multiple utilities were started in parallel
Patterns of a utility not being completed on a particular database partition or data node
Patterns of a utility running outside of scheduled times.
For example, a backup utility that takes progressively longer to run each month might reflect data growth, but it might also reflect the following conditions:
An increase in contention with other utilities or query workloads
A need to perform some database maintenance to archive data or reclaim space
Managing data warehouse performance with Optim Performance Manager Page 21 of 56

A need to reorganize database objects
A need to partition a specific table and assign separate table spaces
Use the Utilities dashboard and filter data by the criteria you are interested in, for example, by Ended jobs or by an individual database partition. Order the results by status and date, and review the elapsed time over the selected period. Copy the results into a spreadsheet for presentation purposes and for further comparison against service level objectives. The dashboard can help to identify situations in which multiple utilities running simultaneously might be causing performance or locking anomalies in your environment.
To see how many utilities were initiated through an individual connection and to monitor in real time the activity of utilities associated with an individual connection, use the Utilities tab on the Connection dashboard.
To report the last backup image created for each database partition across the entire database, use the Open details icon in the Crash Recovery section on the Logging dashboard.
To get detailed information about the connections that are associated with utilities, use the Database Connection report.
Managing data warehouse performance with Optim Performance Manager Page 22 of 56

Monitoring exceptions by using alert thresholds Alerts are triggered when a predefined threshold for a database metric or condition is reached or exceeded. Alerts are generated against Performance, Health, and Operational thresholds and events.
Alert notifications are used to create an alert and send an email when an alert threshold is triggered. Start with simple alert thresholds such as Database Partition Availability and add others as necessary. Avoid generating too many emails by only configuring Alert notifications for specific alerts.
Figure 13 shows an alert notification being created for Database Partition Availability when the condition is Critical. An email address is entered and an additional notification is sent when the alert is closed. A blackout time from 1AM to 8AM is also configured.
Figure 13. Using the alert threshold dashboard
Managing data warehouse performance with Optim Performance Manager Page 23 of 56
Performance alerts When enabling performance alerts, keep the following recommendations in mind:
Limit the number of alert thresholds to those that have a demonstrable effect on the performance or health of the monitored database.
Configure the performance alerts at partition role level so that you receive alerts for thresholds that directly relate to specific database partitions. For example, the number of sort overflows on the administration node is often different from the number of sort overflows on a database partition. In this situation, you should set a separate threshold for the data partition role only.
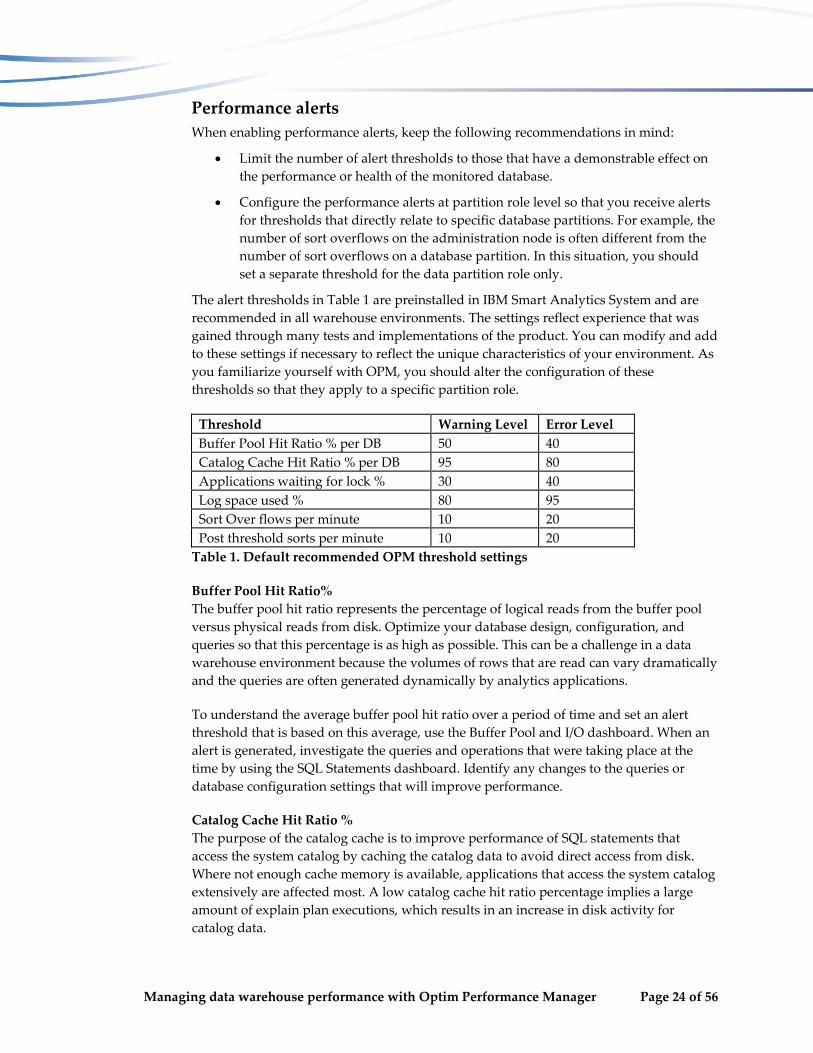
The alert thresholds in Table 1 are preinstalled in IBM Smart Analytics System and are recommended in all warehouse environments. The settings reflect experience that was gained through many tests and implementations of the product. You can modify and add to these settings if necessary to reflect the unique characteristics of your environment. As you familiarize yourself with OPM, you should alter the configuration of these thresholds so that they apply to a specific partition role.
Threshold Warning Level Error Level
Buffer Pool Hit Ratio % per DB 50 40
Catalog Cache Hit Ratio % per DB 95 80
Applications waiting for lock % 30 40
Log space used % 80 95
Sort Over flows per minute 10 20
Post threshold sorts per minute 10 20
Table 1. Default recommended OPM threshold settings
Buffer Pool Hit Ratio% The buffer pool hit ratio represents the percentage of logical reads from the buffer pool versus physical reads from disk. Optimize your database design, configuration, and queries so that this percentage is as high as possible. This can be a challenge in a data warehouse environment because the volumes of rows that are read can vary dramatically and the queries are often generated dynamically by analytics applications.
To understand the average buffer pool hit ratio over a period of time and set an alert threshold that is based on this average, use the Buffer Pool and I/O dashboard. When an alert is generated, investigate the queries and operations that were taking place at the time by using the SQL Statements dashboard. Identify any changes to the queries or database configuration settings that will improve performance.
Catalog Cache Hit Ratio % The purpose of the catalog cache is to improve performance of SQL statements that access the system catalog by caching the catalog data to avoid direct access from disk. Where not enough cache memory is available, applications that access the system catalog extensively are affected most. A low catalog cache hit ratio percentage implies a large amount of explain plan executions, which results in an increase in disk activity for catalog data.
Managing data warehouse performance with Optim Performance Manager Page 24 of 56
Applications waiting for lock An application or transaction that must wait for a lock is not processing data and represents lost time to the business. To understand the percentage of applications that are waiting for a lock, the longest wait time for a connection, and the wait time per transaction to acquire a lock, use the Overview dashboard.
Use the data in the dashboard in the context of the workload in operation to determine whether you must modify any locking‐related database configuration parameters or review any SQL statements or utility parameters.
Log space used Use this alert threshold to understand how often log switching occurs. Log switching should reflect ETL activity in your environment.
Sort overflows per minute The setting of the sortheap database configuration parameter represents the memory that is allocated to each sort and hash join. If insufficient memory is available, sorts use system temporary table space to make up the shortfall. If the system temporary table space is on SSD, the effect of this behavior is contained or less evident.
Post‐threshold sorts per minute The value of the sheapthres (sort heap threshold) database configuration parameter represents a soft limit on the total amount of memory that can be consumed by sorts at any one time. Sorts that take place after this threshold has been reached are called post‐threshold sorts and should be avoided.
To monitor sort overflows and post‐threshold sorts and to identify time periods where they most often occur, use the Workload dashboard. Use the time slider control to identify which SQL statements were executing and the sort operation time for each SQL statement. Order by and tune the top five statements based on criteria such as elapsed time or rows read, and re‐examine the sort overflow data.
Figure 14 illustrates how you can set specific thresholds for specific partition roles, avoiding metric skew caused by aggregating metrics across all database partitions. In the example that is shown, the coordinator partition has a threshold of 10% for a warning alert and 20% for a critical alert, whereas the data partition role has a lower setting of 2% for a warning alert and 3% for a critical alert.
Figure 14. Configuration of an alert threshold for specific roles
Managing data warehouse performance with Optim Performance Manager Page 25 of 56

Health and operational alerts A predefined range of health alerts, including Database Availability and Table Space Utilization are configured by default in OPM. You can enable or disable them as required.
Enable the collection of health alert metrics for both the OPM repository database and the monitored database by selecting the Monitor database health check box in the Health Alerts Configuration tab, shown in figure 15. To configure OPM to send an email notification for a specific alert to a specific email address, click the Alert Notification tab.
Figure 15. Enabling health alerts for a database
Operational alerts are generated by the OPM repository server when OPM cannot perform a function. These alerts can be related to both the OPM repository server and the monitored database. You can view these alerts in the main Alert List page in the OPM web console or through the OPM operating system logs, as described in the “Maintenance and Troubleshooting” section of this paper.
Managing data warehouse performance with Optim Performance Manager Page 26 of 56

Using OPM to enable, configure and monitor DB2 WLM workloads Enable the Workload Manager monitoring profile through step 2 of the Edit Configuration Monitoring wizard. Once enabled you can access the Workload Manager Configuration dashboard where you can configure, monitor and maintain DB2 WLM.
The Workload Manager monitoring profile has two sampling interval rates that are separate from the Inflight sampling interval while adhering to the same retention and aggregation settings:
Activity information
Workload activity information metrics are collected every minute.
Configuration information
Configuration information is collected every 10 minutes.
To create the WLM statistics event monitor, the Workload Manager monitoring profile needs a table space that is available on all database partitions. You specify this table space within OPM by selecting the TS_MONITORING table space in the DB2 event monitor configuration dialog box on step 2 of the Edit Monitoring Configuration wizard.
Using DB2 WLM features within OPM
When you first open the Workload Manager Configuration dashboard in the OPM web console, any existing DB2 WLM configuration is detected. If no WLM configurations exist, OPM prompts you to implement the DB2 WLM best practices stage 1 template on the monitored database. It is recommended that you follow DB2 WLM best practices and use this template.
For a comprehensive description of a staged approach to implementing DB2 WLM, see the best practices paper, “Implementing DB2 workload management in a data warehouse”, referenced in the “Further reading” section.
OPM re‐creates the WLM threshold definitions to align with internal OPM requirements. As part of this process, OPM modifies the threshold names but not the definitions. The modification of the threshold names by OPM is necessary so that you can use the configuration functionality of the Workload Manager Configuration dashboard. Without this change, OPM can only monitor WLM statistics and you cannot make modifications to the configuration of DB2 WLM.
Creating a new application workload through OPM You can build on the stage 1 implementation of WLM by further configuration of WLM through OPM or through the command line. The examples and recommendations that
Managing data warehouse performance with Optim Performance Manager Page 27 of 56

are shown in this section are inspired by the DB2 WLM best practices paper and build toward a stage 2 implementation as defined in that paper.
To configure DB2 WLM for a new application workload so that you can use the DB2 Workload Manager features in OPM more effectively, use the OPM web console. The following steps show how to add a sample application, Sales, to a test system:
1. On the Workload Manager Configuration dashboard, on the Workload tab, click Add, and enter the name of the workload that you want to add. In this example, the workload name is SALES_WL.
2. In the Connection Attributes section of the Properties pane, define a connection attribute and click Add. In the example shown in Figure 16, the user ID and IP address that are associated with the application workload are used. You might choose other identifiers in your environment.
Figure 16. Configuring connection attributes for a new workload
3. On the Service Superclasses tab, add a SALES_SC service superclass object by clicking Add and Create a service superclass from a template. This option creates the service superclass based on best practices and also implicitly creates the underlying service subclasses and related objects including workclass, action sets and thresholds.
Managing data warehouse performance with Optim Performance Manager Page 28 of 56
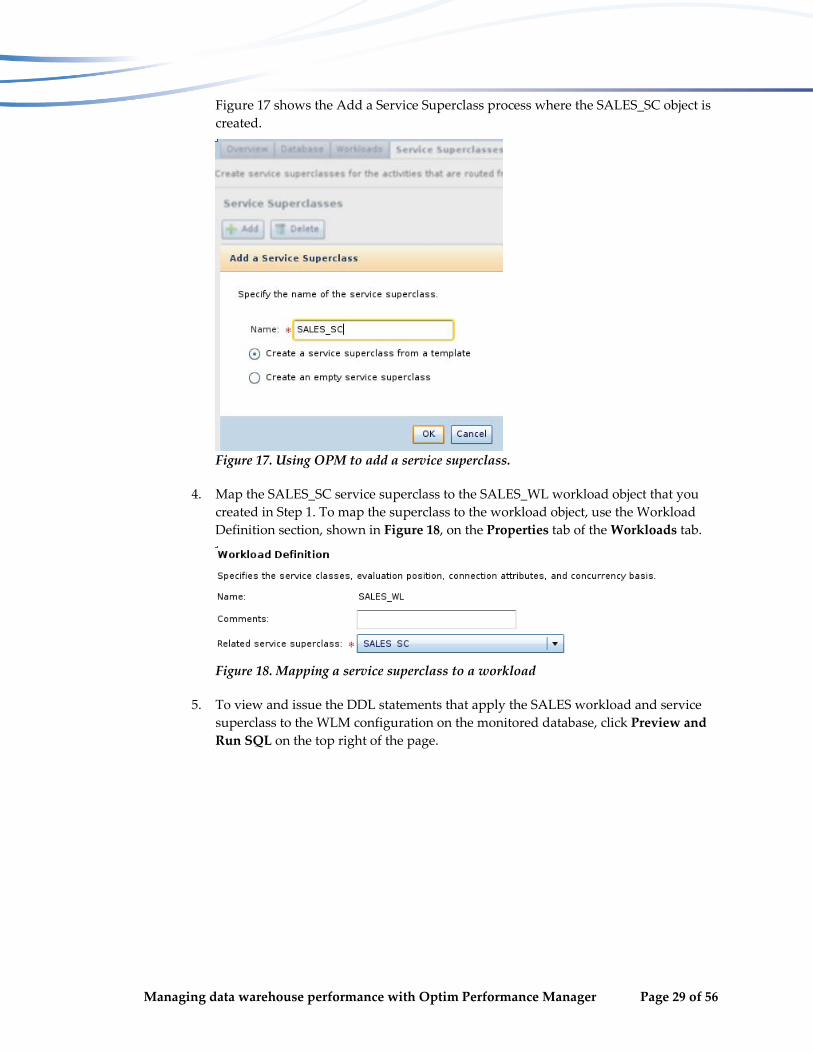
Figure 17 shows the Add a Service Superclass process where the SALES_SC object is created.
Figure 17. Using OPM to add a service superclass.
4. Map the SALES_SC service superclass to the SALES_WL workload object that you created in Step 1. To map the superclass to the workload object, use the Workload Definition section, shown in Figure 18, on the Properties tab of the Workloads tab.
Figure 18. Mapping a service superclass to a workload
5. To view and issue the DDL statements that apply the SALES workload and service superclass to the WLM configuration on the monitored database, click Preview and Run SQL on the top right of the page.
Managing data warehouse performance with Optim Performance Manager Page 29 of 56

Monitoring OPM workload activity Like other database applications accessing the data warehouse, the OPM repository server consumes resources on the monitored database. The frequency of the sampling interval that you select and the number of database partitions that you select for data collection affect resource consumption. Requesting frequent refreshes of in‐memory metrics through the dashboards also increases resource usage.
To configure OPM together with DB2 WLM to help manage and monitor the resources that are used by OPM more efficiently, use the following guidelines.
Create a workload configuration for OPM Use the steps in the previous section to create and map a workload to a service class for OPM database operations. If you created a dedicated user ID for OPM to use when connecting to the monitored database, use this user ID as the connection attribute in Step 2. An alternative in IBM Smart Analytics System is to specify the IP address of the management node.
Observe OPM‐related activities on the data warehouse Use OPM dashboards to monitor OPM activity against the monitored database, as follows:
To monitor activity and metrics for the OPM workload, use the Workload Manager Configuration charts, reports, and data grids. You can monitor activities and metrics after you configure DB2 WLM for the OPM application workload.
To enable the EI dashboard to display OPM activity, such as for troubleshooting:
1. Create a trace file for OPM activity. In the db2pesrv.prop file, located in the RepositoryServer/bin directory on the OPM repository server, add the following line:
set txt.monitor_opm_workload=yes
2. To apply this change, stop and start OPM.
To show data for the table space that is created for event monitor processing, filter the Buffer Pool and I/O dashboard to drill down on and view I/O information for each table under each event monitor.
To display connection activity for OPM, use the Connection dashboard. You can order data or filter data by Client Host Name, for example, the workload object, server host name, or IP address.
To view activity that is generated by OPM, use the Workload Manager Workload and Workload Manager Service Superclass / Subclass reports.
If you implement EI, use the EI dashboard to filter results by host name, accounting string, or other identifier to display activity that is generated by the OPM repository server.
Managing data warehouse performance with Optim Performance Manager Page 30 of 56

Introducing a new application workload When introducing a new application workload, document the service level objectives for the new workload before you begin testing the application.
Use the following approach to introduce the new application workload in a managed way:
1. Configure WLM so that you can isolate the new application workload from all other application workloads and monitor the new application workload separately from all other application workloads.
2. Determine and document start and end times that reflect the time frame for all operations for the new and existing application workloads. Choose times that reflect low usage, normal usage, and peak usage periods for each application workload.
3. Compare performance for the different time periods by using OPM reports, charts, and dashboards. Use this information to understand the effect of the new application workload on system resources, on other application workloads, on alert thresholds, and on workload service subclass concurrency thresholds.
4. Review any WLM configuration needs, alert threshold settings, and SQL statement performance issues.
5. Continue monitoring until you meet your service level objectives. Note the time period where your service level objectives were met so that you can compare metrics at subsequent times.
The following sections provide more information about this approach.
Be aware of existing or potential bottlenecks that the new application might exacerbate, and pay particular attention to these areas.
Configuring DB2 WLM to support the new application Create a workload for the new application as per the best practice recommendations in this paper. By configuring WLM with separate service classes for each application workload, you can use dashboards, charts, and reports to compare performance metrics across workloads.
Use WLM with OPM to separate application workloads for easier reporting, analysis, and performance management.
Figure 19 illustrates the definition of a dedicated workload and superclass for a Marketing application. The subclasses defined are as per DB2 WLM best practice recommendations. Using this approach, each Marketing workload activity can be monitored separately.
Managing data warehouse performance with Optim Performance Manager Page 31 of 56
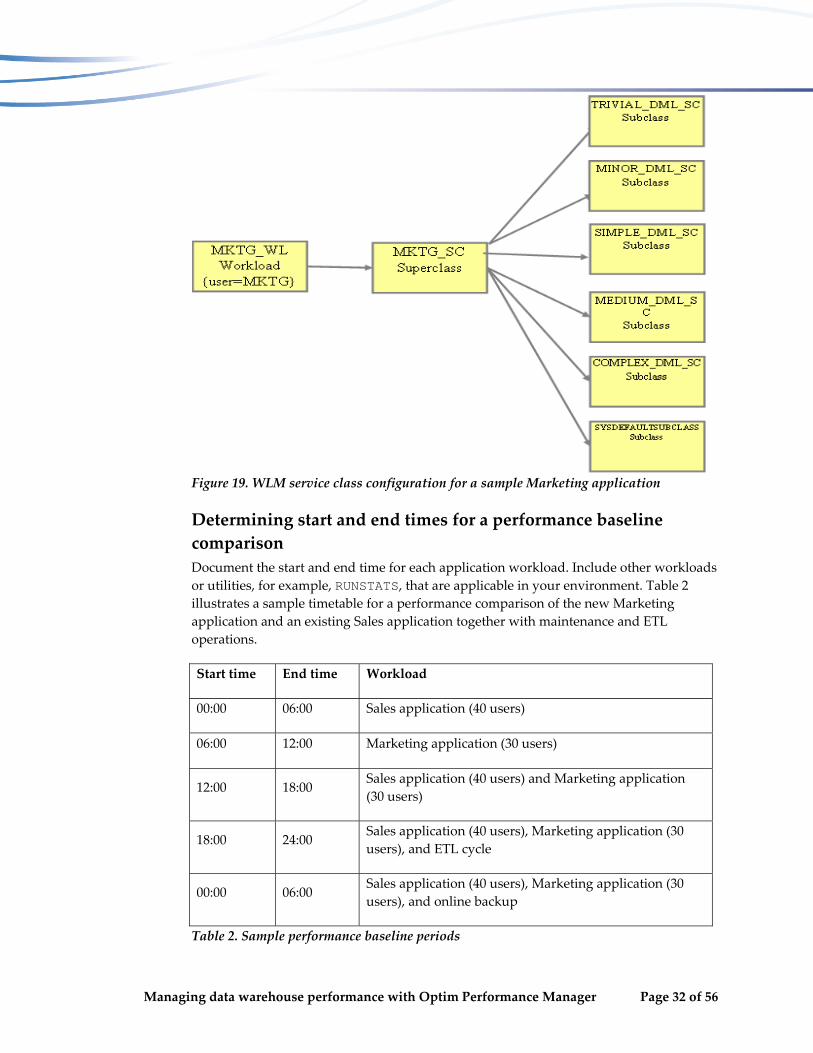
Figure 19. WLM service class configuration for a sample Marketing application
Determining start and end times for a performance baseline comparison Document the start and end time for each application workload. Include other workloads or utilities, for example, RUNSTATS, that are applicable in your environment. Table 2 illustrates a sample timetable for a performance comparison of the new Marketing application and an existing Sales application together with maintenance and ETL operations.
Start time End time Workload
00:00 06:00 Sales application (40 users)
06:00 12:00 Marketing application (30 users)
12:00 18:00 Sales application (40 users) and Marketing application (30 users)
18:00 24:00 Sales application (40 users), Marketing application (30 users), and ETL cycle
00:00 06:00 Sales application (40 users), Marketing application (30 users), and online backup
Table 2. Sample performance baseline periods
Managing data warehouse performance with Optim Performance Manager Page 32 of 56
You should be familiar with how your system performs before introducing the new application:
To understand the number of active connections and average CPU usage for each workload, use the Workload Service Concurrency and CPU Usage chart
To display a representation of CPU usage by workload, use the Workload Service Share of System Resources grid.
To view Key Performance Indicators (KPIs), use the Performance Overview report. Save the reports in a PDF file, spreadsheet, or presentation format, as required.
To understand normal conditions for existing applications, use the service subclass Concurrency and Time in Queue chart.
To determine the top SQL statements by hit ratio for each application, use the SQL Statements dashboard and the Buffer Pool and I/O dashboard.
Managing data warehouse performance with Optim Performance Manager Page 33 of 56

Comparing against performance baselines After the test period is complete, review the performance metrics that you gathered to understand how the introduction of the new application will affect existing application and maintenance workloads.
Use the dashboards and reports to identify SQL statements that you must tune, workload configuration settings that you might need to alter, and maintenance schedules that might benefit from changes. After completing these tasks, repeat the steps to re‐assess the performance of the workloads.
Figure 20 is an example of the Concurrency and CPU Usage chart on the Service Superclasses tab of the Workload Configuration dashboard. The values on the left side of the chart are the number of active connections for the specified workloads. The values on the right side of the chart are the average percentages of CPU usage across the monitored database. The chart includes metrics for the Sales, Marketing, ETL, and OPM workloads, for comparison.
Figure 20. Concurrency and CPU Usage chart
Use the Service Superclasses graphs and the data on the adjacent Share of System Resources grid to monitor the following items:
The number of connections per workload
The average CPU usage across the database
The share of system resources that are consumed by each workload during the test period, as shown in figure 21.
Managing data warehouse performance with Optim Performance Manager Page 34 of 56

Figure 21. Illustration of relative CPU activity across applications
To identify the top 25 SQL statements by resource usage or execution time during the time period when the new application was running in isolation and with existing applications, use the Performance Overview report. In addition to the SQL Baseline Comparison report, focus on tuning the top SQL statements for the new application, and identify and tune those SQL statements for the existing applications that have regressed.
View the history of an individual SQL statement over a period of time by copying the SQL statement text from the above reports into the filter of the SQL Statements dashboard. Order the results by selecting Execution Elapsed Time. Figure 22 illustrates an SQL statement that had an increased elapsed time in our tests.
Figure 22. SQL statement history for selected statement
To observe the elapsed time for backup operations when you run them in isolation and with existing and new application workloads, use the Utilities dashboard, as shown in Figure 23.
Figure 23. Utilities dashboard showing start, end, and elapsed times for backup and runstats operations
Managing data warehouse performance with Optim Performance Manager Page 35 of 56

Monitoring an ETL application workload An ETL application can use a number of utilities and statements to ingest data into the data warehouse. Know the characteristics of the ETL application that you are introducing:
What staging, production, and MQT tables are used by the application?
What INSERT, UPDATE, or DELETE statements are used?
What user ID does the ETL application use?
What are the expected minimum, average, and maximum volumes of rows to ingest?
How long do you expect the ETL process to run?
What are the identifying workload and WLM configuration for the ETL application?
Create a WLM service superclass for ETL connections so that you can analyze, report, and compare ETL performance metrics.
Create a WLM service superclass for ETL connections so that you can filter and order data in OPM dashboards and reports to monitor ETL activity only. Figure 24 illustrates an ETL configuration that is used in our test environment, where LOAD, write, and read operations can be monitored within the ETL workload.
For the DDL statements that are used in creating these DB2 WLM database objects, refer to the scripts that accompany the “Implementing DB2 workload management in a data warehouse”.
Managing data warehouse performance with Optim Performance Manager Page 36 of 56
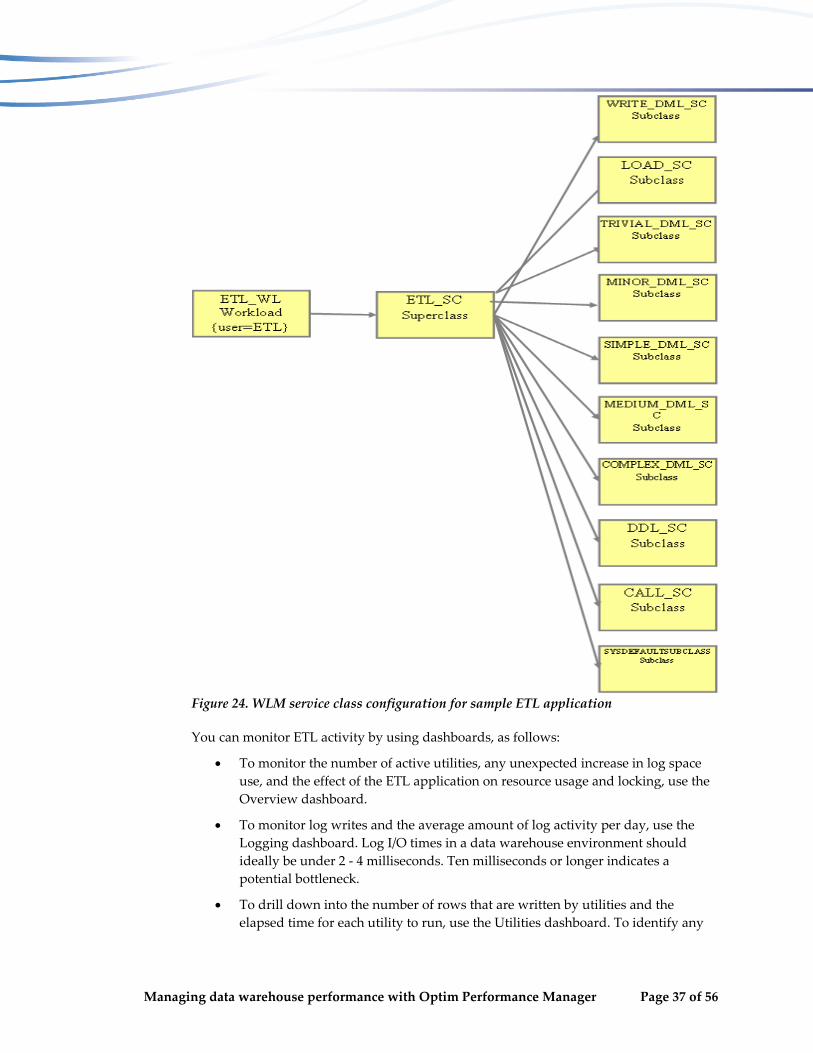
Figure 24. WLM service class configuration for sample ETL application
You can monitor ETL activity by using dashboards, as follows:
To monitor the number of active utilities, any unexpected increase in log space use, and the effect of the ETL application on resource usage and locking, use the Overview dashboard.
To monitor log writes and the average amount of log activity per day, use the Logging dashboard. Log I/O times in a data warehouse environment should ideally be under 2 ‐ 4 milliseconds. Ten milliseconds or longer indicates a potential bottleneck.
To drill down into the number of rows that are written by utilities and the elapsed time for each utility to run, use the Utilities dashboard. To identify any
Managing data warehouse performance with Optim Performance Manager Page 37 of 56

discrepancies that might indicate skew, filter by individual database partition (or member).
To monitor utility heap and buffer pool usage, use the Memory dashboard. Insufficient or inefficient use of the utility heap might affect the performance of utilities. If you run multiple utilities in parallel to increase performance, the Memory dashboard can help identify whether you ran them without specifying a DATA BUFFER parameter value; if you do not specify a value, a single utility can use a disproportionate amount of utility heap memory.
To monitor the number of connections that the ETL application acquires, the number of rows that are modified by INSERT, UPDATE, and DELETE statements that were issued during a connection, and the total CPU time that was used, use the Connection dashboard. To filter your results by user, application name, and current WLM workload so that you see only ETL activity, click Filter. To show the utilities that ran for a connection, use the Utilities tab on the Connection dashboard.
To see the breakdown of logical and physical reads and writes by buffer pool, table space, and table, use the Buffer Pool and I/O dashboard.
To see individual SQL statements that were issued by the ETL application, use the SQL Statements dashboard. To choose which entries you want to monitor, click Filter.
Managing data warehouse performance with Optim Performance Manager Page 38 of 56
Creating an alternative OPM web console user The user ID that you use to install the OPM product has full administrator access to the OPM binary files, the OPM repository server, and the OPM repository database. In IBM Smart Analytics System, the user ID is bcupe. If your security policy requires, you can create a separate user ID to connect to the OPM web console.
Use the following steps as a guideline to completing this task:
1. On the node where OPM is installed (the management node in IBM Smart Analytics System), create an operating system user ID and group. Assume that the user ID is called opmadmin and the group is called opmagrp.
2. As bcupe, grant database administrator authority to the opmadmin user ID:
GRANT DBADM ON DATABASE TO USER opmadmin
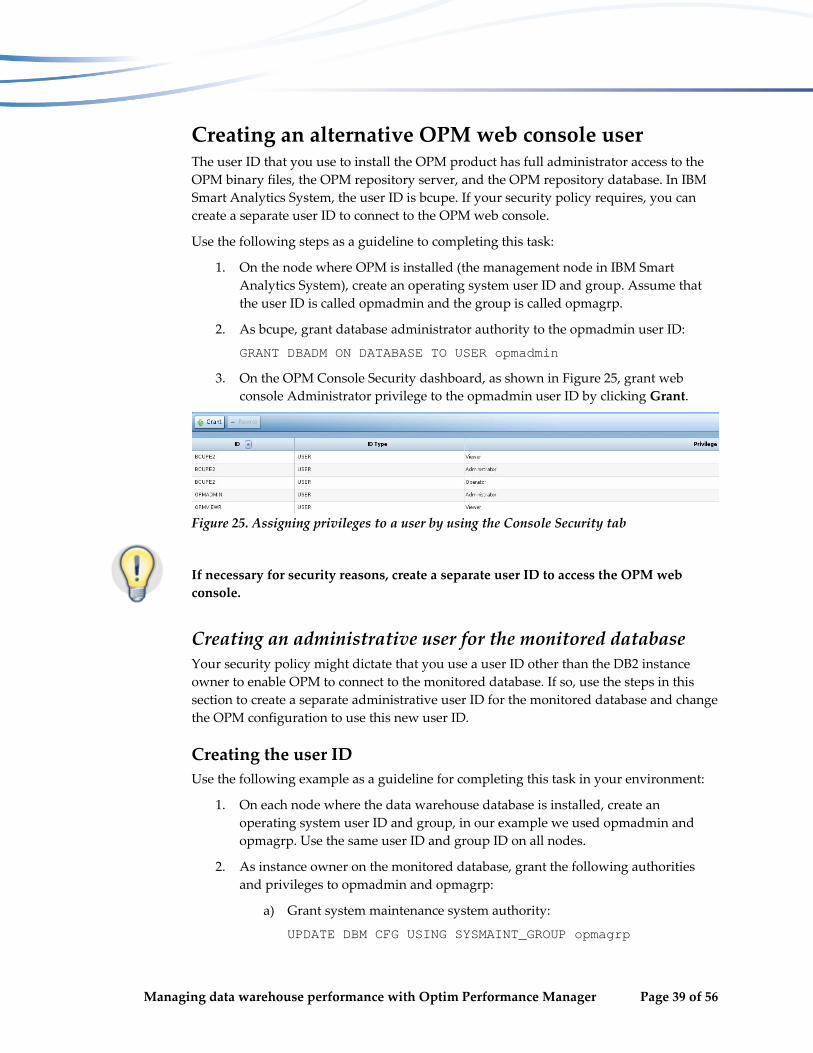
3. On the OPM Console Security dashboard, as shown in Figure 25, grant web console Administrator privilege to the opmadmin user ID by clicking Grant.
Figure 25. Assigning privileges to a user by using the Console Security tab
If necessary for security reasons, create a separate user ID to access the OPM web console.
Creating an administrative user for the monitored database Your security policy might dictate that you use a user ID other than the DB2 instance owner to enable OPM to connect to the monitored database. If so, use the steps in this section to create a separate administrative user ID for the monitored database and change the OPM configuration to use this new user ID.
Creating the user ID Use the following example as a guideline for completing this task in your environment:
1. On each node where the data warehouse database is installed, create an operating system user ID and group, in our example we used opmadmin and opmagrp. Use the same user ID and group ID on all nodes.
2. As instance owner on the monitored database, grant the following authorities and privileges to opmadmin and opmagrp:
a) Grant system maintenance system authority:
UPDATE DBM CFG USING SYSMAINT_GROUP opmagrp
Managing data warehouse performance with Optim Performance Manager Page 39 of 56
b) Grant connect database authority:
GRANT CONNECT ON DATABASE TO USER opmadmin
c) Grant Workload Manager database authority:
GRANT WLMADM ON DATABASE TO USER opmadmin
d) Grant SQL database authority:
GRANT SQLADM ON DATABASE TO USER opmadmin
e) Grant data access database authority:
GRANT DATAACCESS ON DATABASE TO USER opmadmin
f) Grant access control authority:
GRANT ACCESSCTRL ON DATABASE TO USER opmadmin
g) Grant execute privilege on procedures:
GRANT EXECUTE ON PROCEDURE SYSPROC.* TO USER opmadmin
Configuring OPM to use the new user ID Use the following example as a guideline to configure OPM to use the new user ID to connect to and collect data from the monitored data warehouse database:
1. On the Databases dashboard of the OPM web console, click Configure Monitoring to access step 1 of the Edit Monitoring Configuration wizard to disable monitoring for the duration of this process.
2. On the Databases dashboard of the OPM web console, open the current configuration for the data warehouse by clicking Edit.
3. Change the values of the User ID and Password fields to reflect the new opmadmin credentials.
4. To verify the credentials, click Test Connection, and then click OK
5. Stop OPM by using the OPMstop.sh script.
6. Start OPM by using the OPMstart.sh script.
7. Using the Databases dashboard of the OPM web console, change the connection settings for the monitored database by entering the new user ID credentials, disconnecting, and reconnecting using the new settings.
If necessary for security reasons, create an alternative user ID for the DB instance owner for the monitored database.
Managing data warehouse performance with Optim Performance Manager Page 40 of 56

Creating a new OPM web console user for non‐administrative users Your business users might want to understand how their query workload is performing and, more importantly, what might be stopping their query workload from performing as expected. In such circumstances, you might want to give representative users access to OPM to view performance statistics.
However, you will not want to give all non‐administrative users access to the OPM binary files and configuration dashboards and utilities. Instead, follow these steps to create a user ID that can be used to view statistics but provides minimal ability to change the configuration of OPM. Use the following steps as a guideline to completing this task:
1. On the node where OPM is installed (the management node in IBM Smart Analytics System), create an operating system user ID and group. Assume that the user ID is called opmviewr and the group is called opmvgrp.
2. Connect to the database. Assume that the database name is PERFDB.
CONNECT TO PERFDB
3. As bcupe, grant database connect authority to the new opmviewr user:
GRANT CONNECT ON DATABASE TO USER opmviewr
On the OPM Console Security dashboard, grant web console viewer privilege to the opmviewr user by clicking Grant. On the dialog box presented, enter the user ID opmviewr, select the Viewer radiobutton and click OK.
Create a non‐administrative user ID for access to the OPM web console and monitored database.
Creating a non‐administrative user for the monitored database Use the steps in this section to create a non‐administrative user ID for the monitored database and grant only monitoring privileges to the monitoring data that is collected on the data warehouse. Historical data cannot be viewed unless a connection can be established with the monitored database to establish credentials.
Creating the user ID for the monitored database Use the following example as a guideline for completing this task in your environment:
1. On each node where the data warehouse is installed, create an operating system user ID called opmviewr and a group called opmvgrp. Use the same user ID and group ID on all nodes.
2. Connect to the database. Assume that the database name is BCUDB.
CONNECT TO BCUDB
3. As instance owner on the monitored database, grant connect authority on the
Managing data warehouse performance with Optim Performance Manager Page 41 of 56
database to opmviewr:
GRANT CONNECT ON DATABASE TO USER opmviewr
4. If you want this user to access the Workload Manager Configuration dashboard, in addition to all other dashboards, grant authorizations to opmviewr as follows:
Grant workload management database authority:
GRANT WLMADM ON DATABASE TO USER opmviewr
Grant execute privilege on procedures with the SYPROC schema:
GRANT EXECUTE ON PROCEDURE SYSPROC.* TO USER opmviewr
Configuring OPM to use the new user ID Use the following example as a guideline to configure OPM to use the new user ID to connect to and monitor data from the monitored data warehouse database:
1. As administrative user on the OPM web console, on the Databases dashboard, click Configure Monitoring.
2. On Step 4 of the Configure Monitoring wizard, configure one or more of the following monitoring privileges for the new opmviewr user: Can Monitor, Can Monitor in Real‐Time, and Can Manage Alerts. For details on each privilege, see the Information Center which is referenced in the “Further reading” section.
3. Reconnect to the OPM web console as opmviewr.
4. From the Select a Database list, when prompted, select a database and enter the opmviewr user credentials.
Managing data warehouse performance with Optim Performance Manager Page 42 of 56
Maintenance and troubleshooting The maintenance of an OPM environment centers on the OPM repository database and OPM configuration files. The retention settings configured in OPM are used to roll‐up metrics on an ongoing basis and to remove metrics that have aged beyond the retention period. This helps minimize the database administration tasks involved.
Troubleshooting OPM issues can be determined from the web console in general with more details trace and log files available at operating system level.
Maintaining the OPM repository database The OPM repository database is created during installation. On IBM Smart Analytics Systems, if you upgrade Performance Expert to OPM, the database is named BCUPE; otherwise, the database is named PERFDB. DB2 automatic maintenance is enabled on the OPM repository database. This is the recommended mode.
If you must stop the OPM repository database, first stop all OPM processes by using the OPMstop.sh script.
Backing up the OPM repository database The OPM repository database is configured for offline backups by default. You should incorporate your backup and recovery strategy for OPM into your overall backup and recovery strategy for the server on which OPM is installed. In addition, you might want to perform more frequent backups of the OPM repository database and associated configuration files. Include the following files in your backup schedule:
Back up the db2pesrv.prop OPM configuration file, which by default is in the /home/bcupe/opm/v5/bcupe2 directory.
Back up the db2pesrv.cfg file, which by default is in the /var/db2pedirectory.
Back up the OPM repository database regularly and after making configuration changes.
Troubleshooting To help troubleshoot issues with the OPM repository server or database or gather information about them for IBM Support, you can use the system‐level logs in this section.
Also, you can review operational alerts through the Alerts dashboard and configure them for email notification where required.
Before you perform any analysis or remedial action, determine the status of the OPM repository server on the management node by using the OPMstatus.sh script,
OPM repository server
Managing data warehouse performance with Optim Performance Manager Page 43 of 56
From the management node, use the following resources to troubleshoot issues:
To determine the cause of problems for the OPM repository server, use the db2pesrv.log file, located in the /home/bcupe/opm/v5/bcupe directory.
For a more detailed analysis of the causes of repository server issues, use the db2pesrv.trc file, located in the /home/bcupe/opm/v5/bcupe directory. Trace details are written to the db2pesrv.trc file.
To see details specific to the repository server API and web UI log, use the datatools.log file, located in the OPM installation directory in the /logsdirectory
To monitor database health through the operating system, use the dsserver.log file, located in the OPM installation directory in the /logsdirectory. The contents of this log file are displayed in the Logs page of the Product setup menu in OPM.
If the issue is database‐related, use the standard DB2 diagnostics in the db2diag.log file.
You can modify the volume and type of trace information to gather by using configuration files, as follows:
You can modify the trace‐level configuration and volume of trace data for the OPM repository server log through the db2pesrv.prop file. A server restart is required to effect changes. Reverse any changes that you made after you have completed troubleshooting.
You can modify repository server API and web UI log trace‐level settings in the log4j.properties file. An OPM server restart is required to effect changes. Reproduce the problem, and view the output in the datatools.log file.
Use the petrace tool to collect all the previously mentioned output files into a single compressed file. You can then easily send this file to IBM Support for further analysis.
OPM repository database In IBM Smart Analytics System, the database is on the /db2pe file system. To avoid filling up this file system, use the Edit Monitoring Configuration wizard to perform the following tasks:
Increase the sampling interval rate from the default value of 1 minute
Decrease the performance data retention period, particularly for level 1
Disable unwanted monitoring profiles
Every 30 minutes, an OPM repository server process checks for and deletes data that is outside the retention period. To reclaim the space at the file system level, use the ALTER TABLESPACE REDUCE statement.
Managing data warehouse performance with Optim Performance Manager Page 44 of 56
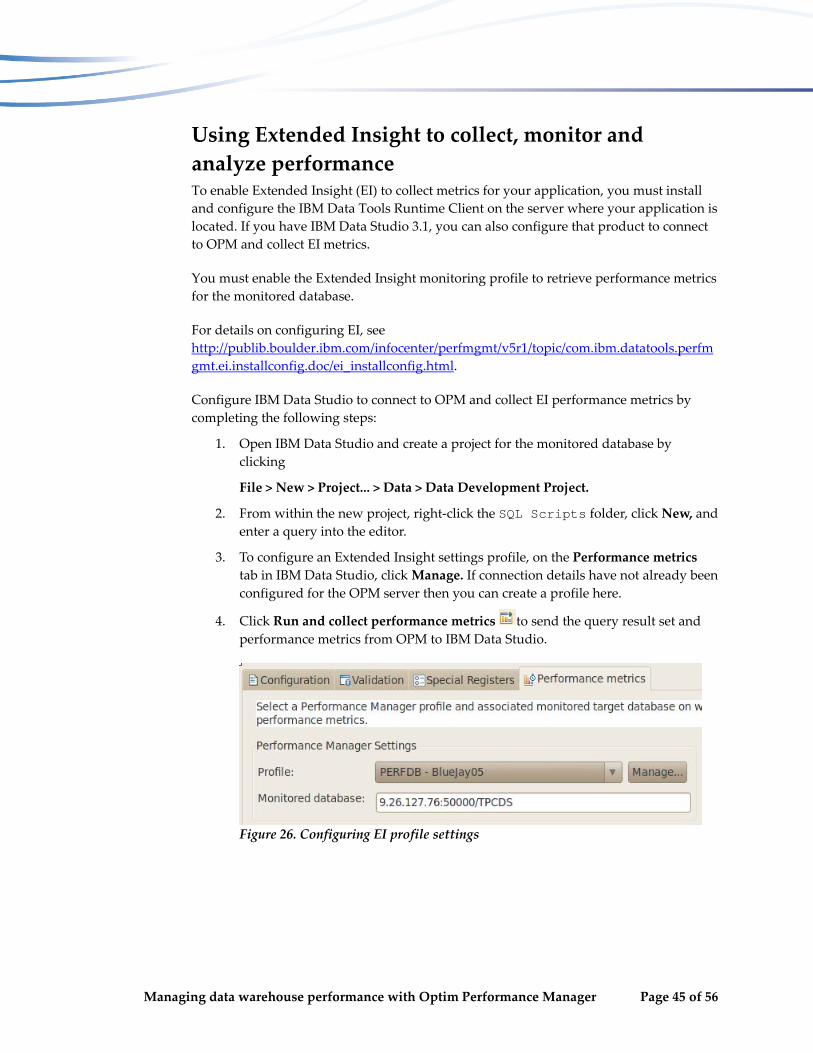
Using Extended Insight to collect, monitor and analyze performance To enable Extended Insight (EI) to collect metrics for your application, you must install and configure the IBM Data Tools Runtime Client on the server where your application is located. If you have IBM Data Studio 3.1, you can also configure that product to connect to OPM and collect EI metrics.
You must enable the Extended Insight monitoring profile to retrieve performance metrics for the monitored database.
For details on configuring EI, see http://publib.boulder.ibm.com/infocenter/perfmgmt/v5r1/topic/com.ibm.datatools.perfm gmt.ei.installconfig.doc/ei_installconfig.html.
Configure IBM Data Studio to connect to OPM and collect EI performance metrics by completing the following steps:
1. Open IBM Data Studio and create a project for the monitored database by clicking
File > New > Project... > Data > Data Development Project.
2. From within the new project, right‐click the SQL Scripts folder, click New, and enter a query into the editor.
3. To configure an Extended Insight settings profile, on the Performance metrics tab in IBM Data Studio, click Manage. If connection details have not already been configured for the OPM server then you can create a profile here.
4. Click Run and collect performance metrics to send the query result set and performance metrics from OPM to IBM Data Studio.
Figure 26. Configuring EI profile settings
Managing data warehouse performance with Optim Performance Manager Page 45 of 56
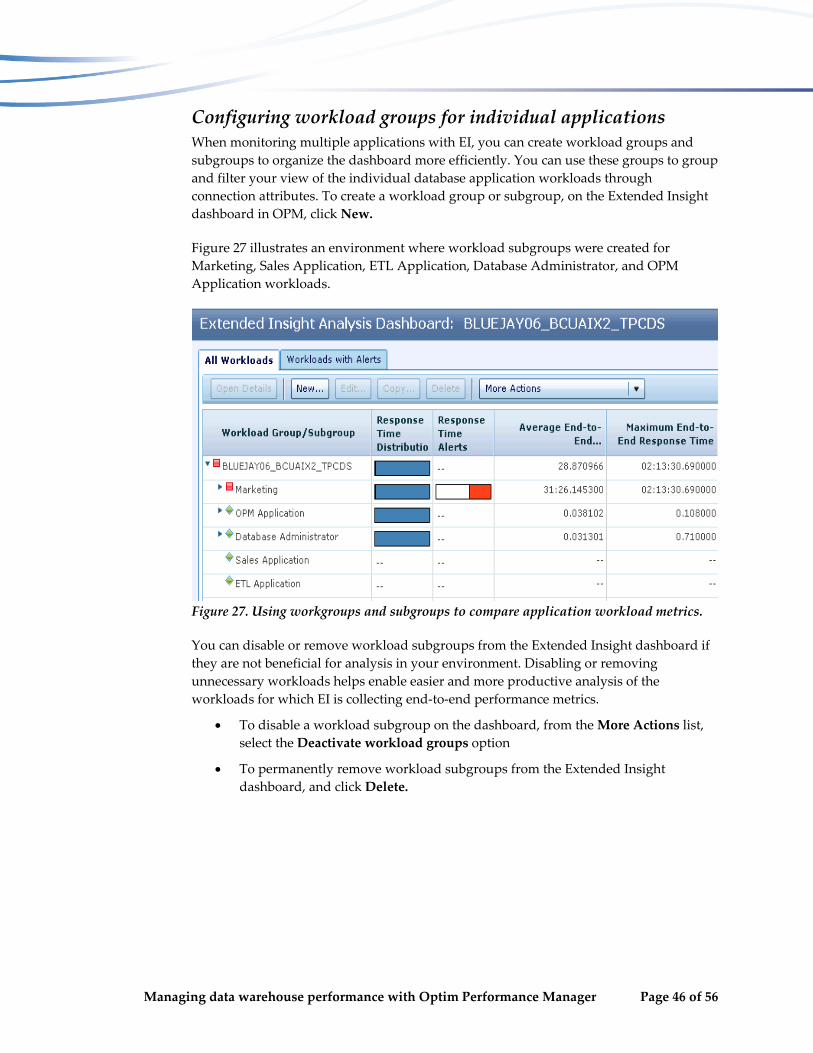
Configuring workload groups for individual applications When monitoring multiple applications with EI, you can create workload groups and subgroups to organize the dashboard more efficiently. You can use these groups to group and filter your view of the individual database application workloads through connection attributes. To create a workload group or subgroup, on the Extended Insight dashboard in OPM, click New.
Figure 27 illustrates an environment where workload subgroups were created for Marketing, Sales Application, ETL Application, Database Administrator, and OPM Application workloads.
Figure 27. Using workgroups and subgroups to compare application workload metrics.
You can disable or remove workload subgroups from the Extended Insight dashboard if they are not beneficial for analysis in your environment. Disabling or removing unnecessary workloads helps enable easier and more productive analysis of the workloads for which EI is collecting end‐to‐end performance metrics.
To disable a workload subgroup on the dashboard, from the More Actions list, select the Deactivate workload groups option
To permanently remove workload subgroups from the Extended Insight dashboard, and click Delete.
Managing data warehouse performance with Optim Performance Manager Page 46 of 56

Setting response time alerts Setting warning and critical response time alerts for transactions can help identify when transaction response times are higher than expected. To create an alert, on the Workload with Alerts tab on the Extended Insight dashboard, click Edit.
Figure 28 shows a configuration for the marketing application where a warning threshold is set for 5 minutes and a critical threshold is set for 15 minutes. For the sampling period chosen, figure 28 shows an average response time of under 4 minutes and a maximum response time of 13 minutes.
Figure 28. Configuring EI response time threshold alerts
Align critical and warning threshold values with service level objectives for an application. Use values that are greater than the average response time value over a period of time that includes low, normal, and peak usage periods.
To view only workloads with defined response alerts for the selected time period, use the Workloads with Alerts tab. The Response Time Alerts column is color coded, as illustrated in Figure 29:
White indicates time where no threshold was breached.
Yellow indicates that at least one transaction in the workload subgroup during the selected time period breached the warning threshold value that you set.
Red indicates that at least one transaction in the workload subgroup during the selected time period breached the critical threshold value that you set.
Managing data warehouse performance with Optim Performance Manager Page 47 of 56

Figure 29. Workload application response times in EI
To view high‐level alerts per workload subgroup, use the main Extended Insight dashboard. To see the proportionate amount of time that was spent in each alert state, hold the mouse over the KPI column label.
Analyzing response time metrics To view detailed alert metrics and statistics for individual workloads, use the charts and grids for the related workload subgroup. If anomalies exist, note the time, and investigate whether there were other workloads or utilities in operation that might explain the difference between average and maximum response times. For example, Figure 30 illustrates a situation in a test environment where one transaction breached the warning threshold and two transactions breached the critical threshold during the selected time period.
Figure 30. Analyzing Marketing response time metrics over a defined time period
Analyzing distribution of total response time in detail To view detailed response time performance metrics and charts for a selected workload, filtered by Data Server Time, Client Time, and Network Time, select a workload subgroup from the data grid on the EI dashboard, and click Open Details.
Use the SQL Statements, Clients, and Partition/Members tabs to get a breakdown at those specific levels as shown in figure 31:
Managing data warehouse performance with Optim Performance Manager Page 48 of 56
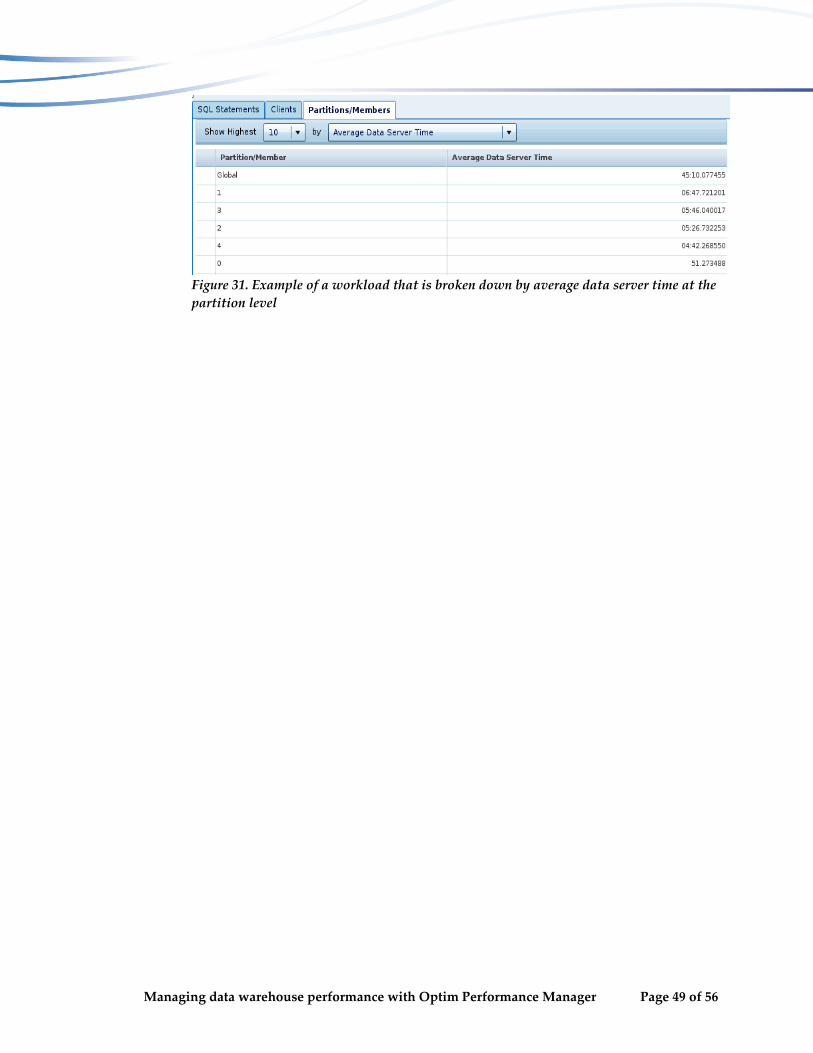
Figure 31. Example of a workload that is broken down by average data server time at the partition level
Managing data warehouse performance with Optim Performance Manager Page 49 of 56
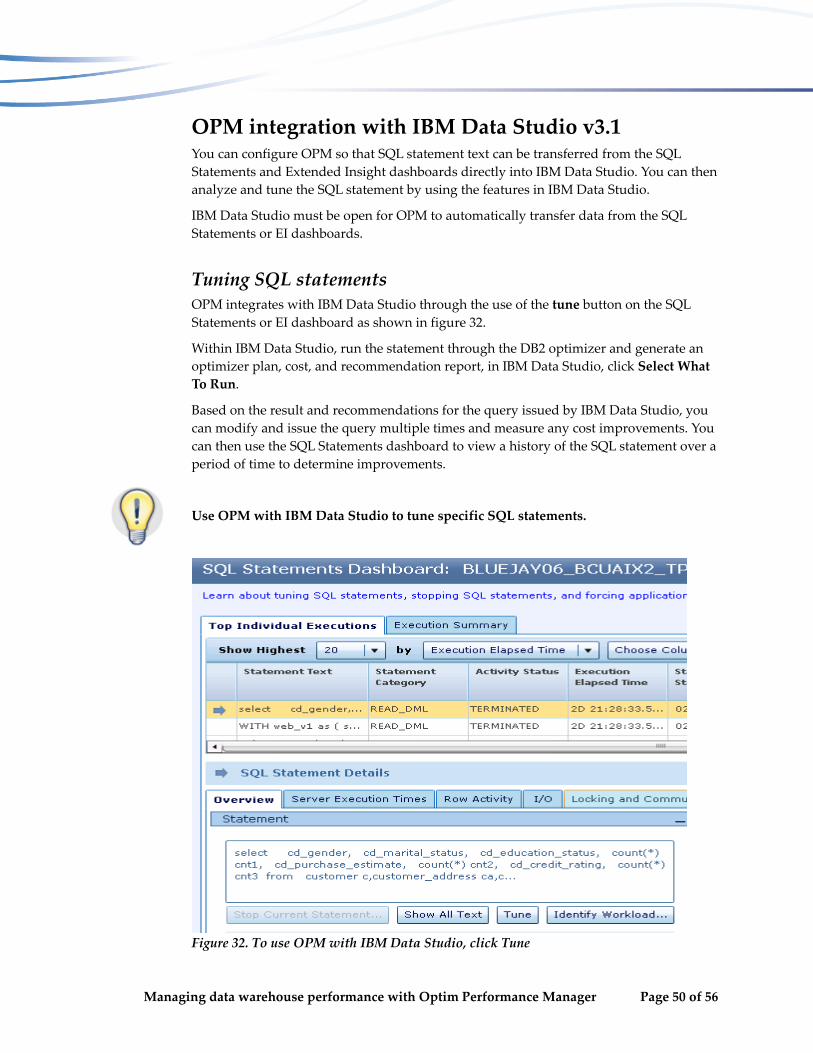
OPM integration with IBM Data Studio v3.1 You can configure OPM so that SQL statement text can be transferred from the SQL Statements and Extended Insight dashboards directly into IBM Data Studio. You can then analyze and tune the SQL statement by using the features in IBM Data Studio.
IBM Data Studio must be open for OPM to automatically transfer data from the SQL Statements or EI dashboards.
Tuning SQL statements OPM integrates with IBM Data Studio through the use of the tune button on the SQL Statements or EI dashboard as shown in figure 32.
Within IBM Data Studio, run the statement through the DB2 optimizer and generate an optimizer plan, cost, and recommendation report, in IBM Data Studio, click Select What To Run.
Based on the result and recommendations for the query issued by IBM Data Studio, you can modify and issue the query multiple times and measure any cost improvements. You can then use the SQL Statements dashboard to view a history of the SQL statement over a period of time to determine improvements.
Use OPM with IBM Data Studio to tune specific SQL statements.
Figure 32. To use OPM with IBM Data Studio, click Tune
Managing data warehouse performance with Optim Performance Manager Page 50 of 56

Conclusion Use the guidelines in this paper to configure and use OPM to manage and monitor database performance in your data warehouse database environment.
In a production environment it is important that you configure OPM to collect only the data that you need to monitor the service level objectives set. Detailed metrics can be collected for defined periods where troubleshooting is needed or a new application is to be introduced to the system.
In particular, use the following recommendations:
Best practices
Use the dynamic service IP address for the administration node when configuring a connection for the monitored database in a High Availability environment.
Use the OPMstart.sh and OPMstop.sh scripts supplied in the /opt/IBM/OPM directory to start and stop OPM repository server services.
Use the BI system templates that are provided. Use the “BI Production system with low overhead” template under normal operating conditions. Use the “BI Production system with all details” template when you are introducing a change such as a new application.
Change the default configuration only for specific performance monitoring needs. Revert to the recommended system template configuration after monitoring is completed.
In large database environments, create a custom partition set that collects data for one database partition per data node and for all database partitions that are associated with each unique generation of IBM Smart Analytics System module.
To compare and analyze metrics for a specific member or partition role, use the Members list, where available on a dashboard.
To identify skew, compare metrics across all database partitions, and use the dashboards to identify the causes.
Use WLM with OPM to separate application workloads for easier reporting, analysis, and performance management.
Use the petrace tool to collect all the previously mentioned output files into a single compressed file. You can then easily send this file to IBM Support for further analysis.
Managing data warehouse performance with Optim Performance Manager Page 51 of 56
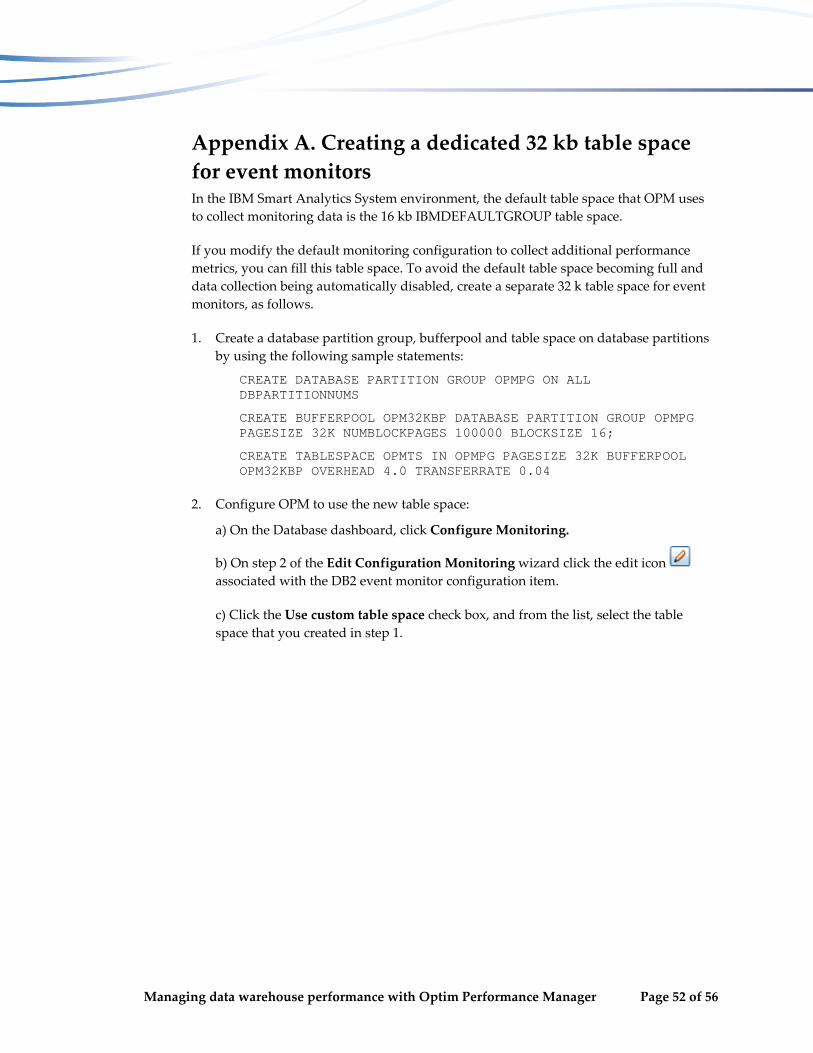
Appendix A. Creating a dedicated 32 kb table space for event monitors In the IBM Smart Analytics System environment, the default table space that OPM uses to collect monitoring data is the 16 kb IBMDEFAULTGROUP table space.
If you modify the default monitoring configuration to collect additional performance metrics, you can fill this table space. To avoid the default table space becoming full and data collection being automatically disabled, create a separate 32 k table space for event monitors, as follows.
1. Create a database partition group, bufferpool and table space on database partitions by using the following sample statements:
CREATE DATABASE PARTITION GROUP OPMPG ON ALL DBPARTITIONNUMS
CREATE BUFFERPOOL OPM32KBP DATABASE PARTITION GROUP OPMPG PAGESIZE 32K NUMBLOCKPAGES 100000 BLOCKSIZE 16;
CREATE TABLESPACE OPMTS IN OPMPG PAGESIZE 32K BUFFERPOOL OPM32KBP OVERHEAD 4.0 TRANSFERRATE 0.04
2. Configure OPM to use the new table space:
a) On the Database dashboard, click Configure Monitoring.
b) On step 2 of the Edit Configuration Monitoring wizard click the edit icon associated with the DB2 event monitor configuration item.
c) Click the Use custom table space check box, and from the list, select the table space that you created in step 1.
Managing data warehouse performance with Optim Performance Manager Page 52 of 56

Further reading OPM Information Center:
http://publib.boulder.ibm.com/infocenter/perfmgmt/v5r1/index.jsp
“Profiles and system templates for monitoring” topic:
http://publib.boulder.ibm.com/infocenter/perfmgmt/v5r1/index.jsp?topic=%2Fco m.ibm.datatools.perfmgmt.monitor.doc%2Fsys_templates_monitor_profiles.html &resultof=%22profile%22%20%22profil%22
“Collecting performance data within the workbench” topic:
http://publib.boulder.ibm.com/infocenter/dstudio/v3r1/topic/com.ibm.datatools. opmintg.ui.doc/topics/c_perf_metrics_head.html
InfoSphere Warehouse and IBM Smart Analytics System best practices:
http://www.ibm.com/developerworks/data/bestpractices/db2luw/#analytics
DB2 for Linux, UNIX, and Windows best practices:
http://www.ibm.com/developerworks/data/bestpractices/db2luw/
DB2 Best practices: Implementing DB2 workload management in a data warehouse paper:
http://www.ibm.com/developerworks/data/bestpractices/workloadmanagement/
Best practices: Query optimization in a data warehouse paper:
http://www.ibm.com/developerworks/data/bestpractices/smartanalytics/queryop timization/index.html
Configure and monitor InfoSphere Warehouse with Optim Performance Manager Extended Insight:
http://www.ibm.com/developerworks/data/library/techarticle/dm‐
1108opmextendedinsight/index.html
Configure and monitor WebSphere Application Server applications with Optim Performance Manager Extended Insight:
http://www.ibm.com/developerworks/data/library/techarticle/dm‐
1107extendedinsight/index.html
Configure and monitor CLI applications with Optim Performance Manager Extended Insight:
http://www.ibm.com/developerworks/data/tutorials/dm‐
1010optimextendedinsight/
“Installing IBM InfoSphere Optim Data Tools Runtime Client” topic:
http://publib.boulder.ibm.com/infocenter/cfgmgr/v2r1/index.jsp?topic=%2Fcom.i bm.datatools.configmgr.install.doc%2Ftclient.html
Managing data warehouse performance with Optim Performance Manager Page 53 of 56

Contributors
Ellen Livengood Information Development Lead for Optim Performance Manager, IBM
Holly Hayes Optim Solutions Architect, IBM
Paul Bird Senior Technical Staff Member, IBM
Ute Baumbach Optim Performance Manager Developer, IBM
Managing data warehouse performance with Optim Performance Manager Page 54 of 56

Notices This information was developed for products and services offered in the U.S.A.
IBM may not offer the products, services, or features discussed in this document in other countries. Consult your local IBM representative for information on the products and services currently available in your area. Any reference to an IBM product, program, or service is not intended to state or imply that only that IBM product, program, or service may be used. Any functionally equivalent product, program, or service that does not infringe any IBM intellectual property right may be used instead. However, it is the user's responsibility to evaluate and verify the operation of any non-IBM product, program, or service.
IBM may have patents or pending patent applications covering subject matter described in this document. The furnishing of this document does not grant you any license to these patents. You can send license inquiries, in writing, to:
IBM Director of Licensing IBM Corporation North Castle Drive Armonk, NY 10504-1785 U.S.A.
The following paragraph does not apply to the United Kingdom or any other country where such provisions are inconsistent with local law: INTERNATIONAL BUSINESS MACHINES CORPORATION PROVIDES THIS PUBLICATION "AS IS" WITHOUT WARRANTY OF ANY KIND, EITHER EXPRESS OR IMPLIED, INCLUDING, BUT NOT LIMITED TO, THE IMPLIED WARRANTIES OF NONINFRINGEMENT, MERCHANTABILITY OR FITNESS FOR A PARTICULAR PURPOSE. Some states do not allow disclaimer of express or implied warranties in certain transactions, therefore, this statement may not apply to you.
Without limiting the above disclaimers, IBM provides no representations or warranties regarding the accuracy, reliability or serviceability of any information or recommendations provided in this publication, or with respect to any results that may be obtained by the use of the information or observance of any recommendations provided herein. The information contained in this document has not been submitted to any formal IBM test and is distributed AS IS. The use of this information or the implementation of any recommendations or techniques herein is a customer responsibility and depends on the customer’s ability to evaluate and integrate them into the customer’s operational environment. While each item may have been reviewed by IBM for accuracy in a specific situation, there is no guarantee that the same or similar results will be obtained elsewhere. People attempting to adapt these techniques to their own environments do so at their own risk.
This document and the information contained herein may be used solely in connection with the IBM products discussed in this document.
This information could include technical inaccuracies or typographical errors. Changes are periodically made to the information herein; these changes will be incorporated in new editions of the publication. IBM may make improvements and/or changes in the product(s) and/or the program(s) described in this publication at any time without notice.
Any references in this information to non-IBM websites are provided for convenience only and do not in any manner serve as an endorsement of those websites. The materials at those websites are not part of the materials for this IBM product and use of those websites is at your own risk.
IBM may use or distribute any of the information you supply in any way it believes appropriate without incurring any obligation to you.
Any performance data contained herein was determined in a controlled environment. Therefore, the results obtained in other operating environments may vary significantly. Some measurements may have been made on development-level systems and there is no guarantee that these measurements will be the same on generally available systems. Furthermore, some measurements may have been estimated through extrapolation. Actual results may vary. Users of this document should verify the applicable data for their specific environment.
Managing data warehouse performance with Optim Performance Manager Page 55 of 56

Information concerning non-IBM products was obtained from the suppliers of those products, their published announcements or other publicly available sources. IBM has not tested those products and cannot confirm the accuracy of performance, compatibility or any other claims related to non-IBM products. Questions on the capabilities of non-IBM products should be addressed to the suppliers of those products.
All statements regarding IBM's future direction or intent are subject to change or withdrawal without notice, and represent goals and objectives only.
This information contains examples of data and reports used in daily business operations. To illustrate them as completely as possible, the examples include the names of individuals, companies, brands, and products. All of these names are fictitious and any similarity to the names and addresses used by an actual business enterprise is entirely coincidental.
COPYRIGHT LICENSE: © Copyright IBM Corporation 2012. All Rights Reserved.
This information contains sample application programs in source language, which illustrate programming techniques on various operating platforms. You may copy, modify, and distribute these sample programs in any form without payment to IBM, for the purposes of developing, using, marketing or distributing application programs conforming to the application programming interface for the operating platform for which the sample programs are written. These examples have not been thoroughly tested under all conditions. IBM, therefore, cannot guarantee or imply reliability, serviceability, or function of these programs.
Trademarks IBM, the IBM logo, and ibm.com are trademarks or registered trademarks of International Business Machines Corporation in the United States, other countries, or both. If these and other IBM trademarked terms are marked on their first occurrence in this information with a trademark symbol (® or ™), these symbols indicate U.S. registered or common law trademarks owned by IBM at the time this information was published. Such trademarks may also be registered or common law trademarks in other countries. A current list of IBM trademarks is available on the Web at “Copyright and trademark information” at www.ibm.com/legal/copytrade.shtml
Windows is a trademark of Microsoft Corporation in the United States, other countries, or both.
UNIX is a registered trademark of The Open Group in the United States and other countries.
Linux is a registered trademark of Linus Torvalds in the United States, other countries, or both.
Other company, product, or service names may be trademarks or service marks of others.
Managing data warehouse performance with Optim Performance Manager Page 56 of 56