Nir Menachemi, Ph.D. - Richard M. Fairbanks School of Public ...
AnalyticalMethods
PAPER
Using iSPA-PLS a
aUniversidade Estadual da Paraıba, Centro dQuımica, Zip Code 58429-500, Campina Gr
[email protected]; [email protected]
+55 833153300 ext. 3516bUniversidad Nacional del Sur, INQUISUR, D
Bahıa Blanca, Buenos Aires, ArgentinacUniversidade Federal da Paraıba, Centr
Departamento de Quımica, Zip Code 58051
Cite this: Anal. Methods, 2015, 7, 3379
Received 30th December 2014Accepted 8th March 2015
DOI: 10.1039/c4ay03099k
www.rsc.org/methods
This journal is © The Royal Society of C
nd NIR spectroscopy for thedetermination of total polyphenols and moisture incommercial tea samples
P. H. G. D. Diniz,*a M. F. Pistonesib and M. C. U. Araujoc
In this work, a methodology is proposed for determining the content of total polyphenols and moisture in
commercial tea samples by using near-infrared spectroscopy (NIRS) and Partial Least Squares (PLS)
regression coupled with the Successive Projections Algorithm for interval selection (iSPA-PLS). For
comparison, full-spectrum PLS and the Interval PLS (iPLS) were also used. Since the spectra are scattered
and exhibit systematic variations on the baseline, standard normal variate transformation (SNV) and
multiplicative scatter correction (MSC) were applied as data preprocessing methods. The number of PLS
latent variables and the number of region intervals were optimized according to the root mean square
error of cross-validation (RMSECV) and coefficient of determination (RCV2) in the calibration set. The
predictive ability of the final model was evaluated in terms of the root mean square error of prediction
(RMSEP), coefficient of determination (RPred2) and ratio performance deviation (RPDPred) in the external
prediction set, which were not employed in the model-building process. For the determination of the
total polyphenol content, 10-iSPA-PLS with MSC preprocessing presented the best results with the
smallest RMSEP (0.599 mg kg�1), and the highest RPred2 (0.933) and RPDPred (3.863) values. For the
determination of moisture content, 20-iSPA-PLS with MSC preprocessing achieved the best results with
the smallest RMSEP (0.32 mg kg�1), and the highest RPred2 (0.94) and RPDPred (4.08) values. Thus, it can
be concluded that the NIRS coupled with iSPA-PLS is a promising analytical tool for monitoring tea quality.
Introduction
Tea is an infusion prepared from the processed leaves and budsof plant Camellia sinensis (L.) Kuntze. The production processincludes xation, withering, rolling, fermentation, polling,drying, etc. The different types of tea (white, yellow, green,oolong, black and Pu-ehr) differ based on the extent of thefermentation process. Green (unfermented) and black (fullyfermented) teas are the two most popular categories, whichtogether account for around 98% of both worldwide teaproduction and consumption.1,2 In 2012, the IntergovernmentalGroup for Teas (created by the Food and Agricultural Organi-zation (FAO) of the United Nations) overviewed the currentmarket situation and medium term outlook for teas (until2021). In the last few years, the tea trade achieved its recordprices, which led to a signicant increase in the worldwide tea
e Ciencias e Tecnologia, Departamento de
ande, Paraıba, Brazil. E-mail: paulodiniz.
.br; Fax: +55 833153300 ext. 3516; Tel:
epartamento de Quımica, Zip Code 8000,
o de Ciencias Exatas e da Natureza,
-970, Joao Pessoa, PB, Brazil
hemistry 2015
production in 2010 by 4.2% to 4.1 million tonnes.3 Tea quality isimportant for its market value and is traditionally assessed byskilful tasters. Many factors contribute to the overall quality oftea, such as colour, appearance, avour and other attributes,which are closely related to the content of some chemicalconstituents obtained during the production process. The drymatter of tea is composed of polyphenols, alkaloids (e.g.caffeine), proteins, carbohydrates, lipids, amino acids, aroma-forming substances, pigments, vitamins, minerals, etc.4–7
Among this complex composition, polyphenols have beenrecognized currently as the most important constituents of teadue to their benecial effects on human health, nutrition, andphysiological function.8,9 Total polyphenols account generallyfor 25–35%, on a dry weight basis of tea leaves. The compo-sition of tea polyphenols in commercial teas varies withspecies, season, agricultural conditions, and mainly with thedegree of fermentation. Polyphenols (especially catechin) areresponsible for the bitterness and astringency of tea bever-ages, and are bioactive compounds recognized as importantquality factors in tea leaves.4,10,11
Tea quality also depends upon its moisture content. Thecontrol of the moisture content avoids inevitable deterioration oftea due to alterations in its physicochemical aspects and therebymaintaining the freshness and stability of the tea in terms of itsorganoleptic properties during a long period of storage. Moisture
Anal. Methods, 2015, 7, 3379–3384 | 3379
Analytical Methods Paper
has a large effect on the reaction rate of fermentation and allowsthe growth of mold and other micro-organisms.12–14
To develop high quality tea products, it is important to estab-lish rapid and reliable analytical methods for the determination ofthese compounds and/or parameters in tea samples. In thiscontext, near infrared spectroscopy (NIRS) has been applied topredict the content of moisture12 and total polyphenols.15–18
NIRS presents intrinsic advantages, since it is a fast, accurateand non-destructive technique that can be employed as areplacement for time-consuming chemical methods. On theother hand, a large number of wavelengths in the NIR spectrumfor each sample can sometimes lead to redundancy in theacquired data. This occurs due to the strong correlation overdifferent analytical channels, which can affect the precision andthe accuracy of the results. In this sense, spectral region selec-tion can signicantly improve the performance of Partial LeastSquares (PLS) regression. The selection of most informativeregions generates more stable models with superior interpret-ability, leading to the lowest prediction error.19,20
This paper proposes a methodology for determining thecontent of total polyphenols and moisture in commercial teasamples usingNIR spectroscopy and PLS regression coupled withthe Successive Projections Algorithm for interval selection (iSPA-PLS).19 The iSPA-PLS algorithm is an extension of SPA to selectintervals of variables for use in PLS modeling, which combinesthe noise-reduction properties of PLS with discarding non-informative variables in SPA. For comparison, we also used twodifferent PLS algorithms: (a) the rst approach using the entirespectral information (full-spectrum), and (b) the Interval PLS(iPLS).20 The number of PLS factors and the number of regionintervals were optimized according to the root mean square errorof cross-validation (RMSECV) and coefficient of determination(RCV
2) in the calibration set. The predictive ability of the nalmodel was evaluated in terms of the root mean square error ofprediction (RMSEP), coefficient of determination (RPred
2) andratio performance deviation (RPDPred) in the external predictionset, which were not employed in the model-building process.
Materials and methodsSamples
Sixty commercial tea samples were purchased from localsupermarkets in Bahıa Blanca city, Buenos Aires Province,Argentina. A quartering step of the samples was performed asdescribed by Diniz et al.21 The content of 100 tea bags of eachbatch was quartered and then reduced until the nal samplecontained 25 g. The nal tea samples were efficiently ground inamill in order to homogenize the particle size and subsequentlystored in sealed plastic bags to prevent contamination and/oradulteration. Finally, tea samples were stored in a vacuumdesiccator at room temperature.
Chemical analysis
Quantitative analysis of total polyphenols and moisture wascarried out as described by Diniz et al.22 by following the spec-ications of the Argentinean Food Codex.23
3380 | Anal. Methods, 2015, 7, 3379–3384
Total polyphenols. Tea infusions were prepared using 2 g ofeach tea sample in 100 mL of double-distilled water at 90 �C,and allowed to stand for 5 minutes. The infusions were lteredwith medium speed and retention (8 mm) lter paper, andstored in Nalgene plastic bottles in a refrigerator at 4 �C. Thetotal polyphenol content was determined by the Folin–Ciocalteumethod, expressed as gallic acid equivalent that was used as thecalibration standard. The measurements were performed in aUV-Vis spectrophotometer GBC Cintra 20 at 760 nm.
Moisture. The determination of moisture content wascarried out by weighing 5 g of each tea sample and placing it inan oven at 103 � 2 �C until it achieved a constant weight. Thepercent loss in weight is reported as the moisture content.
NIR spectra measurements
Diffuse reectance measurements of the tea samples in the NIRrange (3800–9000 cm�1) were performed in duplicate by using aFTLA2000-160 FTIR spectrophotometer (Bomem), at 23 � 1 �Croom temperature. Each spectrum was obtained with anaverage of 32 scans at a resolution of 8 cm�1. The spectrum of apolytetrauoroethylene (PTFE) tablet was used as the blank.
Chemometric procedure
Since the spectra are scattered and exhibit systematic variationson the baseline, two different preprocessing methods wereapplied to the spectral data: standard normal variate trans-formation (SNV) and multiplicative scatter correction (MSC).Then, the sixty tea samples were divided into calibration (40)and prediction (20) sets by applying the Kennard–Stone (KS)uniform sampling algorithm to the data, taking into accountthe x and y distances simultaneously, in order that the sampleswith the smallest and largest values of y are guaranteed to beincluded in the calibration set, thus avoiding extrapolationproblems.24 The validation step used the leave-one-out cross-validation technique. The number of PLS factors (latent vari-ables, LV) and the number of region intervals were optimizedaccording to the RMSECV and RCV
2 in the calibration set. Theprediction was then only used for the nal data evaluation andcomparison of the multivariate calibration models. Thepredictive ability of the nal model was evaluated in terms ofRMSEP, RPred
2 and RPDPred values in the external prediction set,which were not employed in the model-building process. Threedifferent PLS algorithms were used: (a) full-spectrum PLS, (b)the Interval PLS (iPLS), and (c) PLS coupled with the SuccessiveProjections Algorithm for interval selection (iSPA-PLS). Allalgorithms were implemented in Matlab® 6.5 (Mathworks,USA).
Results and discussionNIR spectra and pre-processing procedures
NIR spectra of the 60 studied tea samples were obtained in therange of 3800 to 9000 cm�1. In order to remove the spectralnoise and the systematic variations on the baseline, SNV andMSC were applied as pre-processing methods.
This journal is © The Royal Society of Chemistry 2015
Paper Analytical Methods
PLS algorithms
The reference values for the determination of total polyphenolsand moisture contents were in the range of 6.56–15.11 mg kg�1
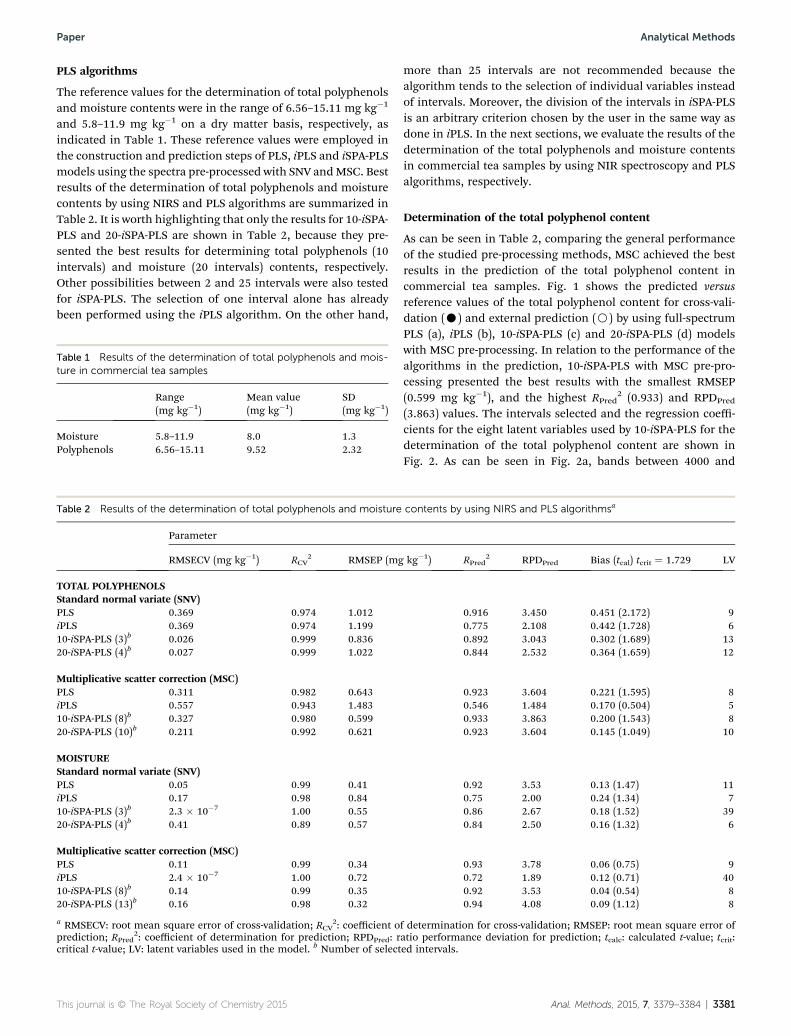
and 5.8–11.9 mg kg�1 on a dry matter basis, respectively, asindicated in Table 1. These reference values were employed inthe construction and prediction steps of PLS, iPLS and iSPA-PLSmodels using the spectra pre-processed with SNV andMSC. Bestresults of the determination of total polyphenols and moisturecontents by using NIRS and PLS algorithms are summarized inTable 2. It is worth highlighting that only the results for 10-iSPA-PLS and 20-iSPA-PLS are shown in Table 2, because they pre-sented the best results for determining total polyphenols (10intervals) and moisture (20 intervals) contents, respectively.Other possibilities between 2 and 25 intervals were also testedfor iSPA-PLS. The selection of one interval alone has alreadybeen performed using the iPLS algorithm. On the other hand,
Table 1 Results of the determination of total polyphenols and mois-ture in commercial tea samples
Range(mg kg�1)
Mean value(mg kg�1)
SD(mg kg�1)
Moisture 5.8–11.9 8.0 1.3Polyphenols 6.56–15.11 9.52 2.32
Table 2 Results of the determination of total polyphenols and moisture
Parameter
RMSECV (mg kg�1) RCV2 RMSEP (mg
TOTAL POLYPHENOLSStandard normal variate (SNV)PLS 0.369 0.974 1.012iPLS 0.369 0.974 1.19910-iSPA-PLS (3)b 0.026 0.999 0.83620-iSPA-PLS (4)b 0.027 0.999 1.022
Multiplicative scatter correction (MSC)PLS 0.311 0.982 0.643iPLS 0.557 0.943 1.48310-iSPA-PLS (8)b 0.327 0.980 0.59920-iSPA-PLS (10)b 0.211 0.992 0.621
MOISTUREStandard normal variate (SNV)PLS 0.05 0.99 0.41iPLS 0.17 0.98 0.8410-iSPA-PLS (3)b 2.3 � 10�7 1.00 0.5520-iSPA-PLS (4)b 0.41 0.89 0.57
Multiplicative scatter correction (MSC)PLS 0.11 0.99 0.34iPLS 2.4 � 10�7 1.00 0.7210-iSPA-PLS (8)b 0.14 0.99 0.3520-iSPA-PLS (13)b 0.16 0.98 0.32
a RMSECV: root mean square error of cross-validation; RCV2: coefficient o
prediction; RPred2: coefficient of determination for prediction; RPDPred: r
critical t-value; LV: latent variables used in the model. b Number of select
This journal is © The Royal Society of Chemistry 2015
more than 25 intervals are not recommended because thealgorithm tends to the selection of individual variables insteadof intervals. Moreover, the division of the intervals in iSPA-PLSis an arbitrary criterion chosen by the user in the same way asdone in iPLS. In the next sections, we evaluate the results of thedetermination of the total polyphenols and moisture contentsin commercial tea samples by using NIR spectroscopy and PLSalgorithms, respectively.
Determination of the total polyphenol content
As can be seen in Table 2, comparing the general performanceof the studied pre-processing methods, MSC achieved the bestresults in the prediction of the total polyphenol content incommercial tea samples. Fig. 1 shows the predicted versusreference values of the total polyphenol content for cross-vali-dation (C) and external prediction (B) by using full-spectrumPLS (a), iPLS (b), 10-iSPA-PLS (c) and 20-iSPA-PLS (d) modelswith MSC pre-processing. In relation to the performance of thealgorithms in the prediction, 10-iSPA-PLS with MSC pre-pro-cessing presented the best results with the smallest RMSEP(0.599 mg kg�1), and the highest RPred
2 (0.933) and RPDPred
(3.863) values. The intervals selected and the regression coeffi-cients for the eight latent variables used by 10-iSPA-PLS for thedetermination of the total polyphenol content are shown inFig. 2. As can be seen in Fig. 2a, bands between 4000 and
contents by using NIRS and PLS algorithmsa
kg�1) RPred2 RPDPred Bias (tcal) tcrit ¼ 1.729 LV
0.916 3.450 0.451 (2.172) 90.775 2.108 0.442 (1.728) 60.892 3.043 0.302 (1.689) 130.844 2.532 0.364 (1.659) 12
0.923 3.604 0.221 (1.595) 80.546 1.484 0.170 (0.504) 50.933 3.863 0.200 (1.543) 80.923 3.604 0.145 (1.049) 10
0.92 3.53 0.13 (1.47) 110.75 2.00 0.24 (1.34) 70.86 2.67 0.18 (1.52) 390.84 2.50 0.16 (1.32) 6
0.93 3.78 0.06 (0.75) 90.72 1.89 0.12 (0.71) 400.92 3.53 0.04 (0.54) 80.94 4.08 0.09 (1.12) 8
f determination for cross-validation; RMSEP: root mean square error ofatio performance deviation for prediction; tcalc: calculated t-value; tcrit:ed intervals.
Anal. Methods, 2015, 7, 3379–3384 | 3381
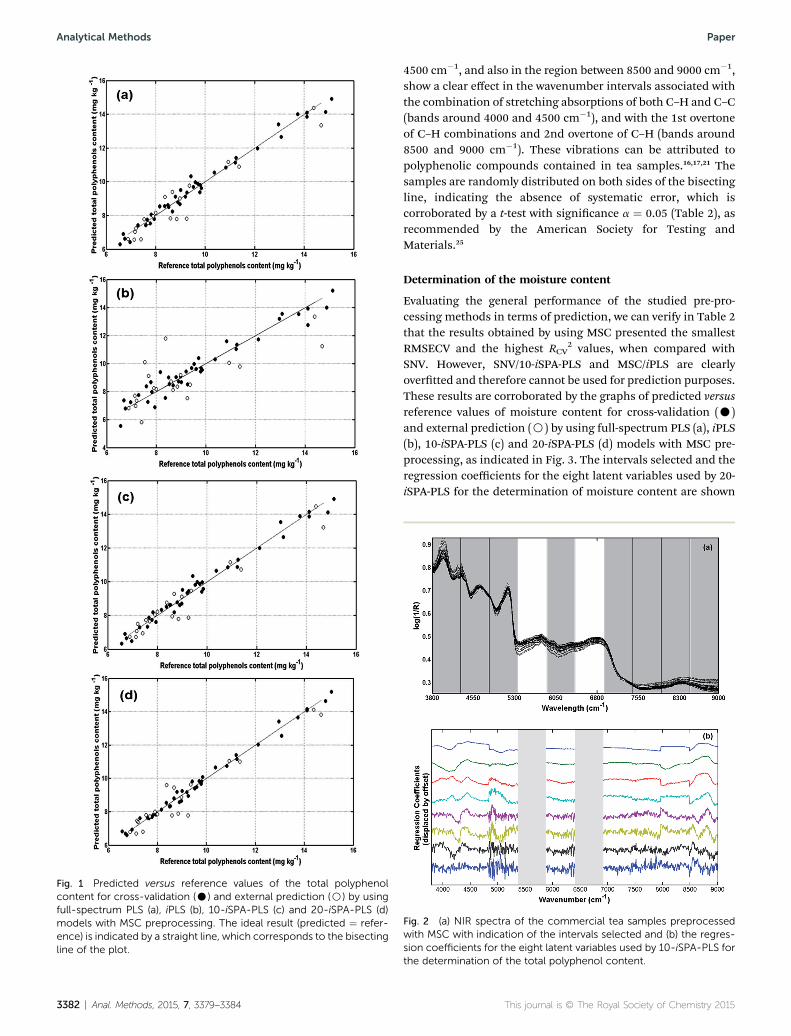
Fig. 1 Predicted versus reference values of the total polyphenolcontent for cross-validation (C) and external prediction (B) by usingfull-spectrum PLS (a), iPLS (b), 10-iSPA-PLS (c) and 20-iSPA-PLS (d)models with MSC preprocessing. The ideal result (predicted ¼ refer-ence) is indicated by a straight line, which corresponds to the bisectingline of the plot.
3382 | Anal. Methods, 2015, 7, 3379–3384
Analytical Methods Paper
4500 cm�1, and also in the region between 8500 and 9000 cm�1,show a clear effect in the wavenumber intervals associated withthe combination of stretching absorptions of both C–H and C–C(bands around 4000 and 4500 cm�1), and with the 1st overtoneof C–H combinations and 2nd overtone of C–H (bands around8500 and 9000 cm�1). These vibrations can be attributed topolyphenolic compounds contained in tea samples.16,17,21 Thesamples are randomly distributed on both sides of the bisectingline, indicating the absence of systematic error, which iscorroborated by a t-test with signicance a ¼ 0.05 (Table 2), asrecommended by the American Society for Testing andMaterials.25
Determination of the moisture content
Evaluating the general performance of the studied pre-pro-cessing methods in terms of prediction, we can verify in Table 2that the results obtained by using MSC presented the smallestRMSECV and the highest RCV
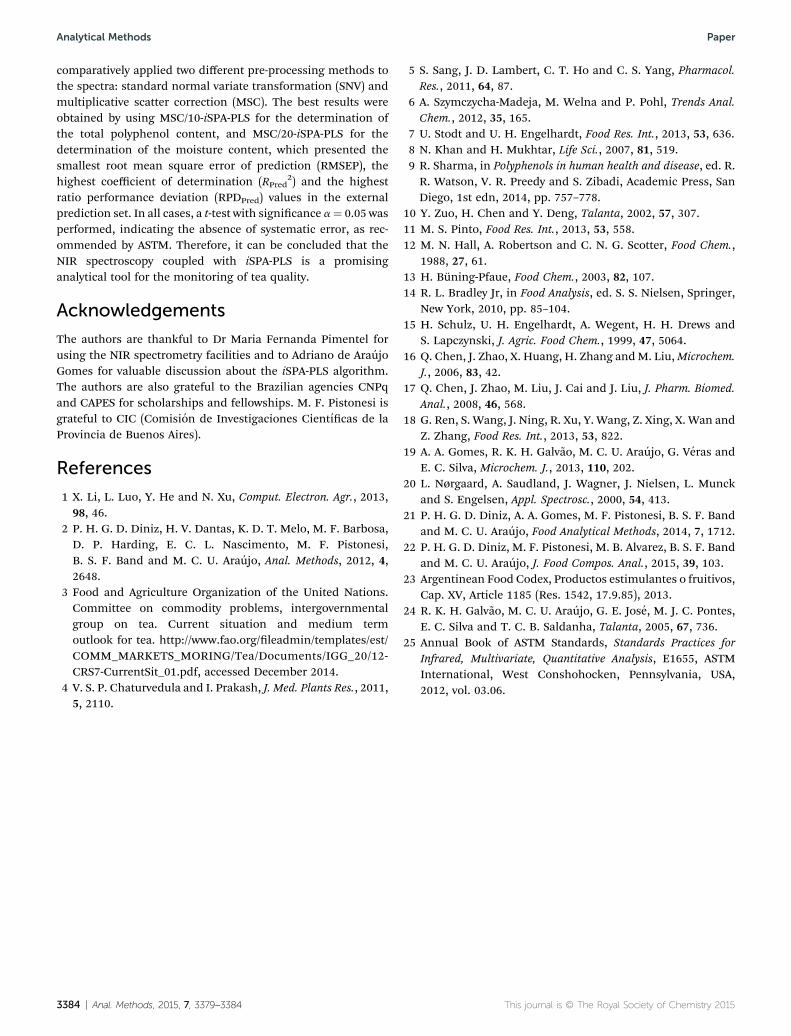
2 values, when compared withSNV. However, SNV/10-iSPA-PLS and MSC/iPLS are clearlyovertted and therefore cannot be used for prediction purposes.These results are corroborated by the graphs of predicted versusreference values of moisture content for cross-validation (C)and external prediction (B) by using full-spectrum PLS (a), iPLS(b), 10-iSPA-PLS (c) and 20-iSPA-PLS (d) models with MSC pre-processing, as indicated in Fig. 3. The intervals selected and theregression coefficients for the eight latent variables used by 20-iSPA-PLS for the determination of moisture content are shown
Fig. 2 (a) NIR spectra of the commercial tea samples preprocessedwith MSC with indication of the intervals selected and (b) the regres-sion coefficients for the eight latent variables used by 10-iSPA-PLS forthe determination of the total polyphenol content.
This journal is © The Royal Society of Chemistry 2015
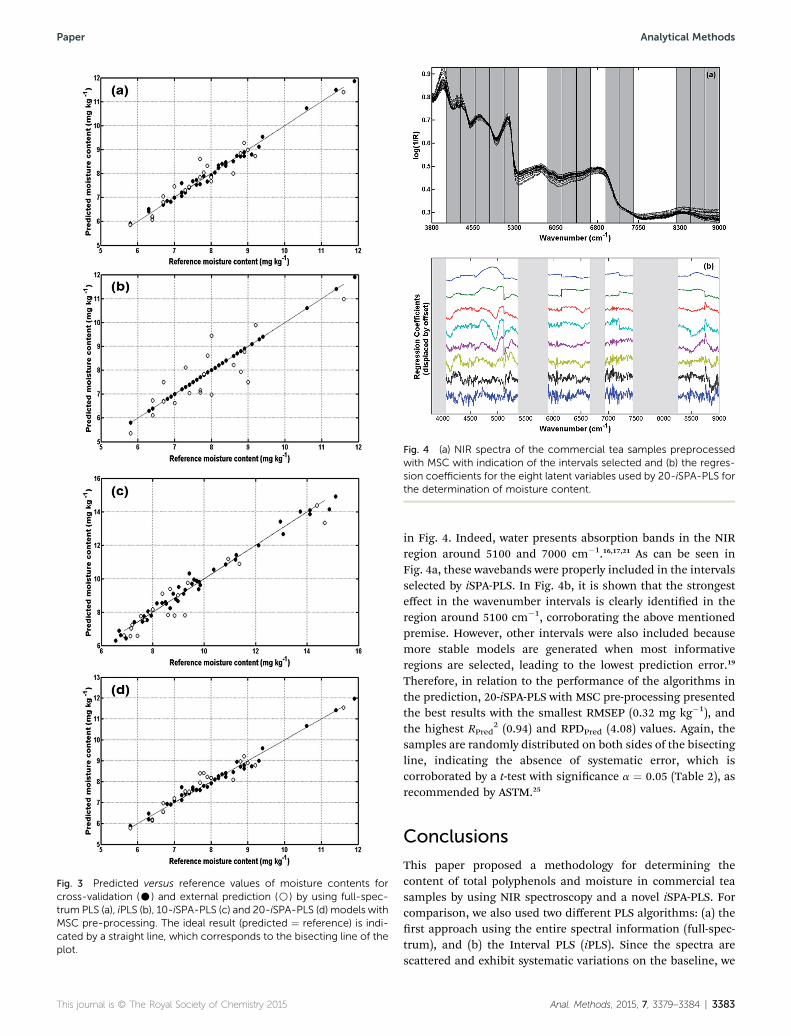
Fig. 3 Predicted versus reference values of moisture contents forcross-validation (C) and external prediction (B) by using full-spec-trum PLS (a), iPLS (b), 10-iSPA-PLS (c) and 20-iSPA-PLS (d) models withMSC pre-processing. The ideal result (predicted ¼ reference) is indi-cated by a straight line, which corresponds to the bisecting line of theplot.
Fig. 4 (a) NIR spectra of the commercial tea samples preprocessedwith MSC with indication of the intervals selected and (b) the regres-sion coefficients for the eight latent variables used by 20-iSPA-PLS forthe determination of moisture content.
This journal is © The Royal Society of Chemistry 2015
Paper Analytical Methods
in Fig. 4. Indeed, water presents absorption bands in the NIRregion around 5100 and 7000 cm�1.16,17,21 As can be seen inFig. 4a, these wavebands were properly included in the intervalsselected by iSPA-PLS. In Fig. 4b, it is shown that the strongesteffect in the wavenumber intervals is clearly identied in theregion around 5100 cm�1, corroborating the above mentionedpremise. However, other intervals were also included becausemore stable models are generated when most informativeregions are selected, leading to the lowest prediction error.19
Therefore, in relation to the performance of the algorithms inthe prediction, 20-iSPA-PLS with MSC pre-processing presentedthe best results with the smallest RMSEP (0.32 mg kg�1), andthe highest RPred
2 (0.94) and RPDPred (4.08) values. Again, thesamples are randomly distributed on both sides of the bisectingline, indicating the absence of systematic error, which iscorroborated by a t-test with signicance a ¼ 0.05 (Table 2), asrecommended by ASTM.25
Conclusions
This paper proposed a methodology for determining thecontent of total polyphenols and moisture in commercial teasamples by using NIR spectroscopy and a novel iSPA-PLS. Forcomparison, we also used two different PLS algorithms: (a) therst approach using the entire spectral information (full-spec-trum), and (b) the Interval PLS (iPLS). Since the spectra arescattered and exhibit systematic variations on the baseline, we
Anal. Methods, 2015, 7, 3379–3384 | 3383
Analytical Methods Paper
comparatively applied two different pre-processing methods tothe spectra: standard normal variate transformation (SNV) andmultiplicative scatter correction (MSC). The best results wereobtained by using MSC/10-iSPA-PLS for the determination ofthe total polyphenol content, and MSC/20-iSPA-PLS for thedetermination of the moisture content, which presented thesmallest root mean square error of prediction (RMSEP), thehighest coefficient of determination (RPred
2) and the highestratio performance deviation (RPDPred) values in the externalprediction set. In all cases, a t-test with signicance a¼ 0.05 wasperformed, indicating the absence of systematic error, as rec-ommended by ASTM. Therefore, it can be concluded that theNIR spectroscopy coupled with iSPA-PLS is a promisinganalytical tool for the monitoring of tea quality.
Acknowledgements
The authors are thankful to Dr Maria Fernanda Pimentel forusing the NIR spectrometry facilities and to Adriano de AraujoGomes for valuable discussion about the iSPA-PLS algorithm.The authors are also grateful to the Brazilian agencies CNPqand CAPES for scholarships and fellowships. M. F. Pistonesi isgrateful to CIC (Comision de Investigaciones Cientıcas de laProvincia de Buenos Aires).
References
1 X. Li, L. Luo, Y. He and N. Xu, Comput. Electron. Agr., 2013,98, 46.
2 P. H. G. D. Diniz, H. V. Dantas, K. D. T. Melo, M. F. Barbosa,D. P. Harding, E. C. L. Nascimento, M. F. Pistonesi,B. S. F. Band and M. C. U. Araujo, Anal. Methods, 2012, 4,2648.
3 Food and Agriculture Organization of the United Nations.Committee on commodity problems, intergovernmentalgroup on tea. Current situation and medium termoutlook for tea. http://www.fao.org/leadmin/templates/est/COMM_MARKETS_MORING/Tea/Documents/IGG_20/12-CRS7-CurrentSit_01.pdf, accessed December 2014.
4 V. S. P. Chaturvedula and I. Prakash, J. Med. Plants Res., 2011,5, 2110.
3384 | Anal. Methods, 2015, 7, 3379–3384
5 S. Sang, J. D. Lambert, C. T. Ho and C. S. Yang, Pharmacol.Res., 2011, 64, 87.
6 A. Szymczycha-Madeja, M. Welna and P. Pohl, Trends Anal.Chem., 2012, 35, 165.
7 U. Stodt and U. H. Engelhardt, Food Res. Int., 2013, 53, 636.8 N. Khan and H. Mukhtar, Life Sci., 2007, 81, 519.9 R. Sharma, in Polyphenols in human health and disease, ed. R.R. Watson, V. R. Preedy and S. Zibadi, Academic Press, SanDiego, 1st edn, 2014, pp. 757–778.
10 Y. Zuo, H. Chen and Y. Deng, Talanta, 2002, 57, 307.11 M. S. Pinto, Food Res. Int., 2013, 53, 558.12 M. N. Hall, A. Robertson and C. N. G. Scotter, Food Chem.,
1988, 27, 61.13 H. Buning-Pfaue, Food Chem., 2003, 82, 107.14 R. L. Bradley Jr, in Food Analysis, ed. S. S. Nielsen, Springer,
New York, 2010, pp. 85–104.15 H. Schulz, U. H. Engelhardt, A. Wegent, H. H. Drews and
S. Lapczynski, J. Agric. Food Chem., 1999, 47, 5064.16 Q. Chen, J. Zhao, X. Huang, H. Zhang andM. Liu,Microchem.
J., 2006, 83, 42.17 Q. Chen, J. Zhao, M. Liu, J. Cai and J. Liu, J. Pharm. Biomed.
Anal., 2008, 46, 568.18 G. Ren, S. Wang, J. Ning, R. Xu, Y. Wang, Z. Xing, X. Wan and
Z. Zhang, Food Res. Int., 2013, 53, 822.19 A. A. Gomes, R. K. H. Galvao, M. C. U. Araujo, G. Veras and
E. C. Silva, Microchem. J., 2013, 110, 202.20 L. Nørgaard, A. Saudland, J. Wagner, J. Nielsen, L. Munck
and S. Engelsen, Appl. Spectrosc., 2000, 54, 413.21 P. H. G. D. Diniz, A. A. Gomes, M. F. Pistonesi, B. S. F. Band
and M. C. U. Araujo, Food Analytical Methods, 2014, 7, 1712.22 P. H. G. D. Diniz, M. F. Pistonesi, M. B. Alvarez, B. S. F. Band
and M. C. U. Araujo, J. Food Compos. Anal., 2015, 39, 103.23 Argentinean Food Codex, Productos estimulantes o fruitivos,
Cap. XV, Article 1185 (Res. 1542, 17.9.85), 2013.24 R. K. H. Galvao, M. C. U. Araujo, G. E. Jose, M. J. C. Pontes,
E. C. Silva and T. C. B. Saldanha, Talanta, 2005, 67, 736.25 Annual Book of ASTM Standards, Standards Practices for
Infrared, Multivariate, Quantitative Analysis, E1655, ASTMInternational, West Conshohocken, Pennsylvania, USA,2012, vol. 03.06.
This journal is © The Royal Society of Chemistry 2015
Copyright © 2022 FDOKUMEN