
Using Discrepant Events in Science Demonstrations - UR ...
262
Using Discrepant Events in Science Demonstrations to Promote Student Engagement in Scientific Investigations: An Action Research Study by Vincent J. Mancuso Submitted in Partial Fulfillment of the Requirements for the Degree Doctor of Education Supervised by Dr. Raffaella Borasi Dr. April Luehmann Warner School of Education and Human Development University of Rochester Rochester, New York 2010
-
Upload
khangminh22 -
Category
Documents
-
view
0 -
download
0
Transcript of Using Discrepant Events in Science Demonstrations - UR ...

Using Discrepant Events in Science Demonstrations to Promote Student Engagement in Scientific Investigations:
An Action Research Study
by
Vincent J. Mancuso
Submitted in Partial Fulfillment
of the
Requirements for the Degree
Doctor of Education
Supervised by
Dr. Raffaella Borasi
Dr. April Luehmann
Warner School of Education and Human Development
University of Rochester Rochester, New York
2010

ii
Acknowledgement
Although only my name appears on its cover, there have been others who have contributed tremendous efforts to the production of this dissertation. I have been incredibly fortunate to have had two remarkable advisors for the past three years, Dr. Raffaella Borasi and Dr. April Luehmann. It is truly because of their time, guidance, insight, and support that my dissertation has become the body of work that it is. To them I owe deep gratitude for the countless ways in which they have influenced my growth as a student and an individual. I would also like to thank Dr. Cindy Callard. Her efforts and guidance as one of my committee members were integral in the direction, focus and strength of my study and this paper. I am deeply grateful to have had the opportunity to share my experiences with my cohort members, Ellen, Pete, and John. Their support and friendship have grown into very special relationships that I will value for the rest of my life. Finally, and most importantly, I would like to thank my family. My efforts were only successful because of the unwavering patience and support from my wife, Nancy. The additional work and worry that she endured through my studies has been a testament to her love and commitment. Along with her, it is my son, Nicholas, and my daughter, Cara who are the driving force and inspiration behind all that I do. My world turns because of you. Cara and Nick, I hope that I can somehow inspire you both as much as you have inspired me. This dissertation is dedicated to the three of you- thank you Cara, Nick, and Nancy. I could not have accomplished any of this without you. I would also like to thank my parents, Sylvia and John for the freedom and encouragement to pursue my ambitions and dreams. A nurturing, loving family is the foundation of all success. This has been an incredible experience for me. Thank you all very much.

iii
Table of Contents Abstract Page vii Chapter 1: Introduction
1.1. Overview Page 1 1.2. Statement of the problem and goals of the study Page 2 1.3. Action research as the chosen methodology Page 5 1.4. Theoretical framework for the proposed study Page 6 1.5. Overview of the research design Page 7 1.6. Preview of key findings Page 12
Chapter 2: Literature Review
2.1. Introduction and overview Page 13 2.2. Situated cognition as the main theoretical framework Page 14 2.3. Conceptual change theory Page 19 2.4. Inquiry-based school science reform Page 21 2.5. Research on demonstrations Page 27 2.6. Research on discrepant events Page 30
Chapter 3: Design of the Study
3.1. Introduction and overview Page 32 3.2. Action research Page 32 3.3. Context of the study and participant recruitment Page 34 3.4. Positionality of the researcher Page 36 3.5. Research questions and overview of the study design Page 37 3.6. Curricular context Page 42 3.7. Detailed plan for the intervention Page 43 3.8. Data collection Page 54 3.8.1. Classroom transcripts Page 54
3.8.2. Reflective journals Page 54 3.8.3. Other student work Page 55 3.8.4. Teacher log Page 55 3.8.5. Observer’s charts Page 56 3.8.6. Final class reflection Page 56 3.8.7. Semi-structured interviews Page 56
3.9. Data analysis Page 57
Chapter 4: Findings 4.1. Introduction and overview Page 59 4.2. Narrative account of how the three instructional designs played out Page 59
4.2.1 Students develop an investigation following a discrepant Page 59 event using POE 4.2.2 Students develop an investigation following a lecture Page 73 4.2.3 Students develop an investigation following a discrepant event Page 84 using NOE

iv
4.3 Research question one 4.3.1 How does a discrepant event demonstration using POE Page 97 impact how students design, conduct and interpret their own investigation to explain the event? 4.3.2 How does a discrepant event demonstration using POE Page 106 impact students’ interest in learning about the scientific phenomenon under study?
4.4 Research question two 4.4.1 How does an NOE discrepant event demonstration impact Page 110 how students design, conduct and interpret their own investigation to explain the event? 4.4.2 How does an NOE discrepant event demonstration impact Page 115 students’ interest in learning about the scientific phenomenon under study? 4.5 Research question three 4.5.1 What are similarities and differences in how students Page 119 design, conduct and interpret their own investigation in the three scenarios (POE, NOE, L/I)? 4.5.2 What are similarities and differences in students’ interest Page 132 in learning about the scientific phenomenon under study in the three scenarios (POE, NOE, L/I)? 4.6 Discussion Page 135
Chapter 5: Actions Resulting From This Research Study 5.1 Introduction and overview Page 143 5.2 Impact on participants Page 143 5.3 Impact on my teaching practice Page 145 5.4 Other actions resulting from this study Page 149 5.5 Future action research plans Page 150 Chapter 6: Conclusion 6.1 Introduction and overview Page 154 6.2 Summary of the key findings Page 155 6.3 Limitations of the study Page 159 6.4 Contributions to the field Page 160 6.5 Recommendations to science teachers Page 167 6.6 Further research Page 167 6.7 Concluding thoughts Page 169
References Page 172 Appendices Appendix A: Background Information
A.1. Curriculum map for the course Page 178 A.2. Detailed lesson plans for Unit 2 Page 181

v
A.3. Detailed lesson plans for Unit 3 Page 184
Appendix B: Data Collection Tools B.1. Journal entry prompts Page 187 B.2. Guiding questions for final class reflection / journal Page 188 entry prompts for final class reflection B.3. Observation chart Page 189 B.4. Teacher log prompts Page 190 B.5. Questions for follow-up student interview Page 191
Appendix C: Data Analysis Tools C.1. Data collection and analysis chart Page 192 C.2. Rating form for quality of research question Page 208 C.3. Rating form for quality of research design/protocol Page 209 C.4. Rating form for quality of observation/data analysis Page 210 C.5. Rating form for quality of conclusions Page 211
Appendix D: Data Summary and Samples D.1. Number of investigable research questions per student Page 212
D.2. Rating for rigor of research questions Page 213 D.3. Rating for centrality of research questions Page 214 D.4. Rating for prediction suitability of research questions Page 215 D.5. Rating for protocol rigor Page 216 D.6. Rating for protocol detail Page 217 D.7. Rating for appropriateness of protocol to research question Page 218 D.8. Rating for centrality of observations Page 219 D.9. Rating for data collection rigor Page 220 D.10. Rating for detail of observations Page 221 D.11. Rating for coherence of conclusions Page 222 D.12. Rating for central concept articulation of conclusions Page 223 D.13. Independent observer engagement data Page 224 D.14. Student interest rating for units (class journal entry) Page 225 D.15. Student interest rating for units (final reflection journal entry) Page 226 D.16. Student value rating for units (final reflection journal entry) Page 227 D.17. Unit 2- POE: Research questions, predictions and conclusions Page 228 developed by each student D.18. Unit 2- NOE: Research questions, predictions and conclusions Page 231 developed by each student D.19. Unit 2- L/I: Research questions, predictions and conclusions Page 234 developed by each student D.20. Unit 3- POE: Research questions, predictions and conclusions Page 237 developed by each student D.21. Unit 3- NOE: Research questions, predictions and conclusions Page 241 developed by each student D.22. Unit 3- L/I: Research questions, predictions and conclusions Page 245 developed by each student

vi
D.23. Complete list of research questions and variables developed Page 248 by Unit 2 POE students D.24. Complete list of research questions and variables developed Page 249 by Unit 2 NOE students D.25. Complete list of research questions and variables developed Page 250 by Unit 2 L/I students D.26. Complete list of research questions and variables developed Page 251 by Unit 3 POE students D.27. Complete list of research questions and variables developed Page 252 by Unit 3 NOE students D.28. Complete list of research questions and variables developed Page 253 by Unit 3 L/I students

vii
Abstract Students’ scientific investigations have been identified in national standards and
related reform documents as a critical component of students’ learning experiences in school,
yet it is not easy to implement them in science classrooms. Could science demonstrations
help science teachers put this recommendation into practice? While demonstrations are a
common practice in the science classroom and research has documented some positive
effects in terms of student motivation and engagement from their use, the literature also
shows that, as traditionally presented, science demonstrations do not always achieve their
intended outcomes. This, in turn, suggested the value of investigating what design elements
of demonstrations could be used to promote specific instructional goals.
Employing action research as a methodology, the proposed study was developed to
explore how science demonstrations can be designed so as to most effectively promote
student engagement in scientific investigations. More specifically, I was interested in
examining the effects of using a discrepant event as part of the demonstration, as a way to
create cognitive conflict and, thus, increase interest and engagement. I also investigated the
relative merit of the well-researched POE (Predict, Observe, Explain) design versus
employing demonstrations that appear to the student to be unplanned (what I will refer to as
NOE, or a Naturally Occurring Experience). This study was informed by Constructivism,
Situated Cognition and Conceptual Change as theoretical frameworks.
The project included the design, implementation and study of an intervention
consisting of three instructional units designed to support students’ learning of the concepts
of density, molecular arrangement of gas particles, and cohesion, respectively. In each of
these units, lasting a total of two 80-minute class periods, students were asked to design and

viii
conduct an investigation to gain a better understanding of the concept under study. In one
case, though, the investigation was preceded by a discrepant event demonstration using POE,
in another case the investigation was preceded by an NOE discrepant event demonstration,
and in the third case the student investigation was preceded by an interactive lecture
(Lecture/Inquiry, or L/I) instead of a demonstration.
The intervention took place in Fall 2009 in three sections of the same middle school science
course I taught. Data from these experiences were collected and analyzed to evaluate the impact
of each unit on (a) students’ interest in learning more about the scientific phenomenon under study;
and (b) how students designed, conducted and interpreted their own investigation to explain the
event. These findings were further compared across experiences to identify similarities and
differences connected with the three design approaches utilized – i.e., inquiry following a
discrepant event demonstration using POE, an NOE discrepant event demonstration, or an
interactive lecture.
Data sources included: audiotapes of each lesson, students’ written work, teacher’s
written reflections, observer’s field notes, audiotapes of a final class reflection and semi-
structured student interviews. Qualitative analysis was employed to analyze the data with the
goal of revealing emerging themes addressing each research question.
Findings from this study show that discrepant event demonstrations can indeed
generate student interest and inform worthwhile student-led science investigations without
requiring great time commitment. Furthermore, each lesson design used (POE, NOE, L/I)
offered distinct benefits in the classroom, influencing student engagement and learning
outcomes in valuable and distinct ways. This, in turn, suggests that science teachers should

ix
choose specific design elements when planning to use demonstrations to achieve specific
objectives.

1
CHAPTER 1
INTRODUCTION 1.1. Overview
This dissertation project employed action research to study how science demonstrations
can be designed so as to provide an effective pedagogical tool to support students’ productive
engagement in scientific investigations. The study included an intervention in a middle
school science course I teach, where a few science demonstrations – all involving a
discrepant event but also utilizing a few different design elements – were implemented and
their effects studied by collecting and analyzing a rich set of qualitative data.
In this first chapter, I will begin by articulating the problem I am trying to address and
the goals of the study, as well as by identifying the theoretical framework and the research
paradigm informing the project. I will also briefly describe the design of the proposed study,
by identifying the research questions framing the study and the data that was collected and
analyzed. The chapter will conclude with a preview of key findings.
Relevant research that informed the proposed study will be summarized in Chapter
Two. Chapter Three will instead provide a detailed description of the research design,
including a more in-depth discussion of the basic tenets of action research and the rationale
for choosing this methodological approach. It will also include a thorough description of the
context of the study and the researcher positionality, participants’ recruitment procedures, the
design of the intervention, and data collection and analysis procedures.
In Chapter Four I will answer the three research questions that inform this study. The
chapter will begin with a narrative account of how each of the three lessons investigated

2
played out in the same unit. I will then provide a detailed account of the major findings
related to each research question. A discussion of these findings will conclude the chapter.
In Chapter Five I will report on the “actions” that resulted from the study. Here I will
first discuss the influence of the study on the participants. I will then articulate how the
findings from the study will influence my future practice as a middle school science teacher.
The chapter concludes with a discussion of the future research that I am interested in
engaging in as a next phase of this action research study.
In Chapter Six I will present a summary of the findings. I will then identify some
limitations of the study followed by suggestions for future research. The chapter will
conclude with a discussion of the implications for the field of science education and
recommendations for science teachers.
Additional documentation supporting this study is provided in the Appendices and
referred to as appropriate throughout the text.
1.2 Statement of the Problem and Goals of the Study
There is consensus in the science education community that in order for students to learn
the kind of science they need to be successful in today’s society they need to productively
engage in science investigations as a core element of their schooling experience (National
Research Council, 1996, 2000; American Association for the Advancement of Science
[AAAS], 1991; Bybee, 2000). Designing these learning experiences is more challenging
than using the traditional transmission model of delivering instruction (Lawson, 2000;
Luehmann, 2007; Windschitl, 2008). However, science teachers can benefit from
pedagogical tools that can help them design relevant, engaging science investigations that
provide rich learning opportunities for their students.

3
As suggested by my own experience as a science teacher as well as a number of research
studies (as summarized in Chapter Two), science demonstrations could provide one such
pedagogical tool, if appropriately designed and used. Indeed, science demonstrations have
been a common practice in science classrooms (Glasson, 1989), yet often they do not
produce the intended learning outcomes – especially in the context of an inquiry-based
instructional approach. Research has also produced somewhat inconsistent results. On the
one hand, several studies have shown science demonstrations to be quite effective in
capturing students attention, generating interest and promoting understanding (e.g., Buncick,
Betts, & Horgan, 2001; Callan, Crouch, Fagen, & Mazur, 2004; Meyer, Schmidt, Nozawa, &
Paneee, 2003). On the other hand, critics have pointed out several inadequacies of traditional
science demonstrations as they often result in only a limited understanding of the underlying
scientific concepts and may become a disincentive to engage in independent problem solving
and investigations (e.g., Glasson, 1989; Lynch & Zenchak, 2002; Roth, McRobbie, Lucas &
Boutonne, 1997).
These somewhat conflicting results and opinions about the benefits of science
demonstrations as a pedagogical tool can be at least partially explained by the fact that much
of current research on this topic has tried to study the effects of science demonstrations as a
rather “monolithic” instructional strategy, rather than focusing on the purpose and design
elements of specific demonstrations – a limitation identified by Milne and Otieno (2007).
Indeed, as a practitioner myself, I also believe that science teachers might benefit from
research that investigates how a science demonstration could be designed so as to maximize
the potential of producing specific types of learning outcomes. Thus, I designed this

4
dissertation study to focus on the effects of specific design elements within science
demonstrations on students’ engagement in scientific investigations.
One of these key design elements was developing the science demonstration around a
discrepant event – that is, “a phenomenon that occurs in a way that seems to run contrary to
initial reasoning” (Wright and Govindarajan, 1995, p. 25). As discussed in more detail in
Chapter Two, anomalies are a major source of dissatisfaction (Limon, 2001) that can lead
students to question their current conceptions and motivate them to look for explanations
through student-generated investigations which may lead to significant learning and possibly
even conceptual change.
Another design element this study investigated was the role played by having students
engage in explicit predictions as an integral part of the demonstration. Known in the
literature as the Predict, Observe and Explain (POE) model, this strategy actively involves
students in the demonstration by predicting what will occur prior to the event, observing the
event, and finally attempting to explain it, verbally and/or in writing.
The last design element investigated in this study is one that is not currently found in
the literature but rather generated from my own practice, which I will refer to as a Naturally
Occurring Experience (NOE). In my classroom I have sometimes experienced the
introduction of an unscripted demonstration in response to students’ questions or as the result
of seizing an unexpected opportunity. On these occasions, I have noticed a heightened tone
in some students’ involvement and interest. Is it possible that when students perceive an
activity as being spontaneous, naturally occurring from their own self-generated interest
rather than a formal component to the curriculum, their engagement is enhanced? How could

5
educators use this insight to design more effective science demonstrations in their
classrooms? These are some of the questions yet to be explored in current research.
To sum, my past experience with science demonstrations combined with research results
reported in the literature suggests the need for research that investigates the effects of specific
types of demonstrations on students’ engagement in scientific investigations, and the learning
that occurs as a result of these experiences. This dissertation study was designed with the
goal of addressing this need by focusing on the roles played by the use of discrepant events
as demonstrations, engaging students in explicit predictions and explanations (POE), and the
spontaneous curiosity that can be generated by “impromptu” demonstrations (NOE), on their
science investigations.
1.3 Action Research as the Chosen Methodology
I chose action research as the methodological approach for this study, since action
research involves a recursive and reflective process of investigation and analysis motivated
by the desire to improve practice, and is focused on the development and study of an
intervention. This study will follow Mills’ (2007) definition of action research as “any
systematic inquiry conducted by teacher researchers, principals, school counselors, or other
stakeholders in the teaching/learning environment to gather information about how their
particular schools operate, how they teach, and how well their students learn” (p. 5). Since
this study took place in my classroom and will provide an opportunity for me as a teacher
researcher to gain a deeper understanding of my teaching practices and how my students
learn in the context of science demonstrations, it is also consistent with the description of
action research as research conducted by “practitioners using their own site… as the focus of
their study” (Anderson, Herr, & Nihlen, 2007, p. 2).

6
More specifically, in this study I employed the Dialectic Action Research Spiral (Mills,
2007), which involves the identification of an area of focus, the development of an action
plan, related data collection, analysis and interpretation of this data, all in an interrelated and
cyclical process. (See Chapter Three for a more in-depth discussion of action research as a
research paradigm and its implications for this study).
1.4 Theoretical Framework for the Proposed Study
This study is informed by the National Science Education Standards that state
“inquiry using authentic questions generated from student experiences is the central strategy
for teaching science” (National Research Council, 1996, p.31), underscoring the need for
educators to establish classroom environments that encourage student engagement in
scientific investigations. These Standards also define what meaningful science investigations
should involve, as well as the roles of students and educators in inquiry-based classrooms (as
discussed in more depth in Chapter Two). Therefore, the science demonstrations at the core
of the planned interventions were orchestrated to take place in the context of inquiry
investigations designed by the students and involving science process skills such as
generating research questions, formulating hypotheses, making observations, collecting data,
and forming conclusions that they could defend.
The overarching theoretical framework for this study is provided by constructivist
theory, the learning theory that has informed the development of the Science Standards. This
theory of learning is grounded in the notion that individuals construct meaning and
knowledge from their perception of prior experiences, which guide their perceptions of
present experiences (Driver, Asoko, Leach, Mortimer & Scott, 1994). More specifically,

7
Situated Cognition, which positions itself under the umbrella of constructivism, will serve as
the central theoretical framework for this study.
Situated Cognition considers knowledge as “inextricably a product of the activity and
situations” (Brown et al., 1989) in which it is produced. Not only are concepts situated by
the activity in which they are experienced, they are also individually developed and
constructed by, and with, those who engage in these experiences. Situated cognition theory
asserts that individuals will actively develop their own perceptive interpretations of
experiences and the objects found within them (Seel, 2001; Young, 1993). Any given
situation becomes a different meaningful experience for different individuals because of their
past experiences and resulting beliefs and values.
Conceptual Change theory offers some additional insights into the process of student
learning that have informed some key decisions made in the design of the intervention, and
also played a role in the data collection and analysis. According to Piaget (1964), intellectual
growth, or change, results from a disruption of cognitive equilibrium, established from a
conflict between incoming information and what already exists in an individual’s conceptual
framework. Resolution of this disequilibration results in a modification of existing
knowledge schemes, leading to learning. This is conceptual change. Pedagogical
approaches informed by a conceptual change model employ cognitive conflict -- in which an
individual’s current conceptual framework is challenged by an experience – as a stimulus for
learning. Such cognitive conflict is most often promoted through the use of anomalous data
– hence my decision to focus on science demonstrations that are designed around a
discrepant event.
1.5 Overview of the Research Design

8
The proposed study was motivated by the following overarching question: How can
demonstrations be designed so as to most effectively promote students’ engagement in
scientific inquiry? I explored this question using an action research study design centering
on an intervention that took place in the three sessions of the seventh grade Physical Science
course I was assigned to teach for the school year 2009-10.
More specifically, the design and study of the intervention was informed by the
following research questions:
1. How does a discrepant event demonstration using POE impact: (a) how students design,
conduct and interpret their own investigation to explain the event; and (b) students’
interest in learning about the scientific phenomenon under study?
2. How does an NOE discrepant event demonstration impact: (a) how students design,
conduct and interpret their own investigation to explain the event; and (b) students’
interest in learning about the scientific phenomenon under study?
3. What are similarities and differences in (a) how students design, conduct and interpret
their own investigation around a scientific phenomenon; and (b) students’ interest in
learning about that scientific phenomenon in the following three scenarios: (i) students
develop their own investigation without a prior demonstration following an interactive
lecture, (ii) students develop their own investigation after a discrepant event
demonstration using POE, and (iii) students develop their own investigation after an
NOE demonstration using a discrepant event?
In order to address these research questions, I designed and implemented an intervention
(as described in detail in Chapter Three) where students in each section of my seventh grade
Physical Sciences course engaged in a sequence of three self-designed investigations around

9
a specific scientific concept; these investigations were once preceded by a discrepant event
demonstration using a Predict-Observe-Explain design (POE), once preceded by a discrepant
event occurring as a more spontaneous demonstration (referred to as a Naturally Occurring
Event, or NOE), and once did not involve any initial demonstration, but rather were preceded
by an interactive lecture (referred to as Lecture/Inquiry, or L/I). The three topics and
demonstrations chosen for this intervention are described below, and all took place in the
beginning of the course in Fall 2009.
• Unit #1:
• Key scientific concept: Density
• Demonstration: Floating/Sinking Pop Cans- Two pop cans, regular Coke and
Diet Coke, are placed into separate large beakers of water. The can of regular
Coke sinks to the bottom of the beaker while the Diet Coke floats at the surface.
• Unit #2:
• Key scientific concept: Molecular arrangement of gas particles
• Demonstration: Inverted Cup- A piece of paper towel is placed into a 1000 ml
beaker which is inverted and pushed into a 4000 ml beaker filled with water. The
inverted beaker is lifted out of the water, and the paper towel removed to show
that it is still dry.
• Unit #3:
• Key scientific concept: Cohesion
• Demonstration: Drops on Pennies- Water drops from an eyedropper are placed
onto a penny resting on a table. The drops continue to be placed one at a time,
until the water spills off the coin and onto the table.

10
In the case when no demonstration was used (L/I), students were given some initial
information about the topic under study in the form of an interactive lecture, where, as it is
my practice, I used some visual images (pictures or short videos), as well as engaged students
in making connections with their own life experiences. After either the interactive lecture, or
a POE or an NOE discrepant event demonstration (both of which were expected to create
cognitive conflict and thus stimulate curiosity and questions), students (in pairs) were asked
to design and conduct an investigation to help them explain the phenomenon under study.
This involved identifying potential variables that might affect outcomes, choosing a specific
variable and related research question they wanted to investigate, developing the protocol for
their investigation, conducting the investigation, interpreting the results and sharing what
they learned with the rest of the class. My role as the teacher in all three lesson designs was
to promote and encourage questions and reflection, and to develop structure in the classroom.
Therefore, I was essentially a facilitator, rather than a transmitter of knowledge.
In order to be able to compare students’ reaction to each scenario (i.e., student-designed
science investigation when preceded by (a) demonstration using POE, (b) NOE
demonstration and (c) interactive lecture around the same topic, I arranged for the three
sections of the course to alternate the instructional strategy used for each of the three topics –
as summarized in Table 1.1 below:
Table 1.1
Class #1 (1st class of the day) –Period 1
Class #2 (2nd class of the day) –Period 3
Class #3 (3rd class of the day) –Period 8
Unit #1 Density
POE demonstration + inquiry.
Lecture + Inquiry NOE demonstration + inquiry.

11
Unit #2 Molecular Arrangement of Gas
Lecture + Inquiry NOE demonstration + inquiry.
POE demonstration + inquiry.
Unit #3 Cohesion
NOE demonstration + inquiry.
POE demonstration + inquiry.
Lecture + Inquiry
Furthermore, to make the three scenarios comparable in terms of learning time, each unit
was developed over a total of two 80-minute class periods. A description of the planned
intervention is provided in Chapter Three, with additional planning documents available in
Appendices A and B; a detailed description of how some of these experiences actually played
out can be found at the beginning of Chapter Four.
To evaluate the impact of these different instructional designs on students’ interest, as
well as their investigations, the following set of data was collected (see Chapter Three for a
more in-depth discussion of each data source and Appendix B for specific data collection
tools):
• Audio-tapes of each lesson (transcribed in their entirety).
• Independent observer’s field notes” (limited to the actual demonstrations and including
the compilation of some charts – see Appendix B.3 – specifically designed to capture
individual students’ interest in the experience).
• Teachers’ log (consisting of field notes taken during each class session and reflections
recorded immediately after informed by some guiding questions- see Appendix B.4).
• Students’ written work (all the written work produced by each student/pair during each
unit- including their research questions, predictions, protocols for the investigation, and
students’ responses to specifically designed journal prompts [see Appendix B.1]).
• Audiotape of final class reflection (where each class was asked to reflect on the three
experiences and compare them; see Appendix B.2 for guiding questions).

12
• Audiotape of selected interviews with individual students (which took place after the final
class reflection to gather more in-depth data about students’ perceptions of the various
instructional designs).
This rich set of complementary data was analyzed using qualitative research techniques
to identify themes that helped me address each of the research questions – as described in
more detail in Chapter Three and Appendix C.1..
1.6 Preview of Key Findings and Contributions of the Study
Findings from this study provide valuable insights about the positive effects of using
discrepant event demonstrations in science instruction as a way to strengthen student-led
scientific investigation and increase students interest and engagement in learning science.
They also suggest that each lesson design investigated (POE, NOE, Lecture/Inquiry) has
value for students, although each influenced student engagement and scientific investigations
in specific ways. In particular, the manner in which demonstrations are presented in the POE
and NOE scenarios affected student engagement and learning outcomes. The study also
confirms the value of employing discrepant events as demonstrations in a science curriculum.
As such, findings from this study should encourage science teachers in the use of science
demonstrations in the context of inquiry-based units. The study also deepens and contributes
nuance to the existing research literature on the design and impact of science demonstrations,
especially as a means to launch into a student-led, inquiry-based investigation.

13
CHAPTER 2
LITERATURE REVIEW 2.1. Introduction and Overview
Developing a more nuanced understanding of the pedagogical potential of
demonstrations requires us to understand the unique role of context in learning, how learners
process information that does not correspond to their current understanding of the world, and
the ways in which demonstrations can affect learning. Thus, to ground this study we need to
look at several complementary bodies of work that shed light on these various dimensions.
This literature review is organized into five sections. In the first section, I report on
findings from research on Situated Cognition Theory and articulate how these findings, and
Brown et al.’s (1989) work in particular, establish compelling support to using Situated
Cognition Theory as the main theoretical framework for this study.
Conceptual Change Theory is discussed in the second section. Here I describe critical
features of conceptual change, and specific findings from empirical research on conceptual
change that have informed the study.
In the third section, I summarize the key elements of inquiry-based reform with
special attention to those features that informed the design of the intervention and data
analysis. I also explain the suitability, guidance, and support this pedagogical paradigm
provided to the design of the intervention.
The fourth section begins with a literature review of research on demonstrations as a
pedagogical tool in the science classroom. I present research findings about documented
desirable outcomes of demonstrations along with shortcomings of these approaches as

14
identified by some critiques. I also report more specifically on what we know about POE
demonstrations, one of the design features employed in my intervention.
The final section focuses on discrepant events, another feature directly relevant to the
design of my intervention. Here I review studies that addressed how discrepant events can be
best used to stimulate conceptual change and engagement.
2.2 Situated Cognition as the Main Theoretical Framework
Situated Cognition Theory lies at the heart of this study, as it provides the theoretical
framework to examine how students experience the science demonstrations and the outcomes
resulting from these demonstrations. Situated Cognition as a theory attempts to explain how
an individual’s observations, interactions, and perceptions of and with an environment lead to
learning (Brown et al., 1989; Seel, 2001). Brown et al. (1989) suggest that “by ignoring the
situated nature of cognition, education defeats its own goal of providing useable, robust
knowledge” (p. 32). Situated Cognition considers knowledge as “inextricably a product of
the activity and situations” in which it is produced (Brown et al., 1989) and regards
knowledge as a set of tools that can be used in new situations and can only be completely
understood through use. Using these tools involves an adoption of the culture in which they
are used and results in modifications of the users perceptions of the world. According to
Brown et al. (1989), through increased use concepts continue to develop. Cognition is
interdependent with the physical and social environment. At the foundation of Situated
Cognition are all the internal processes that transpire as individuals interact with their
environments. As such, in this study I will operationalize learning as the ability for an
individual to construct meaning from one’s environment.

15
Not only are concepts situated by the activity in which they are experienced, they are
also individually developed and constructed by, and with, those who engage in these
experiences. In this sense, situated cognition positions itself under the umbrella of
constructivism, grounded in the notion that individuals construct meaning and knowledge
from their perception of prior experiences, which guides their perceptions of present
experiences. Situated Cognition Theory asserts that individuals will actively develop their
own perceptive interpretations of experiences and the objects found within them (Seel, 2001;
Young, 1993). The dual focus on both the context and the individual’s perception of it is a
significant feature of Situated Cognition. Any given situation becomes a different
meaningful experience for different individuals because of their past experiences and
resulting beliefs and values. Furthermore, the interrelationships that develop between
individuals in a particular context are products of the way distinct backgrounds, beliefs and
values interact.
Situated Cognition relies heavily on the idea of cognitive apprenticeship, in which
students, acting as apprentices, are enculturated into a social community, its practices, and its
culture as they learn to use tools as practitioners within that community. Learning then is
seen as a continuous process that results from acting in various situations and must involve
the interdependent nexus of activity, tool, and culture. These entities are also key
components of this study.
The intervention at the core of this study involves students in demonstrations and
investigations that provide opportunities for revision and construction of a specific concept.
This is consistent with Brown et al.’s (1989) belief that “People who use tools actively rather
than just acquire them, by contrast, build an increasingly rich implicit understanding of the

16
world in which they use the tools and of the tools themselves” (p. 33) and that concepts
continually develop as “new situations, negotiations, and activities inevitably recast it in a
new, more densely textured form” (p. 33).
There is a strong connection between Brown et al.’s (1989) representation of the
progression student’s encounter through cognitive apprenticeship (as illustrated in Figure 1)
and those that the students in this study experienced.
The first phase of the model in Figure 1 illustrates how apprenticeship, guided by
coaching, provides a scaffolding experience in preparation for an authentic activity. This
parallels the launch of two of the three lesson designs, where students exposed to a discrepant
event share their initial ideas, identify variables supported by the teacher, and ultimately
develop and implement an inquiry investigation as an “authentic activity”. Each step of this
process was scaffolded, as seen in Figure 1. The next phase of the model involves multiple
practices with collaboration. In this study, as students conduct their investigations, they
“move into a more autonomous phase of collaborative learning, where they begin to
participate consciously in the culture” (Brown et al., 1989, p. 39) as they acquire more
control and conduct their own investigations collaboratively with a partner. In the final
phase of the model, strategies and findings are articulated and reflected upon. Through class
discussion and reflection, students become participants in the culture and its social network
which, as Brown et al. (1989) reports, promotes enculturation through the development of the

17
cultures’ language and belief systems. Reflection of student experiences will result in
generality of concepts and understandings, “grounded in the students situated understanding”
(Brown et al., 1989, p. 39). The entire unit structure is scaffolded by the teacher and
students, from prediction, observation, explanation, class discussion, inquiry, and all the
processes involved in each.
The intervention at the core of this study also aimed at developing a learning
community engaged in collaborative, inquiry-based experiences, following Brown et al.’s
(1989) belief that through enculturation, individuals who practice in situ, observing behavior
of the cultures members, will begin to acquire the language, jargon and behavior of those
members. This means experiencing conceptual tools being used in authentic ways. This
includes teachers acting as practitioners who, in a science classroom, might model problem-
solving and views of the world through the lens of the scientific community- a type of
situated modeling. Young (1993) says that authentic situations must include the
identification of relevant information in tasks, engagement throughout the identification and
solving of problems, and collaboration. Each of these elements has informed the design of
the intervention. These cultural practices are defined as authentic activities, which although
informal “can be deeply informative- in a way that textbook examples and declarative
explanations are not” (Brown et al., 1989, p. 34). As Brown et al. (1989) point out, learning
can result from “legitimate peripheral participation”, whereby individuals not directly
involved in an activity learn from observing salient features of the activity, and the behavior
and interrelationships of those individuals directly involved.
This study established students as members of a collaboratively developed culture-
with students generating their individual directions of problem solving, and forming

18
conclusions from collaborative discussion and reflection on their experiences. One of the
roles of class discussion was to demonstrate to students the “legitimacy of their implicit
knowledge and its availability as scaffolding in apparently unfamiliar tasks” (Brown et al.,
1989, p. 38).
The idea of cognitive apprenticeship is a main construct of Situated Cognition
Theory. The idea of enculturation embedded in cognitive apprenticeship has identifiable
characteristics shared by inquiry-based reform. Among them are the ideas of students as
active generators of problems and solutions, involving collaborative problem-solving,
reflective narrative, group discussion, and the recognition of misconceptions. As such, this
metacognitive awareness and the process itself become fundamental to enculturation. This
study was conducted in a classroom where learning is perceived as a process- a principle that
was explicitly defined in the first week of school and continued throughout the school year.
As a process, learning in this classroom did not focus on the memorization of terms and
ideas. Although I believe that an understanding of scientific terminology is important to
classroom discourse, the intervention I planned was informed by the goal of promoting
students’ development of individual meaning of the scientific technical terms that can be
confirmed and supported through exploration and discussion. This became part of the
enculturation of the classroom.
The physical science curriculum that I teach involves many conceptual topics at the
molecular and atomic level of matter. As Brown et al. (1989) point out, the epistemology
customarily guiding this type of curriculum, for me and many other educators, has
emphasized a fundamental focus on conceptual representation. However, “a theory of
situated cognition suggests that activity and perception are importantly and epistemologically

19
prior- at a nonconceptual level- to conceptualization” (p. 41). In this study, although
conceptual representations are critical, they are developed and mediated through individual
and collaborative activity and perception.
Young (1993) concludes that from a situated cognition perspective, it is necessary for
teachers to draw student’s attention to the meaningful features of a situation or problem.
Baddock and Bucat (2008) agree and conclude that along with being explicit, teachers should
be repetitive and dramatic, so that students can distinguish the important from the
unimportant information in the demonstration. Without this, the authors believe that
observations, existing knowledge and details of the demonstration might establish a cognitive
overload for students. Baddock and Bucat (2008) conclude that unless the teacher explicitly
points out the most significant information in a demonstration, it is difficult for students to
distinguish it. Without being provided a direction for what they are to learn from the
demonstration, students have difficulty separating noise from signal (Roth et. al, 1997; Roth
& Lucas, 1997). This study incorporated their suggestions to use “emphatic tones, dramatic
(even melodramatic) style at crucial moments, reminding students of their predictions,
pretending musing (aloud) to oneself, or even the use of a mock drum roll” (p. 1126).
2.3 Conceptual Change Theory
Conceptual Change Theory posits that learning occurs “against the background of the
learner’s current concepts” (Posner et al, 1982, p. 212) used to organize new experiences.
Essentially, conceptual change involves the reorganization of an “interrelated system of
beliefs” (Vosniadou et al, 2001, p. 394).
Conceptual Change Theory takes the position that students don’t simply acquire or
form new concepts, but rather they either modify those that already exist or replace an

20
existing concept with a new one. Introduced by Piaget (1964), accommodation is a process of
conceptual restructuring occurring through modification of existing knowledge. Essentially,
it occurs when students use existing concepts to understand new phenomena. On the other
hand, assimilation is the incorporation of new information into existing conceptions.
Piaget (1964) explains that learning can be stimulated when cognitive dissonance
occurs, or when an observer experiences a situation that contradicts expectation. The
resulting state of perplexity and doubt, called disequilibrium, plays a significant role by
stimulating curiosity and engaging the learner. The observer is compelled to seek
information that can explain the occurrence, due to the mental discomfort of two
simultaneously existing competing concepts.
Discrepant events have been identified as a valuable means of causing cognitive
conflict in students, as they represent a type of anomalous experience that compels students
to focus on prior conceptions, a necessary step for conceptual change (Pintrich, Marx &
Boyle, 1993). Even if no conceptual change results, anomalous data support at least the
initial steps towards conceptual change (Limon, 2001) by promoting reflection and initiating
awareness and self-recognition of ideas and assumptions (Limon & Carretero, 1997).
The critical conceptual change features are dissatisfaction, exploration of plausible
explanations, and selection of a fruitful one (Dykstra et al, 1992). This is precisely what
participants of this study experienced as part of the discrepant event demonstrations included
in the intervention. The discrepant event demonstrations were designed so that students
would encounter dissatisfaction during observation, explore plausible explanations through
their own investigations, and finally select a fruitful explanation through experience and

21
discussion. It was the intention of the study to operationalize cognitive conflict in students
through the discrepant event demonstrations.
2.4 Inquiry-Based Reform
A significant amount of research, as reported in the National Science Education
Standards (National Research Council, 1996), supports an inquiry-based approach to science
instruction. As the foundation for my study, it was imperative to learn more about how
demonstrations can help support inquiry experiences. The National Science Education
Standards define “full inquiry” as a process in which students:
1. pose a productive question;
2. design an investigation directed toward answering that question;
3. carry out the investigation, gathering the applicable data in the process;
4. interpret and document their findings;
5. publish or present their findings in an open forum.
The science investigations students engaged in as part of the intervention of this action
research study incorporated each of these traits, except for the last one due to a lack of time.
Traditional teaching methods typically attempt to present abstract concepts through
textbook descriptions and exercises. In this study, rather than reading about density or gas
particles in a class text, or passively watching a demonstration, students studied these
concepts and principles by actively engaging in specific experiences, immersed and
surrounded by a scientific culture and community. Students explored different phenomena
within the domain of a concept, reported and explained their experiences and findings
through class discussions, which led to the discovery of general principles together.

22
The science standards call for scientific inquiry that maintains a focus on student
generated questions and conclusions from student developed investigations involving
observation and reflection. Consistent with this charge, in the intervention I designed
students worked in cooperative groups and attempted to answer questions they generated
through their own investigations. They collected data, interpreted the information, and drew
conclusions based on their findings.
The literature contains extensive empirical support demonstrating that inquiry
conducted in the classroom leads to meaningful student learning (Anderson, Reder, & Simon,
1996). The literature also identifies certain features as characterizing quality scientific
investigation (Chinn & Malhotra, 2002). Utilizing an inquiry-based approach, the
intervention at the core of this study incorporates these features and strategies in a number of
ways.
For purposes of this study, inquiry is operationalized as the ability to generate a
research question, design an investigation or protocol, make observations during the
investigation, and explain the results of the investigation in a summative conclusion, as
proposed by Chinn & Malhotra (2002). I feel that these four features lie at the foundation of
inquiry and are critical to a productive classroom inquiry experience. These are the features
of inquiry that I want my students to successfully engage in. Therefore, this study was
designed to evaluate the extent to which inquiry experiences resulting from three differently
designed lessons led to students’ investigations that reflected the central features of inquiry
mentioned above.
Chinn and Malhotra (2002) make the distinction between authentic scientific inquiry,
which most closely resembles research conducted by scientists, and simple inquiry tasks,

23
which may comprise very few if any elements of authentic inquiry. Each of these types of
experiences lie at opposite ends of a continuum, with classroom tasks situated at any point
within this range, dependent on their design. The goal for my classroom and this study was
to follow the tenets of authentic scientific inquiry, as much as possible within the constraints
of a classroom context. Each of the central features of inquiry identified in Chinn and
Malhotra’s (2002) study is explained in depth in what follows.
The first feature of inquiry identified by Chinn & Malhotra (2002) is the ability to
develop an appropriate research question, developed from a hypothesis or theory that
attempts to explain a specific phenomenon, or to imagine how the world works. In authentic
inquiry, the generation of a research question is done by the student, whereas in simple
inquiry the question is provided by the teacher. As the research question establishes the
direction of the entire investigation, it is critical that the question be a sound, investigable
one. The research question should be narrow; not broad-based. By suggesting what kinds of
evidence would help answer it, an investigable question directs the student toward a method
of data collection, leading to a protocol design. The intervention in this study aims to
examine whether different design elements in a lesson lead to differences in formulation of
research questions by students. For example: can students come up with a broader range of
questions? Is there a difference in the type of research questions they come up with? Do
students develop more questions that are testable or investigable? Is the question central to
the learning of the concept embedded in the demonstration?
The second feature of inquiry these authors identify is the ability to design a protocol
that is organized and focused on the research question. There are many facets involved in
designing a protocol/research design for an investigation. Three specific facets of protocol

24
design will be examined here. They are rigor, level of detail, and appropriateness to the
research question. It is vital for protocol techniques to always be rigorous and thorough. A
well-designed protocol will have one clearly identified variable, well-designed planned
measures, and a rich level of complexity, yet maintain a high level of clarity. Similar to the
research question, in authentic inquiry protocol design is constructed by students and merely
supplied by the teacher in simple inquiry, meaning this is also true for each of the three facets
mentioned above.
Whereas the variables in most simple inquiry tasks are perceptually salient (Chinn &
Malhotra, 2002), this was not the case in my interventions, due to the fact the demonstrations
were based on discrepant events. Variables in discrepant events are much less discernible,
which may lead to either an inability to identify them or misidentification. The source of this
misidentification can be a student’s misconception, a primary justification for the use of
conceptual change as one of the theoretical frameworks. Examining whether differently
designed lessons lead to differences in student developed investigation protocols will be
another goal of this study.
When students are told what to measure and what data to collect in simple inquiry,
they are fundamentally being told what to observe. When the research question and protocol
design are imposed on students in simple inquiry tasks, interest and engagement can be
affected, as well as “ownership” of results since it may seem “pre-planned”. One component
of engagement during inquiry is how students react when there is conflict, either between
what they thought was going to happen and what did happen, or between their ideas and
those of others. I noted this “level of engagement” throughout the three units.

25
The third feature of inquiry identified by Chinn & Malhotra (2002) is the ability to
observe the phenomenon in an investigation, make inferences, and analyze the data collected
during these observations. Scientific claims are validated or contradicted by observing the
phenomenon in an investigation. As a result, it is imperative that the observations be
meaningful and relevant to the question under investigation. In this study, equally important
to observations made during the inquiry are those made by students during the
demonstration, since they could lead directly to the development of a research question. It is
paramount that students be able to identify and focus on the key features of the
demonstration. Equally significant is that principles of logical reasoning are used to develop
explanations and conclusions from observations. This reasoning should make coherent,
intelligible connections between observation and explanation.
Ultimately, observations and measurements must be translated into data. Students
must first choose which data to gather and use, and whether their observations or data direct
them to collect additional data. One criterion for data is that it is efficiently organized in a
sound manner. The choice of data, its collection, and its subsequent interpretation should
aim to be objective and free of bias. Bias is seldom addressed in simple inquiry, but it is
directly considered in authentic inquiry. The protocol, interpretation of data, and theoretical
explanations should endure a rigorous critical review in order to safeguard against bias. The
questioning and critiquing of evidence, logic, and explanations are central tenets of science.
It is important for students to understand this review process, and to be aware of this role
when developing protocol, collecting and analyzing data and forming conclusions. Group
discussion and peer review will be a key component of the student investigations developed

26
in the intervention. Examining whether differently designed lessons lead to differences in
student-developed investigation protocols is another goal of this intervention.
Informed by these considerations, the fourth feature of inquiry I have considered is
the ability to draw conclusions from observed phenomenon and collected data. It is critical
that conclusions are coherent. Explanations need to be scientifically valid and consistent
with accepted scientific principles. Proposed explanations must be replicable and should be
based on evidence developed from observations. Evidence is at the foundation of scientific
inquiry- the cornerstone that supports concluding remarks and arguments. The methods in
which evidence is gathered, analyzed, and explained are critical to the integrity of the
investigation, giving weight to the four central features explored in this study. One goal of
this intervention will be to examine whether students’ conclusions demonstrate coherency,
drawn from strong connections to appropriate observations, and how this element is affected
by discrepant event demonstrations. Another attribute is a clear articulation of the central
concept. Do conclusions show evidence of a strong grasp of the central concept? This is
another question that is addressed in this study.
Palincsar (1989) suggests that, when Brown et al. (1989) speak about the
interdependent nature of activity, concept, and culture, they are advocating bridge-building,
in the sense that an individual can acquire the awareness and ability to translate and apply
knowledge learned in one situation to one that is distinctly novel. This capacity to generalize
will be examined in student- drawn conclusions. In today’s technological age, it is critical
for students to gain an appreciation for locating information, and knowing how to apply it.
For knowledge to be considered a tool (Brown et al., 1989) it must be amenable to various

27
situations (Young, 1993), a strength that may become apparent in journal entries and
interviews.
Each of these considerations drawn from the literature on authentic scientific inquiry
were used both in the design of the lessons comprising the intervention, and in the
development of rubrics to systematically evaluate the nature and quality of the student’s
investigations, as a part of the data analysis (see Appendices C.2-5).
2.5 Research on Demonstrations
The science demonstration is a widely used tool in science curricula at all grade levels
(Glasson, 1989). The design of a traditional science demonstration typically involves a
teacher or student performing an activity while the rest of the class observes (Milne &
Otieno, 2007) Research shows that demonstrations are essentially used by educators to
achieve three primary goals: the first is to illustrate or legitimize a concept, the second is to
promote student comprehension, and the third to increase student engagement in the
classroom (Beall, 1996; Candela, 1998; Manaf & Subramaniam, 2004; Morgan, Barroso, &
Simpson, 2007).
Research has shown that demonstrations in the chemistry classroom stretch students
“cognitive spectrum” through their ability to capture attention (Buncick, Betts, & Horgan,
2001), spark curiosity (Shepardson, Moje, & Kennard-McClelland, 1994), generate interest
(Callan, Crouch, Fagen, & Mazur, 2004), and develop higher level thinking skills, promoting
“functional understanding of various concepts” (Meyer et al., 2003, p. 432). Science
demonstrations have been shown to be effective in “capturing attention, igniting curiosity
and promoting functional understanding of various concepts” (Manaf & Subramaniam, 2004,
p. 1).

28
Others argue that science demonstrations promote active learning environments (Manaf
& Subramaniam, 2004) and can be an effective strategy for learning to occur when students
are actively involved, such as predicting and discussing observations (Furtak, 2009; Morgan
et al, 2007). Beasley (1982) reported by Fagen (2003) found that demonstrations increase
levels of student attention and task involvement leading to increased student learning and
understanding of intended concepts.
Both instructors and students have claimed to learn from demonstrations (Freier, 1981;
Hilton, 1981; Morgan et al, 2007). However, critics of traditional science demonstrations
maintain they are inadequate methods of instruction where students, as passive observers,
have difficulty grasping underlying concepts (Callan et al, 2004; Lynch & Zenchak, 2002;
Roth, McRobbie, Lucas & Boutonne, 1997) and are “less motivated to solve problems
independently” (Glasson, 1989, p. 129). These arguments are grounded in the belief that
demonstrations offer nothing more than momentary, attention-getting displays and, rather
than engaging students in true learning experiences, simply capture fleeting attention due to
their visual appeal. Thompson (1989) acknowledges that demonstrations are oftentimes
misused by science teachers who too often use these as “fun activities”, rather than
illustrations of concepts. Criticism has also labeled traditional science demonstrations as
inquiry stifling, charging they do not allow students to explore “what if” questions (Morgan
et al, 2007).
Roth et al. (1997) report that one reason students fail to learn from teacher
demonstrations designed with a traditional transmission approach to teaching is that they are
not provided opportunity to test their explanations. Shepardson et al. (1994) also conclude
that demonstrations should not be viewed as “an end in themselves, but should lead to the

29
testing of children’s ideas” (p. 255). Therefore, in the intervention at the core of this study,
student-designed inquiry experiences allow students to design and implement an
investigation in an effort to explain an observed discrepant event phenomenon.
Studies have investigated the effects of demonstrations as a means to increase student
attention and task involvement (Beasley, 1982); foster inclusivity (Buncick et al, 2001);
develop students’ critical thinking (Meyer et al, 2003); support students’ abilities to write
predictions, make observations and develop explanations (Shepardson et al, 1994; Furtak,
2009); and improve students’ test scores. Milne and Otieno (2007) claim, however, that
much of the research done on demonstrations examines learners understanding of specific
science content, rather than examining the structure or purpose of the demonstration as the
focus.
There is literature regarding variation in the strategies that educators can employ
during classroom demonstrations. They can be used as an introduction to a topic, as a wrap-
up, and as a tool throughout the class discussion of the topic. Demonstrations have also been
studied as a means to review, reinforce, and relate concepts. Morgan et al. (2007) found that
different types of learning outcomes are achieved in each of these situations.
In a Predict-Observe-Explain (POE) demonstration students are introduced to an
experimental scenario and are asked to predict what they think will happen. The teacher next
conducts the experiment while the students observe and record their observations. Finally,
students are asked to discuss their initial predictions, how they differ from the actual results,
and to explain their reasoning behind their predictions. The central tenet of this design lies in
its strategy to involve students actively in the demonstration experience by predicting what

30
will occur prior to the event, observing the event, and finally attempting to explain it,
verbally, in writing and through discourse.
The Predict-Observe-Explain (POE) strategy has been shown by research to be an
effective instructional tool that engages students and strengthens their understanding of
science concepts through the use of demonstrations (Furtak, 2009). The POE strategy
provides opportunities for students to demonstrate what they know and for misconceptions to
be identified.
2.6. Research on Discrepant Events
Consistent with a conceptual change paradigm, McDermott (2001) found that for
students to identify and correct misconceptions, student ideas need to be explicitly elicited,
students must be explicitly confronted with the errors involved in their thoughts, and students
must be provided the opportunity to address these ideas and errors (Crouch et al, 2004).
Consistent with these recommendations, all the demonstrations used in my intervention
involved discrepant events as a way to create cognitive dissonance and thus provide the
impetus for this kind of process.
As mentioned in Chapter One, Wright and Govindarajan (1995) define a discrepant
event as “a phenomenon that occurs in a way that seems to run contrary to initial reasoning”
(p. 25). Research has shown the most effective implementation of discrepant events involves
teachers who neither confirm nor deny students explanations, but rather guide the student
towards, and through, fruitful investigations to evaluate these explanations (Candela, 1998;
O’Brien, 1991).
Based on these considerations, each discrepant event used in this study was chosen to
reflect the following characteristics:

31
1. It could offer a counter-intuitive experience to what would be expected in a particular
situation. It presented an unexpected outcome, contrary to what would be predicted,
establishing cognitive conflict, or contradicting the observer’s existing cognitive
framework.
2. It was designed to engage and motivate the observer to want to know more,
investigate more, or at the very least, to want to continue to observe.
3. An explanation for the observed phenomena could not occur without further
investigation.
4. The experience would be categorized as surprising, startling, paradoxical, amazing,
puzzling, bewildering, confounding, strange, unusual, unreal, bizarre, shocking or
attention-grabbing.

32
CHAPTER 3
DESIGN OF THE STUDY
3.1.Introduction and Overview
This chapter will articulate the design of the study in detail, beginning with a discussion
of the key tenets of action research and their appropriateness for my study and research
questions. I will then present the context of the study, discuss my positionality as participant
and researcher, and describe participant recruitment and related issues. I will then revisit the
overall design of the study and the research questions informing it, building on the review of
the literature provided in Chapter Two to better articulate specific elements of the study
design. A thorough description of the plan for the intervention and its rationale follow. The
chapter concludes with a discussion of the data collection and analysis procedures used in the
study.
3.2. Action Research as the Chosen Methodology
As mentioned in Chapter One, this study followed Mills (2007) definition of action
research as “any systematic inquiry conducted by teacher researchers, principals, school
counselors, or other stakeholders in the teaching/learning environment to gather information
about how their particular schools operate, how they teach, and how well their students
learn” (p. 5). Action research has also been defined as research conducted by “practitioners
using their own site… as the focus of their study” (Anderson, Herr, & Nihlen, 2007, p.2).
Since this study took place in my classroom, and was conducted by myself, it fit both of
these definitions.
Anderson and his colleagues also characterize action research as a reflective process
that is “deliberately and systematically undertaken and that some form of evidence be

33
presented to support assertions” (p. 2). These authors continue to describe action research as
an “ongoing series of cycles that involves moments of planning actions, acting, observing the
effects, and reflecting on one’s observations” (Anderson, Herr, & Nihlen, 2007, p. 3). In the
proposed study, data collected and analyzed from the first units allowed for modifications in
the design and implementation of subsequent units within the study. Throughout the
intervention in this study, these modifications included instructional strategies, physical
environment of the classroom, chosen demonstrations, and/or interview and written response
questions. This study also implemented an infusion approach, introducing “modest
interventions” (Buncick et al., 2001). Benefits to this type of approach include (a) an
emphasis on techniques rather than restructuring of course content, and (b) each technique or
activity can be introduced independently.
More specifically, this study employed Mills’ (2007) Dialectic Action Research
Spiral, as depicted in the figure below:
(from Mills, 2007, p.20)
Mills, ACTION RESEARCH, Figure 1-6, © 2007. Reprinted by permission of Pearson Education, Inc.

34
Referred to as democratic validity/trustworthiness, Anderson, Herr, & Nihlen (2007)
believe that action research is seen as “an opportunity to make the voices of those who work
closest to the classroom heard” (p.7), including both practitioner and student. Similarly,
McCutcheon and Jung (1990) define action research as systematic, collaborative, critical and
self-reflective. All of the participants of this study, including observers and students, were
provided opportunities to offer thoughts and suggestions regarding their experiences.
3.3 Context of the Study and Participant Recruitment
The participants of this study consisted of a subset of the students of the three seventh
grade Physical Science classes that I taught in the 2009-2010 academic school year
(comprising a total of 47 students). All three of these classes were taught on the same school
day of a block schedule.
There were a total of 47 participants- 24 males and 23 females. This gender
composition reflected that of current student enrollment in the school, which was 51% male
and 49% female. Participants ranged between 11 and 14 years of age. The participants’
race/ethnicity was 11% Asian, 15% African-American, 6% Hispanic, 0% Native American,
and 68% Caucasian- quite similar to student enrollment in the school, which was
approximately 14% Asian, 6% African-American, 3% Hispanic, 0% Native American, and
76% Caucasian. For all participants, English was their primary language.
More specifically, period one consisted of 7 males and 10 females; 3 African-
American, 1 Asian, 1 Hispanic, and 12 Caucasian students. Period three consisted of 10
males and 6 females; 4 African-American, 1 Asian, 1 Hispanic, and 10 Caucasian students.
And period eight consisted of 7 males and 7 females; 3 Asian, 1 Hispanic, and 10 Caucasian
students.

35
I invited all students enrolled in the three Physical Science sections I taught to
participate in the study. There was no inclusion or exclusion from this study based on gender,
age, ability or ethnicity. One week prior to the beginning of the school year, I sent
permission letters to parents/guardians of all potential subjects. During the first class period
of the school year I discussed the nature and purpose of this study and requested students’
participation. Following parent permission, potential subjects of age 13 and 14 were asked to
read and sign an assent form, and a verbal script was provided and read by myself to those
potential subjects of age 11 and 12. After reading these documents to the students I
answered any questions asked at that time. Students were given one week to decide whether
they would participate in the study (i.e., regardless, they would have to fully participate in the
lessons which were part of the intervention as part of their science class, but if they chose not
to participate in the study I would not involve them in the interviews, nor would I use their
data in my analysis). I explicitly reminded students that choosing not to participate would, in
no way, affect other aspects of their participation in the course, including their grade.
Students were also told that they may choose to participate in this study without participating
in the interviews. Students were explicitly told that participation in this study was voluntary
and that they could cease participation at any time during the study without any impact on
their grades or status in the class. All students in periods three and eight chose to participate
in this study. In period one, five students chose not to participate. The demographics
previously reported did not include these five students. Audio-taping took place in order to
provide accurate data, but I removed any identifying material from final reports. All subjects’
names were replaced with pseudonyms in the reporting of any data from this study.

36
Consistent with an action research model, revisions and adaptations to the original
plan were made during the course of the intervention due to unexpected events. Before the
study began I realized there would be a lunch break between the two mornings and one
afternoon class. I was concerned about students talking to each other during lunch. In
particular, my concern was that the afternoon class might hear about an observed
demonstration from one of the morning classes. On the one hand, if there was discussion out
of the classroom it would demonstrate engagement, but on the other hand the advance
knowledge may influence student engagement. As a result, I told the students of the earlier
classes that it would be okay if they talked at lunch with their friends about the class
experience, but to not give away any details. They could say it was fun or interesting, if in
fact they thought it was, but that I didn’t want them to share any details of the class. I
explained that by sharing details with those who had not had class yet would spoil the
surprise and the fun.
3.4. Positionality of the Teacher/Researcher
As science department chair in my school, I am in a position of leadership with the
other two seventh grade Physical Science teachers. Together we have committed to modest
instructional innovations and analysis of them within our curriculum for the potential benefit
of our students interest and learning of science. This commitment is long-term and we
believe continues to build our understanding of science teaching and learning. Throughout
this study I was careful that my role as department chair did not negatively influence the
collaborative efforts characterizing action research.
I have taught the seventh grade Physical Science curriculum at this school district for
eleven years. As such, I brought my experience and knowledge of both the curriculum and

37
the student population to this study, influencing reflections, analyses and modifications to the
intervention throughout the study.
Although there were unique advantages in being both the researcher and the teacher
in this study, there were also potential conflicts resulting from the dual role. It is possible
that students may have felt pressured in some ways, since they observed me in both roles
throughout the study. It was also possible that students felt pressured from assignments, such
as from the journal entries, which were assigned points that affected their grades. This
situation was dealt with by reminding students several times, in written and oral form, that
their grades would not be affected in any way by their choice to participate, or not to
participate, in this study, and that they had the choice to opt out of the study without it
affecting their grades or status in the classroom.
3.5. Research Questions and Overview of the Study
In light of the information provided above about the context of the study and in
Chapter Two about relevant research, I can now provide more details on the design of the
proposed study and its rationale.
As stated in Chapter One, the ultimate goal of this study was to learn more about how
demonstrations could be designed so as to most effectively promote students’ engagement in
scientific inquiry. The choice of focusing on demonstrations as a potentially powerful
pedagogical tool to support student inquiry was motivated by the many research findings
documenting that science demonstrations can increase student interest and motivation to
learn more about a topic – and, thus, provide the catalyst for students to engage in authentic
inquiry. The choice of designing each demonstration around a discrepant event came from
recognizing that, as a discrepant event is likely to create cognitive conflict, it has not only the

38
potential to further increase students’ curiosity – and, thus, their willingness to engage in
inquiry – but could also provide the starting point for conceptual change. Finally,
recognizing that the effectiveness of science demonstrations could depend on specific design
elements, I was interested in exploring the implications of using the well-established POE
(Predict-Observe-Explain) model as well as introducing demonstrations in what appears to
the student to be a more “unplanned” way in response to their interests (what I have termed a
“naturally occurring event”- NOE).
To explore all of these variations, I planned an intervention involving all three
sections of the Physical Science course I taught in Fall 2009, where over the course of three
instructional units, students designed and executed an investigation around a specific topic
under three different scenarios: (a) the unit started with a discrepant event demonstration
including POE as a strategy; (b) the unit started with a demonstration, but using the NOE
model; (c) the unit started with the teacher introducing the topic and providing some
information and materials through an interactive lecture, but with no demonstration. Each of
the interventions designed for this study occurred after an initial unit where the students were
introduced to the process of scientific inquiry and where some classroom expectations and
practices related to scientific inquiry were developed.
The specific elements of this intervention as well as the data collection and analysis
procedures described in detail in the remaining sections of the chapter were designed so as to
enable me to address the following research questions using an action research approach:
1. How does a discrepant event demonstration using POE impact: (a) how students
design, conduct and interpret their own investigation to explain the event; and (b)
students’ interest in learning about the scientific phenomenon under study?

39
2. How does an NOE discrepant event demonstration impact: (a) how students design,
conduct and interpret their own investigation to explain the event; and (b) students’
interest in learning about the scientific phenomenon under study.
3. What are similarities and differences in (a) how students design, conduct and interpret
their own investigation around a scientific phenomenon; and (b) students’ interest in
learning about that scientific phenomenon in the following three scenarios: (i)
students develop their own investigation without a prior demonstration following an
interactive lecture, (ii) students develop their own investigation after a discrepant
event demonstration using POE, and (iii) students develop their own investigation
after an NOE demonstration using a discrepant event.
Before moving further with the detailed description of my plan for the intervention
and specific data collection tools, it will be helpful to further articulate what I mean by, and
how I decided to investigate “how students design, conduct and interpret their own
investigation” and “students’ interest in learning a topic,” respectively.
First, with respect to the first item, based on the research findings reported in Chapter
Two about effective science demonstrations as well as what effective student-directed
investigations should include, I was especially interested in examining the effects of using
discrepant events demonstrations, as well as a POE versus NOE design, on:
• The kinds of research questions the students generated as the possible starting point for
their scientific investigations, and how they came up with them; even more specifically, I
looked for:

40
1. Whether the numbers of research questions the students were able to generate
was influenced by whether or not they experienced a discrepant event
demonstration, and whether or not they engaged in explicit predictions.
2. Whether the content/quality of the research questions the students were able to
generate was influenced by whether or not they experienced a discrepant event
demonstration, and whether or not they engaged in explicit predictions. This
required rating the research questions generated by the students with respect to
(a) how “testable” or investigable the question was; (b) how central it was to
the concept studied in the unit or the potential to help students understand
some central aspects of the concept studied in the unit; and (c) the suitability of
the prediction (see Appendix C.2 for the rubrics I generated to systematically
evaluate each of these elements).
3. Whether the students perceived that it was easier to come up with research
questions when (a) they experienced a discrepant event demonstration, and (b)
engaged in explicit predictions, and if so why.
• The kinds of protocol/research design the students created for their scientific
investigations, and what affected their design decisions; even more specifically, I was
looking for:
1. Whether the content/quality of the protocol/research design the students were
able to create was influenced by whether or not they experienced a discrepant
event demonstration, and whether or not they engaged in explicit predictions;
this required rating the students’ protocols with respect to identification of
important dimensions including: (a) rigor; (b) level/attention of detail; (c)

41
appropriateness for investigating the research question chosen (see Appendix
C.3 for the rubrics I generated to systematically evaluate each of these
elements).
• The kinds of observations/data analysis the students engaged in as they implemented their
scientific investigations, and what affected them; even more specifically, I was looking
for:
1. Whether the content/quality of the students’ observations/data analysis was
influenced by whether or not they experienced a discrepant event
demonstration, and whether or not they engaged in explicit predictions; this
required rating the students’ observations/data analysis with respect to the
identification of important dimensions including: (a) centrality of data
collection to the research question; (b) data collection rigor; (c) detail of
observations (see Appendix C.4 for the rubrics I generated to systematically
evaluate each of these elements).
2. How students responded/reacted to what appears to be conflicting information.
• The kinds of conclusions the students reached at the end of their scientific investigations,
and what affected them; even more specifically, I was looking for:
1. Whether the content/quality of the conclusions the students reached at the end
of their investigation was influenced by whether or not they experienced a
discrepant event demonstration, and whether or not they engaged in explicit
predictions; this required rating the students’ conclusions with respect to the
identification of important dimensions including: (a) level of coherence; (b)
appropriate generalizations formed from the data; and (c) articulation of clear

42
understanding for the central concept in the unit (see Appendix C.5 for the
rubrics I generated to systematically evaluate each of these elements).
Although rubrics were developed for generalizations made by students in their
conclusions, time did not allow for a discussion of it in any of the classes involved in this
study. Therefore, I did not include an analysis of the findings with respect to generalizations.
With respect to “students’ interest in learning about the topic,” I was looking for
evidence in a number of different sources, including:
1. Individual students’ behavior in class activities indicating curiosity or interest -
as shown in their verbal participation in class discussion, level of sustained
attention in specific class activities, time committed to their investigation,
range of approaches attempted, making spontaneous guesses about the
discrepant event, wanting to try the demonstration themselves, wanting to
continue to investigate the discrepant event rather than move on to a new topic,
etc.
2. Individual students’ behavior outside of class time indicating curiosity or
interest- as shown by asking me questions about the phenomenon/topic after
class, doing some additional research on their own afterschool, talking about
the experience at home or with friends, spontaneously repeating the
demonstration with family or friends.
3. Individual students’ explicit reports about the curiosity or interest generated by
the discrepant event and/or investigations that follow.
3.6. Curricular Context

43
As previously noted, prior to the intervention all participating students engaged in an
initial inquiry experience, designed to establish common expectations and introduce a
number of practices that were used consistently throughout the intervention. In this initial
inquiry experience, students were asked to predict what would happen when a sugar cube
was dropped in a beaker of water. Each student was asked to record and report observations,
to identify a variable that could be investigated, and to develop a research question that could
be used to further investigate the observed phenomenon. With a partner, they conducted
their proposed investigations and developed conclusions from their lab experience.
This particular experience was chosen for its simplistic nature in an effort to allow
more focus on the process rather than the content. Since students encountered the same
format through each of the investigations conducted as part of the interventions, this initial
unit established their familiarity and comfort with these processes.
3.7. Detailed Plan for the Intervention
As explained in the previous section, the intervention was designed to provide the
opportunity for each of the three sections of the Physical Science course I taught to
experience three alternative design options to provide the catalyst for student-designed
scientific investigations: (i) students developed their own investigation without a prior
demonstration, following an interactive lecture (Lecture/Inquiry or L/I), (ii) students
developed their own investigation after a discrepant event demonstration using POE, and (iii)
students developed their own investigation after a “spontaneous” discrepant event
demonstration (NOE). More specifically, the intervention involved three different units, so
as to give each class an opportunity to experience and compare all three instructional designs;
and for each unit, a different instructional model was used in each class, so as to better

44
compare the effects of these different models on students’ interest and engagement in
inquiry.
Given the contents and instructional goals my district has associated to this course
(see curriculum map reported in Appendix A.1), I chose as the focus of the three units the
three scientific concepts and related discrepant event demonstrations reported in Table 3.1
below:
Table 3.1- Scientific concept and discrepant event demonstration to be implemented
Unit Key scientific concept
Discrepant event demonstration
#1 Density Floating/Sinking Pop Cans
#2 Molecular arrangement of a gas
Inverted cup
#3 Cohesion Drops on a penny
A description of the demonstrations at the core of each of the three units and the
materials required for the student inquiry that follows is provided below.
Unit 1 Demonstration
The “Floating/Sinking Pop Cans” demonstration was used to present the principle of
density. Two pop cans, regular Coke and Diet Coke, are placed into two separate large
beakers filled with water. The density of a substance is defined by g/cm3. The density of
water is 1.0 g/ml. Any substance with a density less than that will float, and more than that
will sink. The can of regular Coke sinks to the bottom of the beaker while the Diet Coke
floats at the surface of the water. The regular Coke contains more sugar than the Diet Coke
and, as a result, the mass of the regular Coke can is greater than the Diet Coke can. Since the

45
two cans are of equal volume, one can conclude that the regular Coke has a greater density
than the Diet Coke can. Furthermore, the Diet Coke can has a density less than water, and the
regular Coke has a density greater than water, causing it to sink in the beaker.
Materials required for the demonstration and available for the students’
investigations: Can of regular Coke, can of Diet Coke, water, 2- 4000 ml beakers; various
materials as requested by students to create density columns, including various size cups and
beakers, graduated cylinders, raisins, grapes, pennies, pebbles, uncooked pasta, and various
liquids including vegetable oil, syrup, honey, dishwashing liquid, food coloring, and solutes
such as sugar and salt.
Unit 2 Demonstration
The “Inverted Cup” demonstration was used to present the molecular arrangement of
gas particles. A paper towel is placed into a 1000 ml beaker, which is inverted and pushed
into a 4000 ml beaker filled with water. The inverted beaker is then lifted out of the water,
and the paper towel removed to show that it is still dry. This occurs because air occupies
space, and air and water cannot occupy the same space. As long as the cup is held straight
down, the air in the inverted cup is trapped and prevents water from entering.
Materials: 1000 ml beaker, 4000 ml beaker, water, paper towel; various sizes and
shapes of cups as requested by students, various materials requested by students, which may
include food coloring, test tubes, rubber stoppers, salt, sugar, sponges, etc.
Unit 3 Demonstration
The “Drops on a Penny” demonstration was used to present the principle of cohesion.
Water drops from an eyedropper are placed onto a penny, resting on a table. The drops are
continued to be placed one at a time, until the water spills off the coin and onto the table.

46
Typically, thirty to fifty drops of water can be placed onto the penny before any spills over
the edge. The charges within water molecules cause them to be attracted to each other. This
attractive force, called cohesion, causes the water molecules to form a large bubble on the
coin.
Materials: pennies, eyedroppers, water; various coins as requested by students,
various liquids as requested by students.
Each unit comprised of two 80 minute blocks, for a total of 160 minutes of
instruction. Within this time frame, each of the three class period experienced a different
instructional design for each of the three experiences, as summarized in Table 3.2 below:
Table 3.2- Format of the three instructional designs studied Class #1
(1st class of the day)- Period 1
Class #2 (2nd class of the day)- Period 3
Class #3 (3rd class of the day)- Period 8
Unit #1- Density POE demonstration + inquiry.
Lecture + Inquiry NOE demonstration + inquiry.
Unit #2- Molecular Arrangement of Gas
Lecture + Inquiry NOE demonstration + inquiry.
POE demonstration + inquiry.
Unit #3- Cohesion NOE demonstration + inquiry.
POE demonstration + inquiry.
Lecture + Inquiry
These are the major differences between the three alternative instructional designs:
1. In a Predict-Observe-Explain (POE) discrepant event demonstration, students are
introduced to an experimental scenario and are asked to predict what they think will
happen. Then the teacher conducts the experiment while the students observe and
record their observations. Students are then asked to discuss their initial predictions,

47
how they differ from the actual results, and to explain their reasoning behind their
predictions. The demonstration is pre-arranged and the students are aware of this.
2. In a “Naturally Occurring Experience” (NOE) presentation the demonstration does
not appear to the student to be pre-arranged. At the beginning of class, students have
the opportunity to observe an event that is either already set up in the classroom, or is
being inadvertently manipulated by the teacher, without focus being specifically
drawn to it. The intent is for the students to inquire about the physical scenario and
want to know more about it. Although the students are told that the materials are for
a different class, they can observe and experience the presentation and the ensuing
activity due to their interest in it. If students do not ask to engage in activities during
the NOE, I would ask if they are interested in pursuing it “because there is time”.
3. When no demonstration is scheduled, the class begins with an interactive lecture
involving an explanation and a definition of the concept under investigation, plus
class discussion where students are asked to make connections with prior life
experience- an approach I typically use in my classes when introducing a new
concept. In the remainder of the unit, the students engage in an investigation of their
own design on the concept under study, following the same design in all three
models.
Table 3.3, below, is a summary of the intervention:
Table 3.3- Daily agenda for each lesson design
Lesson Day of Unit POE NOE Lecture/Inquiry (L/I- no demo)

48
Day One: Period One (First 40 minutes of the block)
Students will predict, observe, and explain the demonstration.
Opening comments to class. Students observe discrepant event, discuss it and try to explain.
The scenario and the concept to be investigated are explained and discussed through an interactive lecture.
Day One: Period Two (Second 40 minutes of the block)
Students design their investigation. Students complete journal entry.
Students design their investigation. Students complete journal entry.
Students design their investigation. Students complete journal entry.
Day Two: Period One (First 40 minutes of the block)
Students conduct their investigations.
Students conduct their investigations.
Students conduct their investigations.
Day Two: Period Two (Second 40 minutes of the block)
Students discuss results with partners. Through class discussion, students share out results and defend conclusions. Class critiques. Students complete journal entry.
Students discuss results with partners. Through class discussion, students share out results and defend conclusions. Class critiques. Students complete journal entry.
Students discuss results with partners. Through class discussion, students share out results and defend conclusions. Class critiques. Students complete journal entry.
Final Class Reflection- one block (one time only after all three units have been completed)
Class discussion. Students complete final journal entry.
Class discussion. Students complete final journal entry.
Class discussion. Students complete final journal entry.
As noted in the table above, I intended to have the students share their results and
defend conclusions through a class discussion. However, due to a lack of time in this study,
this did not occur. After the last unit was completed, each of the three classes engaged in a
class discussion in which students reflected on and compared their experiences in each of the
three units (see Appendix B.2 for a list of guiding questions). They also completed a final
journal entry (using specific prompts from Appendix B.2).

49
The study occurred within the months of September to November, 2009. A detailed
lesson plan of Unit 1, including each variation within that unit, follows. A similar lesson
plan was also prepared for Unit 2 and Unit 3, but given the similarities among the three plans
I have chosen not to repeat them here, but rather to include them in Appendix A.2 and A.3,
respectively.
Detailed Plan for Unit 1
Unit 1 POE Demonstration Lesson
Day One: Period One
Students each have a laptop on their desks. Students are shown two large beakers of
water and two cans of pop, one regular Coke and one Diet Coke. Students are asked to
predict what will happen when the cans are individually placed into the separate beakers.
They individually make their predictions by typing it into their reflective journals, and are
asked to type an explanation, or justification, for their prediction (see Appendix B.1 for
specific prompts). Student volunteers are asked to verbally share their predictions with the
class. The teacher lists students’ predictions on easel paper in front of the class. Students are
then directed to observe the demonstration. The cans are placed into separate beakers.
Students are asked to list observations in their reflective journals. Students are asked the
following question:
How do you think it is possible that these pop cans reacted differently when placed in
water?
Day One: Period Two
Students type their answers to this question into their laptops. Students then pair up
with a classmate by freely selecting a playing card from a deck of cards, each with a students

50
name from the class written on it. The students name written on their randomly chosen card
is their assigned partner. They are asked to share and discuss their explanations of the
demonstration with their partner. They are given the opportunity to modify their answers and
explanations and to enter their new ideas into their journals. If students do not want to
change their initial explanation, they are instructed to type that response. Now groups are
asked to share their explanations with the class. If the group’s explanation is the same for
both partners, then one student presents the explanation. If their explanations differ, they are
asked to individually present their explanations. I record key words or phrases used in these
explanations on easel paper. Students once again are given the opportunity to modify their
answers and explanations and to type them. If students do not want to change their initial
explanation, they are instructed to type that response in their journal. Students are then asked
to individually type as many research questions as they can think of to investigate the
observed phenomenon and to identify any variables that they believe might affect the
outcome of the demonstration. Class discussion prompts include “what if…” and “I
wonder…” questions. The entire class is given the opportunity to engage in discussion of
these questions. I ask for student answers and from these responses a list of relevant
variables are generated that I record on easel paper. Partners then discuss the list of
variables, collaboratively choose one to investigate, and type a research question that their
investigation attempted to answer. Partners then list the materials they need, and determine
what information and data they need to collect in order to conduct their investigation. Each
group is asked to share with the large group the question they are trying to answer, the
variable they are investigating, and a list of necessary materials. Groups are asked to write a
procedure, or protocol, for their investigation and type it into their journal entry. Each

51
student individually types their predictions of the results of their designed investigations. My
role is to facilitate students in the planning and strategies necessary to conduct their inquiry,
and to help identify potentially impractical or problematic issues. Possible prompts include
whether the outcome is affected by using different liquids, colored liquids, different
containers, varying temperatures of liquids, various objects to place into the liquid, solutes
dissolved in the liquids, and volumes of liquids. Students complete a journal entry (see
Appendix B.1 for specific prompts). I gather any additional materials needed, based on
students questions, before class on day two.
Day Two: Period One
The class begins with a repeat of the demonstration in order to further stimulate
thought for the demonstration, as well as for those students who may have missed class on
the first day. (I actually did not follow up with this item in the intervention because of the
time required to address research question development from day one). Students then
conduct the investigation that they designed on day one.
Day Two: Period Two
Students record results and form conclusions of their investigations on individual
laptops. If time allows, groups present their results and defend their conclusions with the
class. Students are then asked to complete and submit a journal entry (see Appendix B.1 for
specific prompts).
Unit 1 NOE Demonstration Lesson
Day One: Period One
When students enter the classroom and take their seats, there are two 4000 ml beakers
filled with water on the desk at the front of the room. There is a pop can in each; one floating

52
and the other sinking. When attention is drawn to it, students are told that it is from an
experience in the previous class. If the students show interest in experiencing this lesson, I
agree to it. If the students did not ask to pursue this lesson, I ask them if they are interested
in doing it, since “we have time”. The goal is to eventually ask students the following
question regarding the observed phenomenon:
How do you think it is possible that these pop cans reacted differently when placed in
water?
Day One: Period Two
Students design an investigation, following a procedure similar to the one for the POE
unit. Students complete a journal entry (see Appendix B.1 for specific prompts). I gather
any additional materials needed, based on students questions, before class on day two.
Day Two: Period One
Same as POE.
Day Two: Period Two
Same as POE.
Unit 1 Lecture/Inquiry
Day One: Period One
When students enter the classroom, they each have a laptop at their desks. The lesson
follows my typical lecture format. I begin by informing students that the concept under
investigation is density, which is introduced with a definition of the concept, followed by
video and brief notes. The five minute video was an introduction to the concept of density,
involving illustrations of objects and representation of the molecular makeup that composes
their density. The notes are in the form of a PowerPoint presentation. They begin with a

53
picture of an iceberg. This is followed by a definition of density, the formula used to
calculate density, and the relationship of an objects density to their ability to float in water.
Students are asked to describe, through class discussion, any real-world examples or personal
experiences involving the concept of density. The class discussion is directed specifically
towards experiences and explanations involving various sized objects and their capacity to
sink or float in liquid. Students are told the objective is for them to develop their own
investigation in order to deepen their understanding of the concept of density. In particular,
students are asked to design an experiment to help explain how objects of various sizes are
capable of floating and sinking, and to use the class introduction, notes and discussion as a
foundation for their experiments.
Day One: Period Two
Students develop research questions, variables, and investigations similar to what was
done in the POE and NOE classes. Students complete a journal entry (see Appendix B.1 for
specific prompts). I gather any additional materials needed, based on students questions,
before class on day two.
Day Two: Period One
Students conduct the investigation that they developed on day one.
Day Two: Period Two
Students record results and form conclusions of their investigations on individual
laptops. If time allows, groups present their results and defend their conclusions with the
class. Students are then asked to complete and submit a journal entry (see Appendix B.1 for
specific prompts).
Final Class Reflection

54
Soon after the completion of all three units, students engaged in a culminating class
discussion in which they reflected on their experiences from each of the lessons. In the
second part of this class block students individually answered questions (see Appendix B.2)
by typing on individual laptops into a final journal entry. The class discussion and follow-up
journal entry focused on a comparison of the lesson designs employed. Since lesson
transcripts and observations only identified those students who expressed themselves in ways
that could only be seen or heard, the culminating journal entry allowed me to “hear” from all
students. The demonstration props from each unit were visibly displayed during this final
class for student recall and reference, and to refresh student’s memories of their experiences
in the three units.
3.8. Data Collection Plan
Throughout the intervention I collected the following complementary data in order to
address my research questions (as articulated earlier in section 3.5).
3.8.1 Classroom Transcripts (three units per class)
Each lesson, for each of the three units, was audio recorded to capture students’
engagement and reactions to the various demonstration designs. This included the
introduction of the demonstration, the class discussion following it, and the co-construction
of the inquiry question, but not the small group work.
3.8.2 Reflective Journals
Laptop computers were available for each student to type in entries in their reflective
journals. This work was saved to a designated folder, serving as artifacts to be used for later
analysis and reference. As described in the lesson plan, specific journal prompts were
provided at specific points of each lesson (see Appendix B.1 for specific prompts).

55
It is important to note that as well as a valuable data source, student responses written
in reflective journals were an integral part of the inquiry experience. The reflective journals
acted as opportunities for students to build their learning of investigative techniques, and of a
particular concept, as well as opportunities for students to develop the investigation itself in a
progressive, systematic way. Coupled with discussion, their journal responses provided
metacognitive opportunities for students to reflect on their own thought process. At the end
of the lesson, they helped students to reflect on how the lesson affected their understanding
and learning of science and the particular concept at hand. For the teacher, these reflective
journals offered formative assessment tools throughout the process and summative tools at
the end of each unit, as student reflections provided a comprehensive collection of
experiences.
3.8.3 Other Student Work
I collected all the other written work provided by the students in class, including
sketches and protocols/research designs that students had created and shared, and all chart
paper notes recorded during class discussions. As noted in Chapter 2, diagrams or sketches
that students created can be helpful models to clarify aspects of scientific explanations that
are not apparent when orally explained.
3.8.4 Teacher Log
At the end of each day of the intervention lessons, I wrote personal notes in a journal
as a way to record a “teacher’s perspective” on these experiences. These notes included
important decisions made in the planning and/or execution of these lessons, my observations
about students’ reactions to the experiences, suggestions for future presentations, and
anything else that seemed relevant to record, to ensure a systematic process. I had prepared

56
some guiding prompts (see Appendix B.4), which I answered as appropriate each time I
wrote in this log.
3.8.5 Observer’s Charts
In each unit, the initial demonstrations/lecture was also observed by a doctoral
candidate within my cohort, who for each class also completed the observation chart included
as Appendix B.3. Student’s non-verbal body movements are telling ways to identify
engagement and this observer helped recognize these indicators during the lesson, when I
was not able to do so because my attention needed to be focused on doing the demonstration
or lecture. Throughout the demonstration or lecture, the observer marked on the chart any
student who showed evidence of engagement/interest (as identified at the top of the chart
reported in Appendix B.3), so as to provide a qualitative and easily comparable measure of
students’ responses to the different instructional designs employed. The observer’s presence
at each of the demonstrations/lectures established a consistency that provided a richer
comparison of the three models.
3.8.6 Transcripts of Final Class Reflection
The final class reflection that took place in each of the three course sections was
audio-recorded and fully transcribed by me, using pseudonyms for each of the students (see
Appendix B.2 for the guiding questions I used to facilitate this discussion). Following this
class discussion, students completed a final journal entry.
3.8.7 Transcripts of Semi-Structured Interviews
Three students from each of the three course sections that I taught were selected and
invited to participate in an interview, which took place after school, following the final class
reflection (see Appendix B.5 for questions asked). These particular students were selected

57
because I thought their final class reflection comments were particularly thoughtful and
insightful. These interviews were fully transcribed, using pseudonyms.
3.9. Data Analysis
As typical in an action research study, analysis of the data was an ongoing process
that started as soon as the data was collected. On the first day of each unit, I examined and
rated the journal entry responses according to the rubrics I had developed (as reported in
Appendices C.2-3). These responses indicated to me how I would begin the second day of
the unit in each class. For example, in analyzing the student’s research questions written on
the first day of Unit 1 I noticed that more focus and direction was required in order for
potentially fruitful investigations to occur. I was able to identify particular difficulties that
students were having and was able to address them through class discussion. Similarly, I
examined and rated journal entries after day 2 using the rubrics reported in Appendices C.4
and C.5. Analysis and rating of conclusions and observations written in student journal
entries on day two of Unit 1 also allowed me to identify challenges that students were
having. These challenges were addressed at the beginning of day two in Unit 2. Finally,
after each unit I reviewed the notes from my daily teachers log and independent observer’s
charts and notes, which oftentimes provided insights that resulted in minor modifications in
the way I would address the class, or in the identification of activities that I would want to be
more attentive of in the following class.
Once the intervention was completed, I transcribed all audiotapes, including the final
class reflection, and individual student interviews. Transcriptions of classroom lessons, final
class reflection and student interviews were analyzed to address individual research
questions, following the procedures articulated in detail in Appendix C.1. I created Excel

58
spreadsheets in order to organize and further analyze the quantitative data (such as, my rating
of the quality of students’ research question, protocols, etc). Comparisons were continuously
made between the various data sources mentioned, both within and across each of the units.
Throughout this process, credibility was addressed through the triangulation of data
sources, including class audiotapes, final class reflection audio tapes, student interviews, my
researcher journal, the independent observer notes and charts, the notes recorded on easel
paper for each class, and students’ journal entry responses. In addition, a colleague scored
the journal entry responses from one class for one unit (representing approximately 11% of
the collected data from the study). This colleague was familiar with the material and the
developmental level of the students, and I discussed with her the interpretation of each of the
rubrics in Appendix C prior to her rating. The resulting rating scores were compared to my
rating scores for the same class and unit. Analysis of this data revealed that we had 88% of
agreement.

59
CHAPTER FOUR
FINDINGS
4.1 Introduction and overview
This chapter consists of three main sections. It begins with an account of how each of
the three instructional designs played out in the intervention, by presenting a detailed
narrative account of Unit 1 for each type of design (i.e., POE, NOE and L/I). These
accounts serve to ground the summary of findings that follow and act as a reference
throughout the discussion of these findings. The second section provides a presentation
of key findings specific to the three research questions informing this study. In the final
section, I discuss these findings and their main contributions.
4.2 Narrative account of how the three instructional designs played out
What follows is the detailed description of how Unit 1 played out in each of the three
scenarios- POE, Lecture/Inquiry, and NOE. It is important to note that the instructional
vignettes reported here are quite representative of what happened in the other three Units,
although the content was obviously different. It is also important to note that there was
only enough time for class discussion of conclusions for all three lesson designs in Unit
Three.
4.2.1 Students develop an investigation following a discrepant event using POE
Unit 1, Day 1
When students came into the classroom they were instructed to get a laptop from the
computer cart, take it to their desk and login. On this particular day it took twenty-one
minutes to begin the actual lesson, due to battery and login issues with the laptops.

60
I began this class by explaining to students that they will be asked to answer some
questions about a demonstration they will be observing, based on the next concept that we’ll
be studying. Students began to login to the journal entry. The first question, which asked
students to predict the outcome of the demonstration, was read together. I explained that
before actually doing the demonstration I would describe what will happen. I showed two
large beakers and two pop cans. I pointed out that one of the pop cans was regular soda and
the other was diet. Students were told that I would be filling the two beakers with water from
the sink and that I would place each of the cans into a separate beaker. I filled the beakers
with water in front of them. There were immediate questions asked. I did not wish to engage
in class discussion at this point, but these were legitimate questions that one might ask when
attempting to predict the outcome of this event.
Alicia: Are you filling those both with warm water?
Teacher: Why do you ask?
Alicia: Because maybe if it was warm or cold it might make a difference.
Zeke: Will there be the same amount of water in each beaker? (transcript,
9/29/10)
I answered these questions as I finished filling the beakers with water. With the
water-filled beakers in place on a demonstration table in front of the class, and the pop cans
at their sides, students were instructed to type what they thought would happen when the cans
were placed into the water. After one minute had elapsed, all predictions had been typed. A
student excitedly asked if predictions could be shared aloud to the class. I agreed to this and
presented this offer to anyone who wished to do so. Without hesitation, several hands were
raised and predictions were verbalized.

61
Carrie: Water will rise because the cans will take up space.
Alicia: The cans will float because it is a liquid inside a solid.
Zeke: The cans will sink because I saw it happen in a cooler at a picnic. (transcript,
9/29/09)
The cans were lowered into the water. The regular soda sank to the bottom of the
beaker and the diet soda floated at the top. Two students yelled out, “I was right”. Other
than this outburst, there were no visual indications of shock, surprise or excitement from
students. I instructed students to move onto the next question, which asked them to list the
important observations from the event. They were then told that the next question would ask
them to explain what they had seen. I added that they should “try to answer scientifically”,
that is using science as a means to explain their observations. Altogether, students spent five
minutes typing their observations and explanations. Fourteen minutes after the
demonstration began students had completed typing explanations into their journal entries. I
began to randomly assign each student to a partner, who they sat next to for the duration of
the class. The bell rang signifying the end of the first forty minute period.
The independent observer marked on his chart that 59% of the class exhibited
observable engagement (see Appendix D.13) during this first part of the class.
Students were then asked to individually answer the next question in their journal
entry, in which they rated their interest level in the phenomenon observed, on a scale of 1-5
(see Appendix B.1). Before answering the question we had a discussion about the meaning
of the word “phenomenon”, used in the journal entry question. With a 1 representing no
interest and a 5 representing the highest level of interest, the data shows 50% of the class
rated their interest in the 4-5 range (see Appendix D.14).

62
I now challenged students to design a research question intended to more deeply
investigate the observed demonstration.
Teacher: What kind of investigation do you think you could conduct that would help
you more deeply understand what is going on here (pointing to the demonstration with pop
cans still in the water). What kind of experiments could you do to help answer questions that
you might have about this? (again, pointing to the demonstration).
Sohan: What if there was Sprite in one beaker and Coke in the other?
Cassie: Would the same thing happen if you used bottles instead of cans?
Paul: What if we use hot water? (transcript, 9/29/09)
As questions were generated I wrote them down on easel paper hanging in front of the
classroom.
Teacher: These are great questions. You’ll notice that many of you are changing
things to test what happens here (pointing to the demonstration). Do you know what
you call that? What do you call the thing that you change in an experiment…
Jake: Variable! (transcript, 9/29/09)
This led to a definition and brief discussion of what a variable is and what qualifies it as an
appropriate variable, described as a feature that would have the potential to “productively”
lead to a deeper understanding of the observed phenomenon, or the concept, through
investigation.
Teacher: What are some other kinds of things that we could change to test the
outcome or the result of this? (transcript, 9/29/09)
Students did not seem to have difficulty coming up with variables. Several more were
shouted out as I listed them on easel paper. There was not a lot of prompting or leading for

63
variables in this class. A couple of inappropriate suggestions were made. For example,
Shana suggested using “a tissue and a washcloth”. This provided the opportunity for a brief
discussion on features that made these suggestions less than appropriate and how they could
be reworked into more scientifically appropriate choices.
A stream of appropriate variables was rapidly shouted out. The final list compiled on
easel paper included: different size beakers, container with a hole, containers with different
size holes, objects compared to those same objects in vials, salt water, sugar water, dropping
cans from different heights, different types of balls instead of cans, different brands of
pencils, and different size apples.
The entire discussion of research questions and variables took 22 minutes. I then
asked students to individually write as many research questions as possible to investigate the
observed phenomenon in the demonstration, specifically how objects float and sink in liquid.
Teacher: Okay, after having this discussion, now I want you to make a real research
question. Jot down as many as you can. You can use one of these on the board if you
came up with them, but I want you to try to use your imagination. Be creative. It
does not have to be anything that we’ve discussed. It can be about them, but try to
come up with something on your own. (transcript, 9/29/09)
In this unit, students spent four minutes typing research questions. While most
research questions proposed seemed productive, insofar as they could lead to doable and
valuable investigations, a few were not. Here are two examples of research questions
deemed inappropriate:
What will happen if you put a crumpled up piece of paper in very hot water
and then a crumpled up tissue in very cold water? (Journal Entry, 9/29/09)

64
How long can a chocolate cookie float compared to a chocolate chip cookie?
(Journal Entry, 9/29/09)
A complete list of the “productive” research questions developed and their related variable is
shown in Table 4.1 below:
Table 4.1- Complete list of research questions generated by Unit 1 POE students, and related variable. Research Question Variable
1. What if you change the temperature of the water?
Temperature of the liquid
2. What if you used different liquids instead of water?
Type of liquid used
3. Would the pop cans react the same way in salt water or sugar water?
4. What if you use juice boxes instead of cans?
Objects other than pop cans
5. What would happen if you open and then close the pop cans?
Pop cans which have been opened
6. What if you used expired soda? Expired soda
7. What would happen if you used a small can of Coke and a normal size can?
Size of pop cans
8. What would happen if you put both cans in the same water?
Number of beakers pop cans are put in
9. What if you put one can upside down and the other right side up?
Position of pop cans
10. What would grapes and olives do if they were the same weight?
Objects other than pop cans
11. What about different brands of pencils?
12. How would different sized popcorn kernels react?
13. How would an apple with and an apple without skin react?
14. How would a whole apple and an apple with a hole in the middle react?
15. What if you used different types of golf balls?

65
Students in this class spent fifteen minutes sharing their research questions with their
partner, choosing one to pursue, writing a procedure for the investigation and individually
predicting the outcome. The school bell signaled conclusion of the class.
All research questions each pair of students decided to investigate are reproduced in
Table 4.2 below, along with the predictions made by each student; the numbers in parenthesis
indicate the rating given to each research question with respect to rigor and centrality on a
scale of 1-5, and the rating given to each prediction with respect to prediction suitability (see
Appendix C.2 for the rubrics used). (Note: Student’s texts have been reproduced verbatim
from what they typed in their journal entries).
Table 4.2- Research questions and accompanying predictions developed by Unit1 POE students. Research Question Prediction 1. does macaroni float on bubles from a
mixture of corn syrup, warm water, wand soap soap.in a small beaker, we are going to see if the macaroni is heavy enough to go though the bubbles and the corn syrup or just bubbles. (3, 2)
1. the macaroni will go throgh the bubles but not the corn syrup, and water. (3)
2. will pasta float in a beaker of warm water, corn syrup, and soap?(3, 2)
2. That the macaroni will sink through the bubbles but not the corn syrup and water. (3)
3. howdo difrent objects densiteys compare in difrent dencitys of liquid (2, 1)
3. cirtan things will stop at certian liquids (1)
4. Which marble will float if I put one
marble in surger water, and the other in salt water?(4, 3)
4. I predict that the marble in the salt water will float and the marble in the surger water will sink.(3)
5. we are going to see if vegetable oil, corn
syrup, and a raw egg will float or sink in water. (4, 3)
5. That corn syrup will float in water because it's really thick and gooey I think that the oil might float and the egg will flot too (4)
6. what will sink and what will float, a 6. I think the raw egg will float in both of

66
beaker full of corn syrup, water, and sugar with a hard boiled egg dropped from a high distance, or a beaker full of corn syrup, water, and salt with a raw egg dropped from a low distance and then switch (4, 4)
the beakers and the hard boiled egg will always sink (3)
7. we think that light corn syrp will float the best out of tree containers: popcorn cenals, light corn syrup, and popcorn and cornsyrup. (2, 1)
7. i think that the light corn syrup will float the best (2)
8. Does the psta float more in sugar water or water mixed with vegetable oil? (3, 4)
8. The noodk will float and when the sugar goes in all of it will float to the top (1)
9. What is denser, a small beaker full of
corn oil, or a small beaker full of regular oil, and if you add sugar afterwards, will it make the lighter oil heavier? (2, 1)
9. I predict that the corn oil will e heavier at first, then when we add sugar to the veggie oil and it will become heavier (3)
10. Does the pasta float more in sugar water or water mixed with vegetable oil? (3, 4)
10. The oil wil float to the top and the pasta will float on the vegetable oil more than the sugar water. (3)
11. Does the pasta float more in sugar water
or water mixed with vegetable oil? (3, 4)
11. i predict that the pasta will not float in vegable water and will float in sugar water (3)
12. We are going to see if vegetable oil, corn
syrup, and one raw egg float or sink in water. (3, 4)
12. I think the corn syrup will sink because its thick and gooey I think the vegetable oil will float because its thick but not too thick I think the egg will sink because when i cook with eggs or boil them they sink in the water (4)
13. which one will sink, and which one will
float, a beaker full of corn syrup, water, and, sugar and a hard boiled egg dropped from a high distance, or a beaker full of corn syrup, water, and salt with a raw egg dropped from a low distance, and then switch (4, 3)
13. i think the raw egg will float because there is still air in the raw egg, the boiled egg has been bolied and lost some of the air. (4)
14. does the pasta float better in sugar water, or water mixed with vegitable oil. (4, 4)
14. the pasta will float equally well in both. (3)
15. What is denser, a small beaker full of 15. i predict that the lighter one with the

67
corn oil or a small beaker of regular oil and if u add sugar afterwards will it make the lighter oil heavier? (3, 4)
sugar will float longer than the one without the sugar. (1)
16. Which marble will float if I put one
marble in sugar water, and the other marble in salt water?(4, 3)
16. I think both marbles will sink because if it would float, the sugar or salt would hold the marbles but the marble is too heavy. (4)
(see Appendix D.17 and D.20 for the research questions POE students chose to investigate in
the other classes, along with their predictions)
Offered here are two examples of research questions deemed inappropriate.
What will happen if you put a crumpled up piece of paper in very hot water
and then a crumpled up tissue in very cold water? (Journal Entry, 9/29/09)
How long can a chocolate cookie float compared to a chocolate chip cookie?
(Journal Entry, 9/29/09)
Unit 1, Day 2
My preliminary review of the research questions developed on day one showed that
some were inappropriate, lacking a focus that would have led to any productive outcomes, or
had little promise of developing a deeper understanding of density.
In an effort to guide students towards successful and rewarding investigations, I
decided to speak to the class about why particular research questions might not have resulted
in productive experiments. For example, one group wanted to mix some pop together to “see
what would happen.” Other groups had research questions that were not rigorously stated,
for example:
“Two different types of juices” (Journal Entry, 9/29/09)
Others had written research questions that were well stated, but would not have led to
productive outcomes or rewarding learning experiences, for example:

68
“What would happen if you drop a cherry with no pit and dropped it into cherry coke
with a high distance and what would happen if you dropped a cherry with a pit into cherry
coke from a low distance?” (Journal Entry, 9/29/09)
A discussion of this nature is consistent with the degree and format of assistance and
guidance that I typically offer students during investigations. In a situation where I feel that
students need a more focused direction or that they are not pushing themselves to think
scientifically or are not seeing the potential of their investigation, I would first try to prompt
suggestions from the class in an effort to enhance the learning potential. If students are
unable to generate thoughtful ideas, I give suggestions so that the entire class could hear
them, in order to model the kind of thinking that we’re striving for. To remain consistent,
this was the approach that I used in each unit.
The lesson began as students sat with their partners from day one and logged into the
journal entry. Then I brought up the issue of “unproductive” research questions:
Teacher: In an experiment you need a focused question. A question is not when you
say you’re going to mix things together to “see what happens.” That is not a focused
question that tries to answer something specifically about floating or sinking. You
should be able to read your question aloud and everyone in this room should be able
to tell what you’re testing. (transcript, 10/1/09)
After reminding students that the objective of the investigation was to learn more about
density, I specifically focused the question on objects floating and sinking in a given liquid,
and how that related to density. Various materials, including those that were called for to
conduct the investigations students designed on day one (and recorded in their journals),
were prepared and laid out on a lab table. Students were asked to consider how they might

69
be able to use any of the materials to investigate the phenomenon observed during the
demonstration on day one. They were additionally told that they could keep their original
research question, or they could alter it if they felt they could design a research question with
the potential for a more rewarding outcome- that is, one that would help them learn more
about density, specifically how things float or sink in liquids and how that relates to their
density. I began to call off the materials available for their investigations.
Partners were given time to choose and discuss the research question they would
pursue. After four minutes, some partners had decided upon their research question. I asked
that one member of each partnered team announce their research question and intended
investigation aloud to the class.
This was done on the second day of each unit for every class, for a number of
reasons. First, it was meant to remind students of where they left off on day one of the unit,
and of their planned experiments as designed on day one. It also provided other students the
opportunity to ask questions that might strengthen planned investigations, and allowed for
extended creativity as some students modified their own planned investigations after
listening to the ideas of others. Finally, it provided me with an opportunity to question and
challenge each team in an effort to produce focused research questions with good potential
for learning to occur. It was important to me that planned experiments would appropriately
investigate the concept at hand. Once again, this is my standard practice whenever my
students engage in an investigation in the context of a particular curricular unit.
Teams spent eleven minutes describing and discussing their research questions and
planned investigations. The class bell rang to announce the end of the first period and the
investigations began. This class had a noticeable level of excitement. There were comments

70
such as “whoa” and “that’s cool” heard. Students were excited to describe their results to
me, and called me over to do so. Some groups walked around the classroom, interested to
see the results of other groups. As I was called to groups, I answered questions, guided
students where I thought it might be helpful, and tried to get a sense of students’ learning of
the key science ideas related to density in this case. Occasionally, I reminded students to
remain focused on their research question and to make careful observations.
Twenty-one minutes after beginning the investigations, the first group completed
their experiment. I continued to observe and talk to groups still engaged in their
investigations, as well as to those groups who had completed them. More groups completed
their investigations, began to clean up and complete their journal entry regarding their
conclusions (see Appendix B.1 for prompts). I made an announcement regarding
observations and conclusions to be written in their journal entries.
Teacher: your conclusion is where you’re going to talk about what you saw and
explain it. This is where you put everything together and show me that you
understand what happened. You can’t just say “this is what happened. I put an egg
in and it floated.” That’s an observation. Now, you’re going to say “I put an egg in
and it floated because… That’s my conclusion”. Whatever happened… you’re going
to use your observations to make a conclusion. (transcript, 10/1/09)
Thirty minutes after beginning them, every group had completed their investigation,
had cleaned up and was typing in their journal entries. The average amount of time spent on
this investigation was twenty-five minutes. After students submitted their responses they
logged off. There were some students who logged off only seconds before the bell rang to
end the class.

71
All conclusions inputted by the students are reported below, along with their rating
with respect to coherence and central concept articulation respectively (see Appendix C.5 for
rubrics used for this evaluation).
1. my conclution is that the macaroni has such a heavy desity that it sank through the
bubbles, corn syrup, and water.but it took longer to sink because the bubbles helped
it keep air in elbo, the air floats. (4, 3)
2. my comclusion is that the macarni does sink in the mixture but it takes a lot longer
than normal because the bubbles keep the air in it and keeps it steady. so it does sink
through the corn syrup and water but doesn't sink that fast in the bubbles (2, 1)
3. difrent liquids slaw stuf down (1, 1)
4. no matter what we filled the water with, salt or surger, the marbles sunk anyway. (1,
1)
5. when we did this project, we concluded that when the syrup was in the container it
floated but when when it wasn't it sunk, I think it's because of the air in the container.
the egg stuck to it and sunk so we conclude that the syrup sinks the egg sinks to and
the oil floats on top of the water (2, 1)
6. my conclusion is that the eggs sank because maybe they have the same dense. (2, 2)
7. that none of them float. (1, 1)
8. None of the pasta's floated so the pasta is more dence than the vegatable oil and the
sugar water. (3, 4)
9. I concluded that vegatable oil floats, even when things are added to it, because there
are things in it that causes it to float that outshine other masses. I also concluded that

72
corn oil is heavier because of how there are probably more chemicals than water,
causing it to be much closer to being a solid than the veggie oil. (2, 1)
10. Neither one of the pastas floated so the pasta is more dence than the vegetable oil and
the sugar water. (3, 4)
11. my conclusion is that both pieces of pasta did not float i think this happen becasue the
pasta is more dense then the water the vegable oil floated so that did not affect the
pasta and the sugar dissvoled and the water was still less dense than the water (3, 3)
12. When we did this project, we concluded that when the syrup was in the container it
floated but when it wasn't it sunk, I think it's because of the air in the container. The
egg sunk both times and some of the oil and syrup got stuck too it and sunk. So we
conlude that the syrup sinks, the egg sinks too, and the oil floats on the top of the
water. (2, 1)
13. my conclusion is that the eggs sank because they both probably have the same dense.
(2, 2)
14. neither floated. This is because the pasta is more dense than the water. the vegitable
oil floated so that did not affect the pasta, and te shugar dizzolved, and the water was
still less dense than the water. (3, 3)
15. I investegated that when we placed the sugar,salt and food colouring in the beaker
with the veggie oil it still floated. But when we only use corn oil in one of the beaker it
sank beacuse the corn oil is much heavier beacuse it contains alot of chemicals and
less water is added to it. So it concluded that the more things we added to the beaker
of veggie oil it floated.And adding noting to the corn oil it still remained heavier than
the other. (2, 1)

73
16. The marbles sink down even though theres some salt or sugar on water. (1, 1)
4.2.2 Students develop an investigation without a prior demonstration
Unit 1, Day 1
As the lesson began, there was a picture of an iceberg displayed on the Smart Board. It
was a depiction of the percentage of ice that is above and below water. I have always used
this picture as the first slide in a PowerPoint presentation to introduce the concept of density.
Once students were seated, the illustration immediately attracted the attention of one student,
acting as a discrepant event:
David: Can ice ever really sink, until it turns into the water and mixes into the water?
(transcript, Class Audio, 9/29/09)
This question engaged the class in a discussion that lasted three minutes, as students
called out answers to this question and raised others.
Craig: Does dry ice float?
Joyce: I think ice floats because it’s less dense than water, but if we made ice out of a
different kind of liquid, then maybe it could change.
Dillon: It depends on the size of the ice.
Solomon: You could put it in a liquid that was kind of creamy, like milk.
Helen: milk cubes (transcript, Class Audio, 9/29/09)
I pointed out that each of these questions was excellent and pertinent to the concept of
density, which we would be addressing. Students opened their notebooks and wrote down
the definition for density, shown on the next slide. I asked students to define volume, a word
used in the definition. This class had just completed a unit which included the concept of
volume, so this question was meant to connect the most recent lesson with the current one.

74
Responses from the students who volunteered to answer indicated an understanding for
volume. As the slides continued, students were asked whether they had ever heard the word
density used in their own lives. When one student recalled the phrase “dense forest” it led to
a brief discussion of what that meant, followed by an illustration I drew on the Smart Board
representing a dense forest filled with trees and, as a comparison, a forest which would not be
considered dense.
Students were asked whether they had any questions up to this point and responded by
affirming their understanding of density.
Marissa: so like the more stuff that is in there, the more dense it is? (transcript, Class
Audio, 9/29/09)
Recollections of 5th grade classroom experiences with density and other past personal
experiences (referenced to as PPE’s hereafter) helped students to confirm their understanding
using real life examples.
Rick: well when things freeze they get bigger, you know. And cold isn’t a substance, like
you can’t create it. So, that means the atoms expand, therefore making it less dense but
having more volume. (transcript, Class Audio, 9/29/09)
The inaccurate description of how “atoms expand” reflected that we had not yet
discussed atomic structure, but provided an opportunity to briefly preface the next unit. The
traditional lesson continued by showing the formula and units for density, which was written
into students notebooks. It concluded with the density of water and how an object’s density
relates to whether it sinks or floats in water.
Throughout these forty-one minutes of the lecture, students had raised questions
concerning density that had the potential to be investigated in the classroom. As these

75
questions arose, I wrote them down on easel paper hanging in front of the classroom. I now
referred to them as I challenged students to design a research question intended to more
deeply investigate density.
Teacher: You’re going to come up with an idea that you can use to study density.
Make a real question that you can use to study density. What kinds of experiments
could you do to study density and answer questions that you might have? Like
these… (pointing to easel paper).
Craig- Like how does temp affect the density of water?
Helen: I would use things different than water, because I like to try things I don’t
know. (transcript, Class Audio, 9/29/09)
This first response was taken from the short list of questions on the easel paper. The
second comment led to a definition and brief discussion of what a variable is and what
qualifies it as appropriate. I prompted students to think of the amount of water as a variable,
because they were having difficulty coming up with one. Additional prompting led to
suggestions to investigate the densities of various liquids, different pencils, pens and coins.
These were followed by a student who, still considering PPE’s, questioned why people float
in water. Students immediately shouted out their beliefs and experiences concerning this.
The discussion of variables continued when one student commented about people floating in
ocean water. Information presented earlier was referenced at this point.
Rick: when you said the density of water was 1, what kind of water were you talking
about? (transcript, Class Audio, 9/29/09)

76
This ability to use class notes as a tool for reference was an aspect of lecture style classes that
many students later pointed out was valuable to their learning experience, as discussed later
in this chapter.
The class discussion involved a great deal of prompting and leading in an effort to
help students develop appropriate research questions and variables that would gain deeper
insight into the concept of density. Although some excellent examples were developed, there
was a much tighter student focus on investigation of various substances simply to determine
their densities, including comparisons of grapes and raisins, and that of different coins. The
entire discussion of research questions and variables took 25 minutes. The final list compiled
on easel paper included: Can ice ever sink, is salt water a different density than regular water,
is hot or cold water more dense, distilled water compared to regular water, what happens to
density of water when oil is added, what is less dense than water, how does density of grapes,
raisins, or eggs compare in different liquids, does it matter if you use different size beakers,
is density affected by amount of water, do different brands of pencils have different densities,
and do different liquids have different densities (soda, OJ, and other liquids)?
Data analysis of the independent observer charts showed that 44% of the class
exhibited observable engagement (see Appendix D.13 for a list of identifiers) during this
lesson.
Students then opened the laptops at their desks and were instructed to log into their
journal entry. In question number one students rated their interest level in pursuing an
investigation of the concept. Before answering the question we had a discussion about the
meaning of the word “phenomenon”, a word used in the journal entry question, in a similar

77
manner as to what was done in the previous class (POE). The data shows 69% of the class
rated their interest in the 4-5 range (see Appendix D.14).
I asked students to individually write as many research questions as possible to
investigate the concept of density, specifically how objects float and sink in liquid. In this
unit students spent five minutes typing research questions. A complete list of the
“productive” research questions developed and their variables is shown in Table 4.3 below:
Table 4.3- Complete list of research questions generated by Unit 1 L/I students and related variables. Research Question Variable
1. If there was ice in the water, would it change the density of water?
Ice in water
2. Would ice cubes react differently than milk cubes?
Ice cubes made with different liquids
3. Would the size of an ice cube change the way it reacts in water?
Size of ice cube
4. Would the size of the ice cube matter to how it reacts?
5. Will ice sink faster in warm or cold water? Temperature of water
6. Does the temperature of the water affect the way objects react in it?
7. Does a hollowed ice cube react differently in water than a whole ice cube?
Hollowed ice cube
8. Which is more dense: water with ice in small or large beaker?
Size of beaker
9. Will ice sink faster in warm or cold water? Type of liquid
10. Does the amount of water affect its density?
Volume of liquid
11. Is salt water or sugar water denser? Densities of various substances
12. What substances are less dense than water?
13. Which is more dense: glass or plastic?
14. Which is more dense: copper or iron?
15. Can any metals float?

78
16. Which pencil lead is denser?
17. Would apple sauce and whole apples react differently?
18. Which is denser: grapes or raisins?
Students in this class now spent twelve minutes sharing their research questions with
their partner, choosing one to pursue, writing a procedure for the investigation and
individually predicting the outcome. The school bell signaled conclusion of the class.
All research questions students chose to investigate are reproduced in Table 4.4
below, along with the predictions made by each student; as done in the previous vignette, the
numbers in parenthesis indicate the rating given to each research question with respect to
rigor and centrality on a scale of 1-5, and the rating given to each prediction with respect to
prediction suitability (see Appendix C.2 for the rubrics used).
Table 4.4- Research questions and accompanying predictions developed by Unit1 L/I students, along with rating scores for rigor and centrality for research questions and suitability for predictions, out of a scale of 1-5. Research Question Prediction 1. We will test coper and metel in suger and
salt water. Keep on adding food colering,corn syupe and vestable oil. (1, 1)
1. I predict that both coper and metel will sink in suger and salt water, but mite flot with vestoble and corn syrupe added to the mixs. (2)
2. how whold a hard boiled egg float in suger water and salt water. (3, 5)
2. I think the egg might sink in the water with salt and the water with suger. (2)
3. How will a hard boiled egg be different if it is in salt water than in water with sugar? (4, 5)
3. I think that the salt or sugar might make one egg more absorbant to the food coloring than the other and maybe something will affect the shell as well, but I'm not really expecting that. (1)
4. is vegetable oil more dense than 4. i predict that the vegetable oil mixed with

79
vegetable oil mixed with food coloring?(1, 4)
food coloring would be more dense. (3)
5. test coper bibi and metle in suger and salt water and after we put food colering and corn syurp and vegtible oil. (1, 1)
5. i think that copper and metle are gana sink in suger and salt water but not in corn suyrp (2)
6. Which is denser, pennies or bebe bullets in corn syrup?(3, 5)
6. I predict that the bebe bullet will sink faster. (1)
7. which will sink or which one will foat one filled canister of sugar or a raw egg in regular water or in salt water?(3, 4)
7. I predict that the suar will float longer in the water. (1)
8. How will putting sugar and salt (in airtight vials) in different beakers of water affect the way they sink or float? What if we put them in the same beaker together? Does putting different liquids or sugar or salt in the water affect the way the vials of sugar and salt float?(4, 5)
8. I predict that the sugar will float and the salt will sink no matter what we mix into the water. (2)
9. fill a beacker with water and put one regular egg and one hard boiled egg.which egg is more or less dense. (3, 5)
9. i think that the egg will sink faster in the food coloring. (1)
10. which is denser, copper pennies or bebe bullets in corn syrup?(3, 5)
10. i think they both will sink, but the pellet faster (1)
11. What would a rubber stopper do in the water (sink or float) compared marble?(2, 5)
11. the marble will sink and the rubber stopper will float. (the marble is more dense) (4)
12. How will putting sugar and salt in different beakers affect the way they sink or float than when they were in the same beaker? Does putting different liquids or sugar or salt in the water affect the way the vials of sugar and salt float?(4, 5)
12. I predict that the vials might sink in the water, but they sink at different speeds (1)
13. we have two beakers filled with water, one hard boiled egg and one regular egg, which egg is more or less dense?(4, 5)
13. i predict that the hard boiled egg will sink because the other things in the beaker will fill it up and make it sink, it will fill like a sponge. (3)

80
14. Wich on will sink or float the raw egg than a filled canester of sugar in regular H2O or salt H20. (3, 3)
14. That the sugar container will float and the sugar will float in both. (1)
15. is vagable oil more or less dense with food coloring? we are going to have two beakers both with water we'll pour vegetable oil into one and vegalble oil with food coloring in the other and see which one flaots. (3, 5)
15. i predict that the vegable oil with food coloring will be more dense then the one without. (2)
16. What would happen if we put a marble in water? will it sink or float compared to a rubber stoppeer?(2, 5)
16. I predict the marble will sink and the rubber stopper will float.( The marble is more dense) (4)
Offered here are two examples of research questions deemed “unproductive” because they
could not be investigated using the necessary materials in our classroom laboratory:
Can humans sink when they are dead? (Journal Entry, 9/29/09)
Why do we float? (Journal Entry, 9/29/09)
Unit 1, Day 2
Similar to my experience with the POE class, my preliminary review of the research
questions developed on day one showed that many were “unproductive”, lacking a focus that
would have led to any productive outcomes, or had little promise of developing a deeper
understanding of density. As I had done for the other class, I spoke to this class about why
particular proposed investigations might not have been productive experiments. For
example, one group intended to put a lit match in a closed bottle and drop it in a beaker of
water to “see what would happen.” The discussion this class engaged in was consistent with
that experienced in the POE class.
As I had done in the other classes, various materials, including those that were called
for in the investigations designed on Day One, were prepared and laid out on a lab table. The
lesson began as students sat with their partners from day one and logged into their journal

81
entry. After reminding students that the objective of the investigation was to learn more
about density, I specifically focused the question on objects floating and sinking, and how
that relates to density.
Teacher: As I say the names of these objects I want you to think in your head “how
can I use these objects to do an experiment on density?” and in particular-
specifically- “how can I use these objects to test and experiment how things sink or
float?” (transcript, 10/1/09)
As in the other classes, students were told they could keep their original research
question, or alter it if they felt they could design a research question with the potential for a
more rewarding outcome. I called off the available supplies as I had done in the other
classes. Partners were given time to review and possibly modify their research question.
After 5 minutes, some partners had decided upon their research question. I asked that one
member of each team announce their research question and intended investigation aloud to
the class.
Teams spent nine minutes describing and discussing their research questions and
planned investigations. The investigations began. I noticed much less excitement than in the
earlier POE class (and also the NOE class that followed). Unlike my experiences in those
classes, there were no students excitedly calling me to share their observations or results.
There were no students excitedly looking at other student’s experiments. There was
definitely noticeably less energy. I walked around the class to observe, answer questions,
guide students where I thought it might be helpful, and tried to get a sense for any learning
that was occurring. Occasionally, I reminded students to remain focused on their research
question and to make careful observations.

82
Fourteen minutes after the investigations began, the first group completed their
experiment. I continued to observe and talk to groups still engaged in their investigations, as
well as to those groups who had completed them. More groups completed their
investigations, began to clean up and answer journal entry responses. As I had done in the
POE class, I made an announcement regarding observations and conclusions to be written in
their journal entries.
Twenty-nine minutes after beginning them, every group had completed their
investigation, had cleaned up and was typing in their journal entries. The average amount of
time spent on this investigation was twenty-two minutes. As students submitted their
responses, they logged off. There were some students who continued to logoff only seconds
before the bell rang to end the class.
All conclusions inputted by the students are reported below, along with their rating,
with respect to coherence and central concept articulation respectively (see Appendix C.5 for
rubrics used for this evaluation).
1. That nether the copper nor the metel floeted. (1, 1)
2. the salt water make the difference in if the egg floats or sinks becase the egg that was
in the suger water first sank to the bottom and the egg in the salt still floated (2, 1)
3. I figured out that salt and water will make a hard boiled egg float, but only a little bit
of the egg will be showing. Sugar didn't seem to affect the egg much, and I think that
salt also made the egg absorb more color. (2, 1)
4. my conclusion to the invesagation i conducted is that vegatble oil mixed with food
coloring is more dense than regular vegetable oilby a tiny bit (4, 4)
5. thore the copper bibi and the metle bolts sank (1, 1)

83
6. To never depend on the weigh by the size of the object because it is the density inside
the object that truly matters. (1, 5)
7. that the raw egg has more density then the sugar and the sugar has less density than
the egg so the egg sunk before the sugar (3, 4)
8. I conclude that salt and sugar are both less dense than water, sugar water, salt water,
and water with vegetable oil in it. I concluded this because we put vials of sugar and
salt in sugar water, salt water, and water with vegetable oil in it and no matter what
they both floated which means they are less dense than water. (4, 4)
9. when i put both hard boiled and regular in the water i sank so that tells me its bothe
eggs are more dense that water when i put the food coloring in it was still on the
bottom and when i put corn sirup in i was still on the bottom and when i put sugar in
so its still on the bottom so that showws that everything is less dense than an egg. (4,
4)
10. the penny and the bebe pellet were both denser than corn syrup, because they sank,
but the pellet was the most dense because it sank faster. (3, 4)
11. Both a marble and a rubber stopper are more dense than water because they both
sank in water. (3, 4)
12. Salt and sugar are less dense than water, water with salt, water with sugar, and
water with vegetable oil. (3, 4)
13. My hypothesis was wrong about the hard boiled egg floating, both the regular egg
and the hard boiled stayed at the bottom. even with all the things we added. (2, 1)
14. That the raw egg has more density than the sugar and the sugar has less density than
the egg so the egg sunk before the sugar. (3, 4)

84
15. my conclusion is that vegatble oil with food coloring is more dense than normal
vegatble oil. (3, 4)
16. Both the marble and the rubber stopper are more dense then water because they both
sank. (3, 4)
4.2.3 Students develop an investigation following a discrepant event using NOE
Unit 1, Day 1 As students entered the classroom there were two large beakers, with one soda can in
each, on a demonstration table in the front of the classroom, to the side of the room away
from the entrance; one can was floating and had sunk. Students did not have to pass by this
table on their way to be seated. Some students immediately drew attention to the cans as
they walked to their seats. The first comment was heard about thirty seconds after the first
students entered.
Aaron: look, see Diet Coke floats (transcript, 9/29/09)
At least 4 other students were heard talking about the display. I explained that the equipment
set up was “left over” from the previous class. Students were heard moaning in disapproval.
I began to wheel the display table as if I was putting it away in a storage room. One student
mentioned that the can looked big underwater. I responded that it was something they would
study next year and another student yelled out “that’s diffraction.” Another student yelled
out that he had done something similar in sixth grade at a different school he attended. I
asked if anyone else had ever seen it before. This immediately began an unrestrained fast-
paced discussion as students shouted out personal experiences and explanations. There did
not appear to be any systematic order to the conversation that ensued. Students were very
engaged and there was a great deal of observed excitement and energy.

85
Chad: I did this once before. [I saw it] in my coolers. My cousins showed me from
Florida. They explained it to me. It’s kind of cool.
Karen: (speech overlap) yeah, that’s what I was going to say!
Alicia: I saw this on that show Mythbusters! Yeah, but they tried to make it like least
cold and they put it in ice water like that (points to display). (transcript, Class Audio,
9/29/09)
A number of students were heard overlapping each other in speech, excitedly talking about
seeing the same show or having seen this phenomenon themselves. I had to ask students to
speak one at a time. More comments were shouted out.
Allen: is the reason that the regular Coke goes to the bottom is that the sugar adds
more density?
Teacher: are you guessing or have you seen this before?
Allen: I’m guessing. (transcript, Class Audio, 9/29/09)
This led into a five minute class discussion on density, as some students yelled out what they
thought density was, based on personal experiences.
Teacher: well, I wasn’t planning on doing this, but I like your answers and I want to
find more about what you guys know about this, cause some people are talking about
density and it actually does have something to do with density. I’d like to know a
little bit more about what you know about this. (transcript, Class Audio, 9/29/09)
Students nodded their heads in agreement and some exclaimed “yeah” or “sure!”
Teacher: has anyone ever seen density in their real life or can explain it? (transcript,
Class Audio, 9/29/09)

86
Students were heard verbalizing what they knew about density as well as positing questions
about it.
Karen: (explains how she floats while wearing a life preserver and her mother sinks
without one) so, if you’re wearing a life preserver, how does that make you less
dense?
Chad: cause it has so much air in it.
Cameron: it’s kinda like a balloon. If you put helium in a balloon it will float and if
you put air it will sink.
Bryan: when divers go into fresh water I think they can swim down and then rise up
on their own, but if they’re in salt water you have to swim up, but you fall down.
Teacher: anyone know the difference between salt water and fresh water? (transcript,
Class Audio, 9/29/09)
The steady commentary remained unrestrained and unorganized. A conversation ensued
regarding the differences between salt water and fresh water.
Data analysis of the independent observer charts showed that 62% of the class
exhibited observable engagement (see Appendix D.13).
Nine minutes after the discussion of the display began at the start of class, I asked
students to open their laptops and login to their journal entries. In question number one
students rated their interest level in pursuing an investigation of the displayed phenomenon.
Before answering the question we had a discussion about the meaning of the word
“phenomenon”, a word used in the journal entry question. The data show 32% of the class
rated their interest in the 4-5 range (see Appendix D.14 for comparative data in other units
and/or classes).

87
Students moved on to the next question, where they spent seven minutes typing
observations and an explanation. Thirty-six minutes into the class we began to discuss the
next objective.
Teacher: I want you to come up with questions where you can investigate anything
about what you see here… (transcript, Class Audio, 9/29/09)
I said this to the class to provide a general direction with the intent to follow up by discussing
variables, leading into a discussion about research questions. However, this class continued
to exhibit a great deal of spontaneous energy and began to shout out ideas for research
questions, bypassing the intended discussion of variables.
Alicia: 4 beakers/ 2 with warm water and 2 with cold water. Put diet in one of each
and reg coke in the other 2.
Teacher: so what would your question be? What are you investigating? What are
you trying to figure out… like I want to know if …what?
Alicia: does… [having difficulty explaining]
Chad: does the coke can rise in hot water?
Teacher: that’s one thing you could find, but what’s the big general question?
Aaron: does temperature affect density?
Teacher: perfect, those are the kinds of things I want you to think about. Do you
know what you call these things you’re talking about changing in the experiment?
Aaron: the variable (transcript, Class Audio, 9/29/09)
The bell rang to end the first period.
Teacher: good, now look at this [pointing to display]. Tell me what things you could
change to make a variable. (transcript, Class Audio, 9/29/09)

88
There were two variables shared aloud that were inappropriate because they could not
be investigated with the necessary equipment in our classroom laboratory. For example, one
student wanted to investigate whether the pop cans would float in melted chocolate. There
was a bit of prompting and leading, which appeared to be valuable to students as they rapidly
submitted many more appropriate variables which I wrote on easel paper. As it continued,
variables and research questions were both woven into the discussion. Throughout, I made it
a point to identify their appropriateness and their relationship. The final list compiled on
easel paper included: amount of H2O, temperature of H2O, placement of cans, different
liquids, and different objects.
After a total of twenty-two minutes spent discussing research questions, I asked
students to individually write as many research questions as possible to investigate the
observed phenomenon in the demonstrated display, specifically how objects float and sink in
liquid. In this unit, students spent five minutes typing research questions. A complete list of
the “productive” research questions developed and their variables is shown in Table 4.5
below:
Table 4.5- Complete list of research questions generated by Unit 1 NOE students and related variables. Research Question Variable
1. What would happen if you used different liquids?
Type of liquid in beaker
2. What would happen with salt and sugar water?
3. What if you poured the soda into the water? Would the cans still float?
4. What if you added baking soda to the water?
5. What happens if you change the amount of water?
Volume of liquid in beaker
6. What if you changed the temperature of the water?
Temperature of liquid

89
7. Do different colors of water (using food coloring) affect the results?
Color of liquid in beaker
8. What if you change the temperature of the soda?
Temperature of the soda
9. How would different types of soda react? Type of soda
10. What would happen if you mixed the two sodas?
Mixed soda
11. Would different types of wood float or sink?
Objects other than pop cans
12. Would it float or sink if something that floats was in something that sinks?
Partners were now chosen randomly and students in this class spent eighteen minutes
sharing their research questions with their partner, choosing one to pursue, writing a
procedure for the investigation and individually predicting the outcome. There were ten
minutes left in class and students spent that time announcing their chosen research question
to the class. As they did, their classmates asked occasional questions. The school bell
signaled conclusion of the class.
All research questions students chose to investigate are reproduced in Table 4.6
below, along with the predictions made by each student; the numbers in parenthesis indicate
the rating given to each research question with respect to rigor and centrality on a scale of 1-
5, and the rating given to each prediction with respect to prediction suitability (see Appendix
C.2 for the rubrics used).
Table 4.6- Research questions and accompanying predictions developed by Unit1 NOE students. Research Question Prediction 1. what would happen if two bottles one, all
the way filled with bb pellets and one filled half way with bb pellets, and dropped them into two beakers each filled with corn syrup, vegtible oil, and water.the beakers would have diffrent.Also what would happen to the liquads when we put them together in
1. I predict the container containing half bb pellets will sink faster because it holds less wait. (3)

90
same liquad. (5, 2) 2. There will be to beakers and in each
beaker there will be three layers. The first layer would be corn syrup. The secound layer would be vegtable oil.The third layer would be water. Before we mix the liquids we would color them to see how the different mixtures mix together. The next step we would do is drop a little bottel filled with bebes. In the other beaker we would drop a little bottle 1/2 full with bebes. We would see witch little bottle sinks faster. (4, 3)
2. I think the little bottle full with bebes will sink faster then the bottle half filled with bebes. Also I think the liquids will mix together and not be exactly 3 layers. (2)
3. we would fill 1 beaker with vegtable oil 1 with corn syrup and drop 1 hard boil egg in each and see if they float or sinks. (4, 5)
3. i predict that the egg in vegtable oil will sink and the egg in corn syrup will float (2)
4. bb gun pellots vs. sugar cubes in corn syrup. after that we'll change the liquids (5, 2)
4. i predict the sugar cubes will float and the bb pellots will sink (1)
5. in which will beebes and bolts float in better, 1 beaker with oil, 1 with water, and one with oil and water combined ?(4, 4)
5. the nuts and beebes will float in oil and water it will also float in oil, but it will not float in water(2)
6. If we fill one canister of ganulated sugar and fill another one with sugar cubes, will it sink or float? after that we will mix different liquids and see if it effects the results. (5, 4)
6. that the ganulated sugar will float and the sugar cues will sink. (1)
7. We would fill one beaker full of vegtable oil and one beaker full of corn syrup. Then we take two hot boiled eggs and drop one into oil and one into the syrup and see whitch floats and witch sinks. (4, 5)
7. I predict the egg in the vegtable oil will sink faster than the egg in corn syrup. (2)
8. The question we are going to ask is will it float or sink if their are 5 copper bbs in one canaster in corn syrup, and if it will
8. I think that the canaster with10 copper bbs will drop down to the bottom of the beaker. I think that tha canaster with 5

91
float or sink if their are 10 copper bbs in another canaster in corn syrup? (5, 5)
copper bbs will be covered with corn syrup but not go to the bottom of the beaker. (2)
9. first you take 2 raw eggs and 2 beakers,
then you put a amount of oil in the beaker then put the egg inside of it and you do the same thing with the corn syrup. then we will add water and food coloring then put it in the beakers. the question: will the egg float in the oil or the corn syrup. (4, 4)
9. i percit that the egg will float in the oil because when u add water to oil it floats and i think the egg will sink in the corn syrup cuse it thick (4)
10. Which floats beater in corn syrup, bb pellets or sugar cubes? Afterwards, is there any liquid that can change the outcome? (4, 5)
10. I predict neither will float and nothing will change the outcome. (2)
11. If you fill one cannister with granulated sugar and one with sugar cubes, will they sink or float? After that, we will try mixing diferent liquids together and see if it effects whether they sink or float. (5, 4)
11. I predict that both the granulated sugar and the sugar cubes will float. (2)
12. What happens if you have 3 beakers with water, oil and water with oil. And then drop the nuts and bolts and copper bullets into it. Which thing floats in which kind of liquid. (4, 4)
12. I predict that the stuff in the oil will float, the stuff in the water will sink. and in the mixture i thin k the nuts and bolts will float and i think the bullets will sink. (2)
13. The question we are going to ask is, will it float or sink if their if there are 5 cooper bbs in one canister in corn syrup, and 10 bbs in another canister with corrn syrup ??? (5, 5)
13. I predict that the canister with 10 bbs will drop faster because it has more weight inside. (3)
14. You take two beakers, and fill one with corn syrup, and the other with vegtable oil. Then we'll put one egg in each one. Which one will float?Then, we'll add water and food coloring to it. Then, which will float? (4, 4)
14. i predict that the egg in the vegtable oil will float. (1)
Offered here are two examples of research questions deemed inappropriate.

92
Sticks- do they float or not? (Journal Entry, 9/29/09)
Does a test tube float? (Journal Entry, 9/29/09)
Unit 1, Day 2
Similar to my experience with the POE and L/I class, my preliminary review of the
research questions developed on day one showed that many were “unproductive”, lacking a
focus that would have led to any insightful outcomes, or had little promise of developing a
deeper understanding of density. As I had done in the other classes, I spoke to this class
about why particular proposed investigations may not be productive experiments. For
example, one group intended to investigate whether a copper penny would float in water.
The discussion this class engaged in was similar to that experienced in the other classes.
As I had done in the POE class, various materials, including those that were called for
in the investigations designed on day one, were prepared and laid out on a lab table. The
lesson began as students sat with their partners from day one and logged into the journal
entry. After reminding students that the objective of the investigation was to learn more
about density, I specifically focused the question on objects floating and sinking, and how
that relates to density.
As in the other classes, students were told they could stick to their original research
question, or alter it if they felt they could design a research question with the potential for a
more rewarding outcome. I called off the available supplies as I had done in the other
classes. Partners were given time to review and possibly modify their research question.
After four minutes, some partners had decided upon their research question. I asked that one
member of each team announce their research question and intended investigation aloud to
the class.

93
Teams spent twelve minutes describing and discussing their research questions and
planned investigations. The class bell rang to announce the end of the first period just
moments before students finished this. The investigations began. As in the POE class, this
class displayed a heightened level of excitement. This was observed through student’s
enthusiastic comments, tone of voice and energetic physical behavior. Comments such as
“That is so sick!” and “Oh my god- watch this, come here- watch this!” were heard. Students
excitedly called me over to share their results and observations. As in the POE class, there
were groups anxiously looking at the results of other groups. As I was called to groups, I
answered questions, provided direction, and tried to get a sense for any learning that was
occurring. Occasionally, I reminded students to remain focused on their research question
and to make careful observations.
Seventeen minutes after beginning the investigations, the first group completed their
experiment. I continued to observe and talk to groups still engaged in their investigations, as
well as to those groups who had completed them. More groups completed their
investigations, began to clean up and answer journal entry responses. As I had done in the
POE and L/I class, I made an announcement regarding observations and conclusions to be
written in their journal entries.
Twenty-eight minutes after beginning them, every group had completed their
investigation, had cleaned up and was typing in their journal entries. The average amount of
time spent on this investigation was twenty-three minutes. After students submitted their
responses they logged off. The next ten minutes was spent completing journal entries. There
were some students who logged off only seconds before the bell rang to end the class.

94
All conclusions inputted by the students are reported below, along with their rating,
with respect to coherence and central concept articulation respectively (see Appendix C.5 for
rubrics used for this evaluation).
1. my conclusion is that even though the bottles contained diffrent amount of bb pellets
they both sunk to the bottom at the same time. the one that was full, turned to its side
because it had more weight than the container that only contained half the amount of
bb pellets. (1, 1)
2. My conclusion is that corn syrup has the most densaty then water then vegtable oil
and that is why when we put all the liquids togather the corn syrup stayed at the
bottom of the beaker and then the water stayed in between te corn surup and the
vegtable oil and the vegetable oil stayed at the top. Also when we put the little bottels
in 1 filed to the top with bebes and then other 1/2 filled with bebes, they bothe sinked
through the liquids at the same speed but the little bottel fully filled went on it side
because it had to much weight. (3, 4)
3. in conclusion the egg in the corn surp didn't sink because it is so thick and it couldn't
get throught it. The egg in the vegtable oil sunk because it is not as thick so it could
get through. (2, 1)
4. i under stand that the sugar cubes rose and the bb pellots sank (1, 1)
5. In conclusion nuts and beebes float in oil,water and oil and water. This is probably
because the nuts and beebes are less dense than the 3 liquids. (4, 3)
6. That wether it is loose or compacted, the sugar could float in water and in oil. The
sugar floated in both because in the oil there is more weight pushing it up and the
weight did not effect it in the water. (3, 1)

95
7. My prediction on the expirement is corect. The egg in the corn syrup did float while
the egg in the oil sank. I believe this is because the corn syrup is very thick and can
keep anegg afloat while the vegtale oil is less thick so it cant hold much density. (3, 2)
8. The heavier the object is, the deeper it will go i corn syrup. (2, 1)
9. my conclusion is that the oil and water sank the egg but the corn syurp and water
kept the egg up wich is totally diffrent from my prediction. the oil was not heavy so
the egg sank and the corn syurp was heavy so that what kept the egg up. (2, 1)
10. I think the sugar cube floated because there was also air, which is much less dence
than corn syrup. I think the bb pellets sank because it was much dencer than the corn
syrup. I think the liquids layerd because each liquid had different dencitys, so the less
dence floated on the dencer liquids. (4, 5)
11. I was right, both the granulated sugar and the sugar cubes floated in both water and
in water/vegetable oil. this happened because no matter what form it is in, sugar is
not very dense. (4, 3)
12. Oil is less dense than water. When there is no air bebe bullets dont float and when
there is air they do float.It is the same with nuts. (2, 2)
13. We concluded that the canister with 10 bbs sank faster than the canister with 5 bbs.
(1, 1)
14. My conclusion is that my prediction was wrong. I thought that the vegetable oil was
going to make the egg float, but it was actually the corn syrup.I think I know why the
corn syrup held the egg up because the corn syrup is very dense, and the molecules
are really tightly packed together, so it's more dense. The water with food coloring
stayed at the top when we poured it into the corn syrup. I think it happened because

96
it's so dense, nothing came come through. When we poured the water with the the
food coloring in the vegtable oil, it sank to the bottom, just like the egg. I think it's
because the vegtable oil is not as thick as the corn syrup, so it lets things go through
better. (5, 5)
The POE, NOE and L/I lessons within units Two and Three developed in similar
ways to the correspondent lesson design in Unit One, as depicted in the three previous
vignettes. For brevity, I chose not to include their detailed narrative account in the text of
this chapter, but rather I have included tables in Appendices D.17- D.22, that report on
the research questions, predictions, and conclusions that each student developed for their
investigation for each of the other six classes in the study, as well as table in Appendices
D.23- D.28 that report the entire range of research questions and variables generated by
each class in the same six lessons. These tables are intended to provide information
about student work to complement and inform the interpretation of the tables in
Appendices D.1- D.16, where instead I have reported the results of my evaluation of the
student work in each unit using the rubrics articulated in Appendices C.2- C.5.
4.3 Research Question One
In the next section I report findings pertinent to each research question, building on
the narrative accounts included in the previous section, as well as an analysis of quantitative
data based on the scoring of students’ journal entries and observer’s engagement charts – as
summarized in the various tables included in Appendix D and referred to as needed in what
follows, as well as other relevant qualitative data.

97
4.3.1 How does a discrepant event demonstration using POE impact how students design,
conduct and interpret their own investigation to explain the event?
To address this research question, I will first report on the extent to which the POE
lesson design impacted the nature and quality of the investigations students initiated and
conducted after a POE demonstration in each of the three classes.
This will be achieved by reporting on (a) the number and nature of the research
questions they generated across the three units when a POE design was utilized, (b) the rigor,
“centrality”, and “prediction suitability” of the research question each student chose to
investigate, (c) the quality of the protocols the students generated, (d) the nature of their
observations and data analysis, and (e) the “coherence” and “central concept articulation” of
the conclusions each student wrote.
In the effort to identify what design elements of the POE demonstration approach
affected students investigations, and how this occurred, I also examined qualitative data
collected through observations, teacher’s log, students’ journal entries, and transcripts of
final reflection and student follow-up interviews. Two main design elements characteristic
of POE emerged as important from this analysis- (a) the fact that the students were able to
observe the equipment actively being used in a POE demonstration, and (b) the initial
prediction-making component central to this design. In the final components of this section,
I will report on findings related to these two design elements and their impact on the
students’ investigations.
Number and nature of the research questions generated by the students.
As documented in Appendix D.1, and summarized in Table 4.7 below, POE students
generated, on average, between 1.4- 4.8 research questions.
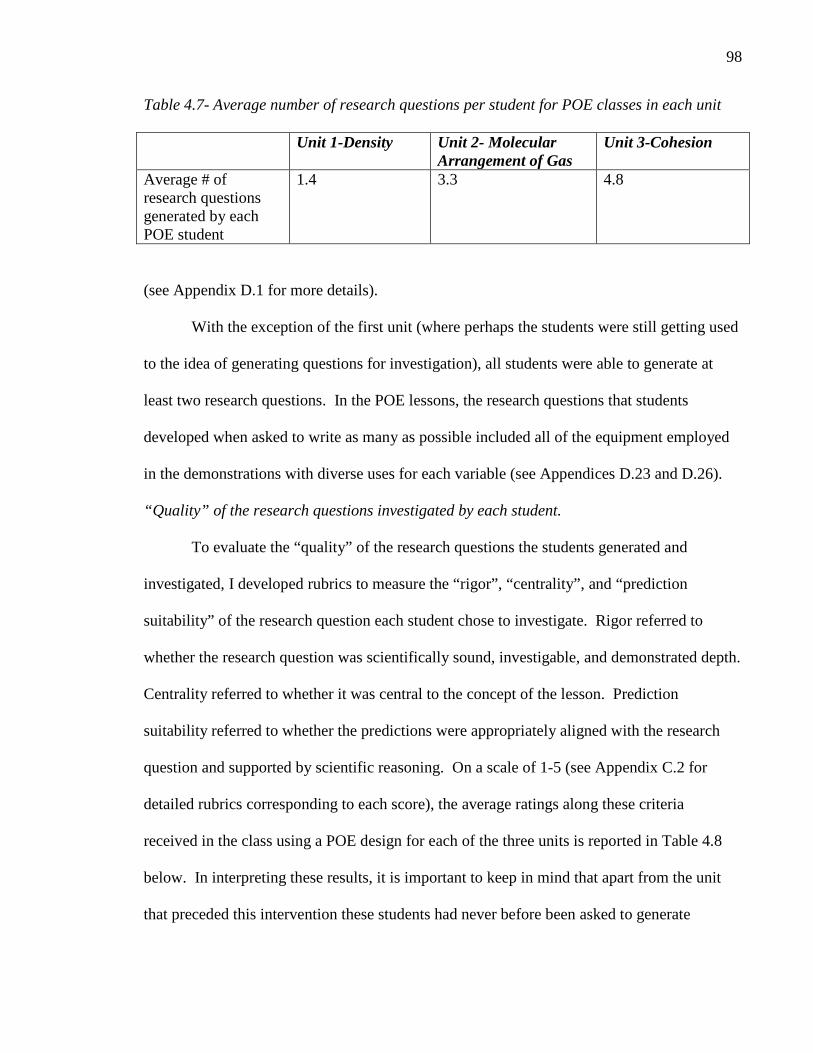
98
Table 4.7- Average number of research questions per student for POE classes in each unit
Unit 1-Density Unit 2- Molecular Arrangement of Gas
Unit 3-Cohesion
Average # of research questions generated by each POE student
1.4 3.3 4.8
(see Appendix D.1 for more details).
With the exception of the first unit (where perhaps the students were still getting used
to the idea of generating questions for investigation), all students were able to generate at
least two research questions. In the POE lessons, the research questions that students
developed when asked to write as many as possible included all of the equipment employed
in the demonstrations with diverse uses for each variable (see Appendices D.23 and D.26).
“Quality” of the research questions investigated by each student.
To evaluate the “quality” of the research questions the students generated and
investigated, I developed rubrics to measure the “rigor”, “centrality”, and “prediction
suitability” of the research question each student chose to investigate. Rigor referred to
whether the research question was scientifically sound, investigable, and demonstrated depth.
Centrality referred to whether it was central to the concept of the lesson. Prediction
suitability referred to whether the predictions were appropriately aligned with the research
question and supported by scientific reasoning. On a scale of 1-5 (see Appendix C.2 for
detailed rubrics corresponding to each score), the average ratings along these criteria
received in the class using a POE design for each of the three units is reported in Table 4.8
below. In interpreting these results, it is important to keep in mind that apart from the unit
that preceded this intervention these students had never before been asked to generate

99
research questions in my classroom. Therefore, I was considering a score of 2 or above as
acceptable for this stage of development. The rigor of the research questions was either
slightly above or slightly below a score of 3, which I considered acceptable for students who
are just beginning to learn to develop research questions.
Table 4.8- Average rating scores for research questions received in POE classes for each of the three units, out of a possible score of 5. POE Unit 1-
Density
POE Unit 2- Molecular Arrangement of Gas
POE Unit 3-
Cohesion
Rigor of chosen research question
3.1 2.5 3.6
Centrality of chosen research question
2.8 2.9 4.6
Prediction suitability of chosen research question
1.8 1.6 2.6
(see Appendices D.2-D.4 for a comparison of these ratings across units and classes).
Narrow focus of the physical demonstration in POE classes led to intensive
discussion of variables, in turn leading to rather rigorously developed research questions.
With respect to centrality, POE students made predictions, observations, explained their
observations, identified variables and developed research questions, all without a prior
detailed discussion of the focal scientific concept- which makes it difficult to develop
research questions that are central to the concept of the lesson. As a result, I considered the
scores for centrality, which were above or slightly below 3, to be appropriate. The low
prediction suitability ratings can be explained by the fact that the POE students did not
receive detailed instruction on the concept, as this would have helped them generate
predictions which were supported through a scientific understanding of the concept.

100
It is important to note that although the rating scores do show improvement in all
three categories from the first to the third units, the POE experience took place in a different
class for each unit. Therefore, the difference in the student composition of each class, as well
as the content of each unit might also have affected the varying rating scores between units.
Although research questions are unique to every lab situation and class, the skills involved in
their development are not. These skills are transferred from one lab experience to the next
and can be developed and honed through each experience.
“Quality” of the protocols the students generated
To evaluate the “quality” of the protocols students developed for their investigations,
I developed rubrics to measure their rigor, level of detail, and appropriateness to the research
question, on a scale of 1-5 (see Appendix C.3). The results of the data analysis showed that
the rating scores met my expectations for students who were just beginning to experience
development of their own protocols. The results, just below, or at, a level 3 rating were also
appropriate, showing that POE students were able to develop good research designs
following a demonstration, considering that there was not enough time in this study to
engage in a focused discussion on the development of protocols. Aside from these results,
the data did not reveal findings that would add much to the discussion of student-developed
investigations. As a result, I chose not to report on the quality of the protocols. The data that
emerged from POE student-developed protocols can be found in Appendices D.5- D.7.
“Quality” of student observations and data analysis
To evaluate the “quality” of the observations and data analysis reported by students
during their investigations, I developed rubrics to measure their “centrality”, or relevance to
the question under study, the rigor of the data collection, and the level of detail made in the

101
observations, on a scale of 1-5 (see Appendix C.4). Results met my expectations, as was
found in the data analysis for protocols, here also revealing rating scores just below, or at, a
level 3 rating, showing that POE students were able to develop good observations of an
investigation. As in the case of the protocols, there was not enough time in this study to
engage in a focused discussion on observations made during investigations. Once again,
aside from these results, the data did not reveal findings that would add much to the
discussion of student-developed investigations. As a result, I chose not to report on the
quality of the observations/data analysis developed by students. The data that emerged from
POE student-developed observations can be found in Appendices D.8- D.10.
“Quality” of the conclusions produced by each student.
To evaluate the “quality” of the conclusions the students reported as a result of their
self-generated and designed investigations, I developed rubrics to measure their coherence
and central concept articulation (see Appendix C.5). Coherence referred to whether results
and observations from the investigation were appropriately and strongly aligned with the
concept. Central concept articulation referred to whether there was a clearly addressed, deep
understanding of the concept in the conclusion. The average ratings along these criteria (on a
scale of 1-5) received in the class using a POE design for each of the three units is reported in
Table 4.9 below.
Table 4.9- Average rating scores received for conclusions developed in POE classes for each of the three units, out of a possible score of 1-5. POE Unit 1-
Density
POE Unit 2- Molecular Arrangement of Gas
POE Unit 3-
Cohesion
Coherence of conclusions
2.1 1.6 2.0
Central Concept Articulation in
1.9 1.9 1.2

102
conclusions
Once again, these low average rating scores are not surprising, given that the POE
students did not experience an explicit lesson that focused on the targeted concept. Unlike
the skills involved in writing research questions, coherence in conclusions will not show
development if the concept embedded in the lesson is not carefully examined. Since this
does not change with experience, the rating scores do not show improvement over time. The
same comments apply to central concept articulation, as indicated in the scores above.
As previously reported, although rubrics were developed for generalizations made by
students in their conclusions (see Appendix C.5), time did not allow for a focused discussion
of it any of the classes involved in this study. Therefore, I did not include an analysis of the
findings with respect to generalizations.
Effects of “seeing the phenomenon in action”
One of the most significant findings that emerged from the data in the units that used
a POE design was that by observing the equipment actively being used in a POE
demonstration, students were able to creatively imagine different ways in which it could be
handled and manipulated, leading to the development of variables, research questions, and
subsequent investigations. This perceived impact of a POE lesson design was explicitly
articulated by a number of students during the final class discussion, including Sohan who
stated that visibly observing a phenomenon taking place, rather than just talking about it,
gave him ideas for investigations that he could conduct. During the discussion, Morgan
supported this view.
Morgan: yeah, you could just change the variable from what you did to something
else.

103
Teacher: so by watching a demo it helped you to think of a variable?
Morgan: yes (transcript, Final Class Reflection, Period 1, 10/28/09)
Also during the final class reflection Zeke provided a specific example, describing
that when in Unit Three I shook the penny and made the water wiggle on top, it gave him
ideas like whether water would go up on a “spike” in the center of the coin.
Joel: we got to see you do it first and it gave us more ideas of how to do our own
experiment. (transcript, Final Class Reflection, Period 3, 10/28/09)
Students written comments in the final reflection following their journal entry,
collected from all three participating classes, confirmed that when students observed an
active demonstration it helped them to develop their own investigations. The percentage of
students who reported this in their journal entries was 59% in period 1, 47% in period 3, and
50% in period 8.
During interviews this also emerged as a theme among students, some who stated that
the “best learning experiences” during the study occurred from demonstrations.
Aaron: I had a better experiment [in POE] than in all my other [investigations].
Teacher: And why is that?
Aaron: Because the demonstration gave me a really good idea [for his
investigation]. (transcript, Participant Interview, 10/30/09)
The significance of actively observing the demonstration was further reinforced by
students who stated that the units which did not employ an active demonstrations could have
been more helpful to them had they observed the demonstration carried out. During her
interview, Morgan reported that if a demonstration was used in Unit 2 (when she instead

104
experienced L/I), it would have helped her to develop variables. Aaron also supported this
idea during an interview.
Aaron: I think for the density, actually doing the demonstration instead of having it
already set up would have helped.
Teacher: oh really, why is that?
Aaron: because when you see it already set up you can’t really see how it happened,
you just see that it happened. (transcript, Participant Interview, 10/30/09)
Twelve other students made similar statements, indicating that the demonstration helped
them better understand the concept.
Each POE class presented recognizable instances of students observing active
demonstrations which ultimately influenced their capacity to identify potential variables. For
example, in the POE vignette reported earlier, while filling two beakers with water, in
preparation for the density demonstration in Unit 1, one student questioned whether I was
filling them both with warm water. Before dropping the soda cans in, another student asked
if the water levels were exactly the same in each beaker. In another class, before pushing the
inverted beaker underwater in Unit 2, I was asked whether I would be pushing the beaker
down very carefully, or quickly. There was even additional evidence showing that a mistake
or accident occurring during a demonstration can promote a complex scope of question and
discussion concerning variables. In one class, while momentarily diverting my attention
from drops being put on the penny, the water accidentally spilled over the edge prematurely.
This incident resulted in nine to ten students excitedly shouting out potential variables that
may have caused the occurrence.
Effects of engaging in explicit predictions

105
Another theme that emerged from the data was that students perceived that making
predictions prior to a demonstration affected their investigations in a positive way. Although
not included as a journal prompt, students did comment on prediction-making. In their final
reflection journal entry, two students from the period 3 and the period 8 class commented
that prediction-making was valuable to them. Analysis of data from student interviews and
final class reflections provide some additional support that students felt prediction-making
was valuable to them. Interviews revealed students’ perception that prediction-making
helped them to learn by guessing and checking the results against their predictions. For
example, Amy’s prediction in Unit 1 (POE) was firmly and appropriately anchored to her
research question. She predicted that the diet Coke would float due to carbonation. She
gained affirmation for her prediction after observing the diet Coke floating. As a result, her
research question was to investigate the outcome after opening and closing the pop cans. She
explained how predicting and observing helped her:
Amy: Instead of seeing what happened, you guessed and like you learned something
from it, not just like here, here’s what happened. You actually learned from it.
(transcript, Participant Interview, 10/28/09)
From the same data source, Joyce agreed that making predictions helped her. She explained
further that making predictions prompted valuable thought for her.
Joyce: The more you get into an experiment [by making predictions] the more you
think about it before you start and the more you want to get into it, so like if you have
questions and if you have things you wonder about before you start then you’re going
to pay more attention and you’re going to think harder during the experiment.
(transcript, Participant Interview, 10/28/09)

106
In the final class reflection, Joyce acknowledged that making predictions “is a good
way to test yourself”. David strengthened this argument, adding that the POE demonstration
was a valuable tool to his own learning in the classroom, providing the following reasons:
David: As you were setting up I feel like I could answer some of my own questions.
I think if I answer my own questions I learn them better instead of somebody having
them just answer them for me. (transcript, final class reflection, Period 3, 10/28/09)
In sum, the POE lesson design seemed to be conducive to the generation of
worthwhile research questions and protocols, even for novice science students, although not
all of the investigations developed were equally valuable in terms of learning about the
concept under study. Furthermore, two main themes emerged with respect to how students
design, conduct and interpret an investigation following a lesson introduced with a POE
demonstration. First, when students observed the equipment actively being used in a POE
demonstration, it provided the opportunity to creatively imagine different ways in which it
could be handled and manipulated, leading to the development of variables, research
questions, and subsequent investigations. Second, prediction-making prior to a
demonstration was identified by students as a valuable tool toward their learning, providing
opportunities for them to be active, responsible participants in their own learning by
predicting and checking the observed results against their predictions.
4.3.2 How does a discrepant event demonstration using POE impact students’ interest in
learning about the scientific phenomenon under study?
I will begin by summarizing quantitative findings about the extent of students’
interest and engagement in POE demonstrations, as captured by the observer’s “engagement
charts” (see Appendix B.3 for a description of this data collection tool), and the students’

107
own rating of their interest and perceived value of the various units, collected first after each
demonstration, and then after the final reflection when the three units were compared (see
Appendices B.1 and B.2 for the prompts used to solicit this information). I will then discuss
how the explicit predictions made at the beginning of a POE lesson may have affected
students’ interest- as predictions emerged from my analysis of the qualitative data as a design
element that impacted student interest.
Quantitative measures of students’ interest and engagement.
Interest and engagement was identified by the independent observer during each
demonstration through signs, such as student focus exhibited in eye gaze, facial expression,
leaning in to observe the phenomenon, completion of others sentences, suppression of
distraction, and request for clarification (see Appendix B.3 for a complete list of observable
evidence of interest/engagement). A summary of these data is provided in Appendix D and
reproduced in Table 4.10 below showing a high level of engagement (around or above 50%
of the students) in all three POE experiences. Students were also asked to rate their interest,
at the beginning of each unit after predicting, observing, and explaining the demonstrated
phenomenon; using a scale of 1-5, (where 1 represents “not interested at all” and 5 represents
“very interested”- see Appendix B.1). As shown by the summary data reported in Table 4.10
below, students exhibited a high level of interest and engagement on the first day of all POE
units. This conclusion is further confirmed by qualitative data coming from audio tapes of
lessons, independent observer’s field notes, and my teacher’s log. Following their final
reflection, students were asked to rate their interest for the three design models. As seen in
Table 4.10, interest for POE Units One and Two was still rated high by the end of the
intervention, although there was a sizable drop in Unit 3.

108
Table 4.10- Observer’s chart results showing percent of student engagement in each unit and student rating for interest and value of POE experience in each unit, from a possible rating between 1 and 5. Unit 1-Density Unit 2- Molecular
Arrangement of Gas Unit 3-Cohesion
% of students showing engagement from observer’s charts for each POE unit
59% 50% 47%
Average of students’ interest rating given by each student right after the POE demonstration
3.4 4.1 4.0
Average of students’ interest rating in POE lesson given by each student after the final reflection
3.6 4.4 2.4
Average of students’ perceived value rating of POE lesson given by each student after the final reflection
3.5 3.9 2.3
Any differences between the ratings students gave right after the demonstration and
the ratings given after the final reflection, as indicated in Table 4.10, might indicate a
discrepancy between their “expectations” of the lesson versus the actual resulting experience.
The ratings show consistency for Unit 1 and 2, but not for Unit 3. In interpreting these
scores, it is important to note that it is unclear whether students rated their interest in the
phenomenon or the lesson design (POE, NOE, L/I). However, an examination of the three
interviews conducted with period three students (those who experienced POE in Unit 3) does
provide some insight. In her interview, Marissa referred specifically to the investigation and
said that Unit 3 was her least favorite because the investigation time was too short. In

109
contrast, Craig cited the lesson design in Unit 3 as contributing to its rating as the least
rewarding for him:
Craig: The third one [was the least rewarding], because it was good, but I
didn’t really get the science behind it. Even with the experiment I don’t feel
like I learned a ton.
Teacher: Can you pinpoint why you don’t think you learned a lot from the
third one?
Craig: Well, I just don’t think I was taught specifically on the… like how and
why the water kind of stacked and bubbled up like that.
And Joyce referenced her interest in the phenomenon being investigated:
Joyce: The third one [was the least interesting], because dropping water
wasn’t too exciting. You drop it on and yay, it’s done.
Each of the examples cited above indicate a different reason provided by students as
affecting their interest level in the POE lessons. While Marissa explained that time
influenced her interest rating, Craig identified the design format, namely the absence of a
lecture lesson specifically addressing the concept, as important to his rating of the POE
lesson, and Joyce said that the observed phenomenon caused her to rate the POE lesson as
her least interesting. This demonstrates the difficulty in determining whether students are
rating their interest for each unit in the phenomenon or the lesson design.
It is also interesting that the rating score for “value” in each POE lesson was very
similar to the rating score for “interest” following the final class reflection in each class,
possibly indicating that the level of perceived value for each lesson is influenced by the level
of interest upon completion of the unit.

110
Effect of making predictions
One of the most distinct features of a POE experience is the initial prediction-making.
My data suggest that such prediction-making influenced student engagement. Several
students commented during the final class reflection regarding prediction-making, and how it
influenced their personal classroom experience – as illustrated in the following exchange:
Dillon: It makes you more interested because you want to know if your prediction
will be right and you focus more (transcript, Final Class Reflection, Period 3,
10/28/09)
Craig: It makes you a little more curious about what the result is going to be and I
think that is a good attribute of any kind of scientist (transcript, Final Class
Reflection, Period 3, 10/28/09)
Joyce: [referring to the Unit using POE] Making a prediction would have definitely
caught our attention, like how many drops of water because it would have made us
interested in… [how close their prediction was to the actual number] (transcript, Final
Class Reflection, Period 3, 10/28/09)
These comments, when taken together with my own observations, suggest that when
students actively predicted the outcome of a demonstration prior to its presentation,
regardless of whether their prediction was accurate, student interest and curiosity in the
lesson and the concept was enhanced.
4.4 Research Question Two
4.4.1 How does an NOE discrepant event demonstration impact how students design,
conduct and interpret their own investigation to explain the event?

111
Parallel to what was done for research question one, I begin this section by
summarizing the most prominent results about the nature and quality of the investigations
designed and conducted by the students after an NOE demonstration, reporting specifically
on (a) the number and nature of the research questions they generated across the three units
when an NOE design was utilized, (b) the rigor, “centrality” and “prediction suitability” of
the research question each student chose to investigate in these situation, (c) the quality of the
protocols the students generated, (d) the nature of their observations and data analysis, and
(e) the “coherence” and “central concept articulation” of the conclusions each student wrote.
I will then document how the most characterizing element of the NOE design – the fact that
the demonstration appears more spontaneous and unplanned – impacted, if any, the students’
scientific investigations.
Number and nature of the research questions generated by the students.
As documented in Appendix D.1, and summarized in Table 4.11 below, all students
were able to generate at least two research questions in each unit.
Table 4.11 - Average number of research questions per student for NOE classes in each unit
Unit 1-Density Unit 2- Molecular Arrangement of Gas
Unit 3-Cohesion
Average # of research questions generated by each NOE student
2.3
4.8
4.4
(see Appendix D.1 for more details).
Except for in Unit 1, where students were beginning to learn how to develop research
questions, an average over 4 research questions per student in Units 2 and 3 seem quite
remarkable. The NOE research questions maintained a focus on the demonstration

112
equipment, with 94% of them identifying a piece of physical apparatus used in the
demonstration as a variable (see Appendix D.24 and D.27).
“Quality” of the research questions investigated by each student.
Once again, to evaluate the “quality” of the research questions the students generated
and investigated in the NOE intervention, I will report on the scores associated with the
“rigor”, “centrality”, and “prediction suitability” of the research question each student chose
to investigate, based on the rubrics reported in Appendix C.2 The average ratings along
these criteria (on a scale of 1-5) received in the class using an NOE design for each of the
three units is reported in Table 4.12 below:
Table 4.12- Rating scores for research questions developed in the NOE design in each unit
Unit 1-Density Unit 2- Molecular Arrangement of Gas
Unit 3-Cohesion
Rigor of chosen research question
4.4 3.7 3.1
Centrality of chosen research question
4.0 3.7 3.1
Prediction suitability of chosen research question
2.1 1.8 1.9
(see Appendix D.2-D.4 for a comparison of these ratings across units and classes).
Rigor and centrality ratings are quite high across the three units. Rating scores from
3-4 indicate a high level of achievement, especially for students who have not had a great
deal of experience developing research questions. The rigor and centrality ratings are also
quite consistent within each unit. As mentioned in the case of the POE classes, the physical
demonstration may have contributed to the development of rigorous research questions. The
high ratings with respect to centrality are especially remarkable, as NOE students observed
and explained phenomenon, identified variables and developed research questions, all

113
without a detailed discussion of the concept. This lack of direct and relevant background
information made it more difficult to develop research questions central to the concept of the
lesson. In contrast, the prediction suitability ratings are low, suggesting that regardless of the
units and class, students lacked the sophistication needed to apply scientific reasoning to their
prediction, especially without an explicit introduction to the concept. The difference in the
student composition of each class also could be reflective of the varying rating scores
between units.
“Quality” of the protocols the students generated
To evaluate the “quality” of the protocols students developed for their investigations,
I developed rubrics to measure their rigor, level of detail, and appropriateness to the research
question, on a scale of 1-5 (see Appendix C.3). The results of the data analysis showed that
the rating scores met my expectations for students who were just beginning to experience
development of their own protocols. The results, just below, or at, a level 3 rating were also
appropriate, showing that NOE students were able to develop good research designs
following a demonstration, considering that there was not enough time in this study to
engage in a focused discussion on the development of protocols. Aside from these results,
the data did not reveal findings that would add much to the discussion of student-developed
investigations. As a result, I chose not to report further on the quality of the protocols. The
data that emerged from NOE student-developed protocols can be found in Appendices D.5-
D.7.
“Quality” of student observations and data analysis
To evaluate the “quality” of the observations and data analysis reported by students
during their investigations, I developed rubrics to measure their “centrality”, or relevance to

114
the question under study, the rigor of the data collection, and the level of detail made in the
observations, on a scale of 1-5 (see Appendix C.4). As it was the case for the protocols,
results met my expectations, with rating scores just below, or at, a level 3 rating, showing
that NOE students were able to develop good observations of an investigation. As in the case
of the protocols, there was not enough time in this study to engage in a focused discussion on
observations made during investigations. Once again, aside from these results, the data did
not reveal findings that would add much to the discussion of student-developed
investigations. As a result, I chose not to report further on the quality of the
observations/data analysis developed by students. The data that emerged from NOE student-
developed observations can be found in Appendices D.8- D.10.
“Quality” of the conclusions produced by each student.
As in the case of POE, the “quality” of the conclusions the students achieved as a
result of their self-generated and designed investigations were evaluated using the rubrics I
developed to measure their coherence and central concept articulation (see Appendix C.5).
The average ratings along these criteria (on a scale of 1-5) received in the class engaged in an
NOE design for each of the three units is reported in Table 4.13 below; see Appendix D.11
and D.12 for more details.
Table 4.13- Average rating scores received for conclusions developed in NOE classes for each of the three units, out of a possible score of 1-5. Unit 1-Density Unit 2- Molecular
Arrangement of Gas Unit 3-Cohesion
Coherence of conclusions
2.6 1.5 1.8
Central concept articulation of conclusions
2.2 1.2 1.0

115
Once again, while these rating scores are low, they are not surprising, given that the
NOE students did not experience a lesson that focused on the targeted scientific concept.
The fact that these scores actually decreased over time suggested that they were influenced
by the content of the unit. And, unlike the skills involved in writing research questions,
students were not able to develop greater ability to achieve coherence in conclusions over
time, possibly because this ability requires a more explicit discussion of the concept, which
was not part of the NOE design in this intervention. The same rationale applies to central
concept articulation, as indicated in the scores above.
4.4.2 How does an NOE discrepant event demonstration impact students’ interest in learning
about the scientific phenomenon under study?
Once again, I will begin by summarizing the main quantitative results about the
students’ interest and engagement in NOE demonstrations, as captured by the observer’s
“engagement charts” (see Appendix B.3 for a description of this data collection tool), and the
students’ own rating of their interest and perceived value of the various units- collected first
at the end of each demonstration and then after the final reflection when the three units were
compared (see Appendices B.1 and B.2 for the prompts used to solicit this information). I
then document, using the previous data combined with other relevant qualitative data, how
some characterizing elements of the NOE design may have affected the previous results, in
particular spontaneity and surprise.
Quantitative measures of students’ interest and engagement.
The most prominent finding related to this question was the observable student
behavior showing a high level of curiosity and interest during NOE lessons. As seen in
Table 4.14 below, in these situations most of the students exhibited considerable overt

116
physical and verbal signs of enthusiasm and excitement for the lesson, such as making
spontaneous guesses about the discrepant event and expressing a desire to try the
demonstration themselves. Students’ rating of the units where they had experienced an NOE
design was also overall quite high, also illustrated by Table 4.14 below, and showed by the
change over time (i.e., the demonstration versus after the final reflection).
Table 4.14- Observer’s chart results showing percent of student engagement in each unit and student rating for interest and value of NOE experience in each unit, from a possible rating between 1 and 5. Unit 1-Density Unit 2- Molecular
Arrangement of Gas Unit 3-Cohesion
% of students showing engagement from observer’s charts
62%
56%
57%
Average of students’ interest rating given by each student right after the NOE demonstration
3.3
4.1
4.1
Average of students’ interest rating in the NOE lesson given by each student after the final reflection
3.2
4.5
4.1
Average of students’ perceived value rating of the NOE lesson given by each student after the final reflection
3.4
3.6
4.4
Any differences between the ratings students gave right after the demonstration and
the ratings given after the final reflection, as indicated in Table 4.14, might indicate a
discrepancy between their “expectations” of the lesson versus the actual resulting experience.
However, the interest ratings remained remarkably consistent for each unit. Once again, the
NOE student’s value ratings were also strikingly close to their interest ratings, possibly

117
indicating that the level of value for each lesson is influenced by the level of interest upon
completion of the unit.
These findings are further supported by qualitative data coming from audio tapes of
lessons, independent observer’s field notes, and my teacher’s log. As illustrated in the
previous vignette of the Unit 1 NOE lesson, student speech pattern in the NOE models was
typically enthusiastic and often overlapping. Although the class discussions were
unrestrained, they contributed to the development of the subsequent investigations.
Effect of characteristic elements of the NOE design: “surprise” and “spontaneity”
The spontaneity inherent in the NOE design seems to have impacted student interest
and engagement. The beginning of the NOE lesson format was not rigidly structured. This
informal design allowed for student engagement to naturally occur and develop. The use of a
discrepant event as the observed phenomenon prompted surprise, bewilderment and
curiosity, all of which encouraged interest and led to an inquiry investigation in a natural
way. Additionally, the informal beginning of the NOE lesson evoked some students’
curiosity, interest, and excitement in such a manner that it was clearly seen and heard by
others in the classroom, contributing to the ensuing discussion. The NOE design allowed for
emotion to be unbridled, animated and expressed in ways that could be shared with the entire
class. Discrepant events were essential components to this design, providing the stimulus for
student emotion. Students were seen and heard to express their wonder, confusion and
excitement, even commenting on personal experiences relating to the observed phenomenon.
Ultimately, this contributed to student motivation for pursuing an investigation in an effort to
explain the observed phenomenon, or questions relating to it.

118
For example, in Unit 3 (NOE) immediately after being seated, Zeke’s attention was
captured by the image projected on the Smart Board, a penny with a bubble of water on it.
Zeke: ooh, ooh, there’s a blob of water on that thing right there [pointing to
the projected image]… it’s sticking, the water’s staying there, it’s not running
off …. that’s so cool. I didn’t know water did that! .... what happens when
you poke it?
Bart: Why does that work on a small scale, but you couldn’t take like a giant
penny and pour tons of water on it, and it would stay, like a giant bubble? [he
is referring to a jumbo size coin that many of the students have seen used in
the Magic Club at school]
Teacher: that’s a great question, but have you tested that?
Bart: no
Teacher: how do you know you can’t, then? [he shrugs his shoulders]
Monisha: Let’s figure it out! [three other students yell out “yeah!”]
Paul: try it with a quarter!
Shana: let’s try it right now!
Teacher: These are great ideas! If you want to test these ideas… we can do
that if you want to? [several students respond “yes!” and “yeah!”]
Carrie: yay!
Sohan: I want to do it!
Wesley: Big penny first! (transcript, Class Audio, 10/22/09)

119
Following this discussion, of the 16 students in the class, four chose to investigate the
phenomenon using a coin other than a penny, four chose to use a jumbo coin, and two
wanted to poke the bubble in various ways to observe the outcome.
4.5 Research Question Three
4.5.1 What are similarities and differences in how students design, conduct and interpret
their own investigation in the three scenarios (POE, NOE, L/I)?
Similar to the structure used for the previous research questions, I begin this section
by comparing quantitative results across the three main design options considered (i.e., POE,
NOE and Lecture/Inquiry, or L/I) regarding (a) the number and nature of the research
questions the students were able to generate, (b) the rigor, “centrality” and “prediction
suitability” of the research question each student chose to investigate, and (c) the
“coherence” and “central concept articulation” of the conclusions each student wrote. I have
chosen not to report on protocols and observations/data analysis as the three lesson designs
did not seem to affect much the nature and quality of the component of the students’
investigations.
Consistent to the focus of this research question, in the tables that follow I will report
the averages across units when the same design was used (i.e., POE, NOE or L/I,
respectively). I will also identify elements that emerged from my analysis as possibly
affecting these results and comment on their impact. More specifically, I will report on the
significance of the placement of demonstrations within a lesson, the role of novelty, students’
perceived value of class discussion and note-taking, and the role played by students’ past
personal experiences.
Number and nature of the research questions generated by the students.

120
As documented in Appendix D.1, and summarized in Table 4.15 below, on average,
all students were able to generate at least one investigable research question in each lesson
design. On average, the number of questions was highest in the NOE scenario, followed by
POE, and finally L/I, although students in the Unit 3 POE lesson were able to generate more
research questions than students in the NOE lesson in the same unit (see Appendix D.1).
Table 4.15- Average number of research questions per student for all three classes, cumulatively, in each lesson design POE NOE Lecture/Inquiry
Average # of research questions generated by each student
3.2
3.9
1.3
(see Appendix D.1 for more details).
Although students developed variables and research questions in each model (i.e.,
POE, NOE and L/I), the analysis of the results reported in the previous vignette and in
Appendices D.23 - D.28 show some interesting differences. As the L/I students were not
exposed to any phenomenon demonstrated in the classroom, their variables and subsequent
investigations were not limited to the physical apparatus involved in any one demonstration,
as the POE and NOE student variables and research questions were. Instead, I noted through
class transcripts that the L/I students developed variables and research questions founded
mainly on past personal experiences explained in class discussion, as well as on picture and
video images observed in the lesson, as discussed below.
It is interesting to note that, across all three designs, observations of a phenomenon,
whether it occurred in the context of a demonstration, video, or even a picture, impacted
student’s inquiry by focusing their attention on particular aspects or variables, ultimately

121
influencing their research questions. In two of the L/I classes, 100% of the student-
developed research questions were founded on activities observed during the video shown as
part of the lecture (see Table 4.3 and Appendix D.28). For example, in her final class
reflection, Karen reported that she got the idea for her investigation of water beads on wax
paper in Unit 3 directly from seeing it in the class video, which showed a child rolling a bead
of water on a sheet of wax paper by tilting the paper. The L/I students in Unit 1 developed a
large number of research questions involving ice after observing a picture of an iceberg
floating on water I used at the beginning of my PowerPoint presentation. The L/I class was
the only class exposed to a visual image of an iceberg, which sparked discussion in class that
led to the development of research questions. There were no research questions regarding ice
developed by students in either the POE or NOE Unit 1 classes (see Tables 4.1 and 4.5).
Further support for this finding emerges from data for the Unit 2 L/I class, which was
shown a video that included an image of a child blowing up a balloon (while neither the POE
nor the NOE classes in Unit 2 were visually exposed to a balloon). It is noteworthy that 76%
of L/I students in Unit 2 investigated a research question involving a balloon, and 41% of the
students included at least one research question involving a balloon when writing as many
research questions as possible in journal entry question five. In contrast, none of the students
in the POE class developed research questions that involved a balloon. One of the NOE
students actually did bring up and briefly discuss the use of a balloon in class discussion,
which was noted in the students journal entry (as documented in Appendix D.24), although it
was the only one and no one actually followed through and conducted any investigation that
involved a balloon in that NOE class. A similar experience occurred in Unit 3. The L/I class
in that unit watched a video that included the image of a beaker that had been filled with

122
water over its rim, forming a reverse meniscus. Neither the POE nor NOE classes observed
this phenomenon in either video or live demonstration, although it was discussed in the NOE
class. Only the L/I class included research questions in their journal entries that were
concerned with this phenomenon (as documented in Appendices D.26- D.28). These
findings suggest that observations of phenomenon or equipment in use influences student’s
development of variables and research questions, regardless of the lesson design chosen.
This may help to explain an observation regarding the demonstration in Unit 3 (Water
Drops on a Penny), where students observed a demonstration in which water was dropped
onto a penny from an eyedropper. In this unit, 100% of NOE students and 75% of POE
students developed research questions directly involving a coin with liquid placed on top.
However, this only occurred with 14% of the L/I students. The phenomenon had been
brought up in the L/I class discussion, yet there was no visual observation of a coin and an
eyedropper. The POE and NOE students seemed to be rigidly aligned with the mental image
of the coin used in the demonstration, preventing them from developing investigations
utilizing materials and equipment that did not involve currency (as documented in
Appendices D.26- D.28).
Another experience in Unit 3 adds further support to this argument. One of the L/I
students verbally conceived a research question involving an overflow can, a piece of
equipment that had been previously used in a lab but had not been discussed in this unit. The
class was having difficulty understanding the student’s idea. My attempts to explain the
research question and describe a procedure for it were unsuccessful because students were
unable to develop a mental illustration of what this experiment would look like. I reached for
an overflow can and physically set it up in front of the class. This direct observation

123
triggered ideas for more research questions involving an overflow can. Several hands
promptly rose. Similarly, I think demonstrations trigger ideas simply through direct
observation. No other class developed research questions using an overflow can (as
documented in Appendices D.26- D.28).
Another example comes from Unit 2, in which a weight was used on top of the
inverted beaker to hold it in place during the NOE and POE demonstrations. Between the
two, there were more NOE students who explained in their journal entries that the weight
caused the paper to remain dry in the inverted beaker. Although the weight was also used in
the POE demonstration, it was only used to hold the beaker in place during the discussion
that followed. Initially, the beaker was put into the water and after a moment pulled out so
the paper could be inspected. Students in this group were not asked to explain the
phenomena until after the weight was put in place, so both groups actually did see the weight
before attempting to explain. The difference between the two observations seems to be that
POE students were able to directly observe the use of the weight, but the NOE students did
not have this advantage. The NOE students walked into the classroom and observed the
inverted beaker already in place with the weight on top. NOE students were basing
explanations on what they observed directly in front of them and since they were not seeing
equipment “in use” they were left to imagine in their own minds what its actual purpose
might be. As a result, 81% of the NOE students in Unit 2 developed research questions
involving the weight used on top of the beaker, compared to only 7% (1 out of 14 students in
the class) of the POE students developed a research question on this piece of equipment (as
documented in Appendices D.23 and D.24).

124
One final example comes from the Unit 1 research questions presented in the
vignettes earlier in this chapter. In this unit, and shown in the previous vignettes, 33% of the
research questions developed in the POE class involved variables using the pop cans,
compared to only 21% of research questions in the NOE class. I think this is because during
the Predict phase focus was directed to the pop cans through explicit discussion of them. The
NOE students saw the same materials, but their lesson did not include a detailed discussion
of the pop cans, resulting in far fewer research questions regarding them and a greater range
of questions for all observed materials.
“Quality” of the research questions investigated by each student.
To compare the “quality” of the research questions generated when using each design
I employed the same rubrics to measure the “rigor”, “centrality”, and “prediction suitability”
of the research questions chosen for investigation in each unit. As a reminder, “rigor”
referred to whether the research question was scientifically sound, investigable, and
demonstrated depth; “centrality” referred to whether it was central to the concept of the
lesson; and “prediction suitability” referred to whether the predictions were appropriately
aligned with the research question and supported by scientific reasoning. As a means of
comparison, on a scale of 1-5, the average ratings from all three lesson designs are reported
below, in Table 4.16.
Table 4.16- Average rating scores of research questions for all three classes, cumulatively, in each lesson design, out of a possible score between 1 and 5. POE NOE Lecture/Inquiry
Rigor of chosen research question
3.1 3.7 2.5
Centrality of chosen research question
3.4 3.6 3.3
Prediction suitability of chosen
2.0 1.9 2.2

125
research question
While the number of students involved is too small for the differences showed in all
of these tables to be statistically significant, it is interesting to note that POE and NOE
students scored higher than L/I students, with respect to rigor, with the NOE classes scoring
the highest. As mentioned earlier, this could be due to a more detailed discussion on research
question development in the POE and NOE classes. However, the L/I classes scored
somewhat higher with respect to prediction suitability, which could be explained by the fact
that they had experienced more in-depth lessons on the science concept than either POE or
NOE.
“Quality” of the conclusions produced by each student.
To evaluate the “quality” of the conclusions the students achieved as a result of their
self-generated and designed investigations, I employed the same rubrics to measure
coherence and central concept articulation, where “coherence” referred to whether results and
observations from the investigation were appropriately and strongly aligned with the concept
and “central concept articulation” referred to whether there was a clearly addressed, deep
understanding for the concept in the conclusion. As a means of comparison, Table 4.17
below reports the average ratings from all three lesson designs (on a scale of 1-5).
Table 4.17- Average rating scores of conclusions for all three classes, cumulatively, in each lesson design, out of a possible score between 1 and 5. POE NOE Lecture/Inquiry
Coherence of conclusions
1.9 1.9 2.4
Central Concept Articulation of conclusions
1.6
1.4 2.4

126
Closer examination of these data, journal entries in particular, revealed some
difference between lessons using demonstrations and those involving lecture/inquiry. Unlike
POE and NOE students, L/I students consistently attempted to use the concept of the lesson
to explain their observations in their conclusions (as documented Appendices D.19 and
D.22). Below are three examples from each of the L/I classes; one example from each unit:
Mandel: I obseved (sic) that when you mix food coloring in with the vegetable
oil drops of it sunk to the bottom. When it was just vegetable oil it all just
floated to the top. So that made the food coloring mixed with the vegetable
oil more dense than just the regular vegetable oil by itself. (journal entry, L/I
Unit 1, 10/1/09)
Bart: The small beaker with the sponge ball in it stayed completely empty, or
dry on the inside even when put totally underwater. This proves that air takes
up spce (sic) because it took up all the space in the beaker/test tube an didn’t
allow water to get in. (journal entry, L/I Unit 2, 10/16/09)
Chad: The water has more cohsion (sic) than the vegetable oil. I think this is
because that vegetable oil has more liquads (sic) in it than one. That would
effect (sic) cohesion because the molucles (sic) must attract to a different (sic)
molucle (sic). (journal entry, L/I Unit 3, 10/22/09)
Data summarizing the results showing the percentage of students who attempted to
explain observations and conclusions based on the concept in each lesson design for each
unit can be seen in Table 4.18, below. These data are derived from student conclusions
reported earlier in the descriptive vignettes, and from Appendices D.17- D.22.
Table 4.18- Average percentage of students using scientific concept in conclusions for all three classes, cumulatively, in each lesson design of each unit

127
POE NOE Lecture/Inquiry
Unit 1 (Density) 44% 50% 69%
Unit 2 (Molecular Arrangement of Gas)
23% 6% 50%
Unit 3 (Cohesion) 24% 7% 75%
These data first of all shows that the content of the lesson may affect the students’
ability to draw conclusions. The consistently higher results in L/I classes, however, also
suggest that the more detailed instruction of the science concept that the L/I classes
experienced in their lessons on the first day of each unit may have better equipped those
students to speak about the concept and identify observations based on the concept in their
conclusions.
Value of class discussions
The value of class discussion was volunteered in several student comments. In their
final reflection journal entries, six students reported value in class discussion from the period
1 class. This was also reported, in the same journal entries, by one person from each of the
other two classes. Discussion was reportedly an asset to the development of variables,
investigations, and research questions, as suggested by students’ comments in the final class
reflection, as well. Analysis of follow-up interviews revealed that class discussions were
valuable towards the development of student-designed investigations, regardless of whether
the approach was POE, NOE, or L/I:
Amy: We had a big discussion and I really understood… and that gave me ideas for
what to do for experiments. [Units could be improved] if we kind of talked more

128
about that topic that would give more ideas to do experiments on. (transcript,
Participant Interview, 10/28/09)
Amy continued to explain that class discussion was valuable to the development of variables
in particular. Craig recounted how a class discussion woven into a traditional lecture format
can benefit learning in the classroom, as it did in the Lecture/Inquiry (L/I) lesson he
experienced in Unit 1 (density).
Craig: the PowerPoint and all the notes were up on the board and it was easier to
understand in the discussion and kinda got our minds thinking for what we might do
for an experiment… and that was the easiest for me to learn. (transcript, Participant
Interview, 10/29/09)
Value of note-taking
Craig’s comment in the previous quote identifies note-taking as a positive feature of
the L/I approach. Morgan similarly recognized note-taking as a valuable strategy because it
“demanded attention.” Notes reportedly also served as a reference, providing detailed
information that could be reviewed out of class. Eleven students in the period 3 class
acknowledged in their final reflection journal entry that this was a key feature of their L/I
experience, making that particular unit their most rewarding learning experience. Comments
were also made during the final class reflection:
Rick: [Referring to Unit 1, where L/I was used, as his most rewarding learning
experience] because we wrote down a lot of notes and with Unit 2 or 3 if I forget
something I can’t look back at notes. (transcript, Final Class Reflection, Period 3,
10/28/09)

129
Katie: [Also referred to Unit 1, which was L/I for her class, as her most rewarding
learning experience] because we took notes and I could look back. (transcript, Final
Class Reflection, Period 3, 10/28/09)
Additional support came from follow-up interviews:
Craig: if we forgot anything then we could just turn back to our notes and we could
study off that for the test [emphasizing this could not be done in other units].
(transcript, Participant Interview, 10/29/09)
The impact of Craig’s learning experience in the classroom without the note-taking
experience became clear during his interview when he referred to Unit 3 (POE) and
explained that “it was good, but I didn’t really get the science behind it”. He added that it
would have been helpful had there been notes to explain the science behind the phenomena.
This was further indicated by Joyce’s comments.
Joyce: we had to like write it down as we were listening, so we had to listen, we had
to pay attention. [Referring to PowerPoint presentations], They are not the most
interesting, but it’s a good way to learn because you see it in writing and the notes can
be referred to later. (transcript, Participant Interview, 10/28/09)
Joyce also tied together the value of note-taking experiences with class discussion.
Joyce: you showed us like pictures and stuff and since there was just a lot to talk
about, I remember when we had the discussion in class we had a lot to say.
(transcript, Participant Interview, 10/28/09)
Role played by past personal experiences
In final class reflections, final reflection journal entries, and follow-up interviews
students reported that class discussion had helped them to recall past personal experiences

130
(PPE) as they related to the concept at hand, helping students connect their lives to the class
lesson. In the final class reflections, several students identified this connection as beneficial
to their conceptual understanding. For example, during a class discussion of air taking up
space, Bart recalled taking baths while playing with cups as a child. During the final class
reflection, he recounted that he was able to relate both Unit 2 and 3 to personal experiences.
The L/I lessons consistently generated greater numbers of PPE’s for students than did the
NOE and POE lessons. Students revealed through journal entries, interviews and final class
reflections that PPE’s helped them to understand the concept by making the lesson and the
concept more personally meaningful. In addition, analysis of the teacher’s log and class
audio revealed that PPE’s were used rather extensively by students. Every lesson in this
intervention involved PPE’s discussed by students. Based on transcripts of the class
discussion, I noted that in every unit, the classes engaged in the NOE design involved the
least number of different PPE’s (1-7), while the L/I classes involved the most (7-16). These
data come from transcripts of class audio. Data and observation also revealed that students
were using PPE’s to develop an understanding for the concept and as a communication tool
to elucidate the concept.
Zeke: [expressing his knowledge of the behavior of gas particles- Unit 2, L/I] well,
we use a smoke machine in our haunted house and when it comes out it kinda goes up
and out. They sort of start out compact and then they expand. (transcript, Class
Audio, 10/14/09)
Teacher: can someone tell me about any experiences in your life that you’ve ever
seen that can prove to you that gas takes up space or has volume?

131
Monisha: I was going to say if you’re boiling water and the pot is covered and you lift
it up and you see the steam coming up. (transcript, Class Audio, 10/14/09)
In another instance, Amy related her personal experience to another that Bart had spoken
about. Still confused, Morgan questions the experience. Jake attempts to help her
understand through another personal experience, which is followed by another description of
a personal experience by Amy who further tries to explain the concept to Morgan.
Amy: like an example of what Bart was talking about you know how in those pirate
movies where they like take a boat [three or four students yell out “oh, yeah” very
excited] and they like put it on top of their head and they walk underneath the water
and there’s still air trapped under there [One student excitedly yells out “like Pirates
of the Caribbean!”].
Morgan: wouldn’t it fill though because the water would come up?
Jake: [Referring to the “air bubble” trapped under the boat] The bubble won’t come
out. I once made a diving bell for an ant. [He recounts how he tied a rock to a film
canister with an ant inside, put it underwater in his pool and the ant stayed alive
because the air doesn’t escape]
Amy: Yeah, like when you’re underwater and you breathe out and that little bubble
comes out? It has to take up space, because it pushes the water away and makes that
little bubble. (transcript, Class Audio, 10/14/09)
Additionally, five other students reported in their final reflection journal entries that
PPE’s made the lesson more interesting and helped them to generate ideas used to develop
their investigations.

132
4.5.2 What are similarities and differences in students’ interest in learning about the
scientific phenomenon under study in the three scenarios (POE, NOE, L/I)?
According to the independent observer’s charts, students exhibited the highest level
of interest in the NOE lessons, closely followed by POE, as shown by the summary data
reported in Table 4.19 below and in Appendix D.13. However, student ratings for each
lesson design did not reveal a notable difference between POE and L/I , although students
consistently rated NOE higher when asked to “evaluate” interest and “value” of each unit
after the final reflection.
Table 4.19- Observer’s chart results showing percent of student engagement and student rating for interest and value for all three classes, cumulatively, in each lesson design of each unit, out of a possible rating between 1 and 5. POE NOE Lecture/Inquiry
% of students showing engagement from observer’s charts
52%
58%
31%
Average of students’ interest rating given be each student right after the demonstration/lecture
3.8
3.9
3.8
Average of students’ interest rating for each unit given by each student after the final reflection
3.4
4.0
3.4
Average of students’ perceived value rating given by each student after the final reflection
3.2
3.8
3.5
Data collected from student interviews and final class reflections revealed that
demonstrations enhanced interest and curiosity for the lesson and the concept, subsequently
cultivating student motivation to engage in investigative experiences:

133
Marissa: you actually do it and it makes me want to try it (transcript, Participant
Interview, 10/29/09)
Several students also indicated, through the final class reflection and in their final
journal entries, that they found demonstrations to “boost curiosity” and more “interesting”
than lecture lessons, notes, and PowerPoint presentations through their ability to “catch
everybody’s eye”. This curiosity seemed to furnish student motivation for the advancement
of their learning through their own investigations.
Cameron: As soon as you did it so many questions popped into my mind [referring to
the demonstrations]. (transcript, Final Class Reflection, Period 8, 10/28/09)
Marissa 8A: When you showed us the demo [referring to Unit 2, POE] a ton of
questions went through my head and I wanted to find out a bunch of things.
(transcript, Final Class Reflection, Period 8, 10/28/09)
There was also evidence in the findings that student interest generated by
demonstrations led to behavior out of the classroom that indicated continued interest and
self-directed engagement with the demonstration or the concept. Final reflection journal
entry analysis revealed that 27% of period 1, 53% of period 3 and 36% of period 8 students
tried or discussed the demonstration experience out of the classroom. I was unable to break
this down into POE and NOE demonstrations, because this was not always specified in the
journal entries. However, in each instance, the observed demonstrations were the focus of
the extracurricular experience, leading me to conclude that demonstrations lead students to
communicate their experiences out of class.
For example, as reported in my teacher’s log, Joel and Katie both recounted that
following Unit 1 they had made density columns at home to show their parents. Also from

134
the teacher’s log, Talicia described to me that she had done the penny demonstration from
Unit 3 at home to show her parents. She had taken a picture of it on her cell phone and
showed it to me. Finally, Bart was very excited to show the Unit 2 demonstration to another
student after school.
Value of novelty
With regards to POE and NOE, students reported that the most rewarding learning
experiences were gained from unfamiliar phenomenon, or phenomenon they had never
observed, and the least rewarding experiences resulted from concepts or phenomenon that
was familiar, already known, or had already been observed.
During an interview Aaron said that Unit 1 (NOE) was least rewarding for him
because he “already knew about it”. This was a feeling echoed by other students.
Marissa: [Unit 3- L/I- was the least rewarding learning experience because I] already
learned about it and so I already knew what would happen. (transcript, Participant
Interview, 10/29/09)
Additional students reported similar views during the final class reflection. Abriana
stated she liked Unit 3 because she had never seen the demonstrated phenomenon. Wesley,
Natalie, Monisha and Kaylee all shared this response. Shana liked Unit 2 because she had
seen a cup floating on water at home in her kitchen sink, but did not know that “if you put it
under water it would do that”. Talicia similarly liked Unit 2 because “it was something
different that I had never seen before”. Ian and Solomon did not like Unit 3 because he had
already seen the phenomenon before, on a rainy day. Alternately, Ahmed liked Unit 3
because he had never seen the phenomenon before. Several students ‘liked’ Unit 2 because
they had never experienced the observed phenomenon. Brett added that Unit 2 helped him

135
most because he had already seen the phenomenon in Unit 1 and 3 and he knew how they
worked, but Unit 2 was new and so he had questions. Alicia explained how past experiences
influenced her interest:
Alicia: (Unit 2- POE was her least rewarding experience because she had already)
seen it a lot. (As a result, she) knew what was going to happen. (transcript, Participant
Interview, 10/28/09)
Additional support comes from Aaron, who liked Unit 2 because he tried something
in his investigation that he never thought would work and, to his surprise, it did. He found
that if there’s a hole on the side of the cup, the water would stop at the hole. Alena liked the
demonstration in Unit 2 because she had seen it before, but didn’t think it could really
happen. She thought it was “fake”. Selma liked the demonstration in Unit 2 because she had
seen it once before but didn’t understand how the paper could remain dry, and “it was cool to
learn how”. Chad said that he had seen the Unit 3 demonstrated phenomenon in faucets, but
didn’t understand the phenomenon and thought that when cohesion was explained in the
lecture it helped him to understand. He added that having a personal experience of it was
more helpful than a demonstration. Morgan liked the Unit 3 demonstration, saying she had
seen this done before with water, but never with vegetable oil. She was surprised at the
outcome when vegetable oil was used in her investigation.
According to data collected in the final class reflection journal entries, 45% of period
1, 24% of period 3 and 57% of period 8 students felt less interested in a unit if they had “seen
it before” or more interested if they had “never seen it before”.
4.6 Discussion

136
In the next few sections, I will discuss the findings previously reported in this chapter,
so as to better address the overarching question informing this study, that is “how can
demonstrations be designed so as to most effectively promote students’ engagement in
scientific inquiry?” Using this previously reported data, along with other relevant qualitative
data, I will comment on the findings by providing some interpretations and summarizing
their implications for designing demonstrations that can motivate and support student-led
investigations. I will begin with a discussion of the observed differences, as reported earlier,
in student’s cognitive and behavioral engagement between POE and NOE designs, and offer
a possible explanation for such differences. I will then summarize and discuss the value of
novelty, the key role that observation of phenomenon “in action” can present to students
towards the development of their investigations, and the value of using a discrepant event as
the core of a demonstration. I will conclude with some observations about the role played by
the position of the demonstration within a lesson, before drawing some conclusion about
what I learned on how to design demonstration-based lessons conducive to students inquiry.
Comparing students’ observed engagement in POE and NOE
I have personally observed a striking difference in student reaction during the
observation of demonstrated phenomenon in POE and NOE lessons. Namely, the POE
students in the study have shown more suppressed reactions. For example, in the Unit 1 POE
the pop can demonstration produced far more subdued reaction than observed in the NOE
class. At first, I thought this perceived difference may be a difference in student’s interest
and excitement. However, I believe this difference may have resulted from students’
demeanor at the time of the demonstration, as they were involved and engaged in the lesson,
asking and answering questions in an attempt to better understand the lesson, and
137
thoughtfully observing the demonstration because they knew they were being asked to do so.
These were observations made by both myself and the independent observer during POE
lessons.
Students were intently focused on the presentation of the demonstration and the way
the equipment was handled, in anticipation of the outcome. Their focus was concentrated on
the demonstration, in part because of the significance that was attributed to it. The structure
of a POE format heightens the students’ sense of responsibility. In this setting, student
expectations rise, in contrast to the traditional demonstration model in which student
responsibility is minimal and entirely relinquished following its presentation. In a POE,
students are held to a higher level of accountability to question and learn from the observed
phenomenon through self-designed investigations and self-directed methods. This can result
in increased cognitive engagement by students. A demonstration presented in this format is
perceived as more significant because the entire lesson that follows will be based on it. The
experience becomes more critical and significant to the student. When a demonstration is
approached as the focal point of the lesson, it is collectively viewed as purposeful, and can be
a valuable strategy to launch into an investigation.
In the POE experience, when students were asked to predict the outcome to the
demonstration and to type this prediction in their journal entry, it established a more focused,
academic classroom atmosphere. Prior to its presentation, I had spoken to the POE students
about the significance of the demonstration to the lesson that would follow. The mindset of
these students was one of analysis, prediction, and expectation for what might occur. The
prediction phase heightened the significance of the lesson and seemed to establish focus and
evidence of cognitive engagement.

138
But, I do think some, or even many, of the students who appeared unemotional during
demonstrations were actually fully immersed in the situation, cognitively engaged and
motivated by interest. The idea is similar to the mental state referred to as “flow”.
Personally, I have experienced this phenomenon during the presentation of a magic trick,
when spectators are so mentally drawn into, and ultimately so perplexed from their
observations that they appear unemotional. Since they know they are about to experience a
magic trick, spectators cognitively engage themselves, anticipating startling phenomenon to
occur. It is only after they have a moment to process and consider the observed phenomenon
that they become animated and excited, trying to make sense of their observations. I believe
POE students were approaching the anticipated demonstration in the same way. They had
been cognitively drawn into, and engaged in, the event about to unfold because of the way I
had established its significance.
POE students may not have verbally said “wow”, but that is not an indication that
they were not thinking it. It may have been just as likely for a student to lean to his/her
partner and say “wow, check that out” in this structured format, than for that same student to
yell out “wow” in a less structured environment, such as an NOE lesson. For example, I
noticed that in one POE class there was a student who whispered to her partner, “I saw this
before, I saw this before”. But, she did not do it in a disappointing way, but rather an excited
way.
In contrast, the atmosphere of an NOE presentation is informal, unintentional, and
inadvertent. My personal observations through this study lead me to believe that it is
perceived by the student as such and that this perception affects engagement and learning
outcomes. Student demeanor during an NOE, especially at its outset, was displayed and

139
observed as unrestrained, unbridled engagement. Students were observed to be much more
vocally and physically engaged. Their excitement and energy was high, essentially resulting
from the approach; the perceived disposition and mindset of the teacher. This experience is
more student-centered than the teacher-centered POE experience.
In sum, I would conclude that both POE and NOE demonstrations involving
discrepant events are likely to trigger a high level of students’ engagement and interest,
although it may take different expressions.
The key role of observation of a phenomenon “in action”
This study has shown that observation of phenomenon influences student-developed
variables and research questions. As mentioned in Chapter Three, students in each of the L/I
lessons were exposed to either a picture or video in class, which influence the type of
variables and research questions they developed. It might be questioned whether images
such as these presented during a lecture provides an experience similar to an NOE. This was
a situation that was not recognized prior to this study. Although this is an issue which needs
to be further addressed, from my personal experiences I think there is a difference. An NOE
occurs “live”, in the observer’s physical space. An NOE always has physical artifacts in the
observer’s actual living space. Another distinctive characteristic of an NOE is that these
artifacts are accessible to the observers for their use. These seem to be the distinguishing
characteristics that make each of the L/I videos and pictures different from the NOE
demonstrations.
From my experiences in this study, I think that when students see an image, either in
a picture or video, that sparks their interest or curiosity, which in turn causes them to offer
some comment or question. Once that happens, a discussion ensues which settles the image

140
in more student minds. The image, no matter how quickly it might appear, is reinforced
through a series of events and develops into a focal point for some students. Data analysis
from this study has shown, however, that demonstrations in which the physical apparatus
shared the physical space of the observer, as in POE and NOE, had much more influence on
student-developed variables and research questions than observations made of pictures or
videos.
As mentioned earlier, POE and NOE students developed slightly more rigorous
research questions than L/I (see Appendix D.2). Although the difference is small, I believe
the observed increase in rigor occurs from something that happens during demonstrations
that cannot happen in a lecture. That is, direct observation and discussion of observed
phenomenon by POE and NOE students allowed for more thorough discussion of potential
variables, leading to more rigorous research questions. Greater focus on equipment in
demonstrations led to more discussion and generation of ideas for their application as
variables. Additionally, a lecture always took longer than demonstration, giving POE and
NOE student’s more time at the end of each lesson on day one that could be devoted to
research question development individually and with their partner.
Differing student experiences preceding the research question discussion could have
also contributed to the observed difference in rigor between POE/NOE and L/I classes.
Whereas the L/I lecture discussion focused on clarification of the science concept,
demonstration discussions centered on observed phenomenon. Narrow focus of the physical
demonstration in POE and NOE classes led to intensive discussion of variables, in turn
leading to more rigorously developed research questions.

141
In summary, I believe that a contributing factor that led POE and NOE students to
develop a more rigorous set of investigable research questions was the direct observation of a
tangible demonstration involving the concept of the lesson, the structure of the discussion
prior to their development, and the amount of time spent individually and with a partner on
their development.
The role of “novelty”
As stated earlier, students reported that the most rewarding learning experiences were
gained from unfamiliar phenomenon, or phenomenon they had never observed. This leads
me to believe that the most rewarding experience then would be to see the full demonstration,
as a POE, if it had never been seen or experienced before. Supporting this argument was
Morgan who said that Unit 3 (NOE) was the best learning experience because she did not
know about it and Unit 1 (POE) was the least rewarding learning experience because she
already knew about it and so it wasn’t that interesting. Although it may be important to see
the demonstration performed, it may actually be equally important, or more important, that
the experience is new or novel to the observer.
As I observed the NOE situations, I saw some very striking parallels to the art of
magic, which is something that I’m very familiar with. Magic promotes deep, sustained
inquiry. People who watch a magic trick will invest much time and deep thought to resolve
what they have seen. They will beg the magician to reveal the secret, or some part of it.
Perhaps, this is the “hook”. It is in the curiosity that builds from the magician’s insistence to
withhold an explanation. It may be this “tease”, this inability to explain a discrepant event
that generates and maintains such a high level of curiosity and need to know. Students
expect the “secret” to be divulged and thoroughly explained when they observe a scientific

142
phenomenon in the classroom. Perhaps, an NOE without any encouragement to initialize
investigation or explanation would be similar and produce deeper inquiry, curiosity, or
interest to investigate.

143
CHAPTER 5
ACTIONS RESULTING FROM THIS RESEARCH STUDY
5.1 Introduction and Overview
In chapter four, I answered the three research questions that informed this study. In
this chapter I will discuss the implications, influence, and impact of this action research
project as it relates to the participants, my practice as a science teacher, the other roles that I
engage in as an educator, and my colleagues.
I begin this chapter by presenting a discussion of how this study impacted the student
participants, as suggested from their personal reports and from my observations. The chapter
continues with a discussion of how my experiences from this study will influence my
practices as a science teacher, which will include considerations of curriculum and
pedagogical choices. The next section will address the implications that each of these
influences will have as they merge and impact my future students. This will be followed by
an examination of the influence of this study on my roles as mentor and department chair,
including a brief review of its impact on my colleagues. The chapter will conclude with a
discussion of future research that this study positions me to engage in, as I move forward into
the next phase of action research.
5.2 Impact on Participants
While I did not collect systematic data to support this claim, as a teacher I observed
that my students gained a deeper understanding of appropriate variables and research
questions as a result of this intervention. I noticed less explanation and direct teaching of
these process skills, while also noticing more student-developed variables and research
questions of an appropriate nature, as I continued teaching the course. While it was evident

144
that much more work was necessary in the classroom to continue cultivation of student
ability to recognize and develop appropriate variables and research questions, it was clear
that exposure and practice had fostered an environment that led students to acquire an
appreciation for the significance of well-developed research questions in the field of science.
Because less work was demanded of me for the development of variable and research
questions, I believe that student’s self-confidence increased in their own abilities to develop
them.
I also sensed that students gained a deeper appreciation for class discussion as it
impacts the development of their own scientific investigations. Discussion has continued to
be a feature in these classrooms for the rest of the school year as a method of engaging
students to share findings, and to collaboratively develop meaning from those findings. In
particular, I saw great value for students in using discussion as a tool to enhance pre-
investigative work. I believe that students recognized the value in sharing their proposed
investigative ideas and in discussing qualities that made each of those proposals more or less
scientifically appropriate, or “productive”.
I also feel that because of their participation in this study, through the multiple
opportunities they were given to reflect and comment on their experiences, my students
potentially gained some metacognitive skills with respect to their learning. There were a
number of comments and suggestions made by students in which they described their most
rewarding learning experiences and what elements made those experiences individually
rewarding. Students also suggested how some of their experiences could be made to be more
rewarding. There were even some suggestions as to how entire lessons should be structured
in order to make them the most valuable learning experiences. Because of these

145
metacognitive statements, I believe that students benefitted from learning more about how
they learn.
5.3 Impact on My Teaching Practice
My experiences from this study have influenced my delivery of instruction,
perspective of student acquisition of concepts, the ways in which I will organize and make
that acquisition more accessible to students, the instructional tools that aid student learning of
the concepts embedded in the science curriculum I teach, and the ways in which students can
better be equipped with those valuable tools.
In my previous classroom experiences, demonstrations have typically been placed
mid-lesson. Following my experiences in this study, as mentioned in Chapter Four, I have
concluded that demonstrations placed mid-lesson communicate the impression of a
“commercial” or an “ice-breaker”, while a POE or NOE demonstration placed at the outset of
the lesson can become the central focus of the lesson. Consistent with this realization, I plan
to use more demonstrations as the beginning and focal point of a unit, and the stimulus of
student-generated investigations.
This study has found that students perceive prediction-making to enhance their
engagement, and that prediction-making provides opportunity for students to be active,
responsible participants in their own learning. Lab inquiry following prediction-making is a
more valuable student experience than inquiry without. As a result, lab inquiry conducted in
my classroom in the future will be prefaced by student-derived predictions often.
As discussed in Chapter Four, observation of phenomenon “in action” influences
student-developed variables, research questions, and investigations. As a result, I plan to

146
incorporate diverse visual aids such as demonstrations, physical models, video, lab
equipment and supplies into lessons involving investigation through inquiry.
This study suggested rewarding benefits to L/I lessons. One of those benefits lies in
class discussion, where personal past experiences (PPE) are elicited and capitalized upon.
L/I class discussions led to many more PPE’s elicited in class discussion, which students
reported helped them to construct meaning of the concept. I believe that PPE’s can be
valuable tools towards conceptual understanding and reinforcement. As a result, I would
want to lead class discussions toward student recall and discussion of PPE’s involving the
concept. I would specifically ask students for any recollections of PPE’s in an effort to
prompt further discussion, engagement, and conceptual understanding, both in the context of
lecture-based and demonstration-based lessons.
In this study, POE and NOE students developed a greater number of investigable
research questions with a higher level of rigor. These findings have motivated me to institute
a new approach to my typical classroom practices. In my personal experiences, labs have
always been centered on individual distinct science concepts. Student expectations for
variable identification and research question writing skills were embedded within these labs.
Conducting lessons in this format have not provided the most advantageous opportunity for
students to successfully learn the tools and techniques for variable identification and research
question development, which I consider to be critical aspects towards the objective of
learning science through inquiry. In the past I think that I have been asking my students to
tackle too much at once, without the benefit of being able to attend to a more focused
objective, allowing them to hone critical skills before moving on in the curriculum. I think a
valuable approach would be one of scaffolding, in which students are allowed to focus on

147
variables and research questions first, perhaps in individual lessons. Once they have
achieved a certain level of understanding and accomplishment with their abilities to identify
variables and develop research questions, it would be entirely appropriate to engage in
lessons that focus on concepts. Students would have the skills necessary to more
appropriately conduct investigations.
Essentially, I am proposing to use POE/NOE demonstrations in the beginning of the
school year to teach variable identification and research question development. Development
of these skills would be followed by lab experiences centrally focused on individual science
concepts. These initial POE/NOE lessons would not be disconnected from important science
content. The lesson would foreground the content, while maintaining the skills of variable
and research question development as primary objectives. These proposed lessons would
concentrate on skill-building in the context of valuable important content.
One way to accomplish this objective is through lessons intended to review sixth
grade concepts or curriculum with students. Specifically, I would use a concept that was
taught in sixth grade, but I would extend this concept into an area unexplored at that grade
level. I could also present a discrepant event that would challenge their understanding of the
concept that they had learned in sixth grade, generating cognitive disequilibrium. In this
situation, students would be surprised by the unexpected outcome of the demonstration, yet
have enough of a foundation from sixth grade that will allow them to explore the concept
deeper. This idea will be successful in my current curriculum, since the first few weeks of the
school year is more focused on classroom/laboratory practices and introductions to science.
Transforming my curriculum and my practice in this way has the potential to greatly increase

148
the value of my student’s lab experiences throughout the school year, presenting richer
learning experiences with more rewarding learning outcomes.
Additionally, the purpose of demonstrations in my classroom will no longer be to
simply generate enthusiasm or interest. Furthermore, I will no longer approach
demonstrations as autonomous entities. In my future teaching, demonstrations will play an
integral role in the lesson. Rather than a supplemental or ancillary role, they will serve as a
focal point. Thoughtful and methodical implementation of demonstrations can be utilized to
establish investigative inquiry as meaningful academic experiences.
The POE lessons in each unit on day one generally had twice the amount of time
remaining at the end of class than did the NOE lessons. This situation might afford the
opportunity for a traditional classroom “lecture” experience in the same lesson, an experience
that some participants of this study claimed would be valuable to their learning. The lecture
format does not necessarily have to precede the inquiry investigation. It would be
informative to investigate a format in which the lecture follows the investigation.
Participants in this study expressed particular value in the note-taking experiences during
lecture lessons, so I would not want to lose this component. The format could be either
POE/NOE, lecture, investigation and note-taking, or POE/NOE, investigation, lecture and
note-taking.
If note-taking followed investigation, it would be a summative experience involving
student generalizations and claims based on their investigative data and experiences. Note-
taking would serve as a verification check for both student and teacher, as well as a way to
generalize and extend learning beyond the specifics of a particular demonstration or
investigation. Perhaps the class would begin with a benchmark lesson, involving a

149
demonstration and referencing general concepts without providing specific details, such as
formal scientific language. This would be followed by investigation and lecture, which
would involve more details as discovered during the inquiry investigation and referencing the
lecture preceding the investigation. An alternative would be a benchmark lesson in between
the demonstration and the inquiry investigation that guides students as they begin to
understand the concept at hand without explicitly being given too much information prior to
the investigation.
Finally, from my experiences in this study, I would want to extend each unit to 3-
eighty minute blocks, instead of the two used in this intervention. There was not enough
time in the two-block format to fully address some features of investigation that I felt were
critical for students to engage in. For example, I felt more time was necessary to reflect on
protocol design, observation/ data collection, and have a class discussion following
presentation of conclusions. One limiting factor to consider is that my curriculum may not
allow me to engage in very deep instruction on these characteristics in each unit, due to time.
However, if I engaged in very thorough instruction of these traits in the first few units, that
might provide the foundation for students in the POE/NOE experiences that follow. This
might allow me to spend less time on their explicit instruction in those follow-up
investigative experiences, affording more opportunity for these experiences in the
curriculum.
5.4 Other Actions Resulting From This Study
In my current role as science department chair, one of my responsibilities is to ensure
the department continues to challenge itself collaboratively and individually. One of our
primary objectives is continued professional growth. This study offers an opportunity for my

150
team to do that by sharing what I learned from this study and drawing implications for
improving our teaching practices.
In March, 2010 I met with two colleagues teaching seventh grade science. The
experiences that I shared generated great interest, since demonstrations are strong
components to our curriculum. There was specific interest in how these findings might affect
my practice in the next school year. After sharing my thoughts, we decided to continue
discussions of my study’s findings during available collegial planning times through the
remainder of the current school year. There was collective agreement to collaboratively
explore the impact of these findings through action research cycle efforts in our classrooms.
There was a consensus that these findings could inform our practices and influence student
learning. Through summer collaborative days we plan to structure an initiative for future
research, including suggestions for the translation of these findings into application in our
classrooms.
5.5 Future Action Research Plans
As previously mentioned, this study has already influenced my practice and
broadened my awareness for the learning experiences of my students, especially as it relates
to science demonstrations. As articulated in Chapter Three, action research involves multiple
cycles of observing, reflecting, planning and acting with the objective of improving practice.
As I position myself for the next steps of the action research cycle, my objective will
be to acquire deeper insights to the findings already generated and to expand these findings
beyond that which was possible with the data collected for this dissertation study. Other
modifications will be intended to examine classroom features and student outcomes that were

151
not within the scope of this investigation. These include studying the impact of the
intervention on student learning, as well as on student success in the course.
Some features I would like to personally explore in the near future are extensions of
findings or observations made during this study. For example, I would like to offer pictorial
illustrations as prediction choices in the POE design. These models would be based on
predictions made in this study, possible demonstration outcomes as choices that students
would then be asked to justify in their journal entry. I would also like to ask students to
identify and list potential variables before developing research questions. I think that doing
this might help them develop more rigorous, better defined research questions.
Another addition to the journal entries would be a question following each
investigation, asking students how valuable they felt the experience was, and what made it
valuable. This would allow me to identify specific components or characteristics of each
investigation that students felt were most rewarding to their learning. Students did respond
to a similar question in this study, but it was in the final class reflection journal entry, where
the focus was more on comparing all three designs.
I would also like to more deeply explore the observed differences in student reactions
between this study and past classroom experiences. For example, I think student reaction to
the demonstration in NOE Unit 1 would have been more enthusiastic had I inadvertently
dropped the soda cans into the water and then pushed the cart aside as the students looked on.
I would like to do this and compare the results. With this same demonstration I would also
like to lower one pop can in the water after predictions are made and then follow that by
seemingly “finding” another can and asking what will happen as I’m dropping it in. I think
this may create potential for greater reaction as some students may not initially recognize the

152
difference in the two cans. I would not point this difference out, as I had done in this study.
I think that many students would think that all cans will do whatever the first one does. I also
think that if students have had past personal experience that differs from what happens in the
demo, it would create more interest and conversation. When one can floats and one sinks
simultaneously it offers an “out” for any personal experience that a student may have had.
The level of cognitive disequilibrium is greatly reduced because the student sees both
alternatives, and possible outcomes, at once. It may be that students are allowed to accept
the discrepant event by “discounting” one.
The discrepant event demonstrations used in this study were chosen with the intent to
display concepts taught in the curriculum at a specific time of the school year. They were
also chosen due to the availability of necessary equipment. But, are there any specific
characteristics of demonstrations, particularly discrepant events, which might position them
more or less suitably for NOE or POE situations? Are there any demonstrations that are
inappropriate candidates for NOE or POE situations? What qualifies them as less than ideal?
These are all considerations that I am very interested in pursuing.
With my personal experiences involving demonstrations as a background to this
study, I feel that a POE demonstration may be most effective and best influence student
engagement if its execution exhibits action, progression, or the development of a process. I
think a procedural demonstration that produces action, movement, or a progressive process
that results in a startling display most affects the observer emotionally, intensifying interest.
These types of presentations are best suited as POE demonstrations. I want to examine this
hunch through further studies.

153
Another possible future study regards student interest. In this study it was possible to
analyze student interest by class period, unit, or lesson model (POE/NOE/L/I). I want to
analyze interest by demonstration, but the current data does not allow me to do that, since
each demonstration was experienced through only one lesson model per class. In a future
study, I would like to present each demonstration in both POE and NOE models, allowing
me to study whether those types of demonstrations generated more interest in a particular
model.

154
CHAPTER SIX
CONCLUSION
6.1 Introduction and Overview
This study was developed using action research methodology to explore how science
demonstrations can be designed to most effectively promote student engagement in scientific
inquiry. The study focused on the impact of specific design elements of demonstrations, so
as to address a limitation of current research identified by Milne and Otieno (2007). A key
component to the design of this study was the use of discrepant events in each of the
demonstrations involved, intended to motivate students to question the observed anomaly and
promote further exploration through self-generated investigation. Along with this common
element, the following three design models were investigated: (1) the Predict, Observe and
Explain (POE) model, in which students predicted the outcome to an event prior to observing
it, (2) the Naturally Occurring Experience (NOE) model, in which students were exposed to a
seemingly impromptu and unscripted demonstration, and (3) an interactive lecture format
lesson not involving a demonstration, used as a comparison model. Following each of these
scenarios, students were asked to design and conduct an investigation to explain the
phenomenon observed in the demonstration and to deepen their understanding of the
embedded concept of the lesson. This involved identifying and selecting a potential variable,
forming a research question and designing and conducting an investigation to examine it.
Alternating each of these instructional models between the three sections of Physical Science
that I taught over three units of instruction allowed for each section to experience all models
and allowed for comparison.

155
More specifically, the research questions providing direction and focus to this study
were:
1. How does a discrepant event demonstration using POE impact: (a) how students design,
conduct and interpret their own investigation to explain the event; and (b) students’
interest in learning about the scientific phenomenon under study?
2. How does an NOE discrepant event demonstration impact: (a) how students design,
conduct and interpret their own investigation to explain the event; and (b) students’
interest in learning about the scientific phenomenon under study?
3. What are similarities and differences in (a) how students design, conduct and interpret
their own investigation around a scientific phenomenon and (b) students’ interest in
learning about that scientific phenomenon in the following three scenarios: (i) students
develop their own investigation without a prior demonstration following an interactive
lecture, (ii) students develop their own investigation after a discrepant event
demonstration using POE, and (iii) students develop their own investigation after an
NOE demonstration using a discrepant event.
A rich set of complementary data was collected from a variety of sources including class
audio-tapes, participant journal entries, independent observer field notes, participant
interviews and a teacher’s log. Analysis of this data disclosed emerging themes and findings
that helped answer each of the research questions, as summarized in the next section.
6.2 Summary of the Findings
Findings from this study revealed that each instructional model investigated influenced
student engagement and learning outcomes in valuable yet distinct ways. First of all, the
manner in which demonstrations are presented seemed to show evidence of student

156
engagement in different ways. POE experiences showed considerable cognitive engagement,
indicated through thoughtful, on-task questions and responses. As the POE format focuses
and directs student attention, it provides more significance and structure to the
demonstration. The NOE format, seemingly because it involves an informal, unintentional,
and inadvertent presentation, resulted in more observable student engagement. Students may
have been observed as less overtly excited and engaged in POE as compared to NOE lessons,
however, they were very cognitively engaged in POE lessons as well.
This engagement can be connected with prediction-making, one of the most notable
characteristics of the POE format and a distinct difference between POE and NOE
demonstrations. Findings from this study confirm claims in the literature that prediction-
making strengthens student focus and attention to details, establishing a rigorous academic
classroom atmosphere and student-minded direction to the class, as determined through
observation and student reporting. This study has shown that students’ prediction-making
also positively influences the quality of student-led scientific investigations, especially with
regard to the development of worthwhile research questions. Prediction-making also
enhances student interest and curiosity in the lesson and the concept, subsequently cultivating
their motivation to understand more, thereby enriching their learning experience.
At the same time, students participating in an NOE demonstration benefited from the
spontaneity and novelty offered by this situation. In addition, POE and NOE students
reported that the most rewarding learning experiences were gained when the phenomenon
demonstrated was unfamiliar, and the least rewarding experiences resulted when the
demonstration featured familiar concepts or phenomena. This finding suggests the value of
choosing “novel” events for events as demonstrations.
157
The use of discrepant events as the content of a demonstration was a critical aspect of the
intervention at the core of this study. Consistent with the literature on conceptual change, the
anomaly embedded in each discrepant event indeed appears to have been an instrumental
feature in motivating student interest and engagement. Discrepant events not only motivated
students to pursue a deeper understanding of the phenomenon but also affected their choice
of variables and research questions for their investigations. As mentioned earlier, pictures
and images in video, which may have also represented a discrepant event, as observed by L/I
students also affected their choice of variables and research questions. Student interest
generated by discrepant event demonstrations, whether using a POE or NOE model, also led
to continued interest and self-directed engagement with the demonstration or the concept,
such as replicating the demonstration at home, or even talking about the phenomenon at
home or with the teacher after class.
Students who observed a demonstrated phenomenon in the classroom (POE and NOE)
were able to develop a greater number of appropriate, investigable research questions than
those who did not have that benefit. These research questions also exhibited a slightly higher
degree of rigor. Observation of a phenomenon also led to a more in-depth discussion of
variables during the research question discussion for POE and NOE. These observations led
to a greater discussion of variables, which in turn generated more rigorous research questions
to be examined in a student-led investigation. In all models investigated, class discussion
emerged as a valuable classroom resource, a significant asset to the development of
variables, research questions, and investigations. One particular feature of class discussion
involved past personal experiences shared by students, and contributing to their development
of variables and research questions.

158
As L/I students benefited from a lecture centrally focused on the concept, not
surprisingly L/I research questions were found to be more central to the concept of the
lesson. When predicting the outcome to their proposed investigations, L/I classes also rated
higher in their ability to apply sound, logical, scientific reasoning that was properly aligned
with the research question. Following their investigations, L/I students’ exhibited a
somewhat deeper level of conceptual understanding in their conclusions. As more of these
students appropriately drew from the concept of the lesson to explain their observations,
more of their conclusions were appropriately founded on the concept, articulating the highest
degree of coherence. This, in turn, suggests the value of enhancing POE or NOE lessons by
including at appropriate points the consideration of key scientific concepts through mini-
lectures and/or readings.
In addition, note-taking was reported by L/I students as offering benefits. Students
claimed that the attention necessary for note-taking was valuable to their conceptual
understanding and that notes also served as an educational tool, as a reference providing
detailed information that could be reviewed out of class. Once again, this suggests another
possible way to enhance POE or NOE lessons, by incorporating note-taking at appropriate
points.
To sum, if rigorous student-led inquiry investigation is the objective, as is recommended
by the National Research Council, POE or NOE lessons can help teachers achieve this goal.
Contributing factors leading POE/NOE students to develop a more rigorous set of
investigable research questions were the direct observation of a tangible demonstration
involving the concept of the lesson, and the structure of the discussion prior to their
development. At the same time, the effectiveness of demonstration-based lessons could be

159
enhanced by including some elements that were present only in my “lecture/inquiry” design,
that is making more explicit connections with the concept and note-taking as appropriate.
6.3 Limitations of the Study
There are some limitations inherent with the design of this study that need to be taken
into consideration before discussing the study’s contributions to the field and implications for
other science teachers. First, the order of the presented demonstrations or concepts may have
affected some of the findings, or influenced data and outcomes. Although the structure of the
study allowed for each class to receive all three instructional models (POE, NOE, L/I) it did
not allow for successive variation in how these experiences were sequenced.
Another limitation involved student ratings of value and interest for each unit.
Because only three demonstrations were investigated, more would have to be studied in order
to validate and more clearly understand the data collected in this study. For example,
without further research, it is unclear whether students rated the instructional model (POE,
NOE, L/I) or the content of the lesson, thus conclusions cannot be made from the existing
data whether it was the content or the format of the lesson that was found more valuable or
interesting.
Another limitation was observed in student journal entries, where it appeared that
some of the conclusions may have been shared and written identically between partners.
This occurred even though it was clearly stated that conclusions were to be individually
written.
Just as in other teaching strategies, the results and findings from this study will not
necessarily generalize to all students. Any of the reported benefits do not impact all students
equally. The learning experiences of each student are unique to each individual. Findings,

160
results and conclusions generated from this study might also, to some extent, be specific to
the school in which it was conducted, the particular participants, or to the grade level in
which they occurred.
Additionally, the scope of this study did not include measurements of student learning
of the concepts. Nor did this study measure conceptual change that may have occurred for
students through their experiences in this study. Both of these outcomes are significant and
deem further exploration in future studies.
Finally, these findings should not be interpreted as best practices in all classroom
situations, nor are they generalizable to best practices for all teachers, as they depended in
part on my own classroom approach and teaching style. From my experiences in this study, I
feel the models investigated in this study might work best for those teachers who are
comfortable with taking risks and are willing to relinquish some control to students-
something that not every teacher may be comfortable with. Unique classroom and
curriculum constraints also may exist. For example, one may not always be able to find a
demonstration that appropriately displays the concept intended to be studied, or have the
necessary time to devote to either the demonstration or the following investigation.
6.4 Contributions to the Field
With the caveats articulated in the previous section, this study supports the value of
using demonstrations to promote fruitful engagement in student-directed scientific
investigations. Through findings from this study, there are a number of claims in the
literature, as discussed in my literature review, which I can now confirm, add to, and
elaborate on.

161
I will begin with research that has shown demonstrations to increase student interest
and engagement. It is significant to point out that prior studies measured interest and
engagement only as the demonstration was actively presented. Results from this study add to
these findings in a number of ways. First, findings from this study have confirmed that
demonstrations produced interest and engagement in the topic of the lesson. In addition, this
interest was carried into the investigation and learning about that topic that followed the
demonstration per-se. Additionally, novelty and spontaneity in the NOE situation was shown
to heighten student engagement, and shown to do so in such a way that was unique and
different from the interest and engagement generated by the prediction-making characteristic
of POE, as found in previous literature and confirmed in this study.
Another point made in the previous literature was that demonstrations can promote
active learning environments, especially if students are not passive observers. Prior research
has positioned prediction-making in POE situations as a strategy to promote active learning,
since students are not passively observing, but rather actively predicting. This study has
confirmed these findings. When students made predictions, they became invested in the
outcome, and engagement was enhanced. However, findings from this study also add to the
existing research in a number of ways.
In much of the literature, demonstrations were used to “confirm”, or show, a
previously taught concept. In these cases, the intent was for predictions and observations to
be aligned with what had been learned. In contrast, demonstrations in this study were used to
introduce a concept. In that sense, since predictions were made prior to the introduction of
the concept, prediction-making was based on the past personal experiences of the observer.
In the context of a discrepant event demonstration with a counterintuitive outcome, the

162
objective of the demonstration is not to align previously learned concepts with the
demonstration, but rather to misalign student’s expectations with the demonstration so as to
extend what they know. Through the cognitive dissonance thus experienced, students
became interested and motivated to investigate a concept in order to learn more about it,
suggesting the importance of discrepant event demonstrations as a way to engage students.
It is significant to point out that this study has shown student engagement in NOE
situations was high, even in the absence of prediction-making. Although the initial
prediction-making has been shown to strengthen engagement, findings from this study have
shown that a high level of student engagement can be achieved even without prediction-
making. It is possible that, in the context of this study, the discrepant event has caused this
engagement without the need for predictions. The literature says that active learners, as in
either “hands-on” or in prediction-making, are more engaged. Yet, in NOE situations
students were not involved in “hands-on” experiences, nor were they actively making
predictions, yet they were still highly engaged.
Some critics in the literature argued that demonstrations could make students less
motivated to solve problems independently and explore “what if” questions. Findings from
this study challenge this claim. As previously mentioned, at the foundation of discrepant
events is the intent to cause discomfort through cognitive dissonance. It is this inherent
quality of discrepant events which positions them as powerful motivators for students, as
shown in this study, to independently investigate “problems” discovered in the observed
phenomenon. Additionally, the ability to identify potential variables that might exist in the
demonstration apparatus was a key feature of these demonstrations that allowed students
already engaged by cognitive dissonance to pursue “what if” questions.
163
Another contribution involves the use of demonstrations for multiple instructional
purposes. Different types of learning outcomes are derived when demonstrations are used for
different purposes. Specifically, this study has shown that demonstrations can be effectively
used to support worthwhile student-led inquiry investigations. Prior research has not
investigated the use of demonstrations in this way. In this regard, this study offers a unique
perspective, and a valuable strategy, for implementing demonstrations within an inquiry-
based lesson. Additionally, this study has shown that rewarding student-led investigations
can follow demonstrations without disrupting the curriculum. The interventions in this study
were achieved without significant constraints put on the curriculum with regard to time and
without modifying the existing curriculum.
As discussed in Chapter Four, my expectation was that prediction-making in POE
would make the most significant influence in student engagement and learning. However,
this study has shown that what actually made the most significant impact on students
investigations were observations of the phenomenon “in action” as experienced through
demonstration. With regards to the presentation of demonstrations in science classrooms,
this finding suggests that student engagement improves if the teacher explicitly directs
students’ attention to the apparatus, its use, and the steps involved in the demonstration.
Designed to study the effects of specific design elements within science
demonstrations on students’ engagement in scientific investigations, this study found that the
“design elements within” the demonstration were not the only critical feature of the lesson
that influenced student engagement. Of great significance is also the structure of the lesson
surrounding the demonstration. Indeed, the design elements around the demonstration, and
their impact on the demonstration, played a very meaningful role in student engagement and

164
potential learning outcomes in the intervention studied. At its outset, the perceived
significance of the demonstration, including its impact on the upcoming lesson, can influence
engagement and learning in meaningful ways. Similarly, an understanding of the
connections between observed phenomenon in the demonstrations and the subsequent
investigation, as well as to the scientific concept in the lesson, is influential. Demonstrations
that have purposeful connections to the preceding and subsequent elements of the lesson are
especially meaningful.
As a result, this study supports the argument that science demonstrations should not
be approached as isolated entities in a lesson. Rather, this study suggests the potential of
using demonstrations as key features of lessons, especially as a means of launching into
student-led inquiry investigations. Numerous learning opportunities and advantages result
when the demonstration is interconnected and embodied to the lesson. Demonstrations
should not be simply presented, but rather thoughtfully coordinated and interwoven into the
lesson, cultivating a synergistic relationship. The demonstration is not mutually exclusive to
the lesson.
Demonstrations should also be viewed as instructional strategies, or tools, influencing
many different facets of a students learning experience. For example, this study has shown
that the POE model generated greater numbers of appropriate student-developed variables.
As a result, when including a POE demonstration into a lesson, the demonstration should
have the potential for investigation of a number of diverse variables. In a POE situation, a
demonstration whose apparatus is limited in variable choice will limit student potential and
expression. On the other hand, a POE demonstration involving a number of components that
can be manipulated during the presentation will be resourceful to students, providing

165
significant opportunity for them to generate an extensive record of variables. This, in turn,
will lead to richer student-led investigations. The more restrictive the demonstration is in
this regard, the more restrictive the experience for the students.
Presenting demonstrations as a way to convey a concept and to generate interest and
enthusiasm for science are commendable objectives in the classroom, but do not allow
demonstrations to be optimally implemented to promote student scientific inquiry and the
benefits that can be gained from it. Rather than serving a supplemental or ancillary role in
the curriculum, demonstrations delivered in a thoughtful and methodical manner, connecting
the demonstration experience to student-led investigations, can become much more than an
enhancement to a lesson. Demonstrations can be the impetus to the lesson, directing the
lesson. Fundamental to this study, and paramount to a science curriculum, demonstrations
can enhance a student’s investigative experience through inquiry. The demonstration can be
an inextricable, driving force of the lesson. Instead of being the thing that is inserted into the
planned lesson, the demonstration can be expanded as the catalyst of the lesson, it can be the
focal point.
Through this study it became evident to me that in each of the units students were
learning more than science content. They were learning about the process and the nature of
science. Essentially, they were learning about how to learn science. Fundamental to this
outcome was the use of discrepant events as demonstrations, due to their inherent nature to
establish cognitive disequilibrium, introducing curiosity. Once established, curiosity and
inquisitiveness fittingly progressed into authentic inquiry investigation. This study
positioned discrepant events as significant tools in the classroom by causing students to
question the demonstration, a critical feature that motivated students to pursue investigations.

166
Each of the discrepant events implemented in this study had the capacity to cultivate
curiosity and wonder without an understanding for the embedded concept. This was critical
to their ability to successfully instill an inquisitive disposition in students. For this reason,
discrepant events are significant demonstration tools. There are a number of chemistry
demonstrations that require at least a basic understanding for a particular science concept in
order to appreciate their results. For example, one demonstration involves using pH paper to
show the changing acidity of a particular liquid through titration. However, the results can
only be appreciated through an understanding of titration, acidity, and the concept of pH. In
contrast, due to the nature of the demonstrations implemented in this study, many students
could relate the observed phenomenon to personal experiences. When students predict in a
POE they are essentially basing their prediction on personal experience, not on a scientific
concept that it is necessary to understand in order to suitably predict.
Research supports inquiry-based scientific investigation. The NRC supports strongly
endorses this classroom approach. This study has shown that scientific inquiry can be
successfully accomplished in a reasonable amount of time, without disruption to established
curriculum. Each of the inquiry experiences involved in this study was successful, in
different ways. Students were shown to successfully develop and engage in all components
of inquiry-based investigations. In each of the lesson designs employed in this study,
students generated their own research questions using appropriate variables, designed their
own experiment to investigate their questions, conducted the investigation, and drew
conclusions based on their observations- all within two 80-minute blocks. The curriculum
covered was based on the required content, as well. One additional student benefit included

167
experiencing the process of “authentic” science. This study has shown tremendous benefits
to student-led inquiry investigations.
6.5 Recommendations for Science Teachers
Findings from the study could help science teachers make more well-informed
pedagogical decisions concerning the design of specific demonstrations, consistent with their
instructional goals. Findings and experiences from this study provide recommendations that
I have identified specific to first year science teachers who are interested in using
demonstrations in their classroom, as well as for established science teachers who do not
have a background in magic. My first suggestion would be to initially use demonstrations in
a limited way, presenting demonstrations that minimize the complexity of the equipment and
the procedure. I would also recommend practicing the demonstration before presenting it to
the students, in order to feel “comfortable” with it. It is important to find demonstrations that
meet the curriculum objectives and targeted concepts, as well. Demonstrations should not be
used to introduce a topic or concept, abandoning the demonstration as the concept is pursued.
Finally, it should be noted that NOE experiences may require a certain “presence” on the part
of the teacher, who must be able to “present” the observed phenomenon in such a way that it
appears as though it was not intended to be presented.
6.6 Further Research
In Chapter Five, I already articulated a few directions I am interested in personally
pursuing as my next cycle of action research on this topic, which include studying the impact
of the intervention on student learning and on student success in the course, incorporating
pictorial illustrations as prediction choices in the POE design, examining different types of
discrepant event demonstrations, and altering the succession of the various designs

168
throughout the study. In what follows, I will identify some additional ideas for future
research motivated by this study.
First of all, more research is necessary to determine whether this study’s findings are
generalizable to other age groups. My impression, based on my experiences with this study,
is that lessons focused on POE and NOE demonstrations could be valuable for other age
groups and science courses, as long as certain criteria are met. The first necessary element
would be that the discrepant event demonstrated be age appropriate, allowing the observer
the opportunity to either relate to the phenomenon from personal experience, or that the
observer has achieved a developmental level to grasp the discrepancy in the demonstration.
The second condition is that the investigation be procedurally age appropriate, and that the
content of the demonstration is accessible, affording the opportunity for deeper
understanding of the concept at an appropriate cognitive level. Unless the demonstration and
subsequent investigation can connect the student’s cognitive developmental stage and the
science content, it remains simply a spectacle to attract attention, rather than the stimulus for
authentic student-driven inquiry.
Participants of this study suggested that the most valuable structure for a unit would
be a demonstration, followed by a lecture, then by an inquiry experience. This study did not
include a scenario in which an inquiry experience preceded a lecture. It would be valuable to
examine the outcomes of a lesson structured with POE/NOE, lecture, investigation and note-
taking, or POE/NOE, investigation, lecture and note-taking. It would also be informative to
study the effects of having the lecture at the beginning or the end of this type of lesson.
Would students benefit from a lesson format consisting of demonstration, investigation, and
lecture with notes? Would this format be strengthened by structuring lecture before

169
investigation, but adding a synthesis of the entire class experience in the form of notes at the
end of the lesson? These are questions that could be addressed in future studies.
One intriguing approach to a POE demonstration would involve students individually
conducting the action leading to the observe phase. In each of the POEs conducted in this
study I activated the observed phenomenon. It would be worthwhile to study and compare
student engagement in experiences involving the same demonstrations used in this study, but
which are executed by a student. For example, in Unit 1 (involving the floating/sinking pop
can demonstration), rather than the teacher dropping the pop cans in water, the students
would have their own equipment and drop the cans into the water themselves. Student
engagement in this situation could be compared to the findings of this study.
As mentioned in Chapter Four, the inclusion of still images and video in L/I lessons
might be interpreted by students as experiences similar to those in NOE lessons. This is an
area that could be addressed in future studies. Investigations should examine whether still
images or video produce results similar to NOE. If this does occur, further investigation
should try to answer how and why this occurs.
Finally, while this was not part of this study, it would be helpful to know the level of
understanding that students had for the core science concepts that were addressed in each
unit. Did all students understand the concepts in the same ways, or were there differences
based on the type of lesson design? While it is significant that students were engaged in
scientific inquiry, what was their “take-away” understanding, and were there differences?
These seem to be valuable pieces of information that might be better understood through
future studies.
6.7 Concluding Thoughts

170
This study investigated how discrepant event demonstrations could be designed so as
to most effectively promote students’ engagement in scientific inquiry. Using an action
research methodology, I explored how demonstrations using discrepant events might be best
designed to facilitate student-developed investigations of inquiry, studying the impact of
different designs. In the process, I discovered many more ways than I had anticipated in
which student engagement and investigations can be influenced by including a demonstration
into a lesson.
This study’s most significant discovery that will affect my practice was the awareness
that in addition to influencing engagement, demonstrations acting as the catalyst, or focal
point of the lesson, can strongly influence student’s development of their investigations and
subsequent investigative experiences. It is through a deeper understanding of the many
facets of the demonstration, the potential ways in which it can be anchored to the lesson, and
the interactions that occur between each facet and the student, that educators can best be
prepared to influence student engagement through the implementation of demonstrations.
The most significant overarching finding from this study is that demonstrations can indeed be
used to enhance a student’s inquiry-based investigative experience.
Scientific inquiry-based investigations offer classroom experiences that are deemed
significant and valuable components to science curriculum and to student’s science education
by the National Research Council, me, my colleagues, and many more science teachers.
Findings from this study have strengthened my belief in the value of demonstrations in a
science curriculum. The study suggests the importance of how a demonstration is “framed”
and carried out. This study has supported, strengthened and reinforced the value of inquiry-
based investigations in science classrooms, positioning them as powerful, meaningful tools to

171
student learning, and valuable, worthwhile components to classrooms of all science
educators.

172
References
American Association for the Advancement of Science. (1991). Science for all Americans:
Project 2061. New York: Oxford University Press.
Anderson, G. L., Herr, K., & Nihlen, A. S. (2007). Studying your own school (2nd Ed.).
California: Corwin Press.
Anderson, J. R., Reder, L. M., & Simon, H. A. (1996). Situated learning and education.
Educational Researcher, 25(4), 5-11.
Baddock, M. & Bucat, R. (2008). Effectiveness of a classroom chemistry demonstration
using the cognitive conflict strategy. International Journal of Science Education,
30(8), 1115- 1128.
Beall, H. (1996). Report on the WPI Conference “Demonstrations as a Teaching Tool in
Chemistry: Pro and Con”. Journal of Chemical Education, 73(7), 641.
Beasley, W. (1982). Teacher demonstrations: The effect on student task involvement.
Journal of Chemical Education, 59,(9), 789-790.
Brown, J. S., Collins, A., & Duguid, P. (1989). Situated cognition and the culture of learning.
Educational Researcher, 18(1), 32-42.
Buncick, M. C., Betts, P. G., & Horgan, D. D. (2001). Using demonstrations as a contextual
road map: enhancing course continuity and promoting active engagement in
introductory college physics. International Journal of Science Education, 23(12),
1237-1255.
Bybee, R. W. (2000). Teaching science as inquiry. In J. Minstrell & E. H. van Zee (Eds.),
Inquiry into inquiry learning and teaching in science (pp. 20-42). Washington, DC:
American Association for the Advancement of Science.

173
Callan, J.P., Crouch, C.H., Fagen, A.P., & Mazur, E. (2004). Classroom demonstrations:
Learning tools or entertainment? American Journal of Physics, 72(6), 835-838.
Candela, A. (1998). Demonstrations and problem-solving exercises in school science: Their
transformation within the Mexican elementary school classroom. Science Education,
81, 497-513.
Chinn, C. A., & Malhotra, B. A. (2002). Epistemologically authentic inquiry in schools: A
theoretical framework for evaluating inquiry tasks. Science Education, 86(2), 175-
218.
Driver, R., Asoko, H., Leach, J., Mortimer, E., & Scott, P. (1994). Constructing scientific
knowledge in the classroom. Educational Researcher, 23(7), 5-12.
Dykstra, D. I., Boyle, C. F., & Monarch, I. A. (1992). Studying conceptual change in
learning physics. Science Education, 76(6), 615-652.
Fagen, A. P. (2003). Assessing and enhancing the introductory science course in physics and
biology; peer instruction, classroom demonstration and genetics vocabulary (Doctoral
dissertation, Harvard University, 2003). Dissertation Abstracts International, 64,
1586.
Freier, G. (1981). The use of demonstrations in physics teaching. The Physics Teacher,
19(6), 384-386.
Furtak, E. M. (2009). Formative assessment for secondary science teachers. Thousand Oaks,
CA: Corwin Press.
Glasson, G. E. (1989). The effects of hands-on and teacher demonstration laboratory methods
on science achievement in relation to reasoning ability and prior knowledge. Journal
of Research in Science Teaching, 26(2), 121-131.

174
Hilton, W. (1981). Demonstrations as an aid in the teaching of physics. The Physics
Teacher, 19(6), 389-390.
Lawson, A. E. (2000). Managing the inquiry classroom: Problems & Solutions. The
American Biology Teacher, 62(9), 641-648.
Limon, M. (2001). On the cognitive conflict as an instructional strategy for conceptual
change: A critical appraisal. Learning and Instruction, 11, 357-380.
Limon, M., & Carretero, M. (1997). Conceptual change and anomalous data; A case study in
the domain of natural sciences. European Journal of Psychology of Education, 12(2),
213- 230.
Luehmann, A. L. (2007). Identity development as a lens to science teacher preparation.
Science Education, 91(5), 822-839.
Lynch, M. J., and Zenchak, J. J., (2002, January). Use of scientific inquiry to explain
counterintuitive observations. Paper presented at the Proceedings of the Annual
International Conference of the Association for the Education of Teachers in Science,
Charlotte, NC.
Manaf, E. B. A., & Subramaniam, R. (2004, June). Use of chemistry demonstrations to foster
conceptual understanding and cooperative learning among students. Paper presented
at the International Association for the Study of Cooperation in Education, Singapore.
McCutcheon, G., & Jung, B. (1990). Alternative perspectives on action research. Theory Into
Practice, 29(3), 144-151.
McDermott, L. C. (2001). Physics education research- the key to student learning. American
Journal of Physics, 69(11), 1127-1137.

175
Meyer, L. S., Schmidt, S., Nozawa, F., & Paneee, D. (2003). Using demonstrations to
promote student comprehension in chemistry. Journal of Chemical Education, 80(4),
431-435.
Mills, G. E. (2007). Action research: A guide for the teacher researcher (3rd Ed.). Columbus,
OH: Pearson.
Milne, C., and Otieno, T. (2007). Understanding engagement: Science demonstrations and
emotional energy. Science Education, 91(4), 523- 53.
Morgan, J., Barroso, L.R., & Simpson, N. (2007, October). Active demonstrations for
enhancing learning. 37th ASEE/IEEE Frontiers in Education Conference. Milwaukee,
WI.
National Research Council, 1996. National science education standards. Washington
National Academy Press.
National Research Council. 2001. Inquiry and the national science education standards.
Washington, DC: National Academy Press.
O’Brien, T. (1991). The science and art of science demonstrations. Journal of Chemical
Education, 68(11), 933-936.
Palincsar, A. S. (1989). Less charted waters. Educational Researcher, 18(4), 5-7.
Piaget, J. (1964). Development and Learning. Journal of Research in Science Teaching, 2,
176- 186.
Pintrich, P.R., Marx, R.W., & Boyle, R.A. (1994). Beyond cold conceptual change: The role
of motivational beliefs and classroom contextual factors in the process of conceptual
change. Review of Educational Research, 63 (2), 167-199.

176
Posner, G. J., Strike, K. A., Hewson, P. W., & Gertzog, W. A. (1982). Accommodation of a
scientific conception: Toward a theory of conceptual change. Science Education, 66,
211-227.
Roth, W-M., and Lucas, K. (1997). From “truth” to “invented reality”: A discourse analysis
of high school physics students’ talk about scientific knowledge. Journal of Research
in Science Teaching, 34, 145-179.
Roth, W-M., McRobbie, C. J., Lucas, K. B., & Boutonne, S. (1997). Why may students fail
to learn from demonstrations? A social perspective on learning in physics. Journal of
Research in Science Teaching, 34, 509-533.
Seel, N. M. (2001). Epistemology, situated cognition, and mental models: ‘Like a bridge over
troubled water’. Instructional Science, 29, 403-427.
Shepardson, D. P., Moje, E. B., and Kennard-McClelland, A. M. (1994). The impact of a
science demonstration on children’s understanding of air pressure. Journal of
Research in Science Teaching, 31(3), 243-258.
Vosniadou, S., Ioannides, C., Dimitrakopoulou, A., & Papademetriou, E. (2001). Designing
learning environments to promote conceptual change in science. Learning and
Instruction, 11, 381-419.
Windschitl, M. (2008). What is inquiry? A framework for thinking about authentic scientific
practice in the classroom. In A. Cocke, J. Cusick, & B. Smith (Eds.), Science as
inquiry in the secondary setting (pp. 1-20). NSTA Press.
Wright, E.L. and Govindarajan, G. (1995). Discrepant event demonstrations: Motivating
students to learn science concepts. The Science Teacher, 62(1), 25- 28.

177
Young, M. (1993). Instructional design for situated learning. Educational Technology
Research and Development, 41(1), 43-58.

178
Appendices
Appendix A A.1: Curriculum Map (1 of 3)

179
A.1: Curriculum Map (2 of 3)

180
A.1: Curriculum Map (3 of 3)

181
A.2: Detailed Unit 2 Lesson Plan
Detailed Plan for Unit 2
Unit 2 POE Demonstration Lesson:
Day One: Period One Students each have a laptop on their desks. Students are shown a beaker and a paper
towel, which is placed into the beaker. Their attention is then directed towards a larger beaker filled with water. Students are asked to predict what would happen if the cup were turned upside-down and pushed down into the water. They individually make their predictions by typing it into their reflective journals, and are also asked to type an explanation, or justification, for their prediction (see Appendix B.1 for specific prompts). Students are asked to verbally share their predictions with the class. I list students’ predictions on easel paper in front of the class. Students are then directed to observe the demonstration. The inverted beaker is pushed into the larger beaker of water. Students are asked to list observations in their reflective journals (again, in response to specific prompts- see Appendix B.1). The inverted beaker is removed and the paper towel is pulled out of the smaller beaker to show that it is dry. Students are then asked the following questions:
How do you think it is possible that the paper towel remained dry even though it was submerged under water? How might you test your explanation?
Day One: Period Two Students type their answers to these questions into their laptops. Students are
randomly paired up with a classmate by freely selecting a playing card from a deck of cards, each with a students name from the class written on it. The students name written on their randomly chosen card is their assigned partner. They are asked to share and discuss their explanations of the demonstration with their partner. They are given the opportunity to modify their answers and explanations and to enter their new ideas into their journals. If students do not want to change their initial explanation, they are instructed to type that response. Now groups are asked to share their explanations with the class. If the group’s explanation is the same for both partners, then one student presents the explanation. If their explanations differ, they are each asked to present their individual explanations. I record key words or phrases used in these explanations on easel paper. Students are once again given the opportunity to modify their answers and explanations and to type them. If students do not want to change their initial explanation, they are instructed to type that response. Students are now asked to individually type as many research questions as they can think of to investigate the observed phenomenon. Students are now asked to identify any variables that they believe might affect the outcome of the demonstration. Class discussion includes “what if…” and “I wonder…” questions. The entire class is given the opportunity to engage in a discussion of these questions. I ask for student answers and from these responses a list of relevant variables is generated and recorded on easel paper. Partners now discuss the list of variables, collaboratively choose one that they would like to investigate, and type a research question that their investigation is attempting to answer. Partners then list the materials they will need, and determine what information and data they need to collect in order to conduct their investigation. Each group is asked to share with the large group the variable they are investigating, a list of necessary materials and the question they are trying

182
to answer. Groups are asked to type a procedure, or protocol, for their investigation. Each student individually types their predictions to the results of their designed investigations. My role is to facilitate students in the planning and strategies necessary to conduct their inquiry, and to help identify potentially impractical or problematic issues. Possible prompts include whether different outcomes would result from using different liquids, different sized beakers, paper cups instead of beakers, a hole in the cup, or whether the placement or size of the hole would matter to the outcome. Students complete a journal entry (see Appendix B.1 for specific prompts). I gather any additional materials needed, based on students questions, before class on Day Two. Day Two: Period One
Students conduct the investigation that they designed on day one. Day Two: Period Two
Students record results and form conclusions of their investigations on individual laptops. If time allows, groups present their results and defend their conclusions with the class. Students are asked to complete and submit a Journal Entry (see Appendix B.1 for specific prompts).
Unit 2 NOE Demonstration Lesson Day One: Period One
When students enter the classroom and take their seats there is a large beaker on the teacher’s desk at the front of the classroom with paper towel inside. This beaker is inverted and sitting inside a larger beaker filled with water. A data projection device is aimed at the setup, but is not projecting an image. If attention is not drawn to the setup by the students, the Elmo is turned on as I clean up the area so that the setup is projected. This is done with the intent to draw attention. When attention is drawn to it, the students are told that it is from a lesson in the previous class. If the students show interest in experiencing this lesson, I agree to it. If the students do not ask to pursue this lesson, I ask them if they are interested in doing it, since “we have time”. The goal is to ask students the following question regarding the observed phenomenon:
How is it possible for the smaller beaker to be underwater, but the paper towel inside it to remain dry? Students are asked to complete a Journal Entry (see Appendix B.1 for specific prompts). Day One: Period Two
Students design an investigation, similar to what was done in the POE unit. Day Two: Period One This is the same as POE. Day Two: Period Two
This is the same as POE.
Unit 2 Lecture/Inquiry Day One: Period One
When students enter the classroom, they each have a laptop at their desks. The lesson follows my typical lecture format. I begin by informing students that the concept under investigation is the molecular arrangement of a gas, which is introduced with a definition of the concept, followed by video and brief notes. The six minute video depicts properties of gases and illustrations of these properties. It includes an image of a boy blowing up a

183
balloon. The notes describe properties of gases. Students are asked to describe, through class discussion, any real-world examples or personals experiences involving whether gas particles have any particular pattern or whether gas has volume, or takes up space. Students would have previously encountered a lesson on volume. Students are told that they will be designing an experiment to help explain the arrangement and properties of gases. In particular, they are told that the class objective is to develop their own investigation in order to deepen their understanding of how gas particles are arranged or organized, or to investigate and show whether gas has volume. They are shown some available materials from which they can construct their investigation, such as beakers and cups of various sizes, balloons, and food coloring. They are told they are free to use other materials, and are not limited to these alone. Students are randomly paired up with a classmate by freely selecting a playing card from a deck of cards, each with a students name from the class written on it. The students name written on their randomly chosen card is their assigned partner. Together with their partner, students develop a question to investigate, relevant to the molecular arrangement of a gas. They are asked to share their ideas with the class, and I record these ideas on easel paper. Day One: Period Two
Responding to Journal Entry prompts (see Appendix B.1) each pair of students selects one question they would like to investigate and designs a protocol for their investigation. My role is to facilitate students in the planning and strategies necessary to conduct their inquiry, and to help identify potentially impractical or problematic issues. Day Two: Period One
Students conduct the investigation that they developed on day one. Day Two: Period Two
Students record results and form conclusions of their investigations on individual laptops. If time allows, groups present their results and defend their conclusions with the class. Students are then asked to complete and submit a Journal Entry (see Appendix B.1 for specific prompts).

184
A.3: Detailed Unit 3 Lesson Plan
Detailed Plan for Unit 3
Unit 3 POE Demonstration Lesson
Day One: Period One Students each have a laptop at their desks. The lesson begins by showing a penny, a
beaker of water, and an eyedropper. The eyedropper is demonstrated first, so that all students understand how it works. It is explained that I will fill the eyedropper and drop single drops of water onto the penny, until the water falls off the edge of the penny. I ask students to predict how many drops of water they believe I will be able to place onto the penny before any water falls off the edge. They individually make their predictions by typing it into their reflective journals. They are also asked to type an explanation, or justification for their prediction (see Appendix B.1 for specific prompts). Students are asked to verbally share their predictions with the class. I list students’ predictions on easel paper in front of the class. The Elmo, a projection device, is used to show a close-up image of the penny lying on the table. Students are directed to observe the demonstration. Drops are placed onto the penny until the water spills off the edge of it. Students are then asked the following question:
How do you think so many drops were able to be put on the penny before falling off the
edge? How might you be able to test this? Day One: Period Two
Students type their answers to these questions into their laptops. Students randomly pair up with a classmate by freely selecting a playing card from a deck of cards, each with a students name from the class written on it. The students name written on their randomly chosen card is their assigned partner. They are asked to share and discuss their explanations of the demonstration with their partner. They are given the opportunity to modify their answers and explanations and to enter their new ideas into their journals. If students do not want to change their initial explanation, they are instructed to type that response. Now, groups are asked to share their explanations with the class. If the group’s explanation is the same for both partners, then one student presents the explanation. If their explanations differ, they are each asked to present their individual explanations. I record key words or phrases used in these explanations on easel paper. Students are once again given the opportunity to modify their answers and explanations and to type them. If students do not want to change their initial explanation, they will be instructed to type that response. Students are now asked to individually type as many research questions as they can think of to investigate the observed phenomenon. Students are now asked to identify any variables that they believe might affect the number of drops able to be placed on the penny. Class discussion includes “what if…” and “I wonder…” questions. The entire class is given the opportunity to engage in discussion of these questions. I ask for student answers and from these responses a list of relevant variables is generated and recorded on easel paper. Partners now discuss the list of variables, collaboratively choose one that they would like to investigate, and type a research question that their investigation is attempting to answer. Partners then list the materials they will need, and determine what information and data they need to collect in order to conduct their investigation. Each group is asked to share with the large group the variable they are

185
investigating, a list of necessary materials and the question they are trying to answer. Groups are asked to type a procedure, or protocol, for their investigation. Each student individually types their predictions to the results of their designed investigations. My role is to facilitate students in the planning and strategies necessary to conduct their inquiry, and to help identify potentially impractical or problematic issues. Guided investigations include whether different liquids will make different shapes, whether different liquids will hold different numbers of drops, whether different size coins hold different numbers of drops, whether different metals affect the number of drops held, and whether size of dropper, the use of heads or tails, the age of the penny, angle that the dropper is held, temperature of the liquid, and whether holding the dropper from different distances will make a difference to the outcome. Students complete a journal entry (see Appendix B.1 for specific prompts). I gather any additional materials needed, based on students questions, before class on Day Two. Day Two: Period One
Students conduct the investigation that they designed on day one. Day Two: Period Two
Students record results and form conclusions of their investigations on individual laptops. If time allows, groups present their results and defend their conclusions with the class. Students are then asked to complete and submit a Journal Entry (see Appendix B.1 for specific prompts).
Unit 3 NOE Demonstration Lesson Day One: Period One
When students enter the classroom and take their seats, there is a penny filled to capacity with drops of water being projected on the Elmo. When attention is drawn to it, the students are told that it is from a lesson in the previous class. If the students show interest in experiencing this lesson, I agree to it. If the students do not ask to pursue this lesson, I ask them if they are interested in doing it, since “we have time”. I explain the use of the eyedropper and how the drops of water were put onto the penny. The goal is to ask students the following question regarding the observed phenomenon:
How do you think so many drops were able to be put on the penny without falling off the
edge? Students are asked to complete a Journal Entry (see Appendix B.1 for specific prompts). Day One: Period Two
Is the same as POE, except that guided questions include whether different liquids will make different shapes, whether different liquids will hold different numbers of drops, whether different size coins hold different numbers of drops, whether different metals affect the number of drops held, and whether size of dropper, the use of heads or tails, the age of the penny, angle that the dropper is held, and how far away the dropper is held will make a difference to the outcome. Day Two: Period One
This is the same as POE. Day Two: Period Two
This is the same as POE.
Unit 3 Lecture/Inquiry

186
Day One: Period One When students enter the classroom they each have a laptop at their desks. The lesson
follows my typical lecture format. I begin by informing students that the concept under investigation is cohesion, which is introduced with a definition of the concept, followed by video and brief notes. The four minute video illustrates the property of cohesion in liquids through images including beads of water formed on wax paper. Students are asked to describe, through class discussion, any real-world examples or personals experiences involving the concept of cohesion. If students do not come up with examples, I offer examples such as water droplets on the side of a drinking glass. Students are told that they will be designing an experiment to investigate this property. They are shown some available materials from which they can construct their investigation, including a collection of pennies, various beakers, liquids, and eyedroppers. They are told they are free to use other materials, and are not limited to these alone. Students pair up with a classmate by freely selecting a playing card from a deck of cards, each with a students name from the class written on it. The students name written on their randomly chosen card is their assigned partner. Together with this partner, students develop a question they would like to investigate, relevant to cohesion. They are asked to share their ideas with the class, and I record these ideas on easel paper. Day One: Period Two
Responding to Journal Entry prompts (see Appendix B.1) each pair of students selects one question they would like to investigate and designs a protocol for their investigation. My role is to facilitate students in the planning and strategies necessary to conduct their inquiry, and to help identify potentially impractical or problematic issues. Day Two: Period One
Students conduct the investigation that they developed on day one. Day Two: Period Two
Students record results and form conclusions of their investigations on individual laptops. If time allows, groups present their results and defend their conclusions with the class. Students are then asked to complete and submit a Journal Entry (see Appendix B.1 for specific prompts).

187
Appendix B
B.1: Journal Entry Prompts
POE NOE Inquiry Only
Questions Before Demonstration
1. I predict the following will happen during this demonstration:
Questions After Demonstration/Introduction to Lesson
1. I made the following important observation(s) of this event:
2. My explanation for this observed phenomenon is:
1. On a scale of 1-5, 1 being “I’m not interested at all and don’t want to know anything more about this”, and 5 being “I’m extremely interested and really want to know more about this”, rank your level of interest in investigating this phenomenon and tell me why it is or is not interesting to you.
2. Write down as many research questions as possible to investigate this phenomenon.
3. The question we are going to ask is: 4. Our investigation will follow this procedure: 5. I predict our findings will be:
Questions After Investigation
1. I made the following important observation(s) while conducting the investigation:
2. My conclusion to the investigation I conducted is: 3. In what way(s) did this unit interest you?

188
B.2: Guiding Questions for Final Class Reflection (#1-5)
and
Final Journal Entry Prompts (#6-8)
(Demonstration props from each unit will be visibly displayed during this discussion)
For both class discussion and journal:
1. Which of the three units did you like the most/least and why?
2. Which of the three units were you the most interested in/ least interested in?
Specifically which parts? Why?
3. Which of the 3 units were most valuable to you in setting up and designing your
inquiry experience and how?
4. Is there anything you would change in these units to make them better?
5. Is there anything about these three units that you’re still interested in?
For journal only:
6. On a scale of 1-5, 1 being “the investigation that I designed was useless and did not
help me to understand the concept we were studying at all” and 5 being “the
investigation that I designed helped me to understand the concept we were studying
and made everything clear to me”, what number would you give to the units on:
Density ____, Molecular Arrangement ____, and Cohesion ___.
7. On a scale of 1-5, 1 being “I was not interested in any part of this unit” and 5 being “I
was completely interested in this entire unit”, what number would you give to the
units on: Density ____, Molecular Arrangement ____, and Cohesion ___.
8. Did you discuss with anyone, or maybe even attempt to repeat, any of the
demonstrations that you observed in these units? Briefly explain?

189
B.3: Observation Chart (Identifiers of student interest will be visible to me during each unit and will be given to the Cohort observer):
Identifiers: Interjects, enthused, focused, completion of others sentences, leans in, stands, asks to move closer, asks to repeat step, asks classmate to move out of way, asks questions, contribution to discussion, eye gaze, overlapping speech, excited speech, short gaps in discourse, desire to go beyond requirements, preference for challenge, suppression of distraction, exchanging ideas, giving directions, justifying an answer, requesting clarification.
Put an X above the corresponding seat number when a student exhibits evidence of interest
Front of Room ____________ ____________ ___________ ___________ ____________ ___________ ___________ _________ 1 2 3 4 5 6 7 8 ____________ ____________ ___________ ___________ ____________ ___________ ___________ _________ 9 10 11 12 13 14 15 16 ____________ ____________ ___________ ___________ ____________ ___________ ___________ _________ 17 18 19 20 21 22 23 24 ____________ ____________ ___________ ___________ ____________ ___________ ___________ _________
25 26 27 28 29 30 31 32

190
B.4: Teacher Log Prompts:
1. Any comments/observations about the execution of the demonstration and how it
could be improved in the future (pay attention in particular to: How much attention
was called to the NOE demonstration in order to generate interest in it?)
2. Any comments/observations about how the students went about their investigations
and the influence the demonstration may have had on it.
3. Were there any elements of the lesson that seemed to affect students’ design and
execution of their investigations?
4. Did any student show evidence of changing any misconceptions? If so, describe, and
indicate what influenced the change.
5. Any comments/observations about the students’ interest and curiosity, and the
influence the demonstration may have had on it.
6. Were there any elements of the lesson that seemed to affect student interest?
7. Did any student extend their engagement beyond the class? If so, report.
8. Any comments/observations about differences noticed in the three classes.
9. How do students respond/react to what appears to be conflicting information in
discrepant events?

191
B.5: Questions for Student Interview
1. In which of the three investigations do you think you had the best learning
experience? What do you think made it a good learning experience?
2. In which of the three investigations do you think you had the least rewarding learning
experience? What do you think made it the least rewarding learning experience?
3. Could any part of these units have been different to increase your level of
participation, or interest to participate?

192
Appendix C
C.1: Data Collection and Analysis Table
Research Questions: 1. How does a discrepant event demonstration using POE impact: (a) how students design, conduct and interpret their own
investigation to explain the event; and (b) students’ interest in learning about the scientific phenomenon under study? 2. How does a discrepant event demonstration using NOE impact: (a) how students design, conduct and interpret their own
investigation to explain the event; and (b) students’ interest in learning about the scientific phenomenon under study? 3. What are similarities and differences in: (a) how students design, conduct and interpret their own investigation to explain the
event; (b) students’ interest in learning about the scientific phenomenon under study?

193
RQ1a. How does a discrepant event demonstration using POE impact: (a) how students design, conduct and interpret their own investigation to explain the event Data Source How the Data Will be Used Question/Prompt Examples
1. Journal Entry (day one)
For each student, I will compile a list of the predictions (from #1), observations (from #2), and explanations (from #3) made at this initial stage, and compare it with the research questions that same student generates in Data Source #2 to see if there is a relationship between the predictions/observations (i.e., the POE demonstration) and the research questions they generate. I will compile the responses to #3 for the entire class, and identify how many students came up with the same/similar research question. I will look for possible connections between the most “popular” research questions and the POE demonstration. I will rate the quality of the research question chosen and of the protocol being designed using the rubrics in Appendix C.2 and C.3 respectively. I will compile class average and distribution, as well as how many students received each rating. I will look for any relationships indicating that POE influences the development of research questions and the design of protocols.
1. I predict the following will happen during this demonstration:
2. I made the following important observation(s) of this event:
3. My explanation for this observed phenomenon is:
4. Write down as many research questions as possible to investigate this phenomenon.
5. The question we are going to ask is:
6. Our investigation will follow this procedure:
7. I predict our findings will be:

194
2. Journal Entry (day two)
For each student, I will rate the quality of the observations and conclusions using the rubrics in Appendix C.4 and C.5 respectively. I will compile class average and distribution, as well as how many students received each rating..
1. I made the following important observation(s) while conducting the investigation: 2. My conclusion to the investigation I conducted is:
3. Lesson Transcripts
I will be looking for any indications of how students are designing, conducting, or interpreting their investigations and possible connections with the POE demonstration.
4. Teacher Log I will be looking for any of my observations that might indicate how specific elements of POE influence student investigations.
1. Any comments or observations about how students conducted their investigations and the influence the demonstration may have had on this.
2. Were there any elements of the unit that seemed to affect students’ design and execution of their investigations?

195
RQ1b. How does a discrepant event demonstration using POE impact: (b) students’ interest in learning more about the scientific phenomenon under study Data Source How the Data Will be Used Question/Prompt Examples
1. Journal Entry (day one)
I will look for indications of student interest and any ways in which these interests might be connected specifically to the POE demonstration. I will calculate the percentage of students indicating their interest at each level of the rating scale for POE.
1. On a scale of 1-5, 1 being “I’m not interested at all and don’t want to know anything more about this” and 5 being “I’m extremely interested and really want to know more about this”, rank your level of interest in investigating this phenomenon and tell me why it is or is not interesting to you.
2. Journal Entry (day two)
I will be looking for distinct features of the POE demonstration that influence student interest.
1. In what way(s) did this unit interest you?
3. Journal Entry (final class reflection)
I will calculate the percentage of students indicating their interest at each level of the rating scale for POE, following the final class reflection (see Appendix D.15). I will calculate the value assigned to each unit by each student following the final class reflection (see Appendix D.16).
1. On a scale of 1-5, 1 being “I was not interested in any part of this unit” and 5 being “I was completely interested in this entire unit”, what number would you give to the units on: Density ____, Molecular Arrangement ____, and Cohesion ___.
2. On a scale of 1-5, 1 being “the investigation that I designed was useless and did

196
not help me to understand the concept we were studying at all” and 5 being “the investigation that I designed helped me to understand the concept we were studying and made everything clear to me”, what number would you give to the units on: Density ____, Molecular Arrangement ____, and Cohesion ___.
4. Lesson Transcripts
I will be looking for any indications of student interest and possible connections with the POE demonstration.
5. Teacher Log
I will be looking for any of my observations that might indicate how specific elements of POE influence student interest. 1. Any comments or
observations about the presentation of the discrepant event and how it could be improved in the future, with particular attention on how much attention was called to the discrepant event in order to generate interest in it?
2. Any comments or observations about the students’ interest and curiosity, and the influence the demonstration may have had on it.
3. Were there any elements of the unit that seemed to

197
affect student interest?
4. Did any student extend their engagement beyond the class?
6. Observation Chart
I will compile the percent of students that showed engagement in the lesson, and look for relationships between this number and level of interest expressed in journal entries and lesson transcripts.
See Appendix B.3

198
RQ2a. How does a discrepant event demonstration using NOE impact: (a) how students design, conduct and interpret their own investigation to explain the event Data Source How the Data Will be Used Question/Prompt Examples
1. Journal Entry (day one)
For each student, I will compile a list of the observations (from #1), and explanations (from #2) made at this initial stage, and compare it with the research questions that same student generates (from #3) to see if there is a relationship between the observations/explanations and the research questions they generate in an NOE. I will compile the responses to #3 for the entire class, and identify how many students came up with the same/similar research question. I will look for possible connections between the most “popular” research questions and the NOE. I will rate the quality of the research question chosen and of the protocol being designed using the rubrics in Appendix C.2 and C.3 respectively. I will compile class average and distribution, as well as how many students received each rating. I will look for any relationships indicating that NOE influences the development of research questions and the design of protocols.
1. I made the following important observation(s) of this event:
2. My explanation for this
observed phenomenon is: 3. Write down as many
research questions as possible to investigate this phenomenon.
4. The question we are going
to ask is: 5. Our investigation will
follow this procedure:
6. I predict our findings will be:
2. Journal Entry (day two)
For each student, I will rate the quality of the observations and conclusions using the rubrics in Appendix C.4 and C.5 respectively. I will compile class average and distribution, as well as how many students received each rating.
1. I made the following important observation(s) while conducting the investigation:
2. My conclusion to the investigation I conducted is:

199
3. Lesson Transcripts
I will be looking for any indications of how students are designing, conducting, or interpreting their investigations and possible connections with the NOE.
4. Teacher Log I will be looking for any of my observations that might indicate how specific elements of NOE influence student investigations. 1. Any comments or
observations about how students conducted their investigations and the influence the demonstration may have had on it.
2. Were there any elements of the unit that seemed to affect students’ design and execution of their investigations?

200
RQ2b. How does a discrepant event demonstration using NOE impact: (b) students’ interest in learning more about the scientific phenomenon under study Data Source How the Data Will be Used Question/Prompt Examples
1. Journal Entry (day one)
I will look for indications of student interest and any ways in which these interests might be connected specifically to the NOE. I will calculate the percentage of students indicating their interest at each level of the rating scale for NOE.
1. On a scale of 1-5, 1 being “I’m not interested at all and don’t want to know anything more about this” and 5 being “I’m extremely interested and really want to know more about this”, rank your level of interest in investigating this phenomenon and tell me why it is or is not interesting to you.
2. Journal Entry (day two)
I will be looking for distinct features of the NOE demonstration that influence student interest.
1. In what way(s) did this unit interest you?
3. Journal Entry (final class reflection)
I will calculate the percentage of students indicating their interest at each level of the rating scale for NOE, following the final class reflection (see Appendix D.15). I will calculate the value assigned to each unit by each student following the final class reflection (see Appendix D.16).
1. On a scale of 1-5, 1 being “I was not interested in any part of this unit” and 5 being “I was completely interested in this entire unit”, what number would you give to the units on: Density ____, Molecular Arrangement ____, and Cohesion ___. 2. On a scale of 1-5, 1 being “the investigation that I designed was useless and did not help me to understand the concept we were studying at all” and 5 being “the investigation that I designed helped me to understand the

201
concept we were studying and made everything clear to me”, what number would you give to the units on: Density ____, Molecular Arrangement ____, and Cohesion ___.
4. Lesson Transcripts
I will be looking for any indications of student interest and possible connections with the NOE demonstration.
5. Teacher Log
I will be looking for any of my observations that might indicate how specific elements of NOE influence student interest.
1. Any comments or observations about the presentation of the discrepant event and how it could be improved in the future, with particular attention on how much attention was called to the discrepant event in order to generate interest in it?
2. Any comments or observations about the students’ interest and curiosity, and the influence the demonstration may have had on it.
3. Were there any elements of the unit that seemed to affect student interest?
4. Did any student extend their engagement beyond the class?
6. Observation Chart
I will compile the percent of students that showed engagement in the lesson, and look for relationships between this number and level of interest expressed in journal entries and lesson transcripts.
See Appendix B.3

202
RQ3a. How do POE, NOE and Lecture/Inquiry compare with respect to impact on: (a) how students design, conduct and interpret their own investigation to explain the event Data Source How the Data Will be Used Question/Prompt Examples 1. Journal Entry (day one)
I will examine and compare how observations and interpretations might be influenced by the different experiences of POE and NOE for the same unit. I will compare whether students are better able to identify key features of the demonstration in either POE or NOE for the same unit. I will compare the research questions generated by each class (POE, NOE, lecture/inquiry) in each unit to see whether (a) students develop more questions in one of these experiences, (b) students develop more detailed, rich, elaborate and scientific questions in one of these experiences, (c) students develop a broader range of questions, (d) the questions are testable or investigable (see Appendix C.2). I will compare protocols to examine whether their design is more/less detailed, rigorous, or scientific in any one particular lesson; POE, NOE and Lecture/inquiry (see Appendix C.3). I will be comparing POE, NOE, Lecture/inquiry to determine whether these experiences influence the depth, scientific reasoning, or any other characteristics of the predictions. I will be looking for whether protocol designs show any differences in depth, rigor or detail between POE, NOE and Lecture/inquiry (see Appendix C.3).
1. I made the following important observation(s) of this event: 2. My explanation for this observed phenomenon is:
3. Write down as many research questions as possible to investigate this phenomenon. 4. The question we are going to ask is: 5. Our investigation will follow this procedure: 6. I predict our findings will be: _
3. Journal Entry (day two)
I will examine whether observations are more meaningful and relevant to the research question for either POE or NOE (see Appendix C.4). I will compare the conclusions generated by each class (POE, NOE, Lecture/inquiry) in each unit to assess (a) their level of coherence, (b) their level of generalizability, (c) whether the central concept is articulated (see
1. I made the following important observation(s) while conducting the investigation: 2. My conclusion to the investigation I conducted is:

203
Appendix C.5).
4. Final Journal Entry (day three)
I will be looking for similarities/differences for what students feel are advantageous or not when designing investigations, particularly whether these differences exist between POE and NOE.
1. Which of the 3 units were most valuable to you in setting up and designing your inquiry experience and how?
5. Lesson Transcripts
I will be looking for any evidence that investigations are designed, conducted, or interpreted in different ways between POE, NOE, and L/I.
6. Teacher Log
I will be looking for similarities and differences between the design and interpretation of the investigation between POE, NOE, and L/I. I will be looking for signs of student behavior of inquiry as operationilized for this paper and how these were influenced by POE and NOE.
1. Any comments or observations about the execution of the demonstration and how it could be improved in the future, with particular attention on how much attention was called to the demonstration in order to generate interest in it?
2. Any comments or observations about how students conducted their investigations and the influence the demonstration may have had on it.
3. Were there any elements of the unit that seemed to affect students’ design and execution of their investigations? 4. Any comments or observations of noticeable differences in the three classes.

204
7. Semi-Structure Student Interview
I will be looking for similarities/differences in characteristics of each experience (POE, NOE, and L/I) that students feel are advantageous or not when designing investigations, particularly whether these differences influence their learning experiences.
1. In which of the three investigations do you think you had the best learning experience? What do you think made it a good learning experience? 2. In which of the three investigations do you think you had the least rewarding learning experience? What do you think made it the least rewarding learning experience?

205
RQ3b. How do POE, NOE and Lecture/Inquiry compare with respect to impact on: (b) students’ interest in learning more about the scientific phenomenon under study Data Source How the Data Will be Used Question/Prompt Examples
1. Final Journal Entry (day three)
I will be looking for indications of interest and similarities/differences between POE, NOE, and L/I. I will be looking for signs of interest that extend beyond the classroom, specifically as they are similar/different between POE, NOE, and L/I.
1. On a scale of 1-5, 1 being “the investigation that I designed was useless and did not help me to understand the concept we were studying at all” and 5 being “the investigation that I designed helped me to understand the concept we were studying and made everything clear to me”, what number would you give to the units on: Density ____, Molecular Arrangement ____, and Cohesion ___.
2. Which of the three units did you like the most/least and why?
3. Did you discuss with anyone, or maybe even attempt to repeat, any of the demonstrations that you observed in these units? Briefly explain?
4. Which of the three units were you the most interested in/ least interested in? Specifically

206
which parts? Why? 5. Is there anything about
these three units that you’re still interested in?
6. Is there anything you would change in these units to make them better?
2. Lesson Transcripts
I will be looking for any ways in which interest is shown to be different between POE, NOE and lecture/inquiry in any facet of the units.
3. Teacher Log I will be looking for similarities and differences of student interest between POE, NOE and Lecture/inquiry in any facet of the units. 1. Any comments or
observations about the execution of the demonstration and how it could be improved in the future, with particular attention on how much attention was called to the demonstration in order to generate interest in it?
2. Any comments or observations about the students’ interest and curiosity, and the influence the POE/NOE demonstration may have had on this.
3. Were there any elements of POE/NOE unit that seemed to affect student interest?

207
4. Did any student extend their engagement beyond the class in either POE/NOE?
5. Any comments or observations describing differences noticed in the three classes.
6. What are the similarities and differences between POE and NOE for how students respond or react to what appears to be conflicting information in discrepant events?
4. Semi-
Structured Student Interview
I will be comparing those aspects of POE, NOE and Lecture/inquiry situations that students feel influence their interest in the experiences. 1. Could any part of these units
have been different to increase your level of participation, or interest to participate?

208
C.2. Rating form for quality of research question Students’ Research Questions
1
2
3
4
5
Rigor Question cannot be scientifically investigated.
Question is potentially investigable, but lacks scientific rigor and depth.
Question is investigable, but lacks scientific rigor and depth.
Question is investigable, has scientific rigor but lacks scientific depth.
Question is scientifically investigable with sound scientific rigor, demonstrating depth.
Centrality Question is not central to the concept at hand, does not address observable phenomena or identify a variable. The question will not lead to a deeper understanding of the concept.
Question is not central to the concept at hand. It does address observable phenomena but not which is central to the key concept. A variable is either not clearly identified or is inappropriate. The question probably will not lead to a deeper understanding of the concept.
Question is central to the concept at hand. It does address observable phenomenon but may not be central to the key concept. A variable is either not clearly identified or is inappropriate. The question may lead to a deeper understanding of the concept.
Question is central to the concept at hand. It does address observable phenomenon that is central to the key concept. A variable is identified, but may be inappropriate. The question has good potential to lead to a deeper understanding of the concept.
Question is central to the concept at hand. It does address observable phenomenon that is central to the key concept. An appropriate variable is identified. The question has great potential to lead to a deeper understanding of the concept.
Prediction Suitability
Prediction is not supported by either logical or scientific reasoning. It is not aligned with research question.
Prediction is not supported by either logical or scientific reasoning. It is aligned with research question but does not completely address it.
Prediction is not supported by either logical or scientific reasoning. It is aligned with research question and completely addresses it.
Prediction is supported by logical reasoning. It is aligned with research question and completely addresses it.
Prediction is supported by scientific reasoning. It is aligned with research question and completely addresses it.

209
C.3. Rating form for quality of research design/protocol Protocol
1
2
3
4
5
Rigor Procedure and planned measures lack scientific rigor and depth.
Either procedure or planned measures lack scientific rigor and depth.
Either procedure or planned measures lack scientific rigor or depth.
Either procedure or planned measures have scientific rigor and depth.
Both procedure and planned measures have scientific rigor and depth.
Level of Detail Procedure is incomplete, not logically sequenced and lacking necessary details.
Plan has a useful general approach, but lacks some logical sequence, detail, or clarity- difficult to follow.
Procedure is complete but lacks some logical sequence, detail or clarity.
Procedure is complete, has clarity but lacks complexity.
Procedure is complete and complex, with logical sequence and a high level of clarity,
Appropriateness to research question
Procedure and planned measures are inappropriate to the research question.
Procedure appropriately addresses the research question, but variable not clearly identified or planned measures are inappropriate.
Procedure appropriately addresses the research question, variable identified but lacks strong connection to research question, and planned measures are somewhat appropriate.
Procedure appropriately addresses the research question, with either strong connection to research question or planned measures are clearly appropriate.
Procedure appropriately and strongly addresses the research question, with strong connection to research question and very appropriate planned measures.

210
C.4. Rating form for quality of observation/data analysis Observation/ Data Analysis
1
2
3
4
5
Centrality
Observations are not meaningful or relevant to the question under study.
Observations are somewhat meaningful, but are not directly relevant to the question under study.
Observations are meaningful and relevant to the question under study, but are not always recognized or referred to.
Observations are meaningful and relevant to the question under study, but are inappropriately referred to.
Observations are meaningful and relevant to the question under study and are appropriately referred to.
Data Collection Rigor
Data is generally not collected in a sound, scientifically acceptable manner. Data is inaccurately represented or is missing.
Data is collected in a sound manner, but lacks depth of scientific rigor, and is misrepresented in written form. Necessary graphs/tables are not included.
Data is collected in a sound manner and shows depth of scientific rigor. Data is accurately represented in written form, but necessary graphs/tables are not included.
Data is collected in a sound, scientifically acceptable manner and shows depth of scientific rigor. Data is accurately represented in written form. Necessary graphs/tables are included, but are inappropriately referred to.
Data is collected in a sound, scientifically acceptable manner. Data is efficiently organized, accurately represented and appropriately referred to.
Detail of Observations
Observations lack detail, with no logical analysis.
Observations include details, but do not have scientific basis. Logical analyses of these observations are not made.
Observations include scientific detail, but logical analyses of these observations do not follow.
Observations include scientific detail, and are followed by logical analyses but strong connections are not made from them.
Observations include scientific details, are logically analyzed and appropriately referred to in a scientific manner. Strong connections are made from them.

211
C.5. Rating form for quality of conclusions Conclusion
1
2
3
4
5
Coherence
Conclusion is incoherent, is not clear and does not appear to be based on intelligible connections to observations. Does not apply any reasoning strategies.
Conclusion is coherent, but does not make connections to observations. Conclusion is not scientifically valid or consistent with scientific principles. Attempts to use reasoning strategies, but does so inappropriately or illogically.
Conclusion is coherent, makes connections to observations, but lacks scientific depth or rigor. Not scientifically valid or consistent with scientific principles. Reasoning appears to be appropriate, but lacks scientific rigor or depth.
Conclusion is coherent and consistent with evidence developed from observations. Conclusion is consistent with scientific principles, but lacks depth. Reasoning has appropriate scientific rigor.
Conclusion is clear and cogent, making strong, intelligible connections to observations. Conclusion is scientifically valid and consistent with scientific principles. Reasoning is appropriate and has scientific depth.
Generalizations Generalization is not made.
Generalization is made, but does not draw from experience, or is inappropriate scientifically or for the situation.
Generalization draws from experience, but is inappropriate scientifically or for the situation.
Generalization draws from experience, and is either appropriate scientifically or for the situation. May not seem to understand scope of generalizations.
Generalization draws from experience, and is appropriate both scientifically and to the situation. Seems to understand scope of generalizations.
Central Concept Articulation
Central concept is not addressed.
Central concept is addressed, but does not appear to be well understood.
Central concept is addressed and appears to be understood at a minimal level.
Central concept is addressed and appears to be clearly understood.
Central concept is addressed and student appears to have a deep understanding of it.

212
Appendix D.1
Number of investigable research questions per student.
Number of investigable RQ's per student 0 1 2 3 4 5 6 7 8 9 11 Unit 1 (Density) Ave. # st's 1.7 Period 1 (POE) 1.4 15 10 4 1 Period 3 (L/I) 1.5 16 1 9 3 3 Period 8 (NOE) 2.3 13 1 2 3 6 1 Unit 2 (Gas Molecules) 2.9 Period 1 (L/I) 0.8 17 7 7 3 Period 3 (NOE) 4.8 16 1 1 3 3 2 3 2 1 Period 8 (POE) 3.3 14 4 4 4 2 Unit 3 (Cohesion) 3.5 Period 1 (NOE) 4.4 16 1 2 3 4 1 2 2 1 Period 3 (POE) 4.8 16 1 2 6 2 3 1 1 Period 8 (L/I) 1.5 14 1 6 6 1
Average POE: 3.2 Average NOE: 3.8 Average L/I: 1.3

213
Appendix D.2
Rating for rigor of research questions.
*Note: See Appendix C.2 rubric used in this analysis.
Average and % of students receiving each rating
UNIT 1 (Density) Ave. # st's 1 2 3 4 5
3.4 46 Per 1 (POE- 16 students) 3.1 16 0 4 6 6 0 0% 25% 38% 38% 0% Per 3 (L/I- 16 students) 2.8 16 3 2 7 4 0 19% 13% 44% 25% 0% Per 8 (NOE- 14 students) 4.4 14 0 0 0 8 6 0% 0% 0% 57% 43% UNIT 2 (Gas Molecules) 2.7 46 Per 1 (L/I- 16 students) 1.9 16 8 3 4 1 0 50% 19% 25% 6% 0% Per 3 (NOE- 17 students) 3.7 17 0 0 7 8 2 0% 0% 41% 47% 12% Per 8 (POE- 13 students) 2.5 13 3 4 3 2 1 23% 31% 23% 15% 8% UNIT 3 (Cohesion) 3.2 46 Per 1 (NOE- 16 students) 3.1 16 1 2 8 5 0 6% 13% 50% 31% 0% Per 3 (POE- 16 students) 3.6 16 0 1 7 5 3 0% 6% 44% 31% 19% Per 8 (L/I- 14 students) 2.9 14 2 4 4 1 3 14% 29% 29% 7% 21% Average POE 3.1 Average NOE 3.7 Average L/I 2.5

214
Appendix D.3
Rating for centrality of each research questions.
*Note: See Appendix C.2 rubric used in this analysis.
Average and % of students receiving each rating
UNIT 1 (Density) Ave. # st's 1 2 3 4 5
3.7 46 Per 1 (POE- 16 students) 2.8 16 4 2 4 6 0 25% 13% 25% 38% 0% Per 3 (L/I- 16 students) 4.3 16 2 0 1 2 11 13% 0% 6% 13% 69% Per 8 (NOE- 14 students) 4.0 14 0 2 1 6 5 0% 14% 7% 43% 36% UNIT 2 (Gas Molecules) 3.0 46 Per 1 (L/I- 16 students) 2.3 16 4 8 0 3 1 25% 50% 0% 19% 6% Per 3 (NOE- 17 students) 3.7 17 1 3 2 5 6 6% 18% 12% 29% 35% Per 8 (POE- 13 students) 2.9 13 3 3 0 6 1 23% 23% 0% 46% 8% UNIT 3 (Cohesion) 3.7 46 Per 1 (NOE- 16 students) 3.1 16 0 5 6 3 2 0% 31% 38% 19% 13% Per 3 (POE- 16 students) 4.6 16 0 1 1 2 12 0% 6% 6% 13% 75% Per 8 (L/I- 14 students) 3.4 14 2 4 0 3 5 14% 29% 0% 21% 36% Average POE 3.4 Average NOE 3.6 Average L/I 3.3

215
Appendix D.4
Rating for prediction suitability of research questions.
*Note: See Appendix C.2 rubric used in this analysis.
Average and % of students receiving each rating
UNIT 1 (Density) Ave. # st's 1 2 3 4 5
1.9 46 Per 1 (POE- 16 students) 1.8 16 7 5 4 0 0 44% 31% 25% 0% 0% Per 3 (L/I- 16 students) 1.9 16 7 5 2 2 0 44% 31% 13% 13% 0% Per 8 (NOE- 14 students) 2.1 14 3 8 2 1 0 21% 57% 14% 7% 0% UNIT 2 (Gas Molecules) 1.8 46 Per 1 (L/I- 16 students) 2.0 16 1 14 1 0 0 6% 88% 6% 0% 0% Per 3 (NOE- 17 students) 1.8 17 4 12 1 0 0 24% 71% 6% 0% 0% Per 8 (POE- 13 students) 1.6 13 5 8 0 0 0 38% 62% 0% 0% 0% UNIT 3 (Cohesion) 2.4 46 Per 1 (NOE- 17 students) 1.9 17 4 10 3 0 0 24% 59% 18% 0% 0% Per 3 (POE- 17 students) 2.6 17 1 8 5 3 0 6% 47% 29% 18% 0% Per 8 (L/I- 12 students) 2.7 12 1 6 2 2 1 8% 50% 17% 17% 8% Average POE 2.0 Average NOE 1.9 Average L/I 2.2

216
Appendix D.5
Rating for protocol rigor
*Note: See Appendix C.3 rubric used in this analysis.
Average and % of students receiving each rating
UNIT 1 (Density) Ave. # st's 1 2 3 4 5
2.7 46 Per 1 (POE- 16 students) 2.8 16 3 2 7 4 0 19% 13% 44% 25% 0% Per 3 (L/I- 16 students) 2.6 16 3 4 6 3 0 19% 25% 38% 19% 0% Per 8 (NOE- 14 students) 2.8 14 1 4 6 3 0 7% 29% 43% 21% 0% UNIT 2 (Gas Molecules) 2.9 46 Per 1 (L/I- 16 students) 2.5 16 4 5 3 3 1 25% 31% 19% 19% 6% Per 3 (NOE- 17 students) 3.3 17 2 2 5 5 3 12% 12% 29% 29% 18% Per 8 (POE- 13 students) 2.8 13 1 5 3 4 0 8% 38% 23% 31% 0% UNIT 3 (Cohesion) 2.8 45 Per 1 (NOE- 17 students) 2.4 17 5 6 2 3 1 29% 35% 12% 18% 6% Per 3 (POE- 16 students) 3.2 16 2 3 4 4 3 13% 19% 25% 25% 19% Per 8 (L/I- 12 students) 3.1 12 0 4 3 5 0 0% 33% 25% 42% 0% Average POE 2.9 Average NOE 2.8 Average L/I 2.7

217
Appendix D.6
Rating for protocol detail
*Note: See Appendix C.3 rubric used in this analysis.
Average and % of students receiving each rating
UNIT 1 (Density) Ave. # st's 1 2 3 4 5
3.1 46 Per 1 (POE- 16 students) 3.1 16 2 4 2 6 2 13% 25% 13% 38% 13% Per 3 (L/I- 16 students) 3.1 16 1 3 6 6 0 6% 19% 38% 38% 0% Per 8 (NOE- 14 students) 3.1 14 0 5 4 4 1 0% 36% 29% 29% 7% UNIT 2 (Gas Molecules) 2.7 46 Per 1 (L/I- 16 students) 2.4 16 5 4 4 2 1 31% 25% 25% 13% 6% Per 3 (NOE- 17 students) 2.8 17 3 5 4 3 2 18% 29% 24% 18% 12% Per 8 (POE- 13 students) 3.0 13 2 2 3 6 0 15% 15% 23% 46% 0% UNIT 3 (Cohesion) 3.0 45 Per 1 (NOE- 17 students) 2.5 17 6 5 0 4 2 35% 29% 0% 24% 12% Per 3 (POE- 16 students) 3.4 16 2 3 2 5 4 13% 19% 13% 31% 25% Per 8 (L/I- 12 students) 3.4 12 2 0 2 7 1 17% 0% 17% 58% 8% Average POE 3.2 Average NOE 2.8 Average L/I 2.9

218
Appendix D.7
Rating for Appropriateness of Protocol to Research Question
*Note: See Appendix C.3 rubric used in this analysis.
Average and % of students receiving each rating
UNIT 1 (Density) Ave. # st's 1 2 3 4 5
2.8 46 Per 1 (POE- 16 students) 2.9 16 2 4 4 6 0 13% 25% 25% 38% 0% Per 3 (L/I- 16 students) 2.5 16 3 5 5 3 0 19% 31% 31% 19% 0% Per 8 (NOE- 14 students) 3.0 14 0 4 6 4 0 0% 29% 43% 29% 0% UNIT 2 (Gas Molecules) 2.9 46 Per 1 (L/I- 16 students) 2.2 16 4 7 3 2 0 25% 44% 19% 13% 0% Per 3 (NOE- 17 students) 3.3 17 2 2 5 5 3 12% 12% 29% 29% 18% Per 8 (POE- 13 students) 3.3 13 0 2 5 6 0 0% 15% 38% 46% 0% UNIT 3 (Cohesion) 2.9 45 Per 1 (NOE- 17 students) 2.2 17 4 7 4 2 0 24% 41% 24% 12% 0% Per 3 (POE- 16 students) 3.3 16 1 3 5 4 3 6% 19% 31% 25% 19% Per 8 (L/I- 12 students) 3.4 12 0 1 5 6 0 0% 8% 42% 50% 0% Average POE 3.2 Average NOE 2.8 Average L/I 2.6

219
Appendix D.8
Rating for Centrality of Observations
*Note: See Appendix C.4 rubric used in this analysis.
Average and % of students receiving each rating
UNIT 1 (Density) Ave. # st's 1 2 3 4 5
2.7 46 Per 1 (POE- 16 students) 2.4 16 2 5 9 0 0 13% 31% 56% 0% 0% Per 3 (L/I- 16 students) 2.8 16 3 2 6 5 0 19% 13% 38% 31% 0% Per 8 (NOE- 14 students) 2.9 14 1 2 9 1 1 7% 14% 64% 7% 7% UNIT 2 (Gas Molecules) 2.6 46 Per 1 (L/I- 16 students) 2.5 16 3 5 5 3 0 19% 31% 31% 19% 0% Per 3 (NOE- 17 students) 2.8 17 2 3 9 2 1 12% 18% 53% 12% 6% Per 8 (POE- 13 students) 2.5 13 1 4 8 0 0 8% 31% 62% 0% 0% UNIT 3 (Cohesion) 2.6 45 Per 1 (NOE- 17 students) 2.2 17 3 9 4 0 1 18% 53% 24% 0% 6% Per 3 (POE- 16 students) 2.9 16 1 4 7 4 0 6% 25% 44% 25% 0% Per 8 (L/I- 12 students) 2.9 12 2 3 3 2 2 17% 25% 25% 17% 17% Average POE 2.6 Average NOE 2.6 Average L/I 2.7

220
Appendix D.9
Rating for Data Collection Rigor
*Note: See Appendix C.4 rubric used in this analysis.
Average and % of students receiving each rating
UNIT 1 (Density) Ave. # st's 1 2 3 4 5
2.3 46 Per 1 (POE- 16 students) 1.9 16 5 8 2 1 0 31% 50% 13% 6% 0% Per 3 (L/I- 16 students) 2.5 16 3 5 6 1 1 19% 31% 38% 6% 6% Per 8 (NOE- 14 students) 2.6 14 2 5 4 3 0 14% 36% 29% 21% 0% UNIT 2 (Gas Molecules) 2.6 46 Per 1 (L/I- 16 students) 2.5 16 3 6 4 2 1 19% 38% 25% 13% 6% Per 3 (NOE- 17 students) 2.8 17 2 4 8 2 1 12% 24% 47% 12% 6% Per 8 (POE- 13 students) 2.5 13 2 2 9 0 0 15% 15% 69% 0% 0% UNIT 3 (Cohesion) 2.9 45 Per 1 (NOE- 17 students) 2.6 17 3 6 4 2 2 18% 35% 24% 12% 12% Per 3 (POE- 16 students) 3.1 16 2 3 5 3 3 13% 19% 31% 19% 19% Per 8 (L/I- 12 students) 2.8 12 1 4 5 0 2 8% 33% 42% 0% 17% Average POE 2.5 Average NOE 2.7 Average L/I 2.6

221
Appendix D.10
Rating for Detail of Observations
*Note: See Appendix C.4 rubric used in this analysis.
Average and % of students receiving each rating
UNIT 1 (Density) Ave. # st's 1 2 3 4 5
2.6 46 Per 1 (POE- 16 students) 2.5 16 1 7 7 1 0 6% 44% 44% 6% 0% Per 3 (L/I- 16 students) 3.0 16 0 5 7 3 1 0% 31% 44% 19% 6% Per 8 (NOE- 14 students) 2.4 14 3 5 4 2 0 21% 36% 29% 14% 0% UNIT 2 (Gas Molecules) 2.6 46 Per 1 (L/I- 16 students) 2.8 16 2 4 6 3 1 13% 25% 38% 19% 6% Per 3 (NOE- 17 students) 2.6 17 1 8 5 3 0 6% 47% 29% 18% 0% Per 8 (POE- 13 students) 2.4 13 2 5 5 1 0 15% 38% 38% 8% 0% UNIT 3 (Cohesion) 2.9 45 Per 1 (NOE- 17 students) 2.4 17 1 10 4 2 0 6% 59% 24% 12% 0% Per 3 (POE- 16 students) 2.8 16 1 7 3 5 0 6% 44% 19% 31% 0% Per 8 (L/I- 12 students) 3.8 12 0 1 4 4 3 0% 8% 33% 33% 25% Average POE 2.6 Average NOE 2.5 Average L/I 3.1

222
Appendix D.11
Rating for coherence of conclusions.
*Note: See Appendix C.5 rubric used in this analysis.
Average and % of students receiving each rating Rating: 1 2 3 4 5
Ave. # st's
UNIT 1 (Density) 2.5 46 Period 1 (POE) 2.1 16 4 7 4 1 0 25% 44% 25% 6% 0% Period 3 (L/I) 2.6 16 3 3 7 3 0 19% 19% 44% 19% 0% Period 8 (NOE) 2.6 14 3 4 3 3 1 21% 29% 21% 21% 7% UNIT 2 (Gas Molecules) 1.9 46 Period 1 (L/I) 2.4 16 2 5 9 0 0 13% 31% 56% 0% 0% Period 3 (NOE) 1.5 17 9 7 1 0 0 53% 41% 6% 0% 0% Period 8 (POE) 1.6 13 8 2 3 0 0 62% 15% 23% 0% 0% UNIT 3 (Cohesion) 1.9 46 Period 1 (NOE) 1.8 17 5 10 2 0 0 29% 59% 12% 0% 0% Period 3 (POE) 2.0 17 5 8 3 1 0 29% 47% 18% 6% 0% Period 8 (L/I) 2.0 12 4 5 2 1 0 33% 42% 17% 8% 0% Average POE 1.9 Average NOE 2.0 Average L/I 2.4

223
Appendix D.12
Rating for Central Concept Articulation of conclusions.
*Note: See Appendix C.5 rubric used in this analysis.
Average and % of students receiving each rating Rating: 1 2 3 4 5
Ave. # st's
UNIT 1 (Density) 2.4 46 Period 1 (POE) 1.9 16 9 2 3 2 0 56% 13% 19% 13% 0% Period 3 (L/I) 3.1 16 5 0 0 10 1 31% 0% 0% 63% 6% Period 8 (NOE) 2.2 14 7 2 2 1 2 50% 14% 14% 7% 14% UNIT 2 (Gas Molecules) 1.7 46 Period 1 (L/I) 2.1 16 6 5 3 2 0 38% 31% 19% 13% 0% Period 3 (NOE) 1.2 17 14 2 1 0 0 82% 12% 6% 0% 0% Period 8 (POE) 1.9 13 6 4 2 0 1 46% 31% 15% 0% 8% UNIT 3 (Cohesion) 1.3 46 Period 1 (NOE) 1.0 17 17 0 0 0 0 100% 0% 0% 0% 0% Period 3 (POE) 1.2 17 15 0 2 0 0 88% 0% 12% 0% 0% Period 8 (L/I) 2.0 12 7 2 0 2 1 58% 17% 0% 17% 8% Average POE 1.7 Average NOE 1.4 Average L/I 2.4

224
Appendix D.13
Independent observer engagement data.
Percentage of Students Observed as Engaged According to Date and Unit Average per Unit UNIT 1 (Density) 9/29/2009 55% Period 1- POE 59% Period 3- L/I 44% Period 8- NOE 62% UNIT 2 (Gas Mol) 10/14/2009 41% Period 1- L/I 18% Period 3- NOE 56% Period 8- POE 50% UNIT 3 (Cohesion) 10/22/2009 45% Period 1- NOE 57% Period 3- POE 47% Period 8- L/I 31% "Average" L/I 31% "Average" POE 52% "Average" NOE 58%

225
Appendix D.14
Students’ rating for interest in each unit
(as rated immediately after the demonstration/lecture)
On a scale of 1-5, 1 being “I’m not interested at all and don’t want to know anything more about this”, and 5 being “I’m extremely interested and really want to know more about this”,
rank your level of interest in investigating this phenomenon and tell me why it is or is not interesting to you.
Average and % of students rating Unit 1/ Day 1 (Density) Ave. #st's 1 2 3 4 5 3.7 44 Per 1 (POE- 16 students) 3.4 16 1 2 5 5 3 6% 13% 31% 31% 19% Per 3 (L/I- 16 students) 4.3 16 0 0 5 2 9 0% 0% 31% 13% 56% Per 8 (NOE- 12 students) 3.3 12 1 1 6 2 2 8% 8% 50% 17% 17% Unit 2/ Day 1 (Gas Molecules) 4.0 48 Per 1 (L/I- 17 students) 3.7 17 0 2 6 4 5 0% 12% 35% 24% 29% Per 3 (NOE- 17 students) 4.1 17 0 2 2 6 7 0% 12% 12% 35% 41% Per 8 (POE- 14 students) 4.1 14 0 0 5 2 7 0% 0% 36% 14% 50% Unit 3/ Day 1 (Cohesion) 3.9 45 Per 1 (NOE- 16 students) 4.1 16 0 1 3 5 7 0% 6% 19% 31% 44% Per 3 (POE- 16 students) 4.0 16 0 0 5 6 5 0% 0% 31% 38% 31% Per 8 (L/I- 14 students) 3.4 13 0 2 6 3 2 0% 15% 46% 23% 15% Average POE 3.8 Average NOE 3.9 Average L/I 3.8

226
Appendix D.15
Students’ rating for interest of each unit following the final class reflection.
On a scale of 1-5, 1 being “I was not interested in any part of this unit” and 5 being “I was completely interested in this entire unit”, what number would you give to the units on:
Density ____, Molecular Arrangement ____, and Cohesion ___.
Average and % of students rating Rating: 1 2 3 4 5
Ave. # st's
Period 1 3.8 42 Density (POE) 3.6 14 0 1 5 6 2 0% 7% 36% 43% 14% Gal Mol (L/I) 3.8 14 0 1 4 6 3 0% 7% 29% 43% 21% Cohesion (NOE) 4.1 14 0 2 1 5 6 0% 14% 7% 36% 43% Period 3 3.5 48 Density (L/I) 3.4 16 1 3 4 4 4 6% 19% 25% 25% 25% Gas Mol (NOE) 4.5 16 1 0 1 2 12 6% 0% 6% 13% 75% Cohesion (POE) 2.4 16 5 4 3 3 1 31% 25% 19% 19% 6% Period 8 3.5 39 Density (NOE) 3.2 13 0 2 7 3 1 0% 15% 54% 23% 8% Gas Mol (POE) 4.4 13 0 1 1 3 8 0% 8% 8% 23% 62% Cohesion (L/I) 2.9 13 4 0 4 3 2 31% 0% 31% 23% 15% Average POE 3.4 Average NOE 4.0 Average L/I 3.4

227
Appendix D.16
Students’ rating for value of each unit following final class reflection.
Average and % of students rating Rating: 1 2 3 4 5
Ave. # st's
Period 1 3.8 42 Density (POE) 3.5 14 0 2 6 3 3 0% 14% 43% 21% 21% Gal Mol (L/I) 3.5 14 0 3 4 4 3 0% 21% 29% 29% 21% Cohesion (NOE) 4.4 14 0 0 3 3 8 0% 0% 21% 21% 57% Period 3 3.2 48 Density (L/I) 3.8 16 0 3 4 3 6 0% 19% 25% 19% 38% Gas Mol (NOE) 3.6 16 1 3 2 5 5 6% 19% 13% 31% 31% Cohesion (POE) 2.3 16 3 7 5 1 0 19% 44% 31% 6% 0% Period 8 3.5 39 Density (NOE) 3.4 13 1 3 2 4 3 8% 23% 15% 31% 23% Gas Mol (POE) 3.9 13 0 1 3 5 4 0% 8% 23% 38% 31% Cohesion (L/I) 3.3 13 1 3 4 1 4 8% 23% 31% 8% 31% Average POE 3.2 Average NOE 3.8 Average L/I 3.5

228
Appendix D.17
Unit 2- POE: Research questions, predictions and conclusions developed by each student
Research Question Prediction Conclusion
1. if you put an overflow can in upsidedown into water and vegtible oil, would the inside get wet because of the liquad of the vegtible oil push up the molucles keeping the can drie?
i predict that the overflow can that is put into the beaker containig vegtible oil will be wet on the inside and the overflow can with thats in the beaker with water wont be drie.
that even though the vegtible oil is dencer than the water , its still not enough to push the molucles up.
2. Does water molecules push out the gas molecules and particels out of a object.
The air will push out of the cup and leave the beaker.
My conculions is that the molecules in water can push the molecules and particles out of a gas and move the gas right out of the object.
3. for our experment we will see if air molecuals will react the same way if the beaker are an unusal shape
i predict that both towels will stay dry.
My conclusion is that the paper towels stayed dry because of the air molicules.
4. can water pus water out of a cup
i predict the air will come out
that water molecules are stronger than air molecules.
5. Our expirement is going to question whether temp changes the gas molecuels.
I think the temp will afect the molecuels. I think the cushy bals in the hot water will get wet.
I conclude that temp makes a difference how the cup is diplacing the water.I conclude this because the ball did not get wet in the hot water. The is because when something is heated the molecuels get less denseley packed.
6. Does it matter what the amount of air molecules are to effect the results?
I think the small beaker with less will not get wet.
I conclude that the amount of air molcules doesn't matter because both didn't get wet. The more you repeat the experiment,the wetter it will get.
7. For our expirement we are seeing if the air molecules will react by floating outside the beaker even if the shape is unorthodox.
I predict that the paper towel will slow the the realese of the air molecules but the paper towel will remain dry.
After conducting this expirement we observed that the unortodox shape and the extra paper towel did have an effct. We beleive that the the beaker taking up space in the other beaker couled with the extra paper towel

229
kept air molecules inside the beakers. This explians why the beakers were floating and the lconstant air release.
8. Wwill a cup with a hole in the side affect the gas taking up space than a cup with the hole in the top?
I predict that the paper towel will be dry with the one with a hole in the side, and wet with the other one.
The cup with the hole in the top and paper towel did get wet, it also bubbled, and the cup with the hole in the side with paper towel in it did not get wet, and did not bubble.
9. will a cup with a hole in the side affect the gas taking up space than a cup with a hole in the top?
that the one with the hole on the side of the cup will stay dry and the cup with the hole on the top will get wet.
My hypothisis was that both cups would have water in them because the air molecules would escape from the holes. I was half wrong. The cup with the hole in the side stayed dry because the air had no place to go because the water was blocking the hole.
10. Would the paper towel still stay dry if we used a different sized container, like a graduated cylinder.
I predict that the paper towel will stay dry
I was wrong because I thought that the sponge would stay dry.
11. Does cold or hot water make a difference on the gas molecules
The koshy balls will get wet The gas molecules are packed tighter in hot water
12. does it matter what the amount of air molecules are to effect the results?
I predict that our findings will be that the beaker with less paper will have more molecules thatn the one with more paper.
I conclued that the more paper towel in the beaker the more wet it will get. I also concluded that the one with more paper towel takes in more water when put underwater. If we put the beakers in fast the one with less paper towel gets wet as well as the one with more aper towel.
13. What if you used a different sized object, but still used a wad of paper?
dont think that the paper towel will get wet at all even though it is in a different shaped container, like a graduated cylinder. I think that any container with
My conclusion is that the sponge got a little wet at the top. i think that because the graduated cylinder is more thin than the beaker, so the water will get pushed up

230
sides that are surrounding the paper towel will not get wet.
more.

231
Appendix D.18
Unit 2- NOE: Research questions, predictions and conclusions developed by each student
Research Question Prediction Conclusion
1. To see if the air excapes if we have no wight.
that the air will come out That the air came out
2. If the air will escape if there is no wight on top of the beaker
The water will fill the smaller beaker with water.
The water will not fill the small baeker unless the small small beaker is tilted
3. What would happen if you put the beaker in the other way around and covered it with something? Would the cover come off? Would it be filled with water?
I think that water may leak in as we put it in because of the spout but maybe it might not leak out until later.
To keep the paper towel dry, the container needs a little more of a cover than a weight so that the water doesn't leak in and that the oxygen does not go out.
4. if you had a two diffrent liquids what will happen with the expirement would it change in any way.
i predict that the expirement will not change from the expirement we did in class
in my conclusion i conlude that the water/ with vegetable oil changed the expirement than just water. adding the vegetable oil made the paper towel inside of the little beaker get wet. the beker with just water stayed dry just as we thought. doing this expirement changed are thoughts a tiny bit.
5. dos the shape of the contaner change anything
i dont think that it rely matter itll not fill with water
i was right it dident make a diference they both stayed drie it did not matter the shape
6. What would happen if you used a different type of a liquid for the experiment?
1. Explosion 2. Gas 3. Same result as water 4.Small beaker rises up
The vegetable oil came with different results than water because it could make air sockets and because of its thickness it takes more time for it to fill up the small beaker.
7. What woould happen if oneself was to put the beaker upside down? And if it was covered?
It will get wet. My conclusion is that silly putty is the answer to all of life's problems, NOT. Actually I observed a lot of things like the weight kept the beaker down that's about all.

232
8. if we put food coloring and sugar and salt in the water then put a paper in the small beaker what would happen??
the paper did not get wet at all in this experiment.
9. What would happen if you poured the water into the large beaker after the small beaker was already turned upside down on the bottom of the large beaker with the weight on top?
I think that the control will hold the water out longer.
I conclude from doing this experiment that if you put a beaker in a bucket before the water is poured in the bucket the air molecules do not get pushed out of the beaker any faster than they would if you put the beaker in after the water was poured. I conclude this because the water rised in both beakers at the same, slow rate.
10. would it make a difference if we changed the shape of the small becer
it will not make a difference if you put the container in upside down then it wont get wet but if you put it in right side up then it will because the water gets in the container.
11. does the shape of the container chnge anything?
it wont matter, neither will fill with water.
if you put a continer in the right way, upside down, the paper towel will stay dry. i did nt matter that the containers wrer different shapes and sizes. our hypothesis was correct.
12. What would happen if you used a different kind of liquid for the same experiment?
I predict no matter what kind of liquid, the same result will happen of the water.
In doing this experiment, we have concluded that, if you put a generally small, glass beaker upside down with a weight on it and have it surrounded by water or oil in a generaly large container, the small container will contain the air inside. Conclusion Statement: Normal air to our knowlege will try to go up,(if it's in water or oil) if it's in a large enough quantity.

233
13. Would would hapen if we added food coloring, sugar, and salt in the water, would it affect the napkin being wet??
I predict that the water will not go inside the small beaker and the napkin will stay dry.
The paper towel remained dry in this experiment.
14. if you had two different liquids would it effect anything? (you would have to have two beakers for the different liquids)
that the veggie water and the regular water will have the same results
my predictions were wrong and so was my observstion, the veggie-oil-beaker-paper-towel did get wet and the water-beaker-paper-towel did not. I conclude that the water still will not get the paper towel wet.
15. What would happen if you put a differnet liquid into the beaker?
I perdict that the papper towel will stay dry.
We thought that all the water would rush in. It dosent nake sence how it wouldnt rush in right when we put it in. We kept on trying and trying but the water would not make the sponge wet.
16. what if you poured the water in the large beaker after the small beaker upside down in the large beaker with the weight on top.
that the control will hold the water out longer.
changing the order and put the beaker in before we put the water in won't make a differance in gas molecules even if more water pressure is put on the beaker and air molecules
17. what would happen if you put a differant liqued into the beaker?
I predict that the paper towl will stay dry.
That even though we used the salt water insted of regular water, it had the same effect. The sponge did not get wet insted it stayed dry. the sponge that was inside the smaller beaker, we thought that te water would go straight up once we put the beaker with he sponge into the water, we thought as the beaker got pushed down into the bigger beaker that the water would go up inside the beaker and hit the sponge atimmaticly. But the water did not tutch the sponge at all.

234
Appendix D.19
Unit 2- L/I: Research questions, predictions and conclusions developed by each student
Research Question Prediction Conclusion
1. will air stay in a balloon when you fiil it with air, don't tie it, then put it under water?
half of the air will stay in the baloon, and the other half will fill with the water.
my conclusion is that the air in the baloon must have had volume to fill the balloon, and the gas reacted in the balloon by rushing out of the balloon and pushing the water away, and that force made it so no water went in the balloon, untill almost all the air was out of the balloon.
2. what will happen if u fill a huge beaker with water then fill a balloon with water and red food coloring then pop it under the water?
i predict that the balloon will float and it will look very cool when we pop it espiecaly with the food coloring.
that the corn syrup reduced the the explosion and made the bubles rise slower
3. will air stay in a baloon when you fill it with air, don't tie it then put it under water?
i predict that all of the air in the baloon will go out but it will make te water all wavey.
my conclusion is the air had volume to fill the baloon and when it was in the water and we let go it was reacting by rushing out of the baloon.and when air is rushing out not alot of water will fill it in.
4. Will Air take up space and push the corn syrup out the way?
that the air will push the corn syrup out the way
that air takes up space in water and out of water and depending on the volume of the air it takes up more space because there wasn't that much air in the balloon because we completely filled it up with oil and the oil still came rushing to the surface
5. What will happen if you pop a balloon under water?
I predict that maybe the gas will empty and go above the water.
That gas has volume because I think that when the balloon got popped the water came out because the air took up that space.
6. if we where to take a balloon and fill it half with air and half with water and
i think that the air will drain pretty fast.
that the air leakes out about twice as fast as the water. also air has some mass

235
poked a hole in the balloon how fast would the air leak out?
because when you squeezed the balloon it would come out faster. and when wwe did this with the water it actually made the hole bigger.
7. If we filled a ballown will water and when it is under water and we will pop it what will happen?
I predict after we pop it the air bubbles will float to the top.
Is that means the air takes up space because the air got pushed up to the top so te volume just came strait up.
8. What would happen if we popped a balloon underwater?
I predict that the larger balloon will have many bubbles and the smaller balloon's bubbles will come up faster with less bubbles.
I concluded that air does have volume to be able to travel through water, and the air travels very fast through the water, so fast, we didn't even see it happen.
9. we are going to put a ballon under water and pop it
the air will explode up and out of the balllon
If air is in alot of pressure, when popped it will release really fast.
10. what happens when you pop a ballon under water
i predict that when we pop it it is going to expand the water and it going to be a big air bubble
is if we put alot of presure on the air then pop it. Then it would make a big pop becasue we put pressure on it.
11. If we put something in a ballon and then filled it with air will it sink? Afterwards pop it in the water what will happen?
The ballon will sink and after popping it air bubble will float up.
The balloon popped and the air bubbles were to fast to see what happened but we did the marbles sink down.
12. What will happen if we fill two balloons (one filled with food coloring, cooking oil and air, the other with just air.), put them under water, and pop them? (what will the air do? does it make a difference?)
I predict that the balloon will float, even with the food coloring and when we pop it, the entrails will float up to the top and the food coloring will disperse.
When we popped the balloons, the cooking oil slowed the air flow from the water. In this way, some of the air got caught. With the ballon that only had air, it flew out of the water making a big splash. So yes, the water takes up space and makes a difference.
13. how long will it take gas particles to get out if we filled a balloon half full of water and half full of air then poppped a hole
the gas particles will take around 30 seconds to escape
it takes about 24 seconds for gas molecules to escape a balloon half full of air, and half full of water.
14. Does water flow ito a cup when put under water
the small beaker will stay empty
The test tube, the beaker, and the small beaker with

236
upsidown. the sponge ball in it stayed completly empty, or dry on the inside even when put totally underwater. This proves that air takes up spce because it took up all the space in the beaker/test tube and didn't allow water to get in.
15. If u squeeze it will the balloon decrease or increase its volume or will it pop or take up space
The vegi oil in the balloon will take up more space
The oil has more gas than water in a balloon.
16. Will air take up space and push corn syrup out of the way?
I think the corn syrup won't go different directions because corn syrup is stronger than water.
Air really does have mass and take up space.

237
Appendix D.20
Unit 3- POE: Research questions, predictions and conclusions developed by each student
Research Question Prediction Conclusion
1. What would happen if we used a thiker liqud, like corn syrupe?
That there will be a bigger buble than the water peney.
That the water, because it has less density can fill up more of the penny that vegaptel oil.
2. What if you use different liquids compared to water and see what liquid can have more drops.
The oil will hold less drops than the water on the penny
The oil can hold more drops on the penny then the drops of water on the penny.
3. Would a thicker liquid , like syrup, stay on the penny better?
I think that the vegetable oil molecules might not hold themselves together as well as the water because it is a different kind of liquid and I think that it won't form such a big bubble of liquid.
Dropping water on a penny, you will get about a third more drops than vegetable oil.
4. we are going to compare a diffrent liquids on the penny we will see if the penny with water on it will take more dropsof water than a penny with vegtable oil on it
i predict that the penny with water on it will take more drops than the penny with vegetable oil because it is thicker than water
i conclude that the penny that we put vegetable oil on took more drops than the penny we put water on. so we proved that the penny with vegetable oil on it can take more drops with a penny with water on it.
5. differnt heat of water, how would that change tha expirement
i prodict that the cold water will hold more
that it dosnt mater if the water is hot or cold they are the same
6. What would happen if we used cooking oil and a penny?
I predict that the vegetable oil will fit less drops on the penny than water.
The conclusion to this investigation is that vegetable oil has more density than water so it fits less drops on a penny than water.
7. we could try differant heats of water, how would that change the ammount of drops it holds?
I predict that the penny that is cold will hold more water than then hot one.
I observed that the ammounts held were the same every time, so we are a bit inconclusive at this point. Actually that's my conclusion.
8. what is the result if u change the temp.
i predict that the cold one will hold te least cause it might reeze the water the
i conclued that the cold penny holds more than the hot penny and the room

238
normal one will hold more then the hot one will evaporate the water so it will hold more than all the others.
temp. penny
9. How would the results vary if we froze the penny and then put the water droplets on it?
I predict that the frozen penny will hold less water than a penny that is kept at room temperature.
I conclude that a frozen penny and a penny kept at room temperature hold the same amount of water, therefore temperature does not have an affect on how much water a penny can hold. This may seem like a strange conclusion because the variable held less water than the control, but I still think this because I believe that there were some variables that were not taken into account. For example, the frozen penny was moldy and rusted, and maybe the drops of water that we put on the frozen penny were larger than the drops of water that were put on the room temperature penny. Also, we compared our results with another group that did the same experiment, and their frozen penny held more water than the room temperature penny. So, all in all, I believe that temperature does not have an affect on how much water a penny can hold.
10. what is the result if we change the temp of the penny.
i predict that the frozen penny will hold less water because the the water will slip off and i think the room temp. peny will hold the most and the hot penny will hold less because i think the watefr will evaporate
my prediction was a little off sincethe cold one held more and the hot one held less and the room temp held the most

239
11. What would happen if we used vegetable oil?
I think less vegetable oil will stay on the penny than water, becuse it is less packed and dense , so the bubble wont hold.
The penny did not hold as much vegatable oil as water. The penny spilled over with 26 drops of oil ad with 37 drops of water. I guessed the penny would hold less. I think it happened because vegetable oil is less dense, and he molecules are farther apart. theydo not hold together as well so they fell apart
12. How would a frozen penny compare to a normal penny if you dropped water on the penny.
I predict that it will take fewer drops for the water to over flow the penny.
Well, our since our variable had slightly different results than the control, we compared our results with another group who conducted the same experiment and their frozen penny held four more drops of water than ours did. Also our frozen penny was moldy. This is why we think the frozen penny held less water. There were probably also many other small changes and differences between our and there experiment. Our main conclusion is that the temperature of the penny doesn't effect how many drops of water a penny can hold.
13. What would happen if we used cooking oil and a quarter?
I predict that the vegetable oil will fit the same amount of drops on the penny as the water on the penny.
My conclusion to the investigation I conducted is that water is able to fit more amounts of drops on the penny than oil because oil is thicker than water.
14. we have two pennys, one with just water and one with soda, what will happen?
I predict that the vegtable oil will break sooner because it is thicker and it is heavier so it wont hold as much, so, the water will hold longer and will break
Our prediction was right! (veggie oil will break sooner then the water) We think that because the water is thinnner and will hold more and the veggie oil is thick so

240
after the veggie oil. it wont hold as much for that reason.
15. We have two pennys, 1 with just water and one with soda what will happen.
I perdict that the vegtible will burst before the water because it is soo much thiker and heavier than the water, so the water will hold longer.
perdicted that the vegtible oil would breack before the water because it is thicker and more heavy and we were right the vegtible oil broke before the water it only took 16 drops for it to break. I think the vegtible oil broke before the water because it is more thick and hevy than water the water is thin and light. But we kept on trying to get diffrent reusults but it took less drops neach time maybe because it was not dry.
16. what would happen if we used a different liquid like cooking oil?
more drops will stay on the penny with cooking oil than with water
my conclusion is that it doesn't make a big differance if you use oil instead of water
17. What would happen if you used a differant liquid like syrup ore cooking oil or juice?
I predict the vegtible oil will go over the side of the penny and will not make a bubble because it is to heavey and heavyer than water.
I did not think the vegtible oil and the ater would have the same # of drops. ( Almost the same #) I thought they would be nowhere near the same amount of drops.

241
Appendix D.21
Unit 3- NOE: Research questions, predictions and conclusions developed by each student
Research Question Prediction Conclusion
1. if you use a HUGE penny, can you wet your finger and touch the water, and not disrupt the shape?
i think the shape will not be disrupted, because the water wil make it so your finger will just slide in and out,easily.
my conclusion is that we thought that whatever you did, you would not disrupt the water, but in fact if you don't touch the bottom of the penny with your wet finger, when you take your finger out the water will go back to it's original shape. also if you do touch the penny, you will se that the water will flow over the penny.
2. will the water stay on the coin if it's size and or texture is different
i prdict that the water will stay on all the coins except the jumbo coin.
my conclusion is that with all the coins we teasted water stays on all the and layers up above the rim of each coin.
3. do difrent bases efect the shape of the water
difrent shapes will efect the shape of the blob
the shape of the watter is efected by the sape of the base
4. will corn surup stay on the penny the same way the water did?
I predict that the vegtable oil will stay on the penny like the water but if we move the penn the vegtable oil wll start to come off the penny.
My conclusion is that the veg. oil doesnt stay on the penny as well as the water, i think that because the veg. oil is more slipery than the water so the easier it is tobrake of the penny. and when you move the water it stays on but when you move the veg. oil it slippes off.
5. What would happen if we use different objects and shapes?
I think it will stay on round objects and fall off of flat things but it will stay on things with a rimm around the egde because the edge will keep the water from coming out
water will stay on certain objects but i wanted to test more objects to see if it would work on those because most of the objects we used were were coins. We KNOW that water will stay on coins but maybe not a spoon or a book or something so I wish we had more time to test some

242
more. So my conclusion is yes,water will stay on most objects such as coins wood and rounded out things.
6. What will happen if you used a different coin, and put a different type of liquid on it?
I predict that maybe the vegetable oil, will not stay like the water instead it will fall over.
That maybe all liquids can form a little bubble on maybe all the coins.
7. what would happen if we where to put water on a coin or flat seface with an indent or outdent in the middle?
i think that the water bubble will change shape to have a ident or outdent.
my conclusion is that the water molicules follow each other so that when we put a nail on and then added water to the penny it was flat ecept around the nail where it sloped up. Also the water would come up ound the end of the penny when you just barrly touched it to the water.
8. If we poured water on top of wax from a coin would the water not spread or will it spread out?
I think sinse there is wax on a piece of paper the water will stay in one place.
I think the water kept together on the crayon with paper because wax could help it stick so it comes in with the water to hold it together so it could hold more. when it was just with the penny it could not hold as much water together so it would only hold the stuff on top of it.
9. what happens with different bases?
I predict that the water will stay on a few of the surfaces, like the square, but it will slide off the other shapes, like a triangle.
I think tat yes, water will stay on top of most objects without spilling over. I've concluded this because out of all the objects we tested, (which were a penny, a nickle, a dime, a quarter, a jumbo penny, a wood block, an evaporation dish, and a watch glass), water did not overflow, but continued going up the top of the object, making a layer of liquid on the object. If you go to eye level of the object being tested, you can clearly

243
see the water is different and higher than the object it sits on.
10. What woulld happen if intead of using water we use oil and put it on the penny or whatever coin and take some away with the eye dropper and see the shape.
I think when we take out the oil, it will maybe go flat instead of keep the same shappe.
While we learned on the side of the experiment that vegetable oil is less dense than food coloring. Also the answer to my question was that oil will not keep its shape with less of it, it will go flat. But water does keep its shape when some is taken away.
11. will the water stay on the coin if its size and texture is different
what i will think is going to happen is that nothing is going to happen i dont think it will change anything if the texture or size is different
my conclusion is that it doesnt matter what the shape or the texture of coin for the out come of the experiment
12. What will happen if you put vinegar at the bottom and water at the top?
The water will come right off the vinegar, and the vinegar will stay on the penny.
The conclusion I made was the water sits on top of the vinegar. I think this happened because the vinegar wasn't thick enough to move the water off of it. If we put vegtable oil or corn syrup (because they're thicker) the water might have come off one of them.
13. What will happen when we have vinegar on the penny, and then water ontop of that?
I predict that when we put the vinegar and the water on the penny, the two liquids will mix ontop of the penny and it wont wiggle as much as the just water would.
I conclude that when you put water and vinegar onto a penny at the same time, it does the same thing as it would with just water. The vinegar must not have anything in it that changes the interaction of the penny and the water.
14. do different bases effect the shape of the water?
that it will stay the same for all the shapes
the more sides a shape has, the more fitted the water is to that shape,and it hold more water with more sides too.
15. Does the water bead up, or not spread out on wax?
The water will react the same on the wax as on the penny.
Water on wax does do the same thing that water on a penny does.
16. What if instead of using I think that the oil would Our conclusion is that when

244
water we use vegi oil then we take away some of the oil n then add some food colouring to see the shape.
stay on the coin jus like the water.
u put oil on an regualar coin it stays, but when u take an i-droper and take some of the oil off it still keeps it shape,just degreasing the amount of oil on the coin.
17. What would happen if a different type of liquid was put on a different type of coin.
I think both corn syrup and water would stay on the nickle.
The vegetable oil stayed on the nickle and the water stayed on the nickle. I think it happens because the texture is making the liquids stay on the nickle. It's like traping liquids. But when the liquid got higher then the liquid just fell off the nickle.

245
Appendix D.22
Unit 3- L/I: Research questions, predictions and conclusions developed by each student
Research Question Prediction Conclusion
1. which molucles can hold to gether beter, vegtible oil or water while we are driving a tooth pick throug the liquads?
that the vegtible oil molucles will hold together better than the water molucles.
theat the water has more cohsion than the vegtible oil, i think this is because thatvegtible oil has more liguads in it than one. That would effect cohesion because the molucles must attract to a diffrent molucle.
2. Tip water onto a piece of wax paper and see if the water sperates or stayes in tack.
I think the glob of water will stay in tack.
Absent
3. what would happen if you mixed 2 liquids together to see if cohesian is created on a piece of wax paper
i predict that the oil will do the same thing that water does. it will come to geather when we move the wax paper around
my conclusion is that the oil did not make cohesion because it is thicker than water
4. if the water is at the tip of the beaker how many penneys does it take to overflow the beaker
think that the pennies will eventually overflow the beaker
really i figured out that water needs mor pennies to over flow
5. What is the result if we change the temp of the penny.
I predict that the frozen penny will hold more water because when cold is added moleuels decrease in size. The penny at room temp will hold thirty the penny with heat added to it will hold less water because molecuels expand when heat is added.
In conclusion I say that the cold makes molecuels decrease in size due to the cold penny holding more and the room and hot penny holding less. So cold obviosly decreases the size of the molcuels.
6. if you have one eyedropper filled with vegtable oil and another one filled with water, then squirt them on wax paper and try to move each with a toothpick, which will move around easier?
I predict that the vegtable oil will be harder to seperate and the cohesion will be stronger there.
The water's molecules werre packed tighter and the cohesion was stronger so it was harder to seperate.
7. The question we are going to ask is would
I predict that the excess liquids will be removed
Absent

246
putting two different liquids in an overflow can speed up or slow down the drip process?
faster.
8. If their is a cup of corn srup and a cup of water and the liquids are both over the top of the cup, how many pennies would it take until the liquids pour out of the cups?
That it takes more pennies to make the cup of vegtable oil pour out of the cup than the cup of water.
The cup of water took 11 pennies to overflow the cup, and the cup of vegtable oil took one pennie to overflow the cup.
9. will the 2 diffrent liquid stick together on the wax paper?
i think they wont stick toether because they are diffrent liqud.
the water and oil does not stick together on wax paper.
10. Is cohesion effected by different liquids on wax paper?
I think the vegetable oil beads will come together slower that the beads of water because vegetable oil is thicker and more dence than water.
My prediction for the outcome of this experement was that the vegetable oil would move together slower than the water. I was right. The vegetable oil hardly moved on this sheet of paper. I think the outcome happened this way because the vegetable oil is much thicker than the water, so it didn't move
11. Would putting two different liquids in the overflow can make the drip process go faster or slower?
I predict that the mixture of vegetable oil and water will drip faster than just water
the pure water drips faster than the mxture of water and vegetable oil. I think this is because the vegetable oil mixes with the water and makes it thicker, which makes it drip more slowly.
12. what happens if you get two pieces of paper and you get on big bead of water and them you pass the big bead of water on to the second peice of paper then see what happens
I think that when i roll the water beads onto the paper the beads will splash all over into millions of little beads.
My conclusion is when you drop the water beads on plastic the water molecules come closer together and make a big bead. My guess was wrong.
13. What would happen if you mixed 2 liquids together to see if cohesian is created on a piece of wax paper?
I predict that we will not find cohesian because vegtable oil is thick. Water is very light.
My conclusion is that vegtable oil is thicker than water and it does not make cohesion like water does.
14. You have one eye dropper filled with water,
I predict that the vegtable oil's molecules will stay
The water's moelcules are more packed together than

247
and another one filled with vegtable oil. You squirt some out, and out a toothpick through it. What liquid's molecules stay together?
together, and that the water molecules will break apart or be easier to break apart.
the vegtable oils, and so there is more cohesion in the water molecules.

248
Appendix D.23
Complete list of research questions and variables developed by Unit 2 POE students
Research Variables
1. What happens if you change the temperature of the water?
Temperature of liquid
2. What if you used different liquids? Type of liquid used
3. What would happen if you used different amounts of water?
Volume of water
4. What if you moved the beaker from inverted to upright?
Position of beaker
5. What if you used a different container than a beaker?
Container other than beaker
6. What if the inverted beaker had a hole in it?
7. What if you used an overflow can in place of the inverted beaker?
8. What if the inverted beaker was upright with a cover that was taken off?
9. What if you used different sized beakers? Size of beaker
10. What would happen if you put the inverted beaker in place, then added water?
Method of adding water
11. Would the same thing happen if you did not use a weight on the beaker?
Not using weight
12. What if you put a different object in the inverted beaker?
Different objects in inverted beaker
13. What would happen with different kinds of paper?

249
Appendix D.24 Complete list of research questions and variables developed by Unit 2 NOE students
Research Question Variable
1. What if you changed the amount of the water?
Volume of liquid
2. What if you used a liquid other than water?
Type of liquid used
3. What if you used salt water?
4. What if you changed the temperature of the water?
Temperature of liquid
5. What if there were two beakers? Number of beakers
6. What if the inverted beaker had a different shape?
Shape of beaker
7. What if you used a beaker without a spout?
8. What if you used a different sized beaker?
Size of beaker
9. What if the inverted beaker was actually upright with a weight on top?
Position of beaker
10. What if you used a lighter weight on top of the beaker?
Different mass of weight
11. What if you used a heavier weight on top of the beaker?
12. Would the same thing happen if there was no weight on top?
No weight used
13. What if you don’t use a weight on top of the inverted beaker?
14. What if you used a different object in the inverted beaker?
Different objects in inverted beaker
15. What would happen if you used a balloon in the inverted beaker?
16. Would it react differently if you left it in place overnight?
Time that experiment is run
17. What if you had different gases in the inverted beaker?
Different gas used

250
Appendix D.25 Complete list of research questions and variables developed by Unit 2 L/I students
Research Question Variable
1. What would happen if you filled a balloon with air and food coloring, then popped it underwater?
Balloon filled with various substances underwater
2. What would happen if you put a balloon full of air and another full of water underwater and popped them?
3. What would happen if you put corn syrup in a balloon and popped it underwater?
4. What would happen if you had a balloon tied, with air in it, and a small hole the size of a pencil point and put it underwater?
5. What happens if you put paper towel into a cup and put it underwater upside down?
Inverted beaker underwater
6. What would happen if you put a screen over a beaker and put it in water [upright]- would water go in?
Screen on inverted beaker underwater
7. If you put a rubber ball with a hole in it underwater, how fast does the gas come out of the ball and the water go in?
Rubber ball with hole underwater

251
Appendix D.26 Complete list of research questions and variables developed by Unit 3 POE students
Research Question Variable
1. What if you used different liquids? Type of liquid used
2. What if you used a thick liquid?
3. What if the water was a different temperature?
Temperature of liquid
4. What would happen to the shape of the bubble if you took water away with the eyedropper?
Removing liquid with eyedropper
5. What if you used a different way to put the liquid on instead of an eyedropper?
Adding water with something other than eyedropper
6. What if you changed the angle of the eyedropper as you hold it?
Angle of eyedropper
7. What if you changed the rate of dropping the water from the eyedropper?
Rate of dropping liquid from eyedropper
8. What if you used a different sized coin? Size of coin
9. What if you used a jumbo coin [very large coin from Magic Club]?
10. What if you used different coins? Different types of coin
11. Would there be a difference if you used heads or tails of the coin?
Different side of coin
12. What if the coin was hot or cold? Temperature of coin
13. What if you used a clean or dirty penny?
Clean or dirty coin
14. Would the year of the coin affect the results?
Year of coin
15. What if you had a coin with a hole in it? Coin with hole
16. What if the coin had a different surface or texture?
Surface or texture of coin
17. What would happen if you used an object instead of a penny that absorbed water?
Object other than penny
18. What would happen if you poked the bubble?
Surface of bubble touched
19. What if the coin was on a different base?
Coin on different base

252
Appendix D.27 Complete list of research questions and variables developed by Unit 3 NOE students
Research Question Variable 1. What if you used different liquids? Type of liquid used
2. What if you used a mixture of liquids?
3. How many drops could fit on the penny? Number of drops on penny
4. Would a change in water temperature affect the results?
Temperature of liquid
5. What if the coin was a different size? Size of coin
6. What if you used a jumbo coin [very large coin from Magic Club]?
7. What if you used different coins? Different types of coins
8. Would there be a difference if you used heads or tails?
Different side of coin
9. What if the coin had a different shape? Shape of coin
10. What if the coin was hot or cold? Temperature of coin
11. What if the coin had a different surface or texture?
Surface or texture of coin
12. What if the coin had an “indent or outdent”?
13. Would the same thing happen without the coin?
No coin used
14. What happens if you poked the bubble? Surface of bubble touched
15. What if the coin was on a different base?
Coin on different base
16. What if you put water on a dollar bill? Liquid dropped on something other than coin
17. What would happen on wax paper?

253
Appendix D.28 Complete list of research questions and variables developed by Unit 3 L/I students
Research Question Variable 1. Do different types of liquids “make cohesion”?
Type of liquid used
2. Does temperature affect the cohesion of water?
Temperature of liquid
3. Which would drip faster: corn syrup or vegetable oil in an overflow can or a faucet turned on low?
Rate of drip from Overflow Can
4. Would putting two different liquids in an overflow can speed up or slow down the drip process?
5. How long can water stay at the bottom of the spout of an overflow can compared to other liquids?
6. Which different liquids drip faster from an overflow can?
7. If you put an object in an overflow can, would more drops come out than if there was no object placed in?
8 Will corn syrup go higher than water when filling a beaker?
Different liquids filled to beaker rim
9 Will corn syrup go higher than water in a beaker at the breaking point?
10. How much water could you put on the bottom of an upside down beaker before the water flows over the edge?
Different base other than coin
11. How many quarters would it take to add to a beaker of water before it overflows?
Number of quarters to filled beaker
12. Which liquid could you put more coins into before it overflows over the beaker: corn syrup or water?
Different liquids with coins added
13. Does corn syrup drip like water? Comparing drip of various liquids 14. Would different liquids come together when you put them on wax paper and shake slightly?
Combining liquids
15. Would water and vegetable oil stay together if you put a toothpick through it?
Surface of bubble touched
16. How much water can a penny hold before the water falls off the penny?
Number of drops on coin
17. What would happen if you put water on different size coins?
Different size of coins