
Effects of shading, irrigation and mycorrhizal inoculation on ...
Upload
ua-huntsvilleCategory
view
0download
0
Using Deep RNA Sequencing for the StructuralAnnotation of the Laccaria Bicolor MycorrhizalTranscriptomePeter E. Larsen1, Geetika Trivedi2, Avinash Sreedasyam2, Vincent Lu1, Gopi K. Podila2, Frank R. Collart1*
1 Biosciences Division, Argonne National Laboratory, Lemont, Illinois, United States of America, 2 Department of Biological Sciences, University of Alabama in Huntsville,
Huntsville, Alabama, United States of America
Abstract
Background: Accurate structural annotation is important for prediction of function and required for in vitro approaches tocharacterize or validate the gene expression products. Despite significant efforts in the field, determination of the genestructure from genomic data alone is a challenging and inaccurate process. The ease of acquisition of transcriptomicsequence provides a direct route to identify expressed sequences and determine the correct gene structure.
Methodology: We developed methods to utilize RNA-seq data to correct errors in the structural annotation and extend theboundaries of current gene models using assembly approaches. The methods were validated with a transcriptomic data setderived from the fungus Laccaria bicolor, which develops a mycorrhizal symbiotic association with the roots of many treespecies. Our analysis focused on the subset of 1501 gene models that are differentially expressed in the free living vs.mycorrhizal transcriptome and are expected to be important elements related to carbon metabolism, membranepermeability and transport, and intracellular signaling. Of the set of 1501 gene models, 1439 (96%) successfully generatedmodified gene models in which all error flags were successfully resolved and the sequences aligned to the genomicsequence. The remaining 4% (62 gene models) either had deviations from transcriptomic data that could not be spanned orgenerated sequence that did not align to genomic sequence. The outcome of this process is a set of high confidence genemodels that can be reliably used for experimental characterization of protein function.
Conclusions: 69% of expressed mycorrhizal JGI ‘‘best’’ gene models deviated from the transcript sequence derived by thismethod. The transcriptomic sequence enabled correction of a majority of the structural inconsistencies and resulted in a setof validated models for 96% of the mycorrhizal genes. The method described here can be applied to improve genestructural annotation in other species, provided that there is a sequenced genome and a set of gene models.
Citation: Larsen PE, Trivedi G, Sreedasyam A, Lu V, Podila GK, et al. (2010) Using Deep RNA Sequencing for the Structural Annotation of the Laccaria BicolorMycorrhizal Transcriptome. PLoS ONE 5(7): e9780. doi:10.1371/journal.pone.0009780
Editor: Jean Peccoud, Virginia Tech, United States of America
Received January 14, 2010; Accepted February 26, 2010; Published July 6, 2010
This is an open-access article distributed under the terms of the Creative Commons Public Domain declaration which stipulates that, once placed in the publicdomain, this work may be freely reproduced, distributed, transmitted, modified, built upon, or otherwise used by anyone for any lawful purpose.
Funding: The submitted manuscript has been created by UChicago Argonne, LLC, Operator of Argonne National Laboratory (‘‘Argonne’’). Argonne, a U.S.Department of Energy Office of Science laboratory, is operated under Contract No. DE-AC02-06CH11357. The authors have been supported by the USDepartment of Energy (DOE) Office of Biological and Environmental Research (http://www.sc.doe.gov/ober/ober_top.html). The funders had no role in studydesign, data collection and analysis, decision to publish, or preparation of the manuscript.
Competing Interests: The authors have declared that no competing interests exist.
* E-mail: [email protected]
Introduction
Advances in sequencing technology have led to an improved
appreciation of the biological diversity associated with specific
ecosystems and the complexity of the molecular systems involved
in the perception and response to external stimuli. Mapping these
signaling and response pathways is especially challenging in
sequence data sets from environmental sequencing projects where
uncharacterized organisms often represent a high proportion of
the sequence data. The standard mechanisms for functional and
structural annotation of genomes are less than perfect and
prediction methods that rely on sequence homology have
limitations for inferring the structural and functional properties
of some genes [1,2,3]. Even proteins with homologs of known
function may have a different biological role due to altered
regulation, posttranslational modification, or cellular compart-
mentalization [4,5]. Estimates vary, but there is a general
consensus that 50–70% of ORFs in newly sequenced genomes
are described as having unknown or poorly characterized function
[1,6,7]. Increased understanding of the biological information
content in the sequence data will require a combination of
bioinformatic and experimental approaches to characterize the
function of these gene products.
Experimental approaches for functional characterization of
gene products are often compromised by incorrect or insufficient
knowledge of the gene structure to enable extraction of the protein
sequence for experimental studies. To facilitate the process for
acquisition of function from complex sequence data sets, we have
developed methods to utilize RNA-seq data to detect and correct
errors in the structural annotation. Software tools have been
developed that perform spliced alignments of EST sequences to
DNA [8,9] or map RNA-Seq reads [10] to recover splice
PLoS ONE | www.plosone.org 1 July 2010 | Volume 5 | Issue 7 | e9780

junctions. Our approach delineates the exon/intron structure
necessary to extract the protein coding sequence for experimental
and homology based approaches for functional interrogation. We
also evaluated methods to extend the boundaries of current gene
models using assembly approaches applied to the RNA-seq data.
Both of these approaches support accurate structural annotation
which is a requirement for experimental approaches for functional
characterization and also provides validated sequence to utilize
tools that enable identification cellular localization signals,
domains. Structural annotation of genes in sequenced genomes
from basidiomycetes is a challenge due to the high intron density
and the frequent presence of small exons coding for less than 10
amino acids. The process developed for validation and improve-
ment of the structural annotation can be applied on a genome
scale to support experimental studies of the molecular events
associated with mycorrhizal symbiosis as well as facilitate better
comparative genomics and evolutionary analyses of gene families
and their functions.
To validate our proposed system, we used a transcriptomic data
set derived from the fungus Laccaria bicolor. This fungus is a
member of the Basidiomycota and its intron density and
distribution of small introns provide a challenge for structural
annotation [11,12,13]. L. bicolor develops a mutualistic symbiotic
association with many tree species [14,15]. This complex
association of the fungus and the plant roots provides nutritional
benefits to both partners [15]. The fungi contribute phosphorous,
nitrogen and mobilized nutrients from organic matter and in
return the fungus obtains plant-derived carbohydrates [16,17]. In
mycorrhizal systems, up to 25% of the plant photosynthate is
utilized by the fungal partner [18]. This fungal-plant symbiosis is a
widespread process of major ecological importance. Knowledge of
the molecular events associated with the development of the
mycorrhizal system is essential for our understanding of natural
biological processes related to carbon sequestration, carbon
management, sustainability and bioenergy.
Results
Method OverviewOur approach for validation and/or correction of gene models is
organized in a framework of five conceptual components (Figure 1).
The initial process uses Bowtie [19] to align RNA-seq reads to the
set of gene models (BestModels v1.0 available for download at the
Joint Genome Institute [JGI], denoted as BestModelsv1 in the text)
and the genome (laccarria.allmasked available for download at the
JGI). The outcome of this process for the set of transcript sequences
which aligned to both the scaffold and the gene models is the
generation of a graphical representation (Figure 1, A) and the
identification of regions where expressed RNA sequence does not
match predicted gene model. The algorithm described in the
Methods Section enables analysis of the aligned reads and the
identification of sequence incongruities between the predicted gene
models and the observed transcriptomic data (Figure 1, B). These
sequence discrepancies are saved as Flagged Deviations from the
Model (FDM) sequences and provide sufficient information for
sequence reconstruction using the transcriptomic reads. Sequence
discrepancies internal to the gene model are corrected by
identification of bridging sequences that span introns or contiguous
reads that eliminate inserted introns (Figure 1, C). A slight
modification of this approach addresses FDM at the beginning or
end of the gene model and enables extension of the sequence
upstream or downstream or the original gene model termini
(Figure 1, D). The outcome of these successive processes is a
contiguous Bridged and Extended Sequence (BES) which is
validated by alignment to the genome scaffold sequences (Figure 1,
E).and used to generate the gene model’s corrected structural
annotation. The gene structure with the correctly identified splice
regions is derived from the scaffold alignment and saved in a
General Feature Format (gff) file. Revised gene models and
modified transcript sequences derived from this study are provided
as supporting data in gff format (Text S1) and fasta format (Text S2),
respectively. It should be noted that our method to utilize RNA-seq
data to correct errors in the structural annotation and extend the
boundaries of current gene models does not require specification of
splice donor or acceptor sites. A consequence of this approach is
increased ambiguity of the exact genome location of the splice site in
the alignments of the transcript-derived models to the genome. This
process can lead to the improper placement of the final coding
nucleotide associated with the beginning or end of an exon. This can
be resolved by manual inspection of the gene of interest or the
output of this method can also be used in conjunction with other
splice assembly programs. A list of all project data files and resources
are available for viewing and download via the project URL
provided in data resources file Text S3.
Evaluation of optimal sequencing depth parameters forgene model validation
The algorithm described in the Methods Section enables analysis
of the aligned reads and the identification of sequence incongruities
between the predicted gene models and the observed transcriptomic
data. These discrepancies are noted as flagged deviations from the
BestModelsv1 (FDM) sequence and can either represent regions of
the predicted model sequence with no transcriptomic sequence
coverage or actual errors in the structural annotation. To select a
useful minimum expression threshold for validation of this method
and confidant correction of gene models, we evaluated the number
of FDM sequences for all gene models expressed in our data set at a
range of expression levels (Figure 2). 7023 gene models or 34% of all
best gene models were expressed at a reads per Kb of gene sequence
(RPK) of 60 or greater in the transcriptomic data set. A RPK of 60
represents an average sequence depth of 3; the human genome
sequence standard for 99% accuracy (http://www.genome.gov/
10000923). This set of 7023 expressed genes was used to identify
FDM sequences and contiguous expressed sequence spanning the
internal flags was generated. The analysis was restricted to the
sequence coverage of the original gene models and flags at the
termini of gene models were not considered in this analysis. This
restriction was imposed to avoid erroneous interpretations that arise
by failure to extend a model beyond its predicted termini. For
example, identification of expressed sequence that bridges two
probe sequences can be judged a success. However the failure to
detect expressed extended sequence may result from an appropriate
truncation of the predicted model or may simply arise as a
consequence of insufficient transcript coverage.
At an RPK of 60, no sequence deviations were detected for
3188 or 53% of the expressed gene models. As expected, the
number of gene models with no detectable sequence deviations
shows an inverse relationship to the depth of transcript sequence
coverage (Figure 2). The use of the transcript data to identify and
correct FDM sequences result in a substantial increase in the total
number of the models without flags (indicated by the green trace in
Figure 2). At the same RPK, the difference between the numerical
values of the green and red traces represents the number of
corrected models. It should be noted that this represents a
significant under-representation of the efficacy of our proposed
method, as only models with zero flags after correction are
considered a success. For example the gene model encoding
protein ID 322344 expressed at an RPK of 111, contained 9 flags
Laccaria Gene Annotation
PLoS ONE | www.plosone.org 2 July 2010 | Volume 5 | Issue 7 | e9780

Figure 1. Overview of the structural annotation analysis method. In the illustrations, the original gene model is shown in blue, the number ofaligned reads at a particular bp in the scaffold is in grey, and the number of reads that align to the gene model but not to the scaffold are in red. A)Bowtie is used to align RNA-seq reads and identify regions where expressed RNA sequence does not match predicted gene model. B) Errors in thegene model are identified where there is a predicted intron (i = predicted expressed gene sequence) but no spanning expressed sequence (‘‘1’’ and‘‘2’’ in example above) or where there is predicted gene but no sequence alignments (‘‘3’’ in above example). The resulting flagged deviation from themodel (FDM) is tagged with ‘X’ to indicate the presence of an internal error in the gene model or and an ‘E’ to indicate an error at the beginning orend of the gene model as illustrated by the expressed sequence string in Dii. C) For each internal error (red X) in FDM, such as error ‘‘1’’ in (A), an 18-mer ‘probe’ sequence is generated up and downstream of error (underlined and bold sequence in (Ci). This intron-spanning sequence was used tosearch the set of RNA-seq reads. for contiguous expressed sequence between selected probes (Green sequence in (Cii).) D) Error from beginning andend of FDM (such as Error ‘‘3’’ in above example) are removed by probes sequences generated from beginning and ends of expressed gene sequence
Laccaria Gene Annotation
PLoS ONE | www.plosone.org 3 July 2010 | Volume 5 | Issue 7 | e9780
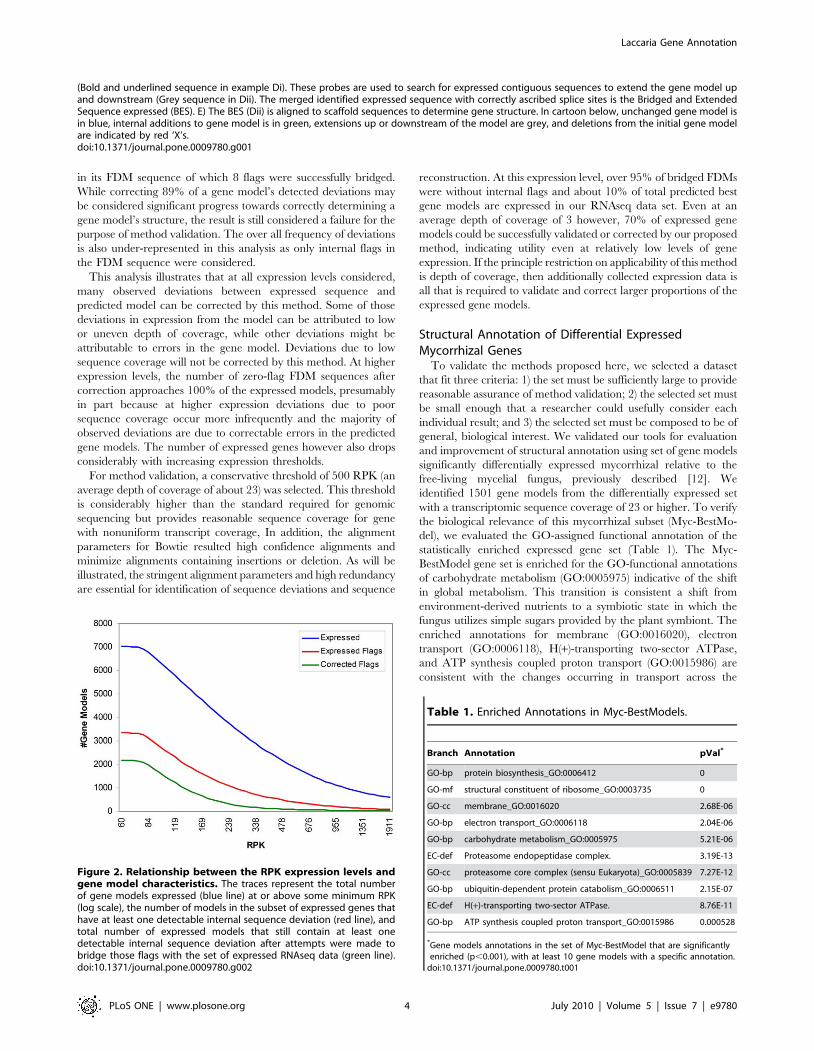
in its FDM sequence of which 8 flags were successfully bridged.
While correcting 89% of a gene model’s detected deviations may
be considered significant progress towards correctly determining a
gene model’s structure, the result is still considered a failure for the
purpose of method validation. The over all frequency of deviations
is also under-represented in this analysis as only internal flags in
the FDM sequence were considered.
This analysis illustrates that at all expression levels considered,
many observed deviations between expressed sequence and
predicted model can be corrected by this method. Some of those
deviations in expression from the model can be attributed to low
or uneven depth of coverage, while other deviations might be
attributable to errors in the gene model. Deviations due to low
sequence coverage will not be corrected by this method. At higher
expression levels, the number of zero-flag FDM sequences after
correction approaches 100% of the expressed models, presumably
in part because at higher expression deviations due to poor
sequence coverage occur more infrequently and the majority of
observed deviations are due to correctable errors in the predicted
gene models. The number of expressed genes however also drops
considerably with increasing expression thresholds.
For method validation, a conservative threshold of 500 RPK (an
average depth of coverage of about 23) was selected. This threshold
is considerably higher than the standard required for genomic
sequencing but provides reasonable sequence coverage for gene
with nonuniform transcript coverage, In addition, the alignment
parameters for Bowtie resulted high confidence alignments and
minimize alignments containing insertions or deletion. As will be
illustrated, the stringent alignment parameters and high redundancy
are essential for identification of sequence deviations and sequence
reconstruction. At this expression level, over 95% of bridged FDMs
were without internal flags and about 10% of total predicted best
gene models are expressed in our RNAseq data set. Even at an
average depth of coverage of 3 however, 70% of expressed gene
models could be successfully validated or corrected by our proposed
method, indicating utility even at relatively low levels of gene
expression. If the principle restriction on applicability of this method
is depth of coverage, then additionally collected expression data is
all that is required to validate and correct larger proportions of the
expressed gene models.
Structural Annotation of Differential ExpressedMycorrhizal Genes
To validate the methods proposed here, we selected a dataset
that fit three criteria: 1) the set must be sufficiently large to provide
reasonable assurance of method validation; 2) the selected set must
be small enough that a researcher could usefully consider each
individual result; and 3) the selected set must be composed to be of
general, biological interest. We validated our tools for evaluation
and improvement of structural annotation using set of gene models
significantly differentially expressed mycorrhizal relative to the
free-living mycelial fungus, previously described [12]. We
identified 1501 gene models from the differentially expressed set
with a transcriptomic sequence coverage of 23 or higher. To verify
the biological relevance of this mycorrhizal subset (Myc-BestMo-
del), we evaluated the GO-assigned functional annotation of the
statistically enriched expressed gene set (Table 1). The Myc-
BestModel gene set is enriched for the GO-functional annotations
of carbohydrate metabolism (GO:0005975) indicative of the shift
in global metabolism. This transition is consistent a shift from
environment-derived nutrients to a symbiotic state in which the
fungus utilizes simple sugars provided by the plant symbiont. The
enriched annotations for membrane (GO:0016020), electron
transport (GO:0006118), H(+)-transporting two-sector ATPase,
and ATP synthesis coupled proton transport (GO:0015986) are
consistent with the changes occurring in transport across the
(Bold and underlined sequence in example Di). These probes are used to search for expressed contiguous sequences to extend the gene model upand downstream (Grey sequence in Dii). The merged identified expressed sequence with correctly ascribed splice sites is the Bridged and ExtendedSequence expressed (BES). E) The BES (Dii) is aligned to scaffold sequences to determine gene structure. In cartoon below, unchanged gene model isin blue, internal additions to gene model is in green, extensions up or downstream of the model are grey, and deletions from the initial gene modelare indicated by red ‘X’s.doi:10.1371/journal.pone.0009780.g001
Figure 2. Relationship between the RPK expression levels andgene model characteristics. The traces represent the total numberof gene models expressed (blue line) at or above some minimum RPK(log scale), the number of models in the subset of expressed genes thathave at least one detectable internal sequence deviation (red line), andtotal number of expressed models that still contain at least onedetectable internal sequence deviation after attempts were made tobridge those flags with the set of expressed RNAseq data (green line).doi:10.1371/journal.pone.0009780.g002
Table 1. Enriched Annotations in Myc-BestModels.
Branch Annotation pVal*
GO-bp protein biosynthesis_GO:0006412 0
GO-mf structural constituent of ribosome_GO:0003735 0
GO-cc membrane_GO:0016020 2.68E-06
GO-bp electron transport_GO:0006118 2.04E-06
GO-bp carbohydrate metabolism_GO:0005975 5.21E-06
EC-def Proteasome endopeptidase complex. 3.19E-13
GO-cc proteasome core complex (sensu Eukaryota)_GO:0005839 7.27E-12
GO-bp ubiquitin-dependent protein catabolism_GO:0006511 2.15E-07
EC-def H(+)-transporting two-sector ATPase. 8.76E-11
GO-bp ATP synthesis coupled proton transport_GO:0015986 0.000528
*Gene models annotations in the set of Myc-BestModel that are significantlyenriched (p,0.001), with at least 10 gene models with a specific annotation.
doi:10.1371/journal.pone.0009780.t001
Laccaria Gene Annotation
PLoS ONE | www.plosone.org 4 July 2010 | Volume 5 | Issue 7 | e9780
membrane between a free living state drawing all of it required
nutrients from its environment to a symbiotic state. The highly
enriched annotations associated with protein biosynthesis
(GO:0006412, GO:0003735, 0006511, and GO:0005839) are
consistent with the significant shift in protein expression between
the free living mycelial and mycorrhizal states. These sets of
enriched annotations suggest that the 1501 gene models in the
Myc-BestModel subset are of potential biological interest and are
specific to the changes in L. bicolor that accompany the shift from a
free living mycelium to symbiotic mycorrhizal transcriptome.
Analysis of Differentially Expressed Mycorrhizal GenesThe transcriptomic data provide an independent approach for
both validation and correction of the gene models. The initial phase
of the process identifies regions where the transcriptomic sequence
deviates from the gene model and also validates intron exon
boundaries incorporated in the gene models. For the Myc-
BestModel subset of 1501 genes, application of the analysis method
resulted in the validation of ,80% of all intron-exon boundaries
(.6000) within the limits of the gene models. The transcriptomic
sequence depth of 23 provides a high level of confidence for the
quality of these models. This level of validation for the original gene
models is notable in view of the complexity of the fungal genome (L.
bicolor genes contain an average of 5.4 introns) and the annotation
limitations arising from the relatively small number of sequenced
fungal genomes, especially basidiomycetes. However, the combi-
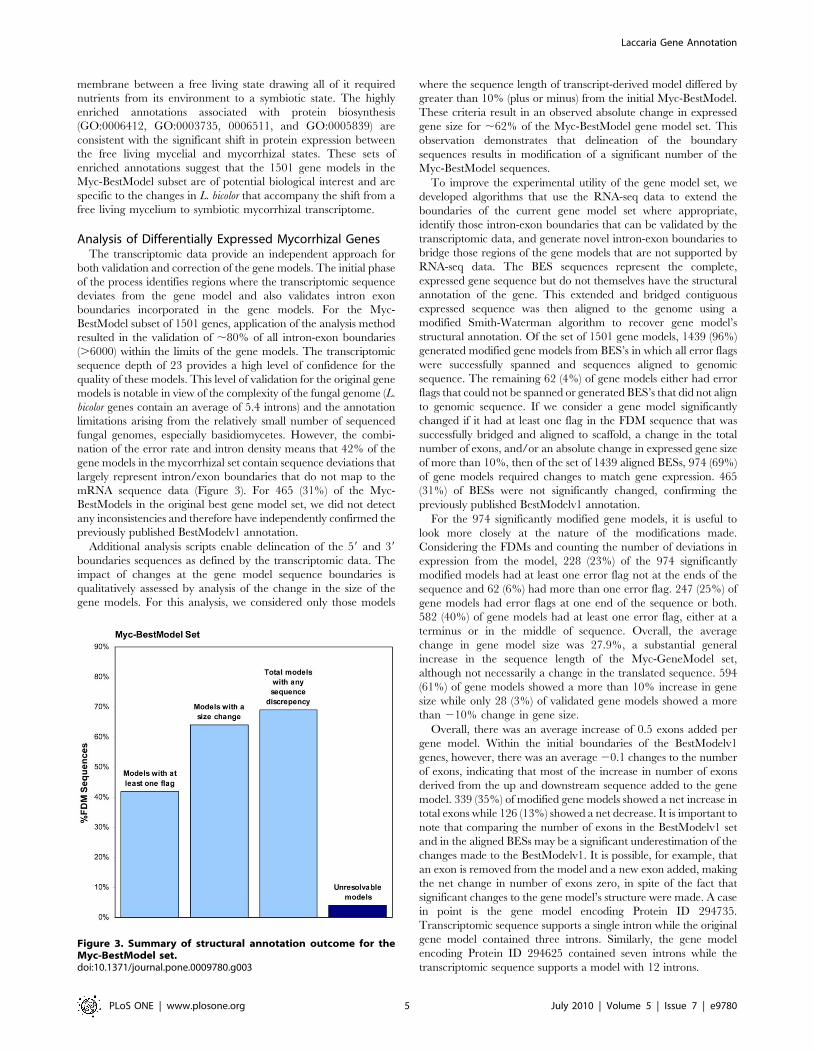
nation of the error rate and intron density means that 42% of the
gene models in the mycorrhizal set contain sequence deviations that
largely represent intron/exon boundaries that do not map to the
mRNA sequence data (Figure 3). For 465 (31%) of the Myc-
BestModels in the original best gene model set, we did not detect
any inconsistencies and therefore have independently confirmed the
previously published BestModelv1 annotation.
Additional analysis scripts enable delineation of the 59 and 39
boundaries sequences as defined by the transcriptomic data. The
impact of changes at the gene model sequence boundaries is
qualitatively assessed by analysis of the change in the size of the
gene models. For this analysis, we considered only those models
where the sequence length of transcript-derived model differed by
greater than 10% (plus or minus) from the initial Myc-BestModel.
These criteria result in an observed absolute change in expressed
gene size for ,62% of the Myc-BestModel gene model set. This
observation demonstrates that delineation of the boundary
sequences results in modification of a significant number of the
Myc-BestModel sequences.
To improve the experimental utility of the gene model set, we
developed algorithms that use the RNA-seq data to extend the
boundaries of the current gene model set where appropriate,
identify those intron-exon boundaries that can be validated by the
transcriptomic data, and generate novel intron-exon boundaries to
bridge those regions of the gene models that are not supported by
RNA-seq data. The BES sequences represent the complete,
expressed gene sequence but do not themselves have the structural
annotation of the gene. This extended and bridged contiguous
expressed sequence was then aligned to the genome using a
modified Smith-Waterman algorithm to recover gene model’s
structural annotation. Of the set of 1501 gene models, 1439 (96%)
generated modified gene models from BES’s in which all error flags
were successfully spanned and sequences aligned to genomic
sequence. The remaining 62 (4%) of gene models either had error
flags that could not be spanned or generated BES’s that did not align
to genomic sequence. If we consider a gene model significantly
changed if it had at least one flag in the FDM sequence that was
successfully bridged and aligned to scaffold, a change in the total
number of exons, and/or an absolute change in expressed gene size
of more than 10%, then of the set of 1439 aligned BESs, 974 (69%)
of gene models required changes to match gene expression. 465
(31%) of BESs were not significantly changed, confirming the
previously published BestModelv1 annotation.
For the 974 significantly modified gene models, it is useful to
look more closely at the nature of the modifications made.
Considering the FDMs and counting the number of deviations in
expression from the model, 228 (23%) of the 974 significantly
modified models had at least one error flag not at the ends of the
sequence and 62 (6%) had more than one error flag. 247 (25%) of
gene models had error flags at one end of the sequence or both.
582 (40%) of gene models had at least one error flag, either at a
terminus or in the middle of sequence. Overall, the average
change in gene model size was 27.9%, a substantial general
increase in the sequence length of the Myc-GeneModel set,
although not necessarily a change in the translated sequence. 594
(61%) of gene models showed a more than 10% increase in gene
size while only 28 (3%) of validated gene models showed a more
than 210% change in gene size.
Overall, there was an average increase of 0.5 exons added per
gene model. Within the initial boundaries of the BestModelv1
genes, however, there was an average 20.1 changes to the number
of exons, indicating that most of the increase in number of exons
derived from the up and downstream sequence added to the gene
model. 339 (35%) of modified gene models showed a net increase in
total exons while 126 (13%) showed a net decrease. It is important to
note that comparing the number of exons in the BestModelv1 set
and in the aligned BESs may be a significant underestimation of the
changes made to the BestModelv1. It is possible, for example, that
an exon is removed from the model and a new exon added, making
the net change in number of exons zero, in spite of the fact that
significant changes to the gene model’s structure were made. A case
in point is the gene model encoding Protein ID 294735.
Transcriptomic sequence supports a single intron while the original
gene model contained three introns. Similarly, the gene model
encoding Protein ID 294625 contained seven introns while the
transcriptomic sequence supports a model with 12 introns.
Figure 3. Summary of structural annotation outcome for theMyc-BestModel set.doi:10.1371/journal.pone.0009780.g003
Laccaria Gene Annotation
PLoS ONE | www.plosone.org 5 July 2010 | Volume 5 | Issue 7 | e9780

Discussion
Deep RNA sequencing of the L. bicolor transcriptome provides a
resource for validation and improvement of structural gene models.
This approach is an extension of the classical approach to utilize
EST libraries to seed and define gene models [8,20]. The two
approaches are complementary and there is a general consensus for
structural annotation derived using the EST or RNA-seq data [21].
However, transcriptomics using next generation sequence technol-
ogy provide superior coverage and redundancy of the transcriptome
[22,23]. Although the available EST libraries for L. bicolor contain
approximately 20K clones, the amount of sequence data from the
single transcriptomic data set generates 30-times more sequence
data than the combined EST reads. The combination of reads
derived from a single set of transcriptomic data (30 million reads)
enables comprehensive examination of ,3000 of the gene models in
the Bestmodelv1 set using a transcript sequence coverage depth of
23. The sequence coverage depth of 23 was empirically selected to
enhance gene coverage and thereby maximize the number of gene
with corrected deviation. At this coverage depth, a large fraction of
the models are improved by application of algorithms and using the
transcriptomic sequence. Even minor changes in the intron/exon
boundaries can be resolved by analysis of aligned sequences. A large
fraction of sequence discrepancies can be resolved by adjustment of
the requirement for transcript sequence coverage depth and
inclusion of additional gene models from the BestModelv1 set.
Decreasing the sequence coverage depth will expand the number of
Bestmodelv1 gene model sequences included in the analysis set and
lead to the identification of additional deviations from the model
sequence. However, nonuniform transcript distribution will results
in coverage gaps for comparison of the gene models with the
transcriptomic sequence. A qualitative assessment of relative
variability in transcript coverage can be obtained by inspection of
transcript coverage for gene models from the corrected set (e.g.
Gene model 143003, accessible via the URL provided in the data
resources file provided in Supporting Data).
Comparison of the transcript and Myc-BestModel subset
sequences led to changes in 974 (69%) of gene models. The large
fraction of gene models with revised structural annotation is not
perhaps surprising in view of the relative complexity of the target set.
The set of best models used for analysis was generated primarily by
an automated annotation process [12]. This process effectively
identified gene candidates and requires little manual input.
However, this homology-based process often results in unresolved
structural features and a limited ability to associate relevant
biological information with the sequences [1,6]. Current approach-
es for structural annotation are unable to accurately define exon
content or location [24,25] for many genes. Analysis of internal
sequence deviations in gene model sets from different annotation
methods indicates a variance in the frequency of internal sequence
deviation in gene model sets derived by different annotation
methods (Supplemental Data Table S1). In general, EST-based
prediction methods tend to have a lower percentage of models with
internal FDMs. However, there is a wide variance in the number of
models derived by the methods. The presence of a significant
number of short exon segments in basidiomycetes further increases
the complexity of the structural annotation process for L. bicolor. In
spite of these impediments, the sequence depth and ease of data
generation indicate RNA sequencing provides a reliable resource
for validation and improvement of structural gene models.
Corrections to the Gene ModelsThe transcriptomic sequence provides the opportunity for
accurate identification and localization of exons and enables the
verification or correction of the structural annotation. Our targeted
approached leverages previously collected information to find splice
sites that match observed data and focuses computational effort only
on those splice sites that are not supported by RNAseq data. Analysis
of internal gene model deviations suggest 42% of the expressed and
selected set of L. bicolor gene models contain sequence deviations that
largely represent intron/exon boundaries that do not map to the
mRNA sequence data (Figure 3). Our method has no restrictions on
intron lengths and can identify exons as short at 9 bp. The method
also places no expectations on splice donor and acceptor sites. Unlike
other published methods, our method has an advantage for
identification of splice sites even if they are not a previously reported
or observed. This strategy reasonable at high sequence coverage
depth and enable identification of the maximum number of exons. A
drawback of this approach is increased ambiguity of the exact
genome location of the splice site. Our alignments of the transcript-
derived models to the genome can lead to the improper placement of
the final coding nucleotide associated with the beginning or end of an
exon. This can be resolved by manual inspection of the gene of
interest or the output of this method can also be used in conjunction
with other splice assembly programs [8].
One additional interesting category of modified gene models are
those which contain no deviations from observed expression data
within the boundaries of the BestModelv1 gene models, but
nonetheless showed significant changes to gene structure by
addition of up and/or downstream expressed sequence. A case in
point is the gene model encoding protein ID 163800. The initial
model consisted of two exons and did not contain an appropriate
start methionine (Figure 4). The revised model is more than doubled
in size, contains four exons, and candidate start codons. Of the 974
modified gene models, 453 (30%) had no error flags within their
FDM sequences, but showed a more that 10% increase in gene size.
Of these 453 expanded genes, 193 (43%) also showed in increase in
the total number of exons. Changes that enabled definition or
extension of the N- or C-termini are especially informative to enable
expression and provide clues for function. Modification of the N- or
C-terminus can result in the identification of additional sequence
features such as signal peptides, regions with membrane spanning
helices or pfam domains. This information is useful for functional
annotation and is often essential to enable in vitro protein expression
and future biochemical characterization. Substantial changes to
predicted UTRs also affect the ability to predict the regulatory
mechanisms of mycorrhizae-specific genes.
Uncorrected modelsA vast majority of the Myc-BestModel gene models (1439 or
96%) generated modified gene models with all error flags were
successfully spanned and transcript sequences well aligned to
genomic sequence. The remaining 62 (4%) of gene models either
had error flags that could not be spanned or generated BES’s that
did not align to genomic sequence. The quality of the genome
scaffold contributes in part to the inability to reconcile these gene
models is attributable to genome correct some of this sequence lies
in the incomplete nature of the genomic sequence. The genome is
currently contained in 1178 scaffolds with some unresolved
nucleotide regions. Several gene models contain regions of
unresolved sequence (e.g. N nucleotide designations) in middle
of gene sequence (e.g. gene models coding for the 293291 or
298293 proteins) and/or unusually long introns regions (e.g. the
model coding for the 298293 protein). For several genes, the
presence of alternative transcripts resulted in an uncorrected model
(e.g. the model coding for the 247279 protein) indicating the
method may not identify multiple splice variants when more than
one variant is simultaneously present in dataset. For this study, we
Laccaria Gene Annotation
PLoS ONE | www.plosone.org 6 July 2010 | Volume 5 | Issue 7 | e9780

restricted the RNA-seq data set to a single biological condition to
minimize the contribution of alternative transcripts and facilitate the
methods development and evaluation process. The current method
will generate a corrected gene model if one of the variant represents
.50% of all transcript sequences at the site of the alternative splice.
The gene model encoding the 308888 protein contains five exons
with clearly identified bridging sequences spanning each of the
introns (accessible via the URL provided in the data resources file
provided in Supporting Data). However, inspection of the transcript
map reveals the presence of transcripts that likely span this intron
and likely represent a read through intron variant. The identifica-
tion of splice variants associated with the free living, interaction, and
mycorrhizal states may have implications for the regulation of
metabolic, functional, and metabolic capabilities. In view of the
biological relevance of these genes, we are developing methods for
identification of splice variants using RNA-seq data. For several
uncorrected models, reasons for failure were not immediately
obvious and will likely require extensive biological confirmations to
resolve which is beyond the scope of this study.
High-throughput transcriptomic data was found to provide far
greater resolution for resolving gene structure than a previously
collected data set of ESTs. The outcome of this process is a set of
high confidence gene models that can be reliably used for
experimental characterization of protein function. The corrected
gene structures improve capabilities for the prediction of protein
function and are required for in vitro approaches to characterize
the function of these proteins. The method described here can be
applied to improve gene structural annotation in other species,
provided that there is a sequenced genome and a set of gene
models. This improved annotation process can be extended to
other important gene families and will facilitate the process to
identify the molecular mechanisms leading to the development of
the mycorrhizal symbiosis and its implications in improving
carbon sequestration by poplar.
Methods
Laccaria bicolor culture, In vitro interaction setup andRNA extraction
L. bicolor (Maire) Orton (strain S238N) culture was maintained
on Modified Melin Norkan’s media as described [26] at 20uC.
Total RNA was extracted from control, interaction and mycor-
rhizal samples by CTAB method [27]. Total RNA is treated with
RQ-DNase (Promega, Madison, WI).
mRNA-Seq sample preparationProcedures described for preparation of mRNA for the mouse
transcriptome analysis [28] were used with some modifications. Ten
ug of total RNA from each was hybridized to Sera-mag oligo (dT)
beads (Thermo Scientific) for mRNA purification. Purified mRNA
was fragmented by addition of 56 fragmentation buffer (Illumina,
Hayward, CA) and was heated for 5 min at 94uC in a thermocycler.
First strand cDNA was synthesized using random primers to
eliminate the general bias towards 39 end of the transcript. Second
strand cDNA synthesis was done by adding GEX second strand
buffer (Illumina, Hayward, CA), dNTPs, RNaseH and DNA
polymerase I followed by incubation for 2.5 h at 16uC. Second
strand cDNA was further subjected to end repair, A-tailing, and
adapter ligation in accordance with the manufacturer supplied
protocols. Purified cDNA templates were enriched by PCR
amplification with Phusion DNA polymerase (Illumina, Hayward,
CA) and the samples were cleaned using QIAquick PCR purification
columns and eluted in 30 ml EB buffer as per manufacturer’s
instructions (QIAGEN, CA). Purified cDNA libraries were quantified
using Nanodrop spectrophotometer and loaded onto Illumina flow
cells. A total of three sequencing lanes were run. One lane was run to
46 bp reads, the others were run to 72 bp reads. For this study, all
72 bp reads were truncated to a uniform 46 bp by removal of bases
from the 39 end. The total sequence yield was 39.1 million reads.
Figure 4. Comparison of the original and revised gene models encoding protein 163800 on genome sequence scaffold 19. Locationon scaffold is on x-axis and numbers of read alignments at each bp is on the y axis. The gray line represents alignments to genomic sequence, The redlines are read alignments to JGI gene model and corrected gene model, but not to the genomic sequence. The sequence span of original gene modelis displayed a green horizontal bar at the bottom of the transcript coverage trace. The revised gene model is displayed as a blue horizontal bar.doi:10.1371/journal.pone.0009780.g004
Laccaria Gene Annotation
PLoS ONE | www.plosone.org 7 July 2010 | Volume 5 | Issue 7 | e9780

Gene Models and L. bicolor Genomic SequenceL. bicolor genomic sequence and gene models were taken from
Joint Genome Institute, using publically available data files. Best
Modelsv1 is the filtered set of models representing the best gene
model for each locus from the Joint Genome Institute (JGI).
‘‘BestModels1.na.fasta’’, contains 20614 gene models which
average 1.1 Kbp per gene with an average of 5.4 exons of an
average 210 bp per exon [12]. The intron density and average
intron length is consistent with that observed in other basidiomy-
cetes. In the BestModelsv1 set, 92% of the splice donor sites are
GT and 5% GA. AG and GC comprise 94% and 5% of the splice
acceptor sites, respectively.
Identification of L. bicolor Mycorrhizal TranscriptomeAffymetix data from [12] was used to identify genes differen-
tially expressed in mycorrhizal L. bicolor relative to free-living
mycelial L. bicolor. Samples compared were ‘‘Laccaria/Populus
ECM greenhouse’’ and ‘‘Laccaria/Populus ECM in vitro’’ vs.
‘‘Free-living mycelium Laccaria bicolor S238N 1’’ and ‘‘Free-
living mycelium Laccaria bicolor S238N 2’’
We selected 1501 gene models expressed at greater than 500
RPK from Set 3 of the ‘Bowtie’ alignments. Gene models in the
selected set were differentially expressed in Mycorrhizal vs. Free
Living Mycelium at a absolute value log 2 fold change greater than
0.6 (a minimum 1.5 fold change) at a Benjamini-Hochberg (BH)
[29] False Discovery Rate (FDR) corrected Local Pooled Error
(LPE) test [30] p-value ,0.05.
Biological significance of L. bicolor MycorrhizalTranscriptome
To assign a p-value to observations that can be considered as
the probability that some number of successes is observed in a set
of observations, the Cumulative Binomial Distribution (CBD) can
be used. The binomial probability mass function is written as:
b(x, n, p)~n
x
� �px(1{p)n{x
The cumulative binomial distribution is a function of the binomial
probability mass function:
B(x, n, p)~Xx
y~0
b(y, n, p)
The CBD as written here returns the probability that there are at
most number x successes in n trials where each trial has a
probability of success p. A CBD-derived p-value is reported as 1-B.
For determining the significance of enrichment of annotations in
the set of 1501 gene models (myc-BestModels) representative of
the mycorrhizal transcriptome, The enrichment of a specific
annotation is determined as CBD p-value with x equal to the
number of gene models in the transcriptome set with a that specific
annotation, n equal to 1501, and p, the probability of success equal
to the fraction of BestModelsv1 with that annotation.
Alignment of RNA-seq reads to gene models andgenomic sequence
The ultra-fast sequence alignment program ‘‘Bowtie-0.9.9’’ [19]
was used to generate alignments of RNA sequence reads to the
genome and gene models. ‘‘Bowtie’’ uses a Burrows-Wheeler
index to rapidly align sequences to a pre-processed indexed set of
sequences and uses a small memory footprint. The output of
‘‘Bowtie’’ includes the names of the reads that aligned, the
orientation of the reads in the alignments, the names of the
sequence to which the reads aligned, and the offsets into the
reference sequences of the alignments. The default Bowtie
conditions of a default high-quality read length of 28, two
permitted mismatches in the high-quality end of a read, and
maximum acceptable quality distance of the overall align-
ment = 70 were used to generate the following subsets of sequence
alignments from the total 39.1 million collected RNA-seq reads:
Set 1– RNA-seq reads aligned to genomic sequence ‘‘laccar-
ia.allmasked’’ (15.4 million reads aligned)
Set 2- RNA-seq reads cDNAs aligned to gene models
‘‘BestModels1.na.fasta’’ but not to genomic sequence
(3.7 million reads aligned)
Set 3- RNA-seq reads cDNAs aligned to gene models
‘‘BestModels1.na.fasta’’ (16.9 million reads aligned)
Identify deviations in RNA-seq data from gene modelsA Perl script was written to analyze the output from ‘Bowtie’ to
determine how many aligned reads were found for every base pair
on the scaffolds how many reads aligned to the proposed splice
sites of each gene. The script parameters were initially validated
using a subset of 1501 genes associated with the mycorrhizal
transcriptome. The gene models in this subset of the Bestmodels
were used to validate the ability to find and correct discrepancies
between the predicted gene models and the observed transcrip-
tomic data. The complete method is also summarized in Figure 1.
For each gene model analyzed, a Flagged Deviations from
Model (FDM) sequence is generated by the following method.
For every gene, indexed n, in analysis set
FDMn~null
For i~tartBpn to stopBpn
If GeneModel i½ �
If GenomeAlign n,i½ �zBorderAlign n,i½ �
vThreshold
FDMn~FDMnz}X}
Else
If Not GeneModel n,iz1½ �
and BorderAlign n,i½ �vThreshold
FDMn~FDMnz}X}
Else
FDMn~FDMnzScaffold i½ �
startBPn and stopBPn are the start and stop positions of the gene model
on the scaffold for gene n. GeneModel[n, i] is an array, indexed by
scaffold bp equal to TRUE when the base pair at scaffold position i
belongs to the gene model n, and equals FALSE otherwise.
GenomeAlign[i] is the number of RNA reads from Set 1 ‘Bowtie’
alignments to scaffold at position i. BorderAlign[i] is the number of
RNA reads alignments from Set 2 ‘Bowtie’ alignments to scaffold at
position i that align to the gene model but not to the scaffold,
indicating a read that spans a splice site. Scaffold[i] is the positive
strand base (A, G, C, T, or N) at position i. FDMn is the Flagged
Laccaria Gene Annotation
PLoS ONE | www.plosone.org 8 July 2010 | Volume 5 | Issue 7 | e9780
Deviation from Model sequence for gene n. Threshold is the minimum
number of read alignments required to consider there to be
expression. For this study, a Threshold of 2 alignments was used. A
base pair of ‘‘X’’ here is used as an error flag in the FDM sequence,
identifying regions in the gene model not supported by the expression
data and that require correction. The resulting FDMn is the sequence
for the gene model n as it is expressed in the set of RNA-seq data with
error flags inserted into the sequence where the observed expression
was found to deviate from the published gene model.
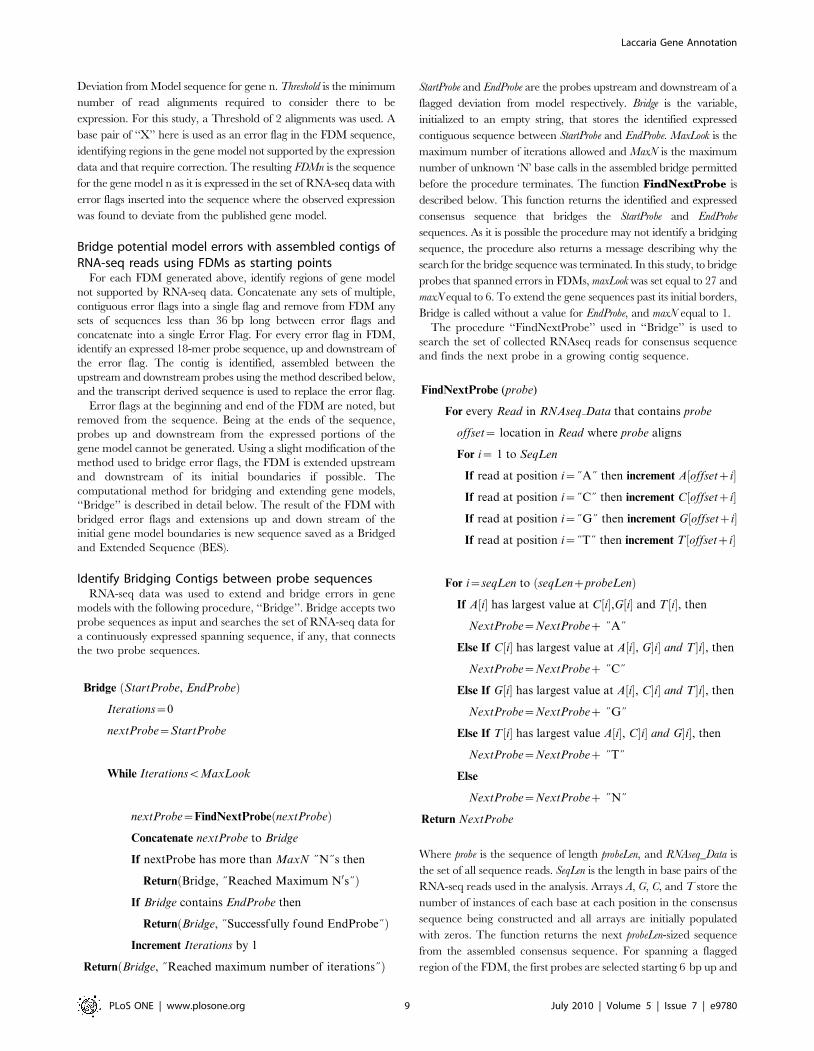
Bridge potential model errors with assembled contigs ofRNA-seq reads using FDMs as starting points
For each FDM generated above, identify regions of gene model
not supported by RNA-seq data. Concatenate any sets of multiple,
contiguous error flags into a single flag and remove from FDM any
sets of sequences less than 36 bp long between error flags and
concatenate into a single Error Flag. For every error flag in FDM,
identify an expressed 18-mer probe sequence, up and downstream of
the error flag. The contig is identified, assembled between the
upstream and downstream probes using the method described below,
and the transcript derived sequence is used to replace the error flag.
Error flags at the beginning and end of the FDM are noted, but
removed from the sequence. Being at the ends of the sequence,
probes up and downstream from the expressed portions of the
gene model cannot be generated. Using a slight modification of the
method used to bridge error flags, the FDM is extended upstream
and downstream of its initial boundaries if possible. The
computational method for bridging and extending gene models,
‘‘Bridge’’ is described in detail below. The result of the FDM with
bridged error flags and extensions up and down stream of the
initial gene model boundaries is new sequence saved as a Bridged
and Extended Sequence (BES).
Identify Bridging Contigs between probe sequencesRNA-seq data was used to extend and bridge errors in gene
models with the following procedure, ‘‘Bridge’’. Bridge accepts two
probe sequences as input and searches the set of RNA-seq data for
a continuously expressed spanning sequence, if any, that connects
the two probe sequences.
Bridge StartProbe, EndProbeð Þ
Iterations~0
nextProbe~StartProbe
While IterationsvMaxLook
nextProbe~FindNextProbe nextProbeð Þ
Concatenate nextProbe to Bridge
If nextProbe has more than MaxN }N}s then
Return Bridge, }Reached Maximum N0s}ð Þ
If Bridge contains EndProbe then
Return Bridge, }Successfully found EndProbe}ð Þ
Increment Iterations by 1
Return Bridge, }Reached maximum number of iterations}ð Þ
StartProbe and EndProbe are the probes upstream and downstream of a
flagged deviation from model respectively. Bridge is the variable,
initialized to an empty string, that stores the identified expressed
contiguous sequence between StartProbe and EndProbe. MaxLook is the
maximum number of iterations allowed and MaxN is the maximum
number of unknown ‘N’ base calls in the assembled bridge permitted
before the procedure terminates. The function FindNextProbe is
described below. This function returns the identified and expressed
consensus sequence that bridges the StartProbe and EndProbe
sequences. As it is possible the procedure may not identify a bridging
sequence, the procedure also returns a message describing why the
search for the bridge sequence was terminated. In this study, to bridge
probes that spanned errors in FDMs, maxLook was set equal to 27 and
maxN equal to 6. To extend the gene sequences past its initial borders,
Bridge is called without a value for EndProbe, and maxN equal to 1.
The procedure ‘‘FindNextProbe’’ used in ‘‘Bridge’’ is used to
search the set of collected RNAseq reads for consensus sequence
and finds the next probe in a growing contig sequence.
FindNextProbe (probe)
For every Read in RNAseq Data that contains probe
offset~ location in Read where probe aligns
For i~ 1 to SeqLen
If read at position i~}A} then increment A offsetzi½ �
If read at position i~}C} then increment C offsetzi½ �
If read at position i~}G} then increment G offsetzi½ �
If read at position i~}T} then increment T offsetzi½ �
For i~seqLen to seqLenzprobeLenð Þ
If A i½ � has largest value at C i½ �,G i½ � and T i½ �, then
NextProbe~NextProbez }A}
Else If C i½ � has largest value at A½i , G� �i and T� �i�, then
NextProbe~NextProbez }C}
Else If G i½ � has largest value at A½i , C� �i and T� �i�, then
NextProbe~NextProbez }G}
Else If T i½ � has largest value A½i , C� �i and G� �i�, then
NextProbe~NextProbez }T}
Else
NextProbe~NextProbez }N}
Return NextProbe
Where probe is the sequence of length probeLen, and RNAseq_Data is
the set of all sequence reads. SeqLen is the length in base pairs of the
RNA-seq reads used in the analysis. Arrays A, G, C, and T store the
number of instances of each base at each position in the consensus
sequence being constructed and all arrays are initially populated
with zeros. The function returns the next probeLen-sized sequence
from the assembled consensus sequence. For spanning a flagged
region of the FDM, the first probes are selected starting 6 bp up and
Laccaria Gene Annotation
PLoS ONE | www.plosone.org 9 July 2010 | Volume 5 | Issue 7 | e9780

downstream of the flag. If these probes do not identify a spanning
sequence, then new probes 15 bp up and downstream of the flag are
used. If these probes fail, probes 21 bp up and downstream of the
flag are used. If these return no spanning sequence, then the error is
flagged as unidentified. Although a perfect match is required for
finding up and downstream probes, this step-wise procedure will
identify spanning sequence even if there are mismatches in one of
the possible probes. Also, this procedure can accommodate for
possible misalignments at the intron-exon border where some
alignments occur that crosses by a few base pairs the intron-exon
boundary. When extending the FDM up and downstream, the first
and last 18 bp of the FDM are used as the initial probes.
Align BESs to scaffoldsThe BESs, constructed from RNA-seq data corrected FDM’s
represent the expressed gene sequence as transcribed under
specific biological conditions, but they do not contain information
regarding the gene structure. Assembled sequence that bridges an
identified error in a BES might contain only corrected intron
boundaries, or might introduce a number of previously unreported
exons. In order to recover gene structure information, it is
necessary to align the BES back to the L. bicolor chromosome. This
was accomplished using the Smith-Waterman algorithm with a
few minor modifications [31]. The L. bicolor scaffold sequences
were taken from ‘‘Laccaria.alllasked’’ from JGI.
The penalty for inserting a gap into the chromosomal sequence
is 224 while the gap penalty for inserting a gap into the BES gene
sequence is 21. The penalty for inserting a gap at the beginning or
end of the BES is 0. This fits our expectations for the alignment.
Gaps in the chromosome are unlikely, but not impossible,
suggesting that some erroneous deletion from the assembled
scaffold has been made. Gaps in the BES sequence, representing
introns, are expected and so the penalty is less than for the scaffold
sequence. Match-Mismatch scores were set to 8 for a match, 212
for a mismatch, and 4 for any nucleotide matching with an ‘N’. ‘N’
nucleotides can be present both in the published genomic
sequence and as a consequence of the bridging contig method
described below. A score of 4 for an ‘N’ prevents inserting spurious
gaps in the contig sequence without over-fitting contiguous ‘N’s
into the alignment. Though L. bicolor exons can be short, isolated
alignments of small sets of nucleotides bracketed by spaces in the
BES should be discouraged. In our modified Smith-Waterman
algorithm, alignments of less than 4 contiguous nucleotides in the
BES, allowing an ‘N’ to match any nucleotide, are not permitted.
Before alignment, 5% off the end of any sequence added from
the gene model extension, upstream or downstream, was trimmed.
The sequence of the scaffold selected for alignment is the region
within the original BestModelv1 boundaries plus three times the
size of the up and downstream sequence added. If the first attempt
to align the BES to the genomic sequence failed, the sequences
were reversed and complimented and a second attempt to realign
was made. From the alignment, the gene model’s structural
annotation can be generated and was saved in GFF format. The
final output of this method is the set of expressed BES gene models
in FASTA format, the structural annotation of the gene models in
GFF format, and a new set of FDMs sequences resulting from the
re-alignment RNA-seq data to the modified gene models using
‘Bowtie’.
Supporting Information
Text S1 A gff format text file containing all revised gene models
for the Myc-BestModel gene model set.
Found at: doi:10.1371/journal.pone.0009780.s001 (0.74 MB
TXT)
Text S2 A fasta format text file containing the modified
transcript sequences for the Myc-BestModel gene model set.
Found at: doi:10.1371/journal.pone.0009780.s002 (1.85 MB
TXT)
Text S3 A text file listing project data files and resources
available for viewing and download. A project URL is provided to
facilitate access to these resources.
Found at: doi:10.1371/journal.pone.0009780.s003 (0.00 MB
TXT)
Table S1 Comparison of Internal Sequence Deviations in Gene
Model Sets from Different Annotation Methods.
Found at: doi:10.1371/journal.pone.0009780.s004 (0.09 MB
DOC)
Acknowledgments
The submitted manuscript has been created by UChicago Argonne, LLC,
Operator of Argonne National Laboratory (‘‘Argonne’’). Argonne, a U.S.
Department of Energy Office of Science laboratory, is operated under
Contract No. DE-AC02-06CH11357. The U.S. Government retains for
itself, and others acting on its behalf, a paid-up nonexclusive, irrevocable
worldwide license in said article to reproduce, prepare derivative works,
distribute copies to the public, and perform publicly and display publicly,
by or on behalf of the Government.
Dedication: This paper is published in memory of Dr. Gopi K. Podila,
Professor and Chair, Department of Biological Sciences, University of
Alabama in Huntsville.
Author Contributions
Conceived and designed the experiments: PL GKP FRC. Performed the
experiments: GT AS. Analyzed the data: PL GKP FRC. Contributed
reagents/materials/analysis tools: PL VL GKP FRC. Wrote the paper: PL
GKP FRC.
References
1. Brent MR (2008) Steady progress and recent breakthroughs in the accuracy of
automated genome annotation. Nat Rev Genet 9: 62–73.
2. Stothard P, Wishart DS (2006) Automated bacterial genome analysis and
annotation. Curr Opin Microbiol 9: 505–510.
3. Valencia A (2005) Automatic annotation of protein function. Curr Opin Struct
Biol 15: 267–274.
4. Friedberg I (2006) Automated protein function prediction–the genomic
challenge. Brief Bioinform 7: 225–242.
5. Sadowski MI, Jones DT (2009) The sequence-structure relationship and protein
function prediction. Curr Opin Struct Biol 19: 357–362.
6. Jones CE, Brown AL, Baumann U (2007) Estimating the annotation error rate of
curated GO database sequence annotations. BMC Bioinformatics 8: 170.
7. Raes J, Harrington ED, Singh AH, Bork P (2007) Protein function space:
viewing the limits or limited by our view? Curr Opin Struct Biol 17: 362–
369.
8. Haas BJ, Salzberg SL, Zhu W, Pertea M, Allen JE, et al. (2008) Automated
eukaryotic gene structure annotation using EVidenceModeler and the Program
to Assemble Spliced Alignments. Genome Biol 9: R7.
9. Huang X, Adams MD, Zhou H, Kerlavage AR (1997) A tool for analyzing and
annotating genomic sequences. Genomics 46: 37–45.
10. Trapnell C, Pachter L, Salzberg SL (2009) TopHat: discovering splice junctions
with RNA-Seq. Bioinformatics 25: 1105–1111.
11. Kupfer DM, Drabenstot SD, Buchanan KL, Lai H, Zhu H, et al. (2004) Introns
and splicing elements of five diverse fungi. Eukaryot Cell 3: 1088–1100.
12. Martin F, Aerts A, Ahren D, Brun A, Danchin EG, et al. (2008) The genome of
Laccaria bicolor provides insights into mycorrhizal symbiosis. Nature 452:
88–92.
13. Stajich JE, Dietrich FS, Roy SW (2007) Comparative genomic analysis of fungal
genomes reveals intron-rich ancestors. Genome Biol 8: R223.
14. Harley JL, Smith SE (1983) Mycorrhizal symbiosis. London: Academic Press.
Laccaria Gene Annotation
PLoS ONE | www.plosone.org 10 July 2010 | Volume 5 | Issue 7 | e9780

15. Smith SE, Read DJ (1997) Mycorrhizal Symbiosis. London: Academic Press.
16. Koide RT, Sharda JN, Herr JR, Malcolm GM (2008) Ectomycorrhizal fungiand the biotrophy-saprotrophy continuum. New Phytol 178: 230–233.
17. Nehls U (2008) Mastering ectomycorrhizal symbiosis: the impact of carbohy-
drates. J Exp Bot 59: 1097–1108.18. Nehls U, Grunze N, Willmann M, Reich M, Kuster H (2007) Sugar for my
honey: carbohydrate partitioning in ectomycorrhizal symbiosis. Phytochemistry68: 82–91.
19. Langmead B, Trapnell C, Pop M, Salzberg SL (2009) Ultrafast and memory-
efficient alignment of short DNA sequences to the human genome. Genome Biol10: R25.
20. Ho EC, Cahill MJ, Saville BJ (2007) Gene discovery and transcript analyses inthe corn smut pathogen Ustilago maydis: expressed sequence tag and genome
sequence comparison. BMC Genomics 8: 334.21. Thierry-Mieg D, Thierry-Mieg J (2006) AceView: a comprehensive cDNA-
supported gene and transcripts annotation. Genome Biol 7 Suppl 1: S12 11–14.
22. Wang Z, Gerstein M, Snyder M (2009) RNA-Seq: a revolutionary tool fortranscriptomics. Nat Rev Genet 10: 57–63.
23. Wilhelm BT, Landry JR (2009) RNA-Seq-quantitative measurement ofexpression through massively parallel RNA-sequencing. Methods.
24. Guigo R, Agarwal P, Abril JF, Burset M, Fickett JW (2000) An assessment of
gene prediction accuracy in large DNA sequences. Genome Res 10: 1631–1642.
25. Guigo R, Flicek P, Abril JF, Reymond A, Lagarde J, et al. (2006) EGASP: the
human ENCODE Genome Annotation Assessment Project. Genome Biol 7
Suppl 1: S2 1–31.
26. Kim SJ, Zheng J, Hiremath ST, Podila GK (1998) Cloning and characterization
of a symbiosis-related gene from an ectomycorrhizal fungus Laccaria bicolor.
Gene 222: 203–212.
27. Cseke LJ, Kaufman PB, Podila GK, Tsai CJ (2004) Handbook of Molecular and
Cellular Methods in Biology and Medicine. Florida, , USA: CRC Press LLC.
28. Mortazavi A, Williams BA, McCue K, Schaeffer L, Wold B (2008) Mapping and
quantifying mammalian transcriptomes by RNA-Seq. Nat Methods 5: 621–628.
29. Hochberg Y, Benjamini Y (1990) More powerful procedures for multiple
significance testing. Stat Med 9: 811–818.
30. Jain N, Thatte J, Braciale T, Ley K, O’Connell M, et al. (2003) Local-pooled-
error test for identifying differentially expressed genes with a small number of
replicated microarrays. Bioinformatics 19: 1945–1951.
31. Smith TF, Waterman MS (1981) Identification of common molecular
subsequences. J Mol Biol 147: 195–197.
Laccaria Gene Annotation
PLoS ONE | www.plosone.org 11 July 2010 | Volume 5 | Issue 7 | e9780
Copyright © 2022 FDOKUMEN