Using a modified Nordmøre grid for by-catch reduction in the Portuguese crustacean-trawl fishery
17
Fisheries Research 71 (2005) 223–239 Using a modified Nordmøre grid for by-catch reduction in the Portuguese crustacean-trawl fishery Paulo Fonseca a,∗ , Aida Campos a , Roger B. Larsen b , Teresa C. Borges c , Karim Erzini c a INIAP/IPIMAR—Portuguese Institute for Agriculture and Fisheries Research, Avenida de Bras´ ılia, 1449-006 Lisboa, Portugal b The Norwegian College of Fishery Science, University of Tromsø, N-9037 Tromsø, Norway c Centre of Marine Sciences (CCMAR), University of the Algarve, Campus de Gambelas, 8000-117 Faro, Portugal Received 3 October 2003; received in revised form 9 August 2004; accepted 9 August 2004 Abstract By-catch and discards are a common problem to all fisheries. Recent studies of the Portuguese crustacean-trawl fishery show that discards average 70% of the total catch. This situation poses a threat not only to the management of target and commercial fish by-catch species stocks, but also in terms of the ecosystem impact of the discarded species whose survival is generally low. Previous attempts to address this problem by using oblique separator mesh panels associated with square-mesh windows, or square-mesh windows alone, provided encouraging results, but these are unlikely to have commercial applicability at present. Therefore, we tested the efficiency of a modified Nordmøre grid in excluding some of the most captured non-commercial by- catch species, such as the blue whiting, Micromesistius poutassou, and the boarfish, Capros aper, evaluating simultaneously the losses of the crustacean target species (rose shrimp, Parapenaeus longirostris, Norway lobster, Nephrops norvegicus and red shrimp, Aristeus antennatus) and commercially valuable fish by-catch. A total of 41 valid hauls were carried out during 2001, and 15 in 2002 on board the R/V “Noruega”. Results from both years varied considerably, with higher by-catch exclusion rates, in weight, registered in the second survey (73–74 and 48–63% for blue whiting and boarfish, respectively). The corresponding percentage reduction for target species was 8–15% for the Norway lobster, 4–9% for rose shrimp and 7–10% for red shrimp. The level of exclusion of the non-commercial by-catch is encouraging, although short-term loss of Norway lobster, where the escapees comprised larger individuals, raises some concern with regards to fishers’ acceptance of mandatory use of grids. © 2004 Elsevier B.V. All rights reserved. Keywords: Trawl selectivity; Sorting grids; By-catch reduction; Nephrops norvegicus; Parapenaeus longirostris; Aristeus antennatus; Microme- sistius poutassou; Capros aper; Portuguese waters ∗ Corresponding author. Tel.: +351 213 027 163; fax: +351 213 015 948. E-mail addresses: [email protected] (P. Fonseca), [email protected] (A. Campos), [email protected] (R.B. Larsen), [email protected] (T.C. Borges), [email protected] (K. Erzini). 0165-7836/$ – see front matter © 2004 Elsevier B.V. All rights reserved. doi:10.1016/j.fishres.2004.08.018
-
Upload
independent -
Category
Documents
-
view
5 -
download
0
Transcript of Using a modified Nordmøre grid for by-catch reduction in the Portuguese crustacean-trawl fishery
Fisheries Research 71 (2005) 223–239
Using a modified Nordmøre grid for by-catch reduction in thePortuguese crustacean-trawl fishery
Paulo Fonsecaa,∗, Aida Camposa, Roger B. Larsenb,Teresa C. Borgesc, Karim Erzinic
a INIAP/IPIMAR—Portuguese Institute for Agriculture and Fisheries Research, Avenida de Bras´ılia, 1449-006 Lisboa, Portugalb The Norwegian College of Fishery Science, University of Tromsø, N-9037 Tromsø, Norway
c Centre of Marine Sciences (CCMAR), University of the Algarve, Campus de Gambelas, 8000-117 Faro, Portugal
Received 3 October 2003; received in revised form 9 August 2004; accepted 9 August 2004
Abstract
By-catch and discards are a common problem to all fisheries. Recent studies of the Portuguese crustacean-trawl fishery showthat discards average 70% of the total catch. This situation poses a threat not only to the management of target and commercialfish by-catch species stocks, but also in terms of the ecosystem impact of the discarded species whose survival is generally low.
Previous attempts to address this problem by using oblique separator mesh panels associated with square-mesh windows, orsquare-mesh windows alone, provided encouraging results, but these are unlikely to have commercial applicability at present.Therefore, we tested the efficiency of a modified Nordmøre grid in excluding some of the most captured non-commercial by-
e
2001,on rates,spondingd shrimp.here thegrids.
catch species, such as the blue whiting,Micromesistius poutassou, and the boarfish,Capros aper, evaluating simultaneously thlosses of the crustacean target species (rose shrimp,Parapenaeus longirostris, Norway lobster,Nephrops norvegicusand redshrimp,Aristeus antennatus) and commercially valuable fish by-catch. A total of 41 valid hauls were carried out duringand 15 in 2002 on board the R/V “Noruega”. Results from both years varied considerably, with higher by-catch exclusiin weight, registered in the second survey (73–74 and 48–63% for blue whiting and boarfish, respectively). The correpercentage reduction for target species was 8–15% for the Norway lobster, 4–9% for rose shrimp and 7–10% for reThe level of exclusion of the non-commercial by-catch is encouraging, although short-term loss of Norway lobster, wescapees comprised larger individuals, raises some concern with regards to fishers’ acceptance of mandatory use of© 2004 Elsevier B.V. All rights reserved.
Keywords:Trawl selectivity; Sorting grids; By-catch reduction;Nephrops norvegicus;Parapenaeus longirostris;Aristeus antennatus;Microme-sistius poutassou; Capros aper; Portuguese waters
∗ Corresponding author. Tel.: +351 213 027 163; fax: +351 213 015 948.E-mail addresses:[email protected] (P. Fonseca), [email protected] (A. Campos), [email protected] (R.B. Larsen),
[email protected] (T.C. Borges), [email protected] (K. Erzini).
0165-7836/$ – see front matter © 2004 Elsevier B.V. All rights reserved.doi:10.1016/j.fishres.2004.08.018

224 P. Fonseca et al. / Fisheries Research 71 (2005) 223–239
1. Introduction
Vessels operating in the crustacean-trawl fishery offthe coast of Algarve (south Portugal), target Norwaylobster,Nephrops norvegicus, rose shrimp,Parape-naeus longirostris, and red shrimp,Aristeus antenna-tus, using a minimum codend mesh size of 55 mm.From 1984 to 1993, the Norway lobster dominatedthe landings, while from 1994 onwards there was ashift to the rose shrimp and red shrimp as the stockof Norway lobster declined. Like in most crustacean-trawl fisheries throughout the world, there is also asubstantial capture of by-catch in addition to the tar-geted species. Some of the by-catch is retained andsold, including high value species such as the Euro-pean hake,Merluccius merluccius, and the monkfish,Lophiusspp., that contribute to a significant propor-tion of the total revenues of this fishery. However,a large subset comprising a miscellaneous collectionof fish, crustaceans and cephalopods is discarded atsea.
An average of 70% of the total catch weight per haulwas discarded in this fishery in 1995–1996 (Borgeset al., 2001), while in subsequent years a lower fig-ure of about 38% was reported byMonteiro et al.(2001). The blue whiting,Micromesistius poutassou,was found to be the most abundant discard in the lat-ter study. Often, a certain proportion of discards cor-responds to undersized individuals of commerciallyvaluable species that form the basis of other fish-e ng isv ofsb thori-t
sh-e rgeq ciesh alter-a im-p lter-a izea useo redt ew,B sh mer-
cially adopted in some fisheries, e.g., in Argentina,Australia, Canada, Iceland, Mexico, Norway, USA(Anon., 1996, 1998), there is often considerable resis-tance from the industry to their enforced use. Someof the factors that have been shown to limit ac-ceptance of modifications include: failure to oper-ate efficiently over a range of commercial condi-tions (Christian and Harrington, 1987), undesirable ef-fects on gear performance and handling (Oravetz andGrant, 1986), complex designs and high costs (Watson,1989; Mounsey et al., 1995; Robins and McGilvray,1999) and unacceptable losses of commercially valu-able by-catch or of target species (Hanna and Jones,2000).
The improvement in codend selectivity of crus-tacean trawls has been previously addressed byINIAP/IPIMAR (Portuguese Institute for Agricultureand Fisheries Research). A considerable amount of in-formation was gathered regarding how the most im-portant species react both to an increase in codendmesh size and changes in mesh configuration (Camposet al., 2002, 2003). The results obtained in these stud-ies support the idea that an increase in codend meshsize from the current 55 mm, as well as a change inmesh configuration from 55 mm diamond to 55 mmsquare mesh, would allow the exclusion of a high pro-portion of undersized individuals, together with non-commercial by-catch, but always at the expense of los-ing an important fraction of commercial-sized shrimp.Experiments using separator mesh panels (Campos andF int ta ves-s nderc hilet ing,l size( eshw kelyt
iffer-e møreg ssfuli sivel atoryi ,1
ries. For these species the practice of discardiiewed as a contribution to growth overfishingtocks, causing conflicts among differentmetiersandetween fishers and fisheries management au
ies.In a considerable number of crustacean-trawl fi
ries, the concern raised by the mortality of lauantities of by-catch and undersized target speas been addressed via the assessment oftions to existing commercial trawls, designed torove both size and species-selectivity. These ations typically have involved changes in the snd shape of the codend meshes and/or thef different types of devices, commonly refer
o as by-catch reducing devices (BRDs) (reviroadhurst, 2000). Although different types of BRDave been successfully testedworldwide and com
onseca, 2004) and square-mesh windows insertedhe upper belly or in the top of the codend (Fonseca el., 1998) were also carried out on board researchels, and therefore the validation of the results uommercial conditions is still needed. However, whe sorting panels had a complex design and riggosses of rose shrimp above the minimum landingMLS) were registered when using the square-mindows alone. Hence, both the latter devices are li
o raise objections from fishers.As a consequence, it was decided to pursue a d
nt approach based on the use of a modified Nordrid, as these types of BRDs have proven succe
n a number of crustacean fisheries (without excesoss of target species), and their use is now mandn several fisheries in the North Atlantic (Anon., 1996998).
P. Fonseca et al. / Fisheries Research 71 (2005) 223–239 225
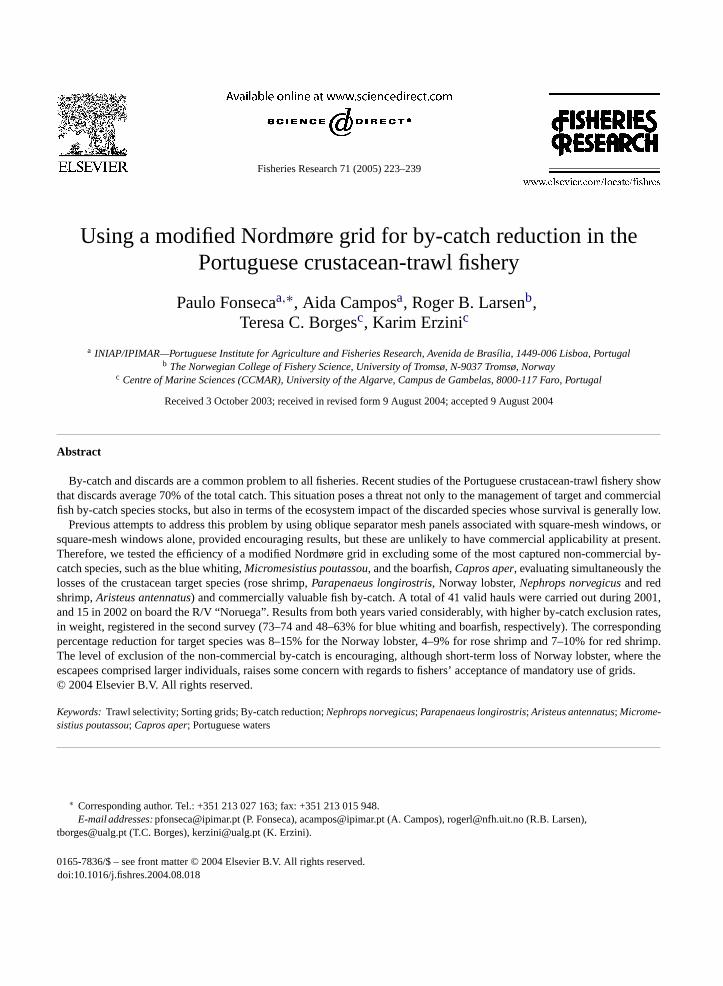
Fig. 1. Technical drawings of the trawl used in this study: (a) top panel; (b) side panel; (c) bottom panel.
2. Material and methods
2.1. The gear
The technical drawings of the trawl used are inFig. 1. The trawl was entirely made of braidedpolyethylene (PET), 47.2 m long from the wing tipsto the codend joining row, with a circumference of1112 meshes of 60 mm1 at the footrope level. The co-dend was 8 m long and was entirely made of twistedpolyamide mesh of 20 mm size and 1.0 mm twine thick-ness. The gear was rigged with a 47.0 m long footrope
1 Throughout the text mesh size should be understood as stretchedmesh.
made up of 16 mm combination rope covered with16 mm PET, 6.9 m bridles, sweeps of 100 m and semi-oval Portuguese Sounete doors of 650 kg each (area:4.2 m2). Trawl geometry and speed were recorded dur-ing the surveys using height, spread and speed sensors.
2.2. The grid system
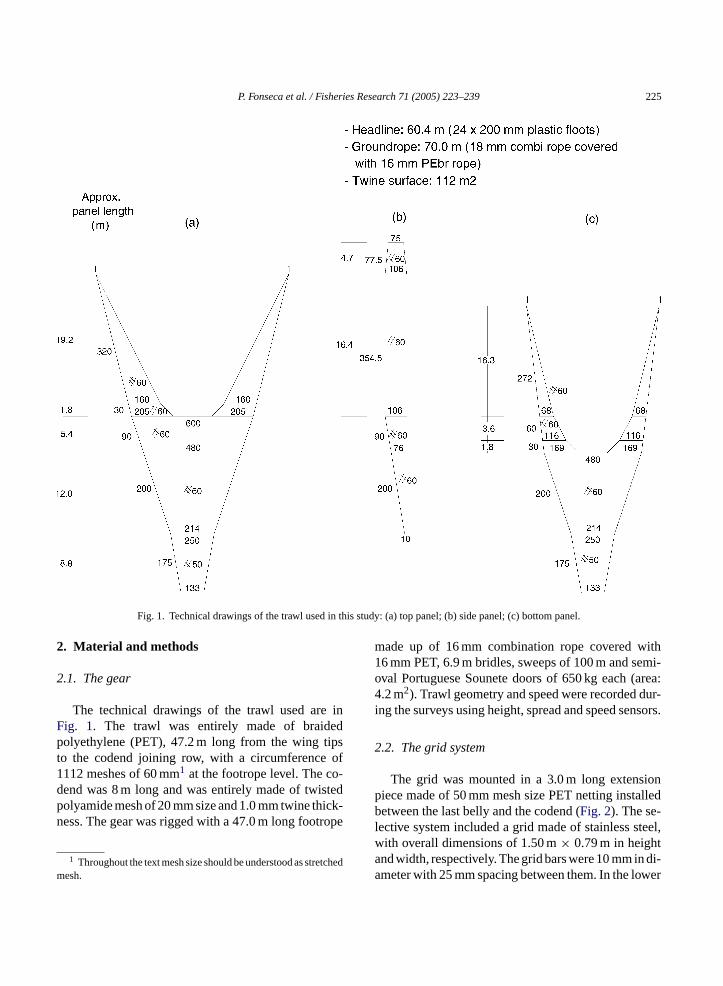
The grid was mounted in a 3.0 m long extensionpiece made of 50 mm mesh size PET netting installedbetween the last belly and the codend (Fig. 2). The se-lective system included a grid made of stainless steel,with overall dimensions of 1.50 m× 0.79 m in heightand width, respectively. The grid bars were 10 mm in di-ameter with 25 mm spacing between them. In the lower
226 P. Fonseca et al. / Fisheries Research 71 (2005) 223–239
Fig. 2. Details of the selective system and its placement in the trawl: (a) trawl top panel; (b) grid details; (c) selective system.
part of the grid a 20 cm high section without bars wasintended to allow Norway lobster to enter directly intothe trawl codend.
A triangular shaped escape hole (1.3 m side length)was located just above the grid at the top of the ex-tension piece, to release fish that either react to thegrid or are too large to cross the bars. A guiding fun-nel with a stretched length of 1.55 m (33 meshes of50 mm) was located before the grid with the purposeof forcing all the fish to enter into contact with thelower half of the grid, irrespective of the height oftheir entrance in the trawl, thus preventing direct escapethrough the top hole. The guiding funnel consisted ofa double PET 50 mm mesh size panel cut along a lineof bars. The funnel was attached to the front end ofthe upper panel of the extension piece and fixed to itslower panel 0.5 m ahead of the grid, where an elasticrope restricted its opening. The grid was mounted intothe extension piece in such a way to achieve a workingangle of attack close to 50◦. A grid sensor was used formeasuring the grid angle with relation to the horizon-tal plane. This grid sensor also provided informationon water speed in the grid zone. In order to minimizethe possibility of a decrease in the grid angle, due tothe weight of the catch in the codend, supporting ropes
were used mounted from the grid top corners to thelastridge ropes.
A top cover, constructed according to the specifica-tions inWileman et al. (1996)and ending in a collectingbag, was placed above the escape hole to collect the in-dividuals excluded by the grid. The cover was made of45 mm twisted PET mesh size, while the collecting bagwas made of the same material as the codend. Duringthe 2002 trials, a collecting bag (inner codend) made ofthe same material as the codend was connected to thelower section of the grid in order to retain those indi-viduals entering directly into the codend (i.e., withoutcrossing the grid bars).
2.3. Experimental procedures and catch handling
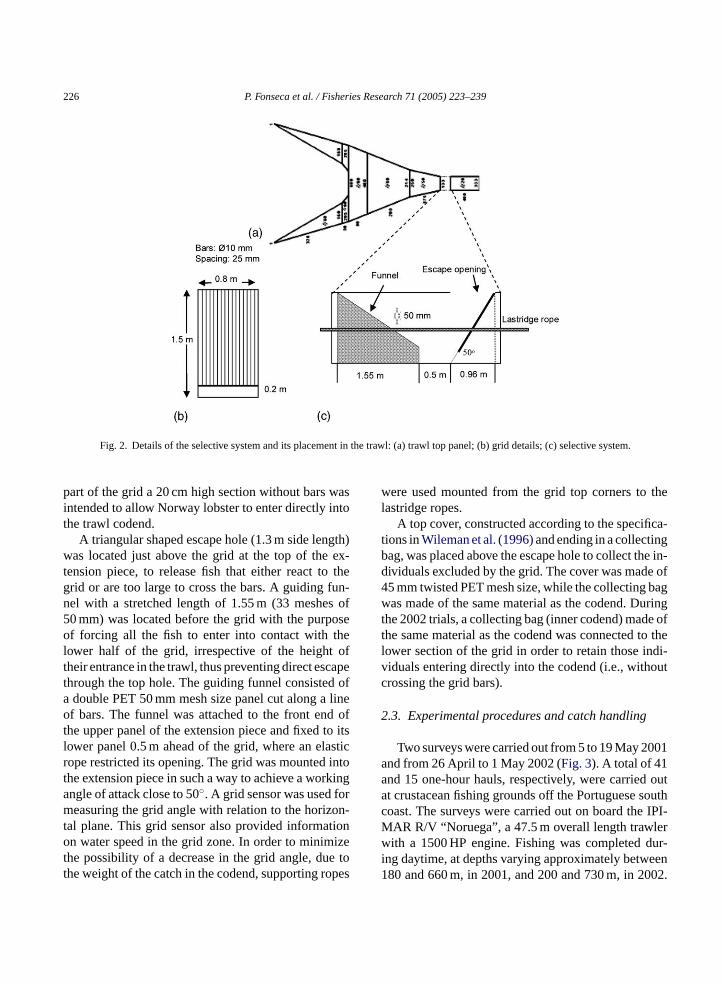
Two surveys were carried out from 5 to 19 May 2001and from 26 April to 1 May 2002 (Fig. 3). A total of 41and 15 one-hour hauls, respectively, were carried outat crustacean fishing grounds off the Portuguese southcoast. The surveys were carried out on board the IPI-MAR R/V “Noruega”, a 47.5 m overall length trawlerwith a 1500 HP engine. Fishing was completed dur-ing daytime, at depths varying approximately between180 and 660 m, in 2001, and 200 and 730 m, in 2002.
P. Fonseca et al. / Fisheries Research 71 (2005) 223–239 227
Fig. 3. Location of the experimental hauls. Black circles: 2001; opencircles: 2002.
Trawling was carried out at speeds between 2.5 and3.0 knots. This represents the depth range normally ex-ploited and the trawling speeds generally adopted bycommercial trawlers.
Catches taken from the codend and the cover (andthe inner codend, in 2002) were handled separately,identified to species and weighed. For commercialcrustaceans, carapace length was measured to the mil-limetre below, while for the most important commercialand by-catch fish species the total length was measuredto the centimetre below. For most of the species caught,including the Norway lobster, the red shrimp and thehake, the whole catch was measured in all hauls, whilefor others such as the rose shrimp and the blue whiting,due to their abundance, sub-sampling was carried outfor the majority of hauls. The length class frequencieswere scaled up by the inverse of the sampling propor-tions.
2.4. Species- and size-selection
Although the key objective of the present study wasto evaluate the species-selective properties of the gridlayout, this type of device also induces a size-selectionboth on target and on by-catch species. As a conse-quence, while the experiments carried out in May 2001had the single purpose of evaluating the escape propor-tion of the by-catch along with the loss proportion ofthe target species, in the following year attention wasa om-p rnalc d sot co-
dend (i.e., not size-selected) could be determined andthus excluded from analysis.
For crustaceans, whenever the catch data struc-ture permitted, the retention-at-length of the grid (rg)for pooled data was modelled by four different two-parameter symmetric (logit and probit) and asymmetric(log–log andc-log–log) models, and a three-parameter(Richards) asymmetric model (Wileman et al., 1996):
rg(l) =(
e(α+βl)
1 + e(α+βl)
)δ
(1)
whereδ is the asymmetry parameter; ifδ > 1, the lowerbranch of the curve will be longer than the upper one,conversely for 0 <δ < 1. Whenδ = 1, it will be equiv-alent to the logistic model. The model with the lowestAIC—Akaike’s Information Criterion (Akaike, 1974)was chosen as the one that best fitted the data.
Considering that fish species, unlike crustaceans, of-ten present active avoidance behaviour when facing agear element, a different approach was followed. Inother words, it may be that not all the fish availableto the grid contact it, escaping directly through the topopening.Tokai et al. (1996)andZuur et al. (2001)mod-elled the probability of a fish encountering the selectivedevice given that it was in its area of influence by using aparameterπ. As a consequence, the available-selectioncurve (ag(l)) was estimated as
a
wt nc
r
E tb 00( ls ty ofT
ibu-t ents( y wayo ely.
lso given to the investigation of the size-specific conent of grid selection. For this purpose, an inteover was adapted to the lower opening of the grihat the proportion of fish entering directly into the
g(l) = π × rg(l) + (1 − π), 0 ≤ π ≤ 1 (2)
hereag(l) is the selectivity of thel length class fish,πhe contact probability andrg(l) the contact-selectiourve. Hererg(l) was assumed to be logistic:
g(l) =(
e(α+βl)
1 + e(α+βl)
)(3)
stimation of parametersα, β, δ andπ was carried ouy maximum likelihood using the software CC20ConStat, DK) for the crustaceans and an ExceTM
preadsheet by Professor Tadashi Tokai (Universiokyo) for the fish.
Differences in mean size and length class distrion of each species among the different compartmcodend, inner codend and cover) were assessed bf t-tests and Kolmogorov–Smirnov tests, respectiv
228 P. Fonseca et al. / Fisheries Research 71 (2005) 223–239
3. Results
3.1. Gear performance
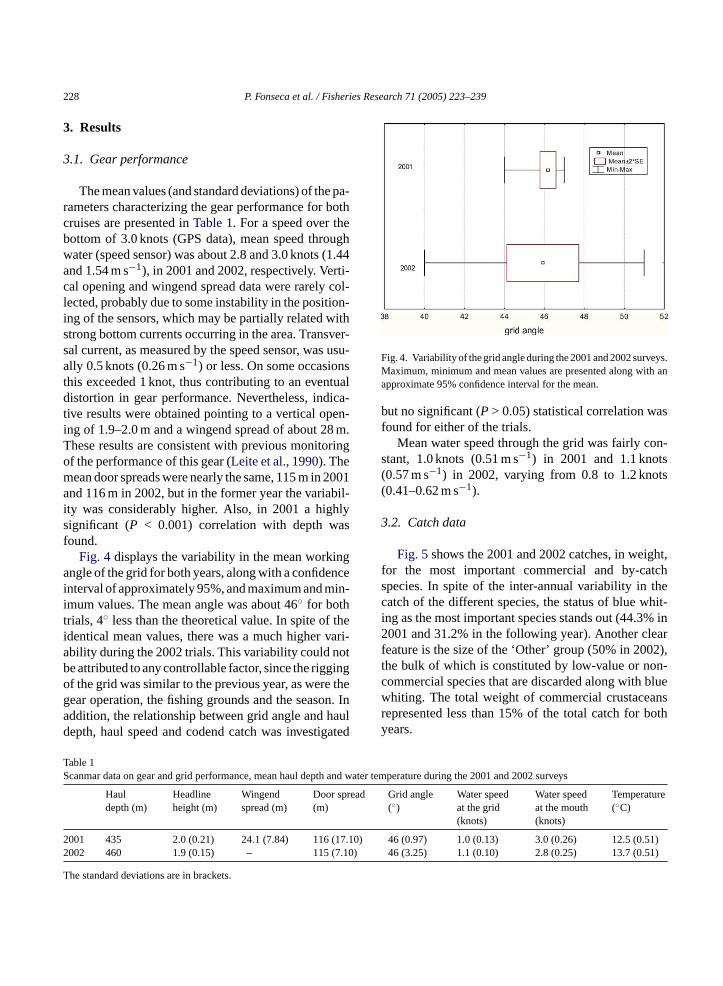
The mean values (and standard deviations) of the pa-rameters characterizing the gear performance for bothcruises are presented inTable 1. For a speed over thebottom of 3.0 knots (GPS data), mean speed throughwater (speed sensor) was about 2.8 and 3.0 knots (1.44and 1.54 m s−1), in 2001 and 2002, respectively. Verti-cal opening and wingend spread data were rarely col-lected, probably due to some instability in the position-ing of the sensors, which may be partially related withstrong bottom currents occurring in the area. Transver-sal current, as measured by the speed sensor, was usu-ally 0.5 knots (0.26 m s−1) or less. On some occasionsthis exceeded 1 knot, thus contributing to an eventualdistortion in gear performance. Nevertheless, indica-tive results were obtained pointing to a vertical open-ing of 1.9–2.0 m and a wingend spread of about 28 m.These results are consistent with previous monitoringof the performance of this gear (Leite et al., 1990). Themean door spreads were nearly the same, 115 m in 2001and 116 m in 2002, but in the former year the variabil-ity was considerably higher. Also, in 2001 a highlysignificant (P < 0.001) correlation with depth wasfound.
Fig. 4 displays the variability in the mean workingangle of the grid for both years, along with a confidenceinterval of approximately 95%, and maximum and min-it thei vari-a otb ingo theg n. Ina hauld gated
TS and water temperature during the 2001 and 2002 surveys
read Grid angle(◦)
Water speedat the grid(knots)
Water speedat the mouth(knots)
Temperature(◦C)
2 .10) 46 (0.97) 1.0 (0.13) 3.0 (0.26) 12.5 (0.51)2 .10) 46 (3.25) 1.1 (0.10) 2.8 (0.25) 13.7 (0.51)
T
Fig. 4. Variability of the grid angle during the 2001 and 2002 surveys.Maximum, minimum and mean values are presented along with anapproximate 95% confidence interval for the mean.
but no significant (P > 0.05) statistical correlation wasfound for either of the trials.
Mean water speed through the grid was fairly con-stant, 1.0 knots (0.51 m s−1) in 2001 and 1.1 knots(0.57 m s−1) in 2002, varying from 0.8 to 1.2 knots(0.41–0.62 m s−1).
3.2. Catch data
Fig. 5shows the 2001 and 2002 catches, in weight,for the most important commercial and by-catchspecies. In spite of the inter-annual variability in thecatch of the different species, the status of blue whit-ing as the most important species stands out (44.3% in2001 and 31.2% in the following year). Another clearfeature is the size of the ‘Other’ group (50% in 2002),the bulk of which is constituted by low-value or non-commercial species that are discarded along with bluewhiting. The total weight of commercial crustaceansrepresented less than 15% of the total catch for bothyears.
mum values. The mean angle was about 46◦ for bothrials, 4◦ less than the theoretical value. In spite ofdentical mean values, there was a much higherbility during the 2002 trials. This variability could ne attributed to any controllable factor, since the riggf the grid was similar to the previous year, as wereear operation, the fishing grounds and the seasoddition, the relationship between grid angle andepth, haul speed and codend catch was investi
able 1canmar data on gear and grid performance, mean haul depth
Hauldepth (m)
Headlineheight (m)
Wingendspread (m)
Door sp(m)
001 435 2.0 (0.21) 24.1 (7.84) 116 (17002 460 1.9 (0.15) – 115 (7
he standard deviations are in brackets.

P. Fonseca et al. / Fisheries Research 71 (2005) 223–239 229
Fig. 5. Catches in weight of the most captured species in 2001 (a)and 2002 (b).
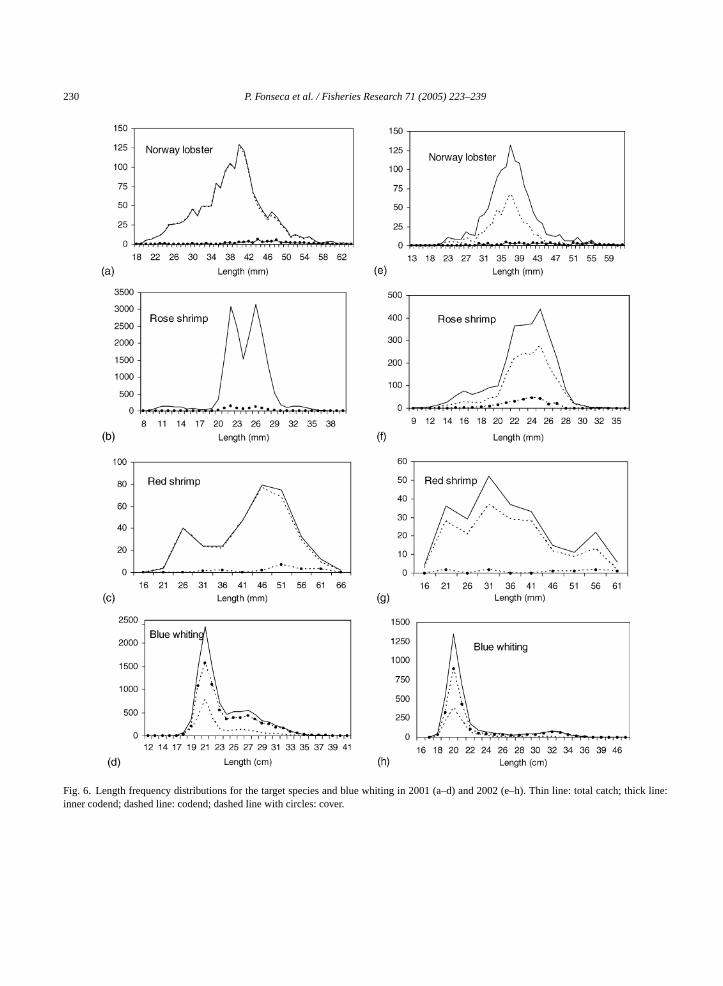
Length frequency distributions for the species anal-ysed are shown inFig. 6. All species were caught withina similar length class range in both years. Differencesin mean size were generally small, with the exceptionof the red shrimp (45.7 mm in 2001 and 37.4 mm in2002). Since both cruises were carried out in the sametime of the year, the differences found are most proba-bly due to differences in the fishing grounds surveyed.In fact, due to time constraints, the number of hauls, theareas and the depth range fished were more restricted in2002, which may explain the considerable differencesin the mean size for the red shrimp.
For Norway lobster, the length ranges were verysimilar during both cruises (18–66 mm in 2001), al-though very few individuals below 18 mm were caughtin the following year. However, the modes differed(37 and 40 mm), with the smallest individuals beingcaught in 2002. In any case, undersized Norway lob-
ster (MLS: 20 mm) were always scarce. Rose shrimpwere caught within the same length interval in bothyears (8–40 mm), with most of the catch between 20and 30 mm. While in the first year there were two dis-tinct modes, at 22 and 26 mm, in 2002 a single modewas found at 25 mm. Red shrimp was the most scarcelyfished of all crustaceans, since only a few hauls werecarried out at depths below 600 m, where the high-est concentrations are found. Consequently, individu-als were grouped in 5 mm interval length classes, from16–21 to 61–66 with an additional 66–71 class in 2001.Larger individuals were captured in the first year, with abimodal distribution characterised by a dominant mode(46–51 class) and a secondary mode (26–31 class),whereas in 2002 a single mode occurred at the 31–36class. Hake, which were only caught in considerablenumbers in 2001 at lengths ranging from 12 to 60 cm,were not included in the analysis.
Blue whiting in 2001 ranged in length from 17 to45 cm, with the bulk of fish concentrated between 19and 30 cm. A main mode was found at 21 cm and asecondary mode at 27 cm. Although the catch rangesin both surveys were almost coincident, average lengthwas smaller in 2002, with fish concentrated in the18–21 cm classes and with a mode at 19 cm.
3.3. By-catch reduction
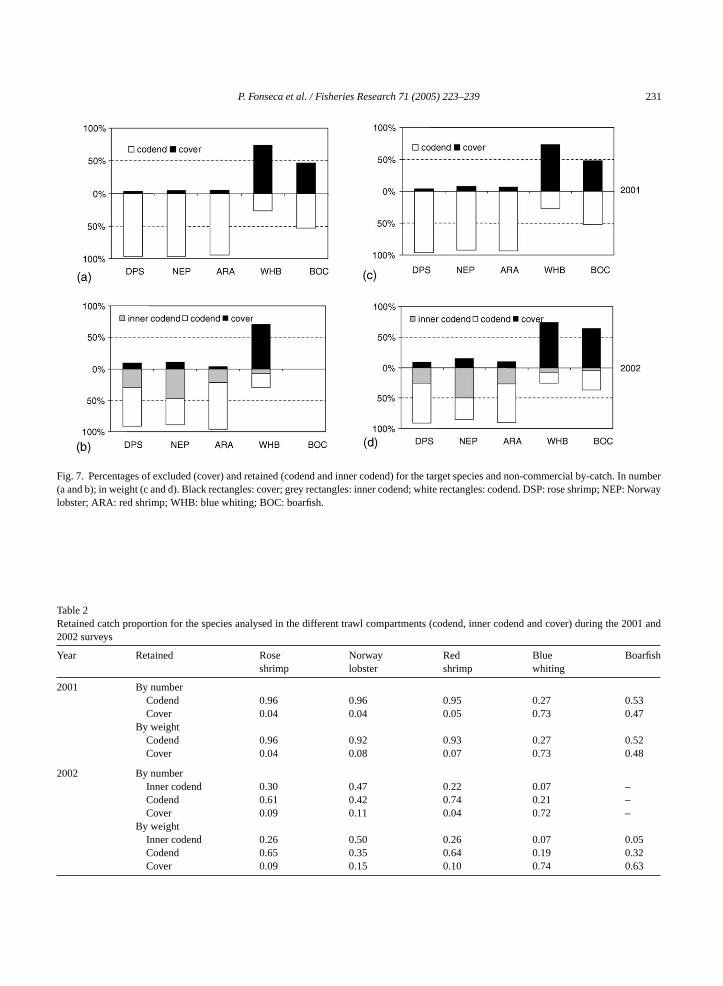
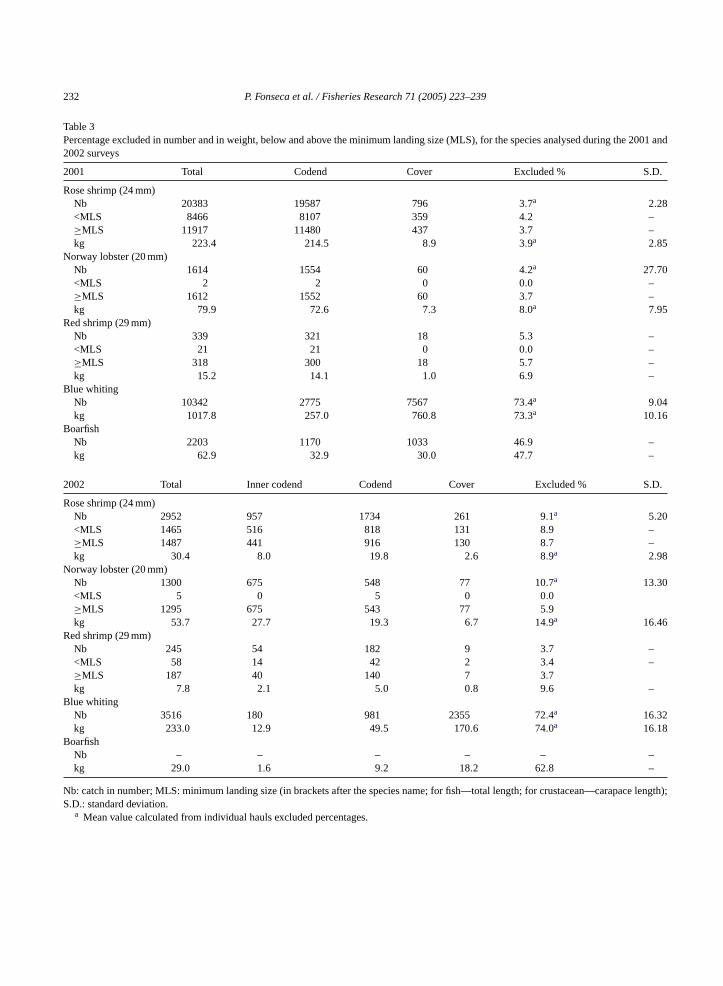
Fig. 7a–d andTables 2 and 3show the percentagesof escape/retention, in both numbers and weight (total,a als.T st ofa awlbs ate ofa 001t 002.
ape-m acht onn il-i lob-s ionso rimps re 8a 1%,i mp,t ther,
bove and below MLS), for the 2001 and 2002 trihe blue whiting mean escape rate was the highell species, with about 73% of all fish entering the treing caught in the cover. Boarfish (Capros aper), theecond major by-catch species, had an escape rbout 47% in both weight and number, in the 2
rials, while this percentage increased to 63% in 2For the crustacean species, differences in esc
ent were registered between trials, and within erial varied according to whether they were basedumbers or weight.Fig. 8a and b displays the variab
ty associated with the mean escape for Norwayter, rose shrimp and blue whiting. Greater proportf Norway lobster escaped compared to both shpecies. While in 2001 Norway lobster losses wend 4%, in 2002 they increased to nearly 15 and 1
n weight and number, respectively. For rose shrihere was a similar increase from one year to the o
230 P. Fonseca et al. / Fisheries Research 71 (2005) 223–239
Fig. 6. Length frequency distributions for the target species and blue whiting in 2001 (a–d) and 2002 (e–h). Thin line: total catch; thick line:inner codend; dashed line: codend; dashed line with circles: cover.
P. Fonseca et al. / Fisheries Research 71 (2005) 223–239 231
Fig. 7. Percentages of excluded (cover) and retained (codend and inner codend) for the target species and non-commercial by-catch. In number(a and b); in weight (c and d). Black rectangles: cover; grey rectangles: inner codend; white rectangles: codend. DSP: rose shrimp; NEP: Norwaylobster; ARA: red shrimp; WHB: blue whiting; BOC: boarfish.
Table 2Retained catch proportion for the species analysed in the different trawl compartments (codend, inner codend and cover) during the 2001 and2002 surveys
Year Retained Roseshrimp
Norwaylobster
Redshrimp
Bluewhiting
Boarfish
2001 By numberCodend 0.96 0.96 0.95 0.27 0.53Cover 0.04 0.04 0.05 0.73 0.47
By weightCodend 0.96 0.92 0.93 0.27 0.52Cover 0.04 0.08 0.07 0.73 0.48
2002 By numberInner codend 0.30 0.47 0.22 0.07 –Codend 0.61 0.42 0.74 0.21 –Cover 0.09 0.11 0.04 0.72 –
By weightInner codend 0.26 0.50 0.26 0.07 0.05Codend 0.65 0.35 0.64 0.19 0.32Cover 0.09 0.15 0.10 0.74 0.63
232 P. Fonseca et al. / Fisheries Research 71 (2005) 223–239
Table 3Percentage excluded in number and in weight, below and above the minimum landing size (MLS), for the species analysed during the 2001 and2002 surveys
2001 Total Codend Cover Excluded % S.D.
Rose shrimp (24 mm)Nb 20383 19587 796 3.7a 2.28<MLS 8466 8107 359 4.2 –≥MLS 11917 11480 437 3.7 –kg 223.4 214.5 8.9 3.9a 2.85
Norway lobster (20 mm)Nb 1614 1554 60 4.2a 27.70<MLS 2 2 0 0.0 –≥MLS 1612 1552 60 3.7 –kg 79.9 72.6 7.3 8.0a 7.95
Red shrimp (29 mm)Nb 339 321 18 5.3 –<MLS 21 21 0 0.0 –≥MLS 318 300 18 5.7 –kg 15.2 14.1 1.0 6.9 –
Blue whitingNb 10342 2775 7567 73.4a 9.04kg 1017.8 257.0 760.8 73.3a 10.16
BoarfishNb 2203 1170 1033 46.9 –kg 62.9 32.9 30.0 47.7 –
2002 Total Inner codend Codend Cover Excluded % S.D.
Rose shrimp (24 mm)Nb 2952 957 1734 261 9.1a 5.20<MLS 1465 516 818 131 8.9 –≥MLS 1487 441 916 130 8.7 –kg 30.4 8.0 19.8 2.6 8.9a 2.98
Norway lobster (20 mm)Nb 1300 675 548 77 10.7a 13.30<MLS 5 0 5 0 0.0≥MLS 1295 675 543kg 53.7 27.7 19.
Red shrimp (29 mm)Nb 245 54 182<MLS 58 14 42≥MLS 187 40 140kg 7.8 2.1 5.
Blue whitingNb 3516 180 981kg 233.0 12.9 49.
BoarfishNb – – –kg 29.0 1.6 9.
Nb: catch in number; MLS: minimum landing size (in brackets after thS.D.: standard deviation.
a Mean value calculated from individual hauls excluded percentage
77 5.93 6.7 14.9a 16.46
9 3.7 –2 3.4 –7 3.7
0 0.8 9.6 –
2355 72.4a 16.325 170.6 74.0a 16.18
– – –2 18.2 62.8 –
e species name; for fish—total length; for crustacean—carapace length);
s.
P. Fonseca et al. / Fisheries Research 71 (2005) 223–239 233
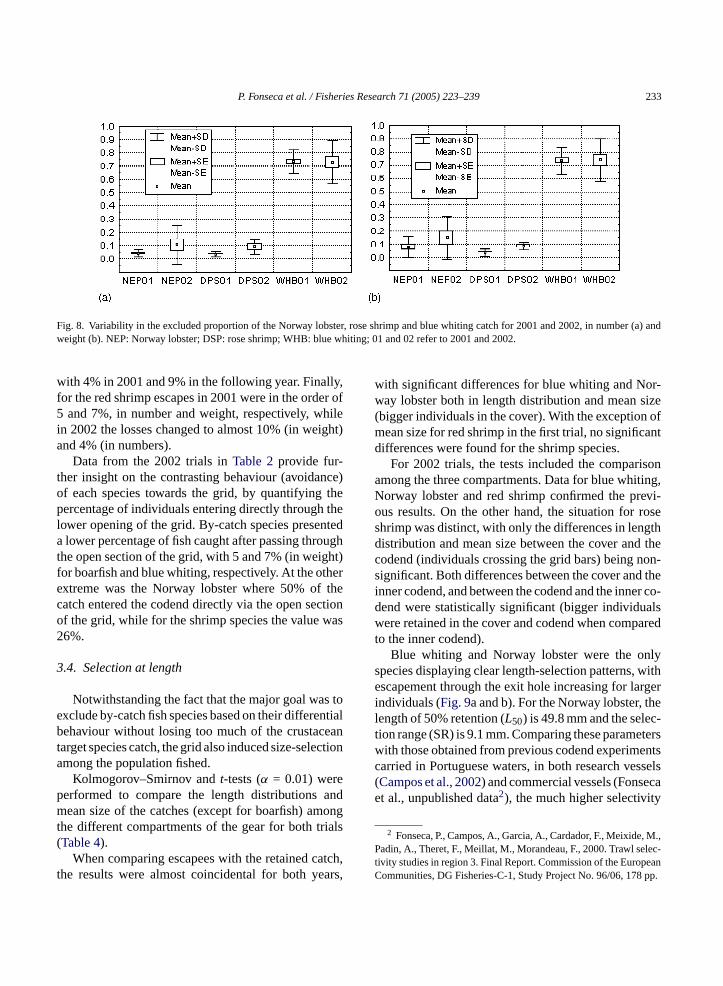
Fig. 8. Variability in the excluded proportion of the Norway lobster, rose shrimp and blue whiting catch for 2001 and 2002, in number (a) andweight (b). NEP: Norway lobster; DSP: rose shrimp; WHB: blue whiting; 01 and 02 refer to 2001 and 2002.
with 4% in 2001 and 9% in the following year. Finally,for the red shrimp escapes in 2001 were in the order of5 and 7%, in number and weight, respectively, whilein 2002 the losses changed to almost 10% (in weight)and 4% (in numbers).
Data from the 2002 trials inTable 2provide fur-ther insight on the contrasting behaviour (avoidance)of each species towards the grid, by quantifying thepercentage of individuals entering directly through thelower opening of the grid. By-catch species presenteda lower percentage of fish caught after passing throughthe open section of the grid, with 5 and 7% (in weight)for boarfish and blue whiting, respectively. At the otherextreme was the Norway lobster where 50% of thecatch entered the codend directly via the open sectionof the grid, while for the shrimp species the value was26%.
3.4. Selection at length
Notwithstanding the fact that the major goal was toexclude by-catch fish species based on their differentialbehaviour without losing too much of the crustaceantarget species catch, the grid also induced size-selectionamong the population fished.
Kolmogorov–Smirnov andt-tests (α = 0.01) wereperformed to compare the length distributions andmean size of the catches (except for boarfish) amongthe different compartments of the gear for both trials(Table 4).
atch,t ars,
with significant differences for blue whiting and Nor-way lobster both in length distribution and mean size(bigger individuals in the cover). With the exception ofmean size for red shrimp in the first trial, no significantdifferences were found for the shrimp species.
For 2002 trials, the tests included the comparisonamong the three compartments. Data for blue whiting,Norway lobster and red shrimp confirmed the previ-ous results. On the other hand, the situation for roseshrimp was distinct, with only the differences in lengthdistribution and mean size between the cover and thecodend (individuals crossing the grid bars) being non-significant. Both differences between the cover and theinner codend, and between the codend and the inner co-dend were statistically significant (bigger individualswere retained in the cover and codend when comparedto the inner codend).
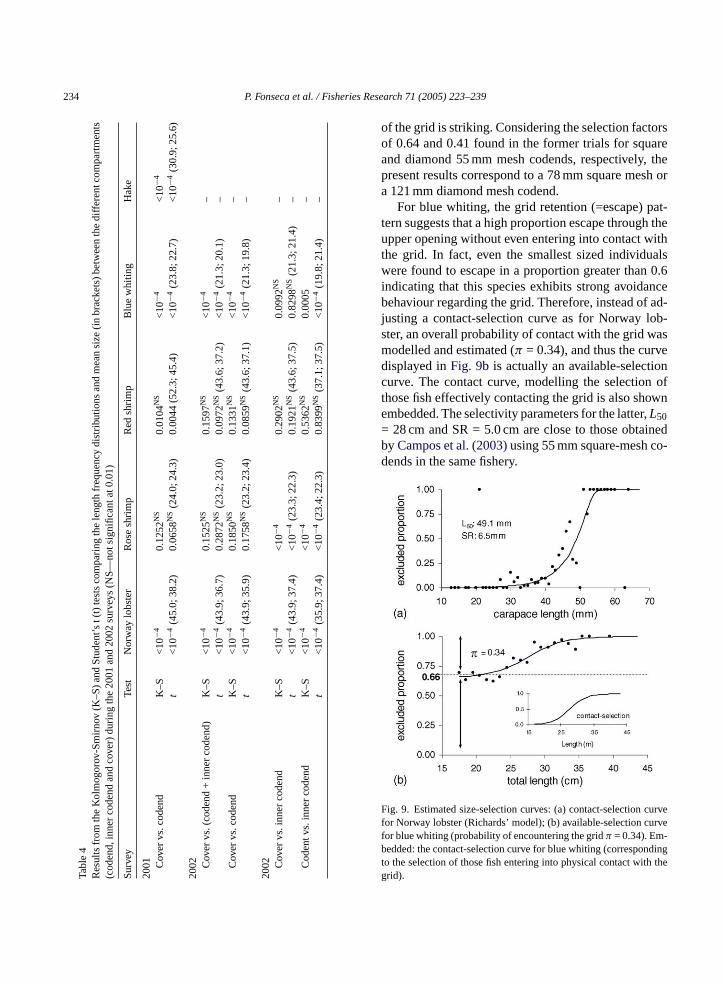
Blue whiting and Norway lobster were the onlyspecies displaying clear length-selection patterns, withescapement through the exit hole increasing for largerindividuals (Fig. 9a and b). For the Norway lobster, thelength of 50% retention (L50) is 49.8 mm and the selec-tion range (SR) is 9.1 mm. Comparing these parameterswith those obtained from previous codend experimentscarried in Portuguese waters, in both research vessels(Campos et al., 2002) and commercial vessels (Fonsecaet al., unpublished data2), the much higher selectivity
2 Fonseca, P., Campos, A., Garcia, A., Cardador, F., Meixide, M.,P lec-t eanC pp.
When comparing escapees with the retained che results were almost coincidental for both ye
adin, A., Theret, F., Meillat, M., Morandeau, F., 2000. Trawl seivity studies in region 3. Final Report. Commission of the Europommunities, DG Fisheries-C-1, Study Project No. 96/06, 178
234 P. Fonseca et al. / Fisheries Research 71 (2005) 223–239
Tabl
e4
Res
ults
from
the
Kol
mog
orov
-Sm
irnov
(K–S
)an
dS
tude
nt’s
t(t)
test
sco
mpa
ring
the
leng
thfr
eque
ncy
dist
ribut
ions
and
mea
nsi
ze(in
brac
kets
)be
twee
nth
edi
ffere
ntco
mpa
rtm
ents
(cod
end,
inne
rco
dend
and
cove
r)du
ring
the
2001
and
2002
surv
eys
(NS
—no
tsig
nific
anta
t0.0
1)
Sur
vey
Test
Nor
way
lobs
ter
Ros
esh
rimp
Red
shrim
pB
lue
whi
ting
Hak
e
2001 C
over
vs.c
oden
dK
–S<
10−4
0.12
52N
S0.
0104
NS
<10
−4<
10−4
t<
10−4
(45.
0;38
.2)
0.06
58NS
(24.
0;24
.3)
0.00
44(5
2.3;
45.4
)<
10−4(2
3.8;
22.7
)<
10−4
(30.
9;25
.6)
2002 C
over
vs.(
code
nd+
inne
rco
dend
)K
–S<
10−40.
1525
NS
0.15
97N
S<
10−4
–t
<10
−4(4
3.9;
36.7
)0.
2872N
S(2
3.2;
23.0
)0.
0972N
S(4
3.6;
37.2
)<
10−4
(21.
3;20
.1)
–C
over
vs.c
oden
dK
–S<
10−4
0.18
50N
S0.
1331
NS
<10
−4–
t<
10−4
(43.
9;35
.9)
0.17
58NS
(23.
2;23
.4)
0.08
59NS
(43.
6;37
.1)
<10
−4(2
1.3;
19.8
)–
2002 C
over
vs.i
nner
code
ndK
–S<
10−4<
10−4
0.29
02N
S0.
0992
NS
–t
<10
−4(4
3.9;
37.4
)<
10−4
(23.
3;22
.3)
0.19
21NS
(43.
6;37
.5)
0.82
98NS
(21.
3;21
.4)
–C
oden
tvs.
inne
rco
dend
K–S
<10−4
<10
−40.
5362
NS
0.00
05–
t<
10−4
(35.
9;37
.4)
<10
−4(2
3.4;
22.3
)0.
8399N
S(3
7.1;
37.5
)<
10−4
(19.
8;21
.4)
–
of the grid is striking. Considering the selection factorsof 0.64 and 0.41 found in the former trials for squareand diamond 55 mm mesh codends, respectively, thepresent results correspond to a 78 mm square mesh ora 121 mm diamond mesh codend.
For blue whiting, the grid retention (=escape) pat-tern suggests that a high proportion escape through theupper opening without even entering into contact withthe grid. In fact, even the smallest sized individualswere found to escape in a proportion greater than 0.6indicating that this species exhibits strong avoidancebehaviour regarding the grid. Therefore, instead of ad-justing a contact-selection curve as for Norway lob-ster, an overall probability of contact with the grid wasmodelled and estimated (π = 0.34), and thus the curvedisplayed inFig. 9b is actually an available-selectioncurve. The contact curve, modelling the selection ofthose fish effectively contacting the grid is also shownembedded. The selectivity parameters for the latter,L50= 28 cm and SR = 5.0 cm are close to those obtainedby Campos et al. (2003)using 55 mm square-mesh co-dends in the same fishery.
F curvef urvef -b dingt h theg
ig. 9. Estimated size-selection curves: (a) contact-selectionor Norway lobster (Richards’ model); (b) available-selection cor blue whiting (probability of encountering the gridπ = 0.34). Emedded: the contact-selection curve for blue whiting (correspon
o the selection of those fish entering into physical contact witrid).
P. Fonseca et al. / Fisheries Research 71 (2005) 223–239 235
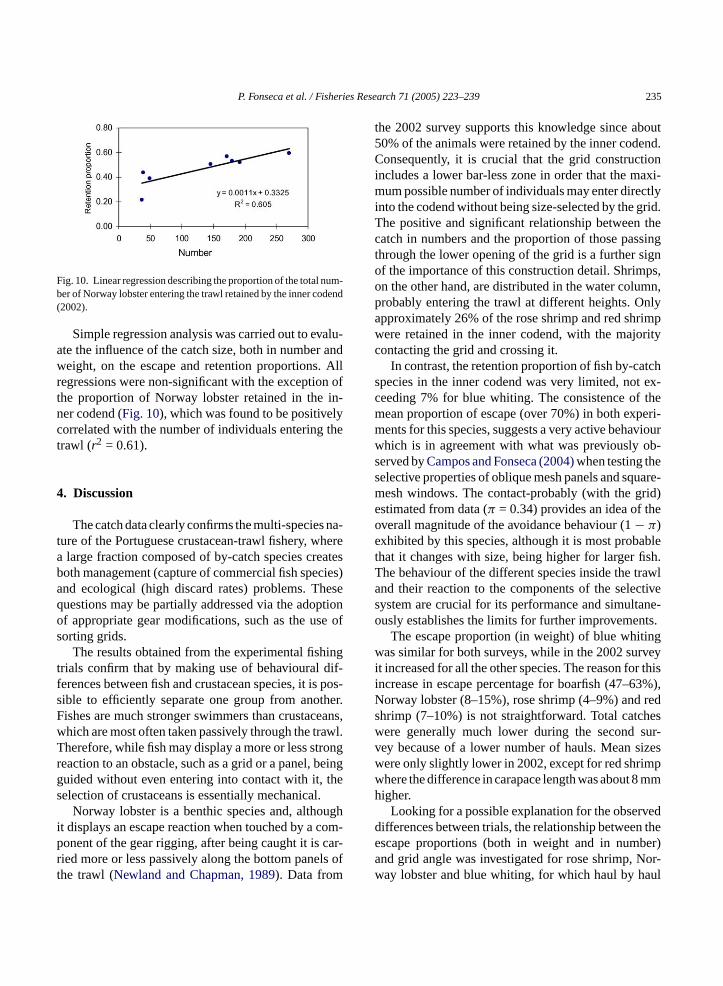
Fig. 10. Linear regression describing the proportion of the total num-ber of Norway lobster entering the trawl retained by the inner codend(2002).
Simple regression analysis was carried out to evalu-ate the influence of the catch size, both in number andweight, on the escape and retention proportions. Allregressions were non-significant with the exception ofthe proportion of Norway lobster retained in the in-ner codend (Fig. 10), which was found to be positivelycorrelated with the number of individuals entering thetrawl (r2 = 0.61).
4. Discussion
The catch data clearly confirms the multi-species na-ture of the Portuguese crustacean-trawl fishery, wherea large fraction composed of by-catch species createsboth management (capture of commercial fish species)and ecological (high discard rates) problems. Thesequestions may be partially addressed via the adoptionof appropriate gear modifications, such as the use ofsorting grids.
The results obtained from the experimental fishingtrials confirm that by making use of behavioural dif-ferences between fish and crustacean species, it is pos-sible to efficiently separate one group from another.Fishes are much stronger swimmers than crustaceans,which are most often taken passively through the trawl.Therefore, while fish may display a more or less strongreaction to an obstacle, such as a grid or a panel, beingguided without even entering into contact with it, theselection of crustaceans is essentially mechanical.
ughi com-p car-r ls oft
the 2002 survey supports this knowledge since about50% of the animals were retained by the inner codend.Consequently, it is crucial that the grid constructionincludes a lower bar-less zone in order that the maxi-mum possible number of individuals may enter directlyinto the codend without being size-selected by the grid.The positive and significant relationship between thecatch in numbers and the proportion of those passingthrough the lower opening of the grid is a further signof the importance of this construction detail. Shrimps,on the other hand, are distributed in the water column,probably entering the trawl at different heights. Onlyapproximately 26% of the rose shrimp and red shrimpwere retained in the inner codend, with the majoritycontacting the grid and crossing it.
In contrast, the retention proportion of fish by-catchspecies in the inner codend was very limited, not ex-ceeding 7% for blue whiting. The consistence of themean proportion of escape (over 70%) in both experi-ments for this species, suggests a very active behaviourwhich is in agreement with what was previously ob-served byCampos and Fonseca (2004)when testing theselective properties of oblique mesh panels and square-mesh windows. The contact-probably (with the grid)estimated from data (π = 0.34) provides an idea of theoverall magnitude of the avoidance behaviour (1− π)exhibited by this species, although it is most probablethat it changes with size, being higher for larger fish.The behaviour of the different species inside the trawland their reaction to the components of the selectives ane-o ts.
ingw veyi r thisi 3%),N reds hesw sur-v izesw mpw mmh
vedd n thee ber)a or-w aul
Norway lobster is a benthic species and, althot displays an escape reaction when touched by aonent of the gear rigging, after being caught it isied more or less passively along the bottom panehe trawl (Newland and Chapman, 1989). Data from
ystem are crucial for its performance and simultusly establishes the limits for further improvemen
The escape proportion (in weight) of blue whitas similar for both surveys, while in the 2002 sur
t increased for all the other species. The reason foncrease in escape percentage for boarfish (47–6orway lobster (8–15%), rose shrimp (4–9%) andhrimp (7–10%) is not straightforward. Total catcere generally much lower during the secondey because of a lower number of hauls. Mean sere only slightly lower in 2002, except for red shrihere the difference in carapace length was about 8igher.
Looking for a possible explanation for the obserifferences between trials, the relationship betweescape proportions (both in weight and in numnd grid angle was investigated for rose shrimp, Nay lobster and blue whiting, for which haul by h

236P.Fo
nseca
etal./F
isheriesResearch
71(2005)223–239
Table 5Experiments with standard Nordmøre grid sorting systems in different crustacean fisheries to exclude fish by-catch and/or undersized crustaceans
Country and/or area Sorting grid and barspacing
Target species loss By-catch reduction Reference
Norway NS, 17–21 mm Pink shrimp: 2–5%≥MLS Cod: 17–48% Isaksen et al. (1992)Svalbad NS, 19 mm Pink shrimp: 3–9% Redfish: 34–84%, Greenland halibut:
80–100%, Dab: 65–83%, Polar cod: 5–43%Larsen (1996)
Canada NS, 28 mma Pink shrimp: 2.9% Fish bycatch: 72–83% Hickey et al. (1993)Australia/New S. Wales NS, 20 mm School prawn: 10% By-catch: 76% Broadhurst and Kenelly (1996)Australia/New S. Wales NS, 20 mm School prawn: no effect By-catch: 77% Broadhurst et al. (1996)Argentina NSD, 47/25 mmb Patagonia red shrimp: 0–14% Argentine hake: 80–98%, rays: 100% Ercoli et al. (1997)Canada/Quebec NS, 19 mm Pink shrimp: 2% By-catch: 97% Brothers (1998)Argentina/San Jorge Gulf NSD, 47/25 mmb Patagonean red shrimp: 47% Argentinean hake: 77% Pettovello (1999)
NS, 47 mm Patagonean red shrimp: 8% Argentinean hake: 61%North Sea, Fladen ground NS (U + L), 19 mm Pink shrimp: no effect, Norway
lobster: 18%≥MLSPink shrimp: 54% <MLS, Norway lobster:88% <MLS, Haddock: 58%≥MLS; 18%<MLS, Whiting: 88%≥MLS; 69% <MLS,Norway pout; 39%, cod: no effect
Madsen and Hansen (2001)
North Sea NS, 12–14 mm Brown shrimp: 13%≥MLS Brown shrimp: 17% <MLS, fish by-catch:70%
Polet (2002)
U.K./East coast NS, 12 mm Brown shrimp: 8.7% Whiting: 76–85%, plaice: 35–45% Graham (2003)Sweden/Skagerrak-Kattegat NS, 35 mm, plus
square mesh codendNorway lobster: 0–9% Fish by-catch: 90–100%≥MLS, fish by-
catch: 50–90% <MLSMats Ulmestrand (pers. commun.)
South Portugal NSL, 25 mm Rose shrimp: 3.9–9.1% Blue whiting: 73–74% Present paperNorway lobster: 8.0–14.9%, redshrimp: 6.9–9.6%
Boarfish: 48–63%, hake: 44%
Pink shrimp,Pandalus borealis(+P. montagui, in Canada); brown shrimp,Crangon crangon; school prawn,Metapenaeus macleayi; Patagonian red shrimp,Pleoticus muelleri.NS—standard Nordmøre grid; NSU—modified grid with upper bar-less section; NSL—modified grid with lower bar-less section; NSD—double Nordmøre grid sorting system.
a Twenty two and 25 mm bar-spacing also tested, with 24 and 44% losses registered.b Primary/secondary grids.

P. Fonseca et al. / Fisheries Research 71 (2005) 223–239 237
information was available. Analysis was only carriedout for 2002 data, where the use of an inner codendmade the quantification of those individuals enteringdirectly to the codend possible. This allowed the calcu-lation of the escape proportion of those effectively con-tacting the grid. No significant statistical differenceswere found for blue whiting (P > 0.05). However, forcrustaceans the relationship was statistically significantfor rose shrimp (P = 0.0427) and Norway lobster (P =0.0063), in weight, and for the latter (P = 0.0169), innumber. The inverse relationship observed is in accor-dance to what has been known from the start of gridresearch, where the angle of attack has been identifiedas a key factor (Isaksen et al., 1992). These authorsidentified an ideal working angle of approximately 45◦.If the angle is too low there will be an increased lossof crustaceans, if it is too steep the escape of by-catchspecies will be affected.
Previous experiments with standard (or slightlychanged) Nordmøre grids (Table 5) were mainlydirected towards prawn (shrimp) fisheries, with dataon Reptantia species such as Norway lobster beingscarce or non-existent. For the latter species,Madsenand Hansen (2001)report a loss of 18% of individualsabove the MLS in a fishery targeting the pink shrimp,Pandalus borealis. On the other hand, a maximum lossof 9% was reported during preliminary experimentscarried out in the Swedish Norway lobster fishery(Mats Ulmestrand, IMR, Sweden, pers. commun.).Therefore, the results reported here for Portuguese wa-t rly,t ably,w ut1 Thee reds o1 sei h theu nyc sid-e rgets prob-l y hasa etsN ouldl n iss nd(
borealis) is the target species along with Norwaylobster as by-catch. Here, there is also interest inkeeping legally sized commercial fish species. In suchcomplex situations, the exclusion of non-commercialby-catch will be inevitably accompanied by significantlosses of some of the commercial species.
The water flow through the selective system (fun-nel, grid, top escaping hole) is of major importance,influencing its performance, i.e., the retention of targetspecies and by-catch exclusion. In spite of the impor-tance of this issue, systematic research on the condi-tioning variables has seldom been undertaken.Riedeland De Alteris (1995)investigated the influence ofwebbing solidity and exit to entrance area ratio for thefunnel, the angle of attack and the bar diameter andshape of the grid, at different towing speeds. Accord-ing to these authors, ‘the ideal configuration for theNordmøre system is a funnel that functions as both aconcentrator and accelerator’ [of fish] ‘and a grate thatdoes not disturb the water moving through it’ (thusminimizing the rejection of water through the top es-capement hole).
Data from water-speed sensors, placed at the centreof the headline and incorporated in the grid sensor, in-dicates that in the current experiments the water speedbehind the grid was about 1/3 of the speed in the mouthof trawl (0.34 in 2001 and 0.39 in the 2002). These aremuch lower values than the 0.70 reported byIsaksenet al. (1992)in their original experiments. The reasonsfor this difference cannot be categorically explaineda eryd witht rrente nes( ex-c sibleg aterfl thel mer-c
5
toe theP hort-c ally
ers are within the range of similar fisheries. Similahe percentage loss for shrimps varies considerith the majority of studies ranging from 0 to abo0%, which is the range of the present study.xception are the experiments for the Patagonianhrimp, whereErcoli et al. (1997)report losses of up t4%, andPettovello (1999)recorded a 47% decrea
n catch. However, these values are associated witse of a secondary grid for shrimp size-sorting. Aomparison with previous studies should be conred simply as indicative, since not only are the tapecies often not the same, but the managementems also differ. The Portuguese crustacean fisher
further particular feature: it simultaneously targorway lobster and shrimp species, and fishers w
ike to retain commercial fish by-catch. This situatioimilar only to the shrimp fishery in the Fladen GrouMadsen and Hansen, 2001), where pink shrimp (P.
t this point. They may be partially gear-related (vifferent designs), but are likely to be associated
he use of small mesh (20 mm) codends in the cuxperiments instead of the commercially sized o55 mm). However, the good results obtained inluding fish by-catch reduce the concern for a poseneral malfunction of the system due to poor wow through the grid. Consequently, a decrease inoss of target species may be expected when comial (larger mesh size) codends are used.
. Conclusions
The potential of the modified Nordmøre gridxclude fish by-catch was demonstrated. Still,ortuguese crustacean fishery suffers from the soming of having three target species with parti
238 P. Fonseca et al. / Fisheries Research 71 (2005) 223–239
overlapping habitats, and different morphologies andmean sizes. Consequently, improvement in the perfor-mance of the selective system by altering grid dimen-sions or design may be a problem, since the right con-figuration for a species may negatively affect the catchof another. While losses of shrimp are undesirable, theyare within expected values. On the other hand, the caseof Norway lobster (average 15% weight, in 2002) is acause for some concern. However, these results wereobtained for a limited number of hauls where the griddisplayed a greater variability in the angle of attack. In2001, when more intensive sampling took place, bothin terms of catches and in the fishing grounds cov-ered, the escape percentage of all crustacean specieswas considerably lower. Variability in mean size of thecatch, species composition, catch volume or gear per-formance due either to seasonal or area effects is to beexpected and needs to be further assessed.
Although the technical feasibility of the use of gridsin this fishery has been established, it is vital to carryout tests on board commercial vessels, since it has longbeen recognized that conditions on board research ves-sels do not exactly match those found in commercialfishing. No less important is to guarantee that fishersmay perceive the advantages of the system and havethe opportunity to put forward their questions and sug-gestions. In spite of the overall advantages that canbe drawn from the used BRDs, such as reduction inecosystem impact due to minimization of by-catch,improvement in stock management of commerciallyv rgets te as-p asei tes.T tanceo asedt
tiono ande del,d f alls thisp
A
the‘ ies
of the University of the Algarve is warmly recog-nised. In this regard, the assistance of Prof. ManuelAfonso-Dias (Univ. of Algarve, PT) is gratefully ac-knowledged. The thorough comments provided by onereferee and the editor were of extreme value for therevision of the manuscript.Trials carried out in 2001were partially supported by EU funds within the scopeof the study project no. 99/058, “Managing by-catchand discards: a multidisciplinary approach (Bydis-card)”, while 2002 trials were carried out under the na-tional project 22-05-01-FDR-00014, ‘Tecnologias dapesca/Fishing Technologies’.
References
Akaike, H., 1974. A new look at the statistical model identification.IEEE Trans. Autom. Contr. AC-19, 716–722.
Anon., 1996. Report of the study group on grid (grate) sortingsystems in trawls, beam trawls and seine nets. Woods Hole,Massachusetts, USA, April 13–14. Int. Coun. Explor. Sea CM1996/B:1.
Anon., 1998. Report of the study group on grid (grate) sorting sys-tems in trawls, beam trawls and seine nets. La Coruna, Spain,April 18–19. Int. Coun. Explor. Sea.CM 1998/B:2.
Borges, T.C., Erzini, K., Bentes, L., Costa, M.E., Gonc¸alves, J.M.S.,Lino, P.G., Pais, C., Ribeiro, J., 2001. By-catch and discardingpractices in five Algarve (southern Portugal) metiers. J. Appl.Ichthyol. 17, 104–114.
Broadhurst, M.K., 2000. Modifications to reduce by-catch in prawntrawls. Rev. Fish. Biol. Fish. 10, 27–60.
Broadhurst, M.K., Kenelly, S.J., 1996. Rigid and flexible separatorthe
. 47,
B nt ofstu-
, 89–
B oten-var-
GridNets.M
C squaretrawl156.
C dia-s
C dia-in the
aluable by-catch species and eventually also of tapecies, emphasis must be put on more immediaects. Reduction of sorting time on deck and incre
n the quality of target species are prime candidahese may be used to facilitate the eventual accepf drawbacks, such as short-term losses and incre
ime of gear handling.The experience of successful implementa
f such devices, of which the developmentnforcement of the original Nordmøre grid is a moemonstrated the importance of the involvement otakeholders (fishers, scientists and managers) inrocess.
cknowledgements
The enthusiastic participation of students fromlicenciatura’ degree in Marine Biology and Fisher
panels in trawls that reduce the by-catch of small fish inClarence river prawn-trawl fishery. Aust. Mar. Freshw. Res991–998.
roadhurst, M.K., Kenelly, S.J., Isaksen, B., 1996. Assessmemodified codends that reduce the by-catch of fish in two earine prawn fisheries in New South Wales. Fish. Res. 27111.
rothers, G., 1998. Estimates of the impact of actual and ptial grid usage on discarded levels of non-target species inious fisheries in Canada. Report of the Study Group on(Grate) Sorting Systems in Trawls, Beam Trawls and SeineLa Coruna, Spain, April 18–19. Int. Coun. Explor. Sea. C1998/B:2, pp. 23–36.
ampos, A., Fonseca, P., 2004. The use of separator panels andmesh windows for by-catch reduction in the crustaceanfishery off the Algarve (South Portugal). Fish. Res. 69, 147–
ampos, A., Fonseca, P., Erzini, K., 2002. Size selectivity ofmond and square mesh cod ends for rose shrimp (Parapenaeulongirostris) and Norway lobster (Nephrops norvegicus) off thePortuguese south coast. Fish. Res. 58, 281–301.
ampos, A., Fonseca, P., Erzini, K., 2003. Size selectivity ofmond and square mesh cod ends for four by-catch species
P. Fonseca et al. / Fisheries Research 71 (2005) 223–239 239
crustacean fishery off the Portuguese south coast. Fish. Res. 60,79–97.
Christian, P., Harrington, D., 1987. Loggerhead turtle, finfish andshrimp retention studies on four excluder devices (TEDs). In:Proceedings of the Nongame and Endangered Wildlife Sympo-sium, Georgia, September 8–10. DNR, Social Circle, GA, pp.114–127.
Ercoli, R., Garcia, J., Salvini, L., Izzo, A., Bartozetti, J., 1997.Manual del dispositivo de selectividad de langostino con doblegrilla—DISELLA II. INIDEP Informe Tecnico Interno.
Fonseca, P., Campos, A., Feitoria, J., 1998. Square mesh windowsexperiments in Portuguese waters. Int. Coun. Explor. Sea C.M.1998/BB:12.
Graham, N., 2003. By-catch reduction in the brown shrimp,Crangoncrangon, fisheries using a rigid separation Nordmøre grid (grate).Fish. Res. 59, 393–407.
Hanna, R.-W., Jones, S.A., 2000. By-catch reduction in an oceanshrimp trawl from a simple modification to the trawl footrope. J.Northw. Atl. Fish. Sci. 27, 227–233.
Hickey, W.M., Brothers, G., Boulos, D.L., 1993. By-catch reductionin the Northern shrimp fishery. Can. Tech. Rep. Fish. Aquat. Sci.1964, vi+41.
Isaksen, B., Valdemarsen, J.W., Larsen, R., Karlsen, L., 1992. Re-duction of fish by-catch in shrimp trawls using a rigid separatorgrid in the aft belly. Fish. Res. 13, 335–352.
Larsen, R., 1996. Experiments with a new, larger type of fish/shrimpseparator grid with comparisons to the standard Nordmøre grid.Report of the Study Group on Grid (Grate) Sorting Systemsin Trawls, Beam Trawls and Seine Nets. Woods Hole, Mas-sachusetts, USA, April 13–14. Int. Coun. For the Explor. Of theSea. CM 1996/B:1, pp. 68–80.
Leite, A., Ferreira, C., Fonseca, P., Henriques, V., 1990. Teste deredes de arrasto pelo fundo. Campanha de pesca experimentalN/E Noruega – 02080889, 14 a 16 de Agosto de 1989. Relat.Tec. Cient. INIP, Lisboa (26) Julho 1990, 50 pp., il.
M grid. 52,
Monteiro, P., Araujo, A., Erzini, K., Castro, M., 2001. Discards ofthe Algarve (southern Portugal) crustacean trawl fishery. Hydro-biologia 449, 267–277.
Mounsey, R.P., Baulch, G.A., Buckworth, R.C., 1995. Developmentof a trawl efficiency device (TED) for Australian prawn fisheries.I. The AusTED design. Fish. Res. 2, 99–105.
Newland, P.L., Chapman, C.J., 1989. The swimming and orientationbehaviour of the Norway lobster,Nephrops norvegicus(L.), inrelation to trawling. Fish. Res. 8, 63–80.
Oravetz, C., Grant, C.J., 1986. Trawl efficiency device showspromise. Aust. Fish. 45, 37–40.
Polet, H., 2002. Selectivity experiments with sorting grids in theNorth Sea brown shrimp (Crangon crangon) fishery. Fish. Res.54, 217–233.
Pettovello, A.D., 1999. By-catch in the Patagonian red shrimp(Pleoticus muelleri) fishery. Mar. Freshw. Res. 50, 123–127.
Riedel, R., De Alteris, J., 1995. Factors affecting hydrodynamic per-formance of the Nordmøre grate system: a by-catch reductiondevice used in the gulf of Main shrimp fishery. Fish. Res. 24,181–198.
Robins, J.B., McGilvray, J.G., 1999. The AusTED II, an improvedtrawl efficiency device 2. Commercial performance. Fish. Res.40, 29–41.
Tokai, T., Omoto, S., Sato, R., Matuda, K., 1996. A method of de-termining selectivity curve of separator grid. Fish. Res. 27, 51–60.
Watson, J.W., 1989. Fish behaviour and trawl design: potential forselective trawl development. In: Campbell, C.M. (Ed.), Proceed-ings of the World Symposium on Fishing Gear and Fishing Ves-sels. Marine Institute, St. Johns, Newfoundland, Canada, pp. 25–29.
Wileman, D., Ferro, R.S.T., Fonteyne, R., Millar, R.B., 1996. Manualof methods of measuring the selectivity of towed fishing gear.ICES Coop. Res. Rep. 215, 126 pp.
Z sizepanel.
adsen, N., Hansen, K., 2001. Danish experiments with asystem tested in the North Sea shrimp fishery. Fish. Res203–216.
uur, G., Fryer, R.J., Ferro, R.S.T., Tokai, T., 2001. Modellingselectivities of a trawl codend and an associate square meshICES J. Mar. Sci. 58, 657–671.