USER PERCEPTIONS TOWARDS STREET CHARACTERISTICS AND QUALITIES THAT CONTRIBUTE TO USER FRIENDLY...
12
Arte-Polis 3 International Conference on Creative Collaboration and the Making of Place 1 User Perceptions Towards Street Characteristics and Qualities that Contribute to User Friendly Street: An Examination Based on Survey Data: Norhafizah ABDUL RAHMAN USER PERCEPTIONS TOWARDS STREET CHARACTERISTICS AND QUALITIES THAT CONTRIBUTE TO USER FRIENDLY STREET: AN EXAMINATION BASED ON SURVEY DATA Norhafizah ABDUL RAHMAN School of Built Environment, University of Nottingham, United Kingdom. laxna2@nottingham.ac.uk Asscociates Professor Shuhana SHAMSUDDIN Department of Civil Engineering (Urban and Regional Planning) Universiti Teknologi Malaysia. shuhana@citycampus.utm.my ABSTRACT Streets are one of the vital components of an urban form that support public and private activities of the city dwellers. Streets are most public of all city spaces and been utilizes by all the users. Therefore the street characteristics and qualities must fulfil the need of all the users. This paper presents findings from a user’s survey which sought user perceptions towards various street characteristics and qualities in Jalan Tunku Abdul Rahman Kuala Lumpur Malaysia that contribute to user friendly street. Such characteristics and qualities included physical, functional and socio cultural. User perceptions information was obtained through a survey of daily users (those who are constantly engage with the street) and occasional users (those who are not dependent on the study are such as shoppers and visitors). It is expected that the findings from this study will help designers, urban planners and policy makers understand the needs and attitudes of users towards user friendly street in Malaysia. Keywords: user friendly street, street characteristics, street qualities and user perceptions INTRODUCTION This research examines the idea of “user friendly street” in Malaysian town centre. The primary concern is to study the physical design features and characteristics of the street that contribute to the usage of streets and liveability in urban areas in our towns in Malaysia. As according to Tibbalds (1992) pp.14 “ we have actually got to address the re-structuring of our urban areas, over possibly quite long time scales, to reflect anew set of priorities in which the needs of people-as pedestrians, cyclists, the young, the old and the infirm, as well as the able-bodied –take precedence over the various demands of traffic and developers‟‟. Streets are one of the vital components of an urban form that support public and private activities of the city dwellers. Streets are most public of all city spaces and been utilizes by all the users. Therefore the street characteristics and qualities must fulfil the need of all the users.
Transcript of USER PERCEPTIONS TOWARDS STREET CHARACTERISTICS AND QUALITIES THAT CONTRIBUTE TO USER FRIENDLY...

Arte-Polis 3 International Conference on Creative Collaboration and the Making of Place 1
User Perceptions Towards Street Characteristics and Qualities that Contribute to User Friendly Street: An Examination Based on Survey Data: Norhafizah ABDUL RAHMAN
USER PERCEPTIONS TOWARDS STREET
CHARACTERISTICS AND QUALITIES THAT
CONTRIBUTE TO USER FRIENDLY STREET: AN
EXAMINATION BASED ON SURVEY DATA
Norhafizah ABDUL RAHMAN School of Built Environment, University of Nottingham, United Kingdom.
Asscociates Professor Shuhana SHAMSUDDIN Department of Civil Engineering (Urban and Regional Planning) Universiti
Teknologi Malaysia.
ABSTRACT Streets are one of the vital components of an urban form that support public and
private activities of the city dwellers. Streets are most public of all city spaces and
been utilizes by all the users. Therefore the street characteristics and qualities
must fulfil the need of all the users. This paper presents findings from a user’s
survey which sought user perceptions towards various street characteristics and
qualities in Jalan Tunku Abdul Rahman Kuala Lumpur Malaysia that contribute
to user friendly street. Such characteristics and qualities included physical,
functional and socio cultural. User perceptions information was obtained through
a survey of daily users (those who are constantly engage with the street) and
occasional users (those who are not dependent on the study are such as shoppers
and visitors). It is expected that the findings from this study will help designers,
urban planners and policy makers understand the needs and attitudes of users
towards user friendly street in Malaysia.
Keywords: user friendly street, street characteristics, street qualities and user
perceptions
INTRODUCTION This research examines the idea of “user friendly street” in Malaysian town centre.
The primary concern is to study the physical design features and characteristics of
the street that contribute to the usage of streets and liveability in urban areas in our
towns in Malaysia. As according to Tibbalds (1992) pp.14 “ we have actually got
to address the re-structuring of our urban areas, over possibly quite long time
scales, to reflect anew set of priorities in which the needs of people-as pedestrians,
cyclists, the young, the old and the infirm, as well as the able-bodied –take
precedence over the various demands of traffic and developers‟‟.
Streets are one of the vital components of an urban form that support public and
private activities of the city dwellers. Streets are most public of all city spaces and
been utilizes by all the users. Therefore the street characteristics and qualities must
fulfil the need of all the users.

Arte-Polis 3 International Conference on Creative Collaboration and the Making of Place 2
User Perceptions Towards Street Characteristics and Qualities that Contribute to User Friendly Street: An Examination Based on Survey Data: Norhafizah ABDUL RAHMAN
This paper presents findings from a user‟s survey which sought user perceptions
towards various street characteristics and qualities in Jalan Tunku Abdul Rahman,
Kuala Lumpur, Malaysia that contribute to user friendly street. Such
characteristics and qualities included physical, functional and socio cultural. User
perceptions information was obtained through a survey of daily user (those who
are constantly engage with the street) and occasional (those who are not dependent
on the study are such as shoppers and visitors and non user).
It is expected that the findings from this study will help designers, urban planners
and policy makers understand the needs and attitudes of users towards user
friendly street in Malaysia.
LITERATURE REVIEW Similar urban design issues that are viewed at from both global and local
perspectives are used as the framework for this research. The issues that are
looked into the urban streets study are; they are non users friendly and don‟t fulfil
users‟ need and the relationship with the quality of the built environment (physical
quality and social quality), which is one of the vital aspects that contributes to the
people friendly built environment.
Most urban areas all over the world suffer from the domination of private vehicles.
Many drivers often ignore pedestrians and especially vulnerable users (children,
people with baby carriage, elderly and handicapped) by claiming in practice
exclusive use of the road networks. The absence of adequate or well designed for
pedestrians makes the walking environment more and more unfriendly for them.
Research results have shown that people are ready to walk more than today in case
of the improvement of public space (Tsourlakis, 2005). Therefore, the rapidly
increasing concentration of people in urban areas along with the focus to improve
quality of life, and revitalize city centre, has led to increased attention to the
quality of open urban spaces (Forsyth, 2003).
In Malaysia, skyscrapers are being built almost everywhere in the city centre
without any response to the local context, which occasionally alienates the city
from its users. The dominant building types consists of a free standing building
and public open spaces around it fail to produce an environment which is
conducive and cohesive to the overall development of the city centres.(Dolbani
2000).The rapid growth of the cities in Malaysia has created frightening trends
towards the urban public places. The existing street network was destroyed in the
name of progress where the streets are dominated by fast traffic (Bashri and
Shuhana, 2001). All this factors influence the qualities of cities in Malaysia.
(Dolbani, 2000) argued that Malaysian planners and urban designers failed to
provide a broader range of activities and a user friendly environment that is fit to
the climatic, physical social and economic circumstances of Malaysian cities. The
street becomes places of interest if the quality can be improved to the need of the
users. Street that exhibit a certain characteristics are used accordingly. The
improvement in the space not only with hardscape and softscape that integrate the
internal and external spaces but also improvement in the activities of the street so
that the linkage can be understood (Wahid, 2008). The existence of an activity that

Arte-Polis 3 International Conference on Creative Collaboration and the Making of Place 3
User Perceptions Towards Street Characteristics and Qualities that Contribute to User Friendly Street: An Examination Based on Survey Data: Norhafizah ABDUL RAHMAN
helps to generate the economy is not caused by the physical element instead it is
reflected by the integration and experiences of individuals.
Discussion on friendly street in this paper revolves around the definitions given
by few literatures, street that easy to use (usability)(oxford , 1993), fulfil the
needs of all users (Tibbalds, 1990) and environment needs (Shuhana,,2000). It‟s
something to do with usability, accessibility and safety (Yaakub et al, 2009). User
friendly facilitates a functional balance between human needs, environmental
factors and financial constrains (Shuhana et al, 2007). Allan Jacobs (1996) noted
that the essential quality in urban public is they meet the needs of the users. The
distinct qualities that the public space should have are safety ( Whyte (1980),
Jacobs (1961) and Carmona et al (2003)), Comfort and convenience (Jacobs
(1996) and Lynch (1981)) and accessibility ( Whyte (1980), Carrs et al (1992)
and Jacobs (1996).
METHODOLOGY User perceptions information was obtained through a survey of daily user (those
who are constantly engage with the street) and occasional (those who are not
dependent on the study are such as shoppers and visitors and non user). It is
expected that the findings from this study will help designers, urban planners and
policy makers understand the needs and attitudes of users towards user friendly
street in Malaysia.
The research is conducted based on literature review on the friendly street in Jalan
Tunku Abdul Rahman . This study focused on the attributes and criteria of street
qualities and characteristics perceived by the users. A self conduct survey was
conducted. A total of 346 questionnaires were distributed. The respondents were
asking to answer the variables regarding the qualities and characteristics of the
street that they perceive. All the data received were analyzed using the SPSS 2005
version 12.0 software. The frequencies of all variables from the data in this sub
topic and a chi-square test is used in order to access the validity of the relationship
between the two variables. In this research, the result of the Chi-square (X²) shows
a degree of association between two variables.
Case study Data presented in this article were collected on the Kuala Lumpur city centre
residents. The study focuses on users‟ needs in Malaysia urban context and the
relationships with physical, functional and social qualities of the built
environments. The physical, functional and social qualities of the streets- Based
on the literature review.
The reasons why choosing this street as a case study because JTAR is the most
significant streets in the Kuala Lumpur city (DBKL 2004). It‟s selected based on
physical, functional characteristics and social cultural significant. Hence the street
is located within main commercial and shopping district with high pedestrian
volumes, popular shopping areas, located within diverse economic activities.

Arte-Polis 3 International Conference on Creative Collaboration and the Making of Place 4
User Perceptions Towards Street Characteristics and Qualities that Contribute to User Friendly Street: An Examination Based on Survey Data: Norhafizah ABDUL RAHMAN
The study area is located within the core of CBD of Kuala Lumpur. The street
name is Jalan Tuanku Abdul Rahman (see figure 1). JTAR begins from Jalan Tun
Perak intersection and ends near Hospital Universiti which is Jalan Pahang
intersection. The length of this street is approximately 2.58 km. JTAR is a long
stretch of one way road defining by two rows of low rise buildings on the southern
side and high rise office buildings and shopping malls towards the north side.
Within the study area, both sides have rows of commercial buildings such as
hotels, office lots, shop houses, bazaars, restaurants, and the likes (see figure 2).
Figure 1: Location Plan: Study area in Kuala Lumpur city centre
Source: DBKL 2008
Street Layout
Form Characteristics
Figure 2: The study area Jalan Tunku Abdul Rahman
Source: Author 2008
Jalan Tunku Abdul Rahman

Arte-Polis 3 International Conference on Creative Collaboration and the Making of Place 5
User Perceptions Towards Street Characteristics and Qualities that Contribute to User Friendly Street: An Examination Based on Survey Data: Norhafizah ABDUL RAHMAN
RESULTS
Respondents’ Demographic
The total number of respondents in this research was 346. They represent the key
users of the places. Based on the feedback it found that most of the respondents
were daily users (49%) followed by occasional users (34.0%) and 17.0% of the
respondents do not use Jalan Tunku Abdul Rahman (see table 1). For daily users,
most of them (46.8%) have already engaged with Jalan Tunku Abdul Rahman for
about 1-5 years. The least response receives from group of user that engage less
than a year in that street. A majority of the respondents is between age group of
26-45 (39%) and 18- 25 (35.0%). This is due to the fact that most of the users in
urban area are people within that aged. The male respondents show more interest
compared to the female respondents. Cultural influence, shy and safety awareness
might have contributed towards unwillingness to answer the questions.
Out of 346 respondents, there are only 282 of them willing to give information
about their monthly income. Majority of the respondents are the group of monthly
income within RM 1001- RM 3000 (77.7 %). In terms of ethnic background,
respondents were mostly Malay. This is due to most of the activities and facilities
provided along this street are per suit Malay needs. Hence the early settlements of
this street are Indian Muslim and Malay population. This has influenced the socio
cultural characteristics and dominancy of particular groups to live and work in this
area. Based on the respondents‟ level of education feedback, 36% are college and
institution followed by secondary school leaver (33.1%), 27 % are university
education, 2.6 % primary education leavers and the remaining are non formal
education. They were mostly attached to private sectors (33.3%) and government
sectors (32.8 %).
Survey analysis from the public respondents In this paper only discuss the relationships of socio economic backgrounds in their
perceptions on street qualities and qualities. The objective is to look at the
similarities and differences within different socio economic backgrounds towards
friendly street in Malaysia context. The frequencies of all variables and Chi-
square test are used to access validity and significance of the variable‟s
relationships in a contingency table. The relationship is only assumed to be
statistically significant if the probability level is 0.05 or less. A significant
relationship only shows the degree of association not what the association is,
where the result of the chi-square test (χ²) show a degree of association between
two variables. Based on the literature review the most mention characters and
qualities n criteria to encourage people to use the street are safe and security,
comfort and convenience; and accessibility and proximity.

Arte-Polis 3 International Conference on Creative Collaboration and the Making of Place 6
User Perceptions Towards Street Characteristics and Qualities that Contribute to User Friendly Street: An Examination Based on Survey Data: Norhafizah ABDUL RAHMAN
Table 1: Demographic of respondents
Source: Field survey 2008
Respondent (N= 346)
Demographic Profile Category Percentage (%)
Types of respondents Daily use 49.0
Occasional 34.0
Non-use 17
Gender Male 60.2
Female 39.8
Age Under 18 2.9
18-25 35.5
26-45 39
46-59 19.7
Above 60 2.9
Marital Status Single 65.1
Married 34.9
Ethnicity Malay 62.4
Chinese 24.7
India 12.1
Others 9.0
Monthly Income Below RM 1000 4.6
RM 1001- 3000 77.7
RM 3001- 6000 15.2
RM6001- 10000 1.8
Above RM 10000 0.7
Occupation Unemployed 20.1
Self employed 8.0
Private 33.3
Government 32.8
Others (student) 5.7
Distance from resident Less than 1 km 0.6
1-5 km 22.9
5-10 km 36.6
10-15 km 9.7
15-20km 9.7
More than 20 km 20.6
Education Non formal education 1.2
Primary Education 2.6
Secondary education 33.1
College or Institution 36.0
University education 27.0
The uses The main attraction of JTAR is shopping centres (46.0%), followed by the best
place to earn money or income (22.6%), public facilities (11.8%) and public
spaces (11.1%) others remain (see figure 3). 60.2 % of the respondents feel not
safe to use JTAR alone. Most of the reasons not feeling safe is because of high
crime rate (42%), followed by lots of migrants and strangers (21%) and lack of
supervision by police (15%).

Arte-Polis 3 International Conference on Creative Collaboration and the Making of Place 7
User Perceptions Towards Street Characteristics and Qualities that Contribute to User Friendly Street: An Examination Based on Survey Data: Norhafizah ABDUL RAHMAN
Figure 3: The main attraction of Jalan Tunku Abdul Rahman
Source: Field Survey 2008
Based on the feedback on duration of visit, most of the users spend around 1-4
hours in this place during their visit to this place (53.4 %) followed by 5-8 hours
(29.3%) more than 12 hours (11.2%) less than 1 hour (3.4%) and 9-12 hours (2.6
%). Majority of the users use this street in the morning (46.2%) , late afternoon
(27.4%), evening (16.2%) afternoon 10% .The result on how they come to this
place shows that most of them used private cars (39.3%) , LRT ( 36.8%), followed
by motorcycle (14.5%) , bus 7.7% and taxi 1.7%.
The results shows that 36.8% of the users visited Jalan Tunku Abdul Rahman
when they are in Kuala Lumpur, 46.2 % are sometimes) and 17.1 % are most of
the time. 55.6 % of the respondents like to come to this place during free time.
Most of the users (43.1%) come to this place with their peers, 31.9 % like to come
here alone followed by with family 12.9 and remains 12.1% are couples. The main
reasons mention in the study on preferring to come with their peers because they
feel more comfortable, safe, leisure and discussion. The results shows user‟ age
group less than 18 years old and above 60 prefer to come to this street with peers.
Groups of users age between 18-24 always use this street alone.
There are significantly different based on the respondents the „age group‟,
„marital status, „distance from residence‟ and „income‟ and their association with
visit to JTAR (see table 2 )
Table 2: Chi-square test of respondents‟ perceptions with the visit to JTAR
Source: Field Survey 2008
Variables Test Result
Age Chi-square χ ²= 24.099, df=8, p= 0.002
Marital status Chi-square χ²= 14.736, df= 7, p= 0.001
Occupation Chi-square χ²= 30.703, df=8, p= 0.000
Distance from residence Chi-square χ²= 20.613, df= 8, p= 0.008
Income Chi-square χ²= 6.967, df= 2, p= 0.031
46
11.8
2.8
11.1
4.2
22.6
1.4
Types of attraction
The main attraction of JTAR
Shopping centres
Public facilities
Buildings
Public spaces
Landscapes
Income
Others

Arte-Polis 3 International Conference on Creative Collaboration and the Making of Place 8
User Perceptions Towards Street Characteristics and Qualities that Contribute to User Friendly Street: An Examination Based on Survey Data: Norhafizah ABDUL RAHMAN
The results of the chi-square test (χ ²) shows not much significant different within
frequency of visit to this street with the variables (see table 3). The only variables
that show significant different are occupation and distance from resident. Most of
the respondents who stay more than 20km distance visit this street occasionally.
Table 3: Chi-square test of users‟ perceptions with their frequency of visit.
Source : Field Survey 2008
Variables Test Result
Occupation Chi-square χ²= 50.621, df=16, p= 0.000
Distance from residence Chi-square χ²= 33.105, df= 16, p= 0.007
In duration of visit „age group‟ shows significant different with the result χ²=
29.594, df=16 and p= 0.02. The respondents with different age group feedbacks
vary significantly in the duration of using JTAR. There is no respondent in the
age group under 18 use this street more than 5 hours. Majority of the respondent‟s
age between 18- 24 spend about 1-4 hours in this street. It shows in this graph that
respondents in the age group 26-45 years old are most vary in their durations
spend in JTAR. The group ages above 60 years spend about 5-8 hours in that
street. Most of the street users‟ age group 18- 45 years old spend their time within
1-4 hour to 5-8 hours there. However the age groups 26-45 tend to spend longer in
that street.
Safety and security attributes to encourage the use of the street The results on the surveys on the criteria on safety and security that encourage
people to use JTAR indicated higher positive responses (see figure 4). The scale of
1.21 – 1.89 of the attributes show that safety and security quality are very
important to encourage the uses of the street (see table 4). However, compared to
others attribute under safety and security „ shows the least important.
Figure 4: Degree of safety and security attributes
Source: Field survey 2008
0%
20%
40%
60%
80%
100%
a b c d e f g h i j k
Attributes
Safety and security qualities
strongly unimportant
slightly unimportant
slightly important
strongly important

Arte-Polis 3 International Conference on Creative Collaboration and the Making of Place 9
User Perceptions Towards Street Characteristics and Qualities that Contribute to User Friendly Street: An Examination Based on Survey Data: Norhafizah ABDUL RAHMAN
Table 4: Degree of safety and security attributes based on mean values
Source: Field survey 2008
Safety qualities Mean Value
a Presence of people 1.77
b Presence of security official and patrol police 1.21
c Presence of activities 1.78
d Safe crossing devices 1.39
e Full of activities day and night 1.89
f Safe environment for elderly, disabled and children 1.41
g Low traffic flow and speed 1.57
h Free of accidents 1.34
i Low crime statistics 1.34
j Free of the presence of anti-social behaviours 1.41
k No graffiti and vandalism 1.47
Mean Value
Response format
1= strongly important
4= strongly unimportant
1.50
Based on chi-square test there are significant variables with the safety and security
attributes (see table 5).
Table 5: Chi square test results on safety and security attributes with demographic factors.
Source: Authors (2009)
Variables Presence
of people
Presence
of
activities
Safe
crossing
devices
Activities
day
and night
Free of
accident
Low
crime
statistic
Age χ²=
57.473,
df=12,
p= 0.000
χ²=
24.904,
df= 12,
p= 0.015
χ²=
19.368,
df= 8,
p= 0.013
χ²=
26.239,
df= 12,
p= 0.010
χ²=
16.812,
df= 8,
p= 0.032
χ²=
10.810,
df= 4,
p=
0.029
Education χ²=
24.135,
df=8,
p= 0.002
χ²=
16.476,
df=8, p=
0.036
Occupation χ²=
26.823,
df=12,
p= 0.008
χ²=
35.053,
df=4, p=
0.000
Distance
from
residence
²=
21.416,
df= 00,
p= 0.018
χ²=
33.740,
df= 15,
p= 0.004

Arte-Polis 3 International Conference on Creative Collaboration and the Making of Place 10
User Perceptions Towards Street Characteristics and Qualities that Contribute to User Friendly Street: An Examination Based on Survey Data: Norhafizah ABDUL RAHMAN
Comfort and convenience attributes to encourage the use of the
street Results indicate the similar patterns of importance in the attributes of comfort and
convenience (see figure 5). The scale of the attributes shows criteria of comfort
and convenience are important. Surprisingly, based on mean value, seating
placement, sufficient and comfortable seating show least important compared to
others.
Figure 5: Degree of comfort and convenience attributes
Source: Field survey 2008
Table 6: Degree of comfort and convenience attributes based on mean values
Source: Field survey 2008 Comfort and Convenience qualities Mean Value
a A lot of veranda way/shade and other protection from sun and rain 1.36
b Free of pollution, noise, smell and vibration 1.23
c Breezy 1.50
d Suitable temperature 1.50
e Width of the walking space 1.87
f Lot of rest area and seating places 1.85
g Comfortable and sufficient seating 1.92
h Seating places adjacent to pedestrian flow 2.01
i Very clear pedestrian signage 1.62
j Lots of convenience place for shopping 1.70
k Very clear direction of the place 1.58
l A lot of greenery (trees/shrubs/flowers and grass) 1.75
m Very attractive building facades 1.76
n Availability of dust bins, telephones and toilets. 1.47
o A lot of outdoor cafes, refreshment kiosks 1.77
p Lot of banking and communications centre 1.66
q A lot of spots for entertainment 1.92
r A lots of recreation facilities 1.64
Mean Value
Response format
1= strongly important
4= strongly unimportant
1.53
0%
20%
40% 60%
80%
100%
a c e g i k m o q attributes
comfort and convenience qualities
strongly unimportant slightly unimportant slightly important strongly important
Arte-Polis 3 International Conference on Creative Collaboration and the Making of Place 11
User Perceptions Towards Street Characteristics and Qualities that Contribute to User Friendly Street: An Examination Based on Survey Data: Norhafizah ABDUL RAHMAN
Based on Chi-square test result, age group and marital status are significant factors
in respondents‟ feedback based on the issue of veranda way and protection from
the rain and sun (see table 7).
Table 7: Chi-square test on the issue of protection from rain and sun
Source : Field Survey 2008
Variables Test Result
Age Chi-square χ²= 27.685, df=12, p= 0.009
Chi-square χ²= 15.236, df= 3, p= 0.002
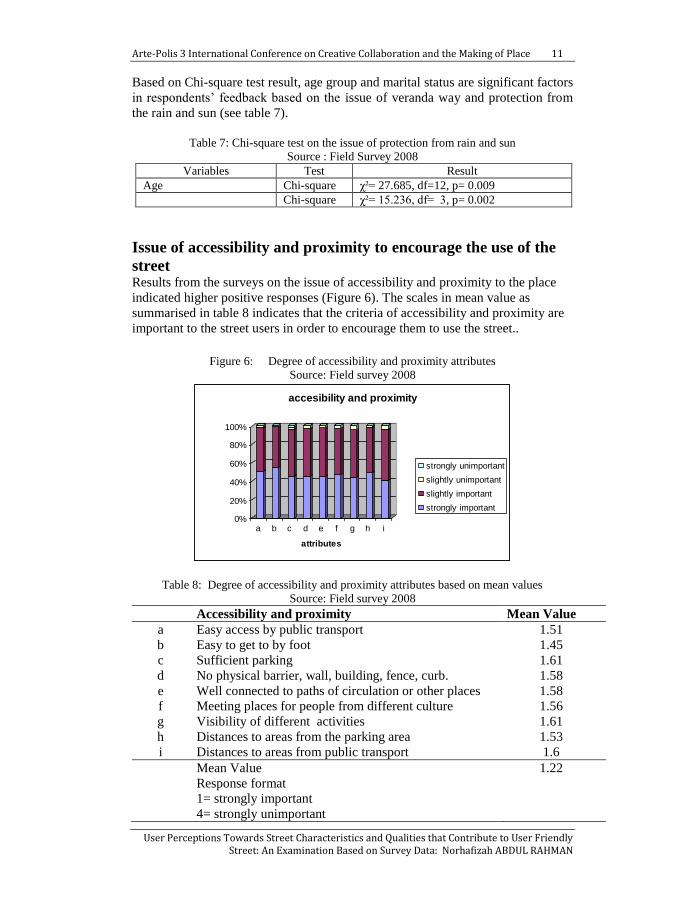
Issue of accessibility and proximity to encourage the use of the
street Results from the surveys on the issue of accessibility and proximity to the place
indicated higher positive responses (Figure 6). The scales in mean value as
summarised in table 8 indicates that the criteria of accessibility and proximity are
important to the street users in order to encourage them to use the street..
Figure 6: Degree of accessibility and proximity attributes
Source: Field survey 2008
0%
20%
40%
60%
80%
100%
a b c d e f g h i
attributes
accesibility and proximity
strongly unimportant
slightly unimportant
slightly important
strongly important
Table 8: Degree of accessibility and proximity attributes based on mean values
Source: Field survey 2008
Accessibility and proximity Mean Value
a Easy access by public transport 1.51
b Easy to get to by foot 1.45
c Sufficient parking 1.61
d No physical barrier, wall, building, fence, curb. 1.58
e Well connected to paths of circulation or other places 1.58
f Meeting places for people from different culture 1.56
g Visibility of different activities 1.61
h Distances to areas from the parking area 1.53
i Distances to areas from public transport 1.6
Mean Value
Response format
1= strongly important
4= strongly unimportant
1.22

Arte-Polis 3 International Conference on Creative Collaboration and the Making of Place 12
User Perceptions Towards Street Characteristics and Qualities that Contribute to User Friendly Street: An Examination Based on Survey Data: Norhafizah ABDUL RAHMAN
CONCLUSION In summary, in order to create a street as successful urban public area, the
understanding of the needs of the urban users is the most important. There are
many ways in which urban designers, planners and policy makers may be able to
act to support the quality of the street in order to create friendly street. The
designers must understand the current need of the users and creating the place that
has qualities and characteristics that can fulfil the needs of user in local context.
Understand the needs of both behavioural and physical environment.
Based on the study, it is found that there are significant different in perception of
users in different socio economic backgrounds. The factors of age, marital status,
gender, distance from residence, income and level of education shows significant
different in their perceptions on friendly street. It was discovered there is no
significant variation in the perception of friendly street between different cultural
groups.
Finally, the research found that there were no significant different between the
theories developed in the west and those found in the Malaysian situation.
REFERENCES CARMONA.M, Heath.T, Oc.T and Tiesdell.S (2003), Public Places- Urban
Spaces: The Dimension of Urban Design, Architectural Press, London.
CARR.et al.(1992) Public Space, Cambridge University Press, Cambridge
FORSYTH, A (2003) People and Urban Green Areas: Perception and Use, Design
Center for American Urban Landscape, Design Brief, 4/June 2003, University of
Minnesota
DOLBANI.M (2000) Responsive Public Open Spaces in the city centre of Kuala
Lumpur . Unpublished PHD thesis.JCUD, Oxford Brookes University.
JACOBS,A,B.(1996),Great Streets, The MIT Press. Cambridge, Massachusetts,
London, England
JACOBS, J (1961), The Death and Life of Great American Cities, Vintage Books,
New York.
LYNCH,K.(1984) Good City Form (Cambridge, MA, MIT Press)
SHAMSUDDIN.S and Sulaiman.A.B (2002) The Vanishing streets in the
Malaysian Urbanscape. In Pu Miao (ed), Public Places in AsiaPacific Cities:
Kluwer Academic Publishers, p.p 137-149
TIBBALDS,F (1992) Making People-friendly Towns: Improving the public
Environment in Towns and Cities. Harlow: Longman
WHYTE,W.H (1980) The Social Life of Small Urban Spaces, Washington, D.C,
The Conservation Foundation
YAAKUB .N.M and Hashim .N.R. (2009) Accessibility for disabled and elderly
people in Malaysia: Problems and solutions, The Malaysian Surveyor, Vol.44,
No.2 .pp 30-34