use of web page credibility information in - CORE
305
USE OF WEB PAGE CREDIBILITY INFORMATION IN INCREASING THE ACCURACY OF WEB-BASED QUESTION ANSWERING SYSTEMS ASAD ALI SHAH THESIS SUBMITTED IN FULFILMENT OF THE REQUIREMENT FOR THE DEGREE OF DOCTOR OF PHILOSOPHY FACULTY OF COMPUTER SCIENCE AND INFORMATION TECHNOLOGY UNIVERSITY OF MALAYA KUALA LUMPUR 2017
-
Upload
khangminh22 -
Category
Documents
-
view
1 -
download
0
Transcript of use of web page credibility information in - CORE

USE OF WEB PAGE CREDIBILITY INFORMATION IN INCREASING THE ACCURACY OF WEB-BASED
QUESTION ANSWERING SYSTEMS
ASAD ALI SHAH
THESIS SUBMITTED IN FULFILMENT OF THE REQUIREMENT FOR THE DEGREE OF DOCTOR OF
PHILOSOPHY
FACULTY OF COMPUTER SCIENCE AND INFORMATION TECHNOLOGY
UNIVERSITY OF MALAYA KUALA LUMPUR
2017
ii
UNIVERSITY OF MALAYA
ORIGINAL LITERARY WORK DECLARATION
Name of Candidate: Asad Ali Shah
Registration/Matric No: WHA120030
Name of Degree: Doctor of Philosophy in Computer Science
Title of Project Paper/Research Report/Dissertation/Thesis (“this Work”):
Use of Web Page Credibility Information in Increasing the Accuracy of Web-Based
Question Answering Systems
Field of Study: Information Systems
I do solemnly and sincerely declare that:
(1) I am the sole author/writer of this Work;
(2) This Work is original;
(3) Any use of any work in which copyright exists was done by way of fair dealing
and for permitted purposes and any excerpt or extract from, or reference to or
reproduction of any copyright work has been disclosed expressly and
sufficiently and the title of the Work and its authorship have been
acknowledged in this Work;
(4) I do not have any actual knowledge nor do I ought reasonably to know that the
making of this work constitutes an infringement of any copyright work;
(5) I hereby assign all and every rights in the copyright to this Work to the
University of Malaya (“UM”), who henceforth shall be owner of the copyright
in this Work and that any reproduction or use in any form or by any means
whatsoever is prohibited without the written consent of UM having been first
had and obtained;
(6) I am fully aware that if in the course of making this Work I have infringed any
copyright whether intentionally or otherwise, I may be subject to legal action
or any other action as may be determined by UM.
Candidate’s Signature Date: 3rd Aug 2017
Subscribed and solemnly declared before,
Witness’s Signature Date:
Name:
Designation:
iii
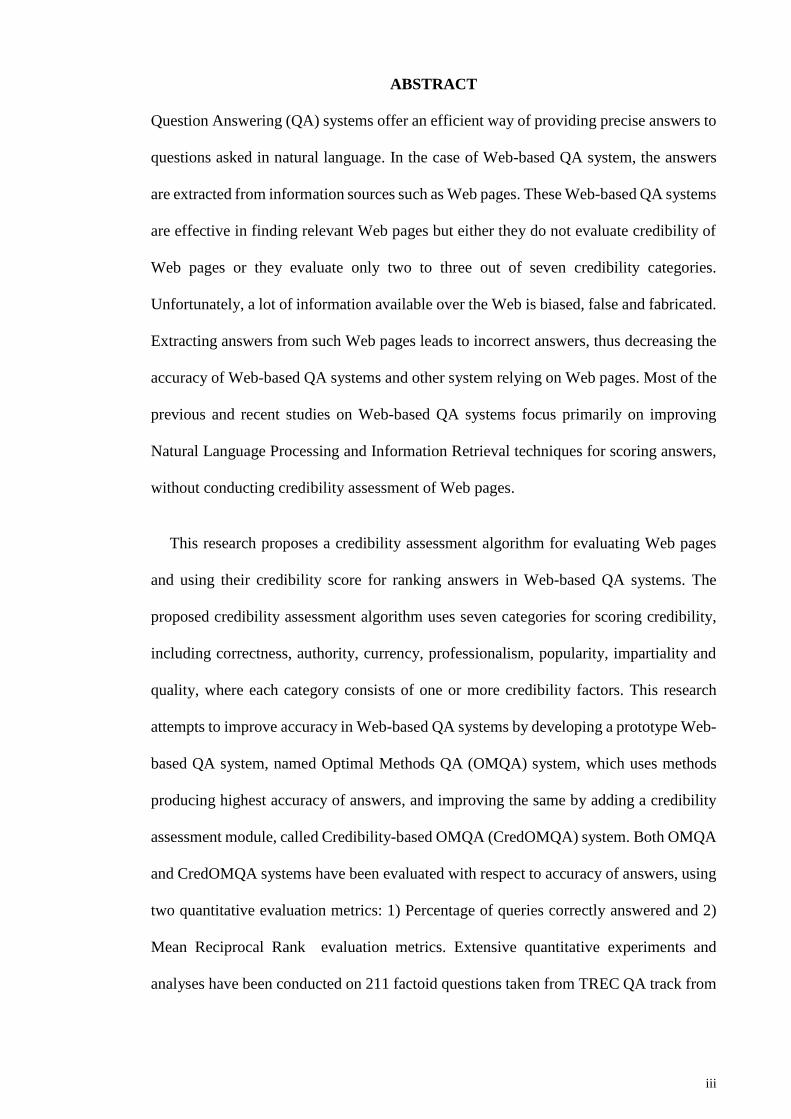
ABSTRACT
Question Answering (QA) systems offer an efficient way of providing precise answers to
questions asked in natural language. In the case of Web-based QA system, the answers
are extracted from information sources such as Web pages. These Web-based QA systems
are effective in finding relevant Web pages but either they do not evaluate credibility of
Web pages or they evaluate only two to three out of seven credibility categories.
Unfortunately, a lot of information available over the Web is biased, false and fabricated.
Extracting answers from such Web pages leads to incorrect answers, thus decreasing the
accuracy of Web-based QA systems and other system relying on Web pages. Most of the
previous and recent studies on Web-based QA systems focus primarily on improving
Natural Language Processing and Information Retrieval techniques for scoring answers,
without conducting credibility assessment of Web pages.
This research proposes a credibility assessment algorithm for evaluating Web pages
and using their credibility score for ranking answers in Web-based QA systems. The
proposed credibility assessment algorithm uses seven categories for scoring credibility,
including correctness, authority, currency, professionalism, popularity, impartiality and
quality, where each category consists of one or more credibility factors. This research
attempts to improve accuracy in Web-based QA systems by developing a prototype Web-
based QA system, named Optimal Methods QA (OMQA) system, which uses methods
producing highest accuracy of answers, and improving the same by adding a credibility
assessment module, called Credibility-based OMQA (CredOMQA) system. Both OMQA
and CredOMQA systems have been evaluated with respect to accuracy of answers, using
two quantitative evaluation metrics: 1) Percentage of queries correctly answered and 2)
Mean Reciprocal Rank evaluation metrics. Extensive quantitative experiments and
analyses have been conducted on 211 factoid questions taken from TREC QA track from
iv
1999, 2000 and 2011 and a random sample of 21 questions from CLEF QA track for
comparison and conclusions.
Results from methods and techniques evaluation show that some techniques improved
accuracy of answers retrieved more than others performing the same function. In some
cases, combination of different techniques produced higher accuracy of answers retrieved
than using them individually.
The inclusion of Web pages credibility score significantly improved accuracy of the
system. Among the seven credibility categories, four categories including correctness,
professionalism, impartiality and quality had a major impact on accuracy of answer,
whereas authority, currency and popularity played a minor role. The results conclusively
establish that proposed CredOMQA performs better than other Web-based QA systems.
Not only that, it also outperforms other credibility-based QA systems, which employ
credibility assessment partially.
It is expected that these results will help researchers/experts in selecting Web-based
QA methods and techniques producing higher accuracy of answers retrieved, and evaluate
credibility of sources using credibility assessment module to improve accuracy of existing
and future information systems. The proposed algorithm can also help in designing
credibility-based information systems in the areas of education, health, stocks,
networking and media, requiring accurate and credible information, and would help
enforce new Web-publishing standards, thus enhancing overall Web experience.
v
ABSTRAK
Sistem soal jawab (QA) menawarkan cara yang cekap untuk memberikan jawapan yang
tepat kepada soalan-soalan yang ditanya dalam bahasa asli. Dalam kes sistem QA
berasaskan Web, jawapan diambil daripada sumber-sumber maklumat seperti laman
Web. Sistem QA berasaskan Web ini berkesan dalam mencari laman Web yang berkaitan
tetapi tidak menilai kredibiliti laman Web tersebut atau hanya menilai dua hingga tiga
daripada tujuh kategori kredibiliti. Malangnya, kebanyakan maklumat yang disediakan
melalui laman Web adalah berat sebelah, palsu dan fabrikasi. Pengekstrakan jawapan dari
sistem QA berasaskan Web tersebut menunjukan jawapan yang kurang tepat, sejurusnya
mengurangkan ketepatan sistem QA berasaskan Web dan sistem lain yang bergantung
kepada laman Web. Kebanyakan kajian sistem QA berasaskan Web yang lepas dan yang
terbaru pada asasnya tertumpu dalam memperbaiki teknik pemprosesan bahasa asli dan
teknik capaian maklumat untuk pemarkahan jawapan, tanpa membuat penilaian
kredibiliti laman Web.
Kajian ini mencadangkan satu algorithm penilaian kredibiliti untuk menilai laman
Web dan menggunakan skor kredibiliti untuk kedudukan jawapan dalam sistem QA
berasaskan Web. Model penilaian kredibiliti yang dicadangkan menggunakan tujuh
kategori untuk menjaringkan kredibiliti, termasuk ketepatan, kuasa, mata wang,
profesionalisme, populariti, kesaksamaan dan kualiti, di mana setiap kategori terdiri
daripada satu atau lebih faktor kredibiliti. Kajian ini cuba meningkatkan ketepatan dalam
sistem QA berasaskan Web dengan membangunkan prototaip sistem QA berasaskan Web
yang dinamakan Optimal Methods QA (OMQA), yang menggunakan kaedah
menghasilkan ketepatan tertinggi jawapan, dan meningkatkannya dengan penambahan
penilaian modul kredibiliti, yang dipanggil sistem Credibility-based OMQA
(CredOMQA). Kedua-dua sistem OMQA dan CredOMQA telah dinilai dari segi
ketepatan jawapan, menggunakan dua metrik penilaian kuantitatif: 1) Peratusan
vi
pertanyaan yang dijawab dengan betul dan 2) metrik penilaian Mean Reciprocal Rank.
Eksperimen kuantitatif dan analisis yang meluas telah dijalankan ke atas 211 soalan
factoid dari trek TREC QA tahun 1999, 2000 dan 2011 dan sampel rawak 21 soalan
daripada trek CLEF QA untuk perbandingan dan kesimpulan.
Hasil daripada kaedah dan teknik penilaian menunjukkan bahawa beberapa teknik
meningkatkan ketepatan jawapan lebih daripada teknik lain yang melaksanakan fungsi
yang sama. Dalam beberapa kes, gabungan teknik yang berbeza menghasilkan ketepatan
jawapan yang lebih tinggi daripada menggunakan mereka secara individu.
Kemasukan kredibiliti skor laman Web meningkatkan ketepatan sistem dengan ketara.
Antara tujuh kategori kredibiliti, lima kategori termasuk ketepatan, profesionalisme,
kesaksamaan dan kualiti mempunyai kesan yang besar kepada ketepatan jawapan,
manakala kuasa, populariti dan mata wang memainkan peranan yang kecil. Keputusan
muktamad membuktikan bahawa cadangan CredOMQA lebih berkesan daripada sistem
QA berasaskan Web yang lain. Bukan sekadar itu, ia juga mengatasi sistem QA
berdasarkan kredibiliti yang menggunakan sebahagian penilaian kredibiliti.
Ia dijangka bahawa keputusan ini akan membantu penyelidik/pakar-pakar dalam
memilih kaedah QA berasaskan Web dan teknik menghasilkan ketepatan yang lebih
tinggi dalam pengekstrakan jawapan, dan menilai kredibiliti sumber menggunakan
algorithm penilaian kredibiliti untuk meningkatkan ketepatan yang sedia ada dan sistem
maklumat kelak.
Model yang dicadangkan juga boleh membantu dalam merekabentuk sistem maklumat
berasaskan kredibiliti termasuk bidang pendidikan, kesihatan, saham, rangkaian dan
media, yang memerlukan maklumat yang tepat serta boleh dipercayai, dan membantu

vii
menguatkuasakan piawaian Web-penerbitan baharu, sekali gus meningkatkan
keseluruhan pengalaman Web.
viii
ACKNOWLEDGEMENTS
First and foremost, thanks to Allah for bestowing me the knowledge and guiding me in
pursuing Ph.D. Accomplishing anything requires both moral and technical guidance. For
technical guidance I will like to thank my supervisor Dr. Sri Devi Ravana for always
being cooperative and providing the necessary assistance whenever it was required. I
would also like to thank my co-supervisors, Dr. Suraya Hamid and Dr. Maizatul Akmar
Binti Ismail, for also giving advice on improving my work. A man can only achieve a
little without moral support, for that all credit goes to my better half, my wife Arooj, who
always has been encouraging me to give my best and has always been supporting me
whenever I needed it the most. My daughter has also been a blessing for me during my
PhD, every time I looked at her I knew what needed to be done and that kept me pushing
forward. Lastly, my parents, in-laws and family members back home who have been
supporting and guiding me throughout my research.
ix
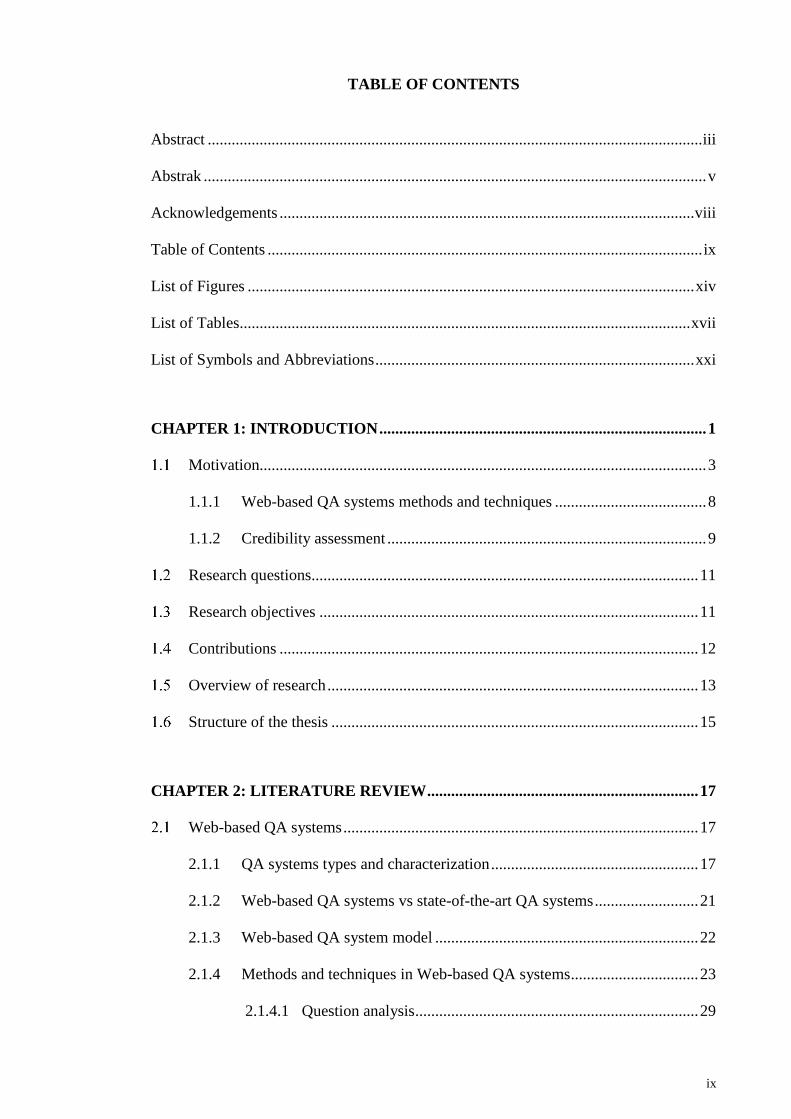
TABLE OF CONTENTS
Abstract ............................................................................................................................ iii
Abstrak .............................................................................................................................. v
Acknowledgements ........................................................................................................ viii
Table of Contents ............................................................................................................. ix
List of Figures ................................................................................................................ xiv
List of Tables................................................................................................................. xvii
List of Symbols and Abbreviations ................................................................................ xxi
CHAPTER 1: INTRODUCTION .................................................................................. 1
Motivation................................................................................................................ 3
1.1.1 Web-based QA systems methods and techniques ...................................... 8
1.1.2 Credibility assessment ................................................................................ 9
Research questions................................................................................................. 11
Research objectives ............................................................................................... 11
Contributions ......................................................................................................... 12
Overview of research ............................................................................................. 13
Structure of the thesis ............................................................................................ 15
CHAPTER 2: LITERATURE REVIEW .................................................................... 17
Web-based QA systems ......................................................................................... 17
2.1.1 QA systems types and characterization .................................................... 17
2.1.2 Web-based QA systems vs state-of-the-art QA systems .......................... 21
2.1.3 Web-based QA system model .................................................................. 22
2.1.4 Methods and techniques in Web-based QA systems ................................ 23
2.1.4.1 Question analysis ....................................................................... 29
x
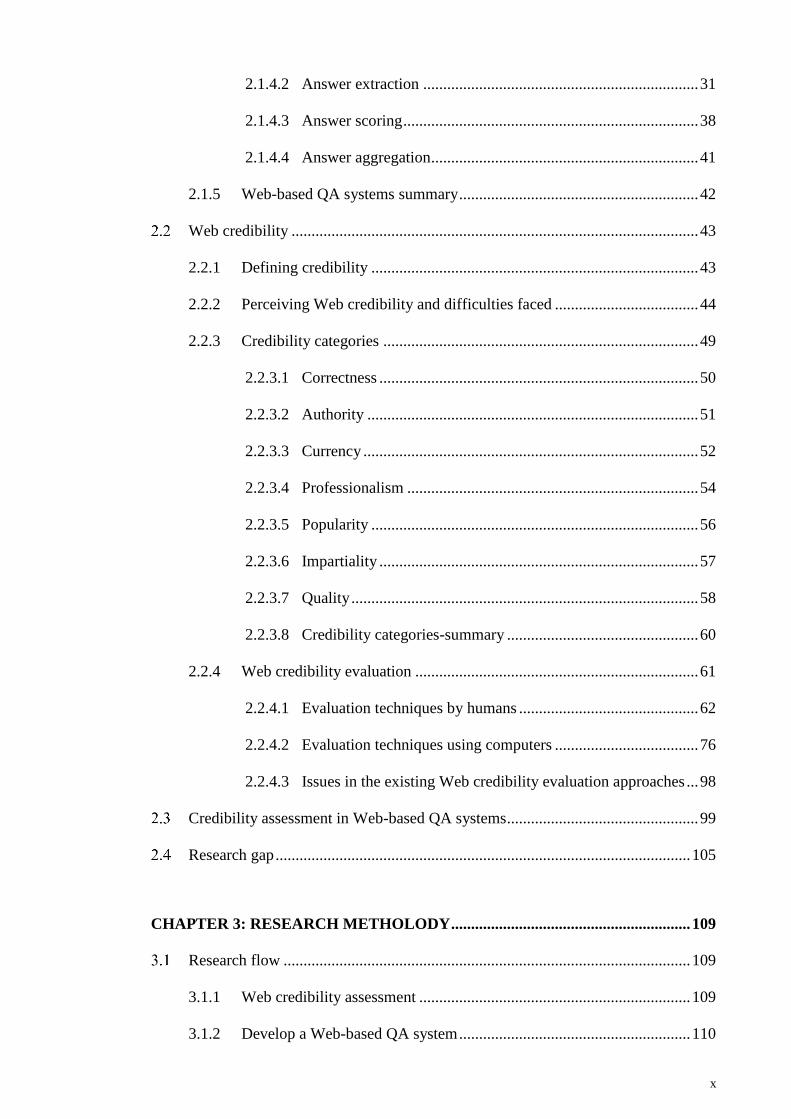
2.1.4.2 Answer extraction ..................................................................... 31
2.1.4.3 Answer scoring .......................................................................... 38
2.1.4.4 Answer aggregation ................................................................... 41
2.1.5 Web-based QA systems summary ............................................................ 42
Web credibility ...................................................................................................... 43
2.2.1 Defining credibility .................................................................................. 43
2.2.2 Perceiving Web credibility and difficulties faced .................................... 44
2.2.3 Credibility categories ............................................................................... 49
2.2.3.1 Correctness ................................................................................ 50
2.2.3.2 Authority ................................................................................... 51
2.2.3.3 Currency .................................................................................... 52
2.2.3.4 Professionalism ......................................................................... 54
2.2.3.5 Popularity .................................................................................. 56
2.2.3.6 Impartiality ................................................................................ 57
2.2.3.7 Quality ....................................................................................... 58
2.2.3.8 Credibility categories-summary ................................................ 60
2.2.4 Web credibility evaluation ....................................................................... 61
2.2.4.1 Evaluation techniques by humans ............................................. 62
2.2.4.2 Evaluation techniques using computers .................................... 76
2.2.4.3 Issues in the existing Web credibility evaluation approaches ... 98
Credibility assessment in Web-based QA systems ................................................ 99
Research gap ........................................................................................................ 105
CHAPTER 3: RESEARCH METHOLODY ............................................................ 109
Research flow ...................................................................................................... 109
3.1.1 Web credibility assessment .................................................................... 109
3.1.2 Develop a Web-based QA system .......................................................... 110

xi
3.1.3 Develop a credibility-based Web QA system ........................................ 111
3.1.4 Evaluation ............................................................................................... 111
Methodology ........................................................................................................ 112
3.2.1 Reasons for choosing quantitative analysis ............................................ 112
3.2.2 Research selection criteria ...................................................................... 113
Experimental Design ........................................................................................... 115
3.3.1 Data collection ........................................................................................ 116
3.3.2 Data cleaning .......................................................................................... 117
3.3.3 Experiment settings ................................................................................ 119
3.3.3.1 Experiment system setup ......................................................... 119
3.3.3.2 Technologies used for evaluation ............................................ 119
3.3.3.3 Evaluation settings for Web-based QA systems’ methods and
techniques ................................................................................ 119
3.3.3.4 Evaluation settings for Web-based QA and credibility-based Web
QA systems ............................................................................. 122
3.3.3.5 Evaluation metrics ................................................................... 126
3.3.4 Develop OMQA system ......................................................................... 133
3.3.5 Generating top ranked answers .............................................................. 134
3.3.6 Credibility assessment module ............................................................... 136
3.3.7 Develop CredOMQA system ................................................................. 137
3.3.7.1 Correctness .............................................................................. 140
3.3.7.2 Authority ................................................................................. 141
3.3.7.3 Currency .................................................................................. 143
3.3.7.4 Professionalism ....................................................................... 144
3.3.7.5 Popularity ................................................................................ 149
3.3.7.6 Impartiality .............................................................................. 152

xii
3.3.7.7 Quality ..................................................................................... 153
3.3.7.8 Web page credibility score ...................................................... 156
3.3.8 Scoring and storing answers ................................................................... 156
3.3.8.1 Frequency score ....................................................................... 157
3.3.8.2 Match Score ............................................................................. 158
3.3.8.3 Prominence score .................................................................... 160
3.3.8.4 Credibility-based answer score ............................................... 162
3.3.9 Generating results for evaluation metrics ............................................... 164
3.3.10 Results analysis ...................................................................................... 166
CHAPTER 4: RESULTS AND DISCUSSION ........................................................ 167
Results for Web-based QA systems methods and techniques ............................. 168
4.1.1 Analysis of Top K search results selection method ................................ 168
4.1.2 Analysis of information from external resources method ...................... 173
4.1.3 Analysis of NER method ........................................................................ 177
4.1.4 Analysis of the removal of unwanted answers method .......................... 181
4.1.5 Analysis of the sentence-matching algorithm method ........................... 186
4.1.6 Analysis of selecting top N sentences method ....................................... 192
4.1.7 Answer scoring test results ..................................................................... 197
4.1.8 Answer aggregation results .................................................................... 202
4.1.9 Web-based QA methods and techniques analysis .................................. 208
4.1.9.1 Answer extraction methods and techniques analysis .............. 209
4.1.9.2 Answer scoring methods and techniques analysis .................. 210
4.1.9.3 Answer aggregation methods and techniques analysis ........... 210
Results for OMQA system vs baseline systems .................................................. 210
4.2.1 PerCorrect and MRR results ................................................................... 211
4.2.2 OMQA system vs baseline systems result analysis ................................ 217
xiii
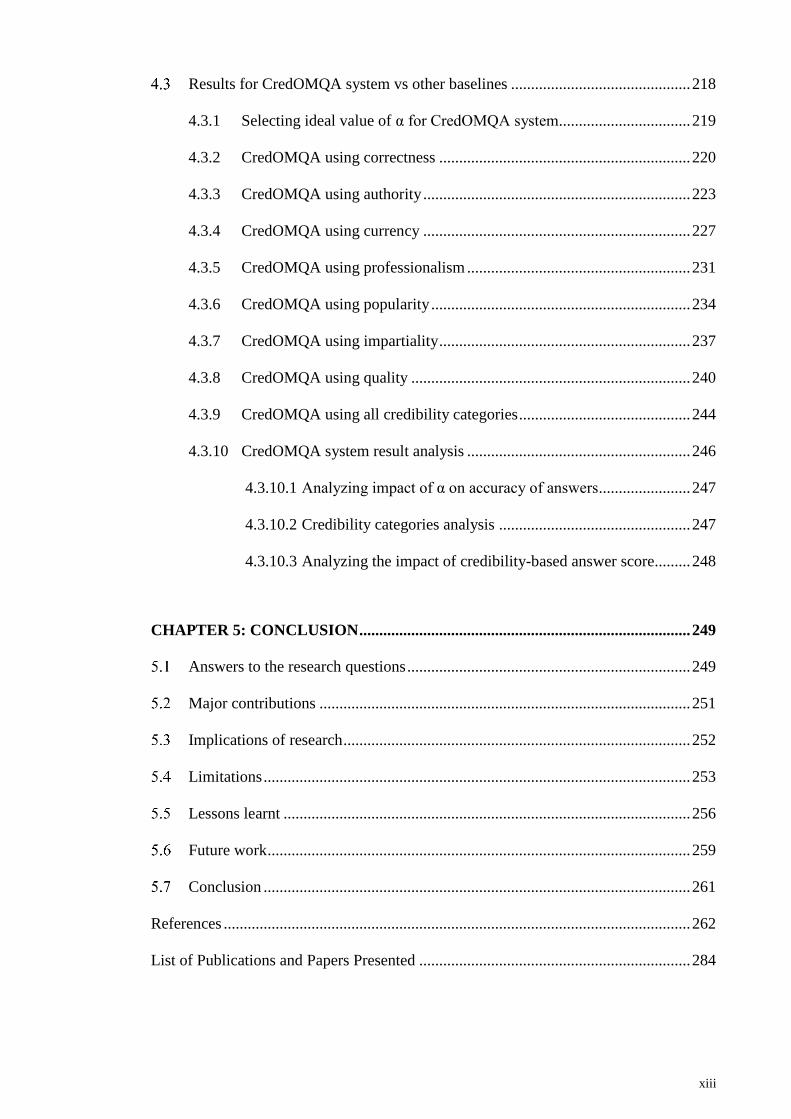
Results for CredOMQA system vs other baselines ............................................. 218
4.3.1 Selecting ideal value of α for CredOMQA system................................. 219
4.3.2 CredOMQA using correctness ............................................................... 220
4.3.3 CredOMQA using authority ................................................................... 223
4.3.4 CredOMQA using currency ................................................................... 227
4.3.5 CredOMQA using professionalism ........................................................ 231
4.3.6 CredOMQA using popularity ................................................................. 234
4.3.7 CredOMQA using impartiality ............................................................... 237
4.3.8 CredOMQA using quality ...................................................................... 240
4.3.9 CredOMQA using all credibility categories ........................................... 244
4.3.10 CredOMQA system result analysis ........................................................ 246
4.3.10.1 Analyzing impact of α on accuracy of answers....................... 247
4.3.10.2 Credibility categories analysis ................................................ 247
4.3.10.3 Analyzing the impact of credibility-based answer score......... 248
CHAPTER 5: CONCLUSION ................................................................................... 249
Answers to the research questions ....................................................................... 249
Major contributions ............................................................................................. 251
Implications of research ....................................................................................... 252
Limitations ........................................................................................................... 253
Lessons learnt ...................................................................................................... 256
Future work .......................................................................................................... 259
Conclusion ........................................................................................................... 261
References ..................................................................................................................... 262
List of Publications and Papers Presented .................................................................... 284
xiv
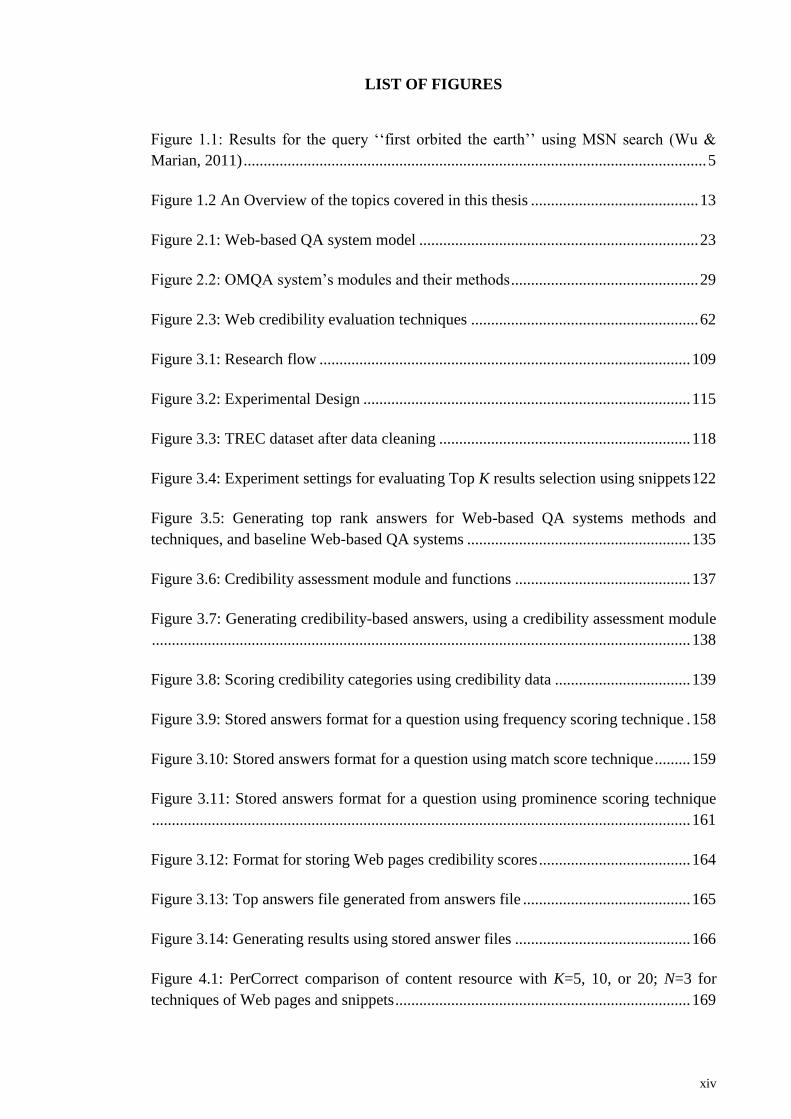
LIST OF FIGURES
Figure 1.1: Results for the query ‘‘first orbited the earth’’ using MSN search (Wu &
Marian, 2011) .................................................................................................................... 5
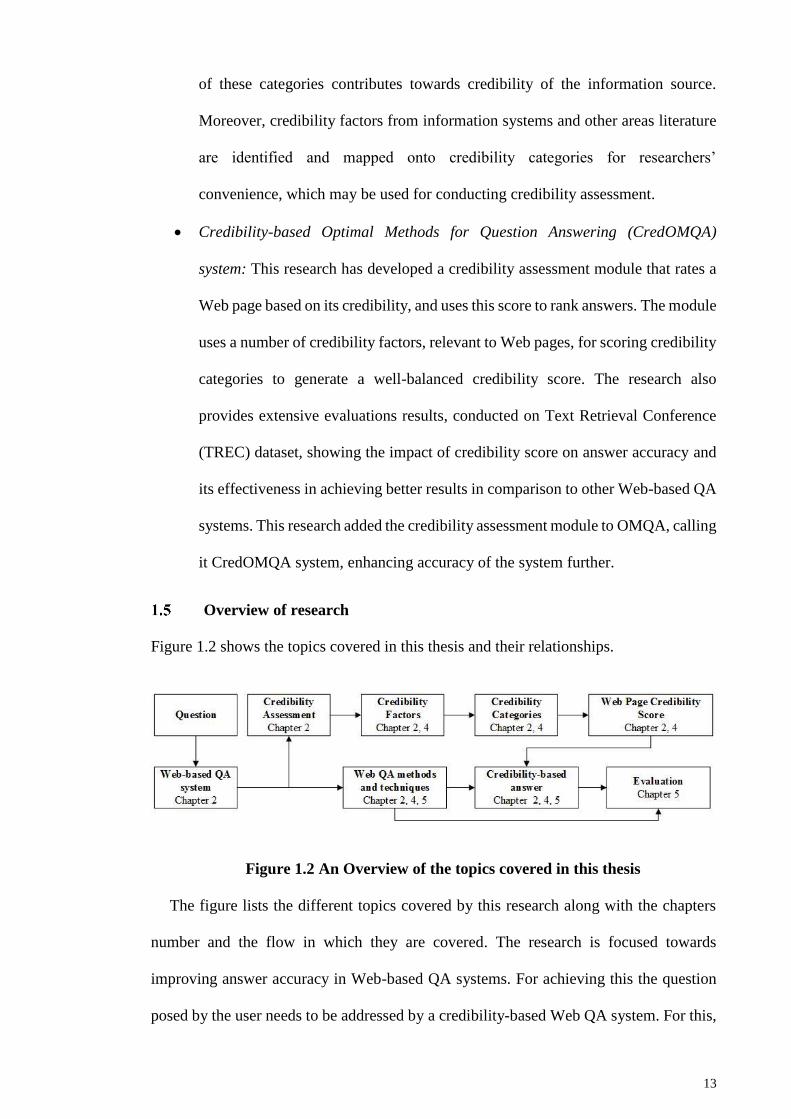
Figure 1.2 An Overview of the topics covered in this thesis .......................................... 13
Figure 2.1: Web-based QA system model ...................................................................... 23
Figure 2.2: OMQA system’s modules and their methods ............................................... 29
Figure 2.3: Web credibility evaluation techniques ......................................................... 62
Figure 3.1: Research flow ............................................................................................. 109
Figure 3.2: Experimental Design .................................................................................. 115
Figure 3.3: TREC dataset after data cleaning ............................................................... 118
Figure 3.4: Experiment settings for evaluating Top K results selection using snippets 122
Figure 3.5: Generating top rank answers for Web-based QA systems methods and
techniques, and baseline Web-based QA systems ........................................................ 135
Figure 3.6: Credibility assessment module and functions ............................................ 137
Figure 3.7: Generating credibility-based answers, using a credibility assessment module
....................................................................................................................................... 138
Figure 3.8: Scoring credibility categories using credibility data .................................. 139
Figure 3.9: Stored answers format for a question using frequency scoring technique . 158
Figure 3.10: Stored answers format for a question using match score technique ......... 159
Figure 3.11: Stored answers format for a question using prominence scoring technique
....................................................................................................................................... 161
Figure 3.12: Format for storing Web pages credibility scores ...................................... 164
Figure 3.13: Top answers file generated from answers file .......................................... 165
Figure 3.14: Generating results using stored answer files ............................................ 166
Figure 4.1: PerCorrect comparison of content resource with K=5, 10, or 20; N=3 for
techniques of Web pages and snippets .......................................................................... 169
xv
Figure 4.2: Web pages and snippets ranked answers results comparison ..................... 171
Figure 4.3: PerCorrect comparison of information from the external resource methods
with K=20, N=3 for no techniques, WordNet keywords, and Google keywords for
QN=211 ......................................................................................................................... 173
Figure 4.4: No technique, WordNet keywords and Google keywords ranked answer
results comparison ......................................................................................................... 176
Figure 4.5: PerCorrect comparison of NER method with K=20, N=3 for the StanfordNER
and AlchemyNER techniques and their combination for QN=211 ............................... 177
Figure 4.6: Alchemy NER, Stanford NER, and Combination NER ranked answer results
comparison .................................................................................................................... 180
Figure 4.7: PerCorrect comparison of removal and non-removal of unwanted answers
K=20, N=3 for QN=211 ................................................................................................ 182
Figure 4.8: Non-removal and removal of unwanted answers technique ranked answer
results comparison ......................................................................................................... 185
Figure 4.9: PerCorrect comparison of sentence matching algorithm methods with K=20,
N=3 for techniques keywords and regex for QN=211 .................................................. 187
Figure 4.10: Keyword and regex sentence-matching algorithms ranked answers results
comparison .................................................................................................................... 190
Figure 4.11: Keyword and regex sentence-matching algorithms ranked answers results
comparison .................................................................................................................... 191
Figure 4.12: PerCorrect comparison of Top N sentences for N=1, N=3, or N=5 with K=20
for QN=211 ................................................................................................................... 193
Figure 4.13: Top N Sentence for N=1, 3, 5 ranked answer results comparison ........... 196
Figure 4.14: PerCorrect comparison of scoring methods with K=20, N=5 for techniques
frequency, scoring answers, prominence, and prominence and match-score for QN=211
....................................................................................................................................... 198
Figure 4.15: Frequency, match-score, prominence and prominence*match-score scoring
techniques ranked answer results comparison .............................................................. 201
Figure 4.16: PerCorrect comparison of the answer aggregation methods with K=20 and
N=5 for dice coefficient, cosine similarity, and combination techniques for QN=211 203
Figure 4.17: Cosine similarity and dice coefficient ranked answer results comparison
....................................................................................................................................... 206
xvi
Figure 4.18: Cosine similarity and dice coefficient ranked answer results comparison
....................................................................................................................................... 207
Figure 4.19: Results showing optimal methods and techniques and their selection in
OMQA system .............................................................................................................. 211
Figure 4.20: OMQA system vs baselines on TREC dataset for QN=211 ..................... 213
Figure 4.21: OMQA system vs baselines on CLEF dataset for QN=21 ....................... 215
Figure 4.22: PerCorrect results for CredOMQA using correctness for QN=211 .......... 221
Figure 4.23: PerCorrect results for CredOMQA using authority for QN=211 ............. 224
Figure 4.24: Authority score given to 20 Web pages for the question “Who was the first
Prime Minister of Canada?” .......................................................................................... 227
Figure 4.25: PerCorrect results for CredOMQA using currency for QN=211 .............. 229
Figure 4.26: Currency score given to 20 search results for the question “Who is the author
of the book, “The Iron Lady: A Biography of Margaret Thatcher”?” .......................... 231
Figure 4.27: PerCorrect results for CredOMQA using professionalism for QN=211 .. 232
Figure 4.28: PerCorrect results for CredOMQA using popularity for QN=211 ........... 235
Figure 4.29: PerCorrect results CredOMQA using impartiality for QN=211 ............... 238
Figure 4.30: PerCorrect results for CredOMQA using quality for QN=211 ................ 241
Figure 4.31: PerCorrect results for CredOMQA using all credibility categories for
QN=211 ......................................................................................................................... 245

xvii
LIST OF TABLES
Table 1.1: Possible consequences that affect users due to lack of credibility assessment 6
Table 2.1: Characterization of QA systems (Gupta & Gupta, 2012) .............................. 18
Table 2.2: Question type descriptions and examples (Kolomiyets & Moens, 2011; Wang,
2006) ............................................................................................................................... 20
Table 2.3: Methods and techniques identified for question analysis .............................. 24
Table 2.4: Methods and techniques identified for answer extraction ............................. 25
Table 2.5: Methods and techniques identified for answer scoring.................................. 27
Table 2.6: Methods and techniques identified for answer aggregation .......................... 28
Table 2.7: Comparison between students’ and non-students’ perceptions of credibility of
information sources (Metzger et al., 2003) ..................................................................... 46
Table 2.8: Categories and their description .................................................................... 60
Table 2.9: Factors mapped into categories for checklist approach ................................. 64
Table 2.10: Factors mapped into categories for cognitive approach .............................. 67
Table 2.11: Factors mapped into categories for prominence-interpretation of factors
approach .......................................................................................................................... 69
Table 2.12: Factors mapped into categories for contextual approach ............................. 71
Table 2.13: Factors mapped into categories for motivation-centred approach ............... 73
Table 2.14: Factors mapped into categories for social and heuristic approach .............. 75
Table 2.15: Factors mapped into categories for scaffolding tool approach .................... 78
Table 2.16: Factors mapped into categories for visual cues approach ............................ 80
Table 2.17: Factors mapped into categories for credibility seal programmes ................ 82
Table 2.18: Factors mapped into categories for credibility rating systems..................... 86
Table 2.19: Factors mapped into categories for digital signatures.................................. 88
Table 2.20: Factors mapped into categories for platform for Internet content selection 90
xviii
Table 2.21: Factors mapped into categories for collaborative filtering and peer review 93
Table 2.22: Factors mapped into categories for machine learning ................................. 95
Table 2.23: Factors mapped into categories for semantic Web ...................................... 96
Table 2.24: Credibility factors indentified for correctness, authority, currency and
professionalism credibility categories from Web-based QA systems and information
retreival systems ............................................................................................................ 103
Table 2.25: Credibility factors indentified for popularity, impartiality and quality
credibility categories from Web-based QA systems and information retreival systems
....................................................................................................................................... 104
Table 2.26: Resarch gap for credibility categories comprising credibility-based Web QA
systems and information systems .................................................................................. 106
Table 3.1: Web-based QA system and credibility-based systems selection criteria ..... 114
Table 3.2: Evaluation settings for Web-based QA systems methods and techniques .. 120
Table 3.3: Evaluation settings for OMQA, CredOMQA, and baseline systems Web-based
and credibility-based QA systems ................................................................................. 123
Table 3.4: Example dataset ........................................................................................... 127
Table 3.5: PerCorrect results for example dataset for QN=5 ........................................ 129
Table 3.6: MRR results for example dataset for QN=5 ................................................ 130
Table 3.7: T-test results for systems used in example dataset for QN=5 ...................... 132
Table 3.8: Currency category factors and conditions for scoring (Aggarwal et al., 2014b)
....................................................................................................................................... 143
Table 3.9: Professionalism category factors and conditions for scoring (Aggarwal et al.,
2014b; Alexa API, 2017; Mozscape API, 2017; SEOstats, 2017; Web of Trust API, 2017).
....................................................................................................................................... 145
Table 3.10: Popularity category factors and conditions for scoring (Aggarwal et al.,
2014b; Alexa API, 2017; Google, 2017; Mozscape API, 2017) ................................... 150
Table 3.11: Impartiality category factors and conditions for scoring (Aggarwal et al.,
2014b; Diffbot, 2016) ................................................................................................... 152
Table 3.12: Quality category factors and conditions for scoring (Microsoft Word, 2016;
Wu & Marian, 2011) ..................................................................................................... 154
xix
Table 3.13: Prominence calculation examples .............................................................. 161
Table 4.1: PerCorrect and MRR comparison of content resource with K=5, 10, or 20; N=3
for techniques of Web pages and snippets from QN=211 ............................................ 168
Table 4.2: PerCorrect and MRR comparison of information from the external resource
methods with K=20, N=3 for no techniques, WordNet keywords, and Google keywords
for QN=211 ................................................................................................................... 174
Table 4.3: PerCorrect and MRR comparison of NER method with K=20, N=3 for the
StanfordNER and AlchemyNER techniques and their combination for QN=211 ........ 178
Table 4.4: PerCorrect and MRR comparison of removal and non-removal of unwanted
answers K=20, N=3 for QN=211................................................................................... 183
Table 4.5: PerCorrect and MRR comparison of sentence matching algorithm methods
with K=20, N=3 for techniques keywords and regex for QN=211 ............................... 188
Table 4.6: PerCorrect and MRR comparison of Top N sentences for N=1, N=3, or N=5
with K=20 for QN=211 ................................................................................................. 194
Table 4.7: PerCorrect and MRR comparison of scoring methods with K=20, N=5 for
techniques frequency, scoring answers, prominence, and prominence and match-score for
QN=211 ......................................................................................................................... 197
Table 4.8: PerCorrect and MRR comparison of the answer aggregation methods with
K=20 and N=5 for dice coefficient, cosine similarity, and combination techniques for
QN=211 ......................................................................................................................... 202
Table 4.9: Evaluation results summary for Web-based QA systems methods and
techniques ...................................................................................................................... 208
Table 4.10: OMQA system vs baselines on TREC dataset for QN=211 ...................... 212
Table 4.11: OMQA system vs baselines on CLEF dataset for QN=21 ......................... 216
Table 4.12: MRR results for CredOMQA system using credibility categories for different
values of α for QN=211 ................................................................................................. 219
Table 4.13: PerCorrect and MRR results for CredOMQA using correctness for QN=211
....................................................................................................................................... 222
Table 4.14: PerCorrect and MRR results for CredOMQA using authority for QN=211
....................................................................................................................................... 225
Table 4.15: PerCorrect and MRR results for CredOMQA using currency for QN=211
....................................................................................................................................... 228
xx
Table 4.16: PerCorrect and MRR results CredOMQA using professionalism for QN=211
....................................................................................................................................... 233
Table 4.17: PerCorrect and MRR results CredOMQA using popularity for QN=211 . 236
Table 4.18: PerCorrect and MRR results for CredOMQA using impartiality for QN=211
....................................................................................................................................... 239
Table 4.19: PerCorrect and MRR results for CredOMQA using quality for QN=211 242
Table 4.20: PerCorrect and MRR results CredOMQA using all credibility categories for
QN=211 ......................................................................................................................... 244
xxi
LIST OF SYMBOLS AND ABBREVIATIONS
API : Application Programming Interface
OMQA : Optimal Methods Question Answering
CredOMQA : Credibility-based Optimal Methods Question Answering
CSCL : Computer-Supported Collaborative Learning
IE : Information Extraction
IR : Information Retrieval
MRR : Mean Reciprocal Rank
NLP : Natural Language Processing
POS Parts-Of-Speech
PerCorrect : Percentage of queries Correctly answered
QA : Question Answering
SEO : Search Engine Optimization
SNS : Social Networking Services
SWoRD : Scaffolded Writing and Rewriting in the Discipline
TF-IDF : Term Frequency Inverse Document Frequency
TREC : Text Retrieval Conference
WoT : Web of Trust

1
CHAPTER 1: INTRODUCTION
Question answering (QA) is a sophisticated form of information retrieval (IR) system
characterized by information needs, where the information is partially expressed in
natural language statements or questions (Hirschman & Gaizauskas, 2001). This makes
it one of the most natural ways for humans to communicate with computers. Since QA
systems involve natural language communication between computers and users, it has
been the center of interest for natural language processing (NLP), IR and machine
learning communities (McCallum, 2005). Requirements in QA are quite complex as
compared with IR, because in IR complete documents are considered relevant to user’s
query, whereas in QA, only specific portions of information within the documents are
returned as answers. A user in QA system is only interested in concise, comprehensible
and correct answer, which may be in the form of an image, video, text, etc. (Gupta &
Gupta, 2012; Kolomiyets & Moens, 2011).
Work on QA was initiated decades ago, with research ranging from natural language
processing to data access or knowledge bases. These technologies are undergoing a
process of resurgence, primarily due to popularity of Web which provides publicly
available multimedia data (Kolomiyets & Moens, 2011). The growing power of querying
in the context of multimedia data such as images, video, text or audio, with natural
language expressions, and drawing conclusions from relevant content in text or any other
media is gaining importance day by day.
Web has grown into one of the largest information repositories, making it the primary
source of information for most users. It also has become a familiar way of acquiring and
sharing information that also allows users to contribute and express themselves (Ward,
2006). CISCO (2016) Visual Networking Index Report suggests that, by 2017, there will
be about 3.6 billion Internet users, i.e., more than 48% of the world’s projected population
2
(7.6 billion). Continuous growth and popularity of Web is a result of its ease of access
and low publication cost. Before the advent of the Web, the cost of information
production was high and its distribution was limited, thus only people and institutions
with authority or funds could benefit from them (Flanagin & Metzger, 2008). This is not
the case in digital environment where content can be published on the Internet easily by
any author without any restriction (Johnson & Kaye, 2000; Rieh & Danielson, 2007;
Subramaniam et al., 2015). Now users can publish individual or collective knowledge
that may involve experienced or inexperienced novices (Castillo, Mendoza, & Poblete,
2011; Morris, Counts, Roseway, Hoff, & Schwarz, 2012).
In order to find information on the Web, users increasingly rely on search engines to
find desired information making it one of the most used services on the Internet today
(Purcell, 2011). According to ComScore (2016) Search Engine Ranking Report of
February 2016, users conducted 16.8 billion explicit core searches with Google sites,
ranking first with 10.8 billion occupying 63.8% of explicit core searches. User requests
information, expressed in the form of queries, were related to research, shopping and
entertainment (Markham, 1998). Current search engines return a long list of potentially
relevant documents without pinpointing the desired result. Thus in order to find answers,
users select documents which seems more reliable based on their own assessment
(Lankes, 2008; Westerwick, 2013).
The popularity of the Web has given rise to Web-based QA systems, which take
advantage of data available over the Web and use it as information source for extraction
of answers. Web-based search engines use search engines like Google, Yahoo, Bing, etc.,
to fetch relevant Web pages that potentially contain answer to the question asked (Gupta
& Gupta, 2012). They are effective in providing concise answers to the questions asked,
saving users the trouble of going through each search result.
3
Motivation
Though information available over the Web is substantial, yet it is often unreliable (Fogg
et al., 2001b; Nakamura et al., 2007; Popat, Mukherjee, Strötgen, & Weikum, 2017;
Tanaka et al., 2010a; Wu & Marian, 2011). Several studies claim that 20% of the Web
pages on the internet are fake, spreading misinformation among Web users (Abbasi &
Hsinchun, 2009; Abbasi, Zhang, Zimbra, Chen, & Nunamaker Jr, 2010; Aggarwal, Van
Oostendorp, Reddy, & Indurkhya, 2014b; Chatterjee & Agarwal, 2016; Gyongi & Garcia-
Molina, 2005; Popat et al., 2017). Fraud and deception is quite common in electronic
market, affecting thousands of Web users every day (Abdallah, Maarof, & Zainal, 2016;
Chua & Wareham, 2004; Gavish & Tucci, 2008). According to studies conducted by
World Health Organization, thousands of deaths have been attributed to fake medical
Web sites, while the number of people visiting such sites continues to rise each day
(Abbasi, Fatemeh, Mariam, Zahedi, & Kaza, 2012; Easton, 2007); needless to say that
trust and security is extremely important for such Websites, (Abbasi et al., 2012; Song &
Zahedi, 2007).
Users take search engines for granted, which often provide them the information they
need, but the truth of the matter is that they are only point information, without verifying
the credibility or correctness of the source (Sullivan, 2002; Wu & Marian, 2011). Instead,
search results are ranked on the basis of factors like advertising and search engine
optimization (SEO) (Lohr, 2006; Tanaka, 2010). Though search engines identify the
answers from Web sources, yet they lack credibility because they contain erroneous,
misleading, biased and outdated information (Olteanu, Peshterliev, Liu, & Aberer, 2013a;
Wu & Marian, 2011). This adversely affects the reliability of Web-based QA systems,
which rely on search engines for answer extraction.
4
Unfortunately, most users consider results returned by search engines and content
available on the Web as credible (Go, You, Jung, & Shim, 2016; Kakol, Nielek, &
Wierzbicki, 2017; Lu, Yu, & Chen, 2017; Yamamoto & Shimada, 2016). According to
one survey, two-thirds of the American population consider search engine result as “fair
and un-biased” (Fallows, 2005). In the absence of search result credibility scores, it can
be very difficult for a person to verify the correctness of information given without any
prior knowledge (Giles, 2005; Miller, 2005). The same principle is true for computers,
which require semantic data in order to understand the content given (Allemang &
Hendler, 2011; Berners-Lee, Hendler, & Lassila, 2001; Weare & Lin, 2000).
Credibility of news on the internet is also a major concern as social media, blogs and
Websites are being to spread false news and rumours (Aggarwal et al., 2014b; Allcott &
Gentzkow, 2017; Popat et al., 2017). This has been observed during major events
including the 2010 earthquake in Chile (Mendoza, Poblete, & Castillo, 2010), the
Hurricane Sandy in 2012 (Gupta, Lamba, Kumaraguru, & Joshi, 2013b) and the Boston
Marathon blast in 2013 (Gupta, Lamba, & Kumaraguru, 2013a). Fake news or rumours
spread quickly on social media platforms like Facebook and Twitter, which can affect
thousands of people (Sela, Milo-Cohen, Ben-Gal, & Kagan, 2017). Thus, evaluating
credibility of information provided by Websites, social media platforms, and blogs is of
utmost importance (Aggarwal et al., 2014b; Chatterjee & Agarwal, 2016; Gupta,
Kumaraguru, Castillo, & Meier, 2014; Popat et al., 2017).
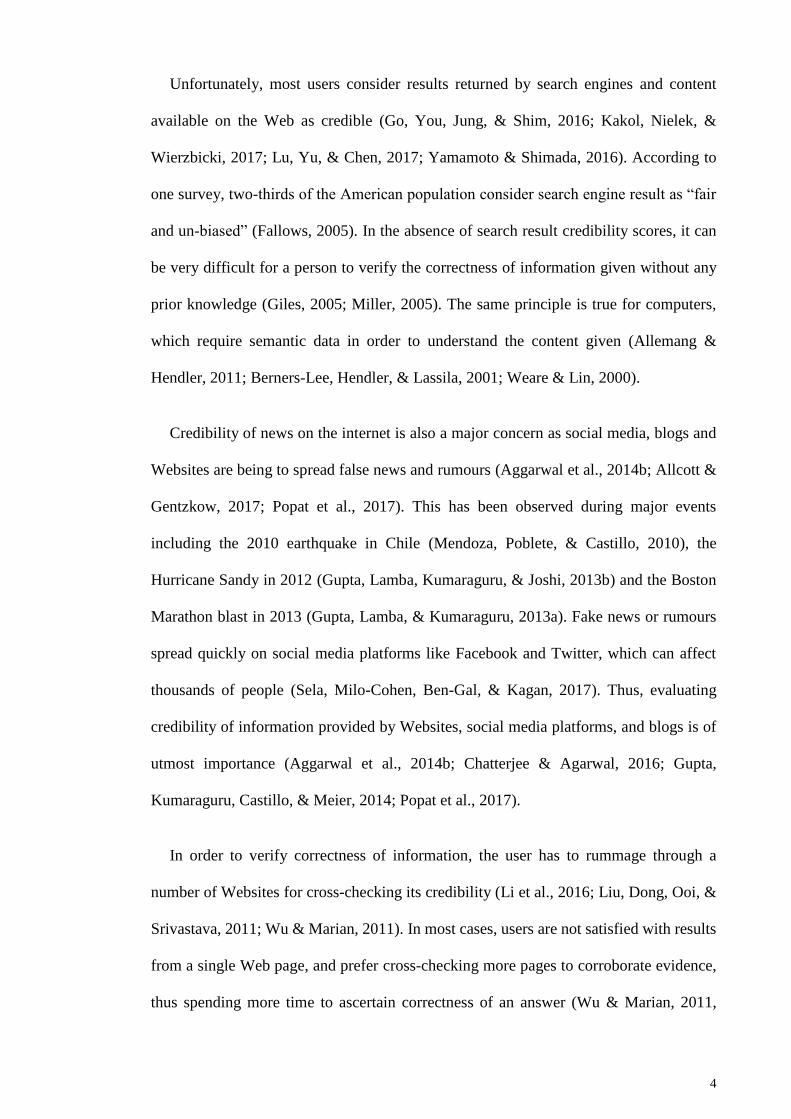
In order to verify correctness of information, the user has to rummage through a
number of Websites for cross-checking its credibility (Li et al., 2016; Liu, Dong, Ooi, &
Srivastava, 2011; Wu & Marian, 2011). In most cases, users are not satisfied with results
from a single Web page, and prefer cross-checking more pages to corroborate evidence,
thus spending more time to ascertain correctness of an answer (Wu & Marian, 2011,
5
2014). To illustrate this problem consider Figure 1.1 showing a list of search results for
the query “first orbited the Earth”, where each result shows a different answer. The correct
answer, Yuri Gagarin, does not appear in the first result. Additionally, there are several
pages which do not contain any answer at all.
Figure 1.1: Results for the query ‘‘first orbited the earth’’ using MSN search
(Wu & Marian, 2011)
A naive solution to solving this problem would be to aggregate answers found on
multiple Websites, which may help in eliminating typos and help in promoting the
frequent answer. However, this solution fails to consider the fact that answers extracted
from different Web pages are not equal, as some Web pages are more credible than others
(Wu & Marian, 2011). Scammers or spammers take advantage of such systems, which
6
rely on redundancy of answers for verification, by creating multiple copies of Web pages
having incorrect answer, thus jeopardizing the outcome (Wu & Marian, 2011). Therefore,
there is a need to rate Web pages based on their credibility and rank the answers
accordingly.
Most Web users are neither capable of performing credibility assessment nor do they
wish to undertake this exercise due to time constraint, motivation and convenience (Amin,
Zhang, Cramer, Hardman, & Evers, 2009; Amsbary & Powell, 2003; Metzger, Flanagin,
& Zwarun, 2003; Walraven, Brand-Gruwel, & Boshuizen, 2009). Without the support of
credibility assessment naïve Web users, such as schoolchildren, can be misled easily with
non-credible content, which is why educators consider it a topic of utmost importance
and term it as one of the major “new media literacies” for students, and regards credibility
assessment “the ability to evaluate the reliability and credibility of different information
sources” being an essential part of the process (Jenkins, Purushotma, Weigel, Clinton, &
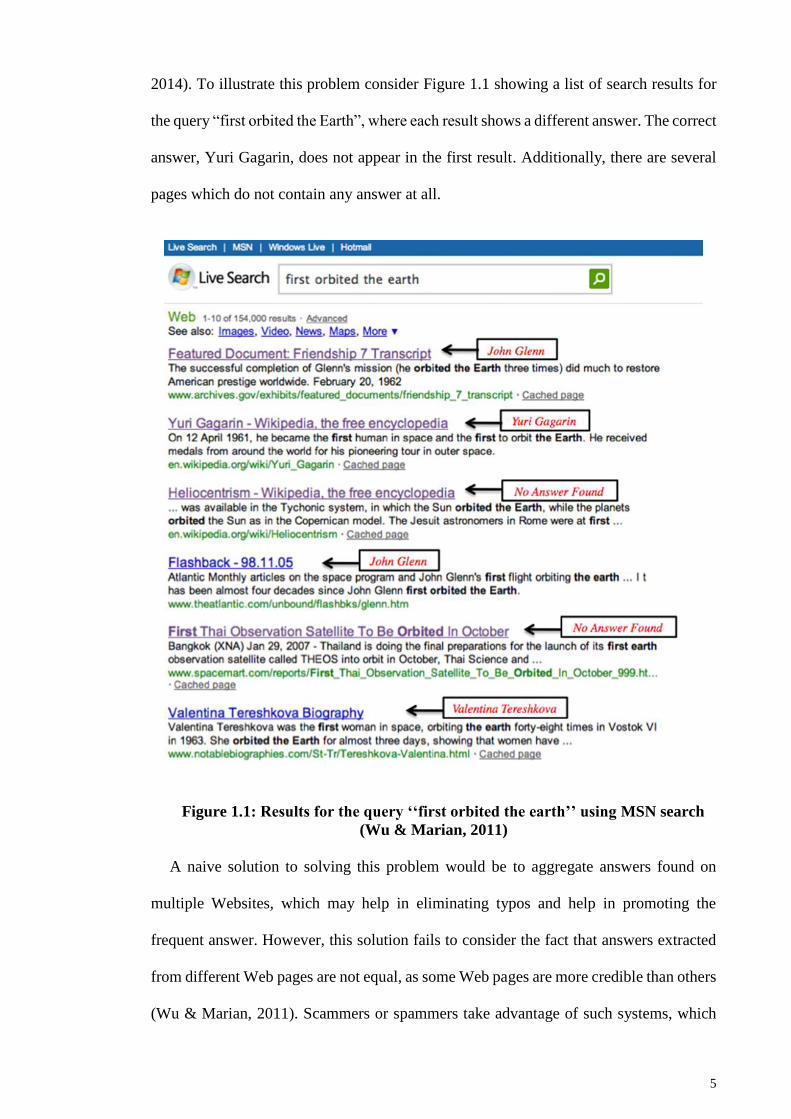
Robison, 2009; Metzger et al., 2003). Table 1.1 lists different scenarios, indicating how
lack of credibility assessment can cause inconvenience and some cases severe
consequences to users.
Table 1.1: Possible consequences that affect users due to lack of credibility
assessment
No. User Scenario Consequences
1. Ill
person
The user is ill and decides to seek medical
advice via the Web. The user does not
check the credibility of the Website and
follows the diagnosis mentioned.
Following the wrong
diagnosis may worsen
the condition or require
serious medical attention.
2. Media
analyst
The user is searching for news material on
an upcoming smart phone. This user will
be required to differentiate between
rumours and facts posted on different
Websites.
The user may take
content from a website
which has posted
rumours only and has not
provided any sources.
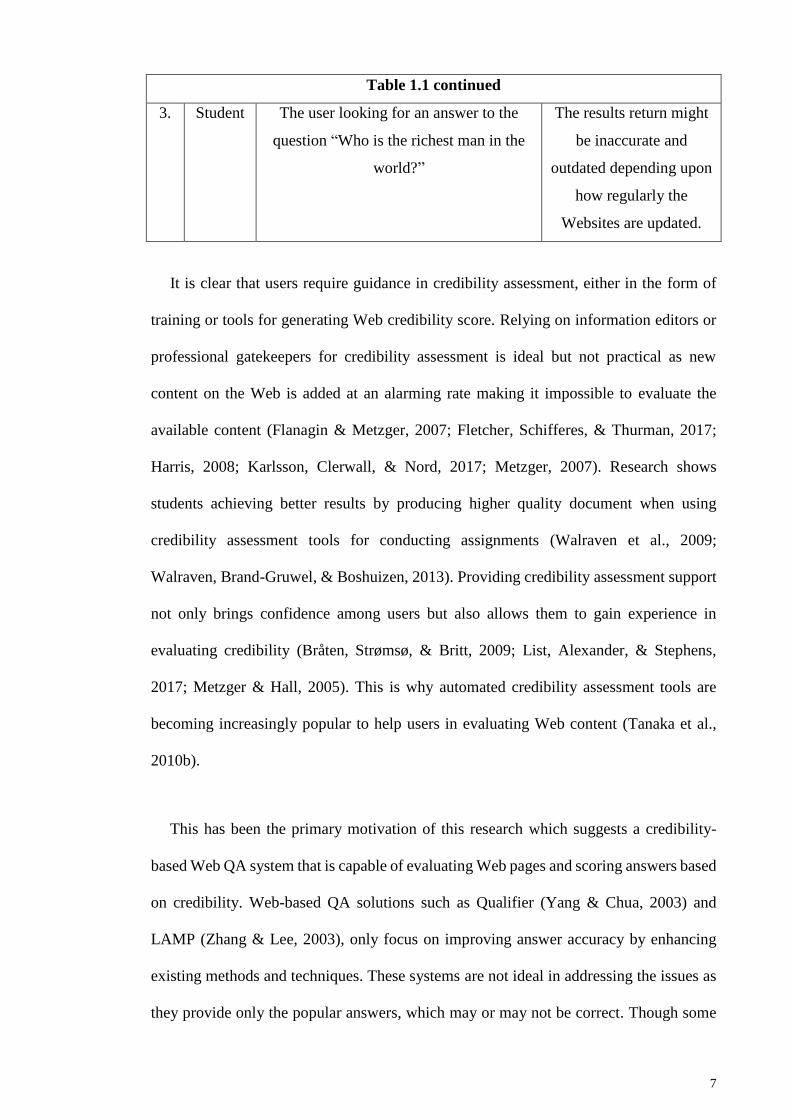
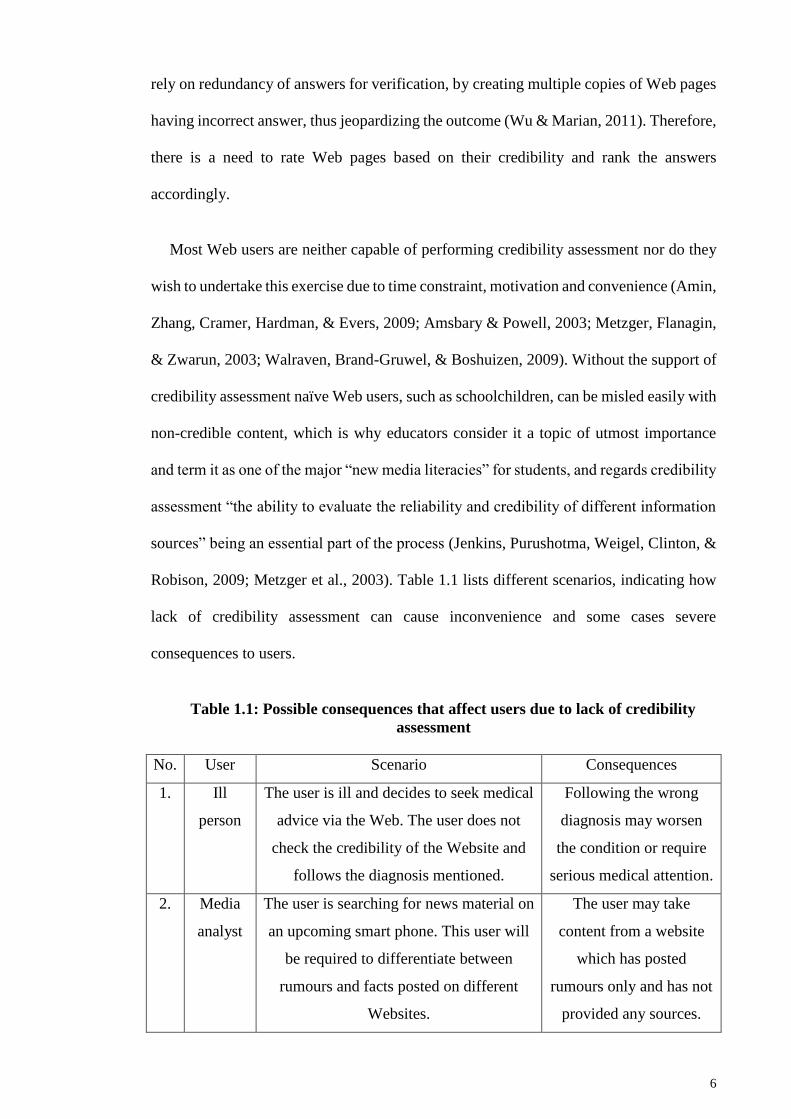
7
Table 1.1 continued
3. Student The user looking for an answer to the
question “Who is the richest man in the
world?”
The results return might
be inaccurate and
outdated depending upon
how regularly the
Websites are updated.
It is clear that users require guidance in credibility assessment, either in the form of
training or tools for generating Web credibility score. Relying on information editors or
professional gatekeepers for credibility assessment is ideal but not practical as new
content on the Web is added at an alarming rate making it impossible to evaluate the
available content (Flanagin & Metzger, 2007; Fletcher, Schifferes, & Thurman, 2017;
Harris, 2008; Karlsson, Clerwall, & Nord, 2017; Metzger, 2007). Research shows
students achieving better results by producing higher quality document when using
credibility assessment tools for conducting assignments (Walraven et al., 2009;
Walraven, Brand-Gruwel, & Boshuizen, 2013). Providing credibility assessment support
not only brings confidence among users but also allows them to gain experience in
evaluating credibility (Bråten, Strømsø, & Britt, 2009; List, Alexander, & Stephens,
2017; Metzger & Hall, 2005). This is why automated credibility assessment tools are
becoming increasingly popular to help users in evaluating Web content (Tanaka et al.,
2010b).
This has been the primary motivation of this research which suggests a credibility-
based Web QA system that is capable of evaluating Web pages and scoring answers based
on credibility. Web-based QA solutions such as Qualifier (Yang & Chua, 2003) and
LAMP (Zhang & Lee, 2003), only focus on improving answer accuracy by enhancing
existing methods and techniques. These systems are not ideal in addressing the issues as
they provide only the popular answers, which may or may not be correct. Though some
8
Web-based systems, like Corrob and Watson, do include some credibility factors for
evaluating Web sources, yet their systems do not include a dedicated credibility
assessment module (Ferrucci et al., 2010; Wu & Marian, 2011). There are two major
reasons behind the limitations of Web-based QA systems including 1) use of less optimal
methods and techniques, and 2) not considering credibility of sources (Oh, Yoon, & Kim,
2013; Wu & Marian, 2011). These limitations affect Web-QA systems in a negative way
by lowering accuracy of answers generated (Oh et al., 2013; Wu & Marian, 2011). The
limitations in methods and techniques, and credibility assessment in Web-based QA
systems is discussed briefly in Section 1.1.1 and 1.1.2.
1.1.1 Web-based QA systems methods and techniques
QA systems go through a series of steps in order to prepare the answer for the question
queried. A typical QA system goes through four modules including question analysis,
answer extraction, answer scoring and answer aggregation in order to prepare the answer
to the question given, which are discussed in greater detail in literature review (Bouziane,
Bouchiha, Doumi, & Malki, 2015; Gupta & Gupta, 2012). These kinds of systems consist
of several methods in order to make this possible, each achieving a certain objective. With
respect to QA systems, the term “method” refers to “an interesting or important part,
quality and ability,” whereas, “technique” refers to “a way of doing something” (Allam
& Haggag, 2012; Bouziane et al., 2015; Kolomiyets & Moens, 2011). The “method”
identifies one of the steps taken in order to accomplish a goal, while “technique” is the
algorithm chosen for accomplishing it (Allam & Haggag, 2012; Bouziane et al., 2015;
Kolomiyets & Moens, 2011). For example, string matching is a method of QA systems
and its goal to merge two strings, which can be accomplished by using the cosine
similarity or dice coefficient techniques (Wu & Marian, 2011). The “accuracy” shows
capability of the system in returning correct answer to the question asked (Wu & Marian,
2011).
9
There has been substantial research on Web-based QA systems, and researchers have
provided novel techniques for providing answers to the questions queried in different
stages (Allam & Haggag, 2012; Bouziane et al., 2015; Gupta & Gupta, 2012; Kolomiyets
& Moens, 2011; Srba & Bielikova, 2016; Wang et al., 2017). However, the material on
method comparison with respect to answer accuracy is very limited. Research on
comparison of methods and techniques will save researchers time in selecting the optimal
option available without investing their time and effort in evaluating them.
When developing a QA system one tends to ask which set of methods should one
choose from the rest. Generally it falls to the platform on which the QA system is being
developed and therefore only the methods that are available are chosen. On the other
hand, when having multiple options to choose from, it can become quite difficult to select
one over the other (Bouziane et al., 2015; Wu & Marian, 2011). Therefore, it is necessary
to evaluate the methods and techniques available and select the ones performing better
than others in order to produce optimal answer accuracy.
1.1.2 Credibility assessment
Credibility is defined as “the quality or power of inspiring belief”, representing a
characteristic of a resource that highlights its expertise and trustworthiness (Fogg &
Tseng, 1999a; Merriam-Webster Inc, 2003). When it comes to credible Web pages, it
means that the Web page is trustworthy and the content provided it is of high quality and
accurate. Schwarz and Morris (2011a) define a credible Web page as one “whose
information one can accept as the truth without needing to look elsewhere. If one can
accept information on a page as true at face value, then the page is credible; if one needs
to go elsewhere to check the validity of the information on the page, then it is less
credible”. Credibility of a resource can be judged using credibility factors and credibility
categories they belong to.
10
Credibility factors are the characteristics of a resource like content updated date, author
details, content quality, etc. that are used to determine whether the resource is credible or
not (Aggarwal et al., 2014b; Lu et al., 2017; Schwarz & Morris, 2011b). However, one
cannot create a well-balanced credibility score by simply including a number of
credibility factors. Instead, the factors should cover various aspects that define credibility,
also called as credibility categories, as high credible site should achieve good scores in
all credibility categories. A credibility category is an aspect of credibility such as
trustworthiness, expertise, correctness, quality, etc., which contributes towards credibility
following a certain theme determined by credibility factors relevant to it (Flanagin &
Metzger, 2007; Fogg & Tseng, 1999a; Yamamoto & Tanaka, 2011a).
These credibility categories and their respective factors are essential in credibility
assessment. In the case a user wants to find about the world’s tallest man, he should only
look into sources having the most updated content. Similarly, if the users wants to find
answer to controversial topics such as whether Pluto is a planet, he should follow the
verdict given by an authorized organization such as International Astronomical Union
(Rincon, 2016).
By measuring credibility of a Web page, computer systems can determine whether the
information provided is correct based on its credibility rating. A Web page earning a
higher credibility score should be trusted more, and the answers found on it should
accordingly be rated higher. This research endeavor to look into appropriate credibility
categories for scoring Web pages, and credibility factors under each category to score
them. This requires identification of credibility factors from literature and mapping onto
credibility categories.
11
Research questions
The answers produced by Web-based QA systems are doubtful because they may have
been extracted from Web pages containing fake answers. There are two key problems in
the current Web-QA systems including 1) Web-based QA systems using methods and
techniques producing lower accuracy of answers retrieved than others (as highlighted in
section 1.1.1 and section 2.1), and 2) Web-based QA systems lacking a credibility
assessment module to allow it evaluate credibility of Web pages (as highlighted in section
1.1.2, section 2.2 and section 2.3).
Based on the problems highlighted above, this research aims at improving answer
accuracy in Web-based QA, taking into account credibility of the Web pages, from which
answers are taken from.
Based on the motivation of this research, several research questions are required to be
answered, in order to determine the methodology that may guide all stages of inquiry,
analysis, and reporting. Therefore, this research aims to explore the following research
questions:
RQ 1) How can credibility of Web pages be measured using credibility factors?
RQ 2) What combination(s) of methods and techniques, and credibility
categories improve answer accuracy?
RQ 3) Does considering credibility in answer scoring help in increasing its
answer accuracy?
Research objectives
Research objectives allows the research to list the steps needed to be taken in order to
find answers to the research questions proposed. Several steps are taken to answer the
research questions posed by this research. Two areas are focused to improve answer
12
accuracy in Web-based QA systems: selection of optimal methods and techniques, and
development of credibility assessment module for ranking answers. A prototype Web-
based QA system has been developed to evaluate answer accuracy of methods and
techniques (that addresses problem highlighted in section 1.1.1), and to monitor the
impact of Web sources credibility on answer accuracy (that addresses problem
highlighted in section 1.1.2). The main objectives are given below
RO1. To design an algorithm for measuring credibility of Web pages (for RQ1)
RO2. To design and develop an enhanced Web-based QA system with
credibility assessment (for RQ2)
RO3. To evaluate the impact of credibility assessment on accuracy of the answer
by means of evaluation and comparison (for RQ3)
Contributions
The contribution of this research are as follows:
Optimal Methods for Question Answering (OMQA) system: Many methods and
techniques are available in Web-based QA systems making it difficult for
researchers/experts to choose one over the other. This research provides
comparative evaluation of these methods and techniques to highlight ones
performing better than others. Moreover, it offers in-depth analysis, giving
reasoning behind methods and techniques improved or decreased performing,
along with ways to rectify the issue. This research also developed a Web-based
QA system using the optimal combination of methods and techniques available,
calling it OMQA system.
Credibility Assessment Algorithm: This research defines credibility categories,
including correctness, authority, currency, professionalism, popularity,
impartiality and quality, onto which credibility factors can be mapped upon. Each
13
of these categories contributes towards credibility of the information source.
Moreover, credibility factors from information systems and other areas literature
are identified and mapped onto credibility categories for researchers’
convenience, which may be used for conducting credibility assessment.
Credibility-based Optimal Methods for Question Answering (CredOMQA)
system: This research has developed a credibility assessment module that rates a
Web page based on its credibility, and uses this score to rank answers. The module
uses a number of credibility factors, relevant to Web pages, for scoring credibility
categories to generate a well-balanced credibility score. The research also
provides extensive evaluations results, conducted on Text Retrieval Conference
(TREC) dataset, showing the impact of credibility score on answer accuracy and
its effectiveness in achieving better results in comparison to other Web-based QA
systems. This research added the credibility assessment module to OMQA, calling
it CredOMQA system, enhancing accuracy of the system further.
Overview of research
Figure 1.2 shows the topics covered in this thesis and their relationships.
Figure 1.2 An Overview of the topics covered in this thesis
The figure lists the different topics covered by this research along with the chapters
number and the flow in which they are covered. The research is focused towards
improving answer accuracy in Web-based QA systems. For achieving this the question
posed by the user needs to be addressed by a credibility-based Web QA system. For this,
14
the research covered literature on Web-based QA systems (section 2.1). In order to
improve accuracy of answers the research covered methods and techniques used in Web-
based QA systems (section 2.1) and defining a credibility assessment module (section 2.2
and section 2.3). Under Web-based QA systems methods and techniques, the research
reviewed existing Web-based QA systems methods and techniques (section 2.1.4),
defined evaluation criteria for evaluating them (section 3.3.3.3), generated results (section
4.1) and analyzed them (section 4.1.9). This allowed the research to develop a system
called OMQA system, which uses optimal combination of methods and techniques in
Web-based QA system that improve accuracy of answers. For introducing a credibility
assessment module to OMQA system, the research covered literature on credibility
(section 2.2), including its categories (section 2.2.3) and factors (section 2.2.4).
Moreover, the research reviewed existing Web-based QA, credibility-based Web QA
systems and credibility-based information systems, making use of credibility assessment
(section 2.3). Based on the credibility categories and factors identified for evaluating
credibility of a source, credibility categories scores (section 3.3.6) have been used to
generate an overall credibility score of a Web page (section 3.3.7.8), which allows the
system to judge the credibility of a source and generate a credibility-based answer score
(section 3.3.8.4). This module is added to the OMQA system in order to form a
CredOMQA system, and then evaluated based on the evaluation settings (section 3.3.3.4)
and the evaluation metrics defined for evaluating accuracy of answers (section 3.3.3.5).
At the end, results for CredOMQA system are generated (section 4.3) and analyzed them
(section 4.3.10) to determine their impact on answer accuracy.
15
Structure of the thesis
This thesis is structured into the following chapters
Chapter 2: Literature Review
It provides literature on QA systems, and credibility assessment. The literature
on QA systems includes introduction to QA systems, system types,
characterization, Web-based QA system model, and Web-based QA systems
methods and techniques. Literature on credibility assessment provides its
definition, users perceptions on credibility, categories that define credibility,
credibility factors used in information systems and credibility assessment in
Web-based QA systems. Research gap is also provided to highlight areas where
existing credibility-based Web QA systems can be improved.
Chapter 3: Research Methodology
It discusses research flow and methodology for research. The research flow
outlines the process involved in achieving the research objectives and
methodology covers the approach used for the research and defined criteria
for conducting it. This chapter also discusses experimental design and the
steps taken for evaluation. This includes data collection, data cleaning,
experiment settings, process for generating top ranks answers, formulae and
algorithms used for credibility assessment module, formulae for scoring
answers, format for storing answers, and process for generating results for
evaluation metrics.
Chapter 4: Results and discussion
The first part of the chapter shows findings from the tests conducted, which
includes evaluation results of methods and techniques used in Web-based QA
systems, and impact of credibility assessment on answer accuracy. This
16
research also compares system’s result against other Web-based QA and
credibility-based Web QA systems.
The second part of the chapter discusses the findings and analysis made from
results shown in CHAPTER 4:. It includes drawing conclusions from answer
accuracy results for Web-based QA systems methods and techniques, OMQA
against other Web-based QA systems, impact of credibility assessment on
OMQA system, and effectiveness of CredOMQA over other Web-based and
credibility-based Web QA systems.
CHAPTER 5: Conclusion
It summarizes the findings made by this research. It also includes limitations
faced during the research and possible future directions.
17
CHAPTER 2: LITERATURE REVIEW
This chapter reviews the background and current work in the area of Web-based QA
systems and credibility assessment tools used in IR systems and Web-based QA systems.
The chapter is divided into three main sub-sections including Web-based QA systems,
credibility assessment, and credibility assessment in Web-based QA systems. The first
sub-section covers Web-based QA systems, their brief overview, types and
characterization, comparison of Web-based systems with state-of-the-art systems, Web-
based QA model and methods and techniques found under such systems. The second sub-
section encompasses credibility assessment, which covers credibility definition, user’s
perception, credibility categories and credibility evaluation techniques. The third sub-
section discusses literature on Web-based QA systems and IR systems making use of
credibility assessment and the factors used by them.
Web-based QA systems
In this sub-section, Web-based QA systems, their brief overview, types and
characterization, comparison of Web-based systems with state-of-the-art systems, Web-
based QA model and methods and techniques found under such systems are discussed.
2.1.1 QA systems types and characterization
Though all QA systems are capable of generating answers for questions asked in natural
language, yet they are divided into different types based on characteristics used by the
system. These characteristics include question and answer types it can address,
complexity of methods and techniques used, type of information source used, domain
addressed, and type of response generated.
QA systems are divided into two main groups with respect to type of methods and
techniques used by them (Gupta & Gupta, 2012). The first group called “QA systems

18
based on NLP and IR”, makes use of simple NLP and IR methods, while the second group
called “QA systems reasoning with NLP” makes use of complex machine learning. NLP
reasoners and semantic-based methods QA systems use a combination of NLP and IR
methods to generate answer for the question asked (Gupta & Gupta, 2012). NLP
components are used to allow the system to understand the question asked in natural
language and generate appropriate response (Kolomiyets & Moens, 2011). IR
components utilize resources, such as entity tagging, template element, template relation,
correlated element and general element, to be able to fetch the correct and relevant
information from the fetched documents (Kolomiyets & Moens, 2011). As QA is a
complex process, the complexity of techniques used by the NLP and IR components can
range from simple techniques (like NER and keyword matching) to complex techniques
(like hypothesis generation, support evidence retrieval, machine learning solution, NLP
reasoners and semantic-based methods).
There are many kinds of QA systems, such as Web-based QA systems, IR and
information extraction-based (IE) QA systems, restricted domain answering system, and
rule-based QA system, but they are generalized under the two main groups stated above.
Table 2.1 shows characterization of these two QA system groups and examples of QA
systems belonging to them.
Table 2.1: Characterization of QA systems (Gupta & Gupta, 2012)
Dimensions QA system based on NLP and
IR
QA systems Reasoning with NLP
Technique Syntax processing, Named
Entity tagging, and IR
Semantic Analysis or high
reasoning
Data
Resource
Free text documents Knowledge Base
Domain Domain Independent Domain Oriented
Responses Extracted Snippets Synthesized Responses
19
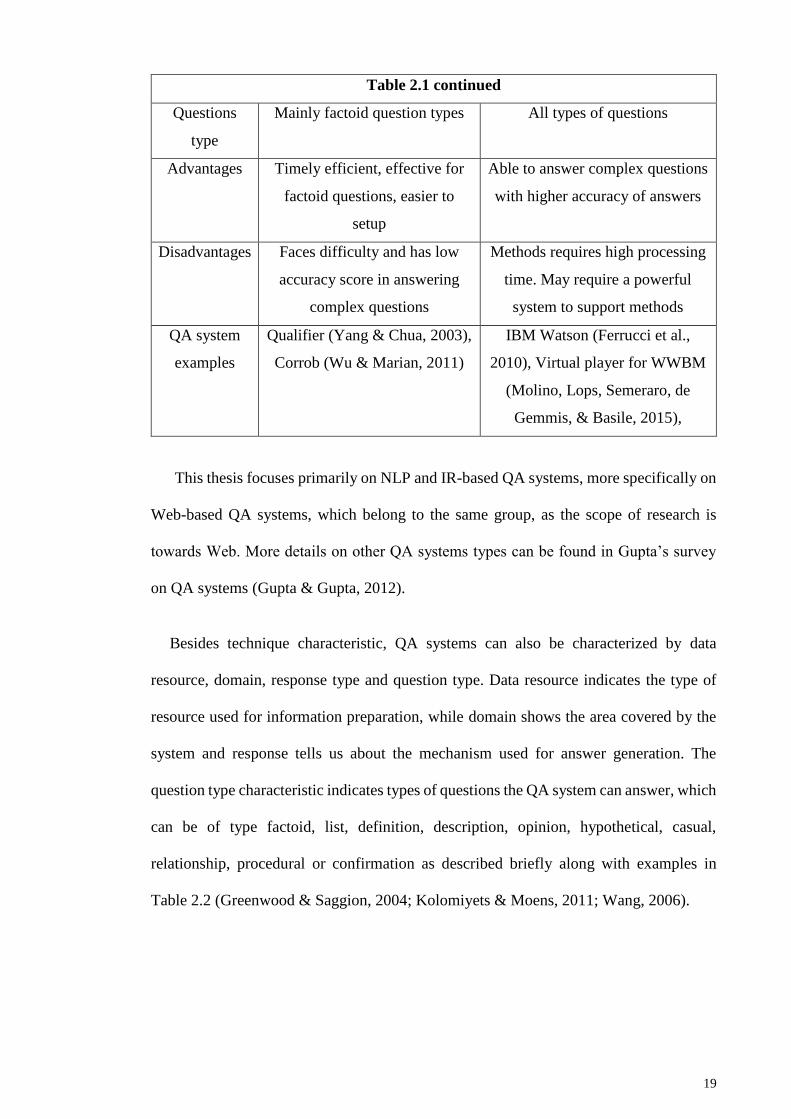
Table 2.1 continued
Questions
type
Mainly factoid question types All types of questions
Advantages Timely efficient, effective for
factoid questions, easier to
setup
Able to answer complex questions
with higher accuracy of answers
Disadvantages Faces difficulty and has low
accuracy score in answering
complex questions
Methods requires high processing
time. May require a powerful
system to support methods
QA system
examples
Qualifier (Yang & Chua, 2003),
Corrob (Wu & Marian, 2011)
IBM Watson (Ferrucci et al.,
2010), Virtual player for WWBM
(Molino, Lops, Semeraro, de
Gemmis, & Basile, 2015),
This thesis focuses primarily on NLP and IR-based QA systems, more specifically on
Web-based QA systems, which belong to the same group, as the scope of research is
towards Web. More details on other QA systems types can be found in Gupta’s survey
on QA systems (Gupta & Gupta, 2012).
Besides technique characteristic, QA systems can also be characterized by data
resource, domain, response type and question type. Data resource indicates the type of
resource used for information preparation, while domain shows the area covered by the
system and response tells us about the mechanism used for answer generation. The
question type characteristic indicates types of questions the QA system can answer, which
can be of type factoid, list, definition, description, opinion, hypothetical, casual,
relationship, procedural or confirmation as described briefly along with examples in
Table 2.2 (Greenwood & Saggion, 2004; Kolomiyets & Moens, 2011; Wang, 2006).
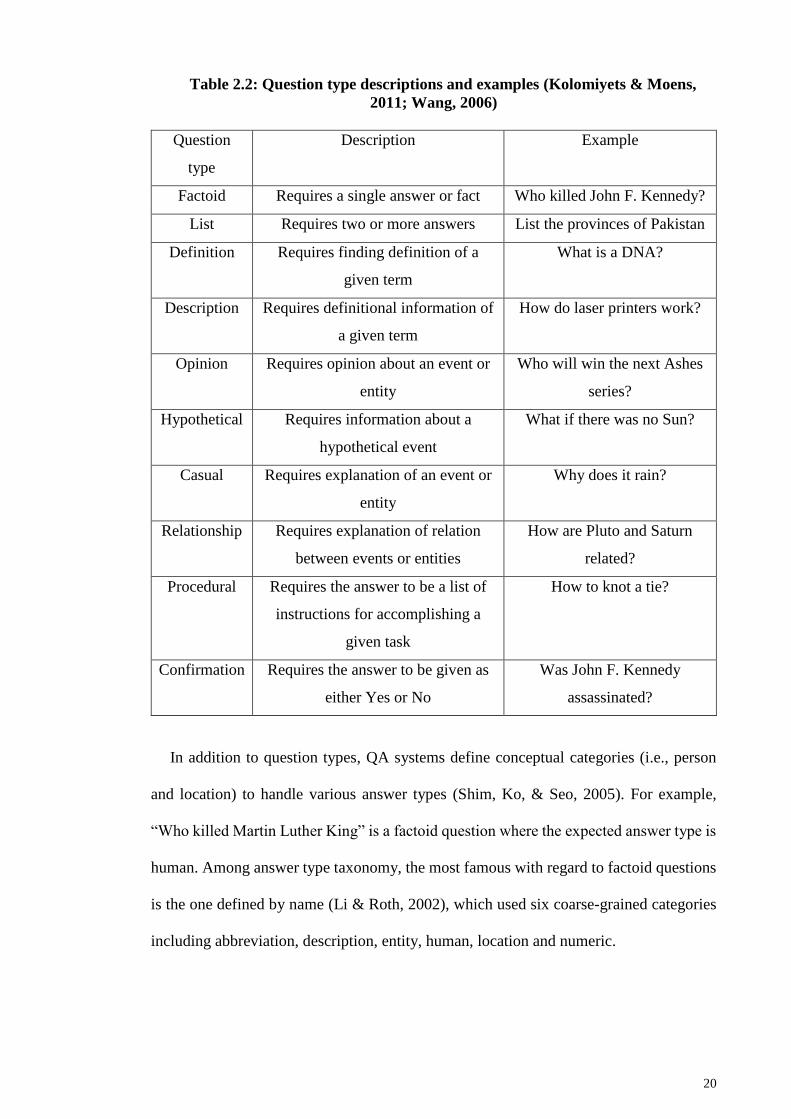
20
Table 2.2: Question type descriptions and examples (Kolomiyets & Moens,
2011; Wang, 2006)
Question
type
Description Example
Factoid Requires a single answer or fact Who killed John F. Kennedy?
List Requires two or more answers List the provinces of Pakistan
Definition Requires finding definition of a
given term
What is a DNA?
Description Requires definitional information of
a given term
How do laser printers work?
Opinion Requires opinion about an event or
entity
Who will win the next Ashes
series?
Hypothetical Requires information about a
hypothetical event
What if there was no Sun?
Casual Requires explanation of an event or
entity
Why does it rain?
Relationship Requires explanation of relation
between events or entities
How are Pluto and Saturn
related?
Procedural Requires the answer to be a list of
instructions for accomplishing a
given task
How to knot a tie?
Confirmation Requires the answer to be given as
either Yes or No
Was John F. Kennedy
assassinated?
In addition to question types, QA systems define conceptual categories (i.e., person
and location) to handle various answer types (Shim, Ko, & Seo, 2005). For example,
“Who killed Martin Luther King” is a factoid question where the expected answer type is
human. Among answer type taxonomy, the most famous with regard to factoid questions
is the one defined by name (Li & Roth, 2002), which used six coarse-grained categories
including abbreviation, description, entity, human, location and numeric.
21
The characterization of QA systems allowed this research to choose appropriate
resources for building and evaluating a Web-based QA system. This includes looking into
datasets containing factoid questions, literature on QA systems using NLP and IR based
techniques, and using Web as information source.
2.1.2 Web-based QA systems vs state-of-the-art QA systems
Several state-of-the-art systems (Abney, Collins, & Singhal, 2000; Chen, Diekema,
Taffet, McCracken, & Ozgencil, 2000; Harabagiu et al., 2000; Hovy, Gerber, Hermjakob,
Junk, & Lin, 2000; Hovy, Hermjakob, & Lin, 2001; Molino et al., 2015; Pasca &
Harabagiu, 2001; Prager, Chu-Carroll, Brown, & Czuba, 2006) have achieved high
accuracy results; IBM’s DeepQA project is a prime example (Ferrucci et al., 2010).
IBM’s Watson supercomputer, based on DeepQA project, beat two champions of the
Jeopardy! TV quiz (Molino et al., 2015). It also goes through the same four modules
including question analysis, answer extraction, answer scoring and answer aggregation
for answer preparation and uses several NLP, IR and machine learning techniques.
Though procedure is roughly the same, complexity of the techniques used are much
higher, which is why they belong to QA systems reasoning with NLP group. For
answering scoring alone, Watson employs more than 50 answer scoring techniques
ranging from formal probabilities to counts to categorical features (Ferrucci et al., 2010).
The virtual player for “Who wants to be a millionaire?” game is based on the same model,
which outperformed human players based on average accuracy in answering the questions
in the game correctly, playing it with their rules. Both of these systems are excellent for
achieving highest accuracy, especially when dealing with complex question types.
Web-based QA systems, such as Corrob and Qualifier systems, in comparison use
simple techniques such as Parts-Of-Speech(POS) tagger and NER, instead of including
complete natural language or machine learning system (Dumais, Banko, Brill, Lin, & Ng,
2002; Kwok, Etzioni, & Weld, 2001; Liu, Wang, Chen, Zhang, & Xiang, 2014; Oh, Ryu,

22
& Kim, 2012; Oh et al., 2013; Radev, Fan, Qi, Wu, & Grewal, 2005; Wu & Marian,
2007a, 2011; Yang & Chua, 2002, 2003; Zhang & Lee, 2003). This is because Web-based
QA systems are highly suitable for answering simple question types like factoid questions
and can achieve decent answer accuracy using simple NLP and IR based techniques only.
It is because of the reasons stated above the research focused on reviewing Web-based
QA systems, using simple NLP and IR based techniques. However, this research did
survey some of the recent and state-of-the-art semantic-based QA systems (Fader,
Zettlemoyer, & Etzioni, 2014; Ferrucci et al., 2010; Molino et al., 2015) which also make
use of simple NLP and IR based techniques.
2.1.3 Web-based QA system model
As stated in Section 2.1.1, Web-based QA systems belong to the group of QA systems
using NLP and IR-based techniques. One of the unique characteristic of Web-based QA
systems is the use of Web pages as data resource, usually provided using search engines
(Gupta & Gupta, 2012). These systems exploit redundancy of information available on
the Web for getting quick answers to simple factoid questions (Gupta & Gupta, 2012).
This thesis considered a number of Web-based QA systems, each using unique
combinations of methods and techniques. However, despite using different methods and
techniques, they follow the same model as shown in Figure 2.1, which is defined based
on comprehensive analysis of existing Web-based QA systems models and survey papers
(Gupta & Gupta, 2012; Kolomiyets & Moens, 2011; Ng & Kan, 2010; Wang, 2006; Wu
& Marian, 2011; Yang & Chua, 2003).

23
Figure 2.1: Web-based QA system model
Web-based QA systems go through a series of steps in order to prepare the answer for
the question asked in natural language form, comprising four major modules: 1) Question
analysis, 2) Answer extraction, 3) Answer Scoring and 4) Answer aggregation (Gupta &
Gupta, 2012; Hirschman & Gaizauskas, 2001; Ng & Kan, 2010; Wu & Marian, 2011;
Yang & Chua, 2003). The question asked by the user is forwarded by the system to
question analysis module and search engine. The question analysis module is responsible
for finding information from the question given and providing these details to the answer
extraction module. Search engines are used for providing Web pages for the question
asked, forwarding results to the answer extraction module. The Answer extraction module
uses a combination of methods and techniques for extracting answer from the Web pages,
using the information provided by question analysis module. The answers found are
ranked by answer scoring module and similar answers are merged by answer aggregation,
before returning ranked answer list to the user. These modules are discussed in detail in
the next sub-section.
2.1.4 Methods and techniques in Web-based QA systems
This thesis covers fourteen Web-based systems and techniques used in state-of-the art
systems, from 2001 to 2015, including Web-based QA systems like Corrob, Qualifier,
Watson, virtual player for “Who wants to be a millionaire”, LAMP and GenreQA QA
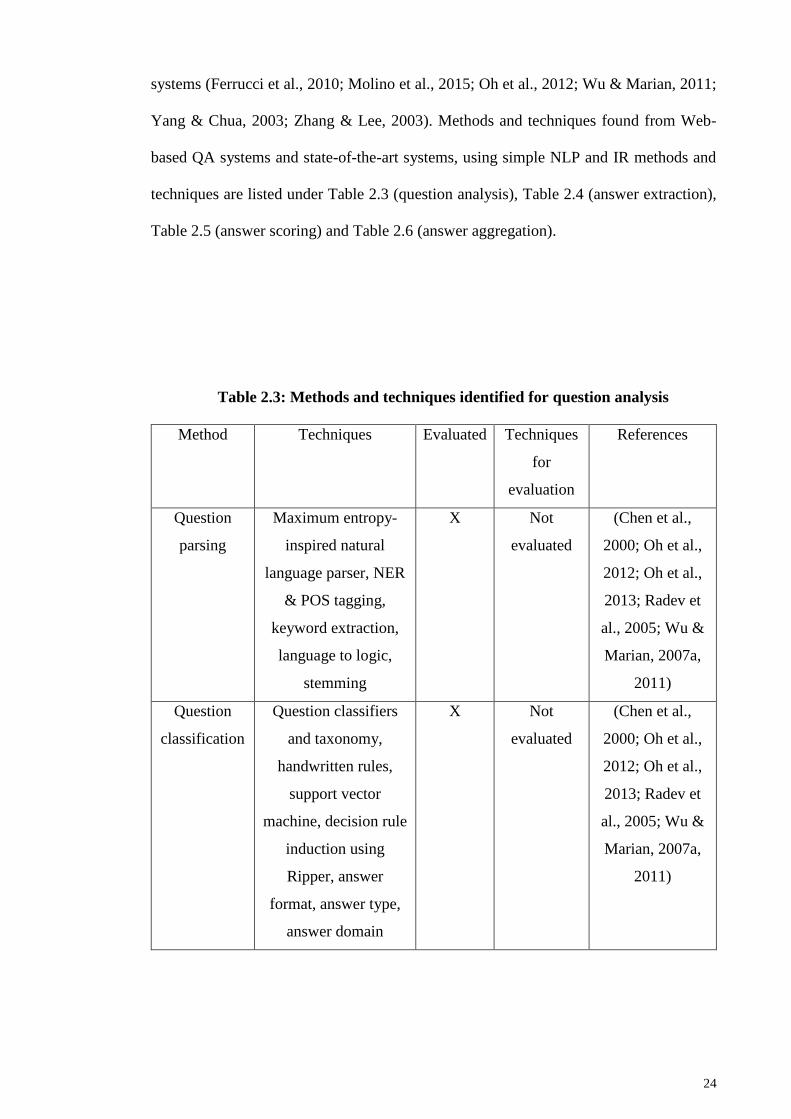
24
systems (Ferrucci et al., 2010; Molino et al., 2015; Oh et al., 2012; Wu & Marian, 2011;
Yang & Chua, 2003; Zhang & Lee, 2003). Methods and techniques found from Web-
based QA systems and state-of-the-art systems, using simple NLP and IR methods and
techniques are listed under Table 2.3 (question analysis), Table 2.4 (answer extraction),
Table 2.5 (answer scoring) and Table 2.6 (answer aggregation).
Table 2.3: Methods and techniques identified for question analysis
Method Techniques Evaluated Techniques
for
evaluation
References
Question
parsing
Maximum entropy-
inspired natural
language parser, NER
& POS tagging,
keyword extraction,
language to logic,
stemming
X Not
evaluated
(Chen et al.,
2000; Oh et al.,
2012; Oh et al.,
2013; Radev et
al., 2005; Wu &
Marian, 2007a,
2011)
Question
classification
Question classifiers
and taxonomy,
handwritten rules,
support vector
machine, decision rule
induction using
Ripper, answer
format, answer type,
answer domain
X Not
evaluated
(Chen et al.,
2000; Oh et al.,
2012; Oh et al.,
2013; Radev et
al., 2005; Wu &
Marian, 2007a,
2011)

25
Table 2.4: Methods and techniques identified for answer extraction
Method Techniques Evalu
ated
Techniques
for evaluation
References
Selecting
Top K
results
Top K (where K=10,
25, 50, 100) Multiple
information sources,
Web pages or snippets,
query formulation, top-
k query processing,
Top-N filter and
threshold algorithm
Top 20 or 10
or 5 Web
pages or
snippets
(Dumais et al.,
2002; Kwok et al.,
2001; Liu et al.,
2014; Molino et
al., 2015; Oh et al.,
2012; Oh et al.,
2013; Radev et al.,
2005; Yang &
Chua, 2002, 2003;
Zhang & Lee,
2003)
HTML
parser
Jericho HTML parser x Not evaluated (Wu & Marian,
2007a, 2011)
Breaking
into
sentences
Maximum entropy-
inspired natural
language parser,
Stanford natural
language parser,
sequencing based on
text density
x Not evaluated
Information
from
external
resources
Google keywords,
WordNet keywords
keywords,
WordNet
keywords or
their
combination
(Ferrucci et al.,
2010; Pasca &
Harabagiu, 2001;
Radev et al., 2005;
Yang & Chua,
2002, 2003)
Stop Word
list
Remove stop words x Not evaluated (Ferrucci et al.,
2010; Molino et
al., 2015)
Quote words
processing
Match quote words in
sentence matching
x Not evaluated (Yang & Chua,
2002, 2003)

26
Table 2.4 continued
Sentence
matching
Voting procedure,
regex, scoring function
based on vector space
model and norm of the
answer vector,
probabilistic phrase re-
ranking, match answer
type, and use of
relevance coefficient
score
Regex or
keyword
matching
(Dumais et al.,
2002; Fader et al.,
2014; Ferrucci et
al., 2010; Kwok et
al., 2001; Liu et al.,
2014; Molino et
al., 2015; Radev et
al., 2005; Wu &
Marian, 2007a,
2011; Yang &
Chua, 2002, 2003;
Zhang & Lee,
2003)
NER Text chunker, fine-
grained named entities,
HMM-based NER,
Stanford NER, NER
system of LTP
Alchemy,
Stanford NER
and their
combination
(Wu & Marian,
2007a, 2011)
Removing
unwanted
answers
Remove unwanted
answers from
candidate answer pool
Remove
answers not
matching
answer type or
question
requirement
(Ferrucci et al.,
2010; Molino et
al., 2015)
Selecting
top N
sentences
Top 1 sentence for
selecting candidate
answer, select all
answers matching rule
on each Web page
Top 1, 3 or 5
sentences
(Dumais et al.,
2002; Kwok et al.,
2001; Liu et al.,
2014; Molino et
al., 2015; Radev et
al., 2005; Wu &
Marian, 2007a,
2011; Yang &
Chua, 2002, 2003)
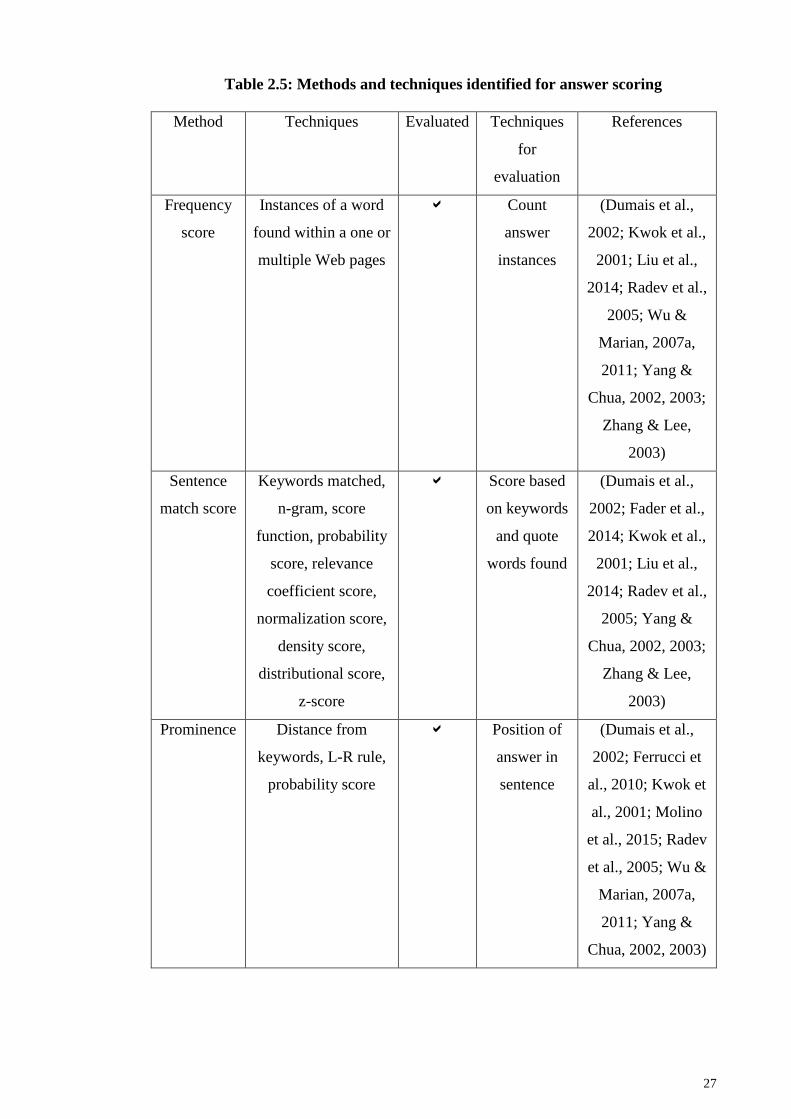
27
Table 2.5: Methods and techniques identified for answer scoring
Method Techniques Evaluated Techniques
for
evaluation
References
Frequency
score
Instances of a word
found within a one or
multiple Web pages
Count
answer
instances
(Dumais et al.,
2002; Kwok et al.,
2001; Liu et al.,
2014; Radev et al.,
2005; Wu &
Marian, 2007a,
2011; Yang &
Chua, 2002, 2003;
Zhang & Lee,
2003)
Sentence
match score
Keywords matched,
n-gram, score
function, probability
score, relevance
coefficient score,
normalization score,
density score,
distributional score,
z-score
Score based
on keywords
and quote
words found
(Dumais et al.,
2002; Fader et al.,
2014; Kwok et al.,
2001; Liu et al.,
2014; Radev et al.,
2005; Yang &
Chua, 2002, 2003;
Zhang & Lee,
2003)
Prominence Distance from
keywords, L-R rule,
probability score
Position of
answer in
sentence
(Dumais et al.,
2002; Ferrucci et
al., 2010; Kwok et
al., 2001; Molino
et al., 2015; Radev
et al., 2005; Wu &
Marian, 2007a,
2011; Yang &
Chua, 2002, 2003)
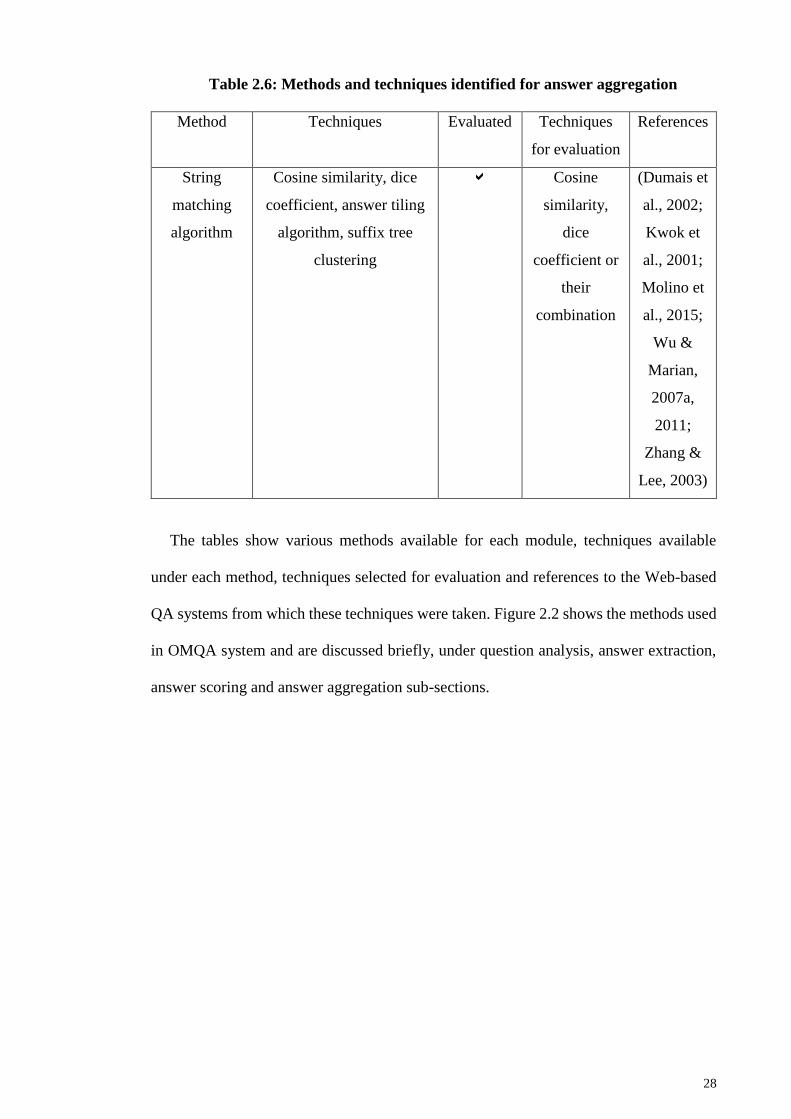
28
Table 2.6: Methods and techniques identified for answer aggregation
Method Techniques Evaluated Techniques
for evaluation
References
String
matching
algorithm
Cosine similarity, dice
coefficient, answer tiling
algorithm, suffix tree
clustering
Cosine
similarity,
dice
coefficient or
their
combination
(Dumais et
al., 2002;
Kwok et
al., 2001;
Molino et
al., 2015;
Wu &
Marian,
2007a,
2011;
Zhang &
Lee, 2003)
The tables show various methods available for each module, techniques available
under each method, techniques selected for evaluation and references to the Web-based
QA systems from which these techniques were taken. Figure 2.2 shows the methods used
in OMQA system and are discussed briefly, under question analysis, answer extraction,
answer scoring and answer aggregation sub-sections.
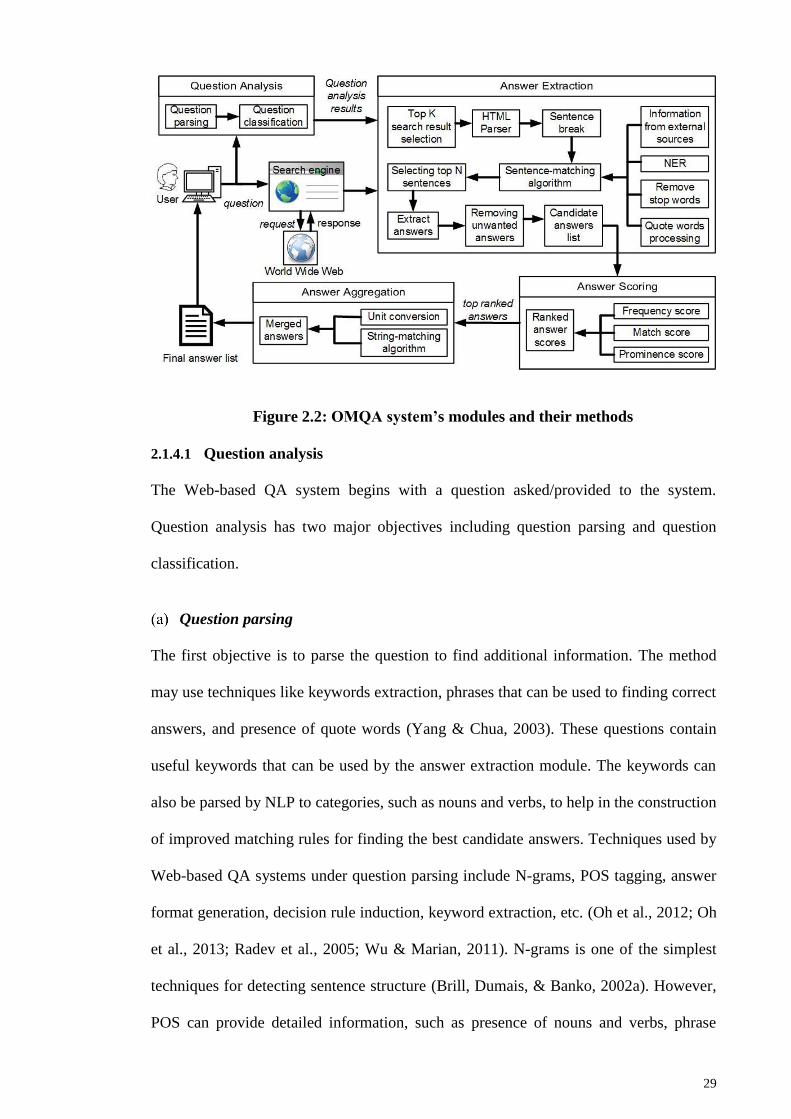
29
Figure 2.2: OMQA system’s modules and their methods
2.1.4.1 Question analysis
The Web-based QA system begins with a question asked/provided to the system.
Question analysis has two major objectives including question parsing and question
classification.
Question parsing
The first objective is to parse the question to find additional information. The method
may use techniques like keywords extraction, phrases that can be used to finding correct
answers, and presence of quote words (Yang & Chua, 2003). These questions contain
useful keywords that can be used by the answer extraction module. The keywords can
also be parsed by NLP to categories, such as nouns and verbs, to help in the construction
of improved matching rules for finding the best candidate answers. Techniques used by
Web-based QA systems under question parsing include N-grams, POS tagging, answer
format generation, decision rule induction, keyword extraction, etc. (Oh et al., 2012; Oh
et al., 2013; Radev et al., 2005; Wu & Marian, 2011). N-grams is one of the simplest
techniques for detecting sentence structure (Brill, Dumais, & Banko, 2002a). However,
POS can provide detailed information, such as presence of nouns and verbs, phrase
30
chunking and more. Radev et al. (2005) applied a POS tagger to phrases and computed
the probability of it, matching the question asked. Somasundaran, Wilson, Wiebe, and
Stoyanov (2007) extracted list of keywords from the question and used it to perform
sentence matching. Chen et al. (2000) suggested the use of POS to identify nouns and
verbs and use WordNet to expand the keyword list further. These techniques allow
question analysis module to extract keywords from the question and build rules to be used
in answer extraction. Systems have reported to improve their accuracy (precision by
9.05%) by adding more techniques in question parsing (Ittycheriah, Franz, Zhu,
Ratnaparkhi, & Mammone, 2000).
Question classification
The second objective is to classify the question asked to judge the expected answer type.
The question may be about a person’s name, place of birth, or an overall concept in some
cases. This classification enables the question analysis module to provide relevant data to
the answer extraction module and identify the expected answer type. There are several
question classifiers suggested by researchers. One of the most popular techniques,
taxonomies used for question classifier, is the one used by Li and Roth (2002), which has
over 50 answer types. It includes types such as colors, religions and musical instruments.
Qualifier QA system defined their own classifier, which uses two stages for classification
(Yang & Chua, 2003). The first stage identifies general entities like human, location, time,
number, object, description and other. The second level allows further classification of a
general entity, like location. Further classification classes can include country, city, state,
river, and mountain. Qualifier system is reported to have achieved over 90% accuracy on
TREC-11 questions, using their own question classifier (Yang & Chua, 2003). The ISI
taxonomy by Hovy, Hermjakob, and Ravichandran (2002) is another example of a large
taxonomy that offers up to 140 different answer types and has been used in (Hovy et al.,
2000; Hovy et al., 2001). Some systems also used SVM classifiers in question

31
classification (Wu, Zhang, Hu, & Kashioka, 2007). For convenience, this research
selected person type questions only, which has a larger subset of question available under
TREC QA track.
2.1.4.2 Answer extraction
Based on the question analysis results, the answer extraction module begins extraction of
answers from the list of search results returned by the search engine. In order to find the
correct answer from a pool of candidate answers, several methods are required to be
introduced. Tasks are performed in sequential order by methods under answer extraction
including 1) Top K search result selection, 2) HTML parser, 3) sentence break, 4)
sentence-matching algorithm, 5) selecting top N sentences, 6) extract answers, and 7)
removing unwanted answers. Methods like information from external sources, NER,
remove stop words, and quote words processing are used by other methods like sentence-
matching algorithm for meeting their objective.
Top K search result selection
Web-based QA systems forward the question as a query to a search engine, which in
turn sends back the results found. Different techniques are available for fetching results.
For example, the questions may be refined to enable the search engine to return better
results (Dumais et al., 2002; Kwok et al., 2001). Moreover, the number of results returned
by the search engine can be limited to results depth K (Yang & Chua, 2002, 2003). For a
given query, the search engine returns 100 results (K=100) and ranks the candidate
answers found from the Web pages. The Top 1 answer is the correct answer in this case.
If the correct answer is ranked at Top 1 for results depth K=10 instead of K=100, then the
accuracy of the answers can be maintained, thus avoiding unnecessary processing of
search results. A research may choose between snippets from a document or the whole
Web document. Searching answers through snippets is faster, but it may overlook other
32
candidate answers that can only be extracted by reading the whole Web document (Liu et
al., 2014; Radev et al., 2005). However, snippets can be used in a system that wishes to
consider more search results than parsing text from few documents only.
Most of the systems reviewed used Google Search to find relevant Web pages for the
questions provided. Variations were found in the use of search engine because systems
use several depths (i.e., Top 100, 50, and 25) of Web results. However, several systems
such as Brill, Dumais, and Banko (2002b); Dumais et al. (2002); Kwok et al. (2001);
Yang and Chua (2002); Yang, Chua, Wang, and Koh (2003); Zhang and Lee (2003)
extract answers from Google snippets only and do not look for answers on Web pages.
Corrob system defined their own Top K method that uses Zipf-like distribution that
dynamically determines the number of pages it requires to predict the correctness of the
answer safely (Wu & Marian, 2011). Some systems also consider credibility of Web
pages for Top K selection, or filter out pages not meeting a certain threshold (Wu &
Marian, 2011). This allows the system to use fewer pages for answer extraction while
achieving similar or better accuracy of answers. Other systems have suggested the use of
multiple sources for information retrieval, where, depending on the question asked, a
particular source is chosen (Oh et al., 2012). This allows systems to retrieve only pages
that are more likely to contain the correct answer. Answers ranked from different sources
are re-ranked for forming the final ranked list. The system showed improved result that
outperformed the lower boundary by about 18% but suffered a 5% loss upper boundary
in MRR.
HTML parsing
Next the answer extraction module works on converting the HTML Web pages or HTML
snippets into plain text. This is done using an HTML parser, such as Jericho parser used
in Corrob QA system (Wu & Marian, 2011), which removes tags from the HTML
33
document and converts it into plain text. However, snippets do not require this conversion
as they are already in plain text form.
Sentence break
Irrespective of whether using snippets or whole Web pages, the plain text is required to
be parsed into individual sentences. This is done to allow sentence matching algorithms
to highlight sentences containing candidate answers. Researchers have used NLP
components such as Stanford NLP for performing this task (Kwok et al., 2001; Liu et al.,
2014; Wu & Marian, 2011).
Before a sentence-matching algorithm is used, some pre-processing is done based on
the data provided by the question analysis module. This includes generating additional
information from external sources, removal of stop words and quote words processing.
Information from external resources
External resources, such as Google and WordNet, can be used to find synonyms of words
within a query, which was first proposed by Yang and Chua (2003) to be used in Web-
based QA systems. They are helpful because the chances of extracting candidate answers
have increased. For example, for the query “Who won the Nobel prize in literature in
1988?”, using the keywords “won,” “Nobel prize,” “literature,” and “1988” from the
question may not be enough to find a sentence containing the correct answer. A sentence
may have used the words “received,” “awarded,” or “gained” instead. Thus, techniques
using external resources can assist by providing synonyms for words and by helping the
sentence-matching method in retrieving the sentence that contains the correct answer. .
This allows the sentence-matching algorithm to capture variety of sentences and thus
increasing the chance of fetching the correct candidate answer.
34
Yang and Chua [6] proposed the use of information from external sources, such as
Google keywords and WordNet, to expand the keywords for sentence matching. Thus,
the algorithm captures a variety of sentences that increase the chance of fetching the
correct candidate answer. Some methods in most systems include the removal of stop
words that have little to no effect on matching and quote words processing that involves
a group of keywords that need to be present in the matched sentence. Yang et al. (2003)
reported an increase of 7.3% over just using the Web keywords.
Removal of stop words
Stop words removal method is used to remove unnecessary keywords from the question
and sentences. These keywords are removed as they have little or no impact on sentence-
matching for finding the correct answer. Some examples of stop words include a, the,
would, is and it.
Quote words processing
Quote words processing checks whether the question contain quote words, which are
group of keywords that need to be present in the matched sentence. For example, in the
question “Name the actress who played the lead role in the movie ‘The Silence of the
Lambs’” the quote words are ‘The Silence of the Lambs’ that needs to be grouped together
when conducting sentence-matching. Both stop words removal and quote words
processing methods were found in almost every Web-based QA system and are
considered as essential part of the QA system.
Sentence-matching algorithm
After conducting the necessary pre-processing the answer extraction is now ready to
perform sentence-matching. The research looked into several Web-based systems, each
providing a unique sentence-matching algorithm. However, these algorithms were
generalized into two main approaches, including sentence matching using regular
35
expressions (regex) (Dumais et al., 2002; Wu & Marian, 2011; Yang & Chua, 2003) and
sentence matching using a list of keywords (or scoring functions) (Ferrucci et al., 2010;
Kwok et al., 2001; Liu et al., 2014; Molino et al., 2015; Oh et al., 2012; Oh et al., 2013;
Radev et al., 2005; Zhang & Lee, 2003).
Regex sentence matching selects a sentence if the condition for the rule is held true
(Dumais et al., 2002; Wu & Marian, 2007a, 2011; Yang & Chua, 2002, 2003). For
example, for the question “Who is the President of USA?”, the regular expression rule
generated would be “X is the President of USA”. This rule will be used for finding
sentences that follow the same structure in hoping to find the answer that is placed at the
position of “X”. The benefit of using a regex is that the candidate answers selected have
a high chance of being correct. Ravichandran and Hovy (2002); Soubbotin and Soubbotin
(2001) used regex/surface pattern for extracting answers. These patterns were either hand
written or generated automatically. This technique is excellent where order of words is
important such as “birds that eat snakes”. Though this technique gives excellent precision
but it has a poor recall (Wang, 2006). This is because sentences can be written in many
ways, and one regex may not cover all possible combinations. Moreover, relaxing the rule
also tends to increase noise and thus decrease the overall accuracy of the answers. Having
said that, Katz (1997) reported that using regex for certain questions that can benefit from
the use of pattern matching can increase accuracy of the system drastically.
Keywords sentence matching is another technique in which the sentence having the
highest number of keywords matched is selected (Kwok et al., 2001; Liu et al., 2014;
Radev et al., 2005; Zhang & Lee, 2003). For example, for the question “Who is the
President of USA?”, the keyword matching technique will use the keywords “President”
and “USA”, and find sentences that use the same keywords found in the question. This
36
technique is more relaxed than the others and collects a large number of candidate
answers.
Selecting Top N sentences
Regardless of the technique used, different Web-based QA systems limited the number
of Top N sentences matched (Wu & Marian, 2011). The literature suggests that some
systems can record all the answers extracted from a Web page (Kwok et al., 2001),
whereas some systems can limit the number of top sentences selected to N (Wu & Marian,
2011; Yang & Chua, 2003). Wu and Marian (2011) suggested to pick a single answer
until the system was confident that it is the correct answer (using Zipf distribution). Yang
and Chua (2003) recommended limiting the answers extract to N in order to avoid
unwanted answers. This is because by considering too many answers in a page, the correct
answer may get buried among a big collection of incorrect answers. However, by
restricting N to a small number may not allow a correct answer to be determined
conclusively (Wu & Marian, 2011). Thus, it is required that the value of N should neither
be too high nor too low. For evaluation of selecting Top N sentences method, limits for
N=1, 3, and 5 were set, where N is the number of sentences considered for extracting
candidate answers.
The sentence-matching algorithm allowed answer extraction module to highlight
sentences containing candidate answers, but a number of filters has to be applied to ensure
that only the correct candidate answers are extracted. The literature highlights systems
using two types of filters ‒ NER and removal of unwanted answers.
NER
NER is used to check whether a sentence contains the expected answer type, which allows
to filter out unwanted sentences (Manning et al., 2014). For example, only person entities
are selected using a NER if the answer to the question is expected to be a person.
37
Therefore, other entity types are ignored and the chances for error are reduced
(Kolomiyets & Moens, 2011; Wu & Marian, 2011).
Among different NERs available, Stanford and Alchemy NER stand out. Stanford
NER, developed by Manning et al. (2014), was used in Corrob QA system which has
reported higher accuracy results over baseline system. Stanford NER also provides
additional customization by all developers to choose from 3, 4, 7 classifier types. This
proves useful when dealing with different document types involving documents, passages
or sentences comprising many or a few possible categories. Similarly, Alchemy NER has
been used in information systems for various information processing (Aggarwal et al.,
2014b).
Removing unwanted answers
This method helps in removing unwanted answers from the candidate answer pool
(Ferrucci et al., 2010; Molino et al., 2015). For example, for questions such as “Who
killed Abraham Lincoln,” any sentence extracted also cites the entity Abraham Lincoln
along with other answers. Abraham Lincoln is removed from the candidate answer pool
because the name cannot be the answer. However, an exception can be taken when the
entity in the question is the correct answer and the answer is removed unintentionally. To
avoid such a scenario, a check is placed to remove the unwanted answer when more than
one answer is found in the sentence. For example, if the question asked is “Who killed
X,” and the answer is “Y killed X,” then X is removed automatically. However, if X
committed a suicide, the answer string would be “X killed himself.” Only one answer can
be found in the second string, and therefore X is not removed.
Literature shows that use of this method is normally followed in complex systems
using hypothesis generation (Ferrucci et al., 2010). However, some conditional patterns
can be defined to use this method for simpler Web-based QA systems as well. Brill et al.

38
(2002a) also suggested strategies for predicting wrong answers. Though many systems
have suggested use of paragraph and sentence filtering, yet answer filtering is still rarely
seen (Allam & Haggag, 2012).
The candidate answer list is scrutinized using NER and remove unwanted answer
filters. The candidate answers list produced by answer extraction module is then
forwarded to the answer scoring module.
2.1.4.3 Answer scoring
Web-based QA systems often encounter sentences containing one or more answers and
require individual answers to be scored (Ferrucci et al., 2010; Oh et al., 2012; Wu &
Marian, 2011). An answer scoring module allocates a score to rank each answer (Wu &
Marian, 2011). The scores enable answers to be compared with one another to determine
which one is more likely to be correct (Ferrucci et al., 2010; Molino et al., 2015). Answers
can be scored in different ways, but the three main methods for scoring answers are based
on the frequency of the answer, the value assigned to answer by a scoring function, and
the prominence of the answer (Liu et al., 2014; Oh et al., 2012; Wu & Marian, 2011). The
system decides whether to include one or more of the techniques for scoring answers and
ranks them. Systems like Wu and Marian (2011) and Yang and Chua (2003) used multiple
methods for scoring answers including frequency, scoring function and prominence of
the answer.
Frequency
Frequency refers to the number of occurrences of a candidate answer (Wu & Marian,
2011; Yang & Chua, 2003). Every answer found in a sentence matched that is considered
a single instance and multiple instances are recorded accordingly. If the same answer is
found on a different Web page, both frequencies are added (Wu & Marian, 2011; Yang
& Chua, 2003). The end result gives the frequency of an answer found on multiple Web
39
pages. For example, the answer Abraham Lincoln is found 2, 3, and 1 time/s from Web
pages 1 to 3. Thus, its frequency score is 6 (Wu & Marian, 2011). Frequency technique
is easiest to implement as it counts the number of occurrences of the answer from the
candidate sentence (Yang & Chua, 2003). However, this technique can also be exploited
if an incorrect answer is used numerous times on multiple Websites (Wu & Marian,
2011).
Match score
The match score method assigns a score to an answer depending on its relevance score or
keyword match score (Oh et al., 2012). The score depends on the rule used for extracting
the answer from the sentence such as number of keywords found in the candidate
sentence, words from thesaurus, Google, WordNet or external keywords, mismatch
words, quote words and more (Ittycheriah et al., 2000). This technique had a lot of
freedom for improvement as more match scoring factors can be added to increase the
likelihood of candidate answer being correct.
The literature identified a number of techniques making use of match-score technique.
Oh et al. (2012) suggested to rank highest scored sentences on a Web page and
considering them for answer extraction. McCallum (2005) formulated a scoring function
that gives a probabilistic score for an answer. Similarly, Liu et al. (2014) used a relevance
coefficient score for candidate answers while Dumais et al. (2002) used an N-gram
scoring function. The literature also identified other systems making use of sentence
matching score one way or the other for ranking candidate answers (Kwok et al., 2001;
Yang & Chua, 2002, 2003; Zhang & Lee, 2003).
For example, the query “What was the name of the first Russian astronaut to do a
spacewalk?” The search engine runs the query on the Web and returns the search results.
One of the search results contains the sentence “Fifty years ago, Alexei Leonov clinched
40
a Soviet victory with the first ever spacewalk,” for which the match score must be
calculated. The keywords “first,” “Russian,” “astronaut,” and “spacewalk” are identified
from the query and are matched against the sentence. Some of these keywords have
synonyms. Russian may be called a Soviet, or an astronaut can also be called a cosmonaut.
The score calculated for the sentence is 3 given that three keywords are matched (i.e.,
first, Russian (or Soviet), and spacewalk) (Oh et al., 2012).
Prominence score
Prominence scoring method used by Wu and Marian (2011) scores answers depending
on the positioning of a word within a sentence or its distance from the match rule. The
answer that is in a better position within a sentence or is closer to the matched rule is
assigned a higher score.
For example, consider the sentence “Ray shot and killed King in Memphis on April 4,
1968”. In this sentence, the candidate answer Ray is placed at position 0 since it is the
beginning of the sentence. If the question was “Who killed Martin Luther King?”, then
the candidate answer Ray is in a better position and thus has a better chance of being the
correct answer. In comparison if the position of the candidate answer somewhere in the
middle of the sentence then it is unlikely to be the correct answer (Doyle, 2014).
Regardless of the answer scoring method used, the answers are ranked with respect to
the score assigned to them (Gupta & Gupta, 2012). This allows the answer scoring module
to generate a ranked answer list, allowing the Web-based QA system to select the top
ranked answers which are likely to be correct answers. However, these answers must
undergo an answer aggregation phase before the final answer list can be compiled (Gupta
& Gupta, 2012).
41
2.1.4.4 Answer aggregation
Before the final top answers list is generated, the answers are checked if similar answers
can be merged in the numerical, string, or date format (Gupta & Gupta, 2012; Wu &
Marian, 2011). The Answer aggregation module merges similar answers whether in
numeric, string or date format (Wu & Marian, 2011). The module consists of methods
like unit conversion and string matching. Unit conversion is useful, especially in date and
numeric answer type, where it is important that all answers considered follow the same
format (Wu & Marian, 2011). Since unit conversion is not within the scope of our
research, it was not covered. String matching method is used to merge two identical
strings . For example, the name John Doe may be written as Doe, John or J. Doe, both the
answers should be merged.
The research found multiple systems making use of this method including (Dumais et
al., 2002; Kwok et al., 2001; Wu & Marian, 2011; Zhang & Lee, 2003). The cosine
similarity technique was used by Wu and Marian (2011) for string matching, but the
research also found another technique called dice coefficient (Gomaa & Fahmy, 2013).
Both cosine similarity and dice coefficient are used for string matching. Cosine similarity
is a measure of similarity between two vectors of an inner product space that measures
the cosine of the angle between them (Gomaa & Fahmy, 2013). Dice coefficient is defined
as twice the number of common terms in the compared strings divided by the total number
of terms in both strings (Gomaa & Fahmy, 2013). Apart from string matching method,
the research also found answer tiling algorithm and suffix tree clustering methods for
merging answers (Dumais et al., 2002; Kwok et al., 2001).
The answer aggregation module merges similar answers found in the ranked answer
list returned by answer scoring module. After merging, the final ranked answer list is
produced which is sent to the user.

42
2.1.5 Web-based QA systems summary
In this sub-section, the research covered background and literature on Web-based
systems. This included details on types and characteristics of QA systems, comparison of
Web-based systems with state-of-the-art systems and details on the working of Web-
based systems. This allowed the research to define a model for Web-based QA system
and highlight methods and techniques used in them.
Methods and techniques used in Web-based QA systems are required to be evaluated
in order to select the ones performing better than others. Table 2.3 under Section 2.1.4,
shows methods and techniques selected for evaluation. However, evaluating these will
only improve answer accuracy using existing techniques.
This research aims at adding a credibility assessment module to the existing Web-
based QA model shown in Figure 2.1, to evaluate its effect on answer accuracy. For this
background and literature on credibility assessment needs to be looked into, covered in
Section 2.2, to define a credibility assessment algorithm that can be used to evaluate Web
pages based on their credibility for scoring answers.
43
Web credibility
This sub-section encompasses credibility assessment, which covers credibility definition,
user’s perception, credibility categories and credibility evaluation techniques
2.2.1 Defining credibility
Credibility is defined as “the quality or power of inspiring belief”. Thus a credible Web
page is one that is trustworthy and the content it provides is of high quality and accurate
(Fogg, 2002a). Schwarz and Morris (2011a) defines a credible Web page as one “whose
information one can accept as the truth without needing to look elsewhere. If one can
accept information on a page as true at face value, then the page is credible; if one needs
to go elsewhere to check the validity of the information on the page, then it is less
credible”. By measuring credibility of a Web page, the computer systems can determine
whether the information provided is correct or not based on its credibility rating.
Credibility can be determined by a number of categories, consisting of credibility
factors that contribute towards it. Fogg and Tseng (1999a) suggests that credibility is
based on two key components: i) trustworthiness and ii) expertise. Trustworthiness of
content is defined in terms of being well-intentioned, truthful and unbiased; while
expertise is defined as being knowledgeable, experienced and competent. However, the
five credibility categories defined by Meola (2004) including accuracy, objectivity,
authority, currency, and coverage cover a lot of credibility factors. Here accuracy is the
correctness of Web information, objectivity is content being un-biased, authority is
reputation of author, currency is freshness of content and coverage is detail of the content.
Many researchers accept accuracy, objectivity, authority, currency, and coverage as main
categories to evaluate credibility of Web pages (Ostenson, 2014; Schwarz & Morris,
2011b; Yamamoto & Tanaka, 2011a). Flanagin and Metzger (2008) added to this by
suggesting that credibility of content consists of objective as well as subjective parts.
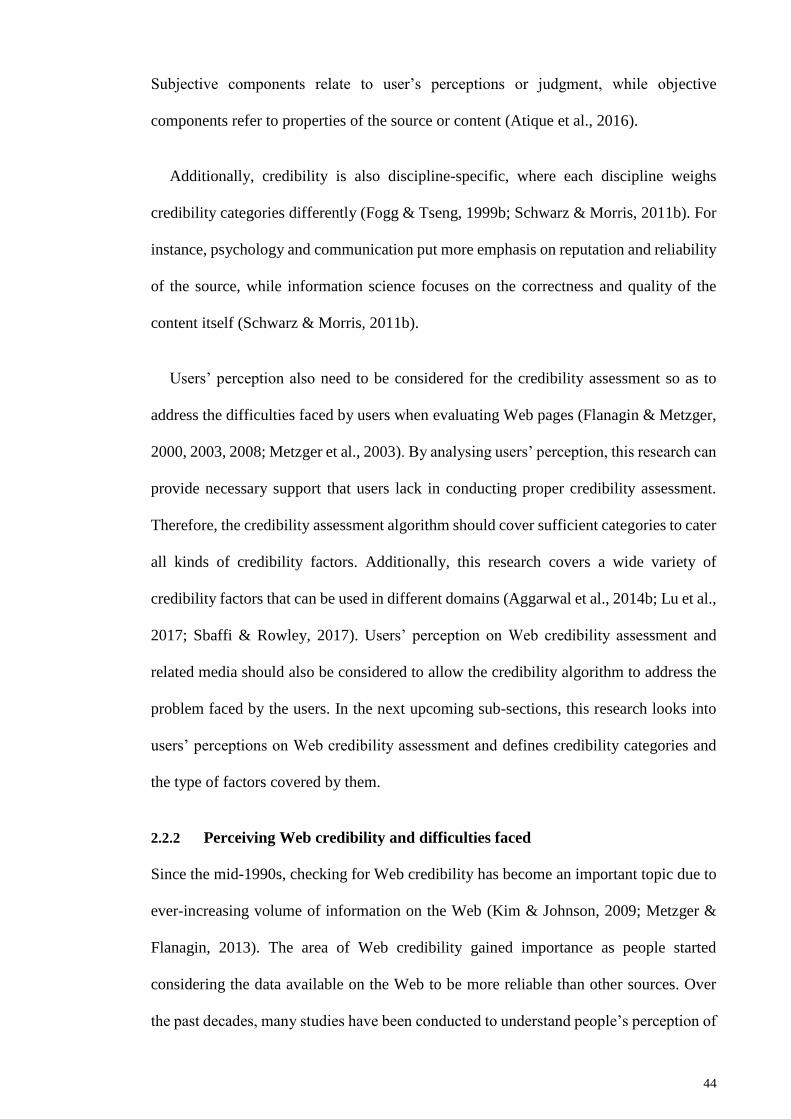
44
Subjective components relate to user’s perceptions or judgment, while objective
components refer to properties of the source or content (Atique et al., 2016).
Additionally, credibility is also discipline-specific, where each discipline weighs
credibility categories differently (Fogg & Tseng, 1999b; Schwarz & Morris, 2011b). For
instance, psychology and communication put more emphasis on reputation and reliability
of the source, while information science focuses on the correctness and quality of the
content itself (Schwarz & Morris, 2011b).
Users’ perception also need to be considered for the credibility assessment so as to
address the difficulties faced by users when evaluating Web pages (Flanagin & Metzger,
2000, 2003, 2008; Metzger et al., 2003). By analysing users’ perception, this research can
provide necessary support that users lack in conducting proper credibility assessment.
Therefore, the credibility assessment algorithm should cover sufficient categories to cater
all kinds of credibility factors. Additionally, this research covers a wide variety of
credibility factors that can be used in different domains (Aggarwal et al., 2014b; Lu et al.,
2017; Sbaffi & Rowley, 2017). Users’ perception on Web credibility assessment and
related media should also be considered to allow the credibility algorithm to address the
problem faced by the users. In the next upcoming sub-sections, this research looks into
users’ perceptions on Web credibility assessment and defines credibility categories and
the type of factors covered by them.
2.2.2 Perceiving Web credibility and difficulties faced
Since the mid-1990s, checking for Web credibility has become an important topic due to
ever-increasing volume of information on the Web (Kim & Johnson, 2009; Metzger &
Flanagin, 2013). The area of Web credibility gained importance as people started
considering the data available on the Web to be more reliable than other sources. Over
the past decades, many studies have been conducted to understand people’s perception of
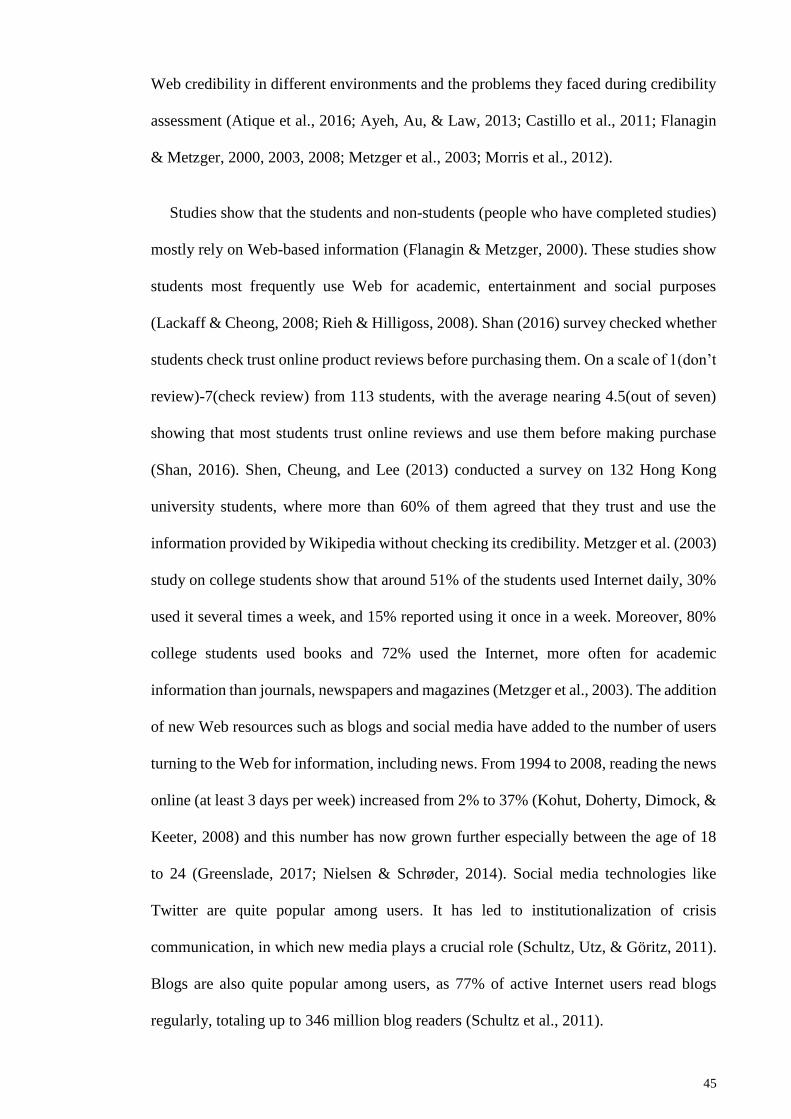
45
Web credibility in different environments and the problems they faced during credibility
assessment (Atique et al., 2016; Ayeh, Au, & Law, 2013; Castillo et al., 2011; Flanagin
& Metzger, 2000, 2003, 2008; Metzger et al., 2003; Morris et al., 2012).
Studies show that the students and non-students (people who have completed studies)
mostly rely on Web-based information (Flanagin & Metzger, 2000). These studies show
students most frequently use Web for academic, entertainment and social purposes
(Lackaff & Cheong, 2008; Rieh & Hilligoss, 2008). Shan (2016) survey checked whether
students check trust online product reviews before purchasing them. On a scale of 1(don’t
review)-7(check review) from 113 students, with the average nearing 4.5(out of seven)
showing that most students trust online reviews and use them before making purchase
(Shan, 2016). Shen, Cheung, and Lee (2013) conducted a survey on 132 Hong Kong
university students, where more than 60% of them agreed that they trust and use the
information provided by Wikipedia without checking its credibility. Metzger et al. (2003)
study on college students show that around 51% of the students used Internet daily, 30%
used it several times a week, and 15% reported using it once in a week. Moreover, 80%
college students used books and 72% used the Internet, more often for academic
information than journals, newspapers and magazines (Metzger et al., 2003). The addition
of new Web resources such as blogs and social media have added to the number of users
turning to the Web for information, including news. From 1994 to 2008, reading the news
online (at least 3 days per week) increased from 2% to 37% (Kohut, Doherty, Dimock, &
Keeter, 2008) and this number has now grown further especially between the age of 18
to 24 (Greenslade, 2017; Nielsen & Schrøder, 2014). Social media technologies like
Twitter are quite popular among users. It has led to institutionalization of crisis
communication, in which new media plays a crucial role (Schultz, Utz, & Göritz, 2011).
Blogs are also quite popular among users, as 77% of active Internet users read blogs
regularly, totaling up to 346 million blog readers (Schultz et al., 2011).
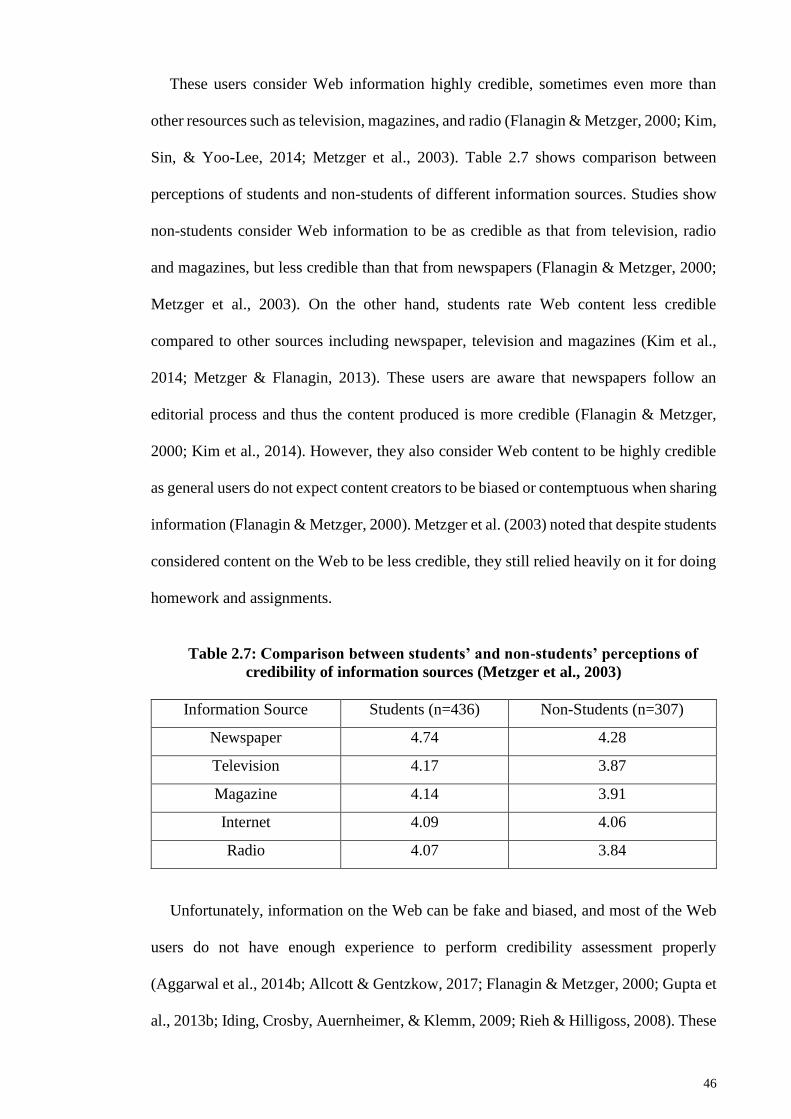
46
These users consider Web information highly credible, sometimes even more than
other resources such as television, magazines, and radio (Flanagin & Metzger, 2000; Kim,
Sin, & Yoo-Lee, 2014; Metzger et al., 2003). Table 2.7 shows comparison between
perceptions of students and non-students of different information sources. Studies show
non-students consider Web information to be as credible as that from television, radio
and magazines, but less credible than that from newspapers (Flanagin & Metzger, 2000;
Metzger et al., 2003). On the other hand, students rate Web content less credible
compared to other sources including newspaper, television and magazines (Kim et al.,
2014; Metzger & Flanagin, 2013). These users are aware that newspapers follow an
editorial process and thus the content produced is more credible (Flanagin & Metzger,
2000; Kim et al., 2014). However, they also consider Web content to be highly credible
as general users do not expect content creators to be biased or contemptuous when sharing
information (Flanagin & Metzger, 2000). Metzger et al. (2003) noted that despite students
considered content on the Web to be less credible, they still relied heavily on it for doing
homework and assignments.
Table 2.7: Comparison between students’ and non-students’ perceptions of
credibility of information sources (Metzger et al., 2003)
Information Source Students (n=436) Non-Students (n=307)
Newspaper 4.74 4.28
Television 4.17 3.87
Magazine 4.14 3.91
Internet 4.09 4.06
Radio 4.07 3.84
Unfortunately, information on the Web can be fake and biased, and most of the Web
users do not have enough experience to perform credibility assessment properly
(Aggarwal et al., 2014b; Allcott & Gentzkow, 2017; Flanagin & Metzger, 2000; Gupta et
al., 2013b; Iding, Crosby, Auernheimer, & Klemm, 2009; Rieh & Hilligoss, 2008). These
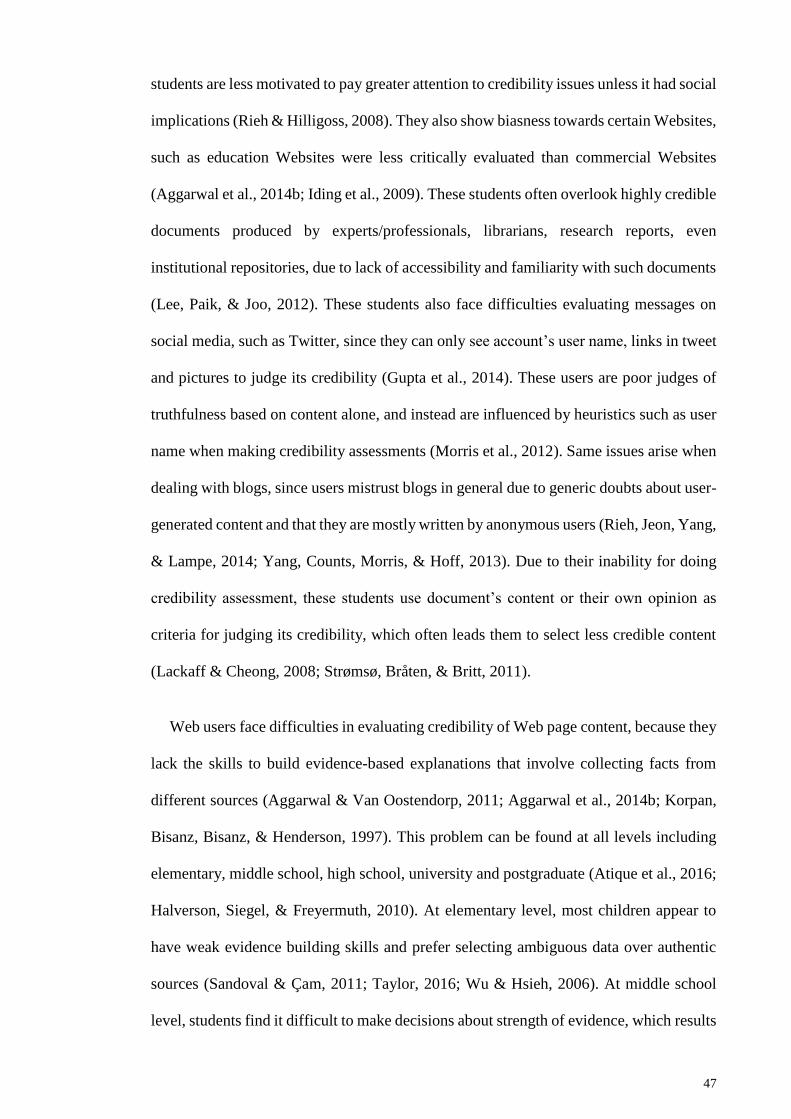
47
students are less motivated to pay greater attention to credibility issues unless it had social
implications (Rieh & Hilligoss, 2008). They also show biasness towards certain Websites,
such as education Websites were less critically evaluated than commercial Websites
(Aggarwal et al., 2014b; Iding et al., 2009). These students often overlook highly credible
documents produced by experts/professionals, librarians, research reports, even
institutional repositories, due to lack of accessibility and familiarity with such documents
(Lee, Paik, & Joo, 2012). These students also face difficulties evaluating messages on
social media, such as Twitter, since they can only see account’s user name, links in tweet
and pictures to judge its credibility (Gupta et al., 2014). These users are poor judges of
truthfulness based on content alone, and instead are influenced by heuristics such as user
name when making credibility assessments (Morris et al., 2012). Same issues arise when
dealing with blogs, since users mistrust blogs in general due to generic doubts about user-
generated content and that they are mostly written by anonymous users (Rieh, Jeon, Yang,
& Lampe, 2014; Yang, Counts, Morris, & Hoff, 2013). Due to their inability for doing
credibility assessment, these students use document’s content or their own opinion as
criteria for judging its credibility, which often leads them to select less credible content
(Lackaff & Cheong, 2008; Strømsø, Bråten, & Britt, 2011).
Web users face difficulties in evaluating credibility of Web page content, because they
lack the skills to build evidence-based explanations that involve collecting facts from
different sources (Aggarwal & Van Oostendorp, 2011; Aggarwal et al., 2014b; Korpan,
Bisanz, Bisanz, & Henderson, 1997). This problem can be found at all levels including
elementary, middle school, high school, university and postgraduate (Atique et al., 2016;
Halverson, Siegel, & Freyermuth, 2010). At elementary level, most children appear to
have weak evidence building skills and prefer selecting ambiguous data over authentic
sources (Sandoval & Çam, 2011; Taylor, 2016; Wu & Hsieh, 2006). At middle school
level, students find it difficult to make decisions about strength of evidence, which results
48
in treating all evidence provided as strong i.e. without any variation (Glassner, Weinstock,
& Neuman, 2005; Johnson & Kaye, 2014; Pluta, Buckland, Chinn, Duncan, & Duschl,
2008). This is because these students struggle to construct, justify, and evaluate scientific
arguments (Johnson & Kaye, 2014; Mathews, Holden, Jan, & Martin, 2008). At high
school level, studies show that pupils face difficulties trying to explain or defend an issue
as their reasoning is mostly based on superficial contextual information and not empirical
evidence (Brem, Russell, & Weems, 2001; Dawson & Venville, 2009; Johnson & Kaye,
2014; Kolsto, 2001; Reiser, 2004; Sandoval & Millwood, 2005). Studies conducted for
undergraduate students show them lacking deep understanding required to judge the
quality of evidence, making them unable to select the best available evidence (Bendersky,
Croft, & Diao, 2011; Lippman, Amurao, Pellegrino, & Kershaw, 2008; List et al., 2017).
This is due to students’ preference for ease of comprehension instead of relevant empirical
and disconfirming evidence (Halverson et al., 2010; Treise, Walsh-Childers, Weigold, &
Friedman, 2003). Even at postgraduate level, pre-service teacher consistently grounded
their arguments in evidence, but they still exhibited a number of limitations such as
collecting best resources and considering credibility factors for selecting them (Karlsson
et al., 2017; Zembal-Saul, Munford, Crawford, Friedrichsen, & Land, 2002).
Though users lack skills to conduct credibility assessment and build evidence-based
explanations, yet providing credibility factors, related to Web pages, can increase
positive beliefs about credibility, which are important both for users and success of a
Website (Freeman & Spyridakis, 2009a; Wogalter & Mayhorn, 2008). Credibility factors
associated with Websites, such as domain suffixes (e.g., .com, .edu), quality seals, and
organization/domain names, can affect user’s credibility belief for Website’s information
(Rodrigues, Wright, & Wadhwa, 2013). Students and non-students, who spend more time
on the Web showed significantly higher trust ratings for credibility factors relating to Web
pages than users not spending much time on the Web (Wogalter & Mayhorn, 2008). Even
49
providing simple information, such as contact details, can dramatically improve
Website’s credibility belief among users (Freeman & Spyridakis, 2009a). Providing
source characteristics, such as health information, published or authored by physicians,
or major health institutions, also improve users’ trust towards the Website (Sillence,
Briggs, Harris, & Fishwick, 2007).
Reader characteristics and experience also affect credibility judgment as experience
readers look into more factors for judging its credibility over novice users (Ahmad, Wang,
Hercegfi, & Komlodi, 2011; Freeman & Spyridakis, 2009a). Robins and Holmes (2008);
Robins, Holmes, and Stansbury (2010) show that there is a close relationship between
people's visual design preferences and credibility assessment as people judge credibility
of Web pages based on their preference of Web page’s aesthetic characteristics.
Moreover, experts consider more credibility factors to evaluate a content than a novice
Web user (Fallow, 2005; Flanagin & Metzger, 2000; Metzger, 2007).
It is observed that both students and non-students lack the training or tools for judging
and understanding evidence for verifying credibility. Moreover, their limit perception
often leads them into selecting weak sources over highly credible sources. These users
often have limited information to deal with, thus evaluating credibility of content becomes
difficult. Keeping in view of users’ lack of credibility judgement and weak skills for
building evidence-based explanation, there is a need to define a credibility assessment
algorithm. In the next sub-section, this research covers the categories that contribute
towards credibility, and the credibility factors they cover.
2.2.3 Credibility categories
Credibility categories allow the system to evaluate credibility of a resource from multiple
aspects. This research formed seven credibility categories based on literature provided by
researchers, covered in Section 2.2.1 (Flanagin & Metzger, 2008; Fogg & Tseng, 1999a;

50
Meola, 2004), to be able to cover old credibility factors (such as, relevancy, update date,
readability) and new ones (popularity on social media, likes and shares counts). These
categories include correctness, authority, professionalism, popularity, currency,
impartiality and quality, and are discussed in detail in their respective sub-sections.
2.2.3.1 Correctness
Correctness deals with the correctness of information provided (Meola, 2004). For
example, a question asking “Who discovered Hawaii”, the QA system expects to search
for answers in Web pages closely related with the query given. If one of the Web pages
given is “Hotels available in Hawaii”, which is unlikely to contain the given answer
should get a lower score. Hovland emphasized the importance of mentioning the source
of the content in order to validate the correctness of the document (Hovland & Weiss,
1951). However, reliance on the source only is not enough, other factors like references
or source of the content play an important role in determining content’s correctness. The
correctness increases further if references are cited to scientific data which also allows it
to be verified from elsewhere (Fogg, 2002a; Fogg et al., 2001a). This helps in measuring
correctness of the document against other known evidence-based guidelines and theories
(Dochterman & Stamp, 2010). Similarly, correctness increases if the content is reviewed
by peers and provides evidence for supporting an argument (Fritch & Cromwell, 2002;
Meola, 2004). Another way to judge the correctness is to use social and heuristics
approach which considers an answer credible if majority agrees with the answer or if
endorsed by an expert on the topic (Metzger, Flanagin, & Medders, 2010). Another useful
application is the use of digital watermarks for important document for verification (Hao
& Su, 2012). Additionally, machine learning algorithms or semantic Web solutions can
be used to conduct content analysis in analyzing content’s correctness, provided that
semantic data relating to the content is available (Archer, Smith, & Perego, 2008b;
Olteanu, Peshterliev, Liu, & Aberer, 2013b).
51
Using correctness in QA systems
Correctness is ideal in scenarios where question’s context or structure is important. For
example, a user asks a question stating “Who killed Jack the Ripper?”. In this question, it
is important to understand that the user is asking about the person who killed Jack the
Ripper and not the victims who were killed by him. Consider another example, where the
user asks “Who was the first American to do spacewalk?”. In this question, it is important
fetch pages covering American astronauts only. It is quite possible that the search engine
also returns pages cover astronauts from other nationalities as well, but a well-defined
correctness module will only score Web sources that are relevant to the question more.
Thus, correctness is ideal for questions where sequence of keywords and context of the
Web sources is important (Molino et al., 2015; Wu & Marian, 2014).
2.2.3.2 Authority
Authority deals with the experience and popularity of the author, which includes author’s
qualifications and credentials in the Web community (Meola, 2004; Wathen & Burkell,
2002). Providing author’s contact details, including his e-mail ID, also impacts authority
(Freeman & Spyridakis, 2009b). In print media, author details are utmost importance as
they provide author’s biography as well his experience in the area to allow readers to
judge the credibility of the content. This is especially true in the case of blogs, where
contents written by known authors are considered more credible and contain less spelling
errors than the ones written by an anonymous user (Chesney & Su, 2010). Using author’s
credentials, author’s popularity on the Web can also be determined by looking into the
number of article citations, author’s prior contributions and awards received. This is quite
important on medical Websites, where a patient feels more secure knowing that doctor
prescribing medication is well reputed (Abbasi et al., 2012; Sbaffi & Rowley, 2017; Wald,
Dube, & Anthony, 2007). Authority is also quite crucial for verifying information taken
52
from social media such as Twitter, where information has a higher credibility if it is
posted by a verified user (Castillo et al., 2011; Chatterjee & Agarwal, 2016; Gupta et al.,
2014). Moreover, it can be used to track author’s popularity, by checking number of
people following him or likes and shares of the published content (Morris et al., 2012).
Using authority in QA systems
Authority plays an important role in questions related to the content’s author, content
produced by an author or a quote by a person. For example, in the question “Who wrote
Sherlock Holmes book?”, authority category can play a pivotal in extracting the author
name. In this question “Arthur Conan Doyle” is the correct answer and Web pages
containing content written by the same author along with author details can assist the QA
system in rating them higher. Similarly, for the question “Which book is George R. R.
Martin currently working on?”, the most credible answer would be the one that has been
taken from a page where the author himself specifies the book he is currently working on.
Similarly, the question “Who wrote the famous quote ‘You too Brutus’?” requires the QA
system to rate Web sources higher that mentions author who wrote the quote. In this case,
Web page mentioning “William Shakespeare” as author of the quote will be rated higher.
This can be applied to questions revolving around rumors regarding a specific person
which can only be clarified by the person himself. Thus, authority category weighting can
be increased in questions where question is regarding a specific person details like
something he produced, said, or plan on doing (Lu et al., 2017; Shan, 2016).
2.2.3.3 Currency
It refers to the freshness and update frequency of the resource (Aggarwal et al., 2014b;
Meola, 2004; Tanaka et al., 2010b; Yamamoto, Tezuka, Jatowt, & Tanaka, 2007). It is of
utmost importance that Web pages considered for answer extraction are most recent for
several reasons. First and foremost, it allows answers to be extracted from the same
53
timeline in case it is not explicitly mentioned in the question itself. For example, if the
user asks “Who is the president of the United States of America?”, then it is only logical
to fetch data from the most recent sources (Aggarwal et al., 2014b; Tanaka, 2010;
Yamamoto & Tanaka, 2011a; Yamamoto et al., 2007). Secondly, it also addresses
answers to questions which may have changed over time. For example, Pluto was
considered a planet by astronomers when it was discovered in 1930s, but current studies
term it as a “dwarf planet” and not a regular planet (Aggarwal et al., 2014b; Tanaka, 2010;
Yamamoto & Tanaka, 2011a; Yamamoto et al., 2007).
Currency can be tracked by extracting meta information and date stamps providing last
update date of content (Aggarwal et al., 2014b; Stvilia, Twidale, Smith, & Gasser, 2005).
Moreover, some application programming interfaces (API) also provides details on the
frequency of updates applied to the content (Diffbot, 2016). Web pages having a higher
currency score will allow the system to rate answers higher than others that have not been
updated in years.
Many researchers have stressed on the importance of currency in measuring
credibility. Presence of date stamp, showing that information is current, and monitoring
how often the content is updated helps in measuring currency (Aggarwal et al., 2014b;
Fritch & Cromwell, 2002; Schwarz & Morris, 2011b; Yamamoto & Tanaka, 2011a). This
is useful as it makes sure that the most recent content is being used and that the answers
within the page are not outdated. Apart from the last update date, the frequency with
which the content is updated also contributes towards currency score of a Web page
(Aggarwal et al., 2014b; Tanaka et al., 2010b; Yamamoto & Tanaka, 2011b). Yamamoto
and Tanaka (2011a) checked the list of updated dates of the Web pages using the
Wayback Machine of Internet Archive to evaluate currency of Web pages. Other

54
researchers used the date provided within meta data of HTML documents to determine
their currency (Olteanu et al., 2013a; Pattanaphanchai, O'Hara, & Hall, 2012).
Using currency in QA systems
Currency category is useful in which questions mentioning date or requiring latest
content. For example, if the user asks “Who was the richest man in the year 2000?” then
the category can be used to rate Web pages archived for the following year. Though it is
possible that some current page also contains details chronological details but finding an
archived Web page belonging to the same year would be more beneficial. In another
scenario, where the user may as “Who is currently the highest paid film actor?”. In this
scenario only the up to date content is require as pages contain answers for previous years
would be considered false. Thus, currency category should be given more weighting in
questions that mentions dates or require most current answers (Aggarwal et al., 2014b;
Yamamoto & Tanaka, 2011a).
2.2.3.4 Professionalism
In most cases, users ignore good quality articles because of poorly managed Websites
thus giving a biased and untrustworthy appearance (Bosch, Bogers, & Kunder, 2016;
Lewandowski, 2012; Robins & Holmes, 2008). These include presence of
advertisements, spelling errors, broken links and no multi-language support. Domain
name or URL suffix plays a major role towards a Website’s credibility (Fogg, 2002a;
George, Giordano, & Tilley, 2016). Some users also place more trust in a Website if
author’s details are given, Website has a privacy policy and has a mission statement or
objectives (Fogg et al., 2003a; George et al., 2016). Privacy certification mechanisms
including data protection certification mechanisms, seals, and marks can help Website’s
achieve higher professionalism (Rodrigues et al., 2013). Some Websites also give
credentials of members on the editorial board and the process taken for maintaining
55
quality of content, and often follow the “paid access to information” policy (Sanchez,
Wiley, & Goldman, 2006a). Moreover, if the Web page is peer-reviewed or highly rated
then it adds towards professionalism of the Website (Meola, 2004). In addition to meta
data given by the Website itself, other details such as domain type of the page, Website’s
speed score, Website score given by reviewers, child safety rating and awards received
contribute towards its professionalism score (Aggarwal, Oostendorp, Reddy, &
Indurkhya, 2014a; Caverlee & Liu, 2007; Schwarz & Morris, 2011b). In addition to these,
ratings given by qualified authors also contribute towards Website’s professionalism
(Pantola, Pancho-Festin, & Salvador, 2010b).
Using professionalism in QA systems
Professionalism category is useful where information should from organizations,
education sector and government Websites needs to be rated higher. For example, for the
question “Who is Pakistan’s chief of army staff?” the information taken from the
government of Pakistan would be considered more credible than information provided by
other community Websites. Another example would be for the question “What is the visa
for a tourist visa for Malaysia?”. This information may also be provided a number of
travel agents, which may provide increased prices for personal gain. Professionalism
category score can be used to ensure prices taken from Malaysian embassy Web page
gets a higher score. Professionalism category is helpful in this regard because the Web
servers used for hosting such Websites are powerful, professional, and popular among
experts, thus cover the factors used by this category. This is why professionalism category
can benefit greatly in score Web pages taken from professional Websites (Aggarwal &
Van Oostendorp, 2011; Aggarwal et al., 2014b).
56
2.2.3.5 Popularity
It deals with the Website’s reputation among Web users, which may be determined by
the number of times it is viewed and shared (Aggarwal & Van Oostendorp, 2011;
Aggarwal et al., 2014b). Popularity may also be determined by looking into the number
of users that have visited the Website or Web user’s past experience with the Website
itself. Social factors, such as the number of likes, shares, comments on the article, also
contribute towards popularity (Aggarwal & Van Oostendorp, 2011; Aggarwal et al.,
2014b; Gupta et al., 2014). A Website’s content’s credibility increases if it has been liked
or shared by Web users on social media like Facebook, Twitter, Google+, Linkedin, etc
(Metzger et al., 2010). Additionally, the popularity of Website’s social media may also
be used to determine its popularity, by checking its members count, global coverage, etc.
Ranking in search engine also matters as it contributes to Website’s popularity, as Search
Engine Optimization(SEO) companies that generate these scores consider a number of
popularity factors of a Web page to compute its score or rank (Aggarwal et al., 2014b;
Schwarz & Morris, 2011a; Tanaka, 2010; Yamamoto & Tanaka, 2011b).
Using popularity in QA systems
Popularity category is quite important when dealing with questions involving
popularity among Web users. For example, a user asks the question “Who is the most
trending person on Twitter?”. In this case, one needs to look into the Twitter’s Web pages
and highlight the person that has received the most popularity over a certain period of
time. In another question “Who is the World’s most famous football player?”, the QA
should rate Web page that are more popular among users. In the year 2017, one might
argue that “Christano Ronaldo” and “Lionel Messi” are equally famous but by
considering factors like followers on social media Websites, articles shared, and user
traffic on respective pages, the popularity category can make a better judgement. In this
57
case Christano Ronaldo should be the correct answer since he has 53M followers on
Twitter compared to 8.8M of Lionel Messi. Lastly, for the question “Who is Ronaldo?”,
the question maybe pointing towards all persons who have the name Ronaldo but the user
is more likely to be more interested in Christano Ronaldo since he is more popular. In this
case, the popularity category should rate the popular Webpages first. Thus, more
weighting should be given to popularity category when questions involve public opinion
or popularity among Web users (Aggarwal & Van Oostendorp, 2011; Aggarwal et al.,
2014b; Gupta et al., 2014).
2.2.3.6 Impartiality
This check makes sure that the content presented is un-biased (Meola, 2004; Ostenson,
2014). This can be checked by checking the sentiment or tone of the article. An un-biased
article will be well-balanced by being neutral on the matter, without being too positive or
negative on the matter. Similarly, the tone of the content can give insight about its
impartiality by making sure that the author’s tone is not negative (Aggarwal et al., 2014a).
Researchers have used several factors for evaluating impartiality of content. Some
systems generated summary of the content in order to check its biasness (Schwarz &
Morris, 2011a). Shibuki et al. (2010a) proposed to generate mediatory summary of a
query by using arguments found on different search results, in order to determine whether
an argument posted on a Web page is positive or negative (Shibuki et al., 2010b).
Sentiment scores also contribute to impartiality as it calculates whether the content is
positive, negative or neutral (Aggarwal et al., 2014b). Similar to impartiality, Web
content’s tone can be used to judge its impartiality by checking if it contains ironic,
humorous, exaggerated or overblown arguments (Aggarwal et al., 2014a). Content being
peer-reviewed by a group of experts also adds up towards impartiality of the document
(Meola, 2004).
58
Using impartiality in QA systems
Impartiality category score plays a significant role when evaluating any page’s content.
However, it excels when considering reviews or comparing different entities. For
example, for the question “Who is the first king of England?”, the article written should
be neutral and written by higher authority(calculated using authority and
professionalism). This is because this question is contraversal with many people have
different views about it. Impartiality can assist here by making sure that the article is as
neutral as possible and is more likely to contain the correct answer over others that too
biased on the subject. Another question can be “How is the engine of Honda City 2017
model?”. In this question, the user is interested in impartial reviews about the car. The
Web is filled reviews that maybe biased in favor or not in favor of the car, and the
impartiality category score can address this issue but scoring such Web pages lower. This
category will allow comments like “The car offers 116 horsepower, which is decent in
this car category” over subjective comments like “I didn’t like the drive”, “I think the car
should had at least 150 horsepower instead of 116 horsepower”. Lastly, for the question
“Is Harvard university better than Oxford university?”, then the QA system can look into
reviews have received a high impartiality score to allow answers be extracted from it.
Thus, impartiality score is important in almost all kind of questions but it excels more in
questions involving reviews or comparison (Aggarwal & Van Oostendorp, 2011;
Aggarwal et al., 2014b; Meola, 2004; Ostenson, 2014).
2.2.3.7 Quality
This category measures the standard written material. This can be determined by checking
how well the article is written and whether the content has plagiarized or not (Molino et
al., 2015; Oh et al., 2012; Wu & Marian, 2011). Any information indicating that the article
59
has been reviewed by a professional in the area will also enhance the quality of the article
(Parsons, Duerr, & Minster, 2010).
There are several factors used for evaluating quality. Readability score is one of these
factors, which usually shows the grade level of the audience that will be able to
understand the content (Aggarwal & Van Oostendorp, 2011; Aggarwal et al., 2014b;
Microsoft Word, 2016). Plagiarism ratio is another factor that can be used in assessing
the quality of the content as original written materials are valued more over copied
material (Wu & Marian, 2011). In the case where the content is taken from a journal or is
peer-reviewed, ranking of the journal/proceeding can also be used for scoring quality
(Lee, Sugimoto, Zhang, & Cronin, 2013; Parsons et al., 2010). The peer-review system
also allows rating Websites containing quality material and for collaborative filtering of
Web content as well (Herlocker, Jung, & Webster, 2012).
Using quality in QA systems
Quality category plays an important role in almost all question types as one expects
the content to be well-written, original and in some cases of good article type. For
example, for the question “What is theory of relativity?”. In this question, the QA system
is expect to find the article written by Einstein, which may be in the form of journal or
book. In this case, the article type is check to ensure answers are fetch from the correct
sources of high quality. Moreover, the content will also be well written and original
allowing it to score higher than others stating the same facts. In another question “Name
one of the major gods of Hinduism?” would also expect the article to be written by a
professional author where the quality of the content is high having a high readability
score. Similarly, for the question “What is the definition of inertia?”, answer fetched from
books and journals should be rated higher. Thus, quality is generally used in all question
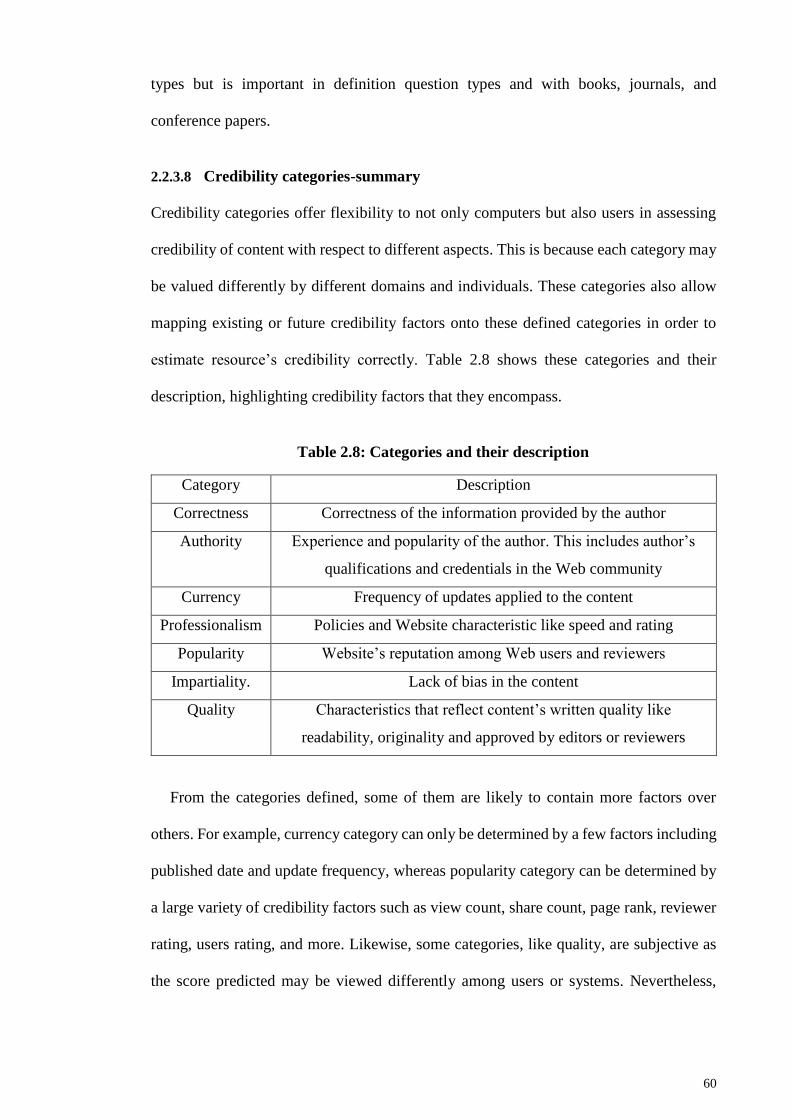
60
types but is important in definition question types and with books, journals, and
conference papers.
2.2.3.8 Credibility categories-summary
Credibility categories offer flexibility to not only computers but also users in assessing
credibility of content with respect to different aspects. This is because each category may
be valued differently by different domains and individuals. These categories also allow
mapping existing or future credibility factors onto these defined categories in order to
estimate resource’s credibility correctly. Table 2.8 shows these categories and their
description, highlighting credibility factors that they encompass.
Table 2.8: Categories and their description
From the categories defined, some of them are likely to contain more factors over
others. For example, currency category can only be determined by a few factors including
published date and update frequency, whereas popularity category can be determined by
a large variety of credibility factors such as view count, share count, page rank, reviewer
rating, users rating, and more. Likewise, some categories, like quality, are subjective as
the score predicted may be viewed differently among users or systems. Nevertheless,
Category Description
Correctness Correctness of the information provided by the author
Authority Experience and popularity of the author. This includes author’s
qualifications and credentials in the Web community
Currency Frequency of updates applied to the content
Professionalism Policies and Website characteristic like speed and rating
Popularity Website’s reputation among Web users and reviewers
Impartiality. Lack of bias in the content
Quality Characteristics that reflect content’s written quality like
readability, originality and approved by editors or reviewers

61
these categories contribute towards the final credibility score, and provide freedom to
assign weightings to each category in case one is favored more over the other.
In the next sub-section, this research covers different information systems,
highlighting credibility factors used and maps them to credibility factors. These factors
may be selected depending upon the system or resource whose credibility is being
evaluated.
2.2.4 Web credibility evaluation
Studies show that users lack training and skill sets to evaluate Web credibility accurately
(Flanagin & Metzger, 2000, 2003, 2008; Metzger et al., 2003), as covered in Section
2.2.2, and thus require a credibility assessment module for evaluation (see Section 2.2.3).
Over the years, researchers have suggested various evaluating techniques for aiding users
in making these credibility judgments. This research has divided these techniques into
two general techniques for evaluating credibility of Web content: 1) credibility evaluation
by users, and 2) credibility evaluation by computers, as shown in Figure 2.3.
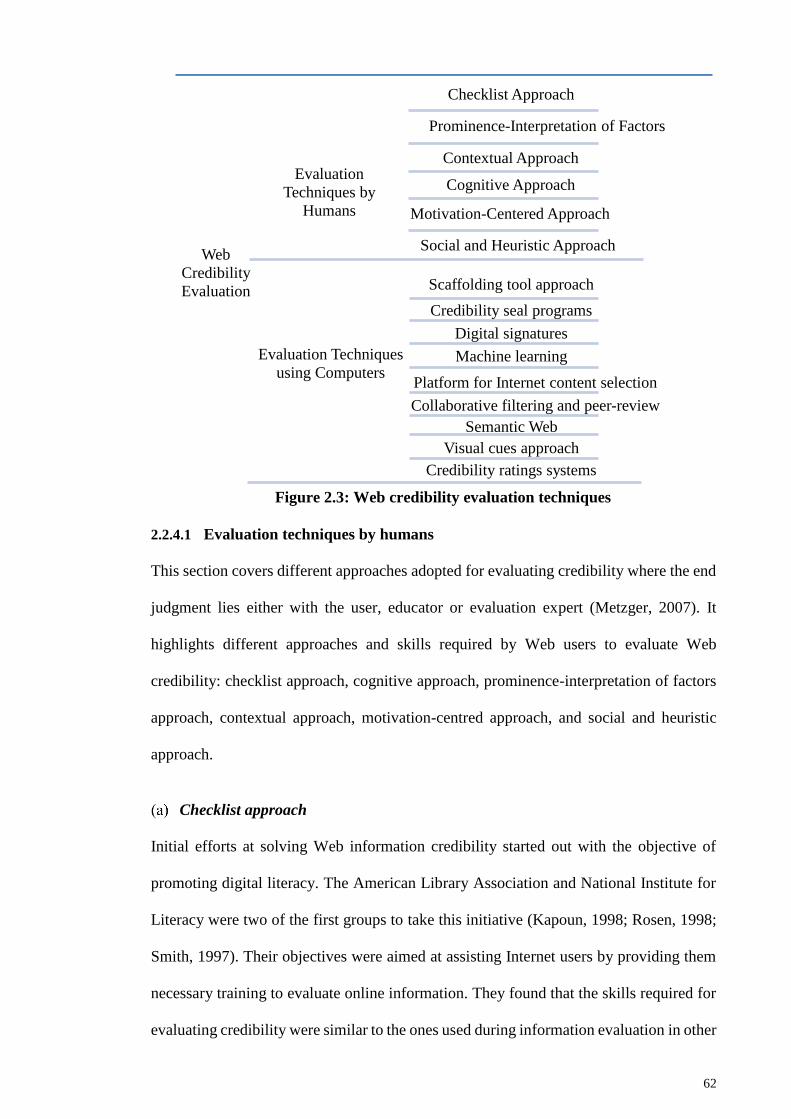
62
Figure 2.3: Web credibility evaluation techniques
2.2.4.1 Evaluation techniques by humans
This section covers different approaches adopted for evaluating credibility where the end
judgment lies either with the user, educator or evaluation expert (Metzger, 2007). It
highlights different approaches and skills required by Web users to evaluate Web
credibility: checklist approach, cognitive approach, prominence-interpretation of factors
approach, contextual approach, motivation-centred approach, and social and heuristic
approach.
Checklist approach
Initial efforts at solving Web information credibility started out with the objective of
promoting digital literacy. The American Library Association and National Institute for
Literacy were two of the first groups to take this initiative (Kapoun, 1998; Rosen, 1998;
Smith, 1997). Their objectives were aimed at assisting Internet users by providing them
necessary training to evaluate online information. They found that the skills required for
evaluating credibility were similar to the ones used during information evaluation in other
Web
Credibility
Evaluation
Evaluation
Techniques by
Humans
Checklist Approach
Prominence-Interpretation of Factors
Contextual Approach
Cognitive Approach
Motivation-Centered Approach
Social and Heuristic Approach
Evaluation Techniques
using Computers
Scaffolding tool approach
Credibility seal programs
Digital signatures
Machine learning
Platform for Internet content selection
Collaborative filtering and peer-review
Semantic Web
Visual cues approach
Credibility ratings systems
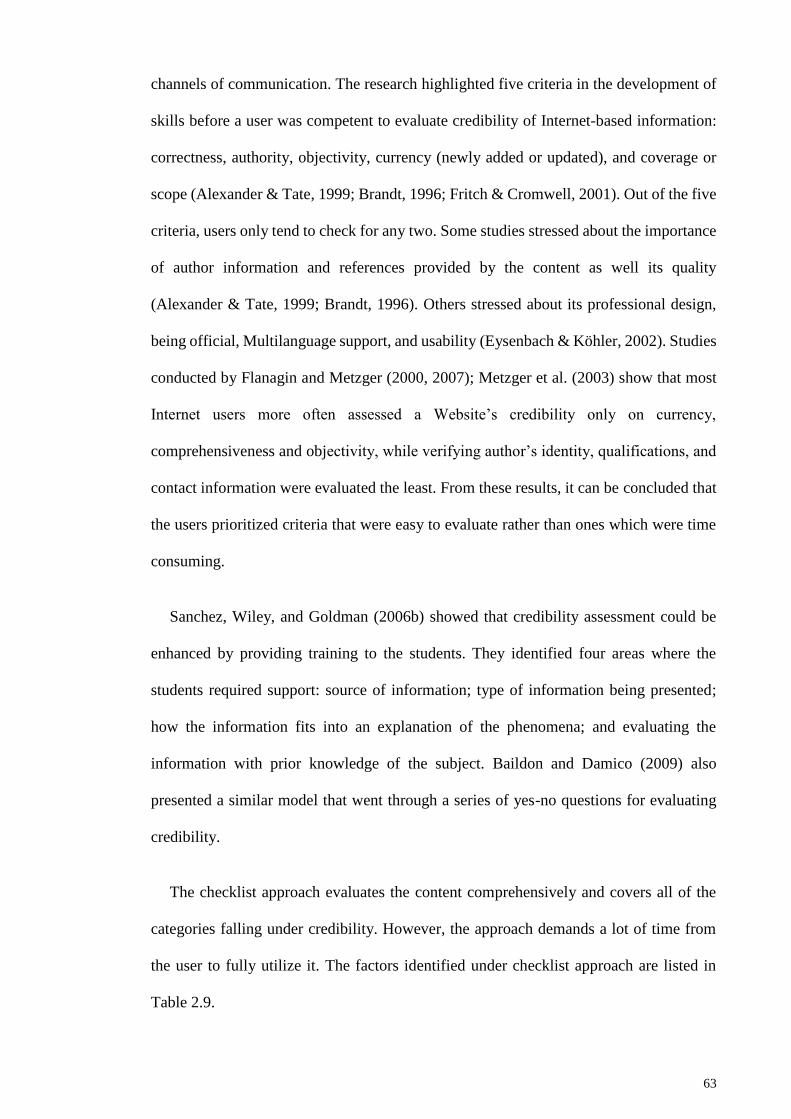
63
channels of communication. The research highlighted five criteria in the development of
skills before a user was competent to evaluate credibility of Internet-based information:
correctness, authority, objectivity, currency (newly added or updated), and coverage or
scope (Alexander & Tate, 1999; Brandt, 1996; Fritch & Cromwell, 2001). Out of the five
criteria, users only tend to check for any two. Some studies stressed about the importance
of author information and references provided by the content as well its quality
(Alexander & Tate, 1999; Brandt, 1996). Others stressed about its professional design,
being official, Multilanguage support, and usability (Eysenbach & Köhler, 2002). Studies
conducted by Flanagin and Metzger (2000, 2007); Metzger et al. (2003) show that most
Internet users more often assessed a Website’s credibility only on currency,
comprehensiveness and objectivity, while verifying author’s identity, qualifications, and
contact information were evaluated the least. From these results, it can be concluded that
the users prioritized criteria that were easy to evaluate rather than ones which were time
consuming.
Sanchez, Wiley, and Goldman (2006b) showed that credibility assessment could be
enhanced by providing training to the students. They identified four areas where the
students required support: source of information; type of information being presented;
how the information fits into an explanation of the phenomena; and evaluating the
information with prior knowledge of the subject. Baildon and Damico (2009) also
presented a similar model that went through a series of yes-no questions for evaluating
credibility.
The checklist approach evaluates the content comprehensively and covers all of the
categories falling under credibility. However, the approach demands a lot of time from
the user to fully utilize it. The factors identified under checklist approach are listed in
Table 2.9.

64
Table 2.9: Factors mapped into categories for checklist approach
Category Factors Identified References
Correctness
Ability to verify claims elsewhere (e.g.,
external links), citations to scientific
data or references, source citations
(Alexander & Tate,
1999; Baildon &
Damico, 2009; Brandt,
1996; Flanagin &
Metzger, 2003; Fogg et
al., 2003b; Fogg, 2002b;
Sanchez et al., 2006b;
Wathen & Burkell, 2002)
Authority
Author identification, author
qualifications and credentials, presence
of contact information
(Alexander & Tate,
1999; Brandt, 1996;
Flanagin & Metzger,
2003; Fogg et al., 2003b;
Fogg, 2002b, 2003;
Freeman & Spyridakis,
2009a; Rieh, 2002)
Currency Presence of date stamp showing
information is current
(Alexander & Tate,
1999; Flanagin &
Metzger, 2003; Fogg et
al., 2003b; Fogg, 2002b,
2003; Wathen & Burkell,
2002)
Professionalism
Certifications or seals from trusted
third parties, absence of advertising,
absence of typographical errors and
broken links, domain name and URL
(suffix), download speed, multi-
language support, notification or
presence of editorial review process or
board, Sponsorship by of external links
to reputable organizations, presence of
privacy and security policies, easy
navigation, well-organized site,
(Baildon & Damico,
2009; Brandt, 1996;
Flanagin & Metzger,
2003; Fogg et al., 2003b;
Fogg, 2002b, 2003;
Sanchez et al., 2006b;
Wathen & Burkell, 2002)
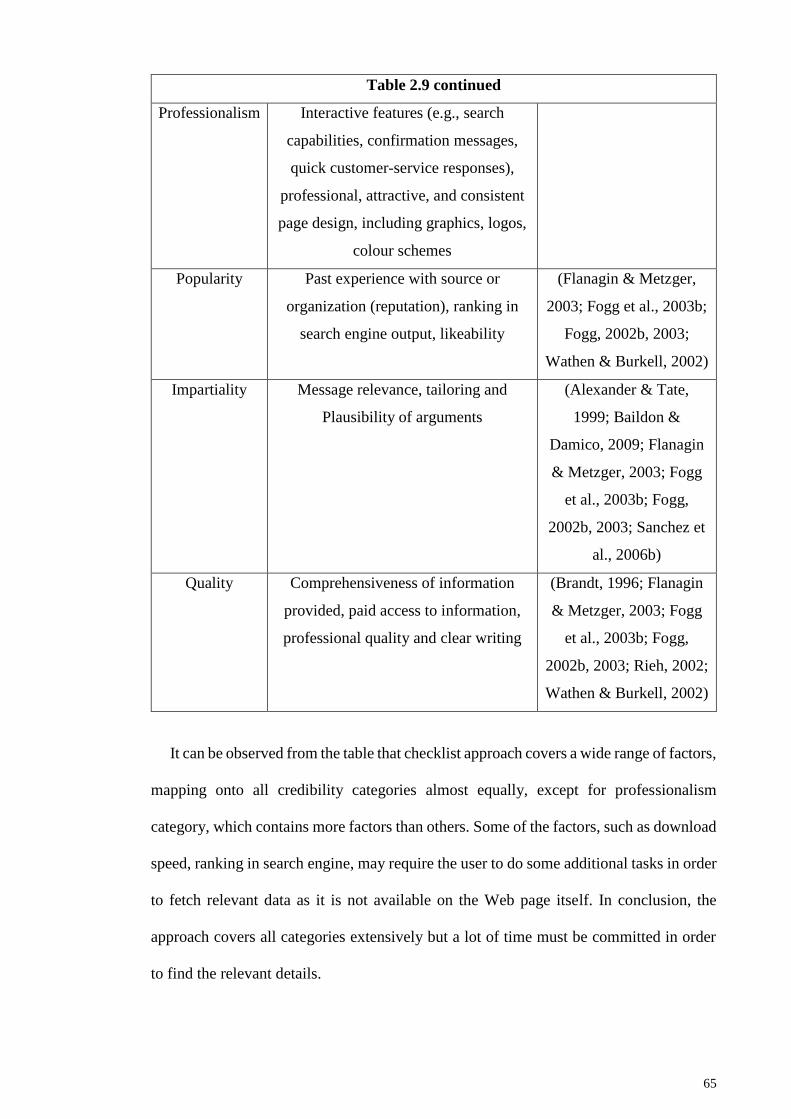
65
Table 2.9 continued
Professionalism
Interactive features (e.g., search
capabilities, confirmation messages,
quick customer-service responses),
professional, attractive, and consistent
page design, including graphics, logos,
colour schemes
Popularity
Past experience with source or
organization (reputation), ranking in
search engine output, likeability
(Flanagin & Metzger,
2003; Fogg et al., 2003b;
Fogg, 2002b, 2003;
Wathen & Burkell, 2002)
Impartiality Message relevance, tailoring and
Plausibility of arguments
(Alexander & Tate,
1999; Baildon &
Damico, 2009; Flanagin
& Metzger, 2003; Fogg
et al., 2003b; Fogg,
2002b, 2003; Sanchez et
al., 2006b)
Quality
Comprehensiveness of information
provided, paid access to information,
professional quality and clear writing
(Brandt, 1996; Flanagin
& Metzger, 2003; Fogg
et al., 2003b; Fogg,
2002b, 2003; Rieh, 2002;
Wathen & Burkell, 2002)
It can be observed from the table that checklist approach covers a wide range of factors,
mapping onto all credibility categories almost equally, except for professionalism
category, which contains more factors than others. Some of the factors, such as download
speed, ranking in search engine, may require the user to do some additional tasks in order
to fetch relevant data as it is not available on the Web page itself. In conclusion, the
approach covers all categories extensively but a lot of time must be committed in order
to find the relevant details.
66
Cognitive approach
Fritch and Cromwell (2001, 2002) proposed a model for introducing a cognitive authority
for assessing Web content information. By definition, cognition is the “mental process of
knowing, including aspects such as awareness, perception, reasoning, and judgment”
(Jonassen & Driscoll, 2003; Metzger & Flanagin, 2013). The model presented is iterative
in nature, where information seekers evaluate the credibility and quality at levels of
author, document, institution, and affiliations, and this is later integrated for global
judgment. The model looks into factors such as verifying the author or institution
information, and whether the content is reviewed by peers, and provides evidence for
supporting an argument, layout and presentation of the content, regularly updated content
and correctness of the document against other known evidence-based guidelines and
theories. Though the factors overlap with the criteria set out for the checklist approach,
the mechanism for evaluation differs. The cognitive approach gives importance to
technological tools (such as Who-is, NSlookup or Dig for providing domain info, and
Traceroute for providing network path details) for users for evaluating different criteria
(Fritch & Cromwell, 2001, 2002).
Wathen and Burkell (2002) proposed an iterative model based on a review of literature
in psychology and communication. The model divides credibility evaluation into three
stages, each evaluating certain criteria. The first stage deals with the overall impression
of the Website by looking at properties like appearance, colours, graphics and layout. The
second stage verifies trustworthiness, correctness and currency of the document. The last
stage takes into account factors relating to the user’s cognitive state when evaluating the
document. Therefore, the result may differ from user to user, depending on his or her
experience of the topic at hand. Metzger and Flanagin (2013) highlighted the use of
cognitive heuristics in credibility judgment. Their findings illustrate the types of cognitive

67
heuristic adopted by users to determine the credibility of the Web content and Web
resources.
The cognitive approach introduces cognitive skills of the user for evaluating the
content and thus the results produced differ between different users. This adds a new
dimension for evaluating Web credibility but the results may be questionable if we take
into account the person judgement. Table 2.10 lists factors identified under this approach.
Table 2.10: Factors mapped into categories for cognitive approach
Category Factors Identified References
Correctness
Correctness of the document against
other known evidence-based
guidelines and theories,
trustworthiness, accuracy, user’s
cognitive state evaluating the
document, provides evidence for
supporting an argument
(Fritch & Cromwell, 2001,
2002; Metzger & Flanagin,
2013; Wathen & Burkell,
2002)
Authority Verifying the author or institution
information,
(Fritch & Cromwell, 2001,
2002; Metzger & Flanagin,
2013)
Currency Regularly updated content
Currency of the document.
(Fritch & Cromwell, 2001,
2002; Metzger & Flanagin,
2013; Wathen & Burkell,
2002)
Professionalism Layout and presentation of the
content, Website’s visual
appearance, colours, graphics and
layout.
(Fritch & Cromwell, 2001,
2002; Wathen & Burkell,
2002)
Popularity None
Impartiality None
Quality The content is reviewed by peers
and depth of the article
(Fritch & Cromwell, 2001,
2002; Metzger & Flanagin,
2013)
68
The number of factors covered by cognitive approach is not as comprehensive as the
checklist approach. This is because studies using cognitive approach did not test any
factor belonging to categories such as popularity and impartiality. However, in
comparison to the checklist approach, cognitive approach take into account user cognitive
skills in evaluating factors.
Prominence-interpretation of factors approach
Though the checklist and cognitive approaches provide criteria for evaluating credibility,
conventional Internet users nonetheless set their own criteria for measuring it. It is safe to
say that Internet users perceive information differently as compared to researchers and
set their own precedence and interpretation for evaluating credibility.
Eysenbach and Köhler (2002) conducted a study to verify this claim. The study
involved 21 participants who were asked to identify the criteria they thought were
important for evaluating credibility. The researchers reported that the criteria which the
participants chose gave precedence to the official authority of the source, presence of
scientific citations, professional design, ease of use, and multiple language or user’s
preferred language support. One interesting observation made by the researchers was that
very few participants looked into the authenticity of the source while evaluating the
Website.
Dochterman and Stamp (2010) explored how Web users make credibility judgments.
They formed three focus groups, which were asked to examine Websites and comment
on them. A total of 629 comments were collected about users’ perceptions of Web
credibility assessment. The focus groups narrowed down twelve credibility factors
impacting their judgment, including authority, page layout, site motive, URL, crosscheck
ability, user motive, content date, professionalism, site familiarity, process, and personal
beliefs.
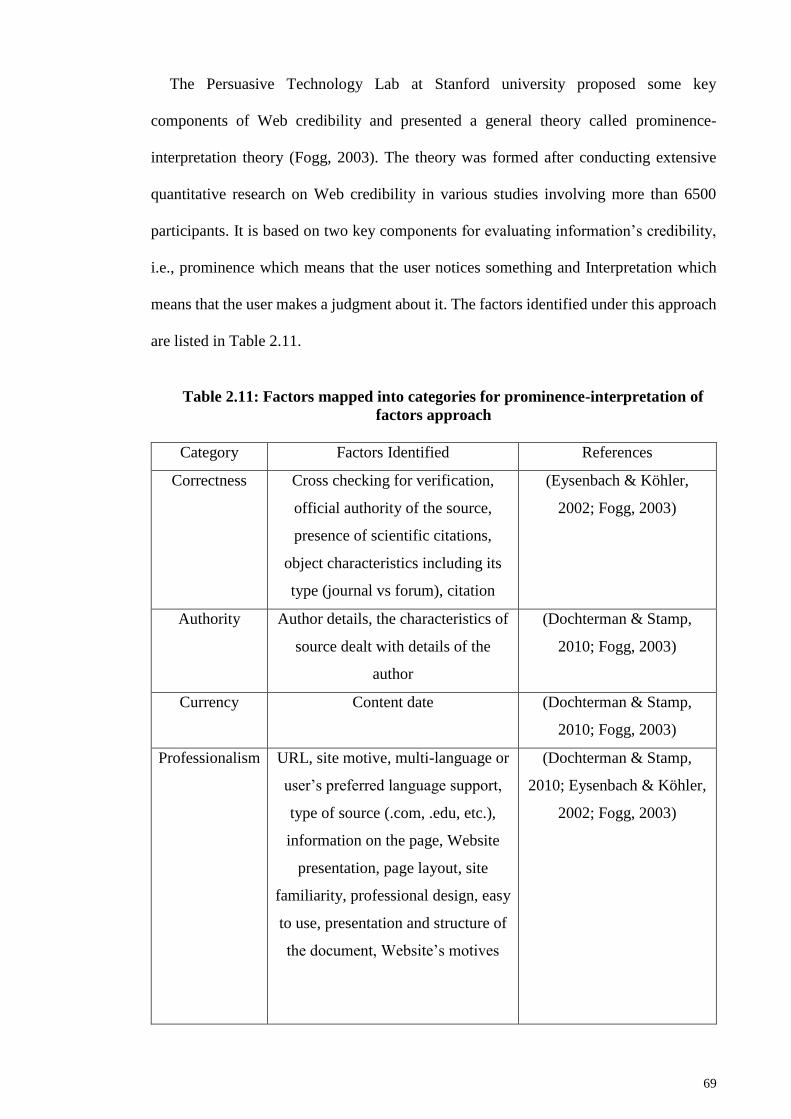
69
The Persuasive Technology Lab at Stanford university proposed some key
components of Web credibility and presented a general theory called prominence-
interpretation theory (Fogg, 2003). The theory was formed after conducting extensive
quantitative research on Web credibility in various studies involving more than 6500
participants. It is based on two key components for evaluating information’s credibility,
i.e., prominence which means that the user notices something and Interpretation which
means that the user makes a judgment about it. The factors identified under this approach
are listed in Table 2.11.
Table 2.11: Factors mapped into categories for prominence-interpretation of
factors approach
Category Factors Identified References
Correctness Cross checking for verification,
official authority of the source,
presence of scientific citations,
object characteristics including its
type (journal vs forum), citation
(Eysenbach & Köhler,
2002; Fogg, 2003)
Authority Author details, the characteristics of
source dealt with details of the
author
(Dochterman & Stamp,
2010; Fogg, 2003)
Currency Content date (Dochterman & Stamp,
2010; Fogg, 2003)
Professionalism URL, site motive, multi-language or
user’s preferred language support,
type of source (.com, .edu, etc.),
information on the page, Website
presentation, page layout, site
familiarity, professional design, easy
to use, presentation and structure of
the document, Website’s motives
(Dochterman & Stamp,
2010; Eysenbach & Köhler,
2002; Fogg, 2003)
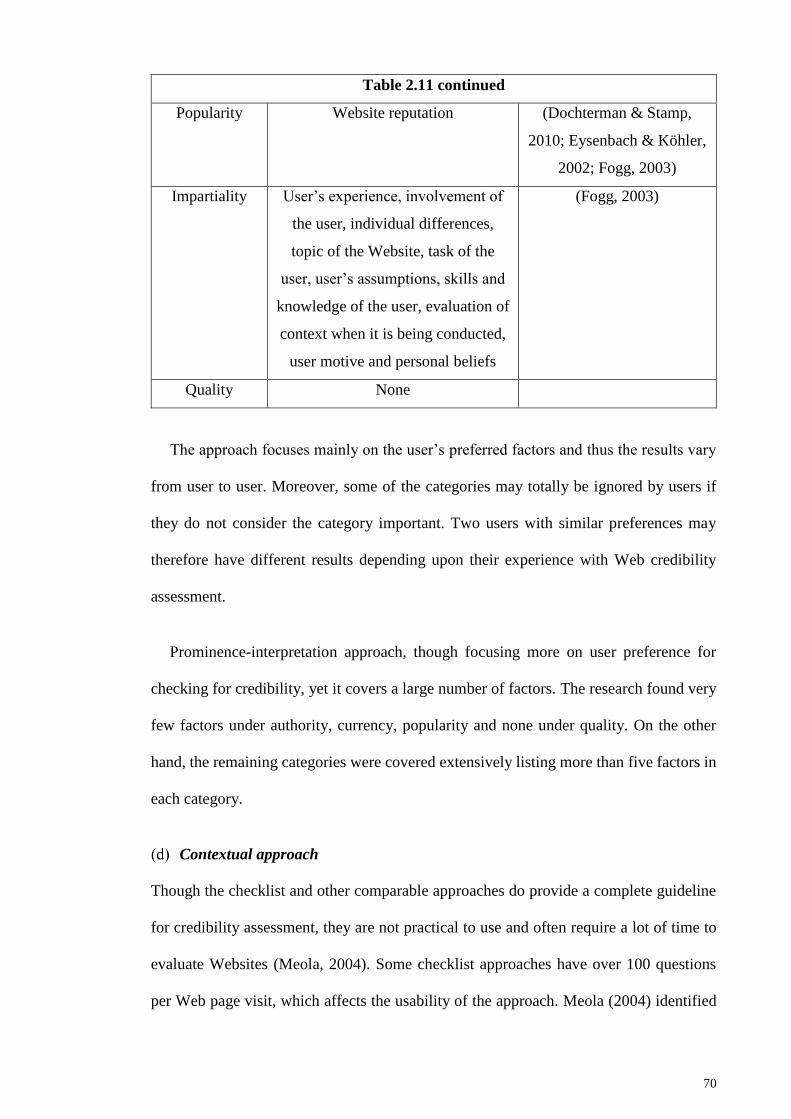
70
Table 2.11 continued
Popularity Website reputation (Dochterman & Stamp,
2010; Eysenbach & Köhler,
2002; Fogg, 2003)
Impartiality User’s experience, involvement of
the user, individual differences,
topic of the Website, task of the
user, user’s assumptions, skills and
knowledge of the user, evaluation of
context when it is being conducted,
user motive and personal beliefs
(Fogg, 2003)
Quality None
The approach focuses mainly on the user’s preferred factors and thus the results vary
from user to user. Moreover, some of the categories may totally be ignored by users if
they do not consider the category important. Two users with similar preferences may
therefore have different results depending upon their experience with Web credibility
assessment.
Prominence-interpretation approach, though focusing more on user preference for
checking for credibility, yet it covers a large number of factors. The research found very
few factors under authority, currency, popularity and none under quality. On the other
hand, the remaining categories were covered extensively listing more than five factors in
each category.
Contextual approach
Though the checklist and other comparable approaches do provide a complete guideline
for credibility assessment, they are not practical to use and often require a lot of time to
evaluate Websites (Meola, 2004). Some checklist approaches have over 100 questions
per Web page visit, which affects the usability of the approach. Meola (2004) identified
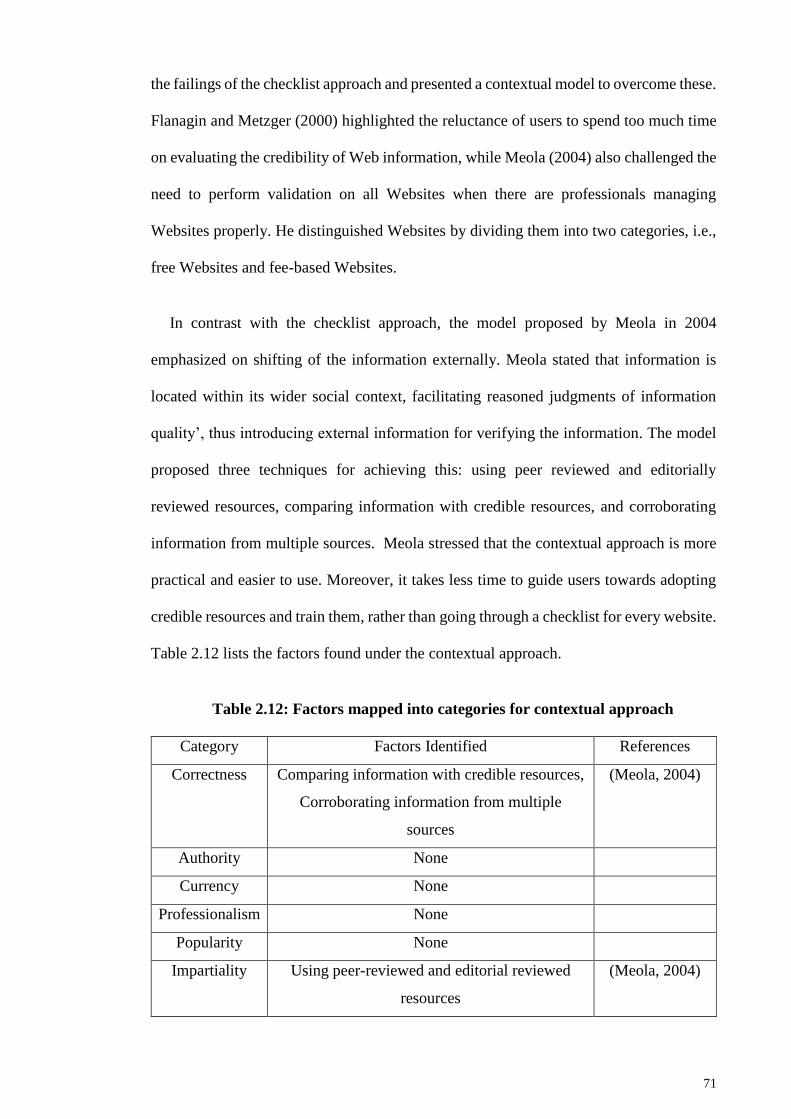
71
the failings of the checklist approach and presented a contextual model to overcome these.
Flanagin and Metzger (2000) highlighted the reluctance of users to spend too much time
on evaluating the credibility of Web information, while Meola (2004) also challenged the
need to perform validation on all Websites when there are professionals managing
Websites properly. He distinguished Websites by dividing them into two categories, i.e.,
free Websites and fee-based Websites.
In contrast with the checklist approach, the model proposed by Meola in 2004
emphasized on shifting of the information externally. Meola stated that information is
located within its wider social context, facilitating reasoned judgments of information
quality’, thus introducing external information for verifying the information. The model
proposed three techniques for achieving this: using peer reviewed and editorially
reviewed resources, comparing information with credible resources, and corroborating
information from multiple sources. Meola stressed that the contextual approach is more
practical and easier to use. Moreover, it takes less time to guide users towards adopting
credible resources and train them, rather than going through a checklist for every website.
Table 2.12 lists the factors found under the contextual approach.
Table 2.12: Factors mapped into categories for contextual approach
Category Factors Identified References
Correctness Comparing information with credible resources,
Corroborating information from multiple
sources
(Meola, 2004)
Authority None
Currency None
Professionalism None
Popularity None
Impartiality Using peer-reviewed and editorial reviewed
resources
(Meola, 2004)
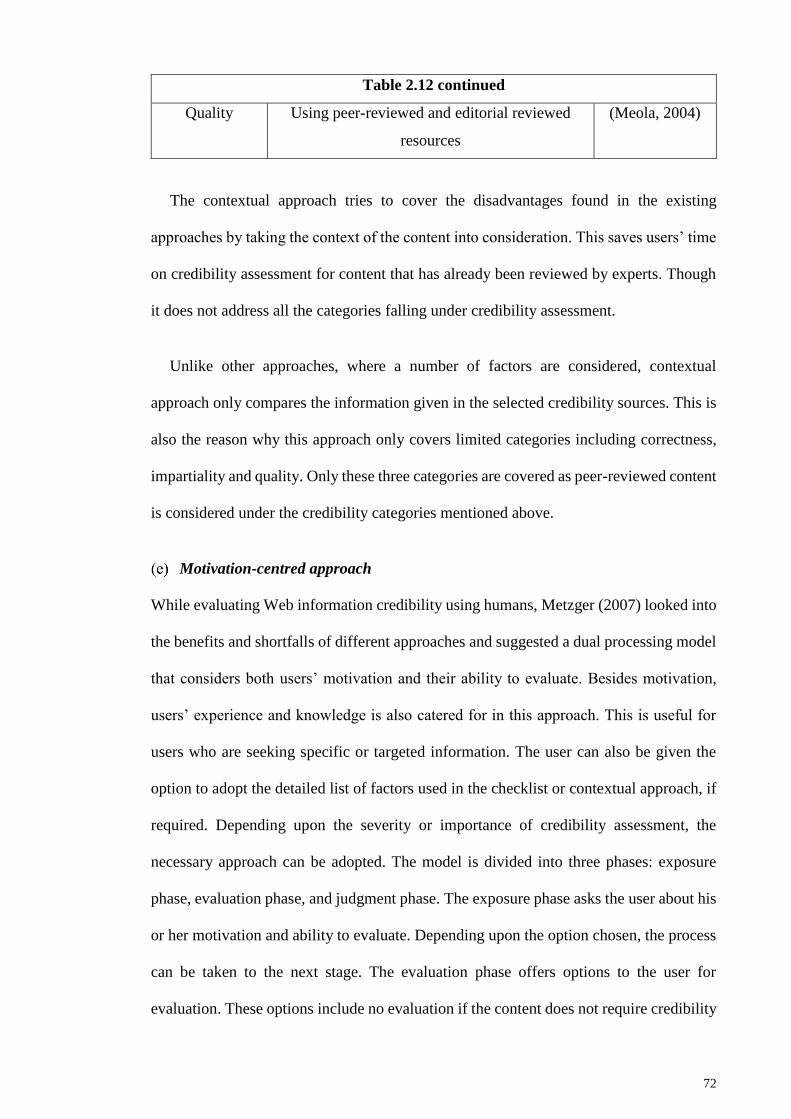
72
Table 2.12 continued
Quality Using peer-reviewed and editorial reviewed
resources
(Meola, 2004)
The contextual approach tries to cover the disadvantages found in the existing
approaches by taking the context of the content into consideration. This saves users’ time
on credibility assessment for content that has already been reviewed by experts. Though
it does not address all the categories falling under credibility assessment.
Unlike other approaches, where a number of factors are considered, contextual
approach only compares the information given in the selected credibility sources. This is
also the reason why this approach only covers limited categories including correctness,
impartiality and quality. Only these three categories are covered as peer-reviewed content
is considered under the credibility categories mentioned above.
Motivation-centred approach
While evaluating Web information credibility using humans, Metzger (2007) looked into
the benefits and shortfalls of different approaches and suggested a dual processing model
that considers both users’ motivation and their ability to evaluate. Besides motivation,
users’ experience and knowledge is also catered for in this approach. This is useful for
users who are seeking specific or targeted information. The user can also be given the
option to adopt the detailed list of factors used in the checklist or contextual approach, if
required. Depending upon the severity or importance of credibility assessment, the
necessary approach can be adopted. The model is divided into three phases: exposure
phase, evaluation phase, and judgment phase. The exposure phase asks the user about his
or her motivation and ability to evaluate. Depending upon the option chosen, the process
can be taken to the next stage. The evaluation phase offers options to the user for
evaluation. These options include no evaluation if the content does not require credibility
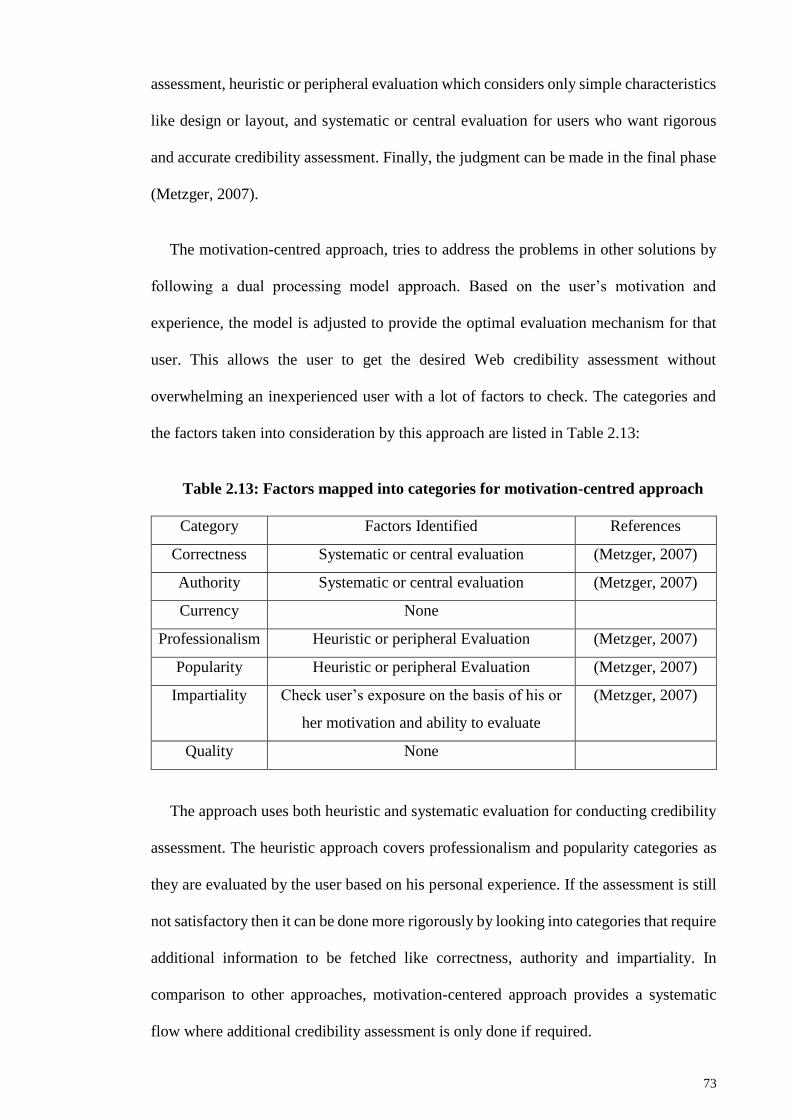
73
assessment, heuristic or peripheral evaluation which considers only simple characteristics
like design or layout, and systematic or central evaluation for users who want rigorous
and accurate credibility assessment. Finally, the judgment can be made in the final phase
(Metzger, 2007).
The motivation-centred approach, tries to address the problems in other solutions by
following a dual processing model approach. Based on the user’s motivation and
experience, the model is adjusted to provide the optimal evaluation mechanism for that
user. This allows the user to get the desired Web credibility assessment without
overwhelming an inexperienced user with a lot of factors to check. The categories and
the factors taken into consideration by this approach are listed in Table 2.13:
Table 2.13: Factors mapped into categories for motivation-centred approach
Category Factors Identified References
Correctness Systematic or central evaluation (Metzger, 2007)
Authority Systematic or central evaluation (Metzger, 2007)
Currency None
Professionalism Heuristic or peripheral Evaluation (Metzger, 2007)
Popularity Heuristic or peripheral Evaluation (Metzger, 2007)
Impartiality Check user’s exposure on the basis of his or
her motivation and ability to evaluate
(Metzger, 2007)
Quality None
The approach uses both heuristic and systematic evaluation for conducting credibility
assessment. The heuristic approach covers professionalism and popularity categories as
they are evaluated by the user based on his personal experience. If the assessment is still
not satisfactory then it can be done more rigorously by looking into categories that require
additional information to be fetched like correctness, authority and impartiality. In
comparison to other approaches, motivation-centered approach provides a systematic
flow where additional credibility assessment is only done if required.
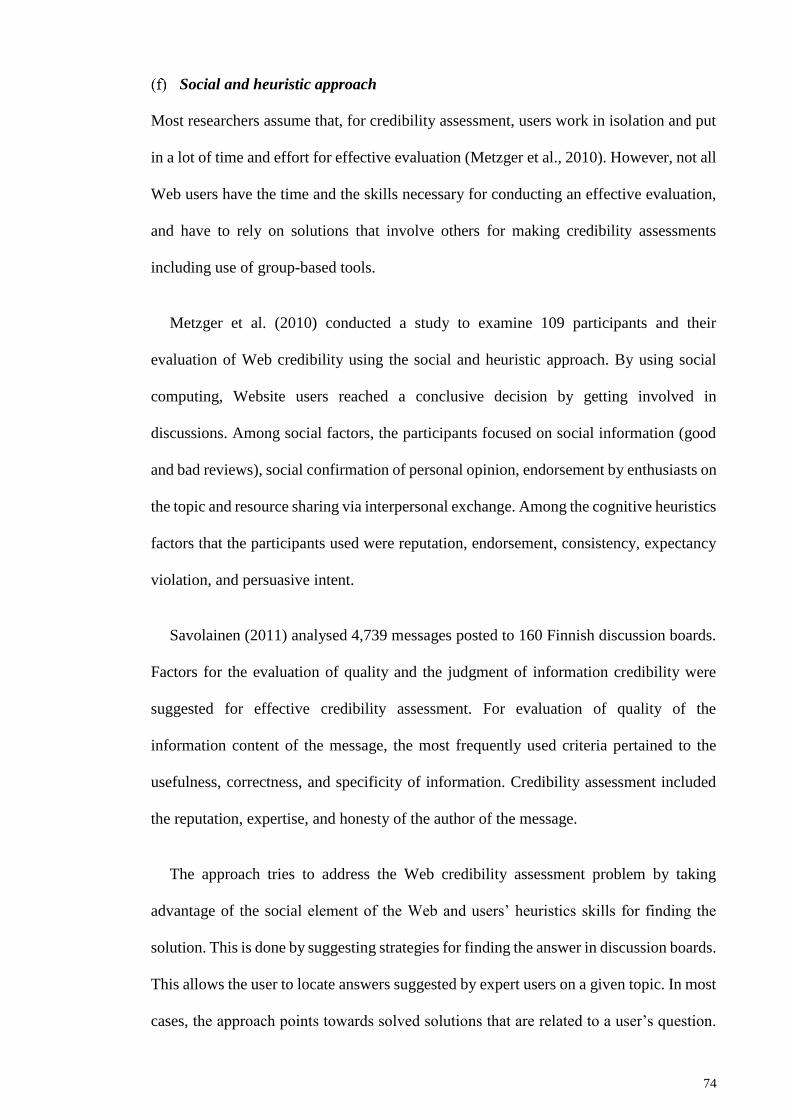
74
Social and heuristic approach
Most researchers assume that, for credibility assessment, users work in isolation and put
in a lot of time and effort for effective evaluation (Metzger et al., 2010). However, not all
Web users have the time and the skills necessary for conducting an effective evaluation,
and have to rely on solutions that involve others for making credibility assessments
including use of group-based tools.
Metzger et al. (2010) conducted a study to examine 109 participants and their
evaluation of Web credibility using the social and heuristic approach. By using social
computing, Website users reached a conclusive decision by getting involved in
discussions. Among social factors, the participants focused on social information (good
and bad reviews), social confirmation of personal opinion, endorsement by enthusiasts on
the topic and resource sharing via interpersonal exchange. Among the cognitive heuristics
factors that the participants used were reputation, endorsement, consistency, expectancy
violation, and persuasive intent.
Savolainen (2011) analysed 4,739 messages posted to 160 Finnish discussion boards.
Factors for the evaluation of quality and the judgment of information credibility were
suggested for effective credibility assessment. For evaluation of quality of the
information content of the message, the most frequently used criteria pertained to the
usefulness, correctness, and specificity of information. Credibility assessment included
the reputation, expertise, and honesty of the author of the message.
The approach tries to address the Web credibility assessment problem by taking
advantage of the social element of the Web and users’ heuristics skills for finding the
solution. This is done by suggesting strategies for finding the answer in discussion boards.
This allows the user to locate answers suggested by expert users on a given topic. In most
cases, the approach points towards solved solutions that are related to a user’s question.
75
This allows the user to use social and heuristics skills for each reaching a credibility
answer without taking too much time. Table 2.14: lists the factors and the credibility
categories used for evaluating.
Table 2.14: Factors mapped into categories for social and heuristic approach
Category Factors Identified References
Correctness Correctness, and specificity of
information.
(Metzger et al., 2010;
Savolainen, 2011)
Authority Expertise of the author, reputation of
the author
(Savolainen, 2011)
Currency None
Professionalism None
Popularity Social factors include social
information (good and bad reviews),
social confirmation of personal
opinion, endorsement by enthusiast on
the topic and resource sharing via
interpersonal exchange. cognitive
heuristics factors include reputation,
endorsement, consistency, expectancy
violation, and persuasive intent.
(Metzger et al., 2010;
Savolainen, 2011)
Impartiality Endorsement by enthusiast on the topic,
honesty of the author of the message
(Savolainen, 2011)
Quality For evaluation of message’s quality
usefulness, endorsement by enthusiasts
(Metzger et al., 2010)
This approach covers categories like popularity extensively, but some categories are
not covered at all including professionalism and currency. This is because the focus is
mainly limited to the answers provided by users on discussion/community boards. By
doing this, only factors relating to the content itself and user providing the solution is
looked into.
76
2.2.4.2 Evaluation techniques using computers
One of the shortfalls of using humans as evaluators for credibility assessment is that the
results vary depending upon users’ perception and interpretation of the information.
Moreover, the methods are either too time consuming, require user training or, in some
cases, require motivation to perform the task. Therefore, researchers have proposed
methods using computers for evaluation or assistance in Web information credibility
evaluation.
Metzger (2007) suggested alternative approaches to human evaluation. She
emphasized the problems faced when conducting evaluation with humans and the benefits
that can be achieved using computers. She suggested various approaches including
credibility seal programmes (for assisting users in located trusted Websites), credibility
rating systems, directories, databases, or search engines showing credible content only, a
platform for Internet content selection labels that establish the credibility of Internet
information, digital signatures, collaborative filtering, and peer review (Metzger, 2007).
Most of these approaches or their variants are being used today for evaluating Web
information credibility along with new approaches. The approaches discussed are:
scaffolding tool approach, visual cues approach, credibility seal programmes, credibility
ratings systems, digital signatures, platform for Internet content selection, collaborative
filtering and peer-review, machine learning, and semantic Web.
Scaffolding tool approach
Scaffolding tools provide helpful features to make the credibility assessment process
easier. Some of these systems are in the form of Web-based learning platforms while
others assist in fetching credible information off the Web.
STOCHASMOS, a Web-based learning platform, acts as a scaffolding tool for helping
students in scientific reasoning (Kyza & Constantinou, 2007; Kyza & Edelson, 2005).
77
This is done by helping students to construct evidence-based explanations. The platform
provides features including omnipresent tools, inquiry environment tools and
STOCHASMOS reflective workspace tools.
Nicolaidou, Kyza, Terzian, Hadjichambis, and Kafouris (2011) shared a credibility
assessment framework for supporting high school students. This framework helps
students to develop skills for assessing credibility of information over the Web. The
results gathered from the group discussion showed that the students became aware of the
credibility criteria, allowing them to identify sources of low, medium and high credibility.
The exercise was done using the STOCHASMOS learning environment. When using the
framework for solving socio-scientific problems, the students went through passive
prompts to identify and rate credibility from 1 (low) to 5 (high) (Nicolaidou et al., 2011).
The framework required students to insert evidence (including its source) to support an
argument. Moreover, the evidence had to be rated on criteria related to credibility
containing funding, author’s background, type of publication and whether the study
included comparison between groups of studies.
This approach guides users to make better credibility judgements by providing an
interface using computers. Instead of doing the work manually, the approach helps users
do the task more easily by providing a mechanism to find evidence related to content’s
credibility. However, it does not provide any credibility assessment on its own. Table
2.15 lists the factors identified under this approach.
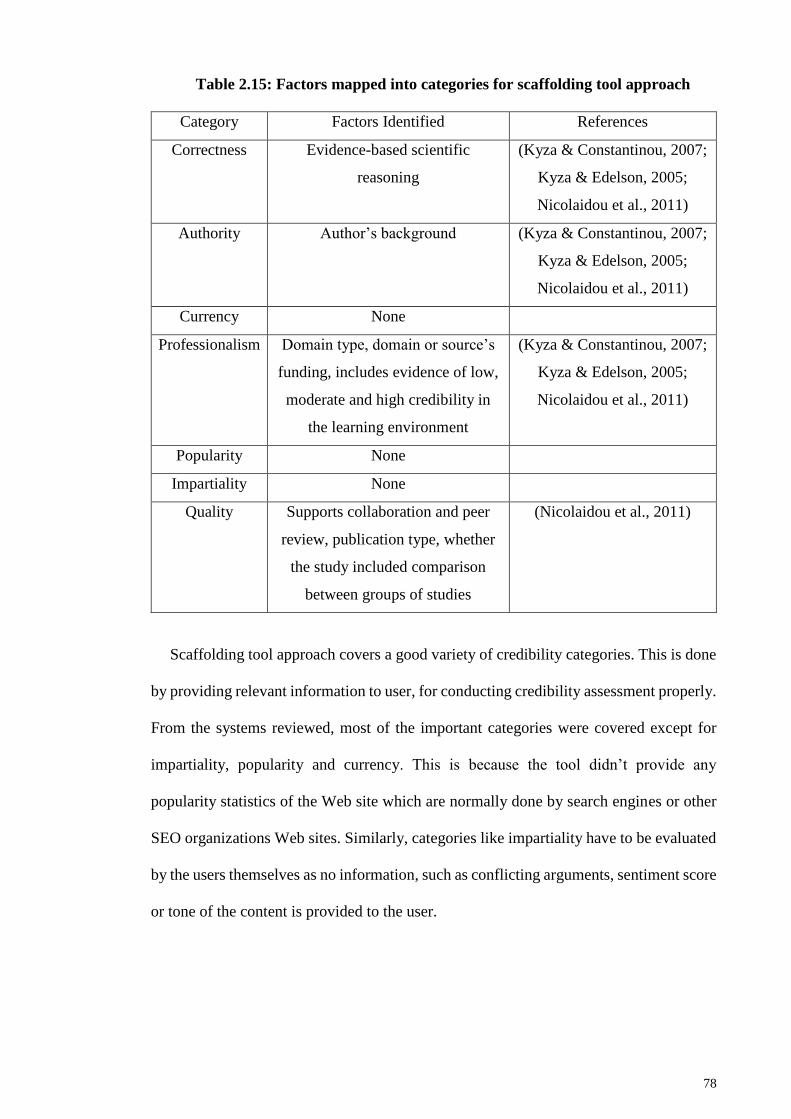
78
Table 2.15: Factors mapped into categories for scaffolding tool approach
Category Factors Identified References
Correctness Evidence-based scientific
reasoning
(Kyza & Constantinou, 2007;
Kyza & Edelson, 2005;
Nicolaidou et al., 2011)
Authority Author’s background (Kyza & Constantinou, 2007;
Kyza & Edelson, 2005;
Nicolaidou et al., 2011)
Currency None
Professionalism Domain type, domain or source’s
funding, includes evidence of low,
moderate and high credibility in
the learning environment
(Kyza & Constantinou, 2007;
Kyza & Edelson, 2005;
Nicolaidou et al., 2011)
Popularity None
Impartiality None
Quality Supports collaboration and peer
review, publication type, whether
the study included comparison
between groups of studies
(Nicolaidou et al., 2011)
Scaffolding tool approach covers a good variety of credibility categories. This is done
by providing relevant information to user, for conducting credibility assessment properly.
From the systems reviewed, most of the important categories were covered except for
impartiality, popularity and currency. This is because the tool didn’t provide any
popularity statistics of the Web site which are normally done by search engines or other
SEO organizations Web sites. Similarly, categories like impartiality have to be evaluated
by the users themselves as no information, such as conflicting arguments, sentiment score
or tone of the content is provided to the user.
79
Visual cues approach
Most search engines and Web pages do not show all the relevant information that is
necessary for making an accurate credibility assessment. Using visual cues to show the
score of different characteristics affecting credibility can greatly help Web users in
selecting credible Web resources (Schwarz & Morris, 2011b; Yamamoto & Tanaka,
2011a).
Yamamoto and Tanaka (2011a) highlighted the problems of Web search engines.
Instead of results list, showing only titles, snippets, and URLs for search results,
visualization about the Website’s correctness, objectivity, authority, currency and
coverage may also be presented to enhance the credibility judgment process. Credibility
factors such as referential importance using Google’s PageRank, reputation of source,
objectivity of content using LexRank algorithm, authority of page creator, topic coverage
and update frequency. Moreover, results are re-ranked by predicting the user’s credibility
judgment model through users’ credibility feedback for Web results.
Schwarz and Morris (2011b) also presented a similar approach in which they identified
different factors that are not available for end users. Moreover, some of the important
features, such as popularity among specialized user groups, are currently difficult for end
users to assess but do provide useful information regarding credibility. The factors were
gathered from search results and the Web page itself. For search results, expert popularity,
summary, URL, awards, title, result rank, page rank, and overall popularity were selected
and for the Web page itself factual correctness, expert popularity, citations, familiarity
with site, title, domain type, look and feel, author information, awards, page rank, overall
popularity, popularity over time, number of ads and where people are visiting from were
selected. The proposed solution presents visualizations designed to augment search
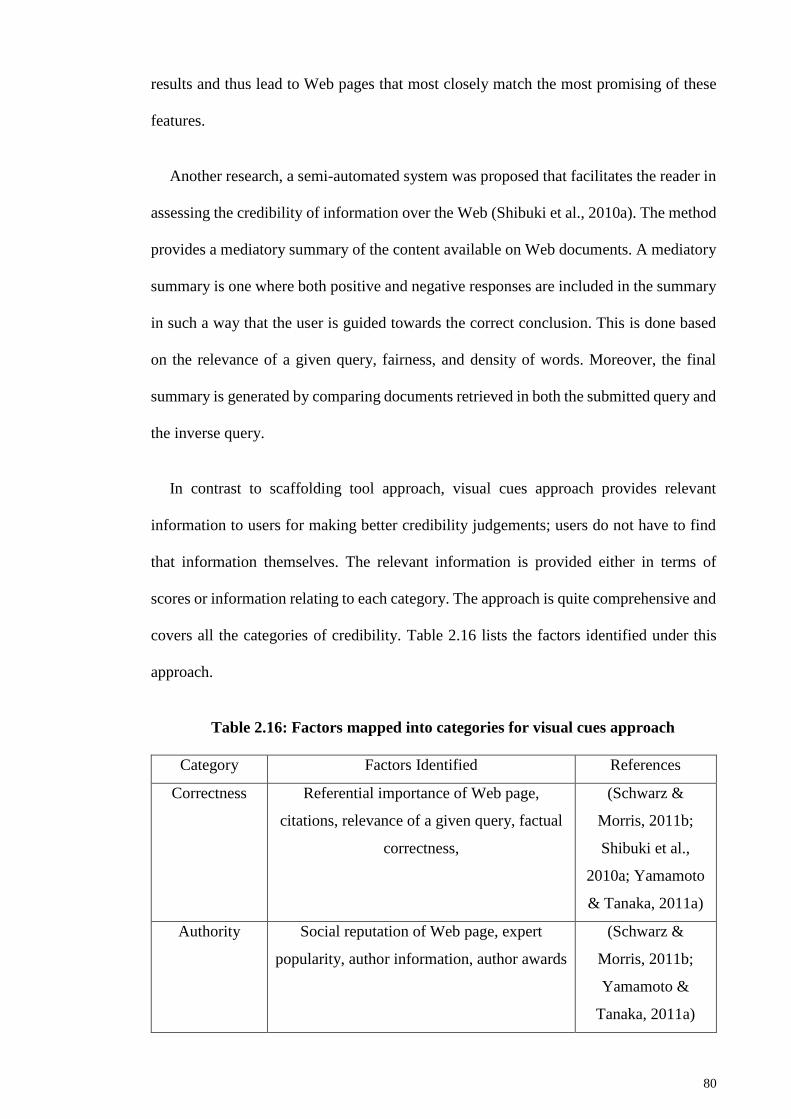
80
results and thus lead to Web pages that most closely match the most promising of these
features.
Another research, a semi-automated system was proposed that facilitates the reader in
assessing the credibility of information over the Web (Shibuki et al., 2010a). The method
provides a mediatory summary of the content available on Web documents. A mediatory
summary is one where both positive and negative responses are included in the summary
in such a way that the user is guided towards the correct conclusion. This is done based
on the relevance of a given query, fairness, and density of words. Moreover, the final
summary is generated by comparing documents retrieved in both the submitted query and
the inverse query.
In contrast to scaffolding tool approach, visual cues approach provides relevant
information to users for making better credibility judgements; users do not have to find
that information themselves. The relevant information is provided either in terms of
scores or information relating to each category. The approach is quite comprehensive and
covers all the categories of credibility. Table 2.16 lists the factors identified under this
approach.
Table 2.16: Factors mapped into categories for visual cues approach
Category Factors Identified References
Correctness Referential importance of Web page,
citations, relevance of a given query, factual
correctness,
(Schwarz &
Morris, 2011b;
Shibuki et al.,
2010a; Yamamoto
& Tanaka, 2011a)
Authority Social reputation of Web page, expert
popularity, author information, author awards
(Schwarz &
Morris, 2011b;
Yamamoto &
Tanaka, 2011a)

81
Table 2.16 continued
Currency Freshness of Web page, update frequency of
Web page
(Yamamoto &
Tanaka, 2011a)
Professionalism Domain type, Website awards, title, no
spelling errors, number of ads
(Schwarz &
Morris, 2011b)
Popularity Social reputation of Web page, result rank,
page rank, overall popularity, popularity over
time, where people are visiting from
familiarity with site
(Schwarz &
Morris, 2011b;
Yamamoto &
Tanaka, 2011a)
Impartiality Content typicality of Web page and its
summary, positive and negative responses of
the given query, fairness, tone of content
(Shibuki et al.,
2010a; Yamamoto
& Tanaka, 2011a)
Quality Content typicality of Web page, coverage of
technical topics on Web page, density of
words
(Yamamoto &
Tanaka, 2011a)
As compared to the scaffolding approach, visual cues provide credibility assessment
score based on the factors used by the system for evaluating each category. Not only does
the approach cover all categories but also uses a number of factors for evaluating each
one of them. The only negative about the visual cues approach is that the scores are based
on the system itself and does not allow freedom to the user in prioritizing one category
over another. However, by providing visual cues for each category, it can be used to judge
which sources are better with respect to a specific category.
Credibility seal programmes
Credibility seal programmes suggest trusted Websites to Internet users by marking a
Website with an approval logo. Verification entities such as TRUSTe, BBB, and Guardian
e-Commerce verify Websites by looking into sites’ privacy policies (Jensen & Potts,
2004). This helps in highlighting credible Websites from fake ones, as among most visited
Websites 77% of them share their privacy policies (Adkinson, Eisenach, & Lenard, 2002;
Tsai, Egelman, Cranor, & Acquisti, 2011; Wu, Huang, Yen, & Popova, 2012).

82
TRUSTe is dedicated to building a consumer’s trust towards the Internet. By signalling
the user, the programme assures the user that the Website is credible. TRUSTe does an
initial evaluation of the Website and its policies to verify its consistency with TRUSTe
licensee’s requirements. After initial evaluation, a privacy program is placed that
continues to monitor the Website and its policies periodically. All initial and periodic
reviews are conducted at TRUSTe’s facility by accessing the Website and its policies. If
TRUSTe finds a Website not following its stated privacy practices then action is taken,
including complaint resolution, consequences for privacy breach, and privacy education
to consumers and business (Benassi, 1999). To prevent unauthorized use of the trademark,
TRUSTe provides a “click to verify” seal which links the user to TRUSTe secure server
to confirm Website’s participation. Rodrigues et al. (2013) reviewed prior seal
programme approaches and suggested an approach that enables these programmes to
unlock their full potential by the use of more comprehensive privacy certification
mechanisms, including data protection certification mechanisms, seals, and marks. The
factors covered by this approach are listed in Table 2.17.
Table 2.17: Factors mapped into categories for credibility seal programmes
Category Factors Identified References
Correctness None
Authority None
Currency None
Professionalism Privacy policies, meeting the requirement
of the license, this includes complaint
resolution, consequences for privacy
breach, privacy education to consumers
and business, privacy certification
mechanisms including data protection
certification mechanisms, seals, and marks
(Adkinson et al.,
2002; Benassi, 1999;
Jensen & Potts, 2004;
Rodrigues et al., 2013;
Tsai et al., 2011; Wu
et al., 2012)
Popularity None
83
Table 2.17 continued
Impartiality None
Quality None
Credibility seal programmes act as filter to allow credible information only. One of
the shortfalls of credibility seal programmes approach is that information provided to user
is often limited due coverage of fewer credibility categories. This is because only the
Websites marked as credible by seal programmes are considered for answer extraction
and a Website containing the necessary info may be ignored. Moreover, the approach
addresses only a few credibility categories.
As compared to other approaches, credibility seal programmes only cover
professionalism score as the factors covered by them fall under this category only.
Though, it certainly helps in selecting Websites that have been marked as credible by
authentic organizations, the quality of the content or Website’s popularity still remains a
question mark. Unless an expert plans to focus primarily on professionalism other
approaches must be considered for giving a better overall credible assessment of the Web
page.
Credibility rating systems
The rise in online social networking Websites and collaborative editing tools has allowed
users to share content and approve information because of features such as rating tools,
comment boxes, collaborative linking and community-editable content. These tools allow
users to give feedback, suggest changes, criticize and, in some cases, edit information.
Social navigation tools, recommendation systems, reputation systems, and rating systems
are all different types of social feedback systems for Websites serving the same purpose
(Aggarwal et al., 2014b; Dieberger, Dourish, Höök, Resnick, & Wexelblat, 2000; Gupta
84
et al., 2014; List et al., 2017; Metzger, 2005; Rainie & Hitlin, 2004; Resnick & Varian,
1997; Shardanand & Maes, 1995).
Giudice (2010) conducted a study to determine the impact of audience feedback on
Web page credibility. For the study, three practice and eight experimental Web pages
containing audience feedback in the form of thumbs-up and thumbs-down were chosen.
These pages had four types of rating: good (90% positive, 10% negative), bad (10%
positive, 90% negative), neutral (50% positive, 50% negative) or no rating. Moreover, a
range of audience feedback, consisting of high (20,000 audience members) and low levels
(2,000 audience members), was also used for checking the behaviour of the participants
(Giudice, 2010). A total of 183 participants underwent the study. The results showed that
the participants considered a Web page more credible if it had a good rating from its
audience. The study also showed that the size of the audience had no major impact on the
participants’ decision (Giudice, 2010). Gupta et al. (2014) system is based on the same
principle in which the system rates credibility of tweets. This system uses factors such as
tweet source, time since tweet, content of tweet, presence of swear words, number of
followers of author, number of re-tweets, number of mentions, and reviewers score for
the tweet. List et al. (2017) also developed a system where users can check content’s
information, trustworthiness rating and citation to content.
A rater rating system proposed by Pantola, Pancho-Festin, and Salvador (2010a)
measures the credibility of the content and the author, based on the rating the author has
received. For computing the overall credibility of an article, an algorithm goes through
several steps including determining a set of raters, getting the set of ratings, computing
consolidated ratings, computing credibility rating, computing contributor reputation, and
computing rater reputation.
85
Adler and Alfaro (2007) proposed a content-driven reputation system that calculates
the amount of content added to or edited by authors which is preserved by subsequent
authors. This allows younger authors and editors to gain a good reputation if the content
is considered material of high quality by the original author, and penalized if it is the other
way round. Tests conducted on Italian and French Wikipedia, having over 691,551 pages,
showed that changes performed by low reputation authors resulted in poor quality
material (less credible), i.e., a larger than average probability of having poor quality.
Papaioannou, Ranvier, Olteanu, and Aberer (2012) proposed a decentralized social
recommender system for credibility assessment. The system takes into account social,
content and search-ranking components before passing a final judgment. Wang, Zou,
Wei, and Cui (2013) also proposed a trust model of content using a rating supervision
model. The model analyses the behaviour and trustworthiness of the network entities
using Website’s content data, changes in data with respect to time and its application. An
artificial neural network is applied on these dimensions to form a trust model for checking
data credibility. The RATEWeb framework also provides a mechanism for providing trust
in service-oriented environments (Malik & Bouguettaya, 2009). It is based on a
collaborative model in which Web services (a software application that supports direct
interaction with other software applications using XML messages) share their experience
of service providers with other Web services using feedback ratings. These ratings are
used to evaluate a service provider’s reputation.
Although the approach looks promising, because ratings help Web users in judging the
credibility of content, some programmes do use unfair means to get high ratings to
mislead users (Liu, Yu, Miao, & Kot, 2013a; Liu, Nielek, Wierzbicki, & Aberer, 2013b).
A two-stage defence algorithm has been proposed by Liu et al. (2013b), which defends
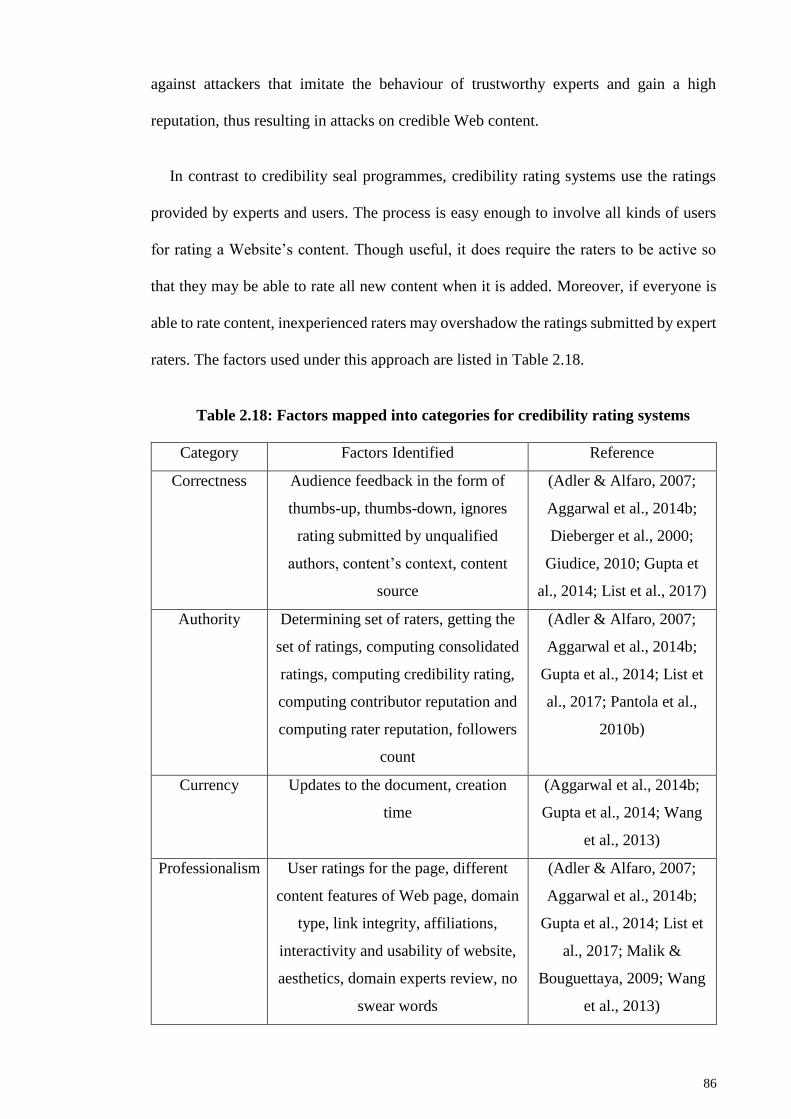
86
against attackers that imitate the behaviour of trustworthy experts and gain a high
reputation, thus resulting in attacks on credible Web content.
In contrast to credibility seal programmes, credibility rating systems use the ratings
provided by experts and users. The process is easy enough to involve all kinds of users
for rating a Website’s content. Though useful, it does require the raters to be active so
that they may be able to rate all new content when it is added. Moreover, if everyone is
able to rate content, inexperienced raters may overshadow the ratings submitted by expert
raters. The factors used under this approach are listed in Table 2.18.
Table 2.18: Factors mapped into categories for credibility rating systems
Category Factors Identified Reference
Correctness Audience feedback in the form of
thumbs-up, thumbs-down, ignores
rating submitted by unqualified
authors, content’s context, content
source
(Adler & Alfaro, 2007;
Aggarwal et al., 2014b;
Dieberger et al., 2000;
Giudice, 2010; Gupta et
al., 2014; List et al., 2017)
Authority Determining set of raters, getting the
set of ratings, computing consolidated
ratings, computing credibility rating,
computing contributor reputation and
computing rater reputation, followers
count
(Adler & Alfaro, 2007;
Aggarwal et al., 2014b;
Gupta et al., 2014; List et
al., 2017; Pantola et al.,
2010b)
Currency Updates to the document, creation
time
(Aggarwal et al., 2014b;
Gupta et al., 2014; Wang
et al., 2013)
Professionalism User ratings for the page, different
content features of Web page, domain
type, link integrity, affiliations,
interactivity and usability of website,
aesthetics, domain experts review, no
swear words
(Adler & Alfaro, 2007;
Aggarwal et al., 2014b;
Gupta et al., 2014; List et
al., 2017; Malik &
Bouguettaya, 2009; Wang
et al., 2013)
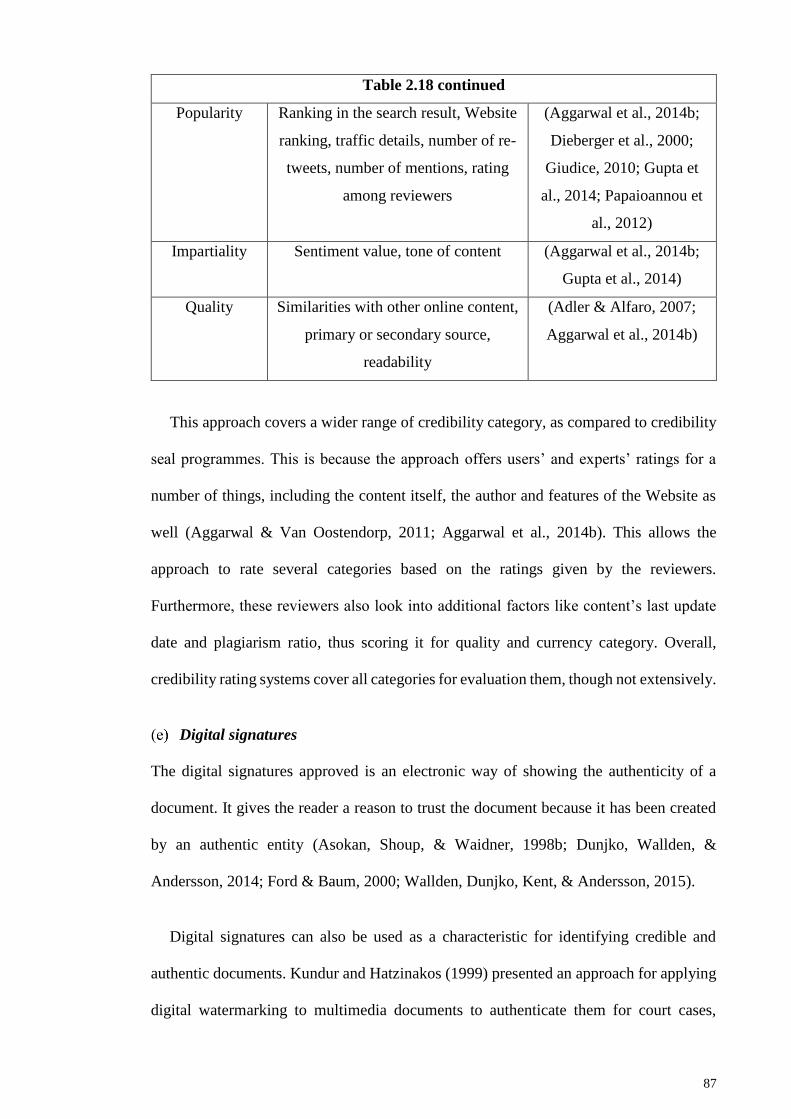
87
Table 2.18 continued
Popularity Ranking in the search result, Website
ranking, traffic details, number of re-
tweets, number of mentions, rating
among reviewers
(Aggarwal et al., 2014b;
Dieberger et al., 2000;
Giudice, 2010; Gupta et
al., 2014; Papaioannou et
al., 2012)
Impartiality Sentiment value, tone of content (Aggarwal et al., 2014b;
Gupta et al., 2014)
Quality Similarities with other online content,
primary or secondary source,
readability
(Adler & Alfaro, 2007;
Aggarwal et al., 2014b)
This approach covers a wider range of credibility category, as compared to credibility
seal programmes. This is because the approach offers users’ and experts’ ratings for a
number of things, including the content itself, the author and features of the Website as
well (Aggarwal & Van Oostendorp, 2011; Aggarwal et al., 2014b). This allows the
approach to rate several categories based on the ratings given by the reviewers.
Furthermore, these reviewers also look into additional factors like content’s last update
date and plagiarism ratio, thus scoring it for quality and currency category. Overall,
credibility rating systems cover all categories for evaluation them, though not extensively.
Digital signatures
The digital signatures approved is an electronic way of showing the authenticity of a
document. It gives the reader a reason to trust the document because it has been created
by an authentic entity (Asokan, Shoup, & Waidner, 1998b; Dunjko, Wallden, &
Andersson, 2014; Ford & Baum, 2000; Wallden, Dunjko, Kent, & Andersson, 2015).
Digital signatures can also be used as a characteristic for identifying credible and
authentic documents. Kundur and Hatzinakos (1999) presented an approach for applying
digital watermarking to multimedia documents to authenticate them for court cases,
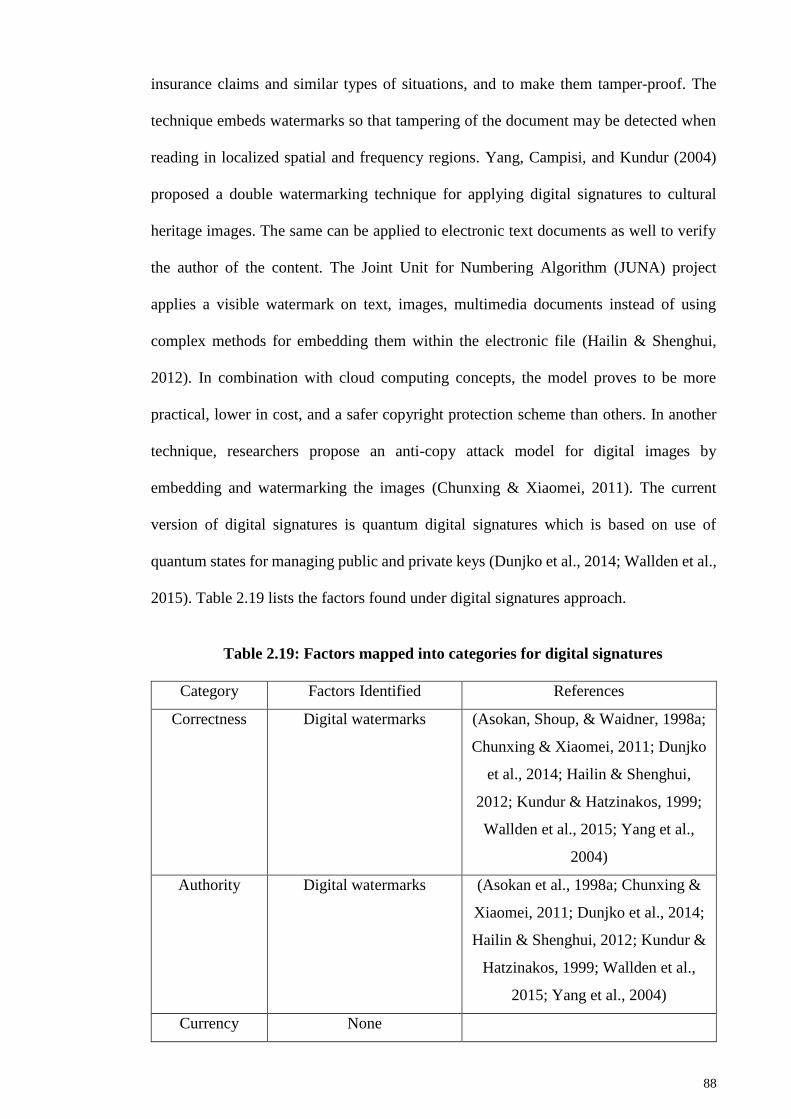
88
insurance claims and similar types of situations, and to make them tamper-proof. The
technique embeds watermarks so that tampering of the document may be detected when
reading in localized spatial and frequency regions. Yang, Campisi, and Kundur (2004)
proposed a double watermarking technique for applying digital signatures to cultural
heritage images. The same can be applied to electronic text documents as well to verify
the author of the content. The Joint Unit for Numbering Algorithm (JUNA) project
applies a visible watermark on text, images, multimedia documents instead of using
complex methods for embedding them within the electronic file (Hailin & Shenghui,
2012). In combination with cloud computing concepts, the model proves to be more
practical, lower in cost, and a safer copyright protection scheme than others. In another
technique, researchers propose an anti-copy attack model for digital images by
embedding and watermarking the images (Chunxing & Xiaomei, 2011). The current
version of digital signatures is quantum digital signatures which is based on use of
quantum states for managing public and private keys (Dunjko et al., 2014; Wallden et al.,
2015). Table 2.19 lists the factors found under digital signatures approach.
Table 2.19: Factors mapped into categories for digital signatures
Category Factors Identified References
Correctness Digital watermarks (Asokan, Shoup, & Waidner, 1998a;
Chunxing & Xiaomei, 2011; Dunjko
et al., 2014; Hailin & Shenghui,
2012; Kundur & Hatzinakos, 1999;
Wallden et al., 2015; Yang et al.,
2004)
Authority Digital watermarks (Asokan et al., 1998a; Chunxing &
Xiaomei, 2011; Dunjko et al., 2014;
Hailin & Shenghui, 2012; Kundur &
Hatzinakos, 1999; Wallden et al.,
2015; Yang et al., 2004)
Currency None

89
Table 2.19 continued
Professionalism Digital watermarks (Asokan et al., 1998a; Chunxing &
Xiaomei, 2011; Dunjko et al., 2014;
Hailin & Shenghui, 2012; Kundur &
Hatzinakos, 1999; Wallden et al.,
2015; Yang et al., 2004)
Popularity None
Impartiality None
Quality None
Digital signatures provide an easy mechanism to verify the credibility of a document.
This proves quite useful for measuring correctness and authority of the document.
However, its scope is limited and thus not all categories of credibility are covered.
Similar to credibility seal programmes approach, digital signatures only provides
credibility assessment for correctness, authority and professionalism categories. This is
because these signatures are used for verifying whether the document is taken from the
original source, thus verifying both the author and the source (Dunjko et al., 2014; Hao
& Su, 2012; Wallden et al., 2015). Similarly, it also adds in to the Website’s reputation
by providing a mechanism for users to verify the document’s credibility (Lu et al., 2017).
However, simply replying on the digital signatures is not enough, as the content itself
needs to be verified as well. Thus, use of other approaches is required in order to give a
clearer picture on the credibility of a resource.
Platform for Internet content selection
The purpose of this platform is to select and show credible content only (World Wide
Web Consortium, 2003). The idea was originally put forward by Resnick and Miller
(1996), whereby they emphasized the importance and need for a platform that filters
credible information. This is also useful for selecting content appropriate for certain age
groups such as children and teenagers. The system does this by using labels (metadata)
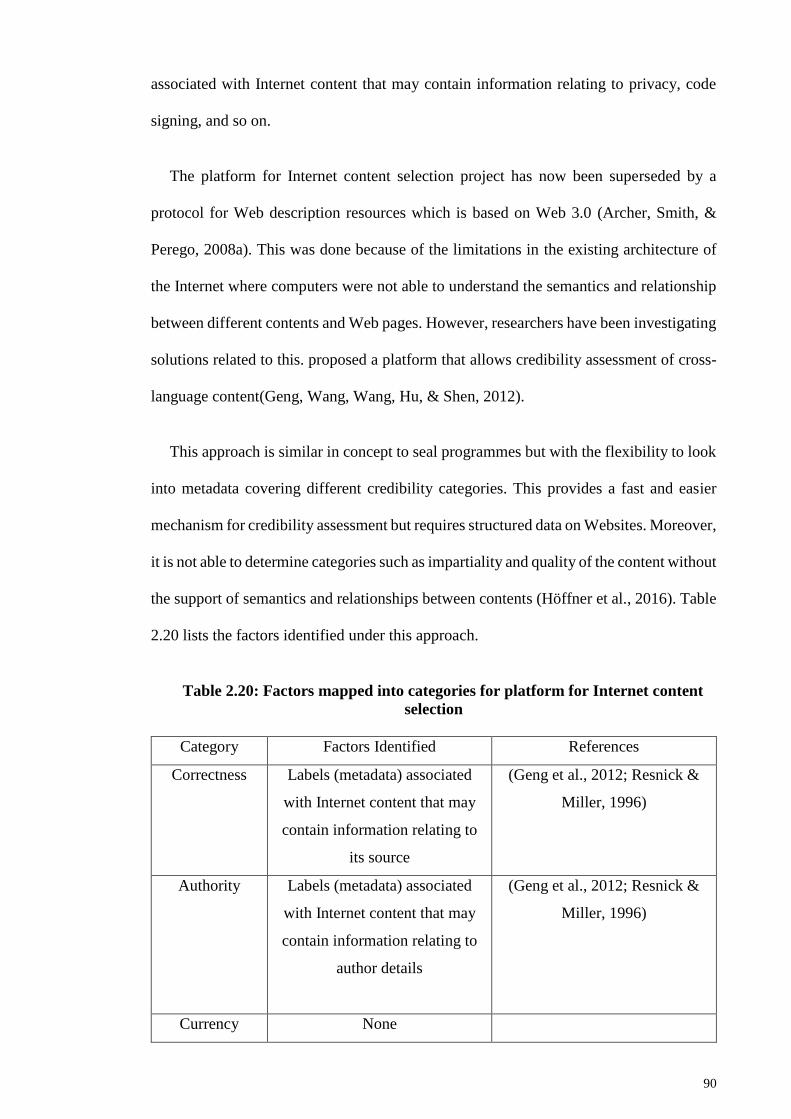
90
associated with Internet content that may contain information relating to privacy, code
signing, and so on.
The platform for Internet content selection project has now been superseded by a
protocol for Web description resources which is based on Web 3.0 (Archer, Smith, &
Perego, 2008a). This was done because of the limitations in the existing architecture of
the Internet where computers were not able to understand the semantics and relationship
between different contents and Web pages. However, researchers have been investigating
solutions related to this. proposed a platform that allows credibility assessment of cross-
language content(Geng, Wang, Wang, Hu, & Shen, 2012).
This approach is similar in concept to seal programmes but with the flexibility to look
into metadata covering different credibility categories. This provides a fast and easier
mechanism for credibility assessment but requires structured data on Websites. Moreover,
it is not able to determine categories such as impartiality and quality of the content without
the support of semantics and relationships between contents (Höffner et al., 2016). Table
2.20 lists the factors identified under this approach.
Table 2.20: Factors mapped into categories for platform for Internet content
selection
Category Factors Identified References
Correctness Labels (metadata) associated
with Internet content that may
contain information relating to
its source
(Geng et al., 2012; Resnick &
Miller, 1996)
Authority Labels (metadata) associated
with Internet content that may
contain information relating to
author details
(Geng et al., 2012; Resnick &
Miller, 1996)
Currency None
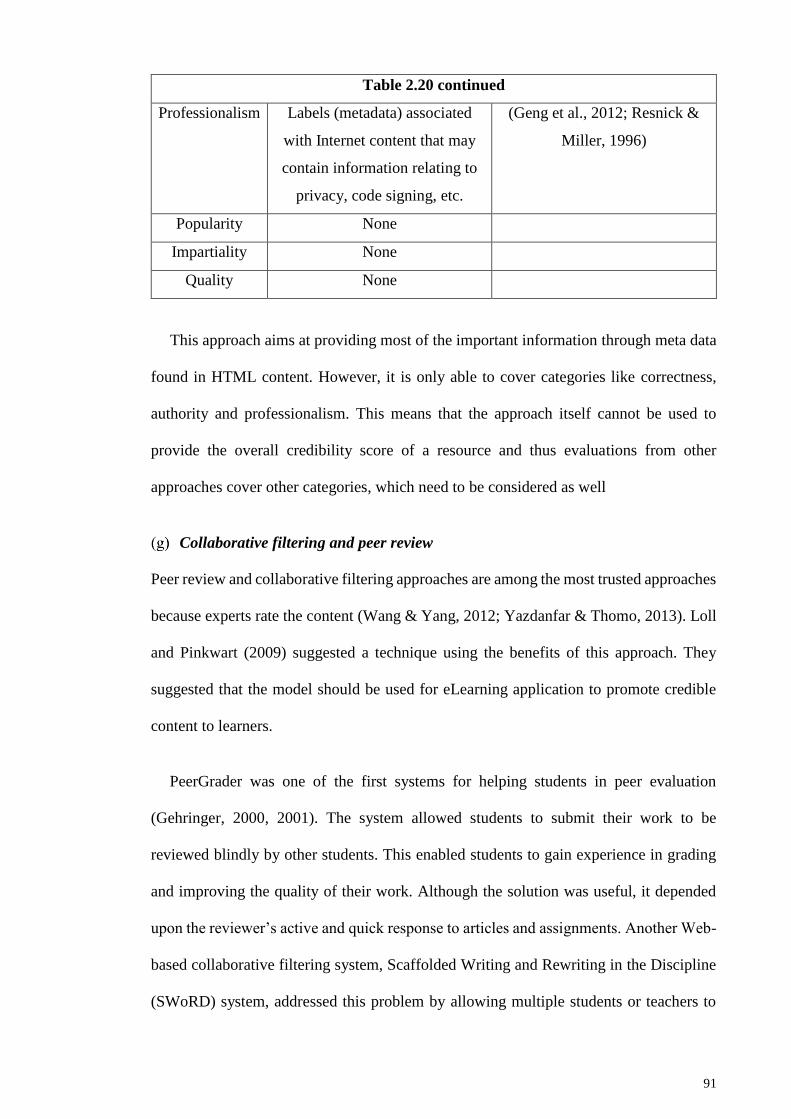
91
Table 2.20 continued
Professionalism Labels (metadata) associated
with Internet content that may
contain information relating to
privacy, code signing, etc.
(Geng et al., 2012; Resnick &
Miller, 1996)
Popularity None
Impartiality None
Quality None
This approach aims at providing most of the important information through meta data
found in HTML content. However, it is only able to cover categories like correctness,
authority and professionalism. This means that the approach itself cannot be used to
provide the overall credibility score of a resource and thus evaluations from other
approaches cover other categories, which need to be considered as well
Collaborative filtering and peer review
Peer review and collaborative filtering approaches are among the most trusted approaches
because experts rate the content (Wang & Yang, 2012; Yazdanfar & Thomo, 2013). Loll
and Pinkwart (2009) suggested a technique using the benefits of this approach. They
suggested that the model should be used for eLearning application to promote credible
content to learners.
PeerGrader was one of the first systems for helping students in peer evaluation
(Gehringer, 2000, 2001). The system allowed students to submit their work to be
reviewed blindly by other students. This enabled students to gain experience in grading
and improving the quality of their work. Although the solution was useful, it depended
upon the reviewer’s active and quick response to articles and assignments. Another Web-
based collaborative filtering system, Scaffolded Writing and Rewriting in the Discipline
(SWoRD) system, addressed this problem by allowing multiple students or teachers to
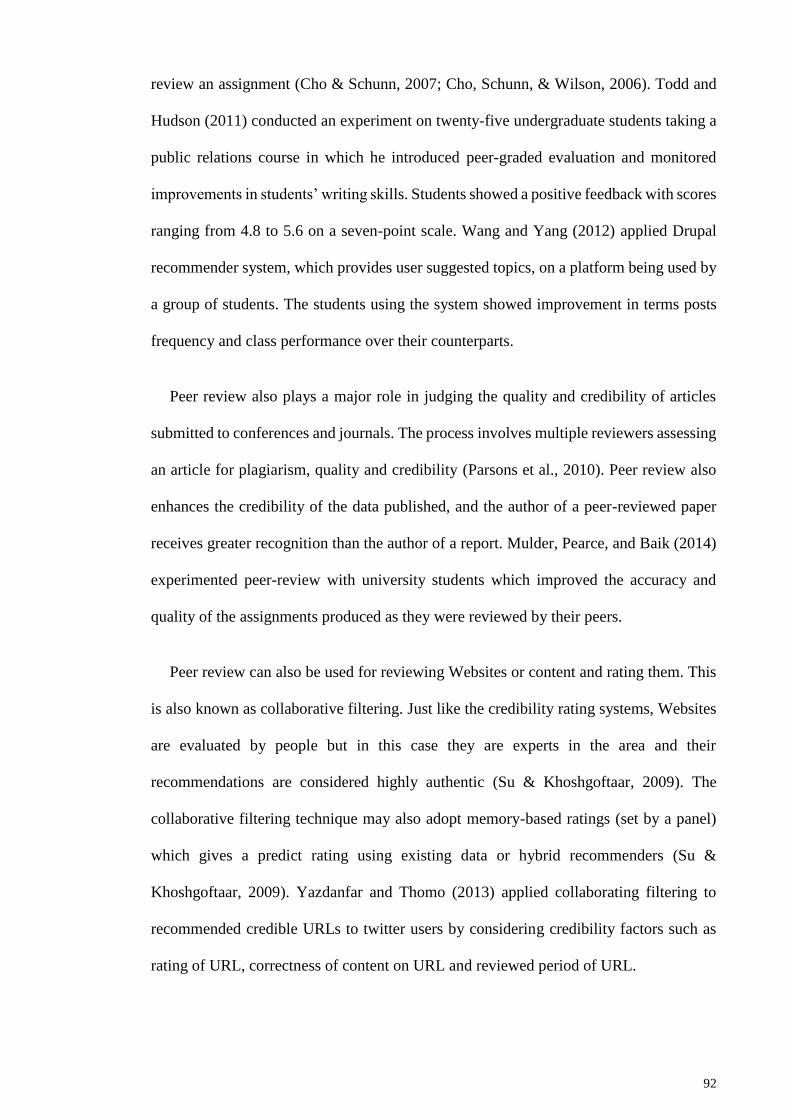
92
review an assignment (Cho & Schunn, 2007; Cho, Schunn, & Wilson, 2006). Todd and
Hudson (2011) conducted an experiment on twenty-five undergraduate students taking a
public relations course in which he introduced peer-graded evaluation and monitored
improvements in students’ writing skills. Students showed a positive feedback with scores
ranging from 4.8 to 5.6 on a seven-point scale. Wang and Yang (2012) applied Drupal
recommender system, which provides user suggested topics, on a platform being used by
a group of students. The students using the system showed improvement in terms posts
frequency and class performance over their counterparts.
Peer review also plays a major role in judging the quality and credibility of articles
submitted to conferences and journals. The process involves multiple reviewers assessing
an article for plagiarism, quality and credibility (Parsons et al., 2010). Peer review also
enhances the credibility of the data published, and the author of a peer-reviewed paper
receives greater recognition than the author of a report. Mulder, Pearce, and Baik (2014)
experimented peer-review with university students which improved the accuracy and
quality of the assignments produced as they were reviewed by their peers.
Peer review can also be used for reviewing Websites or content and rating them. This
is also known as collaborative filtering. Just like the credibility rating systems, Websites
are evaluated by people but in this case they are experts in the area and their
recommendations are considered highly authentic (Su & Khoshgoftaar, 2009). The
collaborative filtering technique may also adopt memory-based ratings (set by a panel)
which gives a predict rating using existing data or hybrid recommenders (Su &
Khoshgoftaar, 2009). Yazdanfar and Thomo (2013) applied collaborating filtering to
recommended credible URLs to twitter users by considering credibility factors such as
rating of URL, correctness of content on URL and reviewed period of URL.

93
The categories and factors covered by different techniques used under collaborative
filtering and peer review approach are listed in Table 2.21.
Table 2.21: Factors mapped into categories for collaborative filtering and peer
review
Category Factors Identified References
Correctness Content reviewed by an editorial
board
(Cho & Schunn, 2007;
Gehringer, 2000, 2001; Mulder
et al., 2014; Parsons et al.,
2010; Su & Khoshgoftaar,
2009; Todd & Hudson, 2011;
Wang & Yang, 2012;
Yazdanfar & Thomo, 2013)
Authority Author’s prior contributions (Cho & Schunn, 2007;
Gehringer, 2000, 2001; Mulder
et al., 2014; Parsons et al.,
2010; Su & Khoshgoftaar,
2009; Todd & Hudson, 2011;
Wang & Yang, 2012;
Yazdanfar & Thomo, 2013)
Currency Content’s published date (Cho & Schunn, 2007;
Gehringer, 2000, 2001; Mulder
et al., 2014; Parsons et al.,
2010; Todd & Hudson, 2011;
Wang & Yang, 2012;
Yazdanfar & Thomo, 2013)
Professionalism Editorial board members listed (Parsons et al., 2010; Su &
Khoshgoftaar, 2009; Yazdanfar
& Thomo, 2013)
Popularity Ranking of journal or proceeding (Parsons et al., 2010; Su &
Khoshgoftaar, 2009; Yazdanfar
& Thomo, 2013)

94
Table 2.21 continued
Impartiality Editorial Boards (Parsons et al., 2010; Su &
Khoshgoftaar, 2009; Yazdanfar
& Thomo, 2013)
Quality Reviewer’s experience, content
reviewed by an editorial board,
ranking of journal or proceeding,
selection of journals and
conference papers meeting the
requirements
(Cho & Schunn, 2007;
Gehringer, 2000, 2001; Mulder
et al., 2014; Parsons et al.,
2010; Su & Khoshgoftaar,
2009; Todd & Hudson, 2011;
Wang & Yang, 2012;
Yazdanfar & Thomo, 2013)
In conclusion, collaborating filtering and peer review approach is dependent on the
activity of experts reviewing the content (Najafabadi & Mahrin, 2016). For it to be
successful it is necessary for newly added content to be reviewed in a timely fashion
(Najafabadi & Mahrin, 2016). Other than that, the peer-reviewed content is considered
more credible than others. Moreover, the approach is comprehensive enough covering
nearly all the credibility categories.
Machine learning approach
This approach focuses on learning the contents of the Web document or resource in order
to come up with a reasonable assessment (Olteanu et al., 2013a). However, it is vital to
identify the features, which the algorithm should look into to ensure accurate
measurement.
Olteanu et al. (2013a) proposed an algorithm that looks into the content and social
features for addressing traditional Websites as well as social networking Websites like
Facebook and Twitter. The algorithm maps the result on a 5-point Likert scale using
supervised algorithms. A test conducted on datasets showed 70% or more precision and
recall as well as improving the absolute error (MAE) by 53% in regression.

95
Machine learning works best with a structured data Website but is not dependent on it
(Olteanu et al., 2013a). If designed properly, a good machine learning algorithm will be
able to cover all the credibility categories. However, this requires training and may lead
to unexpected results at times. Moreover, the solution is not cost-effective and companies
providing such solutions may ask users to pay a small fee in order to use its credibility
assessment features. The factors covered by machine learning approach are listed in Table
2.22.
Table 2.22: Factors mapped into categories for machine learning
Category Factors Identified References
Correctness Metadata features, Link structure (Olteanu et al., 2013a)
Authority Author details under metadata (Olteanu et al., 2013a)
Currency Metadata features (Olteanu et al., 2013a)
Professionalism Content features including text-
based features, appearance and
Web page structure
(Olteanu et al., 2013a)
Popularity Social features including online
popularity of the Web page,
(Olteanu et al., 2013a)
Impartiality Reviews by experts (Olteanu et al., 2013a)
Quality Reviews by experts (Olteanu et al., 2013a)
As compared to other approaches, machine learning approach covers all credibility
categories and provides credibility assessment using minimal human assistance. Though
the solution is expensive, it is able to fetch data from structured and unstructured content
(Ferrucci et al., 2010; Gupta & Gupta, 2012). This is ideal when dealing with users that
have little to no credibility assessment training.
Semantic Web
Semantic Web simply means giving meaning to the Web (Allemang & Hendler, 2011;
Berners-Lee et al., 2001; Höffner et al., 2016; Lopez, Uren, Sabou, & Motta, 2011). It
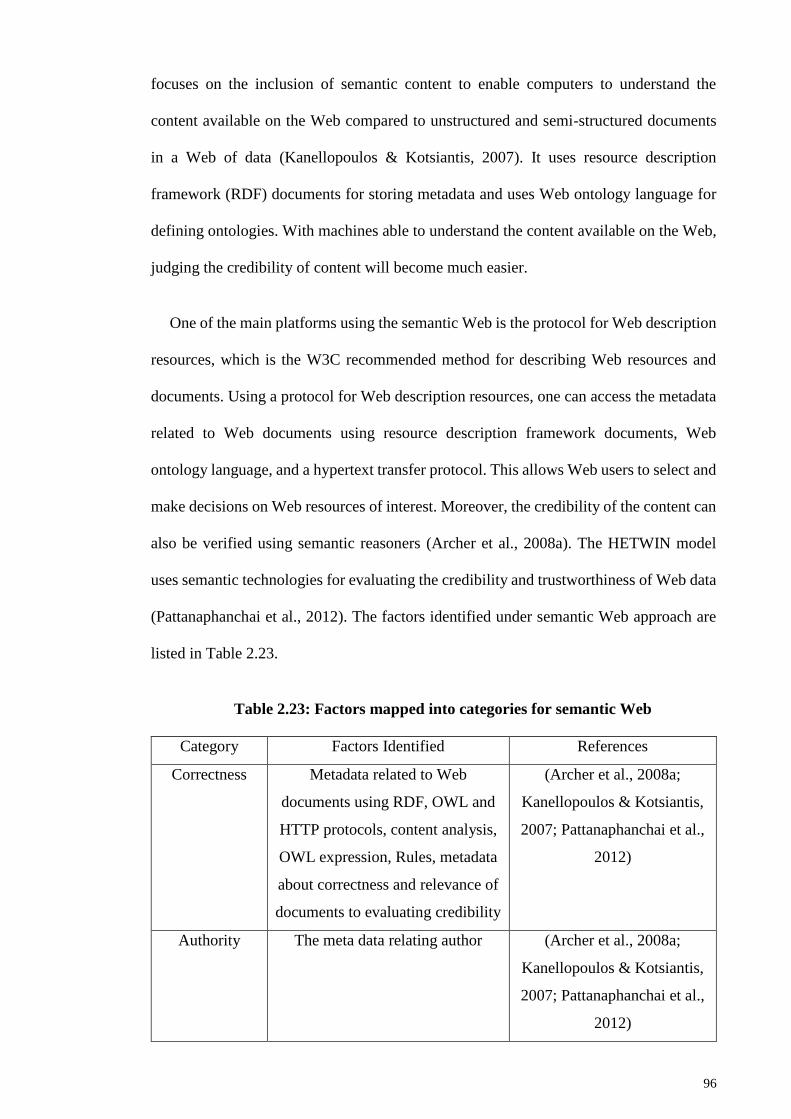
96
focuses on the inclusion of semantic content to enable computers to understand the
content available on the Web compared to unstructured and semi-structured documents
in a Web of data (Kanellopoulos & Kotsiantis, 2007). It uses resource description
framework (RDF) documents for storing metadata and uses Web ontology language for
defining ontologies. With machines able to understand the content available on the Web,
judging the credibility of content will become much easier.
One of the main platforms using the semantic Web is the protocol for Web description
resources, which is the W3C recommended method for describing Web resources and
documents. Using a protocol for Web description resources, one can access the metadata
related to Web documents using resource description framework documents, Web
ontology language, and a hypertext transfer protocol. This allows Web users to select and
make decisions on Web resources of interest. Moreover, the credibility of the content can
also be verified using semantic reasoners (Archer et al., 2008a). The HETWIN model
uses semantic technologies for evaluating the credibility and trustworthiness of Web data
(Pattanaphanchai et al., 2012). The factors identified under semantic Web approach are
listed in Table 2.23.
Table 2.23: Factors mapped into categories for semantic Web
Category Factors Identified References
Correctness Metadata related to Web
documents using RDF, OWL and
HTTP protocols, content analysis,
OWL expression, Rules, metadata
about correctness and relevance of
documents to evaluating credibility
(Archer et al., 2008a;
Kanellopoulos & Kotsiantis,
2007; Pattanaphanchai et al.,
2012)
Authority The meta data relating author (Archer et al., 2008a;
Kanellopoulos & Kotsiantis,
2007; Pattanaphanchai et al.,
2012)

97
Table 2.23 continued
Currency Metadata relating updates to
document
(Archer et al., 2008a;
Kanellopoulos & Kotsiantis,
2007; Pattanaphanchai et al.,
2012)
Professionalism Metadata relating to privacy
policies
(Archer et al., 2008a;
Kanellopoulos & Kotsiantis,
2007; Pattanaphanchai et al.,
2012)
Popularity None
Impartiality Content analysis (Archer et al., 2008a;
Kanellopoulos & Kotsiantis,
2007; Pattanaphanchai et al.,
2012)
Quality Content analysis (Archer et al., 2008a;
Kanellopoulos & Kotsiantis,
2007; Pattanaphanchai et al.,
2012)
The Semantic Web is the future of the Web and can be regarded as Web 3.0. The
inclusion of semantics allows Web reasoners to do content analysis with ease and cover
credibility categories not covered by other approaches. However, since not all content
over the Web is structured (i.e. being able to be processed by semantic Web reasoners),
some important content may be overlooked. Though ideal, it does require Websites to
maintain structured data.
Semantic Web is an extended version of the platform for Internet content selection
approach. Not only is it able to use the data provided in the meta data, but is also able to
do reasoning to provide answers to the questions asked. Furthermore, the approach also
does content analysis in order to cover credibility categories such as impartiality and
quality.
98
2.2.4.3 Issues in the existing Web credibility evaluation approaches
Although researchers have come up with solutions to measure Web credibility, as can be
seen in Section 2.2.4.1 and 2.2.4.2, but these techniques have several key issues. These
techniques cover credibility categories partially and limited credibility factors for some
resources (like social media and blogs) and domains (like medical and stocks). Because
these techniques do not cover all credibility categories, the credibility score produced is
biased towards certain aspect of the resource only. Moreover, these techniques also do
not contain enough credibility factors for some resources widely used nowadays like
social media and blogs, which depend on credibility factors like share count, view count,
resource followers and more (Castillo et al., 2011; Gupta et al., 2014; Schultz et al., 2011).
Furthermore, the combination of credibility factors used for a technique for evaluating
the credibility of one particular Web resource may not be useful for evaluating another
(Schwarz & Morris, 2011b). For example, when evaluating medical Websites, they
require and emphasize on different set of credibility factors, such as correctness and
authority, but educational Websites may focus more on quality of the content. A well-
balanced credibility assessment system needs to consider all of these issues when
evaluating a resource.
When developing a well-balanced credibility assessment system, lessons can be
learned from existing evaluation techniques. Models for assessment using humans are
perhaps the easiest to implement, as the evaluator only needs to be aware of the criteria
for evaluating a document or Website. However, studies have shown that it is impractical
and time-consuming to check each and every criterion when evaluating the credibility of
a Web page (Meola, 2004). Moreover, the assessment is affected by the evaluator’s
experience and motivation (Metzger, 2007). To address these issues, users should be
trained or let experienced users do the evaluation for them. The alternative solution is
computer evaluation, which does seem more practical in assisting users regarding
99
credibility of a page. However, any one solution can only be applied to a limited number
of Web pages and resources. For instance, semantic Web solutions provide the best
possible solution for judging the credibility of an electronic document but this is only
possible if the Web document is written using Web ontology language and metadata is
stored in ontologies (Archer et al., 2008a; Berners-Lee et al., 2001). Similarly, credibility
ratings, peer review, and digital signatures might only be available for a small number of
documents. This poses a major problem for some of the newer Web systems available
such as social networking services (SNS), blogs, forums, Wikis and computer-supported
collaborative learning (CSCL) environments, as they are not rated immediately (Flanagin
& Metzger, 2007; Harris, 2008; Metzger, 2007). These issues should also be considered
when developing a well-balanced credibility assessment system
Therefore, this research will use the credibility assessment algorithm, comprising the
defined categories and select credibility factors that affect Web pages. In the next sub-
section, this research covers credibility assessment module in Web-based QA systems
and the credibility factors used by other credibility-based QA system
Credibility assessment in Web-based QA systems
Web-based QA systems are very efficient in providing quick answers to simple questions
using NLP and IR-based techniques, but their accuracy is affected due to the amount of
fake Web pages and content on the Web (Gyongi & Garcia-Molina, 2005; Wu & Marian,
2011). Work on question answering systems dates back to mid-1960s, while Web-based
QA systems started to gain popularity at the start of year 2000 (Black, 1964; Kwok et al.,
2001). Over the years advancements have been made in Web-based QA systems in terms
of improving extracting techniques and intelligent answer deduction, but there has been
little emphasis on scoring the sources. Therefore, this research suggests developing a
credibility assessment module for Web-based QA system, to allow scoring answers based
100
on credibility of source. This research looks into literature to find credibility factors used
by Web-based QA systems and information systems that can be introduced in the
credibility assessment module.
When reviewing Web-based QA systems, most of the systems focused primarily on
either answer extraction or answer scoring. This is because these systems focus more on
relevancy of the answer extracted, rather than looking into credibility of the source. These
systems suggest methods like use of external resources, voting procedure, and
probabilistic phrase re-ranking algorithm, that focus on improving techniques for answer
extraction and scoring, but do not consider credibility assessment of sources (Ferrucci et
al., 2010; Kwok et al., 2001; Liu et al., 2014; Molino et al., 2015; Oh et al., 2012; Radev
et al., 2005; Wu & Marian, 2011; Yang & Chua, 2003).
However, some Web-based QA systems did introduce Web credibility assessment
partially. Wu and Marian (2007b, 2011) Web-based QA system used two credibility
factors (covering correctness and quality credibility categories) including search result
rank and originality of the Web page by calculating a plagiarism score. Oh et al. (2013)
suggested using three credibility factors including document quality, authority and
reputation of answer sources for scoring answers based on their credibility. Honto?search
by Yamamoto et al. (2007) evaluates information’s trustworthiness based on popularity
and currency credibility categories. This Web-based QA system evaluates popularity of
the content by providing popularity estimation of the phrase and its counter examples
available on the Web, and evaluates currency by monitoring changes in content with
respect to time. Though these systems do consider some credibility factors, yet they can
be enhanced much further by covering all credibility categories and by including more
credibility factors. In the evaluations conducted by these systems, Corrob states to be
achieving .772 in MRR only by covering correctness and quality categories, while
101
GenreQA states to be achieving .743 in MRR using currency, professionalism and quality
categories (Oh et al., 2012; Wu & Marian, 2011). By covering all credibility categories
Web pages more credible than others will get a higher score, allowing answers extracted
from them to be ranked higher in the answer list and thus improving respective QA
system’s accuracy of answers (Aggarwal & Van Oostendorp, 2011).
Since, there are limited Web-based QA systems considering credibility assessment,
this research started looking into Information Systems (IS). IS provide detail information
to users regarding Web pages or content provided by performing information processing
(Aggarwal et al., 2014b). There are many computer-based evaluation techniques through
which credibility can be measured, and have been covered earlier in Section 2.2.4.2.
These evaluation techniques are covered here by divided under two categories: credibility
estimation and computer-aided credibility support systems.
Systems such as TrustRank (Gyöngyi, Garcia-Molina, & Pedersen, 2004) and
CredibleRank (Caverlee & Liu, 2007) fall under the category of credibility estimation,
where they used various factors to assign scores to Web pages before ranking the search
results. These systems used link structure, organization, amount of spam and
advertisements found on the Web page for scoring credibility of Web pages. The language
modeling approach by Banerjee and Han (2009) is another example, which tried to verify
answer validity by evaluating the reliability of the sources. This was done by checking
the relevance between the document containing the candidate answer and the question’s
context model.
Among computer-aided credibility support system, the WISDOM system (Akamine et
al., 2009) is quite popular. The WISDOM system evaluates credibility based on:
information content that extracts major phrases and contradictory phrases, information
senders that classifies Web pages on the basis of axes such as individuals vs. organizations
102
and profit vs. nonprofit organizations, and information appearances showing the
distribution of positive and negative opinions related to the topic. It clusters the
information collected according to senders and opinions made. Schwarz and Morris
(2011a) system, also provides visual cues to assist users in credibility assessment of
individual Web page and search results. Factors considered by the system were divided
under three feature categories: on-page, off-page, and aggregate features. Tanaka et al.
(2010b) also provided credibility results for Web pages by assessing them on the basis of
content analysis, social support analysis and author analysis from Web content, images
and videos. Later, Yamamoto and Tanaka (2011b) expanded this system by maps scores
recorded from various factors into main credibility aspects: correctness, authority,
currency, coverage, objectivity. Additionally, search results are re-ranked according to
the predicted user’s credibility judgement. The automated Web Credibility Assessment
Support Tool (WebCAST), which is an upgrade of its predecessor (Aggarwal & Van
Oostendorp, 2011), evaluates Web pages credibility based on all seven credibility
categories and using multiple credibility factors criteria like type of website, popularity,
sentiment, date of last update, reputation and review based on users’ ratings reflecting
personal experience (Aggarwal et al., 2014b). WebCast uses real-time databases like
Alchemy API, Alexa API, Google API, Web of Trust (WoT) API for retrieving data
relating to credibility factors (Aggarwal et al., 2014b).
Literature on Web-based QA systems and IR systems using credibility assessment,
allowed us to identify factors that can help in assessing Web credibility. The credibility
factors identified from Web-based QA systems and IR systems reviewed, are listed in
Table 2.24 and Table 2.25. Table 2.24 covers the credibility factors identified under
correctness, authority, currency and professionalism credibility category, while Table
2.25 covers popularity, impartiality and quality credibility categories.
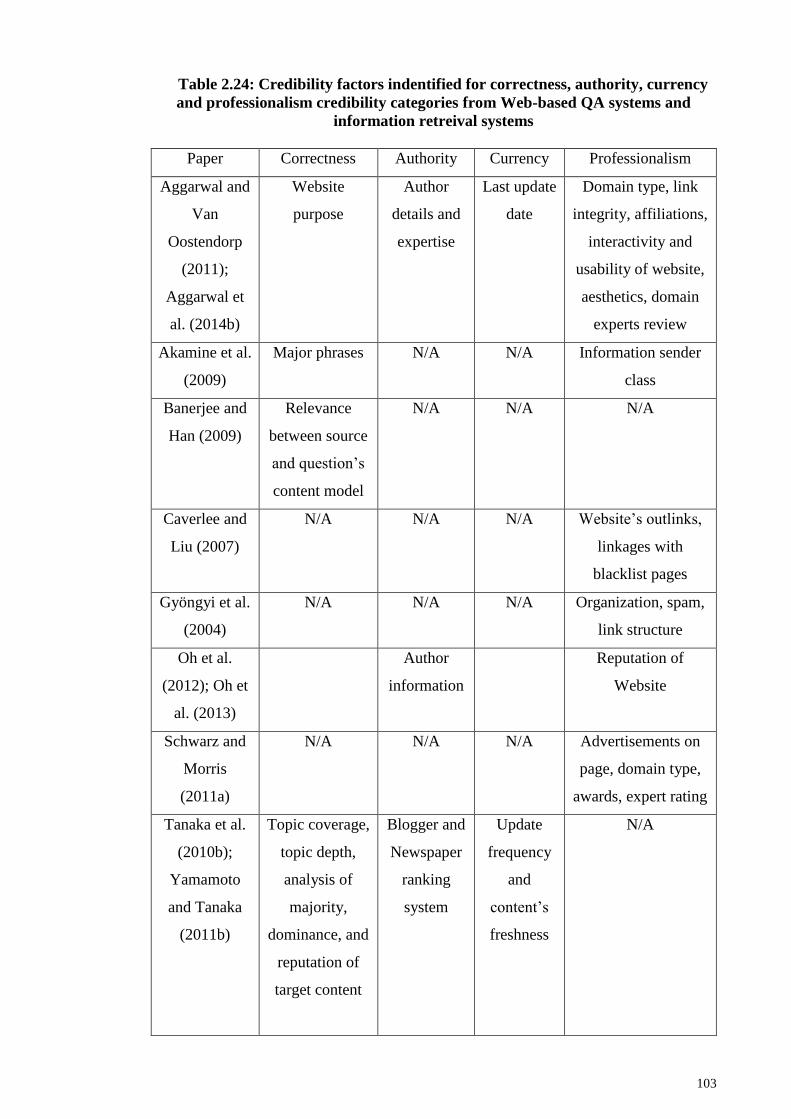
103
Table 2.24: Credibility factors indentified for correctness, authority, currency
and professionalism credibility categories from Web-based QA systems and
information retreival systems
Paper Correctness Authority Currency Professionalism
Aggarwal and
Van
Oostendorp
(2011);
Aggarwal et
al. (2014b)
Website
purpose
Author
details and
expertise
Last update
date
Domain type, link
integrity, affiliations,
interactivity and
usability of website,
aesthetics, domain
experts review
Akamine et al.
(2009)
Major phrases N/A N/A Information sender
class
Banerjee and
Han (2009)
Relevance
between source
and question’s
content model
N/A N/A N/A
Caverlee and
Liu (2007)
N/A N/A N/A Website’s outlinks,
linkages with
blacklist pages
Gyöngyi et al.
(2004)
N/A N/A N/A Organization, spam,
link structure
Oh et al.
(2012); Oh et
al. (2013)
Author
information
Reputation of
Website
Schwarz and
Morris
(2011a)
N/A N/A N/A Advertisements on
page, domain type,
awards, expert rating
Tanaka et al.
(2010b);
Yamamoto
and Tanaka
(2011b)
Topic coverage,
topic depth,
analysis of
majority,
dominance, and
reputation of
target content
Blogger and
Newspaper
ranking
system
Update
frequency
and
content’s
freshness
N/A

104
Table 2.24 continued
Wu and
Marian
(2007b, 2011)
Search result
rank, relevance
N/A N/A N/A
Yamamoto et
al. (2007)
Major phrases N/A Update
frequency
N/A
Table 2.25: Credibility factors indentified for popularity, impartiality and
quality credibility categories from Web-based QA systems and information
retreival systems
Paper Popularity Impartiality Quality
Aggarwal and
Van Oostendorp
(2011); Aggarwal
et al. (2014b)
Website ranking and
traffic details
Sentiment value,
tone of content
Primary or
secondary
source,
readability
Akamine et al.
(2009)
N/A Positive/Negative
statements
N/A
Banerjee and Han
(2009)
N/A N/A N/A
Caverlee and Liu
(2007)
N/A N/A N/A
Gyöngyi et al.
(2004)
N/A N/A N/A
Oh et al. (2012);
Oh et al. (2013)
Quality of
document
Schwarz and
Morris (2011a)
Share count, traffic stats,
geographic reach, dwell
time, re-visitation pattern,
, page rank
N/A Spelling errors
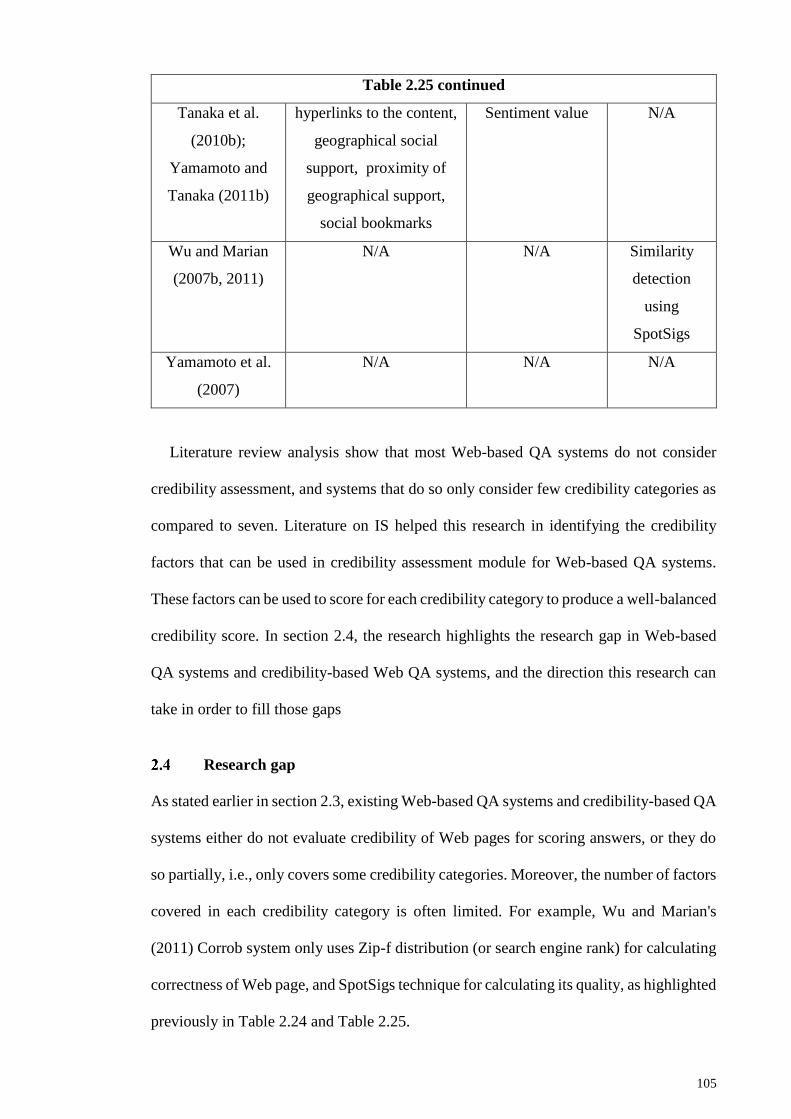
105
Table 2.25 continued
Tanaka et al.
(2010b);
Yamamoto and
Tanaka (2011b)
hyperlinks to the content,
geographical social
support, proximity of
geographical support,
social bookmarks
Sentiment value N/A
Wu and Marian
(2007b, 2011)
N/A N/A Similarity
detection
using
SpotSigs
Yamamoto et al.
(2007)
N/A N/A N/A
Literature review analysis show that most Web-based QA systems do not consider
credibility assessment, and systems that do so only consider few credibility categories as
compared to seven. Literature on IS helped this research in identifying the credibility
factors that can be used in credibility assessment module for Web-based QA systems.
These factors can be used to score for each credibility category to produce a well-balanced
credibility score. In section 2.4, the research highlights the research gap in Web-based
QA systems and credibility-based Web QA systems, and the direction this research can
take in order to fill those gaps
Research gap
As stated earlier in section 2.3, existing Web-based QA systems and credibility-based QA
systems either do not evaluate credibility of Web pages for scoring answers, or they do
so partially, i.e., only covers some credibility categories. Moreover, the number of factors
covered in each credibility category is often limited. For example, Wu and Marian's
(2011) Corrob system only uses Zip-f distribution (or search engine rank) for calculating
correctness of Web page, and SpotSigs technique for calculating its quality, as highlighted
previously in Table 2.24 and Table 2.25.

106
Since, credibility-based Web QA systems used limited credibility factors and only
covered some credibility categories, the search was expanded to IS. Web QA systems
allowed the research to identify more credibility factors under each credibility category.
In comparison to credibility-based QA systems, some information systems cover four to
seven categories.
These findings are summarized in the form of a research gap table that highlights the
categories least addressed by these systems, as shown in Table 2.26. The table shows the
paper sharing details regarding the credibility-based QA system (represented as QA in
the table) and information systems (represented as IS in the table) and the type it belongs
to. The table also shows credibility categories covered by these systems, which are
abbreviated as correctness (Corr), authority (Auth), currency (Curr), professionalism
(Prof), popularity (Pop), impartiality (Im), and quality(Qual). A system covering a
particular category is highlighted as a tick mark.
Table 2.26: Resarch gap for credibility categories comprising credibility-based
Web QA systems and information systems
Paper Type Corr Auth Curr Prof Pop Im Qual
Oh et al. (2012); Oh et al. (2013) QA ✓ ✓ ✓
Wu and Marian (2007b, 2011) QA ✓ ✓
Yamamoto et al. (2007)
QA ✓ ✓
Aggarwal and Van Oostendorp
(2011); Aggarwal et al. (2014b)
IS ✓ ✓ ✓ ✓ ✓ ✓ ✓
Akamine et al. (2009) IS ✓ ✓ ✓
Banerjee and Han (2009) IS ✓
Caverlee and Liu (2007) IS ✓

107
Table 2.26 continued
Gyöngyi et al. (2004) IS ✓
Schwarz and Morris (2011a) IS ✓ ✓ ✓
Tanaka et al. (2010b);
Yamamoto and Tanaka (2011b)
IS ✓ ✓ ✓ ✓ ✓
As shown in Table 2.26, each credibility-based QA system only covers two to three
categories, where popularity and impartiality are not covered by any one of them. Also
authority, currency, and professionalism categories have one occurrence only under QA
systems. In comparison, some information systems a wider range of credibility categories,
but only one of them covers all seven categories. The research gap tables shows that the
credibility-based QA systems to be developed by this research needs to consider all seven
credibility categories and use a number of credibility factors under them if available, as
required under research objectives 1 and 2. Moreover, more emphasis needs to be given
towards credibility categories, such as authority, currency, popularity, impartiality and
quality, which have not been covered extensively by many credibility-based QA systems
and information systems in comparison to categories such as correctness and
professionalism.
The research gap table allowed the research to highlight key weaknesses in existing
credibility-based QA systems. By not covering all seven credibility categories, the
reliability of the credibility scores can always be questioned (Aggarwal & Van
Oostendorp, 2011; Aggarwal et al., 2014b; Wu & Marian, 2011). Moreover, the research
also needs to cover more factors under these categories instead of selecting limited factors
only. Finally, the impact credibility categories that are not used much often will allow
108
research to determine their impact on accuracy of answers, and whether they should be
considered in evaluating credibility in future systems.

109
CHAPTER 3: RESEARCH METHOLODY
This chapter is divided into three sections. The first section explains the research flow for
achieving the research objectives and defines the chosen research methodology in order
to answer the research questions posed in Section 1.2. The second covers reasons for
selecting a particular methodology and explains the selection criteria for conducting
research. The third section covers the experimental design, explaining the steps taken for
conducting evaluations.
Research flow
Defining a research design allows the research to highlight the steps that are taken in order
to meet the research objectives of this thesis. The research goes through these steps one
after another, forwarding the output of the previous step to the next step. Figure 3.1 shows
the research design and steps involved including 1) Web credibility assessment, 2)
develop a Web-based QA system (OMQA system), 3) develop a credibility-based Web
QA system (CredOMQA system) and 4) evaluation, which are discussed in greater detail
in the sub-sections below.
Figure 3.1: Research flow
3.1.1 Web credibility assessment
The first step of the research flow is to provide an algorithm for evaluating credibility of
Web page. This is defined in order to address the first objective of the research, which is
“To design an algorithm for measuring credibility of Web pages”. In this step, the
research starts by reviewing existing systems making use of Web credibility assessment.
Web credibility
assessment
Develop a Web-based QA system
(OMQA system)
Develop a credibility-based Web QA system
(CredOMQA system)
Evaluation
110
By reviewing these systems, the research is able to identify credibility categories that
affect Web credibility assessment. The research defined seven categories for measuring
credibility, as covered in section 2.2.3. Moreover, reviewing these systems allowed the
research to identify credibility factors, for each credibility category, that can be used for
measuring credibility of a Web page. These factors are identified in section 2.2.4. By
defining credibility categories and using credibility factors identified, Web credibility of
a Web page can be measured. In this way the research is able to define a credibility
assessment algorithm allowing it to measure credibility scores of Web pages.
3.1.2 Develop a Web-based QA system
The second step of the research design is to design and develop a Web-based QA system
called OMQA system. This is done in order to address the second research objective,
which is “To design and develop an enhanced Web-based QA system with credibility
assessment”. The OMQA systems needs to be developed first, before it can be combined
with a credibility assessment module to form a credibility-based QA system called
CredOMQA system. In order to develop a Web-based QA system or OMQA system, the
research defined a Web-based QA system model, as covered in section 2.1.3, using which
OMQA can be designed and developed. The research developed different modules of a
Web-based QA system, as per specifications of the Web-based QA model, including
question analysis, answer extraction, answer scoring and answer aggregation. The
research found existing system using different techniques for each method, which are
listed in section 2.1.4. The research added these methods and techniques into OMQA
system for evaluation purposes. Using this system the research will be able to evaluate
methods and techniques available for them, as well as, generate results for baseline
systems such as Qualifier and Corrob*. Upon successfully designing and developing the
OMQA system, the task of adding credibility assessment module to the OMQA system
can be started.
111
3.1.3 Develop a credibility-based Web QA system
The OMQA system developed allows the research to evaluate existing methods and
techniques found in existing systems. However, the research still requires to add a
credibility assessment module to this system in order to it to evaluate the effect of Web
credibility on accuracy of answers. Adding a credibility assessment module for scoring
answers also accomplishes the second research objective of this thesis.
In order to evaluate credibility score of a Web page the research used the credibility
assessment algorithm defined in the first step, and credibility factors identified for
evaluating credibility of Web-source covered in section 2.2.4 and section 2.3. This allows
the research to add a credibility assessment module to the existing OMQA system, thus
calling it CredOMQA system.
The addition of this module allows the research to generate results using credibility-
based answer scores on CredOMQA system. In addition, results for other Web-based QA
baseline systems, which make use of Web credibility score for scoring answers, are
generated.
3.1.4 Evaluation
Step four involves evaluation of results to be generated by systems developed earlier steps
two and three including OMQA system and CredOMQA system respectively. This step
also covers the third research objective of the thesis, which is “To evaluate the impact of
credibility assessment on accuracy of the answer by means of evaluation and
comparison”. The first evaluation conducted in this step is the analysis of accuracy of
answers produced by Web-based QA systems methods and techniques. This also includes
generation of results for baseline system using a subset of methods and techniques
available in the OMQA system. The second evaluation conducted analyzing the change
in accuracy of answers after adding a credibility assessment module into the OMQA
112
system to form CredOMQA system. The results generated by CredOMQA system were
compared other baseline credibility-based Web QA system systems, which targeted
specific credibility categories only. The results from both of these evaluations were
analyzed in order to conclude findings of the research and the implication of credibility
assessment on Web and other systems relying on it.
The evaluation step also requires to have an understanding on the type of methodology
adopted by the research. This is because methodology defines the type of data to be used
to conduct these evaluations and the type of results that are expected to be generated and
evaluation metrics that may applied on them. This is discussed in section 3.2 and 3.2.1.
Methodology
There are two basic approaches to research: 1) quantitative and 2) qualitative (Creswell,
2013). Quantitative approach involves generation of data in quantitative form, which may
undergo rigorous quantitative analysis. Inferential, experiment and simulation approaches
are all sub-classification of quantitative approach. Qualitative approach is concerned with
subjective assessment of attitudes, opinions and behavior. The data generated in
qualitative analysis are either in non-quantitative form or do not require rigorous
quantitative analysis, whereas qualitative approaches involve focus group interviews,
projective techniques and depth interviews for collection of data.
3.2.1 Reasons for choosing quantitative analysis
This research chose quantitative approach for answering the posed research questions and
accomplishing objectives stated for this research, keeping in view the nature of research
questions and objectives defined. The reasons for choosing quantitative approach over
qualitative approach are stated hereunder:
113
1. Web-based QA systems: Web-based QA systems involve use of quantitative data,
such as questions and their answers in order to evaluate answer accuracy.
Literature on Web-based QA systems also uses extensive quantitative analysis for
evaluating answer accuracy, which is why this research also chose it (Oh et al.,
2012; Wu & Marian, 2011).
2. Credibility assessment in Web-based QA systems: Under credibility assessment,
both quantitative and qualitative approaches are found in the literature (Molino et
al., 2015; Ostenson, 2014). Qualitative approaches are used for judging
perceptions and behavior of users towards credibility, while quantitative
approaches are employed for evaluating impact of credibility assessment on
various systems with respect to the evaluation metric chosen. Since this research
intends to analyze the effect of credibility assessment in Web-based QA systems,
thus quantitative approach was chosen.
3. Evaluating answer accuracy: Both Web-based QA systems and credibility
assessment modules are required to be evaluated by this research, with respect to
answer accuracy. Evaluating answer accuracy involves generating answers for
various methods and techniques, and credibility-based answers. The answers
generated are then evaluated with respect to answer accuracy using various
evaluation metrics. Both answer generation, result generation and results analysis
involve rigorous quantitative analyses, which is why quantitative analysis has been
adopted for this research.
3.2.2 Research selection criteria
Since this research is based on quantitative approach, several selection criteria are
required to be specified in order to conduct quantitative analysis systematically. For this,
selection criteria are being defined for review of Web-based QA and credibility-based
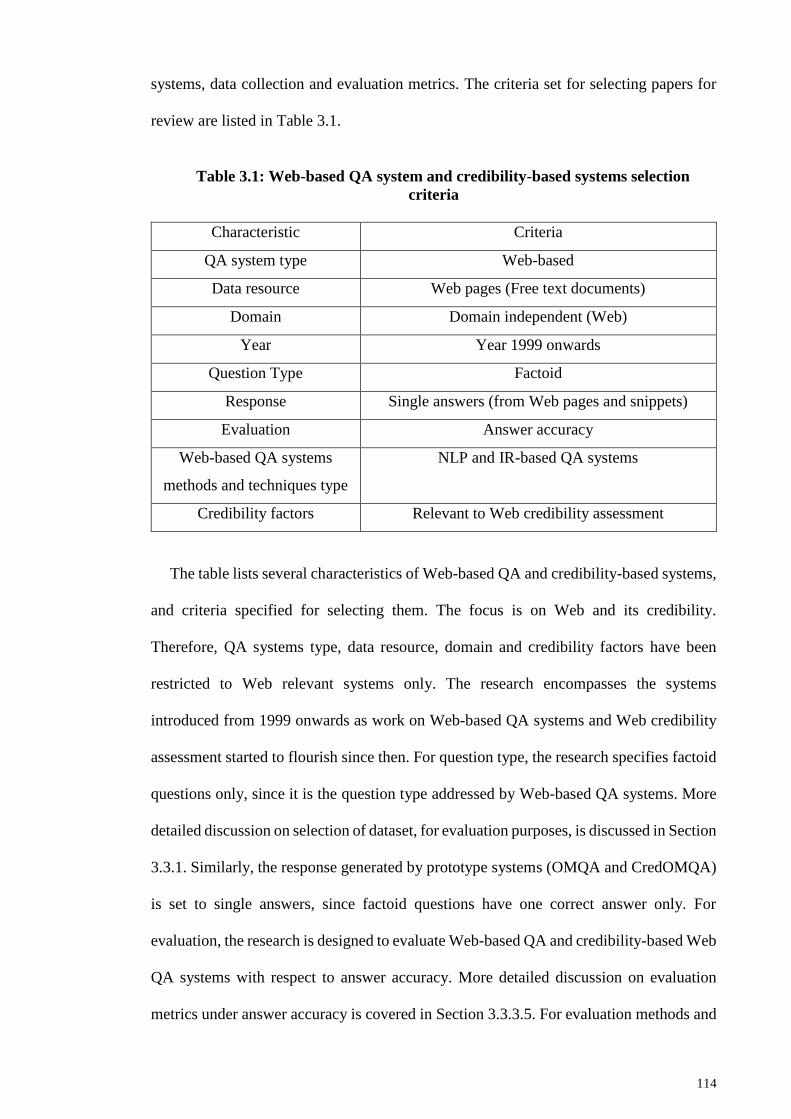
114
systems, data collection and evaluation metrics. The criteria set for selecting papers for
review are listed in Table 3.1.
Table 3.1: Web-based QA system and credibility-based systems selection
criteria
Characteristic Criteria
QA system type Web-based
Data resource Web pages (Free text documents)
Domain Domain independent (Web)
Year Year 1999 onwards
Question Type Factoid
Response Single answers (from Web pages and snippets)
Evaluation Answer accuracy
Web-based QA systems
methods and techniques type
NLP and IR-based QA systems
Credibility factors Relevant to Web credibility assessment
The table lists several characteristics of Web-based QA and credibility-based systems,
and criteria specified for selecting them. The focus is on Web and its credibility.
Therefore, QA systems type, data resource, domain and credibility factors have been
restricted to Web relevant systems only. The research encompasses the systems
introduced from 1999 onwards as work on Web-based QA systems and Web credibility
assessment started to flourish since then. For question type, the research specifies factoid
questions only, since it is the question type addressed by Web-based QA systems. More
detailed discussion on selection of dataset, for evaluation purposes, is discussed in Section
3.3.1. Similarly, the response generated by prototype systems (OMQA and CredOMQA)
is set to single answers, since factoid questions have one correct answer only. For
evaluation, the research is designed to evaluate Web-based QA and credibility-based Web
QA systems with respect to answer accuracy. More detailed discussion on evaluation
metrics under answer accuracy is covered in Section 3.3.3.5. For evaluation methods and
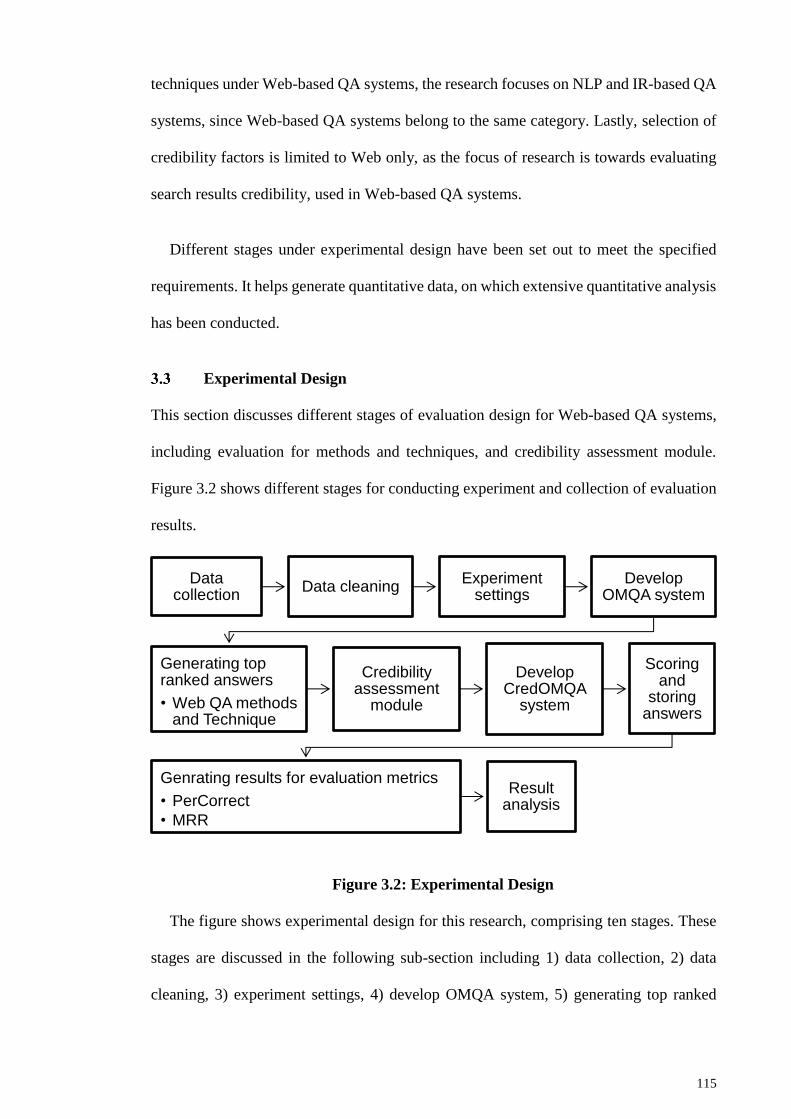
115
techniques under Web-based QA systems, the research focuses on NLP and IR-based QA
systems, since Web-based QA systems belong to the same category. Lastly, selection of
credibility factors is limited to Web only, as the focus of research is towards evaluating
search results credibility, used in Web-based QA systems.
Different stages under experimental design have been set out to meet the specified
requirements. It helps generate quantitative data, on which extensive quantitative analysis
has been conducted.
Experimental Design
This section discusses different stages of evaluation design for Web-based QA systems,
including evaluation for methods and techniques, and credibility assessment module.
Figure 3.2 shows different stages for conducting experiment and collection of evaluation
results.
Figure 3.2: Experimental Design
The figure shows experimental design for this research, comprising ten stages. These
stages are discussed in the following sub-section including 1) data collection, 2) data
cleaning, 3) experiment settings, 4) develop OMQA system, 5) generating top ranked
Data collection
Data cleaningExperiment
settingsDevelop
OMQA system
Generating top ranked answers
• Web QA methods and Technique
Credibility assessment
module
Develop CredOMQA
system
Scoring and
storing answers
Genrating results for evaluation metrics
• PerCorrect
• MRR
Result analysis

116
answers, 6) credibility assessment module, 7) develop CredOMQA system, 8) scoring
and storing answers, 9) generating results and 10) result analysis.
3.3.1 Data collection
Data collection is a dataset, which comprises questions used for evaluating system against
evaluation metrics (Kolomiyets & Moens, 2011). These data collections are usually taken
from organizations that provide them for researchers and experts to conduct experiments,
to facilitate them in comparing results with other systems using the same data collection.
Since the scope of this research is towards evaluation of Web-based QA systems, thus
this research uses a dataset consisting of factoid questions and their answers. For this
purpose, QA tracks from Text Retrieval Conference (TREC) and Conference and Labs of
the Evaluation Forum (CLEF) have been used (Chen et al., 2000; Magnini et al., 2004;
Voorhees, 1999).
Both TREC and CLEF organizations promote research in IR, including work on QA
systems. TREC is a co-sponsored organisation by the National Institute of Standards and
Technology and U.S. Department of Defence, and is responsible for promoting research
in IR (Voorhees, 1999). The CLEF Initiative (Conference and Labs of the Evaluation
Forum, formerly known as Cross-Language Evaluation Forum) is a self-organized body
that focuses research on multilingual and multimodal information with various levels of
structure (Magnini et al., 2004). Both of these organization provide tracks, i.e., datasets
for a number of IR areas, and QA (chosen for this research) track is one of them. These
QA tracks contain test questions, top documents ranked list, judgement set, pattern set
and correct answers to the test questions. Datasets from both of these organizations are
well received by the IR community and are the widely used datasets for QA system
evaluations (Allam & Haggag, 2012; Bouziane et al., 2015; Kolomiyets & Moens, 2011;
Mollá-Aliod & Vicedo, 2010; Webber & Webb, 2010).

117
The dataset chosen for evaluation purposes comprises factoid questions taken from
TREC and CLEF QA tracks. The reason for selecting factoid questions is that Web-based
QA system make use of simple methods and techniques and are more ideal for answering
factoid questions. Secondly, the question type for evaluation purposes is restricted to
Person type only which also falls under factoid question type.
As for the dataset, the larger dataset has been chosen from TREC QA track (QN=211),
while a random sample (QN=21) is taken from CLEF dataset to compare findings in both
of these datasets, where QN indicates the number of questions. Other QA systems have
used datasets of same size or smaller for evaluation (Oh et al., 2012; Wu & Marian, 2011;
Yang & Chua, 2003).
3.3.2 Data cleaning
These datasets contain a lot of information, some of which is considered superfluous for
the purpose of this research. Accordingly, information such as top documents ranked list,
judgement set, pattern set for questions has been excluded from these datasets. This is
because the proposed prototype Web-based QA system generated its own data; thus such
information was not needed. Figure 3.3 shows a screen shot showing TREC dataset stored
in a text file after data cleaning.
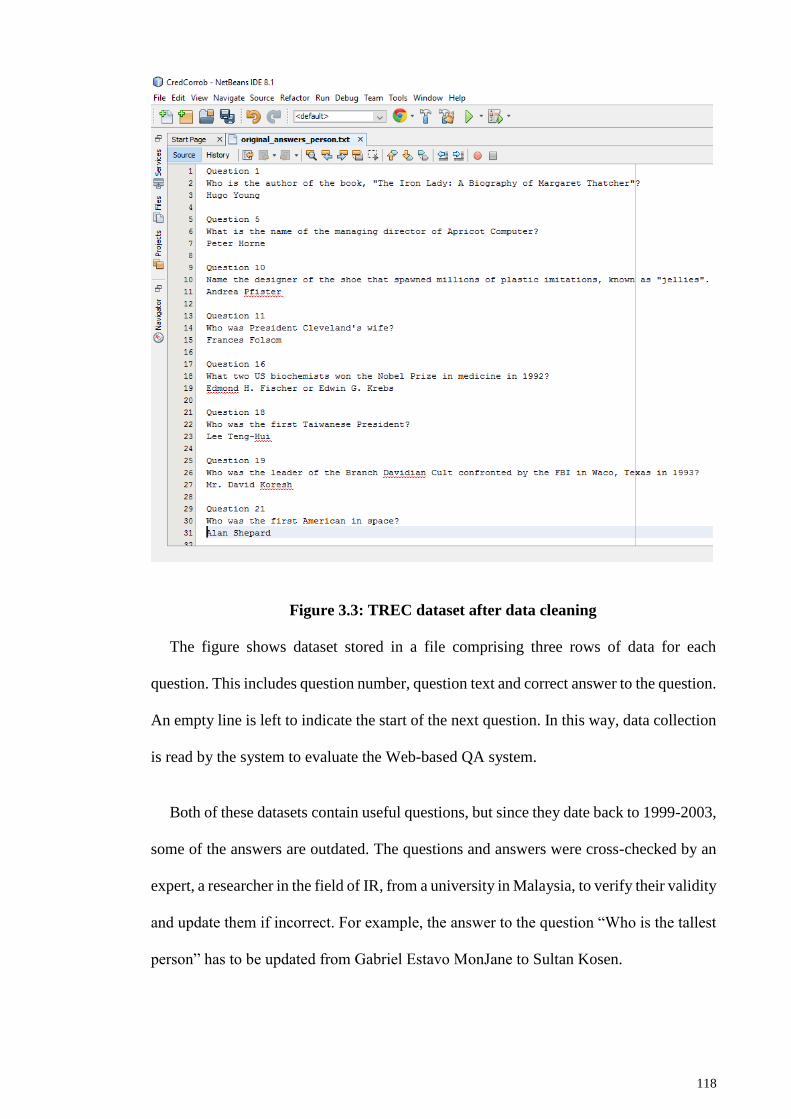
118
Figure 3.3: TREC dataset after data cleaning
The figure shows dataset stored in a file comprising three rows of data for each
question. This includes question number, question text and correct answer to the question.
An empty line is left to indicate the start of the next question. In this way, data collection
is read by the system to evaluate the Web-based QA system.
Both of these datasets contain useful questions, but since they date back to 1999-2003,
some of the answers are outdated. The questions and answers were cross-checked by an
expert, a researcher in the field of IR, from a university in Malaysia, to verify their validity
and update them if incorrect. For example, the answer to the question “Who is the tallest
person” has to be updated from Gabriel Estavo MonJane to Sultan Kosen.

119
3.3.3 Experiment settings
3.3.3.1 Experiment system setup
The Web-based QA system, on which the experiments were conducted, were tested on a
Windows machine running Windows 10 operating system. This system comprised 4GB
RAM and core i5 @1.8Ghz Intel processor.
3.3.3.2 Technologies used for evaluation
The credibility-based Web QA system was developed using PHP 5.6.1 Web server
language, JavaScript and HTML. In addition to use of programming languages, a number
of libraries and APIs were used to develop a prototype credibility-based Web QA system,
called CredOMQA system. These technologies are listed below:
Stanford NER and POS Parser: For tagging word entity type and parsing
sentence with respect to POS
WordNet: For providing synonyms for keywords
Alchemy, Alexa, Diffbot, Google, Mozscape, Web of Trust (WOT) APIs: For
fetching credibility data for Web pages
SeoStats Library: For providing readability, social media and other stats
TFIDF: For providing relevancy score
SpotSigs: For evaluating originality of Web page
Techniques for evaluating the results generated by credibility-based Web QA systems
were also developed, using PHP and Rgraph for plotting data. The evaluation functions
developed were based on the evaluation metrics defined for this research.
3.3.3.3 Evaluation settings for Web-based QA systems’ methods and techniques
In order to evaluate Web-based QA systems’ methods and their techniques, it is important
to use appropriate methods and parameter values that have the least effect on the method
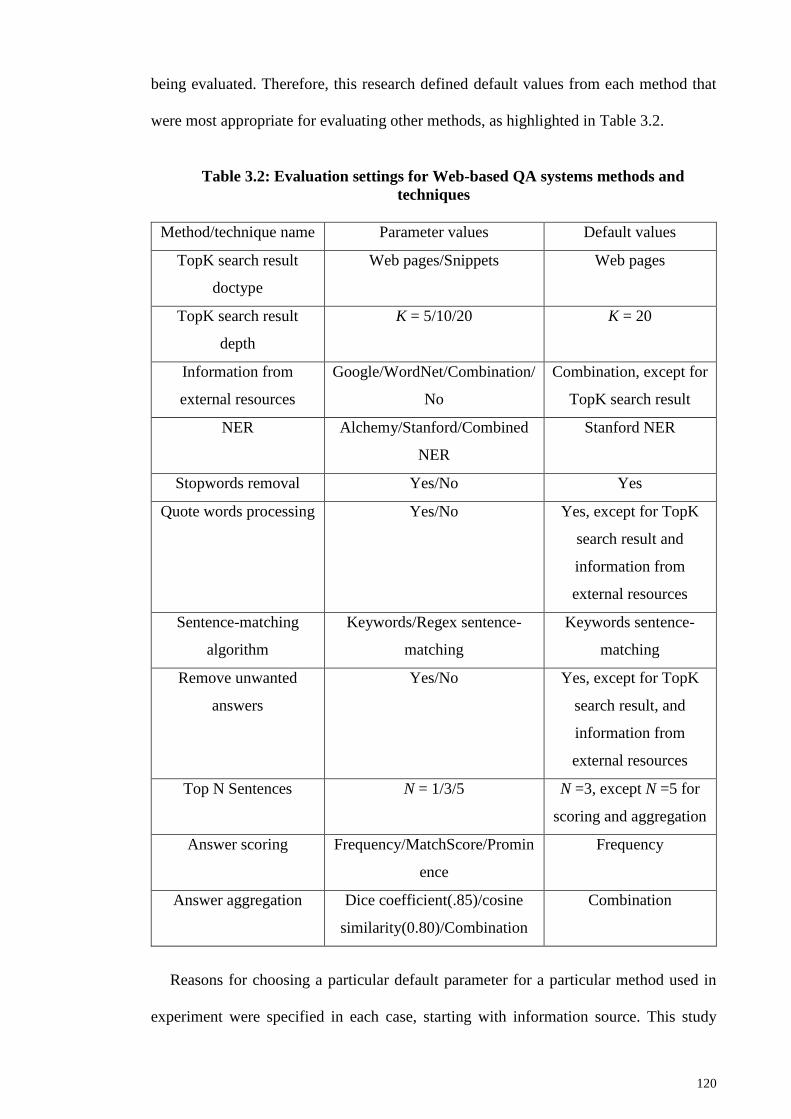
120
being evaluated. Therefore, this research defined default values from each method that
were most appropriate for evaluating other methods, as highlighted in Table 3.2.
Table 3.2: Evaluation settings for Web-based QA systems methods and
techniques
Method/technique name Parameter values Default values
TopK search result
doctype
Web pages/Snippets Web pages
TopK search result
depth
K = 5/10/20 K = 20
Information from
external resources
Google/WordNet/Combination/
No
Combination, except for
TopK search result
NER Alchemy/Stanford/Combined
NER
Stanford NER
Stopwords removal Yes/No Yes
Quote words processing Yes/No Yes, except for TopK
search result and
information from
external resources
Sentence-matching
algorithm
Keywords/Regex sentence-
matching
Keywords sentence-
matching
Remove unwanted
answers
Yes/No Yes, except for TopK
search result, and
information from
external resources
Top N Sentences N = 1/3/5 N =3, except N =5 for
scoring and aggregation
Answer scoring Frequency/MatchScore/Promin
ence
Frequency
Answer aggregation Dice coefficient(.85)/cosine
similarity(0.80)/Combination
Combination
Reasons for choosing a particular default parameter for a particular method used in
experiment were specified in each case, starting with information source. This study
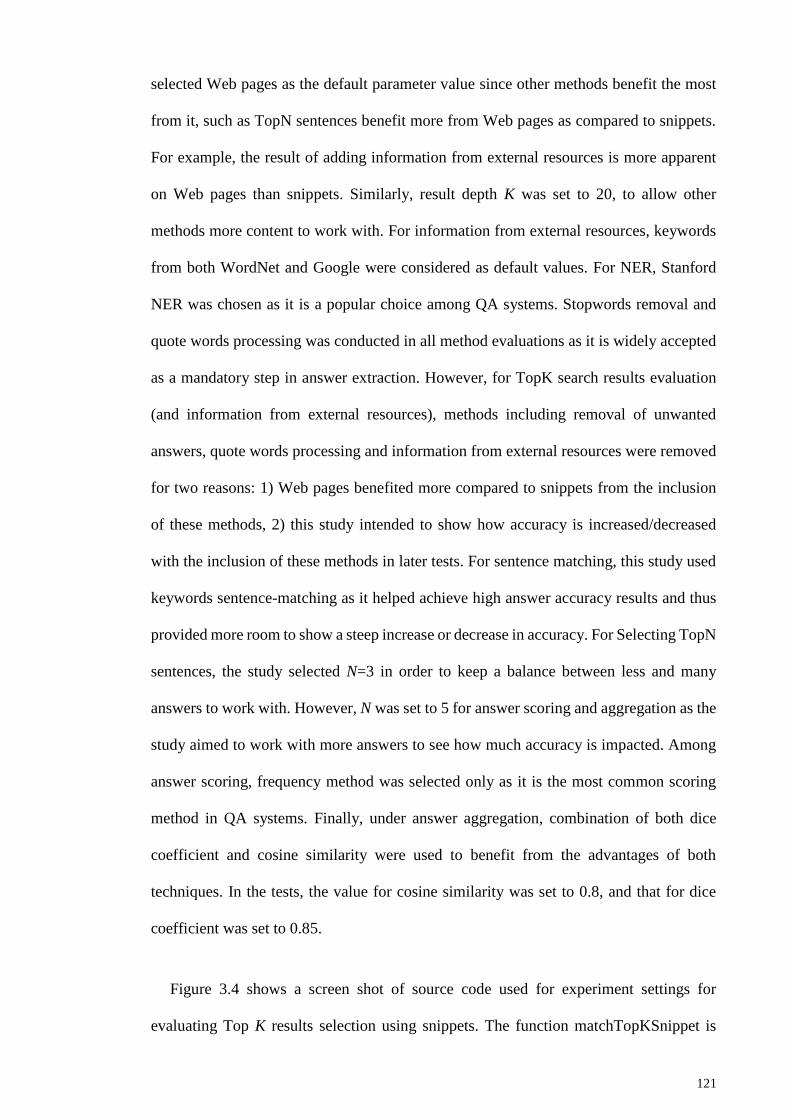
121
selected Web pages as the default parameter value since other methods benefit the most
from it, such as TopN sentences benefit more from Web pages as compared to snippets.
For example, the result of adding information from external resources is more apparent
on Web pages than snippets. Similarly, result depth K was set to 20, to allow other
methods more content to work with. For information from external resources, keywords
from both WordNet and Google were considered as default values. For NER, Stanford
NER was chosen as it is a popular choice among QA systems. Stopwords removal and
quote words processing was conducted in all method evaluations as it is widely accepted
as a mandatory step in answer extraction. However, for TopK search results evaluation
(and information from external resources), methods including removal of unwanted
answers, quote words processing and information from external resources were removed
for two reasons: 1) Web pages benefited more compared to snippets from the inclusion
of these methods, 2) this study intended to show how accuracy is increased/decreased
with the inclusion of these methods in later tests. For sentence matching, this study used
keywords sentence-matching as it helped achieve high answer accuracy results and thus
provided more room to show a steep increase or decrease in accuracy. For Selecting TopN
sentences, the study selected N=3 in order to keep a balance between less and many
answers to work with. However, N was set to 5 for answer scoring and aggregation as the
study aimed to work with more answers to see how much accuracy is impacted. Among
answer scoring, frequency method was selected only as it is the most common scoring
method in QA systems. Finally, under answer aggregation, combination of both dice
coefficient and cosine similarity were used to benefit from the advantages of both
techniques. In the tests, the value for cosine similarity was set to 0.8, and that for dice
coefficient was set to 0.85.
Figure 3.4 shows a screen shot of source code used for experiment settings for
evaluating Top K results selection using snippets. The function matchTopKSnippet is

122
defined, containing experimenting settings for evaluating snippets information source.
This research also offers comments to facilitate the reader in understanding these settings,
within the code, as shown from line 360 to 372. The screen shows no functions for
methods like remove unwanted answers and fetching adding keywords form WordNet.
On line 384, a function call is being made to search for keywords, where the parameter
for resource is set to snippets, indicating that correct settings are being used.
Figure 3.4: Experiment settings for evaluating Top K results selection using
snippets
3.3.3.4 Evaluation settings for Web-based QA and credibility-based Web QA
systems
Credibility assessment module provides credibility scores for answers taken from Web
pages, thus it needs to be applied on a Web-based QA system producing answers. The
123
evaluation results for Web-based QA systems’ methods and techniques highlighted
techniques achieving better accuracy than others, as shown in Section 4.1. Thus, for the
purpose of this research, credibility assessment was applied on the combination of
methods and techniques producing the highest accuracy. Similarly, other Web-based QA
systems, which covered some credibility categories (such as Corrob and GenreQA), the
credibility scores produced were applied on the method and techniques used by them.
Scores for Corrob and GenreQA are shown, using and not using credibility assessment,
where * notation is used to show that it is using credibility assessment. This research also
included such Web-based QA systems, like LAMP and Qualifier, which did not apply
credibility assessment, to show the difference when not using credibility assessment.
Table 3.3 shows the evaluation settings for Web-based QA and credibility-based Web
systems including LAMP, Qualifier, Corrob, GenreQA, and OMQA and CredOMQA
systems suggested by this research (Oh et al., 2012; Wu & Marian, 2011; Yang & Chua,
2003; Zhang & Lee, 2003).
Table 3.3: Evaluation settings for OMQA, CredOMQA, and baseline systems
Web-based and credibility-based QA systems
System
name
Methods and techniques Credibility
categories
OMQA Information source = Web pages and Top K = 20
Information from external resource = WordNet and Google
keywords
Quote words processing = Yes
Stop words removal = Yes
NER = Stanford NER
Removal of unwanted answers = Yes
Sentence-matching algorithm = keyword matching
Top N sentences = 3
Answer scoring = Frequency
Answer aggregation = Cosine similarity and Dice coefficient
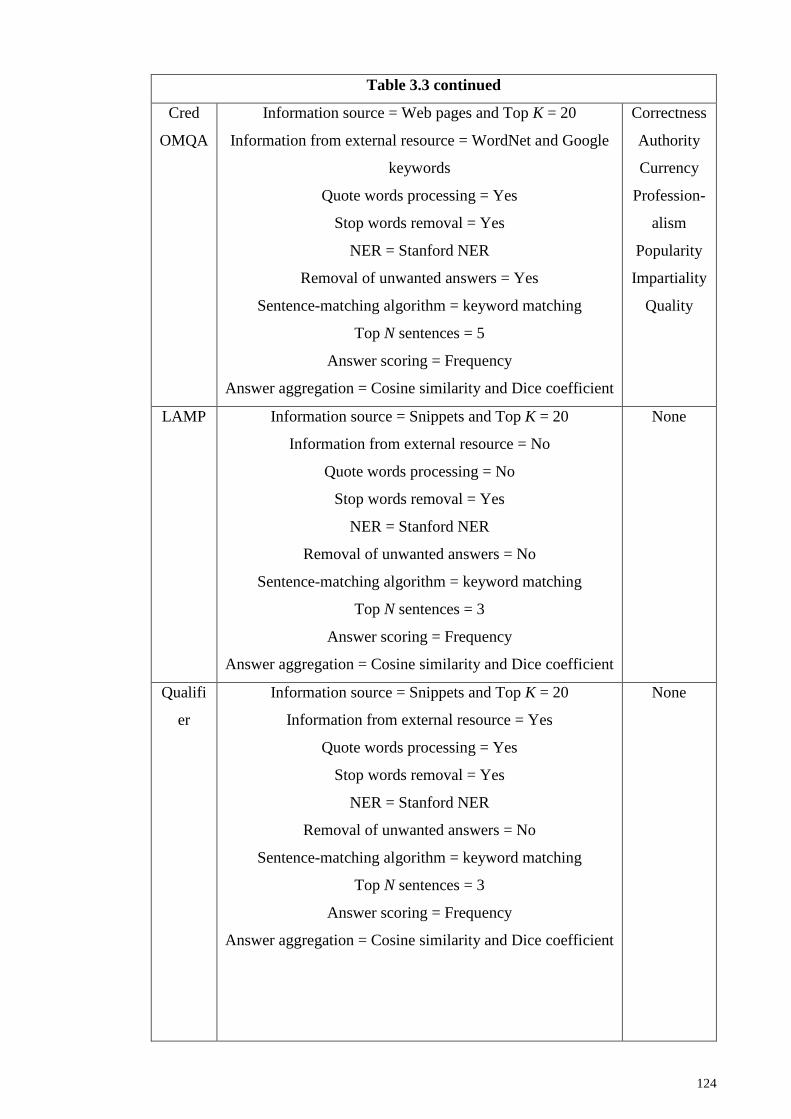
124
Table 3.3 continued
Cred
OMQA
Information source = Web pages and Top K = 20
Information from external resource = WordNet and Google
keywords
Quote words processing = Yes
Stop words removal = Yes
NER = Stanford NER
Removal of unwanted answers = Yes
Sentence-matching algorithm = keyword matching
Top N sentences = 5
Answer scoring = Frequency
Answer aggregation = Cosine similarity and Dice coefficient
Correctness
Authority
Currency
Profession-
alism
Popularity
Impartiality
Quality
LAMP Information source = Snippets and Top K = 20
Information from external resource = No
Quote words processing = No
Stop words removal = Yes
NER = Stanford NER
Removal of unwanted answers = No
Sentence-matching algorithm = keyword matching
Top N sentences = 3
Answer scoring = Frequency
Answer aggregation = Cosine similarity and Dice coefficient
None
Qualifi
er
Information source = Snippets and Top K = 20
Information from external resource = Yes
Quote words processing = Yes
Stop words removal = Yes
NER = Stanford NER
Removal of unwanted answers = No
Sentence-matching algorithm = keyword matching
Top N sentences = 3
Answer scoring = Frequency
Answer aggregation = Cosine similarity and Dice coefficient
None
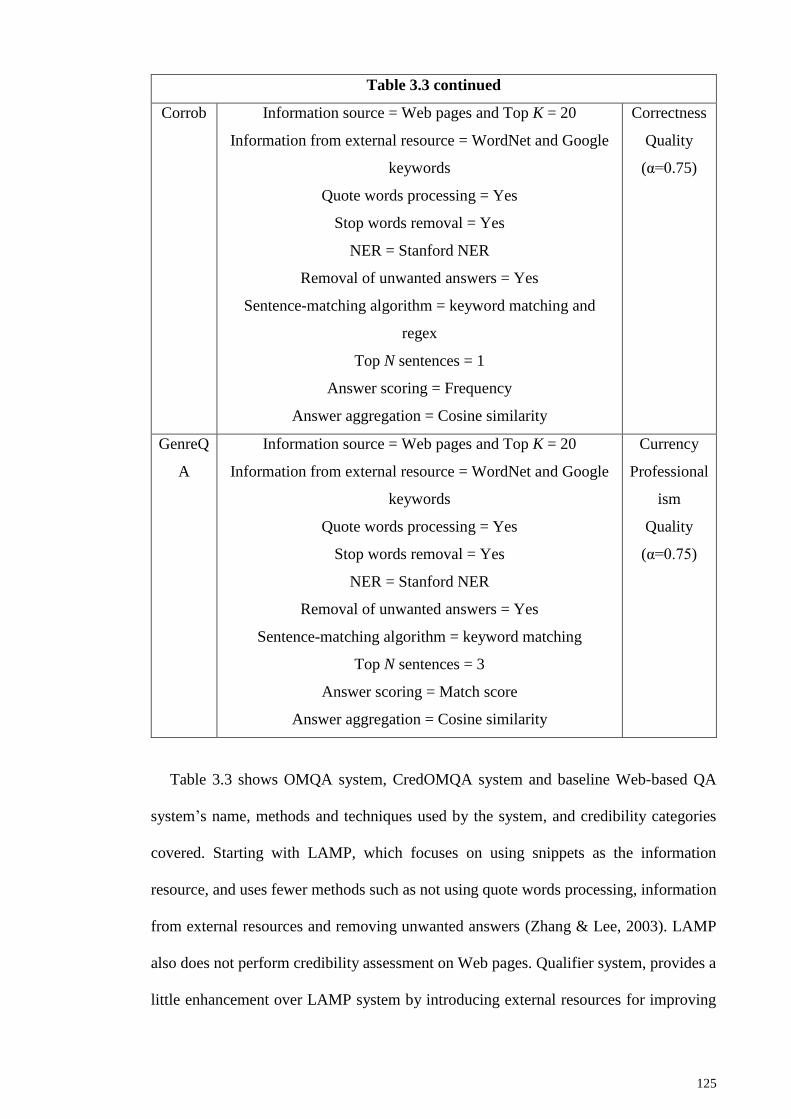
125
Table 3.3 continued
Corrob Information source = Web pages and Top K = 20
Information from external resource = WordNet and Google
keywords
Quote words processing = Yes
Stop words removal = Yes
NER = Stanford NER
Removal of unwanted answers = Yes
Sentence-matching algorithm = keyword matching and
regex
Top N sentences = 1
Answer scoring = Frequency
Answer aggregation = Cosine similarity
Correctness
Quality
(α=0.75)
GenreQ
A
Information source = Web pages and Top K = 20
Information from external resource = WordNet and Google
keywords
Quote words processing = Yes
Stop words removal = Yes
NER = Stanford NER
Removal of unwanted answers = Yes
Sentence-matching algorithm = keyword matching
Top N sentences = 3
Answer scoring = Match score
Answer aggregation = Cosine similarity
Currency
Professional
ism
Quality
(α=0.75)
Table 3.3 shows OMQA system, CredOMQA system and baseline Web-based QA
system’s name, methods and techniques used by the system, and credibility categories
covered. Starting with LAMP, which focuses on using snippets as the information
resource, and uses fewer methods such as not using quote words processing, information
from external resources and removing unwanted answers (Zhang & Lee, 2003). LAMP
also does not perform credibility assessment on Web pages. Qualifier system, provides a
little enhancement over LAMP system by introducing external resources for improving

126
sentence-matching and quote processing. This study evaluated the Qualifier system on
both snippets and Web pages, because the addition of these methods have different effects
on these resources (Yang & Chua, 2003). Qualifier system also does not perform any
credibility assessment. Corrob system makes good additions of answer removal filter, and
uses combination of techniques, such as both regex and keywords for sentence-matching,
but limited sentences matched N to 1 (Wu & Marian, 2011). Corrob system does use
credibility assessment and evaluates Web pages based on correctness and quality
categories, where α is set to 0.75. GenreQA uses more sentences matched (N=5) and
match score for ranking answers, compared to Corrob system (Oh et al., 2012). For
credibility assessment, GenreQA focus on currency, quality, and professionalism
credibility categories, where α is set to 0.75.
OMQA, suggested by this research, uses combination of methods and techniques
producing highest accuracy of answers in the results, as shown in Table 3.3. The
CredOMQA systems, which adds credibility assessment module to OMQA system, is
evaluated for credibility categories with different values of α (between 0 and 1). The
combination of methods and techniques used by the OMQA system is listed in Table 3.3.
Using the evaluation defined for baseline QA systems, OMQA and CredOMQA systems,
evaluation was carried out with respect to the evaluation metrics defined.
3.3.3.5 Evaluation metrics
Evaluation metrics allow researchers to evaluate their findings based on the scores
received. They also provide a measure to compare the system’s standing vis-à-vis other
systems using the same dataset used by other systems. Since one of the questions this
research aims to address is to see whether the inclusion of credibility scores of Web pages
improves accuracy of answers, therefore, evaluation metrics concerning accuracy of
answers in Web-based QA systems were selected. Thus, Mean Reciprocal Rank (MRR)
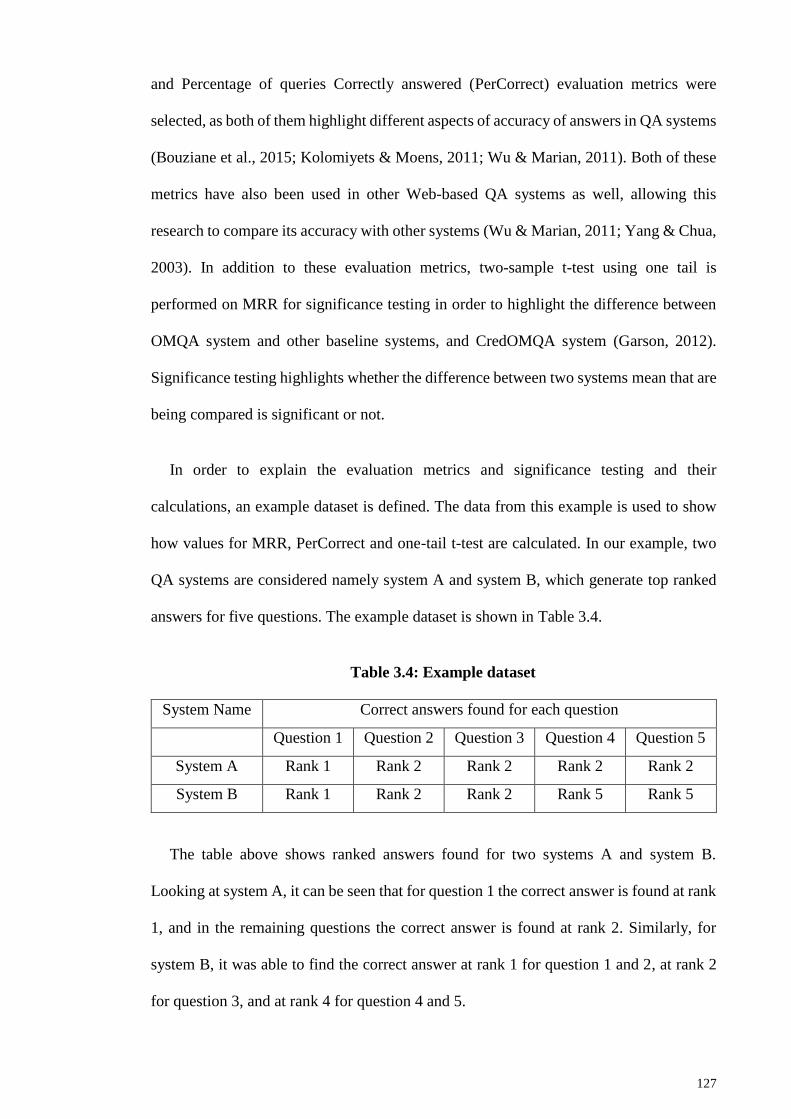
127
and Percentage of queries Correctly answered (PerCorrect) evaluation metrics were
selected, as both of them highlight different aspects of accuracy of answers in QA systems
(Bouziane et al., 2015; Kolomiyets & Moens, 2011; Wu & Marian, 2011). Both of these
metrics have also been used in other Web-based QA systems as well, allowing this
research to compare its accuracy with other systems (Wu & Marian, 2011; Yang & Chua,
2003). In addition to these evaluation metrics, two-sample t-test using one tail is
performed on MRR for significance testing in order to highlight the difference between
OMQA system and other baseline systems, and CredOMQA system (Garson, 2012).
Significance testing highlights whether the difference between two systems mean that are
being compared is significant or not.
In order to explain the evaluation metrics and significance testing and their
calculations, an example dataset is defined. The data from this example is used to show
how values for MRR, PerCorrect and one-tail t-test are calculated. In our example, two
QA systems are considered namely system A and system B, which generate top ranked
answers for five questions. The example dataset is shown in Table 3.4.
Table 3.4: Example dataset
System Name Correct answers found for each question
Question 1 Question 2 Question 3 Question 4 Question 5
System A Rank 1 Rank 2 Rank 2 Rank 2 Rank 2
System B Rank 1 Rank 2 Rank 2 Rank 5 Rank 5
The table above shows ranked answers found for two systems A and system B.
Looking at system A, it can be seen that for question 1 the correct answer is found at rank
1, and in the remaining questions the correct answer is found at rank 2. Similarly, for
system B, it was able to find the correct answer at rank 1 for question 1 and 2, at rank 2
for question 3, and at rank 4 for question 4 and 5.
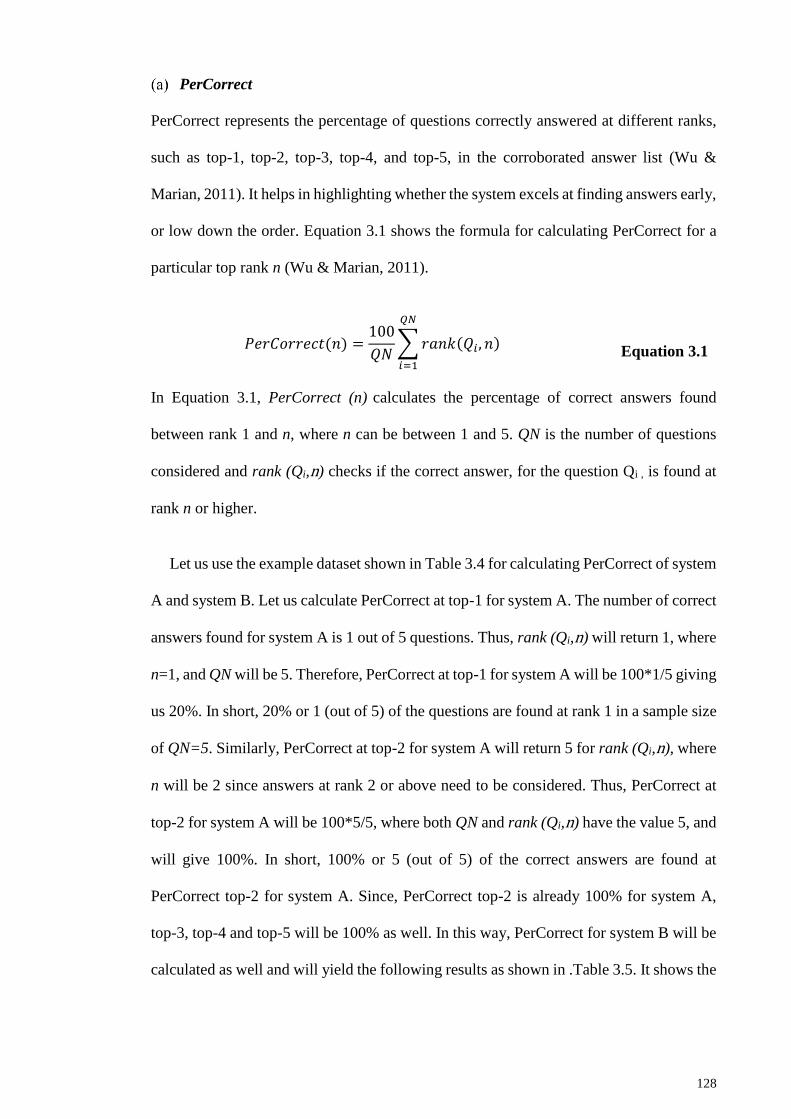
128
PerCorrect
PerCorrect represents the percentage of questions correctly answered at different ranks,
such as top-1, top-2, top-3, top-4, and top-5, in the corroborated answer list (Wu &
Marian, 2011). It helps in highlighting whether the system excels at finding answers early,
or low down the order. Equation 3.1 shows the formula for calculating PerCorrect for a
particular top rank n (Wu & Marian, 2011).
𝑃𝑒𝑟𝐶𝑜𝑟𝑟𝑒𝑐𝑡(𝑛) =100
𝑄𝑁∑ 𝑟𝑎𝑛𝑘(𝑄𝑖, 𝑛)
𝑄𝑁
𝑖=1
Equation 3.1
In Equation 3.1, PerCorrect (n) calculates the percentage of correct answers found
between rank 1 and n, where n can be between 1 and 5. QN is the number of questions
considered and rank (Qi,n) checks if the correct answer, for the question Qi , is found at
rank n or higher.
Let us use the example dataset shown in Table 3.4 for calculating PerCorrect of system
A and system B. Let us calculate PerCorrect at top-1 for system A. The number of correct
answers found for system A is 1 out of 5 questions. Thus, rank (Qi,n) will return 1, where
n=1, and QN will be 5. Therefore, PerCorrect at top-1 for system A will be 100*1/5 giving
us 20%. In short, 20% or 1 (out of 5) of the questions are found at rank 1 in a sample size
of QN=5. Similarly, PerCorrect at top-2 for system A will return 5 for rank (Qi,n), where
n will be 2 since answers at rank 2 or above need to be considered. Thus, PerCorrect at
top-2 for system A will be 100*5/5, where both QN and rank (Qi,n) have the value 5, and
will give 100%. In short, 100% or 5 (out of 5) of the correct answers are found at
PerCorrect top-2 for system A. Since, PerCorrect top-2 is already 100% for system A,
top-3, top-4 and top-5 will be 100% as well. In this way, PerCorrect for system B will be
calculated as well and will yield the following results as shown in .Table 3.5. It shows the

129
percentage of correct answers found at each rank and the frequency of correct answers
out of total questions QN=5.
Table 3.5: PerCorrect results for example dataset for QN=5
System Name PerCorrect percentage at different ranks
Top-1 Top-2 Top-3 Top-4 Top-5
System A 20%(1) 100%(5) 100%(5) 100%(5) 100%(5)
System B 20%(1) 60%(3) 60%(3) 60%(3) 100%(5)
MRR
TREC suggests MRR as the default evaluation metrics for evaluating their sample
(Kolomiyets & Moens, 2011). The metric shows the capability of the system in reaching
the correct answer early. A higher MRR score shows that the system is able to find the
correct answers at higher ranks. Similarly, a system receiving a low MRR score is able to
find correct answers at lower ranks, such as top-4 and top-5. MRR is calculated by taking
reciprocal of the rank where the correct answer was found. If the correct answer is not
found, then it is assigned an MRR score of zero. Consider a scenario where the correct
answer was found at rank 1, the MRR score is 1/1. Similarly, if the answer is found at
rank 2, then its MRR score is ½. The equation for calculating MRR is shown in Equation
3.2(Kolomiyets & Moens, 2011).
𝑀𝑅𝑅 =1
𝑄𝑁∑
1
𝑟𝑎𝑛𝑘(𝑄𝑖)
𝑄𝑁
𝑖=1
Equation 3.2
In Equation 3.2, QN represents number of questions considered and rank(Qi) is the
rank of the topmost correct answer of question i.
Let us calculate MRR for each question and the average MRR of system A and B using
the sample dataset. Look at question 1 for system A, it is able to find the correct answer

130
at rank 1. For calculating system A’s MRR for question 1 would 1/ rank(Q1), where
rank(Q1) is 1 and will yield 1/1 that is 1. Similarly, for question 2 it would be ½ or 0.5
since rank(Q2) is 2. The same process is done for the remaining question. System A’s
MRR for each question would be 1, 0.5, 0.5, 0.5, 0.5 respectively. Using these results
system A’s MRR can be calculated, which is the average of the MRRs of all questions,
which is (1+ 0.5 + 0.5 + 0.5 + 0.5)/QN where QN is 5 and will give 0.6. Similarly, MRR
for system B can be calculate using the same mechanism and will yield the following
results, as shown in .
Table 3.6: MRR results for example dataset for QN=5
System Name MRR for each question
System
MRR
Q1 MRR Q2 MRR Q3 MRR Q4 MRR Q5 MRR
System A 0.6 1 0.5 0.5 0.5 0.5
System B 0.48 1 0.5 0.5 0.2 0.2
Two-sample t-test using one tail
T-test is a type of hypothesis test that is used to compare means of one or two sample
populations to determine whether they are equal or not (Garson, 2012). It is called a t-test
as the sample population is represented using a single number called a t-value. There are
many variations of t-tests including one-sample t-test, two-sample t-test which can be
paired or un-paired and using one tail or two tail t-test for showing result(Garson, 2012).
In our tests, two-sample t-test is chosen as the research would like to compared the
difference between two systems (Bruin, 2016). Moreover, one tail is chosen as the aim is
to only test whether the average mean of the first system is less than the second system.
Two-tail is performed when it is not known whether the first system will be better or
worse (Bruin, 2016). In short, one-tail is unidirectional and two-tail is bi-directional. In
our tests, one-tail is used in order to highlight whether baseline system is performing less
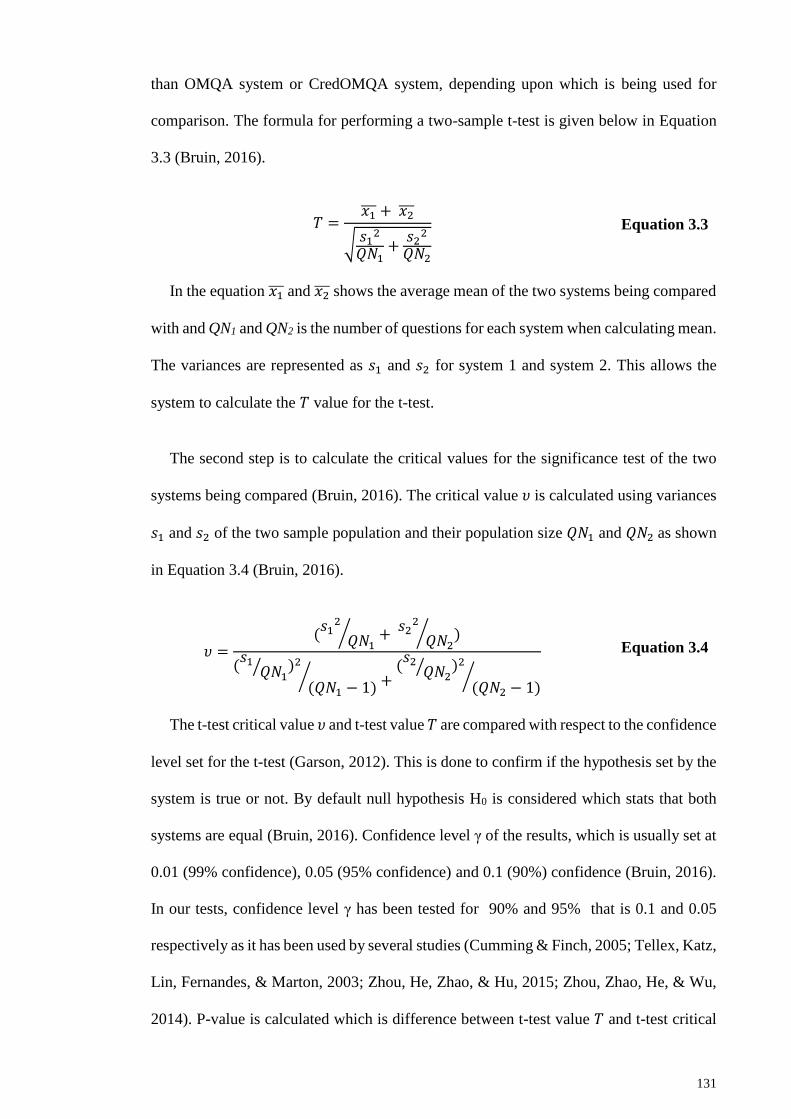
131
than OMQA system or CredOMQA system, depending upon which is being used for
comparison. The formula for performing a two-sample t-test is given below in Equation
3.3 (Bruin, 2016).
𝑇 =𝑥1̅̅̅ + 𝑥2̅̅ ̅
√𝑠1
2
𝑄𝑁1+
𝑠22
𝑄𝑁2
Equation 3.3
In the equation 𝑥1̅̅̅ and 𝑥2̅̅ ̅ shows the average mean of the two systems being compared
with and QN1 and QN2 is the number of questions for each system when calculating mean.
The variances are represented as 𝑠1 and 𝑠2 for system 1 and system 2. This allows the
system to calculate the 𝑇 value for the t-test.
The second step is to calculate the critical values for the significance test of the two
systems being compared (Bruin, 2016). The critical value 𝜐 is calculated using variances
𝑠1 and 𝑠2 of the two sample population and their population size 𝑄𝑁1 and 𝑄𝑁2 as shown
in Equation 3.4 (Bruin, 2016).
𝜐 =(𝑠1
2
𝑄𝑁1⁄ +
𝑠22
𝑄𝑁2⁄ )
(𝑠1
𝑄𝑁1⁄ )2
(𝑄𝑁1 − 1)⁄ +
(𝑠2
𝑄𝑁2⁄ )2
(𝑄𝑁2 − 1)⁄
Equation 3.4
The t-test critical value 𝜐 and t-test value 𝑇 are compared with respect to the confidence
level set for the t-test (Garson, 2012). This is done to confirm if the hypothesis set by the
system is true or not. By default null hypothesis H0 is considered which stats that both
systems are equal (Bruin, 2016). Confidence level γ of the results, which is usually set at
0.01 (99% confidence), 0.05 (95% confidence) and 0.1 (90%) confidence (Bruin, 2016).
In our tests, confidence level γ has been tested for 90% and 95% that is 0.1 and 0.05
respectively as it has been used by several studies (Cumming & Finch, 2005; Tellex, Katz,
Lin, Fernandes, & Marton, 2003; Zhou, He, Zhao, & Hu, 2015; Zhou, Zhao, He, & Wu,
2014). P-value is calculated which is difference between t-test value 𝑇 and t-test critical
132
value 𝜐. If the difference between the two is lower than the confidence level set for the
test, then the systems are significantly different, with system A less than system B thus
rejecting the null hypothesis H0. Otherwise, the null hypothesis is not rejected and both
systems are not considered significantly different. Equation 3.5 shows the formula used
for calculating P-value for significance testing comparison (Bruin, 2016)
𝑃 − 𝑣𝑎𝑙𝑢𝑒 (𝑇 < 𝑣) = 𝑣 − 𝑇, where γ=0.1 Equation 3.5
Consider the example dataset for performing significance test between system A and
system B. First average mean of both systems A and B are calculated, which are .6 and
.48. Then variance of both sample sets are also calculated which are 0.05 and .107 for
system A and B respectively. Higher value of variance shows that there is more
inconsistency in the sample population. Using these values, . This is then computed with
the confidence level set for the test and critical values for the sample . At the end the final
P-values are calculated which are shown in the table below.
Table 3.7: T-test results for systems used in example dataset for QN=5
System Name Sig test
P-value
System A 0.0889
System B
The P-value of system A is given since system A is being compared with System B.
P-value for system B is not calculated as significance testing is not performing on the
same dataset. As it can be seen that P-value for system A is less than 0.10. Thus P-value
is within the 90% confidence level, so it is safe to say that system A is significantly better
than system B.
133
3.3.4 Develop OMQA system
Based on the literature covered on methods and techniques in section 2.1.4 OMQA
system is developed. The modules and methods used in OMQA systems have been
highlighted in Figure 2.2. As highlighted in literature, a number of methods and
techniques are available in Web-based QA systems. In order to evaluate the different
methods and techniques OMQA system is developed. OMQA systems has a number of
techniques available for each method, which are selected for evaluation and are
highlighted in section 2.1.4. These are covered briefly below.
Starting with question analysis, the OMQA system uses various techniques like
keywords extraction, quote-words extraction and stopwords removal. Though methods
under question analysis are not evaluated, yet the OMQA system did perform question
parsing and question classification before sending data to the answer extraction module.
In the answer extraction module, OMQA system goes through a twelve methods. Each
of these methods has one more techniques to choose from. The method and their
techniques available under the answer extraction module are highlighted in Table 2.4
along with the techniques selected for evaluation. Our reasons for selecting a subset of
techniques for evaluation is due to their popularity by most QA systems and ease of use.
For example, under Top K results selection OMQA system can perform this operation
using Web pages or snippets and set K to 5, 10 or 20. This allows the system to evaluate
different techniques under Top K results selection and generate results for different
baseline systems. Similarly, there are two techniques available under sentence-matching
including keyword matching and regex matching, and both of them can be used by the
OMQA system.
In the answer scoring module, OMQA system has three methods to choose from
including frequency, match-score and prominence score. All of these methods are

134
included in the OMQA system and are highlighted in Table 2.5. Similarly, in the answer
aggregation module the OMQA system has a two techniques available under string
matching including cosine similarity and dice coefficient. Since, both of these techniques
can be used by QA systems so both of them are included in the OMQA system so that
they may be evaluated.
Using all the methods and techniques available, the OMQA is capable of generating
comparison results for different techniques available under each method. This is done
using the experiment settings specified for methods and techniques in section 3.3.3.3.
Additionally, the system is capable of producing results for baseline systems based on the
methods and techniques used by these systems, which have been highlighted in section
3.3.3.4. Once results for different methods and techniques are generated, the OMQA
system selects the ones performing better than others to produce its own results. This
allows the OMQA system to use optimal methods and techniques available in literature
to produce highest accuracy of answers.
3.3.5 Generating top ranked answers
Using the cleaned data collection and experiment settings for Web-based QA systems
methods and techniques, and other Web-based QA systems, the OMQA system is now
capable of generating top ranked answers. Figure 3.5 shows the interface designed for the
prototype, providing valuable information and functions to generate top ranked answers.
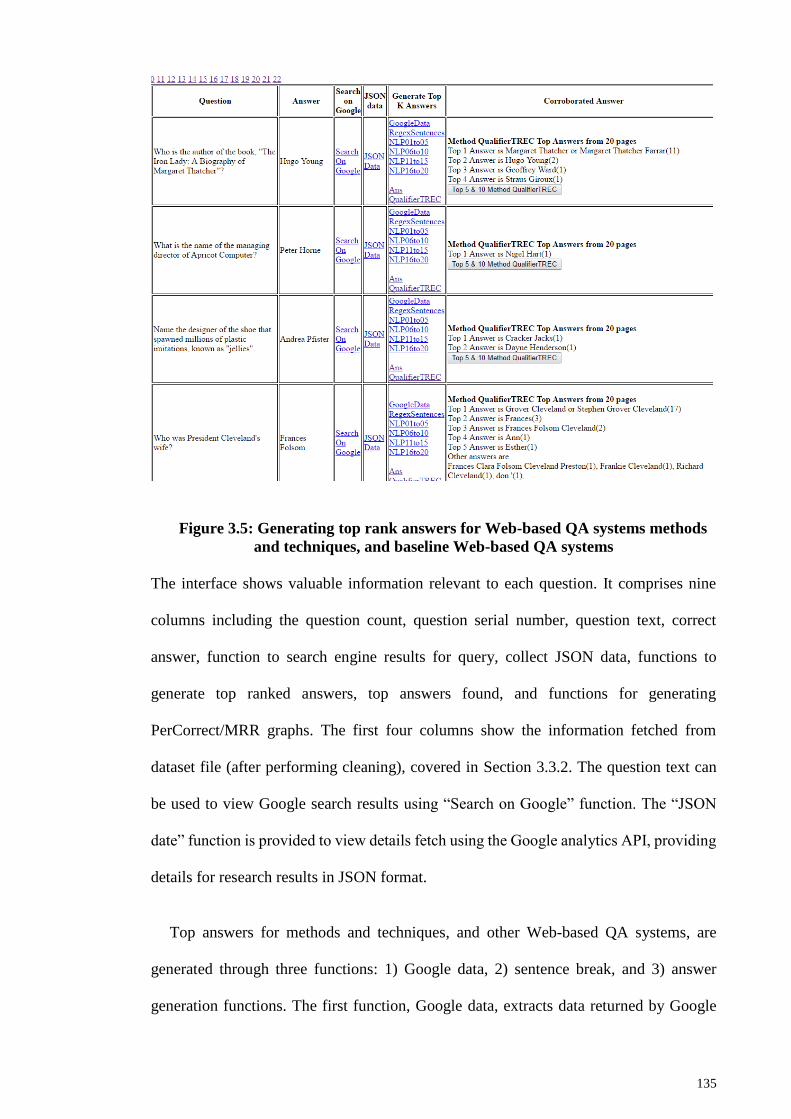
135
Figure 3.5: Generating top rank answers for Web-based QA systems methods
and techniques, and baseline Web-based QA systems
The interface shows valuable information relevant to each question. It comprises nine
columns including the question count, question serial number, question text, correct
answer, function to search engine results for query, collect JSON data, functions to
generate top ranked answers, top answers found, and functions for generating
PerCorrect/MRR graphs. The first four columns show the information fetched from
dataset file (after performing cleaning), covered in Section 3.3.2. The question text can
be used to view Google search results using “Search on Google” function. The “JSON
date” function is provided to view details fetch using the Google analytics API, providing
details for research results in JSON format.
Top answers for methods and techniques, and other Web-based QA systems, are
generated through three functions: 1) Google data, 2) sentence break, and 3) answer
generation functions. The first function, Google data, extracts data returned by Google

136
analytics API consisting of details such as search results’ URL, snippets for URLs, and
Google keywords, which are stored on hard disk. The second function, breaks Web pages
into sentences using two functions―regex and NLP break functions. Regex break
function performs sentence break using regex expressions while NLP break performs it
using NLP techniques. These sentences are also stored on hard disk. Third set of functions
is answer generation functions, which are defined for every method and technique, and
baseline Web-based QA system, to be evaluated. The methods and techniques evaluated
are listed in Table 2.3, Table 2.4, Table 2.5 and Table 2.6, based on the experiment
settings defined in Table 3.2. These functions go through all the modules of a Web-based
QA system to generate rank answers. These answers are also stored in text files on the
computer so that they could be used for evaluation. More details on stored answers are
covered in Section 3.3.8.
These results can be viewed in two ways: 1) top ranked answer list or 2) PerCorrect
and MRR graphs. The top rank answer list is generated using answer scoring and answer
aggregation modules, depending upon the technique specified for the function. The
graphs use the same data but show them in the form of PerCorrect and MRR graphs.
3.3.6 Credibility assessment module
Similar to generation of top answers, credibility scores for Web pages are generated as
well. These Web credibility scores are generated using a number of credibility factors
used for scoring credibility categories. Before they can be generated, the system fetches
data related to credibility factors, such as readability score, impartiality score, originality
score, etc. Figure 3.6 shows functions defined for fetching credibility factors data and
credibility score generation functions.

137
Figure 3.6: Credibility assessment module and functions
Similar to the interface discussed in Section 3.3.4, the credibility-assessment module
is able to generate credibility factors data for each question. The first four columns of the
interface show information for a question, including question count, question number,
question text and correct answer for the question. The fifth column, i.e., search on Google,
shows the results of the query on Google search engine. The sixth column provides a list
of functions used for generating credibility factors data. This data is for scoring credibility
categories and generating ranked answer list based on credibility scores of Web pages.
The last column, i.e., the seventh column of the interface, shows ranked answer list
generated using credibility scores and without them, to help compare the differences.
3.3.7 Develop CredOMQA system
Credibility-based answers are generated by using a credibility assessment module
alongside OMQA system, which is referred to as CredOMQA system as shown in Figure
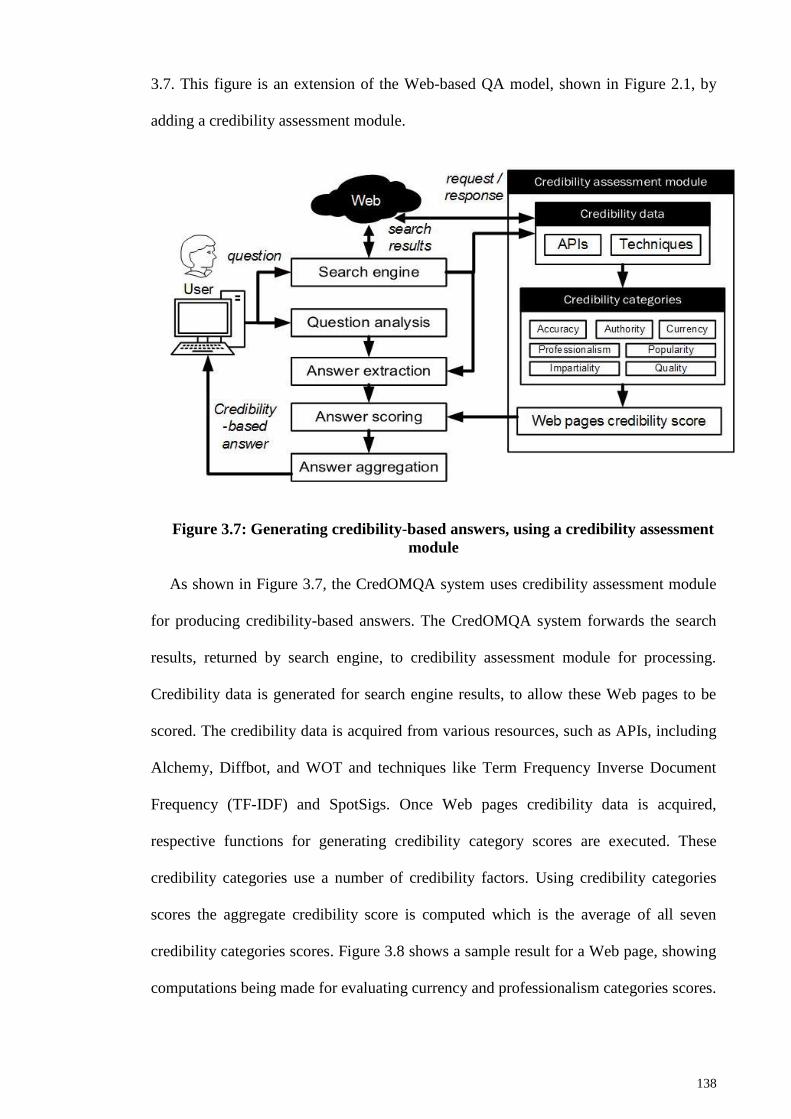
138
3.7. This figure is an extension of the Web-based QA model, shown in Figure 2.1, by
adding a credibility assessment module.
Figure 3.7: Generating credibility-based answers, using a credibility assessment
module
As shown in Figure 3.7, the CredOMQA system uses credibility assessment module
for producing credibility-based answers. The CredOMQA system forwards the search
results, returned by search engine, to credibility assessment module for processing.
Credibility data is generated for search engine results, to allow these Web pages to be
scored. The credibility data is acquired from various resources, such as APIs, including
Alchemy, Diffbot, and WOT and techniques like Term Frequency Inverse Document
Frequency (TF-IDF) and SpotSigs. Once Web pages credibility data is acquired,
respective functions for generating credibility category scores are executed. These
credibility categories use a number of credibility factors. Using credibility categories
scores the aggregate credibility score is computed which is the average of all seven
credibility categories scores. Figure 3.8 shows a sample result for a Web page, showing
computations being made for evaluating currency and professionalism categories scores.
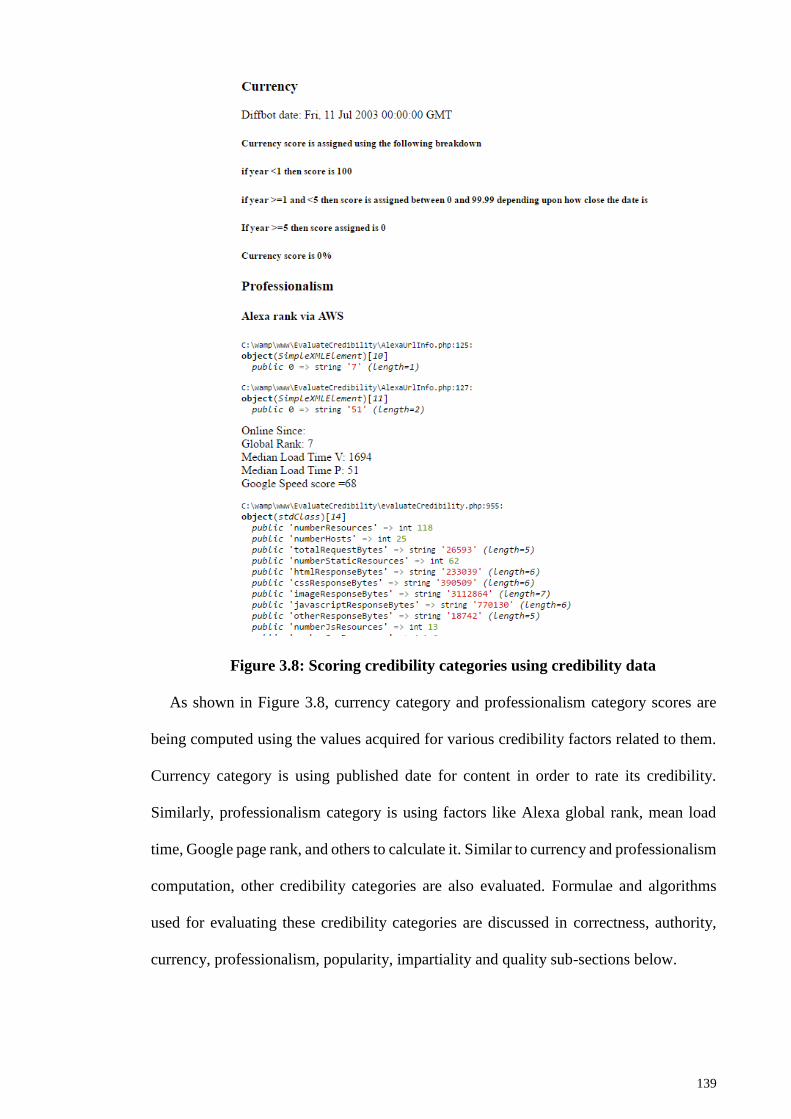
139
Figure 3.8: Scoring credibility categories using credibility data
As shown in Figure 3.8, currency category and professionalism category scores are
being computed using the values acquired for various credibility factors related to them.
Currency category is using published date for content in order to rate its credibility.
Similarly, professionalism category is using factors like Alexa global rank, mean load
time, Google page rank, and others to calculate it. Similar to currency and professionalism
computation, other credibility categories are also evaluated. Formulae and algorithms
used for evaluating these credibility categories are discussed in correctness, authority,
currency, professionalism, popularity, impartiality and quality sub-sections below.
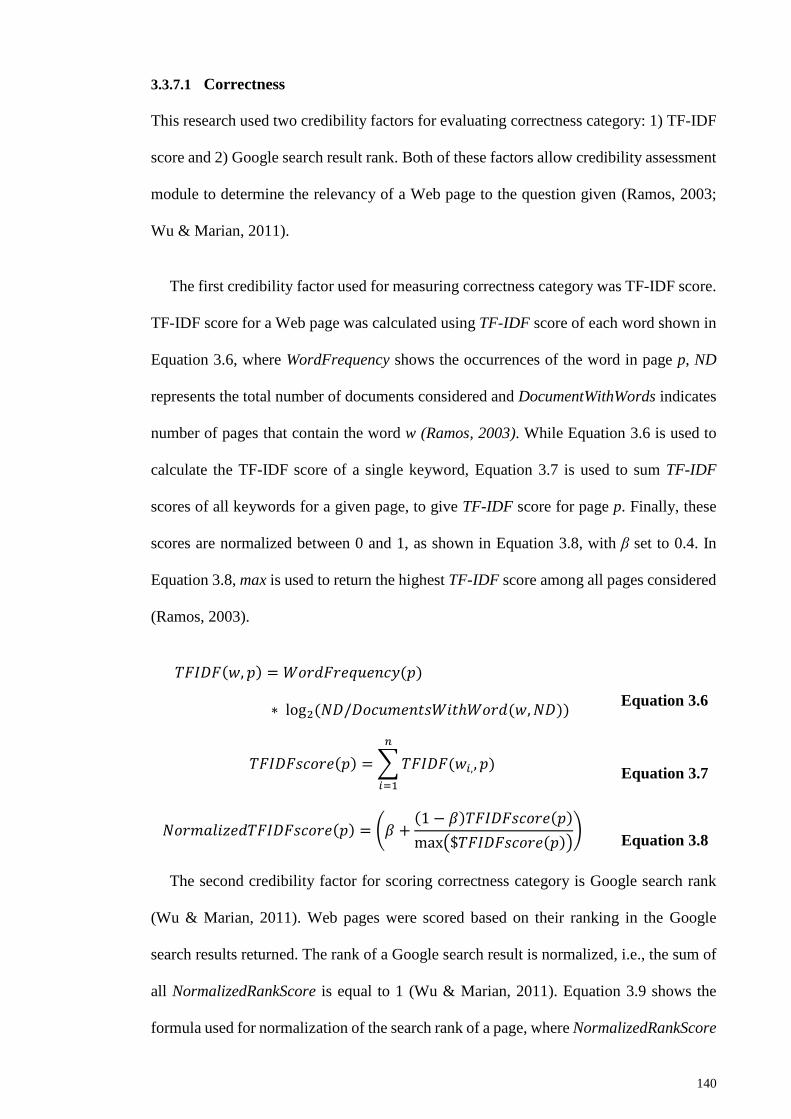
140
3.3.7.1 Correctness
This research used two credibility factors for evaluating correctness category: 1) TF-IDF
score and 2) Google search result rank. Both of these factors allow credibility assessment
module to determine the relevancy of a Web page to the question given (Ramos, 2003;
Wu & Marian, 2011).
The first credibility factor used for measuring correctness category was TF-IDF score.
TF-IDF score for a Web page was calculated using TF-IDF score of each word shown in
Equation 3.6, where WordFrequency shows the occurrences of the word in page p, ND
represents the total number of documents considered and DocumentWithWords indicates
number of pages that contain the word w (Ramos, 2003). While Equation 3.6 is used to
calculate the TF-IDF score of a single keyword, Equation 3.7 is used to sum TF-IDF
scores of all keywords for a given page, to give TF-IDF score for page p. Finally, these
scores are normalized between 0 and 1, as shown in Equation 3.8, with β set to 0.4. In
Equation 3.8, max is used to return the highest TF-IDF score among all pages considered
(Ramos, 2003).
𝑇𝐹𝐼𝐷𝐹(𝑤, 𝑝) = 𝑊𝑜𝑟𝑑𝐹𝑟𝑒𝑞𝑢𝑒𝑛𝑐𝑦(𝑝)
∗ log2(𝑁𝐷/𝐷𝑜𝑐𝑢𝑚𝑒𝑛𝑡𝑠𝑊𝑖𝑡ℎ𝑊𝑜𝑟𝑑(𝑤, 𝑁𝐷)) Equation 3.6
𝑇𝐹𝐼𝐷𝐹𝑠𝑐𝑜𝑟𝑒(𝑝) = ∑ 𝑇𝐹𝐼𝐷𝐹(𝑤𝑖,, 𝑝)
𝑛
𝑖=1
Equation 3.7
𝑁𝑜𝑟𝑚𝑎𝑙𝑖𝑧𝑒𝑑𝑇𝐹𝐼𝐷𝐹𝑠𝑐𝑜𝑟𝑒(𝑝) = (𝛽 +(1 − 𝛽)𝑇𝐹𝐼𝐷𝐹𝑠𝑐𝑜𝑟𝑒(𝑝)
max($𝑇𝐹𝐼𝐷𝐹𝑠𝑐𝑜𝑟𝑒(𝑝)))
Equation 3.8
The second credibility factor for scoring correctness category is Google search rank
(Wu & Marian, 2011). Web pages were scored based on their ranking in the Google
search results returned. The rank of a Google search result is normalized, i.e., the sum of
all NormalizedRankScore is equal to 1 (Wu & Marian, 2011). Equation 3.9 shows the
formula used for normalization of the search rank of a page, where NormalizedRankScore
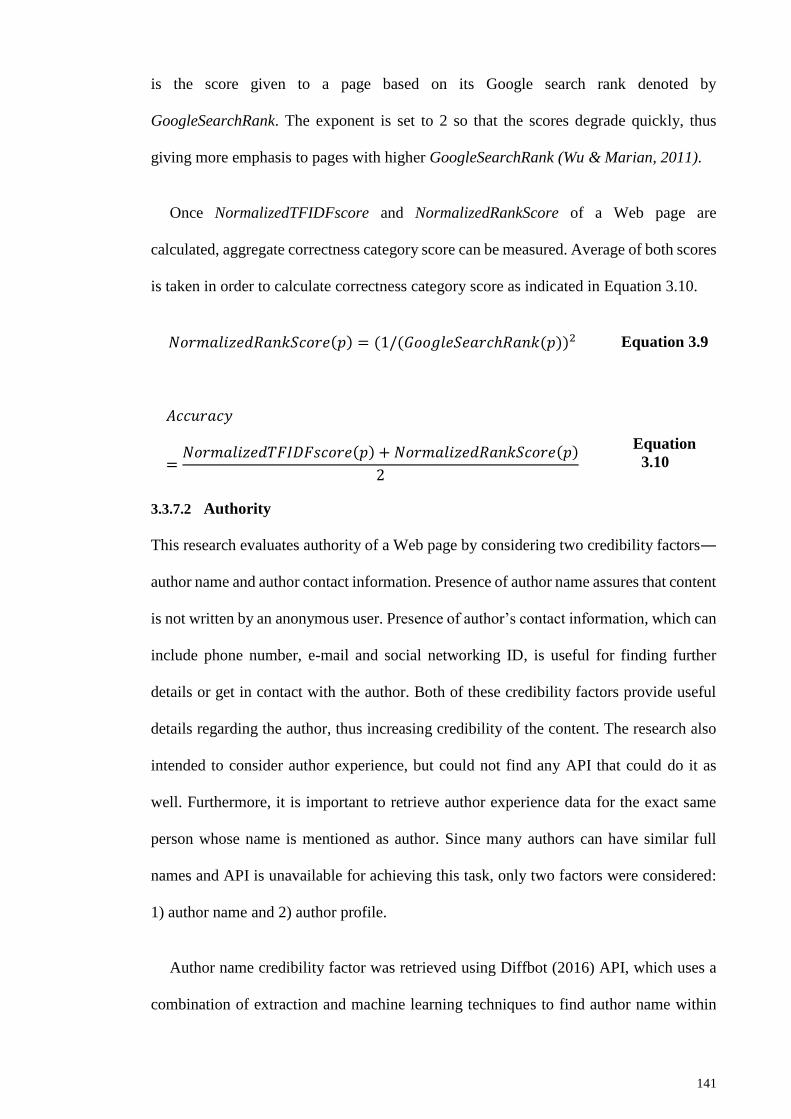
141
is the score given to a page based on its Google search rank denoted by
GoogleSearchRank. The exponent is set to 2 so that the scores degrade quickly, thus
giving more emphasis to pages with higher GoogleSearchRank (Wu & Marian, 2011).
Once NormalizedTFIDFscore and NormalizedRankScore of a Web page are
calculated, aggregate correctness category score can be measured. Average of both scores
is taken in order to calculate correctness category score as indicated in Equation 3.10.
𝑁𝑜𝑟𝑚𝑎𝑙𝑖𝑧𝑒𝑑𝑅𝑎𝑛𝑘𝑆𝑐𝑜𝑟𝑒(𝑝) = (1/(𝐺𝑜𝑜𝑔𝑙𝑒𝑆𝑒𝑎𝑟𝑐ℎ𝑅𝑎𝑛𝑘(𝑝))2 Equation 3.9
𝐴𝑐𝑐𝑢𝑟𝑎𝑐𝑦
=𝑁𝑜𝑟𝑚𝑎𝑙𝑖𝑧𝑒𝑑𝑇𝐹𝐼𝐷𝐹𝑠𝑐𝑜𝑟𝑒(𝑝) + 𝑁𝑜𝑟𝑚𝑎𝑙𝑖𝑧𝑒𝑑𝑅𝑎𝑛𝑘𝑆𝑐𝑜𝑟𝑒(𝑝)
2
Equation
3.10
3.3.7.2 Authority
This research evaluates authority of a Web page by considering two credibility factors―
author name and author contact information. Presence of author name assures that content
is not written by an anonymous user. Presence of author’s contact information, which can
include phone number, e-mail and social networking ID, is useful for finding further
details or get in contact with the author. Both of these credibility factors provide useful
details regarding the author, thus increasing credibility of the content. The research also
intended to consider author experience, but could not find any API that could do it as
well. Furthermore, it is important to retrieve author experience data for the exact same
person whose name is mentioned as author. Since many authors can have similar full
names and API is unavailable for achieving this task, only two factors were considered:
1) author name and 2) author profile.
Author name credibility factor was retrieved using Diffbot (2016) API, which uses a
combination of extraction and machine learning techniques to find author name within
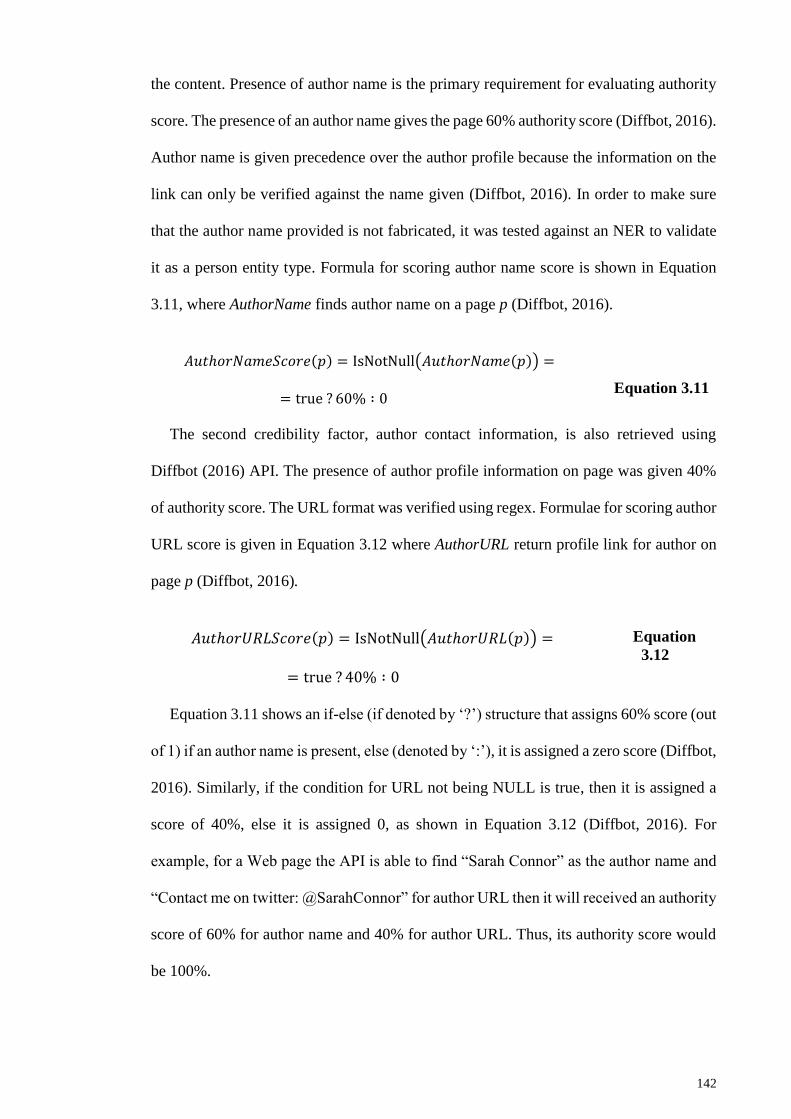
142
the content. Presence of author name is the primary requirement for evaluating authority
score. The presence of an author name gives the page 60% authority score (Diffbot, 2016).
Author name is given precedence over the author profile because the information on the
link can only be verified against the name given (Diffbot, 2016). In order to make sure
that the author name provided is not fabricated, it was tested against an NER to validate
it as a person entity type. Formula for scoring author name score is shown in Equation
3.11, where AuthorName finds author name on a page p (Diffbot, 2016).
𝐴𝑢𝑡ℎ𝑜𝑟𝑁𝑎𝑚𝑒𝑆𝑐𝑜𝑟𝑒(𝑝) = IsNotNull(𝐴𝑢𝑡ℎ𝑜𝑟𝑁𝑎𝑚𝑒(𝑝)) =
= true ? 60% ∶ 0 Equation 3.11
The second credibility factor, author contact information, is also retrieved using
Diffbot (2016) API. The presence of author profile information on page was given 40%
of authority score. The URL format was verified using regex. Formulae for scoring author
URL score is given in Equation 3.12 where AuthorURL return profile link for author on
page p (Diffbot, 2016).
𝐴𝑢𝑡ℎ𝑜𝑟𝑈𝑅𝐿𝑆𝑐𝑜𝑟𝑒(𝑝) = IsNotNull(𝐴𝑢𝑡ℎ𝑜𝑟𝑈𝑅𝐿(𝑝)) =
= true ? 40% ∶ 0
Equation
3.12
Equation 3.11 shows an if-else (if denoted by ‘?’) structure that assigns 60% score (out
of 1) if an author name is present, else (denoted by ‘:’), it is assigned a zero score (Diffbot,
2016). Similarly, if the condition for URL not being NULL is true, then it is assigned a
score of 40%, else it is assigned 0, as shown in Equation 3.12 (Diffbot, 2016). For
example, for a Web page the API is able to find “Sarah Connor” as the author name and
“Contact me on twitter: @SarahConnor” for author URL then it will received an authority
score of 60% for author name and 40% for author URL. Thus, its authority score would
be 100%.
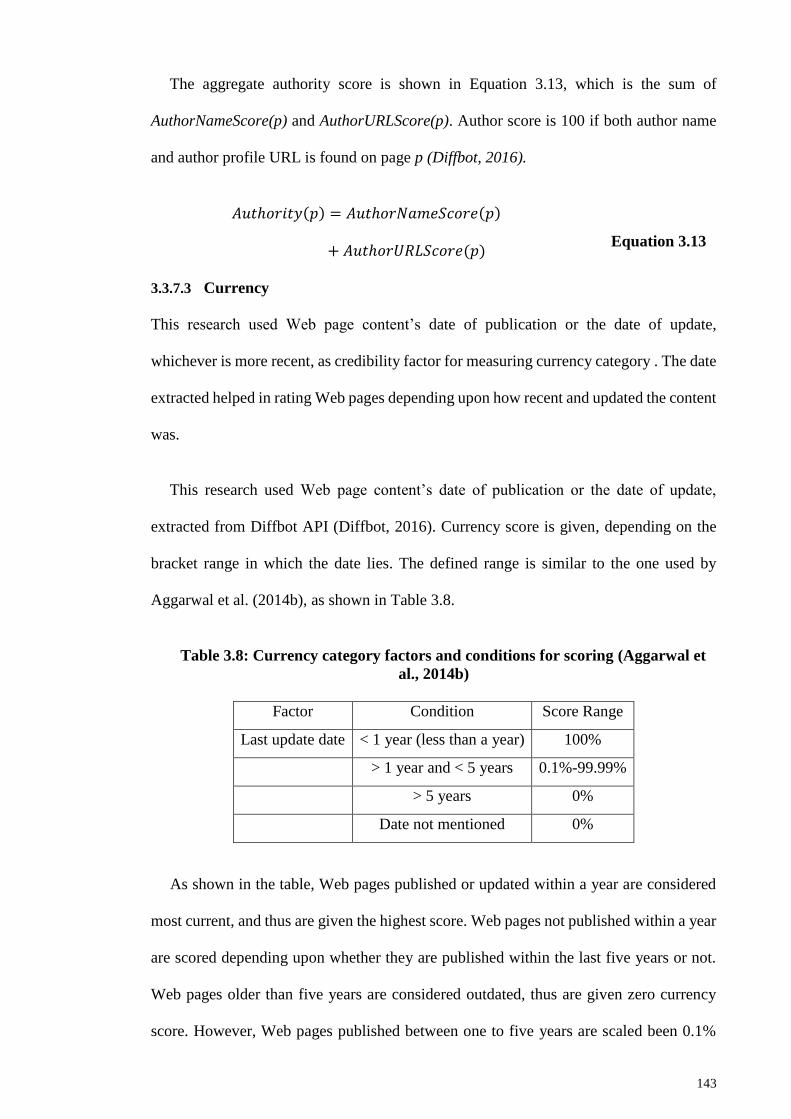
143
The aggregate authority score is shown in Equation 3.13, which is the sum of
AuthorNameScore(p) and AuthorURLScore(p). Author score is 100 if both author name
and author profile URL is found on page p (Diffbot, 2016).
𝐴𝑢𝑡ℎ𝑜𝑟𝑖𝑡𝑦(𝑝) = 𝐴𝑢𝑡ℎ𝑜𝑟𝑁𝑎𝑚𝑒𝑆𝑐𝑜𝑟𝑒(𝑝)
+ 𝐴𝑢𝑡ℎ𝑜𝑟𝑈𝑅𝐿𝑆𝑐𝑜𝑟𝑒(𝑝) Equation 3.13
3.3.7.3 Currency
This research used Web page content’s date of publication or the date of update,
whichever is more recent, as credibility factor for measuring currency category . The date
extracted helped in rating Web pages depending upon how recent and updated the content
was.
This research used Web page content’s date of publication or the date of update,
extracted from Diffbot API (Diffbot, 2016). Currency score is given, depending on the
bracket range in which the date lies. The defined range is similar to the one used by
Aggarwal et al. (2014b), as shown in Table 3.8.
Table 3.8: Currency category factors and conditions for scoring (Aggarwal et
al., 2014b)
Factor Condition Score Range
Last update date < 1 year (less than a year) 100%
> 1 year and < 5 years 0.1%-99.99%
> 5 years 0%
Date not mentioned 0%
As shown in the table, Web pages published or updated within a year are considered
most current, and thus are given the highest score. Web pages not published within a year
are scored depending upon whether they are published within the last five years or not.
Web pages older than five years are considered outdated, thus are given zero currency
score. However, Web pages published between one to five years are scaled been 0.1%
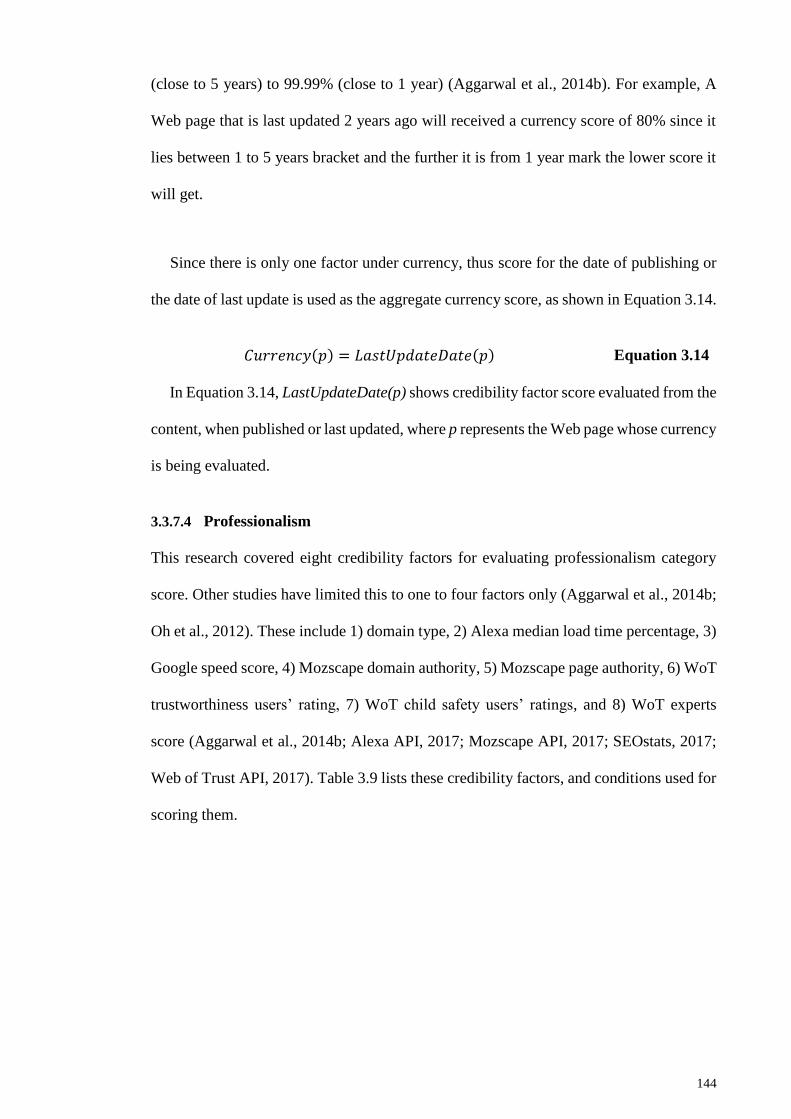
144
(close to 5 years) to 99.99% (close to 1 year) (Aggarwal et al., 2014b). For example, A
Web page that is last updated 2 years ago will received a currency score of 80% since it
lies between 1 to 5 years bracket and the further it is from 1 year mark the lower score it
will get.
Since there is only one factor under currency, thus score for the date of publishing or
the date of last update is used as the aggregate currency score, as shown in Equation 3.14.
𝐶𝑢𝑟𝑟𝑒𝑛𝑐𝑦(𝑝) = 𝐿𝑎𝑠𝑡𝑈𝑝𝑑𝑎𝑡𝑒𝐷𝑎𝑡𝑒(𝑝) Equation 3.14
In Equation 3.14, LastUpdateDate(p) shows credibility factor score evaluated from the
content, when published or last updated, where p represents the Web page whose currency
is being evaluated.
3.3.7.4 Professionalism
This research covered eight credibility factors for evaluating professionalism category
score. Other studies have limited this to one to four factors only (Aggarwal et al., 2014b;
Oh et al., 2012). These include 1) domain type, 2) Alexa median load time percentage, 3)
Google speed score, 4) Mozscape domain authority, 5) Mozscape page authority, 6) WoT
trustworthiness users’ rating, 7) WoT child safety users’ ratings, and 8) WoT experts
score (Aggarwal et al., 2014b; Alexa API, 2017; Mozscape API, 2017; SEOstats, 2017;
Web of Trust API, 2017). Table 3.9 lists these credibility factors, and conditions used for
scoring them.
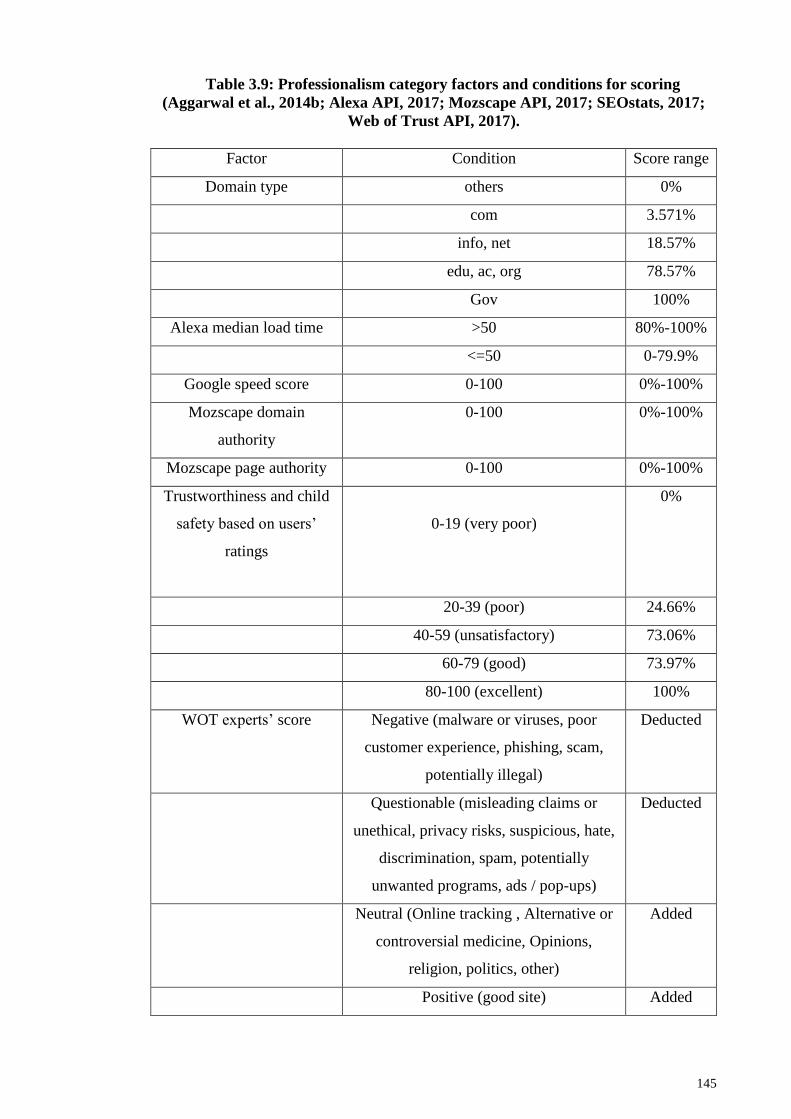
145
Table 3.9: Professionalism category factors and conditions for scoring
(Aggarwal et al., 2014b; Alexa API, 2017; Mozscape API, 2017; SEOstats, 2017;
Web of Trust API, 2017).
Factor Condition Score range
Domain type others 0%
com 3.571%
info, net 18.57%
edu, ac, org 78.57%
Gov 100%
Alexa median load time >50 80%-100%
<=50 0-79.9%
Google speed score 0-100 0%-100%
Mozscape domain
authority
0-100 0%-100%
Mozscape page authority 0-100 0%-100%
Trustworthiness and child
safety based on users’
ratings
0-19 (very poor)
0%
20-39 (poor) 24.66%
40-59 (unsatisfactory) 73.06%
60-79 (good) 73.97%
80-100 (excellent) 100%
WOT experts’ score Negative (malware or viruses, poor
customer experience, phishing, scam,
potentially illegal)
Deducted
Questionable (misleading claims or
unethical, privacy risks, suspicious, hate,
discrimination, spam, potentially
unwanted programs, ads / pop-ups)
Deducted
Neutral (Online tracking , Alternative or
controversial medicine, Opinions,
religion, politics, other)
Added
Positive (good site) Added
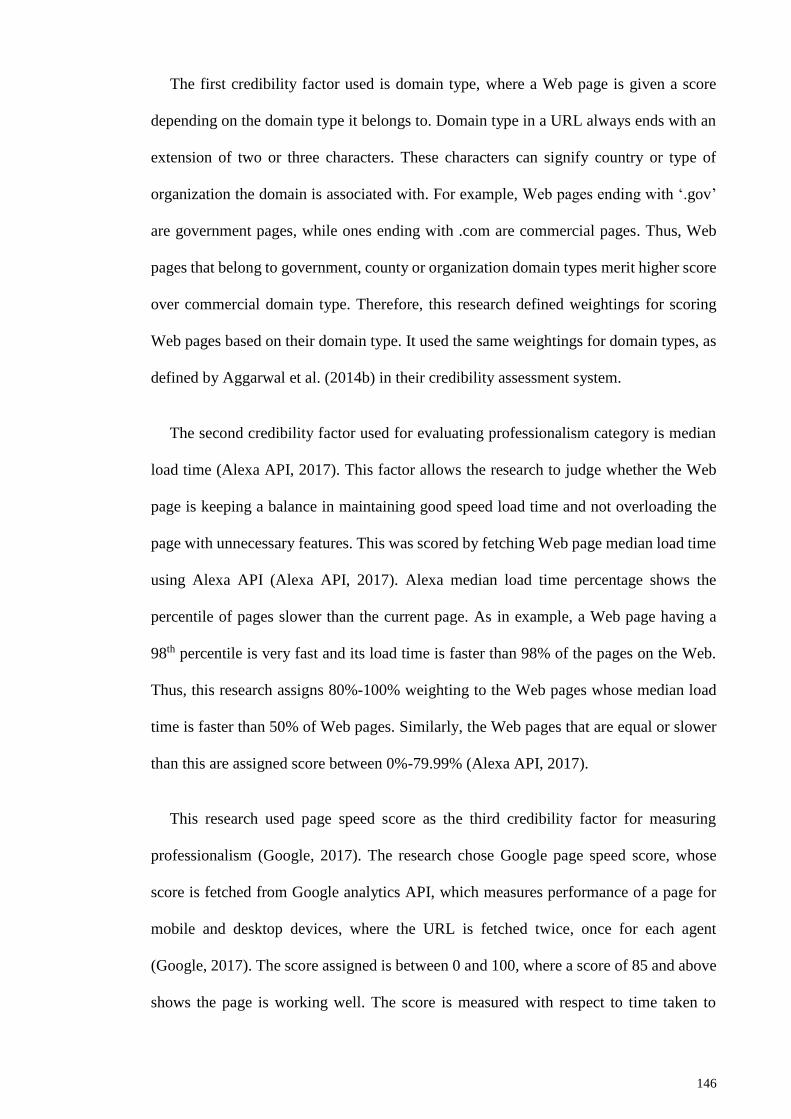
146
The first credibility factor used is domain type, where a Web page is given a score
depending on the domain type it belongs to. Domain type in a URL always ends with an
extension of two or three characters. These characters can signify country or type of
organization the domain is associated with. For example, Web pages ending with ‘.gov’
are government pages, while ones ending with .com are commercial pages. Thus, Web
pages that belong to government, county or organization domain types merit higher score
over commercial domain type. Therefore, this research defined weightings for scoring
Web pages based on their domain type. It used the same weightings for domain types, as
defined by Aggarwal et al. (2014b) in their credibility assessment system.
The second credibility factor used for evaluating professionalism category is median
load time (Alexa API, 2017). This factor allows the research to judge whether the Web
page is keeping a balance in maintaining good speed load time and not overloading the
page with unnecessary features. This was scored by fetching Web page median load time
using Alexa API (Alexa API, 2017). Alexa median load time percentage shows the
percentile of pages slower than the current page. As in example, a Web page having a
98th percentile is very fast and its load time is faster than 98% of the pages on the Web.
Thus, this research assigns 80%-100% weighting to the Web pages whose median load
time is faster than 50% of Web pages. Similarly, the Web pages that are equal or slower
than this are assigned score between 0%-79.99% (Alexa API, 2017).
This research used page speed score as the third credibility factor for measuring
professionalism (Google, 2017). The research chose Google page speed score, whose
score is fetched from Google analytics API, which measures performance of a page for
mobile and desktop devices, where the URL is fetched twice, once for each agent
(Google, 2017). The score assigned is between 0 and 100, where a score of 85 and above
shows the page is working well. The score is measured with respect to time taken to
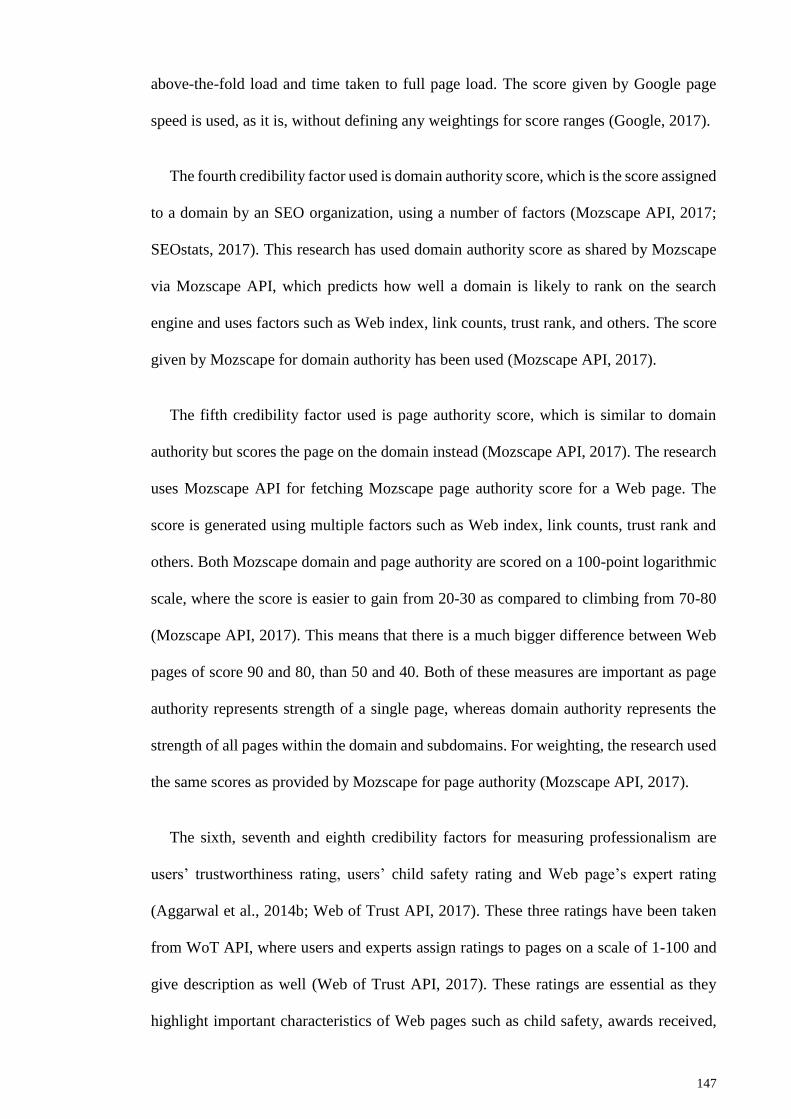
147
above-the-fold load and time taken to full page load. The score given by Google page
speed is used, as it is, without defining any weightings for score ranges (Google, 2017).
The fourth credibility factor used is domain authority score, which is the score assigned
to a domain by an SEO organization, using a number of factors (Mozscape API, 2017;
SEOstats, 2017). This research has used domain authority score as shared by Mozscape
via Mozscape API, which predicts how well a domain is likely to rank on the search
engine and uses factors such as Web index, link counts, trust rank, and others. The score
given by Mozscape for domain authority has been used (Mozscape API, 2017).
The fifth credibility factor used is page authority score, which is similar to domain
authority but scores the page on the domain instead (Mozscape API, 2017). The research
uses Mozscape API for fetching Mozscape page authority score for a Web page. The
score is generated using multiple factors such as Web index, link counts, trust rank and
others. Both Mozscape domain and page authority are scored on a 100-point logarithmic
scale, where the score is easier to gain from 20-30 as compared to climbing from 70-80
(Mozscape API, 2017). This means that there is a much bigger difference between Web
pages of score 90 and 80, than 50 and 40. Both of these measures are important as page
authority represents strength of a single page, whereas domain authority represents the
strength of all pages within the domain and subdomains. For weighting, the research used
the same scores as provided by Mozscape for page authority (Mozscape API, 2017).
The sixth, seventh and eighth credibility factors for measuring professionalism are
users’ trustworthiness rating, users’ child safety rating and Web page’s expert rating
(Aggarwal et al., 2014b; Web of Trust API, 2017). These three ratings have been taken
from WoT API, where users and experts assign ratings to pages on a scale of 1-100 and
give description as well (Web of Trust API, 2017). These ratings are essential as they
highlight important characteristics of Web pages such as child safety, awards received,
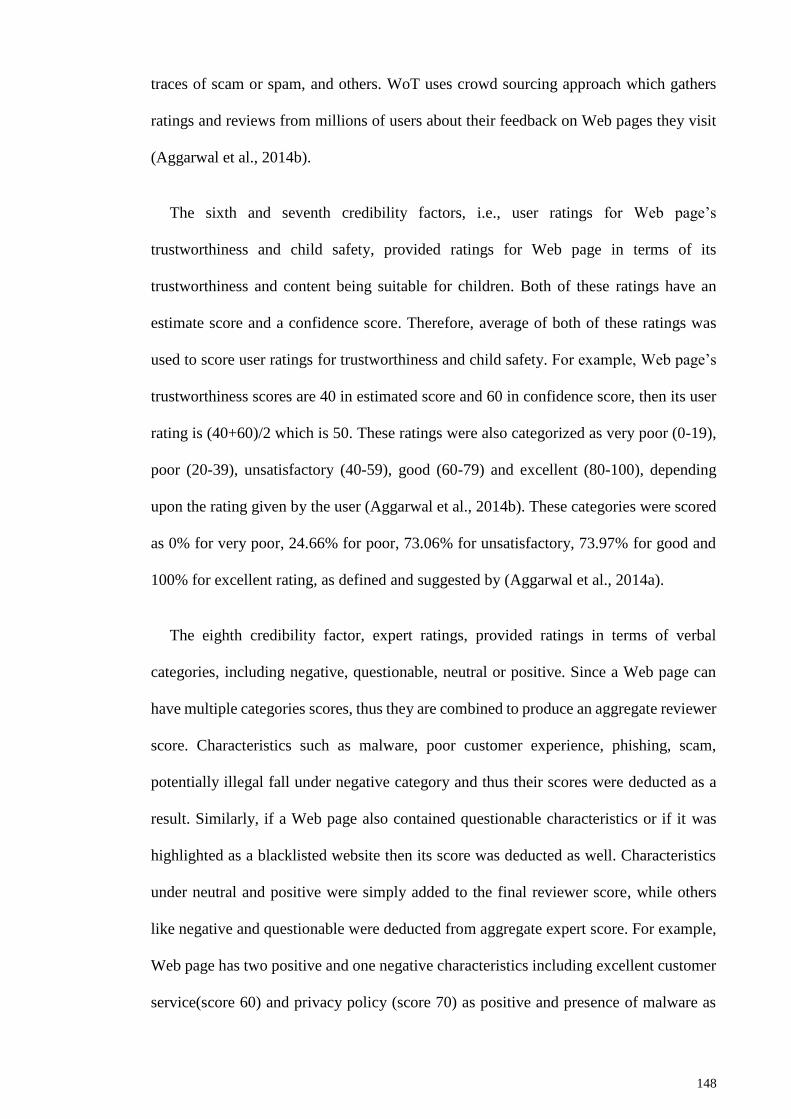
148
traces of scam or spam, and others. WoT uses crowd sourcing approach which gathers
ratings and reviews from millions of users about their feedback on Web pages they visit
(Aggarwal et al., 2014b).
The sixth and seventh credibility factors, i.e., user ratings for Web page’s
trustworthiness and child safety, provided ratings for Web page in terms of its
trustworthiness and content being suitable for children. Both of these ratings have an
estimate score and a confidence score. Therefore, average of both of these ratings was
used to score user ratings for trustworthiness and child safety. For example, Web page’s
trustworthiness scores are 40 in estimated score and 60 in confidence score, then its user
rating is (40+60)/2 which is 50. These ratings were also categorized as very poor (0-19),
poor (20-39), unsatisfactory (40-59), good (60-79) and excellent (80-100), depending
upon the rating given by the user (Aggarwal et al., 2014b). These categories were scored
as 0% for very poor, 24.66% for poor, 73.06% for unsatisfactory, 73.97% for good and
100% for excellent rating, as defined and suggested by (Aggarwal et al., 2014a).
The eighth credibility factor, expert ratings, provided ratings in terms of verbal
categories, including negative, questionable, neutral or positive. Since a Web page can
have multiple categories scores, thus they are combined to produce an aggregate reviewer
score. Characteristics such as malware, poor customer experience, phishing, scam,
potentially illegal fall under negative category and thus their scores were deducted as a
result. Similarly, if a Web page also contained questionable characteristics or if it was
highlighted as a blacklisted website then its score was deducted as well. Characteristics
under neutral and positive were simply added to the final reviewer score, while others
like negative and questionable were deducted from aggregate expert score. For example,
Web page has two positive and one negative characteristics including excellent customer
service(score 60) and privacy policy (score 70) as positive and presence of malware as
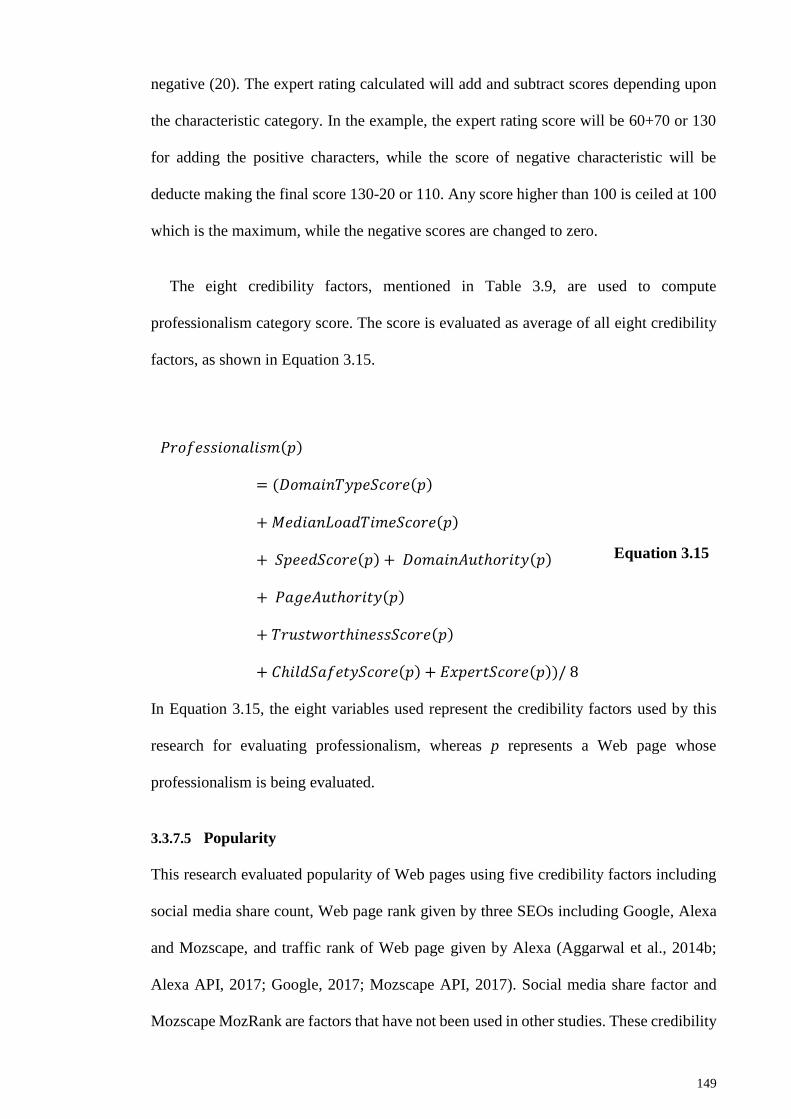
149
negative (20). The expert rating calculated will add and subtract scores depending upon
the characteristic category. In the example, the expert rating score will be 60+70 or 130
for adding the positive characters, while the score of negative characteristic will be
deducte making the final score 130-20 or 110. Any score higher than 100 is ceiled at 100
which is the maximum, while the negative scores are changed to zero.
The eight credibility factors, mentioned in Table 3.9, are used to compute
professionalism category score. The score is evaluated as average of all eight credibility
factors, as shown in Equation 3.15.
𝑃𝑟𝑜𝑓𝑒𝑠𝑠𝑖𝑜𝑛𝑎𝑙𝑖𝑠𝑚(𝑝)
= (𝐷𝑜𝑚𝑎𝑖𝑛𝑇𝑦𝑝𝑒𝑆𝑐𝑜𝑟𝑒(𝑝)
+ 𝑀𝑒𝑑𝑖𝑎𝑛𝐿𝑜𝑎𝑑𝑇𝑖𝑚𝑒𝑆𝑐𝑜𝑟𝑒(𝑝)
+ 𝑆𝑝𝑒𝑒𝑑𝑆𝑐𝑜𝑟𝑒(𝑝) + 𝐷𝑜𝑚𝑎𝑖𝑛𝐴𝑢𝑡ℎ𝑜𝑟𝑖𝑡𝑦(𝑝)
+ 𝑃𝑎𝑔𝑒𝐴𝑢𝑡ℎ𝑜𝑟𝑖𝑡𝑦(𝑝)
+ 𝑇𝑟𝑢𝑠𝑡𝑤𝑜𝑟𝑡ℎ𝑖𝑛𝑒𝑠𝑠𝑆𝑐𝑜𝑟𝑒(𝑝)
+ 𝐶ℎ𝑖𝑙𝑑𝑆𝑎𝑓𝑒𝑡𝑦𝑆𝑐𝑜𝑟𝑒(𝑝) + 𝐸𝑥𝑝𝑒𝑟𝑡𝑆𝑐𝑜𝑟𝑒(𝑝))/ 8
Equation 3.15
In Equation 3.15, the eight variables used represent the credibility factors used by this
research for evaluating professionalism, whereas p represents a Web page whose
professionalism is being evaluated.
3.3.7.5 Popularity
This research evaluated popularity of Web pages using five credibility factors including
social media share count, Web page rank given by three SEOs including Google, Alexa
and Mozscape, and traffic rank of Web page given by Alexa (Aggarwal et al., 2014b;
Alexa API, 2017; Google, 2017; Mozscape API, 2017). Social media share factor and
Mozscape MozRank are factors that have not been used in other studies. These credibility

150
factors and conditions for scoring them are covered in Table 3.10: Popularity category
factors and conditions for scoring.
Table 3.10: Popularity category factors and conditions for scoring (Aggarwal et
al., 2014b; Alexa API, 2017; Google, 2017; Mozscape API, 2017)
Factor Condition Score range
Social media shares >=10,000 100%
>=5,000 and <10,000 80%-99.99%
>0 and <5,000 0.1%-79.99%
= 0 0%
Google rank 0-10 (higher is better) 0%-100%
Alexa global and traffic rank 1-100 100%
101-1,000 54.66%-99.9%
1001-10,000 46.58%-54.65%
10,001-50,000 0.1%-46.57%
>50,000 0%
Mozscape MozRank 0-10 0%-100%
This research used social media share count as the first credibility factor for measuring
popularity (SEOstats, 2017). Social media is one of the growing trends on the Web and
people use the service to share all kinds of information, thus tracking statistics relating to
it can allow judge popularity of a Web page (Chatterjee & Agarwal, 2016). This research
used SEOstats1, which is an open source PHP library to get SEO-relevant Website
metrics, including article share count on social media Web pages such as Facebook,
Twitter, GooglePlus, VKontakte, Pinterest, Linkedin, Xing, Delicious, Digg and
Stumpleupon (SEOstats, 2017). Depending upon the social media share count of a Web
page, they were scored depending upon the bracket range for share count. The research
defined a score of 100% for Web pages having equal or more than 10,000 share count,
1 https://github.com/eyecatchup/SEOstats
151
score of 80%-99.99% for share count between 5,000 to 10,000, and score of 0% to
79.99% for share count between 0 and 5,000, allowing Web having a higher share count
to score higher (SEOstats, 2017).
The second credibility factor used is Google page rank (Google, 2017). Google page
rank, retrieved via Google analytics API, is the score assigned by Google to a Web page
between 0 and 10 on an exponential scale. Web pages such as usa.gov and twitter.com
are page rank 10 domains which have the highest volume inbound links of any Web pages
on the Web (Google, 2017). Similarly, pages with page rank 5 have decent inbound links,
with 3 and 4 having a fair amount while new Web sites are given a 0 score. The score
assigned by Google page rank was scaled to 0% to 100% for evaluating popularity
category.
The third and fourth credibility factors for evaluating popularity category include
global rank and traffic rank given by Alexa, retrieved using Alexa API (Alexa API, 2017).
Alexa global ranks shows three month average traffic rank where traffic rank shows
current rank earned by a Web page. This is determined by a combination of unique
visitors and page views for a given page. The credibility factors are scored depending
upon the bracket range in which global and traffic rank of a Web page lies. This research
used the suggested ranges given by Alexa for defining them. As shown in Table 3.10,
Web pages ranking between 1 and 100 are assigned 100% score, and Web pages ranking
in other brackets are scored accordingly (Alexa API, 2017).
The fifth credibility factor used is the popularity rank assigned to Web pages by
Mozscape (Mozscape API, 2017). Retrieved via Mozscape API, the score represents
link’s popularity on the Web. Mozscape ranks Web pages between 0-10, where 0 is
assigned to newly published Web pages and 10 for Web pages having high link
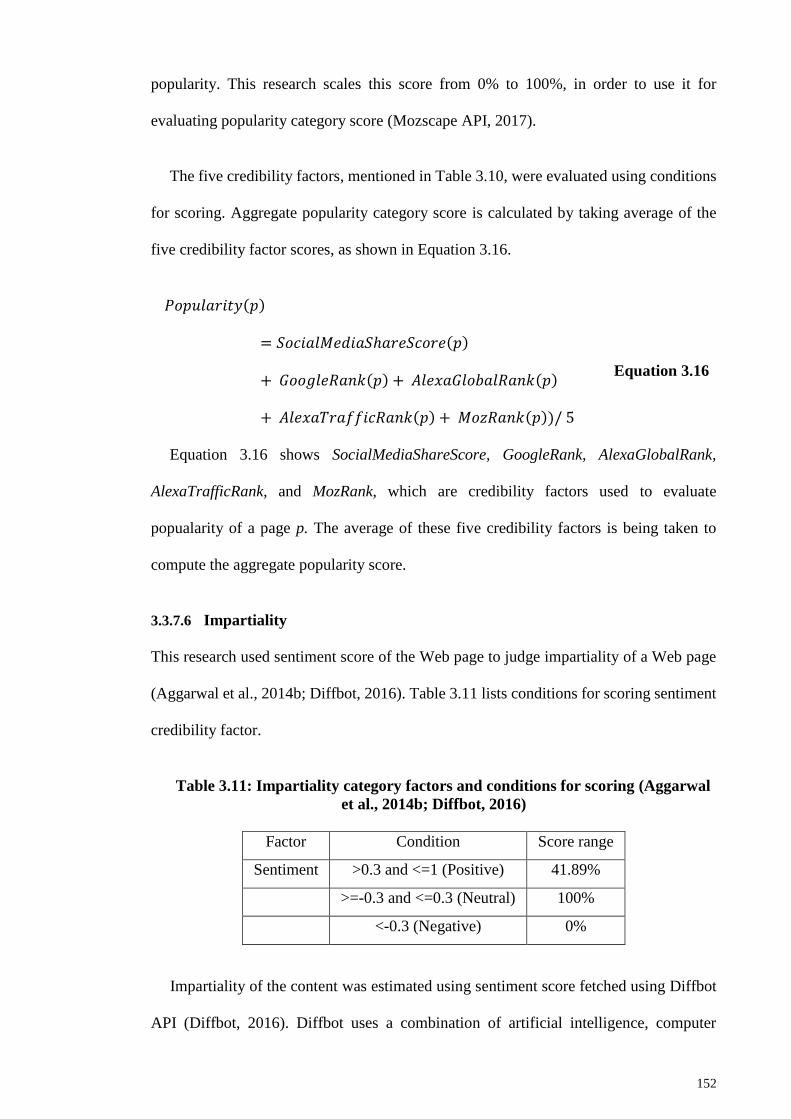
152
popularity. This research scales this score from 0% to 100%, in order to use it for
evaluating popularity category score (Mozscape API, 2017).
The five credibility factors, mentioned in Table 3.10, were evaluated using conditions
for scoring. Aggregate popularity category score is calculated by taking average of the
five credibility factor scores, as shown in Equation 3.16.
𝑃𝑜𝑝𝑢𝑙𝑎𝑟𝑖𝑡𝑦(𝑝)
= 𝑆𝑜𝑐𝑖𝑎𝑙𝑀𝑒𝑑𝑖𝑎𝑆ℎ𝑎𝑟𝑒𝑆𝑐𝑜𝑟𝑒(𝑝)
+ 𝐺𝑜𝑜𝑔𝑙𝑒𝑅𝑎𝑛𝑘(𝑝) + 𝐴𝑙𝑒𝑥𝑎𝐺𝑙𝑜𝑏𝑎𝑙𝑅𝑎𝑛𝑘(𝑝)
+ 𝐴𝑙𝑒𝑥𝑎𝑇𝑟𝑎𝑓𝑓𝑖𝑐𝑅𝑎𝑛𝑘(𝑝) + 𝑀𝑜𝑧𝑅𝑎𝑛𝑘(𝑝))/ 5
Equation 3.16
Equation 3.16 shows SocialMediaShareScore, GoogleRank, AlexaGlobalRank,
AlexaTrafficRank, and MozRank, which are credibility factors used to evaluate
popualarity of a page p. The average of these five credibility factors is being taken to
compute the aggregate popularity score.
3.3.7.6 Impartiality
This research used sentiment score of the Web page to judge impartiality of a Web page
(Aggarwal et al., 2014b; Diffbot, 2016). Table 3.11 lists conditions for scoring sentiment
credibility factor.
Table 3.11: Impartiality category factors and conditions for scoring (Aggarwal
et al., 2014b; Diffbot, 2016)
Factor Condition Score range
Sentiment >0.3 and <=1 (Positive) 41.89%
>=-0.3 and <=0.3 (Neutral) 100%
<-0.3 (Negative) 0%
Impartiality of the content was estimated using sentiment score fetched using Diffbot
API (Diffbot, 2016). Diffbot uses a combination of artificial intelligence, computer
153
vision, machine learning and NLP techniques for conducting sentiment analysis of the
article. It looks for words that carry a negative and positive connotation from the words
present in the article, such as ‘not’ for negative and ‘good’ for positive, and estimates the
overall sentiment score of the content. The API returns a sentiment score where the value
ranges from -1 (very negative) to +1 (very positive) (Diffbot, 2016). For scoring,
precedence was given to articles being positive over articles have a negative sentiment
value. Since the values are in numerical form, a range was defined for each category
where content was rated as neutral if sentiment score was between -0.3 and 0.3, positive
if between >0.3 and 1, and negative if between <0.3 and -1. The range for being neutral
was not set to zero as it is difficult to achieve a near perfect zero score (Tanaka et al.,
2010b). For example, two reviews are received one have a sentiment score of 0.2 and the
other having a score of -0.5. It is clear that the first review is neutral so it will be scored
as 1 and the other is negative so it will be scored as 0. Thus the first review is given a
higher score so answers extracted from that are given more weighting
The sentiment value was also used for calculating the accumulative impartiality of the
article, as shown in Equation 3.17.
𝐼𝑚𝑝𝑎𝑟𝑡𝑖𝑎𝑙𝑖𝑡𝑦(𝑝) = 𝑆𝑒𝑛𝑡𝑖𝑚𝑒𝑛𝑡(𝑝) Equation 3.17
In the equation, Sentiment score indicates whether a score is negative, neutral or positive
and is scored accordingly. The Sentiment score calculated for a Web page is indicated as
p.
3.3.7.7 Quality
This research used two credibility factors evaluating content’s quality--its readability and
plagiarism (or originality) score (Microsoft Word, 2016; Wu & Marian, 2011). The
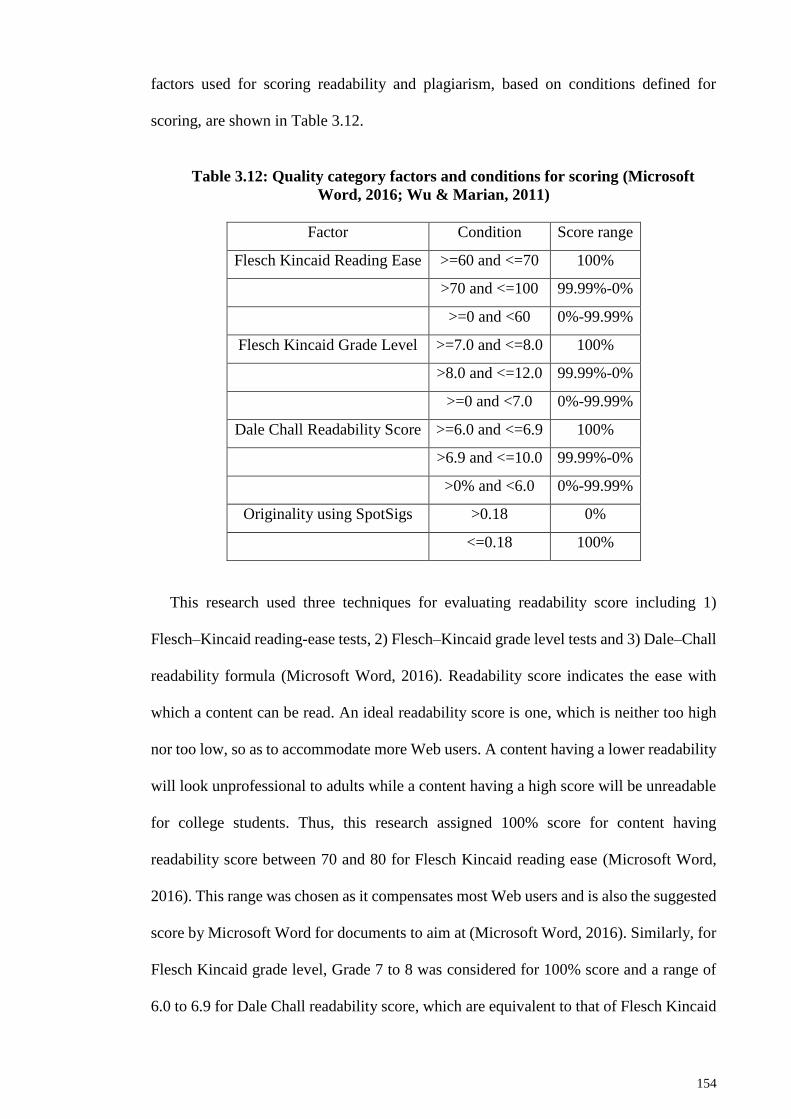
154
factors used for scoring readability and plagiarism, based on conditions defined for
scoring, are shown in Table 3.12.
Table 3.12: Quality category factors and conditions for scoring (Microsoft
Word, 2016; Wu & Marian, 2011)
Factor Condition Score range
Flesch Kincaid Reading Ease >=60 and <=70 100%
>70 and <=100 99.99%-0%
>=0 and <60 0%-99.99%
Flesch Kincaid Grade Level >=7.0 and <=8.0 100%
>8.0 and <=12.0 99.99%-0%
>=0 and <7.0 0%-99.99%
Dale Chall Readability Score >=6.0 and <=6.9 100%
>6.9 and <=10.0 99.99%-0%
>0% and <6.0 0%-99.99%
Originality using SpotSigs >0.18 0%
<=0.18 100%
This research used three techniques for evaluating readability score including 1)
Flesch–Kincaid reading-ease tests, 2) Flesch–Kincaid grade level tests and 3) Dale–Chall
readability formula (Microsoft Word, 2016). Readability score indicates the ease with
which a content can be read. An ideal readability score is one, which is neither too high
nor too low, so as to accommodate more Web users. A content having a lower readability
will look unprofessional to adults while a content having a high score will be unreadable
for college students. Thus, this research assigned 100% score for content having
readability score between 70 and 80 for Flesch Kincaid reading ease (Microsoft Word,
2016). This range was chosen as it compensates most Web users and is also the suggested
score by Microsoft Word for documents to aim at (Microsoft Word, 2016). Similarly, for
Flesch Kincaid grade level, Grade 7 to 8 was considered for 100% score and a range of
6.0 to 6.9 for Dale Chall readability score, which are equivalent to that of Flesch Kincaid

155
reading ease 60 to 70 readability score range (Microsoft Word, 2016). The average of
these three readability scores was used as the aggregate readability score of Web page, as
shown in Equation 3.18.
𝑅𝑒𝑎𝑑𝑎𝑏𝑖𝑙𝑖𝑡𝑦(𝑝)
=
(𝐹𝑙𝑒𝑠𝑐ℎ𝐾𝑖𝑛𝑐𝑎𝑖𝑑𝑅𝑒𝑎𝑑𝑖𝑛𝑔𝐸𝑎𝑠𝑒 + 𝐹𝑙𝑒𝑠𝑐ℎ𝐾𝑖𝑛𝑐𝑎𝑖𝑑𝐺𝑟𝑎𝑑𝑒𝐿𝑒𝑣𝑒𝑙 +𝐷𝑎𝑙𝑒𝐶ℎ𝑎𝑙𝑙𝑅𝑒𝑎𝑑𝑎𝑏𝑖𝑙𝑖𝑡𝑦𝑆𝑐𝑜𝑟𝑒)
3
Equation 3.18
The second credibility factor used for evaluating quality of content is plagiarism ratio
or originality of the content. This factor helped in checking whether the content is primary
or secondary source of information. The research used SpotSigs technique for comparing
originality of two documents. It was used to counter check originality of search result
with other search results. The threshold value was set to .18, which is the threshold used
by Australian OA journal for accepting journal submissions (Australian OA Journal,
2017). If the condition is satisfied, the search result, higher up in search results, was
considered original whereas the latter was considered plagiarized. For example, if doc 5
and doc 8 are found to be similar then doc 5 is considered original and doc 8 is considered
plagiarized.
The aggregate quality of a Web page is calculated by taking average of readability
score (shown in Equation 3.18), and originality score, as shown in Equation 3.19.
𝑄𝑢𝑎𝑙𝑖𝑡𝑦(𝑝) =(𝑅𝑒𝑎𝑑𝑎𝑏𝑖𝑙𝑖𝑡𝑦(𝑝) + 𝑂𝑟𝑖𝑔𝑖𝑛𝑎𝑙𝑖𝑡𝑦(𝑝))
2⁄ Equation 3.19
The equation shows Readability credibility factor, evaluating content readability and
Originality evaluating plagiarism ratio of a page p.
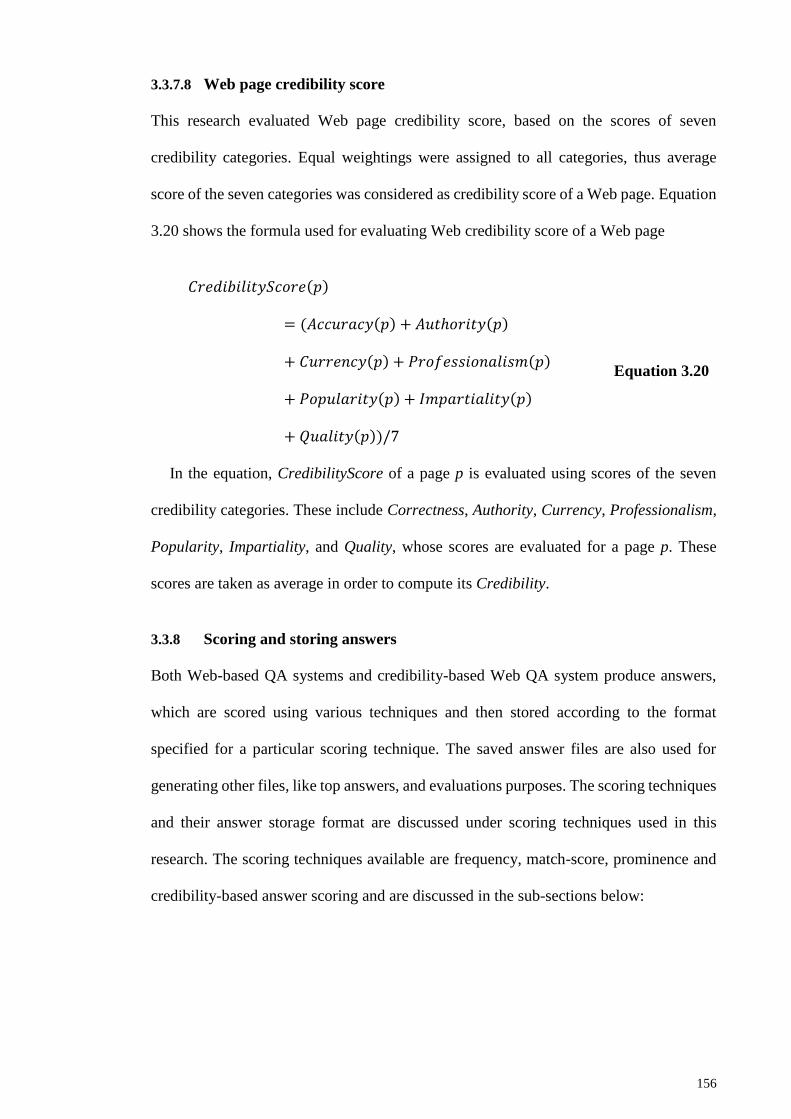
156
3.3.7.8 Web page credibility score
This research evaluated Web page credibility score, based on the scores of seven
credibility categories. Equal weightings were assigned to all categories, thus average
score of the seven categories was considered as credibility score of a Web page. Equation
3.20 shows the formula used for evaluating Web credibility score of a Web page
𝐶𝑟𝑒𝑑𝑖𝑏𝑖𝑙𝑖𝑡𝑦𝑆𝑐𝑜𝑟𝑒(𝑝)
= (𝐴𝑐𝑐𝑢𝑟𝑎𝑐𝑦(𝑝) + 𝐴𝑢𝑡ℎ𝑜𝑟𝑖𝑡𝑦(𝑝)
+ 𝐶𝑢𝑟𝑟𝑒𝑛𝑐𝑦(𝑝) + 𝑃𝑟𝑜𝑓𝑒𝑠𝑠𝑖𝑜𝑛𝑎𝑙𝑖𝑠𝑚(𝑝)
+ 𝑃𝑜𝑝𝑢𝑙𝑎𝑟𝑖𝑡𝑦(𝑝) + 𝐼𝑚𝑝𝑎𝑟𝑡𝑖𝑎𝑙𝑖𝑡𝑦(𝑝)
+ 𝑄𝑢𝑎𝑙𝑖𝑡𝑦(𝑝))/7
Equation 3.20
In the equation, CredibilityScore of a page p is evaluated using scores of the seven
credibility categories. These include Correctness, Authority, Currency, Professionalism,
Popularity, Impartiality, and Quality, whose scores are evaluated for a page p. These
scores are taken as average in order to compute its Credibility.
3.3.8 Scoring and storing answers
Both Web-based QA systems and credibility-based Web QA system produce answers,
which are scored using various techniques and then stored according to the format
specified for a particular scoring technique. The saved answer files are also used for
generating other files, like top answers, and evaluations purposes. The scoring techniques
and their answer storage format are discussed under scoring techniques used in this
research. The scoring techniques available are frequency, match-score, prominence and
credibility-based answer scoring and are discussed in the sub-sections below:
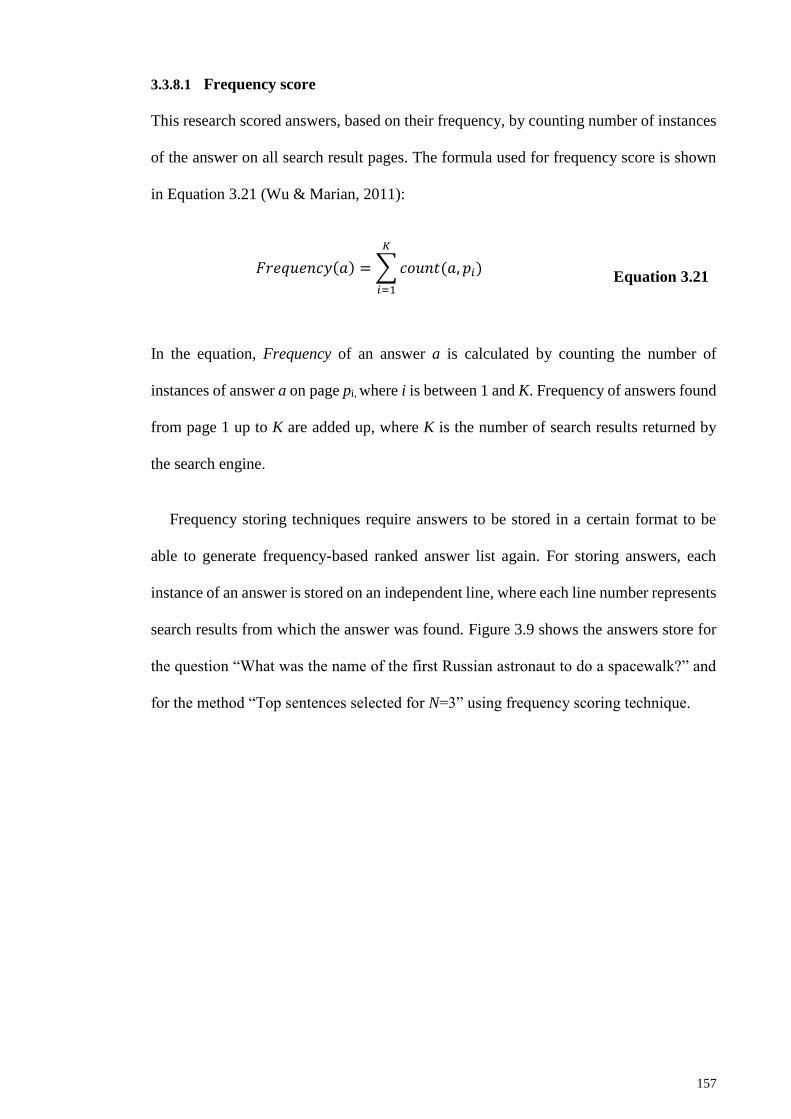
157
3.3.8.1 Frequency score
This research scored answers, based on their frequency, by counting number of instances
of the answer on all search result pages. The formula used for frequency score is shown
in Equation 3.21 (Wu & Marian, 2011):
𝐹𝑟𝑒𝑞𝑢𝑒𝑛𝑐𝑦(𝑎) = ∑ 𝑐𝑜𝑢𝑛𝑡(𝑎, 𝑝𝑖)
𝐾
𝑖=1
Equation 3.21
In the equation, Frequency of an answer a is calculated by counting the number of
instances of answer a on page pi, where i is between 1 and K. Frequency of answers found
from page 1 up to K are added up, where K is the number of search results returned by
the search engine.
Frequency storing techniques require answers to be stored in a certain format to be
able to generate frequency-based ranked answer list again. For storing answers, each
instance of an answer is stored on an independent line, where each line number represents
search results from which the answer was found. Figure 3.9 shows the answers store for
the question “What was the name of the first Russian astronaut to do a spacewalk?” and
for the method “Top sentences selected for N=3” using frequency scoring technique.
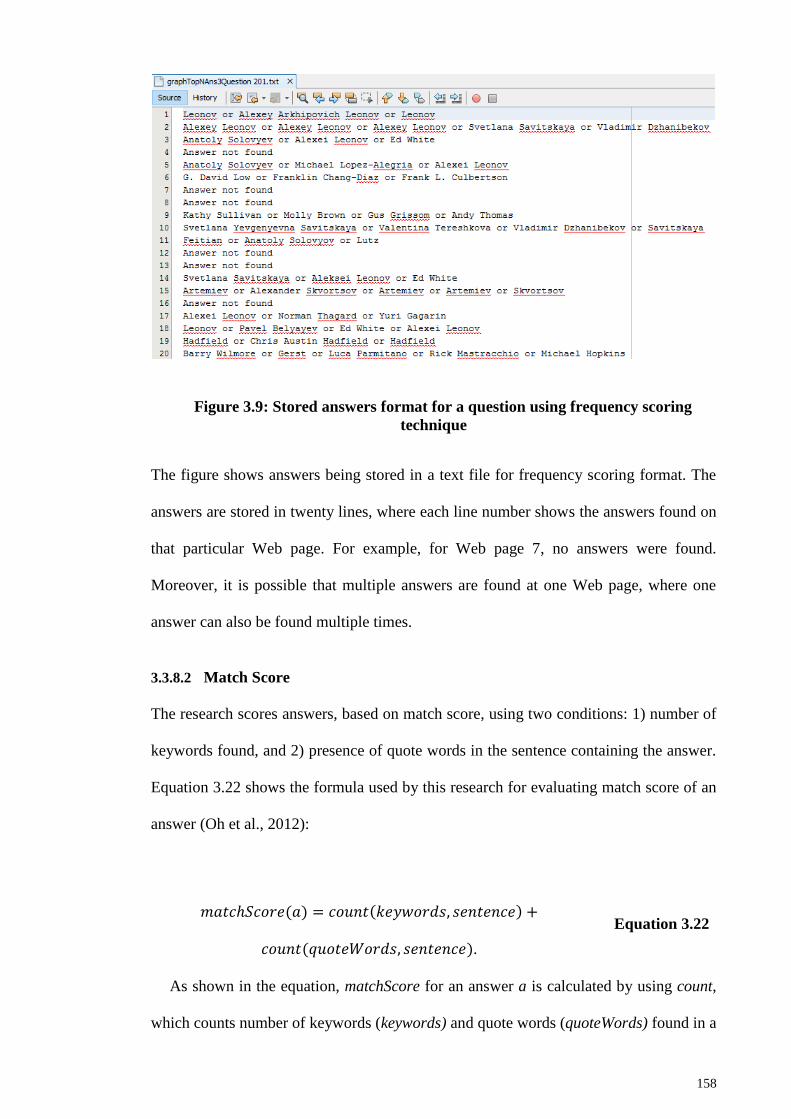
158
Figure 3.9: Stored answers format for a question using frequency scoring
technique
The figure shows answers being stored in a text file for frequency scoring format. The
answers are stored in twenty lines, where each line number shows the answers found on
that particular Web page. For example, for Web page 7, no answers were found.
Moreover, it is possible that multiple answers are found at one Web page, where one
answer can also be found multiple times.
3.3.8.2 Match Score
The research scores answers, based on match score, using two conditions: 1) number of
keywords found, and 2) presence of quote words in the sentence containing the answer.
Equation 3.22 shows the formula used by this research for evaluating match score of an
answer (Oh et al., 2012):
𝑚𝑎𝑡𝑐ℎ𝑆𝑐𝑜𝑟𝑒(𝑎) = 𝑐𝑜𝑢𝑛𝑡(𝑘𝑒𝑦𝑤𝑜𝑟𝑑𝑠, 𝑠𝑒𝑛𝑡𝑒𝑛𝑐𝑒) +
𝑐𝑜𝑢𝑛𝑡(𝑞𝑢𝑜𝑡𝑒𝑊𝑜𝑟𝑑𝑠, 𝑠𝑒𝑛𝑡𝑒𝑛𝑐𝑒).
Equation 3.22
As shown in the equation, matchScore for an answer a is calculated by using count,
which counts number of keywords (keywords) and quote words (quoteWords) found in a
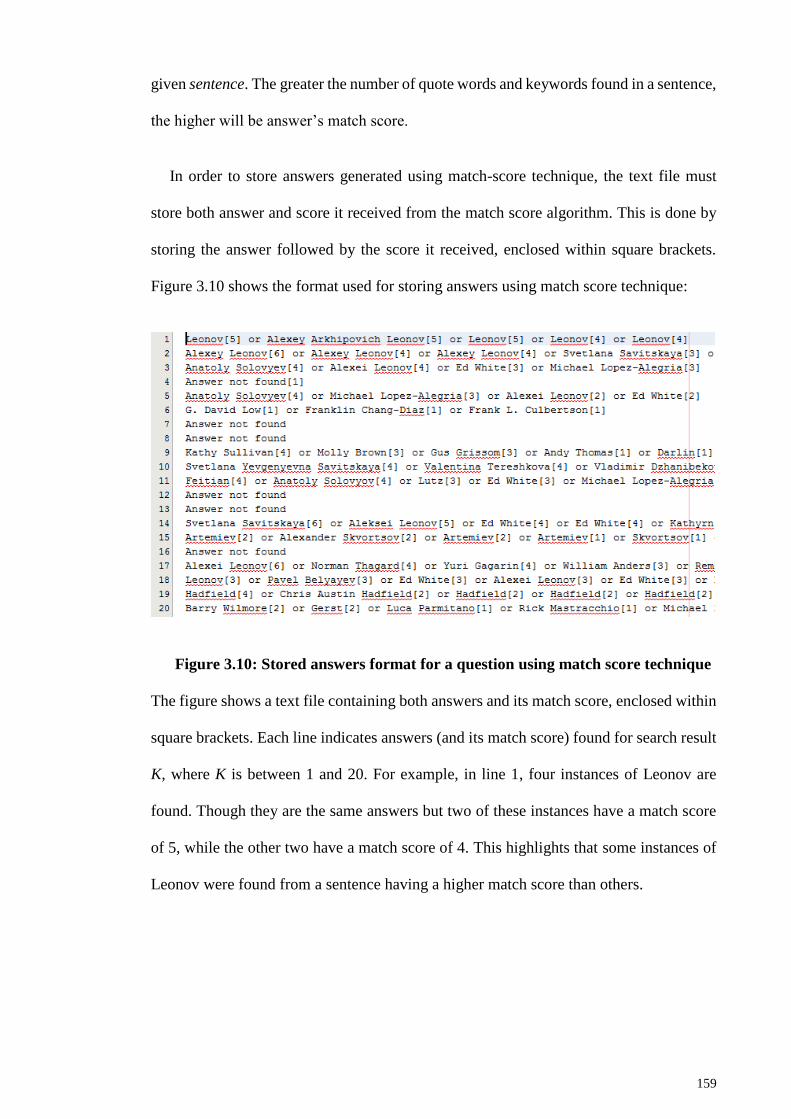
159
given sentence. The greater the number of quote words and keywords found in a sentence,
the higher will be answer’s match score.
In order to store answers generated using match-score technique, the text file must
store both answer and score it received from the match score algorithm. This is done by
storing the answer followed by the score it received, enclosed within square brackets.
Figure 3.10 shows the format used for storing answers using match score technique:
Figure 3.10: Stored answers format for a question using match score technique
The figure shows a text file containing both answers and its match score, enclosed within
square brackets. Each line indicates answers (and its match score) found for search result
K, where K is between 1 and 20. For example, in line 1, four instances of Leonov are
found. Though they are the same answers but two of these instances have a match score
of 5, while the other two have a match score of 4. This highlights that some instances of
Leonov were found from a sentence having a higher match score than others.
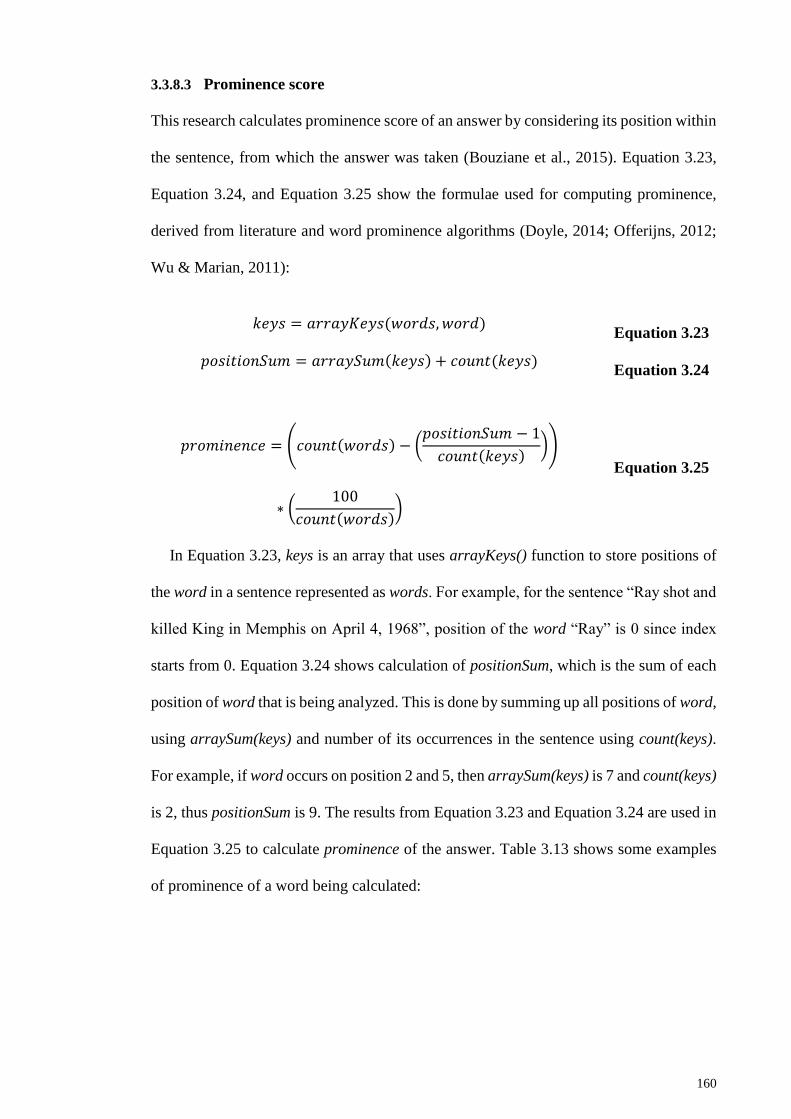
160
3.3.8.3 Prominence score
This research calculates prominence score of an answer by considering its position within
the sentence, from which the answer was taken (Bouziane et al., 2015). Equation 3.23,
Equation 3.24, and Equation 3.25 show the formulae used for computing prominence,
derived from literature and word prominence algorithms (Doyle, 2014; Offerijns, 2012;
Wu & Marian, 2011):
𝑘𝑒𝑦𝑠 = 𝑎𝑟𝑟𝑎𝑦𝐾𝑒𝑦𝑠(𝑤𝑜𝑟𝑑𝑠, 𝑤𝑜𝑟𝑑) Equation 3.23
𝑝𝑜𝑠𝑖𝑡𝑖𝑜𝑛𝑆𝑢𝑚 = 𝑎𝑟𝑟𝑎𝑦𝑆𝑢𝑚(𝑘𝑒𝑦𝑠) + 𝑐𝑜𝑢𝑛𝑡(𝑘𝑒𝑦𝑠) Equation 3.24
𝑝𝑟𝑜𝑚𝑖𝑛𝑒𝑛𝑐𝑒 = (𝑐𝑜𝑢𝑛𝑡(𝑤𝑜𝑟𝑑𝑠) − (𝑝𝑜𝑠𝑖𝑡𝑖𝑜𝑛𝑆𝑢𝑚 − 1
𝑐𝑜𝑢𝑛𝑡(𝑘𝑒𝑦𝑠)))
∗ (100
𝑐𝑜𝑢𝑛𝑡(𝑤𝑜𝑟𝑑𝑠))
Equation 3.25
In Equation 3.23, keys is an array that uses arrayKeys() function to store positions of
the word in a sentence represented as words. For example, for the sentence “Ray shot and
killed King in Memphis on April 4, 1968”, position of the word “Ray” is 0 since index
starts from 0. Equation 3.24 shows calculation of positionSum, which is the sum of each
position of word that is being analyzed. This is done by summing up all positions of word,
using arraySum(keys) and number of its occurrences in the sentence using count(keys).
For example, if word occurs on position 2 and 5, then arraySum(keys) is 7 and count(keys)
is 2, thus positionSum is 9. The results from Equation 3.23 and Equation 3.24 are used in
Equation 3.25 to calculate prominence of the answer. Table 3.13 shows some examples
of prominence of a word being calculated:
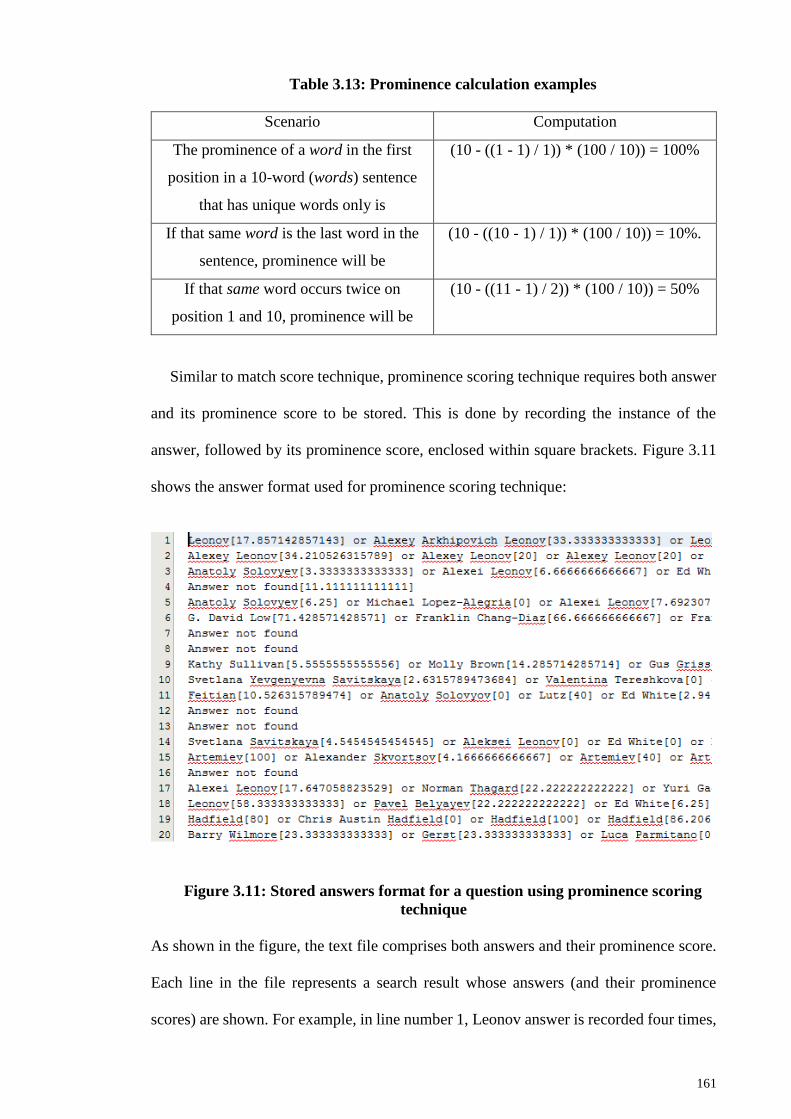
161
Table 3.13: Prominence calculation examples
Scenario Computation
The prominence of a word in the first
position in a 10-word (words) sentence
that has unique words only is
(10 - ((1 - 1) / 1)) * (100 / 10)) = 100%
If that same word is the last word in the
sentence, prominence will be
(10 - ((10 - 1) / 1)) * (100 / 10)) = 10%.
If that same word occurs twice on
position 1 and 10, prominence will be
(10 - ((11 - 1) / 2)) * (100 / 10)) = 50%
Similar to match score technique, prominence scoring technique requires both answer
and its prominence score to be stored. This is done by recording the instance of the
answer, followed by its prominence score, enclosed within square brackets. Figure 3.11
shows the answer format used for prominence scoring technique:
Figure 3.11: Stored answers format for a question using prominence scoring
technique
As shown in the figure, the text file comprises both answers and their prominence score.
Each line in the file represents a search result whose answers (and their prominence
scores) are shown. For example, in line number 1, Leonov answer is recorded four times,

162
but each of its instance has a different prominence score. This shows that each instance
of Leonov is taken from a different sentence, where each instance of Leonov has a
different score.
3.3.8.4 Credibility-based answer score
This research scored answers based on their credibility using two values including 1) Web
page credibility score, from which the answer is taken and 2) answer percentage
(evaluated using frequency of answer) (Wu & Marian, 2011). Existing credibility-based
QA systems like Corrob* also used combination for traditional and Web page credibility
score for producing credibility based answers(Wu & Marian, 2011). Moreover, the
weighting between answer percentage and Web page credibility is controlled using a
smoothing factor to control ratio between them.
Frequency of an answer a can be determined by evaluating its frequency score, shown
in Equation 3.21. However, this score is normalized between 0 and 1, in order to bring it
to the same range as that of credibility score. Equation 3.26 shows the formulae used for
calculating answer percentage for an answer on a page p, while Equation 3.27 shows the
formula used for calculating answer percentage on all pages K:
𝐴𝑛𝑠𝑤𝑒𝑟𝑃𝑒𝑟𝑐𝑒𝑛𝑡𝑎𝑔𝑒𝑂𝑛𝑃𝑎𝑔𝑒(𝑎, 𝑝) = 𝐹𝑟𝑒𝑞𝑢𝑒𝑛𝑐𝑦(𝑎, 𝑝)
∑ 𝐹𝑟𝑒𝑞𝑢𝑒𝑛𝑐𝑦(𝑎𝑖, 𝑝)𝑛𝑖=1
Equation 3.26
𝐴𝑛𝑠𝑤𝑒𝑟𝑃𝑒𝑟𝑐𝑒𝑛𝑡𝑎𝑔𝑒(𝑎)
= ∑ 𝐴𝑛𝑠𝑤𝑒𝑟𝑃𝑒𝑟𝑐𝑒𝑛𝑡𝑎𝑔𝑒𝑂𝑛𝑃𝑎𝑔𝑒(𝑎, 𝑝𝑗)
𝐾
𝑗=1
Equation 3.27
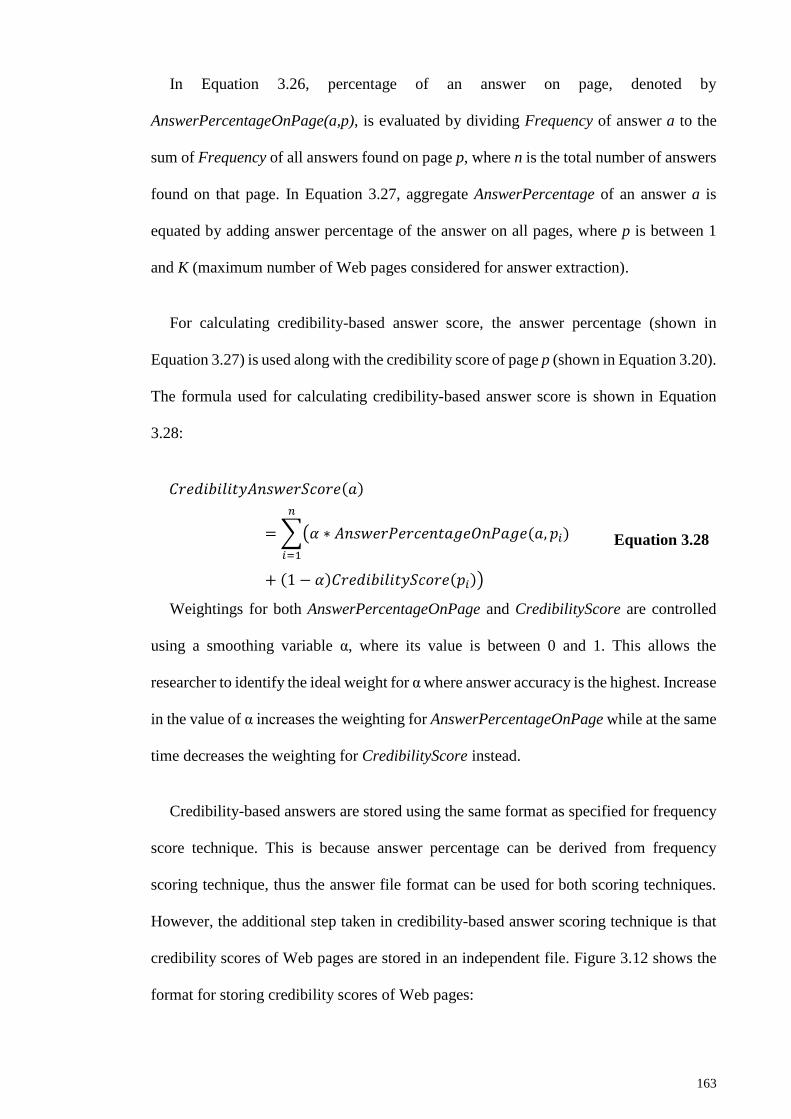
163
In Equation 3.26, percentage of an answer on page, denoted by
AnswerPercentageOnPage(a,p), is evaluated by dividing Frequency of answer a to the
sum of Frequency of all answers found on page p, where n is the total number of answers
found on that page. In Equation 3.27, aggregate AnswerPercentage of an answer a is
equated by adding answer percentage of the answer on all pages, where p is between 1
and K (maximum number of Web pages considered for answer extraction).
For calculating credibility-based answer score, the answer percentage (shown in
Equation 3.27) is used along with the credibility score of page p (shown in Equation 3.20).
The formula used for calculating credibility-based answer score is shown in Equation
3.28:
𝐶𝑟𝑒𝑑𝑖𝑏𝑖𝑙𝑖𝑡𝑦𝐴𝑛𝑠𝑤𝑒𝑟𝑆𝑐𝑜𝑟𝑒(𝑎)
= ∑(𝛼 ∗ 𝐴𝑛𝑠𝑤𝑒𝑟𝑃𝑒𝑟𝑐𝑒𝑛𝑡𝑎𝑔𝑒𝑂𝑛𝑃𝑎𝑔𝑒(𝑎, 𝑝𝑖)
𝑛
𝑖=1
+ (1 − 𝛼)𝐶𝑟𝑒𝑑𝑖𝑏𝑖𝑙𝑖𝑡𝑦𝑆𝑐𝑜𝑟𝑒(𝑝𝑖))
Equation 3.28
Weightings for both AnswerPercentageOnPage and CredibilityScore are controlled
using a smoothing variable α, where its value is between 0 and 1. This allows the
researcher to identify the ideal weight for α where answer accuracy is the highest. Increase
in the value of α increases the weighting for AnswerPercentageOnPage while at the same
time decreases the weighting for CredibilityScore instead.
Credibility-based answers are stored using the same format as specified for frequency
score technique. This is because answer percentage can be derived from frequency
scoring technique, thus the answer file format can be used for both scoring techniques.
However, the additional step taken in credibility-based answer scoring technique is that
credibility scores of Web pages are stored in an independent file. Figure 3.12 shows the
format for storing credibility scores of Web pages:
164
Figure 3.12: Format for storing Web pages credibility scores
As shown in the figure, scores of Web pages are stored into 20 independent lines. This is
because each line represents a Web page, and the score on that line represents credibility
score of that page. The credibility score range is between 0 and 100, where a higher score
indicates higher credibility for the page.
3.3.9 Generating results for evaluation metrics
The answer files can be used to generate a number of results including top answers,
PerCorrect and MRR. Figure 3.13 shows the top answers file generated using stored
answers for a question, shown earlier in Figure 3.9.
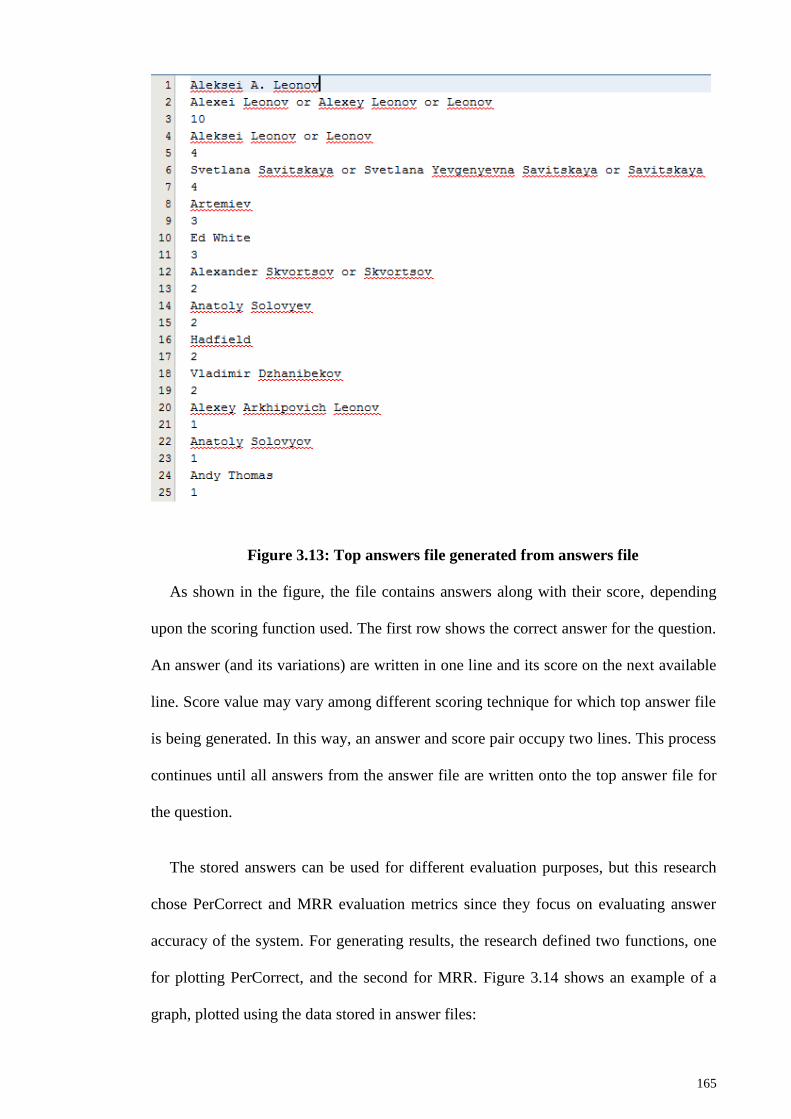
165
Figure 3.13: Top answers file generated from answers file
As shown in the figure, the file contains answers along with their score, depending
upon the scoring function used. The first row shows the correct answer for the question.
An answer (and its variations) are written in one line and its score on the next available
line. Score value may vary among different scoring technique for which top answer file
is being generated. In this way, an answer and score pair occupy two lines. This process
continues until all answers from the answer file are written onto the top answer file for
the question.
The stored answers can be used for different evaluation purposes, but this research
chose PerCorrect and MRR evaluation metrics since they focus on evaluating answer
accuracy of the system. For generating results, the research defined two functions, one
for plotting PerCorrect, and the second for MRR. Figure 3.14 shows an example of a
graph, plotted using the data stored in answer files:
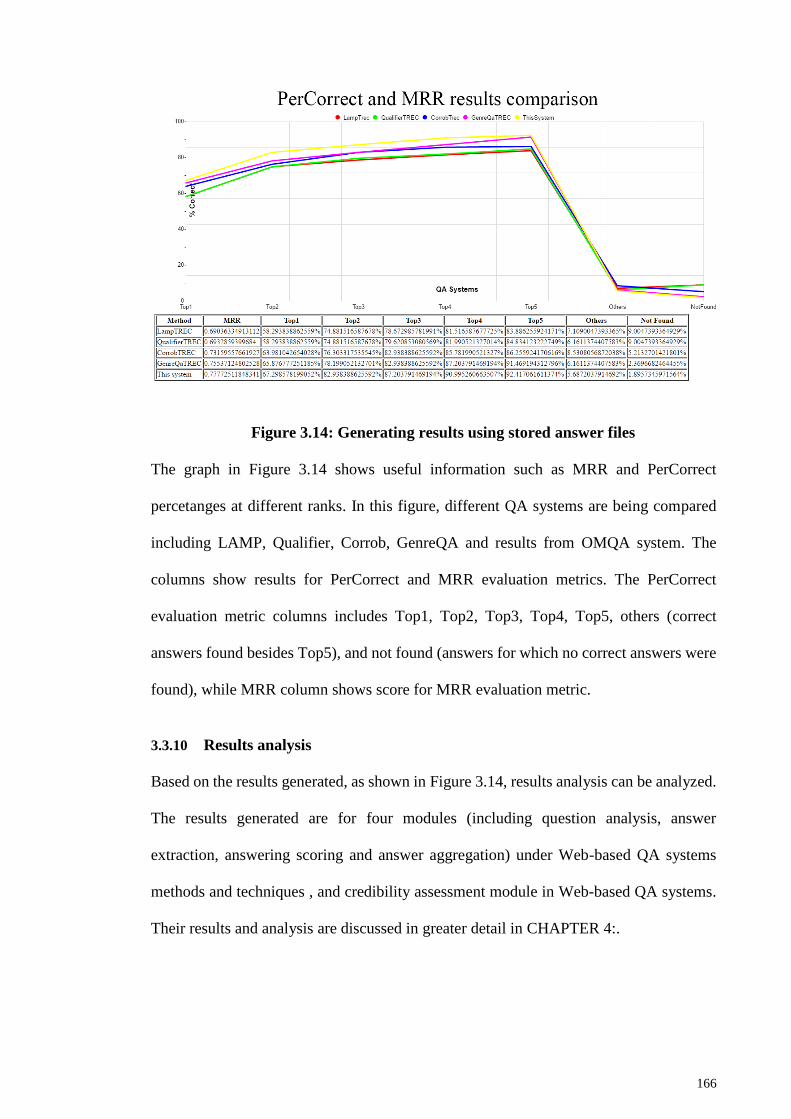
166
Figure 3.14: Generating results using stored answer files
The graph in Figure 3.14 shows useful information such as MRR and PerCorrect
percetanges at different ranks. In this figure, different QA systems are being compared
including LAMP, Qualifier, Corrob, GenreQA and results from OMQA system. The
columns show results for PerCorrect and MRR evaluation metrics. The PerCorrect
evaluation metric columns includes Top1, Top2, Top3, Top4, Top5, others (correct
answers found besides Top5), and not found (answers for which no correct answers were
found), while MRR column shows score for MRR evaluation metric.
3.3.10 Results analysis
Based on the results generated, as shown in Figure 3.14, results analysis can be analyzed.
The results generated are for four modules (including question analysis, answer
extraction, answering scoring and answer aggregation) under Web-based QA systems
methods and techniques , and credibility assessment module in Web-based QA systems.
Their results and analysis are discussed in greater detail in CHAPTER 4:.

167
CHAPTER 4: RESULTS AND DISCUSSION
The chapter is divided into three sections. These are listed below:
1. Results for Web-based QA systems methods and techniques
2. Results for OMQA systems vs baseline systems
3. Results for CredOMQA vs baseline systems
In the first evaluation section, methods and techniques found in the existing Web-
based QA systems were evaluated. This helped in highlighting methods that improved
accuracy of answers. Additionally, multiple techniques available for each method were
evaluated as well, whether to choose one over the other or combine available techniques
for achieving higher accuracy. Results from this stage allowed the research to suggest
combinations of methods and techniques that produce optimal accuracy of answers in
Web-based QA systems, and use them in OMQA system. In the end, a result analysis
summary of methods and techniques found under the answer extraction, answer scoring
and answer aggregation is provided.
In the second evaluation section, OMQA system which is using optimal methods and
techniques is compared against baseline systems not using credibility assessment. This
allows the research to highlight the success of OMQA by using methods producing
optimals. In the end analysis summary for the OMQA vs baseline results is provided.
In the third evaluation section, credibility of Web pages was evaluated using credibility
assessment module, producing credibility-based answer scores. This credibility
assessment module is added to the existing OMQA system to form CredOMQA system.
After selecting the optimal value for α in credibility-based answer scores, CredOMQA is
evaluated, for individual credibility categories and all categories colectovely, against
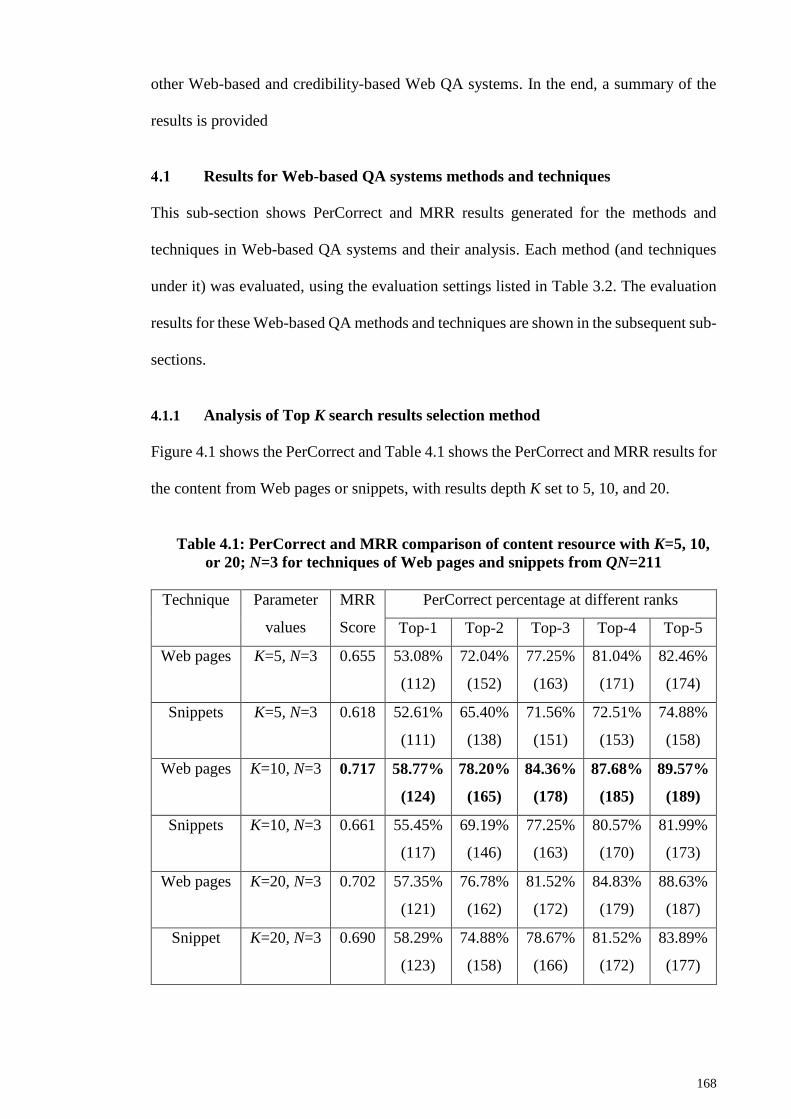
168
other Web-based and credibility-based Web QA systems. In the end, a summary of the
results is provided
Results for Web-based QA systems methods and techniques
This sub-section shows PerCorrect and MRR results generated for the methods and
techniques in Web-based QA systems and their analysis. Each method (and techniques
under it) was evaluated, using the evaluation settings listed in Table 3.2. The evaluation
results for these Web-based QA methods and techniques are shown in the subsequent sub-
sections.
4.1.1 Analysis of Top K search results selection method
Figure 4.1 shows the PerCorrect and Table 4.1 shows the PerCorrect and MRR results for
the content from Web pages or snippets, with results depth K set to 5, 10, and 20.
Table 4.1: PerCorrect and MRR comparison of content resource with K=5, 10,
or 20; N=3 for techniques of Web pages and snippets from QN=211
Technique Parameter
values
MRR
Score
PerCorrect percentage at different ranks
Top-1 Top-2 Top-3 Top-4 Top-5
Web pages K=5, N=3 0.655 53.08%
(112)
72.04%
(152)
77.25%
(163)
81.04%
(171)
82.46%
(174)
Snippets K=5, N=3 0.618 52.61%
(111)
65.40%
(138)
71.56%
(151)
72.51%
(153)
74.88%
(158)
Web pages K=10, N=3 0.717 58.77%
(124)
78.20%
(165)
84.36%
(178)
87.68%
(185)
89.57%
(189)
Snippets K=10, N=3 0.661 55.45%
(117)
69.19%
(146)
77.25%
(163)
80.57%
(170)
81.99%
(173)
Web pages K=20, N=3 0.702 57.35%
(121)
76.78%
(162)
81.52%
(172)
84.83%
(179)
88.63%
(187)
Snippet K=20, N=3 0.690 58.29%
(123)
74.88%
(158)
78.67%
(166)
81.52%
(172)
83.89%
(177)
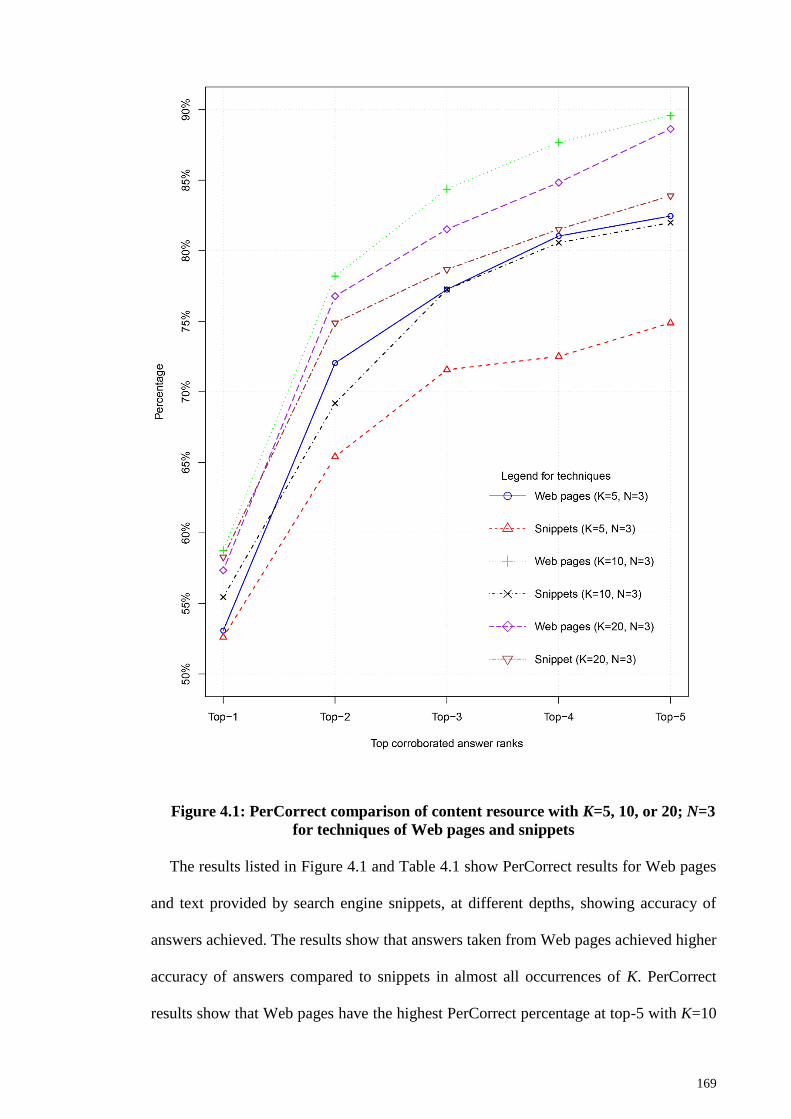
169
Figure 4.1: PerCorrect comparison of content resource with K=5, 10, or 20; N=3
for techniques of Web pages and snippets
The results listed in Figure 4.1 and Table 4.1 show PerCorrect results for Web pages
and text provided by search engine snippets, at different depths, showing accuracy of
answers achieved. The results show that answers taken from Web pages achieved higher
accuracy of answers compared to snippets in almost all occurrences of K. PerCorrect
results show that Web pages have the highest PerCorrect percentage at top-5 with K=10
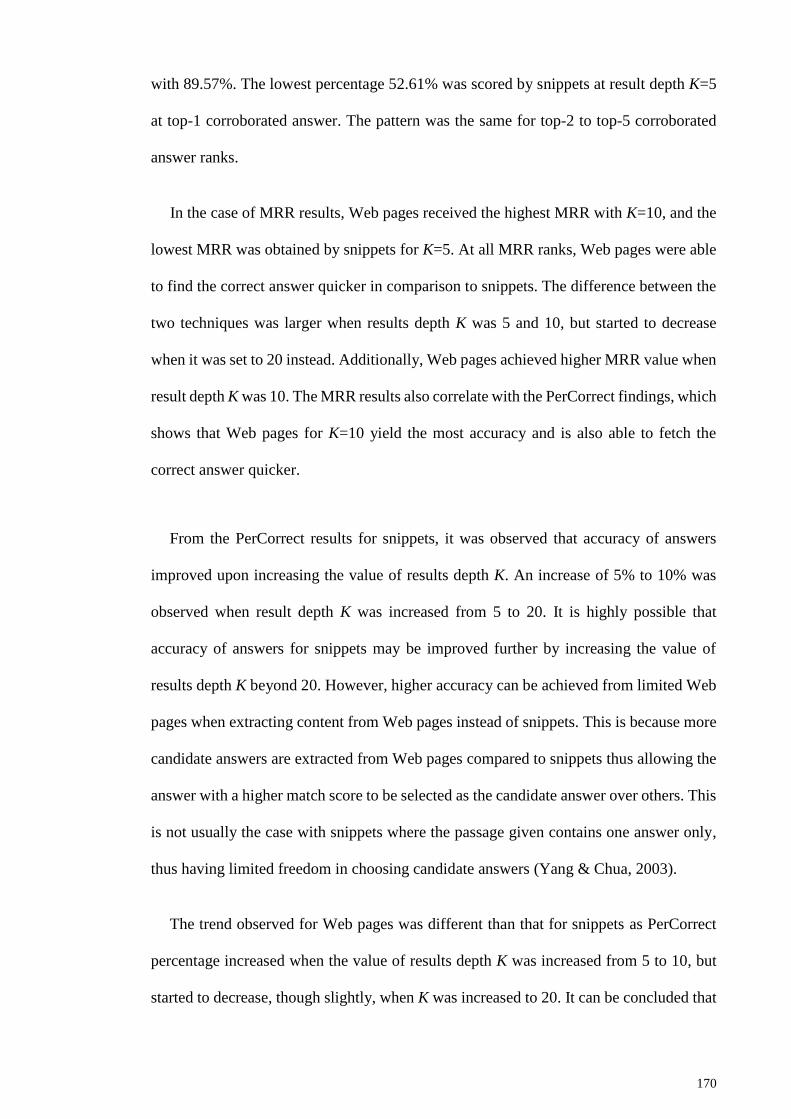
170
with 89.57%. The lowest percentage 52.61% was scored by snippets at result depth K=5
at top-1 corroborated answer. The pattern was the same for top-2 to top-5 corroborated
answer ranks.
In the case of MRR results, Web pages received the highest MRR with K=10, and the
lowest MRR was obtained by snippets for K=5. At all MRR ranks, Web pages were able
to find the correct answer quicker in comparison to snippets. The difference between the
two techniques was larger when results depth K was 5 and 10, but started to decrease
when it was set to 20 instead. Additionally, Web pages achieved higher MRR value when
result depth K was 10. The MRR results also correlate with the PerCorrect findings, which
shows that Web pages for K=10 yield the most accuracy and is also able to fetch the
correct answer quicker.
From the PerCorrect results for snippets, it was observed that accuracy of answers
improved upon increasing the value of results depth K. An increase of 5% to 10% was
observed when result depth K was increased from 5 to 20. It is highly possible that
accuracy of answers for snippets may be improved further by increasing the value of
results depth K beyond 20. However, higher accuracy can be achieved from limited Web
pages when extracting content from Web pages instead of snippets. This is because more
candidate answers are extracted from Web pages compared to snippets thus allowing the
answer with a higher match score to be selected as the candidate answer over others. This
is not usually the case with snippets where the passage given contains one answer only,
thus having limited freedom in choosing candidate answers (Yang & Chua, 2003).
The trend observed for Web pages was different than that for snippets as PerCorrect
percentage increased when the value of results depth K was increased from 5 to 10, but
started to decrease, though slightly, when K was increased to 20. It can be concluded that
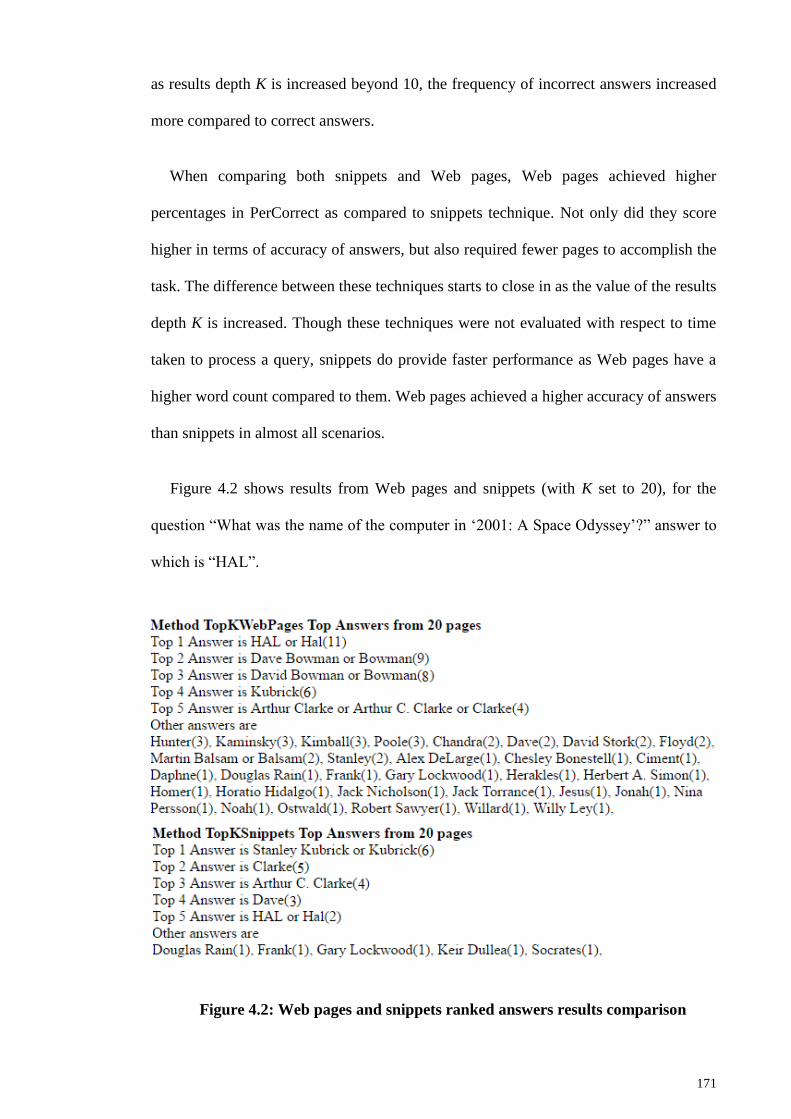
171
as results depth K is increased beyond 10, the frequency of incorrect answers increased
more compared to correct answers.
When comparing both snippets and Web pages, Web pages achieved higher
percentages in PerCorrect as compared to snippets technique. Not only did they score
higher in terms of accuracy of answers, but also required fewer pages to accomplish the
task. The difference between these techniques starts to close in as the value of the results
depth K is increased. Though these techniques were not evaluated with respect to time
taken to process a query, snippets do provide faster performance as Web pages have a
higher word count compared to them. Web pages achieved a higher accuracy of answers
than snippets in almost all scenarios.
Figure 4.2 shows results from Web pages and snippets (with K set to 20), for the
question “What was the name of the computer in ‘2001: A Space Odyssey’?” answer to
which is “HAL”.
Figure 4.2: Web pages and snippets ranked answers results comparison
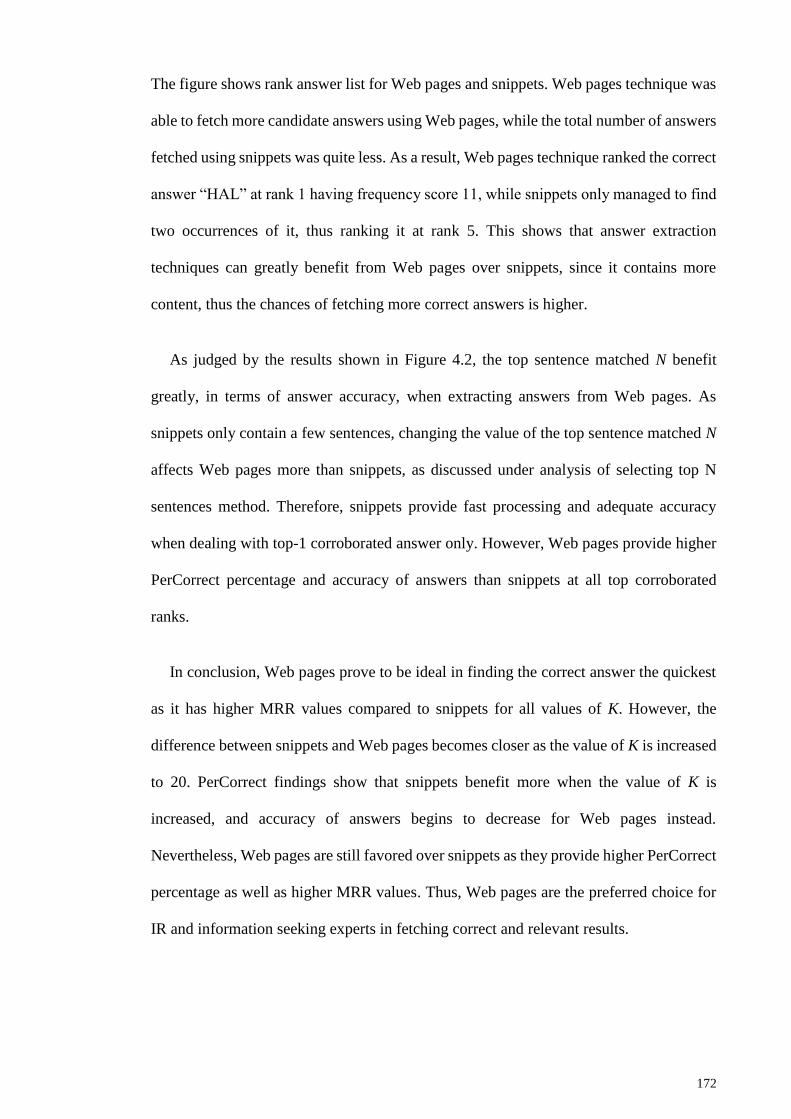
172
The figure shows rank answer list for Web pages and snippets. Web pages technique was
able to fetch more candidate answers using Web pages, while the total number of answers
fetched using snippets was quite less. As a result, Web pages technique ranked the correct
answer “HAL” at rank 1 having frequency score 11, while snippets only managed to find
two occurrences of it, thus ranking it at rank 5. This shows that answer extraction
techniques can greatly benefit from Web pages over snippets, since it contains more
content, thus the chances of fetching more correct answers is higher.
As judged by the results shown in Figure 4.2, the top sentence matched N benefit
greatly, in terms of answer accuracy, when extracting answers from Web pages. As
snippets only contain a few sentences, changing the value of the top sentence matched N
affects Web pages more than snippets, as discussed under analysis of selecting top N
sentences method. Therefore, snippets provide fast processing and adequate accuracy
when dealing with top-1 corroborated answer only. However, Web pages provide higher
PerCorrect percentage and accuracy of answers than snippets at all top corroborated
ranks.
In conclusion, Web pages prove to be ideal in finding the correct answer the quickest
as it has higher MRR values compared to snippets for all values of K. However, the
difference between snippets and Web pages becomes closer as the value of K is increased
to 20. PerCorrect findings show that snippets benefit more when the value of K is
increased, and accuracy of answers begins to decrease for Web pages instead.
Nevertheless, Web pages are still favored over snippets as they provide higher PerCorrect
percentage as well as higher MRR values. Thus, Web pages are the preferred choice for
IR and information seeking experts in fetching correct and relevant results.
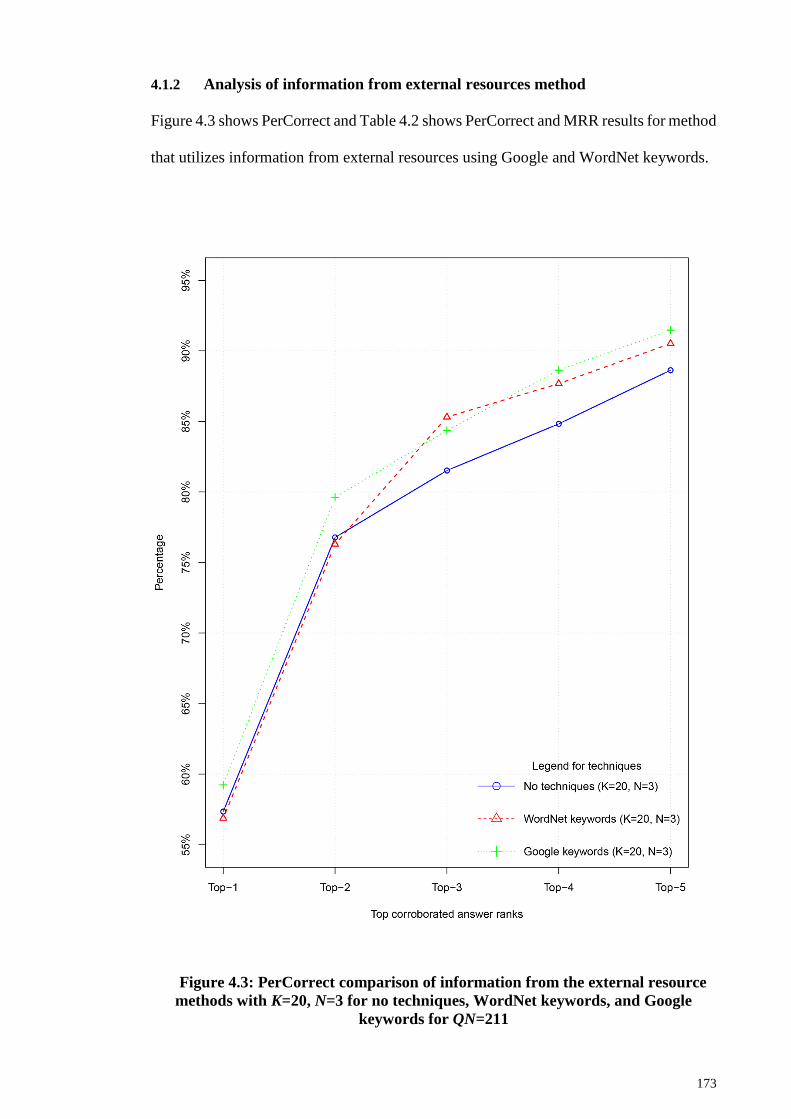
173
4.1.2 Analysis of information from external resources method
Figure 4.3 shows PerCorrect and Table 4.2 shows PerCorrect and MRR results for method
that utilizes information from external resources using Google and WordNet keywords.
Figure 4.3: PerCorrect comparison of information from the external resource
methods with K=20, N=3 for no techniques, WordNet keywords, and Google
keywords for QN=211
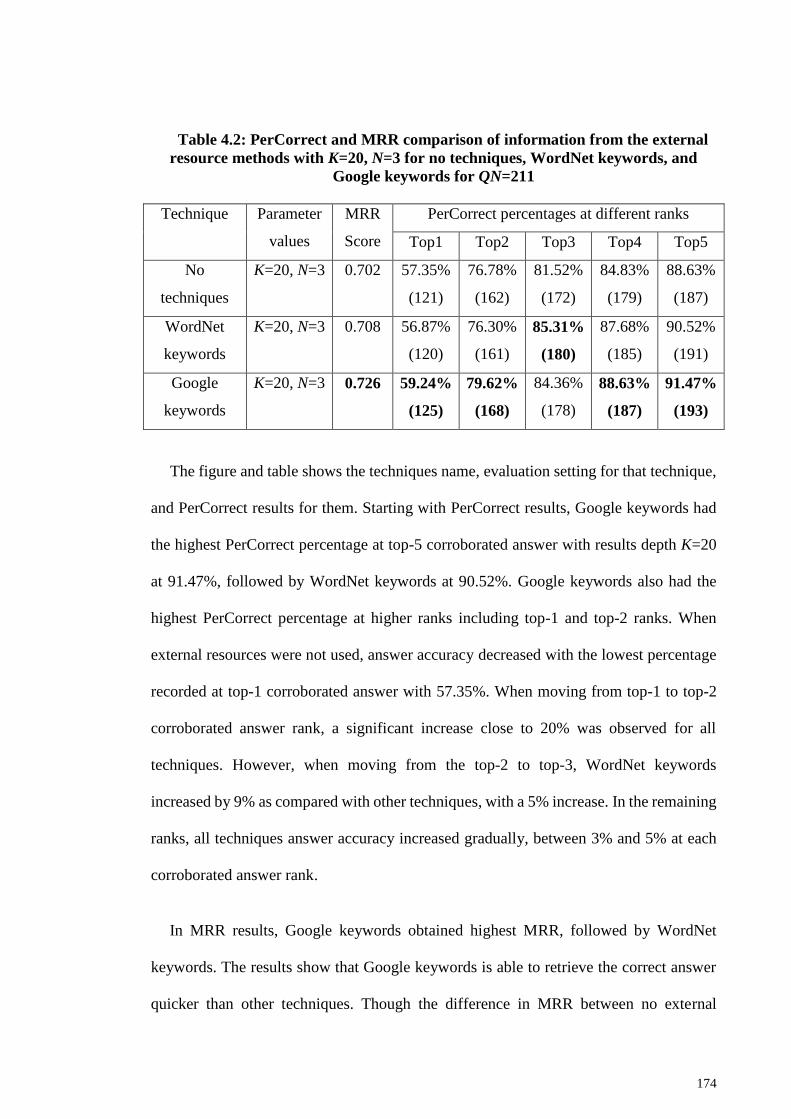
174
Table 4.2: PerCorrect and MRR comparison of information from the external
resource methods with K=20, N=3 for no techniques, WordNet keywords, and
Google keywords for QN=211
Technique Parameter
values
MRR
Score
PerCorrect percentages at different ranks
Top1 Top2 Top3 Top4 Top5
No
techniques
K=20, N=3 0.702 57.35%
(121)
76.78%
(162)
81.52%
(172)
84.83%
(179)
88.63%
(187)
WordNet
keywords
K=20, N=3 0.708 56.87%
(120)
76.30%
(161)
85.31%
(180)
87.68%
(185)
90.52%
(191)
keywords
K=20, N=3 0.726 59.24%
(125)
79.62%
(168)
84.36%
(178)
88.63%
(187)
91.47%
(193)
The figure and table shows the techniques name, evaluation setting for that technique,
and PerCorrect results for them. Starting with PerCorrect results, Google keywords had
the highest PerCorrect percentage at top-5 corroborated answer with results depth K=20
at 91.47%, followed by WordNet keywords at 90.52%. Google keywords also had the
highest PerCorrect percentage at higher ranks including top-1 and top-2 ranks. When
external resources were not used, answer accuracy decreased with the lowest percentage
recorded at top-1 corroborated answer with 57.35%. When moving from top-1 to top-2
corroborated answer rank, a significant increase close to 20% was observed for all
techniques. However, when moving from the top-2 to top-3, WordNet keywords
increased by 9% as compared with other techniques, with a 5% increase. In the remaining
ranks, all techniques answer accuracy increased gradually, between 3% and 5% at each
corroborated answer rank.
In MRR results, Google keywords obtained highest MRR, followed by WordNet
keywords. The results show that Google keywords is able to retrieve the correct answer
quicker than other techniques. Though the difference in MRR between no external

175
resource used and WordNet was less than 0.01, the technique did improve accuracy of
answers, even if marginally. When comparing MRR results between Google keywords
and no external resources techniques, the difference goes up to 0.025, showing that adding
keywords help in increasing accuracy of answers.
Google keywords had the highest answer accuracy in all corroborated answer ranks,
except at top-3. Though the difference between using and not using external keywords
was not significant, nevertheless accuracy did improve at all corroborated answer ranks.
These externals resources have more impact on queries where the keywords provided by
the question itself are not sufficient in finding the best matches on Web pages. Normally
the system uses the keywords in the question. Adding a set of keywords in the form of
synonyms increases its chances of finding the correct answer. Techniques such as
WordNet and Google keywords increase the keyword pool and help sentence matching
method for finding additional candidate answers. Results show that Google keywords
perform better than WordNet keywords, which might be due to use of Google search
engine for answer extraction.
External resources method is best used when answer extraction is done on Web pages
in comparison to snippets. This is because Web pages contain more information and have
a higher chance of catching sentences containing keywords from external resources.
Therefore, external resources help increase the accuracy of answers, even if it is by a
small margin. The combination of multiple external information resources can also
produce better results. This point is highlighted in the example shown in Figure 4.4, for
the question “What was the name of the first Russian astronaut to do a spacewalk?” and
correct answer was “Aleksei A. Leonov”.
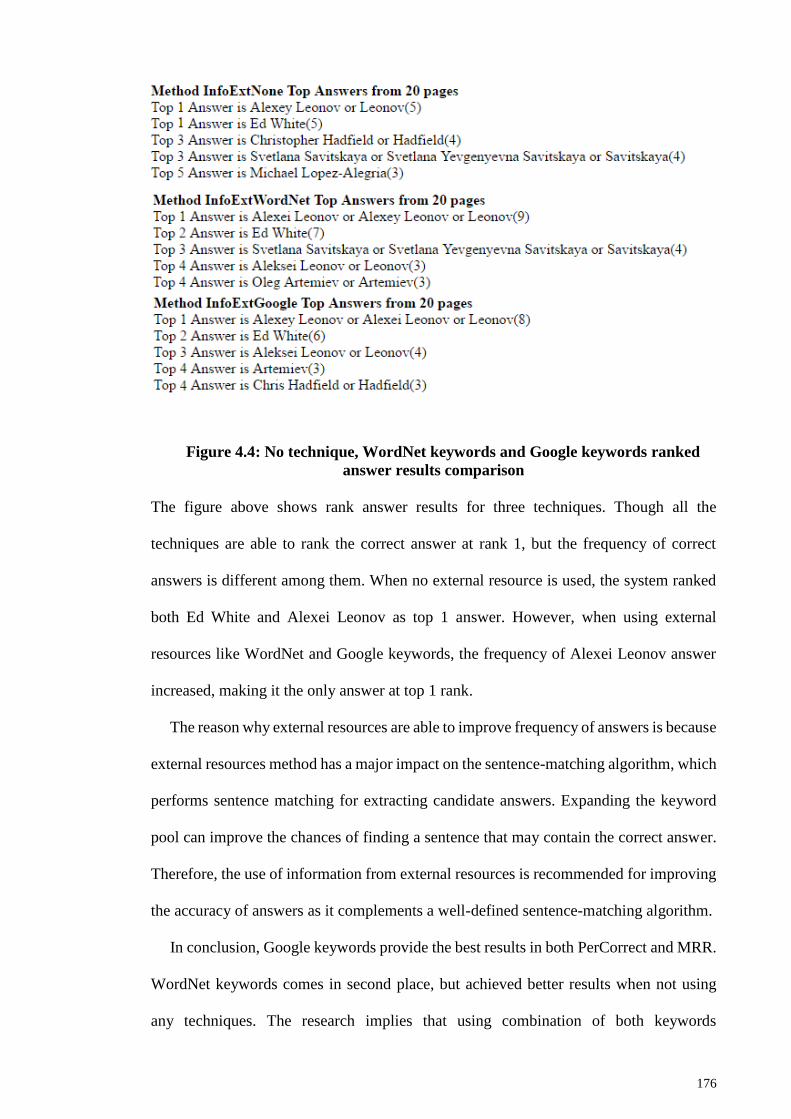
176
Figure 4.4: No technique, WordNet keywords and Google keywords ranked
answer results comparison
The figure above shows rank answer results for three techniques. Though all the
techniques are able to rank the correct answer at rank 1, but the frequency of correct
answers is different among them. When no external resource is used, the system ranked
both Ed White and Alexei Leonov as top 1 answer. However, when using external
resources like WordNet and Google keywords, the frequency of Alexei Leonov answer
increased, making it the only answer at top 1 rank.
The reason why external resources are able to improve frequency of answers is because
external resources method has a major impact on the sentence-matching algorithm, which
performs sentence matching for extracting candidate answers. Expanding the keyword
pool can improve the chances of finding a sentence that may contain the correct answer.
Therefore, the use of information from external resources is recommended for improving
the accuracy of answers as it complements a well-defined sentence-matching algorithm.
In conclusion, Google keywords provide the best results in both PerCorrect and MRR.
WordNet keywords comes in second place, but achieved better results when not using
any techniques. The research implies that using combination of both keywords

177
techniques, in order to expand the keywords list, would increase the chances of extracting
correct candidate answers.
4.1.3 Analysis of NER method
Figure 4.5 shows PerCorrect results and Table 4.3 shows PerCorrect and MRR results
vis-a-vis the NER method, using Stanford, Alchemy, and the combination of the two NER
techniques.
Figure 4.5: PerCorrect comparison of NER method with K=20, N=3 for the
StanfordNER and AlchemyNER techniques and their combination for QN=211
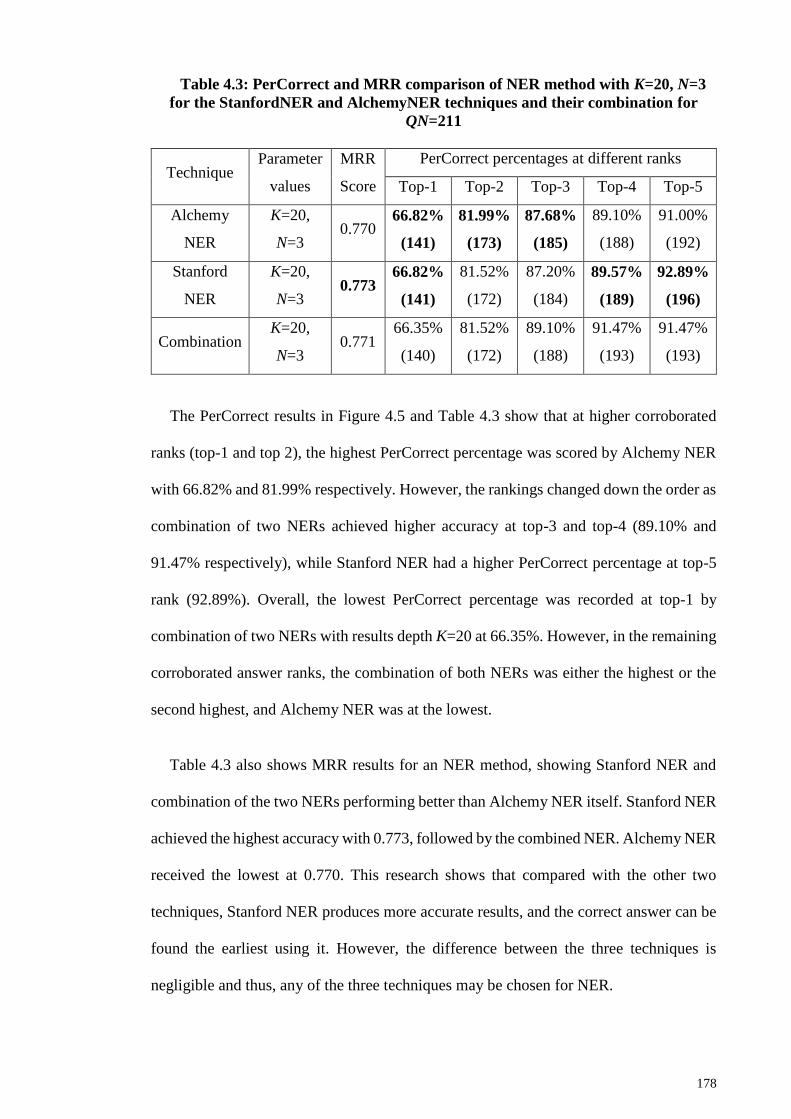
178
Table 4.3: PerCorrect and MRR comparison of NER method with K=20, N=3
for the StanfordNER and AlchemyNER techniques and their combination for
QN=211
Technique Parameter
values
MRR
Score
PerCorrect percentages at different ranks
Top-1 Top-2 Top-3 Top-4 Top-5
Alchemy
NER
K=20,
N=3 0.770
66.82%
(141)
81.99%
(173)
87.68%
(185)
89.10%
(188)
91.00%
(192)
Stanford
NER
K=20,
N=3 0.773
66.82%
(141)
81.52%
(172)
87.20%
(184)
89.57%
(189)
92.89%
(196)
Combination K=20,
N=3 0.771
66.35%
(140)
81.52%
(172)
89.10%
(188)
91.47%
(193)
91.47%
(193)
The PerCorrect results in Figure 4.5 and Table 4.3 show that at higher corroborated
ranks (top-1 and top 2), the highest PerCorrect percentage was scored by Alchemy NER
with 66.82% and 81.99% respectively. However, the rankings changed down the order as
combination of two NERs achieved higher accuracy at top-3 and top-4 (89.10% and
91.47% respectively), while Stanford NER had a higher PerCorrect percentage at top-5
rank (92.89%). Overall, the lowest PerCorrect percentage was recorded at top-1 by
combination of two NERs with results depth K=20 at 66.35%. However, in the remaining
corroborated answer ranks, the combination of both NERs was either the highest or the
second highest, and Alchemy NER was at the lowest.
Table 4.3 also shows MRR results for an NER method, showing Stanford NER and
combination of the two NERs performing better than Alchemy NER itself. Stanford NER
achieved the highest accuracy with 0.773, followed by the combined NER. Alchemy NER
received the lowest at 0.770. This research shows that compared with the other two
techniques, Stanford NER produces more accurate results, and the correct answer can be
found the earliest using it. However, the difference between the three techniques is
negligible and thus, any of the three techniques may be chosen for NER.
179
Alchemy NER technique was able to achieve highest PerCorrect percentages at higher
corroborated ranks (top-1 and top-2), but its accuracy deteriorated in the remaining ranks.
However, the difference between Alchemy NER and the other techniques was less than
1% between top-1 to top-3 ranks. Looking at the positives and negatives of the techniques,
it was observed that Alchemy NER had difficulty identifying mythical names, such as
Zeus, in some sentences but ran smoothly when dealing with normal names, like Tom,
Jack, etc. On the plus side, Alchemy NER was effective in identifying the full names of
people, and not breaking them into separate entities.
Stanford NER technique shows better results at lower corroborated answer ranks, i.e.,
top-5, by scoring the highest PerCorrect percentage of 92.89% compared to other
techniques. However, its accuracy was lower at higher ranks such as top-2 and top-3.
During evaluation, Stanford NER faced problems in detecting entity types, at times. There
were scenarios where Stanford NER was unable to detect the desired entity type in a
sentence, and thus would skip a valid candidate answer. However, this pattern varied from
sentence to sentence as the same person’s name, which could not be detected in one
sentence, was identified in the other. Another issue found with Stanford NER was that
the technique could not tag a person’s full name as one cohesive unit but rather broke it
down into individual names instead. For example, the name Abraham Lincoln was
identified as two separate person type entities. For addressing this issue, additional coding
had to be done for detecting full names in sentences when using Stanford NER.
The third technique is the combination of Stanford and Alchemy NER, which records
entities detected by both of them. This allows the technique to be able to find more
entities.If one NER was unable to detect an entity type, the other NER technique would
be able to detect it instead. Though the technique did not achieve the highest accuracy at
top-1 or top-2 ranks, it did score higher accuracy at top-3 and top-4 instead, while secured
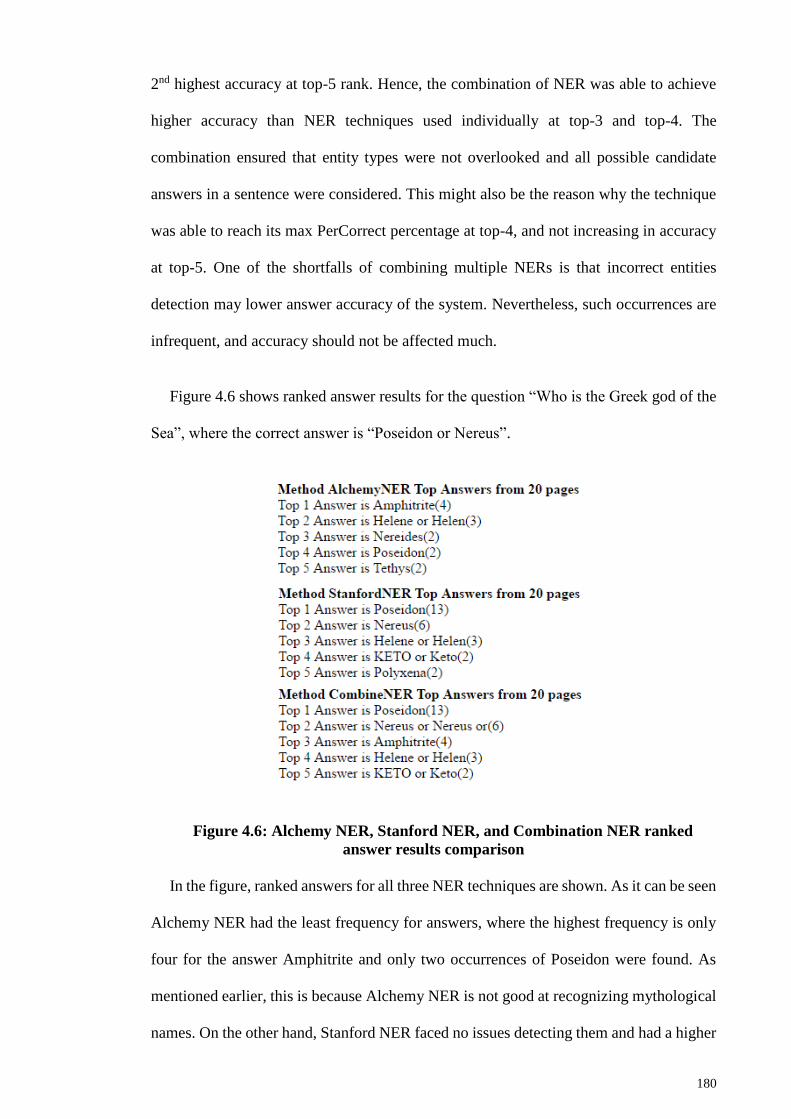
180
2nd highest accuracy at top-5 rank. Hence, the combination of NER was able to achieve
higher accuracy than NER techniques used individually at top-3 and top-4. The
combination ensured that entity types were not overlooked and all possible candidate
answers in a sentence were considered. This might also be the reason why the technique
was able to reach its max PerCorrect percentage at top-4, and not increasing in accuracy
at top-5. One of the shortfalls of combining multiple NERs is that incorrect entities
detection may lower answer accuracy of the system. Nevertheless, such occurrences are
infrequent, and accuracy should not be affected much.
Figure 4.6 shows ranked answer results for the question “Who is the Greek god of the
Sea”, where the correct answer is “Poseidon or Nereus”.
Figure 4.6: Alchemy NER, Stanford NER, and Combination NER ranked
answer results comparison
In the figure, ranked answers for all three NER techniques are shown. As it can be seen
Alchemy NER had the least frequency for answers, where the highest frequency is only
four for the answer Amphitrite and only two occurrences of Poseidon were found. As
mentioned earlier, this is because Alchemy NER is not good at recognizing mythological
names. On the other hand, Stanford NER faced no issues detecting them and had a higher
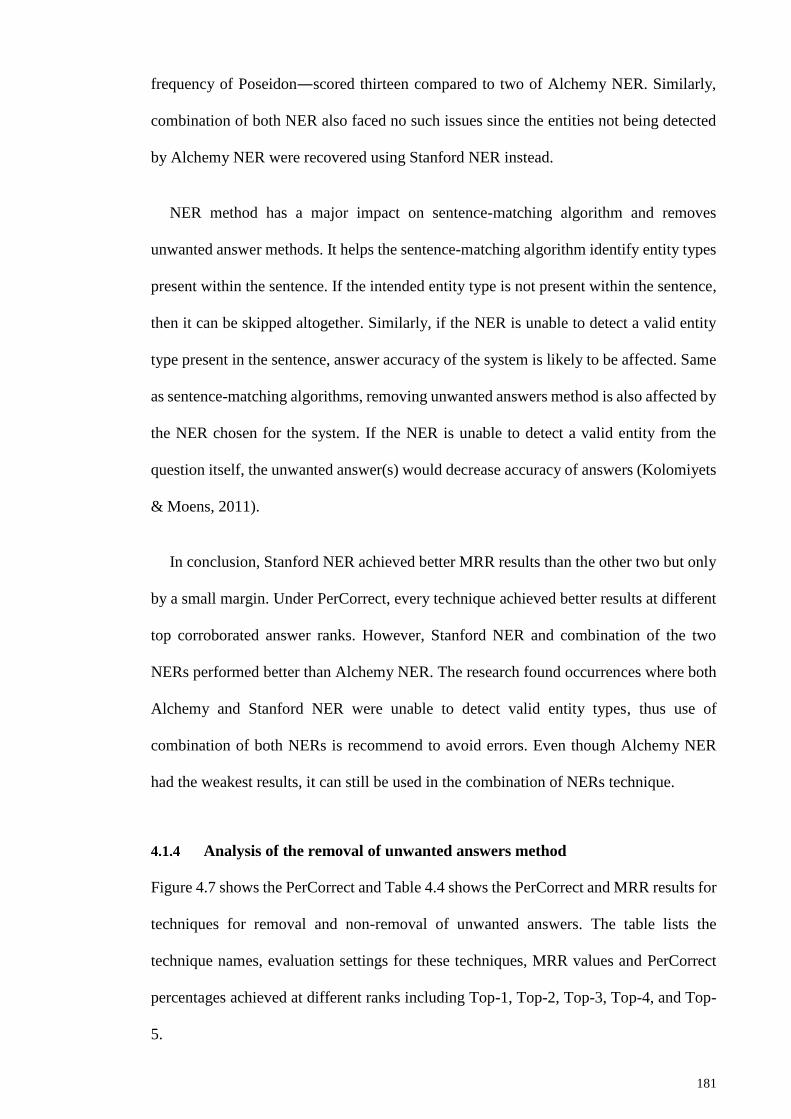
181
frequency of Poseidon―scored thirteen compared to two of Alchemy NER. Similarly,
combination of both NER also faced no such issues since the entities not being detected
by Alchemy NER were recovered using Stanford NER instead.
NER method has a major impact on sentence-matching algorithm and removes
unwanted answer methods. It helps the sentence-matching algorithm identify entity types
present within the sentence. If the intended entity type is not present within the sentence,
then it can be skipped altogether. Similarly, if the NER is unable to detect a valid entity
type present in the sentence, answer accuracy of the system is likely to be affected. Same
as sentence-matching algorithms, removing unwanted answers method is also affected by
the NER chosen for the system. If the NER is unable to detect a valid entity from the
question itself, the unwanted answer(s) would decrease accuracy of answers (Kolomiyets
& Moens, 2011).
In conclusion, Stanford NER achieved better MRR results than the other two but only
by a small margin. Under PerCorrect, every technique achieved better results at different
top corroborated answer ranks. However, Stanford NER and combination of the two
NERs performed better than Alchemy NER. The research found occurrences where both
Alchemy and Stanford NER were unable to detect valid entity types, thus use of
combination of both NERs is recommend to avoid errors. Even though Alchemy NER
had the weakest results, it can still be used in the combination of NERs technique.
4.1.4 Analysis of the removal of unwanted answers method
Figure 4.7 shows the PerCorrect and Table 4.4 shows the PerCorrect and MRR results for
techniques for removal and non-removal of unwanted answers. The table lists the
technique names, evaluation settings for these techniques, MRR values and PerCorrect
percentages achieved at different ranks including Top-1, Top-2, Top-3, Top-4, and Top-
5.
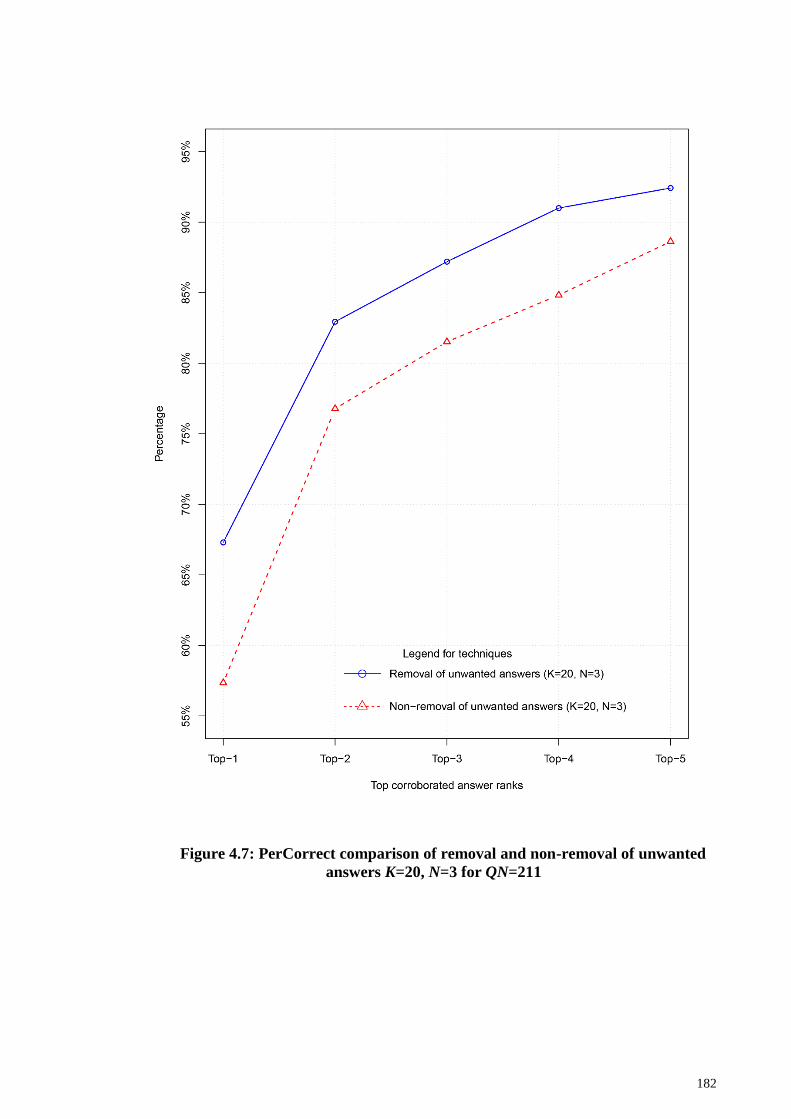
182
Figure 4.7: PerCorrect comparison of removal and non-removal of unwanted
answers K=20, N=3 for QN=211

183
Table 4.4: PerCorrect and MRR comparison of removal and non-removal of
unwanted answers K=20, N=3 for QN=211
Technique Parameter
values
MRR
Score
PerCorrect percentages at different ranks
Top-1 Top-2 Top-3 Top-4 Top-5
Removal of
unwanted
answers
K=20,
N=3 0.778
67.30%
(142)
82.94%
(175)
87.20%
(184)
91.00%
(192)
92.42%
(195)
Non-
removal of
unwanted
answers
K=20,
N=3 0.702
57.35%
(121)
76.78%
(162)
81.52%
(172)
84.83%
(179)
88.63%
(187)
In PerCorrect results, the highest accuracy was achieved by removing unwanted
answers with a PerCorrect percentage of 92.42% at top-5 corroborated answer rank,
67.30% at top-1. The lowest accuracy was obtained by the technique containing unwanted
answers with a score of 57.35% at top-1 corroborated answer rank. Thus, removing
unwanted answers technique is able to achieve higher PerCorrect percentages than non-
removal of unwanted answers technique at all top corroborated answer ranks.
Table 4.4 also shows the MRR comparison between the removal and non-removal of
unwanted answers and the difference is significant. The removal of unwanted answers
had an MRR value of 0.778, which is 0.076 higher than the other technique. It indicates
that it is the best technique to obtain the correct answer quickly. The non-removal of
unwanted answers achieved an MRR value of more than .70. However, the difference
between the two techniques cannot be neglected.
Removal of unwanted answer technique achieved higher PerCorrect percentage at all
top corroborated answer ranks and had considerable margin against the other technique.
The increase was steeper in the higher ranks as compared to lower ranks. This is because
most of the correct answers are placed higher in the corroborated list generated by
184
removal of unwanted answer technique, and the remaining correct answers were placed
between top-3 and top-5 ranks. The difference between the top-4 and top-5 corroborated
answer ranks was roughly 1.5%, which shows that most of the correct answers were found
till top-4 rank. This technique is quite useful in ruling out a particular answer that cannot
be the correct answer in a particular question. This allows to create a wider margin
between the top 2 ranked answers, thus clarifying the answers that are more likely to be
correct for the question.
The lowest accuracy in all top corroborated answer ranks was obtained because of the
non-removal of unwanted answers. The difference between the two techniques has always
been significant except at top-5 rank. This is understandable because most of the correct
answers were not able to be placed at higher ranks, thus the percentage starts to increase
once correct answers are being found at lower corroborated ranks instead. However, the
technique scored 89% accuracy at the top-5 rank, which indicates that around 11% of the
answers are either pushed further down or are not found by the system at all. Thus the
accuracy of the Web-based QA system is deeply affected as correct answers are pushed
to lower corroborated answer ranks instead. When unwanted answers are not removed
from the candidate answers pool, the technique may push the correct answers down the
lower ranks.
This study observed a huge increase in accuracy in both techniques when moving from
top-1 to top-2 corroborated answer rank, but the pattern changed as it went to lower ranks.
In the case of removal of unwanted answers technique, accuracy increased gradually
when it went to the top-4 rank but increased afterwards by 1.42% when going to the top-
5 answer rank. This was not the case when removal of unwanted answers was not used.
Increase in answer accuracy was more gradual as it increased close to 4%–5% in each
rank. Removal of unwanted answers increased accuracy of answers by 20%–43% at
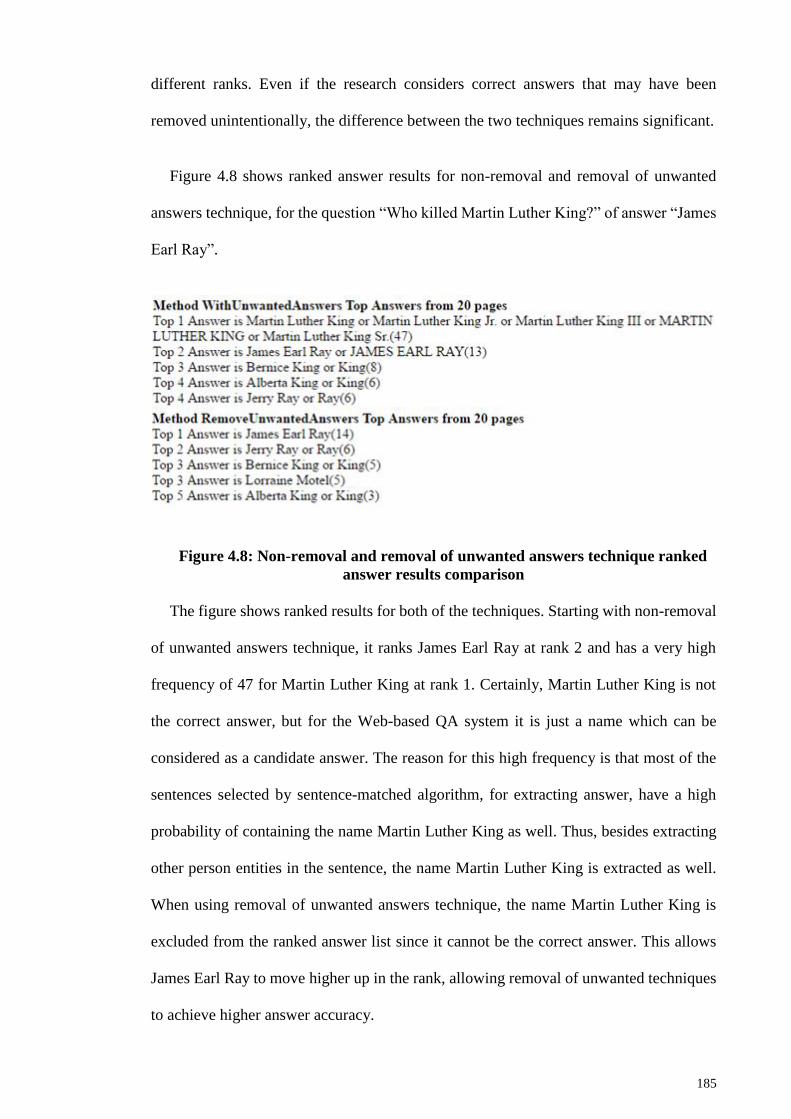
185
different ranks. Even if the research considers correct answers that may have been
removed unintentionally, the difference between the two techniques remains significant.
Figure 4.8 shows ranked answer results for non-removal and removal of unwanted
answers technique, for the question “Who killed Martin Luther King?” of answer “James
Earl Ray”.
Figure 4.8: Non-removal and removal of unwanted answers technique ranked
answer results comparison
The figure shows ranked results for both of the techniques. Starting with non-removal
of unwanted answers technique, it ranks James Earl Ray at rank 2 and has a very high
frequency of 47 for Martin Luther King at rank 1. Certainly, Martin Luther King is not
the correct answer, but for the Web-based QA system it is just a name which can be
considered as a candidate answer. The reason for this high frequency is that most of the
sentences selected by sentence-matched algorithm, for extracting answer, have a high
probability of containing the name Martin Luther King as well. Thus, besides extracting
other person entities in the sentence, the name Martin Luther King is extracted as well.
When using removal of unwanted answers technique, the name Martin Luther King is
excluded from the ranked answer list since it cannot be the correct answer. This allows
James Earl Ray to move higher up in the rank, allowing removal of unwanted techniques
to achieve higher answer accuracy.
186
This method is dependent on the NER method as it gives the method the ability to
identify entities within the question which may be selected as unwanted candidate
answers. If the technique used by the NER method is unable to detect an entity within the
question itself, it will be unable to remove the unwanted answer. The removal of
unwanted answers may affect the answer scoring module. For example, if the scores
assigned to answers found on a Web page are in terms of probability, removing one of
the answers from the equation increases the likelihood of others being the correct answer.
Thus, removing answers indirectly affects the answer scoring module and how the
answers are ranked. Therefore, removing unwanted answers helps eliminate noise and
increase accuracy of answers by widening the gap between correct and incorrect answers.
In conclusion, removal of unwanted answers improves answer accuracy by a huge
margin in both PerCorrect and MRR results. Though it should only be used with strict
conditions to avoid scenarios where a correct answer may be removed instead.
4.1.5 Analysis of the sentence-matching algorithm method
Figure 4.9 shows the PerCorrect and Table 4.5 shows the PerCorrect and MRR results for
the sentence-matching method using keywords and regular expression techniques. They
lists technique name, evaluation settings for that technique, and the results achieved for
MRR and PerCorrect ranks.
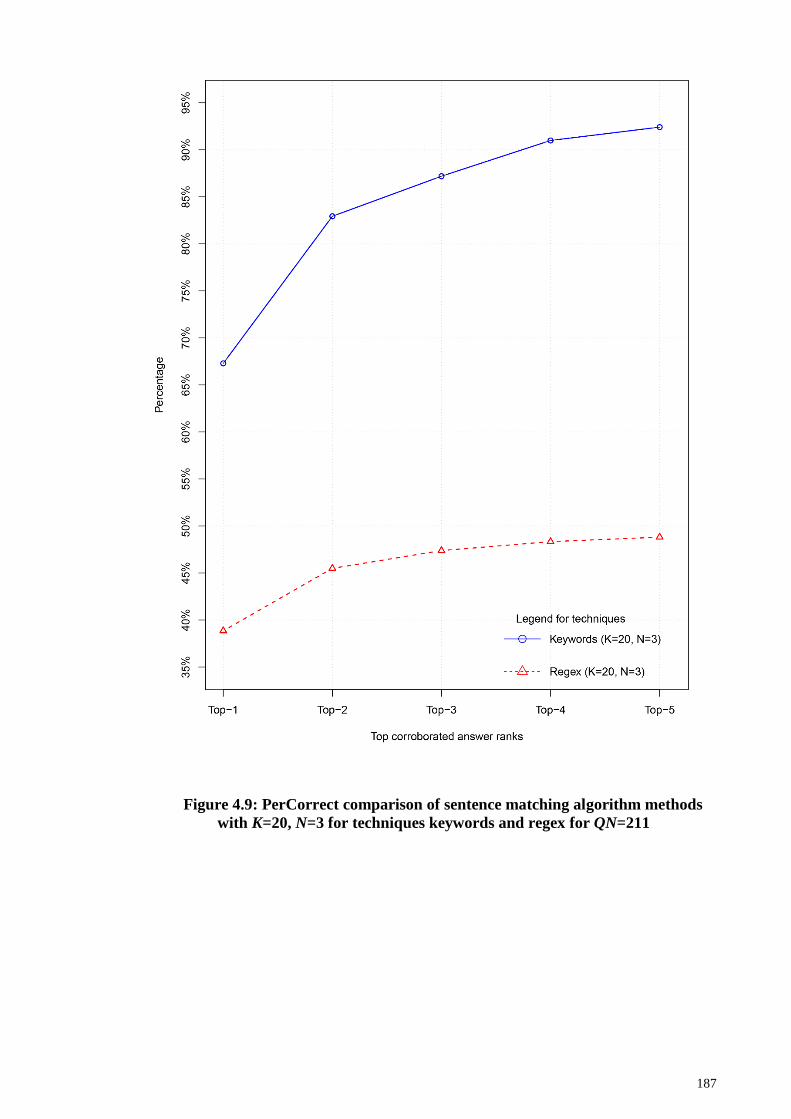
187
Figure 4.9: PerCorrect comparison of sentence matching algorithm methods
with K=20, N=3 for techniques keywords and regex for QN=211
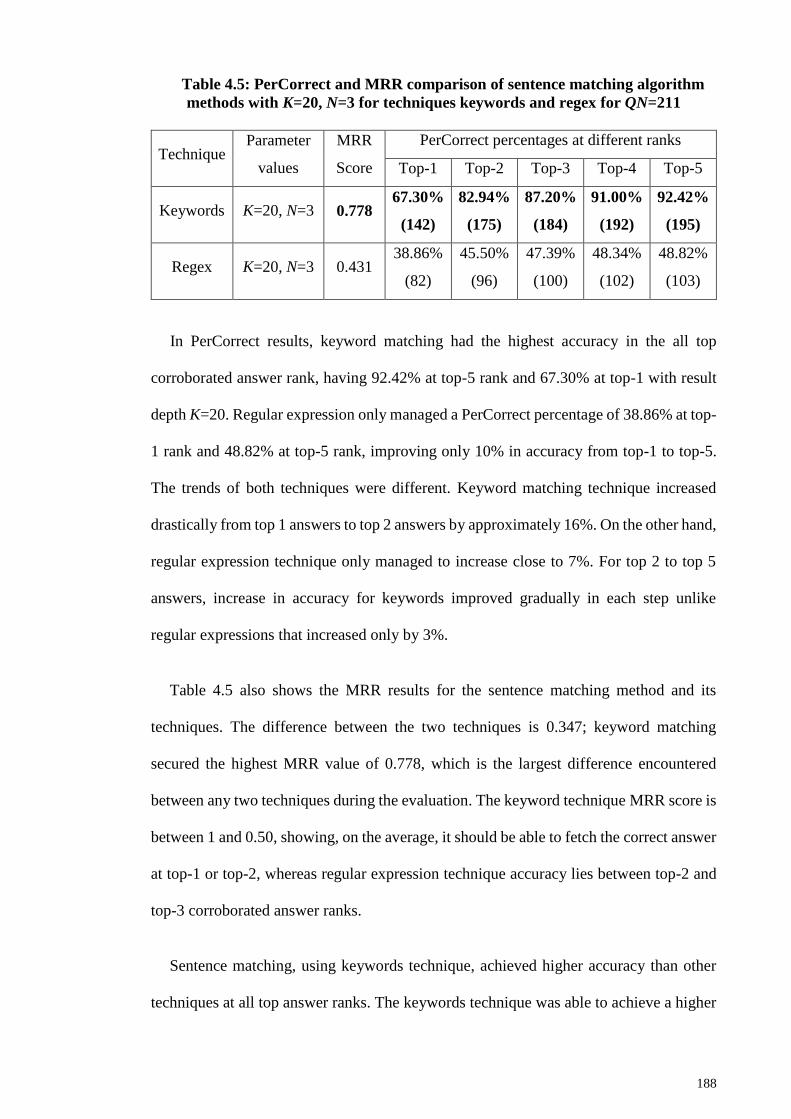
188
Table 4.5: PerCorrect and MRR comparison of sentence matching algorithm
methods with K=20, N=3 for techniques keywords and regex for QN=211
Technique Parameter
values
MRR
Score
PerCorrect percentages at different ranks
Top-1 Top-2 Top-3 Top-4 Top-5
Keywords K=20, N=3 0.778 67.30%
(142)
82.94%
(175)
87.20%
(184)
91.00%
(192)
92.42%
(195)
Regex K=20, N=3 0.431 38.86%
(82)
45.50%
(96)
47.39%
(100)
48.34%
(102)
48.82%
(103)
In PerCorrect results, keyword matching had the highest accuracy in the all top
corroborated answer rank, having 92.42% at top-5 rank and 67.30% at top-1 with result
depth K=20. Regular expression only managed a PerCorrect percentage of 38.86% at top-
1 rank and 48.82% at top-5 rank, improving only 10% in accuracy from top-1 to top-5.
The trends of both techniques were different. Keyword matching technique increased
drastically from top 1 answers to top 2 answers by approximately 16%. On the other hand,
regular expression technique only managed to increase close to 7%. For top 2 to top 5
answers, increase in accuracy for keywords improved gradually in each step unlike
regular expressions that increased only by 3%.
Table 4.5 also shows the MRR results for the sentence matching method and its
techniques. The difference between the two techniques is 0.347; keyword matching
secured the highest MRR value of 0.778, which is the largest difference encountered
between any two techniques during the evaluation. The keyword technique MRR score is
between 1 and 0.50, showing, on the average, it should be able to fetch the correct answer
at top-1 or top-2, whereas regular expression technique accuracy lies between top-2 and
top-3 corroborated answer ranks.
Sentence matching, using keywords technique, achieved higher accuracy than other
techniques at all top answer ranks. The keywords technique was able to achieve a higher
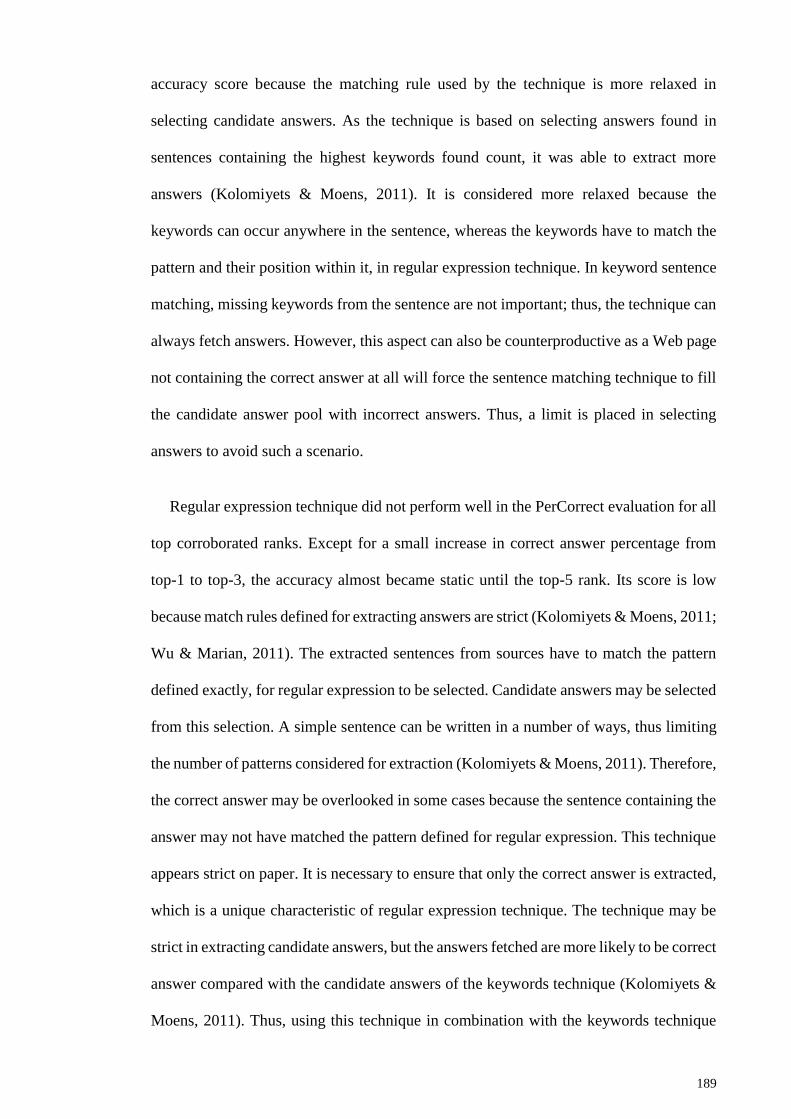
189
accuracy score because the matching rule used by the technique is more relaxed in
selecting candidate answers. As the technique is based on selecting answers found in
sentences containing the highest keywords found count, it was able to extract more
answers (Kolomiyets & Moens, 2011). It is considered more relaxed because the
keywords can occur anywhere in the sentence, whereas the keywords have to match the
pattern and their position within it, in regular expression technique. In keyword sentence
matching, missing keywords from the sentence are not important; thus, the technique can
always fetch answers. However, this aspect can also be counterproductive as a Web page
not containing the correct answer at all will force the sentence matching technique to fill
the candidate answer pool with incorrect answers. Thus, a limit is placed in selecting
answers to avoid such a scenario.
Regular expression technique did not perform well in the PerCorrect evaluation for all
top corroborated ranks. Except for a small increase in correct answer percentage from
top-1 to top-3, the accuracy almost became static until the top-5 rank. Its score is low
because match rules defined for extracting answers are strict (Kolomiyets & Moens, 2011;
Wu & Marian, 2011). The extracted sentences from sources have to match the pattern
defined exactly, for regular expression to be selected. Candidate answers may be selected
from this selection. A simple sentence can be written in a number of ways, thus limiting
the number of patterns considered for extraction (Kolomiyets & Moens, 2011). Therefore,
the correct answer may be overlooked in some cases because the sentence containing the
answer may not have matched the pattern defined for regular expression. This technique
appears strict on paper. It is necessary to ensure that only the correct answer is extracted,
which is a unique characteristic of regular expression technique. The technique may be
strict in extracting candidate answers, but the answers fetched are more likely to be correct
answer compared with the candidate answers of the keywords technique (Kolomiyets &
Moens, 2011). Thus, using this technique in combination with the keywords technique
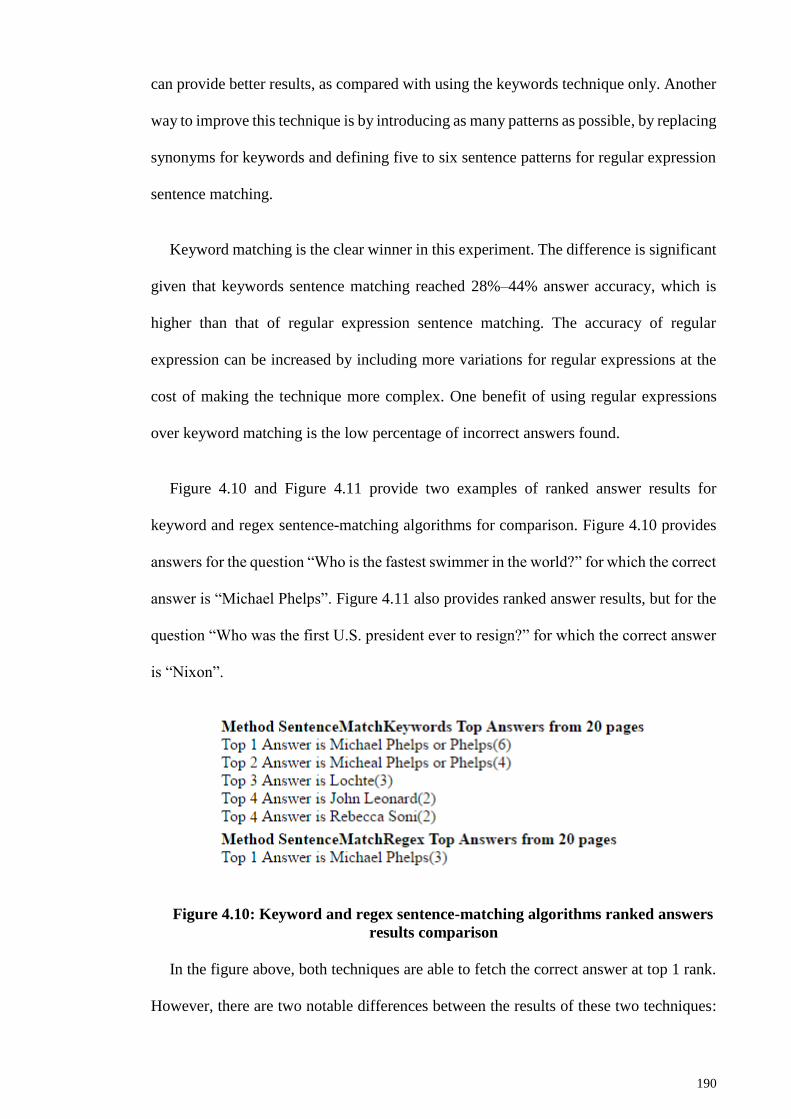
190
can provide better results, as compared with using the keywords technique only. Another
way to improve this technique is by introducing as many patterns as possible, by replacing
synonyms for keywords and defining five to six sentence patterns for regular expression
sentence matching.
Keyword matching is the clear winner in this experiment. The difference is significant
given that keywords sentence matching reached 28%–44% answer accuracy, which is
higher than that of regular expression sentence matching. The accuracy of regular
expression can be increased by including more variations for regular expressions at the
cost of making the technique more complex. One benefit of using regular expressions
over keyword matching is the low percentage of incorrect answers found.
Figure 4.10 and Figure 4.11 provide two examples of ranked answer results for
keyword and regex sentence-matching algorithms for comparison. Figure 4.10 provides
answers for the question “Who is the fastest swimmer in the world?” for which the correct
answer is “Michael Phelps”. Figure 4.11 also provides ranked answer results, but for the
question “Who was the first U.S. president ever to resign?” for which the correct answer
is “Nixon”.
Figure 4.10: Keyword and regex sentence-matching algorithms ranked answers
results comparison
In the figure above, both techniques are able to fetch the correct answer at top 1 rank.
However, there are two notable differences between the results of these two techniques:
191
1) difference in frequency scores for the same answer, and 2) number of candidate
answers found. Though keyword sentence-matching algorithm is able to find more
occurrences of the answer Michael Phelps, it also fetched candidate answers that are
incorrect answers to the question. On the other hand, regex sentence-matching algorithm
is able to fetch the correct answer “Michael Phelps” only, despite being unable to find
many occurrences of it. However, not being able to find all occurrences of the correct
answer, due to limited regex patterns, can prove troublesome in other questions, which is
highlighted in the example shown in Figure 4.11.
Figure 4.11: Keyword and regex sentence-matching algorithms ranked answers
results comparison
Figure 4.11 shows ranked answer results for both techniques. In this example, not only
is the keywords sentence-matching algorithm able to find the correct answer, but is able
to find many occurrences of it also, allowing the answer to receive a high score. On the
other hand, regex sentence-matching technique is not able to find any answers at all. This
is because regex sentence-matching algorithm is not able to find any sentences matching
the regex patterns used by this technique.
This method greatly benefits from the use of information from external resources. By
expanding the list of keywords to be matched against, sentence matching techniques have
a better chance of finding sentences that are likely to contain the correct answer. The
information source type also plays an important role here. If Web pages are considered,
the method has more room for finding candidate answers. On the other hand, restricting
192
the method to snippets only reduces the number of candidate answers. Web pages provide
more space for sentence matching method to find the correct answer, whereas in snippets
it completely relies on extracting answers from limited content shown by snippets.
Moreover, knowing the number of answers being considered for fetching answers is
important. An adequate balance is necessary for setting the value for N. Keeping it too
low may result in skipping the correct candidate answers, but setting the value too high
will attract incorrect answers into the candidate answers pool. Lastly, the NER method
can affect the accuracy of sentence matching method as well. An entity that is not detected
by the NER method is ignored by the sentence-matching algorithm, and thus the answer
accuracy of the method is decreased.
Keyword sentence matching produces higher answer accuracy than regular expression
sentence matching. However, it fetches many answers, including incorrect ones, and thus
creates noise. This problem is ideally addressed by using a combination of both keyword
and regular expression sentence matching techniques, that is, applying regular expression
sentence matching and then keyword sentence matching in case no matches are found.
In conclusion, keywords sentence matching algorithm achieved much better results
than regular expressions in both PerCorrect and MRR results. However, regular
expression can still be used in combination with keywords technique, as an answer
captured by regular expression technique has a very high percentage chance of being
correct.
4.1.6 Analysis of selecting top N sentences method
Figure 4.12 shows PerCorrect and Table 4.6 shows PerCorrect and MRR results for this
method, using different values for top sentences matched N (1, 3 or 5), that is, the number
of sentences selected for fetching answers.
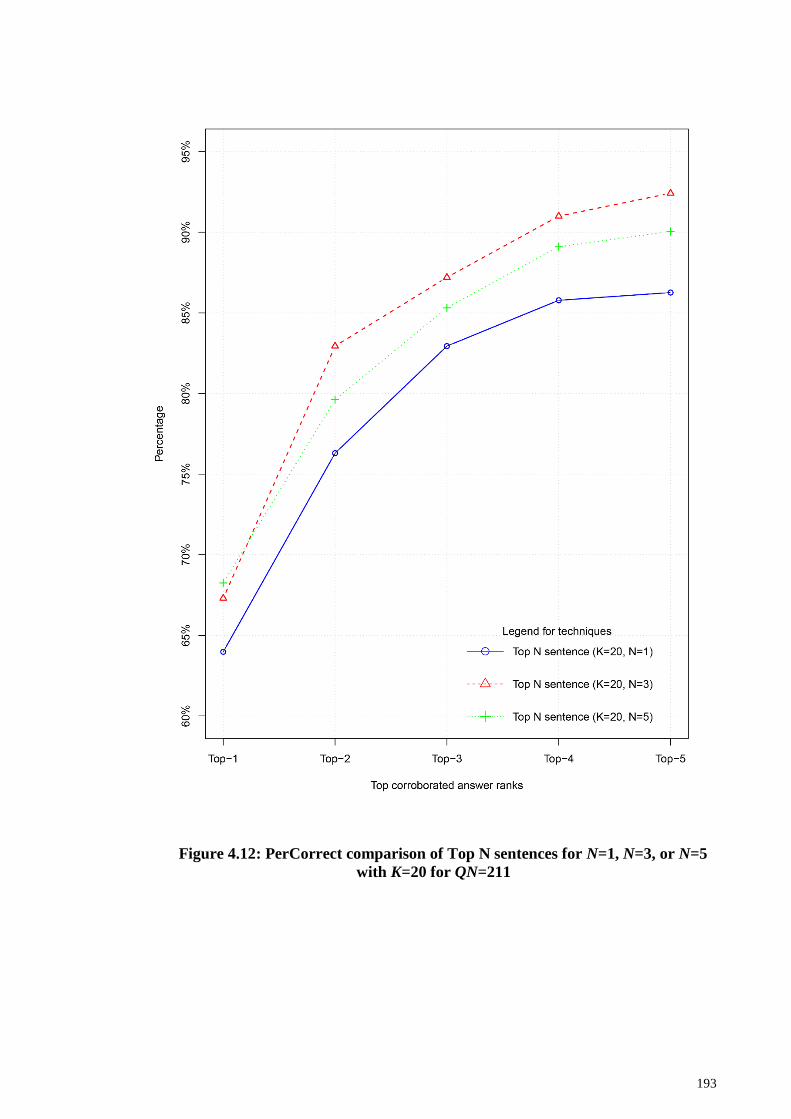
193
Figure 4.12: PerCorrect comparison of Top N sentences for N=1, N=3, or N=5
with K=20 for QN=211
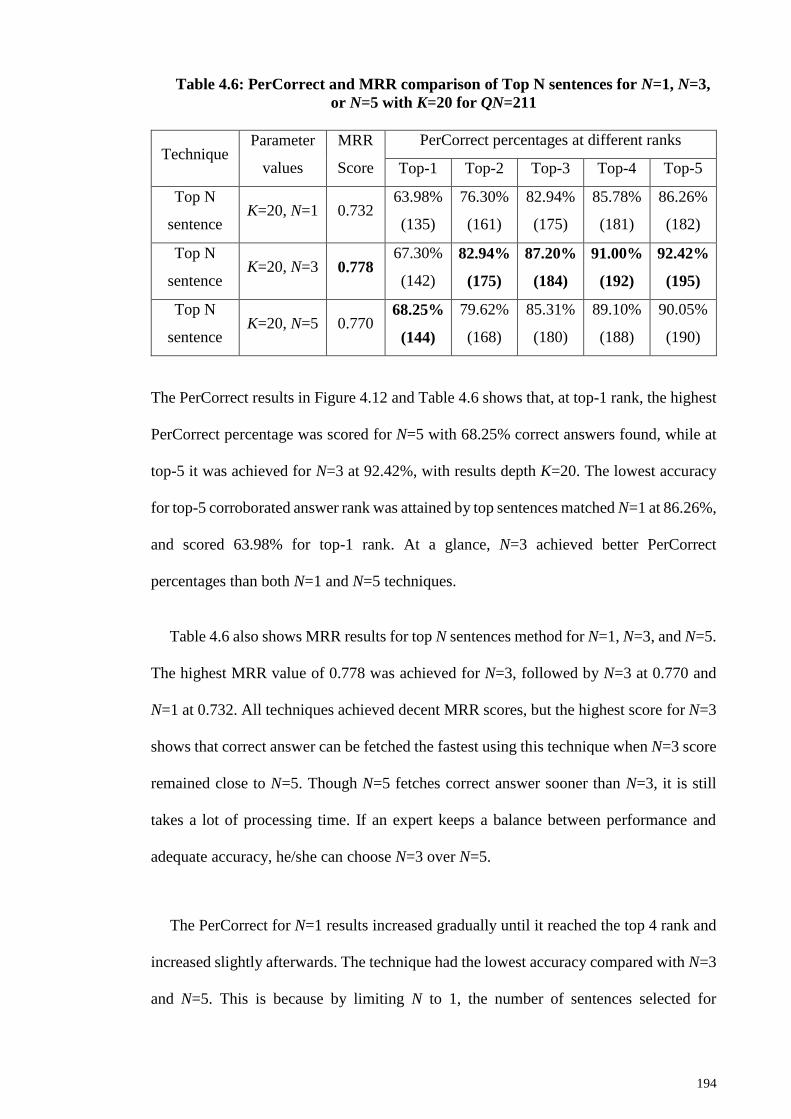
194
Table 4.6: PerCorrect and MRR comparison of Top N sentences for N=1, N=3,
or N=5 with K=20 for QN=211
Technique Parameter
values
MRR
Score
PerCorrect percentages at different ranks
Top-1 Top-2 Top-3 Top-4 Top-5
Top N
sentence K=20, N=1 0.732
63.98%
(135)
76.30%
(161)
82.94%
(175)
85.78%
(181)
86.26%
(182)
Top N
sentence K=20, N=3 0.778
67.30%
(142)
82.94%
(175)
87.20%
(184)
91.00%
(192)
92.42%
(195)
Top N
sentence K=20, N=5 0.770
68.25%
(144)
79.62%
(168)
85.31%
(180)
89.10%
(188)
90.05%
(190)
The PerCorrect results in Figure 4.12 and Table 4.6 shows that, at top-1 rank, the highest
PerCorrect percentage was scored for N=5 with 68.25% correct answers found, while at
top-5 it was achieved for N=3 at 92.42%, with results depth K=20. The lowest accuracy
for top-5 corroborated answer rank was attained by top sentences matched N=1 at 86.26%,
and scored 63.98% for top-1 rank. At a glance, N=3 achieved better PerCorrect
percentages than both N=1 and N=5 techniques.
Table 4.6 also shows MRR results for top N sentences method for N=1, N=3, and N=5.
The highest MRR value of 0.778 was achieved for N=3, followed by N=3 at 0.770 and
N=1 at 0.732. All techniques achieved decent MRR scores, but the highest score for N=3
shows that correct answer can be fetched the fastest using this technique when N=3 score
remained close to N=5. Though N=5 fetches correct answer sooner than N=3, it is still
takes a lot of processing time. If an expert keeps a balance between performance and
adequate accuracy, he/she can choose N=3 over N=5.
The PerCorrect for N=1 results increased gradually until it reached the top 4 rank and
increased slightly afterwards. The technique had the lowest accuracy compared with N=3
and N=5. This is because by limiting N to 1, the number of sentences selected for
195
extracting candidate answers is lowered. The findings indicate that this affects accuracy
in a negative way thus sentences likely to contain the correct answers get omitted in this
way. Moreover, accuracy that becomes almost static at the end indicates less room for
improvement given that only a few answers are beyond the top-5 rank.
When changing N to 3, the technique performed considerably better than for N=1. It
continuously and gradually increased until top-5 rank. The technique was able to score
the highest accuracy at all top answer ranks except at top-1 rank. The gradual increase
indicates that a moderate number of candidate answers are extracted by setting N=3; the
candidate answers may include the correct answer. The balance between performance and
accuracy can be maintained by keeping N=3. The technique was not able to secure the
highest accuracy but was still able to achieve decent accuracy using half of the sentences
used for N=5.
When considering five sentences for the top N sentence selection, the technique had
the highest accuracy at top-1 rank. It also rose steadily until it reached rank 4, after which
only a small increase occurred. The technique was not able to secure highest accuracy at
all ranks, and the number of candidate answers considered was almost double than that
of N=3, thus making the technique attract more incorrect answers. Hence, the processing
may be ignored with regards to accuracy as the technique is good in terms of accuracy
for higher ranks such as top-1 corroborated answer rank.
The results showed that top sentences for N=3 technique was ahead in terms of
accuracy between the top-2 and top-5 corroborated answer ranks. In comparison, only
N=5 managed to secure higher accuracy at N=3 at top-1 rank, but had lower accuracy in
the remaining ranks. Sentences matched N=1 had lower accuracy than both N=3 and N=5.
In terms of processing time, N=5 requires more time to process queries since number of
196
sentences used for extracting sentences is being increased. Therefore, the value for N can
be set lower if maintaining a balance between accuracy and performance is desired.
Figure 4.13 shows an example of rank answer results comparison between Top N
sentences techniques, for the question “What is the name of the managing director of
Apricot Computer?” with correct answer “Peter Horne”.
Figure 4.13: Top N Sentence for N=1, 3, 5 ranked answer results comparison
The figure shows results for Top N = 1, 3 and 5 sentence selection techniques. For
N=1, though the technique was able to find the correct answer at rank, yet it had to share
its rank with another candidate answer making it unclear which one of them is the correct
answer. Additionally, the total candidate answers returned by N=1 sentence match
technique were less as compared to the other two techniques. For N=3, the frequency
score of the answer Peter Horne increased, making it clear that it is the correct answer.
Similarly, N=5 increased its score further. This shows that N=3 is able to provide the
correct answer more prominently over N=1, while at the same time requires less sentences
to reach that conclusion.
The experiment was performed on Web pages because snippets only contained a few
sentences and did not completely show the effect of increase and decrease of value of the
top sentences matched N. In sentence matching method, the rule used to identify a
sentence that contains a candidate answer determines the sentences to be selected.
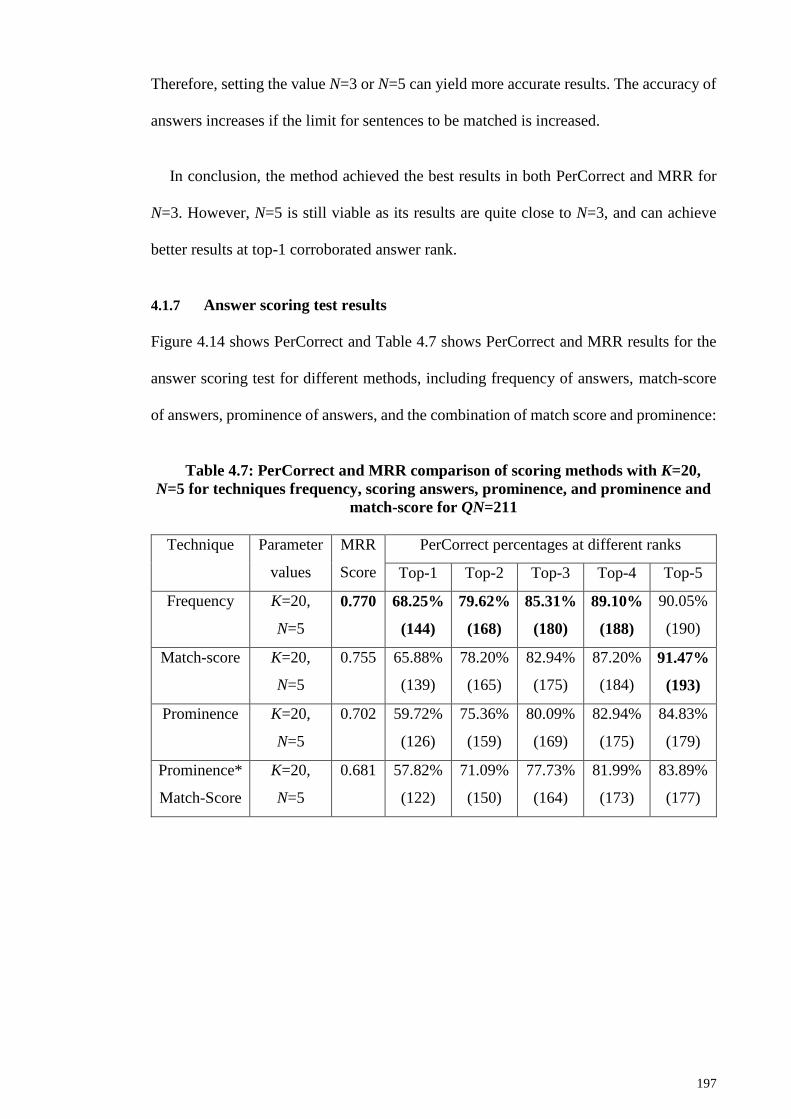
197
Therefore, setting the value N=3 or N=5 can yield more accurate results. The accuracy of
answers increases if the limit for sentences to be matched is increased.
In conclusion, the method achieved the best results in both PerCorrect and MRR for
N=3. However, N=5 is still viable as its results are quite close to N=3, and can achieve
better results at top-1 corroborated answer rank.
4.1.7 Answer scoring test results
Figure 4.14 shows PerCorrect and Table 4.7 shows PerCorrect and MRR results for the
answer scoring test for different methods, including frequency of answers, match-score
of answers, prominence of answers, and the combination of match score and prominence:
Table 4.7: PerCorrect and MRR comparison of scoring methods with K=20,
N=5 for techniques frequency, scoring answers, prominence, and prominence and
match-score for QN=211
Technique Parameter
values
MRR
Score
PerCorrect percentages at different ranks
Top-1 Top-2 Top-3 Top-4 Top-5
Frequency K=20,
N=5
0.770 68.25%
(144)
79.62%
(168)
85.31%
(180)
89.10%
(188)
90.05%
(190)
Match-score K=20,
N=5
0.755 65.88%
(139)
78.20%
(165)
82.94%
(175)
87.20%
(184)
91.47%
(193)
Prominence K=20,
N=5
0.702 59.72%
(126)
75.36%
(159)
80.09%
(169)
82.94%
(175)
84.83%
(179)
Prominence*
Match-Score
K=20,
N=5
0.681 57.82%
(122)
71.09%
(150)
77.73%
(164)
81.99%
(173)
83.89%
(177)

198
Figure 4.14: PerCorrect comparison of scoring methods with K=20, N=5 for
techniques frequency, scoring answers, prominence, and prominence and match-
score for QN=211
The PerCorrect results in Figure 4.14 and Table 4.7 show that frequency and match-
score scoring techniques achieve higher percentages than other techniques. While
frequency technique achieved the highest percentages between top-1 and top-4
corroborated ranks, yet the highest accuracy at top-5 was achieved by match score with a
value of 91.47%, while frequency score achieved 90.05% instead. The lowest was scored
199
by the combination of match score and prominence technique in all corroborated ranks,
with the lowest recorded at 57.82% for the top-1 corroborated answer rank.
Table 4.7 also shows MRR comparison of the scoring methods. The highest MRR at
0.770 was scored by frequency technique, followed by match score technique at 0.755.
Again, frequency techniques gains upper hand in MRR as well, making it ideal for
fetching correct answers quicker compared to other techniques. The combination of
prominence and match score scored the lowest at 0.681. The MRR results tend to agree
with the PerCorrect findings, thus indicating that the correct answer is fetched early by
the frequency or match score technique.
Frequency scoring technique is easy to implement and is quite effective in achieving
decent accuracy. One of the possibilities of the technique that makes it obtain higher
accuracy than the other techniques is that the top answers generated have a few cases only
in which the frequencies of the two answers are quite close or almost equal. If such a
scenario occurs, match score and prominence technique can assist in distinguishing the
better one between the two answers.
Match score also performed considerably well compared with prominence and the
combination of prominence and match score technique. It did not achieve higher accuracy
than the frequency technique, but it maintained a close score in most ranks as it increased
gradually. The technique was able to surpass the accuracy of frequency technique at the
top-5 rank, thus showing the potential of the technique. Match score answers are effective
when scoring answers based on a sentence from which the answer is found and when
distinguishing the scores of two answers that may be equal in terms of frequency. The
formula used for generating a match score for the answers is simple (i.e., it only uses the
number of keywords found in the sentence). Accuracy can be increased even higher by
200
considering more factors for generating match score, including frequency of the answer,
because it already has decent accuracy.
Prominence scoring technique and its combination with the match score technique had
the lowest accuracy in all top answer ranks. The concept behind prominence is good, but
the chances of having more than one candidate answers in a sentence are less. Considering
prominence alone tends to lower the score of correct answers that may have been placed
poorly in the sentence but have the sole answer in the sentence. Therefore, the prominence
score should only be considered when dealing with two or more answers in a sentence
and as a factor for distinguishing the better answers from the available pool. The low
score of the combination of prominence and match score technique could be due to low
score of the prominence technique.
Figure 4.15 shows sample results for the four scoring techniques for question “Who
leads the star ship Enterprise in Star Trek?” of answer “Captain Kirk or Jim Kirk”.

201
Figure 4.15: Frequency, match-score, prominence and prominence*match-score
scoring techniques ranked answer results comparison
In the figure, top 5 answers from each scoring technique including frequency, match-
score, prominence, and prominence*match-score are listed. Starting with frequency
scoring technique, though it is able to rank the correct answer at rank 1, yet the rank is
shared with another candidate answer making it unclear which one of them is correct. On
the other hand, the scores assigned by match-score technique show a clear difference
between the top two answers, making it apparent that the correct answer is Jim Kirk. This
shows that match-score of answers can be looked into if frequency of two answers is the
same. Moving forward to prominence technique, the correct answer Jim Kirk moved
down to rank 2, and another candidate answer Albert Einstein, which is not even included
in top 5 answers for frequency and match-score techniques, is placed at top 1 rank.
Though, prominence*match-score technique also managed to place Jim Kirk at top 1
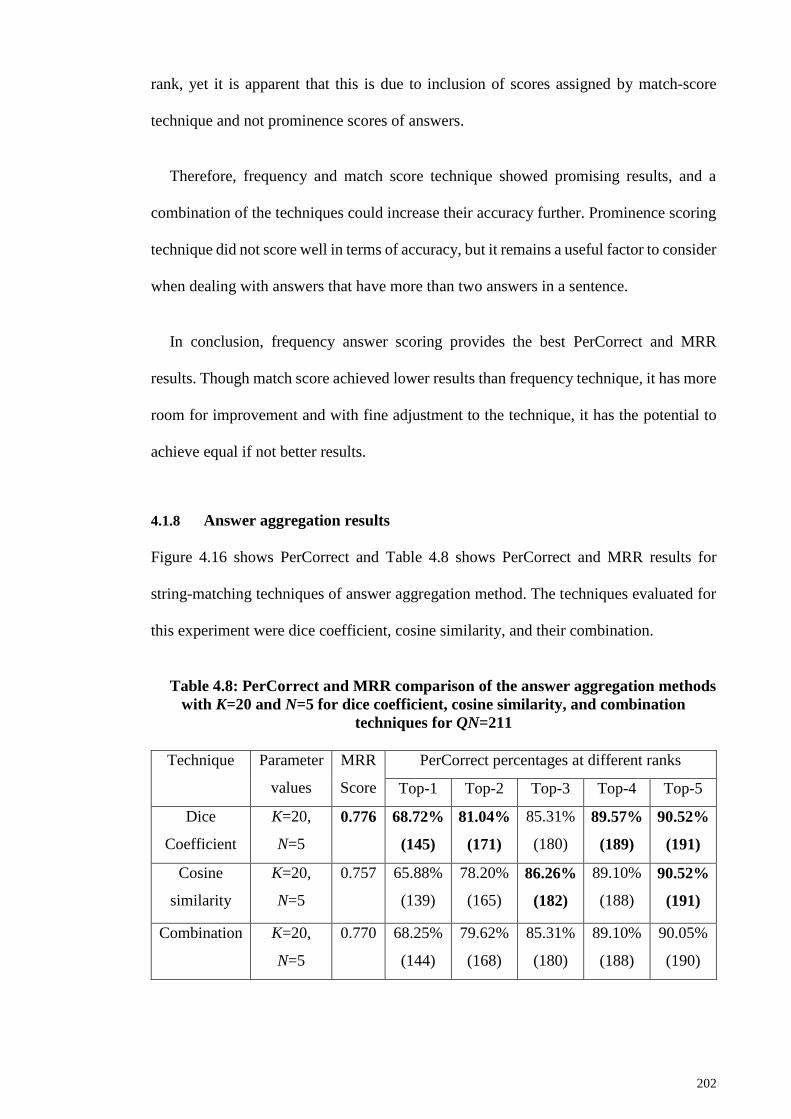
202
rank, yet it is apparent that this is due to inclusion of scores assigned by match-score
technique and not prominence scores of answers.
Therefore, frequency and match score technique showed promising results, and a
combination of the techniques could increase their accuracy further. Prominence scoring
technique did not score well in terms of accuracy, but it remains a useful factor to consider
when dealing with answers that have more than two answers in a sentence.
In conclusion, frequency answer scoring provides the best PerCorrect and MRR
results. Though match score achieved lower results than frequency technique, it has more
room for improvement and with fine adjustment to the technique, it has the potential to
achieve equal if not better results.
4.1.8 Answer aggregation results
Figure 4.16 shows PerCorrect and Table 4.8 shows PerCorrect and MRR results for
string-matching techniques of answer aggregation method. The techniques evaluated for
this experiment were dice coefficient, cosine similarity, and their combination.
Table 4.8: PerCorrect and MRR comparison of the answer aggregation methods
with K=20 and N=5 for dice coefficient, cosine similarity, and combination
techniques for QN=211
Technique Parameter
values
MRR
Score
PerCorrect percentages at different ranks
Top-1 Top-2 Top-3 Top-4 Top-5
Dice
Coefficient
K=20,
N=5
0.776 68.72%
(145)
81.04%
(171)
85.31%
(180)
89.57%
(189)
90.52%
(191)
Cosine
similarity
K=20,
N=5
0.757 65.88%
(139)
78.20%
(165)
86.26%
(182)
89.10%
(188)
90.52%
(191)
Combination K=20,
N=5
0.770 68.25%
(144)
79.62%
(168)
85.31%
(180)
89.10%
(188)
90.05%
(190)
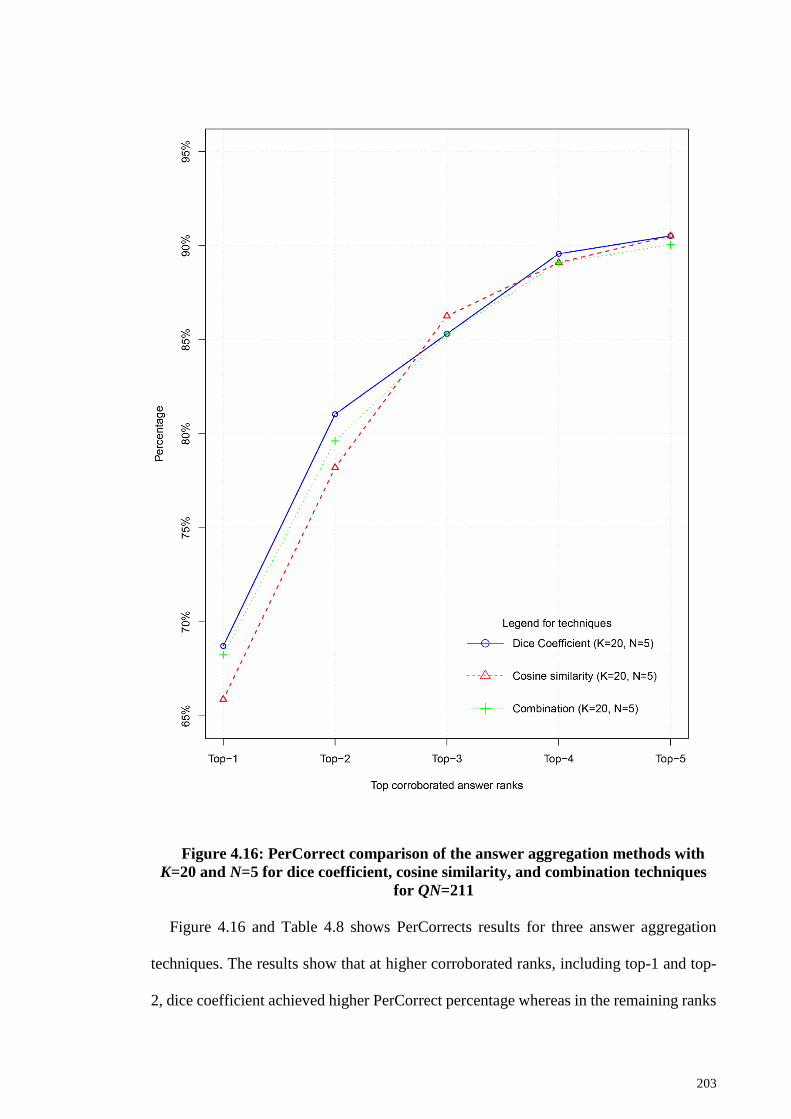
203
Figure 4.16: PerCorrect comparison of the answer aggregation methods with
K=20 and N=5 for dice coefficient, cosine similarity, and combination techniques
for QN=211
Figure 4.16 and Table 4.8 shows PerCorrects results for three answer aggregation
techniques. The results show that at higher corroborated ranks, including top-1 and top-
2, dice coefficient achieved higher PerCorrect percentage whereas in the remaining ranks
204
the percentages were pretty even with the other answer aggregation techniques. Dice
coefficient and cosine similarity achieved the highest accuracy score of 90.52% for the
top-5 corroborated answer rank, while combination of the two techniques scored 90.05 at
the same rank. At top-1 Dice coefficient had the highest PerCorrect percentage of 68.72%
while cosine coefficient scored the lowest with 65.88%.
Table 4.8 also shows MRR results for answer aggregation techniques. Dice coefficient
achieved the highest MRR with 0.776, and cosine similarity scored the lowest at 0.757.
The MRR results show a unique aspect of the results compared with the PerCorrect
results. Combination of the two string similarity techniques was unable to achieve the
highest accuracy at any of the PerCorrect results, but it remains a viable technique. Hence,
it is a viable technique for achieving correct answers quickly.
Dice coefficient achieved high accuracy in almost all top answer ranks except top 3.
The difference between dice coefficient technique and cosine similarity was significant
at higher ranks. The combination of both the techniques was the only technique that came
close to dice coefficient. The pattern for the results shows a steady increase until the top-
4 corroborated answer rank, and the increase from top-4 to top-5 rank was merely 1%.
Dice coefficient provides higher accuracy results than the other techniques by a decent
margin at higher ranks and by a minor margin at lower ranks. It obtained higher accuracy
than cosine similarity because most of the candidate answers found were single words.
Dice coefficient technique provides more accurate results when dealing with single-word
names than cosine similarity.
The trend followed by cosine similarity results was nearly identical to that of dice
coefficient, except that the cosine similarity results scored lower at higher ranks but
redeemed itself by scoring the highest at the top-3 and top-5 ranks. The technique did not
perform as good as the dice coefficient because it performs better for names that contain
205
more than one word (Wu & Marian, 2011). This attribute is unique and useful, but the
frequency of such candidate answers was lower than that of singular names.
The trend followed by the combination of two string-matching techniques was similar
to the trend found in the individual techniques. The combination of two techniques
performed moderately. The technique was expected to score higher than the individual
techniques. The combination showed high accuracy at high ranks for cosine similarity;
this was not the case at the lower ranks because the accuracy was either identical to one
of the techniques or lower.
Dice coefficient scored high accuracy results for top-1 and top-2 corroborated answer
ranks, followed closely by the combination of dice coefficient and cosine similarity.
However, the combination of both techniques was on a par with the dice coefficient at the
later stages. Cosine similarity scored relatively low in the first two top answers and then
jumped to be on a par with its competitors. The difference was noticeable for the top-1
and top-2 corroborated answer rank, but the accuracy results became almost equal for the
remaining top answers. Therefore, both dice coefficient and the combination of the two
techniques provide higher accuracy results than cosine similarity.
When evaluating these two techniques in initial testing, it was observed that cosine
similarity more accurately handled candidate answers, which consist of two or more
words, whereas dice coefficient showed improved results when dealing with candidate
answers, which contain one word only. Two scenarios were evaluated in the initial testing
for string matching. In the first scenario, the string “Alexey Arkhipovich Leonov” was
compared with “Alexey Leonov,” as both strings represent the same person. For this
comparison, the dice coefficient returned a value of 0.66, whereas cosine similarity
returned .81. Thus, dice coefficient indicated that it is not a match, but cosine similarity
indicated that it is. In the second scenario, the string “Alexey Leonov” was compared
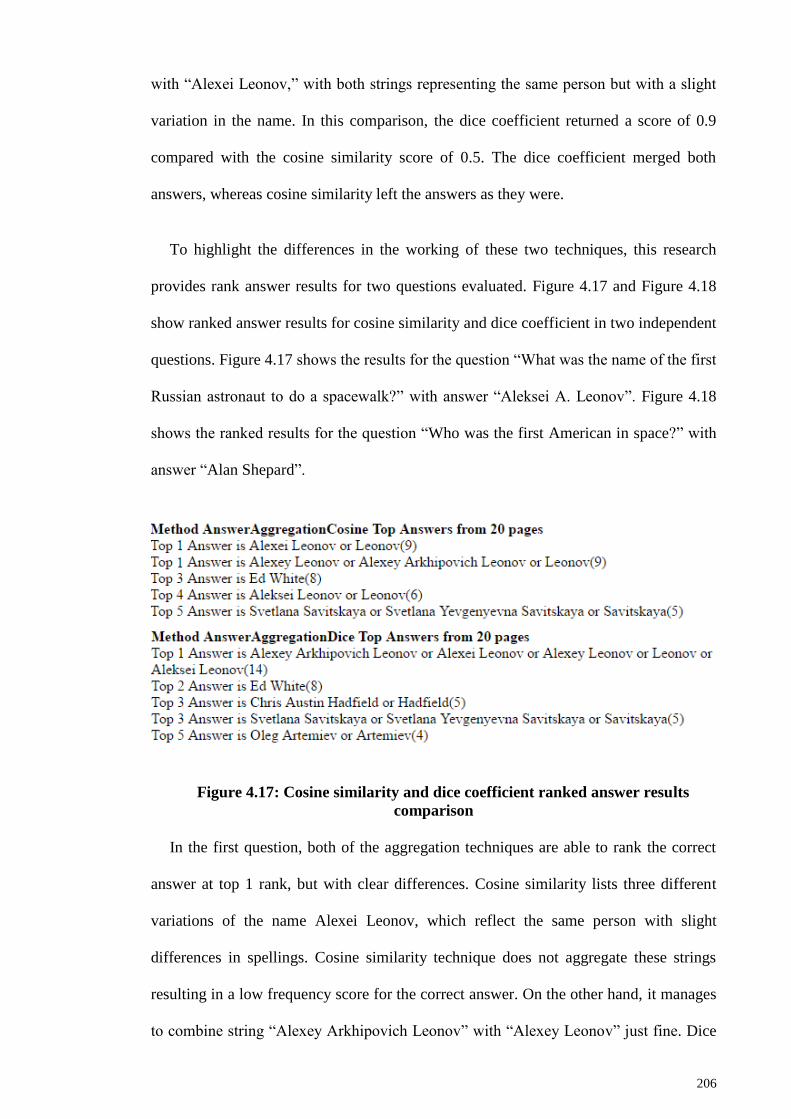
206
with “Alexei Leonov,” with both strings representing the same person but with a slight
variation in the name. In this comparison, the dice coefficient returned a score of 0.9
compared with the cosine similarity score of 0.5. The dice coefficient merged both
answers, whereas cosine similarity left the answers as they were.
To highlight the differences in the working of these two techniques, this research
provides rank answer results for two questions evaluated. Figure 4.17 and Figure 4.18
show ranked answer results for cosine similarity and dice coefficient in two independent
questions. Figure 4.17 shows the results for the question “What was the name of the first
Russian astronaut to do a spacewalk?” with answer “Aleksei A. Leonov”. Figure 4.18
shows the ranked results for the question “Who was the first American in space?” with
answer “Alan Shepard”.
Figure 4.17: Cosine similarity and dice coefficient ranked answer results
comparison
In the first question, both of the aggregation techniques are able to rank the correct
answer at top 1 rank, but with clear differences. Cosine similarity lists three different
variations of the name Alexei Leonov, which reflect the same person with slight
differences in spellings. Cosine similarity technique does not aggregate these strings
resulting in a low frequency score for the correct answer. On the other hand, it manages
to combine string “Alexey Arkhipovich Leonov” with “Alexey Leonov” just fine. Dice
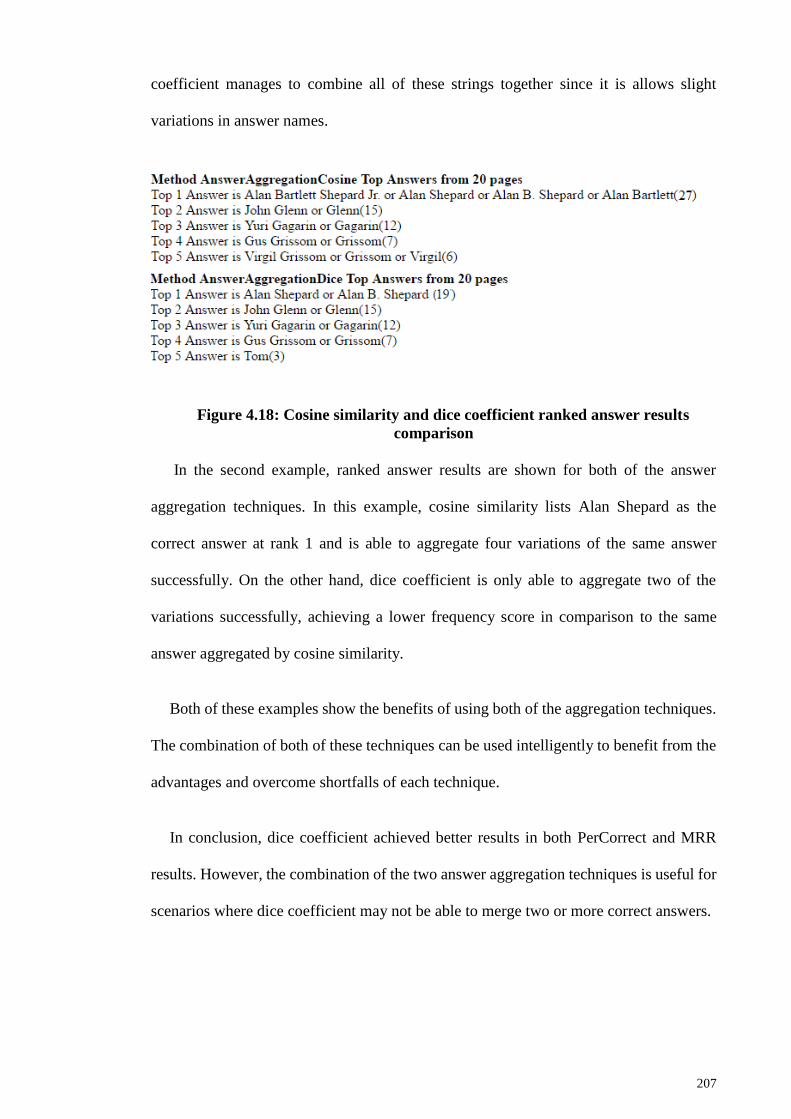
207
coefficient manages to combine all of these strings together since it is allows slight
variations in answer names.
Figure 4.18: Cosine similarity and dice coefficient ranked answer results
comparison
In the second example, ranked answer results are shown for both of the answer
aggregation techniques. In this example, cosine similarity lists Alan Shepard as the
correct answer at rank 1 and is able to aggregate four variations of the same answer
successfully. On the other hand, dice coefficient is only able to aggregate two of the
variations successfully, achieving a lower frequency score in comparison to the same
answer aggregated by cosine similarity.
Both of these examples show the benefits of using both of the aggregation techniques.
The combination of both of these techniques can be used intelligently to benefit from the
advantages and overcome shortfalls of each technique.
In conclusion, dice coefficient achieved better results in both PerCorrect and MRR
results. However, the combination of the two answer aggregation techniques is useful for
scenarios where dice coefficient may not be able to merge two or more correct answers.

208
4.1.9 Web-based QA methods and techniques analysis
Evaluation results for Web-based QA systems methods and techniques, shown in Section
4.1, highlight research techniques, or combination of them, performing better than others
with respect to PerCorrect and MRR evaluation metrics. Table 4.9 shows summary of
these findings, which consist of three columns, including module name, method name
and summary of the evaluation results for that method. This research evaluated methods
and techniques under Web-based QA systems module including 1) question analysis, 2)
answer extraction, 3) answer scoring, and 4) answer aggregation which are discussed
below:
Table 4.9: Evaluation results summary for Web-based QA systems methods and
techniques
Module Method Summary
Answer
extraction
TopK search
results
selection
Web pages had higher accuracy overall, whereas
snippets performed better while dealing with Top1
answer only. Web pages also achieved better results
for K=10, while snippets performed better for K=20.
Information
from external
resources
Inclusion of Google and WordNet keywords improved
answer accuracy over not using any external resources
NER Difference between the NERs results was almost
negligible, though combined NER seems better as it
avoids situations where an entity may not be detected
Removal of
unwanted
answers
Removing unwanted answers played a vital role in
improving accuracy of answers, both at higher and
low corroborated answer ranks
Sentence-
matching
algorithm
Keywords sentence-matching provided a much higher
accuracy compared to regex. Regex require writing of
additional rules to be effective.
Selecting
TopN
sentences
Sentences matched N=3 produced highest answer
accuracy, though N=5 can also be considered where
the focus is towards top 1 answer only.
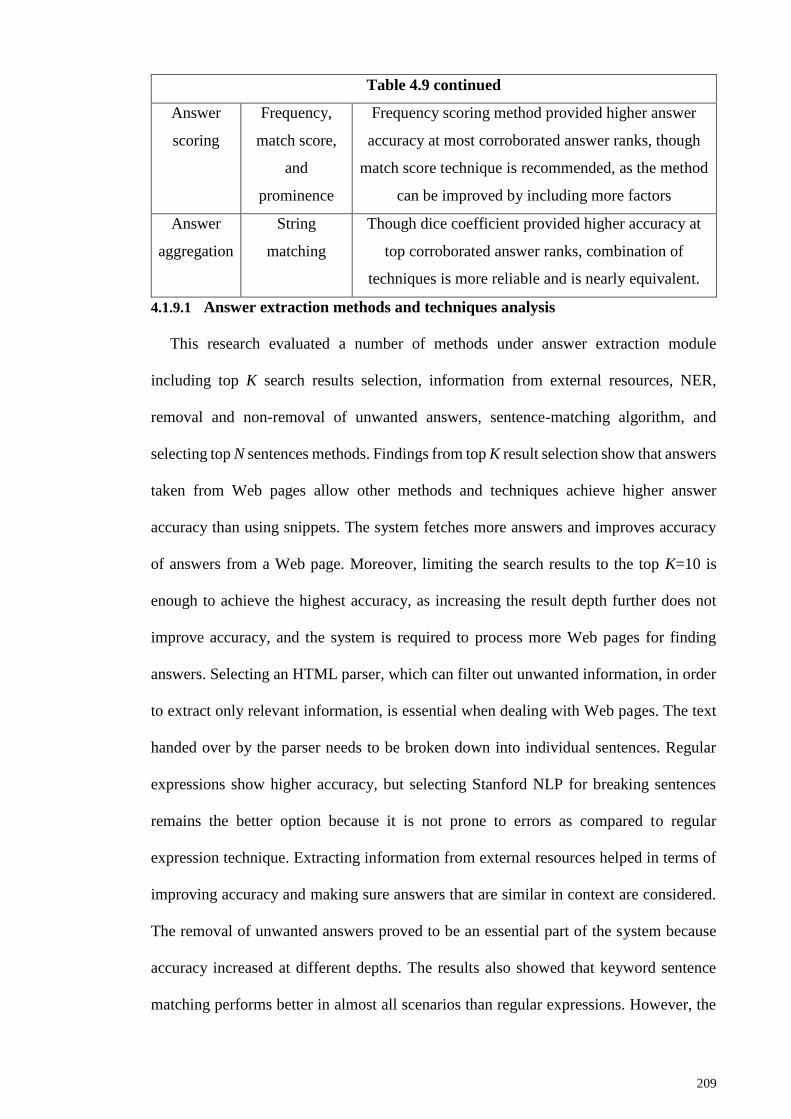
209
Table 4.9 continued
Answer
scoring
Frequency,
match score,
and
prominence
Frequency scoring method provided higher answer
accuracy at most corroborated answer ranks, though
match score technique is recommended, as the method
can be improved by including more factors
Answer
aggregation
String
matching
Though dice coefficient provided higher accuracy at
top corroborated answer ranks, combination of
techniques is more reliable and is nearly equivalent.
4.1.9.1 Answer extraction methods and techniques analysis
This research evaluated a number of methods under answer extraction module
including top K search results selection, information from external resources, NER,
removal and non-removal of unwanted answers, sentence-matching algorithm, and
selecting top N sentences methods. Findings from top K result selection show that answers
taken from Web pages allow other methods and techniques achieve higher answer
accuracy than using snippets. The system fetches more answers and improves accuracy
of answers from a Web page. Moreover, limiting the search results to the top K=10 is
enough to achieve the highest accuracy, as increasing the result depth further does not
improve accuracy, and the system is required to process more Web pages for finding
answers. Selecting an HTML parser, which can filter out unwanted information, in order
to extract only relevant information, is essential when dealing with Web pages. The text
handed over by the parser needs to be broken down into individual sentences. Regular
expressions show higher accuracy, but selecting Stanford NLP for breaking sentences
remains the better option because it is not prone to errors as compared to regular
expression technique. Extracting information from external resources helped in terms of
improving accuracy and making sure answers that are similar in context are considered.
The removal of unwanted answers proved to be an essential part of the system because
accuracy increased at different depths. The results also showed that keyword sentence
matching performs better in almost all scenarios than regular expressions. However, the
210
combination of regular expressions and keyword matching can be used to ensure that only
the correct answer is extracted and answers that increase noise only are ignored. Finally,
the results suggest that the highest accuracy was achieved when limiting the number of
sentences to N=3 for answer selection, but adequate answer accuracy can still be achieved
for top sentences matched N=5.
4.1.9.2 Answer scoring methods and techniques analysis
Four methods were evaluated under the answer scoring module. Scoring answers using
frequency showed the highest accuracy achieved for answers, and it was closely followed
by scoring answers using the answer’s match score. Improvement is needed when
considering match scores because it is dependent on the technique used for selecting the
top N sentences matched. Scoring answers using prominence of an answer within a
sentence and the combination of prominence and match score had the least accuracy.
4.1.9.3 Answer aggregation methods and techniques analysis
Under answer aggregation module, this research evaluated string-matching
algorithms. The results show that dice coefficient had the highest accuracy. However, this
study recommends using the combination of dice coefficient and cosine similarity
because both techniques perform well under different circumstances.
Results for OMQA system vs baseline systems
This sub-section shows PerCorrect and MRR results generated for OMQA system vs
baseline systems and analysis from the results.
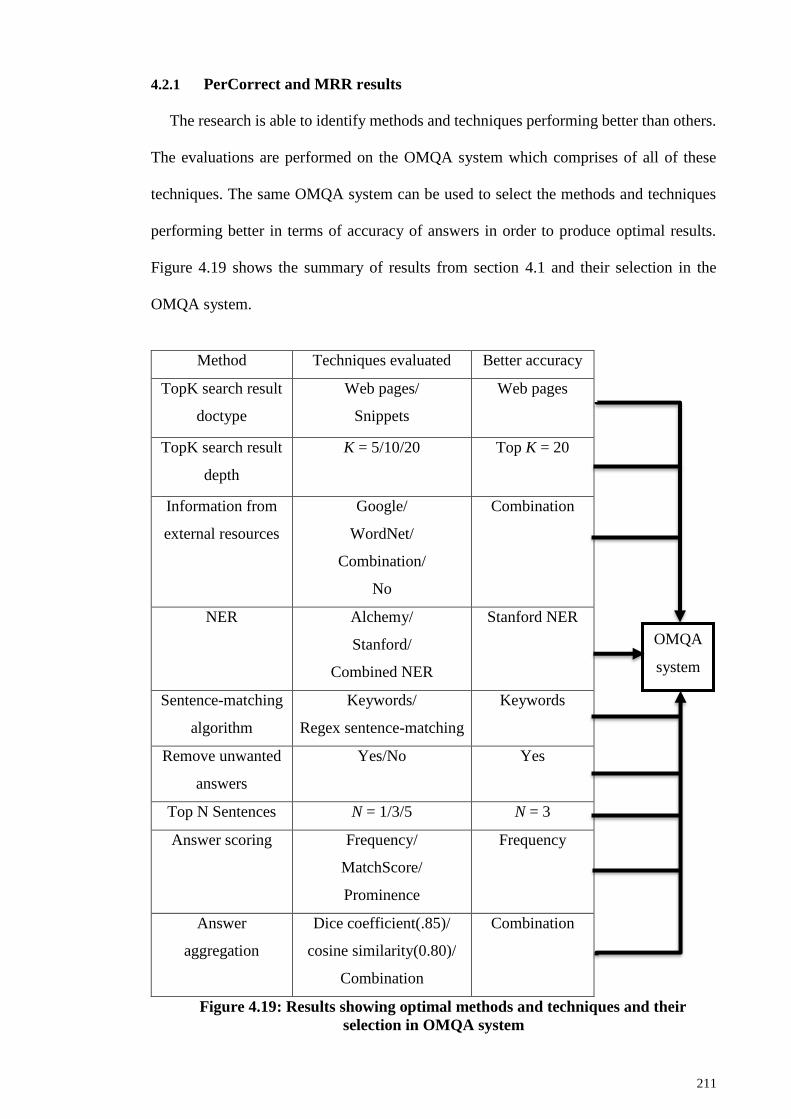
211
4.2.1 PerCorrect and MRR results
The research is able to identify methods and techniques performing better than others.
The evaluations are performed on the OMQA system which comprises of all of these
techniques. The same OMQA system can be used to select the methods and techniques
performing better in terms of accuracy of answers in order to produce optimal results.
Figure 4.19 shows the summary of results from section 4.1 and their selection in the
OMQA system.
Method Techniques evaluated Better accuracy
TopK search result
doctype
Web pages/
Snippets
Web pages
TopK search result
depth
K = 5/10/20 Top K = 20
Information from
external resources
Google/
WordNet/
Combination/
No
Combination
NER Alchemy/
Stanford/
Combined NER
Stanford NER
Sentence-matching
algorithm
Keywords/
Regex sentence-matching
Keywords
Remove unwanted
answers
Yes/No Yes
Top N Sentences N = 1/3/5 N = 3
Answer scoring Frequency/
MatchScore/
Prominence
Frequency
Answer
aggregation
Dice coefficient(.85)/
cosine similarity(0.80)/
Combination
Combination
Figure 4.19: Results showing optimal methods and techniques and their
selection in OMQA system
OMQA
system

212
The OMQA system, using recommended methods and techniques, is compared against
baseline systems reviewed from literature. The research generated results for these Web-
based QA systems using the methods and techniques they have used, according to their
specifications. For evaluation, four Web-based QA systems’ results were generated
including LAMP (Dumais et al., 2002; Kwok et al., 2001; Zhang & Lee, 2003), Qualifier
(Liu et al., 2014; Yang & Chua, 2002, 2003), Corrob (Wu & Marian, 2007a, 2011) and
GenreQA (Oh et al., 2012; Oh et al., 2013), and other systems based on the same
architecture. While other Web-based QA systems were also reviewed, their techniques
were either not available or not evaluated in the current study. The evaluation settings for
these systems are listed in Table 3.3 and covered in detail in Section 3.3.3.4.
The OMQA system was tested against these baseline systems on TREC and CLEF
datasets. Figure 4.20 and Table 4.10 shows comparison results of baseline systems against
OMQA on TREC dataset. The figure shows PerCorrect and table shows MRR, PerCorrect
and P-value (significance test) results along with Web-based QA systems’ names that
achieved them.
Table 4.10: OMQA system vs baselines on TREC dataset for QN=211
Web-based
QA system
MRR PerCorrect percentages at different ranks
Score Sig test
P-value
Top-1 Top-2 Top-3 Top-4 Top-5
LAMP 0.690 8.08E-12
(**)
58.29%
(123)
74.88%
(158)
78.67%
(166)
81.52%
(172)
83.89%
(177)
Qualifier
(Snippets)
0.693 1.94E-11
(**)
58.29%
(123)
74.88%
(158)
79.62%
(168)
81.99%
(173)
84.83%
(179)
Qualifier
(Web pages)
0.702 2.49E-09
(**)
57.35%
(121)
76.78%
(162)
81.52%
(172)
84.83%
(179)
88.63%
(187)
Corrob 0.732 1.33E-06
(**)
63.98%
(135)
76.30%
(161)
82.94%
(175)
85.78%
(181)
86.26%
(182)
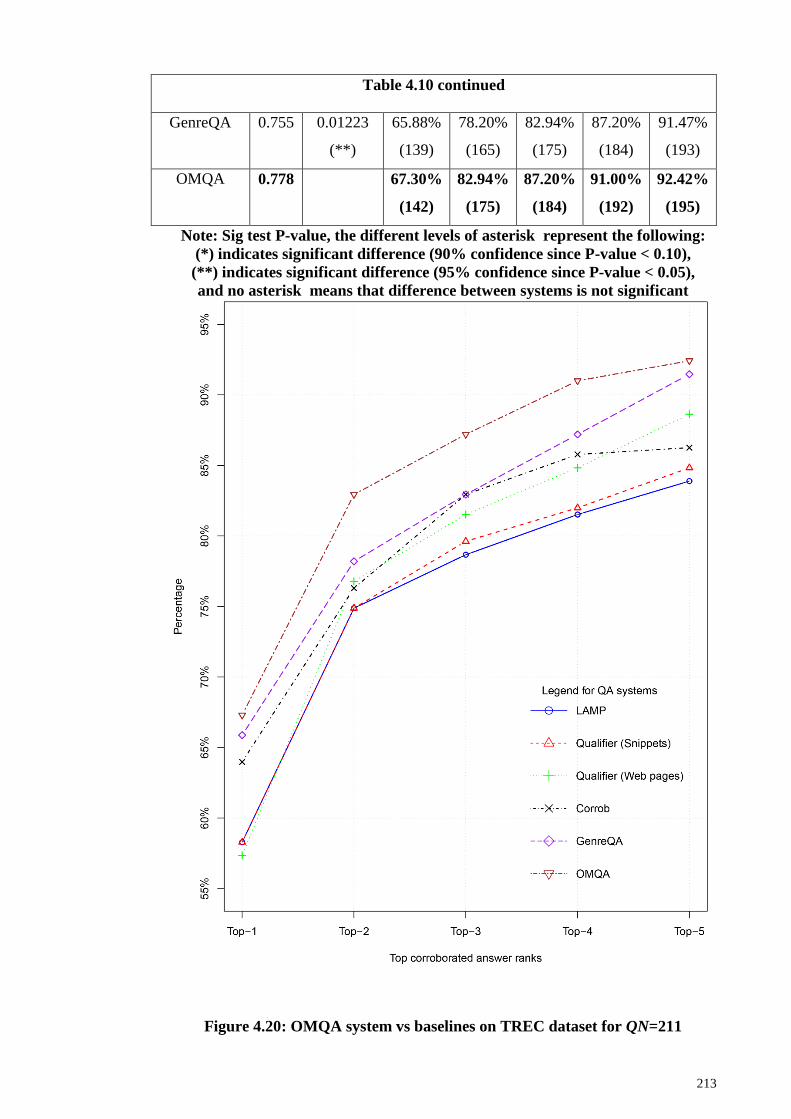
213
Table 4.10 continued
GenreQA 0.755 0.01223
(**)
65.88%
(139)
78.20%
(165)
82.94%
(175)
87.20%
(184)
91.47%
(193)
OMQA 0.778 67.30%
(142)
82.94%
(175)
87.20%
(184)
91.00%
(192)
92.42%
(195)
Note: Sig test P-value, the different levels of asterisk represent the following:
(*) indicates significant difference (90% confidence since P-value < 0.10),
(**) indicates significant difference (95% confidence since P-value < 0.05),
and no asterisk means that difference between systems is not significant
Figure 4.20: OMQA system vs baselines on TREC dataset for QN=211
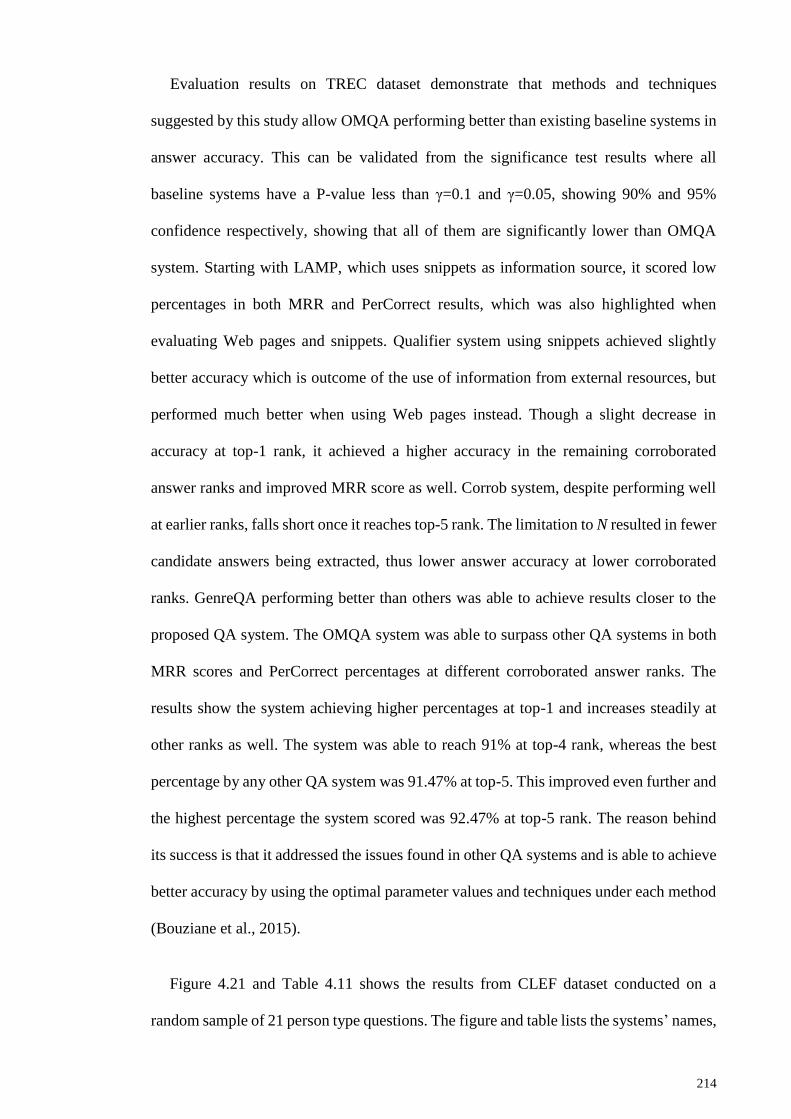
214
Evaluation results on TREC dataset demonstrate that methods and techniques
suggested by this study allow OMQA performing better than existing baseline systems in
answer accuracy. This can be validated from the significance test results where all
baseline systems have a P-value less than γ=0.1 and γ=0.05, showing 90% and 95%
confidence respectively, showing that all of them are significantly lower than OMQA
system. Starting with LAMP, which uses snippets as information source, it scored low
percentages in both MRR and PerCorrect results, which was also highlighted when
evaluating Web pages and snippets. Qualifier system using snippets achieved slightly
better accuracy which is outcome of the use of information from external resources, but
performed much better when using Web pages instead. Though a slight decrease in
accuracy at top-1 rank, it achieved a higher accuracy in the remaining corroborated
answer ranks and improved MRR score as well. Corrob system, despite performing well
at earlier ranks, falls short once it reaches top-5 rank. The limitation to N resulted in fewer
candidate answers being extracted, thus lower answer accuracy at lower corroborated
ranks. GenreQA performing better than others was able to achieve results closer to the
proposed QA system. The OMQA system was able to surpass other QA systems in both
MRR scores and PerCorrect percentages at different corroborated answer ranks. The
results show the system achieving higher percentages at top-1 and increases steadily at
other ranks as well. The system was able to reach 91% at top-4 rank, whereas the best
percentage by any other QA system was 91.47% at top-5. This improved even further and
the highest percentage the system scored was 92.47% at top-5 rank. The reason behind
its success is that it addressed the issues found in other QA systems and is able to achieve
better accuracy by using the optimal parameter values and techniques under each method
(Bouziane et al., 2015).
Figure 4.21 and Table 4.11 shows the results from CLEF dataset conducted on a
random sample of 21 person type questions. The figure and table lists the systems’ names,
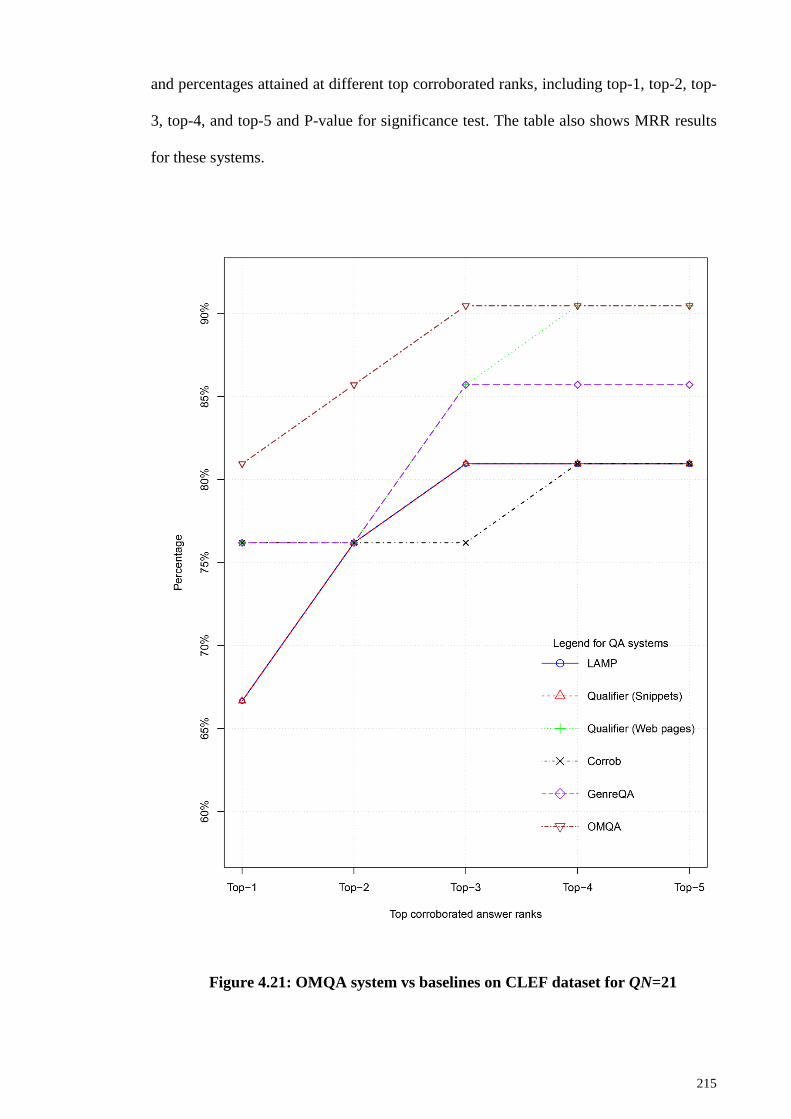
215
and percentages attained at different top corroborated ranks, including top-1, top-2, top-
3, top-4, and top-5 and P-value for significance test. The table also shows MRR results
for these systems.
Figure 4.21: OMQA system vs baselines on CLEF dataset for QN=21
216
Table 4.11: OMQA system vs baselines on CLEF dataset for QN=21
Web-based QA
system
MRR PerCorrect percentages at different ranks
Score Sig test
P-value
Top-1 Top-2 Top-3 Top-4 Top-5
LAMP 0.730 0.0132
(**)
66.66%
(15)
76.19%
(17)
80.95%
(18)
80.95%
(18)
80.95%
(18)
Qualifier
(Snippets)
0.730 0.0132
(**)
66.66%
(15)
76.19%
(17)
80.95%
(18)
80.95%
(18)
80.95%
(18)
Qualifier
(Web pages)
0.805 0.0868
(*)
76.19%
(17)
76.19%
(17)
85.71%
(19)
90.47%
(20)
90.47%
(20)
Corrob 0.773 0.0593
(*)
76.19%
(17)
76.19%
(17)
76.19%
(17)
80.95%
(18)
80.95%
(18)
GenreQA 0.793 0.0648
(*)
76.19%
(17)
76.19%
(17)
85.71%
(19)
85.71%
(19)
85.71%
(19)
OMQA 0.849 80.95%
(18)
85.71%
(19)
90.47%
(20)
90.47%
(20)
90.47%
(20)
Note: Sig test P-value, the different levels of asterisk represent the following:
(*) indicates significant difference (90% confidence since P-value < 0.10),
(**) indicates significant difference (95% confidence since P-value < 0.05),
and no asterisk means that difference between systems is not significant
Figure 4.21 and Table 4.11 shows the comparison results of the QA systems on this
dataset. Significance testing done using t-test shows 90% confidence that all baseline
systems are significantly lower than OMQA system. Even at 95% confidence (γ=0.05)
two baseline systems including LAMP and Qualifier (Snippets) are significantly lower
except for Qualifier(Web pages), Corrob and GenreQA baseline systems. As expected,
the results show that LAMP and Qualifier systems using snippets score lower than other
systems due to their reliance on snippets information source. Though Qualifier system
uses additional methods than LAMP system, it could not surpass it because these methods
are less effective on snippets. This is proved when the resource is changed to Web pages,
allowing Qualifier to achieve higher MRR scores and PerCorrect percentages. Corrob
system also scored high at top-1 rank but only increased slightly for the remaining ranks
217
as sentences matched N is set to 1. This is also the reason Corrob scored lower than
Qualifier, despite being able to remove unwanted answers. This observation is confirmed
in GenreQA results, where sentences match N=5, allowing it to score higher than Corrob
system.
The system suggested by this study was able to achieve higher MRR scores and
PerCorrect percentages than other QA systems. Taking the positives from both Qualifier
using Web pages, Corrob and GenreQA systems, making slight adjustments to methods
and techniques, the selection allowed it to gain a comfortable lead compared with the
other QA systems. The only questions OMQA system and other baselines was not able
to answer was due to inability of the NERs in detecting entities such as horse’s name
“Little Sorrel” and mythological name “Neptune”. Despite this, the OMQA system was
able to achieve a respectable answer accuracy in comparison to other baseline systems.
Thus, the results from CLEF dataset also support and acknowledge the effectiveness of
the methods and techniques in achieving higher answer accuracy.
4.2.2 OMQA system vs baseline systems result analysis
The results from Web-based QA systems methods and techniques highlighted the ones
performing better than others, which are used in the OMQA system. This OMQA system
was evaluated against other baseline system. The results show that the suggested system
was able to perform better than other systems in both MRR and perCorrect results. The
reasons for this success is simply due to use of optimal combination of methods and
techniques, which was not the case in baseline Web-based QA systems. For example, the
research suggests use of Web pages over snippets. LAMP system uses snippets as
information source and thus scored results are much lower than systems using Web pages
instead. The same pattern was found in other systems, thus showing the selection of
218
correct combination of methods and techniques is vital to increase answer accuracy in
existing Web-based QA systems.
Results for CredOMQA system vs other baselines
This sub-section shows PerCorrect and MRR results for CredOMQA system which is a
combination of OMQA system and credibility assessment module. The tests includes
evaluation of individual credibility categories and all categories for computing
credibility-based answer score. First the CredOMQA system is evaluated for selecting the
ideal value of of α used in Equation 3.28. Since the value has to be between 0 and 1, this
study chose 4 intervals for evaluation, including 0, 0.25, 0.50, and 0.75, where 1 was
excluded since it will return the same results as that of OMQA system by giving it 100%
weighting and giving 0% weighting to Web credibility. Once an ideal value of α is
selected then the CredOMQA system is evaluated for individual categories. This is done
for highlighting credibility categories that had the biggest or lowest impact on accuracy
of answers. At the end the CredOMQA system is evaluated using all categories for
generating credibility-based answer score and compared its results against baseline
systems.
Four Web-based and credibility-based Web QA systems were chosen as baseline for
comparing results for the prototype credibility-based Web QA system, proposed by this
research. These baselines system are: LAMP (Dumais et al., 2002; Kwok et al., 2001;
Zhang & Lee, 2003), Qualifier (Liu et al., 2014a; Yang & Chua, 2002, 2003a), Corrob
(Wu & Marian, 2007b, 2011) and GenreQA (Oh et al., 2012; Oh et al., 2013). Among
these baseline systems, LAMP and Qualifier do not use credibility scores, while Corrob
and GenreQA systems make use of Web credibility scores for scoring answers. The
settings used for these baseline systems are listed in Table 3.3. This research also shows
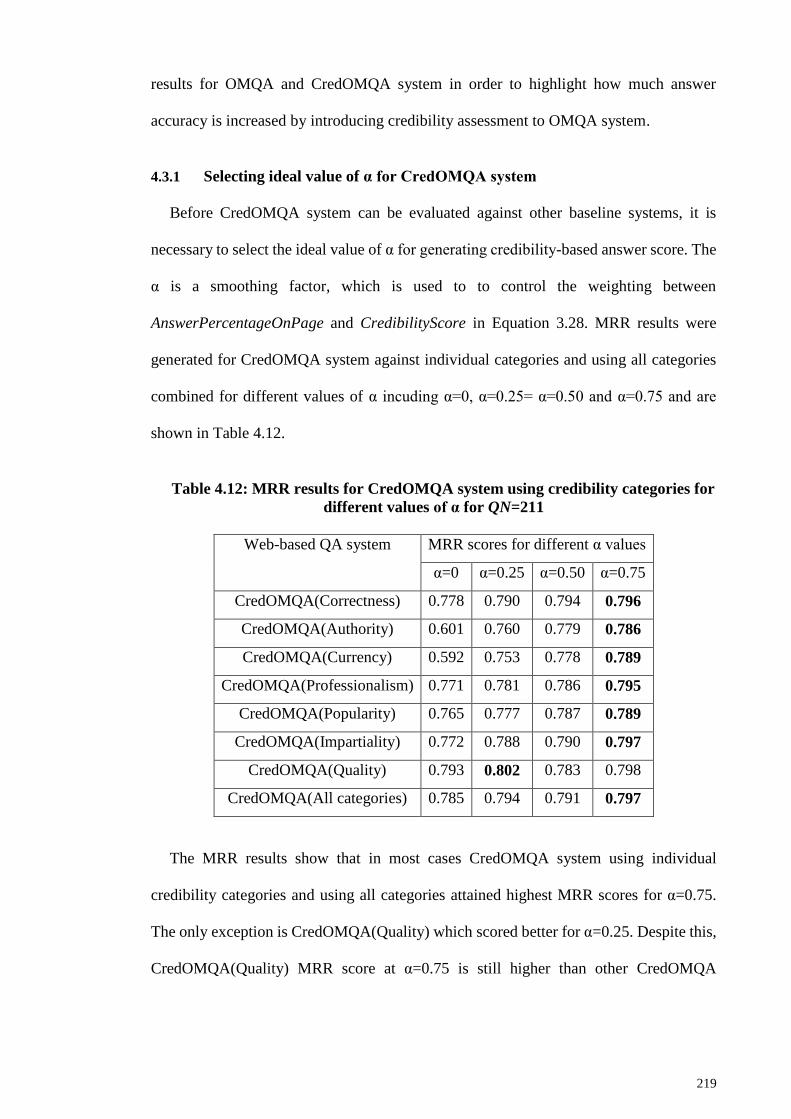
219
results for OMQA and CredOMQA system in order to highlight how much answer
accuracy is increased by introducing credibility assessment to OMQA system.
4.3.1 Selecting ideal value of α for CredOMQA system
Before CredOMQA system can be evaluated against other baseline systems, it is
necessary to select the ideal value of α for generating credibility-based answer score. The
α is a smoothing factor, which is used to to control the weighting between
AnswerPercentageOnPage and CredibilityScore in Equation 3.28. MRR results were
generated for CredOMQA system against individual categories and using all categories
combined for different values of α incuding α=0, α=0.25= α=0.50 and α=0.75 and are
shown in Table 4.12.
Table 4.12: MRR results for CredOMQA system using credibility categories for
different values of α for QN=211
Web-based QA system MRR scores for different α values
α=0 α=0.25 α=0.50 α=0.75
CredOMQA(Correctness) 0.778 0.790 0.794 0.796
CredOMQA(Authority) 0.601 0.760 0.779 0.786
CredOMQA(Currency) 0.592 0.753 0.778 0.789
CredOMQA(Professionalism) 0.771 0.781 0.786 0.795
CredOMQA(Popularity) 0.765 0.777 0.787 0.789
CredOMQA(Impartiality) 0.772 0.788 0.790 0.797
CredOMQA(Quality) 0.793 0.802 0.783 0.798
CredOMQA(All categories) 0.785 0.794 0.791 0.797
The MRR results show that in most cases CredOMQA system using individual
credibility categories and using all categories attained highest MRR scores for α=0.75.
The only exception is CredOMQA(Quality) which scored better for α=0.25. Despite this,
CredOMQA(Quality) MRR score at α=0.75 is still higher than other CredOMQA
220
combinations for α=0.75. Thus, the α=0.75 is selected as the ideal value for CredOMQA
system in the upcoming evaluations.
There are two reasons for credibility-based answer scores performing better at α=0.75
than other values. The first reason is that relying only on credibility of source does not
gives the best results (Wu & Marian, 2011). Systems like Corrob* reported better results
when the threshold for considering a Web page as credibility was made lenient instead of
being strict. CredOMQA using correctness. The second reason is that by not considering
AnswerPercentageOnPage, factors like frequency of answer being fount and its match-
score is neglected. Thus, with α=0.75 more weighting is given to
AnswerPercentageOnPage but CredibilityScore of answer score is still considered giving
ideal MRR scores in almost all results.
4.3.2 CredOMQA using correctness
Figure 4.22 shows PerCorrect and Table 4.13 shows PerCorrect and MRR results for
correctness category answer score. The figure and table lists systems’ name which
includes baseline systems, OMQA system and CredOMQA system scores using
correctness category score. In the table (*) notation is used with baseline systems for
indicating the system using credibility-based answer scores, such as Corrob*, GenreQA*
and correctness category scores, while LAMP, Qualifier, Corrob, GenreQA and OMQA
do not.
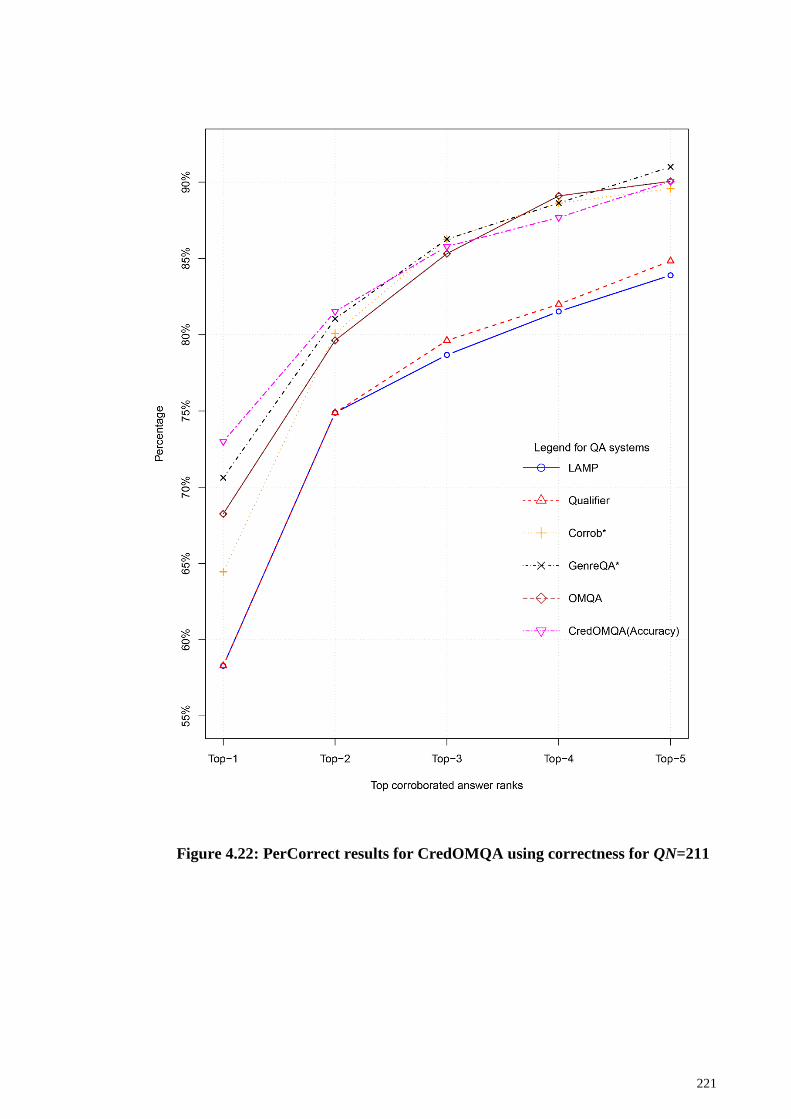
221
Figure 4.22: PerCorrect results for CredOMQA using correctness for QN=211
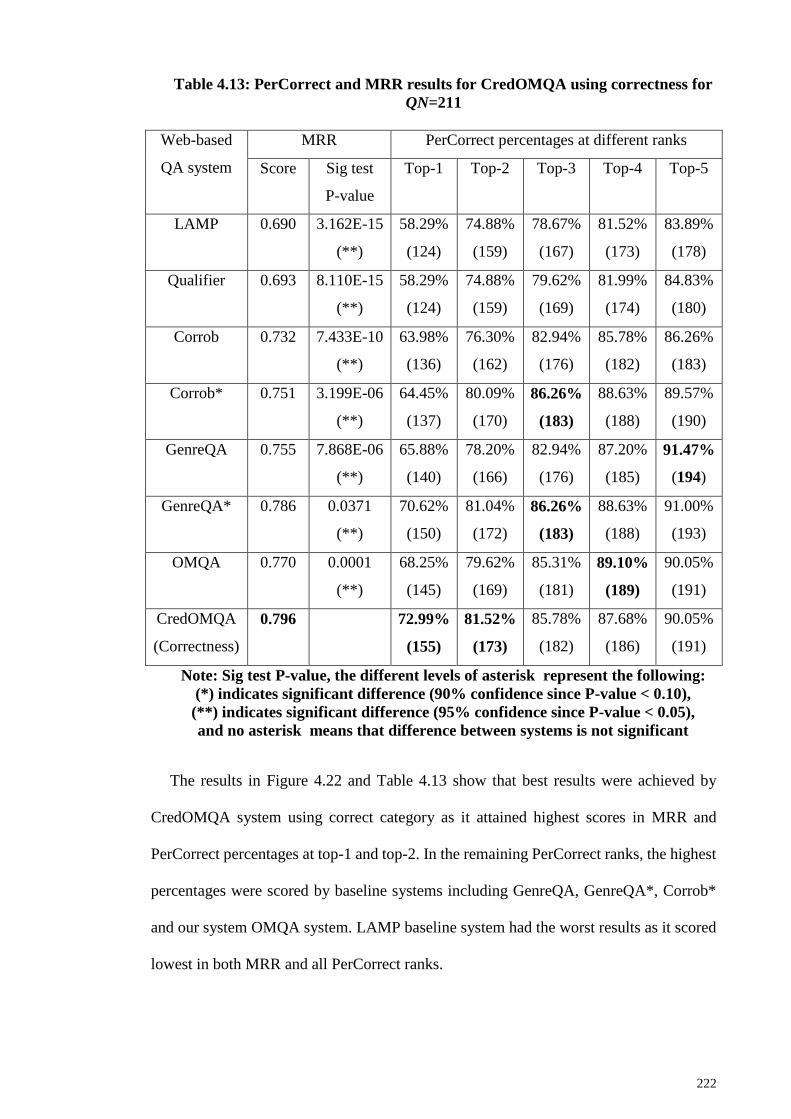
222
Table 4.13: PerCorrect and MRR results for CredOMQA using correctness for
QN=211
Web-based
QA system
MRR PerCorrect percentages at different ranks
Score Sig test
P-value
Top-1 Top-2 Top-3 Top-4 Top-5
LAMP 0.690 3.162E-15
(**)
58.29%
(124)
74.88%
(159)
78.67%
(167)
81.52%
(173)
83.89%
(178)
Qualifier 0.693 8.110E-15
(**)
58.29%
(124)
74.88%
(159)
79.62%
(169)
81.99%
(174)
84.83%
(180)
Corrob 0.732 7.433E-10
(**)
63.98%
(136)
76.30%
(162)
82.94%
(176)
85.78%
(182)
86.26%
(183)
Corrob* 0.751 3.199E-06
(**)
64.45%
(137)
80.09%
(170)
86.26%
(183)
88.63%
(188)
89.57%
(190)
GenreQA 0.755 7.868E-06
(**)
65.88%
(140)
78.20%
(166)
82.94%
(176)
87.20%
(185)
91.47%
(194)
GenreQA* 0.786 0.0371
(**)
70.62%
(150)
81.04%
(172)
86.26%
(183)
88.63%
(188)
91.00%
(193)
OMQA 0.770 0.0001
(**)
68.25%
(145)
79.62%
(169)
85.31%
(181)
89.10%
(189)
90.05%
(191)
CredOMQA
(Correctness)
0.796 72.99%
(155)
81.52%
(173)
85.78%
(182)
87.68%
(186)
90.05%
(191)
Note: Sig test P-value, the different levels of asterisk represent the following:
(*) indicates significant difference (90% confidence since P-value < 0.10),
(**) indicates significant difference (95% confidence since P-value < 0.05),
and no asterisk means that difference between systems is not significant
The results in Figure 4.22 and Table 4.13 show that best results were achieved by
CredOMQA system using correct category as it attained highest scores in MRR and
PerCorrect percentages at top-1 and top-2. In the remaining PerCorrect ranks, the highest
percentages were scored by baseline systems including GenreQA, GenreQA*, Corrob*
and our system OMQA system. LAMP baseline system had the worst results as it scored
lowest in both MRR and all PerCorrect ranks.
223
Results show that by considering correctness category, the accuracy of the
CredOMQA system improved over OMQA system significantly. This can also be verified
by the significance test performed showing 95% confidence is significance difference
between the two systems. In comparison to other baseline systems, the difference between
CredOMQA(Correctness) system and other baseline systems is also significant with 95%
confidence in signifance testing.
It can be concluded that CredOMQA system using correct category performed better
than baseline systems and the OMQA system, including baseline systems conducting
credibility assessment. Additionally, the reason we believe this category performed better
was due to the introduction of TFIDF method in addition to the search results rank (Wu
& Marian, 2011). This ensured that documents achieving a higher TFIDF score
considered the keywords used for answer extraction by the Web-based QA system instead
of relying on the rank given by the search engine only (Wu & Marian, 2011). Thus, an
introduction of a scoring method to check the relevancy of the document, with respect to
keywords used, helped in improving accuracy of answers.
4.3.3 CredOMQA using authority
Figure 4.23 shows PerCorrect and Table 4.14 shows the PerCorrect, MRR and testing
results for CredOMQA(Authority) system against baseline systems. The significant test
is done using t-test, which shows whether a baseline system is significantly different than
CredOMQA(Authority) system or not using different confidence levels including 90%
and 95%.
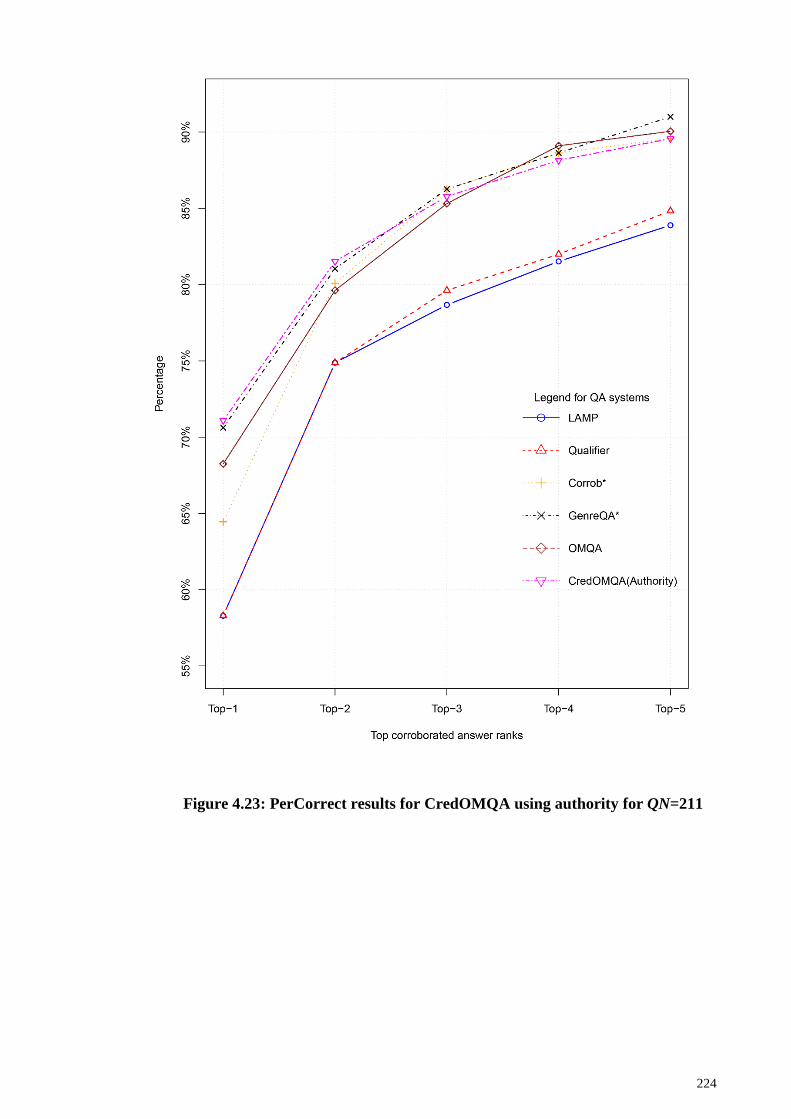
224
Figure 4.23: PerCorrect results for CredOMQA using authority for QN=211
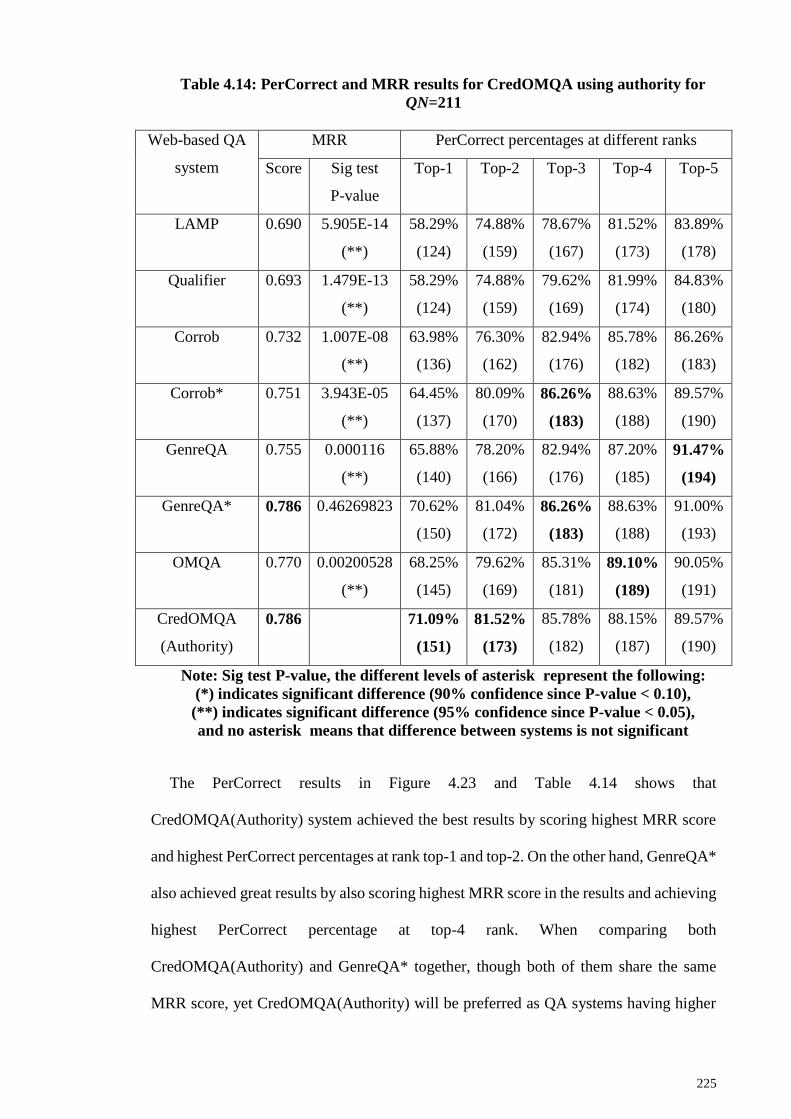
225
Table 4.14: PerCorrect and MRR results for CredOMQA using authority for
QN=211
Web-based QA
system
MRR PerCorrect percentages at different ranks
Score Sig test
P-value
Top-1 Top-2 Top-3 Top-4 Top-5
LAMP 0.690 5.905E-14
(**)
58.29%
(124)
74.88%
(159)
78.67%
(167)
81.52%
(173)
83.89%
(178)
Qualifier 0.693 1.479E-13
(**)
58.29%
(124)
74.88%
(159)
79.62%
(169)
81.99%
(174)
84.83%
(180)
Corrob 0.732 1.007E-08
(**)
63.98%
(136)
76.30%
(162)
82.94%
(176)
85.78%
(182)
86.26%
(183)
Corrob* 0.751 3.943E-05
(**)
64.45%
(137)
80.09%
(170)
86.26%
(183)
88.63%
(188)
89.57%
(190)
GenreQA 0.755 0.000116
(**)
65.88%
(140)
78.20%
(166)
82.94%
(176)
87.20%
(185)
91.47%
(194)
GenreQA* 0.786 0.46269823
70.62%
(150)
81.04%
(172)
86.26%
(183)
88.63%
(188)
91.00%
(193)
OMQA 0.770 0.00200528
(**)
68.25%
(145)
79.62%
(169)
85.31%
(181)
89.10%
(189)
90.05%
(191)
CredOMQA
(Authority)
0.786 71.09%
(151)
81.52%
(173)
85.78%
(182)
88.15%
(187)
89.57%
(190)
Note: Sig test P-value, the different levels of asterisk represent the following:
(*) indicates significant difference (90% confidence since P-value < 0.10),
(**) indicates significant difference (95% confidence since P-value < 0.05),
and no asterisk means that difference between systems is not significant
The PerCorrect results in Figure 4.23 and Table 4.14 shows that
CredOMQA(Authority) system achieved the best results by scoring highest MRR score
and highest PerCorrect percentages at rank top-1 and top-2. On the other hand, GenreQA*
also achieved great results by also scoring highest MRR score in the results and achieving
highest PerCorrect percentage at top-4 rank. When comparing both
CredOMQA(Authority) and GenreQA* together, though both of them share the same
MRR score, yet CredOMQA(Authority) will be preferred as QA systems having higher

226
accuracy at top-1 and top-2 PerCorrect ranks are considered better (Wu & Marian, 2011).
Apart from deciding whether CredOMQA(Authority) did better than GenreQA*, it is
clear that both of these systems did improve accuracy of answers over non-credible
version of QA systems including OMQA and GenreQA system respectively.
Despite CredOMQA(Authority) achieving highest results in comparison to other
baseline systems, its MRR score is much lower than CredOMQA system using other
baselines. For example, CredOMQA(Correctness) also achieved better results than other
baseline systems but had a much higher MRR score than CredOMQA(Authority) in the
results, that is 0.796 in comparison to 0.786 to that of CredOMQA(Authority).
When looking at significance testing results, it shows that CredOMQA(Authority)
system is significantly better than majority of the baseline systems. The only exception
here is the GenreQA*. For all other baseline systems, with 95% confidence it can be
stated that CredOMQA system is significantly better than all baseline systems except
GenreQA*.
In conclusion, though CredOMQA(Authority) achieved higher results than most
baseline systems, yet its difference between other credibility-based like GenreQA*
system was not significant. The category did not perform as good as other credibility
categories due to several reasons. One of the factors for scoring low on the results is that
most of the sources (from where answers were extracted) did not mention the author name
or the URLs (Diffbot, 2016). Figure 4.24 shows authority scores, for question “Who was
the first Prime Minister of Canada?”, which shows that only 3 out of 20 search results
mentioned both author name and contact details.
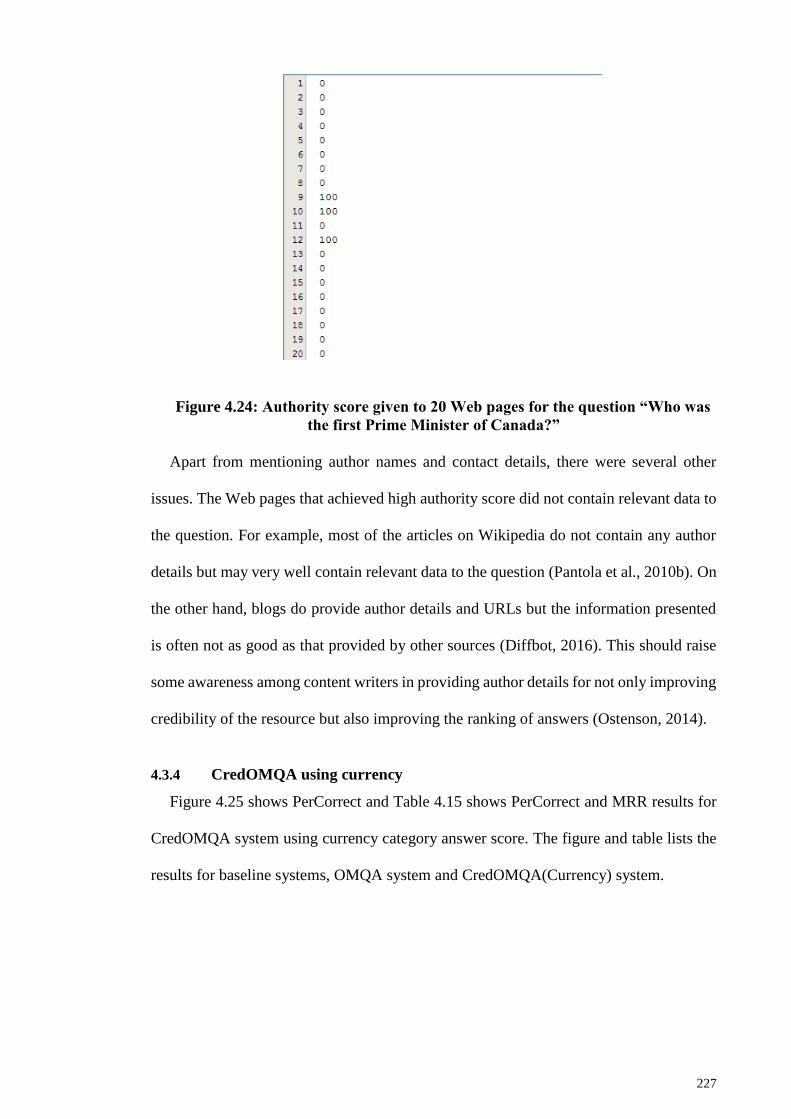
227
Figure 4.24: Authority score given to 20 Web pages for the question “Who was
the first Prime Minister of Canada?”
Apart from mentioning author names and contact details, there were several other
issues. The Web pages that achieved high authority score did not contain relevant data to
the question. For example, most of the articles on Wikipedia do not contain any author
details but may very well contain relevant data to the question (Pantola et al., 2010b). On
the other hand, blogs do provide author details and URLs but the information presented
is often not as good as that provided by other sources (Diffbot, 2016). This should raise
some awareness among content writers in providing author details for not only improving
credibility of the resource but also improving the ranking of answers (Ostenson, 2014).
4.3.4 CredOMQA using currency
Figure 4.25 shows PerCorrect and Table 4.15 shows PerCorrect and MRR results for
CredOMQA system using currency category answer score. The figure and table lists the
results for baseline systems, OMQA system and CredOMQA(Currency) system.
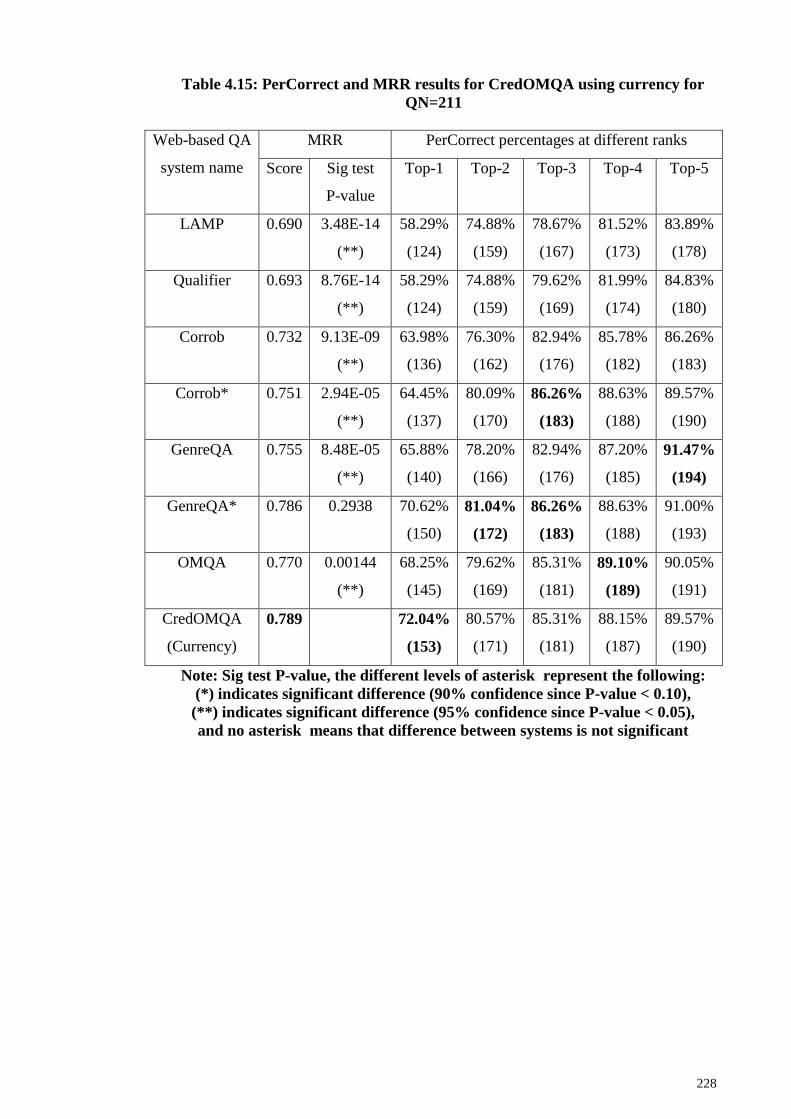
228
Table 4.15: PerCorrect and MRR results for CredOMQA using currency for
QN=211
Web-based QA
system name
MRR PerCorrect percentages at different ranks
Score Sig test
P-value
Top-1 Top-2 Top-3 Top-4 Top-5
LAMP 0.690 3.48E-14
(**)
58.29%
(124)
74.88%
(159)
78.67%
(167)
81.52%
(173)
83.89%
(178)
Qualifier 0.693 8.76E-14
(**)
58.29%
(124)
74.88%
(159)
79.62%
(169)
81.99%
(174)
84.83%
(180)
Corrob 0.732 9.13E-09
(**)
63.98%
(136)
76.30%
(162)
82.94%
(176)
85.78%
(182)
86.26%
(183)
Corrob* 0.751 2.94E-05
(**)
64.45%
(137)
80.09%
(170)
86.26%
(183)
88.63%
(188)
89.57%
(190)
GenreQA 0.755 8.48E-05
(**)
65.88%
(140)
78.20%
(166)
82.94%
(176)
87.20%
(185)
91.47%
(194)
GenreQA* 0.786 0.2938
70.62%
(150)
81.04%
(172)
86.26%
(183)
88.63%
(188)
91.00%
(193)
OMQA 0.770 0.00144
(**)
68.25%
(145)
79.62%
(169)
85.31%
(181)
89.10%
(189)
90.05%
(191)
CredOMQA
(Currency)
0.789 72.04%
(153)
80.57%
(171)
85.31%
(181)
88.15%
(187)
89.57%
(190)
Note: Sig test P-value, the different levels of asterisk represent the following:
(*) indicates significant difference (90% confidence since P-value < 0.10),
(**) indicates significant difference (95% confidence since P-value < 0.05),
and no asterisk means that difference between systems is not significant

229
Figure 4.25: PerCorrect results for CredOMQA using currency for QN=211
Table 4.15 and Figure 4.25 show CredOMQA(Currency) system best results as
compared to other baseline systems as it scores the highest MRR and achieves highest
PerCorrect percentage at top-1 rank. In the remaining PerCorrect ranks, highest
percentages is shared among different baseline systems. A close second would be
230
GenreQA* whose MRR is close to CredOMQA(Currency) and also scored highest
PerCorrect percentage at in the middle PerCorrect ranks like top-2 and top-3.
Just like CredOMQA(Authority), CredOMQA(Currency) achieved lower MRR score
as compared to other credibility categories. This means that CredOMQA(Currency)
despite achieving better results than other baseline systems, its accuracy can still be
improved much further.
The significance results show CredOMQA(Currency) is significantly better than most
of the baseline systems. This also includes significant improvement over OMQA system,
based on which CredOMQA(Currency) is developed. For all baseline systems, except
GenreQA*, CredOMQA(Currency) achieved significantly better results with 95%
confidence in the significance testing. This also includes Corrob* system which also
conducts credibility assessment. Though, CredOMQA(Currency) results were not
significantly different than GenreQA*, yet CredOMQA(Currency) is still preffered over
it for achieving higher MRR scores and having better PerCorrect percentages at top-1 and
top-2 ranks.
In conclusion, CredOMQA(Currency) showed significant improvement over OMQA
system and achieved significantly better results than most of the baseline systems. One
of the reasons for this category to have a low accuracy turnover is that most Websites do
not update their Web pages regularly (Diffbot, 2016). If that was not all, they fail to
mention the last time the page was updated, leaving the user clueless about source’s
credibility with respect to currency (Diffbot, 2016). Like authority, currency is among
those categories that are often neglected by content writers and Web users when
conducting credibility assessment of the resource. Figure 4.26 shows the currency scores
for the question “Who is the author of the book, “The Iron Lady: A Biography of Margaret
Thatcher”?”.
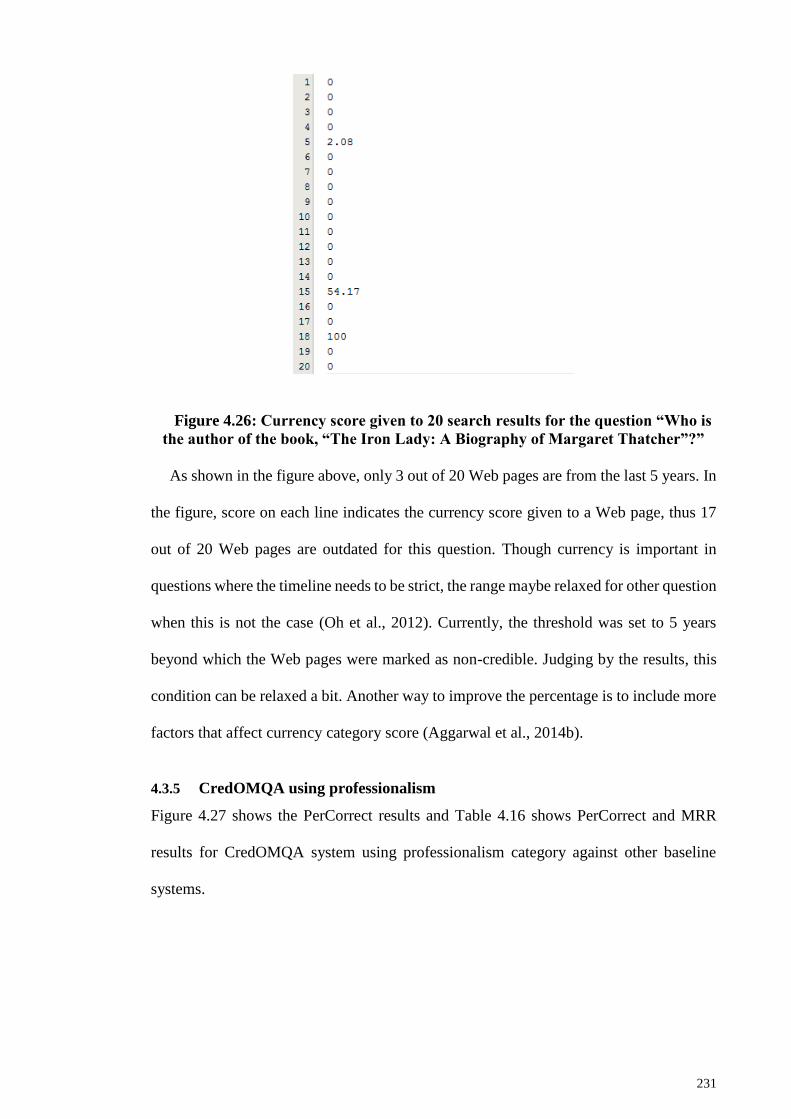
231
Figure 4.26: Currency score given to 20 search results for the question “Who is
the author of the book, “The Iron Lady: A Biography of Margaret Thatcher”?”
As shown in the figure above, only 3 out of 20 Web pages are from the last 5 years. In
the figure, score on each line indicates the currency score given to a Web page, thus 17
out of 20 Web pages are outdated for this question. Though currency is important in
questions where the timeline needs to be strict, the range maybe relaxed for other question
when this is not the case (Oh et al., 2012). Currently, the threshold was set to 5 years
beyond which the Web pages were marked as non-credible. Judging by the results, this
condition can be relaxed a bit. Another way to improve the percentage is to include more
factors that affect currency category score (Aggarwal et al., 2014b).
4.3.5 CredOMQA using professionalism
Figure 4.27 shows the PerCorrect results and Table 4.16 shows PerCorrect and MRR
results for CredOMQA system using professionalism category against other baseline
systems.

232
Figure 4.27: PerCorrect results for CredOMQA using professionalism for
QN=211
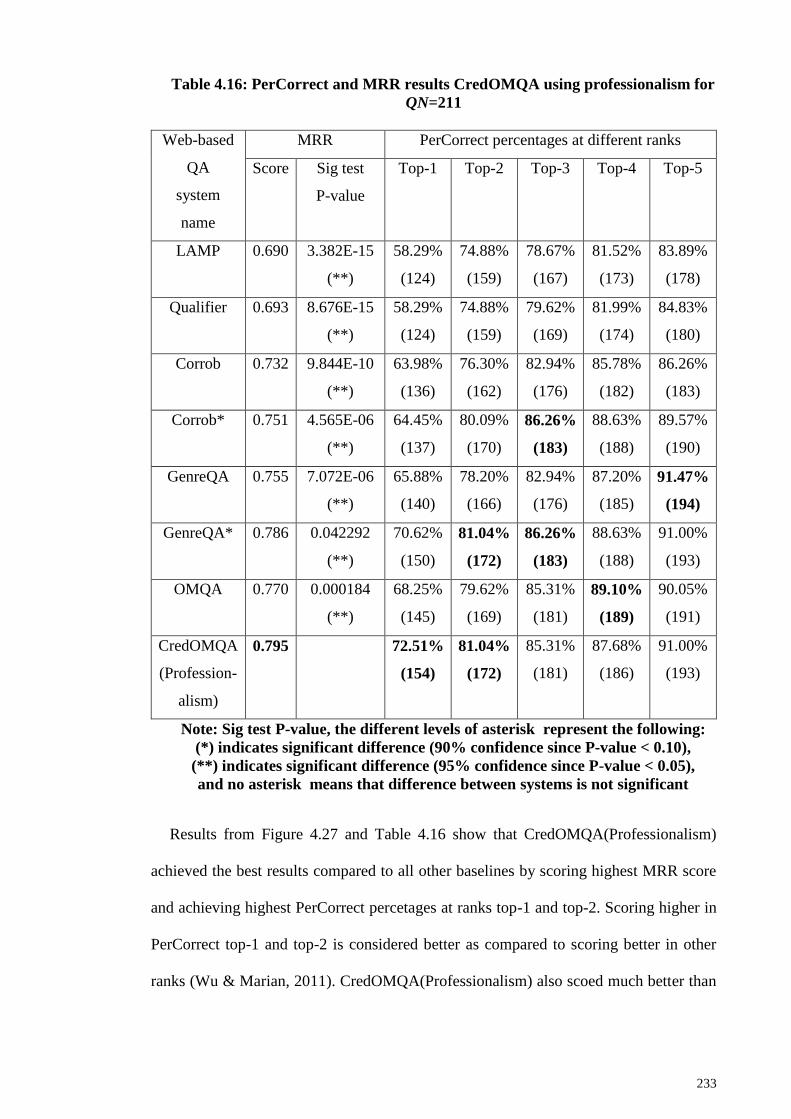
233
Table 4.16: PerCorrect and MRR results CredOMQA using professionalism for
QN=211
Web-based
QA
system
name
MRR PerCorrect percentages at different ranks
Score Sig test
P-value
Top-1 Top-2 Top-3 Top-4 Top-5
LAMP 0.690 3.382E-15
(**)
58.29%
(124)
74.88%
(159)
78.67%
(167)
81.52%
(173)
83.89%
(178)
Qualifier 0.693 8.676E-15
(**)
58.29%
(124)
74.88%
(159)
79.62%
(169)
81.99%
(174)
84.83%
(180)
Corrob 0.732 9.844E-10
(**)
63.98%
(136)
76.30%
(162)
82.94%
(176)
85.78%
(182)
86.26%
(183)
Corrob* 0.751 4.565E-06
(**)
64.45%
(137)
80.09%
(170)
86.26%
(183)
88.63%
(188)
89.57%
(190)
GenreQA 0.755 7.072E-06
(**)
65.88%
(140)
78.20%
(166)
82.94%
(176)
87.20%
(185)
91.47%
(194)
GenreQA* 0.786 0.042292
(**)
70.62%
(150)
81.04%
(172)
86.26%
(183)
88.63%
(188)
91.00%
(193)
OMQA 0.770 0.000184
(**)
68.25%
(145)
79.62%
(169)
85.31%
(181)
89.10%
(189)
90.05%
(191)
CredOMQA
(Profession-
alism)
0.795 72.51%
(154)
81.04%
(172)
85.31%
(181)
87.68%
(186)
91.00%
(193)
Note: Sig test P-value, the different levels of asterisk represent the following:
(*) indicates significant difference (90% confidence since P-value < 0.10),
(**) indicates significant difference (95% confidence since P-value < 0.05),
and no asterisk means that difference between systems is not significant
Results from Figure 4.27 and Table 4.16 show that CredOMQA(Professionalism)
achieved the best results compared to all other baselines by scoring highest MRR score
and achieving highest PerCorrect percetages at ranks top-1 and top-2. Scoring higher in
PerCorrect top-1 and top-2 is considered better as compared to scoring better in other
ranks (Wu & Marian, 2011). CredOMQA(Professionalism) also scoed much better than
234
GenreQA* and Corrob* systems , which also use credibility assessment for scoring
answers.
CredOMQA(Professionalism) also scored much higher than CredOMQA system using
categories such as authority and currency. In short, CredOMQA(Professionalism) not
only did CredOMQA(Professionalism) scored better than baseline systems but its
accuracy of answers is also quite high with a clear margin of difference. This is evident
in the signifance testing as well.
The signifance testing results show us CredOMQA(Professionalism) showing
significant improvement over OMQA system. Additionally, there is significant difference
between CredOMQA(Professionalism) and other baseline systems as well. The results
show that P-value of all baseline systems (including Corrob* and GenreQA*) was
significantly lower than γ=0.05, showing CredOMQA(Professionalism) being
significantly better than others with confidence level of 95%.
In conclusion, professionalism category is among the categories that had a major
impact on improving accuracy of answers. The inclusion of reviewer’s score and
reputation given to Web pages helped a lot in segregating credible resources from non-
credible ones, thus promoting the correct answers even higher (Aggarwal et al., 2014b).
Furthermore, this category contained many factors compared to others, covered in greater
detail in Section 3.3.7.4, thus producing a score with less variation. This is because even
if the values for some of the factors were not found or extracted, the overall impact on the
professionalism score was less as there were other factors to consider as well (Aggarwal
et al., 2014b).
4.3.6 CredOMQA using popularity
Figure 4.28 shows PerCorrect results and Table 4.17 shows PerCorrect and MRR results
for CredOMQA using popularity category. The table also shows significance testing
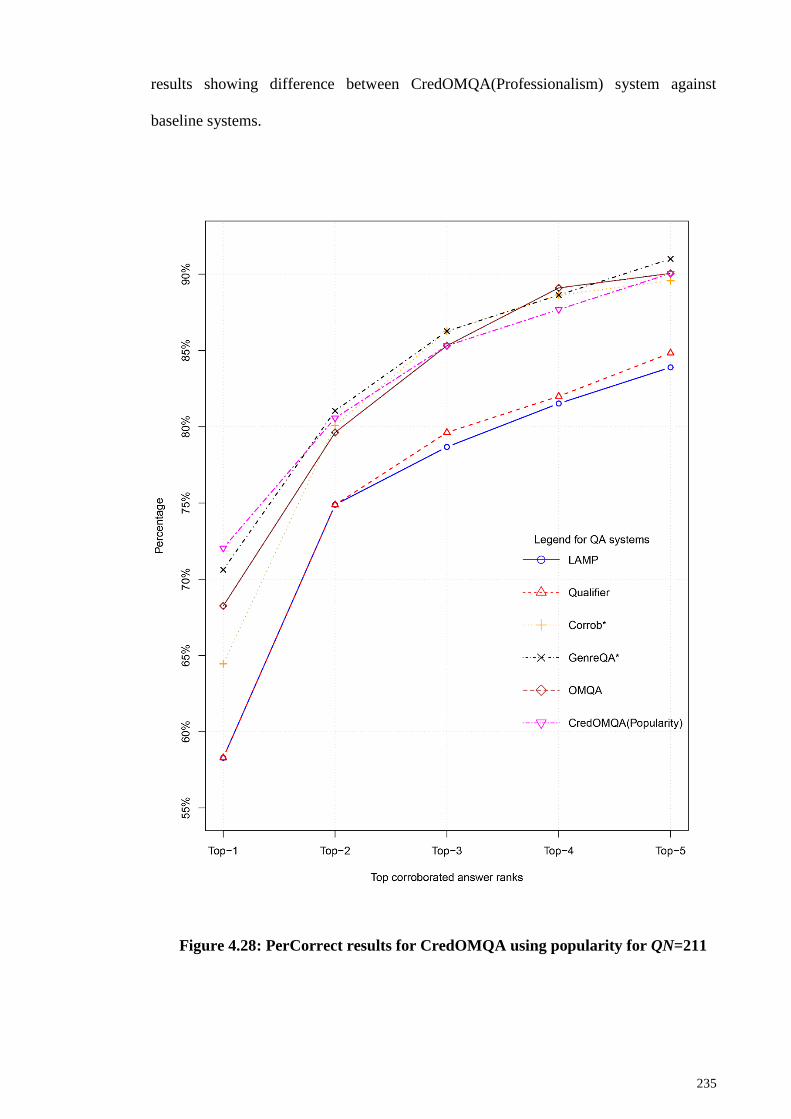
235
results showing difference between CredOMQA(Professionalism) system against
baseline systems.
Figure 4.28: PerCorrect results for CredOMQA using popularity for QN=211
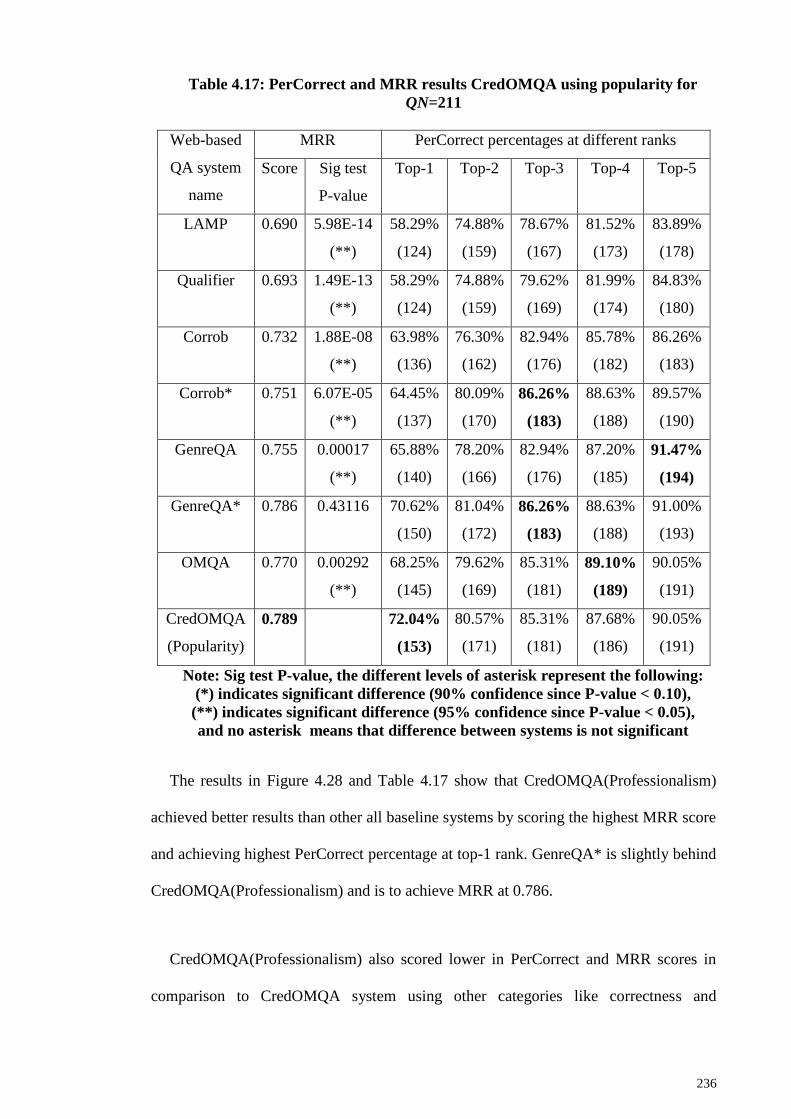
236
Table 4.17: PerCorrect and MRR results CredOMQA using popularity for
QN=211
Web-based
QA system
name
MRR PerCorrect percentages at different ranks
Score Sig test
P-value
Top-1 Top-2 Top-3 Top-4 Top-5
LAMP 0.690 5.98E-14
(**)
58.29%
(124)
74.88%
(159)
78.67%
(167)
81.52%
(173)
83.89%
(178)
Qualifier 0.693 1.49E-13
(**)
58.29%
(124)
74.88%
(159)
79.62%
(169)
81.99%
(174)
84.83%
(180)
Corrob 0.732 1.88E-08
(**)
63.98%
(136)
76.30%
(162)
82.94%
(176)
85.78%
(182)
86.26%
(183)
Corrob* 0.751 6.07E-05
(**)
64.45%
(137)
80.09%
(170)
86.26%
(183)
88.63%
(188)
89.57%
(190)
GenreQA 0.755 0.00017
(**)
65.88%
(140)
78.20%
(166)
82.94%
(176)
87.20%
(185)
91.47%
(194)
GenreQA* 0.786 0.43116
70.62%
(150)
81.04%
(172)
86.26%
(183)
88.63%
(188)
91.00%
(193)
OMQA 0.770 0.00292
(**)
68.25%
(145)
79.62%
(169)
85.31%
(181)
89.10%
(189)
90.05%
(191)
CredOMQA
(Popularity)
0.789 72.04%
(153)
80.57%
(171)
85.31%
(181)
87.68%
(186)
90.05%
(191)
Note: Sig test P-value, the different levels of asterisk represent the following:
(*) indicates significant difference (90% confidence since P-value < 0.10),
(**) indicates significant difference (95% confidence since P-value < 0.05),
and no asterisk means that difference between systems is not significant
The results in Figure 4.28 and Table 4.17 show that CredOMQA(Professionalism)
achieved better results than other all baseline systems by scoring the highest MRR score
and achieving highest PerCorrect percentage at top-1 rank. GenreQA* is slightly behind
CredOMQA(Professionalism) and is to achieve MRR at 0.786.
CredOMQA(Professionalism) also scored lower in PerCorrect and MRR scores in
comparison to CredOMQA system using other categories like correctness and

237
professionalism. This results in close gap between CredOMQA(Professionalism) and
credibility-based Web QA systems like GenreQA*.
In significance testing, CredOMQA(Professionalism) system has a significant
difference against most baseline systems, except for GenreQA*. Though the difference
between GenreQA* is not signifant, it does not mean GenreQA performed better. As for
other baseline systems, with confidence level of 95%, CredOMQA(Professionalism)
shows significant improvement over others.
In conclusion, CredOMQA(Professionalism) shows results higher than baseline
systems, but did not show significant improvement against credibility-based QA systems
like GenreQA*. This is due to lower scores in comparison to other credibility categories.
Despite not achieving optimal results, yet the category scored higher than most baseline
systems. This is credited towards the inclusion of multiple factors acquired from various
SEO organizations which provide Web pages ranks, traffic details and social media share
count. In general, a Web page needs to achieve respectable scores in all of these factors
for achieving a higher credibility score, that may help in improving the score of answers
found on the page as well. Many Web pages try to exploit popularity by addressing
limited factors only, which are addressed by a particular search engine. This research
suggests using a number factors, covered by several SEO organizations, to make it
difficult for Web pages to exploit popularity scores. Furthermore, share count of an article
is also difficult to address by the content creator alone.
4.3.7 CredOMQA using impartiality
Figure 4.29 shows PerCorrect results and Table 4.18 shows PerCorrect and MRR results
for CredOMQA system using impartiality category answer score against other baseline
systems.
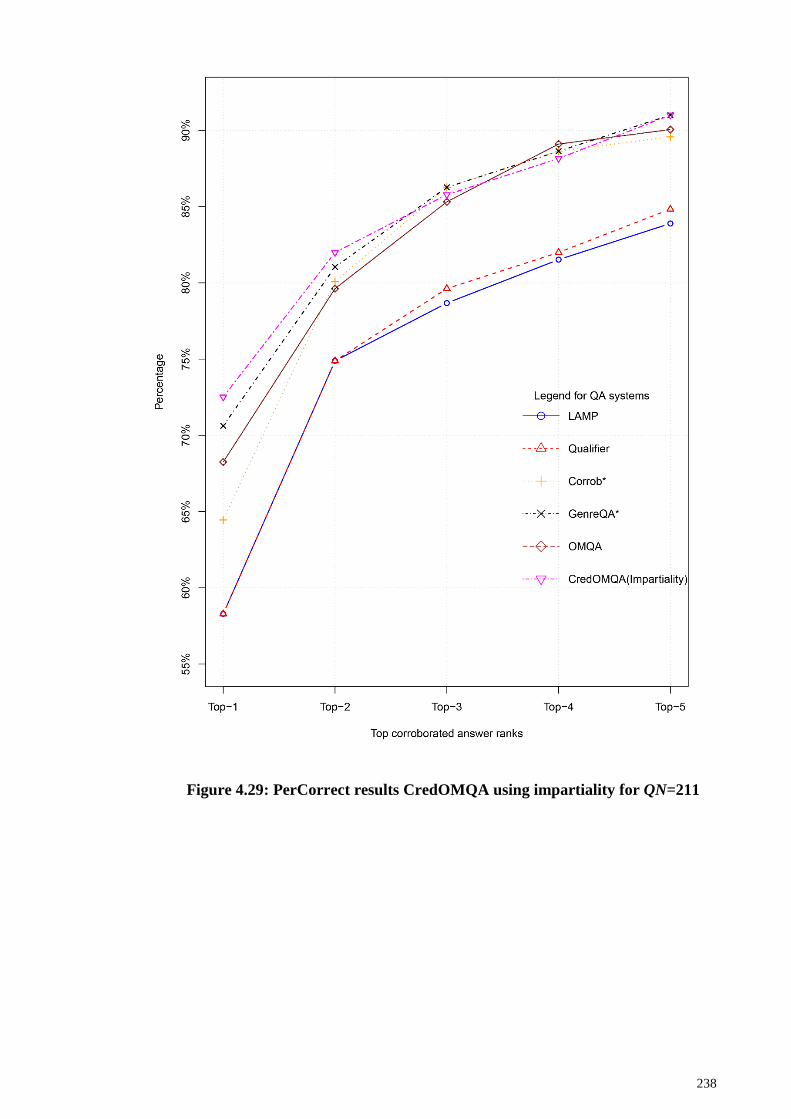
238
Figure 4.29: PerCorrect results CredOMQA using impartiality for QN=211
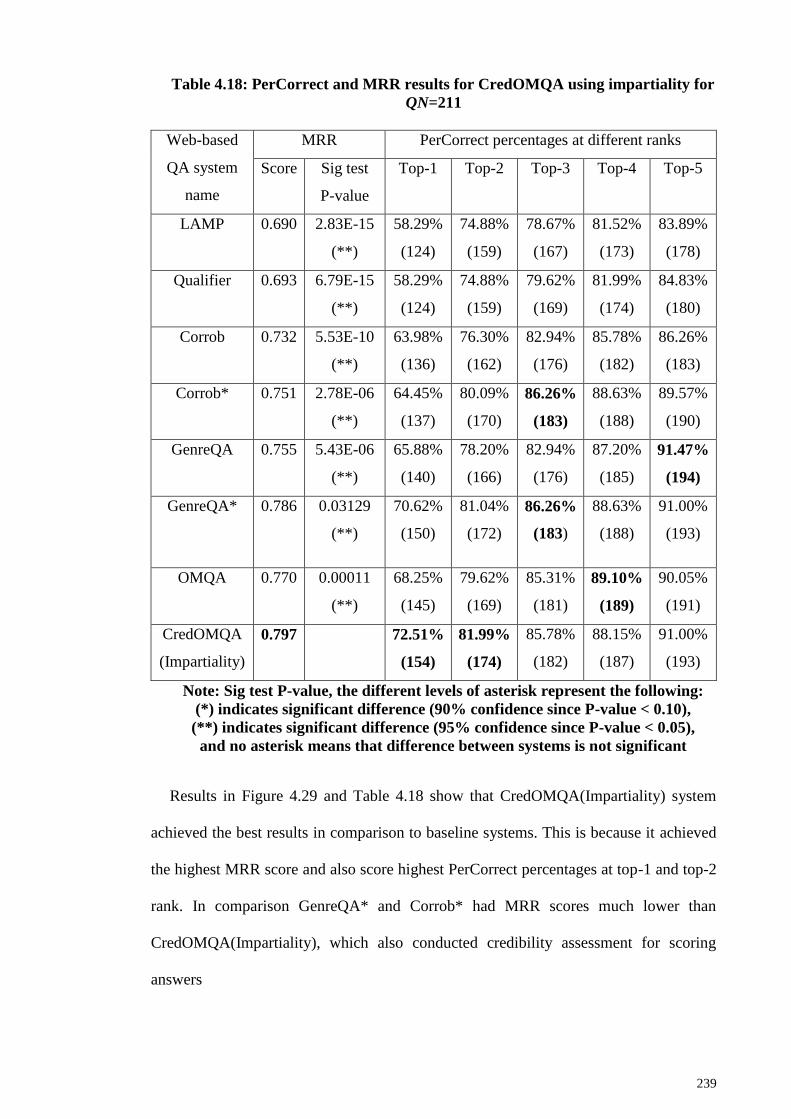
239
Table 4.18: PerCorrect and MRR results for CredOMQA using impartiality for
QN=211
Web-based
QA system
name
MRR PerCorrect percentages at different ranks
Score Sig test
P-value
Top-1 Top-2 Top-3 Top-4 Top-5
LAMP 0.690 2.83E-15
(**)
58.29%
(124)
74.88%
(159)
78.67%
(167)
81.52%
(173)
83.89%
(178)
Qualifier 0.693 6.79E-15
(**)
58.29%
(124)
74.88%
(159)
79.62%
(169)
81.99%
(174)
84.83%
(180)
Corrob 0.732 5.53E-10
(**)
63.98%
(136)
76.30%
(162)
82.94%
(176)
85.78%
(182)
86.26%
(183)
Corrob* 0.751 2.78E-06
(**)
64.45%
(137)
80.09%
(170)
86.26%
(183)
88.63%
(188)
89.57%
(190)
GenreQA 0.755 5.43E-06
(**)
65.88%
(140)
78.20%
(166)
82.94%
(176)
87.20%
(185)
91.47%
(194)
GenreQA* 0.786 0.03129
(**)
70.62%
(150)
81.04%
(172)
86.26%
(183)
88.63%
(188)
91.00%
(193)
OMQA 0.770 0.00011
(**)
68.25%
(145)
79.62%
(169)
85.31%
(181)
89.10%
(189)
90.05%
(191)
CredOMQA
(Impartiality)
0.797 72.51%
(154)
81.99%
(174)
85.78%
(182)
88.15%
(187)
91.00%
(193)
Note: Sig test P-value, the different levels of asterisk represent the following:
(*) indicates significant difference (90% confidence since P-value < 0.10),
(**) indicates significant difference (95% confidence since P-value < 0.05),
and no asterisk means that difference between systems is not significant
Results in Figure 4.29 and Table 4.18 show that CredOMQA(Impartiality) system
achieved the best results in comparison to baseline systems. This is because it achieved
the highest MRR score and also score highest PerCorrect percentages at top-1 and top-2
rank. In comparison GenreQA* and Corrob* had MRR scores much lower than
CredOMQA(Impartiality), which also conducted credibility assessment for scoring
answers
240
CredOMQA(Impartiality) not only achieved higher scores than baseline systems but
also had among the highest MRR and PerCorrect scores attained by CredOMQA system
against other credibility categories. Thus, impartiality should be highly prioritized for
achieving high accuracy of answers.
In significance testing, the results also show baseline systems are significantly
different and lower than CredOMQA(Impartiality) system. All the baseline systems,
including credibility-based Web QA systems like Corrob* and GenreQA* were
significantly lower in terms of accuracy compared to CredOMQA(Impartiality) system
with a confidence level of 95%.
In conclusion, impartiality category shows that it is among the categories that
improved percentage of correct answers the most. Though there was only one factor
considered under impartiality, i.e., sentiment of the content, yet the scores had a major
impact on accuracy of answers (Diffbot, 2016; Schwarz & Morris, 2011b). One of the
reasons for this category’s success is that the factor is difficult to exploit (Diffbot, 2016).
This is because an ill-intentioned content writer will try to write material that will support
his cause by increasing the frequency of an incorrect answer deliberately or being biased
in general (Wu & Marian, 2011). By doing this, he/she is likely to show some bias in the
content, thus allowing sentiment score to give it a lower rating (Diffbot, 2016). This
category in particular will encourage content writers to be un-biased and keep the tone of
the article positive when sharing content on the Web and thus achieve decent ranking in
credibility based systems (Fletcher et al., 2017).
4.3.8 CredOMQA using quality
Figure 4.30 shows PerCorrect results and Table 4.19 shows PerCorrect and MRR results
for CredOMQA system using quality category answer score against baseline systems.
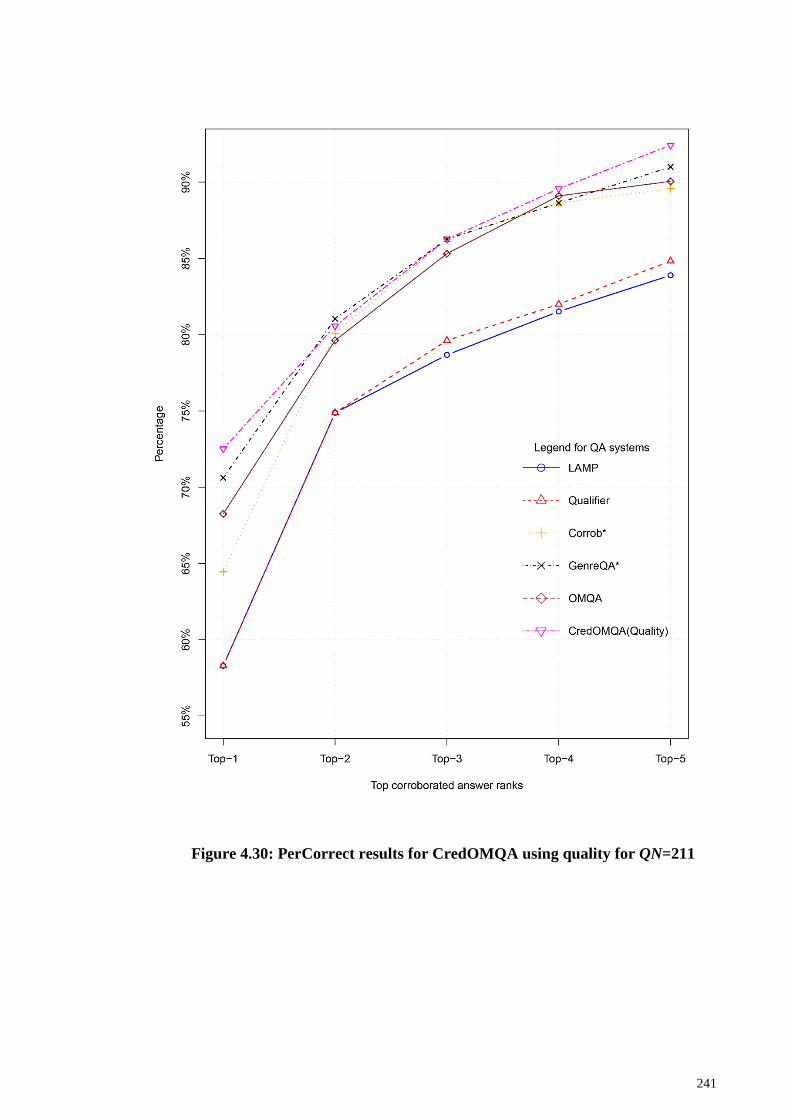
241
Figure 4.30: PerCorrect results for CredOMQA using quality for QN=211

242
Table 4.19: PerCorrect and MRR results for CredOMQA using quality for
QN=211
Web-based
QA
system name
MRR PerCorrect percentages at different ranks
Score Sig test
P-value
Top-1 Top-2 Top-3 Top-4 Top-5
LAMP 0.690 6.855E-16
(**)
58.29%
(124)
74.88%
(159)
78.67%
(167)
81.52%
(173)
83.89%
(178)
Qualifier 0.693 1.777E-15
(**)
58.29%
(124)
74.88%
(159)
79.62%
(169)
81.99%
(174)
84.83%
(180)
Corrob 0.732 1.913E-10
(**)
63.98%
(136)
76.30%
(162)
82.94%
(176)
85.78%
(182)
86.26%
(183)
Corrob* 0.751 8.158E-07
(**)
64.45%
(137)
80.09%
(170)
86.26%
(183)
88.63%
(188)
89.57%
(190)
GenreQA 0.755 1.192E-06
(**)
65.88%
(140)
78.20%
(166)
82.94%
(176)
87.20%
(185)
91.47%
(194)
GenreQA* 0.786 0.00908
(**)
70.62%
(150)
81.04%
(172)
86.26%
(183)
88.63%
(188)
91.00%
(193)
OMQA 0.770 3.285E-05
(**)
68.25%
(145)
79.62%
(169)
85.31%
(181)
89.10%
(189)
90.05%
(191)
CredOMQA
(Quality)
0.798 72.51%
(154)
80.57%
(171)
86.26%
(183)
89.57%
(190)
92.42%
(196)
Note: Sig test P-value, the different levels of asterisk represent the following:
(*) indicates significant difference (90% confidence since P-value < 0.10),
(**) indicates significant difference (95% confidence since P-value < 0.05),
and no asterisk means that difference between systems is not significant
Figure 4.30 and Table 4.19 results show CredOMQA(Quality) system achieving the
best results among all other baseline systems. This is because CredOMQA(Quality)
system achieved not only the highest MRR score, but had highest PerCorrect percentages
at all ranks except top-2 rank. Credibility-based QA systems like Corrob* and GenreQA*
fell much shorter in terms of answer accuracy by only being achieve to achieve MRR
scores of 0.751 and 0.786 respectively, where as CredOMQA(Quality) system is almost
0.8.
243
In comparison to other credibility categories, CredOMQA(Quality) system achieved
the highest MRR score. This shows that CredOMQA(Quality) system not only achieved
better results than baseline systems but also achieved optimal results for significantly
improving accuracy of answers. This is also provided in significant testing results as well.
The significant tests share the same picture, clearly showing CredOMQA(Quality)
system having significant difference than baseline system in terms of improvement. At
confidence level 95%, CredOMQA(Quality) system is significantly different than all
baseline systems including GenreQA*. Moreover, CredOMQA(Quality) system is the
only category which still shows significant difference against all baseline systems even if
the confidence level is extended to 99%.
In conclusion, CredOMQA(Quality) system had the most impact in improving
accuracy of OMQA system. This shows that readability and originality scores of the
content have a major impact on improving accuracy of answers (Oh et al., 2012; Wu &
Marian, 2011). These factors not only help assess the credibility of sources but they also
improve the ranking of correct answer, thus improving answer accuracy of the system as
well (Wu & Marian, 2011). Readability makes sure that content writers target most of the
audience on the Web and not a particular group of people (Microsoft Word, 2016). By
keeping the ideal readability level towards college students, it can be ensured that the
content is easily readable by most users on the Web including adults and young students
(List et al., 2017). The second factor, named originality, makes sure that only unique
content is shown to the end users. In case a copy of the original content is found, then
answers found from the given sources is given a low answer score, thus promoting sharing
of original content (Wu & Marian, 2011).
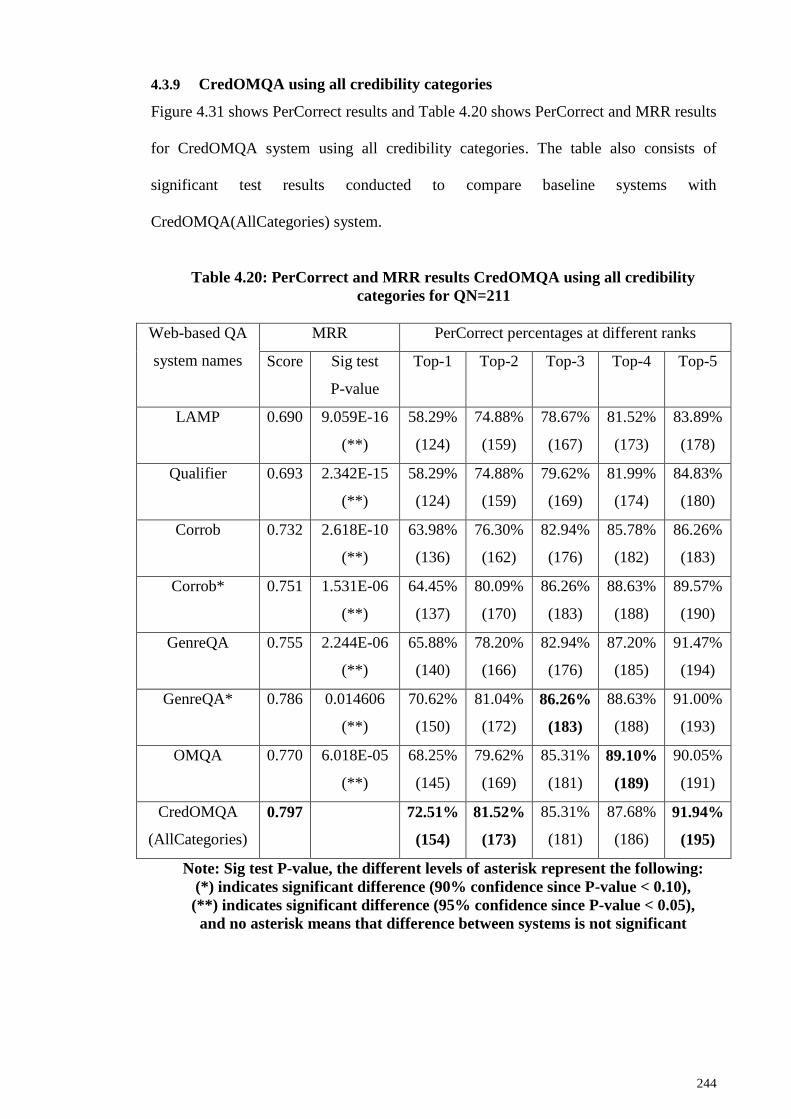
244
4.3.9 CredOMQA using all credibility categories
Figure 4.31 shows PerCorrect results and Table 4.20 shows PerCorrect and MRR results
for CredOMQA system using all credibility categories. The table also consists of
significant test results conducted to compare baseline systems with
CredOMQA(AllCategories) system.
Table 4.20: PerCorrect and MRR results CredOMQA using all credibility
categories for QN=211
Web-based QA
system names
MRR PerCorrect percentages at different ranks
Score Sig test
P-value
Top-1 Top-2 Top-3 Top-4 Top-5
LAMP 0.690 9.059E-16
(**)
58.29%
(124)
74.88%
(159)
78.67%
(167)
81.52%
(173)
83.89%
(178)
Qualifier 0.693 2.342E-15
(**)
58.29%
(124)
74.88%
(159)
79.62%
(169)
81.99%
(174)
84.83%
(180)
Corrob 0.732 2.618E-10
(**)
63.98%
(136)
76.30%
(162)
82.94%
(176)
85.78%
(182)
86.26%
(183)
Corrob* 0.751 1.531E-06
(**)
64.45%
(137)
80.09%
(170)
86.26%
(183)
88.63%
(188)
89.57%
(190)
GenreQA 0.755 2.244E-06
(**)
65.88%
(140)
78.20%
(166)
82.94%
(176)
87.20%
(185)
91.47%
(194)
GenreQA* 0.786 0.014606
(**)
70.62%
(150)
81.04%
(172)
86.26%
(183)
88.63%
(188)
91.00%
(193)
OMQA 0.770 6.018E-05
(**)
68.25%
(145)
79.62%
(169)
85.31%
(181)
89.10%
(189)
90.05%
(191)
CredOMQA
(AllCategories)
0.797 72.51%
(154)
81.52%
(173)
85.31%
(181)
87.68%
(186)
91.94%
(195)
Note: Sig test P-value, the different levels of asterisk represent the following:
(*) indicates significant difference (90% confidence since P-value < 0.10),
(**) indicates significant difference (95% confidence since P-value < 0.05),
and no asterisk means that difference between systems is not significant
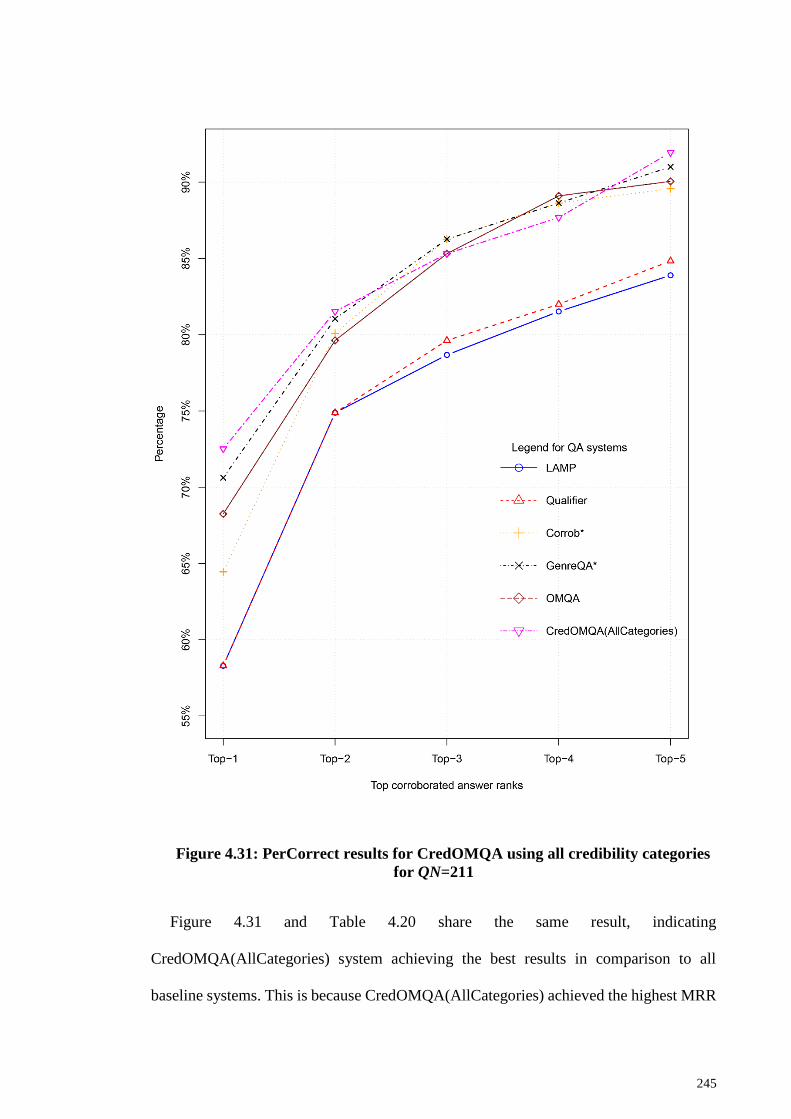
245
Figure 4.31: PerCorrect results for CredOMQA using all credibility categories
for QN=211
Figure 4.31 and Table 4.20 share the same result, indicating
CredOMQA(AllCategories) system achieving the best results in comparison to all
baseline systems. This is because CredOMQA(AllCategories) achieved the highest MRR
246
score and is also able to achieve highest PerCorrect percentages at top-1, top-2 and top-5
ranks.
CredOMQA(AllCategories) also achieves one of the highest MRR and PerCorrect
percentages in comparison to CredOMQA system using individual categories. Though,
its accuracy is not as high as CredOMQA(Quality), it is still able to keep a score closer
to it.
The drastic difference between CredOMQA(AllCategories) and other baseline is
confirmed by looking at the significance test results. The results show that there is
significant difference between CredOMQA(AllCategories) and other baseline systems
including credibility-based Web QA systems like Corrob* and GenreQA*. Moreover,
CredOMQA(AllCategories) is able to achieve this with confidence level at 95%.
In conclusion, credibility answer score showed improved results both in PerCorrect
and MRR. Though when considering all categories, it is possible that
CredOMQA(AllCategories) accuracy is affected by categories such as authority and
currency, that in particular did not perform well . By assigning more weigting to
credibility categories like correctness, professionalism, impartiality and quality, the
accuracy of CredOMQA(AllCategories) can be extended even further (Wu & Marian,
2011). Despite this, credibility answer score still was able to maintain a healthy
percentage by scoring not only higher than baseline systems but also keeping a decent
margin.
4.3.10 CredOMQA system result analysis
In this sub-section, the summary of analysis for CredOMQA system results are
discussed.
247
4.3.10.1 Analyzing impact of α on accuracy of answers
Looking at the impact of α on credibility and its categories, it was seen that the ideal
values were achieved when α was set to 0.75. For other values of α, either CredOMQA
system did not perform well and the results varied as well.. For α=0.75, the PerCorrect
results at top-1 and top-2 improved for almost all categories and in MRR results. This
shows that in order to reach the correct answer quicker it is better to giving more
weighting to frequency while also giving 0.25% of the weighting to credibility (Wu &
Marian, 2011). Moreover, α=0.75 should be preferred as it gives better resulst at higher
PerCorrect ranks (Wu & Marian, 2011).
4.3.10.2 Credibility categories analysis
The research evaluated the impact of credibility categories, including correctness,
authority, currency, professionalism, popularity, impartiality and quality, on answer
scoring with respect to answer accuracy. From the evaluation, it was observed that among
the seven credibility categories, four of them (correctness, professionalism, impartiality
and quality) had a major impact on improving answer accuracy. Especially, quality
category which significantly improved accuracy of answers than other baselines even if
confidence level is extended to 99%. Though, categories like authority, currency and
popularity did not show significant difference in comparison to GenreQA* baseline
system, its accuracy is still higher than it. Moreover, for all other baseline systems, these
three categories also showed significant difference.
Among the different credibility categories, impartiality and quality stood out the most
as they improved the OMQA system’s PerCorrect percentages, i.e. CredOMQA system,
up to 5%-6% at various corroborated ranks. By giving more weighting to these two
categories, the ranking of correct answers is likely to improve further. This is also verified
by looking at the improvement in answer accuracy results for Corrob* and GenreQA*
248
systems, over Corrob and GenreQA respectively, which considered quality category score
for scoring answers. For example, Corrob* system improved its PerCorrect percentage
from 76.30% to 80.09% at top-2 rank, while GenreQA* improved from 65.88% to
70.62%, which is much contributed to the inclusion of quality category score used by
both of these systems. The accuracy of CredOMQA (AllCateogies) can be improved even
further by reducing weighting of the least impactful categories like authority and
currency.
4.3.10.3 Analyzing the impact of credibility-based answer score
In conclusion, credibility answer scores improved answer accuracy not only for
CredOMQA system over OMQA system, but also for Web-based QA systems (Corrob*
and GenreQA*). This certainly shows that considering credibility of sources is useful in
increasing accuracy of the system. Though the credibility assessment algorithm is used
for Web-based QA systems here, it can easily be implemented for other systems used in
networking, education, and health domains which rely on data on the Web for processing
information (Lu et al., 2017; Sbaffi & Rowley, 2017).

249
CHAPTER 5: CONCLUSION
This chapter highlights major contributions made by this research, limitations faced and
possible future directions.
Answers to the research questions
Based on the motivation of the research (covered in section 1.1), three research
questions were raised (covered in section 1.2). In this section, the research discusses the
steps and the objectives met in order to answer these research questions. The research
questions and their answers are discussed below
RQ1. How can credibility of Web pages be measured using credibility
factors?
This research designed an algorithm for measuring credibility of Web pages in order
to achieve RO1 which states “To design an algorithm for measuring credibility of
Web pages”. This algorithm is defined in this thesis in section 3.3.6 and 3.3.8.4. It
uses a number of credibility factors belonging to credibility categories. The research
identified the factors such as readability score, sentiment score, originality score,
content update date, author name, and others scoring different credibility categories
and measuring overall credibility of Web pages
RQ2. What combination(s) of methods and techniques, and credibility
categories improve answer accuracy?
The research designed and developed a Web-based QA system called OMQA system,
in order to answer RQ1 and achieve RO2 which states “To design and develop an
enhanced Web-based QA system with credibility assessment”. This OMQA system
considers methods and techniques used by Web-based QA system and the OMQA

250
system is extended further by including a credibility assessment module named
CredOMQA system (containing credibility categories) for evaluation, as covered in
section 4.1 and 4.3. The research evaluated various methods and techniques and
credibility categories based on answer accuracy evaluation metrics, highlighting that
not all techniques provided equal answer accuracy. Instead, some techniques
performed better than others, while in some cases a combination of techniques
provided better accuracy than the techniques themselves. For example, for sentence-
matching algorithm, keyword matching provide higher answer accuracy than regex
technique. Similarly, combined NER and string-matching techniques achieved higher
accuracy than some individual techniques. Moreover, a number of methods depended
on other methods, using the optimal technique under a particular method which
improved results for other methods as well.
Likewise, some credibility categories like impartiality and quality had more
pronounced impact on answer accuracy. Though, four out seven categories (including
correctness, professionalism, impartiality and quality) improved answer accuracy
significantly, yet three out of these (including authority, currency and popularity)
achieved better but not significant results than systems like GenreQA*. Categories
such has quality and impartiality categories had a major impact on answer accuracy,
having up to 6% higher PerCorrect percentage than other baseline methods.
RQ3. Does considering credibility in answer scoring help in increasing its
answer accuracy?
The results gathered from the CredOMQA (AllCategories) system were analyzed, as
mentioned in RO3 which states “To evaluate the impact of credibility assessment on
accuracy of the answer by means of evaluation and comparison”, to address this
question. Evaluation results, covered in section 4.3.9, show that
251
CredOMQA(AllCategories) system was able to achieve higher answer accuracy than
other baseline QA systems. It highlights that credible Web pages, having higher
credible score, are more likely to contain correct answers thus producing higher
answer accuracy. Thus, inclusion of credible assessment in Web-based systems
improves accuracy of the system.
Major contributions
The research defines a credibility assessment algorithm for evaluating
credibility of resources, including categories that contribute towards it, and
the types of factors it encompasses. (see CHAPTER 2:, section 2.2.3)
It identifies credibility factors found in various information systems, maps
them onto credibility categories and uses them for evaluation of Web pages.
(see CHAPTER 2:, , section 2.2.4 and section 2.3)
The research developed an algorithm designed for measuring credibility of
Web pages, which includes defining of formulae for scoring individual
credibility categories contributing towards overall credibility of a Web source.
(see CHAPTER 3:, section 3.3.7)
The research has developed a prototype Web-based system incorporating a
credibility assessment module called CredOMQA system, employing multiple
methods and techniques identified from literature. (see CHAPTER 3:, section
3.3.4 and section 3.3.7)
This research provides evaluation results for methods and techniques available
in Web-based QA systems, which show that certain techniques, and in some
cases combination of techniques, provide higher answer accuracy than
individual techniques. These results also show relationship of methods with
one another, and how the way improving one method can benefit the other. (see
CHAPTER 4:, section 4.1 and section 4.2)
252
Lastly, it provides evaluation results showing the impact of credibility
assessment on answer accuracy in Web-based QA systems. The CredOMQA
system, using the proposed credibility assessment algorithm, achieved higher
answer accuracy in comparison with the baseline Web-based and credibility-
based Web QA systems tested against. (see CHAPTER 4:, section 4.3)
Implications of research
This research has implication in the following areas
Web-based QA systems: The introduction of credibility assessment in Web-
based QA systems would allow users to have greater confidence in the answer
given by the system, making them more credible and accurate. Moreover,
evaluation results will allow research in selecting optimal methods and techniques
achieving higher answer accuracy.
Web surfing and searching: The research will impact the area of Web surfing,
searching, and other services using Web pages as credibility assessment module
allows the system to generate a credibility score for Web pages, allowing users to
judge its credibility based on the score received in various credibility categories.
It helps users select the most credible source, instead of cross-checking a number
of sources to verify the information given.
Web publishing standards: Use of credibility assessment in Web services will
enforce new Web publishing standards, making content writers provide necessary
credibility details, such as, content publishing date, author details, plagiarism ratio
of content, readability score, etc.
IR, information seeking and heuristics: The research shall have wider
implications because credibility assessment allows researchers/experts in using
new ways to improve answer accuracy. Instead of enhancing and improving

253
retrieval and heuristics methods, sources can be scored with respect to credibility
factors related to them. Thus experts would start considering credibility of sources
to filter out non-credible sources, thus saving precious time and resources spend
on computation.
Diverse domains: The research will impact diverse areas as credibility
assessment would prove beneficial to domains such as education, medical, media,
stocks and networking. Students who are not capable of conducting proper
credibility assessment may use automatic assessment tools to select best sources.
Enforcing credibility standards will highlight official medical Web sites on the
search engines, lowering percentage of fake Websites. Media, where news
required to be accurate and credible, especially on social media, where users are
easily mislead by disinformation and propaganda. Finally, stocks and networking
domains heavily rely on digital market which unfortunately is heavily affected by
fraud and deception. The introduction of credibility assessment in both of these
domains would increase accuracy of data by considering credible sources for IR.
Credibility assessment in online news: Credibility of online news has become
even more important in today’s age due to the rise in fake news on social media
platforms like Twitter and Facebook. Providing automatic credibility assessment
can not only stop false news from spreading but can also force users to go through
a check list of things before news is posted online.
Limitations
Limitations faced by this research are highlighted below:
Processing time: One of the major limitations in this research was the processing time
required to process different methods. Parse Web pages in individual sentences is
among the methods that required a lot of processing time. As the research extracted
254
answers from Web pages, these pages needed to be broken down into individual
sentences, using NLP, in order to apply sentence-matching algorithm onto them.
Considering each query can have up to 100 Web pages, processing all Web pages
required a lot of time (Wu & Marian, 2011). Thus, the max number of Web pages
considered for each query was limited to 20, which still required a decent processing
to time for covering all 211 TREC questions.
Limited literature: Some of the methods available from literature discussed their
working but provided little detail on how to re-produce them (Kolomiyets & Moens,
2011). Regex for sentence-matching is one such example. Literature only provided
some examples on creating regex for a question, without proffering an algorithm for
creating one on another platform (Wang, 2006; Wu & Marian, 2011). Moreover, only
limited examples were covered while the system from literature used only a handful
of regex for a question. Despite these limitations, this research tried to generate enough
regex expressions to provide satisfactory sentence-matching for the system (Bouziane
et al., 2015). Apart from regex sentence-matching, the research faced difficulty in re-
producing question classifiers, probabilistic phrase re-ranking and n-gram score
function.
Limited API transactions: Another limitation faced was limited transactions per day
for APIs used by the system (Aggarwal et al., 2014b). This required delayed evaluation
process as a certain number of days are required to be passed before the transaction
counter is reset.
Limited credibility APIs: Though the research was able to find a handful of APIs for
credibility factors listed in literature, yet there were hardly any APIs available for
certain credibility factors (Aggarwal et al., 2014b). Some of the credibility factors that
could not be included due to unavailability of APIs, include author qualification or
255
experience based on name provided, detecting presence of privacy and security
policies, detecting presence of editorial board and their qualifications, etc (Lu et al.,
2017).
Connectivity issues: Evaluation required running a batch of methods and techniques
in order to generate the desired top answers list or credibility score. At times, due to
internet connectivity issues or disconnection from requested server, data for method
or technique could not be processed successfully. This caused certain queries to be
processed again, or requiring a specific method or technique to be rerun after
identifying it from the list of processes done.
Addressing factoid question type only: The current system is only able to handle
factoid questions only. Thus, there are a number of other question types like list,
definition and procedural questions types that the CredOMQA system cannot handle
at the moment (Gupta & Gupta, 2012). Moreover, among factoid questions, the current
system is only handle person type answers only, which needs to be extended to time,
location and entity types (Gupta & Gupta, 2012).
Lack of semantic-based techniques: It was stated that Web-based QA systems do
not rely on complex techniques for answering questions. However, in some of the
questions sematic-based approaches can play a major role (Ferrucci et al., 2010). For
example, in the question “Name birds that eat snakes”, the QA system needs to
understand the question semantic that the expected answer needs to be birds only
(Molino et al., 2015). Unfortunately, most Web-based QA system types use keyword
for finding answers, where it may only focus on finding sentences mentioning the
keywords bird, snake and eat without focus on the requirement of the question. Thus,
the addition of semantic-based techniques can allow the system to properly understand
the question and provide the correct answer (Höffner et al., 2016).
256
Limited to text-based answering: The current system is able to answer text-based
questions only. There other data types out there where question answering can be
applied including images, videos, and audios. Moreover, the QA system also needs to
extend its capabilities in performing queries on databases and ontologies(Gupta &
Gupta, 2012).
Multiple datasets: Some of the systems reviewed in literature used multiple datasets
for answering questions (Oh et al., 2012). This provides excellent accuracy of answers
as the system can consider a specific dataset for answer questions belonging to a
certain domain (Oh et al., 2012). For example, when dealing with medical questions
the QA system can select medical databases only for answer extraction.
Providing results in real-time: The current system is developed on a PC. The
credibility-based answers generated require question answer processing and Web
pages credibility-assessment to be done. The current system takes around 4-10 mins
to answer a single question. By deploying the CredOMQA system on a powerful server
the questions can be answered in real-time.
Lessons learnt
In this sub-section, the research highlights the lessons learnt from the problems faced
during the course of the study and steps that can be taken to avoid them.
Usage of server: All results were processed on a PC due to which a lot of time needed
to be spent in generating results. Not only that, most of the batch requests need to be done
one at a time since the PC would either take too long to process a particular request or
timeout. This was also one of the limitations of our research as well. This could had been
avoided if the QA system was deployed on a powerful server allow the system to generate
results quickly and also be able to process multiple requests in parallel. Moreover, a server
257
with 24/7 internet, data backup and power backup would had ensured that all transactions
are processed successfully and their backup is also being maintained by the server.
Choice of platform: Our main reason for choosing Php was due to our experience on the
given platform. However, the research faced a lot of issues when trying to find off the
shelf solutions for the given platform, which were easily available on other platforms like
Python and Java. If more time was spent in choosing a platform which offers the most off
the shelf solutions then it would had allowed the research to only include those solution
instead of developing themselves.
Storing results in Databases: Currently all results are saved in text file format. Though
it seemed easier at first but storing results for all methods, techniques, credibility
categories, baseline systems and others is a huge problem. Not only it makes the data
unmanageable but makes it difficult for us to find relevant data. If the results were stored
in relational databases instead it would had allows us to form relationships between
different tables and allow generate results easily using structured query language offered
by a database management system. Moreover, databases is more suitable when multiple
processes are being performed at the same time since it caters for concurrent access.
Full licensed plan for APIs: Due to financial issues of the project only free licensed
APIs were chosen that offered limited transactions only. This caused the project of often
wait until more transactions were available to be performed. By buying a fill licensed plan
for API, the transaction limits could had been avoided allowing the QA system to perform
as much transactions as possible. This would had saved a lot of time and also had allowed
the QA system to generate answer much quickly.
Reviewing Web-based QA systems: A lot of time was spent on reviewing different
Web-based and credibility-based Web QA systems. Reviewing these systems involved
258
identifying methods and techniques, and credibility factors used by these systems. This
process could had been improved by first reviewing survey papers on Web-based QA
systems and credibility-based Web QA systems (Allam & Haggag, 2012; Kolomiyets &
Moens, 2011; Mollá-Aliod & Vicedo, 2010; Webber & Webb, 2010). This is because
most of these survey papers have provided details on most of the methods and techniques
used by Web-based QA system and credibility factors used by them. Moreover, they have
identified the state-of-the-art Web-based QA systems available that can be used for
comparison purposes. By reviewing survey papers first, and then individual Web-based
QA systems would had saved more time and made the process smoother.
OMQA system architecture: The OMQA system architecture went through different
revisions. This is because new modules and its methods were added to it as they were
identified by reviewing different systems. Later on, the research came across survey
papers which have defined model of a general Web-based QA system (Gupta & Gupta,
2012). Thus, different revisions of OMQA system could had been avoided if the model
of general Web-based QA system was followed from the start (Gupta & Gupta, 2012).
Relative scoring: Initially only absolute values of answer scores and credibility factor
scores were used. This caused problems when computing an aggregate score using
multiple scores with different ranges. This problem could had been avoided sooner if the
scores were scored between 0 to 1 instead of their absolute values.
Significant testing: Initially, when computing results only PerCorrect and MRR
evaluation metrics were used. Though these metrics are great for portraying accuracy of
Web-based QA systems, yet they need to be looked into greater detail when comparing
systems having nearly equal MRR scores. It was realized later that significant testing is a
better way of showing significance difference between two systems, instead of providing
evidence by looking at percentages different PerCorrect levels.
259
Future work
This research identifies the following directions for future work.
Evaluating complex question types: The current research conducted evaluation on
Web-based QA systems using factoid questions. It would be interesting to see how answer
accuracy is impacted by credibility factors on complex question types including list,
definition, procedural and others. More importantly, to see whether question
classification such as what, why, where, when and how classifications, and expected
answer types are affected differently or not?
Evaluating semantic-based QA systems: In future, the research would also like to work
on complex systems using machine learning and semantic-based approaches. The
availability of complex methods will allow the research to address some of the complex
question types and also address limitations that were not possible to address using NLP
and IR-based techniques
Semantic-based techniques in credibility assessment: Just like using semantic-based
techniques can assist in improve accuracy of methods and techniques used in question
analysis and answer extraction, it can also be applied to credibility assessment. Semantic-
based techniques can be applied to categories like correctness, authority and currency.
For example, semantic-reasoning can be applied for questions like “Name birds that eat
snakes” where simple sentence-matching keywords might return answers contain
“Snakes that eat birds” instead without understanding the structure and context of the
question. Semantic-based techniques can also be used to build evidence to support an
argument which was not possible using NLP and IR-based techniques.
260
Assigning weights from case to case basis: Individual weights were not assigned to the
categories in the study (i.e. correctness for example was not considered to be more
important than professionalism), hence future studies could further investigate if results
can be improved when specific importance is given to each of the categories (i.e. by
assigning weights).
Multiple datasets: Highlighted in limitations as well, in future research would like to
expand the system to multiple datasets. This would allow the QA system to select the
most appropriate dataset for the question asked and also be able to rate answers fetched
from a specific dataset higher based over others for a given question. Moreover, the
system needs to be expand to make use of databases and ontologies.
Addressing disagreeing views: Disagreeing views is a very interesting topic where a
conclusion facts needs to be drawn from multiple Webpages of equal weightages that are
stating conflicting facts. As an example, the birth date of Napoleon Bonaparte, an
important topic among historians where it is debated whether Napoleon was born French
or Italian, and whether his date of birth is August 15, 1769 or as January 7, 1768 . The
research would like to look into algorithms along with credibility information of Web
sources used to compile factors from multiple sources and suggest conclusive facts
relating to the question asked.
Other data types: The research would also like to explore credibility assessment on other
data types including images and videos. The current research focused primarily on text
data, as dealing with other data types would have required different methods and
techniques for evaluation and even additional and different credibility factors for
credibility evaluation.
261
Other domains: In the future, this research could be expanded also like to evaluate
credibility assessment on other types of systems like social media platforms, blogs,
databases that may be providing stocks, networking and education information. This
would require further research in exploring new credibility factors for evaluating
credibility categories.
Conclusion
The research successfully and categorically answered all the research questions. It also
designed and implemented an algorithm for measuring credibility of Web pages and
developed a prototype credibility-based Web QA system. This prototype system is the
first of its kind to have a dedicated credibility assessment module and to cover all seven
categories concerning credibility of Web sources. This system greatly improved accuracy
of answers in comparison to QA system not using Web credibility assessment. The
research is confident that Web credibility assessment will have wider implications for
improvement of credibility of Web sources.
262
REFERENCES
Abbasi, A., Fatemeh, Mariam, Zahedi, & Kaza, S. (2012). Detecting Fake Medical Web
Sites Using Recursive Trust Labeling. ACM Transactions on Information
Systems, 30(4), 1-36. doi:10.1145/2382438.2382441
Abbasi, A., & Hsinchun, C. (2009). A comparison of fraud cues and classification
methods for fake escrow website detection. Information Technology &
Management, 10(2/3), 83-101. doi:10.1007/s10799-009-0059-0
Abbasi, A., Zhang, Z., Zimbra, D., Chen, H., & Nunamaker Jr, J. F. (2010). Detecting
fake websites: the contribution of statistical learning theory. MIS Quarterly, 34(3),
435-461.
Abdallah, A., Maarof, M. A., & Zainal, A. (2016). Fraud detection system: A survey.
Journal of Network and Computer Applications, 68, 90-113.
doi:http://dx.doi.org/10.1016/j.jnca.2016.04.007
Abney, S., Collins, M., & Singhal, A. (2000). Answer extraction. Paper presented at the
Proceedings of the sixth conference on Applied natural language processing,
Seattle, Washington.
Adkinson, W. F., Eisenach, J. A., & Lenard, T. M. (2002). Privacy online: a report on
the information practices and policies of commercial Websites. Retrieved from
Washington, DC: http://www.pff.org/issues-
pubs/books/020301privacyonlinereport.pdf
Adler, B. T., & Alfaro, L. d. (2007). A content-driven reputation system for the Wikipedia.
Paper presented at the Proceedings of the 16th International Conference on World
Wide Web, Banff, Canada.
Aggarwal, S., Oostendorp, H. V., Reddy, Y. R., & Indurkhya, B. (2014a). Providing Web
Credibility Assessment Support. Paper presented at the Proceedings of the 2014
European Conference on Cognitive Ergonomics, Vienna, Austria.
Aggarwal, S., & Van Oostendorp, H. (2011). An attempt to automate the process of
source evaluation. Proc. of ACE.
Aggarwal, S., Van Oostendorp, H., Reddy, Y. R., & Indurkhya, B. (2014b). Providing
Web Credibility Assessment Support. Paper presented at the Proceedings of the
2014 European Conference on Cognitive Ergonomics, Vienna, Austria.
Ahmad, R., Wang, J., Hercegfi, K., & Komlodi, A. (2011). Different people different
styles: impact of personality style in web sites credibility judgement Human
Interface and the Management of Information. Interacting with Information (pp.
521-527): Springer.
Akamine, S., Kawahara, D., Kato, Y., Nakagawa, T., Inui, K., Kurohashi, S., & Kidawara,
Y. (2009). WISDOM: A web information credibility analysis system. Paper
presented at the Proceedings of the ACL-IJCNLP 2009 Software Demonstrations,
Suntec, Singapore.

263
Alexa API. (2017). Alexa Web Information Service. Retrieved from
http://docs.aws.amazon.com/AlexaWebInfoService/latest/index.html
Alexander, J. E., & Tate, M. A. (1999). Web wisdom: how to evaluate and create Web
page quality on the Web. Hillsdale, NJ: L. Erlbaum Associates Inc.
Allam, A. M. N., & Haggag, M. H. (2012). The question answering systems: A survey.
International Journal of Research and Reviews in Information Sciences (IJRRIS),
2(3).
Allcott, H., & Gentzkow, M. (2017). Social media and fake news in the 2016 election.
Retrieved from
Allemang, D., & Hendler, J. (2011). Semantic Web for the working ontologist: effective
modeling in RDFS and OWL (2 ed.). San Francisco, CA: Morgan Kaufmann.
Amin, A., Zhang, J., Cramer, H., Hardman, L., & Evers, V. (2009). The effects of source
credibility ratings in a cultural heritage information aggregator. Paper presented
at the Proceedings of the 3rd workshop on Information credibility on the web,
Madrid, Spain.
Amsbary, J. H., & Powell, L. (2003). Factors influencing evaluations of Website
information. Psychological Reports, 93(1), 191-198.
Archer, P., Smith, K., & Perego, A. (2008a). Protocol for Web description resources
(POWDER): description resources. Retrieved from Cambridge, MA:
http://www.w3.org/TR/powder-dr/
Archer, P., Smith, K., & Perego, A. (2008b). Protocol for web description resources
(POWDER): Description resources. W3C Working Draft, 14.
Asokan, N., Shoup, V., & Waidner, M. (1998a). Optimistic fair exchange of digital
signatures. In K. Nyberg (Ed.), Advances in Cryptology — EUROCRYPT'98 (Vol.
1403, pp. 591-606). Berlin, Germany: Springer
Asokan, N., Shoup, V., & Waidner, M. (1998b). Optimistic fair exchange of digital
signatures: Springer.
Atique, S., Hosueh, M., Fernandez-Luque, L., Gabarron, E., Wan, M., Singh, O., . . .
Shabbir, S. A. (2016, 16-20 Aug. 2016). Lessons learnt from a MOOC about
social media for digital health literacy. Paper presented at the 2016 38th Annual
International Conference of the IEEE Engineering in Medicine and Biology
Society (EMBC), Orlando, FL, USA.
Australian OA Journal. (2017). Plagiarism detection threshold. Retrieved from
https://www.researchgate.net/post/What_is_your_threshold_when_detecting_pla
giarism
Ayeh, J. K., Au, N., & Law, R. (2013). “Do we believe in TripAdvisor?” Examining
credibility perceptions and online travelers’ attitude toward using user-generated
content. Journal of Travel Research, 52(4), 437-452.

264
Baildon, M., & Damico, J. S. (2009). How do we know?: students examine issues of
credibility with a complicated multimodal Web-based text. Curriculum Inquiry,
39(2), 265-285. doi:10.1111/j.1467-873X.2009.00443.x
Banerjee, P., & Han, H. (2009). Answer credibility: a language modeling approach to
answer validation. Paper presented at the Proceedings of Human Language
Technologies: The 2009 Annual Conference of the North American Chapter of
the Association for Computational Linguistics, Companion Volume: Short
Papers, Boulder, Colorado.
Benassi, P. (1999). TRUSTe: an online privacy seal program. Communications of the
ACM, 42(2), 56-59. doi:10.1145/293411.293461
Bendersky, M., Croft, W. B., & Diao, Y. (2011). Quality-biased ranking of web
documents. Paper presented at the Proceedings of the fourth ACM international
conference on Web search and data mining, Hong Kong, China.
Berners-Lee, T., Hendler, J., & Lassila, O. (2001). The semantic Web. Scientific
American, 284(5), 28-37.
Black, F. S. (1964). A deductive question answering system: Harvard University.
Bosch, A., Bogers, T., & Kunder, M. (2016). Estimating search engine index size
variability: a 9-year longitudinal study. Scientometrics, 107(2), 839-856.
Bouziane, A., Bouchiha, D., Doumi, N., & Malki, M. (2015). Question Answering
Systems: Survey and Trends. Procedia Computer Science, 73, 366-375.
Brandt, D. S. (1996). Evaluating information on the Internet. Computers in Libraries,
16(5), 44-46.
Bråten, I., Strømsø, H. I., & Britt, M. A. (2009). Trust matters: Examining the role of
source evaluation in students' construction of meaning within and across multiple
texts. Reading Research Quarterly, 44(1), 6-28.
Brem, S. K., Russell, J., & Weems, L. (2001). Science on the Web: student evaluations
of scientific arguments. Discourse Processes, 32(2-3), 191-213.
doi:10.1207/s15326950dp3202&3_06
Brill, E., Dumais, S., & Banko, M. (2002a). An analysis of the AskMSR question-
answering system. Paper presented at the Proceedings of the ACL-02 conference
on Empirical methods in natural language processing-Volume 10.
Brill, E., Dumais, S., & Banko, M. (2002b). An analysis of the AskMSR question-
answering system. Paper presented at the Proceedings of the ACL-02 conference
on Empirical methods in natural language processing-Volume 10, Stroudsburg,
PA, USA.
Bruin, J. (2016). Introduction to SAS. UCLA: Statistical Consulting Group. Retrieved
from https://stats.idre.ucla.edu/sas/modules/sas-learning-moduleintroduction-to-
the-features-of-sas/

265
Castillo, C., Mendoza, M., & Poblete, B. (2011). Information credibility on Twitter. Paper
presented at the Proceedings of the 20th International Conference on World Wide
Web, Hyderabad, India.
Caverlee, J., & Liu, L. (2007). Countering web spam with credibility-based link analysis.
Paper presented at the Proceedings of the twenty-sixth annual ACM symposium
on Principles of distributed computing, Portland, Oregon, USA.
Chatterjee, R., & Agarwal, S. (2016). Twitter truths: Authenticating analysis of
information credibility. Paper presented at the Computing for Sustainable Global
Development (INDIACom), 2016 3rd International Conference on, New Delhi,
India.
Chen, J., Diekema, A. R., Taffet, M. D., McCracken, N., & Ozgencil, N. E. (2000).
Question answering: CNLP at the TREC-10 question answering track.
Chesney, T., & Su, D. K. S. (2010). The impact of anonymity on weblog credibility.
International Journal of Human-Computer Studies, 68(10), 710-718.
doi:http://dx.doi.org/10.1016/j.ijhcs.2010.06.001
Cho, K., & Schunn, C. D. (2007). Scaffolded writing and rewriting in the discipline: a
Web-based reciprocal peer review system. Computers & Education, 48(3), 409-
426.
Cho, K., Schunn, C. D., & Wilson, R. W. (2006). Validity and reliability of scaffolded
peer assessment of writing from instructor and student perspectives. Journal of
Educational Psychology, 98(4), 891-901.
Chua, C. E. H., & Wareham, J. (2004). Fighting Internet auction fraud: an assessment and
proposal. Computer, 37(10), 31-37. doi:10.1109/MC.2004.165
Chunxing, W., & Xiaomei, Z. (2011). A watermarking scheme based on digital images'
signatures. Paper presented at the Proceedings of the 2011 International
Conference on Multimedia Technology (ICMT), Hangzhou, China.
CISCO. (2016). Cisco Visual Networking Index. Retrieved from
http://www.cisco.com/c/en/us/solutions/collateral/service-provider/visual-
networking-index-vni/complete-white-paper-c11-481360.html
ComScore. (2016). comScore Explicit Core Search Share Report. Retrieved from
http://www.comscore.com/Insights/Rankings/comScore-Releases-February-
2016-US-Desktop-Search-Engine-Rankings
Creswell, J. W. (2013). Research design: Qualitative, quantitative, and mixed methods
approaches: Sage publications.
Cumming, G., & Finch, S. (2005). Inference by eye: confidence intervals and how to read
pictures of data. American Psychologist, 60(2), 170.
Dawson, V., & Venville, G. J. (2009). High-school students' informal reasoning and
argumentation about biotechnology: an indicator of scientific literacy?
266
International Journal of Science Education, 31(11), 1421-1445.
doi:10.1080/09500690801992870
Dieberger, A., Dourish, P., Höök, K., Resnick, P., & Wexelblat, A. (2000). Social
navigation: techniques for building more usable systems. Interactions, 7(6), 36-
45.
Diffbot. (2016). Diffbot: Web Data Extraction Using Artificial Intelligence. Retrieved
from https://diffbot.com/
Dochterman, M. A., & Stamp, G. H. (2010). Part 1: The Determination of Web
Credibility: A Thematic Analysis of Web User's Judgments. Qualitative Research
Reports in Communication, 11(1), 37-43.
Doyle, D. (2014). What is Keyword Prominence ?
Dumais, S., Banko, M., Brill, E., Lin, J., & Ng, A. (2002). Web question answering: is
more always better? Paper presented at the Proceedings of the 25th Annual
International ACM SIGIR Conference on Research and Development in
Information Retrieval, Tampere, Finland.
Dunjko, V., Wallden, P., & Andersson, E. (2014). Quantum digital signatures without
quantum memory. Physical review letters, 112(4), 040502.
Easton, G. (2007). Clicking for pills. BMJ : British Medical Journal, 334(7583), 14-15.
doi:10.1136/bmj.39063.418391.68
Eysenbach, G., & Köhler, C. (2002). How do consumers search for and appraise health
information on the World Wide Web? Qualitative study using focus groups,
usability tests, and in-depth interviews. BMJ: British Medical Journal, 324(7337),
573-577.
Fader, A., Zettlemoyer, L., & Etzioni, O. (2014). Open question answering over curated
and extracted knowledge bases. Paper presented at the Proceedings of the 20th
ACM SIGKDD international conference on Knowledge discovery and data
mining, New York, New York, USA.
Fallow, D. (2005). Search engine users: Internet searchers are confident, satisfied and
trusting–but they are also unaware and naive. Retrieved from Washington, DC:
http://www.pewinternet.org/files/old-
media/Files/Reports/2005/PIP_Searchengine_users.pdf.pdf
Fallows, D. (2005). Search Engine Users. PEW INTERNET & AMERICAN LIFE
PROJECT. Retrieved from http://www.pewinternet.org/2005/01/23/search-
engine-users/
Ferrucci, D., Brown, E., Chu-Carroll, J., Fan, J., Gondek, D., Kalyanpur, A. A., . . . Prager,
J. (2010). Building Watson: An overview of the DeepQA project. AI magazine,
31(3), 59-79.
Flanagin, A. J., & Metzger, M. J. (2000). Perceptions of Internet information credibility.
Journalism & Mass Communication Quarterly, 77(3), 515-540.

267
Flanagin, A. J., & Metzger, M. J. (2003). The perceived credibility of personal Web page
information as influenced by the sex of the source. Computers in Human
Behavior, 19(6), 683-701.
Flanagin, A. J., & Metzger, M. J. (2007). The role of site features, user attributes, and
information verification behaviors on the perceived credibility of Web-based
information. New Media & Society, 9(2), 319-342.
Flanagin, A. J., & Metzger, M. J. (2008). Digital media and youth: unparalleled
opportunity and unprecedented responsibility. Cambridge, MA: MIT Press.
Fletcher, R., Schifferes, S., & Thurman, N. (2017). Building the ‘Truthmeter’: Training
algorithms to help journalists assess the credibility of social media sources.
Convergence: The International Journal of Research into New Media
Technologies, 23(3), 1-31.
Fogg, B. (2002a). Stanford guidelines for web credibility. Res. Sum. Stanford Persuasive
Tech. Lab.
Fogg, B., Marshall, J., Laraki, O., Osipovich, A., Varma, C., Fang, N., . . . Swani, P.
(2001a). What makes Web sites credible?: a report on a large quantitative study.
Paper presented at the Proceedings of the SIGCHI conference on Human factors
in computing systems.
Fogg, B., Marshall, J., Laraki, O., Osipovich, A., Varma, C., Fang, N., . . . Swani, P.
(2001b). What makes Websites credible?: a report on a large quantitative study.
Paper presented at the Proceedings of the SIGCHI Conference on Human Factors
in Computing Systems, New York, NY.
Fogg, B., Soohoo, C., Danielson, D. R., Marable, L., Stanford, J., & Tauber, E. R.
(2003a). How do users evaluate the credibility of Web sites?: a study with over
2,500 participants. Paper presented at the Proceedings of the 2003 conference on
Designing for user experiences.
Fogg, B., Soohoo, C., Danielson, D. R., Marable, L., Stanford, J., & Tauber, E. R.
(2003b). How do users evaluate the credibility of Websites?: a study with over
2,500 participants. Paper presented at the Proceedings of the 2003 Conference on
Designing for User Experiences, New York, NY.
Fogg, B., & Tseng, H. (1999a). The elements of computer credibility. Paper presented at
the Proceedings of the SIGCHI Conference on Human factors in Computing
Systems: the CHI is the Limit, New York, NY.
Fogg, B. J. (2002b). Stanford guidelines for Web credibility: a research summary from
the Stanford persuasive technology lab. Retrieved from Stanford, CA:
https://credibility.stanford.edu/guidelines/
Fogg, B. J. (2003). Prominence-interpretation theory: explaining how people assess
credibility online. Paper presented at the Proceedings of the Extended Abstracts
on Human Factors in Computing Systems, Ft. Lauderdale, FL.

268
Fogg, B. J., & Tseng, H. (1999b). The elements of computer credibility. Paper presented
at the Proceedings of the SIGCHI conference on Human Factors in Computing
Systems, Pittsburgh, Pennsylvania, USA.
Ford, W., & Baum, M. S. (2000). Secure electronic commerce: building the infrastructure
for digital signatures and encryption (2 ed.). Upper Saddle River, NJ: Prentice
Hall PTR.
Freeman, K. S., & Spyridakis, J. H. (2009a). Effect of contact information on the
credibility of online health information. IEEE Transactions on Professional
Communication, 52(2), 152-166.
Freeman, K. S., & Spyridakis, J. H. (2009b). Effect of contact information on the
credibility of online health information. Professional Communication, IEEE
Transactions on, 52(2), 152-166.
Fritch, J. W., & Cromwell, R. L. (2001). Evaluating Internet resources: Identity,
affiliation, and cognitive authority in a networked world. Journal of the American
Society for Information Science and Technology, 52(6), 499-507.
Fritch, J. W., & Cromwell, R. L. (2002). Delving deeper into evaluation: exploring
cognitive authority on the Internet. Reference Services Review, 30(3), 242-254.
Garson, G. D. (2012). Significance Testing: Statistical Associates Publishers.
Gavish, B., & Tucci, C. L. (2008). Reducing internet auction fraud. Commun. ACM,
51(5), 89-97. doi:10.1145/1342327.1342343
Gehringer, E. F. (2000). Strategies and mechanisms for electronic peer review. Paper
presented at the Proceedings of the 30th Annual Frontiers in Education, Kansas
City, MO.
Gehringer, E. F. (2001). Electronic peer review and peer grading in computer-science
courses. Paper presented at the Proceedings of the thirty-second SIGCSE
Technical Symposium on Computer Science Education, Charlotte, NC.
Geng, G.-G., Wang, L.-M., Wang, W., Hu, A.-L., & Shen, S. (2012). Statistical cross-
language Web content quality assessment. Knowledge-Based Systems, 35, 312-
319.
George, J. F., Giordano, G., & Tilley, P. A. (2016). Website credibility and deceiver
credibility: Expanding Prominence-Interpretation Theory. Computers in Human
Behavior, 54, 83-93.
Giles, J. (2005). Internet encyclopaedias go head to head. Nature, 438(7070), 900-901.
Giudice, K. D. (2010). Crowdsourcing credibility: the impact of audience feedback on
Web page credibility. Paper presented at the Proceedings of the American Society
for Information Science and Technology, Pittsburgh, Pennsylvania.
269
Glassner, A., Weinstock, M., & Neuman, Y. (2005). Pupils' evaluation and generation of
evidence and explanation in argumentation. British Journal of Educational
Psychology, 75, 105-118. doi:10.1348/000709904x22278
Go, E., You, K. H., Jung, E., & Shim, H. (2016). Why do we use different types of
websites and assign them different levels of credibility? Structural relations
among users' motives, types of websites, information credibility, and trust in the
press. Computers in Human Behavior, 54, 231-239.
doi:http://dx.doi.org/10.1016/j.chb.2015.07.046
Gomaa, W. H., & Fahmy, A. A. (2013). A survey of text similarity approaches.
International Journal of Computer Applications, 68(13).
Google. (2017). About PageSpeed Insights. Retrieved from
https://developers.google.com/speed/docs/insights/about
Greenslade, R. (2017). Online news more popular, just about, than news in newspapers.
Retrieved from
https://www.theguardian.com/media/greenslade/2014/jun/25/ofcom-newspapers
Greenwood, M. A., & Saggion, H. (2004). A pattern based approach to answering
factoid, list and definition questions. Paper presented at the Proceedings of the 7th
Recherche d'Information Assistée par Ordinateur, Avignon, France.
Gupta, A., Kumaraguru, P., Castillo, C., & Meier, P. (2014). Tweetcred: Real-time
credibility assessment of content on twitter. Paper presented at the International
Conference on Social Informatics, Barcelona, Spain.
Gupta, A., Lamba, H., & Kumaraguru, P. (2013a, 17-18 Sept. 2013). $1.00 per RT
#BostonMarathon #PrayForBoston: Analyzing fake content on Twitter. Paper
presented at the 2013 APWG eCrime Researchers Summit, San Francisco, CA,
USA.
Gupta, A., Lamba, H., Kumaraguru, P., & Joshi, A. (2013b). Faking Sandy:
characterizing and identifying fake images on Twitter during Hurricane Sandy.
Paper presented at the Proceedings of the 22nd International Conference on World
Wide Web, Rio de Janeiro, Brazil.
Gupta, P., & Gupta, V. (2012). A survey of text question answering techniques.
International Journal of Computer Applications, 53(4).
Gyongi, Z., & Garcia-Molina, H. (2005). Spam: It's Not Just for Inboxes Anymore.
Computer, 38(10), 28-34. doi:10.1109/mc.2005.352
Gyöngyi, Z., Garcia-Molina, H., & Pedersen, J. (2004). Combating web spam with
trustrank. Paper presented at the Proceedings of the Thirtieth international
conference on Very large data bases-Volume 30, Toronto, Canada.
Hailin, H., & Shenghui, S. (2012). Digital copyright protection scheme based on JUNA
lightweight digital signatures. Paper presented at the Proceedings of the 2012
Eighth International Conference on Computational Intelligence and Security,
Guangzhou, China.
270
Halverson, K. L., Siegel, M. A., & Freyermuth, S. K. (2010). Non-science majors' critical
evaluation of Websites in a biotechnology course. Journal of Science Education
and Technology, 19(6), 612-620. doi:10.1007/s10956-010-9227-6
Hao, H., & Su, S. (2012). Digital Copyright Protection Scheme Based on JUNA
Lightweight Digital Signatures. Paper presented at the Computational Intelligence
and Security (CIS), 2012 Eighth International Conference on.
Harabagiu, S. M., Moldovan, D. I., Paşca, M., Mihalcea, R., Surdeanu, M., Bunescu, R.,
. . . Morărescu, P. (2000). Falcon: Boosting knowledge for answer engines.
Harris, F. J. (2008). Challenges to teaching credibility assessment in contemporary
schooling. Digital media, youth, and credibility, 155-179.
Herlocker, J., Jung, S., & Webster, J. G. (2012). Collaborative filtering for digital
libraries.
Hirschman, L., & Gaizauskas, R. (2001). Natural language question answering: the view
from here. Natural Language Engineering, 7(04), 275-300.
Höffner, K., Walter, S., Marx, E., Usbeck, R., Lehmann, J., & Ngonga Ngomo, A.-C.
(2016). Survey on challenges of Question Answering in the Semantic Web.
Semantic Web(Preprint), 1-26.
Hovland, C. I., & Weiss, W. (1951). The influence of source credibility on
communication effectiveness. Public opinion quarterly, 15(4), 635-650.
Hovy, E., Hermjakob, U., & Ravichandran, D. (2002). A question/answer typology with
surface text patterns. Paper presented at the Proceedings of the second
international conference on Human Language Technology Research, San Diego,
California.
Hovy, E. H., Gerber, L., Hermjakob, U., Junk, M., & Lin, C.-Y. (2000). Question
Answering in Webclopedia. Paper presented at the TREC, Gaithersburg,
Maryland.
Hovy, E. H., Hermjakob, U., & Lin, C.-Y. (2001). The Use of External Knowledge of
Factoid QA. Paper presented at the TREC, Gaithersburg, Maryland.
Iding, M. K., Crosby, M. E., Auernheimer, B., & Klemm, E. B. (2009). Web site
credibility: Why do people believe what they believe? Instructional Science,
37(1), 43-63.
Ittycheriah, A., Franz, M., Zhu, W.-J., Ratnaparkhi, A., & Mammone, R. J. (2000). IBM's
Statistical Question Answering System. Paper presented at the TREC.
Jenkins, H., Purushotma, R., Weigel, M., Clinton, K., & Robison, A. J. (2009).
Confronting the challenges of participatory culture: Media education for the 21st
century: Mit Press.

271
Jensen, C., & Potts, C. (2004). Privacy policies as decision-making tools: an evaluation
of online privacy notices. Paper presented at the Proceedings of the SIGCHI
Conference on Human Factors in Computing Systems, Vienna, Austria.
Johnson, T. J., & Kaye, B. K. (2000). Using is believing: the influence of reliance on the
credibility of online political information among politically interested Internet
users. Journalism & Mass Communication Quarterly, 77(4), 865-879.
Johnson, T. J., & Kaye, B. K. (2014). Credibility of social network sites for political
information among politically interested Internet users. Journal of Computer‐
Mediated Communication, 19(4), 957-974.
Jonassen, D., & Driscoll, M. (2003). Handbook of research for educational
communications and technology: a project of the association for educational
communications and technology (2 ed.). Mahwah, NJ: Lawrence Erlbaum
Associates.
Kakol, M., Nielek, R., & Wierzbicki, A. (2017). Understanding and predicting Web
content credibility using the Content Credibility Corpus. Information Processing
& Management, 53(5), 1043-1061.
Kanellopoulos, D. N., & Kotsiantis, S. B. (2007). Semantic Web: a state of the art survey.
International Review on Computers and Software, 2(5), 428-442.
Kapoun, J. (1998). Teaching undergrads Web evaluation: a guide for library instruction.
C&Rl News, 59(7), 522-523.
Karlsson, M., Clerwall, C., & Nord, L. (2017). Do not stand corrected: Transparency and
users’ attitudes to inaccurate news and corrections in online journalism.
Journalism & Mass Communication Quarterly, 94(1), 148-167.
Katz, B. (1997). Annotating the World Wide Web using natural language. Paper presented
at the Computer-Assisted Information Searching on Internet, Montreal, Quebec,
Canada.
Kim, D., & Johnson, T. J. (2009). A shift in media credibility comparing Internet and
traditional news sources in South Korea. International Communication Gazette,
71(4), 283-302.
Kim, K.-S., Sin, S.-C. J., & Yoo-Lee, E. Y. (2014). Undergraduates' use of social media
as information sources. College & Research Libraries, 75(4), 442-457.
Kohut, A., Doherty, D. C., Dimock, M., & Keeter, S. (2008). Key news audiences now
blend online and traditional sources. Pew Research Center Biennial News
Consumption Survey. Retrieved August, 1, 2009.
Kolomiyets, O., & Moens, M.-F. (2011). A survey on question answering technology
from an information retrieval perspective. Information Sciences, 181(24), 5412-
5434.
272
Kolsto, S. D. (2001). 'To trust or not to trust': pupils' ways of judging information
encountered in a socio-scientific issue. International Journal of Science
Education, 23(9), 877-901. doi:10.1080/09500690010016102
Korpan, C. A., Bisanz, G. L., Bisanz, J., & Henderson, J. M. (1997). Assessing literacy
in science: evaluation of scientific news briefs. Science Education, 81(5), 515-
532. doi:10.1002/(sici)1098-237x(199709)81:5<515::aid-sce2>3.0.co;2-d
Kundur, D., & Hatzinakos, D. (1999). Digital watermarking for telltale tamper proofing
and authentication. Proceedings of the IEEE, 87(7), 1167-1180.
doi:10.1109/5.771070
Kwok, C., Etzioni, O., & Weld, D. S. (2001). Scaling question answering to the web.
ACM Transactions on Information Systems, 19(3), 242-262.
Kyza, E. A., & Constantinou, C. P. (2007). STOCHASMOS: a Web-based platform for
reflective, inquiry-based teaching and learning. Cyprus: Learning in Science
Group. Retrieved from
http://www.stochasmos.org/media/Public%20website/STOCHASMOSManual_
English_version.pdf
Kyza, E. A., & Edelson, D. C. (2005). Scaffolding middle school students' coordination
of theory and evidence. Educational Research and Evaluation, 11(6), 545-560.
Lackaff, D., & Cheong, P. H. (2008). Communicating authority online: Perceptions and
interpretations of Internet credibility among college students. Open
Communication Journal, 2, 143-155.
Lankes, R. D. (2008). Trusting the Internet: New approaches to credibility tools. Digital
media, youth, and credibility, 101-122.
Lee, C. J., Sugimoto, C. R., Zhang, G., & Cronin, B. (2013). Bias in peer review. Journal
of the Association for Information Science and Technology, 64(1), 2-17.
Lee, J. Y., Paik, W., & Joo, S. (2012). Information resource selection of undergraduate
students in academic search tasks. Information Research: An International
Electronic Journal, 17(1), n1.
Lewandowski, D. (2012). Credibility in Web search engines. Online credibility and
digital ethos: Evaluating computer-mediated communication, 131-146.
Li, X., & Roth, D. (2002). Learning question classifiers. Paper presented at the
Proceedings of the 19th International Conference on Computational Linguistics,
Taipei, Taiwan.
Li, Y., Gao, J., Meng, C., Li, Q., Su, L., Zhao, B., . . . Han, J. (2016). A survey on truth
discovery. Acm Sigkdd Explorations Newsletter, 17(2), 1-16.
Lippman, J. P., Amurao, F. K., Pellegrino, J. W., & Kershaw, T. C. (2008).
Undergraduate cognitive psychology students' evaluations of scientific arguments
in a contrasting-essays assignment. Paper presented at the Proceedings of the 8th
273
International Conference on International conference for the Learning Sciences,
Utrecht, The Netherlands.
List, A., Alexander, P. A., & Stephens, L. A. (2017). Trust But Verify: Examining the
Association Between Students' Sourcing Behaviors and Ratings of Text
Trustworthiness. Discourse Processes, 54(2), 83-104.
doi:10.1080/0163853X.2016.1174654
Liu, S., Yu, H., Miao, C., & Kot, A. C. (2013a). A fuzzy logic based reputation model
against unfair ratings. Paper presented at the Proceedings of the 12th International
Foundation for Autonomous Agents and Multiagent Systems, St. Paul, MN.
Liu, X., Dong, X. L., Ooi, B. C., & Srivastava, D. (2011). Online data fusion. Proceedings
of the VLDB Endowment, 4(11).
Liu, X., Nielek, R., Wierzbicki, A., & Aberer, K. (2013b). Defending imitating attacks in
Web credibility evaluation systems. Paper presented at the Proceedings of the
22nd International Conference on World Wide Web Companion, Rio de Janeiro,
Brazil.
Liu, Z.-J., Wang, X.-L., Chen, Q.-C., Zhang, Y.-Y., & Xiang, Y. (2014). A Chinese
question answering system based on Web search. Paper presented at the
International Conference on Machine Learning and Cybernetics, Lanzhou, China.
Lohr, S. (2006). This boring headline is written for Google. The New York Times.
Loll, F., & Pinkwart, N. (2009). Using collaborative filtering algorithms as elearning
tools. Paper presented at the Proceedings of the 42nd Hawaii International
Conference on System Sciences, Big Island, HI.
Lopez, V., Uren, V., Sabou, M., & Motta, E. (2011). Is question answering fit for the
semantic web?: a survey. Semantic Web, 2(2), 125-155.
Lu, T.-C., Yu, T., & Chen, S.-H. (2017). Information Manipulation and Web Credibility.
Paper presented at the International Symposium on Distributed Computing and
Artificial Intelligence, Polytechnic of Porto, Portugal.
Magnini, B., Vallin, A., Ayache, C., Erbach, G., Peñas, A., De Rijke, M., . . . Sutcliffe,
R. (2004). Overview of the CLEF 2004 multilingual question answering track.
Paper presented at the Workshop of the Cross-Language Evaluation Forum for
European Languages, Darmstadt, Germany.
Malik, Z., & Bouguettaya, A. (2009). RATEWeb: reputation assessment for trust
establishment among Web services. The International Journal on Very Large
Data Bases, 18(4), 885-911. doi:10.1007/s00778-009-0138-1
Manning, C. D., Surdeanu, M., Bauer, J., Finkel, J., Bethard, S. J., & McClosky, D. (2014,
June 22-27, 2014). The Stanford core NLP natural language processing toolkit.
Paper presented at the Proceedings of 52nd Annual Meeting of the Association
for Computational Linguistics: System Demonstrations, Baltimore, Maryland,
USA.
274
Markham, A. N. (1998). Life online: Researching real experience in virtual space (Vol.
6): Rowman Altamira.
Mathews, J., Holden, C., Jan, M.-F., & Martin, J. (2008). Sick at South Shore beach: a
place-based augmented reality game as a framework for building evidence-based
arguments. Paper presented at the Proceedings of the 8th International Conference
on International conference for the learning sciences Utrecht, The Netherlands.
McCallum, A. (2005). Information Extraction: Distilling Structured Data from
Unstructured Text. Queue, 3(9), 48-57. doi:10.1145/1105664.1105679
Mendoza, M., Poblete, B., & Castillo, C. (2010). Twitter Under Crisis: Can we trust what
we RT? Paper presented at the Proceedings of the first workshop on social media
analytics, Washington D.C., District of Columbia.
Meola, M. (2004). Chucking the checklist: A contextual approach to teaching
undergraduates Web-site evaluation. Portal: Libraries and the Academy, 4(3),
331-344.
Merriam-Webster Inc. (2003). Merriam-Webster's collegiate dictionary (11 ed.).
Springfield, MA: Merriam-Webster, Inc.
Metzger, M., & Hall, E. (2005). Understanding how Internet users make sense of
credibility: A review of the state of our knowledge and recommendations for
theory, policy, and practice. Paper presented at the Symposium on Internet
Credibility and the User.
Metzger, M. J. (2005). Understanding how Internet users make sense of credibility: a
review of the state of our knowledge and recommendations for theory, policy, and
practice. Paper presented at the Symposium on Internet Credibility and the User,
Seattle, WA.
http://projects.ischool.washington.edu/credibility/Metzger%20skills.pdf
Metzger, M. J. (2007). Making sense of credibility on the Web: models for evaluating
online information and recommendations for future research. Journal of the
American Society for Information Science and Technology, 58(13), 2078-2091.
Metzger, M. J., & Flanagin, A. J. (2013). Credibility and trust of information in online
environments: the use of cognitive heuristics. Journal of Pragmatics, 59(B), 210-
220. doi:http://dx.doi.org/10.1016/j.pragma.2013.07.012
Metzger, M. J., Flanagin, A. J., & Medders, R. B. (2010). Social and heuristic approaches
to credibility evaluation online. Journal of Communication, 60(3), 413-439.
Metzger, M. J., Flanagin, A. J., & Zwarun, L. (2003). College student Web use,
perceptions of information credibility, and verification behavior. Computers &
Education, 41(3), 271-290.
Microsoft Word. (2016). Test your document's readability. Test your document's
readability. Retrieved from https://support.office.com/en-us/article/Test-your-
document-s-readability-0adc0e9a-b3fb-4bde-85f4-c9e88926c6aa
275
Miller, N. (2005). Wikipedia and the disappearing “Author”. ETC: A Review of General
Semantics, 62(1), 37-40.
Molino, P., Lops, P., Semeraro, G., de Gemmis, M., & Basile, P. (2015). Playing with
knowledge: A virtual player for “Who Wants to Be a Millionaire?” that leverages
question answering techniques. Artificial Intelligence, 222, 157-181.
Mollá-Aliod, D., & Vicedo, J.-L. (2010). Question answering Handbook of Natural
Language Processing, Second Edition (pp. 485-510): Chapman and Hall/CRC.
Morris, M. R., Counts, S., Roseway, A., Hoff, A., & Schwarz, J. (2012). Tweeting is
believing?: understanding microblog credibility perceptions. Paper presented at
the Proceedings of the ACM 2012 Conference on Computer Supported
Cooperative Work, Seattle, WA.
Mozscape API. (2017). What is Page Authority? Retrieved from
https://moz.com/learn/seo/page-authority
Mulder, R. A., Pearce, J. M., & Baik, C. (2014). Peer review in higher education: Student
perceptions before and after participation. Active Learning in Higher Education,
15(2), 157-171. doi:doi:10.1177/1469787414527391
Najafabadi, M. K., & Mahrin, M. N. r. (2016). A systematic literature review on the state
of research and practice of collaborative filtering technique and implicit feedback.
Artificial Intelligence Review, 45(2), 167-201. doi:10.1007/s10462-015-9443-9
Nakamura, S., Konishi, S., Jatowt, A., Ohshima, H., Kondo, H., Tezuka, T., . . . Tanaka,
K. (2007). Trustworthiness analysis of web search results Research and Advanced
Technology for Digital Libraries (pp. 38-49): Springer.
Ng, J. P., & Kan, M.-Y. (2010). QANUS: An Open-source Question-Answering Platform.
Retrieved from arXiv preprint arXiv:1501.00311
Nicolaidou, I., Kyza, E. A., Terzian, F., Hadjichambis, A., & Kafouris, D. (2011). A
framework for scaffolding students' assessment of the credibility of evidence.
Journal of Research in Science Teaching, 48(7), 711-744.
Nielsen, R. K., & Schrøder, K. C. (2014). The relative importance of social media for
accessing, finding, and engaging with news: an eight-country cross-media
comparison. Digital journalism, 2(4), 472-489.
Offerijns, J. (2012). Keyword analysis in PHP. Retrieved from
http://stackoverflow.com/questions/10721836/keyword-analysis-in-php
Oh, H.-J., Ryu, P.-M., & Kim, H. (2012). Which is the best?: Re-ranking Answers Merged
from Multiple Web Sources. Journal of Emerging Technologies in Web
Intelligence, 4(1), 35-42.
Oh, H.-J., Yoon, Y.-C., & Kim, H. K. (2013). Finding more trustworthy answers: Various
trustworthiness factors in question answering. Journal of Information Science,
39(4), 509-522.
276
Olteanu, A., Peshterliev, S., Liu, X., & Aberer, K. (2013a). Web credibility: features
exploration and credibility prediction. In P. Serdyukov, P. Braslavski, S.
Kuznetsov, J. Kamps, S. Rüger, E. Agichtein, I. Segalovich, & E. Yilmaz (Eds.),
Advances in Information Retrieval (Vol. 7814, pp. 557-568). Berlin, Germany:
Springer.
Olteanu, A., Peshterliev, S., Liu, X., & Aberer, K. (2013b). Web credibility: Features
exploration and credibility prediction Advances in Information Retrieval (pp. 557-
568): Springer.
Ostenson, J. (2014). Reconsidering the checklist in teaching internet source evaluation.
Portal: Libraries and the Academy, 14(1), 33-50.
Pantola, A. V., Pancho-Festin, S., & Salvador, F. (2010a). Rating the raters: a reputation
system for Wiki-like domains. Paper presented at the Proceedings of the 3rd
International Conference on Security of Information and Networks, Taganrog,
Russia.
Pantola, A. V., Pancho-Festin, S., & Salvador, F. (2010b). Rating the raters: a reputation
system for wiki-like domains. Paper presented at the Proceedings of the 3rd
international conference on Security of information and networks, Taganrog,
Rostov-on-Don, Russian Federation.
Papaioannou, T. G., Ranvier, J.-E., Olteanu, A., & Aberer, K. (2012). A decentralized
recommender system for effective Web credibility assessment. Paper presented at
the Proceedings of the 21st ACM International Conference on Information and
Knowledge Management, Maui, HI.
Parsons, M. A., Duerr, R., & Minster, J. B. (2010). Data citation and peer review. Eos,
Transactions American Geophysical Union, 91(34), 297-298.
Pasca, M. A., & Harabagiu, S. M. (2001). High performance question/answering. Paper
presented at the Proceedings of the 24th annual international ACM SIGIR
conference on Research and development in information retrieval, New Orleans,
Louisiana, USA
Pattanaphanchai, J., O'Hara, K., & Hall, W. (2012). HETWIN: helping evaluate the
trustworthiness of web information for web users framework using semantic web
technologies. Paper presented at the Proceedings of the I-SEMANTICS 2012
Posters & Demonstrations Track, Graz, Austria.
Pluta, W. J., Buckland, L. A., Chinn, C. A., Duncan, R. G., & Duschl, R. A. (2008).
Learning to evaluate scientific models. Paper presented at the Proceedings of the
8th International Conference on International conference for the learning sciences,
Utrecht, The Netherlands.
Popat, K., Mukherjee, S., Strötgen, J., & Weikum, G. (2017). Where the Truth Lies:
Explaining the Credibility of Emerging Claims on the Web and Social Media.
Paper presented at the Proceedings of the 26th International Conference on World
Wide Web Companion, Perth, Australia.

277
Prager, J., Chu-Carroll, J., Brown, E. W., & Czuba, K. (2006). Question answering by
predictive annotation Advances in Open Domain Question Answering (pp. 307-
347): Springer.
Purcell, K. (2011). Search and email still top the list of most popular online activities.
Pew Internet & American Life Project, 9.
Radev, D., Fan, W., Qi, H., Wu, H., & Grewal, A. (2005). Probabilistic question
answering on the web. Journal of the American Society for Information Science
and Technology, 56(6), 571-583.
Rainie, L., & Hitlin, P. (2004). Use of online rating systems. Retrieved from Washington,
DC: http://www.pewinternet.org/2004/10/20/use-of-online-rating-systems/
Ramos, J. (2003). Using tf-idf to determine word relevance in document queries. Paper
presented at the Proceedings of the first instructional conference on machine
learning, Piscataway, NJ.
Ravichandran, D., & Hovy, E. (2002). Learning surface text patterns for a question
answering system. Paper presented at the Proceedings of the 40th annual meeting
on association for computational linguistics, Philadelphia, Pennsylvania.
Reiser, B. J. (2004). Scaffolding complex learning: the mechanisms of structuring and
problematizing student work. The Journal of the Learning Sciences, 13(3), 273-
304.
Resnick, P., & Miller, J. (1996). PICS: Internet access controls without censorship.
Communications of the ACM, 39(10), 87-93.
Resnick, P., & Varian, H. R. (1997). Recommender systems. Communications of the
ACM, 40(3), 56-58.
Rieh, S. Y. (2002). Judgment of information quality and cognitive authority in the Web.
Journal of the American Society for Information Science and Technology, 53(2),
145-161.
Rieh, S. Y., & Danielson, D. R. (2007). Credibility: a multidisciplinary framework.
Annual Review of Information Science and Technology, 41(1), 307-364.
Rieh, S. Y., & Hilligoss, B. (2008). College students’ credibility judgments in the
information-seeking process. Digital media, youth, and credibility, 49-72.
Rieh, S. Y., Jeon, G. Y., Yang, J. Y., & Lampe, C. (2014). Audience-Aware Credibility:
From Understanding Audience to Establishing Credible Blogs. Paper presented
at the Proceedings of the Eighth International AAAI Conference on Weblogs and
Social Media Michigan, USA.
Rincon, P. (2016). Why is Pluto no longer a planet? Retrieved from
http://www.bbc.com/news/science-environment-33462184
Robins, D., & Holmes, J. (2008). Aesthetics and credibility in Website design.
Information Processing & Management, 44(1), 386-399.
278
Robins, D., Holmes, J., & Stansbury, M. (2010). Consumer health information on the
Web: the relationship of visual design and perceptions of credibility. Journal of
the American Society for Information Science and Technology, 61(1), 13-29.
Rodrigues, R., Wright, D., & Wadhwa, K. (2013). Developing a privacy seal scheme (that
works). International Data Privacy Law, 3(2), 100-116.
Rosen, D. J. (1998). Driver education for the information superhighway (Vol. 2). Boston,
MA: National Institute for Literacy.
Sanchez, C. A., Wiley, J., & Goldman, S. R. (2006a). Teaching students to evaluate
source reliability during Internet research tasks. Paper presented at the
Proceedings of the 7th international conference on Learning sciences.
Sanchez, C. A., Wiley, J., & Goldman, S. R. (2006b). Teaching students to evaluate
source reliability during internet research tasks. Paper presented at the
Proceedings of the 7th International Conference on Learning Sciences,
Bloomington, Ind.
Sandoval, W. A., & Çam, A. (2011). Elementary children's judgments of the epistemic
status of sources of justification. Science Education, 95(3), 383-408.
Sandoval, W. A., & Millwood, K. A. (2005). The quality of students' use of evidence in
written scientific explanations. Cognition and Instruction, 23(1), 23-55.
doi:10.1207/s1532690xci2301_2
Savolainen, R. (2011). Judging the quality and credibility of information in Internet
discussion forums. Journal of the American Society for Information Science and
Technology, 62(7), 1243-1256. doi:10.1002/asi.21546
Sbaffi, L., & Rowley, J. (2017). Trust and Credibility in Web-Based Health Information:
A Review and Agenda for Future Research. Journal of Medical Internet Research,
19(6), e218.
Schultz, F., Utz, S., & Göritz, A. (2011). Is the medium the message? Perceptions of and
reactions to crisis communication via twitter, blogs and traditional media. Public
Relations Review, 37(1), 20-27.
doi:http://dx.doi.org/10.1016/j.pubrev.2010.12.001
Schwarz, J., & Morris, M. (2011a). Augmenting web pages and search results to support
credibility assessment. Paper presented at the Proceedings of the SIGCHI
Conference on Human Factors in Computing Systems.
Schwarz, J., & Morris, M. (2011b). Augmenting web pages and search results to support
credibility assessment. Paper presented at the Proceedings of the SIGCHI
Conference on Human Factors in Computing Systems, Vancouver, Canada.
Sela, A., Milo-Cohen, O., Ben-Gal, I., & Kagan, E. (2017). Increasing the Flow of
Rumors in Social Networks by Spreading Groups. Computing research
repository, 1704(02095), 1-14.
279
SEOstats. (2017). SEOstats: SEO metrics library for PHP. Retrieved from
https://github.com/eyecatchup/SEOstats
Shan, Y. (2016). How credible are online product reviews? The effects of self-generated
and system-generated cues on source credibility evaluation. Computers in Human
Behavior, 55, 633-641. doi:http://dx.doi.org/10.1016/j.chb.2015.10.013
Shardanand, U., & Maes, P. (1995). Social information filtering: algorithms for
automating “word of mouth”. Paper presented at the Proceedings of the SIGCHI
Conference on Human factors in Computing Systems, Denver, CO.
Shen, X. L., Cheung, C. M., & Lee, M. K. (2013). What leads students to adopt
information from Wikipedia? An empirical investigation into the role of trust and
information usefulness. British Journal of Educational Technology, 44(3), 502-
517.
Shibuki, H., Nagai, T., Nakano, M., Miyazaki, R., Ishioroshi, M., & Mori, T. (2010a). A
method for automatically generating a mediatory summary to verify credibility of
information on the Web. Paper presented at the Proceedings of the 23rd
International Conference on Computational Linguistics: Posters, Beijing.
Shibuki, H., Nagai, T., Nakano, M., Miyazaki, R., Ishioroshi, M., & Mori, T. (2010b). A
method for automatically generating a mediatory summary to verify credibility of
information on the web. Paper presented at the Proceedings of the 23rd
International Conference on Computational Linguistics: Posters.
Shim, B., Ko, Y., & Seo, J. (2005). Extracting and utilizing of IS-A relation patterns for
question answering systems. In G. Lee, A. Yamada, H. Meng, & S. Myaeng
(Eds.), Information Retrieval Technology (Vol. 3689, pp. 697-702). Heidelberg,
Germany: Springer.
Sillence, E., Briggs, P., Harris, P. R., & Fishwick, L. (2007). How do patients evaluate
and make use of online health information? Social Science & Medicine, 64(9),
1853-1862.
Smith, A. G. (1997). Testing the surf: criteria for evaluating Internet information
resources. Public-Access Computer Systems Review, 8(3), 1-14.
Somasundaran, S., Wilson, T., Wiebe, J., & Stoyanov, V. (2007). QA with Attitude:
Exploiting Opinion Type Analysis for Improving Question Answering in On-line
Discussions and the News. Paper presented at the ICWSM.
Song, J., & Zahedi, F. M. (2007). Trust in health infomediaries. Decision Support
Systems, 43(2), 390-407. doi:http://dx.doi.org/10.1016/j.dss.2006.11.011
Soubbotin, M. M., & Soubbotin, S. M. (2001). Patterns of Potential Answer Expressions
as Clues to the Right Answers. Paper presented at the TREC.
Srba, I., & Bielikova, M. (2016). A comprehensive survey and classification of
approaches for community question answering. ACM Transactions on the Web
(TWEB), 10(3), 18.

280
Strømsø, H. I., Bråten, I., & Britt, M. A. (2011). Do students’ beliefs about knowledge
and knowing predict their judgement of texts’ trustworthiness? Educational
Psychology, 31(2), 177-206. doi:10.1080/01443410.2010.538039
Stvilia, B., Twidale, M. B., Smith, L. C., & Gasser, L. (2005). Assessing Information
Quality of a Community-Based Encyclopedia. Paper presented at the In
Proceedings of the 2005 International Conference on Information Quality, MIT,
Cambridge, Massachusetts, USA.
Su, X., & Khoshgoftaar, T. M. (2009). A survey of collaborative filtering techniques.
Advances in Artificial Intelligence, 2009(article ID 421425), 1-19.
doi:10.1155/2009/421425
Subramaniam, M., Taylor, N. G., St. Jean, B., Follman, R., Kodama, C., & Casciotti, D.
(2015). As simple as that? Tween credibility assessment in a complex online
world. Journal of documentation, 71(3), 550-571. doi:10.1108/jd-03-2014-0049
Sullivan, D. (2002). How search engines work. SEARCH ENGINE WATCH, at
http://www. searchenginewatch. com/webmasters/work. html (last updated June
26, 2001)(on file with the New York University Journal of Legislation and Public
Policy).
Tanaka, K. (2010). Web Information Credibility. In L. Chen, C. Tang, J. Yang, & Y. Gao
(Eds.), Web-Age Information Management (Vol. 6184, pp. 781-781): Springer
Berlin Heidelberg.
Tanaka, K., Nakamura, S., Ohshima, H., Yamamoto, Y., Yanbe, Y., & Kato, M. (2010a).
Improving search and information credibility analysis from interaction between
Web1. 0 and Web2. 0 content. Journal of Software, 5(2), 154-159.
Tanaka, K., Ohshima, H., Jatowt, A., Nakamura, S., Yamamoto, Y., Sumiya, K., . . .
Kawai, Y. (2010b). Evaluating credibility of web information. Paper presented at
the Proceedings of the 4th International Conference on Uniquitous Information
Management and Communication, Suwon, Republic of Korea.
Taylor, J. M. B. (2016). Communication Between Educators and Parents in Title I
Elementary Schools. Walden University.
Tellex, S., Katz, B., Lin, J., Fernandes, A., & Marton, G. (2003). Quantitative evaluation
of passage retrieval algorithms for question answering. Paper presented at the
Proceedings of the 26th annual international ACM SIGIR conference on Research
and development in informaion retrieval, Toronto, Canada.
Todd, V., & Hudson, J. C. (2011). Using graded peer evaluation to improve students’
writing skills, critical thinking ability, and comprehension of material in a
principles of public relations course. Journal of College Teaching & Learning,
4(10), 39-46.
Treise, D., Walsh-Childers, K., Weigold, M. F., & Friedman, M. (2003). Cultivating the
science Internet audience: impact of brand and domain on source credibility for
science information. Science Communication, 24(3), 309-332.
doi:10.1177/1075547002250298
281
Tsai, J. Y., Egelman, S., Cranor, L., & Acquisti, A. (2011). The effect of online privacy
information on purchasing behavior: An experimental study. Information Systems
Research, 22(2), 254-268.
Voorhees, E. M. (1999). The TREC-8 Question Answering Track Report. Paper presented
at the TREC, Gaithersburg, Maryland.
Wald, H. S., Dube, C. E., & Anthony, D. C. (2007). Untangling the Web—The impact of
Internet use on health care and the physician–patient relationship. Patient
education and counseling, 68(3), 218-224.
Wallden, P., Dunjko, V., Kent, A., & Andersson, E. (2015). Quantum digital signatures
with quantum-key-distribution components. Physical Review A, 91(4), 042304.
Walraven, A., Brand-Gruwel, S., & Boshuizen, H. P. (2009). How students evaluate
information and sources when searching the World Wide Web for information.
Computers & Education, 52(1), 234-246.
Walraven, A., Brand-Gruwel, S., & Boshuizen, H. P. (2013). Fostering students’
evaluation behaviour while searching the internet. Instructional Science, 41(1),
125-146.
Wang, H.-C., Wang, H.-C., Yang, C.-T., Yang, C.-T., Yen, Y.-H., & Yen, Y.-H. (2017).
Answer selection and expert finding in community question answering services:
A question answering promoter. Program, 51(1), 17-34.
Wang, M. (2006). A survey of answer extraction techniques in factoid question
answering. Computational Linguistics, 1(1).
Wang, P.-Y., & Yang, H.-C. (2012). Using collaborative filtering to support college
students’ use of online forum for English learning. Computers & Education,
59(2), 628-637. doi:http://dx.doi.org/10.1016/j.compedu.2012.02.007
Wang, T., Zou, H., Wei, L. H., & Cui, L. (2013). A trust model award content security
and rating supervision model. Advanced Materials Research, 655, 1765-1769.
Ward, M. (2006). How the Web went world wide. BBC News. Retrieved from
http://news.bbc.co.uk/2/hi/technology/5242252.stm
Wathen, C. N., & Burkell, J. (2002). Believe it or not: Factors influencing credibility on
the Web. Journal of the American Society for Information Science and
Technology, 53(2), 134-144.
Weare, C., & Lin, W. (2000). Content analysis of the World Wide Web. Social Science
Computer Review, 18(3), 272-292.
Web of Trust API. (2017). API - WOT Wiki. Retrieved from
https://www.mywot.com/wiki/API
Webber, B., & Webb, N. (2010). Question answering. The handbook of computational
linguistics and natural language processing, 630-654.
282
Westerwick, A. (2013). Effects of sponsorship, web site design, and Google ranking on
the credibility of online information. Journal of Computer‐Mediated
Communication, 18(2), 80-97.
Wogalter, M. S., & Mayhorn, C. B. (2008). Trusting the internet: Cues affecting perceived
credibility. International Journal of Technology and Human Interaction, 4(1), 75.
World Wide Web Consortium. (2003). Platform for Internet content selection (PICS).
Retrieved from Cambridge, MA: http://www.w3.org/PICS/
Wu, H. K., & Hsieh, C. E. (2006). Developing sixth graders’ inquiry skills to construct
explanations in inquiry‐based learning environments. International Journal of
Science Education, 28(11), 1289-1313.
Wu, K.-W., Huang, S. Y., Yen, D. C., & Popova, I. (2012). The effect of online privacy
policy on consumer privacy concern and trust. Computers in Human Behavior,
28(3), 889-897.
Wu, M., & Marian, A. (2007a). Corroborating answers from multiple Web sources. Paper
presented at the Proceedings of the Tenth International Workshop on the Web and
Databases, Beijing, China.
Wu, M., & Marian, A. (2007b). Corroborating Answers from Multiple Web Sources.
Paper presented at the WebDB.
Wu, M., & Marian, A. (2011). A framework for corroborating answers from multiple web
sources. Information Systems, 36(2), 431-449.
Wu, M., & Marian, A. (2014). Corroborating Facts from Affirmative Statements. Paper
presented at the 17th International Conference on Extending Database
Technology, Athens, Greece.
Wu, Y., Zhang, R., Hu, X., & Kashioka, H. (2007). Learning unsupervised SVM classifier
for answer selection in web question answering.
Yamamoto, Y., & Shimada, S. (2016). Can Disputed Topic Suggestion Enhance User
Consideration of Information Credibility in Web Search? Paper presented at the
Proceedings of the 27th ACM Conference on Hypertext and Social Media,
Halifax, Nova Scotia, Canada.
Yamamoto, Y., & Tanaka, K. (2011a). Enhancing credibility judgment of web search
results. Paper presented at the Proceedings of the SIGCHI Conference on Human
Factors in Computing Systems, Vancouver, Canada.
Yamamoto, Y., & Tanaka, K. (2011b). Enhancing credibility judgment of web search
results. Paper presented at the Proceedings of the SIGCHI Conference on Human
Factors in Computing Systems.
Yamamoto, Y., Tezuka, T., Jatowt, A., & Tanaka, K. (2007). Honto? search: Estimating
trustworthiness of web information by search results aggregation and temporal
analysis Advances in data and web management (pp. 253-264): Springer.
283
Yang, H., & Chua, T.-S. (2002). The integration of lexical knowledge and external
resources for question answering. Paper presented at the Text retrieval
conference, Gaithersburg, Maryland, USA.
Yang, H., & Chua, T.-S. (2003). QUALIFIER: question answering by lexical fabric and
external resources. Paper presented at the Proceedings of the Tenth Conference
on European Chapter of the Association for Computational Linguistics, Budapest,
Hungary.
Yang, H., Chua, T.-S., Wang, S., & Koh, C.-K. (2003). Structured use of external
knowledge for event-based open domain question answering. Paper presented at
the Proceedings of the 26th annual international ACM SIGIR conference on
Research and development in informaion retrieval, Toronto, Canada.
Yang, J., Counts, S., Morris, M. R., & Hoff, A. (2013). Microblog credibility perceptions:
comparing the USA and China. Paper presented at the Proceedings of the 2013
conference on Computer supported cooperative work, San Antonio, Texas, USA.
Yang, Z., Campisi, P., & Kundur, D. (2004). Dual domain watermarking for
authentication and compression of cultural heritage images. IEEE Transactions
on Image Processing, 13(3), 430-448. doi:10.1109/TIP.2003.821552
Yazdanfar, N., & Thomo, A. (2013). LINK RECOMMENDER: Collaborative-Filtering
for Recommending URLs to Twitter Users. Procedia Computer Science, 19, 412-
419. doi:http://dx.doi.org/10.1016/j.procs.2013.06.056
Zembal-Saul, C., Munford, D., Crawford, B., Friedrichsen, P., & Land, S. (2002).
Scaffolding preservice science teachers' evidence-based arguments during an
investigation of natural selection. Research in Science Education, 32(4), 437-463.
doi:10.1023/a:1022411822951
Zhang, D., & Lee, W. S. (2003). A Web-based question answering system. Paper
presented at the Proceedings of the Singapore-MIT Alliance Annual Symposium,
Singapore.
Zhou, G., He, T., Zhao, J., & Hu, P. (2015). Learning Continuous Word Embedding with
Metadata for Question Retrieval in Community Question Answering. Paper
presented at the ACL (1), Beijing, China.
Zhou, G., Zhao, J., He, T., & Wu, W. (2014). An empirical study of topic-sensitive
probabilistic model for expert finding in question answer communities.
Knowledge-Based Systems, 66, 136-145.
284
LIST OF PUBLICATIONS AND PAPERS PRESENTED
Shah, A. A., Ravana, S. D., Hamid, S., & Ismail, M. A. (2015). Web credibility
assessment: affecting factors and assessment techniques. Information Research,
20(1).
Shah, A. A., & Ravana, S. D. (2014). Enhancing Collaborative Learning in Wikis through
an Iterative Model by Supporting Various User Roles. Malaysian Journal of
Computer Science, 27(4).
Shah, A. A., & Ravana, S. D. (2014). Evaluating Information Credibility of Digital
Content using Hybrid Approach. International Journal of Information Systems
and Engineering, 2(1), 92-99.
Shah, A. A., Ravana, S. D., Hamid, S., & Ismail, M. A. (2017). Accuracy Evaluation of
Methods and Techniques in Web-based Question Answering Systems: A Survey.
Knowledge and Information Systems (unpublished), X(X). (initial submission
2016, re-submitted after 2nd revision) (ISI-indexed)
Shah, A. A., Ravana, S. D., Hamid, S., & Ismail, M. A. (2017). Credibility scores for
improving the Accuracy of Answers by Question Answering systems. Aslib
Journal of Information Management (unpublished), X(X). (Draft completed, to be
submitted) (ISI-indexed)