US Students, Poverty, and School Libraries - ERIC
26
Volume 17, 2014 Approved September 11, 2014 ISSN: 2165-1019 www.ala.org/aasl/slr U.S. Students, Poverty, and School Libraries: What Results of the 2009 Programme for International Student Assessment Tell Us Denice Adkins, Associate Professor, School of Information Science & Learning Technologies, University of Missouri, 303 Townsend Hall, Columbia, MO 65211, Tel: (573) 884-9804; Fax: (573) 884-4944 Abstract This paper looks at results from the 2009 Programme for International Student Assessment to examine the effects of school libraries on students’ test performance, with specific focus on the average of students’ family wealth in a school. The paper documents students’ school library use and students’ home possessions to indicate how school libraries support students and which students need that support the most. ANOVA results indicate that poor students (those whose family wealth was in the lowest third) make more use of the school library than their wealthier peers and that poor students’ families are less likely to have information and cultural resources than wealthier students’ families. Hierarchical regression indicates that school libraries and, more specifically, school library adequacy, as defined by the principal’s perception of adequate staffing and materials, account for a small but significant portion of students’ test performance variance. Finally, quantile regression indicates that the benefit of school libraries is not spread evenly, and some students gain more benefit than others. A direct implication of this research is that school libraries have the capacity to better serve poor students but will need the support of policy- and decision-makers before such a change happens. Introduction Many research projects have demonstrated that school libraries make a difference in students’ test performance (e.g., Haycock 2011; Lance 1994; Lance, Rodney, and Schwarz 2010). Most of these studies look at students within the same state or region, comparing test performance between those students who have access to fully stocked and staffed school libraries and students who have lower-quality or no school libraries. In most standardized exams, student-level data is relatively limited. Researchers typically work with student-performance data as the dependent variable predicted by school-level data such as the number of librarians and the quality of the school library.
-
Upload
khangminh22 -
Category
Documents
-
view
2 -
download
0
Transcript of US Students, Poverty, and School Libraries - ERIC

Volume 17, 2014 Approved September 11, 2014 ISSN: 2165-1019 www.ala.org/aasl/slr
U.S. Students, Poverty, and School Libraries: What Results of the 2009 Programme for International Student Assessment Tell Us Denice Adkins, Associate Professor, School of Information Science & Learning Technologies, University of Missouri, 303 Townsend Hall, Columbia, MO 65211, Tel: (573) 884-9804; Fax: (573) 884-4944
Abstract This paper looks at results from the 2009 Programme for International Student Assessment to examine the effects of school libraries on students’ test performance, with specific focus on the average of students’ family wealth in a school. The paper documents students’ school library use and students’ home possessions to indicate how school libraries support students and which students need that support the most. ANOVA results indicate that poor students (those whose family wealth was in the lowest third) make more use of the school library than their wealthier peers and that poor students’ families are less likely to have information and cultural resources than wealthier students’ families. Hierarchical regression indicates that school libraries and, more specifically, school library adequacy, as defined by the principal’s perception of adequate staffing and materials, account for a small but significant portion of students’ test performance variance. Finally, quantile regression indicates that the benefit of school libraries is not spread evenly, and some students gain more benefit than others. A direct implication of this research is that school libraries have the capacity to better serve poor students but will need the support of policy- and decision-makers before such a change happens.
Introduction Many research projects have demonstrated that school libraries make a difference in students’ test performance (e.g., Haycock 2011; Lance 1994; Lance, Rodney, and Schwarz 2010). Most of these studies look at students within the same state or region, comparing test performance between those students who have access to fully stocked and staffed school libraries and students who have lower-quality or no school libraries. In most standardized exams, student-level data is relatively limited. Researchers typically work with student-performance data as the dependent variable predicted by school-level data such as the number of librarians and the quality of the school library.

U.S. Students, Poverty, and School Libraries Volume 17 | ISSN: 2165-1019
The Programme for International Student Assessment (PISA) is an international standardized exam administered every three years, assessing reading, mathematics, and science. In addition to assessing students’ skills and knowledge, PISA collects data about students, including their parents’ jobs, their possessions, and their study habits. PISA also collects data about schools, such as school climate, enrollment, and resources. For each administration, PISA focuses on one of the subject areas and collects supplemental information about that area. PISA 2009 focused on reading and collected data on students’ reading habits and school library use. PISA 2009 was administered to 515,958 students from 18,641 different schools in 72 participating countries or economies. In the United States, 5,233 students from 165 schools participated. While the nature of the study permits international comparisons, it also allows investigators to look at results from one country specifically.
In this study, I used PISA 2009 data to extend Keith Curry Lance’s question about whether school libraries make a difference in student performance, particularly when other predictors are controlled. Because PISA makes information about family wealth available, I compared school library use with students’ family income, dividing total student wealth into three categories and classifying students in the bottom third as “Poor,” the middle third as “Middle,” and the upper third as “Rich.” I also took the opportunity to look at the roles that school libraries play for students taking the PISA 2009 exam. The rationale for this study is to demonstrate the importance of school library resources and personnel to enhance children’s learning across the country and in all three test areas (reading, math, and science). This study also was intended to demonstrate poor children’s needs from school libraries—needs that differ from those of wealthier students. The study has two objectives: to support the argument for school library resource planning based on the needs of neighborhoods or school populations, and to demonstrate that, more than the mere existence of school libraries, their adequacy in staffing and materials is what makes a difference in students’ test performance.
Literature Review In 1992 Keith Curry Lance, Lynda Welborn, and Christine Hamilton-Pennell released the first impact study demonstrating the value of school libraries in helping children meet Colorado educational standards. Since then, numerous impact studies have been conducted across the United States, and all support the idea that school libraries can make a positive difference in student achievement—as long as the school libraries are adequately staffed and adequately resourced. Studies demonstrate that full-time certified school librarians are associated with higher student test scores (Lance and Hofschire 2012; Lance, Rodney, and Hamilton-Pennell 2000; Rodney, Lance, and Hamilton-Pennell 2002). Higher test scores are also associated with students’ access to adequate collections of materials (Lance, Rodney, and Hamilton-Pennell 2000; Rodney, Lance, and Hamilton-Pennell 2002); increased technology access (Lance, Rodney, and Hamilton-Pennell 2000); and increased school library access (Lance, Rodney, and Hamilton-Pennell 2005; Lance, Rodney, and Schwarz 2010).
Previous studies indicate that poor children have less access to books at home than their wealthier peers do (Neuman and Celano 2001; Smith, Constantino, and Krashen 1997). Libraries could fill a need for these children by providing access to resources they do not have at home (Krashen 2011). School libraries have the opportunity to level the playing field, as it were, by giving disadvantaged students increased exposure to reading material, information resources, role models who value reading and learning, and spaces reserved for study.
2 School Library Research | www.ala.org/aasl/slr

U.S. Students, Poverty, and School Libraries Volume 17 | ISSN: 2165-1019
School libraries have been found to be especially helpful for poor children. In Illinois, school library staff size and book and periodical collection sizes have positive relationships with students’ test performance, even controlling for household income (Lance, Rodney, and Hamilton-Pennell 2005). Keith Curry Lance and Linda Hofschire (2012) controlled for poverty when they analyzed the effects of Colorado school library staffing, and they found an association between increased staff and increased scores—even for poor students. Keith Curry Lance and Bill Schwarz (2012) also looked at results for poor, African American, and Hispanic student groups and found that all groups were more likely to score “advanced” in reading and writing with a full-time librarian on staff, access to more and newer school computers, access to databases, and larger book collections.
Nonetheless, other studies indicate that school and public libraries serving poor communities are less common and less well-stocked than those serving wealthier communities (Jue et al. 1999; Koontz 1992; Neuman and Celano 2001; Privesh and Gavigan 2009). As a result, poor students may be doubly disadvantaged in regard to access to learning materials. The PISA 2009 data allows researchers to compare data on school library use based on students’ family wealth levels, to determine whether poor students use school libraries in the same way that rich students do, and to determine whether poor students get the same intellectual benefits from libraries as students with more material wealth.
Susan B. Neuman and Donna C. Celano talk about leveling the playing field for disadvantaged children. The theory behind leveling the playing field suggests that “equalizing resources (funding) has a causal effect on equalizing opportunity” (2006, 176). They documented heavy use of public libraries in poor neighborhoods but noted that increased access to technology did not enable poor students to overcome the achievement gap between them and their middle-class peers. Middle-income children’s library use was done in concert with parents, while low-income children tended to use the library on their own. This suggests that low-income children do need resources but also need role models and guidance to help them learn to use the resources to which they have access. Neuman and Celano further note that merely leveling the playing field is not enough and that to achieve similar gains disadvantaged children need more resources than privileged children (2012).
Findings are not limited to impact studies and research on libraries. Engagement in reading positively impacts test performance (Kirsch et al. 2002; Krashen 1995), even including poverty as a covariate (Krashen, Lee, and McQuillan 2012). Studies in the field of education find that increased investment in schools affects student performance. Using the High School & Beyond data set, Eric Eide and Mark H. Showalter found that increased school expenditures increased test performance for the lowest achievers, those students in need of the most support (1998, 348). Analyzing PISA 2000 data, Michael Fertig and Christoph M. Schmidt found that poor school conditions negatively impacted students’ reading performance and that the negative impact was greater for low achievers (2002, 7). However, in a meta-analysis of four hundred studies, Eric A. Hanushek found no consistent relationship between school resources and test scores, particularly after accounting for family-related variables (1997).
Method
Research Questions
This research project focused on two main questions.
3 School Library Research | www.ala.org/aasl/slr

U.S. Students, Poverty, and School Libraries Volume 17 | ISSN: 2165-1019
• First, do school libraries level the playing field between Poor and wealthier students? In other words, do school libraries provide for Poor students some of the resources and advantages that wealthier students already have?
• Second, does school library adequacy make a difference in student test scores? In other words, if the school library is adequately managed and stocked, will that circumstance be indicated in student test scores?
PISA Exam
PISA is one of three major international standardized exams. The other two, Trends in International Mathematics and Science Study (TIMSS) and Progress in International Reading Literacy Study (PIRLS), collect data on home and school environments, but they focus on younger students and have a longer interval between test administrations. Although PISA is administered to an international population, its careful population selection and weighting strategy allows researchers to evaluate the whole country’s test performance. Unfortunately, PISA divides the United States by region rather than state; this division does not allow researchers to compare one state’s performance against another’s.
An advantage of PISA is its depth of school-level data collection. Data is collected from school principals, students, and a sample of parents. Principals provide information on school policies and practices, governance, and student-teacher relations. In addition to completing the test, students provide data about their parents’ educational background, their material resources, their study habits, and their housing situations. Parents provide information about home literacy practices, their backgrounds, and their involvement with schools. The equivalent national-level exam, the National Assessment of Educational Progress (NAEP), collects information from students about parental education and material resources, but PISA’s coverage of these topics goes into greater detail. State-level standardized exams allow for detailed focus on school characteristics, but do not look at the country as a whole and do not permit state-by-state comparisons.
Population and Sample
The target population for the PISA 2009 assessment was 15-year-old students who were attending school and were in grades 7 or higher (OECD 2012, 58). A two-stage sampling design was used, first selecting schools from national lists of schools and then selecting students from those schools to participate in the PISA assessment. In the United States schools were broken down into eight explicit strata, accounting for public and private schools in four geographic regions, the Northeast, Midwest, South, and West, and implicit strata representing school grade levels, urbanicity, minority status, and three-digit postal code (OECD 2012, 65).
Some schools and some students were intentionally excluded from the target population. Student-level exclusions included those students who had intellectual or physical disabilities that would prevent them from taking the test, and students who were not fluent in the language in which the exam was delivered. School-level exclusions were applied to schools that served only one or two students in the target population or schools that served students who would have been excluded (OECD 2012, 59). A total of 315 students were excluded in the United States sample, and the majority of those were excluded because of severe intellectual disability (OECD 2010, 173–75).
4 School Library Research | www.ala.org/aasl/slr
U.S. Students, Poverty, and School Libraries Volume 17 | ISSN: 2165-1019
After student and school exclusions 5,233 students’ exam results were used to represent 3,373,264 students in the United States (PISA 2010, 173, 177). While the number of students sampled is less than one percent of the population, PISA, using its own criteria, carefully selected students and schools to ensure that the students represented the broad variety of 15-year-old students in the population of study. PISA used a two-stage stratified sampling design. In the first stage, schools were selected from a national list of schools serving 15-year-old students using “systematic Probability Proportional to Size” sampling, where size was “a function of the estimated number of PISA-eligible 15-year-old students enrolled in the school” (OECD 2012, 58). This stratified sampling helped to ensure the sample is representative of the whole, by selectively targeting schools that represent a type (e.g., rural and urban schools, schools in poor neighborhoods, and schools in rich neighborhoods). To ensure that results from one school would not count more heavily than that school was represented in the population, weights were attached to school results, such that results from an over-sampled type of school would be worth a smaller percentage than results from an under-sampled type of school.
Once schools were selected, a list of all the PISA-eligible students in each school was compiled, and a target cluster of roughly thirty-five students was randomly selected from each school’s list. PISA analysts applied student weights to ensure that students and schools from each stratum were adequately represented. Observations from children attending the same school are not truly independent, as children who attend the same schools have the same teachers, attend many of the same classes, and generally come from the same neighborhoods.
Variables
All variables employed came from the PISA 2009 administration. These included ratio-level variables such as student performance on reading, math, and science; number of students, faculty, and computers at a given school; the student-to-teacher ratio; and the computer-to-student ratio. Some ratio-level variables had been standardized based on responses from OECD countries, so the mean value for all respondents in OECD countries is zero, and each unit represents one standard deviation. These standardized variables included family wealth and school library use. Family wealth was made up of several dichotomous variables measuring home possessions, such as whether the student had his or her own bedroom or whether the family owned a dishwasher; students selected that they either had the possessions or that they did not. Another dichotomous variable was whether the school had a library or not.
Ordinal variables included how often the student read various formats, performed computer-mediated activities, or used the school library, with answers ranging from “never” to “several times per week.” Other ordinal variables were used for the principals’ perceptions that shortages of library staff, library materials, computers, Internet connections, and software affected their schools’ ability to provide instruction “Not at all,” “Very little,” “To some extent,” or “A lot.” These ordinal shortage variables were treated as scalar for the purposes of constructing an index variable.
PISA calculates two variables that measure students’ backgrounds. The Wealth index was calculated using selected home possessions, and this index included questions about computers and high-speed Internet access in addition to other items such as guest rooms and musical instruments (OECD 2012, 288). The Educational, Social, and Cultural Status (ESCS) index was calculated from students’ responses as to their home possessions, parental occupation, and parental education (OECD 2012, 312). For ESCS PISA uses the full index of home possessions;
5 School Library Research | www.ala.org/aasl/slr

U.S. Students, Poverty, and School Libraries Volume 17 | ISSN: 2165-1019
included were cultural resources such as books of poetry and classical literature as well as information resources like technical reference books, dictionaries, computers, and an Internet connection.
Wealth and ESCS were very highly correlated, and ESCS used several variables that overlapped with the variables used in this study. For the first analysis, I used each student’s reported value for wealth. I divided that variable into three categories and classified students as Poor, Middle, or Rich based on whether they fell into the lowest, middle, or highest wealth category. Students in the Poor group had wealth values of lower than .0148. Students in the Middle group had wealth values between .0148 and .8094, and students in the Rich group had wealth values above .8094. For the second analysis, to serve as a school-level variable, I used the mean family wealth of all students who took the test at that school.
PISA student score estimates are made using the plausible value imputation method. PISA used thirteen different question sets, so no student answered all of the questions, but many answered overlapping questions. Students’ performance on the questions they answered was then used to predict their overall performance. However, “plausible values are not test scores and should not be treated as such” (OECD 2012, 142). Rather, they are estimates of student performance based on population measures. For each analysis, I use the first plausible value reported for math, reading, and science performance. For the second analysis, I use the mean of the first plausible value for all students reported as having taken the exam at that school; in other words, a school’s reported math performance is the average of the scores from all students from that school.
The PISA school library data are not as complete as data used by other researchers. Keith Curry Lance and Linda Hofschire (2012) and Ken Haycock (2011) had much richer library-related data, including information on school library usage, budgets, collection size, and staff qualifications. The data available through PISA 2009 are merely student reports of school library usage and principals’ perceptions of library adequacy. Though this limited scope of PISA school library data limits the depth of inquiry that can be done with this data set, the categories of school library data collected for PISA do differentiate this study because the collected data focus on the way students and principals think about the school library and whether principals are aware of the potential of the school library.
Analysis and Results
Research Question One: Do school libraries level the playing field between Poor and wealthier students?
The first set of analyses was performed using student-level data, assessing students themselves rather than their schools. These analyses used wealth as an independent variable. Based on their Wealth index scores, students are divided into three equal groups, Poor, Middle, and Rich. Dependent variables in the first set of analyses include students’ test scores, principals’ perceptions of the adequacy of school library resources and computers, students’ reported frequency of school library use, students’ reported types of school library use, and students’ study resources. One-way analysis of variance (ANOVA) was used to determine whether differences in students’ scores exist, based on students’ presence in one of three family wealth groups (Poor, Middle, or Rich). Chi-square analysis was used to analyze differences in students’ library use on the basis of family wealth group, as the student library use variable was collected on an ordinal level.
6 School Library Research | www.ala.org/aasl/slr

U.S. Students, Poverty, and School Libraries Volume 17 | ISSN: 2165-1019
Table 1 presents descriptive statistics from the United States PISA 2009 results. Descriptive statistics show that 97 percent of schools in this distribution had school libraries. Principals felt there was generally not a shortage of school library staff, and, to a slightly lesser extent, not a shortage of library materials.
Table 1. Descriptive statistics for PISA 2009 United States results.
N Minimum Maximum Mean Std. Deviation
Mean Family Wealth 165 -.54 1.62 .3991 .44050 School Library 165 .00 1.00 .9697 .17194 Library Staff Adequacy 165 .00 3.00 2.6485 .75552 Library Materials Adequacy 165 .00 3.00 2.3636 .82706 Computer Adequacy 165 .00 3.00 2.1636 .93242 Internet Adequacy 165 .00 3.00 2.5152 .69498 Software Adequacy 165 .00 3.00 2.3455 .73795 Index Variable for Library Adequacy 165 .00 1.00 .8354 .23713
Index Variable for Technology Adequacy 165 .22 1.00 .7805 .23085
Mean Math Score for School 165 335.53 614.02 484.5258 52.57873 Mean Reading Score for School 165 359.01 635.75 497.4094 50.05673
Mean Science Score for School 165 344.59 658.69 499.2501 53.67108
Analysis of Variance. Rich and Middle students performed better than Poor students in math, reading, and science. Additionally, Rich and Middle students tended to have access to better-staffed and better-stocked school libraries. As shown in table 2, in all assessment areas Rich students had higher test scores than Middle students, and Middle students had higher test scores than Poor students. A one-way ANOVA was calculated for the effects of wealth on math performance, F(2, 5230) = 200.848, p = .000; on reading performance, F(2, 5230) = 146.792, p = .000; and on science performance, F(2, 5230) = 156.259, p = .000.
Table 2. Student performance on PISA 2009 math, reading, and science scales, by wealth classification.
Wealth Scale Math Performance
Reading Performance
Science Performance
Poor Mean 460.2686 474.4866 475.5405
N 1309490 1309490 1309490
Std. Deviation 89.02897 95.33890 96.64048
Middle Mean 487.2653 499.7599 501.4709
N 824009 824009 824009
7 School Library Research | www.ala.org/aasl/slr

U.S. Students, Poverty, and School Libraries Volume 17 | ISSN: 2165-1019
Std. Deviation 85.17713 93.53996 93.44071
Rich Mean 516.0125 526.5624 529.8209
N 1239766 1239766 1239766
Std. Deviation 86.03695 92.19458 93.06050
Total Mean 487.3506 499.7996 501.8242
N 3373264 3373264 3373264
Std. Deviation 90.31264 96.44563 97.45508
Schools for all wealth levels reported the presence of school libraries. Principals felt that 91 percent had adequate library staff, 86 percent had adequate library materials, 75 percent had adequate computers, and 89 percent had adequate Internet connectivity. Principals’ perceptions of resource availability differed in schools attended by Poor, Middle, and Rich students, though. No statistically significant difference was found between the school library presence for Rich, Middle, and Poor students. However, a one-way ANOVA test did reveal a significant difference between wealth groups in the adequacy of school library staff, F(2, 5230) = 17.775, p = .000; school library materials, F(2, 5230) = 16.845, p = .000; computers at school, F(2, 5230) = 14.325, p = .000; and Internet connections at school, F (2, 5230) = 21.558, p = .000.
As illustrated in table 3, school libraries played a far greater role in supporting Poor students than they did in supporting wealthier students. Poor students reported more school library use than Middle or Rich students. An ANOVA test indicated a statistically significant difference in school library use between groups, F (2, 5111) = 18.342, p = .000.
Table 3. Resources available to students at school and at home, and students’ use of resources, by wealth level.
Poor Middle Rich Total Mean N SD Mean N SD Mean N SD Mean N SD School Library Available
.9706 2038 .16908 .9770 1306 .14987 .9815 1889 .13489 .9761 5233 .15271
Students’ Reported Library Use
.3776 1962 .97199 .2454 1289 .97389 .1920 1863 .96875 .2767 5114 .97458
Principal Perceives Sufficient Library Staff Available
.8768 2038 .32870 .9119 1306 .28348 .9317 1889 .25231 .9054 5233 .29268
Principal Perceives Sufficient Library Materials Available
.8248 2038 .38021 .8706 1306 .33577 .8872 1889 .31638 .8588 5233 .34828
Principal Perceives Sufficient Computers Available
.7100 2038 .45387 .7504 1306 .43296 .7840 1889 .41161 .7468 5233 .43489
Principal Perceives Sufficient
.8602 2038 .34691 .8951 1306 .30654 .9248 1889 .26374 .8922 5233 .31013
8 School Library Research | www.ala.org/aasl/slr

U.S. Students, Poverty, and School Libraries Volume 17 | ISSN: 2165-1019
School Internet Available Students Have Place to Study at Home
.8142 1975 .38906 .8917 1283 .31093 .9583 1872 .19988 .8862 5130 .31765
Students Have Desk at Home
.6695 1973 .47050 .8132 1285 .38988 .9084 1867 .28852 .7926 5125 .40549
Students Have Literature at Home
.2475 1968 .38021 .3307 1279 .47066 .4721 1866 .49936 .3503 5113 .47711
Students Have Poetry at Home
.3482 1970 .47653 .3925 1284 .48850 .5110 1867 .50001 .4187 5121 .40653
Students Have Textbooks at Home
.7304 1973 .44389 .7864 1278 .41002 .8583 1877 .34885 .7911 5128 .40653
Chi-square Test for Variance. Regardless of Poor students’ greater use of the school library, it appears all students used it in roughly the same way: Internet use was the most frequently selected use, followed by working on homework, and the general category “learn things.” Because the scales for measures of school library use are ordinal, I used a Chi-square analysis to test for significant differences between wealth groups. For each category, a significant difference between wealth groups was revealed. Table 4 presents grouped median values for each category.
Table 4. Student use of school library based on students’ wealth levels, by grouped median.
Wealth Scale Borrow for Pleasure
Borrow for Work
Work on homework
Read Magazines
Read for Fun
Learn Things
Use the Internet
Poor
Grouped Median .8838 1.1409 1.4665 .7508 .8172 1.2594 2.3689
N 1954 1949 1944 1947 1945 1949 1944
Std. Deviation 1.24547 1.15844 1.47531 1.35122 1.39376 1.49605 1.59476
Middle
Grouped Median .7880 1.1131 1.2758 .6604 .6905 .9369 1.7982
N 1273 1271 1269 1270 1264 1267 1271
Std. Deviation 1.18019 1.09793 1.43272 1.31125 1.31731 1.46619 1.65470
Grouped Median .7546 1.0752 1.1609 .5822 .6589 .8609 1.5938
N 1860 1858 1845 1853 1858 1852 1856
Std. Deviation 1.13185 1.04743 1.40996 1.26227 1.26116 1.43370 1.64738
Total Grouped Median .8106 1.1086 1.3026 .6642 .7247 .9839 1.9434
N 5087 5078 5058 5070 5067 5068 5071
9 School Library Research | www.ala.org/aasl/slr

U.S. Students, Poverty, and School Libraries Volume 17 | ISSN: 2165-1019
Std. Deviation 1.19088 1.10426 1.44371 1.31213 1.33108 1.47109 1.63709
For many students, school libraries are a place to study where they can be reasonably assured of comfort, quiet, and resources to support them. Poor students were less likely than Middle or Rich students to have a desk at home, F(2, 5197) = 103.178, p = .000, or a place to study at home, F (2, 5122) = 180.481, p = .000.
Although the schools attended by Poor students were less likely to have “sufficient” materials than those attended by Middle and Rich students, schools attended by Poor students nonetheless provided them with access to more resources than their homes did. One-way ANOVA tests revealed significant differences in the availability of literature at home, F(2, 5110) = 112.322, p = .000; books of poetry at home, F(2, 5118) = 55.726, p = .000; textbooks at home, F(2, 5125) = 48.628, p = .000; and a dictionary at home, F(2, 5130) = 44.102, p = .000.
Students at all three wealth levels attended schools where their principals wished for more computers and software, though principals were more satisfied with the availability of Internet connections at their schools. School access to computers, software, and Internet connections may serve to even out the extreme disparities between Poor students and their wealthier peers. While 76 percent of Poor students had computers at home, 97 percent of Middle and 99 percent of Rich students did. Results for home Internet connections were similar; Middle and Rich students were more likely to have Internet access at home. One-way ANOVA tests found significant differences between family wealth levels for computers at home, F(2, 5135) = 374.095, p = .000; software at home, F(2, 5102) = 192.536, p = .000; and Internet access at home, F(2, 5135) = 483.881, p = .000.
Research Question Two: Does School Library Adequacy Make a Difference in Student Test Scores?
The second set of analyses used school-level data, asking about schools, their resources, and their effects on scores. Each school’s mean student math, reading, and science scores were dependent variables. Independent variables included presence of a school library and principals’ perceptions of the sufficiency of library staffing, materials, audiovisual materials, computers, software, and Internet connection. Because there was a high degree of correlation between library staff adequacy and library materials adequacy, for regression analyses an index variable was created by adding these scores together and averaging them into a variable called Library Adequacy; a similar Technology Adequacy index variable was created for computers, Internet, and software. Mean Family Wealth was a control variable.
Tests for violation of regression assumptions were mixed. Skewness and kurtosis were near zero for all variables. Scatterplots showed greater variance in the 450–500 score ranges than in the lower or higher score ranges, but not sufficient variance to indicate heteroskedasticity. Tests for normality were mixed: for math, Kolmogorov-Smirnov normality test was non-significant, but Shapiro-Wilk was significant. Both were significant for reading, and both were non-significant for science. Histograms were skewed to the right, but Q–Q plots appeared normal for all three dependent variables.
Tolerance values for all variables were above .10, and variation inflation factors were less than 10, indicating that multicollinearity was not a serious problem. However, a correlation matrix
10 School Library Research | www.ala.org/aasl/slr

U.S. Students, Poverty, and School Libraries Volume 17 | ISSN: 2165-1019
(see Appendix A) showed some strong relationships. Correlations of greater than .5 were found between the principal’s perceptions of whether the school had adequate computers and adequate Internet connectivity; whether the school had adequate school library staffing and adequate school library materials; and whether the school’s library as a whole and technology as a whole were adequate. Mean family wealth variables were also highly correlated with test scores.
Hierarchical Linear Regression. Hierarchical weighted least-squares regression is used to indicate how much variance in performance can be accounted for by individual covariates, as well as providing a general assessment of the contribution of covariates to the dependent variable of test performance. Three hierarchical multiple regression analyses were performed, with math, reading, and science as the dependent variables, and with PISA’s school weights applied. The independent variable initially included was mean family wealth. Initially, regressing on the wealth variable revealed how much variance was explained by wealth. That result, in turn, enabled examination of how much more variance was explained by the presence of the school library and, additionally, by the School Library Adequacy index variable. The Technology Adequacy index variable was added to the final model.
As seen in table 5, the model that predicted math performance as a function of mean family wealth accounted for 52 percent of the variance in mean school math performance. The presence of a school library, as indicated in model 2, accounted for an additional half-percent in variance. Library adequacy accounted for another two percent of variance in performance, and adding adequacy of technology to the analysis accounted for another two percent of variance.
Table 5. Summary of hierarchical regression analysis for variables predicting math performance (N=164).
Model 1 Model 2 Model 3 Model 4 B SE Beta B SE Beta B SE Beta B SE Beta
Constant 440.174 *** 5.374 454.248
*** 12.882 427.489 *** 16.589 450.889
*** 18.622
Mean Family Wealth
107.757 *** 7.958 .728 106.171
*** 8.056 .717 104.962 *** 7.943 .709 104,406
*** 7.808 .705
School Library -15.073 12.543 -.065 -18.906 12.439 -.082 -16.686 12.253 -.072 Library
Adequacy 41.254 ** 6.495 .133 65.527 *** 18.707 .212
Technology Adequacy -57.446
** 22.105 -.157
R2 .529 .534 .551 .569
F 183.353 92.648 65.854 52.844
*p < .10 ** p < .05 ***p < .01
In models 2, 3, and 4, the presence of a school library was not a significant predictor of student math performance. However, the index variable accounting for school library adequacy in staff and materials was revealed as a significant positive predictor of math performance in models 3
11 School Library Research | www.ala.org/aasl/slr

U.S. Students, Poverty, and School Libraries Volume 17 | ISSN: 2165-1019
and 4. A principal’s belief that the school has adequate staffing and adequate materials was associated with a 41-point increase in math performance. Technology adequacy was a significant negative predictor of math performance. A principal’s belief that the school has adequate computers, Internet connections, and software was associated with a 57-point decrease in math performance. This finding may mean that, to allow lower-performing students the opportunity to increase their skills through educational software designed to meet their needs, technology is more often found in schools where students need extra math help. Because this determination was based on principal perceptions rather than hard figures about technology available in the schools, a more negative implication is that principals in schools with low-performing students might have judged their school technology as adequate to the limited abilities of their students, even if their schools do not have the latest and best technology.
Model 1 in table 6 shows that mean family wealth accounted for 57 percent of the variance in mean school reading performance. Adding the school library variable accounted for another 3 percent of variance; adding school library adequacy accounted for another percent, and adding technology adequacy accounted for another two percent of variance.
Table 6. Summary of hierarchical regression analysis for variables predicting reading performance (N=164).
Model 1 Model 2 Model 3 Model 4 B SE Beta B SE Beta B SE Beta B SE Beta
Constant 464.255 *** 4.206 493.068
*** 9.815 480.149 *** 12.786 499.799
*** 14.296
Mean Family Wealth
92.249 *** 6.228 .757 88.997
*** 6.138 .731 88.413 *** 6.122 .726 87.947
*** 5.944 .722
School Library -30.893 *** 9.557 -.163 -32.744
*** 9.588 -.173 -30.880 *** 9.406 -.163
Library Adequacy 19.918 12.714 .078 40.300
*** 14.361 .158
Technology Adequacy -48.238
*** 16.970 -.160
R2 .574 .600 .606 .625
F 219.369 121.267 82.389 66.529S
*p < .10 ** p < .05 ***p < .01
In models 2, 3, and 4, the presence of a school library was a significant negative predictor of reading scores. The presence of a school library was associated with a 31-point decrease in reading performance in model 4. In model 3, the Library Adequacy index variable did not predict student performance. When Technology Adequacy was added in model 4, the Library Adequacy variable did become a significant predictor of reading performance, accounting for 40-point increase in reading performance. However, Technology Adequacy was itself associated with a 48-point decrease in reading performance.
12 School Library Research | www.ala.org/aasl/slr

U.S. Students, Poverty, and School Libraries Volume 17 | ISSN: 2165-1019
Table 7 shows the prediction of science performance in three regression models. The first model with only mean family wealth accounted for 46 percent of variance in science performance. Model 2 (including presence of school library) explained another 5 percent of the variance, model 3 (including school library adequacy) accounted for another 2 percent, and model 4 (including technology adequacy) accounted for another 2 percent.
Table 7. Summary of hierarchical regression analysis for variables predicting science performance (N=164).
Model 1 Model 2 Model 3 Model 4 B SE Beta B SE Beta B SE Beta B SE Beta
Constant 471.059 *** 4.807 508.004
*** 11.125 485.598*** 14.319 506.256
*** 16.023
Mean Family Wealth
83.839 *** 7.118 .678 79.664
*** 6.957 .644 78.606 *** 6.856 .636 78.092
*** 6.718 .632
School Library -39.571 *** 10.832 -.206 -42.925
*** 10.737 -.223 -40.870 *** 10.543 -.212
Library Adequacy 36.087
** 14.238 .140 58.552 *** 16.096 .226
Technology Adequacy -53.167
*** 19.020 -.174
R2 .460 .501 .520 .542
F 138.685 81.267 58.133 47.399
*p < .10 ** p < .05 ***p < .01
Once again, the presence of a school library was a significant negative predictor of science performance. Library adequacy was a significant positive predictor of science performance, associated with a 59-point increase in science performance in model 4. However, technology adequacy was a significant negative predictor of science performance and predicted a 53-point decrease in science performance.
Quantile Regression. Hierarchical regression analysis was supplemented with quantile regression analysis to look at effects across the entire range of test scores, and to determine whether low performers got the same library benefits as higher-level performers. Quantile regression expands on least squares regression by showing how the predictor affects the entire distribution of the data, while linear regression focuses only on the mean of a distribution. In focusing only on the mean, information about the spread of the data is lost. To see if some changes had greater effects on low performers than they did on good performers or vice versa, quantile regression was used to look at the conditional distribution of the data to see the effects of school library variables at different points in the distribution of the dependent variable.
Mean student test scores in math, reading, and science were the dependent variables. Independent variables were mean family wealth, school library, school library adequacy, and technology adequacy. Standard errors were calculated based on the assumption that error terms
13 School Library Research | www.ala.org/aasl/slr
U.S. Students, Poverty, and School Libraries Volume 17 | ISSN: 2165-1019
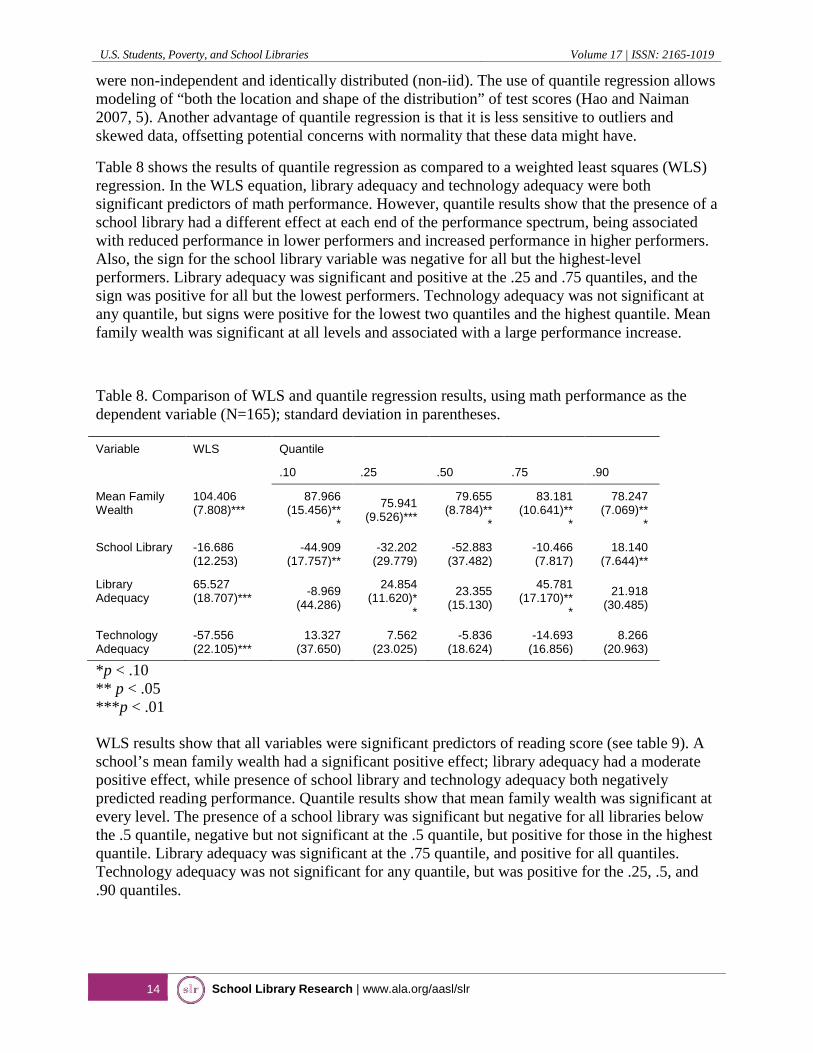
were non-independent and identically distributed (non-iid). The use of quantile regression allows modeling of “both the location and shape of the distribution” of test scores (Hao and Naiman 2007, 5). Another advantage of quantile regression is that it is less sensitive to outliers and skewed data, offsetting potential concerns with normality that these data might have.
Table 8 shows the results of quantile regression as compared to a weighted least squares (WLS) regression. In the WLS equation, library adequacy and technology adequacy were both significant predictors of math performance. However, quantile results show that the presence of a school library had a different effect at each end of the performance spectrum, being associated with reduced performance in lower performers and increased performance in higher performers. Also, the sign for the school library variable was negative for all but the highest-level performers. Library adequacy was significant and positive at the .25 and .75 quantiles, and the sign was positive for all but the lowest performers. Technology adequacy was not significant at any quantile, but signs were positive for the lowest two quantiles and the highest quantile. Mean family wealth was significant at all levels and associated with a large performance increase.
Table 8. Comparison of WLS and quantile regression results, using math performance as the dependent variable (N=165); standard deviation in parentheses.
Variable WLS Quantile
.10 .25 .50 .75 .90
Mean Family Wealth
104.406 (7.808)***
87.966 (15.456)**
*
75.941 (9.526)***
79.655 (8.784)**
*
83.181 (10.641)**
*
78.247 (7.069)**
*
School Library -16.686 (12.253)
-44.909 (17.757)**
-32.202 (29.779)
-52.883 (37.482)
-10.466 (7.817)
18.140 (7.644)**
Library Adequacy
65.527 (18.707)*** -8.969
(44.286)
24.854 (11.620)*
*
23.355 (15.130)
45.781 (17.170)**
*
21.918 (30.485)
Technology Adequacy
-57.556 (22.105)***
13.327 (37.650)
7.562 (23.025)
-5.836 (18.624)
-14.693 (16.856)
8.266 (20.963)
*p < .10 ** p < .05 ***p < .01 WLS results show that all variables were significant predictors of reading score (see table 9). A school’s mean family wealth had a significant positive effect; library adequacy had a moderate positive effect, while presence of school library and technology adequacy both negatively predicted reading performance. Quantile results show that mean family wealth was significant at every level. The presence of a school library was significant but negative for all libraries below the .5 quantile, negative but not significant at the .5 quantile, but positive for those in the highest quantile. Library adequacy was significant at the .75 quantile, and positive for all quantiles. Technology adequacy was not significant for any quantile, but was positive for the .25, .5, and .90 quantiles.
14 School Library Research | www.ala.org/aasl/slr

U.S. Students, Poverty, and School Libraries Volume 17 | ISSN: 2165-1019
Table 9. Comparison of WLS and quantile regression results, using reading performance as the dependent variable (N=165); standard deviation in parentheses.
Variable WLS Quantile
.10 .25 .50 .75 .90
Mean Family Wealth 87.947
(5.994)***
76.264 (9.637)**
*
72.067 (10.865)*
**
88.091 (7.269)*
**
78.433 (6.155)**
*
78.673 (9.109)*
**
School Library -30.880
(9.406)***
-28.614 (13.530)*
*
-39.014 (14.214)*
**
-19.926 (56.657)
9.046 (31.938)
34.896 (8.450)*
**
Library Adequacy
40.300 (14.361)**
*
14.890 (39.248)
21.067 (23.639)
10.081 (15.573)
23.641 (7.937)**
*
34.183 (28.809)
Technology Adequacy
-48.238 (16.970)**
*
11.113 (28.172)
12.461 (24.606)
-4.604 (19.355)
-4.008 (13.801)
1.106 (20.045)
*p < .10 ** p < .05 ***p < .01
The WLS regression of science performance was similar to that of reading: all independent variables were revealed to be significant; wealth and library adequacy were positive, and school library and technology adequacy were negative (see table 10). In the first quantile, only family wealth was a significant predictor of science performance. Family wealth was a significant positive predictor of science performance in the .25 quantile, and the presence of a school library was a significant negative predictor. Mean family wealth and library adequacy were significant predictors in the .5 quantile, while only family wealth remained significant for the .75 quantile. Finally, every variable in the .90 quantile was a significant predictor of science performance.
Table 10. Comparison of WLS and quantile regression results, using science performance as the dependent variable (N=165); standard deviation in parentheses.
Variable WLS Quantile
.10 .25 .50 .75 .90
Mean Family Wealth 78.092
(6.718)***
83.514 (13.961)*
**
77.052 (10.660)*
**
73.570 (9.043)*
**
84.273 (8.273)**
*
88.986 (5.432)*
**
School Library
-40.870 (10.543)**
*
-11.425 (14.421)
-30.914 (9.006)**
*
-1.618 (35.197)
-23.092 (53.586)
26.887 (5.217)*
**
Library Adequacy
58.552 (16.096)**
*
14.480 (39.477)
27.643 (22.365)
44.054 (23.308)
*
7.184 (15.280)
37.900 (7.494)*
**
15 School Library Research | www.ala.org/aasl/slr

U.S. Students, Poverty, and School Libraries Volume 17 | ISSN: 2165-1019
Technology Adequacy
-53.167 (19.020)**
*
16.568 (37.906)
16.953 (25.509)
-32.597 (20.461)
-.053 (20.900)
-16.462 (8.157)*
**
* p < .1 ** p < .05 ***p < .01
Discussion
Research Question One: Do school libraries level the playing field between Poor and wealthier students?
Despite 97 percent of schools having a school library, there is still quite a test score differential between Rich and Poor students. Moreover, a significant difference in principals’ perceptions of library staff, materials, and computer adequacy exists between schools that serve Rich and Poor students. These two results alone suggest that Rich students have better school libraries to work with than Poor students, and even if the school library could level the playing field, it is not doing so in current circumstances.
The school library can provide a safety net for Poor students in offering resources they do not have at home, such as study space, literature and study materials, computer access, and Internet access. Middle and Rich students have home access to resources that Poor children might not have; Middle and Rich students do not necessarily need the school library to provide these resources. Poor students are forced to rely on the school library for these resources. Moreover, Poor students report making greater use of school library resources than Middle or Rich students do, so the resources the school library provides to Poor students are more likely to be used and appreciated. However, because school library access is limited, it seems unlikely that school libraries alone can level the playing field without significant policy changes in the services provided at Poor and Rich schools. This observation echoes public library findings by Neuman and Celano (2006), wherein poor children had a greater quantity but lesser quality of library use, and findings by Lance, Hamilton, and Pennell (1993) that demonstrated that school libraries could positively affect poor students by moving the best-trained librarians to their schools.
Poor students benefit more from libraries and library resources than do Middle or Rich students. School libraries play a significant role in providing space, resources, and services to Poor students. Ironically, this and other studies have found that school libraries serving poor children are less likely to have sufficient resources (Neuman and Celano 2001; Smith, Constantino, and Krashen 1997). This finding suggests that investing resources into poor neighborhoods would yield more return in terms of use than investing those same resources in wealthier neighborhoods.
Research Question Two: Does school library adequacy make a difference in student test scores?
As demonstrated by the regression models that predicted the effects of family wealth, school libraries, school library adequacy, and technology adequacy on student test scores, school libraries in themselves were not shown to make a positive difference in student test scores.
16 School Library Research | www.ala.org/aasl/slr

U.S. Students, Poverty, and School Libraries Volume 17 | ISSN: 2165-1019
However, school library adequacy does make a positive difference. Looking at quantile regression reveals more about the effects of school libraries and school library adequacy at various performance levels. For the bottom 50 percent of performers, school libraries do not positively influence test scores on math, reading, or science. However, having adequate library resources does positively influence students’ reading and science scores. Having adequate technology positively influences math, reading, and science for the lowest performing 25 percent. For the top 10 percent of performers, school libraries and school library adequacy are both positively associated with math, reading, and science scores. However, these top performers would probably be able to take advantage of the resources provided to them even if the resources themselves were inferior.
Students’ family wealth makes a significant difference in student performance in all subject areas, and that effect tends to overwhelm other school effects, including whether the school has a school library or whether that school library is adequately staffed and stocked. Mean family wealth accounts for the most variance in reading performance, and the least variance in science performance. This finding suggests that reading performance is highly dependent on having material resources, namely reading materials, but also family members with sufficient leisure that they can model reading and allow teens to use their free time for reading rather than income-generating activities. The school library fills a dual role for Poor students; it provides both materials and reading role models who can encourage literacy and reading motivation. However, given that low performers have already started at a disadvantage compared to high performers, high performers may reap more of the benefits of these services than do low performers.
Adequate school library resources do make a difference, though. When examining WLS regression, school library adequacy makes a strong positive difference in reading, math, and science performance. The existence of the school library by itself has a significant negative effect on reading and science, and no effect on math performance. While these findings seem damning, they are likely the result of insufficient variance in the school library value as compared to the variance in performance. Simply put, the presence of a school library is not enough to make a prediction about student performance because almost all schools in the PISA population had libraries. This negative effect held true whether students performed well or performed poorly. This negative result is important, though; it tells us that merely having a dedicated library space is insufficient to serve the needs of students. What is more important, especially for low performers, is having resources available and staff who can provide support in using those resources.
Quantile regression results suggest that school libraries currently have an uneven benefit on student performance. The highest performers, in the .90 quantile, generally see a benefit in all subjects from having a school library, and a benefit in science from having adequate library resources. These students are likely to succeed in any case, but the school library gives them an advantage. The lowest performers, students in the .10 quantile, may not be able to benefit from school library services, or may need specialized services customized to their needs and abilities. For a library serving a full population range, adding services to cater to one population extreme may be difficult, especially in schools where library time is a privilege. In math performance, students in the .25 and .75 quantiles benefit significantly from having adequately staffed and stocked school libraries, and the sign for library adequacy is positive for all except the .10 quantile. For reading and science, all library adequacy figures have positive signs, though only the .75 quantile in reading, and the .5 and .9 quantiles in science indicate a significant difference.
17 School Library Research | www.ala.org/aasl/slr

U.S. Students, Poverty, and School Libraries Volume 17 | ISSN: 2165-1019
These findings suggest that better students are more likely to benefit from school library services.
While technology results are not significant, it is interesting to note that the signs for sufficient technological resources are positive for students at the .10 and .25 quantiles, while negative at all higher levels. These findings may suggest that access to technology is a key driver in helping low-performing students advance. As mean family wealth and mean student test results were so highly correlated, these findings could also suggest that access to technology at school helps meet poor students’ needs.
Conclusion This study, like many that came before it, indicates that adequate school libraries are essential to leveling the playing field between poor students and their wealthier peers. It is not necessarily the school library space itself, but the care and attention put into the library by the school, which ultimately results in student achievement. The library as a space is not useful unless it is supported by a caring and competent school librarian who works to stock the school library with the best materials and resources chosen to meet students’ needs.
This study also offers a look at how poor children’s library use compares to the library use of wealthier children. It demonstrates that their library use is similar in nature to the library use of wealthy children, but because their home resources are fewer, Poor children are more dependent upon libraries, especially school libraries, for their resources. Most children in this data set do have general resources like books at home. However, the school library’s role is not only providing books, but providing access to technology, training on how and why to search for information, and instructional support for teachers in all subject areas. Poor children are more likely to need this sort of guidance than their wealthier peers.
For school librarians the take-away message from this study should be that even imperfect data show that the school librarian has an effect on student learning in all areas, not just reading, and that school library resources have more potential to impact poor children than to impact middle-income or wealthy children. School librarians, especially those working with disadvantaged populations, should know that the resources they provide are essential to helping students increase achievement. Library advocates should note the importance of providing resources for poor children, and for helping all students maximize their learning opportunities, not just the wealthiest children or the best performers.
A goal of the American Association of School Librarians is to document a causal relationship between school library factors and student performance. This paper provides some support for that goal, as well as pointing out directions for future research. Though a regression analysis can imply causality by holding the effects of other variables constant, the nature of the variables in this study does not allow for causality to be established. The dependent variables, student test scores, are influenced by societal factors such as teacher expectation and parental background long before the school library can have any effect. Poor students who perform exceptionally well may be more likely to gain access to improved school resources, either through parental actions (moving to a different neighborhood or registering the student at a different address) or through school policies (adding students to gifted and talented programs or sending them to magnet schools).
18 School Library Research | www.ala.org/aasl/slr

U.S. Students, Poverty, and School Libraries Volume 17 | ISSN: 2165-1019
Future research projects might include longitudinal studies of children from different backgrounds, assessing their skills before and after school library interventions. Future studies might include more information about the nature of students’ school library experiences, using qualitative methods to document changes in individual students, or more-specific information about the backgrounds of the students beyond generic definitions of wealth. For instance, some poor children may nonetheless have very extensive cultural exposure, while some rich children may not. Additional research might analyze how and why students use the library, and whether an increase in home resources leads to a decrease in library use. A large-scale research project might seek grant funding to compare three schools in demographically similar areas, using one as a control school, providing one with exceptional library and technological resources in a library, and providing the other with exceptional resources and dedicated interaction time between classes and school librarians. A project like that would need to be carefully monitored to make sure that the school library was the only variable that changed, as, without close documentation of the changes that were made, gains in student performance might be attributed to factors such as teaching style or school administration.
One advantage of a large-scale international survey like PISA is that it provides the chance to look at practices in a variety of countries. This broad base may help school librarians and researchers to determine what interventions work best for particular contexts, and consider alternative strategies to help international and struggling students to make use of school libraries. Another potential gain from international assessments is the broad scope of data collected. In addition to questions about library use, PISA 2009 also included questions about reading preferences, home language use, and very specific information about parental career backgrounds. Analysis of answers to those questions, when correlated with students’ test results, may add to our understanding of what drives student performance and how school libraries might work to build the whole student.
Possibly the most important finding of this study is that poor students make greater use of library resources than rich students. These results suggest that if school administrators devote more resources (including staff) to poor schools, those resources will have higher levels of use than at schools serving students from wealthier families. Similar results have been found for public libraries (e.g., Neuman and Celano 2006). This consistency suggests a role for school library advocacy. Librarians should be advocating for schools to provide the best resources and the best librarians to poor schools, moving beyond merely “leveling” the playing field by providing equal resources. To take full advantage of those resources and gain the kinds of skills and abilities that middle-income and rich children gain at home, Poor children need additional support.
Works Cited Eide, Eric, and Mark H. Showalter. 1998. “The Effects of School Quality on Student
Performance: A Quantile Regression Approach.” Economic Letters 58: 345–50. <http://darp.lse.ac.uk/PapersDB/Eide-Showalter_(EL_98).pdf> (accessed September 20, 2014).
Fertig, Michael, and Christoph M. Schmidt. 2002. “The Role of Background Factors for Reading Literacy: Straight National Scores in the PISA 2000 Study.” IZA Discussion Paper, no. 545. <http://hdl.handle.net/10419/21383> (accessed May 5, 2014).
19 School Library Research | www.ala.org/aasl/slr

U.S. Students, Poverty, and School Libraries Volume 17 | ISSN: 2165-1019
Hanushek, Eric A. 1997. “Assessing the Effects of School Resources on Student Performance: An Update.” Educational Evaluation and Policy Analysis 19 (2): 141–64. <http://hanushek.stanford.edu/sites/default/files/publications/Hanushek%201997%20EduEvaPolAna%2019%282%29.pdf> (accessed May 5, 2014).
Hao, Lingxin, and Daniel Q. Naiman. 2007. Quantile Regression. Thousand Oaks, CA: Sage.
Haycock, Ken. 2011. “Connecting British Columbia (Canada) School Libraries and Student Achievement: A Comparison of Higher and Lower Performing Schools with Similar Overall Funding.” School Libraries Worldwide 17 (1): 37–50.
Jue, Dean K., et al. 1999. “Using Public Libraries to Provide Technology Access for Individuals in Poverty: A Nation-Wide Analysis of Library Market Areas Using a Geographic Information System.” Library and Information Science Research 21 (3): 299–325.
Kirsch, Irwin, et al. 2002. Reading for Change: Performance and Engagement across Countries, Results from PISA 2000. Organisation for Economic Cooperation and Development. <www.oecd.org/edu/school/programmeforinternationalstudentassessmentpisa/33690904.pdf> (accessed May 5, 2014).
Koontz, Christine M. 1992. “Public Library Site Evaluation and Location: Past and Present Market-Based Modelling Tools for the Future.” Library & Information Science Research 14: 379–409. <www.geolib.org/pdf/lisr.pdf> (accessed September 20, 2014).
Krashen, Stephen D. 1995. “School Libraries, Public Libraries, and the NAEP Reading Scores.” School Library Media Quarterly 23 (4). <www.ala.org/aasl/aaslpubsandjournals/slmrb/editorschoiceb/infopower/slctkrashen> (accessed May 5, 2014).
———. 2011. “Protecting Students against the Effects of Poverty: Libraries.” New England Reading Association Journal 46 (2): 17–21.
Krashen, Stephen, Sy-Ying Lee, and Jeff McQuillan. 2012. “Is the Library Important? Multivariate Studies at the National and International Level.” Journal of Language and Literacy Education 8 (1). <http://jolle.coe.uga.edu/wp-content/uploads/2012/06/Is-the-Library-Important.pdf> (accessed May 5, 2014).
Lance, Keith Curry. 1994. “The Impact of School Library Media Centers on Academic Achievement.” School Library Media Quarterly 22 (3). <www.ala.org/aasl/aaslpubsandjournals/slmrb/editorschoiceb/infopower/slctlancehtml> (accessed May 5, 2014).
Lance, Keith Curry, and Hofschire, Linda. 2012. “School Librarian Staffing Linked with Gains in Student Achievement, 2005 to 2011.” Teacher Librarian 39 (6): 15–19.
Lance, Keith Curry, Marcia J. Rodney, and Christine Hamilton-Pennell. 2000. Measuring Up to Standards: The Impact of School Library Programs and Information Literacy in Pennsylvania Schools. Greensburg, PA: Pennsylvania Citizens for Better Libraries. <www.portal.state.pa.us/portal/server.pt/document/699822/measuring_up_to_standards_findings_pdf> (accessed May 5, 2014).
20 School Library Research | www.ala.org/aasl/slr

U.S. Students, Poverty, and School Libraries Volume 17 | ISSN: 2165-1019
———. 2005. Powerful Libraries Make Powerful Learners: The Illinois Study. Canton, IL: Illinois School Library Media Association. <www.islma.org/pdf/ILStudy2.pdf> (accessed May 5, 2014).
Lance, Keith Curry, Marcia J. Rodney, and Bill Schwarz. 2010. “The Impact of School Libraries on Academic Achievement: A Research Study Based on Responses from Administrators in Idaho.” School Library Monthly 26 (9): 14–17. <www.schoollibrarymonthly.com/articles/Lance2010-v26n9p14.html> (accessed September 20, 2014).
Lance, Keith Curry, and Bill Schwarz. 2012. How Pennsylvania School Libraries Pay Off: Investments in Student Achievement and Academic Standards. Louisville, CO: RSL Research Group. <http://files.eric.ed.gov/fulltext/ED543418.pdf> (accessed May 5, 2014).
Lance, Keith Curry, Lynda Welborn, and Christine Hamilton-Pennell. 1992. The Impact of School Library Media Centers on Academic Achievement. Denver, CO: Colorado Dept. of Education. <http://files.eric.ed.gov/fulltext/ED353989.pdf> (accessed May 5, 2014).
Neuman, Susan B., and Donna Celano. 2001. “Access to Print in Low-Income and Middle-Income Communities: An Ecological Study of Four Neighborhoods.” Reading Research Quarterly 36 (1): 8–26.
———. 2006. “The Knowledge Gap: Implications of Leveling the Playing Field for Low-Income and Middle-Income Children.” Reading Research Quarterly 41 (2): 176–201.
———. 2012. “Don’t Level the Playing Field: Tip It toward the Underdogs.” American Educator 36 (3): 20–21.
Organisation for Economic Cooperation and Development. 2010. PISA 2009 Results: What Students Know and Can Do—Student Performance in Reading, Mathematics, and Science (Volume I). <http://dx.doi.org/10.1787/9789264091450-en> (accessed May 5, 2014).
———. 2012. PISA 2009 Technical Report. <http://dx.doi.org/10.1787/9789264167872-en> (accessed May 5, 2014).
Privesh, Shana, and Karen Gavigan. 2009. “Equal Opportunity? Poverty and Characteristics of School Library Media Centers.” Library Media Connection 27 (5): 20–22.
Rodney, Marcia J., Keith Curry Lance, and Christine Hamilton-Pennell. 2002. Make the Connection: Quality School Library Media Programs Impact Academic Achievement in Iowa. Bettendorf, IA: Iowa Area Education Agencies. <www.iowaaeaonline.org/pages/uploaded_files/Make%20The%20Connection.pdf> (accessed May 5, 2014).
Smith, Courtney, Rebecca Constantino, and Stephen Krashen. 1997. “Differences in Print Environment for Children in Beverly Hills, Compton, and Watts.” Emergency Librarian 24 (4): 8–9.
21 School Library Research | www.ala.org/aasl/slr

Appendix A. Correlation Matrix for School-Level Variables Mean
Family
Wealth
School
Library
Library
Staff
Adequa
cy
Library
Material
s
Adequa
cy
Comput
er
Adequc
y
Internet
Adequa
cy
Softwar
e
Adequa
cy
Audiovis
ual
Material
s
Adequa
cy
Library
Adequa
cy
Technol
ogy
Adequa
cy
Mean
Math
Score
for
School
Mean
Reading
Score
for
School
Mean
Science
Score
for
School
Mean Family
Wealth
Pearson
Correlation 1 .043 .162* .225** .176* .172* .161* .175* .217** .194* .710** .708** .686**
Sig. (2-
tailed)
.584 .038 .004 .024 .027 .038 .024 .005 .012 .000 .000 .000
N 165 165 165 165 165 165 165 165 165 165 165 165 165
School Library
Pearson
Correlation .043 1 .011 .121 -.083 -.073 -.109 -.059 .076 -.100 .118 .069 .055
Sig. (2-
tailed) .584
.885 .122 .289 .354 .163 .452 .330 .200 .130 .380 .482
N 165 165 165 165 165 165 165 165 165 165 165 165 165
Library Staff
Adequacy
Pearson
Correlation .162* .011 1 .616** .342** .301** .328** .404** .889** .371** .189* .179* .193*
Sig. (2-
tailed) .038 .885
.000 .000 .000 .000 .000 .000 .000 .015 .021 .013
N 165 165 165 165 165 165 165 165 165 165 165 165 165
Library
Materials
Adequacy
Pearson
Correlation .225** .121 .616** 1 .523** .372** .582** .630** .908** .566** .287** .270** .264**
Sig. (2-
tailed) .004 .122 .000
.000 .000 .000 .000 .000 .000 .000 .000 .001
N 165 165 165 165 165 165 165 165 165 165 165 165 165

U.S. Students, Poverty, and School Libraries Volume 17 | ISSN: 2165-1019
Mean
Family
Wealth
School
Library
Library
Staff
Adequa
cy
Library
Material
s
Adequa
cy
Comput
er
Adequc
y
Internet
Adequa
cy
Softwar
e
Adequa
cy
Audiovis
ual
Material
s
Adequa
cy
Library
Adequa
cy
Technol
ogy
Adequa
cy
Mean
Math
Score
for
School
Mean
Reading
Score
for
School
Mean
Science
Score
for
School
Computer
Adequacy
Pearson
Correlation .176* -.083 .342** .523** 1 .622** .688** .538** .486** .901** .172* .176* .156*
Sig. (2-
tailed) .024 .289 .000 .000
.000 .000 .000 .000 .000 .027 .023 .046
N 165 165 165 165 165 165 165 165 165 165 165 165 165
Internet
Adequacy
Pearson
Correlation .172* -.073 .301** .372** .622** 1 .650** .412** .376** .844** .167* .145 .141
Sig. (2-
tailed) .027 .354 .000 .000 .000
.000 .000 .000 .000 .032 .063 .071
N 165 165 165 165 165 165 165 165 165 165 165 165 165
Software
Adequacy
Pearson
Correlation .161* -.109 .328** .582** .688** .650** 1 .740** .513** .881** .187* .206** .162*
Sig. (2-
tailed) .038 .163 .000 .000 .000 .000
.000 .000 .000 .016 .008 .038
N 165 165 165 165 165 165 165 165 165 165 165 165 165
Audiovisual
Materials
Adequacy
Pearson
Correlation .175* -.059 .404** .630** .538** .412** .740** 1 .581** .642** .227** .224** .179*
Sig. (2-
tailed) .024 .452 .000 .000 .000 .000 .000
.000 .000 .003 .004 .022
N 165 165 165 165 165 165 165 165 165 165 165 165 165
Library
Adequacy
Pearson
Correlation .217** .076 .889** .908** .486** .376** .513** .581** 1 .526** .267** .252** .256**
23 School Library Research | www.ala.org/aasl/slr

U.S. Students, Poverty, and School Libraries Volume 17 | ISSN: 2165-1019
Mean
Family
Wealth
School
Library
Library
Staff
Adequa
cy
Library
Material
s
Adequa
cy
Comput
er
Adequc
y
Internet
Adequa
cy
Softwar
e
Adequa
cy
Audiovis
ual
Material
s
Adequa
cy
Library
Adequa
cy
Technol
ogy
Adequa
cy
Mean
Math
Score
for
School
Mean
Reading
Score
for
School
Mean
Science
Score
for
School
Index Sig. (2-
tailed) .005 .330 .000 .000 .000 .000 .000 .000
.000 .001 .001 .001
N 165 165 165 165 165 165 165 165 165 165 165 165 165
Technology
Adequacy
Index
Pearson
Correlation .194* -.100 .371** .566** .901** .844** .881** .642** .526** 1 .200* .201** .174*
Sig. (2-
tailed) .012 .200 .000 .000 .000 .000 .000 .000 .000
.010 .010 .025
N 165 165 165 165 165 165 165 165 165 165 165 165 165
Mean Math
Score for
School
Pearson
Correlation .710** .118 .189* .287** .172* .167* .187* .227** .267** .200* 1 .938** .916**
Sig. (2-
tailed) .000 .130 .015 .000 .027 .032 .016 .003 .001 .010
.000 .000
N 165 165 165 165 165 165 165 165 165 165 165 165 165
Mean Reading
Score for
School
Pearson
Correlation .708** .069 .179* .270** .176* .145 .206** .224** .252** .201** .938** 1 .943**
Sig. (2-
tailed) .000 .380 .021 .000 .023 .063 .008 .004 .001 .010 .000
.000
N 165 165 165 165 165 165 165 165 165 165 165 165 165
Mean Science
Score for
School
Pearson
Correlation .686** .055 .193* .264** .156* .141 .162* .179* .256** .174* .916** .943** 1
Sig. (2-
tailed) .000 .482 .013 .001 .046 .071 .038 .022 .001 .025 .000 .000
N 165 165 165 165 165 165 165 165 165 165 165 165 165
24 School Library Research | www.ala.org/aasl/slr

U.S. Students, Poverty, and School Libraries Volume 17 | ISSN: 2165-1019
Mean
Family
Wealth
School
Library
Library
Staff
Adequa
cy
Library
Material
s
Adequa
cy
Comput
er
Adequc
y
Internet
Adequa
cy
Softwar
e
Adequa
cy
Audiovis
ual
Material
s
Adequa
cy
Library
Adequa
cy
Technol
ogy
Adequa
cy
Mean
Math
Score
for
School
Mean
Reading
Score
for
School
Mean
Science
Score
for
School
*. Correlation is significant at the 0.05 level (2-tailed).
**. Correlation is significant at the 0.01 level (2-tailed).
25 School Library Research | www.ala.org/aasl/slr

Cite This Article Adkins, Denice. “U.S. Students, Poverty, and School Libraries: What Results of the 2009
Programme for International Student Assessment Tell Us.” American Association of School Librarians. <http://www.ala.org/aasl/slr/volume17/adkins>
School Library Research (ISSN: 2165-1019) is an official journal of the American Association of School Librarians. It is the successor to School Library Media Quarterly Online and School Library Media Research. The purpose of School Library Research is to promote and publish high quality original research concerning the management, implementation, and evaluation of school library media programs. The journal will also emphasize research on instructional theory, teaching methods, and critical issues relevant to school library media. Visit the SLR website for more information.
The mission of the American Association of School Librarians is to advocate excellence, facilitate change, and develop leaders in the school library field. Visit the AASL website for more information.