US emergency department visits for fireworks injuries, 2006-2010
7
US emergency department visits for fireworks injuries, 2006e2010 Joseph K. Canner, MHS,* Adil H. Haider, MD, MPH, Shalini Selvarajah, MD, MPH, Xuan Hui, MD, ScM, Han Wang, MD, MPH, David T. Efron, MD, Elliott R. Haut, MD, Catherine G. Velopulos, MD, Diane A. Schwartz, MD, Albert Chi, MD, and Eric B. Schneider, PhD Department of Surgery, Johns Hopkins University School of Medicine, Baltimore, Maryland article info Article history: Received 3 January 2014 Received in revised form 11 March 2014 Accepted 21 March 2014 Available online xxx Keywords: Emergency department Fireworks NEDS Injury abstract Background: Most literature regarding fireworks injuries are from outside the United States, whereas US-based reports focus primarily on children and are based on datasets which cannot provide accurate estimates for subgroups of the US population. Methods: The 2006e2010 Nationwide Emergency Department Sample was used to identify patients with fireworks injury using International Classification of Diseases, Ninth Revision, Clinical Modification external cause of injury code E923.0. International Classification of Dis- eases, Ninth Revision, Clinical Modification diagnosis codes were examined to determine the mechanism, type, and location of injury. Sampling weights were applied during analysis to obtain US population estimates. Results: There were 25,691 emergency department visits for fireworks-related injuries be- tween 2006 and 2010. There was no consistent trend in annual injury rates during the 5-y period. The majority of visits (50.1%) were in patients aged <20 y. Most injuries were among males (76.4%) and were treated in hospitals in the Midwest and South (42.0% and 36.4%, respectively) than in the West and Northeast (13.3% and 8.3%, respectively) census regions. Fireworks-related injuries were most common in July (68.1%), followed by June (8.3%), January (6.6%), December (3.4%), and August (3.1%). The most common injuries (26.7%) were burns of the wrist, hand, and finger, followed by contusion or superficial injuries to the eye (10.3%), open wounds of the wrist, hand, and finger (6.5%), and burns of the eye (4.6%). Conclusions: Emergency department visits for fireworks injuries are concentrated around major national holidays and are more prevalent in certain parts of the country and among young males. This suggests that targeted interventions may be effective in combating this public health problem. ª 2014 Elsevier Inc. All rights reserved. 1. Introduction A number of researchers around the world have studied fire- works injuries relating to their respective national holidays where fireworks are commonly used, including China, Greece, India, Iran, and the United Kingdom [1e12]. In addition to looking at fireworks injuries in connection with public holi- days, most of these researchers also found that these injuries * Corresponding author. Department of Surgery, Johns Hopkins University School of Medicine, 600 N. Wolfe Street, Blalock 618, Balti- more, MD 21287. Tel.: þ1 410 502 2673; fax: þ1 410 955 8101. E-mail address: [email protected] (J.K. Canner). Available online at www.sciencedirect.com ScienceDirect journal homepage: www.JournalofSurgicalResearch.com journal of surgical research xxx (2014) 1 e7 0022-4804/$ e see front matter ª 2014 Elsevier Inc. All rights reserved. http://dx.doi.org/10.1016/j.jss.2014.03.066
-
Upload
independent -
Category
Documents
-
view
4 -
download
0
Transcript of US emergency department visits for fireworks injuries, 2006-2010
ww.sciencedirect.com
j o u rn a l o f s u r g i c a l r e s e a r c h x x x ( 2 0 1 4 ) 1e7
Available online at w
ScienceDirect
journal homepage: www.JournalofSurgicalResearch.com
US emergency department visits for fireworksinjuries, 2006e2010
Joseph K. Canner, MHS,* Adil H. Haider, MD, MPH,Shalini Selvarajah, MD, MPH, Xuan Hui, MD, ScM, Han Wang, MD, MPH,David T. Efron, MD, Elliott R. Haut, MD, Catherine G. Velopulos, MD,Diane A. Schwartz, MD, Albert Chi, MD, and Eric B. Schneider, PhD
Department of Surgery, Johns Hopkins University School of Medicine, Baltimore, Maryland
a r t i c l e i n f o
Article history:
Received 3 January 2014
Received in revised form
11 March 2014
Accepted 21 March 2014
Available online xxx
Keywords:
Emergency department
Fireworks
NEDS
Injury
* Corresponding author. Department of Surgmore, MD 21287. Tel.: þ1 410 502 2673; fax:
E-mail address: [email protected] (J.K. C0022-4804/$ e see front matter ª 2014 Elsevhttp://dx.doi.org/10.1016/j.jss.2014.03.066
a b s t r a c t
Background: Most literature regarding fireworks injuries are from outside the United States,
whereas US-based reports focus primarily on children and are based on datasets which
cannot provide accurate estimates for subgroups of the US population.
Methods: The 2006e2010 Nationwide Emergency Department Sample was used to identify
patients with fireworks injury using International Classification of Diseases, Ninth Revision,
Clinical Modification external cause of injury code E923.0. International Classification of Dis-
eases, Ninth Revision, Clinical Modification diagnosis codes were examined to determine the
mechanism, type, and location of injury. Sampling weights were applied during analysis to
obtain US population estimates.
Results: There were 25,691 emergency department visits for fireworks-related injuries be-
tween 2006 and 2010. There was no consistent trend in annual injury rates during the 5-y
period. The majority of visits (50.1%) were in patients aged <20 y. Most injuries were among
males (76.4%) and were treated in hospitals in the Midwest and South (42.0% and 36.4%,
respectively) than in the West and Northeast (13.3% and 8.3%, respectively) census regions.
Fireworks-related injuriesweremost common in July (68.1%), followed by June (8.3%), January
(6.6%), December (3.4%), and August (3.1%). The most common injuries (26.7%) were burns of
the wrist, hand, and finger, followed by contusion or superficial injuries to the eye (10.3%),
open wounds of the wrist, hand, and finger (6.5%), and burns of the eye (4.6%).
Conclusions: Emergency department visits for fireworks injuries are concentrated around
major national holidays and are more prevalent in certain parts of the country and among
young males. This suggests that targeted interventions may be effective in combating this
public health problem.
ª 2014 Elsevier Inc. All rights reserved.
1. Introduction where fireworks are commonly used, including China, Greece,
A number of researchers around the world have studied fire-
works injuries relating to their respective national holidays
ery, Johns Hopkins Univeþ1 410 955 8101.anner).ier Inc. All rights reserved
India, Iran, and the United Kingdom [1e12]. In addition to
looking at fireworks injuries in connection with public holi-
days, most of these researchers also found that these injuries
rsity School of Medicine, 600 N. Wolfe Street, Blalock 618, Balti-
.
j o u r n a l o f s u r g i c a l r e s e a r c h x x x ( 2 0 1 4 ) 1e72
were most prevalent among young males. However, little has
been written about the same phenomenon in the United
States, particularly with respect to Independence Day (July
4th) and New Year’s Eve (December 31st). The most recent
publications in the United States based on national data
concentrated on pediatric cases occurring between 1990 and
2003 [13,14]. Since that time, consumer fireworks consump-
tion has increased from 107e185.5 million pounds in 2012,
with a high of 255 million pounds in 2005, and several states
have relaxed their laws concerning fireworks [15e17]. In
addition, the Internet has created an environment where
firework procurement has become possible even in places
where they may not be legal.
We examined emergency department (ED) visits for
fireworks-related injuries from the Nationwide Emergency
Department Sample (NEDS), Healthcare Cost and Utilization
Project, and Agency for Healthcare Research and Quality. This
study aims to provide an update of national figures on
fireworks-related injury using a data set, which can provide
precise estimates for national totals and for descriptive fac-
tors. Findings from this study can help EDs to anticipate in-
creases in fireworks-related injuries during certain times of
the year and in certain parts of the country, as well as help
focus firework-related injury prevention efforts.
Table 1 e Demographic characteristics of emergencydepartment visits for injuries due to fireworks.
Characteristic n (%)
Age
Mean (SD) 22.8 (15.3)
Gender
Male 19,613 (76.4)
Female 6062 (23.6)
Region
Northeast 2124 (8.3)
Midwest 10,798 (42.0)
South 9363 (36.4)
West 3406 (13.3)
Income quartile
1 7915 (31.3)
2 7379 (29.2)
3 6013 (23.8)
4 3978 (15.7)
Total 25,691 (100)
2. Methods
The NEDS is an all-payer ED database containing approxi-
mately 28million ED visits per year and can beweighted to the
entire US population using weights provided by Healthcare
Cost and Utilization Project. For 2010, the NEDS included 961
hospitals in 29 states, representing a 20% stratified sample of
all hospital EDs in the US. The NEDS provides a variety of in-
formation relating to patient demographics, diagnosis, and
hospital course. The JohnsHopkins Institutional Review Board
approved this study.
NEDS data from 2006e2010 were queried to identify pa-
tients who were admitted with fireworks injuries to EDs at
hospitals across the United States. Patients with fireworks
injuries were identified using the International Classification
of Diseases, Ninth Revision, Clinical Modification (ICD-9-CM)
external cause of injury codes (“E-Codes”) for accidents caused
by explosive material, particularly fireworks: E923.0. The
NEDS includes up to four E-Codes for each visit, which were
searched for the indicated codes. TheNEDS also includes up to
15 ICD-9-CM diagnosis codes for each visit, which were
examined to determine additional details about the mecha-
nism of injury, type of injury, and location of injury. Type and
location of injury were determined using the International
Classification of Diseases Programs for Injury Categorization
written for Stata [18]. In particular, injuries were categorized
using the Barell Injury Diagnosis Matrix [19], which classifies
ICD-9-CM diagnosis codes according to body region and na-
ture of injury. If more than one diagnosis code was provided
for these patients, the code with the highest severity was
chosen, based on the Abbreviated Injury Scale as calculated by
the International Classification of Diseases Programs for
Injury Categorization program. If there was more than one
code with the highest severity for a particular patient, the first
of these codes was used.
As appropriate, the number of ED visits was divided by the
US census population to obtain population rates. ED charges
were adjusted for inflation and reported in 2010 dollars.
All analyses were performed using Stata version 12.1,
StataCorp, College Station, TX.
3. Results
A total of 625,166,156 ED visits between January 1, 2006 and
December 31, 2010 were examined, of which 25,691 (41.1 per
million ED visits) had an E-code indicating a fireworks injury.
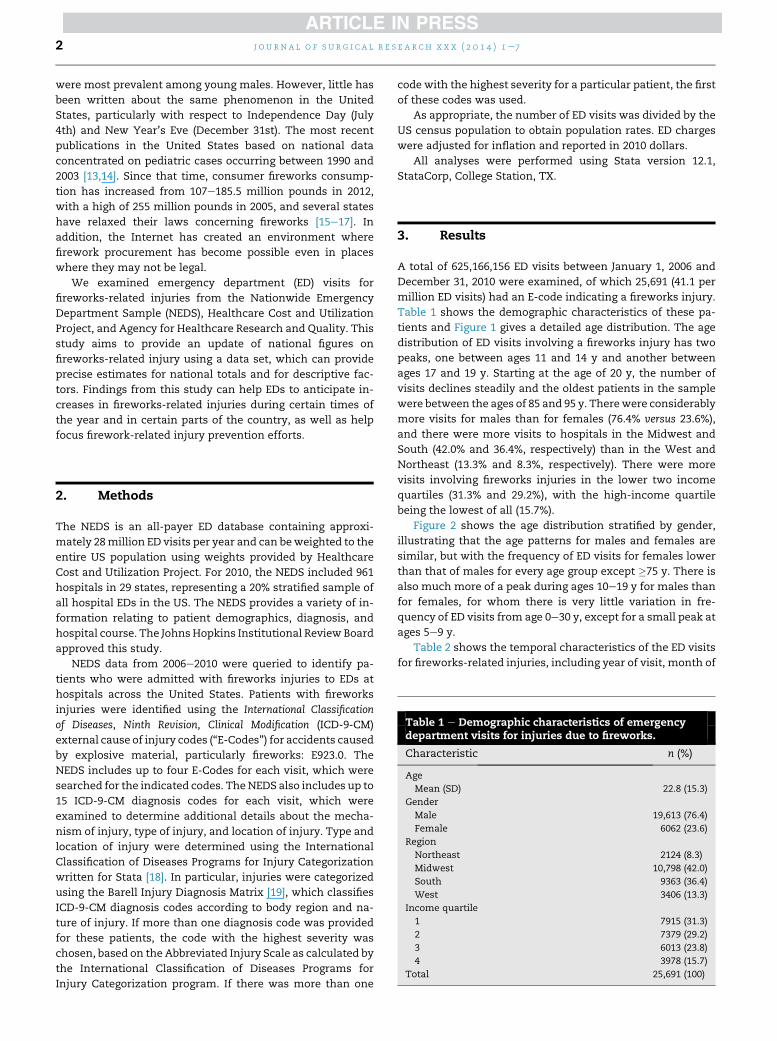
Table 1 shows the demographic characteristics of these pa-
tients and Figure 1 gives a detailed age distribution. The age
distribution of ED visits involving a fireworks injury has two
peaks, one between ages 11 and 14 y and another between
ages 17 and 19 y. Starting at the age of 20 y, the number of
visits declines steadily and the oldest patients in the sample
were between the ages of 85 and 95 y. Therewere considerably
more visits for males than for females (76.4% versus 23.6%),
and there were more visits to hospitals in the Midwest and
South (42.0% and 36.4%, respectively) than in the West and
Northeast (13.3% and 8.3%, respectively). There were more
visits involving fireworks injuries in the lower two income
quartiles (31.3% and 29.2%), with the high-income quartile
being the lowest of all (15.7%).
Figure 2 shows the age distribution stratified by gender,
illustrating that the age patterns for males and females are
similar, but with the frequency of ED visits for females lower
than that of males for every age group except �75 y. There is
also much more of a peak during ages 10e19 y for males than
for females, for whom there is very little variation in fre-
quency of ED visits from age 0e30 y, except for a small peak at
ages 5e9 y.
Table 2 shows the temporal characteristics of the ED visits
for fireworks-related injuries, including year of visit, month of

Fig. 1 e Age distribution of fireworks-related injuries.
j o u rn a l o f s u r g i c a l r e s e a r c h x x x ( 2 0 1 4 ) 1e7 3
visit, and whether the visit occurred on weekday or weekend.
The number of visits per year varied between a low value of
4103 in 2009 and a high value of 5763 in 2006. When adjusted
for the US population, the annual rate of visits ranged from
1.34 per 100,000 in 2008 to 1.93 per 100,000 in 2006. All the 95%
confidence intervals (CIs) for these rates overlap, with the
exception of the 2009 rate, which is significantly lower than
the rates for 2006e2007. ED visits for fireworks-related injuries
were most common in July (68.1%), followed by June (8.3%),
January (6.6%), December (3.4%), and August (3.1%). The
Fig. 2 e Fireworks-related injurie
proportion of visits that occurred on the weekend was 38.1%.
In 2006 and 2007, years when Independence Day was on
Tuesday and Wednesday, respectively, weekend visits in July
were 18.7% over those 2 y. In 2008, Independence Daywas on a
Friday and 37.9% of visits were on a weekend. In 2009 and
2010, Independence Day was on Saturday and Sunday,
respectively, and weekend visits were 60.4% over those 2 y. A
similar pattern was observed in December and January, con-
necting a high proportion of weekend visits with years when
New Year’s Eve fell on a weekend.
s age distribution by gender.

Table 2 e Temporal characteristics of emergencydepartment visits for injuries due to fireworks.
Characteristic n (%)
Year of visit
2006 5763 (22.4)
2007 5222 (20.3)
2008 5727 (22.3)
2009 4103 (16.0)
2010 4877 (19.0)
Month of visit
January 1515 (6.6)
February 243 (1.1)
March 223 (1.0)
April 309 (1.3)
May 504 (2.2)
June 1890 (8.3)
July 15,554 (68.1)
August 701 (3.1)
September 378 (1.7)
October 350 (1.5)
November 381 (1.7)
December 776 (3.4)
Day of Week
Weekday 15,900 (61.9)
Weekend 9787 (38.1)
j o u r n a l o f s u r g i c a l r e s e a r c h x x x ( 2 0 1 4 ) 1e74
Almost half (45.9%) of patients who visited an ED for a
fireworks injury had only one injury. About one-third (32.2%)
had two injuries, 10.7% had three injuries, and 4.4% had four
injuries. The highest number of injuries reported was 13. As
shown in Table 3, themost common body region of injury was
the wrist, hand, and finger (41.4%), followed by the eye (16.8%)
and the face (6.9%). The most common types of injuries,
regardless of body region, were burns (57.0%), contusions and
superficial injuries (16.2%), and open wounds (15.8%). The
most common injuries, accounting for 26.7% of all cases, were
burns of the wrist, hand, and finger. Other common injuries
included contusion or superficial injuries to the eye (10.3%),
open wounds of the wrist, hand, and finger (6.5%), and burns
of the eye (4.6%).
There were 879 patients with injuries that were not
covered by the Barell Injury Diagnosis Matrix. These included
foreign bodies in the eye (27%), ear symptoms (12%), and a
variety of other miscellaneous eye and limb symptoms.
In 6070 cases, there were one or more E-Codes, in addition
to the E-Code for fireworks-related injury, indicating the
Table 3 e Body region and injury type for injuries due tofireworks.
Barell matrix body region n (%)
Wrist, hand, or finger 10,271 (41.4)
Eye 4170 (16.8)
Face 1707 (6.9)
Head, face, or neck (specific location unspecified) 1505 (6.1)
Barell matrix injury type
Burn 14,141 (57.0)
Contusions and superficial injuries 4015 (16.2)
Open wound 3921 (15.8)
Fracture 1132 (4.6)
Total 24,803 (100)
specific place of occurrence of the fireworks injury. Of these,
the vastmajority (82.1%) occurred at home. A small number of
cases occurred in a “place for recreation and sport” (7.7%) or
on street or highway (7.5%).
Fireworks injuries did not generally result in death. Of the
25,435 ED visits withmortality information, the patient died in
the ED in fewer than 11 cases, and 18 (0.07%) died after being
admitted to the hospital. Most patients were either discharged
from the ED (86.2%), admitted as an inpatient at the same
hospital (6.3%), or transferred to another hospital (5.1%).
ED charges are available for 22,661 visits (88.2%). There was
a wide variety of charges relating to ED visits for fireworks
injuries, ranging from $27e$31,628. The mean charge was
$1256 (standard deviation, $2105), and the median charge was
$688 (Interquartile range, $420e$1234). Although the number
of ED visits for fireworks-related injuries was relatively stable
between 2006 and 2010, the total annual ED charges increased
significantly from $4.37 million (95% CI, $3.66 millione$5.08
million) in 2006 to $7.8 million (95% CI, $6.01 millione$9.55
million) in 2010.
4. Discussion
As with reports of fireworks-related injuries from other
countries, these injuries were most prevalent in the United
States around holiday times. The high number of injuries in
July is probably due to fireworks use on or around the Inde-
pendence Day (July 4th) holiday. Aside from the injury peak in
July, there is a smaller increase in injuries in the months of
June and August, with the higher prevalence in June probably
connected the Independence Day holiday. The higher preva-
lence of injuries in December and January is likely connected
to the New Year’s Eve (December 31st) holiday.
Overall, weekend injuries comprised 38% of all injuries,
considerably more than one would expect if the injuries were
equally distributed amongst all days of the week. Weekend
injuries were higher than expected for all months of the year
except for January. This is similar to other reports of ED uti-
lization [20] and may reflect increased injury risk on the
weekend. In addition, the year-to-year variation in the pro-
portion of weekend visits in July adds support to the conclu-
sion that the July injuries are related to the Independence Day
holiday. Similarly, the year-to-year variation in the proportion
of weekend visits in December and January supports the
conclusion that injuries in these months are related to the
New Year’s Eve holiday.
Most reports in the literature regarding fireworks-related
injuries are single-center studies from countries other than
the United States. The most recent report from the United
States was published by Witsaman et al. [14] in 2006 and per-
tained to pediatric injuries from 1990e2003. Focusing on the
pediatric population ignores a substantial proportion of
fireworks-related injuries; 49.9% of patients in the current
study were aged �20 y. Although fireworks-related injuries
decline with age, there are reportable numbers of patients
even in their eighties who experience these injuries.
The source of the data for the report byWitsaman et al. was
the National Electronic Injury Surveillance System (NEISS)
operated by the Consumer Product Safety Commission (CPSC)

Table 4 e Fireworks injury data from the NEISS, 2006e2010.
Year Deaths ED visits (95% CI) MidJuneemidJuly(% of total)
Sex ratio (M:F) % Age <15 y % Age <20 y Hand injury
2006 11 9200 (6900e11,700) 6400 (70) 3:1 36 47 2300
2007 11 9800 (7700e11,800) 6300 (64) 70:30 42 54 2000
2008 7 7000 (5200e9000) 5000 (71) 62:38 40 58 1400
2009 2 8800 (6800e10,800) 5900 (67) 73:27 39 54 1900
2010 3 8600 (6600e10,700) 6300 (73) 65:35 40 53 30%
F ¼ female; M ¼ male.
j o u rn a l o f s u r g i c a l r e s e a r c h x x x ( 2 0 1 4 ) 1e7 5
[21]. The CPSC publishes a series of annual reports on injuries
related to a variety of consumer products, including fireworks
[22]. The NEISS is a stratified sample of 98 US hospital EDs. In
comparison, the NEDS includes data from over 950 US Hos-
pital EDs. Consequently, the standard errors for estimates
from the NEISS are much larger than those for the NEDS.
Based on the 95% CIs provided in the CPSC reports, it appears
that the standard errors for the NEISS annual fireworks-
related injury estimates are usually at least 1000, whereas
the corresponding standard errors in the NEDS are around
300. As shown in Table 4, the NEISS data are highly variable
from year to year, and the estimates of total injuries per year
generally exceed those of the NEDS by several 1000 cases.
With respect to age and gender distributions and the type and
location of injury, however, the two sources are consistent.
One advantage that the NEDS has over the NEISS is that the
NEDS has a sufficient sample of hospitals to draw conclusions
about geographical variations in injury rates. When NEDS
injury estimates for each census region were adjusted for
population, we find significant differences between the re-
gions. The Midwest region has by far the highest rate, with
16.2 fireworks-related injuries per 100,000 population (95% CI,
14.3e18.2). The South has about half that rate: 8.4 per 100,000
(95% CI, 7.4e9.3). The rates in the Northeast andWest are half
as much again: 3.9 (95% CI, 3.3e4.4) and 4.8 (95% CI, 4.1e5.6)
per 100,000, respectively. Perhaps not coincidentally, some of
the states with the most liberal firework laws are in the Mid-
west (e.g., Indiana) and South (e.g., South Carolina and Ten-
nessee). In contrast, the four states that maintain a total
prohibition on all consumer fireworks (Delaware, Massachu-
setts, New Jersey, and New York) are all in the Northeast, the
area with the lowest injury rate [23]. Five states (Kentucky,
Table 5 e US states in the NEDS by census region.
Region States
Northeast Connecticut, Massachusetts, Maine (2006e2009),
New Hampshire (2006e2009), New Jersey, New
York (2007e2010), Rhode Island (2007e2010), and
Vermont
Midwest Iowa, Indiana, Illinois (2009e2010), Kansas,
Minnesota, Missouri, Nebraska, Ohio, South Dakota,
and Wisconsin
South Florida, Georgia, Kentucky (2008e2010), Maryland,
North Carolina (2007e2010), South Carolina,
and Tennessee
West Arizona, California, Hawaii, Nevada (2010 only),
and Utah
Utah, New Hampshire, Maine, and Michigan) significantly
liberalized their laws in 2011 or 2012, after the period of the
present study [16]. See Table 5 for a list of all states included in
the NEDS by census region.
The American Pyrotechnics Association (APA) contends,
using injury data from NEISS and firework import data from
the US International Trade Commission, that fireworks-
related injury as a function of fireworks consumption has
declined since 1976 [16,17]. Although the number of firework-
related injuries has fluctuated between 7000 and 12,500 during
that time, with some evidence of an increase between 1976
and 1994 and a slight decline thereafter, fireworks consump-
tion has increased from around 30 million pounds in 1976 to
>200 million pounds in 2012, peaking at 281 million pounds in
2005. Accordingly, the number of injuries per 100,000 pounds
has decreased from 38.3 in 1976 to 4.1 in 2012. However, as
Witsaman et al. point out, firework weight is probably not the
appropriate denominator, as it does not relate to the actual
number of fireworks used, but rather gives more significance
to heavier fireworks and less to lighter fireworks. Moreover,
although heavier fireworks may cause more severe injuries,
there is no reason to believe that heavier fireworks are more
likely to cause injuries than lighter fireworks.
The APA conclusions, moreover, fail to acknowledge a
recent reversal in the trends that they cite. Although the
number of injuries per 100,000 pounds did indeed decrease
sharply from 38.3 in 1976 to 4.4 in 2003, the rate has decreased
muchmore slowly since then, bottoming out at 3.3 in 2006 and
increasing to 4.1 starting in 2012.
4.1. Limitations
The primary limitation of this study is that it relies on
administrative data, in particular the use of ICD-9-CM codes,
which are used primarily for billing purposes. E-codes, which
are used in the present study to identify fireworks-related
injuries, are not typically required in billing for trauma, as
the mechanism of injury does not usually have implications
for billing. Also, as noted in the NEDS documentation, the
collection and reporting of E-codes vary greatly across states,
as some states require collection of E-codes and others do not
[24]. Accordingly, the total number of ED visits for fireworks
injuries may be underestimated. This may explain why injury
estimates in the NEISS are higher than those in the NEDS, as
NEISS hospitals are actively monitoring their ED cases for
injuries caused by consumer products. The possible under-
estimation of injuries in the NEDS is less likely to affect
the distributions of demographic, temporal, clinical, and

j o u r n a l o f s u r g i c a l r e s e a r c h x x x ( 2 0 1 4 ) 1e76
economic characteristics related to fireworks injuries, as there
is no reason to believe that the ascertainment of mechanism
of injury is related to these characteristics. The similarity
between the NEDS and the NEISS with respect to these char-
acteristics supports this conclusion.
Another limitation of this study is that the NEDS does not
indicate the state or local area where the hospital is located.
Accordingly, it is difficult to correlate injury rates with the
strength of state laws or with local events that might involve
fireworks. In addition, fireworks consumption is only avail-
able on a national level, which means that fireworks con-
sumption cannot be correlated with injury rates even at the
level of a census region. Further, the tremendous variability in
state and local laws regarding the sale of fireworks, either
directly or over the Internet, may lead to local differences in
fireworks consumption and injury rates that we are unable to
assess at that granular level.
5. Conclusions
Notwithstanding claims by the APA that firework safety has
improved over time despite the liberalization of fireworks
laws in some states, firework-related injuries remain a public
health problem, particularly because they are concentrated
around certain times of the year, on weekends, and in certain
geographic regions. The fact that firework-related injuries
have remained steady over time, despite liberalized fireworks
laws and increases in firework consumption suggest that
public health measures have been moderately successful.
However, more data are needed on the effectiveness of spe-
cific public health measures. The results from this study
suggest that public health measures should be targeted by
time (Independence Day and New Year’s Eve holidays), by
location (Midwest and South), and toward thosewho purchase
fireworks for younger males.
The regional variation in fireworks injuries, the constantly
changing pattern of state laws concerning fireworks, and the
increased availability of fireworks over the Internet highlight
the need for more standardized regulation of fireworks across
the US. Continued monitoring of fireworks injury rates is
needed to ascertain the effect of the liberalization of fireworks
laws in some states; and consumption and injury data by state
are needed to more precisely estimate the relationship be-
tween state fireworks laws and injury rates.
Acknowledgment
J.K.C., E.B.S., and A.H.H. contributed for conception and
design; J.K.C. and E.B.S. for analysis and interpretation; J.K.C.,
E.B.S. and S.S. for writing the manuscript; X.H., H.W., D.T.E.,
E.R.H., C.G.V., D.A.S., and A.C. for revising themanuscript; and
A.H.H. for funding.
Disclosure
The authors reported no proprietary or commercial interest in
any product mentioned or concept discussed in this article.
r e f e r e n c e s
[1] Wang C, Zhao R, Du WL, Ning FG, Zhang GA. Fireworkinjuries at a major trauma and burn center: a five-yearprospective study. Burns; 2013. pii: S0305e4179(13)00189-7.http://dx.doi.org/10.1016/j.burns.2013.06.007. [Epub ahead ofprint].
[2] Pallantzas A, Kourakos P, Stampolidis N, et al. Burns duringEaster festivities in Greece. Ann Burns Fire Disasters 2012;25:171.
[3] Malik A, Bhala S, Arya SK, Sood S, Narang S. Five-year studyof ocular injuries due to fireworks in India. Int Ophthalmol2013;33:381. http://dx.doi.org/10.1007/s10792-013-9714-x.Epub 2013 Jan 13.
[4] Rashid RA, Heidary F, Hussein A, et al. Ocular burns andrelated injuries due to fireworks during the Aidil Fitricelebration on the East Coast of the Peninsular Malaysia.Burns 2011;37:170. http://dx.doi.org/10.1016/j.burns.2010.05.019. Epub 2010 Jun 23.
[5] Jing Y, Yi-qiao X, Yan-ning Y, Ming A, An-huai Y, Lian-hong Z. Clinical analysis of firework-related ocular injuriesduring Spring Festival 2009. Graefes Arch Clin ExpOphthalmol 2010;248:333. http://dx.doi.org/10.1007/s00417-009-1292-2. Epub 2010 Jan 30.
[6] Tavakoli H, Khashayar P, Amoli HA, et al. Firework-relatedinjuries in Tehran’s Persian Wednesday Eve Festival(Chaharshanbe Soori). Emerg Med 2011;40:340. http://dx.doi.org/10.1016/j.jemermed.2009.10.024. Epub 2010 Jan 25.
[7] de Faber JT. [Fireworks injuries treated by Dutchophthalmologists New Year 2008/’09] [Article in Dutch]. NedTijdschr Geneeskd 2009;153:A507.
[8] Wisse RP, Bijlsma WR, Stilma JS. Ocular firework trauma: asystematic review on incidence, severity, outcome andprevention. Br J Ophthalmol 2010;94:1586. http://dx.doi.org/10.1136/bjo.2009.168419. Epub 2009 Oct 20.
[9] Puri V, Mahendru S, Rana R, Deshpande M. Firework injuries:a ten-year study. J Plast Reconstr Aesthet Surg 2009;62:1103.http://dx.doi.org/10.1016/j.bjps.2007.12.080. Epub 2008 Jul 7.
[10] Knox FA, Chan WC, Jackson AJ, Foot B, Sharkey JA,McGinnity FG. A British Ophthalmological Surveillance Unitstudy on serious ocular injuries from fireworks in the UK. Eye(Lond) 2008;22:944. Epub 2007 Mar 9.
[11] Chan WC, Knox FA, McGinnity FG, Sharkey JA. Serious eyeand adnexal injuries from fireworks in Northern Irelandbefore and after lifting of the firework banean ophthalmologyunit’s experience. Int Ophthalmol 2004;25:167.
[12] Zohar Z, Waksman I, Stolero J, Volpin G, Sacagiu E, Eytan A.[Injury from fireworks and firecrackers during holidays].[Article in Hebrew]. Harefuah 2004;143:698. 768.
[13] American Academy of Pediatrics: Committee on Injury andPoison Prevention. Fireworks-related injuries to children.Pediatrics 2001;108:190.
[14] Witsaman RJ, Comstock RD, Smith GA. Pediatric fireworks-related injuries in the United States: 1990-2003. Pediatrics2006;118:296.
[15] American Pyrotechnics Association, “U.S. fireworksconsumption figures 2000-2012”. Available from http://www.americanpyro.com/assets/docs/FactsandFigures/fireworks%20consump.%20figures%202000-12.pdf (Accessed August 1,2013).
[16] American Pyrotechnics Association, “ Fireworks-relatedinjury rates continue to decline as states liberalize law”.Available from http://www.americanpyro.com/assets/docs/FactsandFigures/copyonsumption%20vs%20injuries%20graph%201980-2010.pdf (Accessed August 1, 2013).
[17] American Pyrotechnics Association, “Fireworks-relatedinjury rates, 1976e2012amprdquosemicolon. Available from
http://www.americanpyro.com/assets/docs/FactsandFigures/fireworks%20consump.%20figures%202000-12.pdf
http://www.americanpyro.com/assets/docs/FactsandFigures/fireworks%20consump.%20figures%202000-12.pdf

j o u rn a l o f s u r g i c a l r e s e a r c h x x x ( 2 0 1 4 ) 1e7 7
http://www.americanpyro.com/assets/docs/FactsandFigures/fireworks%20related%20injuries%20table%201976%20-2012.pdf (Accessed August 1, 2013).
[18] Clark DE, Osler TM, Hahn DR. ICDPIC: stata module to providemethods for translating InternationalClassificationofDiseases(Ninth Revision) diagnosis codes into standard injurycategories and/or scores. Available fromhttp://ideas.repec.org/c/boc/bocode/s457028.html (Accessed November 18, 2013).
[19] Barell V, Aharonson-Daniel L, Fingerhut LA, Mackenzie EJ,Ziv A, Boyko V. An introduction to the Barell body-region bynature of injury diagnosis matrix. Inj Prev 2002;8:91.
[20] Schoenfeld EM, McKay MP. Weekend emergency departmentvisits in Nebraska: higher utilization, lower acuity. J EmergMed 2010;38:542.
[21] United States Consumer Product Safety Commission,“National Electronic Injury Surveillance System (NEISS)”.
Available from http://www.cpsc.gov/en/Research-Statistics/NEISS-Injury-Data/(Accessed December 18, 2013).
[22] Tu Y, Granados DV. 2012 fireworks annual report: fireworks-related deaths, emergency department-treated injuries, andenforcement activities during 2012. U.S. Consumer ProductSafety Commission. Available from http://www.cpsc.gov/en/Research-Statistics/Fuel-Lighters-and-Fireworks/(AccessedDecember 18, 2013).
[23] American Pyrotechnic Association, “Directory of state laws”.Available from http://www.americanpyro.com/state-law-directory (Accessed December 20, 2013).
[24] Agency for Healthcare Research and Quality, “Introduction tothe HCUP Nationwide Emergency Department Sample(NEDS)”. Available from http://www.hcup-us.ahrq.gov/db/nation/neds/NEDS2011Introduction121013.pdf (AccessedDecember 26, 2013).