Urban rural differences in prevalence of self-reported diabetes in India—The WHO–ICMR Indian NCD...
10
Urban rural differences in prevalence of self-reported diabetes in India—The WHO–ICMR Indian NCD risk factor surveillance Viswanathan Mohan a, *, Prashant Mathur b , Raj Deepa a , Mohan Deepa a , D.K. Shukla b , Geetha R. Menon b , Krishnan Anand c , Nimesh G. Desai d , Prashant P. Joshi e , J. Mahanta f , K.R. Thankappan g , Bela Shah b a Madras Diabetes Research Foundation & Dr.Mohan’s Diabetes Specialities Centre, 4 Conran Smith Road, Gopalapuram, Chennai 600 086, India b Division of Noncommunicable Diseases, Indian Council of Medical Research, New Delhi, India c Centre for Community Medicine, All India Institute of Medical Sciences, New Delhi, India d Institute of Human Behaviour and Applied Sciences, Delhi, India e Government Medical Colleges & Hospital, Nagpur, India f Regional Medical Research Centre, Dibrugarh, India g Achutha Menon Centre for Health Science Studies, Sree Chitra Tirunal Institute for Medical Sciences and Technology, Trivandrum, India diabetes research and clinical practice xxx (2008) xxx–xxx article info Article history: Received 9 March 2007 Accepted 21 November 2007 Keywords: Self-reported diabetes Risk factors India Surveillance Urban Rural Peri-urban Non-communicable diseases Asian Indians South Asians abstract Recent reports show strikingly high prevalence of diabetes among urban Asian Indians; however, there are very few studies comparing urban, peri-urban and rural prevalence rates of diabetes and their risk factors at the national level. This study is a part of the national non- communicable diseases (NCD) risk factor surveillance conducted in different geographical locations (North, South, East, West/Central) in India between April 2003 and March 2005. A total of 44,523 individuals (age: 15–64 years) inclusive of 15,239 from urban, 15,760 from peri- urban/slum and 13,524 from rural areas were recruited. Major risk factors were studied using modified WHO STEPS approach. Diabetes was diagnosed based on self-reported diabetes diagnosed by a physician. The lowest prevalence of self-reported diabetes was recorded in rural (3.1%) followed by peri-urban/slum (3.2%) and the highest in urban areas (7.3%, odds ratio (OR) for urban areas: 2.48, 95% confidence interval (CI): 2.21–2.79, p < 0.001). Urban residents with abdominal obesity and sedentary activity had the highest prevalence of self-reported diabetes (11.3%) while rural residents without abdominal obesity perform- ing vigorous activity had the lowest prevalence (0.7%). In conclusion, this nation-wide NCD risk factor surveillance study shows that the prevalence of self-reported diabetes is higher in urban, intermediate in peri-urban and lowest in rural areas. Urban residence, abdominal obesity and physical inactivity are the risk factors associated with diabetes in this study. # 2007 Elsevier Ireland Ltd. All rights reserved. * Corresponding author. Tel.: +91 44 2835 9048; fax: +91 44 2835 0935. E-mail address: [email protected] (V. Mohan). URL: http://www.drmohansdiabetes.com DIAB-4084; No of Pages 10 available at www.sciencedirect.com journal homepage: www.elsevier.com/locate/diabres 0168-8227/$ – see front matter # 2007 Elsevier Ireland Ltd. All rights reserved. doi:10.1016/j.diabres.2007.11.018 Please cite this article in press as: V. Mohan et al., Urban rural differences in prevalence of self-reported diabetes in India—The WHO– ICMR Indian NCD risk factor surveillance, Diab. Res. Clin. Pract. (2008), doi:10.1016/j.diabres.2007.11.018
Transcript of Urban rural differences in prevalence of self-reported diabetes in India—The WHO–ICMR Indian NCD...

DIAB-4084; No of Pages 10
Urban rural differences in prevalence of self-reporteddiabetes in India—The WHO–ICMR Indian NCDrisk factor surveillance
Viswanathan Mohan a,*, Prashant Mathur b, Raj Deepa a, Mohan Deepa a,D.K. Shukla b, Geetha R. Menon b, Krishnan Anand c, Nimesh G. Desai d,Prashant P. Joshi e, J. Mahanta f, K.R. Thankappan g, Bela Shah b
aMadras Diabetes Research Foundation & Dr.Mohan’s Diabetes Specialities Centre, 4 Conran Smith Road,
Gopalapuram, Chennai 600 086, IndiabDivision of Noncommunicable Diseases, Indian Council of Medical Research, New Delhi, IndiacCentre for Community Medicine, All India Institute of Medical Sciences, New Delhi, Indiad Institute of Human Behaviour and Applied Sciences, Delhi, IndiaeGovernment Medical Colleges & Hospital, Nagpur, IndiafRegional Medical Research Centre, Dibrugarh, IndiagAchutha Menon Centre for Health Science Studies, Sree Chitra Tirunal Institute for Medical Sciences
and Technology, Trivandrum, India
d i a b e t e s r e s e a r c h a n d c l i n i c a l p r a c t i c e x x x ( 2 0 0 8 ) x x x – x x x
a r t i c l e i n f o
Article history:
Received 9 March 2007
Accepted 21 November 2007
Keywords:
Self-reported diabetes
Risk factors
India
Surveillance
Urban
Rural
Peri-urban
Non-communicable diseases
Asian Indians
South Asians
a b s t r a c t
Recent reports show strikingly high prevalence of diabetes among urban Asian Indians;
however, there are very few studies comparing urban, peri-urban and rural prevalence rates
of diabetes and their risk factors at the national level. This study is a part of the national non-
communicable diseases (NCD) risk factor surveillance conducted in different geographical
locations (North, South, East, West/Central) in India between April 2003 and March 2005. A
total of 44,523 individuals (age: 15–64 years) inclusive of 15,239 from urban, 15,760 from peri-
urban/slum and 13,524 from rural areas were recruited. Major risk factors were studied
using modified WHO STEPS approach. Diabetes was diagnosed based on self-reported
diabetes diagnosed by a physician. The lowest prevalence of self-reported diabetes was
recorded in rural (3.1%) followed by peri-urban/slum (3.2%) and the highest in urban areas
(7.3%, odds ratio (OR) for urban areas: 2.48, 95% confidence interval (CI): 2.21–2.79, p < 0.001).
Urban residents with abdominal obesity and sedentary activity had the highest prevalence
of self-reported diabetes (11.3%) while rural residents without abdominal obesity perform-
ing vigorous activity had the lowest prevalence (0.7%). In conclusion, this nation-wide NCD
risk factor surveillance study shows that the prevalence of self-reported diabetes is higher in
urban, intermediate in peri-urban and lowest in rural areas. Urban residence, abdominal
obesity and physical inactivity are the risk factors associated with diabetes in this study.
# 2007 Elsevier Ireland Ltd. All rights reserved.
* Corresponding author. Tel.: +91 44 2835 9048; fax: +91 44 2835 0935.E-mail address: [email protected] (V. Mohan).
avai lab le at www.sc iencedi rec t .com
journal homepage: www.e lsev ier .com/ locate /d iabres
URL: http://www.drmohansdiabetes.com
0168-8227/$ – see front matter # 2007 Elsevier Ireland Ltd. All rights reserved.doi:10.1016/j.diabres.2007.11.018
Please cite this article in press as: V. Mohan et al., Urban rural differences in prevalence of self-reported diabetes in India—The WHO–
ICMR Indian NCD risk factor surveillance, Diab. Res. Clin. Pract. (2008), doi:10.1016/j.diabres.2007.11.018

DIAB-4084; No of Pages 10
d i a b e t e s r e s e a r c h a n d c l i n i c a l p r a c t i c e x x x ( 2 0 0 8 ) x x x – x x x2
1. Introduction
Diabetes is a major cause of morbidity and mortality world-
wide [1,2]. The problem of diabetes is particularly relevant to
India as several studies have clearly documented an increased
ethnic susceptibility to diabetes in migrant Asian Indians [3–7].
Recent epidemiological studies have pointed to the growing
epidemic of diabetes in India [8–14]. Indeed, according to the
recent Diabetes Atlas produced by the International Diabetes
Federation (IDF), India is home to the largest number of people
with diabetes in the world, 40.9 million diabetic subjects in
2007, and these numbers are predicted to increase to 69.9
million by 2025 [15].
These projections are based on a few isolated studies
conducted in specific geographical locations and do not
take into consideration the increase in various environ-
mental risk factors, like increasing urbanization and
economic development. There is hence an urgent need for
a nation-wide surveillance system for non-communicable
diseases in general and diabetes in particular. The present
study is a collaborative effort of the World Health
Organization (WHO) and Indian Council of Medical Research
(ICMR) to develop a sustainable system for NCD risk factor
surveillance in India using the WHO STEPS approach [16].
This article reports on the risk factors for self-reported
diabetes in Indians from the first national NCD surveillance
project, which was conducted in India from April 2003 to
March 2005.
Fig. 1 – Indian national NCD risk fa
Please cite this article in press as: V. Mohan et al., Urban rural differe
ICMR Indian NCD risk factor surveillance, Diab. Res. Clin. Pract.
2. Materials and methods
2.1. Study centers
The national NCD risk factor surveillance was conducted in six
different geographical locations (East, South, North, West/
Central India) in India (Fig. 1). The centers were selected based
on the experience of the investigator in conducting studies on
NCDs, location of the center and institutional infrastructure
for long-term involvement in NCD surveillance.
2.2. Recruitment
Sample size was calculated using the means of the risk factors.
The WHO STEPS recommends surveillance of the population
aged 25–64. However, as exposure to risk factors start in
younger ages in India, the age group was chosen as 15–64 years
[17].
2.3. Sampling units
Each state in the country is divided into wards based on
geographical location by the Government of India. The
existing ward in the sampling areas was used as the primary
sampling unit in the urban and peri-urban/slum areas. For the
rural areas, the primary health centre (PHC) was selected
randomly from one district at each stage, and the village was
selected as the primary sampling unit for data collection.
ctor surveillance study centers.
nces in prevalence of self-reported diabetes in India—The WHO–
(2008), doi:10.1016/j.diabres.2007.11.018

d i a b e t e s r e s e a r c h a n d c l i n i c a l p r a c t i c e x x x ( 2 0 0 8 ) x x x – x x x 3
DIAB-4084; No of Pages 10
2.4. Sample size
The total sample size of the NCD risk factor surveillance was
44,537, rural 13,527 (6672 men and 6855 women), peri-urban/
slum 15,763 (7649 men and 8114 women) and urban 15,247
(7564 men and 7683 women). A minimum of 2500 subjects
aged between 15 and 64 years stratified by sex and 10-year age
group was available in each of the area (rural, peri-urban/slum
and urban) in each centre, except in the Delhi centre, where
rural sampling was not available.
2.5. Data collection
The study was undertaken based on the methodology adapted
from the WHO global STEP-wise approach for risk factor
surveillance for NCDs. Data collection was done through
active surveillance. Major risk factors were studied using
adapted and modified WHO’s STEPS approach. Data collected
included demography, occupation, literacy, tobacco use,
alcohol use, physical activity and dietary behaviour. History
of medical ailments like self-reported diabetes and hyperten-
Table 1 – Characteristics of study population
Parameters Rural (n = 13,524)
Age (years) 38.6 � 14.1
Body mass index (kg/m2)
Men 20.3 � 3.4
Women 20.8 � 4.0
Waist (cm)
Men 77 � 10
Women 74 � 12
Systolic blood pressure (mm Hg)
Men 126 � 18
Women 123 � 19
Diastolic blood pressure (mm Hg)
Men 77 � 12
Women 77 � 11
Educational status, n (%)
Illiterate 3609 (26.7)
Some schooling 8805 (65.1)
Graduate and above 1105 (8.2)
Physical activity, n (%)
Sedentary 4648 (35.0)
Moderate 5245 (39.5)
Vigorous 3377 (25.4)
Smoking, n (%)
Men 1783 (26.7)
Women 296 (4.3)
Generalized obesity, n (%)
Men 623 (9.4)
Women 961 (14.1)
Abdominal obesity, n (%)
Men 811 (12.2)
Women 1975 (29.6)
Missing data pertaining to various parameters were excluded from the re* p < 0.001 compared to subjects in rural area.** p < 0.001 compared to subjects in peri-urban/slum area.
Please cite this article in press as: V. Mohan et al., Urban rural differe
ICMR Indian NCD risk factor surveillance, Diab. Res. Clin. Pract.
sion were also collected. The questionnaires of STEPS was pre-
tested and suitably modified to fit Indian conditions after pilot
testing on a sub-population in each centre.
2.6. Anthropometry and clinical examination
Height and weight were measured and the body mass index
(BMI) was calculated in all study participants. Waist
circumference was measured using standard techniques.
Blood pressure was recorded in the sitting position in the
right arm to the nearest 1 mm Hg using the electronic
OMRON machine (Omran Corporation,Tokyo, Japan). Two
readings were taken 5 min apart and the mean of the two
was taken as the blood pressure. If the difference between
these two measurements was greater than 10 mm Hg for a
participant, a third measurement was done and the mean of
the two closest readings was recorded as the blood pressure
of the individual.
Ethical committee approval was obtained prior to the start
of the study and informed consent was obtained from all the
study subjects.
Peri-urban/slum (n = 15,760) Urban (n = 15,239)
39.0 � 14.0 39.3 � 14.2*
21.2 � 3.9* 23.1 � 4.2*
22.3 � 4.6* 24.0 � 4.9*,**
79 � 11* 84 � 15*
77 � 16* 82 � 13*,**
129 � 19* 131 � 19*
125 � 21* 127 � 21*,**
79 � 12* 80 � 12*
77 � 12* 78 � 11*,**
4,015 (25.5) 1,223 (8.0)*
10,536 (66.9) 10,771 (70.8)*
1,201 (7.6) 3,229 (21.2)*,**
6,431 (41.4)* 8,208 (56.1)*
6,905 (44.4)* 5,337 (36.5)*
2,212 (14.2)* 1,080 (7.4)*,**
2,625 (34.3)* 2,003 (26.5)
222 (2.7)* 53 (0.7)*,**
1,274 (16.7)* 2,316 (30.7)*
2,098 (26.1)* 2,956 (38.8)*,**
1,370 (17.9)* 2,333 (30.9)*
3,230 (41.1)* 4,354 (57.8)*,**
levant analysis, so the number of subjects may differ with variables.
nces in prevalence of self-reported diabetes in India—The WHO–
(2008), doi:10.1016/j.diabres.2007.11.018
d i a b e t e s r e s e a r c h a n d c l i n i c a l p r a c t i c e x x x ( 2 0 0 8 ) x x x – x x x4
DIAB-4084; No of Pages 10
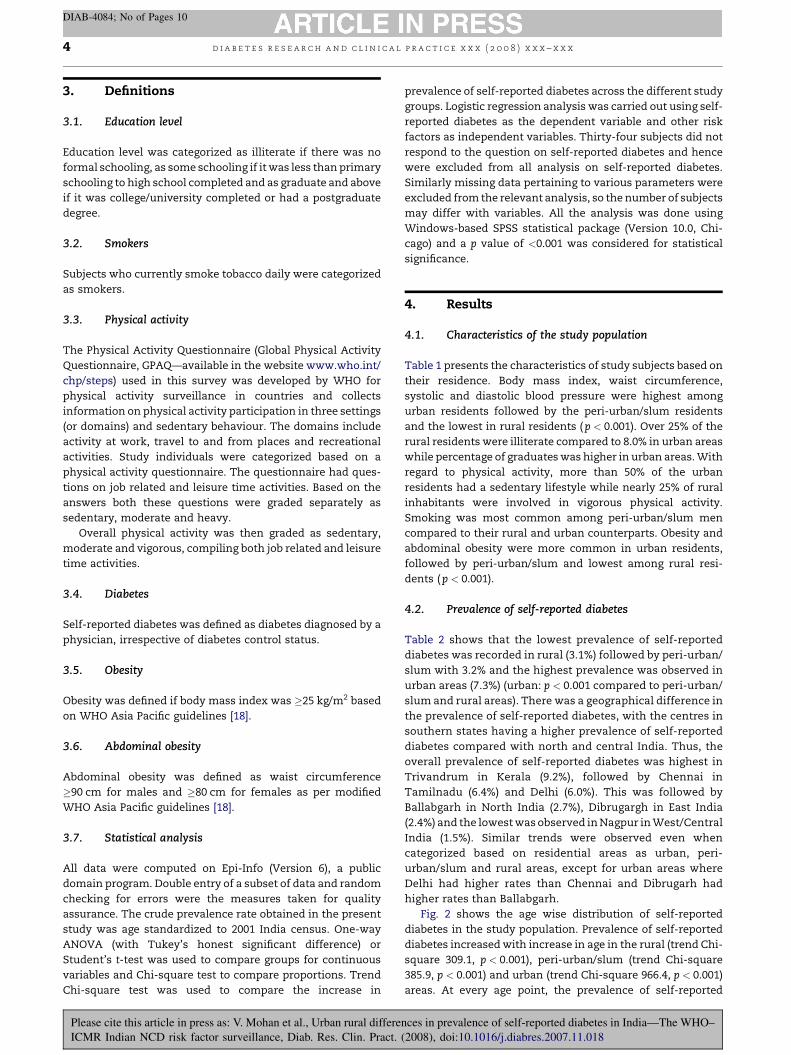
3. Definitions
3.1. Education level
Education level was categorized as illiterate if there was no
formal schooling, as some schooling if it was less than primary
schooling to high school completed and as graduate and above
if it was college/university completed or had a postgraduate
degree.
3.2. Smokers
Subjects who currently smoke tobacco daily were categorized
as smokers.
3.3. Physical activity
The Physical Activity Questionnaire (Global Physical Activity
Questionnaire, GPAQ—available in the website www.who.int/
chp/steps) used in this survey was developed by WHO for
physical activity surveillance in countries and collects
information on physical activity participation in three settings
(or domains) and sedentary behaviour. The domains include
activity at work, travel to and from places and recreational
activities. Study individuals were categorized based on a
physical activity questionnaire. The questionnaire had ques-
tions on job related and leisure time activities. Based on the
answers both these questions were graded separately as
sedentary, moderate and heavy.
Overall physical activity was then graded as sedentary,
moderate and vigorous, compiling both job related and leisure
time activities.
3.4. Diabetes
Self-reported diabetes was defined as diabetes diagnosed by a
physician, irrespective of diabetes control status.
3.5. Obesity
Obesity was defined if body mass index was �25 kg/m2 based
on WHO Asia Pacific guidelines [18].
3.6. Abdominal obesity
Abdominal obesity was defined as waist circumference
�90 cm for males and �80 cm for females as per modified
WHO Asia Pacific guidelines [18].
3.7. Statistical analysis
All data were computed on Epi-Info (Version 6), a public
domain program. Double entry of a subset of data and random
checking for errors were the measures taken for quality
assurance. The crude prevalence rate obtained in the present
study was age standardized to 2001 India census. One-way
ANOVA (with Tukey’s honest significant difference) or
Student’s t-test was used to compare groups for continuous
variables and Chi-square test to compare proportions. Trend
Chi-square test was used to compare the increase in
Please cite this article in press as: V. Mohan et al., Urban rural differe
ICMR Indian NCD risk factor surveillance, Diab. Res. Clin. Pract.
prevalence of self-reported diabetes across the different study
groups. Logistic regression analysis was carried out using self-
reported diabetes as the dependent variable and other risk
factors as independent variables. Thirty-four subjects did not
respond to the question on self-reported diabetes and hence
were excluded from all analysis on self-reported diabetes.
Similarly missing data pertaining to various parameters were
excluded from the relevant analysis, so the number of subjects
may differ with variables. All the analysis was done using
Windows-based SPSS statistical package (Version 10.0, Chi-
cago) and a p value of <0.001 was considered for statistical
significance.
4. Results
4.1. Characteristics of the study population
Table 1 presents the characteristics of study subjects based on
their residence. Body mass index, waist circumference,
systolic and diastolic blood pressure were highest among
urban residents followed by the peri-urban/slum residents
and the lowest in rural residents (p < 0.001). Over 25% of the
rural residents were illiterate compared to 8.0% in urban areas
while percentage of graduates was higher in urban areas. With
regard to physical activity, more than 50% of the urban
residents had a sedentary lifestyle while nearly 25% of rural
inhabitants were involved in vigorous physical activity.
Smoking was most common among peri-urban/slum men
compared to their rural and urban counterparts. Obesity and
abdominal obesity were more common in urban residents,
followed by peri-urban/slum and lowest among rural resi-
dents (p < 0.001).
4.2. Prevalence of self-reported diabetes
Table 2 shows that the lowest prevalence of self-reported
diabetes was recorded in rural (3.1%) followed by peri-urban/
slum with 3.2% and the highest prevalence was observed in
urban areas (7.3%) (urban: p < 0.001 compared to peri-urban/
slum and rural areas). There was a geographical difference in
the prevalence of self-reported diabetes, with the centres in
southern states having a higher prevalence of self-reported
diabetes compared with north and central India. Thus, the
overall prevalence of self-reported diabetes was highest in
Trivandrum in Kerala (9.2%), followed by Chennai in
Tamilnadu (6.4%) and Delhi (6.0%). This was followed by
Ballabgarh in North India (2.7%), Dibrugargh in East India
(2.4%) and the lowest was observed in Nagpur in West/Central
India (1.5%). Similar trends were observed even when
categorized based on residential areas as urban, peri-
urban/slum and rural areas, except for urban areas where
Delhi had higher rates than Chennai and Dibrugarh had
higher rates than Ballabgarh.
Fig. 2 shows the age wise distribution of self-reported
diabetes in the study population. Prevalence of self-reported
diabetes increased with increase in age in the rural (trend Chi-
square 309.1, p < 0.001), peri-urban/slum (trend Chi-square
385.9, p < 0.001) and urban (trend Chi-square 966.4, p < 0.001)
areas. At every age point, the prevalence of self-reported
nces in prevalence of self-reported diabetes in India—The WHO–
(2008), doi:10.1016/j.diabres.2007.11.018

Table 2 – Centre-wise prevalence of self-reported diabetes
Regions Places Prevalence of self-reported diabetes (%)
Rural(n = 13,522)
Peri-urban/slum(n = 15,751)
Urban(n = 15,230)
Overall(n = 44,503)
North India Delhi (n = 5103) – 1.8 10.3# 6.0
Ballabgarh (n = 7990) 1.1 2.3* 4.8*,# 2.7
South India Chennai (n = 7847) 3.9 6.6* 8.7*,## 6.4
Trivandrum (n = 7537) 9.6 6.6* 11.2**,# 9.2
East India Dibrugarh (n = 8365) 0.6 1.4** 5.5*,# 2.4
West/Central India Nagpur (n = 7661) 0.6 0.6 3.2*,# 1.5
Overall (n = 44,503) 3.1 3.2 7.3*,# 4.5
*p < 0.001 and **p < 0.05 compared to subjects in rural area. #p < 0.001 and ##p < 0.05 compared to subjects in peri-urban/slum area.
d i a b e t e s r e s e a r c h a n d c l i n i c a l p r a c t i c e x x x ( 2 0 0 8 ) x x x – x x x 5
DIAB-4084; No of Pages 10
diabetes was higher among the urban residents compared to
peri-urban/slum (statistically significant at all age groups) and
rural residents (reached statistical significance after the age of
25 years).
4.3. Risk factors of diabetes
Table 3 presents the characteristics of subjects with and
without diabetes. Diabetic subjects were older (p < 0.001), had
higher body mass index (p < 0.001), waist circumference
(p < 0.001), systolic (p < 0.001) and diastolic (p < 0.001) blood
pressure compared to non-diabetic subjects. Diabetic subjects
were also more sedentary (p < 0.001) and more literate than
non-diabetic subjects (p < 0.001). Prevalence of generalized
obesity (p < 0.001) and abdominal obesity (p < 0.001) were also
higher among diabetic subjects but smoking rates were lower
(p < 0.001).
4.4. Residential area and diabetes
Table 4 shows the logistic regression analysis using self-
reported diabetes as the dependent variable and residential
area, physical activity, abdominal obesity and literacy rates
as independent variables. Subjects residing in urban areas
had significantly higher rates of self-reported diabetes
compared to rural residents (odds ratio (OR): 2.48, 95%
confidence interval (CI): 2.21–2.78, p < 0.001), which per-
Fig. 2 – Age-wise prevalence rates of self-rep
Please cite this article in press as: V. Mohan et al., Urban rural differe
ICMR Indian NCD risk factor surveillance, Diab. Res. Clin. Pract.
sisted even after adding age ( p < 0.001) into the model. There
was no significant increase in risk among peri-urban slum
residents compared to their rural counterparts (data not
shown).
4.5. Physical activity and diabetes
Subjects with moderate grade activity had 1.69 times higher
(p < 0.001), and those with sedentary activity, 2.3 times higher
(p < 0.001) rates of self-reported diabetes compared to those
with vigorous activity. Introducing age into the model did not
change the effect of physical activity on diabetes.
4.6. Abdominal obesity indices and diabetes
The risk for self-reported diabetes was four times higher
among subjects with abdominal obesity compared to those
without obesity (OR: 4.5). Adjusting for age reduced the odds
ratio to 3.55, but it was still statistically significant
( p < 0.001).
4.7. Literacy rates and diabetes
Literacy showed an association with self-reported diabetes
and education levels of graduate or above had 3.0 times
(p < 0.001) increased risk of having self-reported diabetes after
adjusting for age.
orted diabetes in the study population.
nces in prevalence of self-reported diabetes in India—The WHO–
(2008), doi:10.1016/j.diabres.2007.11.018

Table 4 – Logistic regression analysis using self-reported diabetes as the dependent variable
Unadjusted Adjusted for age
Oddsratio
95% confidenceintervals
Adjustedfor age
Oddsratio
95% confidenceintervals
P value
Residential area
Rural (reference) 1.0 – – – – –
Urban 2.48 2.21–2.78 <0.001 2.48 2.21–2.79 <0.001
Physical activity
Vigorous activity (reference) 1.0 – – – – –
Moderate 1.69 1.42–2.00 <0.001 1.52 1.28–1.81 <0.001
Sedentary 2.30 1.95–2.71 <0.001 1.79 1.51–2.12 <0.001
Abdominal obesity
Subjects without abdominal
obesity (reference)
1.0 – – – – –
Subjects with abdominal obesity 4.50 4.27–5.17 <0.001 3.55 3.22–3.91 <0.001
Literacy levels
Illiterate (reference) 1.0 – – – – –
Some schooling 1.38 1.20–1.50 <0.001 2.51 2.48–2.89 <0.001
Graduate and above 1.20 0.99–1.50 NS 3.02 2.45–3.71 <0.001
Table 3 – Characteristics of non-diabetic and diabetic subjects
Parameters Non-diabetic subjects (n = 42,466) Diabetic subjects (n = 2023) p-Value
Age (years) 38 � 14 52 � 10 <0.001
Males n (%) 20,853 (49.1) 1017 (50.3) –
BMI (kg/m2)
Men 21.5 � 4.0 24.3 � 4.0 <0.001
Women 22.2 � 4.7 26.0 � 4.9 <0.001
Waist (cm)
Men 80 � 13 90 � 12 <0.001
Women 78 � 14 90 � 13 <0.001
Systolic blood pressure (mm Hg)
Men 128 � 18 142 � 22 <0.001
Women 124 � 20 142 � 24 <0.001
Diastolic blood pressure (mm Hg)
Men 79 � 12 85 � 12 <0.001
Women 77 � 11 84 � 11 <0.001
Educational status, n (%)
Illiterate 8,552 (20.1) 292 (14.4)
Some schooling 28,675 (67.5) 1435 (70.9) <0.001
Graduate and above 5,239 (12.3) 296 (14.6)
Physical activity, n (%)
Sedentary 18,203 (43.9) 1082 (54.6)
Moderate 16,754 (40.4) 730 (36.9) <0.001
Vigorous 6,501 (15.7) 168 (8.5)
Smoking, n (%)
Men 6,150 (29.5) 259 (25.5) <0.001
Women 558 (2.6) 13 (1.3) <0.001
Generalized obesity, n (%)
Men 3,789 (18.2) 424 (41.9) <0.001
Women 5,444 (25.4) 569 (56.8) <0.001
Abdominal obesity, n (%)
Men 3,978 (19.1) 535 (52.6) <0.001
Women 8,737 (41.5) 821 (82.0) <0.001
d i a b e t e s r e s e a r c h a n d c l i n i c a l p r a c t i c e x x x ( 2 0 0 8 ) x x x – x x x6
DIAB-4084; No of Pages 10
4.8. Cumulative effect of risk factors
The cumulative effect of risk factors was determined by
combining the risk factors and looking at the prevalence of
Please cite this article in press as: V. Mohan et al., Urban rural differe
ICMR Indian NCD risk factor surveillance, Diab. Res. Clin. Pract.
self-reported diabetes (Fig. 3). The prevalence of self-reported
diabetes among rural subjects with no abdominal obesity and
vigorous activity was 0.7%, which dramatically increased to
9.9% in rural subjects with abdominal obesity with sedentary
nces in prevalence of self-reported diabetes in India—The WHO–
(2008), doi:10.1016/j.diabres.2007.11.018

Fig. 3 – Prevalence of self-reported diabetes in relation to
residential area, abdominal obesity and physical
inactivity.
d i a b e t e s r e s e a r c h a n d c l i n i c a l p r a c t i c e x x x ( 2 0 0 8 ) x x x – x x x 7
DIAB-4084; No of Pages 10
activity (trend Chi-square 246.4, p < 0.001). Similarly among
urban subjects, the prevalence of self-reported diabetes rises
from 1.8% in those without abdominal obesity and with
vigorous activity to 11.3% in those with abdominal obesity and
sedentary lifestyle (trend Chi-square 141.8, p < 0.001). This
figure clearly shows the independent contributions of abdom-
inal obesity, physical inactivity and urban residence on
diabetes prevalence in India.
4.9. Regional differences in prevalence of diabetes
Southern India (Chennai (6.4%) and Trivandrum (9.2%), mean
(7.7%)) had higher prevalence of self-reported diabetes
compared to northern India (Delhi (6.0%) and Ballabgarh
(2.7%), mean (4.0%)), eastern India (Dibrugarh (2.4%)) and
western/central India (Nagpur (1.5%)). The higher prevalence
rates of diabetes correlated well with higher rates of obesity in
the respective regions generalized obesity (South India: 27.2%,
North India: 23.8%, East India: 15.9%, West India: 15%, trend
Chi-square: 12.03, p = 0.001) and abdominal obesity (South
India: 39.6%, North India: 34.2%, East India: 20.7%, West India:
19.7%, trend Chi-square: 33.28, p < 0.001). There were differ-
ences in physical activity and literacy levels in different
regions of India but they did not correlate with the prevalence
of diabetes in the respective regions.
5. Discussion
The main findings of the study are the following: (1) crude
prevalence rate of self-reported diabetes was highest in urban,
intermediate in peri-urban/slum and lowest in rural areas in
India, (2) urban residence, abdominal obesity and physical
inactivity were the main risk factors for diabetes.
The first nation-wide diabetes prevalence study was
conducted by ICMR in the year 1972 and covered six different
states of India. Prevalence of diabetes in this study was
recorded as 2.1% in urban areas and 1.5% in rural areas [19].
Following this there were several epidemiological studies in
Please cite this article in press as: V. Mohan et al., Urban rural differe
ICMR Indian NCD risk factor surveillance, Diab. Res. Clin. Pract.
different geographical areas of India which reported pre-
valence ranging from 3.8 to 15.5% [20–22]. This study was
conducted at the national level in urban, peri-urban and rural
areas using standardized WHO STEPS methodology. Since it is
a national surveillance project the results are of great
significance as they can be used as baseline for future
surveillance studies. The overall crude prevalence of self-
reported diabetes was 7.3% in urban, 3.2% in peri-urban/slum
and 3.1% in rural areas. Assuming from earlier published
studies in India that for every known case of diabetes, there
would be at least one unknown [8,10], one could assume that
the figures for total diabetes (self reported + undiagnosed)
would be 14.6% (urban), 6.4% (peri-urban) and 6.2% in rural
areas. These figures are remarkably higher than those
reported in 1970 [19] and are similar to those recently reported
from India [8,10]. Only one recent study done in southern India
called CURES (Chennai Urban Rural Epidemiology Study) [10]
had used plasma glucose measurement. This study reported
an overall diabetes prevalence of 15.5 and 6.1% of known
diabetes (i.e., 9.4% unknown diabetes). Therefore the ratio of
all diabetes/known diabetes in the study is 2.5. In addition, the
recently published Diabetes Atlas [23] states that to account
for unknown diabetes, the prevalence of diabetes for Canada
and US was multiplied by a factor of 1.5, and for the other
countries it was multiplied by 2.0. An earlier nation-wide study
on prevalence of diabetes in India (which, however, used
capillary blood glucose) reported the ratio of newly diagnosed
to known diabetes as 2.5 for overall India, 2.1% for urban India
and 4.2% for rural India [24]. We have chosen to be
conservative and therefore have multiplied the known
diabetes prevalence by 2, which is exactly what the IDF
Diabetes Atlas recommends. Moreover, as a 15-year age cut
point was used in this study compared to 20 years in most
earlier studies, the prevalence rates in this study would be
even higher had the 20-year cut point been used.
A recent nation-wide study [24], prevalence of diabetes in
India study (PODIS) reported the overall prevalence of diabetes
in urban and rural to be 5.9 and 2.7%, respectively, which is
much lower than that reported in this study, although the
PODIS had used glucose tolerance tests to detect undiagnosed
diabetes. The lower prevalence rates observed in PODIS could
be due to the following reasons: (i) sampling areas were
categorized as urban and rural based on the population. Areas
having a population over 100,000 were designated as urban,
while those less than 100,000 were designated as rural. (ii)
Diagnosis of diabetes was based on capillary blood sample
using venous plasma criteria, which could obviously under-
estimate the prevalence of diabetes. (iii) Correlation of 2 h
post-load capillary blood glucose with venous sample was
quite low (0.62).
An interesting observation in this study is that higher
prevalence of self-reported diabetes was observed in southern
India compared to northern, eastern and western part of the
country (except Delhi urban residents). Other studies have
also shown similar results [25,26]. Our study results are in
agreement with the earlier national urban diabetes survey
(NUDS), which showed that Hyderabad, Chennai and Banga-
lore in the south had higher prevalence rates compared to
Delhi, Mumbai or Kolkatta in north, west and east of India,
respectively [9]. In this study, we observed that the higher
nces in prevalence of self-reported diabetes in India—The WHO–
(2008), doi:10.1016/j.diabres.2007.11.018

d i a b e t e s r e s e a r c h a n d c l i n i c a l p r a c t i c e x x x ( 2 0 0 8 ) x x x – x x x8
DIAB-4084; No of Pages 10
rates of generalized and abdominal obesity were associated
with higher rates of diabetes in the respective regions. The
fact that south Indians consume rice-based diets, which
have a higher glycemic index compared to northern India
where the staple food is wheat, could be another contribut-
ing factor. Variations in genetic factors also need to be
studied to explain these differences. Finally, one cannot rule
out the fact that more frequent screening of the population
in some places, e.g., South India/Delhi may have contributed
to the higher prevalence rates of known diabetes in these
regions. The high prevalence of diabetes in Trivandrum
could be explained by the fact that Trivandrum is in Kerala
state which is one of the most urbanized states in India.
Indeed, a recent study [27] from Ernakulam district in Kerala
has reported a prevalence of 19.5%, which is the highest
reported in India so far.
In developing countries, the prevalence of diabetes is
higher in urban than rural while in developed countries, the
prevalence is higher in rural than urban. In India, in the year
2000, the prevalence of diabetes was 12.4% in urban [28] and
2.5% in rural areas [29] and in 2004, the prevalence was 15.5%
in urban [10] and 2.7% in rural areas [24]. In developed
countries like Australia, the reverse situation is seen and the
prevalence is higher in rural (11.6%) [30] than in urban areas
(7.4%) [31]. Thus the urban–rural differences in the prevalence
of diabetes are not universal. Both urban and rural difference
and geographical difference could also be explained by
awareness and knowledge about diabetes. Literacy rates
among urban residents were higher compared to their rural
and slum counterparts. This could play a major role in
increased prevalence of self-reported diabetes and indeed
literacy did come as a factor associated with diabetes in this
study. Literate people are more likely to know about self-
reported diabetes compared to illiterate people.
The main risk factors for self-reported diabetes were
abdominal obesity, physical inactivity and urban residence.
Earlier studies both in West [32,33] and in India [8–10] have
consistently reported an association of diabetes with abdom-
inal obesity. The mean BMI of this study population ranged
between 20.3 and 23.5 kg/m2, which is much lower than the
cut off of >25 kg/m2 suggested by WHO Asia Pacific guidelines
for obesity [18]. Similarly, the waist circumference was also
lower than the cut off of �80 cm for women and �90 cm for
men recommended by WHO Asia Pacific guidelines to define
abdominal obesity. This indicates that the thresholds for BMI
and waist to develop diabetes may be lower in Asian Indians
compared to other ethnic groups. This is consistent with
earlier reports describing this peculiar phenotype, which has
been referred to as the ‘Asian Indian or South Asian
Phenotype’ [34–38].
Physical inactivity has been consistently shown to be a risk
factor for diabetes. An earlier population-based study in
Chennai showed that prevalence of diabetes was higher
among subjects with light grade activity compared to heavy
grade activity [39]. In the present study, subjects with
sedentary activity had 2.2 times higher risk for diabetes
compared to those with vigorous activity. The fact that only
7.4% of the urban residents performed vigorous activity
compared to 25.4% in rural inhabitants could also partly
explain the higher prevalence of diabetes in urban people.
Please cite this article in press as: V. Mohan et al., Urban rural differe
ICMR Indian NCD risk factor surveillance, Diab. Res. Clin. Pract.
Increased prevalence of abdominal obesity and decreased
physical activity is a consequence of economic transition and
nutritional transition. Urbanization has played a major role in
the epidemiological transition cum health transition. In this
regard, this study has yielded interesting results as urban
residents had increased prevalence of diabetes compared to
peri-urban/slum and rural residents. However, even physi-
cally active, non-obese urban residents had higher risk of
having diabetes compared to their rural counterparts. Further,
the influence of affluence is obvious from the fact that urban
residents had higher prevalence of diabetes compared to their
peri-urban/slum counterparts, which in turn was higher than
the rural residents. This is in agreement with earlier studies
[22,40] indicating urban rural differences in the prevalence of
diabetes. It has recently been shown that environmental
pollution in urban areas is an independent risk factor for
diabetes [41]. Future studies should look at the role of pollution
in increasing risk of diabetes in urban Indians.
Another interesting observation in this study is that
abdominal obesity and physical inactivity had a synergistic
effect on the diabetes risk. Thus, among urban rural residents
without sedentary life style or abdominal obesity, the
prevalence of diabetes was 0.7%; this increased to 1.9% if
the subjects had sedentary life style and further increased to
11.3% if they also had abdominal obesity. This underscores
the importance of primary prevention of diabetes by
increasing physical activity and prevention of obesity as part
of a national programme to prevent diabetes and cardiovas-
cular disease.
One of the limitations of the study is that the study was not
performed on a representative sample of India with regard to
age distribution as study subjects were recruited based on age-
specific criteria. Another limitation is that diabetes was
diagnosed based on self-reported diabetes. However, the
STEPS 3 of the NCD risk factor surveillance, currently ongoing
on a subset of study subjects, includes collection of blood
samples for detecting undiagnosed diabetes. Finally, this
study being a cross-sectional study, it cannot provide evidence
for a cause and effect relationship between the association of
risk factors with diabetes.
In conclusion, this nation-wide NCD risk factor surveil-
lance study shows that the prevalence of self-reported
diabetes in India is highest in urban (7.3%), intermediate in
peri-urban 3.2% and lowest in rural area (3.1%) among adults
aged �15 years. Urban residence, abdominal obesity and
physical inactivity are the risk factors for diabetes in this
study.
Acknowledgements
The NCD risk factor surveillance is supported by the World
Health Organization (WHO) India Office and the Indian Council
of Medical Research (ICMR), New Delhi and the Government of
India under WHO—Government of India Collaborative Pro-
gramme. The technical support from Dr. Cherian Varghese is
gratefully acknowledged. We thank the study coordinators
and field staff at the various centres for their help with this
study. Most importantly we thank all the participants of this
study for their cooperation in conducting this survey.
nces in prevalence of self-reported diabetes in India—The WHO–
(2008), doi:10.1016/j.diabres.2007.11.018

d i a b e t e s r e s e a r c h a n d c l i n i c a l p r a c t i c e x x x ( 2 0 0 8 ) x x x – x x x 9
DIAB-4084; No of Pages 10
Conflict of interest
The authors state that they have no conflict of interest.
r e f e r e n c e s
[1] G. Roglic, N. Unwin, P.H. Bennett, C. Mathers, J. Tuomilehto,S. Nag, et al., The burden of mortality attributable todiabetes: realistic estimates for the year 2000, Diabetes Care28 (2005) 2130–2135.
[2] N.J. Morrish, S.L. Wang, L.K. Stevens, J.H. Fuller, H. Keen,Mortality and causes of death in the WHO Multinationalstudy of vascular disease in diabetes, Diabetologia 44 (2001)S14–S21.
[3] G.K. Dowse, H. Gareeboo, P.Z. Zimmet, K.G. Alberti, J.Tuomilehto, D. Fareed, et al.,Mauritius NoncommunicableDisease Study Group, The high prevalence of non-insulindependent diabetes and impaired glucose tolerance inIndian, Creole and Chinese Mauritians, Diabetes 39 (1990)390–396.
[4] M.A. Omar, M.A. Seedat, R.B. Dyer, M.C. Rajput, A.A. Motala,S.M. Joubert, The prevalence of diabetes mellitus in a largegroup of Indians, S. Afr. Med. J. 67 (1985) 924–926.
[5] P. Zimmet, R. Taylor, P. Ram, H. King, G. Sloman, L.R. Raper,et al., The prevalence of diabetes and impaired glucosetolerance in the biracial (Melanesian and Indian)population of Fiji: a rural–urban comparison, Am. J.Epidemiol. 118 (1983) 673–688.
[6] K.L. Ramaiya, V.R.R. Kodali, K.G.M.M. Alberti, Epidemiologyof diabetes in Asians of the Indian sub-continent, Int. J.Diabetes Dev. Countries 2 (1991) 15–36.
[7] A.B. Swai, D.G. McLarty, F. Sherrif, L.M. Chuwa, E. Maro, Z.Lukmanji, et al., Diabetes and impaired glucose tolerance inan Asian community in Tanzania, Diabetes Res. Clin. Pract.8 (1990) 227–234.
[8] A. Ramachandran, et al., High prevalence of diabetes andimpaired glucose tolerance in India: National UrbanDiabetes Survey, Diabetologia 44 (2001) 1094–1101.
[9] V. Mohan, C.S. Shanthirani, R. Deepa, Glucose intolerance(diabetes and IGT) in a selected south Indian populationwith special reference to family history, obesity and lifestyle factors—the Chennai Urban Population Study (CUPS14), J. Assoc. Phys. India 51 (2003) 771–777.
[10] V. Mohan, M. Deepa, R. Deepa, C.S. Shanthirani, S. Farooq,A. Ganesan, et al., Secular trends in the prevalence ofdiabetes and impaired glucose tolerance in urban SouthIndia—the Chennai Urban Rural Epidemiology Study(CURES-17), Diabetologia 49 (2006) 1175–1178.
[11] V. Mohan, S. Shanthirani, R. Deepa, G. Premalatha, N.G.Sastry, R. Saroja, Intra urban differences in the prevalenceof the metabolic syndrome in southern India—the ChennaiUrban Population Study (CUPS-4), Diabetes Med. 18 (2001)280–287.
[12] J.S. Cheah, A.C. Thai, Epidemiology of diabetes mellitus inSingapore: comparison with other ASEAN countries, in:Proceedings of 7th Congress of ASEAN Federation,Singapore, 1993, pp. S58–S6A1.
[13] H.M. Mather, H. Keen, Southall Diabetes Survey: prevalenceof known diabetes, Br. Med. J. 291 (1985) 1081–1084.
[14] D. Simmons, D.R. Williams, M.J. Powell, Prevalence ofdiabetes in a predominantly Asian community: preliminaryfindings of the Coventry diabetes study, Br. Med. J. 298(1989) 18–21.
[15] R. Sicree, J. Shaw, P. Zimmet, Diabetes and impairedglucose tolerance, in: D. Gan (Ed.), Diabetes Atlas,International Diabetes Federation, third edition,
Please cite this article in press as: V. Mohan et al., Urban rural differe
ICMR Indian NCD risk factor surveillance, Diab. Res. Clin. Pract.
International Diabetes Federation, Belgium, 2006, pp. 15–103.
[16] STEPwise approach to surveillance (STEPS) World HealthOrganization (WHO) http://www.who.int/chp/steps/en/(accessed March 3, 2007).
[17] Risk factor surveillance for non-communicable diseases(NCDs): the multi-site ICMR–WHO collaborative initiative.http://www.globalforumhealth.org/filesupld/forum9/CD%20Forum%209/papers/Shah%20B.pdf (accessed March3, 2007).
[18] The Asia Pacific perspective: redefining obesity and itstreatment, Regional Office for the Western Pacific of theWorld Health Organization. World Health Organization,International Association for the Study of Obesity andInternational Obesity Task Force, Health CommunicationsAustralia Pty. Ltd., Sydney, 2000, pp. 17–21.
[19] M.M.S. Ahuja, Epidemiology studies on diabetes mellitus inIndia, in: M.M.S. Ahuja (Ed.), Epidemiology of Diabetes inDeveloping Countries, Interprint, New Delhi, 1979, pp. 29–38.
[20] J.C. Patel, Prevalence of hypertension and diabetes mellitusin a rural village, J. Diabetes Assoc. India 26 (1986) 68–73.
[21] A. Ramachandran, C. Snehalatha, E. Latha, V. Vijay, M.Viswanathan, Rising prevalence of NIDDM in urbanpopulation in India, Diabetologia 40 (1997) 232–237.
[22] A. Ramachandran, C. Snehalatha, D. Dharmaraj, M.Viswanathan, Prevalence of glucose intolerance in AsianIndians. Urban–rural difference and significance of upperbody adiposity, Diabetes Care 15 (1992) 1348–1355.
[23] R. Sicree, J. Shaw, P. Zimmet, Methodology, in: D. Gan (Ed.),Diabetes Atlas, International Diabetes Federation, thirdedition, International Diabetes Federation, Belgium, 2006 ,pp. 335–338 (Chapter 1.1).
[24] S.M. Sadikot, A. Nigam, S. Das, S. Bajaj, A.H. Zargar, K.M.Prasannakumar, et al., The burden of diabetes andimpaired glucose tolerance in India using the WHO1999criteria: prevalence of diabetes in India study (PODIS),Diabetes Res. Clin. Pract. 66 (2004) 301–307.
[25] A. Ramachandran, C. Snehalatha, E. Latha, V. Vijay, M.Viswanathan, Rising prevalence of NIDDM in an urbanpopulation in India, Diabetologia 40 (1997) 232–237.
[26] P. Joshi, S. Islam, P. Pais, S. Reddy, P. Dorairaj, K. Kazmi,et al., Risk factors for early myocardial infarction in SouthAsians compared with individuals in other countries, JAMA297 (2007) 286–294.
[27] V.U. Menon, K.V. Kumar, A. Gilchrist, T.N. Sugathan, K.R.Sundaram, V. Nair, H. Kumar, Prevalence of known andundetected diabetes and associated risk factors in centralKerala—ADEPS, Diabetes Res. Clin. Pract. 74 (2006) 289–294.
[28] Raman Kutty, C.R. Soman, A. Joseph, et al., Type 2 diabetesin southern Kerala. Variation in prevalence amonggeographic divisions within a region, Natl. Med. J. India 13(2000) 287–292.
[29] A. Ramachandran, C. Snehalatha, A.D. Baskar, S. Mary, C.K.Kumar, S. Selvam, et al., Temporal changes in prevalenceof diabetes and impaired glucose tolerance associated withlifestyle transition occurring in the rural population inIndia, Diabetologia 47 (2004) 860–865.
[30] R. McDermott, K.G. Rowley, A.J. Lee, S. Knight, K. O’Dea,Increase in prevalence of obesity and diabetes and decreasein plasma cholesterol in a central Australian aboriginalcommunity, Med. J. Aust. 172 (2000) 480–484.
[31] D.W. Dunstan, P.Z. Zimmet, T.A. Welborn, M.P. De Courten,A.J. Cameron, R.A. Sicree, et al., The rising prevalence ofdiabetes and impaired glucose tolerance: the Australiandiabetes, obesity and lifestyle study, Diabetes Care 25 (2002)829–834.
[32] K.M. Shelgikar, T.D. Hockaday, C.S. Yajnik, Central ratherthan generalized obesity is related to hyperglycaemia inAsian Indian subjects, Diabet. Med. 8 (1991) 712–717.
nces in prevalence of self-reported diabetes in India—The WHO–
(2008), doi:10.1016/j.diabres.2007.11.018

d i a b e t e s r e s e a r c h a n d c l i n i c a l p r a c t i c e x x x ( 2 0 0 8 ) x x x – x x x10
DIAB-4084; No of Pages 10
[33] G.K. Dowse, P.Z. Zimmet, H. Gareeboo, K. George, M.M.Alberti, J. Tuomilehto, et al., Abdominal obesity andphysical inactivity as risk factors for NIDDM and impairedglucose tolerance in Indian, Creole, and ChineseMauritians, Diabetes Care 14 (1991) 271–282.
[34] R. Deepa, S. Sandeep, V. Mohan, Abdominal obesity,visceral fat and Type 2 diabetes—‘‘Asian IndianPhenotype’’, in: V. Mohan, G.H.R. Rao (Eds.), Type 2Diabetes in South Asians: Epidemiology, Risk Factors andPrevention, Jaypee Brothers Medical Publishers, 2006, pp.138–152.
[35] M. Chandalia, N. Abate, A. Garg, J. Stray-Gundersen, S.M.Grundy, Relationship between generalized and upper bodyobesity to insulin resistance in Asian Indian men, J. Clin.Endocrinol. Metab. 84 (1999) 2329–2335.
[36] M. Anjana, S. Sandeep, R. Deepa, K.S. Vimaleswaran, S.Farooq, V. Mohan, Visceral and central abdominal fat andanthropometry in relation to diabetes in Asian Indians,Diabetes Care 27 (2004) 2948–2953.
[37] P.S. Sharp, V. Mohan, J.C. Levy, H.M. Mather, E.M. Kohner,Insulin resistance in patients of Asian Indian and European
Please cite this article in press as: V. Mohan et al., Urban rural differe
ICMR Indian NCD risk factor surveillance, Diab. Res. Clin. Pract.
origin with non-insulin dependent diabetes, Horm. Metab.Res. 19 (1987) 84–85.
[38] V. Mohan, P.S. Sharp, H.R. Cloke, J.M. Burrin, B. Schumer,E.M. Kohner, Serum immunoreactive insulin responses to aglucose load in Asian Indian and European type 2 (non-insulin-dependent) diabetic patients and control subjects,Diabetologia 29 (1986) 235–237.
[39] V. Mohan, K. Gokulakrishnan, R. Deepa, C.S. Shanthirani,M. Datta, Association of physical inactivity withcomponents of metabolic syndrome and coronary arterydisease—The Chennai urban population study (CUPS No.15), Diabet. Med. 22 (2005) 1206–1211.
[40] A. Ramachandran, C. Snehalatha, E. Latha, M. Manoharan,V. Vijay, Impacts of urbanisation on the life style and onthe prevalence of diabetes in native Asian Indianpopulation, Diabetes Res. Clin. Pract. 44 (1999) 207–213.
[41] D.H. Lee, I.K. Lee, K. Song, M. Steffes, W. Toscano, B.A.Baker, et al., A strong dose–response relation betweenserum concentrations of persistent organic pollutants anddiabetes: results from the National Health and ExaminationSurvey 1999–2002, Diabetes Care 29 (2006) 1638–1644.
nces in prevalence of self-reported diabetes in India—The WHO–
(2008), doi:10.1016/j.diabres.2007.11.018