Uranium depletion across the Permian–Triassic boundary in Middle East carbonates: Signature of...
13
Uranium depletion across Permian–Triassic Boundary in Persian Gulf and its implications for paleooceanic conditions V. Tavakoli ⁎, H. Rahimpour-Bonab Department of Geology, College of Science, University of Tehran, Tehran, Iran abstract article info Article history: Received 14 February 2011 Received in revised form 2 June 2012 Accepted 28 June 2012 Available online 6 July 2012 Keywords: Uranium Permian–Triassic boundary Mass extinction South Pars Field Iran High-resolution uranium analyses as well as oxygen, carbon and strontium isotopes data through Permian– Triassic Boundary (PTB) in the marine sections of three offshore wells in Persian Gulf are illustrated in this paper. A decreasing trend in U content from Upper Permian strata toward the PTB is recorded in all wells. Such a trend could not be adequately explained by the facies changes, diagenetic events, salinity variations, dolomitization or total organic carbon (TOC) content of the samples. Distinct and negative uranium anomalies coincide with the onset of the carbon isotope shifts, which might indicate influx of anoxic waters. The Th/U ratios below the PTB in the studied sections are mainly less than 2, reinforcing this possibility. Reducing conditions associated with the anoxia would have gradually increased the rate of U fixation on the deep-sea floor, resulting in low U concentration in the shallow water carbonates. A negative δ 18 O shift of about 4‰ could be seen at the PTB in all studied wells. Such excursion indicates a me- teoric diagenesis below the boundary. Also, abnormally higher 87 Sr/ 86 Sr ratios below the PTB indicate signif- icant input of radiogenic 87 Sr during subaerial exposures at the end of Permian. This palaeoexposure surface is also reflected in depleted oxygen isotope values of this interval. Biostratigraphic studies also show that some important guide forms of Late Permian are absent in studied wells that could be due to several factors including non-sedimentation, subaerial exposure and erosion. Thus a near surface meteoric realm or emer- gent surface could be considered for the PTB in studied wells. © 2012 Elsevier B.V. All rights reserved. 1. Introduction The Permian–Triassic mass extinction, the largest in the Earth's history, continues to spark controversy and debate over its origins. Several possible exogenic and endogenic causes have been proposed for the cause of the mass extinction, including: (1) asteroid/comet impact (e.g., Retallack et al., 1998; Becker et al., 2001); (2) oceanic anoxia or overturn (e.g., Isozaki, 1997; Wignall and Twitchett, 2002); (3) volcanism (e.g., Renne et al., 1995; Reichow et al., 2002) (4) methane clathrate dissociation events (e.g., de Wit et al., 2002; Retallack et al., 2003), (5) release of methane from thermal cracking of coal by flood basalt intrusion (Retallack and Jahren, 2008) and synergistic combination of these possible causes (e.g., Erwin, 1996; Ward et al., 2000). Recent advances in understanding of this global catastrophe indi- cate a scenario of oceanic anoxia caused by huge igneous eruptions and resulting massive release of methane hydrate from the sea floor (Twitchett et al., 2001; Wignall and Twitchett, 2002; Heydari and Hassanzadeh, 2003). A careful study of stratigraphic relationships, de- positional facies and fossil content in PTB stratigraphic sections from various settings is important for improvement of this understanding. A literature compilation of unusual facies occurring in various regions during the Early Triassic, such as central and western Tethys (Oman, Armenia, Iran, Hungary, northern Italy) (Marcoux and Baud, 1986; Wignall and Twitchett, 1999; Heydari et al., 2003; Rahimpour-Bonab et al., 2009), eastern Tethys (south China) (Kershaw et al., 1999; Lehrmann, 1999; Lehrmann et al., 2001) and the East Greenland (Wignall and Twitchett, 2002) showed that fol- lowing the extinction event anomalous deposition occurred globally and in some regions persisted to the Middle Triassic. Permian–Triassic boundary sections with carbonate lithology are uniquely relevant for investigating the end-Permian mass extinction because of their potential for recording changes in seawater geo- chemistry (Kempe and Kazmierczak, 1994; Grotzinger and Knoll, 1995; Lehrmann et al., 2003; Ehrenberg et al., 2008), although such evidences must be differentiated from diagenetic overprints and pos- sible siliciclastic influx (Ehrenberg et al., 2008; Rahimpour-Bonab et al., 2009; Tavakoli et al., 2011). Furthermore, considering the close connection between secular geochemical changes in the oceans and extinction events in the earth history, as observed in case of the Cretaceous–Tertiary (C/T) event (Asaro et al., 1982; Kyte et al., 1985), it is worthwhile to ask if any such changes took place across the PTB. In particular, the oxygen poor condition, developed in the PTB ocean (Wignall and Twitchett, 1996), can be investigated by considering Palaeogeography, Palaeoclimatology, Palaeoecology 350–352 (2012) 101–113 ⁎ Corresponding author. Tel.: +98 9127035242; fax: +98 2166491623. E-mail addresses: [email protected], [email protected] (V. Tavakoli), [email protected] (H. Rahimpour-Bonab). 0031-0182/$ – see front matter © 2012 Elsevier B.V. All rights reserved. doi:10.1016/j.palaeo.2012.06.019 Contents lists available at SciVerse ScienceDirect Palaeogeography, Palaeoclimatology, Palaeoecology journal homepage: www.elsevier.com/locate/palaeo
-
Upload
independent -
Category
Documents
-
view
2 -
download
0
Transcript of Uranium depletion across the Permian–Triassic boundary in Middle East carbonates: Signature of...
Palaeogeography, Palaeoclimatology, Palaeoecology 350–352 (2012) 101–113
Contents lists available at SciVerse ScienceDirect
Palaeogeography, Palaeoclimatology, Palaeoecology
j ourna l homepage: www.e lsev ie r .com/ locate /pa laeo
Uranium depletion across Permian–Triassic Boundary in Persian Gulf and itsimplications for paleooceanic conditions
V. Tavakoli ⁎, H. Rahimpour-BonabDepartment of Geology, College of Science, University of Tehran, Tehran, Iran
⁎ Corresponding author. Tel.: +98 9127035242; fax:E-mail addresses: [email protected], vahid61
[email protected] (H. Rahimpour-Bonab).
0031-0182/$ – see front matter © 2012 Elsevier B.V. Alldoi:10.1016/j.palaeo.2012.06.019
a b s t r a c t
a r t i c l e i n f oArticle history:Received 14 February 2011Received in revised form 2 June 2012Accepted 28 June 2012Available online 6 July 2012
Keywords:UraniumPermian–Triassic boundaryMass extinctionSouth Pars FieldIran
High-resolution uranium analyses as well as oxygen, carbon and strontium isotopes data through Permian–Triassic Boundary (PTB) in the marine sections of three offshore wells in Persian Gulf are illustrated in thispaper. A decreasing trend in U content from Upper Permian strata toward the PTB is recorded in all wells.Such a trend could not be adequately explained by the facies changes, diagenetic events, salinity variations,dolomitization or total organic carbon (TOC) content of the samples.Distinct and negative uranium anomalies coincide with the onset of the carbon isotope shifts, which mightindicate influx of anoxic waters. The Th/U ratios below the PTB in the studied sections are mainly less than2, reinforcing this possibility. Reducing conditions associated with the anoxia would have gradually increasedthe rate of U fixation on the deep-sea floor, resulting in low U concentration in the shallow water carbonates.A negative δ18O shift of about 4‰ could be seen at the PTB in all studied wells. Such excursion indicates a me-teoric diagenesis below the boundary. Also, abnormally higher 87Sr/86Sr ratios below the PTB indicate signif-icant input of radiogenic 87Sr during subaerial exposures at the end of Permian. This palaeoexposure surfaceis also reflected in depleted oxygen isotope values of this interval. Biostratigraphic studies also show thatsome important guide forms of Late Permian are absent in studied wells that could be due to several factorsincluding non-sedimentation, subaerial exposure and erosion. Thus a near surface meteoric realm or emer-gent surface could be considered for the PTB in studied wells.
© 2012 Elsevier B.V. All rights reserved.
1. Introduction
The Permian–Triassic mass extinction, the largest in the Earth'shistory, continues to spark controversy and debate over its origins.Several possible exogenic and endogenic causes have been proposedfor the cause of the mass extinction, including: (1) asteroid/cometimpact (e.g., Retallack et al., 1998; Becker et al., 2001); (2) oceanicanoxia or overturn (e.g., Isozaki, 1997; Wignall and Twitchett,2002); (3) volcanism (e.g., Renne et al., 1995; Reichow et al.,2002) (4) methane clathrate dissociation events (e.g., de Wit et al.,2002; Retallack et al., 2003), (5) release of methane from thermalcracking of coal by flood basalt intrusion (Retallack and Jahren,2008) and synergistic combination of these possible causes (e.g.,Erwin, 1996; Ward et al., 2000).
Recent advances in understanding of this global catastrophe indi-cate a scenario of oceanic anoxia caused by huge igneous eruptionsand resulting massive release of methane hydrate from the sea floor(Twitchett et al., 2001; Wignall and Twitchett, 2002; Heydari andHassanzadeh, 2003). A careful study of stratigraphic relationships, de-positional facies and fossil content in PTB stratigraphic sections from
+98 [email protected] (V. Tavakoli),
rights reserved.
various settings is important for improvement of this understanding.A literature compilation of unusual facies occurring in various regionsduring the Early Triassic, such as central and western Tethys (Oman,Armenia, Iran, Hungary, northern Italy) (Marcoux and Baud, 1986;Wignall and Twitchett, 1999; Heydari et al., 2003;Rahimpour-Bonab et al., 2009), eastern Tethys (south China)(Kershaw et al., 1999; Lehrmann, 1999; Lehrmann et al., 2001) andthe East Greenland (Wignall and Twitchett, 2002) showed that fol-lowing the extinction event anomalous deposition occurred globallyand in some regions persisted to the Middle Triassic.
Permian–Triassic boundary sections with carbonate lithology areuniquely relevant for investigating the end-Permian mass extinctionbecause of their potential for recording changes in seawater geo-chemistry (Kempe and Kazmierczak, 1994; Grotzinger and Knoll,1995; Lehrmann et al., 2003; Ehrenberg et al., 2008), although suchevidences must be differentiated from diagenetic overprints and pos-sible siliciclastic influx (Ehrenberg et al., 2008; Rahimpour-Bonab etal., 2009; Tavakoli et al., 2011). Furthermore, considering the closeconnection between secular geochemical changes in the oceansand extinction events in the earth history, as observed in case ofthe Cretaceous–Tertiary (C/T) event (Asaro et al., 1982; Kyte et al.,1985), it is worthwhile to ask if any such changes took place acrossthe PTB. In particular, the oxygen poor condition, developed in the PTBocean (Wignall and Twitchett, 1996), can be investigated by considering
102 V. Tavakoli, H. Rahimpour-Bonab / Palaeogeography, Palaeoclimatology, Palaeoecology 350–352 (2012) 101–113
redox sensitive elements such as U, V, Co, Mo and some rare earth ele-ments (REEs) such as Ce (Wang et al., 1986; Sarkar et al., 1993;Holser, 1997a,b). Negative δ13C spikes, recorded at extinction bound-aries, have often been explained by a global collapse of the primary pro-ductivity or ecosystem due to a bolide impact or shock-heating ofmarine gas hydrates (Bowring et al., 1998 and references therein).Such an inference, however, requires further high resolution searchfrom other PTB sections both marine and continental.
The purpose of this paper is to document marine PTB section of theMiddle East from three offshore wells in the Persian Gulf, Iran.High-resolution uranium analyses as well as oxygen, carbon and stron-tium isotope data through PTB section in shelf carbonates of the LatePermian–Early Triassic Kangan–upper Dalan formations are measuredin continuous well logs in South Pars Gasfield. The main goal of thispaper is to recognize declining trend in the uranium content contempo-rary with the end-Permian mass extinction. In addition, consideringnew geochemical and stable isotope data, correlation of offshore wellsalong an area in the boundary of Arabian plate is carried out. After de-scribing the available supporting evidences for the studied successions,several alternative hypotheses for explaining the observed long-lastingdepletion of U in the Upper Permian carbonate strata are deliberated.These results can be useful as a basis for distinguishing stratigraphic sur-faces, especially in Permian–Triassic sections. As some boundaries havean important role in the studied reservoir (Rahimpour-Bonab et al.,2009) the results could be used for reservoirs assessment studies, aswell.
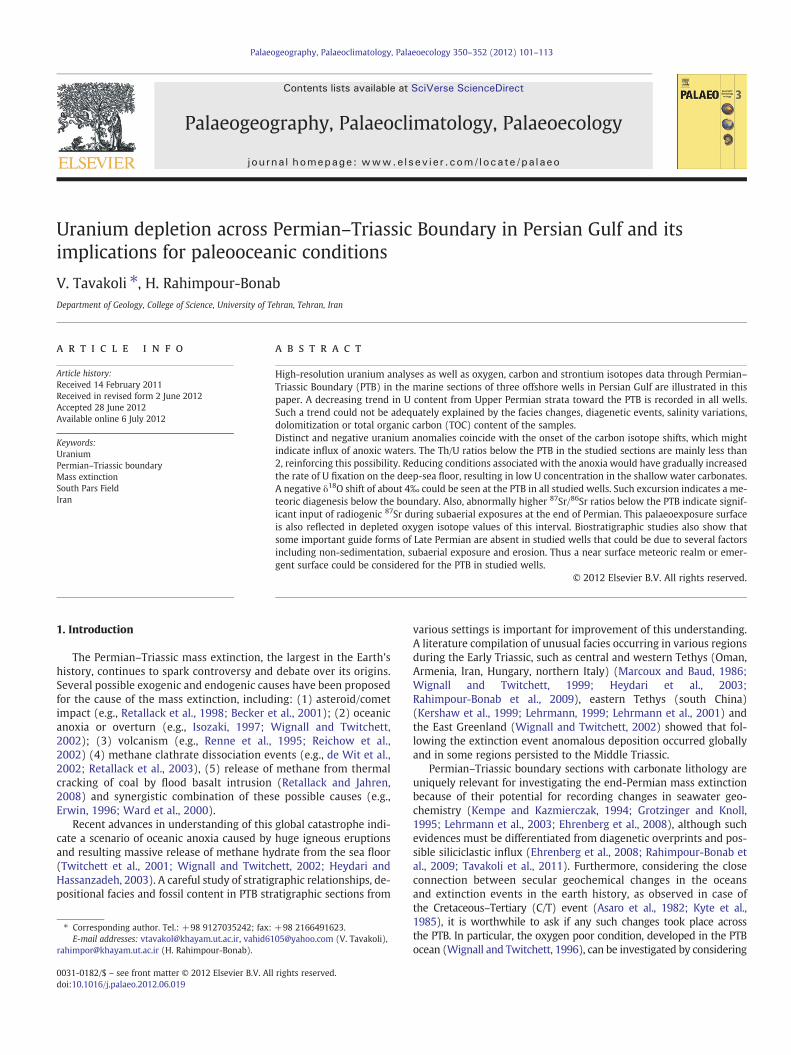
Fig. 1. Tectonic scheme of the Persian Gulf region (Konyuhov and Maleki, 2006). The South Pare Zal, Amol and Abadeh sections, respectively (Horacek et al., 2007b).
2. Geological setting and stratigraphy
The Persian Gulf Basin is situated in the Arabian Peninsula betweenthe Arabian Shield in the west, Taurus Mountains in the north, andZagros Orogen in the east and northeast. In addition to the vast plainsof Arabia, this basin also includes the Persian and Oman gulfs (Fig. 1).At the end of the Palaeozoic, this basin witnessed formation of severalstructural elements, including three large troughs: Gotnia Trough inthe north (Iraq and Syria), Arabian Trough in the central part of thebasin (Saudi Arabia, northern branch of the Persian Gulf and Bahrain),and Rub-Al-Khali in the United Arabian Emirates, (U.A.E.) (Konyuhovand Maleki, 2006). The second and third troughs were separated bythe Qatar Arch and its northern extension i.e. the Fars Block (Iran).
Geology and reservoir characterization of South Pars Gas field iswell-documented by Alsharhan (1993), Al-Jallal (1994) and Alsharhanand Nairn (1997), Rahimpour-Bonab (2007), Esrafili-Dizaji andRahimpour-Bonab (2009), Rahimpour-Bonab et al. (2009). The Generallocation of South Pars Field is illustrated in Fig. 1. The field is part of thehuge NNE–SSW trending Qatar–Fars Arch.
During the most part of the Paleozoic, the Persian Gulf Basin was azone of stable subsidence. The Paleotethys Ocean was situated to thenorth of the Central Iranian Massif. In the Paleozoic, along with theArabo–Nubian Shield, the Central Iranian Massif was situated in thepassive margin of Gondwana continent (Stampfli and Borel, 2002;Konyuhov and Maleki, 2006).
ars Gasfield is part of the huge NNE–SSW trending Qatar-Fars Arch. Numbers 1, 2 and 3
103V. Tavakoli, H. Rahimpour-Bonab / Palaeogeography, Palaeoclimatology, Palaeoecology 350–352 (2012) 101–113
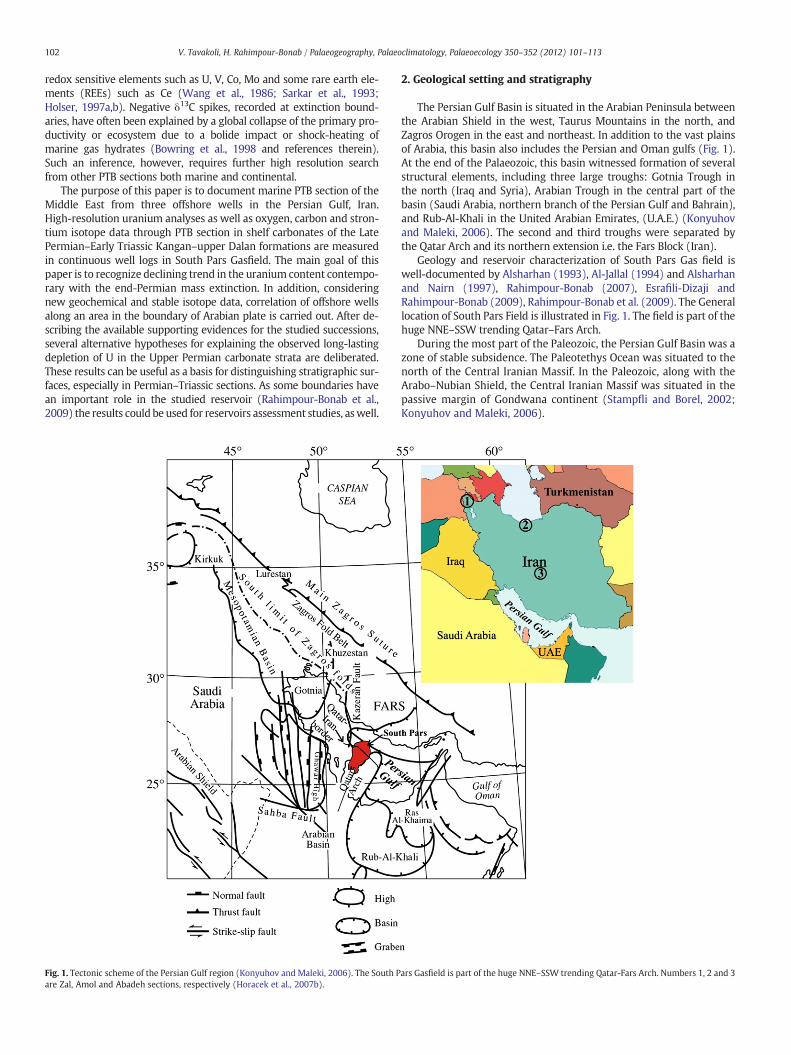
Late Permian time was marked by the intense accumulation ofcarbonate sediments in very different realms ranging from lagoonand coastal zones to offshore areas of the open shelf. They also accu-mulated in sabkhas and salt lakes on the coastal plain. This is indicatedby abundant evaporites (mainly, gypsum and anhydrite) at the UpperPermian and Lower Triassic sequences. The Kangan–upper Dalan forma-tions composed of carbonate–evaporite series known as the Khuff For-mation in the Arabian nomenclature (Alsharhan and Nairn, 1997;Kashfi, 2000). In the studied field, the Early Permian–Early Triassic hasbeen divided into Faraghan (Early Permian), Dalan (Late Permian) andKangan (Early Triassic) formations (Kashfi, 2000). The Faraghan Forma-tion is overlain conformably by the Dalan Formation that is subdividedinto K5, Median Anhydrite (Nar member), K4 and K3 from the bottomto the top, respectively. The Median Anhydrite rests on the K5 dolomite(Fig. 2). The succession is followed by K4 unit that consists of dolomiteand limestone with some anhydrite and is the main gas reservoir unit.So, the Nar–K4 boundary is characterized with a sharp lithology changefrom anhydrite to dolomite from bottom to top. The K3member consistsof dolomite with lesser amounts of dolomitic limestone. This unit sepa-rates from the underlying K4 part with appearance of intervening anhy-drite layers in dolomite lithology of Upper K4. The begging of anhydriteprecipitation is considered as the K4–K3 boundary. Another main reser-voir unit, the Kangan Formation of Early Triassic, unconformably overlieson the Upper Permian strata of K3. Limestones and dolomites of K2 andanhydritic dolomite, dolomite and limestones of K1 are themain constit-uents of this formation. Using the same approach for K4–K3 boundary,the K2–K1 transition is detectable in Kangan Formation. Mud dominatedfacies are frequent in both cases in the lower units. TheKangan Formationis covered by the Dashtak Formation as an efficient cap rock. It should benoted that above mentioned nomenclature are used in Iranian territoryand different names are applied in the other countries (Fig. 2). So, thePTB has different named equivalent strata above and below in the region.
Fig. 2. Regional correlation and sequence stratigraphic framework for the Khuff Formation (KKangan boundary (PTB) named sequence boundary1 (SB1) in sequence stratigraphic studie
3. Materials and methods
Used dataset consists of wireline logs of three wells, core and thinsections in about 30 cm intervals from 1200 m cores of the Kanganand Dalan formations for these wells from South Pars Gas field in Per-sian Gulf (wells OFA_1, OFA_2 and OFA_3). Wireline logs, cores andthin sections for 12 other wells have been used for the general fieldstudy. Detailed core examinations, petrographic studies of thin sectionsand scanning electron microscopy (SEM) are used for determination offacies types, different diagenetic imprints, distribution patterns of vari-ous grains and pore types. Thin sections were stained with alizarinred-S for distinguishing calcite from dolomite. Carbon and oxygen iso-topic data of the 348 samples from twowellswere available fromearlierstudies (Rahimpour-Bonab et al., 2009) in the Dalan and Kangan forma-tions. Carbon and Oxygen isotopic data from 137 samples added in thisstudy from OFA_2 well. All cores were studied in detail for lithofaciesdetermination and sedimentological logs preparation. TOC measuredin well OFA_1. For this purpose, 73 samples from the logged intervalsof the Kangan and Dalan reservoirs were collected for Rock-Eval pyrol-ysis and measuring TOC content. The experiment consists of heating(initially at 300 °C then up to 550 °C with a temperature gradient of25 °C per minute) a small quantity of rock (100 mg). In this experi-ment, geochemical parameter of the rock, fromwhich TOC is extracted,determined, quantitatively. Shale volume is calculated using CGR logand compared with the results of petrographic studies.
A vehicle-mounted spectral gamma-ray probe sensor has measuredthe energy of each gamma ray detected in wells. K, U and Th emitgamma rayswith characteristic energies, so the estimates of the concen-trations of the three radioelements can be made. It should be noted thatthere is very little difference in the quality of the logs obtained from ahand-portable system as compared with those from largervehicle-mounted (Cripps and McCann, 2000). So the results of this
angan and upper Dalan in Iranian nomenclature) in the Middle East. The Upper Dalan–s (Alsharhan, 2006).
104 V. Tavakoli, H. Rahimpour-Bonab / Palaeogeography, Palaeoclimatology, Palaeoecology 350–352 (2012) 101–113
paper could be compared with the similar results obtained fromoutcrops (such as Maurer et al., 2009).
4. Results and discussion
4.1. Depositional environment summery
For facies analysis, the modified Dunham texture scheme was usedtogether with the sedimentary structures and fabrics, grain size, lithol-ogy and diagnostic allochems such as ooids, pelloids, shells and etc.
In general, five major facies belts can be recognized in the fieldscale: 1) the supratidal facies association is characterized by anhy-drite lithology and dolomudstones with layered, massive and nodular(chicken-wire) structures, 2) the intertidal facies association consistsof dolomudstones with fenestral and homogeneous fabrics and algalmat boundstone that contain anhydrite crystals, 3) the lagoon faciesassociation consists of bioturbated peloid-dominated packstones tolaminated mudstones, 4) the shoal facies association is characterizedby oolitic, bioclastic and intraclastic grainstones with cross-beddingstructures and oolitic mudstones in back shoal setting and 5) theoffshoal facies association consists of very fine bioclastic and laminat-ed mudstones. Such depositional setting for the upper Dalan–Kanganstrata (upper Khuff equivalent) are also recognized and documentedby other workers in outcrop sections (Zagros outcrops) and other gasfields in the Persian Gulf basin (e.g., Al-Aswad, 1997; Alsharhan, 2006;Insalaco et al., 2006). Seemingly, the studied strata were deposited overthe inner part of a carbonate ramp system. Using fossil data (Swinchatt,1969; Budd and Perkins, 1980; Scholle et al., 1983) inner ramp settingwith a maximum water depth of 30 m is proposed here.
Reconstruction of the depositional environments has been per-formed based on detailed macroscopic and microscopic sedimentologi-cal studies of the cored intervals and thin sections. Accordingly, themainfacies belts in the studied interval indicate shallow marine environ-ments of a homoclinal ramp in both Permian and Triassic time, asnoted by Rahimpour-Bonab et al. (2009). As revealed by some authors,the ramp facies of the Late Permian are separated from the Triassicones by a disconformity and related subaerial exposure (Heydari et al.,2001; Rahimpour-Bonab et al., 2009 for example). The appearance of
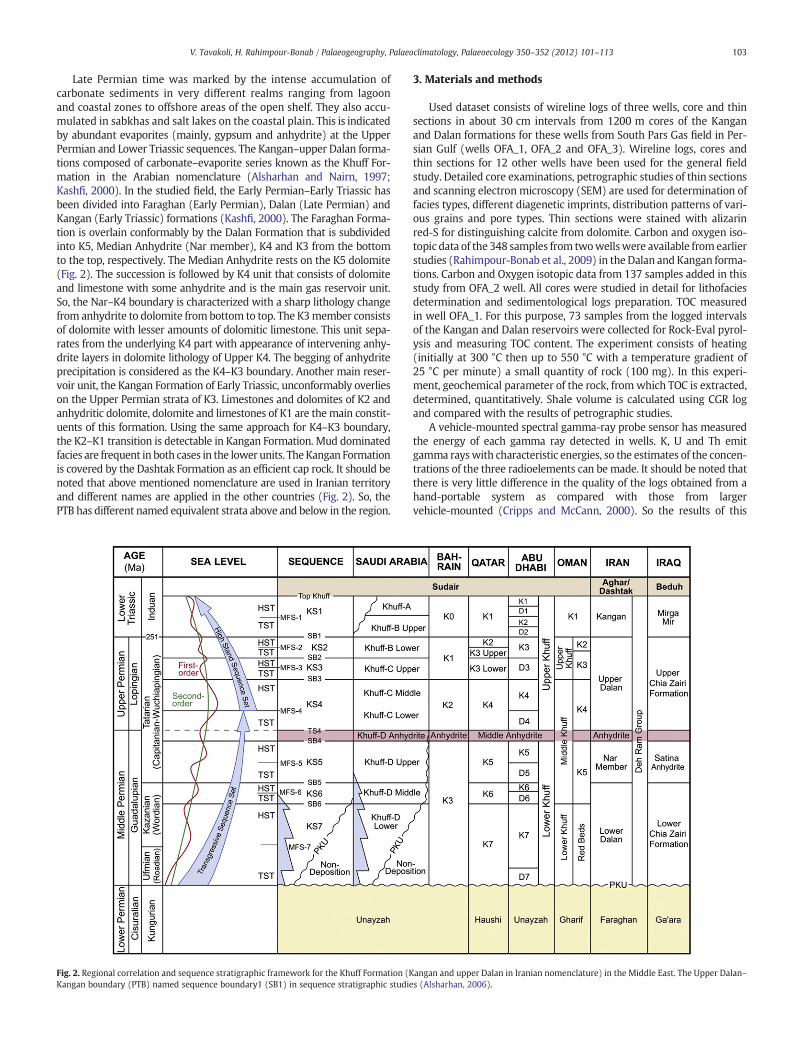
Fig. 3. Macroscopic and microscopic characteristics of PTB in well OFA_1. Thin se
thrombolitic facies in the Early–Mid Triassic is known as a post massextension event (e.g., Schubert and Bottjer, 1992; Lehrmann, 1999;Lehrmann et al., 2003; Rahimpour-Bonab et al., 2009). Thus, in allthree studied wells, the thrombolitic facies with thickness of severaldecimeters is an important evidence for this event just above the P–Tboundary. Petrographic as well as core properties and FMI image log ofPTB in well OFA_1 are illustrated in Fig. 3.
4.2. Diagenetic imprints
Based on the mineralogical compositions, cement types and occur-rences, as well as main microfabrics, diagenetic environments of thestudied units are distinguished and assigned to the marine, meteoricand burial realms (as observed by some authors, such as Moradpouret al., 2008; Esrafili-Dizaji and Rahimpour-Bonab, 2009; Tavakoli et al.,2011). Marine cements are abundant in the high energy facies of theupper Dalan unit. Generally, the early diagenetic overprints of marineorigin include micritisation, marine cementation and early stages ofcompaction. The petrological features of this realm include fibrous ce-ments, skeletal micritisation, orientation of the elongated grains, earlyanhydrite cementation and slight grains deformation. Aragonitic iso-pachous fringes around ooids, skeletal and non-skeletal fragmentshave been stabilized to calcite in the meteoric realm.
Typical freshwater cementations anddissolutions alongwith thepoly-morphic transformations of primary marine minerals all are indication ofmeteoric diagenetic realm. Petrological features typical of this realm in-clude equant sparry calcite cement, vadose calcite silt, intragranular andintergranular dissolution pores, solution-enlarged vugs, and so on. De-tailed petrographic examinations and stable isotopes analysis of thePermian–Triassic Boundary (PTB) (Rahimpour-Bonab et al., 2009) sug-gests that the studied units near the PTB were mainly exposed to a shal-low meteoric diagenesis. As a whole, main diagenetic processes in theseunits were facies selective and it is relatively easy to identify diageneticboundaries in the facies units. In the vicinity of the Permian–Triassic tran-sition, due to prolonged subaerial exposure, hypersaline and meteoricdiagenetic realms were established influencing reservoir characteristicsof bordering intervals. Features of these diagenetic realms include intensemeteoric cementation in the boundary facies, dolomitisation in some
ction locations are labeled on cores. FMI log is illustrated beside these data.
105V. Tavakoli, H. Rahimpour-Bonab / Palaeogeography, Palaeoclimatology, Palaeoecology 350–352 (2012) 101–113
intervals, anhydrite plugging as well as some dissolution. As a whole, de-tailed thin section examinations (Rahimpour-Bonab et al., 2009) indicatethat diagenetic processes (cementation, dolomitisation, dissolution) havemainly affected reservoir quality of the bordering interval (PTB) by poros-ity occlusion and generation. However, once stabilized in a meteoricrealm, these units were subjected to some subsequent burial diageneticalterations, as well.
Grading recrystallization and chemical compaction indicate a burialdiagenetic environment and its petrographic characteristics includecoarse mosaic calcites with undulatory extinction, stylolites, suturedand concave–convex contacts between grains, fractures and dissolutionvugs along the stylolites. Precipitation of blocky anhydrites is a very im-portant diagenetic event as they generally cause complete pore occlu-sion (plugging) and hence drastically reduced the poroperm values.
4.3. Chemistry
4.3.1. Uranium geochemistryThe gamma-ray log measures the natural radiation of uranium, po-
tassium, and thorium (Dypvik and Eriksen, 1983). For carbonate strata,however, rather few studies documenting spectral GR significancehave been published. Although there appears to bewidespread appreci-ation that K and Th reflect clastic content, whereas U is determined bydiagenetic processes involving changes in oxidation state (for example,Lucia, 1999) or U-rich organic matter. In shallow-water platform car-bonates, high gamma activities are interpreted in the same way, exceptthat these limestones are usually devoid of organic matter.
Detailed bulk-chemical profiling of selected GR peaks shows thatpotassium (K) and thorium (Th) are correlated (Fig. 4a) and are a directindex of siliciclastic (aluminosilicate) content (Fig. 4b,c), whereas ura-nium(U) is not correlatedwith K, Th,measured volume of shale and an-hydrite content (Fig. 4d–g). These plots show that while K and Th havedirect relation with each other and with the shale volume, there is norelationship between uranium with these two elements or shale vol-ume. Also there is no correlation between uranium and anhydrite con-tent. It reveals that lithology has no strong effect on the uraniumconcentration changes in the studied intervals.
A possible explanation for the observedUfluctuations in the Permian–Triassic carbonates is that following the end‐Permian extinction, sea-water became barren of suspended organic particles. Commonly highorganic content is associated with increased uranium values (Mo et al.,1973; Klinkhammer and Palmer, 1991; Spirakis, 1996; Fiet and Gorin,2000). This element is generally precipitated in clay-dominatedmarinesettings through fixation on organic particles or in association with re-ducing conditions, developed by organic decomposition near the seafloor (Myers andWignall, 1987). Correlation betweenU and organic car-bon is therefore typical of U-enriched sediments deposited underoxygen-poor conditions (Beers and Goodman, 1944; Russell, 1945;Swanson, 1960, 1961; Schlumberger, 1982). Therefore, low availabilityof organicmatter could reduce the potential for incorporation of U inma-rine sediments. Some similar studies relate the uranium content to TOC(Algeo et al., 2007; Maurer et al., 2009 for example). On the contrary,plot of TOC data versus uranium content do not show any correlation be-tween two factors (Fig. 4h), demonstrating that this hypothesis is not ap-plicable for the studied intervals.
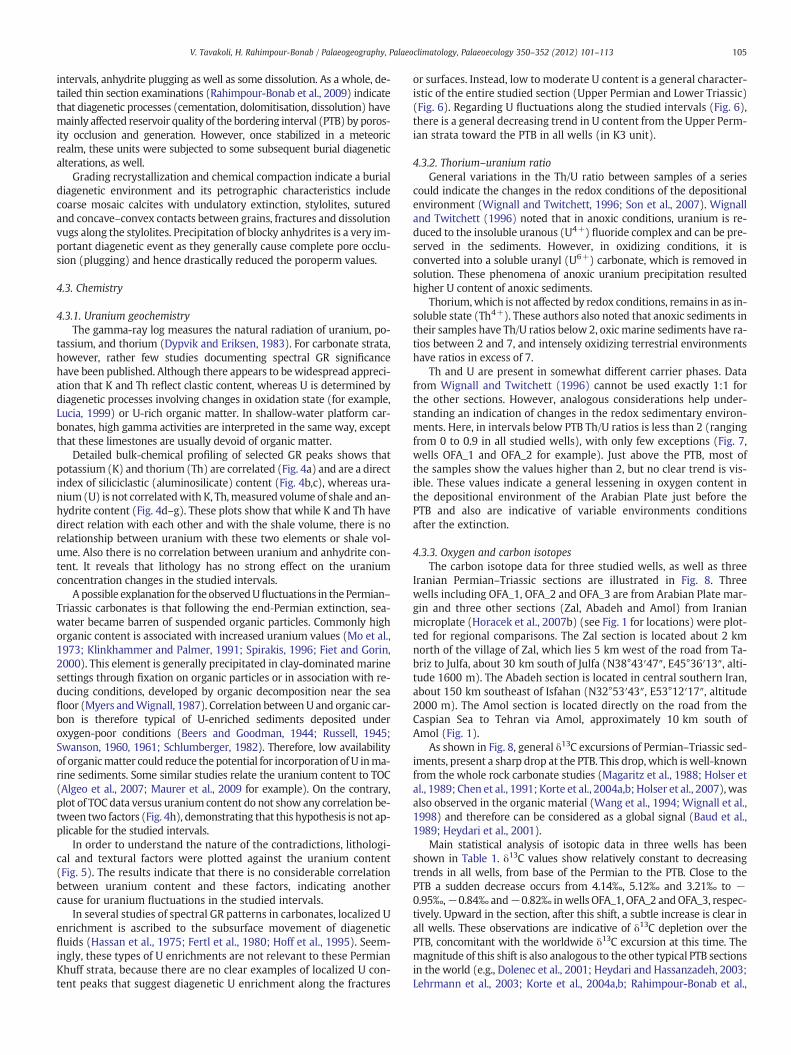
In order to understand the nature of the contradictions, lithologi-cal and textural factors were plotted against the uranium content(Fig. 5). The results indicate that there is no considerable correlationbetween uranium content and these factors, indicating anothercause for uranium fluctuations in the studied intervals.
In several studies of spectral GR patterns in carbonates, localized Uenrichment is ascribed to the subsurface movement of diageneticfluids (Hassan et al., 1975; Fertl et al., 1980; Hoff et al., 1995). Seem-ingly, these types of U enrichments are not relevant to these PermianKhuff strata, because there are no clear examples of localized U con-tent peaks that suggest diagenetic U enrichment along the fractures
or surfaces. Instead, low to moderate U content is a general character-istic of the entire studied section (Upper Permian and Lower Triassic)(Fig. 6). Regarding U fluctuations along the studied intervals (Fig. 6),there is a general decreasing trend in U content from the Upper Perm-ian strata toward the PTB in all wells (in K3 unit).
4.3.2. Thorium–uranium ratioGeneral variations in the Th/U ratio between samples of a series
could indicate the changes in the redox conditions of the depositionalenvironment (Wignall and Twitchett, 1996; Son et al., 2007). Wignalland Twitchett (1996) noted that in anoxic conditions, uranium is re-duced to the insoluble uranous (U4+) fluoride complex and can be pre-served in the sediments. However, in oxidizing conditions, it isconverted into a soluble uranyl (U6+) carbonate, which is removed insolution. These phenomena of anoxic uranium precipitation resultedhigher U content of anoxic sediments.
Thorium,which is not affected by redox conditions, remains in as in-soluble state (Th4+). These authors also noted that anoxic sediments intheir samples have Th/U ratios below 2, oxic marine sediments have ra-tios between 2 and 7, and intensely oxidizing terrestrial environmentshave ratios in excess of 7.
Th and U are present in somewhat different carrier phases. Datafrom Wignall and Twitchett (1996) cannot be used exactly 1:1 forthe other sections. However, analogous considerations help under-standing an indication of changes in the redox sedimentary environ-ments. Here, in intervals below PTB Th/U ratios is less than 2 (rangingfrom 0 to 0.9 in all studied wells), with only few exceptions (Fig. 7,wells OFA_1 and OFA_2 for example). Just above the PTB, most ofthe samples show the values higher than 2, but no clear trend is vis-ible. These values indicate a general lessening in oxygen content inthe depositional environment of the Arabian Plate just before thePTB and also are indicative of variable environments conditionsafter the extinction.
4.3.3. Oxygen and carbon isotopesThe carbon isotope data for three studied wells, as well as three
Iranian Permian–Triassic sections are illustrated in Fig. 8. Threewells including OFA_1, OFA_2 and OFA_3 are from Arabian Plate mar-gin and three other sections (Zal, Abadeh and Amol) from Iranianmicroplate (Horacek et al., 2007b) (see Fig. 1 for locations) were plot-ted for regional comparisons. The Zal section is located about 2 kmnorth of the village of Zal, which lies 5 km west of the road from Ta-briz to Julfa, about 30 km south of Julfa (N38°43′47″, E45°36′13″, alti-tude 1600 m). The Abadeh section is located in central southern Iran,about 150 km southeast of Isfahan (N32°53′43″, E53°12′17″, altitude2000 m). The Amol section is located directly on the road from theCaspian Sea to Tehran via Amol, approximately 10 km south ofAmol (Fig. 1).
As shown in Fig. 8, general δ13C excursions of Permian–Triassic sed-iments, present a sharp drop at the PTB. This drop, which is well-knownfrom the whole rock carbonate studies (Magaritz et al., 1988; Holser etal., 1989; Chen et al., 1991; Korte et al., 2004a,b; Holser et al., 2007),wasalso observed in the organic material (Wang et al., 1994; Wignall et al.,1998) and therefore can be considered as a global signal (Baud et al.,1989; Heydari et al., 2001).
Main statistical analysis of isotopic data in three wells has beenshown in Table 1. δ13C values show relatively constant to decreasingtrends in all wells, from base of the Permian to the PTB. Close to thePTB a sudden decrease occurs from 4.14‰, 5.12‰ and 3.21‰ to −0.95‰,−0.84‰ and−0.82‰ inwells OFA_1, OFA_2 andOFA_3, respec-tively. Upward in the section, after this shift, a subtle increase is clear inall wells. These observations are indicative of δ13C depletion over thePTB, concomitant with the worldwide δ13C excursion at this time. Themagnitude of this shift is also analogous to the other typical PTB sectionsin the world (e.g., Dolenec et al., 2001; Heydari and Hassanzadeh, 2003;Lehrmann et al., 2003; Korte et al., 2004a,b; Rahimpour-Bonab et al.,

Fig. 4. Cross-plots of various geochemical data against each other. a. Potassium–Thorium crossplot shows strong correlation between these two elements in well OFA_1 (R2=0.746). b. Potassium has strong correlation with calculated volume of shale (R2=0.905). c. Such as potassium, thorium has strong correlation with volume of shale (R2=0.866).d and e. There is no correlation between potassium and thorium with uranium in studied interval. f. Uranium content doesn't have any relationship with volume of shale.g. Uranium is not correlating with anhydrite content of the sediments. h. Uranium content also has not any relation with measured TOC in Kangan and upper Dalan strata.
106 V. Tavakoli, H. Rahimpour-Bonab / Palaeogeography, Palaeoclimatology, Palaeoecology 350–352 (2012) 101–113
2009). These findings suggest that a large input of 12C-enriched carboninto the ocean–atmosphere system has occurred and may have causeda global environmental change, probably related to this greatest massextinction in the Phanerozoic.
While the minimum of δ13C values occur just above the P–T bound-ary, a gradual increase towards the uppermost Kangan Formation (Tri-assic) is clear in the δ13C curve. This increasing values toward the top(relative to PTB) have been related to restoration of primary productiv-ity (Rahimpour-Bonab et al., 2009), while decreasing trend from bot-tom of the section toward the PTB could be ascribed to reoxidation of
previously stored 12C-enriched organic material caused by eustatic re-gression (Erwin, 1994; Heydari et al., 2000; Horacek et al., 2007b;Loydell, 2007). This evidence shows major regression and a meteoric/exposure environment at the end of Permian.
Wells OFA_1 and OFA_2 have a nearly complete δ18O data from allover the Upper Permian to Lower Triassic of the Kangan and theupper Dalan strata. Well OFA_3 has δ18O data just near the boundary(Fig. 9). These wells show similar trends in δ18O excursions. There arehigher-frequency fluctuations in K3–K4 boundary and then a subtleincrease occurs from lower K3 to the top of this interval (boundary
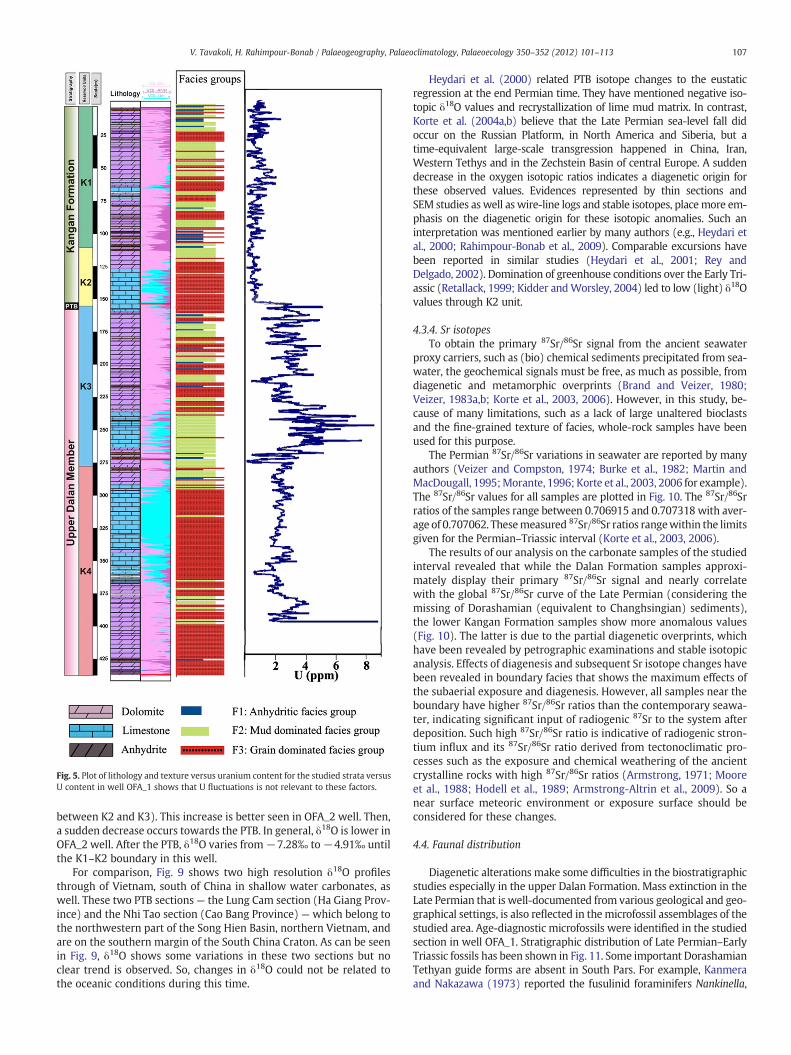
Fig. 5. Plot of lithology and texture versus uranium content for the studied strata versusU content in well OFA_1 shows that U fluctuations is not relevant to these factors.
107V. Tavakoli, H. Rahimpour-Bonab / Palaeogeography, Palaeoclimatology, Palaeoecology 350–352 (2012) 101–113
between K2 and K3). This increase is better seen in OFA_2 well. Then,a sudden decrease occurs towards the PTB. In general, δ18O is lower inOFA_2 well. After the PTB, δ18O varies from−7.28‰ to−4.91‰ untilthe K1–K2 boundary in this well.
For comparison, Fig. 9 shows two high resolution δ18O profilesthrough of Vietnam, south of China in shallow water carbonates, aswell. These two PTB sections— the Lung Cam section (Ha Giang Prov-ince) and the Nhi Tao section (Cao Bang Province) — which belong tothe northwestern part of the Song Hien Basin, northern Vietnam, andare on the southern margin of the South China Craton. As can be seenin Fig. 9, δ18O shows some variations in these two sections but noclear trend is observed. So, changes in δ18O could not be related tothe oceanic conditions during this time.
Heydari et al. (2000) related PTB isotope changes to the eustaticregression at the end Permian time. They have mentioned negative iso-topic δ18O values and recrystallization of lime mud matrix. In contrast,Korte et al. (2004a,b) believe that the Late Permian sea-level fall didoccur on the Russian Platform, in North America and Siberia, but atime-equivalent large-scale transgression happened in China, Iran,Western Tethys and in the Zechstein Basin of central Europe. A suddendecrease in the oxygen isotopic ratios indicates a diagenetic origin forthese observed values. Evidences represented by thin sections andSEM studies as well as wire-line logs and stable isotopes, placemore em-phasis on the diagenetic origin for these isotopic anomalies. Such aninterpretation was mentioned earlier by many authors (e.g., Heydari etal., 2000; Rahimpour-Bonab et al., 2009). Comparable excursions havebeen reported in similar studies (Heydari et al., 2001; Rey andDelgado, 2002). Domination of greenhouse conditions over the Early Tri-assic (Retallack, 1999; Kidder andWorsley, 2004) led to low (light) δ18Ovalues through K2 unit.
4.3.4. Sr isotopesTo obtain the primary 87Sr/86Sr signal from the ancient seawater
proxy carriers, such as (bio) chemical sediments precipitated from sea-water, the geochemical signals must be free, as much as possible, fromdiagenetic and metamorphic overprints (Brand and Veizer, 1980;Veizer, 1983a,b; Korte et al., 2003, 2006). However, in this study, be-cause of many limitations, such as a lack of large unaltered bioclastsand the fine-grained texture of facies, whole-rock samples have beenused for this purpose.
The Permian 87Sr/86Sr variations in seawater are reported by manyauthors (Veizer and Compston, 1974; Burke et al., 1982; Martin andMacDougall, 1995;Morante, 1996; Korte et al., 2003, 2006 for example).The 87Sr/86Sr values for all samples are plotted in Fig. 10. The 87Sr/86Srratios of the samples range between 0.706915 and 0.707318 with aver-age of 0.707062. Thesemeasured 87Sr/86Sr ratios rangewithin the limitsgiven for the Permian–Triassic interval (Korte et al., 2003, 2006).
The results of our analysis on the carbonate samples of the studiedinterval revealed that while the Dalan Formation samples approxi-mately display their primary 87Sr/86Sr signal and nearly correlatewith the global 87Sr/86Sr curve of the Late Permian (considering themissing of Dorashamian (equivalent to Changhsingian) sediments),the lower Kangan Formation samples show more anomalous values(Fig. 10). The latter is due to the partial diagenetic overprints, whichhave been revealed by petrographic examinations and stable isotopicanalysis. Effects of diagenesis and subsequent Sr isotope changes havebeen revealed in boundary facies that shows the maximum effects ofthe subaerial exposure and diagenesis. However, all samples near theboundary have higher 87Sr/86Sr ratios than the contemporary seawa-ter, indicating significant input of radiogenic 87Sr to the system afterdeposition. Such high 87Sr/86Sr ratio is indicative of radiogenic stron-tium influx and its 87Sr/86Sr ratio derived from tectonoclimatic pro-cesses such as the exposure and chemical weathering of the ancientcrystalline rocks with high 87Sr/86Sr ratios (Armstrong, 1971; Mooreet al., 1988; Hodell et al., 1989; Armstrong-Altrin et al., 2009). So anear surface meteoric environment or exposure surface should beconsidered for these changes.
4.4. Faunal distribution
Diagenetic alterations make some difficulties in the biostratigraphicstudies especially in the upper Dalan Formation. Mass extinction in theLate Permian that is well-documented from various geological and geo-graphical settings, is also reflected in themicrofossil assemblages of thestudied area. Age-diagnostic microfossils were identified in the studiedsection in well OFA_1. Stratigraphic distribution of Late Permian–EarlyTriassic fossils has been shown in Fig. 11. Some important DorashamianTethyan guide forms are absent in South Pars. For example, Kanmeraand Nakazawa (1973) reported the fusulinid foraminifers Nankinella,
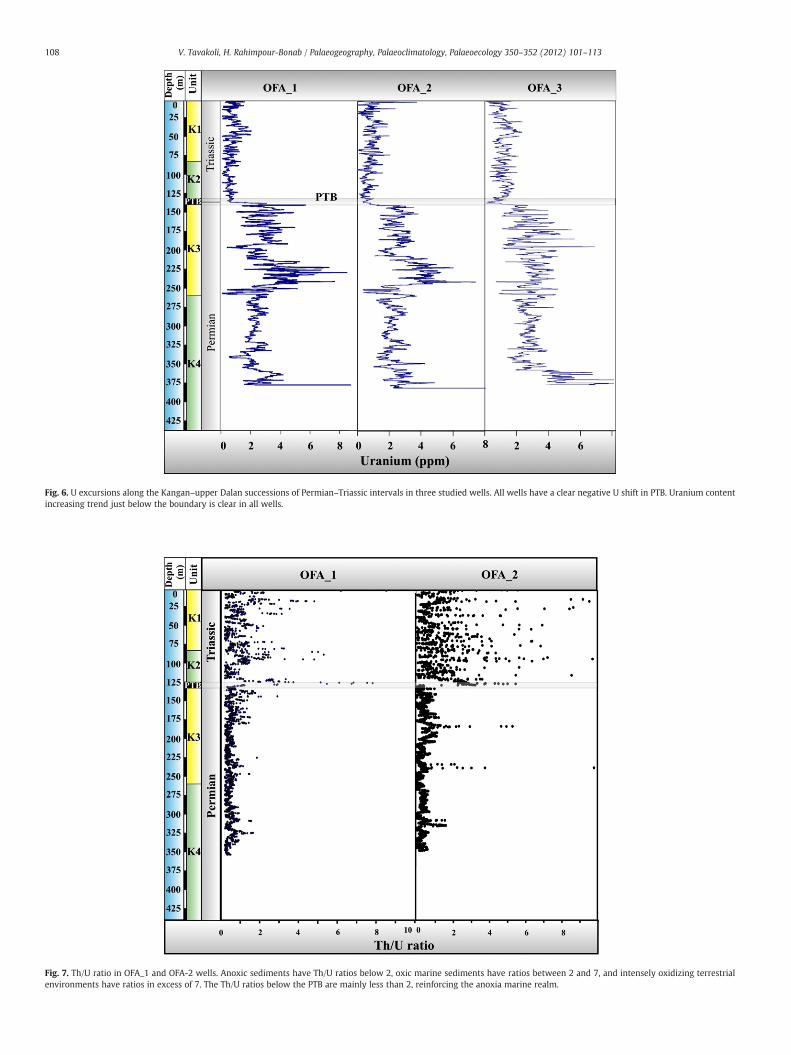
Fig. 6. U excursions along the Kangan–upper Dalan successions of Permian–Triassic intervals in three studied wells. All wells have a clear negative U shift in PTB. Uranium contentincreasing trend just below the boundary is clear in all wells.
Fig. 7. Th/U ratio in OFA_1 and OFA-2 wells. Anoxic sediments have Th/U ratios below 2, oxic marine sediments have ratios between 2 and 7, and intensely oxidizing terrestrialenvironments have ratios in excess of 7. The Th/U ratios below the PTB are mainly less than 2, reinforcing the anoxia marine realm.
108 V. Tavakoli, H. Rahimpour-Bonab / Palaeogeography, Palaeoclimatology, Palaeoecology 350–352 (2012) 101–113

Fig. 8. Carbon isotope profiles through Permian–Triassic intervals in wells OFA_1, OFA_2 and OFA_3. In addition, Zal, Abadeh and Amol sections are presented for regional compar-isons (Horacek et al., 2007b). Locations of these sections are clear in Fig. 2.
109V. Tavakoli, H. Rahimpour-Bonab / Palaeogeography, Palaeoclimatology, Palaeoecology 350–352 (2012) 101–113
Staffella, and Codonofusiella from the Upper Mitai Formation in Japan,indicating a Late Permian (middle Dorashamian equivalent to Changhsingian) age. Lehrman (Lehrman et al., 2003) reported Changhsingianforaminifers (Palaeofusulina and Colaniella) from south China that areabundant in the Upper Permian. Kobayashi (Kobayashi, 1999) notedthat Palaeofusulina fauna is one of themost reliable indicators of upper-most Permian. These fossils are absent in the shallow basin of SouthPars, even though that basin had water depths similar to the waterdepths of sections in Iran. The assemblage of index fossils in the studiedwells shows that at least parts of the Upper Permian (Dorashamian)sediments aremissing in this area, which could be due to several factorsincluding non-sedimentation, subaerial exposure and erosion.
An important marker annelid Spirorbis phlyctaena give an Early Tri-assic (Scythian) age to the lower part of K2 following the thromboliticlevel. This fossil has been related to beginning of the Triassic (Scythian)in some places such as Tunisia (Kilani-Mazraoui et al., 1990) andSaudi Arabia (Vaslet et al., 2005). The Djulfian index foraminifersGlobivalvulina vonderschmitti and Paraglobivalvulinamira are presentbelow the PTB. Other fossils of studied Upper Permian–Lower Triassicsediments in the wells have been shown in Fig. 11.
In summary, combination of C, O, Sr isotope datawith biostratigraphicstudies provides a reliable mean for identification of the PTB in ourstudied sections and potentially others in the regions.
Table 1Statistical analysis of carbon and oxygen data in studied wells.
OFA_1 OFA_2 OFA_3
δ13C ‰
Mean 2.66 3.85 1.87Minimum −0.95 −0.61 −0.82Maximum 6.89 7.24 4.98Count 163 137 185
δ18O ‰
Mean −2.82 −3.54 −2.62Minimum −6.27 −9.41 −6.46Maximum 3.26 1.53 4.01Count 163 137 185
4.5. Chemostratigraphy and correlation
Due to rapid sea-level changes, the Permian–Triassic stratigraphicsections commonly contain a hiatus or high degree of condensation atthe PTB transition, which are not always easily identified. Difficultiesin world-wide correlation of the uppermost Permian have resultedbecause of different geographic faunal compositions and the geographicpatterns of extinction of the Permianmarine faunas. Here, carbon and Srisotope data as well as changes in uranium concentration have beenused for the chemostratigraphic analysis of Permian–Triassic boundaryin three Iranian offshore wells. The δ13C curve coincides with the globaltrend from other Permian–Triassic boundary sections, and places thechemostratigraphic P–T boundary within the lower microbialite. Theseδ13C trends have been reported from the Tethyan sections withwell-defined biostratigraphy, including Abadeh in central Iran (Baudet al., 1989; Heydari et al., 2000, 2003), a section from ZagrosMountainsin Iran (Wang et al., 2007), Vedi in Armenian, and Curuk Dag in Turkey(Baud et al., 1989). This chronological relation was also extended to thecorresponding sections outside the Iranian Plate (Lehrmann, 1999;Ezaki et al., 2003). Carbon isotopedata of thesewells that have been cor-related with oxygen and Sr isotopes as well as paleontology content canbe used as an indicator of worldwide PTB correlation. Negative shift inδ13C about 5‰ in all studied wells could be an indicator of PTB withpoorly-defined biostratigraphical data.
In the studied intervals, 87Sr/86Sr varies from 0.7070 below the PTBto more than 0.7072 above it. Two explanations can be put forward toaccount for the high 87Sr/86Sr values above PTB. First, diagenetic alter-ation of carbonates might account for the enrichment in radiogenic Sr.As discussed earlier, δ18O anomalies denote diagenetic alterations intheses formations. An alternative explanation might be the influx ofmeteoric water into the basin, thus providing higher amounts of radio-genic Sr to the basin or the early diagenetic environment (Armstrong,1971; Moore et al., 1988; Hodell et al., 1989; Armstrong-Altrin et al.,2009). Petrographic, SEMand stable isotope data confirms this explana-tion too. These two statements are not in contrast. So, 87Sr/86Sr varia-tions across PTB in offshore Iran sections are the result of meteoricwater diagenesis.
Uranium changes suddenly in PTB that can be used for regional andglobal correlation of the same aged shallow carbonate successions. This
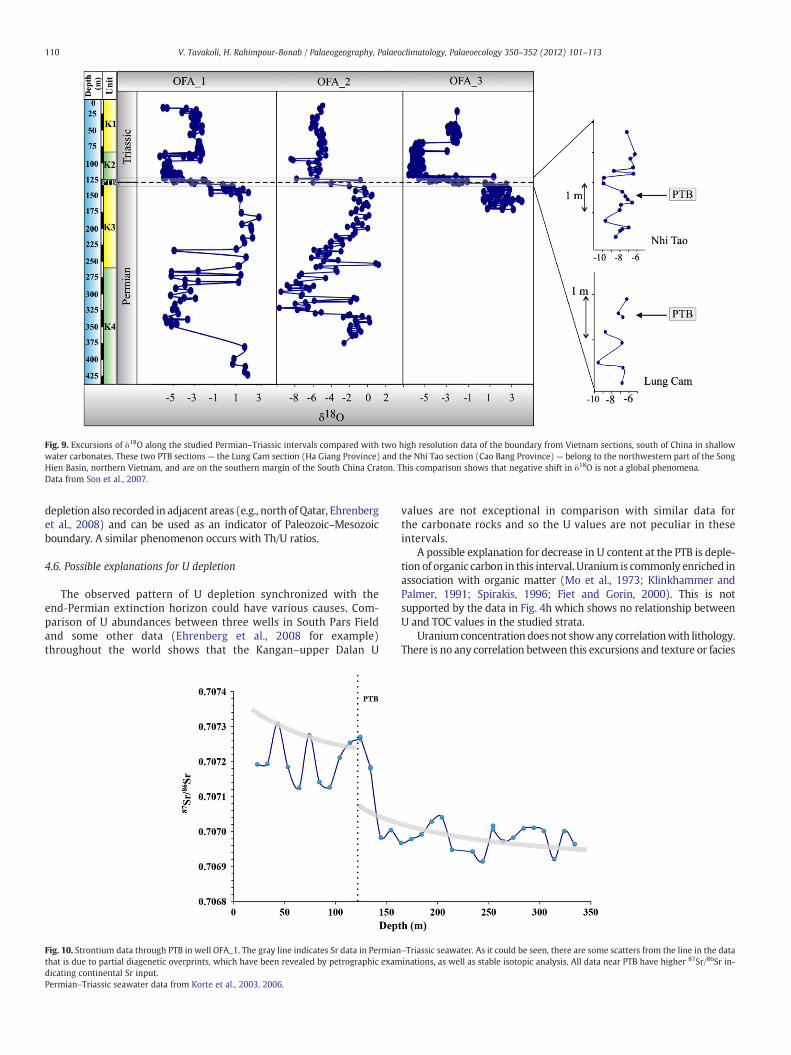
Fig. 9. Excursions of δ18O along the studied Permian–Triassic intervals compared with two high resolution data of the boundary from Vietnam sections, south of China in shallowwater carbonates. These two PTB sections — the Lung Cam section (Ha Giang Province) and the Nhi Tao section (Cao Bang Province) — belong to the northwestern part of the SongHien Basin, northern Vietnam, and are on the southern margin of the South China Craton. This comparison shows that negative shift in δ18O is not a global phenomena.Data from Son et al., 2007.
110 V. Tavakoli, H. Rahimpour-Bonab / Palaeogeography, Palaeoclimatology, Palaeoecology 350–352 (2012) 101–113
depletion also recorded in adjacent areas (e.g., north of Qatar, Ehrenberget al., 2008) and can be used as an indicator of Paleozoic–Mesozoicboundary. A similar phenomenon occurs with Th/U ratios.
4.6. Possible explanations for U depletion
The observed pattern of U depletion synchronized with theend‐Permian extinction horizon could have various causes. Com-parison of U abundances between three wells in South Pars Fieldand some other data (Ehrenberg et al., 2008 for example)throughout the world shows that the Kangan–upper Dalan U
Fig. 10. Strontium data through PTB in well OFA_1. The gray line indicates Sr data in Permianthat is due to partial diagenetic overprints, which have been revealed by petrographic examdicating continental Sr input.Permian–Triassic seawater data from Korte et al., 2003, 2006.
values are not exceptional in comparison with similar data forthe carbonate rocks and so the U values are not peculiar in theseintervals.
A possible explanation for decrease in U content at the PTB is deple-tion of organic carbon in this interval. Uranium is commonly enriched inassociation with organic matter (Mo et al., 1973; Klinkhammer andPalmer, 1991; Spirakis, 1996; Fiet and Gorin, 2000). This is notsupported by the data in Fig. 4h which shows no relationship betweenU and TOC values in the studied strata.
Uraniumconcentration does not showany correlationwith lithology.There is no any correlation between this excursions and texture or facies
–Triassic seawater. As it could be seen, there are some scatters from the line in the datainations, as well as stable isotopic analysis. All data near PTB have higher 87Sr/86Sr in-
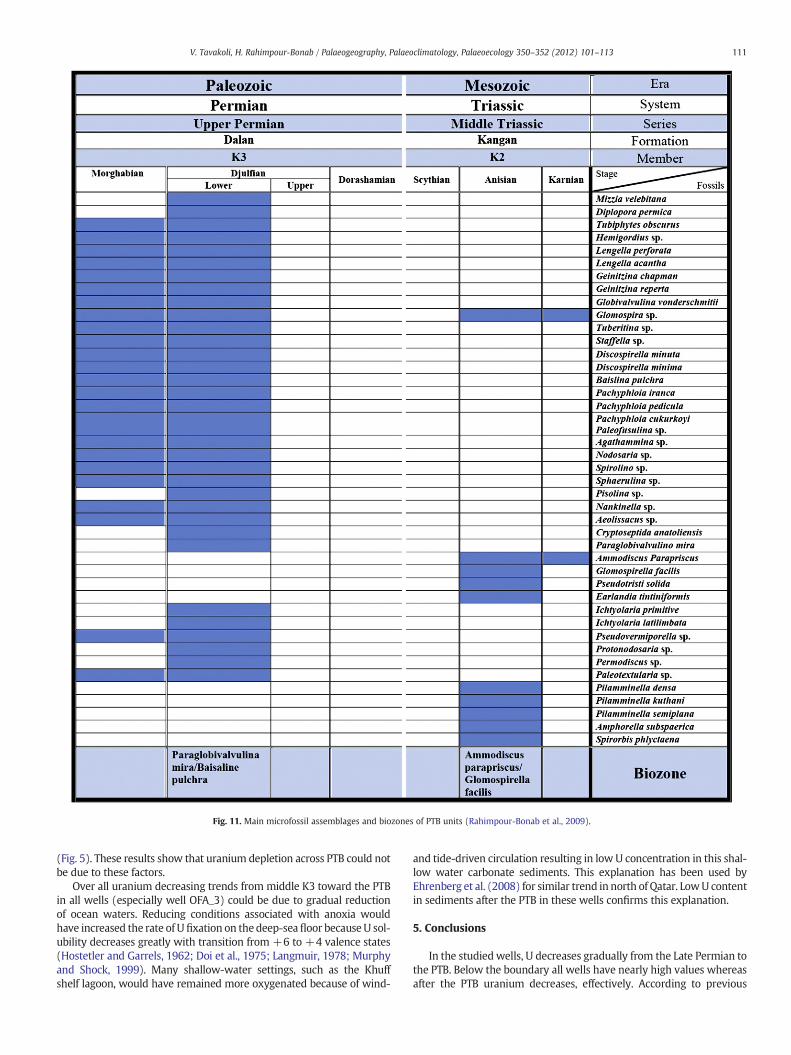
Fig. 11. Main microfossil assemblages and biozones of PTB units (Rahimpour-Bonab et al., 2009).
111V. Tavakoli, H. Rahimpour-Bonab / Palaeogeography, Palaeoclimatology, Palaeoecology 350–352 (2012) 101–113
(Fig. 5). These results show that uranium depletion across PTB could notbe due to these factors.
Over all uranium decreasing trends from middle K3 toward the PTBin all wells (especially well OFA_3) could be due to gradual reductionof ocean waters. Reducing conditions associated with anoxia wouldhave increased the rate of U fixation on the deep-seafloor because U sol-ubility decreases greatly with transition from +6 to +4 valence states(Hostetler and Garrels, 1962; Doi et al., 1975; Langmuir, 1978; Murphyand Shock, 1999). Many shallow-water settings, such as the Khuffshelf lagoon, would have remained more oxygenated because of wind-
and tide-driven circulation resulting in low U concentration in this shal-low water carbonate sediments. This explanation has been used byEhrenberg et al. (2008) for similar trend in north of Qatar. LowU contentin sediments after the PTB in these wells confirms this explanation.
5. Conclusions
In the studied wells, U decreases gradually from the Late Permian tothe PTB. Below the boundary all wells have nearly high values whereasafter the PTB uranium decreases, effectively. According to previous
112 V. Tavakoli, H. Rahimpour-Bonab / Palaeogeography, Palaeoclimatology, Palaeoecology 350–352 (2012) 101–113
discussions, TOC and facies change could not satisfactory explain PTBuranium depletion in studied formations. Results of this study indicatethat gradual U decrease to the PTB in Kangan–upper Dalan extinctionhorizon reflects a gradual decrease of theU content of shallow seawater.This is due to high precipitation of U in deep-ocean. It is suggested thatthe global U depletion in shallow water sediments in the Late Permianseawater, caused by declining but persistent deep-ocean anoxia andthe resulting increase in U precipitation in deep oxygen-poor sedi-ments. Little mixing of deep and shallow waters in latest Permian en-forces this explanation. In other words, high precipitation of uraniumin deep-ocean caused deposition of poor uranium sediments on theshallow shelf settings where the Kangan and Dalan formations havebeen deposited. These considerations indicate that even though theredox conditions of depositional environments in all wells fluctuated,they indicate a general decline in oxygenation, and may point towardsanoxic conditions in the Late Permian, though shelf environmentswere more oxygenated than deeper waters. This is supported by theTh/U ratios, as discussed above. All other possible controlling factors ap-pear to have varied cyclically within similar limits both before and afterthe PTB, including sedimentary facies, incorporation of organic matter,and dolomitization.
Acknowledgments
The Vice-President of Research and Technology of the Universityof Tehran provided financial support for this research, which we aregrateful. We also extend our appreciation to the POGC (Pars Oil andGas Company of Iran) for sponsoring, data preparation, and permis-sion to publish this paper. We would like to thank Ms. Naderi forher detailed and helpful reviews and comments. Many thanks to theEditor, Professor F. Surlyk, and two anonymous reviewers who helpedto improve the final version of this paper.
References
Al-Aswad, A., 1997. Stratigraphy, sedimentary environment anddepositional evolution of theKhuff Formation in south-central Saudi Arabia. Journal of Petroleum Geology 20, 1–20.
Algeo, T.J., Ellwood, B.B., Nguyen, T.K.T., Rowe, H., Maynard, J.B., 2007. The Permian–Triassic boundary at Nhi Tao, Vietnam: evidence for recurrent influx of sulfidicwatermasses to a shallow-marine carbonate platform. Palaeogeography, Pal-aeoclimatology, Palaeoecology 252, 304–327.
Al-Jallal, A.I., 1994. Stratigraphy, depositional environments and reservoir potential ofthe Khuff Formation in the Arabian Gulf Countries. Proceedings of the 6th AbuDhabi International Petroleum Exhibition and Conference, p. 402.
Alsharhan, A.S., 1993. Facies and sedimentary environment of the Permian carbonates(Khuff Formation) in the United Arab Emirates. Sedimentary Geology 84, 89–99.
Alsharhan, A.S., 2006. Sedimentological character and hydrocarbon parameters of themiddle Permian to Early Triassic Khuff Formation, United Arab Emirates. Geo-Arabia 11, 121–158.
Alsharhan, A.S., Nairn, A.E.M., 1997. Sedimentary Basins and Petroleum Geology of theMiddle East. Elsevier, Amsterdam.
Armstrong, R.L., 1971. Glacial erosion and the variable isotopic composition of stron-tium in seawater. Nature 230, 132–133.
Armstrong-Altrin, J.S., Leeb, Y., Verma, S.P., Worden, R.H., 2009. Carbon, oxygen, andstrontium isotope geochemistry of carbonate rocks of the upper MioceneKudankulam Formation, southern India: implications for paleoenvironment anddiagenesis. Chemie der Erde 69, 45–60.
Asaro, F., Alvarez, L.W., Alvarez, W., Michel, H.V., 1982. Geochemical anomalies nearthe Eocene–Oligocene and Permian–Triassic boundaries. Geological Society ofAmerica Special Papers 190, 517–528.
Baud, A., Magaritz, M., Holser, W.T., 1989. Permian–Triassic of the Tethys: carbon iso-tope studies. Geologische Rundschau 78, 649–677.
Becker, L., Poreda, R.L., Hunt, A.G., Bunch, T.E., Rampino, M., 2001. Impact event at thePermian–Triassic boundary: evidence from extraterrestrial gases in fullerenes. Sci-ence 291, 1530–1533.
Beers, R.F., Goodman, C., 1944. Distribution of radioactivity in ancient sediments. Geo-logical Society of America Bulletin 55, 1229–1254.
Bowring, S.A., Erwin, D.H., Jin, Y., Martin, M.W., Davidek, K.L., Wei, W., 1998. U/Pb zir-con geochronology and tempo of the end-Permian mass extinction. Science 280,1039–1045.
Brand, U., Veizer, J., 1980. Chemical diagenesis of a multi-component carbonate system.I. Trace elements. Journal of Sedimentary Petrology 50, 1219–1236.
Budd, D.A., Perkins, R.D., 1980. Bathymetric zonation and paleoecological significanceof microborings in Puerto Rican shelf and slope sediments. Journal of SedimentaryPetrology 50, 881–904.
Burke, W.H., Denison, R.E., Hetherington, E.A., Koepnick, R.B., Nelson, H.F., Otto, J.B., 1982.Variation of seawater 87Sr/86Sr throughout Phanerozoic time. Geology 10, 516–519.
Chen, J.H., Curran, H.A., White, B., Wasserburg, G.J., 1991. Precise chronology of the lastinterglacial period: 234U–230Th data from fossil coral reefs in the Bahamas. Geolog-ical Society of America Bulletin 103, 82–97.
Cripps, A.C., McCann, D.M., 2000. The use of the natural gamma log in engineering, geo-logical investigations. Engineering Geology 55, 313–324.
de Wit, M.J., Ghosh, J.G., de Villiers, S., Rakotosolofo, N., Alexander, J., Tripathi, A., Looy,C., 2002. Multiple organic carbon isotope reversals across the Permo-Triassicboundary of terrestrial Gondwana sequences: clues to extinction patterns and de-layed ecosystem recovery. Journal of Geology 110, 227–240.
Doi, K., Shuichiro, H., Sokamaki, Y., 1975. Uranium mineralization in groundwater insedimentary rocks, Japan. Economic Geology 70, 628–646.
Dolenec, T., Lojen, S., Ramovs, A., 2001. The Permian–Triassic boundary in Western Slo-venia (Idrijca Valley section): magnetostratigraphy, stable isotopes, and elementalvariations. Chemical Geology 175, 175–190.
Dypvik, H., Eriksen, D.O., 1983. Natural radioactivity of clastic sediments and the con-tributions of U, Th and K. Journal of Petroleum Geology 5, 409–416.
Ehrenberg, S.N., Svana, T.A., Swart, P.K., 2008. Uranium depletion across the Permian–Triassic boundary in Middle East carbonates: signature of oceanic anoxia. Ameri-can Association of Petroleum Geologists Bulletin 92, 691–707.
Erwin, D.H., 1994. The Permo-Triassic extinction. Nature 367, 231–236.Erwin, D.H., 1996. Understanding biotic recoveries: extinction, survival and preserva-
tion during the End-Permian mass extinction. In: Jablonski, D., Erwin, D.H., Lipps,J.H. (Eds.), Evolutionary Paleobiology, pp. 398–418.
Esrafili-Dizaji, B., Rahimpour-Bonab, H., 2009. Effects of depositional and diageneticcharacteristics on carbonate reservoir quality: a case study from the South ParsGasfield in the Persian Gulf. Petroleum Geoscience 15, 325–344.
Ezaki, Y., Adach, J., Liu, N., 2003. Earliest Triassic microbialite micro- and mega-structures in the Huaying area of Sichuan Province, south China: implications forthe nature of oceanic conditions after the end-Permian extinction. Palaios 18,388–402.
Fertl, W.H., Stapp, W.L., Vaello, D.B., Vercellino, W.C., 1980. Spectral gamma-ray loggingin the Austin Chalk trend. Journal of Petroleum Technology 32, 481–488.
Fiet, N., Gorin, G.E., 2000. Gamma-ray spectrometry as a tool for stratigraphic correla-tions in the carbonate‐dominated, organic rich, pelagic Albian sediments in centralItaly. Eclogae Geologicae Helvetiae 93, 175–181.
Grotzinger, J.P., Knoll, A.H., 1995. Anomalous carbonate precipitates: is the Precambri-an the key to the Permian? Palaios 10, 578–596.
Hassan, M., Selo, M., Combaz, A., 1975. Uranium distribution and geochemistry ascriteria of diagenesis in carbonate rocks. Proceeding of the 9th Congress Interna-tional de Seimentologie, France, pp. 69–75.
Heydari, E., Hassanzadeh, J., 2003. Deev jahi model of the Permian–Triassic boundarymass extinction: a case for gas hydrates as the main cause of biological crisis onEarth. Sedimentary Geology 163, 147–163.
Heydari, E., Hassanzadeh, J., Wade, W.J., 2000. Geochemistry of central tethyan upperPermian and lower Triassic strata, Abadeh region, Iran. Sedimentary Geology137, 85–99.
Heydari, E., Wade, W.J., Hassanzadeh, J., 2001. Diagenetic origin of carbon and oxygenisotope compositions of Permian–Triassic boundary strata. Sedimentary Geology143, 191–197.
Heydari, E., Hassanzadeh, J., Wade, W.J., Ghazi, A.M., 2003. Permian–Triassic boundaryinterval in the Abadeh section of Iran with implications for the mass extinction:Part 1. Sedimentology. Palaeogeography, Palaeoclimatology, Palaeoecology 193,405–423.
Hodell, D.A., Mueller, P.A., McKenzie, J.A., Mead, G.A., 1989. Strontium isotope stratigra-phy and geochemistry of the late Neogeneocean. Earth and Planetary Science Let-ters 92, 165–178.
Hoff, J.A., Jameson, J., Hanson, G.N., 1995. Application of Pb isotopes to the absolutetiming of regional exposure events in carbonate rocks: an example from U-richdolostones from the Wahoo Formation (Pennsylvanian), Prudhoe Bay, Alaska.Journal of Sedimentary Research 65, 225–233.
Holser, W.T., 1997a. Geochemical events documented in inorganic carbon isotopes.Palaeogeography, Palaeoclimatology, Palaeoecology 132, 173–182.
Holser, W.T., 1997b. Evaluation of the application of rare earth elements to paleo-ceanography. Palaeogeography, Palaeoclimatology, Palaeoecology 132, 309–323.
Holser, W.T., Schonlaub, H.P., Attrep, M., Boeckelmann, K., Klein, P., Magaritz, M., Orth,C.J., Fenninger, A., Jenny, C., Kralik, M., Mauritsch, H., Pak, E., Schramm, J.M.,Stattegger, K., Schmoller, R., 1989. A unique geochemical record at the Permian/Triassic boundary. Nature 337, 39–44.
Holser, W.T., Schonlaub, H.P., Attrep, M., 2007. Evidence for recurrent changes in LowerTriassic oceanic circulation of the Tethys: the δ13C record from marine sections inIran. Palaeogeography, Palaeoclimatology, Palaeoecology 252, 355–369.
Horacek, M., Richoz, S., Brandner, R., Krystyn, L., Spotl, C., 2007b. Evidence for recurrentchanges in Lower Triassic oceanic circulation of the Tethys: the δ13C recordfrommarine sections in Iran. Palaeogeography, Palaeoclimatology, Palaeoecology252, 355–369.
Hostetler, P.B., Garrels, R.M., 1962. Transport and precipitation of uranium and vanadi-um at low temperatures, with special reference to sandstone-type uranium de-posits. Economic Geology 57, 137–167.
Insalaco, E., Virgone, A., Courme, B., Gaillot, J., Kamali, M., Moallemi, A., Lotfpour, M.,Monibi, S., 2006. Upper Dalan Member and Kangan Formation between the ZagrosMountains and offshore Fars, Iran: depositional system, biostratigraphy and strat-igraphic architecture. GeoArabia 11, 75–176.
Isozaki, Y., 1997. Permo‐Triassic boundary superanoxia and stratified superocean; re-cords from lost deep sea. Science 276, 235–238.
113V. Tavakoli, H. Rahimpour-Bonab / Palaeogeography, Palaeoclimatology, Palaeoecology 350–352 (2012) 101–113
Kanmera, K., Nakazawa, K., 1973. Permian–Triassic relationship and faunal changes inthe eastern Tethys. In: Logan, A., Hills, L.V. (Eds.), The Permian and Triassic Systemsand Their Mutual Boundary: Can. Soc. Pet. Geol., Mem., 2, pp. 100–119.
Kashfi, M.S., 2000. Greater Persian Gulf Permian–Triassic stratigraphic nomenclaturerequires study. Oil and Gas Journal 6, 36–44.
Kempe, S., Kazmierczak, J., 1994. The role of alkalinty in the evolution of ocean chem-istry, organization of living systems, and biocalcification processes. In: Doumenge,F., Allemand, D., Toulemont, A. (Eds.), Past and Present Biomineralization, Monaco,pp. 61–117.
Kershaw, S., Zhang, T., Lan, G., 1999. Amicrobialite carbonate crust at the Permian–Triassicboundary in south China, and its palaeoenvironmental significance. Palaeogeography,Palaeoclimatology, Palaeoecology 146, 1–18.
Kidder, D.L., Worsley, T.R., 2004. Causes and consequences of extreme Permo-Triassicwarming to globally equable climate and relation to the Permo-Triassic extinctionand recovery. Palaeogeography, Palaeoclimatology, Palaeoecology 203, 207–237.
Kilani-Mazraoui, F., Razgallah-Gargouri, S., Mannai-Tayech, B., 1990. The Permo-Triassic ofSouthern Tunisia—biostratigraphy and palaeoenvironment. Review of Palaeobotanyand Palynology 66, 273–291.
Klinkhammer, G.P., Palmer, M.R., 1991. Uranium in the oceans: where it goes and why.Geochimica et Cosmochimica Acta 55, 1799–1806.
Kobayashi, F., 1999. Tethyan uppermost Permian (Dzhulfian andDorashamian) foraminif-eral faunas and their paleogeographic and tectonic implications. Palaeogeography,Palaeoclimatology, Palaeoecology 150, 279–307.
Konyuhov, A.I., Maleki, B., 2006. The Persian Gulf Basin: geological history, sedimentaryformations, and petroleum potential. Lithology and Mineral Resources 41, 344–361.
Korte, C., Kozur, H.W., Bruckschen, P., Veizer, J., 2003. Strontium isotope evolution ofLate Permian and Triassic seawater. Geochimica et Cosmochimica Acta 67, 47–62.
Korte, C., Kozur, H.W., Joachimski, M.M., Strauss, H., Veizer, J., Schwark, L., 2004a. Car-bon, sulfur, oxygen and strontium isotope records, organic geochemistry and bio-stratigraphy across the Permian/Triassic boundary in Abadeh, Iran. InternationalJournal of Earth Sciences 93, 565–581.
Korte, C., Kozur, H.W., Mohtat-Aghai, P., 2004b. Dzhulfian to lowermost Triassic δ13Crecord at the Permian/Triassic boundary section at Shahreza, Central Iran. Hal-lesches Jahrbuch der Geowissenschaften Beiheft 18, 73–78.
Korte, C., Jasper, T., Kozur, H.W., Veizer, J., 2006. 87Sr/86Sr record of Permian seawater.Palaeogeography, Palaeoclimatology, Palaeoecology 240, 89–107.
Kyte, F.T., Smit, J., Wasson, J.T., 1985. Siderophile interelement variations in theCretaceous–Tertiary boundary sediments from Caravaca, Spain. Earth and PlanetaryScience Letters 73, 183–195.
Langmuir, D., 1978. Uranium solution–mineral equilibria at low-temperatures with appli-cation to sedimentary ore deposition. Geochimica et Cosmochimica Acta 42, 547–569.
Lehrmann, D.J., 1999. Early Triassic calcimicrobial mounds and biostromes of theNanpanjiang Basin, south China. Geology 27, 359–362.
Lehrmann, D.J., Wang, Y., Wei, J., Yu, Y.Y., Xiao, J., 2001. Lower Triassic peritidal cycliclimestone: an example of anachronistic carbonate facies from the Great Bank ofGuizhou, Nanpanjiang Basin, Guizhou province, South China. Palaeogeography,Palaeoclimatology, Palaeoecology 173, 103–123.
Lehrmann, D.J., Payne, J.L., Felix, S.V., Dillett, P.M., Wang, H., Yu, Y.Y., Wei, J., 2003.Permian–Triassic boundary sections from shallow-marine carbonate platforms ofthe Nanpanjiang Basin, south China: implications for oceanic conditions associatedwith the end-Permian extinction and its aftermath. Palaios 18, 138–152.
Loydell, D.K., 2007. Early Silurian positive δ13C excursions and their relationship to gla-ciations, sea-level changes and extinction events. Geological Journal 42, 531–546.
Lucia, F.J., 1999. Carbonate Reservoir Characterization. Springer-Verlag, Berlin.Magaritz, M., Bar, R., Baud, A., Holser, W.T., 1988. The carbon isotope shift at the Perm-
ian–Triassic boundary in the Southern Alps is gradual. Nature 331, 337–339.Marcoux, J., Baud, A., 1986. The Permo-Triassic boundary in the Antalya nappes
(western Taurides, Turkey). Memorie della Società Geoligica Italiana 34, 243–252.Martin, E.E., Macdougall, J.D., 1995. Sr and Nd isotopes at the Permian/Triassic bound-
ary: a record of climate change. Chemical Geology 125, 73–99.Maurer, F., Martini, R., Rettori, R., Hillgartner, H., Cirilli, S., 2009. The geology of Khuff
outcrop analogues in the Musandam Peninsula, United Arab Emirates and Oman.GeoArabia 14, 125–158.
Mo, T., Suttle, A.D., Sackett, W.M., 1973. Uranium concentrations in marine sediments.Geochimica et Cosmochimica Acta 37, 35–51.
Moore, C.H., Chowdhury, A., Chan, A., 1988. Upper Jurassic platform dolomitization,northwestern Gulf of Mexico: a tale of two waters. In: Shukla, V., Baker, P.A.(Eds.), Sedimentology and Geochemistry of Dolostones: SEPM Spec Publ, Tulsa,OK, 43, pp. 175–190.
Moradpour, M., Zamani, Z., Moallemi, S.A., 2008. Controls on reservoir quality in thelower Triassic Kangan Formation, Southern Persian Gulf. Journal of Petroleum Ge-ology 31, 367–386.
Morante, R., 1996. Permian and early Triassic isotopic records of carbon and strontiumin Australia and a scenario of events about the Permian–Triassic boundary. Histor-ical Biology 11, 289–310.
Murphy, W.M., Shock, E.L., 1999. Environmental aqueous geochemistry of actinides. In:Burns, P.C., Finch, R. (Eds.), Uranium: Mineralogy, Geochemistry and the Environ-ment. Rev Mineral, Mineral Soc Am, Washington, pp. 221–253.
Myers, K.J., Wignall, P.B., 1987. Understanding Jurassic organic-rich mudrocks — newconcepts using gammaray spectrometry and palaeoecology: examples from theKimmeridge Clay of Dorset and the Jet Rock of Yorkshire. In: Legget, J.K., Zuffa,G.G. (Eds.), Marine Clastic Sedimentology. Graham and Trotman, London, pp.172–189.
Rahimpour-Bonab, H., 2007. A procedure for appraisal of a hydrocarbon reservoir con-tinuity and quantification of its heterogeneity. Journal of Petroleum Science andEngineering 58, 1–12.
Rahimpour-Bonab, H., Asadi-Eskandar, A., Sonei, R., 2009. Controls of Permian–Triassicboundary over reservoir characteristics of South Pars Gasfield, Persian Gulf. Geo-logical Journal 44, 341–364.
Reichow, M.K., Saunders, A.D., White, R.V., Pringle, M.S., Al'Mukhamedov, A.I.,Medvedev, A.Y., Kirda, N.P., 2002. 40Ar/39Ar dates from the West Siberian Basin:Siberian Flood Basalt Province doubled. Science 296, 1846–1849.
Renne, P.R., Zichao, Z., Richards, M.A., Black, M.T., Basu, A.R., 1995. Synchrony and caus-al relations between Permian–Triassic boundary crises and Siberian flood volca-nism. Science 269, 1413–1416.
Retallack, G.J., 1999. Postapocalyptic greenhouse paleoclimate revealed by earliest Tri-assic paleosols in the Sydney Basin, Australia. Geological Society of America Bulle-tin 111, 52–70.
Retallack, G.J., Jahren, A.H., 2008. Methane release from igneous intrusion of coal dur-ing Late Permian extinction events. Journal of Geology 116, 1–20.
Retallack, G.J., Seyedolali, A., Krull, E.S., Holser, W.T., Ambers, C.P., Kyte, F.T., 1998.Search for evidence of impact at the Permian–Triassic boundary in Antarcticaand Australia. Geology 26, 979–982.
Retallack, G.J., Smith, R.M.H., Ward, P.D., 2003. Vertebrate extinction across thePermian–Triassic boundary in the Karoo Basin, South Africa. Geological Society ofAmerica Bulletin 115, 1133–1152.
Rey, R., Delgado, A., 2002. Carbon and oxygen isotopes: a tool for Jurassic and early Cre-taceous pelagic correlation (southern Spain). Geological Journal 37, 337–345.
Russell, W.L., 1945. Relation of radioactivity, organic content, and sedimentation.American Association of Petroleum Geologists Bulletin 29, 1470–1494.
Sarkar, A., Bhattacharya, S.K., Sarin, M.M., 1993. Geochemical evidence for anoxic deepwater in the Arabian Sea during the last glaciations. Geochimica et CosmochimicaActa 57, 1009–1016.
Schlumberger, 1982. Natural gamma-ray spectrometry: essentials of N. G. S. interpretation.Scholle, P.A., Arthur, M.A., Ekdale, A.A., 1983. Pelagic environments. In: Scholle, P.A.,
Bebout, D.G., Moore, C.H. (Eds.), Carbonate Depositional Environments: Am AssocPet Geol Bull Memoir, 33, pp. 619–691.
Schubert, J.K., Bottjer, D.J., 1992. Early Triassic stromatolites as postmass extinction di-saster forms. Geology 20, 883–886.
Son, T.H., Koeberl, C., Ngocb, N.L., Huyenb, D.T., 2007. The Permian–Triassic boundarysections in northern Vietnam (Nhi Tao and Lung Cam sections): carbon-isotope ex-cursion and elemental variations indicate major anoxic event. Palaeoworld 16,51–66.
Spirakis, C.S., 1996. The roles of organic matter in the formation of uranium deposits insedimentary rocks. Ore Geology Reviews 11, 53–69.
Stampfli, G.M., Borel, G.D., 2002. A plate tectonic model for the Paleozoic and Mesozoicconstrained by dynamic plate boundaries and restored synthetic oceanic iso-chrons. Earth and Planetary Science Letters 196, 17–33.
Swanson, V.E., 1960. Oil yield and uranium content of black shales. American Geologi-cal Survey Professional Paper 356, 1–44.
Swanson, V.E., 1961. Geology and geochemistry of uranium in marine black shales, areview. American Geological Survey Professional Paper 356, 67–112.
Swinchatt, J.P., 1969. Algal boring: a possible depth indicator in carbonate rocks andsediments. Geological Society of America Bulletin 80, 1391–1398.
Tavakoli, V., Rahimpour-Bonab, H., Esrafili-Dizaji, B., 2011. Diagenetic controlled reser-voir quality of South Pars Gas field, an integrated approach. Comptes Rendus Geo-science 343 (1), 55–71.
Twitchett, R.J., Looy, C., Morante, R., Visscher, H., Wignall, P.B., 2001. Rapid and syn-chronous collapse of marine and terrestrial ecosystems during the end-Permian bi-otic crisis. Geology 29, 351–354.
Vaslet, D., Le Nindre, Y.M., Vachard, D., Broutin, J., Crasquin, S., Berthelin, M., Gaillot, J.,Halawani, M., Al-Husseini, M., 2005. The Permian–Triassic Khuff Formation of Cen-tral Saudi Arabia. GeoArabia 10, 77–134.
Veizer, J., 1983a. Chemical diagenesis of carbonates: theory and application of trace el-ement technique. In: Arthur, M.A. (Ed.), Stable Isotopes in Sedimentary Geology,Soc. Econ. Palaeontol. Mineral. Short Course, 10 (3/1–3/100).
Veizer, J., 1983b. Trace elements and isotopes in sedimentary carbonates. In: Reeder,R.J. (Ed.), Carbonates: Mineralogy and Chemistry, Rev. Mineral., 11, pp. 265–299.
Veizer, J., Compston, W., 1974. 87Sr/86Sr composition of seawater during the Phanero-zoic. Geochimica et Cosmochimica Acta 38, 1461–1484.
Wang, Y.L., Liu, Y.G., Schmitt, R.A., 1986. Rare earth element geochemistry of SouthAtlantic deep sea sediments: Ce anomaly change at ~54 Ma. Geochimica etCosmochimica Acta 50, 1337–1355.
Wang, K., Geldsetzer, H.H.J., Krouse, H.R., 1994. Permian–Triassic extinction: organicδ13C evidence from British Columbia, Canada. Geology 22, 580–584.
Wang, W., Kano, A., Okumura, T., Ma, Y., Matsumoto, R., Matsuda, N., Ueno, K., Chen,X., Kakuwa, Y., Mahmudy Gharaie, M.H., Rahmati Ilkhchi, M., 2007. Isotopicchemostratigraphy of the microbialite-bearing Permian–Triassic boundary sec-tion in the Zagros Mountains, Iran. Chemical Geology 244, 708–714.
Ward, P.D., Montgomery, D.R., Smith, R., 2000. Altered river morphology in SouthAfrica related to the Permian–Triassic extinction. Science 289, 1740–1743.
Wignall, P.B., Twitchett, R.J., 1996. Oceanic anoxia and the End Permian mass extinc-tion. Science 272, 1155–1158.
Wignall, P.B., Twitchett, R.J., 1999. Unusual intraclastic limestones in Lower Triassiccarbonates and their bearing on the aftermath of the end-Permian mass extinction.Sedimentology 46, 303–316.
Wignall, P.B., Twitchett, R.J., 2002. Extent, duration, and nature of the Permian–Triassicsuperanoxia. In: Koeberl, C., MacLeod, K.G. (Eds.), Catastrophic Events and MassExtinctions: Impacts and Beyond: Geol Soc Am Spec Publ, 356, pp. 395–413.
Wignall, P.B., Morante, R., Newton, R., 1998. The Permo-Triassic transition in Spitsber-gen: δ13C org chemostratigraphy, Fe and S geochemistry, facies, fauna, and tracefossils. Geological Magazine 135, 47–62.