Upper lithospheric seismic velocity structure across the Pripyat Trough and the Ukrainian Shield...
39
Upper lithospheric seismic velocity structure across the Pripyat Trough and the Ukrainian Shield along the EUROBRIDGE’97 profile H. Thybo a, * , T. Janik b, * , V.D. Omelchenko c , M. Grad d, * , R.G. Garetsky e , A.A. Belinsky f , G.I. Karatayev e , G. Zlotski e , M.E. Knudsen a , R. Sand a , J. Yliniemi g , T. Tiira h , U. Luosto h , K. Komminaho i , R. Giese j , A. Guterch b , C.-E. Lund k , O.M. Kharitonov c,1 , T. Ilchenko c , D.V. Lysynchuk c , V.M. Skobelev c , J.J. Doody l a Geological Institute, University of Copenhagen, Øster Voldgade 10, DK-1350 Copenhagen, Denmark b Institute of Geophysics, Polish Academy of Sciences, Ks. Janusza 64, 01-452 Warsaw, Poland c Institute of Geophysics, Palladin av. 32, Kiev 252680, Ukraine d Institute of Geophysics, University of Warsaw, Pasteura 7, 02-093 Warsaw, Poland e Institute of Geological Sciences, Zhodinskaya str. 7, Minsk 220141, Belarus f Central Geophysical Expedition, Nekrasov str. 7, Minsk 220040, Belarus g Sodankyla ¨ Geophysical Observatory, University of Oulu, FIN-90014 Oulu, Finland h Institute of Seismology, P.O. Box 26, FIN-00014 University of Helsinki, Helsinki, Finland i Department of Geosciences, University of Oulu, FIN-90014 Oulu, Finland j GeoForschungsZentrum Potsdam, Telegrafenberg, D-14473 Potsdam, Germany k Department of Earth Sciences, Uppsala University, Villava ¨gen 16, 752 36 Uppsala, Sweden l c/o Division of Earth Science, University of Glasgow, Glasgow G12 8QQ, UK Received 27 May 2002; accepted 25 April 2003 Abstract We present new results on the structure resulting from Palaeoproterozoic terrane accretion and later formation of one of the aulacogens in the East European Platform. Seismic data has been acquired along the 530-km-long, N – S-striking EUROBRIDGE’97 traverse across Sarmatia, a major crustal segment of the East European Craton. The profile extends across the Ukrainian Shield from the Devonian Pripyat Trough, across the Palaeoproterozoic Volyn Block and the Korosten Pluton, into the Archaean Podolian Block. Seismic waves from chemical explosions at 18 shot points at approximately 30-km intervals were recorded in two deployments by 120 mobile three-component seismographs at 3 – 4 km nominal station spacing. The data has been interpreted by use of two-dimensional tomographic travel time inversion and ray trace modelling. The high data quality allows modelling of the P- and S-wave velocity structure along the profile. There are pronounced differences in seismic velocity structure of the crust and uppermost mantle between the three main tectonic provinces traversed by the profile: 0040-1951/03/$ - see front matter D 2003 Elsevier B.V. All rights reserved. doi:10.1016/S0040-1951(03)00200-2 * Corresponding authors on behalf of the EUROBRIDGE Seismic Working Group. H. Thybo is to be contacted at Tel.: +45-3532-2452; fax: +45-3314-8322. E-mail addresses: [email protected] (H. Thybo), [email protected] (T. Janik), [email protected] (M. Grad). 1 Deceased April 1998. www.elsevier.com/locate/tecto Tectonophysics 371 (2003) 41– 79
Transcript of Upper lithospheric seismic velocity structure across the Pripyat Trough and the Ukrainian Shield...

www.elsevier.com/locate/tecto
Tectonophysics 371 (2003) 41–79
Upper lithospheric seismic velocity structure across the Pripyat
Trough and the Ukrainian Shield along the
EUROBRIDGE’97 profile
H. Thyboa,*, T. Janikb,*, V.D. Omelchenkoc, M. Gradd,*, R.G. Garetskye,A.A. Belinskyf, G.I. Karatayeve, G. Zlotskie, M.E. Knudsena, R. Sanda, J. Yliniemig,
T. Tiirah, U. Luostoh, K. Komminahoi, R. Giesej, A. Guterchb, C.-E. Lundk,O.M. Kharitonovc,1, T. Ilchenkoc, D.V. Lysynchukc, V.M. Skobelevc, J.J. Doodyl
aGeological Institute, University of Copenhagen, Øster Voldgade 10, DK-1350 Copenhagen, Denmarkb Institute of Geophysics, Polish Academy of Sciences, Ks. Janusza 64, 01-452 Warsaw, Poland
c Institute of Geophysics, Palladin av. 32, Kiev 252680, Ukrained Institute of Geophysics, University of Warsaw, Pasteura 7, 02-093 Warsaw, Poland
e Institute of Geological Sciences, Zhodinskaya str. 7, Minsk 220141, BelarusfCentral Geophysical Expedition, Nekrasov str. 7, Minsk 220040, Belarus
gSodankyla Geophysical Observatory, University of Oulu, FIN-90014 Oulu, Finlandh Institute of Seismology, P.O. Box 26, FIN-00014 University of Helsinki, Helsinki, Finland
iDepartment of Geosciences, University of Oulu, FIN-90014 Oulu, FinlandjGeoForschungsZentrum Potsdam, Telegrafenberg, D-14473 Potsdam, Germany
kDepartment of Earth Sciences, Uppsala University, Villavagen 16, 752 36 Uppsala, Swedenlc/o Division of Earth Science, University of Glasgow, Glasgow G12 8QQ, UK
Received 27 May 2002; accepted 25 April 2003
Abstract
We present new results on the structure resulting from Palaeoproterozoic terrane accretion and later formation of one of the
aulacogens in the East European Platform. Seismic data has been acquired along the 530-km-long, N–S-striking
EUROBRIDGE’97 traverse across Sarmatia, a major crustal segment of the East European Craton. The profile extends
across the Ukrainian Shield from the Devonian Pripyat Trough, across the Palaeoproterozoic Volyn Block and the Korosten
Pluton, into the Archaean Podolian Block. Seismic waves from chemical explosions at 18 shot points at approximately 30-km
intervals were recorded in two deployments by 120 mobile three-component seismographs at 3–4 km nominal station spacing.
The data has been interpreted by use of two-dimensional tomographic travel time inversion and ray trace modelling. The high
data quality allows modelling of the P- and S-wave velocity structure along the profile. There are pronounced differences in
seismic velocity structure of the crust and uppermost mantle between the three main tectonic provinces traversed by the profile:
0040-1951/03/$ - see front matter D 2003 Elsevier B.V. All rights reserved.
doi:10.1016/S0040-1951(03)00200-2
* Corresponding authors on behalf of the EUROBRIDGE Seismic Working Group. H. Thybo is to be contacted at Tel.: +45-3532-2452;
fax: +45-3314-8322.
E-mail addresses: [email protected] (H. Thybo), [email protected] (T. Janik), [email protected] (M. Grad).1 Deceased April 1998.

H. Thybo et al. / Tectonophysics 371 (2003) 41–7942
(i) the Pripyat Trough is a ca. 4-km-deep sedimentary basin, fully located in the Osnitsk–Mikashevichi Igneous Belt in the
northern part of the profile. The velocity structure is typical for a Precambrian craton, but is underlain by a ca. 5-km-thick
lowest crustal layer of high velocity. The development of the Pripyat Trough appears to have only affected the upper crust
without noticeable thinning of the whole crust; this may be explained by a rheologically strong lithosphere at the time of
formation of the trough. (ii) Very high seismic velocity and Vp/Vs ratio characterise the Volyn Block and Korosten Pluton to a
depth of 15 km and probably also the lowest crust. The values are consistent with an intrusive body of mafic composition in the
upper crust that formed from bimodal melts derived from the mantle and the lower crust. (iii) The Podolian Block is close to a
typical cratonic velocity structure, although it is characterised by relatively low seismic velocity and Vp/Vs ratio. A pronounced
SW-dipping mantle reflector from Moho to at least 70 km depth may represent the Proterozoic suture between Sarmatia and
Volgo–Uralia, the structure from terrane accretion, or a later shear zone in the upper mantle. The sub-Moho P-wave seismic
velocity is high everywhere along the profile, with the exception of the area above the dipping reflector. This velocity change
further supports a plate tectonic origin of the dipping mantle reflector. The profile demonstrates that structure from
Palaeoproterozoic plate tectonic processes are still identifiable in the lithosphere, even where younger metamorphic
equilibration of the crust has taken place.
D 2003 Elsevier B.V. All rights reserved.
Keywords: Crustal accretion; Aulacogens; Secular lithospheric evolution; East European Craton; Seismic velocity; Ukrainian Shield
1. Introduction
There is considerable debate about the existence
and type of plate tectonic processes during the Pre-
cambrian evolution of the Earth. Tectonic structure
has survived in the continental lithosphere since the
Proterozoic (e.g. BABELWorking Group, 1990). It is
still an open question whether the tectonic style is
similar to present-day tectonic style or later metamor-
phic and other processes may have changed the
inherited structure. A thin layer of sedimentary rocks
often covers the basement of Precambrian cratons and
erosion has levelled the surface topography. The
basement of the East European Platform is largely
unknown, and it may therefore be thought of as
relatively homogeneous. However, recent research
has shown that there are pronounced changes in rock
types which may be related to Proterozoic and Ar-
chaean plate tectonic processes, such as collision
between major plates, amalgamation of terranes, and
docking of island arcs. The main changes in rock
types take place along lineaments, which may be
traced by means of magnetic data, as in an analysis
of major terrane boundaries in the East European
Craton by Bogdanova et al. (1996). Another charac-
teristic feature of the East European Platform is the
existence of aulacogens, which are identified as large,
elongated structures with a sedimentary fill of mainly
Late Precambrian or Palaeozoic age. They are often
assumed to have formed by rifting processes, although
compared to more recent rift zones, they are generally
much wider and the available information indicates a
different type of deep crustal structure. A specific
feature of aulacogens appears to be a flat Moho and a
lower crust with very high seismic velocity, which
may be related to magmatic activity.
Acquisition of seismic data along the EURO-
BRIDGE deep seismic sounding (DSS) transect is a
EUROPROBE project (Bogdanova et al., 2001). The
approximately 1500-km-long, NW–SE and N–S
trending profile segments span the western part of
the East European Craton extending from the Palae-
oproterozoic accretionary belt of Fennoscandia to the
western part of the Ukrainian Shield (Fig. 1). The
principal scientific objective of the EUROBRIDGE
seismic profiling is to establish the seismic velocity
structure of the lithosphere beneath the sediment-
covered platform between the exposed Proterozoic
and Archaean complexes of the Baltic and Ukrainian
Shields. The EUROBRIDGE international seismic
group has carried out three major phases of onshore
data acquisition. EUROBRIDGE’95 was recorded in
a NW–SE direction in Lithuania to image Fenno-
scandian deep structure (EUROBRIDGE Seismic
Working Group, 2001). Coverage was extended to
the southeast across Lithuania and Belarus by
EUROBRIDGE’96 to image the regional setting of
the Fennoscandia–Sarmatia suture zone, which is the

H. Thybo et al. / Tectonophysics 371 (2003) 41–79 43
most important tectonic boundary in the Belarus–
Baltic region of the East European Craton (EURO-
BRIDGE Seismic Working Group, 1999). In the third
phase, the N–S trending EUROBRIDGE’97 profile
was recorded between Belarus and Ukraine to image
the northwestern part of Sarmatia and the Pripyat
Fig. 1. Location map of the EUROBRIDGE’97 DSS profile and its intersec
sounding profiles are also shown, including the parallel and close profile
Ukrainian Shield (‘ + ’ hatching) and the overlying Pripyat–Dnieper–Don
the EUROBRIDGE DSS profiles. The thick dashed lines indicate the near-s
Sarmatia and the East European Craton from Palaeozoic Europe (TE
Abbreviations: KNM—Korsun–Nowomyrgorod Massif; KP—Korosten P
Zone.
Rift. The EUROBRIDGE’97 profile is 530 km long
and crosses EUROBRIDGE’96 in southern Belarus
(Fig. 1).
This paper presents a detailed interpretation of
the P- and S-wave velocity structure along the
EUROBRIDGE’97 profile. The northern end of
tion with the earlier EUROBRIDGE’96 profile. Earlier deep seismic
VIII (illustrated in Figs. 3 and 10). Relevant regional units of the
ets Palaeorift system are shown. Inset map shows the location of all
urface location of the suture zones separating the Fennoscandia from
SZ). Asterisks represent the shot points of EUROBRIDGE’97.
luton; NM—Novoukrainka Massif, TESZ—Trans European Suture
H. Thybo et al. / Tectonophy44
the profile line is located within the ca. 2.0 Ga
Osnitsk–Mikashevichi Igneous Belt, which marks
the northwestern margin of the Sarmatian crustal
segment. The profile crosses the Pripyat Trough,
which is a part of the extensive Phanerozoic Pri-
pyat–Dnieper–Donetsk palaeorift. The major base-
ment components traversed in the Ukrainian Shield
are the Palaeoproterozoic Volyn Block, which has
been intruded by the gabbro–anorthosite–rapakivi
Korosten Pluton, and the Archaean Podolian Block.
The main findings are (1) the Korosten Pluton
shows high seismic velocity throughout the crust
and most pronounced in the upper crust which is
related to several mafic intrusions, (2) an indication
that the rifting activity at the Pripyat Trough was
largely shallow, and (3) a dipping mantle reflector
may be related to Precambrian plate tectonic accre-
tionary processes.
2. Regional geology
The East European Craton comprises three major
segments: Fennoscandia, Sarmatia and Volgo–Uralia
(Bogdanova et al., 1996). The segments are large
composite terranes, each with an independent Ar-
chaean and Palaeoproterozoic history, brought to-
gether during the Late Palaeoproterozoic (ca. 1.80–
1.75 Ga). This process was characterised by a long-
lasting ‘‘soft’’ collision, in which newly formed
island arcs successively accreted to the edges of
the Archaean crustal nucleus of the craton. Major
differences in crustal structure, lithology and time of
crust-forming processes characterise the segments.
The suture zones between the segments are funda-
mental features of the East European Craton, and
they probably underwent reactivation during Meso-
to Neoproterozoic rifting episodes. Most of the
craton is covered by platform sediments. The fill of
the Pripyat Trough is mainly of Phanerozoic age.
Many important present-day regional structures were
created during basement formation and amalgam-
ation, and others were formed in association with
the later episodes of sedimentation.
EUROBRIDGE’97 traverses the northwestern
part of the Sarmatia segment, including the Pripyat
Trough (Fig. 1). The geology of the main basement
units (Fig. 2) of the upper crust is summarised below.
2.1. Osnitsk–Mikashevichi Igneous Belt (OMIB)
This belt constitutes the northwestern zone of
Sarmatia as a ca. 2.0 Ga active margin. Its northwest-
ern border forms the contact between the Palaeopro-
terozoic terranes related to Fennoscandia and Sarmatia
(Bogdanova et al., 1996). The OMIB has a SW–NE
trend and is about 100–150 km wide, probably
limited by deep listric faults (EUROBRIDGE Seismic
Working Group, 1999). It consists of Palaeoprotero-
zoic igneous complexes, essentially free of regional
metamorphism. The complexes include metagabbro–
diabase (2.02 Ga), large batholiths of the dominant
diorite –granodiorite–granite (2.0–1.97 Ga), and
quartz–syenite–granite (1.8–1.75 Ga) (Aksamen-
tova, 1990). The OMIB assemblages are chemically
similar to those of present-day active continental
margins. The OMIB is partly concealed by the sedi-
ments of the Pripyat Trough.
2.2. Pripyat Trough (PT)
The PT is part of the regional Palaeozoic–Phaner-
ozoic Pripyat–Dnieper–Donets Palaeorift. The PT is
about 280 km long and 150 km wide and contains up
to 6 km of sediment fill. The oldest formations are
200–300 m of Middle Devonian terrigenous and
carbonate strata. The most widespread formations
range from Upper Devonian to Middle Triassic age
and include terrigenous, carbonate, saliferous and
volcanogenic lithologies. These rocks form strata of
several kilometres’ thickness, whereas the youngest
strata (Upper Triassic to Quaternary) are only 150–
200 m thick (Aizberg et al., 1987; Garetsky and
Klushin, 1989). The subsidence history and its tec-
tonic implications have been discussed by Kusznir et
al. (1996). Juhlin et al. (1996) and Stephenson et al.
(2001) present detailed interpretations of reflections
seismic profiles across the Pripyat Trough.
2.3. Volyn Block (VB)
The Palaeoproterozoic gneiss complexes, particu-
larly seen in the SE and SW parts, are metamorphosed
in amphibolite to epidote–amphibolite facies with
ages of formation ranges from 2.4 to 2.1 Ga (Shcher-
bak et al., 1989; Skobelev et al., 1991). Younger rocks
are represented by anatectic granites in numerous
sics 371 (2003) 41–79

Fig. 2. Geological map (a) and upper crustal cross-section (b) along the EUROBRIDGE’97 DSS profile. Arrows show the positions of the shot
points. Vertical exaggeration, 1:5. Legend: (1) sedimentary rocks, Palaeoproterozoic; (2) Tolckachy Suite, quartz sandstones and schists (1.7–
1.6 Ga); (3) Perga complex, subalkaline leicogranites (1.76–1.75 Ga); (4) Korosten complex, rapakivi granites (1.77 Ga); (5) Korosten
complex, anorthosites and gabbros (1.8–1.76 Ga); (6) Osnitsk complex, granodiorites and subalkaline granites (2.0–1.98 Ga); (7) Bucky
complex, gabbronorites, monzodiorites, quartz monzonites (2.05–1.98 Ga); (8) Zhitomir and Uman complexes, granites (2.06–2.02 Ga); (9)
Paleoproterozoic anatectites and migmatites; (10) Berdichev complex, charnockites (2.1–2.0 Ga); (11) Berdichev complex, high-aluminous
granites and migmatites (2.1–2.0 Ga); (12) Vasilyevka strata, plagiogneisses (2.5–2.4 Ga), Archean; (13) Gaivoron (3.1 Ga) and Litin (2.8 Ga)
complexes, enderbites; (14) Dniester–Bug complex, granulites, gneisses, quartzites (>3.4 Ga); (15) deep-reaching faults.
H. Thybo et al. / Tectonophysics 371 (2003) 41–79 45
small massifs and bodies in the southern and western
parts of the domain (Zhitomir complex, 2.06–2.02
Ga. Slightly younger (2.02–1.98 Ga) intrusive rock
complexes may have formed along deep faults, prob-
ably associated with synchronous tectonic events
further to the NW in the OMIB. Many types of rock
assemblage have been distinguished which were
formed from different magma sources and by varying
degrees of melting. These intrusive complexes are not
metamorphosed and are always discordant with older
lithologies. During the subsequent ca. 170 Ma of tec-
tonic stabilisation, only denudation products were
deposited, accumulating in depressions. Quartz sand-
stone, conglomerates and clay shale occur in the
northwest of the region.
2.4. Korosten Pluton (KP)
This distinctive, layered plutonic complex was
previously thought to extend to a depth of 6 km.
Seismic reflection and gravity interpretation indicate
that the crust has been extensively intruded by mafic
H. Thybo et al. / Tectonophysics 371 (2003) 41–7946
melts (Bucharev, 1992). Melting of lower crust may
have been an important factor for the generation of
both mafic and felsic rocks in the KP, as based upon
Sm–Nd values for these rocks Dovbush et al. (2000).
Diverse magmatic activity took place between 1.8
and 1.73 Ga (Verkhogliad, 1995), probably caused by
the approach of the Fennoscandia and Sarmatia ter-
ranes (Stepanyuk et al., 1999). The igneous rocks
consist of the gabbro, anorthosite and rapakivi granite
of the Korosten Pluton, and subalkaline leucogranite
(1.76–1.74 Ga) to the west of the pluton. Volcanic
subalkaline andesites and rhyolites (1.73 Ga) and
sedimentary rocks (quartz sandstones and slates) over-
lie the northern part of the Korosten Pluton. No rocks
of later Proterozoic age are known in the western area
of the Ukrainian Shield, which became a stable plat-
form toward the end of the Palaeoproterozoic.
2.5. Podolian Block (PB)
The PB is in the southern part of the western
Ukrainian Shield. Its oldest geological units are the
>3.4 Ga supracrustal Dniester–Bug Group (Lesnaya
et al., 1995). Mafic and intermediate granulites of this
complex are widespread in the central part of the PB.
The Dniester–Bug Group is intruded by enderbites of
3.1 Ga and 2.8 Ga age (Shcherbak et al., 1989;
Lesnaya et al., 1995). The Bug complex represents a
younger (ca. 2.6 Ga) stratified unit observed in narrow
synforms mainly in southern and central parts of the
PB. The Bug and Dniester–Bug complexes are quite
similar in composition. Various anatectic granitoids of
2.08–2.02 Ga were formed in the north, close to the
VB during the Palaeoproterozoic (Shcherbak et al.,
1989; Skobelev et al., 1991; Lesnaya et al., 1995).
3. Previous geophysical studies
The EUROBRIDGE’97 profile crosses the EURO-
BRIDGE’96 profile (EUROBRIDGE Seismic Work-
ing Group, 1999) between shot points SP06 and SP07
in the Pripyat Trough (Fig. 1). At the cross point, the
latter profile shows an overall seismic velocity–depth
profile which is close to the expected three-layered
crustal structure of a Precambrian craton (Meissner,
1986), although relatively complicated. The velocities
of individual layers of the crystalline crust below the
ca. 4-km-thick sedimentary sequences are: 6.25 km/s
to 12 km depth, 6.4 km/s to 15 km depth, 6.65 km/s to
28 km depth and 7.0 km/s to 49 km depth. The middle
crust appears to consist of two main layers and the
lower crust is strongly reflective in wide-angle inci-
dence, some of which may be attributed to the
existence of the Pripyat Trough at the cross point. A
pronounced subhorizontal mantle reflector has been
interpreted at a depth of f 60 km over a length of
250 km along the profile; it is unknown whether it
represents a positive velocity contrast or a localized
reflective band in the uppermost mantle. Kozlovskaya
et al. (2002) present the results of gravity modelling
for density and the petrophysical implications along
the EUROBRIDGE’95 and ’96 profiles.
The study area has been covered relatively densely
by DSS profiles, mainly to offsets smaller than 150
km; we refer to Sollogub (1982 and references therein)
for a review. The EUROBRIDGE’97 profile is located
in the vicinity of four previous DSS and deep reflec-
tion seismic profiles in Belarus. These earlier profiles
are: Grodno–Starobin, and CDP seismic reflection
profiles III and VIII across the Pripyat Trough (Kar-
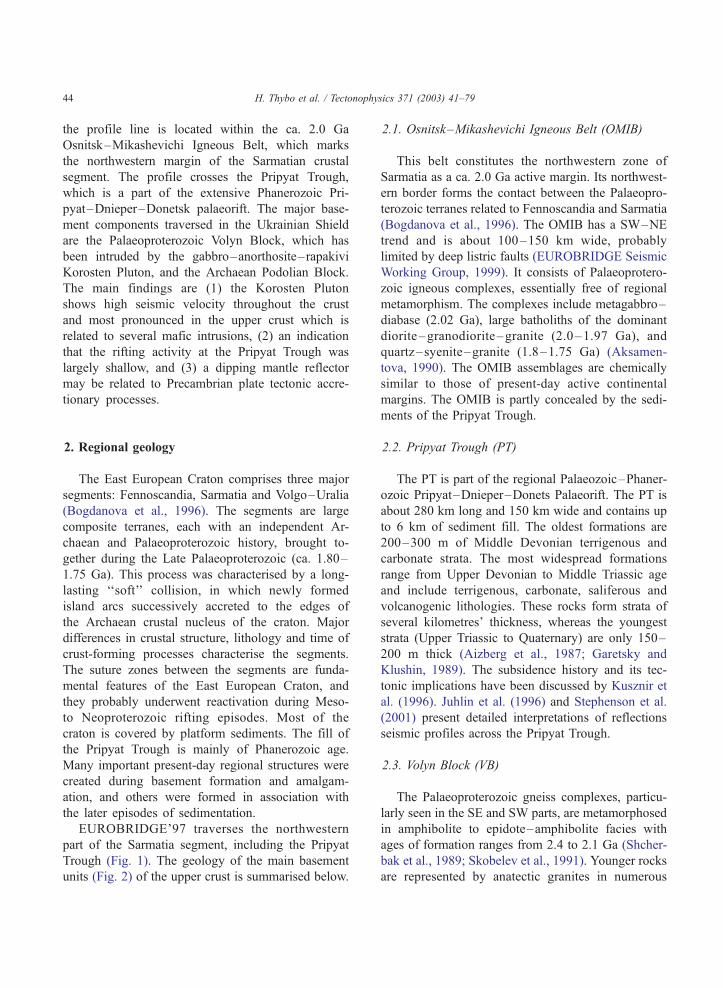
atayev et al., 1993). Interpretations of the deep crustal
structure along profiles III and VIII (Fig. 3) show a
system of deep listric faults in the vicinity of the
Pripyat Trough and two reflectors at depths of 35
and 47–50 km (Juhlin et al., 1996; Stephenson et al.,
2001). Further, zones of unusually low seismic veloc-
ity in the lower crust and beneath the Moho have been
interpreted (Garetsky and Klushin, 1989). The zone
between the two reflectors is seismically reflective,
much in the same way as often observed in extensional
areas. We find from the new refraction data that the
Moho is the lower of the two reflectors.
Within the northern region of the Pripyat Trough
the average P-wave velocity of the sedimentary cover
is described by the relationship: V = 2250 m/s + z
0.397 s� 1, where z is the depth (Belinsky et al.,
1984). The southern region of the Pripyat Trough is
more complicated due to the presence of saliferous
deposits, which usually have strong velocity and
density contrasts to the surrounding rocks. The depth
to the salt surface ranges from 400 to 2600 m with
steep gradients. There is evidence of salt tectonics,
which complicates the interpretation of DSS data. The
lateral dimension of salt domes is often less that 4 km,
which is comparable to the distance between obser-
Fig. 3. Normal-incidence reflection seismic CDP section along line VIII converted into a depth profile (after Juhlin et al., 1996; Stephenson et
al., 2001). The profile line is parallel to the EUROBRIDGE’97 profile at a distance of ca. 25 km. (a) Overlay showing interpretation of the main
crustal blocks, the Pripyat Rift, putative steep deep crustal discontinuities, and a reflective lower crust above the reflection Moho, which is
defined as the lower termination of crustal reflectivity. (b) Raw seismic section. Abbreviations: OMIB—Osnitsk–Mikashevichi Igneous Belt;
RLC—reflective lower crust; UkS—Ukrainian Shield; UM—upper mantle.
H. Thybo et al. / Tectonophysics 371 (2003) 41–79 47
vation sites. The velocity of the strata between the salt
surface and the basement is 3800–4500 m/s. The
basement surface is tilted in a mosaic of blocks with
different inclination. An estimate of the average
velocity in the sedimentary cover as a whole cannot
be provided because of the salt structures and base-
ment topography. For the post-salt deposits, Belinsky
et al. (1984) estimate the average velocity to be
V= 1800 m/s + z 0.42 s� 1, where z is the depth.
The EUROBRIDGE’97 profile crosses DSS pro-
files II and VI at km 313 and km 441 (Fig. 1). The
recording frequencies of 7–30 Hz and seismograph
spacing of 100–200 m adopted for these profiles
provide high resolution of the seismic velocity mod-
els. The vertical component of ground movement was
recorded to maximum offsets of 220 km.
Profile II intersects the EUROBRIDGE’97 profile
in the southern part of the Korosten Pluton (KP). The
P-wave velocity model suggests that the crust of the
KP region has significantly higher velocities than the
adjacent regions (Ilchenko, 1985; Ilchenko and
Kaluzhnaya, 1998). A zone of alternating layers of

H. Thybo et al. / Tectonophysics 371 (2003) 41–7948
low and high velocity was modelled down to 20 km
depth using sharp delays of the travel time curves. The
interpreted low-velocity layers are thicker (1–4 km,
velocity 5.8–6.2 km/s) than the high-velocity layers
(1–2 km, velocity 6.5–6.95 km/s), and they are
laterally more variable in thickness. The lateral posi-
tive velocity contrast of the KP to the surrounding
blocks is 0.6 km/s at the top of crystalline basement
and 0.35 km/s at 20 km depth. The zone widens within
this depth interval from 33 to 85 km. The high-velocity
layers may consist of mafic rocks. The velocity model
below 20 km depth is inferred from a strong reflection
only, assumed to be the PmP reflection from the Moho.
There is indication for a 70-km-wide zone of in-
creased, relatively constant velocity of 6.95–7.0 km/
s compared to the surrounding areas with velocities of
6.6–6.95 km/s in the same depth range. The Moho is
modelled at a depth of 37–39 km and the P-wave
velocity of the topmost mantle is assumed to be 7.9–
8.2 km/s. Several uppermost mantle reflectors are
interpreted between 2 and 6 km below the Moho.
However, our new EUROBRIDGE’97 results from
modelling refracted waves from the same depth inter-
val, show that the assumed Moho may instead be the
top of a lower crustal layer with high velocity (>7.0
km/s), and that the ‘‘mantle reflectors’’ may reside in
the lowest crust (c.f. the discussion in the following
chapters).
Profile VI intersects the EUROBRIDGE’97 profile
within the Podolian Block (PB). The velocity model
obtained from refraction data of Profile VI shows a
low vertical velocity gradient where the P-wave
velocity increases from 6.1 to 6.2 km/s at the top of
the basement to 6.4 at a first-order discontinuity at 21
km. Below this discontinuity, a high vertical velocity
gradient is proposed for the lower crust from 6.5 to
7.2 km/s immediately above the Moho at 52–54 km
depth, based on indications from the PmP reflection
only. The sub-Moho velocity of 8.4–8.5 km/s is
constrained by uppermost mantle refractions.
4. Data acquisition and description of the observed
seismic wave field
EUROBRIDGE’97 was an international collabora-
tive project with participation from institutions in
Belarus, Denmark, Finland, Germany, Poland, Russia,
Sweden, UK and Ukraine. Seismic data acquisition
was undertaken in August and September 1997 along
a 530-km-long N–S transect within the Sarmatian
segment of the East European Craton (Fig. 1).
Designed to investigate crustal and upper mantle
structure, the EUROBRIDGE’97 profile crosses ter-
ranes of Sarmatia, with particular attention to achieve
a high recording density in the vicinity of the Kor-
osten Pluton.
The scheme of shot points and recording stations is
similar to that employed for the EUROBRIDGE’95
and EUROBRIDGE’96 profiles. Seismic energy was
recorded from shots fired at 18 locations (SP01–
SP18; Fig. 1; Table 1) located at nominal intervals
of 31 km. Each source consisted of explosives dis-
tributed in an array of drillholes, with total shot sizes
varying between 250 and 1000 kg (Table 1). Each
borehole was 40 m deep and loaded with a maximum
explosive charge of 85 kg. Shots SP01–07, 14–15
and 17 were fired with high precision by use of a GPS
system. Data acquisition was undertaken in two
deployments with about 120 mobile three-component
seismometers deployed at a typical station spacing of
3–4 km. Overlapping coverage between the two
deployments in the centre of the profile ensured
double density recording in the region of the Korosten
Pluton of shots from several locations.
In Phase 1 of the field program, shots SP01–07,
09, 11, 13 and 14 were recorded in the segment from
SP01 to the vicinity of SP14, an interval of approx-
imately 400 km length. Phase 2 coverage extended
from the vicinity of SP06 to SP18, such that seismic
waves from shots SP04, 06, 08, 10 and 12–18 were
recorded over a distance of about 380 km. Seismom-
eters in the overlapping centre part of the profile, from
approximately SP06 to SP14, were moved by half a
station spacing (about 1.5 km) to obtain a high density
coverage in the area of the Korosten Pluton for the
repeated shots SP04, 06, 13 and 14. These shots were
recorded in both phases of EUROBRIDGE’97 and
therefore along the whole profile.
Each recording group carried out initial processing
of the data acquired by them, using in-house or other
software, to extract 130-s-long seismograms starting at
each shot time. The extracted traces were collated into
a common data set of shot gathers at GFZ-Potsdam.
Geometry information was applied to the common
data set, which was then distributed to all participants.
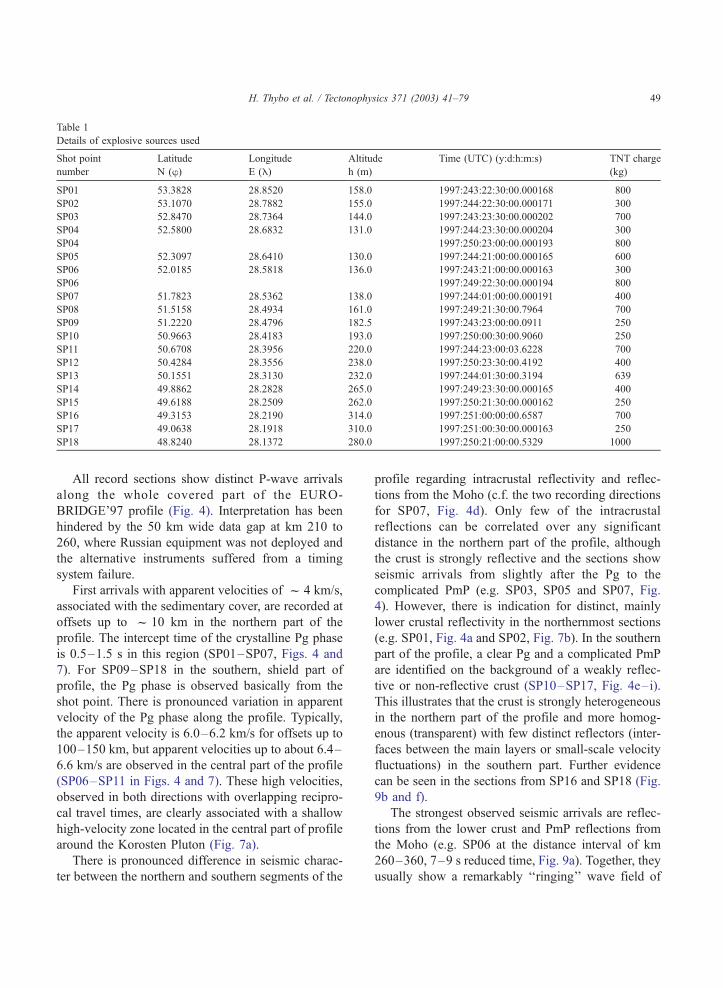
Table 1
Details of explosive sources used
Shot point
number
Latitude
N (B)Longitude
E (E)Altitude
h (m)
Time (UTC) (y:d:h:m:s) TNT charge
(kg)
SP01 53.3828 28.8520 158.0 1997:243:22:30:00.000168 800
SP02 53.1070 28.7882 155.0 1997:244:22:30:00.000171 300
SP03 52.8470 28.7364 144.0 1997:243:23:30:00.000202 700
SP04 52.5800 28.6832 131.0 1997:244:23:30:00.000204 300
SP04 1997:250:23:00:00.000193 800
SP05 52.3097 28.6410 130.0 1997:244:21:00:00.000165 600
SP06 52.0185 28.5818 136.0 1997:243:21:00:00.000163 300
SP06 1997:249:22:30:00.000194 800
SP07 51.7823 28.5362 138.0 1997:244:01:00:00.000191 400
SP08 51.5158 28.4934 161.0 1997:249:21:30:00.7964 700
SP09 51.2220 28.4796 182.5 1997:243:23:00:00.0911 250
SP10 50.9663 28.4183 193.0 1997:250:00:30:00.9060 250
SP11 50.6708 28.3956 220.0 1997:244:23:00:03.6228 700
SP12 50.4284 28.3556 238.0 1997:250:23:30:00.4192 400
SP13 50.1551 28.3130 232.0 1997:244:01:30:00.3194 639
SP14 49.8862 28.2828 265.0 1997:249:23:30:00.000165 400
SP15 49.6188 28.2509 262.0 1997:250:21:30:00.000162 250
SP16 49.3153 28.2190 314.0 1997:251:00:00:00.6587 700
SP17 49.0638 28.1918 310.0 1997:251:00:30:00.000163 250
SP18 48.8240 28.1372 280.0 1997:250:21:00:00.5329 1000
H. Thybo et al. / Tectonophysics 371 (2003) 41–79 49
All record sections show distinct P-wave arrivals
along the whole covered part of the EURO-
BRIDGE’97 profile (Fig. 4). Interpretation has been
hindered by the 50 km wide data gap at km 210 to
260, where Russian equipment was not deployed and
the alternative instruments suffered from a timing
system failure.
First arrivals with apparent velocities of f 4 km/s,
associated with the sedimentary cover, are recorded at
offsets up to f 10 km in the northern part of the
profile. The intercept time of the crystalline Pg phase
is 0.5–1.5 s in this region (SP01–SP07, Figs. 4 and
7). For SP09–SP18 in the southern, shield part of
profile, the Pg phase is observed basically from the
shot point. There is pronounced variation in apparent
velocity of the Pg phase along the profile. Typically,
the apparent velocity is 6.0–6.2 km/s for offsets up to
100–150 km, but apparent velocities up to about 6.4–
6.6 km/s are observed in the central part of the profile
(SP06–SP11 in Figs. 4 and 7). These high velocities,
observed in both directions with overlapping recipro-
cal travel times, are clearly associated with a shallow
high-velocity zone located in the central part of profile
around the Korosten Pluton (Fig. 7a).
There is pronounced difference in seismic charac-
ter between the northern and southern segments of the
profile regarding intracrustal reflectivity and reflec-
tions from the Moho (c.f. the two recording directions
for SP07, Fig. 4d). Only few of the intracrustal
reflections can be correlated over any significant
distance in the northern part of the profile, although
the crust is strongly reflective and the sections show
seismic arrivals from slightly after the Pg to the
complicated PmP (e.g. SP03, SP05 and SP07, Fig.
4). However, there is indication for distinct, mainly
lower crustal reflectivity in the northernmost sections
(e.g. SP01, Fig. 4a and SP02, Fig. 7b). In the southern
part of the profile, a clear Pg and a complicated PmP
are identified on the background of a weakly reflec-
tive or non-reflective crust (SP10–SP17, Fig. 4e–i).
This illustrates that the crust is strongly heterogeneous
in the northern part of the profile and more homog-
enous (transparent) with few distinct reflectors (inter-
faces between the main layers or small-scale velocity
fluctuations) in the southern part. Further evidence
can be seen in the sections from SP16 and SP18 (Fig.
9b and f).
The strongest observed seismic arrivals are reflec-
tions from the lower crust and PmP reflections from
the Moho (e.g. SP06 at the distance interval of km
260–360, 7–9 s reduced time, Fig. 9a). Together, they
usually show a remarkably ‘‘ringing’’ wave field of

H. Thybo et al. / Tectonophysics 371 (2003) 41–7950

Fig. 4. Examples of amplitude-normalized vertical component seismic sections for a selection of shot points along the EUROBRIDGE’97
profile. The data have been filtered using an Ormsby band-pass filter of 2–18 Hz and displayed using a reduction velocity of 8.0 km/s.
Locations of major basement tectonic units and the Pripyat Trough are indicated. Abbreviations: Pg—Seismic refraction from the uppermost
crystalline crust; PmP—Seismic reflections from the Moho; Pn—Refracted arrivals from the sub-Moho uppermost mantle. (a) Shot SP01, (b)
shot SP03 and (c) shot SP05, (d) shot SP07, (e) shot SP10, (f) shot SP12, (g) shot SP13, (h) shot SP15, (i) Shot SP17.
H. Thybo et al. / Tectonophysics 371 (2003) 41–79 51
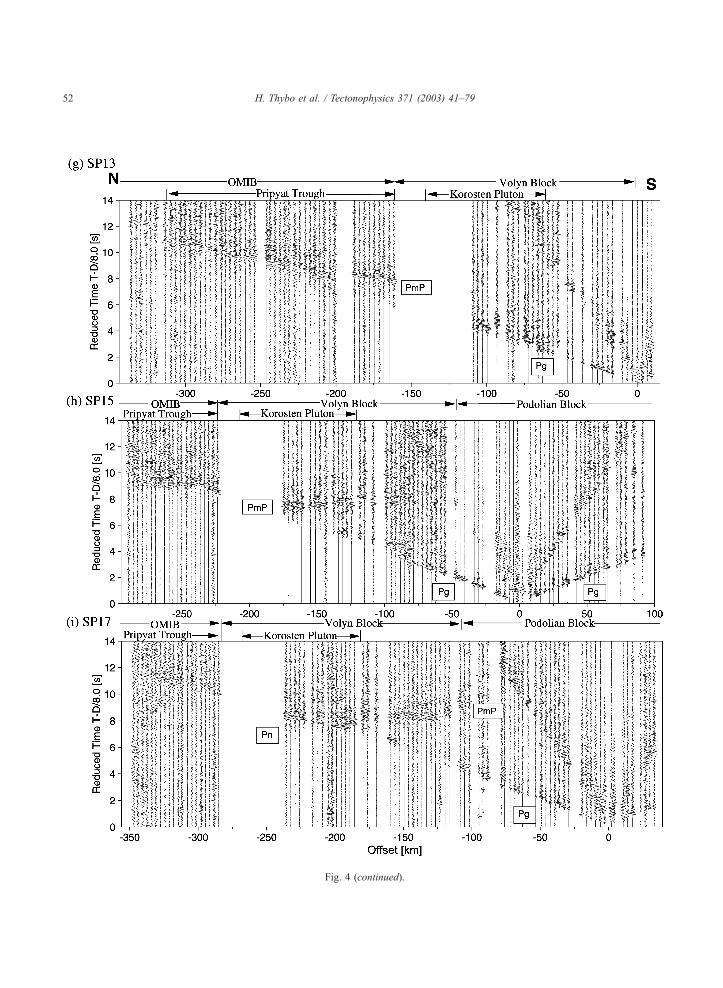
Fig. 4 (continued).
H. Thybo et al. / Tectonophysics 371 (2003) 41–7952

H. Thybo et al. / Tectonophysics 371 (2003) 41–79 53
1.5–2.5 s duration; the lower crustal arrivals mainly
in the northern part of the profile and the PmP along
most of the profile. These phases are observed at
offsets of 90–200 km and the two series of reflectiv-
ities are often merging, although usually a distinct
onset of the PmP can be identified. In some record
sections, however, a distinct PmP reflection is ob-
served as a sharp and short phase with a duration of
less than three periods (e.g. SP07 southward and SP18
northward, Figs. 4d and 9f).
A strong seismic phase from the lower lithosphere
(P1) is observed as a late arrival in several record
sections (SP16, 17 and 18 at offsets of 250–350 km,
illustrated in Figs. 7e, 9b and f). This phase is
characterised by a high apparent velocity of >9 km/s
and a f 1-s-long coda, indicating that it originates
from a dipping reflector in the uppermost mantle,
which may either be a first-order discontinuity or an
inhomogeneous zone with a complicated fine struc-
ture. In the opposite direction, the strongest long-
range energy arrives very late (around 9 s reduced
time in the offset interval 260 to the end of the section
at 360 km) with an apparent velocity of 8.2 km/s in
the section for SP06 (Fig. 9a). This energy may easily
be mistaken for Pn arrivals, but there are clear,
although weak, distinct earlier arrivals on several
individual seismograms. This time corresponds to
the arrival time for the mantle phase in the sections
for SP14–18, indicative of a strong southward dip of
the mantle reflector.
5. P-wave modelling
5.1. Seismic tomographic inversion of first arrivals
Initial two-dimensional models of seismic P-
wave velocity were obtained by application of three
different methods for tomographic inversion, using
first arrivals only. A first model of the upper 20 km
(Fig. 5a) was calculated with the commercial Pro-
MAX program. The model is parameterized with a
regular grid of 5� 1.25 km, horizontally and verti-
cally, respectively. The root mean square (RMS)
residual difference between observed and calculated
travel times for this model is 120 ms. The upper-
most 5–10 km of the model is best resolved with
up to 80 rays per unit grid size. Beneath this depth,
values decrease to 20 rays per unit grid size at 20
km depth.
The second tomographic inversion model (Fig. 5b)
was calculated with the method described by Hole
(1992) to the maximum penetration depth of the rays.
In the first iterations, only picks with offsets smaller
than 40 km were inverted. In the following iterations,
this offset threshold was stepwise increased to 300 km
in steps of 40 km. This stepwise increase in maximum
offset ensures that the shallow part of the model is
constrained before the deep part, which has the least
dense ray coverage and for which the calculated travel
times are also influenced by the upper part of the
model. The model is parameterized in a 1�1 km grid,
which is finer than the obtainable resolution. There-
fore, smoothing filters were applied in each iteration
to the calculated derivatives and model perturbations,
but not to the model itself. The initial model was
chosen with a high average velocity at all depths in
order to prevent artificial low-velocity zones from
developing during the inversion procedure. At each
chosen maximum offset, the size of the smoothing
filter was decreased stepwise from 120� 30 to 8� 4
km to increase the resolution. The total number of
iterations was 175 and the final RMS residual travel
time difference was 89 ms.
The third P-wave velocity distribution (Fig. 5c)
was calculated with the FAST tomographic inversion
program package (Zelt and Barton, 1998) to the
deepest ray penetration. The tomographic method
applies regularized inversion, which allows the user
to constrain the flatness and smoothness of the per-
turbations. The grid size was 1�1 km for forward
calculations of the rays and 15� 2 km for inverse
computations. An initial one-dimensional model,
based on previous studies was subject to different
flattening and smoothing parameters, and the starting
model for the inversion was calculated as the average
of the nine models with the smallest RMS travel time
misfit. The resulting model was obtained after 20
iterations. It provides a RMS misfit of 96 ms between
the observed and computed travel times. The three
resulting velocity models based on tomographic in-
version show the same overall structure, although
details vary at scale below the resolution. The differ-
ences are primarily caused by differences in processes
and the choice of smoothing parameters, as well as
different choices of criteria for terminating the inver-
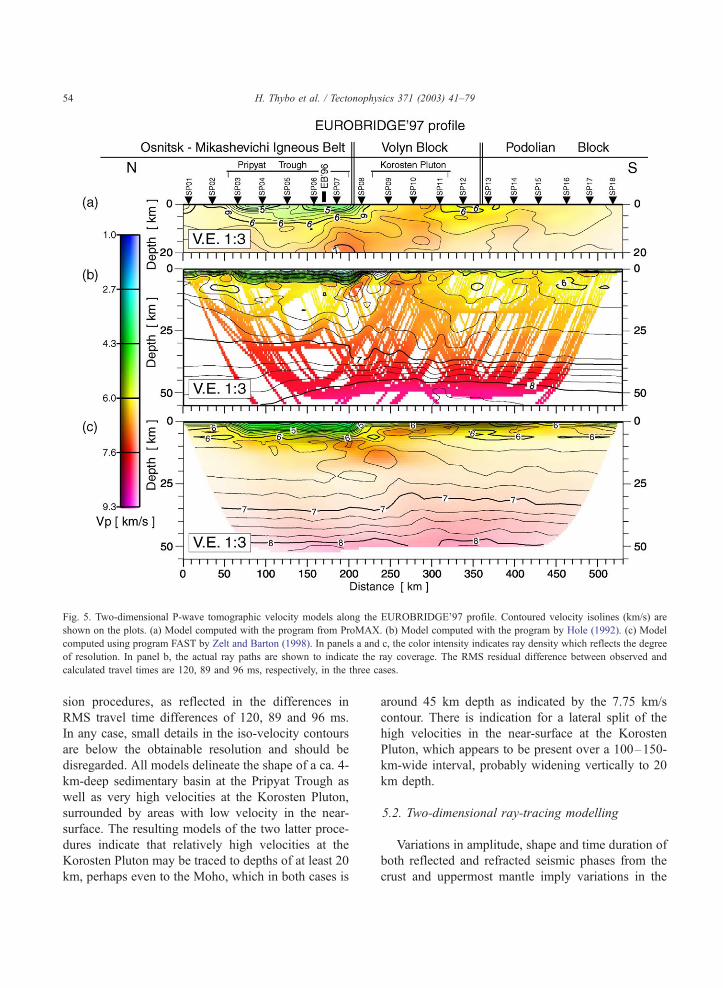
Fig. 5. Two-dimensional P-wave tomographic velocity models along the EUROBRIDGE’97 profile. Contoured velocity isolines (km/s) are
shown on the plots. (a) Model computed with the program from ProMAX. (b) Model computed with the program by Hole (1992). (c) Model
computed using program FAST by Zelt and Barton (1998). In panels a and c, the color intensity indicates ray density which reflects the degree
of resolution. In panel b, the actual ray paths are shown to indicate the ray coverage. The RMS residual difference between observed and
calculated travel times are 120, 89 and 96 ms, respectively, in the three cases.
H. Thybo et al. / Tectonophysics 371 (2003) 41–7954
sion procedures, as reflected in the differences in
RMS travel time differences of 120, 89 and 96 ms.
In any case, small details in the iso-velocity contours
are below the obtainable resolution and should be
disregarded. All models delineate the shape of a ca. 4-
km-deep sedimentary basin at the Pripyat Trough as
well as very high velocities at the Korosten Pluton,
surrounded by areas with low velocity in the near-
surface. The resulting models of the two latter proce-
dures indicate that relatively high velocities at the
Korosten Pluton may be traced to depths of at least 20
km, perhaps even to the Moho, which in both cases is
around 45 km depth as indicated by the 7.75 km/s
contour. There is indication for a lateral split of the
high velocities in the near-surface at the Korosten
Pluton, which appears to be present over a 100–150-
km-wide interval, probably widening vertically to 20
km depth.
5.2. Two-dimensional ray-tracing modelling
Variations in amplitude, shape and time duration of
both reflected and refracted seismic phases from the
crust and uppermost mantle imply variations in the

H. Thybo et al. / Tectonophysics 371 (2003) 41–79 55
nature of the boundaries and transition zones. Based
on all such phases that could be correlated with some
certainty in the seismic record sections, we derived a
two-dimensional model of the lithospheric structure
down to 60–80 km depth (Fig. 6). The method used
was iterative, manual travel time fitting, using the ray-
tracing package SEIS83 (Cerveny and Psencık, 1983),
supported by the programs MODEL and XRAYS
(Komminaho, 1998). The basis for the kinematic
modelling was a consistent series of travel times,
which was picked using traditional seismic phase
correlation for refracted and reflected phases. The
time differences at reciprocal points do not exceed
50 ms, which is about the uncertainty of picks for
the upper crustal refraction Pg. The uncertainties
for deeper seismic phases are higher; we assess
them to be on the order of 100 ms for crustal
refractions and the PmP reflection from the Moho,
and 200 ms for intracrustal reflections and the Pn
refraction from the sub-Moho mantle. The model
includes first-order discontinuities in seismic veloc-
ity which may represent major transitions in the
lithosphere.
The initial model of velocities was based on the
resulting models from the tomographic inversion (Fig.
5), and the overall lithospheric layering was derived
from the number of seismic reflection phases (Fig. 7)
together with results from previous high-resolution
interpretations of seismic velocity in the area. The
latter were particularly important for constraining the
top basement and the sedimentary sequences, since
EUROBRIDGE’97 is designed to image primarily the
deep structure.
In the ray-tracing procedure, travel times are suc-
cessively recalculated for a sequence of models which
is constructed by the interpreters in order to improve
the fit between observed and calculated travel times
for one seismic phase at a time. In the initial model-
ling, the uppermost velocity structure is determined
using the appropriate seismic phases. This is followed
by stepwise modelling of phases from layers at deeper
levels, usually in a sequence in which the velocity is
determined by refracted phases from the relevant
layer, after which the thickness of the layer is deter-
mined by reflected phases from the interface to the
next, deeper layer together with refractions from the
deeper layer. Usually only super-critical reflections
are strong enough to be identified in the seismic
record sections. Changes to the model are assessed
by comparison of calculated and observed travel
times. This iterative procedure is continued until a
reasonable fit has been obtained, as judged from the
assessed uncertainty of each modelled seismic phase.
Additionally, synthetic seismograms were calculated
to control vertical velocity gradients within the layers
and velocity contrasts across the seismic discontinu-
ities. The synthetic seismograms calculated for the
final model are in qualitative agreement with the
observed seismograms, in particular for the relation
in amplitude between first arrival, lower crustal reflec-
tivity and the reflection from the Moho (PmP) (Fig. 7).
However, some difference is also evident for the sub-
Moho refraction Pn as well as some of the upper
mantle reflections. In some of the presented exam-
ples, the Pg to PmP relation is not reproduced very
well in certain offset intervals, generally between
110 and 160 km. We ascribe the discrepancies
mainly to the use of ray-tracing techniques for the
calculation of the synthetic seismograms in a com-
plex model. The detailed velocity model of the
lithosphere along profile EUROBRIDGE’97 from
ray-trace modelling is shown in Fig. 6. Fig. 8 shows
a simplified sketch of the lithospheric model, which
also indicates which parts of the model that are
constrained by raypath coverage. It is based on the
ray-tracing model (Fig. 6), the tomographic inversion
models, and qualitative implications from the ob-
served wavefield.
6. P-wave velocity model
There is significant lateral variation of seismic
velocity along the EUROBRIDGE’97 profile (Fig.
6a,b). Pronounced lateral transitions were modelled
in the upper crystalline crust at 150–210 km (beneath
the southern half of the Pripyat Trough) and 300–350
km. The exact form and nature of these zones cannot
be resolved with the DSS technique, which relies on
modelling of wide-angle reflected and refracted
waves. The zones separate crustal units (blocks) of
different velocity structure in the north, centre and
south of the profile, which can be spatially correlated
with the Osnitsk–Mikashevichi Igneous Belt, the
Volyn Block including the Korosten Pluton, and the
Podolian block.

Fig. 6. Two-dimensional models of seismic P- and S-wave velocity along the EUROBRIDGE’97 profile in Belarus and Ukraine. P-wave
velocity model: (a) upper crustal details; (b) the complete lithospheric model. Thick, black lines represent major velocity discontinuities
(interfaces). The dipping reflector in the mantle is constrained by reflections only, hence the velocity below this feature is unknown. (c) S-wave
velocity model. Those parts of the first-order discontinuities that have been constrained by reflected and/or refracted arrivals of S-waves are
marked by thick lines. (d) Model of Vp/Vs ratio distribution. Those parts of the first-order discontinuities that have been constrained by reflected
or refracted arrivals of P- or S-waves are marked by thick lines. Thin lines represent velocity isolines with values (km/s) shown in white boxes.
Locations of major basement tectonic units and the Pripyat Trough are indicated. Arrows show positions of shot points. The location where
EUROBRIDGE’97 crosses the EUROBRIDGE’96 profile is marked as EB’96.
H. Thybo et al. / Tectonophysics 371 (2003) 41–7956
The most complicated and significant structures are
in the upper crust down to 10–15 km depth, as well as
in the lower crust below a depth of 35 km. In the
northern part of the profile (km 60–220), low veloc-
ities of f 2.4–4.2 km/s in an approximately 4-km-
thick layer represent the sedimentary fill of the Pripyat
Trough. The centre of the profile, in the vicinity of the
Korosten Pluton (Fig. 1) is characterised by upper
crustal velocities of 6.4–6.7 km/s, which are extreme-
ly high given the shallow depth interval (0–10 km) in
which they occur (Fig. 7a). In the northern and
southern parts of the profile, top crystalline basement
velocity values are 6.1–6.2 km/s. In the south, a weak
low-velocity zone (LVZ) underlies this basement and
part of the high-velocity zone of the Korosten Pluton.
The LVZ has been modelled with a rather small

Fig. 6 (continued ).
H. Thybo et al. / Tectonophysics 371 (2003) 41–79 57
velocity contrast of 0.1 km/s to the surrounding rocks,
but the exact velocity is unconstrained by the avail-
able data.
Below f 15 km depth the middle to lower crust is
represented by two layers with velocities of f 6.4
and f 6.7 km/s. We only observe sporadic reflections
between these layers (Fig. 8). Deeper crustal units are
absent at the southern end of the profile (at distances
of more than 450 km), where a relatively simple,
‘‘normal type’’ of Precambrian crustal structure with a
three-layered crust (e.g. Meissner, 1986) exists within
the Podolian Block. A deeper, third zone of high
velocity is found elsewhere, ca. 5 km thick within
the Osnitsk–Mikashevichi Igneous Belt and thicker
and more complicated in the Volyn Block. This lowest
crustal layer is characterised by very high velocities of
7.0–7.4 km/s. At the base of the crust, particularly in
the central part of the profile within the Volyn Block,
there is a complicated structure with velocities ex-
ceeding 7.4 km/s. This lowermost layer of the crust is
associated with large contrasts in P- and S-wave
velocities which may explain the observation of
H. Thybo et al. / Tectonophysics 371 (2003) 41–7958
strong PmP and SmS arrivals from the centre part of
the profile. However, the exact velocities are relatively
uncertain, as they are only constrained from amplitude
modelling of reflections from the interval, and not
from refracted arrivals. The observation of a very
strong reflection from the Moho shows that the
velocities of this thin lowermost crustal layer must
be well below the velocities in the sub-Moho mantle.
Within the northern and southern parts of the profile,
the lowermost crust and uppermost mantle include
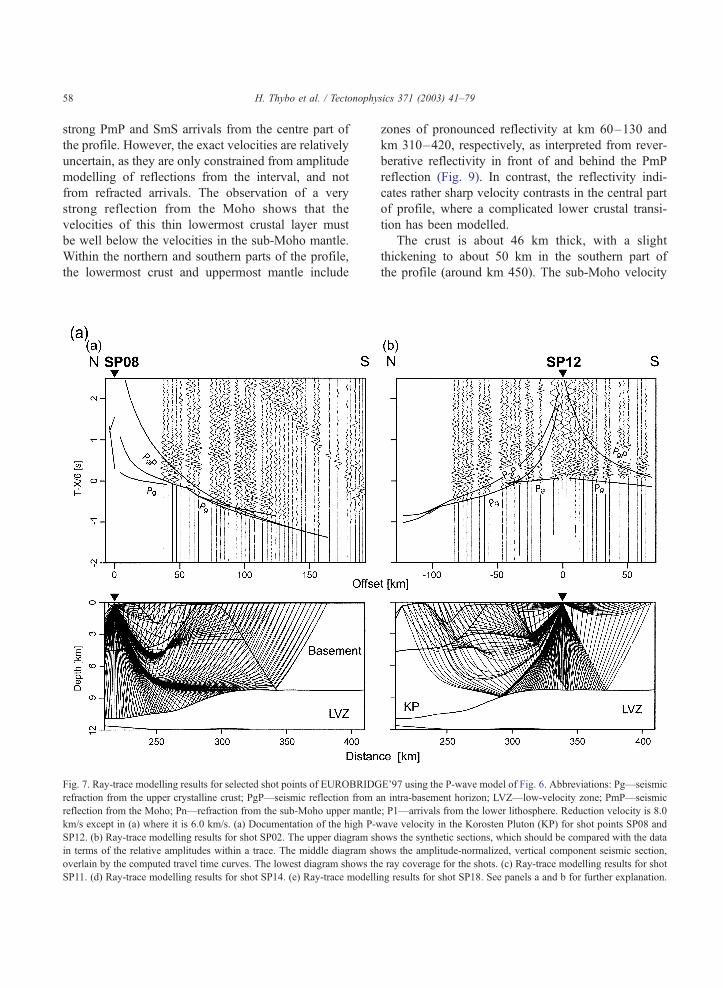
Fig. 7. Ray-trace modelling results for selected shot points of EUROBRIDG
refraction from the upper crystalline crust; PgP—seismic reflection from a
reflection from the Moho; Pn—refraction from the sub-Moho upper mantl
km/s except in (a) where it is 6.0 km/s. (a) Documentation of the high P-w
SP12. (b) Ray-trace modelling results for shot SP02. The upper diagram sh
in terms of the relative amplitudes within a trace. The middle diagram sh
overlain by the computed travel time curves. The lowest diagram shows th
SP11. (d) Ray-trace modelling results for shot SP14. (e) Ray-trace modelli
zones of pronounced reflectivity at km 60–130 and
km 310–420, respectively, as interpreted from rever-
berative reflectivity in front of and behind the PmP
reflection (Fig. 9). In contrast, the reflectivity indi-
cates rather sharp velocity contrasts in the central part
of profile, where a complicated lower crustal transi-
tion has been modelled.
The crust is about 46 km thick, with a slight
thickening to about 50 km in the southern part of
the profile (around km 450). The sub-Moho velocity
E’97 using the P-wave model of Fig. 6. Abbreviations: Pg—seismic
n intra-basement horizon; LVZ—low-velocity zone; PmP—seismic
e; P1—arrivals from the lower lithosphere. Reduction velocity is 8.0
ave velocity in the Korosten Pluton (KP) for shot points SP08 and
ows the synthetic sections, which should be compared with the data
ows the amplitude-normalized, vertical component seismic section,
e ray coverage for the shots. (c) Ray-trace modelling results for shot
ng results for shot SP18. See panels a and b for further explanation.

Fig. 7 (continued ).
H. Thybo et al. / Tectonophysics 371 (2003) 41–79 59

Fig. 7 (continued ).
H. Thybo et al. / Tectonophysics 371 (2003) 41–7960

Fig. 7 (continued ).
H. Thybo et al. / Tectonophysics 371 (2003) 41–79 61

Fig. 7 (continued ).
H. Thybo et al. / Tectonophysics 371 (2003) 41–7962
H. Thybo et al. / Tectonophysics 371 (2003) 41–79 63
(Pn velocity) is as high as 8.3–8.4 km/s along most of
the profile, except for the central part of the profile,
where it is f 8.1 km/s between km 80 and 260.
The cause of the P1 phase is a dipping mantle
interface. It may either represent a change in lithology,
i.e. a first-order seismic discontinuity between layers
with different velocity, or it may represent a relatively
narrow mantle zone of high-velocity gradient and
inhomogeneity without any noticeable change in
seismic velocity across the interface, e.g. a tectonic
shear zone. Both possibilities produce rather similar
synthetic seismograms. The southward apparent dip
from f 46 km depth at km 120 to f 80 km depth at
km 260 along the EUROBRIDGE’97 profile is well
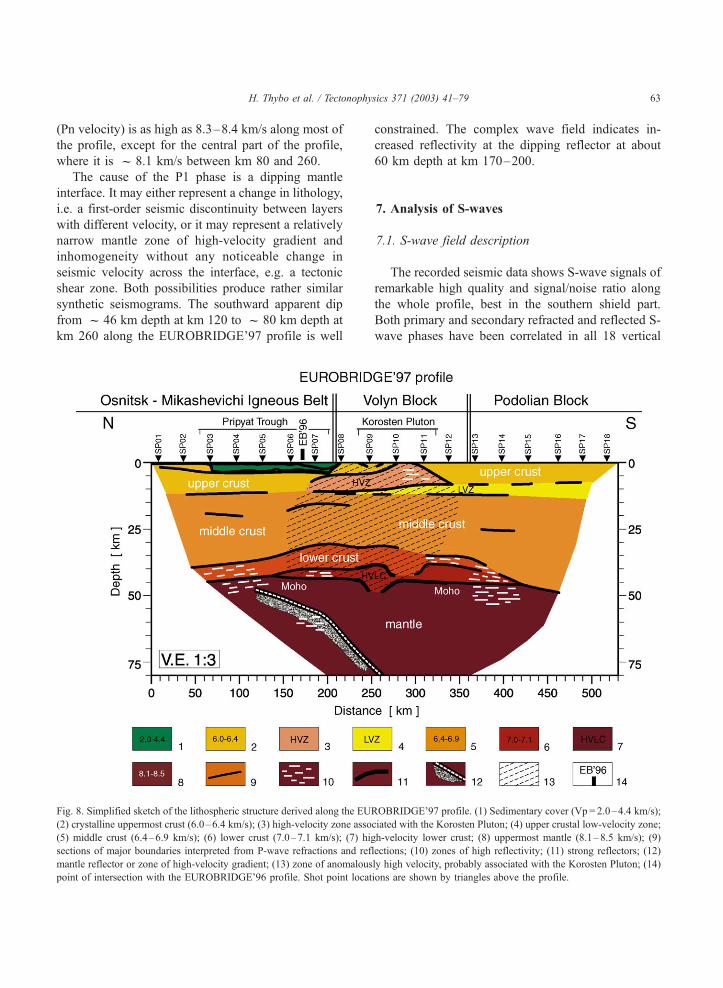
Fig. 8. Simplified sketch of the lithospheric structure derived along the EUR
(2) crystalline uppermost crust (6.0–6.4 km/s); (3) high-velocity zone asso
(5) middle crust (6.4–6.9 km/s); (6) lower crust (7.0–7.1 km/s); (7) hig
sections of major boundaries interpreted from P-wave refractions and ref
mantle reflector or zone of high-velocity gradient; (13) zone of anomalous
point of intersection with the EUROBRIDGE’96 profile. Shot point locat
constrained. The complex wave field indicates in-
creased reflectivity at the dipping reflector at about
60 km depth at km 170–200.
7. Analysis of S-waves
7.1. S-wave field description
The recorded seismic data shows S-wave signals of
remarkable high quality and signal/noise ratio along
the whole profile, best in the southern shield part.
Both primary and secondary refracted and reflected S-
wave phases have been correlated in all 18 vertical
OBRIDGE’97 profile. (1) Sedimentary cover (Vp = 2.0–4.4 km/s);
ciated with the Korosten Pluton; (4) upper crustal low-velocity zone;
h-velocity lower crust; (8) uppermost mantle (8.1–8.5 km/s); (9)
lections; (10) zones of high reflectivity; (11) strong reflectors; (12)
ly high velocity, probably associated with the Korosten Pluton; (14)
ions are shown by triangles above the profile.
H. Thybo et al. / Tectonophysics 371 (2003) 41–7964
component record. From previous experience (EURO-
BRIDGE Seismic Working Group, 1999), we find the
vertical component as good as the horizontal compo-
nents for detection of S-waves in the record sections.
This may be surprising, but it is often the case for
crustal refraction data. Record sections with a reduc-
tion velocity of 4.52 km/s were prepared for correla-
tion of S-wave phases using a band-pass filter of 1–
8 Hz and the axes scaled by a factor of 3� 0.5 to match
the corresponding P-wave sections with a reduction
velocity of 8 km/s (Fig. 9).
In the northern part, in the interval of km 0–200,
the observed initial (‘‘first’’) Sg arrivals are weak
compared to the background P-wave coda and strong
secondary S-wave arrivals (Fig. 9a,c,d). S-wave
reflections from the lower crust are clearly identifiable
beyond offsets of approximately 50 km in record
sections from the northern shots (SP01–07; Fig.
9a,c). In the southern part of the profile, high-quality,
clear S-waves are observed at all offsets (SP08–18;
Fig. 9b,d–f).
The high-quality data to the south of km 200
allows exact phase correlation of refracted and
reflected S-waves on most record sections. The differ-
ences in picked travel times between the two direc-
tions usually do not exceed 100 ms at the reciprocal
points. Remarkably, Sg arrivals are strong enough,
with very high signal/noise ratio, to be comparable to
Pg arrivals in the southern part of the profile (Fig. 9).
In the northern part, Sg arrivals are weaker than the
corresponding Pg arrivals and it is usually only rarely
possible to correlate the Sg phase in the background
seismic noise and P-wave coda.
S-wave reflections from the middle crust are only
sparsely identified. Reflections from the lower crust
and from the Moho discontinuity (SmS) are the
strongest S-waves observed in all sections. These
waves are recorded in many sections over long offset
ranges from 50–80 to 300–350 km. In the southern
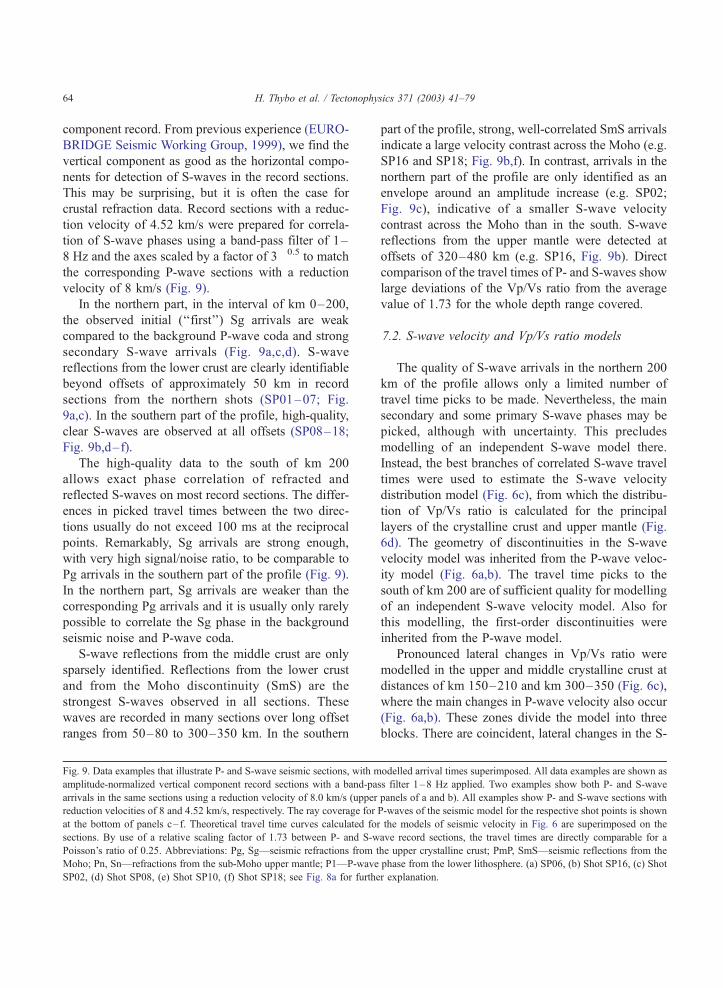
Fig. 9. Data examples that illustrate P- and S-wave seismic sections, with m
amplitude-normalized vertical component record sections with a band-pa
arrivals in the same sections using a reduction velocity of 8.0 km/s (upper
reduction velocities of 8 and 4.52 km/s, respectively. The ray coverage for
at the bottom of panels c– f. Theoretical travel time curves calculated fo
sections. By use of a relative scaling factor of 1.73 between P- and S-w
Poisson’s ratio of 0.25. Abbreviations: Pg, Sg—seismic refractions from t
Moho; Pn, Sn—refractions from the sub-Moho upper mantle; P1—P-wave
SP02, (d) Shot SP08, (e) Shot SP10, (f) Shot SP18; see Fig. 8a for furthe
part of the profile, strong, well-correlated SmS arrivals
indicate a large velocity contrast across the Moho (e.g.
SP16 and SP18; Fig. 9b,f). In contrast, arrivals in the
northern part of the profile are only identified as an
envelope around an amplitude increase (e.g. SP02;
Fig. 9c), indicative of a smaller S-wave velocity
contrast across the Moho than in the south. S-wave
reflections from the upper mantle were detected at
offsets of 320–480 km (e.g. SP16, Fig. 9b). Direct
comparison of the travel times of P- and S-waves show
large deviations of the Vp/Vs ratio from the average
value of 1.73 for the whole depth range covered.
7.2. S-wave velocity and Vp/Vs ratio models
The quality of S-wave arrivals in the northern 200
km of the profile allows only a limited number of
travel time picks to be made. Nevertheless, the main
secondary and some primary S-wave phases may be
picked, although with uncertainty. This precludes
modelling of an independent S-wave model there.
Instead, the best branches of correlated S-wave travel
times were used to estimate the S-wave velocity
distribution model (Fig. 6c), from which the distribu-
tion of Vp/Vs ratio is calculated for the principal
layers of the crystalline crust and upper mantle (Fig.
6d). The geometry of discontinuities in the S-wave
velocity model was inherited from the P-wave veloc-
ity model (Fig. 6a,b). The travel time picks to the
south of km 200 are of sufficient quality for modelling
of an independent S-wave velocity model. Also for
this modelling, the first-order discontinuities were
inherited from the P-wave model.
Pronounced lateral changes in Vp/Vs ratio were
modelled in the upper and middle crystalline crust at
distances of km 150–210 and km 300–350 (Fig. 6c),
where the main changes in P-wave velocity also occur
(Fig. 6a,b). These zones divide the model into three
blocks. There are coincident, lateral changes in the S-
odelled arrival times superimposed. All data examples are shown as
ss filter 1–8 Hz applied. Two examples show both P- and S-wave
panels of a and b). All examples show P- and S-wave sections with
P-waves of the seismic model for the respective shot points is shown
r the models of seismic velocity in Fig. 6 are superimposed on the
ave record sections, the travel times are directly comparable for a
he upper crystalline crust; PmP, SmS—seismic reflections from the
phase from the lower lithosphere. (a) SP06, (b) Shot SP16, (c) Shot
r explanation.

H. Thybo et al. / Tectonophysics 371 (2003) 41–79 65

Fig. 9 (continued ).
H. Thybo et al. / Tectonophysics 371 (2003) 41–7966

Fig. 9 (continued ).
H. Thybo et al. / Tectonophysics 371 (2003) 41–79 67

Fig. 9 (continued ).
H. Thybo et al. / Tectonophysics 371 (2003) 41–7968

Fig. 9 (continued ).
H. Thybo et al. / Tectonophysics 371 (2003) 41–79 69

Fig. 9 (continued ).
H. Thybo et al. / Tectonophysics 371 (2003) 41–7970
H. Thybo et al. / Tectonophysics 371 (2003) 41–79 71
wave velocity (Fig. 6d), although the variation is
smaller than for the P-wave velocity. The sediments
of the Pripyat Trough in the northern block have Vp/
Vs ratios as large as 2.0–2.3. These values were
adapted from a detailed study by Molotova and
Vasilev (1960). In the crystalline crust of the northern
Osnitsk–Mikashevichi Igneous Belt, the Vp/Vs ratio
increases with depth from 1.72 to 1.78, although not
well constrained because of the low signal/noise ratio
for most crustal S-wave arrivals in this part of the
profile. The model values provide the correct mean
velocity for the whole crust, as can be checked from
the high-quality SmS reflections. The S-wave velocity
increases from 3.63 km/s in the upper crust to 3.80
km/s near the Moho.
The ‘‘high-velocity body’’ in the central part of the
profile, associated with the Korosten Pluton, has much
higher Vp/Vs ratio in the upper and middle crust than
the neighbouring blocks: 1.77–1.79 for the two main
upper crustal layers, corresponding to S-wave velocity
values of 3.57–3.73 km/s; 1.75 was chosen for the
LVZ, although non-constrained by the data (in the
central and southern blocks); 1.78–1.84 at depths of
15–20 km (Vs f 3.60 km/s). Such extraordinary
high values of Vp/Vs were also measured in samples
of biotite-bearing gneisses and amphiboles from sim-
ilar depth in the deep drill hole on the Kola Peninsula
in the northeastern part of the East European Craton
(Kern et al., 2001).
The southern block of the Ukrainian Shield has the
lowest values of Vp/Vs ratio in the model: in the
upper crust it varies from 1.71–1.73 (Vs f 3.55 km/
s) at 300–430 km distance to 1.67–1.68 (Vs f 3.65
km/s) at 430–500 km distance. This variation is
significant because the P-wave modelling indicates a
homogeneous upper crust. Below a depth of 12 km,
Vp/Vs exhibits no lateral variation with a vertical
increase from 1.69 to 1.74 at the Moho (Vs f 3.75–
3.95 km/s).
The S-wave velocities in the lowest crust and
uppermost mantle of the central block are about
3.95, 4.25–4.45 and 4.55 km/s. These values are high
compared to the surrounding areas, similarly to the
high P-wave velocities. A high Vp/Vs of 1.78 was
also found for the main lower crustal layer, whereas
the lowest, thin transition layer into the uppermost
mantle has been modelled with a low Vp/Vs ratio, in
order to explain the high amplitude of the reflectivity
around the SmS phase. The sub-Moho mantle exhibits
extremely high values of Vp/Vs of f 1.83 in the part
of the model, where a reliable estimate can be given
based on Sn arrivals.
There are some discrepancies between the P- and
S-wave models. At a depth of 55 km between km 340
and 480 along the profile, the S-wave record sections
indicate the existence of a strong reflector in the upper
mantle (c.f. the last reflection at 90–200 km offset for
SP16; Fig. 9b). There is no indication for a similar
structure from the P-wave sections, which instead
indicate a highly reflective uppermost mantle in high
frequencies at these distances from reverberative
arrivals (SP16). The S-wave data further indicates
that the Moho is flat around km 255, where the P-
wave data indicates a distinct flexure.
8. Discussion
8.1. Crustal blocks and palaeo-terranes
The seismic models of the EUROBRIDGE’97
profile define three blocks (or segments of palaeo-
terranes of different affinities), based on strong lateral
contrasts in the P- and S-wave velocities and the Vp/
Vs ratio. The centre block corresponds to the base-
ment area of the Volyn Block, in which the profile
mainly traverses the Korosten Pluton. The southern
part corresponds to the Podolian Block of the Ukrai-
nian Shield. The northern part is fully within the
Osnitsk–Mikashevichi Igneous Belt of the Palaeopro-
terozoic active margin of Sarmatia, where the profile
mainly traverses the area of the Pripyat Trough.
Despite the changes in surface conditions from a thin
platform cover and a sedimentary trough in the north
to exposed crystalline basement in the shield area, the
vertical velocity profiles in the northern and southern
blocks are very close to the average velocity profile of
typical Precambrian cratons. A f 45-km-thick crys-
talline crust is expected in such areas, consisting of
three main components with P-wave velocities of
f 6.1, f 6.5, and f 7.0 km/s (Meissner, 1986).
The EUROBRIDGE’97 profile shows similar veloci-
ties, although the deep crustal velocity may be slightly
low in the Osnitsk–Mikashevichi Igneous Belt where
a thin layer above Moho instead has a velocity
substantially higher than 7.0 km/s. The occurrence
H. Thybo et al. / Tectonophysics 371 (2003) 41–7972
of P-wave velocities higher than 7.0 km/s and rela-
tively thick crust (f 50 km) appear to characterise
this part of the East European Craton as the ‘Protero-
zoic type’ described by Grad and Luosto (1987),
BABEL Working Group (1993), Grad and Tripolsky
(1995), EUROBRIDGE Seismic Working Group
(1999), and Sroda and POLONAISE Profile P3
Working Group (1999).
The EUROBRIDGE’97 profile crosses the bound-
aries between three distinct basement areas or blocks
of the Sarmatian crustal segment of the East European
Platform. The velocity model shows pronounced
differences between these blocks. However, the main
reason for these changes may be the presence of the
Korosten Pluton which was emplaced in the Volyn
Block and constitutes a large part of this block along
the profile. It appears evident that this overprinting of
the original velocity structure of individual terranes is
responsible for the main contrasts. The combined
EUROBRIDGE’95 and ’96 profiles also show distinct
lateral changes in the velocity structure between all
the Palaeproterozoic orogenic belts along these pro-
files, although changes are less pronounced than along
the current profile. The contact zones between the
three main blocks in the EUROBRIDGE’97 profile
are pronounced, but the applied DSS method does not
allow assessment of the width of the transitions; the
best estimate obtainable with the current resolution is
that they are less than 50 km wide. The profile clearly
demonstrates that the transitions between the individ-
ual blocks have been preserved since the Palaeproter-
ozoic as changes in physical properties. However,
younger processes have modified the velocity struc-
ture without destroying the fine-scale reflectors in the
upper to middle crust, which are probably related to
faulting, either during crustal assemblage or during
the subsequent formation of the Pripyat Trough.
At the cross point, the velocity structure is in
agreement between the two EUROBRIDGE profiles,
except for the depth to the lower crustal layer charac-
terised by a P-wave velocity of f 7.0 km/s (f 27 km
in the EUROBRIDGE’96 profile and f 31 km in the
EUROBRIDGE’97 profile). This discrepancy may be
caused by the uncertainty in interpreting the lateral
extent of the elevated velocities at the Korosten Pluton
along the EUROBRIDGE’97 profile. The EURO-
BRIDGE’97 model shows slightly increased velocity
associated with the Korosten Pluton at the cross point,
contrary to the EUROBRIDGE’96 model. This indi-
cates that the Korosten Pluton anomaly is sharper than
shown in the velocity model, i.e. that the lateral
velocity gradient is too small in the model at the
Korosten Pluton. Hence, the elevated velocity may
be underestimated and extend too far to the north in
the present model. However, the lateral data coverage
along EUROBRIDGE’97 is much better than along
EUROBRIDGE’96, such that the current profile ex-
pectedly provides the best resolution of the seismic
velocity structure. The EUROBRIDGE’96 interpreta-
tion includes a pronounced zone of lower crustal
reflectors below f 20 km depth in the Osnitsk–
Mikashevichi Igneous Belt. The EUROBRIDGE’97
data also shows lower crustal reflectivity from the
same block, but only below f 35 km depth and the
character of the reflectivity in this direction indicates a
fine-scale layering, rather than distinct reflectors as
along the other profile. Seismic reflection sections in
the proximity of the profiles also show lower crustal
reflectivity in near-normal-incidence. EUROBRIDGE
Seismic Working Group (1999) suggests that the
reflectivity may be either a characteristic of the
Osnitsk–Mikashevichi Igneous Belt or related to the
formation of the Pripyat Trough. With the new veloc-
ity model along the EUROBRIDGE’97 profile, we
find it unlikely that the reflectivity can mainly be
caused by structure from the development of the
Pripyat Trough. We prefer the first explanation, name-
ly that the elevated seismic velocity and pronounced
reflectivity in the lower crust are characteristics of the
Osnitsk–Mikashevichi Igneous Belt. The change in
reflectivity characteristics and depth between the two
profiles indicates anisotropy in the fine structure of the
lower crust.
The general intracrustal, wide-angle reflectivity is
high at all crustal levels in the northern part of the
Osnitsk–Mikashevichi Igneous Belt, although reflec-
tions are not observed from any pronounced first-
order discontinuities. It could be speculated that the
reflectivity is only apparent and caused by the plat-
form cover instead of intracrustal reflectors. However,
the strongly changing conditions along the EURO-
BRIDGE’97 from normal platform cover to a trough
make it unlikely that the sedimentary sequences may
be the primary explanation for the reflectivity. Hence,
dispersed crustal reflectivity is another characteristic
of the Osnitsk–Mikashevichi Igneous Belt, as in all

H. Thybo et al. / Tectonophysics 371 (2003) 41–79 73
the seismic sections from the northern part of the
EUROBRIDGE’97 profile.
The crustal structure of the Ukrainian Shield proper
in the southern part of the EUROBRIDGE’97 profile
in the Podolian block, is relatively uniform and
without pronounced lateral variation, except for a
pronounced change in Vp/Vs ratio which is not
understood at present. Most of the lateral change in
velocity appears to be related to the evolution of the
Korosten Pluton, although a seismic low-velocity
zone at around 10 km depth is only interpreted in
the southern part of the profile and not in the south-
ernmost part of the profile. It is remarkable that the
crustal thickness increases away from the Korosten
Pluton to f 50 km, which may be the average
thickness of the crust in the western Ukrainian Shield.
8.2. Pripyat Trough and magmatic intrusions
Comparison of the velocity model with the parallel
seismic reflection profile VIII (Juhlin et al., 1996;
Stephenson et al., 2001) shows some correspondence
between the velocity layers and intracrustal reflectivity
(Fig. 10). There is clear correspondence between the
Fig. 10. Seismic reflection profile VIII with the velocity model along the E
between the two models, regarding the shape and thickness of the Pripyat
tend to sole out at the top of the lowest crustal layer. The two profiles are p
complete correspondence.
two profiles at the Pripyat Basin, and the Moho
corresponds roughly to a change between strong
crustal reflectivity and an almost transparent upper
mantle. The dipping mantle reflector is not evident in
the reflection profile, although there is a tendency for a
change in reflection character. Dipping crustal, nor-
mal-incidence reflections cross some of the velocity
interfaces, which indicates that the velocity distribu-
tion is a younger feature than the high-frequency
reflectors. The change in velocity across the reflectors
may be caused by metamorphic changes which post-
date the tectonic creation of the normal-incidence
reflectors. If so, these transformations have largely left
the small wavelength, pre-existing reflectivity un-
changed.
The crustal thickness is relatively constant along
the EUROBRIDGE’97 profile: f 46 km in the
central part of the profile and deepening to the sides
to f 50 km. The Moho is at a constant depth and
there is apparently no crustal thinning associated
with the Pripyat Trough, as also noted by the
EUROBRIDGE Seismic Working Group (1999) at
the northern part of the trough. One may speculate
that crustal thinning associated with the formation of
UROBRIDGE’97 profile superimposed. There is general agreement
Trough and the Moho depth. Further, dipping intracrustal reflections
arallel but are located ca. 25 km apart; hence, one should not expect

H. Thybo et al. / Tectonophy74
the trough may have been hidden by magmatic
ponding at the base of the crust (magmatic under-
plating), as indicated by the high seismic velocities
in the centre part of the profile. Such masking of
crustal thinning has recently been suggested under
the currently active Kenya Rift Zone (Thybo et al.,
2000). However, these velocities are spatially coin-
cident with the Korosten Pluton, and are most likely
associated with the emplacement of this magmatic
body. Otherwise, the seismic velocity models show
no evidence for magmatic activity in the crust along
neither the EUROBRIDGE’97 profile nor the
EUROBRIDGE’96 profile. Wilson and Lyashkevich
(1996) interpret the presence of volcanic rocks from
the Pripyat–Dnieper–Donets rift system as an indi-
cation of strong volcanic activity caused by a mantle
plume. However, the relatively constant seismic
velocities around the Pripyat Trough are normal to
low for a platform area. Our velocity model shows
no sign of magmatic intrusions in the crust below the
Pripyat Trough, except for the apparent northward
extension of the high-velocity anomaly from the
Korosten Pluton to under the trough. It appears
likely that the Devonian volcanic rocks originated
directly from the mantle without affecting the crust
along the EUROBRIDGE’97 and EUROBRIDGE’96
profiles.
The layer of P-wave velocity f 6.4 km/s has
been observed to the southeast from the Fennoscan-
dia–Sarmatia suture along the EUROBRIDGE’96
profile to beneath the Pripyat Trough. The EURO-
BRIDGE’97 profile indicates that it only extends to
the southern edge of the Pripyat Trough and the
transition into the Volyn Block. The EUROBRIDGE
Seismic Working Group (1999) suggested that this
layer may have acted as a decollement for the
extension that created the Pripyat Trough and that
the extension only affected the upper crust. The flat
Moho may be explained by significant tectonic
involvement of the middle crust in the rift process
because of a rheologically strong crust. A flat Moho
has also been detected below Proterozoic basins in
the Baltic Shield (BABEL Working Group, 1993).
From comparisons to typical rock velocities (Chris-
tensen, 1996), the high-velocity gradient indicates
that metamorphic or compositional changes from
felsic to mafic granulites may take place in this
interval.
8.3. Compositional constraints from the Vp/Vs ratio
Changes in P-wave velocity values may be used to
discriminate between different tectonic/magmatic
areas, although these values are not sufficient to
constrain the rock types. The high-velocity gradient
in the middle crust indicates a gradual change from
felsic to mafic granulites. Further constraints may be
derived from knowledge of the Vp/Vs ratio distribu-
tion (e.g. Musacchio et al., 1997). High Vp/Vs values
usually indicate low quartz content of the rocks or the
presence of pore fluids at high pressure (Christensen,
1996). The high-quality S-wave energy observed
along most of the EUROBRIDGE’97 profile has
allowed direct modelling of the S-wave velocity and
Vp/Vs ratio distribution along the profile. The Vp/Vs
ratio and P-wave velocity encountered in the northern
and southern blocks support a model of the crust with
an increasing content of basic rocks with depth, from
felsic rocks at the surface to intermediate, mafic rocks
in the lower crust. However, the very low Vp/Vs ratio
in the lower crust of the Podolian Block of the
Ukrainian Shield indicates unusually high quartz
content in the lower crust.
The most outstanding aspect of the seismic veloc-
ity model is that the Vp/Vs ratio is distinctly higher in
the upper and middle crust around the Korosten
Pluton than in the surrounding blocks. These high
Vp/Vs ratio values extend along the profile under-
neath the surface expression of the Korosten Pluton
and further to the north, roughly coinciding with a
high P-wave velocity anomaly in the same depth
interval. The model shows Vp/Vs values of 1.77–
1.79 coinciding with P-wave velocities larger than
6.70 km/s down to a depth of 10 km, and up to 1.84
associated with P-wave velocities of 6.60–6.70 km/s
to 15 km depth. These values indicate a basic com-
position of the rocks. The highest Vp/Vs ratio is
compatible with a mafic, gabbroic rock with a high
content of plagioclase, pyroxene or amphibole (Chris-
tensen, 1996), consistent with the presence of a
magmatic body composed of anorthosite and gab-
bro–norite with remnants of granite–gneiss. This
may be explained by the presence of a plutonic body
that formed from mantle-derived melts with additional
melts from a gabbroic lower crust (Dovbush et al.,
2000). The internal layering as seen from the shin-
gling of refracted seismic phases may be caused by
sics 371 (2003) 41–79
H. Thybo et al. / Tectonophysics 371 (2003) 41–79 75
layering from several phases of melt injection into an
original granitic–gneissic upper crust or, alternatively,
fractional crystallization during cooling (Thybo et al.,
2000). Our results show that the pluton extends deeper
than previously believed, to depths of at least 15 km,
and that there is internal layering as well as lateral
differentiation. The highest content of anorthosites in
the body appears to occur in the depth interval
between 10 and 15 km at distances between km 170
and 260 along the profile. The presence of anorthosite
and gabbro–norite to large depths is further supported
by a pronounced, relative gravity low over the Kor-
osten Pluton (Wybraniec et al., 1998), as high velocity
and low density are characteristics of such rocks. The
high-velocity lower crust also exhibits high Vp/Vs
values in the northern and central part of the profile,
except for the lowest thin layer of velocity >7.40 km/
s, which is only interpreted in the central part of the
profile. These values indicate a mafic lower crust with
a lower content of plagioclase than in the upper body.
The upper main layer of the lower crust may have
a high content of pyroxenes, compatible with the
high Vp/Vs ratio and relatively high P-wave velocity.
The lower layer may be in a metamorphic grade
corresponding to garnet-granulites, compatible with
the very high P-wave velocity and relatively low Vp/
Vs ratio. The internal stratification indicates that
melting and underplating processes may have been
active during the emplacement of the Korosten Plu-
ton. However, the high velocities in the lowest crust
may also have their origin in metamorphic processes
that transformed original granulitic lower crustal rocks
into felsic eclogites (Mengel and Kern, 1992; Abra-
movitz et al., 1998). Such processes create rock types
with very high seismic velocity for felsic rocks. They
may have been active during a period of nearby
subduction that may have provided water to catalyse
the metamorphic processes and which may have
cooled the lowest crust.
There is pronounced lower crustal layering in the
central part of the seismic velocity model beneath the
Korosten Pluton and further to the north. This layering
may be explained by intrusion of mantle-derived
melts into the lower crust and around the original
Moho, where several series of intrusion and substan-
tial fractionation of the melts during cooling may have
occurred. The layering may have formed during the
emplacement of the Korosten Pluton or during the
formation of the Pripyat Trough. Outside this zone,
there appears to be substantial seismic reflectivity or
scattering, which originate from finer heterogeneity
than in the central part of the profile. The origin of this
reflectivity is not understood; it may be speculated
that it may be related to edge effects at the presumed
intrusions into the lower crust.
Another remarkable feature of the Vp/Vs ratio
distribution is the very high values of 1.85–1.84 in
the sub-Moho mantle, wherever constrained, coincid-
ing with a remarkably high P-wave velocity of >8.35
km/s. The sub-Moho Pn velocity is high along the
whole profile, except in the distance interval km 80–
260, where the velocity is around 8.10 km/s, which is
a Pn velocity value often encountered in the southern
Baltic Shield along the BABEL profile and East
European Platform along the POLONAISE profiles
(BABEL Working Group, 1993; Grad et al., 2002).
The extremely high Pn velocities are encountered
along the whole EUROBRIDGE transect from the
Baltic Sea into the Ukrainian Shield. The pronounced
difference in velocity between the EUROBRIDGE
profiles and other profiles in the region may be
because the profiles sample different geographical
areas. However, it is remarkable that the Pn velocities
are mainly sampled in a SW–NE direction along the
BABEL and POLONAISE profiles, whereas the
EUROBRIDGE profiles have a NW–SE direction.
Hence, substantial anisotropy cannot be excluded,
although further profiling is needed before any firm
judgement can be made.
8.4. Upper mantle features
A strongly southward dipping reflector has been
interpreted in the uppermost mantle, extending from
the Moho at km 80 to a depth of 75 km at km 250.
The reflector coincides with a subhorizontal reflector
in the EUROBRIDGE’96 profile at the cross point
with the EUROBRIDGE’97 profile. This indicates
that the true dip direction is approximately SW to
SSW, which is approximately perpendicular to the
dominating strike directions of the individual terranes
in the Palaeoproterozoic accretionary belt to the
northwest. The seismic data along the EURO-
BRIDGE’96 and EUROBRIDGE’97 profiles can only
constrain the position and approximate dip-direction
of the reflector, but the velocity below the reflector is

H. Thybo et al. / Tectonophysics 371 (2003) 41–7976
unknown. From the structure along the EURO-
BRIDGE’97 profile, it is tempting to relate the dip-
ping reflector to Palaeoproterozoic accretion of a
series of terranes, including the continental margin
of the Osnitsk–Mikashevichi Igneous Belt, which
were accreted to the Archaean nucleus of Sarmatia.
However, the SW–NE strike direction of the terrane
boundaries is not favourable for such interpretation,
although the strike direction is NW–SE for the main
suture between the Sarmatian and Volgo–Uralian
plates (Bogdanova et al., 2001). The boundary be-
tween the Archaean Podolian block and the Paleo-
proterozoic Teterev–Belaya Tserkov Belt and its
continuation to the north is NNW–SSE striking in
the immediate vicinity to the profile. The near-surface
location of this suture is approximately 500 km to the
northeast of the dipping mantle reflector. We suggest
that the dipping reflector is the trace of the suture or,
alternatively, a collision-related shear zone in the
upper mantle. The relatively low mantle velocities to
the south of (above) the dipping mantle reflector lead
us to favour a compositional change across the reflec-
tor, which may represent the structural outline of the
suture in the uppermost mantle. The basis and con-
clusion for this interpretation is similar to the infer-
ence of a crustal and upper mantle suture further north
in the Baltic Shield (Abramovitz et al., 1997).
The uppermost mantle generally shows substantial
occurrences of subhorizontal reflectors in the sub-
Moho mantle of the Baltic Shield and East European
Platform (e.g. Grad, 1992; BABEL Working Group,
1993; EUROBRIDGE Seismic Working Group, 1999;
Grad et al., 2002). These reflectors are often found
around 10 km below the Moho. Remarkably, the
EUROBRIDGE’97 profile only shows one such re-
flector in the S-wave model and none in the P-wave
model. Because the reflectors are generally identified
along single profiles, one cannot exclude that some of
these are dipping in a direction away from the
profiles, c.f. the above discussion, but the abundant
occurrence indicates that some of the reflectors are
actually subhorizontal. Some of the possible causes
that are being discussed include magmatic intrusions,
shear zones from tectonic movement, seismic aniso-
tropy, variation in fluid content, and metamorphic
transitions, e.g. between a felsic lower crust in eclo-
gite facies (REF) and a basic upper mantle (e.g.
Ryberg et al., 1995; Thybo and Perchuc, 1997;
Abramovitz et al., 1997, 1998; Steer et al., 1988).
The mantle reflectors are also observed as subhori-
zontal features beneath substantial Moho undulations.
This indicates that they are younger features than the
undulations.
9. Conclusions
Seismic data of high quality for interpretation of
both the P- and S-wave velocity structure was ac-
quired during the EUROBRIDGE’97 project along a
530-km-long, N–S-striking profile in the East Euro-
pean Platform. The profile extends from the Pripyat
Trough in the Osnitsk–Mikashevichi Igneous Belt,
across the Korosten Pluton and the Volyn Block into
the Podolian Block of the Ukrainian Shield. Seismic
energy from 18 shot points at approximately 30 km
distance along the profile were recorded by 120
mobile three-component seismographs in two deploy-
ments. The data has been interpreted by seismic
tomographic inversion of the travel times of first
arrival P-waves, by two-dimensional ray-tracing of
travel times of primary and secondary P- and S-
waves, as well as by calculation of two-dimensional
synthetic seismograms to match the P-wave arrivals.
The models of seismic P-wave velocity and Vp/Vs
ratio are indicative of a number of features of the crust
and uppermost mantle along the profile:
1. There are pronounced differences in velocity
structure between the three main crustal blocks
traversed by the profile. These blocks are related to
Palaeoproterozoic amalgamation of the crust by
terrane accretion to an Archaean nucleus. Hence,
tectonic structure and compositional difference has
survived for approximately 1.8 Ga.
2. Contrasts in seismic velocity cross dipping reflec-
tors as identified in seismic normal-incidence
reflection sections. This indicates that the seismic
velocity structure has changed since the formation
of the crust, although pronounced contrasts in
seismic velocity has also survived at the terrane
boundaries.
3. The Korosten Pluton is imaged as a high-velocity
anomaly to depths of at least 15 km instead of 6 km
as previously interpreted, possibly connected to a
lower crustal, high-velocity anomaly. The Vp/Vs
H. Thybo et al. / Tectonophysics 371 (2003) 41–79 77
ratio is high, indicative of a basic composition,
consistent with a mafic body of mantle-derived
melts with contribution from the lower gabbroic
crust.
4. The Ukrainian Shield shows a typical cratonic
velocity structure, however, with relatively low
seismic P-wave velocity and very small Vp/Vs
ratios.
5. The northern part of the Osnitsk–Mikashevichi
Igneous Belt is characterised by a typical velocity
structure of the Baltic–Belarussian part of the East
European Platform area, i.e. with a typical platform
structure, which remarkably, is underlain by a thin
layer of very high velocity.
6. The Pripyat Trough is outlined as a rift type
sedimentary basin. TheMoho is basically flat across
the trough, which indicates that the extension only
affected the upper to middle crust, e.g. by stretching
of a rheologically strong lithosphere, or, alterna-
tively, that processes of magmatic underplating have
masked crustal thinning.
7. A steeply southwesterly dipping mantle reflector is
present in the profile. This reflector correlates with
a subhorizontal reflector in the NW–SE-striking
EUROBRIDGE’96 profile. We suggest that this
reflector is the mantle expression of the suture
between Sarmatia and Volga–Uralia or a mantle
shear zone related to later tectonic processes.
8. The sub-Moho mantle has very high seismic
velocity along most of the profile, with the
exception of a 200-km-wide belt above the dipping
mantle reflector.
Acknowledgements
This work was carried out as part of the EURO-
BRIDGE project within the framework of EUROP-
ROBE (ILP/ESF) and IGCP Project 371 COPENA
(‘‘Structure and Correlation of the Precambrian in NE
Europe and the North Atlantic Realm’’).
The authors offer their sincere thanks to the many
people and organisations from Belarus, Denmark,
Finland, Germany, Poland, Sweden, Ukraine and the
United Kingdom who have contributed to EURO-
BRIDGE’97, especially the observers and technical
experts who participated in the field work and data
processing. The seismic reflection line in Figs. 3 and
10 was kindly provided by C. Juhlin (Uppsala) and R.
Stephenson (Amsterdam). Instructive comments to
earlier versions of the text by Dr. A. Ross and Dr. L.
Nielsen (Copenhagen) and Dr. S. Bogdanova (Lund)
are gratefully acknowledged. Drs. N. Pavlenkova, R.
Stephensson and an anynomous reviewer are ac-
knowledged for their suggestions.
Financial support for EUROBRIDGE’97 was
provided by the Danish Natural Science Research
Council, Academy of Finland, Deutsche Forschungs-
gemeinschaft, Institute of Geophysics PAS (Poland),
and other organisations.
We gratefully acknowledge the loan of seismo-
graphs from the Geophysical Instrument Pool at GFZ
Potsdam and from the NERC Geophysical Equipment
Pool. J. Hall (Memorial University, Canada) kindly
provided economical support to the participation of B.
Doody in the field work. Timing equipment for some
shots was provided by Polish Oil and Gas Company
and Geophysical Enterprise in Torun. The public
domain GMT software (Wessel and Smith, 1995) was
used to produce many of the figures.
References
Abramovitz, T., Berthelsen, A., Thybo, H., 1997. Proterozoic su-
tures and terranes in the southeastern Baltic interpreted from
BABEL deep seismic data. Tectonophysics 270, 259–277.
Abramovitz, T., Thybo, H., MONA LISA Working Group, 1998.
Seismic structure across the Caledonian deformation front along
MONA LISA profile 1 in the southeastern North Sea. Tectono-
physics 288, 153–176.
Aizberg, R.E., Garetsky, R.G., Klushin, S.V., Levkov, E.A., 1987.
Deep structure and geodynamic of the Pripyat palaeorift and its
frame. Actual Problems of Tectonic of Oceans and Continents,
pp. 200–211. Moscow (in Russian).
Aksamentova, N.V., 1990. Tectonic of the basement. Tectonic of the
west of the eastern European platform. In: Garetsky, R.G. (Ed.),
Science and Technology, Minsk, pp. 13–24 (in Russian).
BABEL Working Group (Baltic and Bothnian Echoes from the
Lithosphere), 1990. Early Proterozoic plate tectonics: evidence
from seismic reflection profiles in the Baltic Shield. Nature 348
(6296), 34–38.
BABEL Working Group, 1993. Deep seismic reflection/refrac-
tion interpretation of the crustal structure along BABEL pro-
files A and B in the southern Baltic Sea. Geophys. J. Int.
112, 325–343.
Belinsky, A.A., Boborykin, A.M., Klushin, S.V., et al., 1984. Meth-
ods of increasing the effectiveness of seismic research in the
Pripyat Trough—methods and results of geological and geo-
physical search for oil and gas in the Pripyat Trough. Science
and Technical Report, pp. 5–16. Minsk.

H. Thybo et al. / Tectonophysics 371 (2003) 41–7978
Bogdanova, S.V., Pashkevich, I.K., Gorbatschev, R., Orlyuk, M.I.,
1996. Riphean rifting and major Palaeoproterozoic boundaries
in the East European Craton: geology and geophysics. Tectono-
physics 268, 1–21.
Bogdanova, S.V., Gorbatschev, R., Stephenson, R.A., Guterch,
A. (Eds.), 2001. EUROBRIDGE: Palaeoproterozoic Accretion
of Fennoscandia and Sarmatia. Tectonophysics, vol. 339,
pp. 1–237.
Bucharev, V.P., 1992. Evolution of Precambrian magmatism in the
western part of the Ukrainian Shield, Kiev. Naukova Dumka
151 (in Russian).
Cerveny, V., Psencık, I., 1983. SEIS83-numerical modelling of
seismic wave fields in 2-D laterally varying layered structure
by the ray method. In: Engdahl, E.R. (Ed.), Documentation of
Earthquake Algorithm. World Data Centre A for Solid Earth
Geophysics, Boulder, pp. 36–40. Re. SE-35.
Christensen, N.I., 1996. Poisson’s ratio and crustal seismology. J.
Geophys. Res. 101, 3129–3156.
Dovbush, T.I., Skobelev, V.M., Stepaniuk, L.M., 2000. Investiga-
tion of Precambrian rocks of the western part of the Ukrainian
Shield by Sm–Nd isotopic method. Mineral. Z. 22, 132–142
(in Russian).
EUROBRIDGE Seismic Working Group, 1999. Seismic velocity
structure across the Fennoscandia–Sarmatia suture of the East
European Craton beneath the EUROBRIDGE profile through
Lithuania and Belarus. Tectonophysics 314, 193–217.
EUROBRIDGESeismicWorking Group, 2001. EUROBRIDGE’95:
deep seismic profiling within the East European Craton. Tecto-
nophysics 339, 153–175.
Garetsky, R.G., Klushin, S.V., 1989. Listric faults into the Pripyat
palaeorift. Geotectonic N1, 48–60 (in Russian).
Grad, M., 1992. Seismic structure of the sub-crustal continental
lithosphere. Phys. Earth Planet. Inter. 69, 224–230.
Grad, M., Luosto, U., 1987. Seismic models of the crust of the
Baltic Shield along the SVEKA profile in Finland. Ann. Geo-
phys. 5B, 639–650.
Grad, M., Tripolsky, A.A., 1995. Crustal structure from P and S
seismic waves and petrological models of the Ukrainian shield.
Tectonophysics 250, 89–112.
Grad, M., Keller, G.R., Thybo, H., Guterch, A., POLONAISE
Working Group, 2002. Lower lithospheric structure beneath
the trans European Suture Zone from POLONAISE’97 seismic
profiles. Tectonophysics 360, 153–168.
Hole, J.A., 1992. Nonlinear high-resolution three-dimensional seis-
mic travel time tomography. J. Geophys. Res. 97, 6553–6562.
Ilchenko, T.V., 1985. A technique for determining velocity struc-
ture from traveltimes along DSS profiles. Geofiz. Z. 7 (1),
59–66.
Ilchenko, T.V., Kaluzhnaya, L.T., 1998. The Earth’s crust and upper
mantle of the Volhyn Block and Korosten Pluton (north–West
of the Ukrainian Shield) from detailed DSS profiling. Geofiz. Z.
20 (4), 81–82.
Juhlin, C., Stephenson, R.A., Klushin, S., 1996. Reappraisal of
deep seismic reflection profile VIII across the Pripyat Trough.
Tectonophysics 268, 99–108.
Karatayev, G.I., Girin, R.E., Dankevich, I.V., 1993. Geophysical
Models of the Earth’s Crust of Belarus–Baltic Region Institute
of Geological Sciences of Academy of Sciences of Belarus,
Minsk (in Russian).
Kern, H., Popp, T., Gorbatsevich, F., Zharikov, A., Lobanov, K.V.,
Smirnov, Yu.P., 2001. Pressure and temperature dependence of
Vp and Vs in rocks from the superdeep well and from surface
analogues at Kola and the nature of velocity anisotropy. Tecto-
nophysics 338, 113–134.
Komminaho, K., 1998. Software manual for programs MODEL and
XRAYS—a graphical interface for SEIS83 program package.
University of Oulu, Department of Geophysics, Report No. 20.
Kozlovskaya, E., Taran, L.N., Yliniemi, J., Giese, R., Karatayev,
G.I., 2002. Deep structure of the crust along the Fennoscandia–
Sarmatia Junction Zone (central Belarus): results of a geophys-
ical–geological integration. Tectonophysics 358, 97–120.
Kusznir, N.J., Stovba, S.M., Stephenson, R.A., Poplavskii, K.N.,
1996. The formation of the northwestern Dniepr–Donets Basin;
2-D forward and reverse syn-rift and post-rift modelling. Tecto-
nophysics 268, 237–255.
Lesnaya, I.M., Plotkina, T.E., Stepanyuk, L.M., Bartnitsky, Ye.N.,
1995. Age stages of formation of the mafic–enderbite assem-
blage of the Near Bug Region Geochemistry and Ore Forma-
tion. Naukova Dumka 21, 56–69 (in Russian).
Meissner, R., 1986. The continental crust: a geophysical approach.
International Geophysical Series, vol. 34. Academic Press, New
York.
Mengel, K., Kern, H., 1992. Evolution of the petrological and
seismic Moho—implications for the continental crust –mantle
boundary. Terra Nova 4, 109–116.
Molotova, L.W., Vasilev, J.I., 1960. On the ratio value of P- and S-
waves in the rocks. Izv. Akad. Nauk SSSR, Ser. Geofiz. 8,
1097–1116 (in Russian).
Musacchio, G., Mooney, W.D., Luetgert, J.H., Christensen, N.I.,
1997. Composition of the crust in the grenville and Appalachian
provinces of North America inferred from Vp/Vs ratios. J. Geo-
phys. Res 102, 15225–15241.
Ryberg, T., Fuchs, K., Egorkin, A.V., Solodilov, L., 1995. Obser-
vation of high-frequency teleseismic Pn on the long-range
QUARTZ profile across northern Eurasia. J. Geophys. Res.
100, 18151–18163.
Shcherbak, N.P., Artemenko, G.V., Bartnitsky, Ye.N., et al., 1989.
Geochronological scale of the Precambrian of the Ukrainian
Shield. Naukova Dumka 144 (in Russian).
Skobelev, V.M., Yakovlev, B.G., Galiy, S.A., et al., 1991. Petro-
genesis of nickel-bearing gabbroic intrusions of the Volynsky
megablock of the Ukrainian. Naukova Dumka 140 (in Russian).
Sollogub, V.B., 1982. The structure of the lithosphere of the Uk-
raine. Geofiz. Z. 4 (4), 3–25 (in Russian).
Sroda, P., and POLONAISE Profile P3 Working Group, 1999. P-
and S-wave velocity model of the southwestern margin of the
Precambrian East European Craton; POLONAISE’97, profile
P3. Tectonophysics 314, 175–192.
Steer, D.N., Knapp, J.H., Brown, L.D., 1988. Super-deep reflection
profiling: exploring the continental mantle lid. Tectonophysics
286, 111–121.
Stepanyuk, L.M., Bibikova, E.B., Claesson, S., Stein, H.J., Bogda-
nova, S.V., Skobelev, V.M., 1999. Geochronological and petro-
logical evidence for far-field effects of 2.1–2.0 Ga convergent

H. Thybo et al. / Tectonophysics 371 (2003) 41–79 79
tectonics in the western Ukrainian Shield. Abstracts of the Sev-
enth EUROBRIDGE Workshop, pp. 80–83.
Stephenson, R.A., Stovba, S., Starostienko, V., 2001. Pripyat –
Dniepr –Doniec Basin: implications for dynamics of rifting
and the tectonic history of the northern Peri_Tethyan Platform.
In: Ziegler, P.A., Cavazza, W., Robertson, A.H.F., Crasquin-
Soleau, S. (Eds.), Peri_Thethys Memoir 6: Peri-Tethyan Rift/
Wrench Basins and Passive Margins. Memoires du Museum
National d’Historie Naturelle, vol. 186, pp. 369–406.
Thybo, H., Perchuc, E., 1997. The seismic 8 degree disconti-
nuity and partial melting in continental mantle. Science 275,
1626–1629.
Thybo, H., Maguire, P., Birt, C., Perchuc, E., 2000. Seismic reflec-
tivity of the lower crust and magmatic underplating beneath the
Kenya Rift. Geophys. Res. Lett. 27, 2745–2749.
Verkhogliad, V.M., 1995. Age stages of magmatism of the Korosten
pluton. Geochemistry and ore formation. Naukova Dumka 21,
70–84 (in Russian).
Wessel, P., Smith, W.H.F., 1995. New version of the Generic
Mapping Tools released. EOS Trans.-Am. Geophys. Union
76, 329.
Wilson, M., Lyashkevich, Z.M., 1996. Magmatism and the geody-
namics of rifting of the Pripyat –Dnieper –Donats rift, East
European Platform. Tectonophysics 268, 65–81.
Wybraniec, S., Zhou, S., Thybo, H., Forsberg, R., Perchuc, E., Lee,
M., Demianov, G.D., Strakhov, V.N., 1998. New map compiled
of Europe’s gravity field. EOS Trans.-Am. Geophys. Union 79
(37), 437–442.
Zelt, C.A., Barton, P.J., 1998. Three-dimensional seismic refraction
tomography: a comparison of two methods applied to data from
the Faeroe Basin. J. Geophys. Res. 103, 7187–7210.