Updated End Use Market Analysis Report v12 - State of ...
65
0 September 2016 DRAFT FINAL REPORT MICHIGAN RECYCLING ENDUSE MARKET SURVEY AND RECOMMENDATIONS COMMISSIONED BY: MICHIGAN DEPARTMENT OF ENVIRONMENTAL QUALITY PREPARED BY: 416 LONGSHORE DRIVE ANN ARBOR, MI 48105 734.996.1361 RECYCLE.COM Microsoft
-
Upload
khangminh22 -
Category
Documents
-
view
1 -
download
0
Transcript of Updated End Use Market Analysis Report v12 - State of ...
0
September 2016
DRAFT FINAL REPORT
MICHIGAN RECYCLING END-‐USE MARKET SURVEY AND RECOMMENDATIONS
COMMISSIONED BY: MICHIGAN DEPARTMENT OF ENVIRONMENTAL QUALITY
PREPARED BY:
416 LONGSHORE DRIVE ANN ARBOR, MI 48105 734.996.1361 RECYCLE.COM
Microsoft

1

2
TAB L E O F CONTENTS
Table of Contents ............................................................................................................................................. 2
Executive Summary .......................................................................................................................................... 3
Background and Purpose .................................................................................................................................. 9
Methodology .................................................................................................................................................. 12
MRF Interview and Market Survey Findings .................................................................................................. 18
Economic Analysis .......................................................................................................................................... 29
Recommendations .......................................................................................................................................... 37
Appendix A: Major Michigan End Markets .................................................................................................... 53
Appendix B: NAICS Codes ............................................................................................................................... 57
3
MICHIGAN RECYCL ING END-‐USE MARKET SURVEY AND
RECOMMENDATIONS
EXECUT I V E SUMMARY OVERVIEW
The Michigan Department of Environmental Quality (MDEQ) hired RRS to conduct an analysis of end-‐use markets in Michigan for recycled commodities including paper, metal, glass, plastic and organics through residential recycling programs, commercial recycling and industrial recycling systems. This end-‐use market analysis was combined with a market survey to gather information on the actual and perceived market drivers, barriers and opportunities for market expansion for various commodities in Michigan. RRS conducted this analysis through the following four steps:
1. Interviews of material recovery facility (MRF) operators
2. Market survey
3. An economic analysis, infrastructure investment and the recycling business case
4. Development of recommendations
Results will be used to inform decision making around efforts to increase recycling rates in the state and transition to a system of sustainable materials management whereby the focus is placed on the management of materials throughout their lifecycles as opposed to solely at end of life.
METHODOLOGY
During the first phase of this project, RRS gathered information through a series of interviews with MRF operators in Michigan. The MRFs that responded to the survey represented between 40% and 60% of throughput in Michigan. To conduct the market survey in the second phase, RRS interviewed experts in the field of end-‐use markets for recyclable materials. These interviewees represent a range of expertise in end-‐use markets, including brokers who buy and sell multiple commodities, glass recyclers, metal recyclers,

4
plastic recyclers, composting operations, paper mills, users of recycled commodities, and national recycling organizations. In the third phase, RRS staff conducted a macro-‐level economic analysis of the recycling, reuse, and recovery (RRR) economy in the state. The analysis utilized peer reviewed methodology and the impact analysis for planning (IMPLAN) modeling system to estimate the degree of RRR activity that makes use of locally generated recovered materials to create jobs and provide economic benefits to local economies of employment in Michigan. We incorporated, where appropriate, RRS’ own confidential data and metrics to verify and enhance the overall economic analysis and inform the development of recommendations. This analysis included a detailed evaluation of the required infrastructure investment for reaching recycling rates of 30% and higher – and the recycling business case for approaches that make that infrastructure investment possible. Finally, RRS and The Recycling Partnership met to discuss the findings of the three previous tasks and to collaborate on making a set of recommendations for MDEQ.
F INDINGS OF MRF OPERATOR INTERVIEWS AND MARKET SURVEYS
Results from the MRF operator interviews and market surveys were organized into 13 categories:
1. End-‐User Consistency 2. Factors Influencing the Ability of MRFs to Move Material 3. Destination of commodities (in state or out of state) 4. Processing Capacity (MRF capacity, re-‐processing capacity) 5. Strength of the Michigan marketplace 6. Weaknesses of the Michigan marketplace 7. Contamination and Material Quality 8. Education 9. Enforcement 10. Special Topic: Glass 11. Special Topic: Recycled Products 12. The future of recycling 13. Respondent Recommendations
MRF operators who participated in this study found consistency in who purchases their materials. They also felt there were many factors that influence commodity purchases, but that one primary impact is price. Strong relationships between MRFs and their commodity buyers were seen as an asset to the recycling markets overall. Experts interviewed for the market survey discussed a range of issues, including capacity of Michigan processors to accept additional materials, the strengths and weaknesses of Michigan’s

5
end-‐use markets, how the global economy affects Michigan recycling, contamination issues, and others. These experts also provided their own recommendations for MDEQ, including policy recommendations that have been taken into consideration in developing the report recommendations.
ECONOMIC ANALYS IS OVERVIEW AND RECYCL ING BUSINESS CASE
RRS’ economic analysis found that the RRR economy results in 35,954 direct jobs in the state of Michigan with a total annual labor income of $2,641,571,424. When the indirect and induced labor impacts are included, the industry has an impact of 93,722 jobs and a labor income of $5,710,439,086. If the 93,722 jobs created by the industry were all in the same city, it would be the eleventh largest city in the state. The direct economic output of the RRR industry in the state is $14,762,338,773 and the total economic output (including indirect and induced effects) is $24,328,780,057. Table 1 shows these results, while Figure 1 depicts them visually.
Table 1: Direct, Indirect, Induced and Total Impacts of RRR in Michigan
Impact Type Employment Labor Income Total Value Added
Output
Direct Effect 35,954 $2,641,571,424 $4,549,103,668 $14,762,338,773
Indirect Effect 28,873 $1,818,185,685 $2,793,190,821 $5,665,323,102
Induced Effect 28,894 $1,250,681,977 $2,191,859,363 $3,901,118,181
Total Effect 93,722 $5,710,439,086 $9,534,153,852 $24,328,780,057
Figure 1: Economic Benefits of Recycling in Michigan
6
Overall, the RRR industry accounts for 1.73% of the total employment in Michigan and 2.56% of the state’s total economic output. The benefit cost ratio for the direct economic output of the RRR industry in Michigan is 11.4, and the benefit cost ratio for the total economic output is 18.7. In simplified terms, this means that for every $1 of investment (cost) in Michigan, the RRR provides $11.40 in direct economic output benefits and $18.70 in total economic output benefits.
The RRR, despite its significant role in Michigan’s economy, currently is diverting only 15% of Michigan’s commercial and residentially generated recyclables. There is significant room for improvement, based on experience in leading states across the county. In April 2014, Governor Rick Snyder announced a statewide recycling initiative to double the state’s recycling rate to 30%. This will require the implementation of a coherent infrastructure modernization that guarantees the percentage of recycling increases in a compressed timeframe and ensures that the recycling rate will continue to grow.
Analysis is projecting that the total investments necessary to increase Michigan’s recycling rate to the 30% to 50% range would include infrastructure development in the recycling processing and end markets, collection containers and vehicles, and support services. This recycling infrastructure investment is anticipated to total in the range of $600 to $700 million USD in one-‐time costs – most of which will be made as part of private and public sector service provider investment.
The annualized operating cost associated with the investment (including amortization of that investment) is projected at approximately $217M. There are off-‐sets to these costs, however, as shifting economies of scale and avoided costs in the current situation are realized through the recycling infrastructure investment. The net impact of the operational costs for the recycling infrastructure investment are approximately $115M per year. This represents less than a 9% increase in the $1.3B that has been calculated as Michigan’s current annual spend – while increasing overall diversion and transitioning from a linear “make, use, dispose” economy to the circular economy of sustainable materials management – with diversion approaching 50% -‐ up from our current 15% level.
RECOMMENDATIONS OVERVIEW
Based on the analysis, RRS and the Recycling Partnership developed the following 10 recommendations to support end-‐use markets in Michigan and to move Michigan towards a sustainable materials management system. The summary of recommendations below is organized around the recommended timeline for implementation. This section contains abbreviated recommendations; a full explanation of recommendations can be found in the Recommendations section of this report.
7
WITHIN THE NEXT THREE TO NINE MONTHS
1. Provide Additional Staff Training
In order to carry out any of the subsequent recommendations with success, MDEQ must invest in the education and training of their staff, specifically their Recycling Specialists that provide field assistance to local governments and community members across the state. It is recommended the Recycling Specialists engage with peers in other state agencies, The Recycling Partnership’s State Leaders Group, and other states employing recycling BMPs.
2. Set Goals for Michigan and Track Performance
Achievement of Governor Snyder’s goal to increase the state’s residential recycling rate to 30% should continue to be a priority, however, MDEQ should also work to integrate incremental goal setting into all aspects of state government, including at the local government level.
WITHIN THE NEXT YEAR
3. Share Data on Recycling Metrics
MDEQ should share data from the repository of information gathered due to SB507, enabling benchmarking of Michigan’s progress against previous years and other states, as well as allowing data access to private sector and local governments.
4. Continue to Assess the State of End-‐Use Markets at Regular Intervals
We recommend that MDEQ conduct a comprehensive census of manufacturers who currently or could potentially consume recyclable feedstocks and maintain a regular survey to identify current and potential consumers of recyclable feedstocks in Michigan and the region.
5. Collaborate with Economic Development Agencies to Connect Stakeholders
MDEQ can empower regional economic development agencies – chambers of commerce and economic development corporations – to make connections between communities that create a supply of materials, facilities that sort materials, and processors and manufacturers that use recycled commodities.
6. Develop a Substantive and Continual Education and Outreach Program
Michigan leaders must make a lasting, substantial and consistent investment in education and outreach that engages residents, front line staff, elected officials, and business and industry. This education and outreach program should have two main areas of focus: 1) developing and disseminating education and outreach tools that drive behavior change, not just ways to build
8
awareness; and 2) supporting Michigan’s communities in managing contamination in recycling streams to avoid conflicts with MRF contracts.
7. Embrace and Leverage National Brands, Associations and Agencies Seeking Sustainable Materials Management
The MDEQ should consider active participation and funding of events and projects that might foster increased investment and activity by these groups.
WITHIN THE NEXT 18 MONTHS
8. Institute a Recycling Business Grant Program
The MDEQ should create and fund a program that would provide partial or matching grant funding directly to recycling businesses that are involved in the collection, processing or end use of materials in the solid waste stream, enabling smart, prioritized infrastructure improvements across the state.
9. Encourage Private Investment in State Recycling by Leveraging New Financial Mechanisms
MDEQ and its partner state organizations (e.g. Michigan Economic Development Corporation) should encourage private investment in building recycling and organics processing infrastructure in Michigan from partners with an interest in the supply chain. Collection infrastructure and transportation are weaknesses in Michigan’s recycling end markets; RRS and The Recycling Partnership recommend that the state offer a set of incentives to encourage private investments in recycling, including tax credits, low interest bonds or loans, or other financial mechanisms. The state should also consider designating “Recycling Market Development Zones” to incubate innovation in recycling.
WITHIN TWO TO FIVE YEARS
10. State Seed Funding to Leverage Investments in Recycling and Organics Infrastructure
State government should provide seed funding to leverage the necessary private and public sector investments in investments that will maximize both the capture rate for recyclables and organics and the quality of those materials.
9
BACKGROUND AND PURPOSE At the onset of this project, there was a lack of information about the diversity, strengths and weaknesses of end-‐use markets for recycled materials in Michigan. The Michigan Department of Environmental Quality (MDEQ) sought to fill this gap through an analysis of end-‐use markets. MDEQ hired RRS to conduct an analysis of end-‐use markets in Michigan for recycled commodities including paper, metal, glass, plastic and organics through residential recycling programs, commercial recycling and industrial recycling systems. The learnings will help inform decision making in order to increase recycling and move Michigan towards a sustainable materials management system that optimizes the flow of materials throughout their lifecycles.
CURRENT STATE OF RECYCL ING IN MICHIGAN
One estimate of the current state of recycling was developed as part of a project in Michigan called Recycle by Design. This estimate found that the total annual volume of residential and commercial waste generated in Michigan in 2014 was approximately 10.4 million tons. This figure is based on a volume of residential waste of 6.8 million tons, 3.2 million tons of commercial waste, 0.25 million tons of take-‐back recovery, and 0.62 million tons of deposit recovery.
The current amount of waste that is being recycled is approximately 1 million tons per annum. This volume consists of composted organic materials (378,000 tons), curbside recyclables (411,000 tons) and drop-‐off recyclables (266,000 tons). For the purpose of Recycle by Design, the take-‐back recovery and deposit recovery volumes are excluded from the 1 million tons.
The 1 million tons of recycled materials calculates a recycling rate of 11%. If take-‐back and container deposit volumes are included, the recycling rate for Michigan reaches 15%.

10
Table 2 on the following page summarizes the residential and commercial waste flows through Michigan’s existing infrastructure of collection, transfer, end disposition and residuals management.

11
Table 2: Material Flow Pathways
Material Flow Pathways Current Tons
Waste Direct Haul to Landfill 5,643,178 Waste Via Transfer Station to Landfill 2,418,505 Waste Direct Haul to WtoE 617,367 Waste Via Transfer Station to WtoE 264,586 Organics Direct Haul to Compost 264,668 Organics Via Transfer Station to Compost 113,429 Curbside Recyclables Direct Haul to MRF 288,077 Curbside Recyclables Via Transfer to MRF 123,462 Drop-‐off Recyclables Direct Haul to MRF 185,959 Drop-‐off Recyclables Via Transfer to MRF 79,697 Total 9,998,927
Source – Recycle by Design Analysis (RRS/IMG Rebel) Note – take back and container deposit tonnage not included
The figure on the following page depicts the flow of materials through the Michigan waste system using the data provided by Recycle by Design. Figure 2 on the next page illustrates the pathways from generation of the waste material to the point of disposal. This figure approximates the proportion of materials entering each of the separate pathways.Figure 2
Once designated recyclables are collected in Michigan and sorted by area MRFs, they are sold to brokers and re-‐processors in and around Michigan. The markets that use the materials collected from residential recycling programs, commercial recycling programs and industrial recycling systems in Michigan are a diverse set of organizations that span across the state. End markets in Michigan exist in each of the major commodity categories, specifically paper; PET, HDPE, and polypropylene plastics; glass; and metals. A full list of major end markets in the state of Michigan is shown in Appendix A.
Figure 2 also shows an estimate of the proportion of recyclable materials as they move from Michigan through a variety of end markets, both in and outside of Michigan. The proportions shown in this figure are based on educated assumptions, and the reality of the marketplace is most likely different than what is shown here.

12
Figure 2: Waste Pathways
METHODOLOGY The end-‐use market analysis consisted of interviews with MRF operators, a market survey, an economic analysis that included estimated of the required infrastructure investment and the recycling business case for that investment, and finally, recommendations developed in a collaboration between RRS and the Recycling Partnership that support end-‐use markets in Michigan and move Michigan towards a sustainable materials management system.
MRF INTERVIEWS
The first step in the end-‐use market analysis was a survey of MRFs in the state of Michigan. RRS contacted 43 MRF operators in Michigan – to the best of the study team’s knowledge, the complete list of MRFs in Michigan -‐-‐ and requested their participation in the survey. RRS team members contacted MRFs using email and phone calls. We attempted to reach each MRF multiple times. Interviews were conducted using phone calls or email, depending on the preference of the MRF.
13
The goal of the interviews was to identify the types of commodities the MRFs commonly sell, to which end markets the MRFs sell their commodities, the consistency of their markets, and what factors impact to whom MRFs sell their commodities.
MARKET SURVEY
To supplement the MRF interviews and gather information specific to the selling of materials once the MRF has processed them and the use of the materials in remanufacturing, RRS interviewed 16 experts in the field of recycling markets. These interviewees represent a range of expertise in end-‐use markets, including MRF operators, brokers who buy and sell multiple commodities, glass recyclers, metal recyclers, plastic recyclers, composting operations, paper mills, users of recycled commodities, and national recycling organizations. Of the end-‐use market experts interviewed, 10 participate directly in the Michigan marketplace by selling or purchasing commodities processed in Michigan. Two experts are in end-‐use markets who do not currently participate in the Michigan marketplace. The remaining four experts have a broader, national expertise with end-‐use markets and do not buy or sell materials. The goal of the market survey was to reveal actual and perceived market drivers, barriers and opportunities for market expansion for various commodities in Michigan.
ECONOMIC ANALYS IS AND RECYCL ING BUSINESS CASE
To conduct the economic analysis, RRS followed the published and peer reviewed methodology incorporated by three statewide reports and one regional report. The four reports are:
• ENVIRON International Corporation for the Colorado Department of Public Health and Environment. Economic Study of Recycling in Colorado. November 17, 2014.
• SAIC for the Houston-‐Galveston Area Council. The Economic Contribution of the Recycling Industry to the Houston-‐Galveston Region. May 2013.
• Valentine, David, and Ann Ulmer. Missouri Recycling Economic Information Study MOREIS. Prepared by the University of Missouri Institute of Public Policy for the Environmental Improvement and Energy Resources Authority. January 20, 2005.
• The National Recycling Coalition in association with R.W. Beck, Inc. for the Florida Department of Environmental Protection. Florida Recycling Economic Information Study. June 2000.
In order to gather a complete picture of the RRR industry in Michigan, the economic study included the impacts of both supply and demand side activities in the state. On the supply side, the study

14
included the impacts of all activities involved in collecting, processing, selling, and using recovered items in the state. On the demand side, the study included all activities up to the first point in which the materials are used or products have been completed. Following the methodology of the four previous reports listed above, the study excluded advocacy, education and other organizations or individuals that do not directly add value to the recovered items. The study also excluded waste to energy, incineration, refuse derived fuel and combustion activities. RRS reviewed North American Classification System (NAICS)1 information from the 2012 U.S. Economic Census as well as the NAICS codes and businesses identified in other state studies to identify the businesses involved in RRR in Michigan. The following business activities were considered in the research:
• Businesses and organizations involved in the collection and transportation of RRR materials, including both private and public sector collectors;
• Intermediate processing of recovered scrap materials or reused products and items, including activities such as sorting and cleaning as well as disassembling, consolidating, composting and densifying;
• Reclaiming materials used for manufacturing inputs;
• Manufacturing of products using recovered materials;
• Wholesale or retail establishments selling used, recovered or reclaimed materials; and
• Businesses supporting the industries above through research, consulting, equipment sales, engineering and brokering.
The complete list of NAICS codes, business classifications, and the NAICS description of the classifications included in the study can be found in Appendix B of this report. The table includes businesses directly involved in the RRR business (collection, processing, and recovery), businesses involved in reuse and remanufacture, and businesses involved in resale of RRR materials. Unlike the previously referenced studies completed in other states, the economic analysis for the state of Michigan did not use direct industry surveys to estimate the impact of RRR on the state’s economy. Due to budget and scope limitations, RRS staff instead focused efforts on the NAICS data, previously published reports, trade journals, interviews with industry experts, and interviews with trade organizations to gather the economic model inputs. While this data limitation does decrease the accuracy of the model outputs, it should be noted that the primary data used by the published reports from other states was in some cases limited, and industry experts and secondary data sources were relied upon to estimate model inputs.
1 NAICS codes are the standard federal classification for business establishments in the United States and are used to publish statistical data on employment in the U.S.

15
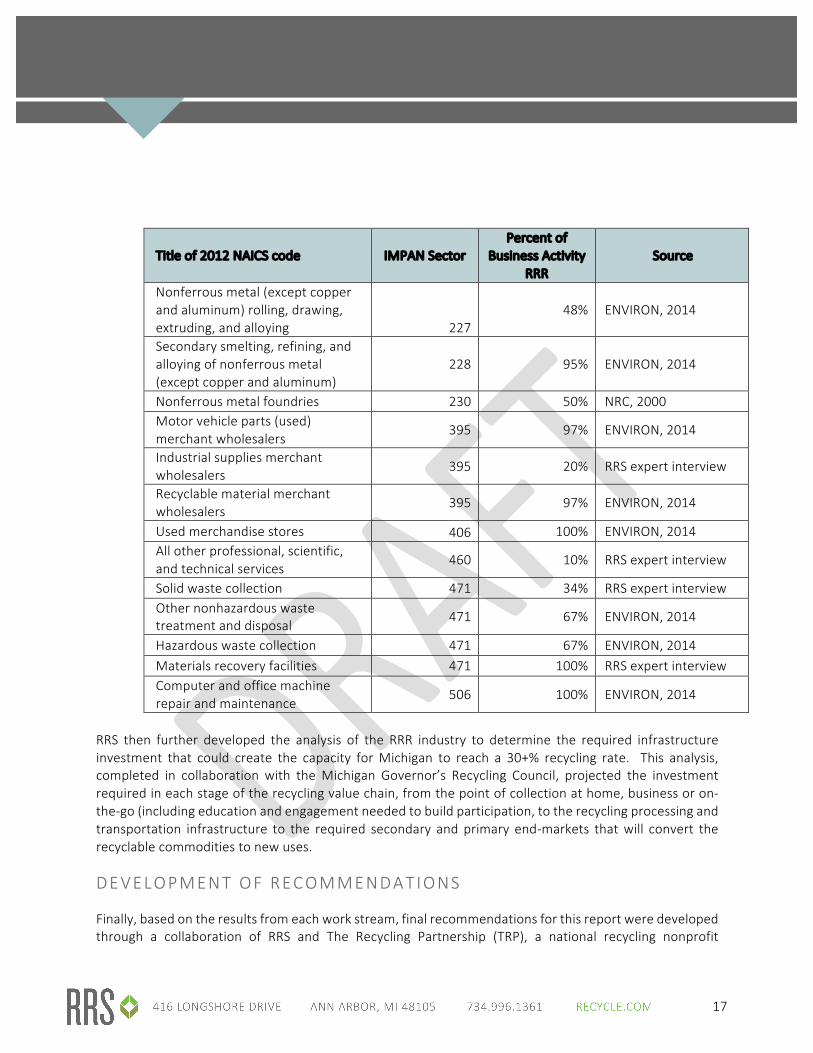
The impact analysis was conducted using the input / output model IMPLAN (IMpact analysis for PLANning).2 IMPLAN is a widely accepted model that uses an input-‐output dollar flow table to account for all dollar flows between sectors in the economy. The model uses national and local industry data to estimate the total economic implications of certain economic scenarios. The embedded IMPLAN data was for the year 2014 and was the primary source of economic data for the model. RRS used secondary research to determine the number of employees directly engaged in RRR activities in the state and estimate what percentage of a sector’s business activity is related to RRR for each of the NAICS codes. For instance, while there are multiple paper mills in the state, 100% of the activity at 100% of the paper mills is not directly related to RRR. In fact, only a portion of the activities at the paper mills directly use recovered fiber as inputs in their process, thus the impact of paper mills on the state’s economy needed to be discounted by the percentage of the business activity that is not related to RRR. When there was an option to choose from multiple data sources for the recycling factor, RRS staff chose the more conservative from the published reports so as to avoid overstating the impacts in the state. Table 3 displays the NAICS sectors, the associated IMPLAN sector,3 the percent share of business activity related to the recycling industry used in the model, and the source of the data.
Table 3: RECYCLING ACTIVITY FACTORS AND IMPLAN SECTORS
Title of 2012 NAICS code IMPAN Sector Percent of
Business Activity RRR
Source
Wood container and pallet manufacturing
142 56% RRS expert interview
Pulp mills 146 43% NRC, 2000 Paper mills 147 43% NRC, 2000 All other converted paper product manufacturing 153 100% ENVIRON, 2014
Asphalt paving mixture and block manufacturing
157 100% ENVIRON, 2014
Fertilizer (mixing only) manufacturing
171 13% ENVIRON, 2014
2 IMPLAN is the same model used in the Colorado, Missouri, Houston and Florida economic impact studies. 3 The IMPLAN sector names do not always match up with the NAICS Codes, and more than one NAICS code could be grouped in an IMPLAN Sector based on similarities in the business activity.
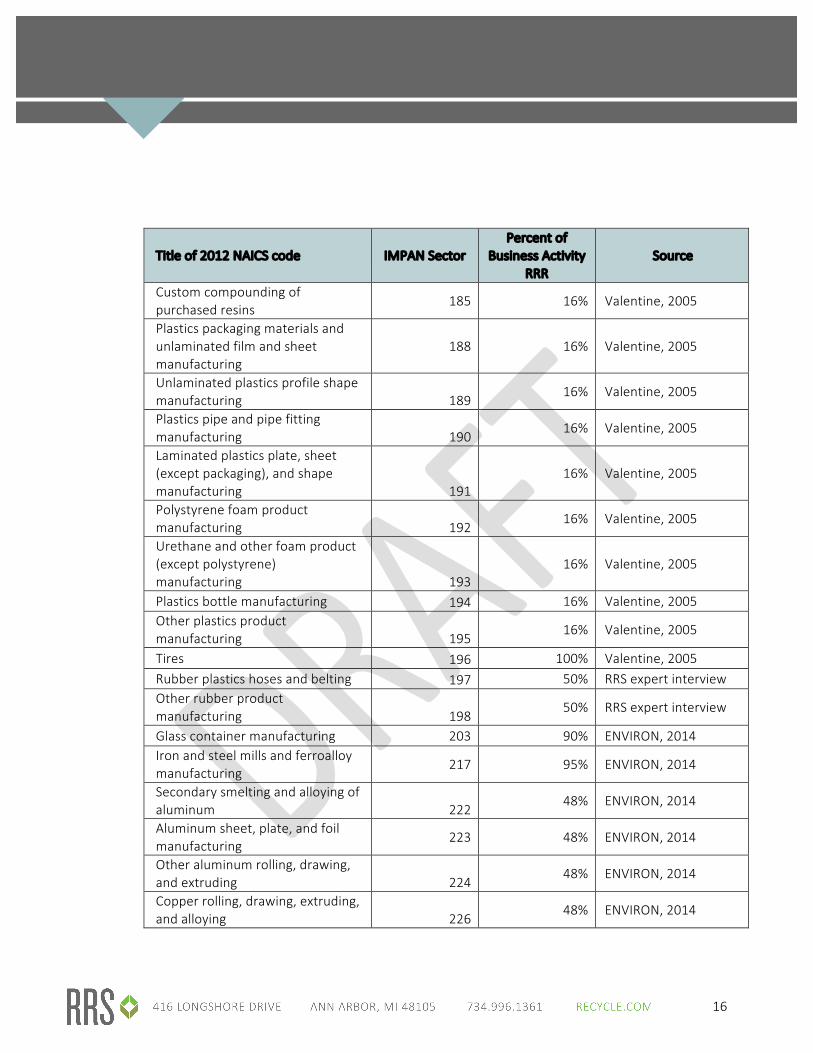
16
Title of 2012 NAICS code IMPAN Sector Percent of
Business Activity RRR
Source
Custom compounding of purchased resins
185 16% Valentine, 2005
Plastics packaging materials and unlaminated film and sheet manufacturing
188 16% Valentine, 2005
Unlaminated plastics profile shape manufacturing 189
16% Valentine, 2005
Plastics pipe and pipe fitting manufacturing 190
16% Valentine, 2005
Laminated plastics plate, sheet (except packaging), and shape manufacturing 191
16% Valentine, 2005
Polystyrene foam product manufacturing 192
16% Valentine, 2005
Urethane and other foam product (except polystyrene) manufacturing 193
16% Valentine, 2005
Plastics bottle manufacturing 194 16% Valentine, 2005 Other plastics product manufacturing 195
16% Valentine, 2005
Tires 196 100% Valentine, 2005 Rubber plastics hoses and belting 197 50% RRS expert interview Other rubber product manufacturing 198
50% RRS expert interview
Glass container manufacturing 203 90% ENVIRON, 2014 Iron and steel mills and ferroalloy manufacturing
217 95% ENVIRON, 2014
Secondary smelting and alloying of aluminum 222
48% ENVIRON, 2014
Aluminum sheet, plate, and foil manufacturing
223 48% ENVIRON, 2014
Other aluminum rolling, drawing, and extruding 224
48% ENVIRON, 2014
Copper rolling, drawing, extruding, and alloying 226
48% ENVIRON, 2014
17
Title of 2012 NAICS code IMPAN Sector Percent of
Business Activity RRR
Source
Nonferrous metal (except copper and aluminum) rolling, drawing, extruding, and alloying 227
48% ENVIRON, 2014
Secondary smelting, refining, and alloying of nonferrous metal (except copper and aluminum)
228 95% ENVIRON, 2014
Nonferrous metal foundries 230 50% NRC, 2000 Motor vehicle parts (used) merchant wholesalers
395 97% ENVIRON, 2014
Industrial supplies merchant wholesalers
395 20% RRS expert interview
Recyclable material merchant wholesalers
395 97% ENVIRON, 2014
Used merchandise stores 406 100% ENVIRON, 2014 All other professional, scientific, and technical services
460 10% RRS expert interview
Solid waste collection 471 34% RRS expert interview Other nonhazardous waste treatment and disposal
471 67% ENVIRON, 2014
Hazardous waste collection 471 67% ENVIRON, 2014 Materials recovery facilities 471 100% RRS expert interview Computer and office machine repair and maintenance
506 100% ENVIRON, 2014
RRS then further developed the analysis of the RRR industry to determine the required infrastructure investment that could create the capacity for Michigan to reach a 30+% recycling rate. This analysis, completed in collaboration with the Michigan Governor’s Recycling Council, projected the investment required in each stage of the recycling value chain, from the point of collection at home, business or on-‐the-‐go (including education and engagement needed to build participation, to the recycling processing and transportation infrastructure to the required secondary and primary end-‐markets that will convert the recyclable commodities to new uses.
DEVELOPMENT OF RECOMMENDATIONS
Finally, based on the results from each work stream, final recommendations for this report were developed through a collaboration of RRS and The Recycling Partnership (TRP), a national recycling nonprofit
18
organization that focuses on improving residential recycling. To provide input from outside stakeholders on the final report, RRS held two meetings with TRP to review the findings of the surveys and to discuss recommendations. Following these meetings RRS then compiled the draft recommendations with TRP review and comment. MDEQ staff then participated in a final stage of review to further refine the recommendations.
MRF IN T ERV I EW AND MARKET SURVEY F IND INGS 4 END-‐USER CONSISTENCY
MRF operators who participated in this study stated there is consistency in who purchases their materials. Occasionally a business will close, but buyers generally remain the same from month to month. Only one MRF operator interviewed stated that their end markets vary regularly. One benefit of having a consistent and constructive relationship with buyers, according to one of the MRFs interviewed, is that the vendor can provide regular input on the quality of material and make recommendations to improve processing/output.
FACTORS INFLUENCING THE ABIL ITY OF MRFS TO MOVE MATERIAL
The MRF operators indicated a variety of impacts on who purchases commodities and whether they sold commodities to the same companies each month. Some MRF operators noted price as the primary influence, but others mentioned demand and the ability to move material. Specifically, one MRF operator said “Sometimes price has to be sacrificed in order to move material due to relatively limited storage capacity at our plants.”
4 Note, many MRFs were reluctant to share information on their businesses and did not wish to participate in the study. Other MRFs participated by providing indirect responses to questions. However, RRS was able to interview nine MRF operators who represent a total of 13 MRFs in Michigan. The MRFs that responded to the survey represent between 40 and 60% of throughput in Michigan and are comprised of differing sizes, geographic locations and processing capabilities. Data gathered in the interviews, in conjunction with publicly available data, was used to identify the universe of secondary processors and end users in Michigan by material type.
Due to the hesitation of many MRFs to share proprietary information with the study team, the attempt to develop a complete picture of secondary processors proved challenging and did not provide adequate cost or performance data to provide this type of analysis. However, the study team was able to capture qualitative information that allows us to describe the strengths and weaknesses of end-‐use markets in Michigan.
19
DEST INATION OF COMMODIT IES
To better understand the flow of materials within the state, national and international markets, RRS asked end-‐use market experts about whether their commodities stay in Michigan or are exported outside the state. Responses to this question varied as the location of buyers of materials seems to depend more on the commodity type than on the MRF selling the commodity. One MRF interviewee reported that 97% of the buyers of their materials are in Michigan, and the remaining buyers come from out of state. However, that 97% does not account for brokers who are located in Michigan but sell materials out of state so the actual percentage of materials staying in the state is likely lower than 97%. However, this expert also noted that certain material types are consistently sold outside the state. For example, #1-‐7 non-‐bottle plastic mix is typically sold to out-‐of-‐state buyers, but that commodity may later return to Michigan to the automotive industry. A glass purchaser reported that 99% of the materials they buy comes from within Michigan. A processor of glass and other materials estimated that 36% of the materials they purchase originate in Michigan. For at least one expert, the vast majority of fiber has historically stayed in Michigan, but recently there have been higher offers for fiber from out of state.
PROCESS ING CAPACITY
RRS asked certain end-‐use market experts about the capacity of MRFs in Michigan to handle an increase to the state’s estimated recycling rate, since the capacity of the processing infrastructure to accept, process, store, sell, and remanufacture goods is important to Michigan’s recycling economy and indicative of the recycling maximums. Of the nine experts who were asked whether MRFs have the capacity to handle additional materials should Michigan’s recycling rate increase, seven responded yes, although two of those respondents made the caveat that it would depend on which material categories increase. Two of these seven experts said “there is plenty of capacity.” One MRF operator stated they could triple or quadruple incoming volume. The two remaining respondents did not answer with a direct “yes” or “no.” Some said they may have to process materials during an additional shift in the day, and “things are less expensive per unit the more volume you can run through existing infrastructure.” However, there would be an investment needed in terms of manpower resources. Another expert noted, “We do have capacity in certain material areas, but we haven’t hit those thresholds that push the private sector into providing that capacity.”

20
A reprocessor disclosed if Michigan’s recycling rate doubled, they would not need to make any changes or further investments, but would simply reduce purchasing materials from outside of Michigan. For the bottle deposit system, an expert suggested to RRS that even if a new category of materials were added, there would be sufficient capacity to handle the increase in materials. In some states with a bottle deposit, such as New York, there could be concerns about storage space for the extra materials, yet our expert did not feel this would be a concern in Michigan as he felt retailers in Michigan typically have adequate storage space (when compared to New York). However, there are constraints with the bottle deposit system in terms of the size of materials that can be accepted in existing machinery, for example, wine and liquor bottles may be too large or different a shape to be compatible with existing machines.
EST IMATE OF MICHIGAN’S PROCESS ING CAPACITY
To help understand whether an increase in the amount of materials recycled in Michigan could be handled by existing MRFs, RRS modeled the theoretical design capacity of Michigan MRFs. This estimate was developed using a combination of the information obtained directly from MRFs who participated in the survey, data from MRF equipment manufacturers, and data already known to RRS staff on the throughput capabilities of various Michigan MRFs. The estimate assumes that the maximum realistic capacity of a MRF is 15 hours per day of operational time, consisting of two eight-‐hour shifts with a half hour of break time in each shift. MRFs were assumed to be operational six days per week year-‐round. Downtime for maintenance was assumed to be an additional 10% of all operational time. In some cases, where MRFs were known to rely on court-‐supplied labor, only one shift per day was included in the estimate.
Based on this analysis, RRS estimated the design capacity of Michigan MRFs, or the amount of processing capacity that is available to MRFs, to be a maximum of 791,000 tons of materials per year. This is not the same as the amount of processing capacity currently being used at MRFs in Michigan. Because there is no MRF reporting system currently in place, our ability to indicate what percent of MRF design capacity is being used is limited by the willingness of MRFs to share information they may consider proprietary.
Once data is reported from MRFs as required by Public Act No. 55, MRFs will be required to provide information on the amount of each type of recyclable material that they receive and that they ship out of their facility. This data will allow for more accurate estimations of the processing capacity of each MRF in the state.
21
STRENGTHS OF THE MICHIGAN MARKETPLACE
In order to understand the recycling marketplace from the perspective of those interviewed, RRS asked respondents to identify what they considered to be strengths of the Michigan recycling marketplace. Bottle Bill Many of the experts we spoke with cited Michigan’s bottle bill as a strength of the state’s marketplace because it provides clean, local materials for processing. Mandatory Reporting The passage of SB507 legislation in March of 2016 that requires reporting of recycling tonnages was also cited by more than one interviewee as a new strength of the Michigan marketplace because it will gather data about recycling in the state. Collaboration Another strength that interviewees spoke of was the ability to network and develop relationships with other players in the Michigan materials marketplace. One person told us that because the Chinese market affects the pricing of everything, everyone in the U.S. is “kind of in the same boat,” and to hedge those impacts, some MRF operators have talked to factories currently utilizing their commodity materials to find out what other types of materials they could use; the MRFs then started accepting those materials. Another interviewee pointed out that some players in southeast Michigan collaborate to secure #1 and #2 plastics, are vertically integrated, and can turn those materials into bottles. This ability to develop relationships with other players in Michigan is a strength that not everyone in the state may be taking advantage of currently, but it is an action that MDEQ could encourage and support. Others that RRS interviewed conveyed a lack of confidence in the Michigan markets with one expert declaring, “There aren’t a lot of strengths right now.”
WEAKNESSES OF THE MICHIGAN MARKETPLACE
Single Stream Experts mentioned while one of Michigan’s strengths is the cleanliness of the material available through the bottle deposit system, one of Michigan’s weaknesses is the dirtiness of the state’s single stream materials. Contaminants in single stream materials include shredded paper, general trash, chicken bones, food waste, batteries, porcelain, ceramic and Pyrex. Others noted that glass
22
from single stream sources is so contaminated that some programs are removing it from their accepted materials list. Lack of Coordination Based on comments from interviewees, there appears to be a lack of coordination among various members of the industry. Sellers do not always have a nearby buyer for their materials. In addition, because of Michigan’s geography, there are large parts of the state without processing infrastructure. Providing facilitation among businesses and a hub and spoke structure for these areas may prove helpful. U.S. Economy Another weakness of the materials marketplace in Michigan is the economy in general. As one interviewee said, “Much has been lost in Michigan due to the economy -‐ cultural changes and local attitudes. Engineering innovators and marketplace capabilities have been lost.” Low Tip Fees One expert cited Michigan’s tipping fees, saying, “The 800-‐pound gorilla in the room in Michigan and in the Midwest is price. Price in Michigan is driven by extremely low tip fees at the landfill. The competition is not other recyclers, it’s landfilling.” Lack of Data The quality of recycling data was also highlighted as a weakness by more than one expert. They noted that Michigan faces a challenge in improving recycling because there is less longevity of recycling data available in Michigan than in other states. There is a lack of data describing curbside performance, so it is difficult to set a strategy on how to improve recycling in Michigan. It was suggested that obtaining a better residential recycling material profile would also aid in understanding and planning. Data collection is paramount to increasing volumes collected and improving education efforts. One person said that data from haulers, processors and communities should be collected, and another suggested that trucks with RFID can track daily set-‐out rates and be combined with scale information to measure the pounds per household (but noted tracking ahead of the truck to see what is in carts would be necessary as well).
CONTAMINATION AND MATERIAL QUALITY
RRS asked interviewees about what types of contamination exist and how big of a problem contamination poses. Some felt that paper was a major contaminant that was on the rise in non-‐paper commodities, in part due to MRFs speeding up the lines to move material more quickly. Other contaminants cited were steel and aluminum.

23
One expert stated, “Contamination keeps going up and bale yields keep going down and some of that is due to problems we’ve been facing for years, like shrink wrap labels. Machines don’t know what it is so it almost seems like whack a mole. One company will modify their label or make it easier to remove and then another company will come out with a full sleeve label.” Some experts felt that material quality had worsened recently. One said that the decline was connected to the economy and to the current pricing structures, and is not as related to what homeowners put in the bin or cart. Rather, MRFs are speeding up their lines and are not sorting as well today as they were a few months ago. Another expert stated, “Single stream material has gotten worse. A lot of the reason is structural, in terms of how plants are designed and what material is coming in. There’s too much crappy material coming in and too much crappy material going out and they run the lines too fast to do anything about it. The MRF operators are forced to process more material and the only way to do that is to speed up the line to increase throughput and get more money, and they end up losing a lot of material that way. They under-‐design the MRFs.” Degradation of bale specifications was also mentioned as problematic within the MRF community. What was once an old newsprint (ONP) grade bale has morphed into a lower valued mixed waste paper (MWP) grade bale, further reducing income. Some felt local governments are responsible for quality: “Quality cannot be improved unless local governments are willing to pay more to have it done.” Others saw end users as responsible: “The mills have to adapt to take materials the way they are.” Potential solutions to contamination issues varied. One suggestion was to work with companies to make packaging more recycling-‐friendly. Others noted there has been some exploration of tactics that can be utilized to reduce contamination, such as having a route manager ahead of the truck checking carts for contaminants. In terms of handling film, MRFs with a vacuum system at the front of the line seem perform better at pulling out film than others, however, it’s difficult to find markets for film plastics. Others saw education as the solution: “The whole concept of measuring quality is missing in collection, and cities don’t feel like they can control contamination. If they can see the economic advantage and what they would gain by dropping contamination levels down they might be willing to spend more on education.” Not everyone saw contamination as a concern. Some interviewees noted that contamination is not an issue for those handling material from the bottle deposit system. Other experts significantly downplayed contamination issues within localities utilizing dual stream drop-‐off collections.
24
One expert said that although others feel that the quality of materials declines when the price is very low because processors are trying to cut corners, for example by reducing electricity use in the plant, he feels that quality was worse in the 1990s because there was increased demand for the materials, and processors could get away with more.
EDUCATION
RRS asked end-‐use market experts about the state of recycling education in Michigan. Two people responded, “What education?” Those who did recognize existing recycling education in Michigan felt that it could be better. One interviewee noted, “Education must be improved to improve Michigan recycling.” Some felt that the problem with education is the lack of responsibility for undertaking education efforts and the disconnect between the party providing education and the party responsible for materials. MRFs are put in a difficult position when they are responsible for the quality of the material, yet they are not responsible for educating residents on how to prepare recyclables. Local governments lack the funding to provide education or do not make education a priority, and they may also not have a good understanding of the economic drivers of recycling. Some felt that because of this, the organization with the responsibility for providing clean materials should have the authority to provide education. But some also cited the need to hold MRFs more accountable for how they will provide quality materials. Several interviewees pointed to “recyclables going to the landfill” to indicate poor education from community to community and myths (or historical issues) still prevail within the residential recycling community.
ENFORCEMENT
RRS asked interviewees about the relevance of enforcement. Most agreed few local governments are willing to be enforcers. One said, “Nobody wants to do that work, but if you’re not going to do that work, you have to do education. Education is the last thing to go in the budget and the first thing to come out. It’s the most important thing after the cart.” Another expert said, “The only way to really enforce proper recycling is to have people go ahead of the collection vehicles and check the bins to see if there are any issues, or you could put cameras on the trucks and record everything.”
25
SPECIAL TOPIC : GLASS
Glass has become an issue for recycling operations around the country, and although the bottle deposit systems blunts the impact of the challenges of glass recycling, by providing Michigan with a glass stream that is cleaner than what is found in some non-‐bottle bill states, Michigan is not entirely immune. In Michigan, the roles are reversed for glass. The deposit system is working well, the material that comes out of the deposit system is in high demand and has no difficulty finding a home, but on the other hand there is no home for the curbside material. One glass processor stated, “The quality of the material [from Michigan] was the worst that each plant was getting and the cost was the most that each plant was getting because of the logistics.” Even though glass processors are paying what they consider to be a high price, the MRFs do not make money on glass so they are not incentivized to clean it up. One expert interviewed by RRS had recently heard of a MRF that had been landfilling glass for over a year since a reprocessor stopped taking it. The MRF didn’t want to “toy with” the public, but feels their job is to tell the hauler and let the hauler address it. At least one interviewee felt that the markets for glass are not that bad, but that processing of glass at the MRF is poor, leaving contamination such as paper on the glass when it is sold to reprocessors. This causes a lower quality product and lower prices, therefore it becomes a self-‐fulfilling prophecy. It was noted that there are several structural problems in the system for glass; modern single stream MRFs were designed to remove glass from other commodities, not necessarily to recover glass without contamination. A glass breaker is designed to break glass and the screens are two inches, all materials sized smaller fall through those holes and end up in the glass stream. The glass stream then has to be cleaned of contaminants to meet the glass market’s specifications. There is no standard specification for pre-‐mixed glass sorted from a MRF and the experts interviewed felt that the companies that process glass have not done a sufficient job of policing what they receive in relation to their ability to remove contamination until recently. In many cases, glass recyclers have insufficient equipment to remove contaminants, and adding more cleaning capacity would require spending additional money to meet demand. Opinions on how to tackle this situation varied. More than one expert pointed to cases in which state and federal grant funding enabled MRFs to improve their facilities to better capture materials such as glass. One interviewee described three models by which MRFs can manage the glass issue.
1. Utilize a secondary MRF for further processing, such as a glass plant that will remove contaminants from the glass and sell pure glass commodities to end-‐users.
26
2. Some MRFs maintain the status quo and do nothing to address the glass issue, or they sell glass into markets that do not have strict contamination requirements, such as sand or gravel markets.
3. Internalize glass processing capabilities at the MRF itself (the “Rumpke” model) by installing equipment to capture and sort the glass and remove contaminants so that the MRF can sell to end-‐users directly. Build the capacity large enough to process glass from multiple MRFs in addition to their own single stream MRF. According to the expert, the Rumpke model (i.e., sorted glass sold directly to end-‐users or to processors or utilized internally) provides more cohesion between the MRF and the end markets. In order for it to work, there must be a sufficient volume of glass entering the system. This volume can be provided by regionalization, or a hub and spoke system, that pulls material from a large geography. Regionalization has the added benefit of insulating against the pinch of commodity pricing.
Another solution offered was to require that glass be taken to drop-‐off sites and handled separately from other recyclables. One expert warned that small to midsize plastics could be problematic in the future like glass is today.
SPEC IAL TOPIC : RECYCLED PRODUCTS
Some materials generated in Michigan are returned as recycled products. For example, #1-‐7 non-‐bottle plastics recycled at the curb by communities in Emmett County are sorted and baled at the Emmett County MRF and sold to Entropex, a reprocessor in Sarnia, Ontario Canada, who processes the rigid plastics for Michigan automakers to use in new cars.
In another example, film plastics from MRFs in Michigan are sold to Petoskey Plastics, headquartered in Petoskey, Michigan, near Lake Michigan. The bales are shipped to Petoskey’s recycling plant in Hartford City, IN. Petoskey uses the recovered plastics to make trash and other film plastic bags, including the supply of bags used for Michigan’s redemption containers. Petoskey Plastics also supplies plastics for automotive manufacturers, construction and home improvement projects, and other uses in Michigan.
THE FUTURE OF RECYCL ING
RRS asked end-‐use market experts what they saw in the future for recycling. Some experts felt technology would help improve recycling. One said, “I have to believe there are going to be continued advances in technology -‐ ballistics, optical sorting. Rumpke [produces] some of the cleanest material [out there]. They’ve spent a lot of money on technology. They’re generating both OCC and mixed paper that is second to none in the industry.”
27
Others noted that while technological improvements would help, they come at a cost. At least one expert felt that the technology exists but MRFs will not spend money to make changes until they resolve their current losses and poor contracts. One expert stated there are possible upgrades, as seen in Europe, however MRFs in Europe can afford to purchase high end equipment due to a $150 tipping fee. Others felt that there is no new technology out there that could help. Some noted the rise of Amazon prime and other services that deliver products directly to homes as a reason for the increase in cardboard recycling and see that trend as continuing in the future. One expert cited mixed waste processing, or dirty MRFs that aim to recover recyclable materials from the general refuse stream, as the future of recycling since hauling and recycling materials are expensive and local governments are not willing or able to pay the true cost of recycling. Even if mixed waste processing becomes commonplace, this expert felt commercial businesses like large retailers and strip malls may still recycle, but overall, source-‐separated recycling would return to more of a niche market. On the other hand, another interviewee felt that technology “will have to improve a lot and become much more affordable for a dirty MRF to really work.”
RECOMMENDATIONS OF THE END-‐USE MARKET EXPERTS
RRS asked experts what the State of Michigan could do to help increase recycling. They responded with a diverse set of suggestions:
• Support economic development agencies in understanding recycling and providing recycling data. For instance, Michigan might be a great place to make recycled glass counters, but there is a lack of data to prove the theory.
• Focus less on collections and more on a communication program that encourages products made in Michigan with recycled content. Share the story of how the commodity flows through the system and into what new product.
• Provide information on Michigan capacity, quantities of material Michigan generates, and identify areas of opportunity, like how to recycle specific materials like agricultural plastic.
• To achieve a higher recycling rate, the mechanics and the MRF systems have to be bigger and employ more optics.
• Hub and spoke is necessary to consolidate material acceptance across regions.
• Implement policies and regulations that incentivize recycling, such as a solid waste surcharge on top of the tipping fee, tax credits for recycling equipment, or material bans.
28
• Include a glass specification in local government contracts with MRFs that would specify the amount of contamination in glass and the amount of undersized glass that would come out of the MRF. Local governments should request quality reports generated by the MRF’s outlets.
• Set goals and objectives that solid waste districts must reach, including access to recycling. Solid waste districts can serve as a clearinghouse on the recyclability of products and provide a clear message on education.
• Consider goals for diversion – something between recycling and landfilling, for example, glass used as alternative daily cover (ADC).
• Keep the bottle deposit law in place and expand curbside recycling. Consider charging people for recycling. Offer drop-‐off centers and educate households on what can and can’t be put in the recycling bin.
• Expand the bottle bill.
• Increase the use of recycled materials to incentivize recycling.
• Attract forward thinking companies to invest and locate in Michigan with an eye towards using the recycled commodity materials generated in the state.
• Wait for a rebound in world economic markets, which will resolve current issues in recycling markets.
• Expand grocery store film collection programs.
• Determine methodology to capture film at the MRF.
• Pay as you throw (PAYT) is a mistake because it incentivizes contamination. Giving folks a smaller trash can and a larger recycling cart also incentivizes contamination.
• Education is key.
• As we conduct higher level state discussions, pinpointing who is responsible for education is a key part of success. If the private sector isn’t held to some standard of education, it’s always going to be government’s role, but government is being defunded year after year. It doesn’t make sense to leave education to government if government doesn’t have the capacity to manage it. If we miss our education mark and have to go back and really focus on contamination we’ve lost an opportunity and now we’re talking about a negative message.
29
ECONOMIC ANALYS I S RRS staff conducted a macro-‐level economic analysis of the current structure of the recycling, reuse and recovery (RRR) economy in the state. The task estimated the degree of RRR activity that makes use of locally generated recycled commodity materials to create jobs and provide economic benefits to local economies of employment in Michigan. To conduct the economic analysis, RRS followed the published and peer reviewed methodology incorporated by three statewide reports and one regional report. Using those data sources as a guide, RRS then conducted an economic impact analysis using the impact analysis for planning (IMPLAN) modeling system. We incorporated, where appropriate, RRS’ own confidential data and metrics to verify and enhance the overall economic analysis and inform the development of recommendations.
RESULTS OF THE ECONOMIC IMPACT ANALYS IS
IMPLAN modeled the following effects of RRR on Michigan’s economy: • Direct economic impacts: The dollar value of the economic activity available to circulate
throughout the state economy. This includes not only the dollar value for the RRR industries from Table 1, but also those in other industries that directly support RRR.
• Indirect economic impacts: These are the inter-‐industry impacts of the input-‐output analysis and cover the impacts that result from the spending and the increased demand by the RRR companies.
• Induced impacts: Include the impacts of household spending by the employees generated by the direct and indirect impacts.
Table 4 displays the summary of direct, indirect and induced impacts of RRR in Michigan for the following categories:
• Employment: The annual average of monthly jobs in that industry (this is the same definition used by the U.S. Bureau of Labor Statistics and the U.S. Bureau of Economic Analysis at the national level). Thus, one job lasting 12 months is equal to two jobs lasting six months, which is equal to three jobs lasting four months each. A job can be either full-‐time or part-‐time.
• Labor Income: All forms of employment income, including Employee Compensation (wages and benefits) and Proprietor Income.
• Total Value Added: The difference between an industry’s or an establishment’s total output and the cost of its intermediate inputs. Total value added equals gross output (sales or receipts and other operating income, plus inventory change) minus intermediate inputs
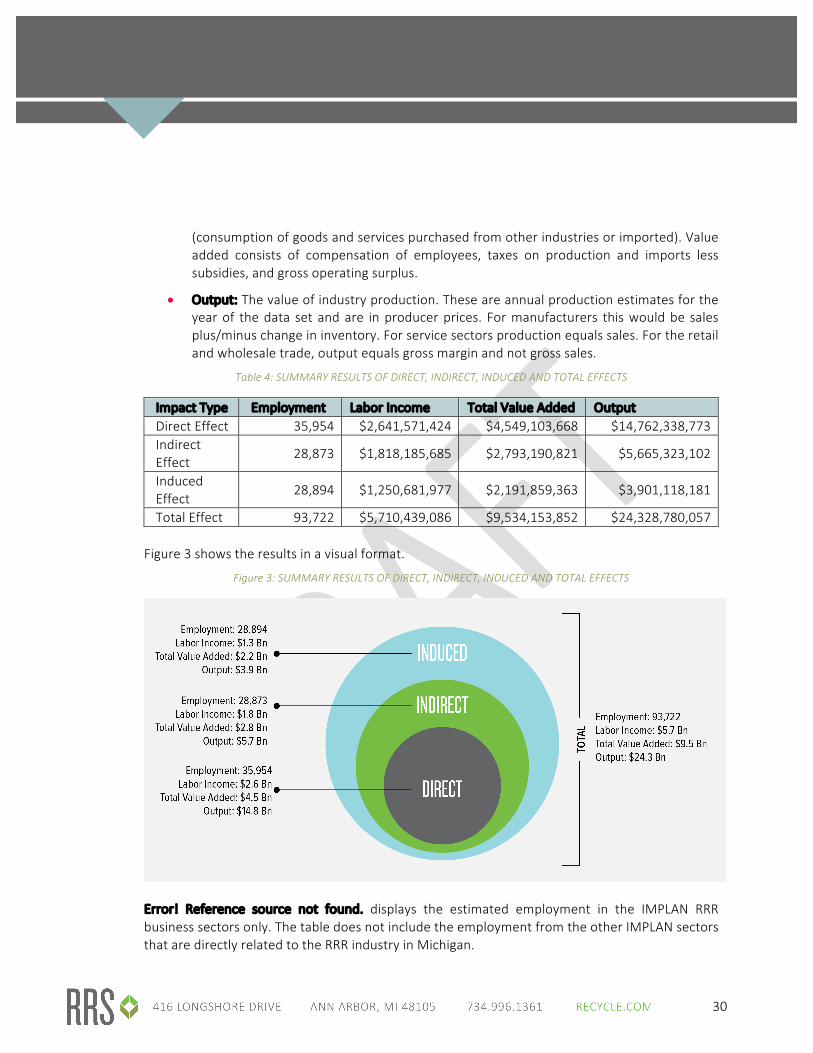
30
(consumption of goods and services purchased from other industries or imported). Value added consists of compensation of employees, taxes on production and imports less subsidies, and gross operating surplus.
• Output: The value of industry production. These are annual production estimates for the year of the data set and are in producer prices. For manufacturers this would be sales plus/minus change in inventory. For service sectors production equals sales. For the retail and wholesale trade, output equals gross margin and not gross sales.
Table 4: SUMMARY RESULTS OF DIRECT, INDIRECT, INDUCED AND TOTAL EFFECTS
Impact Type Employment Labor Income Total Value Added Output Direct Effect 35,954 $2,641,571,424 $4,549,103,668 $14,762,338,773 Indirect Effect
28,873 $1,818,185,685 $2,793,190,821 $5,665,323,102
Induced Effect
28,894 $1,250,681,977 $2,191,859,363 $3,901,118,181
Total Effect 93,722 $5,710,439,086 $9,534,153,852 $24,328,780,057 Figure 3 shows the results in a visual format.
Figure 3: SUMMARY RESULTS OF DIRECT, INDIRECT, INDUCED AND TOTAL EFFECTS
Error! Reference source not found. displays the estimated employment in the IMPLAN RRR business sectors only. The table does not include the employment from the other IMPLAN sectors that are directly related to the RRR industry in Michigan.
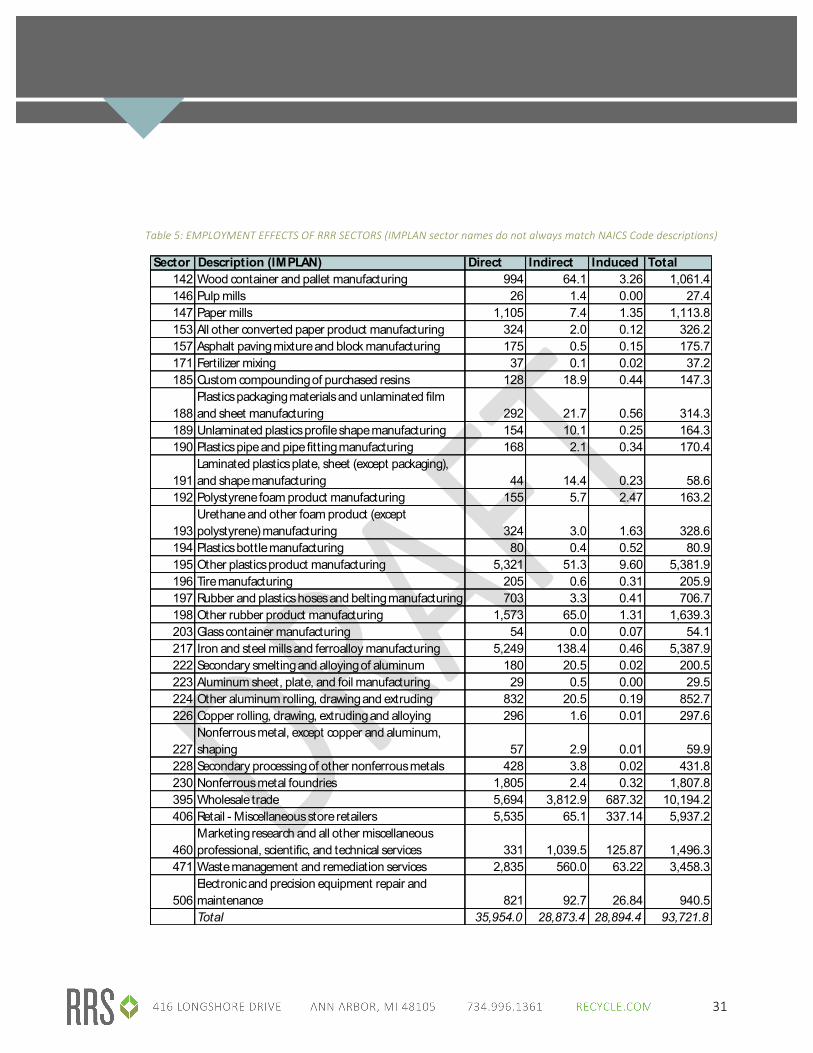
31
Table 5: EMPLOYMENT EFFECTS OF RRR SECTORS (IMPLAN sector names do not always match NAICS Code descriptions)
Sector Description (IMPLAN) Direct Indirect Induced Total142 Wood container and pallet manufacturing 994 64.1 3.26 1,061.4146 Pulp mills 26 1.4 0.00 27.4147 Paper mills 1,105 7.4 1.35 1,113.8153 All other converted paper product manufacturing 324 2.0 0.12 326.2157 Asphalt paving mixture and block manufacturing 175 0.5 0.15 175.7171 Fertilizer mixing 37 0.1 0.02 37.2185 Custom compounding of purchased resins 128 18.9 0.44 147.3
188Plastics packaging materials and unlaminated film and sheet manufacturing 292 21.7 0.56 314.3
189 Unlaminated plastics profile shape manufacturing 154 10.1 0.25 164.3190 Plastics pipe and pipe fitting manufacturing 168 2.1 0.34 170.4
191Laminated plastics plate, sheet (except packaging), and shape manufacturing 44 14.4 0.23 58.6
192 Polystyrene foam product manufacturing 155 5.7 2.47 163.2
193Urethane and other foam product (except polystyrene) manufacturing 324 3.0 1.63 328.6
194 Plastics bottle manufacturing 80 0.4 0.52 80.9195 Other plastics product manufacturing 5,321 51.3 9.60 5,381.9196 Tire manufacturing 205 0.6 0.31 205.9197 Rubber and plastics hoses and belting manufacturing 703 3.3 0.41 706.7198 Other rubber product manufacturing 1,573 65.0 1.31 1,639.3203 Glass container manufacturing 54 0.0 0.07 54.1217 Iron and steel mills and ferroalloy manufacturing 5,249 138.4 0.46 5,387.9222 Secondary smelting and alloying of aluminum 180 20.5 0.02 200.5223 Aluminum sheet, plate, and foil manufacturing 29 0.5 0.00 29.5224 Other aluminum rolling, drawing and extruding 832 20.5 0.19 852.7226 Copper rolling, drawing, extruding and alloying 296 1.6 0.01 297.6
227Nonferrous metal, except copper and aluminum, shaping 57 2.9 0.01 59.9
228 Secondary processing of other nonferrous metals 428 3.8 0.02 431.8230 Nonferrous metal foundries 1,805 2.4 0.32 1,807.8395 Wholesale trade 5,694 3,812.9 687.32 10,194.2406 Retail - Miscellaneous store retailers 5,535 65.1 337.14 5,937.2
460Marketing research and all other miscellaneous professional, scientific, and technical services 331 1,039.5 125.87 1,496.3
471 Waste management and remediation services 2,835 560.0 63.22 3,458.3
506Electronic and precision equipment repair and maintenance 821 92.7 26.84 940.5Total 35,954.0 28,873.4 28,894.4 93,721.8

32
Table 6 displays the estimated labor income effects in IMPLAN RRR business sectors. The table does not include the labor income from the other IMPLAN sectors that are directly related to the RRR industry in Michigan.
Table 6: LABOR INCOME EFFECTS OF RRR SECTORS (IMPLAN sector names do not always match NAICS Code descriptions)
Sector Description (IMPLAN) Direct Indirect Induced Total142 Wood container and pallet manufacturing 44,586,781$ 2,875,384$ 146,113$ 47,608,278$ 146 Pulp mills 2,517,256$ 132,249$ 368$ 2,649,872$ 147 Paper mills 119,224,437$ 803,813$ 146,003$ 120,174,253$ 153 All other converted paper product manufacturing 19,276,796$ 120,835$ 7,138$ 19,404,769$ 157 Asphalt paving mixture and block manufacturing 102,705,025$ 309,577$ 88,075$ 103,102,677$ 171 Fertilizer mixing 2,492,074$ 9,742$ 1,623$ 2,503,438$ 185 Custom compounding of purchased resins 9,749,460$ 1,438,443$ 33,532$ 11,221,435$
188Plastics packaging materials and unlaminated film and sheet manufacturing 19,783,390$ 1,470,198$ 37,952$ 21,291,540$
189 Unlaminated plastics profile shape 10,288,714$ 673,010$ 16,710$ 10,978,434$ 190 Plastics pipe and pipe fitting manufacturing 11,506,046$ 140,883$ 23,275$ 11,670,204$
191Laminated plastics plate, sheet (except packaging), and shape manufacturing 2,801,632$ 914,823$ 14,383$ 3,730,837$
192 Polystyrene foam product manufacturing 10,512,563$ 388,303$ 167,301$ 11,068,167$
193Urethane and other foam product (except polystyrene) manufacturing 19,071,142$ 174,820$ 95,968$ 19,341,931$
194 Plastics bottle manufacturing 11,724,604$ 53,615$ 75,765$ 11,853,984$ 195 Other plastics product manufacturing 335,498,175$ 3,235,055$ 605,340$ 339,338,570$ 196 Tire manufacturing 13,048,854$ 39,996$ 19,590$ 13,108,440$ 197 Rubber and plastics hoses and belting 50,067,251$ 233,404$ 29,494$ 50,330,148$ 198 Other rubber product manufacturing 98,918,043$ 4,089,223$ 82,154$ 103,089,420$ 203 Glass container manufacturing 3,766,021$ 587$ 5,019$ 3,771,627$ 217 Iron and steel mills and ferroalloy manufacturing 583,530,655$ 15,388,150$ 50,617$ 598,969,421$ 222 Secondary smelting and alloying of aluminum 10,637,732$ 1,211,999$ 1,401$ 11,851,131$ 223 Aluminum sheet, plate, and foil manufacturing 3,661,682$ 65,276$ 200$ 3,727,158$ 224 Other aluminum rolling, drawing and extruding 52,970,710$ 1,304,084$ 11,934$ 54,286,728$ 226 Copper rolling, drawing, extruding and alloying 19,995,107$ 105,226$ 383$ 20,100,715$
227Nonferrous metal, except copper and aluminum, shaping 3,032,976$ 151,817$ 484$ 3,185,277$
228 Secondary processing of other nonferrous metals 38,029,899$ 338,702$ 1,615$ 38,370,215$ 230 Nonferrous metal foundries 130,773,372$ 176,180$ 23,209$ 130,972,761$ 395 Wholesale trade 496,791,682$ 332,667,663$ 59,967,447$ 889,426,791$ 406 Retail - Miscellaneous store retailers 144,917,044$ 1,703,833$ 8,827,016$ 155,447,893$
460Marketing research and all other miscellaneous professional, scientific, and technical services 15,038,882$ 47,227,694$ 5,718,752$ 67,985,327$
471 Waste management and remediation services 199,240,264$ 39,359,364$ 4,443,319$ 243,042,948$
506Electronic and precision equipment repair and maintenance 55,413,157$ 6,253,792$ 1,811,581$ 63,478,530$ Total 2,641,571,424$ 1,818,185,685$ 1,250,681,977$ 5,710,439,086$

33
Table 7 displays the estimated “value added” effects in the IMPLAN RRR business sectors. The figure excludes effects from the other IMPLAN sectors that are directly related to the RRR industry in Michigan. Table 7: VALUE ADDED EFFECTS OF RRR SECTORS (IMPLAN sector names do not always match NAICS Code descriptions)
Sector Description Direct Indirect Induced Total142 Wood container and pallet manufacturing 48,942,197$ 3,156,263$ 160,385$ 52,258,845$ 146 Pulp mills 3,459,580$ 181,755$ 505$ 3,641,840$ 147 Paper mills 197,303,593$ 1,330,224$ 241,620$ 198,875,437$
153All other converted paper product manufacturing 24,227,905$ 151,871$ 8,971$ 24,388,747$
157Asphalt paving mixture and block manufacturing 95,782,997$ 288,712$ 82,139$ 96,153,849$
171 Fertilizer mixing 3,039,185$ 11,881$ 1,979$ 3,053,044$ 185 Custom compounding of purchased resins 12,902,587$ 1,903,658$ 44,377$ 14,850,621$
188Plastics packaging materials and unlaminated film and sheet manufacturing 33,483,952$ 2,488,353$ 64,235$ 36,036,539$
189Unlaminated plastics profile shape manufacturing 17,278,058$ 1,130,200$ 28,062$ 18,436,320$
190 Plastics pipe and pipe fitting manufacturing 25,263,199$ 309,329$ 51,104$ 25,623,632$
191Laminated plastics plate, sheet (except packaging), and shape manufacturing 5,185,755$ 1,693,316$ 26,622$ 6,905,693$
192 Polystyrene foam product manufacturing 19,572,360$ 722,945$ 311,482$ 20,606,787$
193Urethane and other foam product (except polystyrene) manufacturing 29,826,202$ 273,409$ 150,089$ 30,249,700$
194 Plastics bottle manufacturing 21,501,434$ 98,324$ 138,943$ 21,738,700$ 195 Other plastics product manufacturing 421,639,652$ 4,065,678$ 760,766$ 426,466,096$ 196 Tire manufacturing 19,414,044$ 59,505$ 29,147$ 19,502,696$
197Rubber and plastics hoses and belting manufacturing 77,076,188$ 359,314$ 45,404$ 77,480,906$
198 Other rubber product manufacturing 154,110,832$ 6,370,865$ 127,993$ 160,609,690$ 203 Glass container manufacturing 5,309,748$ 827$ 7,076$ 5,317,652$
217Iron and steel mills and ferroalloy manufacturing 1,329,248,857$ 35,053,309$ 115,303$ 1,364,417,469$
222 Secondary smelting and alloying of aluminum 23,186,062$ 2,641,679$ 3,053$ 25,830,794$ 223 Aluminum sheet, plate, and foil manufacturing 6,405,506$ 114,189$ 349$ 6,520,044$ 224 Other aluminum rolling, drawing and extruding 64,398,877$ 1,585,433$ 14,509$ 65,998,819$ 226 Copper rolling, drawing, extruding and alloying 53,547,846$ 281,799$ 1,025$ 53,830,670$
227Nonferrous metal, except copper and aluminum, shaping 4,990,545$ 249,803$ 796$ 5,241,144$
228Secondary processing of other nonferrous metals 190,249,792$ 1,694,403$ 8,078$ 191,952,273$
230 Nonferrous metal foundries 198,925,239$ 267,996$ 35,304$ 199,228,539$ 395 Wholesale trade 916,190,809$ 613,510,797$ 110,592,883$ 1,640,294,490$ 406 Retail - Miscellaneous store retailers 169,289,491$ 1,990,387$ 10,311,562$ 181,591,440$
460Marketing research and all other miscellaneous professional, scientific, and technical services 14,069,228$ 44,182,619$ 5,350,027$ 63,601,874$
471 Waste management and remediation services 286,944,393$ 56,685,072$ 6,399,236$ 350,028,701$
506Electronic and precision equipment repair and maintenance 76,337,555$ 8,615,267$ 2,495,647$ 87,448,470$ Total 4,549,103,668$ 2,793,190,821$ 2,191,859,363$ 9,534,153,852$
34
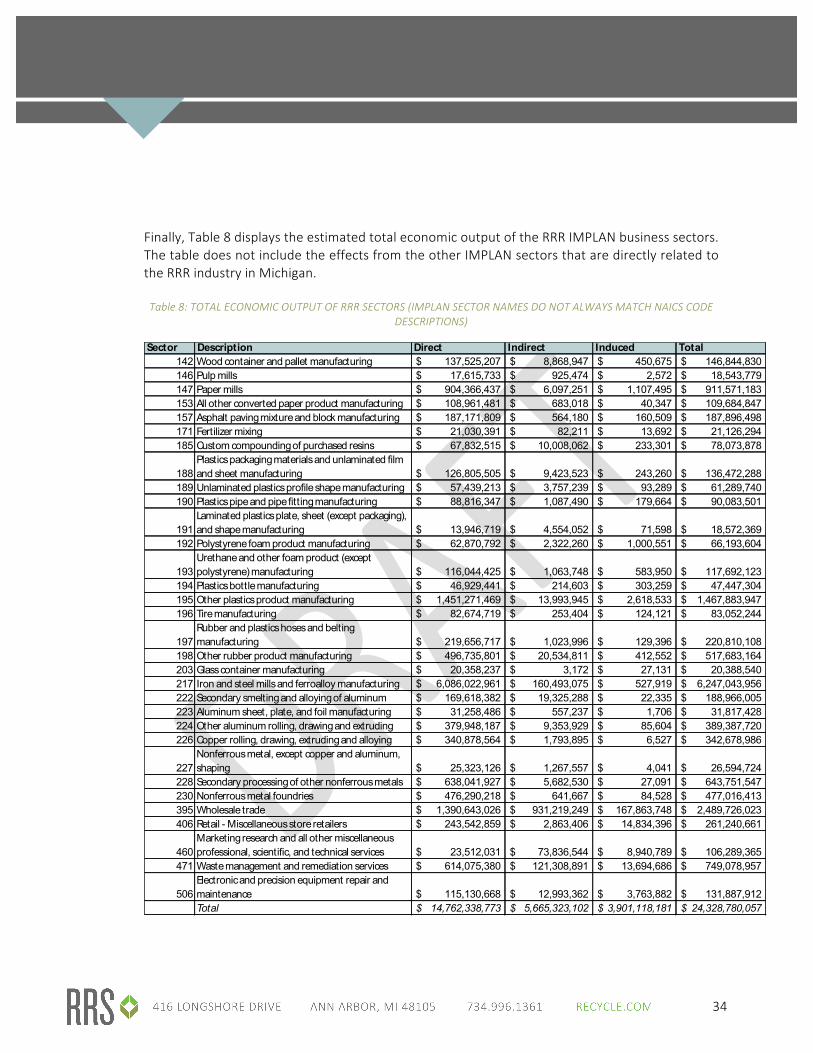
Finally, Table 8 displays the estimated total economic output of the RRR IMPLAN business sectors. The table does not include the effects from the other IMPLAN sectors that are directly related to the RRR industry in Michigan. Table 8: TOTAL ECONOMIC OUTPUT OF RRR SECTORS (IMPLAN SECTOR NAMES DO NOT ALWAYS MATCH NAICS CODE
DESCRIPTIONS)
Sector Description Direct Indirect Induced Total142 Wood container and pallet manufacturing 137,525,207$ 8,868,947$ 450,675$ 146,844,830$ 146 Pulp mills 17,615,733$ 925,474$ 2,572$ 18,543,779$ 147 Paper mills 904,366,437$ 6,097,251$ 1,107,495$ 911,571,183$ 153 All other converted paper product manufacturing 108,961,481$ 683,018$ 40,347$ 109,684,847$ 157 Asphalt paving mixture and block manufacturing 187,171,809$ 564,180$ 160,509$ 187,896,498$ 171 Fertilizer mixing 21,030,391$ 82,211$ 13,692$ 21,126,294$ 185 Custom compounding of purchased resins 67,832,515$ 10,008,062$ 233,301$ 78,073,878$
188Plastics packaging materials and unlaminated film and sheet manufacturing 126,805,505$ 9,423,523$ 243,260$ 136,472,288$
189 Unlaminated plastics profile shape manufacturing 57,439,213$ 3,757,239$ 93,289$ 61,289,740$ 190 Plastics pipe and pipe fitting manufacturing 88,816,347$ 1,087,490$ 179,664$ 90,083,501$
191Laminated plastics plate, sheet (except packaging), and shape manufacturing 13,946,719$ 4,554,052$ 71,598$ 18,572,369$
192 Polystyrene foam product manufacturing 62,870,792$ 2,322,260$ 1,000,551$ 66,193,604$
193Urethane and other foam product (except polystyrene) manufacturing 116,044,425$ 1,063,748$ 583,950$ 117,692,123$
194 Plastics bottle manufacturing 46,929,441$ 214,603$ 303,259$ 47,447,304$ 195 Other plastics product manufacturing 1,451,271,469$ 13,993,945$ 2,618,533$ 1,467,883,947$ 196 Tire manufacturing 82,674,719$ 253,404$ 124,121$ 83,052,244$
197Rubber and plastics hoses and belting manufacturing 219,656,717$ 1,023,996$ 129,396$ 220,810,108$
198 Other rubber product manufacturing 496,735,801$ 20,534,811$ 412,552$ 517,683,164$ 203 Glass container manufacturing 20,358,237$ 3,172$ 27,131$ 20,388,540$ 217 Iron and steel mills and ferroalloy manufacturing 6,086,022,961$ 160,493,075$ 527,919$ 6,247,043,956$ 222 Secondary smelting and alloying of aluminum 169,618,382$ 19,325,288$ 22,335$ 188,966,005$ 223 Aluminum sheet, plate, and foil manufacturing 31,258,486$ 557,237$ 1,706$ 31,817,428$ 224 Other aluminum rolling, drawing and extruding 379,948,187$ 9,353,929$ 85,604$ 389,387,720$ 226 Copper rolling, drawing, extruding and alloying 340,878,564$ 1,793,895$ 6,527$ 342,678,986$
227Nonferrous metal, except copper and aluminum, shaping 25,323,126$ 1,267,557$ 4,041$ 26,594,724$
228 Secondary processing of other nonferrous metals 638,041,927$ 5,682,530$ 27,091$ 643,751,547$ 230 Nonferrous metal foundries 476,290,218$ 641,667$ 84,528$ 477,016,413$ 395 Wholesale trade 1,390,643,026$ 931,219,249$ 167,863,748$ 2,489,726,023$ 406 Retail - Miscellaneous store retailers 243,542,859$ 2,863,406$ 14,834,396$ 261,240,661$
460Marketing research and all other miscellaneous professional, scientific, and technical services 23,512,031$ 73,836,544$ 8,940,789$ 106,289,365$
471 Waste management and remediation services 614,075,380$ 121,308,891$ 13,694,686$ 749,078,957$
506Electronic and precision equipment repair and maintenance 115,130,668$ 12,993,362$ 3,763,882$ 131,887,912$ Total 14,762,338,773$ 5,665,323,102$ 3,901,118,181$ 24,328,780,057$
35
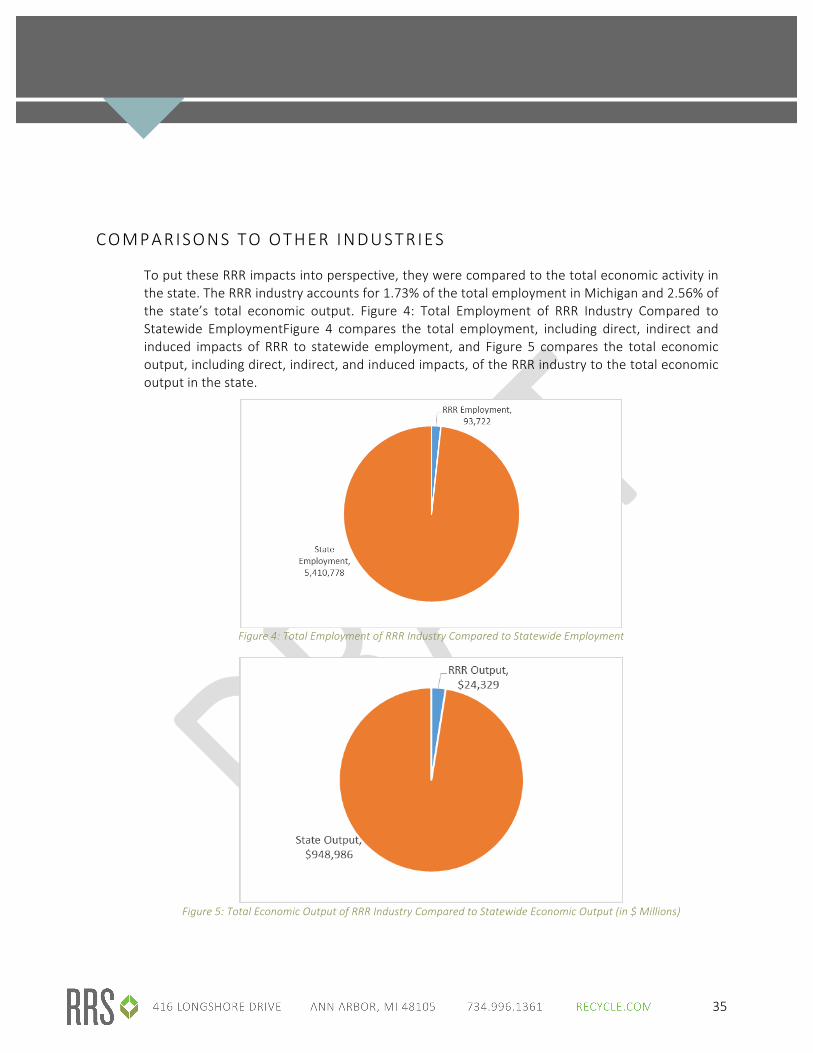
COMPARISONS TO OTHER INDUSTRIES
To put these RRR impacts into perspective, they were compared to the total economic activity in the state. The RRR industry accounts for 1.73% of the total employment in Michigan and 2.56% of the state’s total economic output. Figure 4: Total Employment of RRR Industry Compared to Statewide EmploymentFigure 4 compares the total employment, including direct, indirect and induced impacts of RRR to statewide employment, and Figure 5 compares the total economic output, including direct, indirect, and induced impacts, of the RRR industry to the total economic output in the state.
Figure 4: Total Employment of RRR Industry Compared to Statewide Employment
Figure 5: Total Economic Output of RRR Industry Compared to Statewide Economic Output (in $ Millions)
36
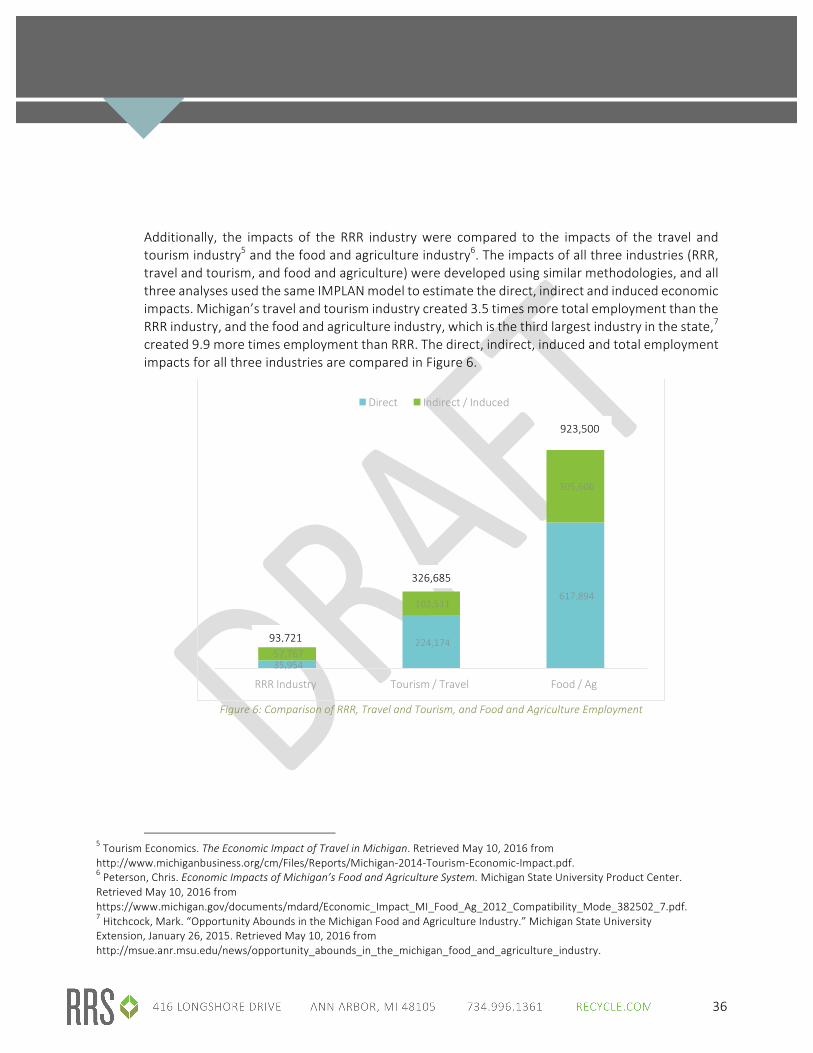
Additionally, the impacts of the RRR industry were compared to the impacts of the travel and tourism industry5 and the food and agriculture industry6. The impacts of all three industries (RRR, travel and tourism, and food and agriculture) were developed using similar methodologies, and all three analyses used the same IMPLAN model to estimate the direct, indirect and induced economic impacts. Michigan’s travel and tourism industry created 3.5 times more total employment than the RRR industry, and the food and agriculture industry, which is the third largest industry in the state,7 created 9.9 more times employment than RRR. The direct, indirect, induced and total employment impacts for all three industries are compared in Figure 6.
Figure 6: Comparison of RRR, Travel and Tourism, and Food and Agriculture Employment
5 Tourism Economics. The Economic Impact of Travel in Michigan. Retrieved May 10, 2016 from http://www.michiganbusiness.org/cm/Files/Reports/Michigan-‐2014-‐Tourism-‐Economic-‐Impact.pdf. 6 Peterson, Chris. Economic Impacts of Michigan’s Food and Agriculture System. Michigan State University Product Center. Retrieved May 10, 2016 from https://www.michigan.gov/documents/mdard/Economic_Impact_MI_Food_Ag_2012_Compatibility_Mode_382502_7.pdf. 7 Hitchcock, Mark. “Opportunity Abounds in the Michigan Food and Agriculture Industry.” Michigan State University Extension, January 26, 2015. Retrieved May 10, 2016 from http://msue.anr.msu.edu/news/opportunity_abounds_in_the_michigan_food_and_agriculture_industry.
35,954
224,174
617,894
57,767
102,511
305,606
RRR Industry Tourism / Travel Food / Ag
Direct Indirect / Induced
93,721
326,685
923,500

37
BENEF IT COST RAT IO
In 2015, the Recycle by Design project and the Recycle by Design Advisory Group estimated that the total cost of the waste and recycling value chain in the state of Michigan, including the costs for collection, transfer, and end deposition of all solid waste and recyclables, was $1,298,020,475.8 The total costs were compared to the total output (benefits) to develop a benefit cost ratio. In general, a benefit cost ratio value above 1 indicates a good investment, and a ratio below 1 indicates a bad investment. The benefit cost ratio for the direct economic output of the RRR industry in Michigan is 11.4, and the benefit cost ratio for the total economic output is 18.7. In simplified terms, this means that for every $1 of investment (cost) in Michigan, the RRR provides $11.40 in direct economic output benefits and $18.70 in total economic output benefits.
INFRASTRUCTURE INVESTMENT AND THE RECYCL ING BUSINESS CASE
Framework for Recommendations for infrastructure investment
As part of the work stream, RRS worked with the Michigan Governor’s Recycling Council (GRC) to identify strategic best practices to modernize the state's waste materials management infrastructure, and then completed analysis of required infrastructure and investment needed to collect and process two times the tonnage of recyclables currently being moved in the state. As was outlined in the Governor’s Recycling Plan of Action, as well as the 2007 Solid Waste Policy, Michigan’s current regulations, and our entire system for managing and regulating waste handling activities needs modernization. The following basic framework outlines the required infrastructure investment and the recycling business case that can support that infrastructure investment.
The analysis and approach described below shows what types of tools can be used to leverage an estimated $600M to $700M infrastructure investment in recycling by private and public sector service providers while keeping a proposed “state recycling infrastructure investment” in the $100M range. If that state share were bond financed over a ten to fifteen-‐year time-‐frame then the actual annual spend for principal and interest would be more likely in the $10M+ range. These approaches may be one of the most important tools the State could use to cause required investments to be made that will result in the target 30% to 50% recycling rate that has been discussed as an ambitious but realistic goal for the state.
Obligations for Public Health, Safety and Welfare
Michigan’s system of waste materials management is built to be responsive to the basic public health, safety and welfare needs of our communities. Michigan’s constitution establishes authority for local units of government within the state and holds those local units responsible for the capacity to provide or cause to be provided necessary governmental services essential to the public
8 RRS, IMG Rebel. Recycle by Design Financial Model. September 2015.
38
health, safety and welfare.9 Waste materials management has long been established as an area of responsibility for these local units, and the public health, safety and welfare obligation is central to several statutes in Michigan law that enable local units to manage those responsibilities. In this way, waste materials management in Michigan is a fundamental infrastructure obligation at the local level.
Waste as a Resource – Michigan’s Recycling Economy
As Michigan has become a more industrialized economy, our system of waste materials management has evolved and begun to move towards a recycling, reuse, and recovery (RRR) industrial economy. As part of the Governor’s Recycling Plan of Action, the economic impact of this RRR industrial activity makes use of locally generated raw materials to create jobs and provide economic benefits to local economies in MI.
As shown in the economic analysis provided in this report, the RRR industry economic impact results show 35,954 direct jobs in the state with a total annual labor income of $2,6B. When indirect and induced labor impacts are included, the industry has an impact of 93,722 jobs and a labor income of $5.7B. Direct economic output of the RRR industry in the state is $14.8B and the total economic output (including indirect and induced effects) is $24.3B.10 Michigan’s recycling economy is a cornerstone of the state’s manufacturing base, with the potential for even greater economic impact and job contribution that could be accomplished through doubling of the state’s recycling rate – a level of performance that many other states across the country have already achieved. 11
Waste as a Resource – Michigan’s Lost Economic Opportunity
Even with the efforts of this $24B “waste as a resource” economy – Michigan’s current approach to waste materials management still results in landfilling more than 6.2M tons of residential waste and 3.2M tons of commercial waste each year. The current amount of residential and commercial waste that is recycled each year is 1M tons along with .25M tons of take back recovery and .62M tons of container deposit recovery. 12 This represents an aggregate recycling rate of 15% -‐ only half the national average and a third of some of our peer states. A material flow analysis of those tons shows that nearly 8.2M tons are landfilled, waste that is no longer available as a resource to our economy, but for a small amount of energy recovery from landfill gas. Michigan’s residents, businesses, private haulers and local units of government pay $1.15B to collect this material and move it out of communities and into disposal facilities. An additional $150M is paid to manage the non-‐deposit law recyclables, moving those materials back into the manufacturing system as
9 Home Rule in Michigan – Then and Now, Communities Count, Michigan Municipal League
10 RRS, IMG Rebel. Recycle by Design Financial Model. September 2015 11 RRS, IMG Rebel. Recycle by Design Financial Model. September 2015 12 RRS, IMG Rebel. Recycle by Design Financial Model. September 2015
39
new industrial feedstocks. The lost value of the waste materials that are disposed instead of recycled has been estimated in the range of $368M13 to $600M annually. 14
The Performance Gap – Target for Infrastructure Modernization
In April 2014, Governor Rick Snyder announced a statewide recycling initiative to double the state’s recycling rate to 30%. This will require the implementation of a coherent infrastructure modernization that guarantees the percentage of recycling increases in a compressed timeframe and ensures that the recycling rate will continue to grow.
An increase in the recycling rate from 15% to 30% will mean adding approximately 1M to 1.4M tons in additional recycling/organics material flows – an average of the two or 1.2M tons will be used in the balance of this evaluation. This first stage of increase to 30% can’t be viewed in isolation with the larger performance gap. The infrastructure investments required to realize a 30% goal will reach a “tipping point” in performance that will set the stage for a second push to 50%. Investments in processing infrastructure (new and expanded material recovery facilities aka “MRFs”), hub and spoke recycling and organics transfer operations, secondary processing for challenging materials like mixed plastics, flexible packaging and glass and end market investments (paper, plastics, glass, etc.) will all be ready for higher volume throughput. The following analysis considers both the first and second phases – reaching 30% diversion and setting the stage for 50% performance for Michigan – an additional 1.8M tons that could be recycled by diverting from disposal.
The Materials Management Infrastructure Need
Preliminary analysis is projecting that the total investments necessary to increase Michigan’s recycling rate to the 30% to 50% range would include infrastructure development in the following areas:
Infrastructure Investment in Processing and Marketing of Recyclables
Preparing recyclables to rigorous market specifications is an industrial scale activity, requiring a range of investments in infrastructure of all kinds – from recycling and organics processing facilities to a network transfer and drop-‐off operations to secondary processing and end market upgrades. Following is a more detailed summary of assumptions used 15 in developing infrastructure investment targets, based on calculations of the material flow technical requirements for recycling the additional tons that will result from doubling Michigan’s recycling rate – identifying those requirements at each stage of the process from collection to processing to end-‐markets.
13 Economic Impact Potential and Characterization of Municipal Solid Waste in Michigan 2016. Prepared by the West Michigan Sustainable Business Forum Waste Task Force. Funded by a 2014 Michigan Department of Environmental Quality Grant.
14 RRS, IMG Rebel. Recycle by Design Financial Model. September 2015 15 RRS, IMG Rebel. Recycle by Design Financial Model. September 2015

40
• Material Recovery Facilities: A range of investments in new and upgraded recycling processing facilities (material recovery facilities or MRFs) is anticipated as required to meet geographic and population density driven location decisions. These new developments will take place over the next 2 to 8 years.
• Organics Processing Capacity: Similarly, a range of both larger scale as well as smaller community scale organics processing facilities are anticipated.
• Hub/Spoke Transfer for Recycling/Organics: Rural areas and lower density suburban and exurban areas would function as satellite transfer “spokes”, feeding regional MRFs and composting facilities (the “hubs”) to reach diversion goals while the system achieves benefits from economy of scale.
• Super Drop-‐off Convenience/Take Back Centers: A system of full service drop-‐off locations are anticipated across the state to enable direct haul by residents and small businesses of a wide range of recyclables that are not collected in curbside recycling programs (e.g. appliances, textiles, Styrofoam, film, mattresses, tires, latex paint, construction materials, wood waste, electronic waste, etc.) along with other special difficult to handle materials (household hazardous waste, batteries, bulbs, etc.). These centers could be co-‐located with recycling facilities, transfer sites, public works yards or similar facilities.
• Secondary Processing: There are two challenging streams of material in the curbside recycling system that likely will require additional “secondary” processing to prepare them to market specifications. These include mixed plastics as well as mixed glass cleaning operations needed to insure a robust market channel for these materials after they have moved through MRFs. In some cases, even the MRF residue can be further harvested in secondary processing operations to recover additional materials or to prepare engineered “spec” fuels.
• End Market Capacity Expansions: Recycling markets are global, with recyclable “commodities” having strong demand throughout, even while recycling prices fluctuate – just like oil and agricultural products. The greatest economic benefit is realized, however, when those recyclables are processed locally in domestic in-‐state markets – even though the price paid for those recyclables may not be as attractive as distant export markets. Michigan has a strong manufacturing base that is built on our legacy of paper making, steel production and plastics/chemical processing – helping Michigan realize additional economic and job creation benefits – connecting the dots between our recycling system as a source of supply and our manufacturers as converters of that supply into valued end-‐products.
Following, in Table 9, are the compiled estimates for these infrastructure investments for the processing and marketing of recyclables. A break out subtotal is shown for investments directly related to transfer and processing of recyclable and organics, totaling $282.8M. And additional subtotal is shown for investments in the end-‐market capacity expansions and the secondary processing capacity that will increase the quality and value of those commodity streams, totaling
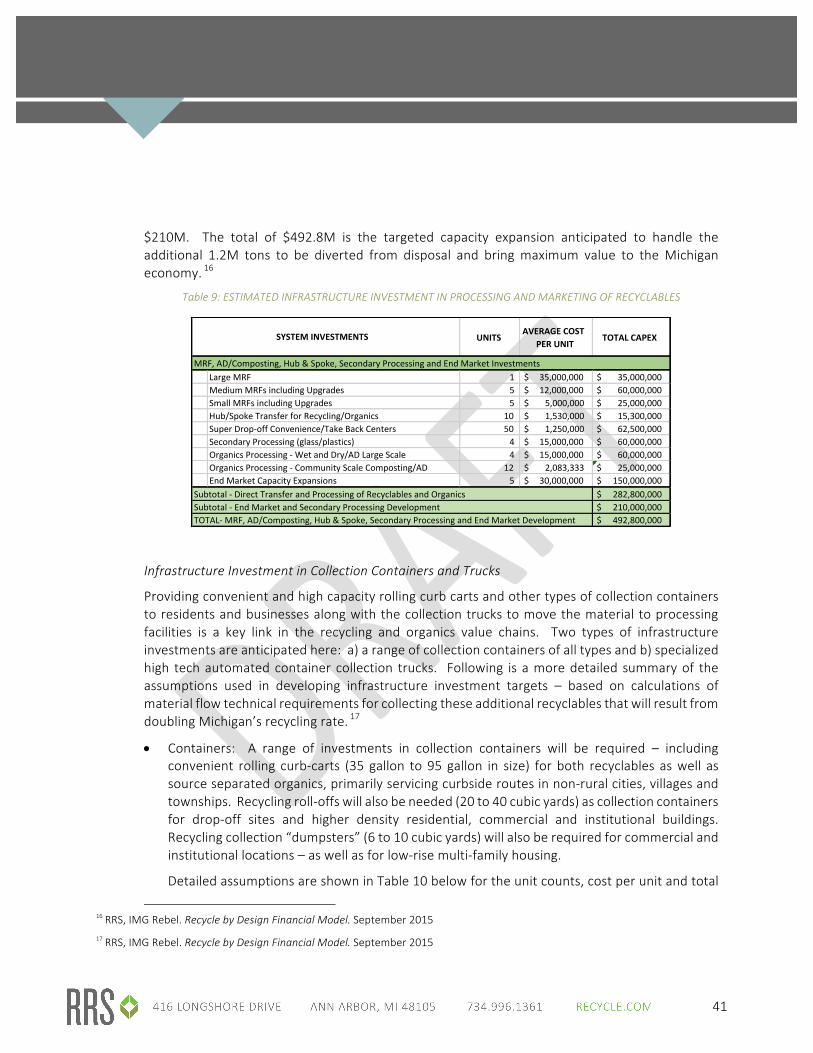
41
$210M. The total of $492.8M is the targeted capacity expansion anticipated to handle the additional 1.2M tons to be diverted from disposal and bring maximum value to the Michigan economy. 16
Table 9: ESTIMATED INFRASTRUCTURE INVESTMENT IN PROCESSING AND MARKETING OF RECYCLABLES
Infrastructure Investment in Collection Containers and Trucks
Providing convenient and high capacity rolling curb carts and other types of collection containers to residents and businesses along with the collection trucks to move the material to processing facilities is a key link in the recycling and organics value chains. Two types of infrastructure investments are anticipated here: a) a range of collection containers of all types and b) specialized high tech automated container collection trucks. Following is a more detailed summary of the assumptions used in developing infrastructure investment targets – based on calculations of material flow technical requirements for collecting these additional recyclables that will result from doubling Michigan’s recycling rate. 17
• Containers: A range of investments in collection containers will be required – including convenient rolling curb-‐carts (35 gallon to 95 gallon in size) for both recyclables as well as source separated organics, primarily servicing curbside routes in non-‐rural cities, villages and townships. Recycling roll-‐offs will also be needed (20 to 40 cubic yards) as collection containers for drop-‐off sites and higher density residential, commercial and institutional buildings. Recycling collection “dumpsters” (6 to 10 cubic yards) will also be required for commercial and institutional locations – as well as for low-‐rise multi-‐family housing.
Detailed assumptions are shown in Table 10 below for the unit counts, cost per unit and total
16 RRS, IMG Rebel. Recycle by Design Financial Model. September 2015 17 RRS, IMG Rebel. Recycle by Design Financial Model. September 2015
THIS%DRAFT%DEVELOPED%FOR%CONSIDERATION%AS%PART%OF%STATE%INFRASTRUCTURE%INVESTMENT%TO%LEVERAGE%PUBLIC/PRIVATE%PARTNERSHIPS%TO%DOUBLE%RECYCLING%RATE
UNITS AVERAGE+COST+PER+UNIT TOTAL+CAPEX
MRF,%AD/Composting,%Hub%&%Spoke,%Secondary%Processing%and%End%Market%InvestmentsLarge%MRF 1%%%%%%%%%%%%%%%%%% % 35,000,000$%%%% % 35,000,000$%%%%%% %Medium%MRFs%including%Upgrades 5%%%%%%%%%%%%%%%%%% % 12,000,000$%%%% % 60,000,000$%%%%%% %Small%MRFs%including%Upgrades 5%%%%%%%%%%%%%%%%%% % 5,000,000$%%%%%% % 25,000,000$%%%%%% %Hub/Spoke%Transfer%for%Recycling/Organics 10%%%%%%%%%%%%%%%% % 1,530,000$%%%%%% % 15,300,000$%%%%%% %Super%DropToff%Convenience/Take%Back%Centers%% 50%%%%%%%%%%%%%%%% % 1,250,000$%%%%%% % 62,500,000$%%%%%% %Secondary%Processing%(glass/plastics) 4%%%%%%%%%%%%%%%%%% % 15,000,000$%%%% % 60,000,000$%%%%%% %Organics%Processing%T%Wet%and%Dry/AD%Large%Scale 4%%%%%%%%%%%%%%%%%% % 15,000,000$%%%% % 60,000,000$%%%%%% %Organics%Processing%T%Community%Scale%Composting/AD 12%%%%%%%%%%%%%%%% % 2,083,333$%%%%%% % 25,000,000$%%%%%% %End%Market%Capacity%Expansions 5%%%%%%%%%%%%%%%%%% % 30,000,000$%%%% % 150,000,000$%%%% %
282,800,000$%%%% %210,000,000$%%%% %
TOTALT%MRF,%AD/Composting,%Hub%&%Spoke,%Secondary%Processing%and%End%Market%Development 492,800,000$%%%% %
Subtotal%T%Direct%Transfer%and%Processing%of%Recyclables%and%OrganicsSubtotal%T%End%Market%and%Secondary%Processing%Development
SYSTEM+INVESTMENTS

42
capital investment of $268M anticipated for containers. Note that one of the major US suppliers of curbside carts is located right here in Michigan, with potential to bring even greater economic benefit to the state both in jobs and economic activity as well as demand for post-‐consumer resin that is used to manufacture those carts.
Table 10: ESTIMATED INFRASTRUCTURE INVESTMENT IN COLLECTION CONTAINERS
• Collection Trucks: These containers required specialized trucks to service them – most of them
utilizing automated or semi-‐automated arms and lifting devices – both side load, real load, front load, all with high-‐compaction capabilities – along with roll-‐off trucks and service support vehicles. Estimates are provided for anticipated trucking requirements.
Detailed assumptions are shown in Table 11 below for the unit counts, cost per unit and total capital investment of $74.25M anticipated for collection vehicles.
Table 11: ESTIMATED INFRASTRUCTURE INVESTMENT IN COLLECTION TRUCKS
Infrastructure Investment in Support Systems
Investment in the “bricks and mortar” of on modernizing our recycling materials management infrastructure requires supporting systems in order to effectively enable target diversion goals to be reached. These support systems are the “software” of recycling and sustainable materials management – just like the smart phone hardware requires software to be of any use – so it is with recycling. The following types of support services are anticipated: a) Cart Roll-‐out and Outreach, b) Technology; c) Outreach/Engagement/Messaging; d) County Materials Management Plans and e) Program Support/Management. Following is a more detailed summary of the assumptions used in developing infrastructure investment targets:
UNITS AVERAGE+COST+PER+UNIT TOTAL+CAPEX
Cart%and%Container%InvestmentsCurbside%Carts%for%Recycling 2,000,000%%%%%% 55$%%%%%%%%%%%%%%%%%%%%%%%%%%%%%%% 110,000,000$%%%%%%%Curbside%Carts%for%Oganics 2,500,000%%%%%% 55$%%%%%%%%%%%%%%%%%%%%%%%%%%%%%%% 137,500,000$%%%%%%%Recycling%Roll@offs%for%High%Density%Drop@offs 500%%%%%%%%%%%%%%%%% 3,000$%%%%%%%%%%%%%%%%%%%%%%%%% 1,500,000$%%%%%%%%%%%%Commercial%Recycling%Collection%Containers 15,000%%%%%%%%%%% 800$%%%%%%%%%%%%%%%%%%%%%%%%%%%% 12,000,000$%%%%%%%%%%Multi@Family%Recycling%Dumpsters 10,000%%%%%%%%%%% 700$%%%%%%%%%%%%%%%%%%%%%%%%%%%% 7,000,000$%%%%%%%%%%%%
TOTAL@%Cart%and%Container%Investments 268,000,000$%%%%%%%
SYSTEM+INVESTMENTS
TOTAL%&Cart&and&Container&Investments 268,000,000$&&&&&&&
UNITS AVERAGE+COST+PER+UNIT TOTAL+CAPEX
Collection&Truck&InvestmentsAutomated 150&&&&&&&&&&&&&&&&& 300,000$&&&&&&&&&&&&&&&&&&&& 45,000,000$&&&&&&&&&&Semi%Automated 60&&&&&&&&&&&&&&&&&&& 190,000$&&&&&&&&&&&&&&&&&&&& 11,400,000$&&&&&&&&&&Front&Load 60&&&&&&&&&&&&&&&&&&& 160,000$&&&&&&&&&&&&&&&&&&&& 9,600,000$&&&&&&&&&&&&Roll%off 50&&&&&&&&&&&&&&&&&&& 140,000$&&&&&&&&&&&&&&&&&&&& 7,000,000$&&&&&&&&&&&&Support& 25&&&&&&&&&&&&&&&&&&& 50,000$&&&&&&&&&&&&&&&&&&&&&&& 1,250,000$&&&&&&&&&&&&
TOTAL%&Collection&Truck&Investments 74,250,000$&&&&&&&&&&
SYSTEM+INVESTMENTS
43
• Cart Roll-‐out and Outreach: A one-‐time cost, at the time of cart distribution, has been programmed in, given the compelling case that has been demonstrated when cart recipients receive the kinds of education, outreach and instruction that enables them to fully engage in using their newly received recycling and/or source separated organics carts.
• Technology: As in many other service areas, the use of advanced technology (RFID, GPS, smart-‐phone aps, etc.) has been proven to be an effective tool for increasing participation in recycling programs.
• Outreach/Engagement/Messaging: Annualized spend at both statewide and local levels has been found to be essential for effective engagement of citizens and businesses in utilizing the recycling system.
• County Recycling Plans: Anticipated as a key step in bringing community based discussions forward for both the public and private sectors as the right recycling solutions are identified, and the means to develop and operate those solutions are mapped out in action plans with set milestones and all associated clarification of goals, roles and responsibilities.
• Program Support/Management: In addition to a baseline commitment of technical assistance and management support a need is anticipated for facilitation of the public private partnerships to leverage investment and risk sharing to support development of the recycling infrastructure and the sustainable funding and operational framework that will make that possible. Use of tools like the Michigan Recycle By Design Challenge (currently on hold), and the data room and best practice assessment protocols are anticipated as part of this components of support services.
Together these anticipated infrastructure investments represent the comprehensive best practice “system” that has been proven to result in the achievement of 30% to 50% diversion.
The Recycling Infrastructure Investment
Together these anticipated infrastructure and support system investments represent the comprehensive best practice “system” that has been proven to result in the achievement of 30% to 50% diversion.
The recycling infrastructure outlined and detailed above are anticipated to total in the range of $600 to $700 million in one-‐time costs – most of which will be made as part of private and public sector service provider investment. Note that $210M in the estimates of capital spend in the tables above are for end-‐market development – private sector investments in manufacturing – so not directly related to the collection, transfer and processing of the newly recovered recyclables. The $650M figure used in the following analysis does not include these investments. This investment will not only occur in new and expanded infrastructure but also in the development and support of stronger, more resilient end markets within the state.
Based on an annual amortization of the $650M investments at an average of 10 years (accounting
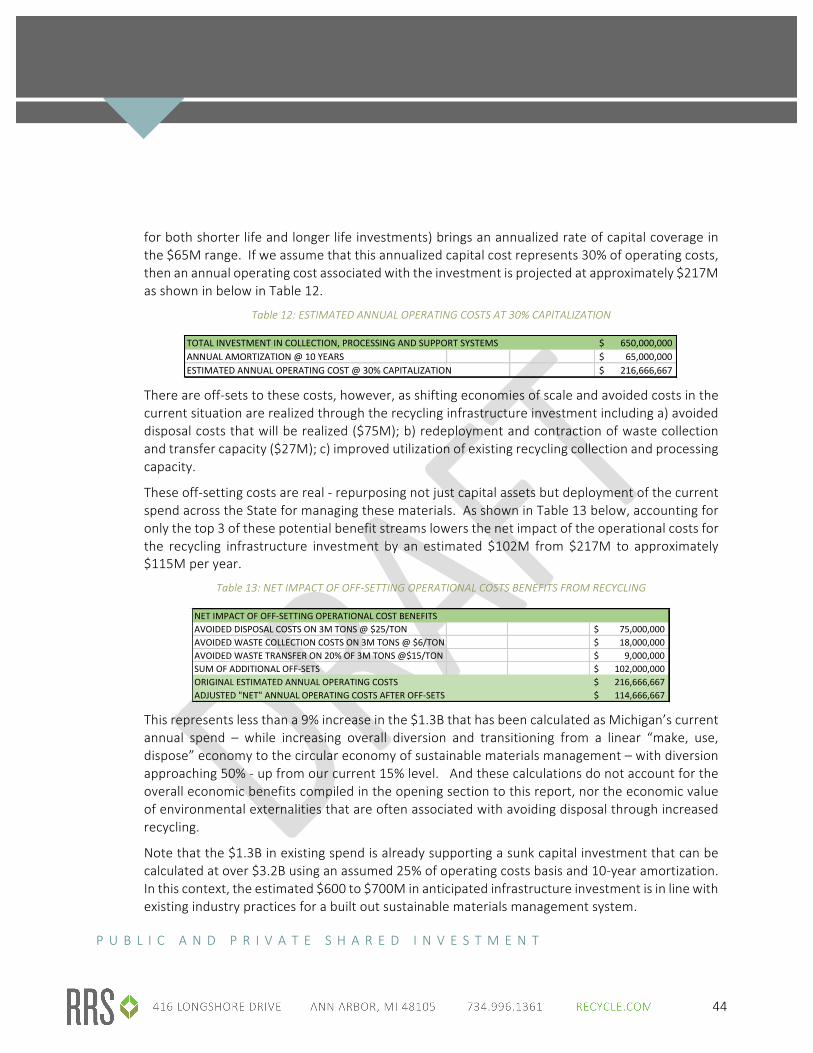
44
for both shorter life and longer life investments) brings an annualized rate of capital coverage in the $65M range. If we assume that this annualized capital cost represents 30% of operating costs, then an annual operating cost associated with the investment is projected at approximately $217M as shown in below in Table 12.
Table 12: ESTIMATED ANNUAL OPERATING COSTS AT 30% CAPITALIZATION
There are off-‐sets to these costs, however, as shifting economies of scale and avoided costs in the current situation are realized through the recycling infrastructure investment including a) avoided disposal costs that will be realized ($75M); b) redeployment and contraction of waste collection and transfer capacity ($27M); c) improved utilization of existing recycling collection and processing capacity.
These off-‐setting costs are real -‐ repurposing not just capital assets but deployment of the current spend across the State for managing these materials. As shown in Table 13 below, accounting for only the top 3 of these potential benefit streams lowers the net impact of the operational costs for the recycling infrastructure investment by an estimated $102M from $217M to approximately $115M per year.
Table 13: NET IMPACT OF OFF-‐SETTING OPERATIONAL COSTS BENEFITS FROM RECYCLING
This represents less than a 9% increase in the $1.3B that has been calculated as Michigan’s current annual spend – while increasing overall diversion and transitioning from a linear “make, use, dispose” economy to the circular economy of sustainable materials management – with diversion approaching 50% -‐ up from our current 15% level. And these calculations do not account for the overall economic benefits compiled in the opening section to this report, nor the economic value of environmental externalities that are often associated with avoiding disposal through increased recycling.
Note that the $1.3B in existing spend is already supporting a sunk capital investment that can be calculated at over $3.2B using an assumed 25% of operating costs basis and 10-‐year amortization. In this context, the estimated $600 to $700M in anticipated infrastructure investment is in line with existing industry practices for a built out sustainable materials management system.
P U B L I C A N D P R I V A T E S H A R E D I N V E S T M E N T
TOTAL%CAPEX 857,490,610$%%%%%%%TOTAL%INVESTMENT%IN%COLLECTION,%PROCESSING%AND%SUPPORT%SYSTEMS 650,000,000$%%%%%%%ANNUAL%AMORTIZATION%@%10%YEARS% 65,000,000$%%%%%%%%%%ESTIMATED%ANNUAL%OPERATING%COST%@%30%%CAPITALIZATION 216,666,667$%%%%%%%
Avoided'CostsNET'IMPACT'OF'OFF3SETTING'OPERATIONAL'COST'BENEFITSAVOIDED'DISPOSAL'COSTS'ON'3M'TONS'@'$25/TON 75,000,000$''''''''''AVOIDED'WASTE'COLLECTION'COSTS'ON'3M'TONS'@'$6/TON 18,000,000$''''''''''AVOIDED'WASTE'TRANSFER'ON'20%'OF'3M'TONS'@$15/TON 9,000,000$''''''''''''SUM'OF'ADDITIONAL'OFF3SETS 102,000,000$'''''''ORIGINAL'ESTIMATED'ANNUAL'OPERATING'COSTS 216,666,667$'''''''ADJUSTED'"NET"'ANNUAL'OPERATING'COSTS'AFTER'OFF3SETS 114,666,667$'''''''

45
Finding the mechanisms to incentivize that level of investment to take place takes serious commitment, planning and discipline in execution – not to mention collaboration on many levels. While some states have taken the approach of using top-‐down mandates to cause such investment (e.g. California and its goals and franchise tools) the track record in Michigan historically has been to use grants and or bond financing to incentivize investment. In fact, many of the more successful legacy recycling programs in the state have roots in prior state efforts like the Clean Michigan Fund of the past. Luckily a great deal has been learned across the country on best practices in such matters. In fact, development of recycling programs across the country have demonstrated that funding tools can be used as “carrots” to leverage the bulk of required infrastructure investment from private as well as public funding mechanisms. The following chart illustrates an example of how a “10 cents on the dollar” approach could be an important tool to leverage a significant portion of the targeted capital.
Each area of capital spend has been reviewed to determine what an optimum State Infrastructure Investment grant allocation might be to leverage the necessary contribution by the recipient. So for, example, the second column from the right shows a 10% “state recycling infrastructure investment” contribution for MRFs leveraging the remaining 90% of the investment from other private and or local public sources. Similarly, a 20% “state recycling infrastructure investment” for collection containers leverages the 80% match on the private/local public slide.
Incentivizing Investment in Processing and Marketing of Recyclables
Table 14 shows how the needed investments in processing and marketing of recyclables would be leveraged through the proposed incentive. For the direct costs of transfer and processing the approximately $28M in the proposed State Infrastructure Investment column would leverage the balance of $284M investment by others (private and public sector service providers). Similarly, the $21M in in the proposed State Infrastructure Investment column for the End Market and Secondary Processing Development investments would leverage a balance of $189M investment by the manufacturing sector.
Table 14: STATE INVESTMENT TO LEVERAGE PROCESSING AND END MARKET INVESTMENT BY RECYCLING INDUSTRY
THIS%DRAFT%DEVELOPED%FOR%CONSIDERATION%AS%PART%OF%STATE%INFRASTRUCTURE%INVESTMENT%TO%LEVERAGE%PUBLIC/PRIVATE%PARTNERSHIPS%TO%DOUBLE%RECYCLING%RATE
TOTAL%CAPEX
MRF,%AD/Composting,%Hub%&%Spoke,%Secondary%Processing%and%End%Market%Investments PERCENT AMOUNT
Large%MRF 35,000,000$%%%%%%%%% % 90% 31,500,000$%%% % 10% 3,500,000$%%%% %Medium%MRFs%including%Upgrades 60,000,000$%%%%%%%%% % 90% 54,000,000$%%% % 10% 6,000,000$%%%% %Small%MRFs%including%Upgrades 25,000,000$%%%%%%%%% % 90% 22,500,000$%%% % 10% 2,500,000$%%%% %Hub/Spoke%Transfer%for%Recycling/Organics 15,300,000$%%%%%%%%% % 90% 13,770,000$%%% % 10% 1,530,000$%%%% %Super%DropXoff%Convenience/Take%Back%Centers%% 62,500,000$%%%%%%%%% % 90% 56,250,000$%%% % 10% 6,250,000$%%%% %Secondary%Processing%(glass/plastics) 60,000,000$%%%%%%%%% % 90% 54,000,000$%%% % 10% 6,000,000$%%%% %Organics%Processing%X%Wet%and%Dry/AD%Large%Scale 60,000,000$%%%%%%%%% % 90% 54,000,000$%%% % 10% 6,000,000$%%%% %Organics%Processing%X%Community%Scale%Composting/AD 25,000,000$%%%%%%%%% % 90% 22,500,000$%%% % 10% 2,500,000$%%%% %End%Market%Capacity%Expansions 150,000,000$%%%%%%% % 90% 135,000,000$ % 10% 15,000,000$%% %
Subtotal%X%Direct%Transfer%and%Processing% 282,800,000$%%%%%%% % 90% 254,520,000$ % 10% 28,280,000$%% %Subtotal%X%End%Market%and%Secondary%Processing%Development 210,000,000$%%%%%%% % 90% 189,000,000$ % 10% 21,000,000$%% %TOTALX%All 492,800,000$%%%%%%% % 90% 443,520,000$ % 10% 49,280,000$%% %
INVESTMENT%BY%OTHERS%(PRIVATE%AND%
PUBLIC)
PROPOSED%STATE%INFRASTRUCTURE%
INVESTMENT%SYSTEM%INVESTMENTS

46
Incentivizing Investment in Containers and Collection
Table 15 shows how the needed investments in containers and collection of recyclables would be leveraged through the proposed incentive.
Table 15: STATE INVESTMENT TO LEVERAGE COLLECTION SYSTEM INVESTMENT BY RECYCLING INDUSTRY
For these Containers and Collection Investments a proposed incentive of $50.1M would leverage and additional $205M. For Collection Truck Investments no incentive is proposed.
Summary
As stated in the intro to this section, the net benefit of the approach outlined above, one that is unique to the waste and recycling space, is that various tools like this can be used to leverage the anticipated $600M to $700M infrastructure investment, while keeping the “state recycling infrastructure investment” in the $100M range, and if that spend were to be bonded the actual annual spend would be more likely in the $10M+ range. These approaches may be one of the most important tools that the State could use to cause the required investment to be made that will result in the target 30% to 50% recycling rate that has been discussed as an ambitious but realistic goal for the state.
TOTAL%&All 492,800,000$&&&&&&& & 90% 443,520,000$ & 10% 49,280,000$&& &
TOTAL%CAPEX
Cart&and&Container&InvestmentsCurbside&Carts&for&Recycling 110,000,000$&&&&&&& & 80% 88,000,000$&&& & 20% 22,000,000$&& &Curbside&Carts&for&Oganics 137,500,000$&&&&&&& & 80% 110,000,000$ & 20% 27,500,000$&& &Recycling&Roll%offs&for&High&Density&Drop%offs 750,000$&&&&&&&&&&&&& & 100% 750,000$&&&&&&&& & 0% %$&&&&&&&&&&&&&& &Commercial&Recycling&Collection&Containers 5,625,000$&&&&&&&&&&& & 80% 4,500,000$&&&&& & 20% 1,125,000$&&&& &Multi%Family&Recycling&Dumpsters 2,450,000$&&&&&&&&&& & 90% 2,205,000$&&&&& & 10% 245,000$&&&&&&& &
Collection&Truck&InvestmentsAutomated 38,250,000$&&&&&&&&& & 100% 38,250,000$&&& & 0% %$&&&&&&&&&&&&&& &Semi%Automated 11,400,000$&&&&&&&&& & 100% 11,400,000$&&& & 0% %$&&&&&&&&&&&&&& &Front&Load 9,600,000$&&&&&&&&&& & 100% 9,600,000$&&&&& & 0% %$&&&&&&&&&&&&&& &Roll%off 3,500,000$&&&&&&&&&& & 100% 3,500,000$&&&&& & 0% %$&&&&&&&&&&&&&& &Support& 1,250,000$&&&&&&&&&& & 100% 1,250,000$&&&&& & 0% %$&&&&&&&&&&&&&& &
Subtotal&%&Cart&and&Container&Investments& 256,325,000$&&&&&&& & 80% 205,455,000$ & 20% 50,870,000$&& &Subtotal&%&Collection&Truck&Investments 64,000,000$&&&&&&&&& & 100% 64,000,000$&&& & 0% %$&&&&&&&&&&&&&& &TOTAL%&All 320,325,000$&&&&&&& & 84% 269,455,000$ & 16% 50,870,000$&& &
PROPOSED%STATE%INFRASTRUCTURE%
INVESTMENT%INCENTIVE
SYSTEM%INVESTMENTSINVESTMENT%BY%
OTHERS%(PRIVATE%AND%PUBLIC)

47
RECOMMENDAT IONS Following the completion of the previous activities, RRS and The Recycling Partnership reviewed the survey results and developed the following ten recommendations to support end-‐use markets in Michigan and to move Michigan towards a sustainable materials management system. The recommendations below are organized around a proposed timeline for implementation.
WITHIN THE NEXT THREE TO NINE MONTHS
1. PROVIDE ADDITIONAL STAFF TRAINING
In order to carry out any of the subsequent recommendations for success, the MDEQ must first invest in the education and training of their staff, specifically their Recycling Specialists. These Recycling Specialists provide on the ground assistance to local governments and community members across the state. To perform their jobs in a way that provides support to these stakeholders, Recycling Specialists must have superior knowledge of recycling trends in other states, firsthand experience seeing the latest recycling processing and manufacturing technologies in action, and exposure to best management practices in place in communities across the country. To address this, RRS and The Recycling Partnership recommend that MDEQ develop an action plan for the four Recycling Specialists to learn from their peers in other state agencies as well as from The Recycling Partnership’s State Leaders Group. This action plan should include sending the Recycling Specialists on trips to other states employing BMPs to learn and to bring that knowledge back to the State of Michigan. We recommend that the action plan be developed in the next three months and that MDEQ begin implementation of the plan within the next six months, with a goal of completing the action plan by spring of 2017.
2. SET GOALS FOR MICHIGAN AND TRACK PERFORMANCE
With the recycling measurement system ready to be launched, and a 2013 and 2014 baseline established, the state should complete a goal setting process for reaching diversion that institutionalizes a targeted level of performance and a targeted timeline. Achievement of Governor Snyder’s goal to increase the state’s residential recycling rate to 30% should continue to be a priority, however, MDEQ should also work to integrate incremental goal setting across the state – including at the local government level. For example, MDEQ could set goals for purchasing recycled content materials in state government, for diverting organic materials from landfills, and for number of communities with convenient access to recycling. MDEQ

48
recycling specialists could offer assistance to local governments in developing their own set of recycling goals that incorporate these statewide performance targets. With foundational work completed in the past two years, the ongoing development of the ReTrac system, and the passage of SB507 in March 2016 requiring the reporting of quantities of recycled materials by recycling establishments, MDEQ will have access to a wealth of data on recycling in the state, and should track progress towards the goals that are set in addition to the residential recycling rate goal. This will allow state government, residents, businesses and local governments to understand where Michigan stands in improving recycling in the state, both in comparison to other states and in comparison to previous years. We recommend that the goal setting process begin within the next three months, with specific performance targets outlined within the next six months.
WITHIN THE NEXT YEAR
3. SHARE DATA ON RECYCLING METRICS
Once MDEQ has collected data resulting from the passage of SB507, this information should be shared widely. MDEQ should also develop performance metrics and use them for benchmarking Michigan’s progress against previous years and other states. Private sector businesses may use information on where the public sector has generated supply of recyclable materials and can demonstrate that supply in order to site new processing or manufacturing sites. Local governments may track their own progress against that of their peers, and use that information to show elected officials how they are progressing or whether past investments in recycling programs have produced results. We recommend that this type of data be made public within the next year.
4. CONTINUE TO ASSESS THE STATE OF END-‐USE MARKETS AT REGULAR INTERVALS
We recommend that MDEQ conduct a comprehensive census of manufacturers who currently or could potentially consume recyclable feedstocks and maintain a regular survey to identify current and potential consumers of recyclable feedstocks in Michigan and the region. Valuable information can be gleaned from regular communication with the experts we have assembled for this review, and can also help to support the networks needed to ensure Michigan’s recycling system is strong. MDEQ should continue to conduct an annual survey or other formal interaction (workshop, capital day, investment conference with current and potential end-‐use markets. Gathering and sharing data from end-‐use markets on a regular basis

49
will assist MDEQ in tracking progress towards goals as well as to identify new areas of opportunity or challenges that the Department may provide support.
5. COLLABORATE WITH ECONOMIC DEVELOPMENT AGENCIES TO CONNECT STAKEHOLDERS
Representatives of Michigan end markets contacted in this study emphasized the need to find ways for communities, processors and manufacturers to work together when possible. One way to catalyze such collaborations is to empower regional economic development agencies to make connections between communities that create a supply of materials, facilities that sort materials, and processors and manufacturers that use recycled commodities. Ideally, economic development agencies will be able to foster relationships between MRFs looking to sell materials and brokers or manufacturers looking to purchase materials. Economic development agencies may also be able to establish hub and spoke systems by identifying partners who are interested in being a hub or spoke and making connections between the two. Creating these types of relationships will build regionalization within the recycling industry and thereby strengthen Michigan’s end markets. We recommend that MDEQ work with regional economic development agencies, including local chambers of commerce and local economic development corporations, to help them attract businesses that can use materials generated in Michigan. MDEQ can encourage this by providing economic development agencies with information on the basics of recycling, the system of recycling markets, and the positive economic impacts of recycling. We recommend that MDEQ being researching ways to work with economic development agencies immediately, and roll out a plan for engaging with them within the next year. We also recommend that the MEDC be a full partner, along with the MDEQ, in the development and execution of a comprehensive census of manufacturers who currently or could potentially consume recyclable feedstocks and maintain a regular survey to identify current and potential consumers of recyclable feedstocks.
6. DEVELOP A SUBSTANTIVE AND CONTINUAL EDUCATION AND OUTREACH PROGRAM
To increase participation and reduce contamination, Michigan leaders must make a lasting, substantial and consistent investment in education and outreach that engages residents, front line staff, elected officials, and business and industry. This education and outreach program should have two main areas of focus: 1) developing and disseminating education and outreach tools that drive behavior change, not just ways to build awareness; and 2) supporting Michigan’s communities in managing contamination in recycling streams to avoid conflicts with MRF contracts.
50
As part of the training plan of action developed under Recommendation #1, MDEQ should provide for training the four Recycling Specialists to learn even more about these two main areas of focus, so that they can then pass that knowledge along to local government officials throughout the state. Educating recycling specialists, and in turn others in Michigan, about the importance of both raising awareness and driving behavior changes, will be critical to the success of Michigan recycling. This should include learning from peers, learning from successful local governments such as New York City and Orange County, NC, as well as from The Recycling Partnership. Once this training is complete, MDEQ should devote staff time to working one-‐on-‐one with local governments and with MRFs and haulers to help them strengthen education and outreach programs. MDEQ should also focus on providing education to other agencies that work directly with recycling businesses, for example, MEDC, so that those agencies can be effective educators and communicators about recycling. MDEQ staff should provide advice and suggestions on speaking to elected officials, messaging, designing outreach materials, and other education and outreach tasks. MDEQ’s website should be updated to include a page dedicated to sharing resources from Michigan local governments and businesses who have successful recycling campaigns or materials. This could include recycling brochures and case studies, allowing Michigan local governments and businesses to learn from each other. The education and outreach program should be a collaborative public private partnership with state agencies, Michigan NGOs and trade associations (like the Michigan Recycling Coalition, the Michigan Waste and Recycling Association, ISRI and others) as well as national NGOs and trade associations (like The Recycling Partnership, Keep America Beautiful, the Carton Council and others) and private industry (retail, grocer, food service, brands and others). We recommend that education and outreach training is incorporated into the training action plan for the four Recycling Specialists that is completed within the next year. This information should then be disseminated to local governments and businesses with whom the Recycling Specialists work. The website update should be completed within the next six months.
7. EMBRACE AND LEVERAGE NATIONAL BRANDS, ASSOCIATIONS AND AGENCIES SEEKING SUSTAINABLE MATERIALS MANAGEMENT
The MDEQ should inventory and identify a potential role in Michigan for the many initiatives currently progressing throughout the country. The MDEQ should consider active participation and funding of events and projects that might foster increased investment and activity by these groups, as well as routinizing access for Michigan stakeholders to national resources through

51
technical support, partner agreements, matching funds and in kind supports. These groups will also provide a cost effective means for access to training, best practices, and topical experts for the professional training and development of the Recycling Specialists.
WITHIN THE NEXT 18 MONTHS
8. INSTITUTE A RECYCLING BUSINESS GRANT PROGRAM
Other states, in particular North Carolina, have had success in helping the private sector move more materials by providing grants to recycling businesses that leverage private sector dollars. These grants can stimulate end use markets by helping businesses make infrastructure improvements at MRFs and organics processing facilities, build transfer stations, or undertake other improvements that improve the collection or processing of materials. We recommend that MDEQ creates and funds a program that would provide grant funding directly to recycling businesses that are involved in the collection, processing or end use of materials in the solid waste stream, in order to make smart, prioritized infrastructure improvements across the state. The intent is to solidify infrastructure to deliver quality Michigan materials to Michigan companies and to increase funding and prioritization around what BMPs needed to increase supply. These grants should not be designed to fully fund a project, but instead should look to provide a portion of the funding needed for any given project, with additional or matching funds provided by the business itself or other public or private sector sources. The distribution of grants should be prioritized so that infrastructure development is not haphazard, but rather planned in a way that makes the most of the grant dollars from a statewide perspective. This can be done by targeting materials that Michigan recyclers are demanding, or by focusing on regions within the state, or by establishing BMPs that ensure the grants dollars are used effectively. We recommend that MDEQ begin work towards implementing a recycling business grant program immediately, and work to secure funding for the grants in the upcoming budget cycle. Assuming the program is budgeted in the Fiscal Year 2018 budget, MDEQ could solicit grant applications in the fall of 2017 (on a schedule that does not overlap with the community P2 grants program) and provide grants as early as 2018.
9. ENCOURAGE PRIVATE INVESTMENT IN STATE RECYCLING BY LEVERAGING NEW FINANCIAL
MECHANISMS
MDEQ and its partner state organizations (e.g. Michigan Economic Development Corporation) should encourage private investment in building recycling and organics processing

52
infrastructure in Michigan from partners with an interest in strengthening the supply chain. Collection infrastructure and transportation are weaknesses in Michigan’s recycling end markets; RRS and The Recycling Partnership recommend that the state offer a set of incentives to encourage private investments in recycling, including tax credits, low interest bonds or loans or other financial mechanisms. The state should also consider designating “Recycling Market Development Zones” to incubate innovation in recycling, organics processing, donation and reuse/source reduction initiatives that are targeted at materials that make up municipal solid waste. MDEQ should reach financial incentives within the next six months and seek funding and legislation offering financial incentives to private businesses within the next year, so that these incentives may be offered to private businesses by the end of 2017.
WITHIN TWO TO F IVE YEARS
10. STATE SEED FUNDING TO LEVERAGE INVESTMENTS IN RECYCLING AND ORGANICS INFRASTRUCTURE
State government should provide seed funding (along with other incentives) to leverage the necessary private and public sector investments in MRF capacity, organics processing capacity, hub and spoke collection and processing networks, moving from bins to carts, drop-‐off and convenience centers and other investments that will maximize both the capture rate for recyclables and organics and the quality of those materials. In addition, it is recommended that that during the current down recycling market, MDEQ plan for the inevitable rise in commodity pricing and use this time to research and set goals for attracting, over the next five years, secondary processing facilities for materials that are more challenging to recycle and/or need stronger supply chains to reach end markets – including mixed plastics, glass and e-‐waste. The MDEQ and the Michigan Legislature should develop a process within the university system that would consider how materials research and potential substitution (recyclable for virgin), technology transfer, and basic research into materials handling and supply chain are currently adapted to incorporate recovery market needs. Recommendations about how best to integrate and prioritize recovery markets should be prepared, vetted and supported by the MDEQ and the Legislature, to ensure that our university assets are being fully leveraged.
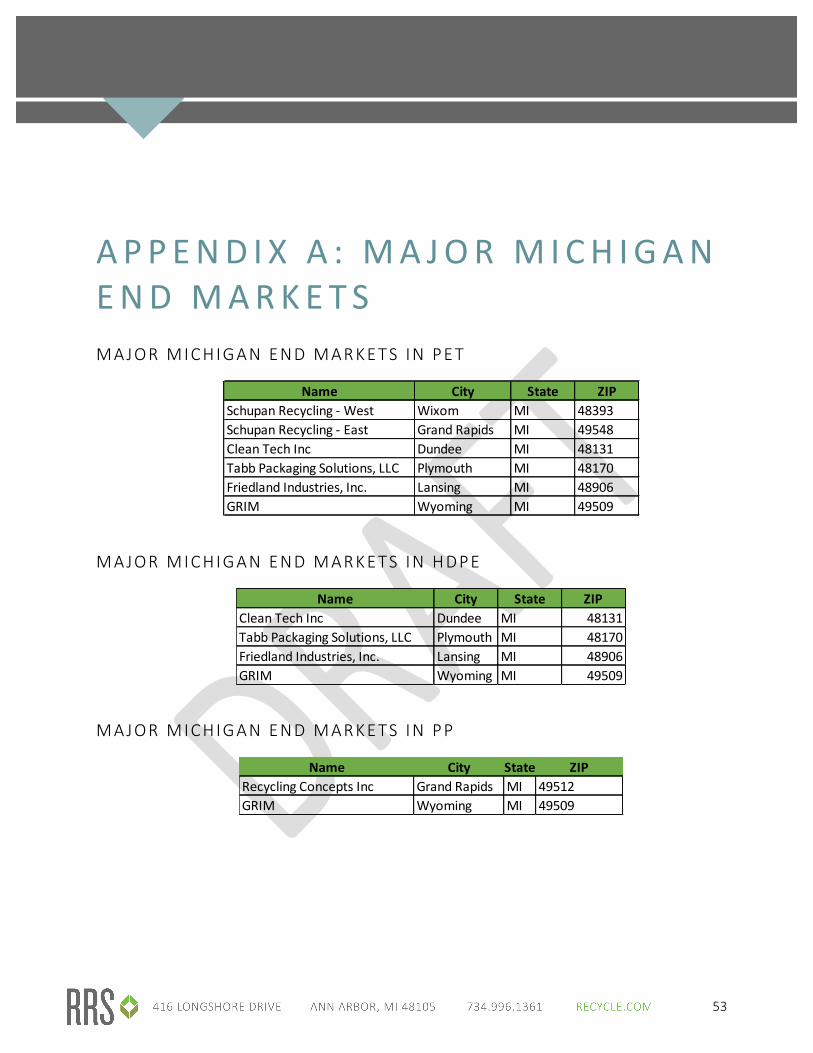
53
APPEND I X A : MA JOR M ICH IGAN END MARKETS MAJOR MICHIGAN END MARKETS IN PET
MAJOR MICHIGAN END MARKETS IN HDPE
MAJOR MICHIGAN END MARKETS IN PP
Name City State ZIPSchupan Recycling -‐ West Wixom MI 48393Schupan Recycling -‐ East Grand Rapids MI 49548Clean Tech Inc Dundee MI 48131Tabb Packaging Solutions, LLC Plymouth MI 48170Friedland Industries, Inc. Lansing MI 48906GRIM Wyoming MI 49509
Name City State ZIPClean Tech Inc Dundee MI 48131Tabb Packaging Solutions, LLC Plymouth MI 48170Friedland Industries, Inc. Lansing MI 48906GRIM Wyoming MI 49509
Name City State ZIPRecycling Concepts Inc Grand Rapids MI 49512GRIM Wyoming MI 49509
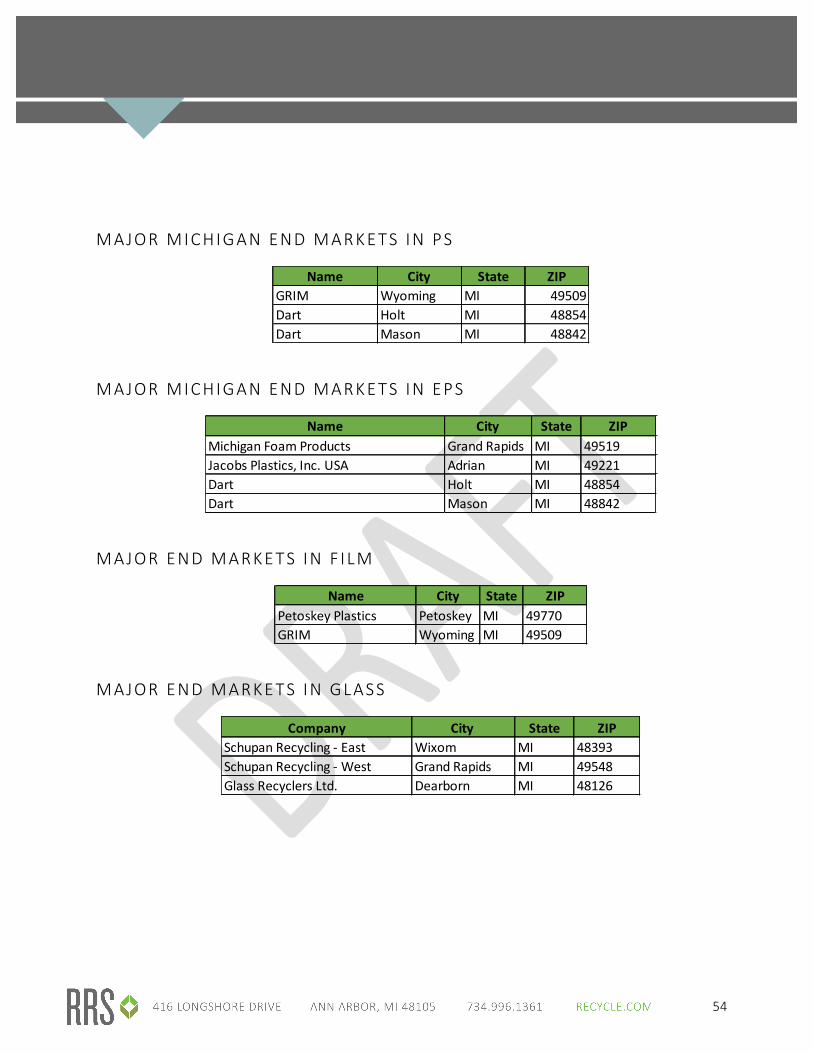
54
MAJOR MICHIGAN END MARKETS IN PS
MAJOR MICHIGAN END MARKETS IN EPS
MAJOR END MARKETS IN F ILM
MAJOR END MARKETS IN GLASS
Name City State ZIPGRIM Wyoming MI 49509Dart Holt MI 48854Dart Mason MI 48842
Name City State ZIPMichigan Foam Products Grand Rapids MI 49519Jacobs Plastics, Inc. USA Adrian MI 49221Dart Holt MI 48854Dart Mason MI 48842
Name City State ZIPPetoskey Plastics Petoskey MI 49770GRIM Wyoming MI 49509
Company City State ZIPSchupan Recycling -‐ East Wixom MI 48393Schupan Recycling -‐ West Grand Rapids MI 49548Glass Recyclers Ltd. Dearborn MI 48126
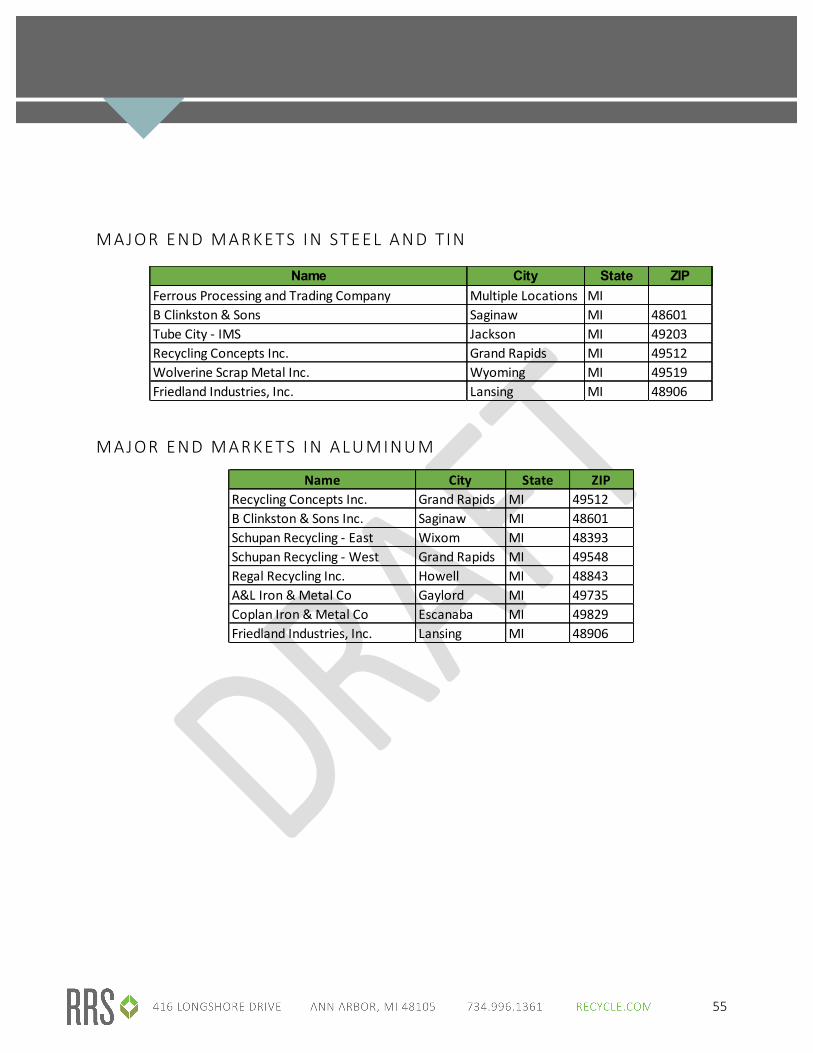
55
MAJOR END MARKETS IN STEEL AND T IN
MAJOR END MARKETS IN ALUMINUM
Name City State ZIPFerrous Processing and Trading Company Multiple Locations MIB Clinkston & Sons Saginaw MI 48601Tube City -‐ IMS Jackson MI 49203Recycling Concepts Inc. Grand Rapids MI 49512Wolverine Scrap Metal Inc. Wyoming MI 49519Friedland Industries, Inc. Lansing MI 48906
Name City State ZIPRecycling Concepts Inc. Grand Rapids MI 49512B Clinkston & Sons Inc. Saginaw MI 48601Schupan Recycling -‐ East Wixom MI 48393Schupan Recycling -‐ West Grand Rapids MI 49548Regal Recycling Inc. Howell MI 48843A&L Iron & Metal Co Gaylord MI 49735Coplan Iron & Metal Co Escanaba MI 49829Friedland Industries, Inc. Lansing MI 48906

56
MAJOR END MARKETS IN PAPER
Name City State ZIPGraphic Packaging International Battle Creek MI 49017WestRock Company Battle Creek MI 49037Great Lakes Tissue Cheboygan MI 49721Ox Paperboard Michigan LLC Constantine MI 49042NewPage Escanaba MI 49829Packaging Corp of America Filer City MI 49634Graphic Packaging International Kalamazoo MI 49007FutureMark Paper Manistique MI 49854Resolute Forest Products Menominee MI 49858Clearwater Paper Menominee MI 49858Neenah Paper Munising MI 49862French Paper Niles MI 49120US Gypsum Corp Otsego MI 49078Domtar Port Huron MI 48060Dunn Paper Port Huron MI 48060Verso Paper Corp. Quinnesec MI 49876White Pigeon Paper White Pigeon MI 49099Krell Paper Stock Inc Grand Rapids MI 49507Royal Oak Waste Paper & Metal Co Royal Oak MI 48067Fibrek Inc Menominee MI 49858Green Bay Packaging Kalamazoo MI 49003Friedland Industries, Inc. Lansing MI 48906GRIM Wyoming MI 49509
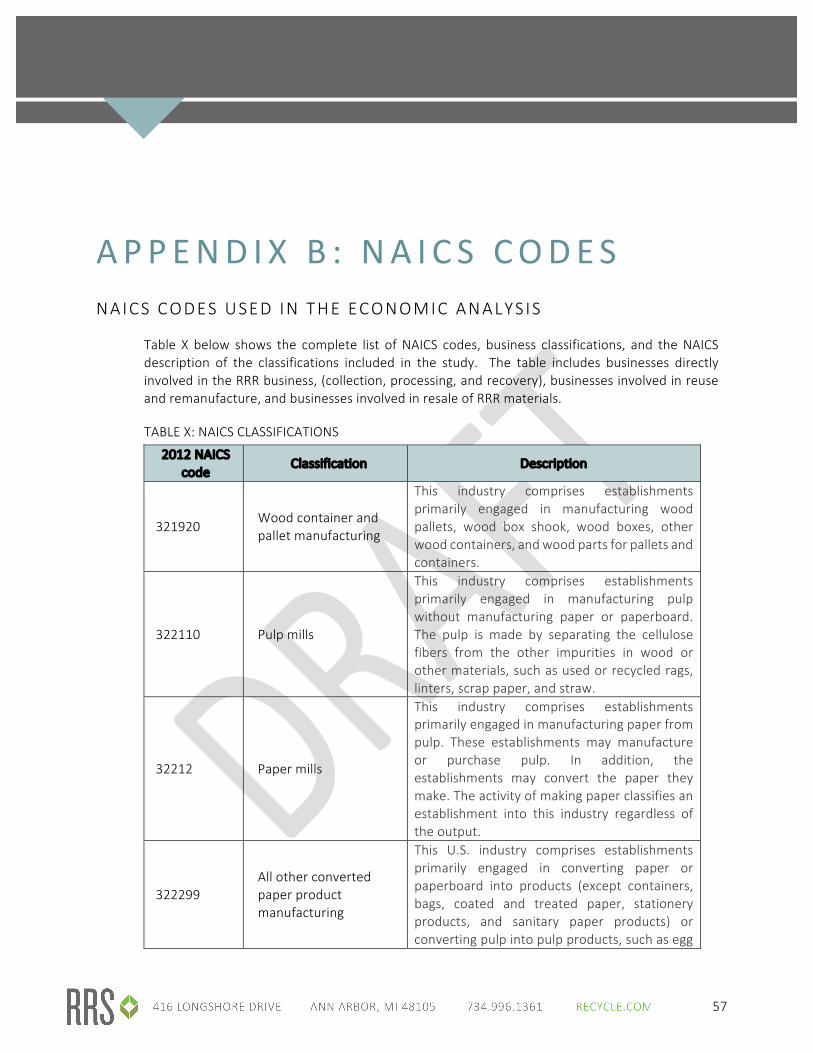
57
APPEND I X B : NA I C S CODES NAICS CODES USED IN THE ECONOMIC ANALYS IS
Table X below shows the complete list of NAICS codes, business classifications, and the NAICS description of the classifications included in the study. The table includes businesses directly involved in the RRR business, (collection, processing, and recovery), businesses involved in reuse and remanufacture, and businesses involved in resale of RRR materials.
TABLE X: NAICS CLASSIFICATIONS
2012 NAICS code
Classification Description
321920 Wood container and pallet manufacturing
This industry comprises establishments primarily engaged in manufacturing wood pallets, wood box shook, wood boxes, other wood containers, and wood parts for pallets and containers.
322110 Pulp mills
This industry comprises establishments primarily engaged in manufacturing pulp without manufacturing paper or paperboard. The pulp is made by separating the cellulose fibers from the other impurities in wood or other materials, such as used or recycled rags, linters, scrap paper, and straw.
32212 Paper mills
This industry comprises establishments primarily engaged in manufacturing paper from pulp. These establishments may manufacture or purchase pulp. In addition, the establishments may convert the paper they make. The activity of making paper classifies an establishment into this industry regardless of the output.
322299 All other converted paper product manufacturing
This U.S. industry comprises establishments primarily engaged in converting paper or paperboard into products (except containers, bags, coated and treated paper, stationery products, and sanitary paper products) or converting pulp into pulp products, such as egg
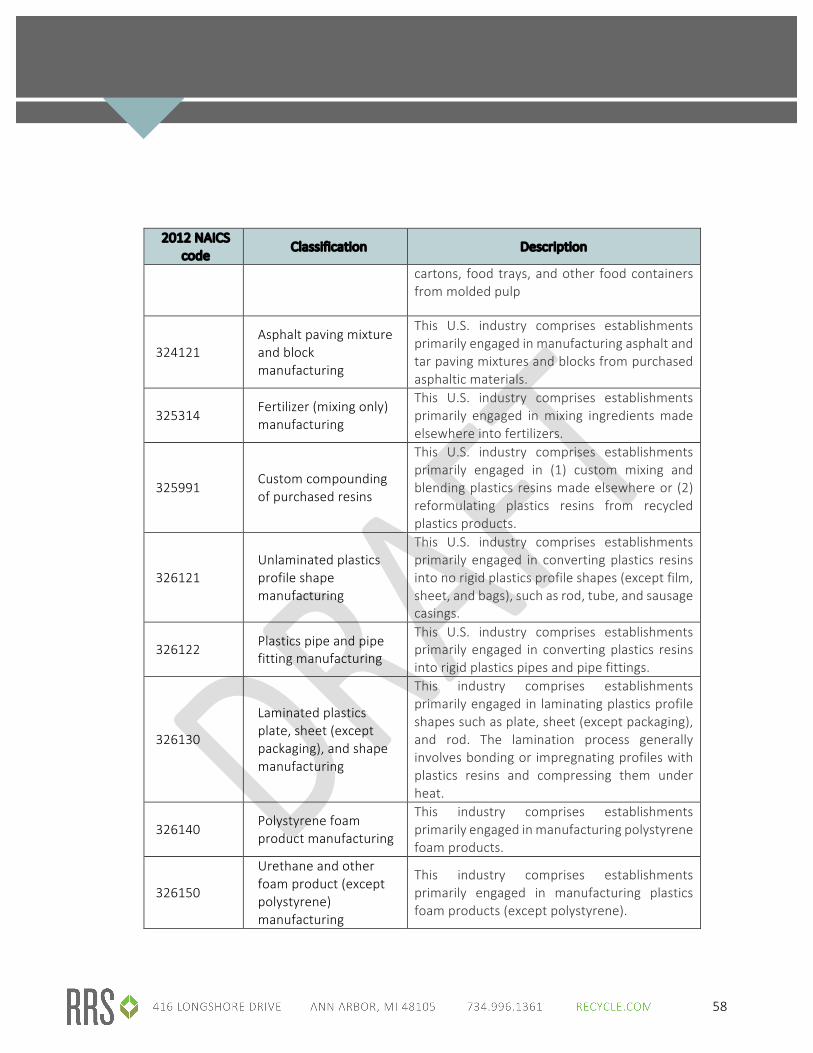
58
2012 NAICS code
Classification Description
cartons, food trays, and other food containers from molded pulp
324121 Asphalt paving mixture and block manufacturing
This U.S. industry comprises establishments primarily engaged in manufacturing asphalt and tar paving mixtures and blocks from purchased asphaltic materials.
325314 Fertilizer (mixing only) manufacturing
This U.S. industry comprises establishments primarily engaged in mixing ingredients made elsewhere into fertilizers.
325991 Custom compounding of purchased resins
This U.S. industry comprises establishments primarily engaged in (1) custom mixing and blending plastics resins made elsewhere or (2) reformulating plastics resins from recycled plastics products.
326121 Unlaminated plastics profile shape manufacturing
This U.S. industry comprises establishments primarily engaged in converting plastics resins into no rigid plastics profile shapes (except film, sheet, and bags), such as rod, tube, and sausage casings.
326122 Plastics pipe and pipe fitting manufacturing
This U.S. industry comprises establishments primarily engaged in converting plastics resins into rigid plastics pipes and pipe fittings.
326130
Laminated plastics plate, sheet (except packaging), and shape manufacturing
This industry comprises establishments primarily engaged in laminating plastics profile shapes such as plate, sheet (except packaging), and rod. The lamination process generally involves bonding or impregnating profiles with plastics resins and compressing them under heat.
326140 Polystyrene foam product manufacturing
This industry comprises establishments primarily engaged in manufacturing polystyrene foam products.
326150
Urethane and other foam product (except polystyrene) manufacturing
This industry comprises establishments primarily engaged in manufacturing plastics foam products (except polystyrene).

59
2012 NAICS code
Classification Description
326160 Plastics bottle manufacturing
This industry comprises establishments primarily engaged in manufacturing plastics bottles.
32619 Other plastics product manufacturing
This industry comprises establishments primarily engaged in manufacturing plastics plumbing fixtures and other plastics products (except film, sheet, bags, profile shapes, pipes, pipe fittings, laminates, foam products, and bottles
32621 Tires
This industry comprises establishments primarily engaged in manufacturing tires and inner tubes from natural and synthetic rubber and retreading or rebuilding tires.
326220 Rubber plastics hoses and belting
This industry comprises establishments primarily engaged in manufacturing rubber hose and/or plastics (reinforced) hose and belting from natural and synthetic rubber and/or plastics resins. Establishments manufacturing garden hoses from purchased hose are included in this industry.
32629 Other rubber product manufacturing
This industry comprises establishments primarily engaged in manufacturing rubber products (except tires, hoses, and belting) from natural and synthetic rubber.
327213 Glass container manufacturing
This U.S. industry comprises establishments primarily engaged in manufacturing glass packaging containers.
331110 Iron and steel mills and ferroalloy manufacturing
This industry comprises establishments primarily engaged in one or more of the following: (1) direct reduction of iron ore; (2) manufacturing pig iron in molten or solid form; (3) converting pig iron into steel; (4) making steel; (5) making steel and manufacturing shapes (e.g., bar, plate, rod, sheet, strip, wire); (6) making steel and forming pipe and tube; and (7) manufacturing electrometallurgical ferroalloys. Ferroalloys add critical elements, such as silicon and manganese for carbon steel
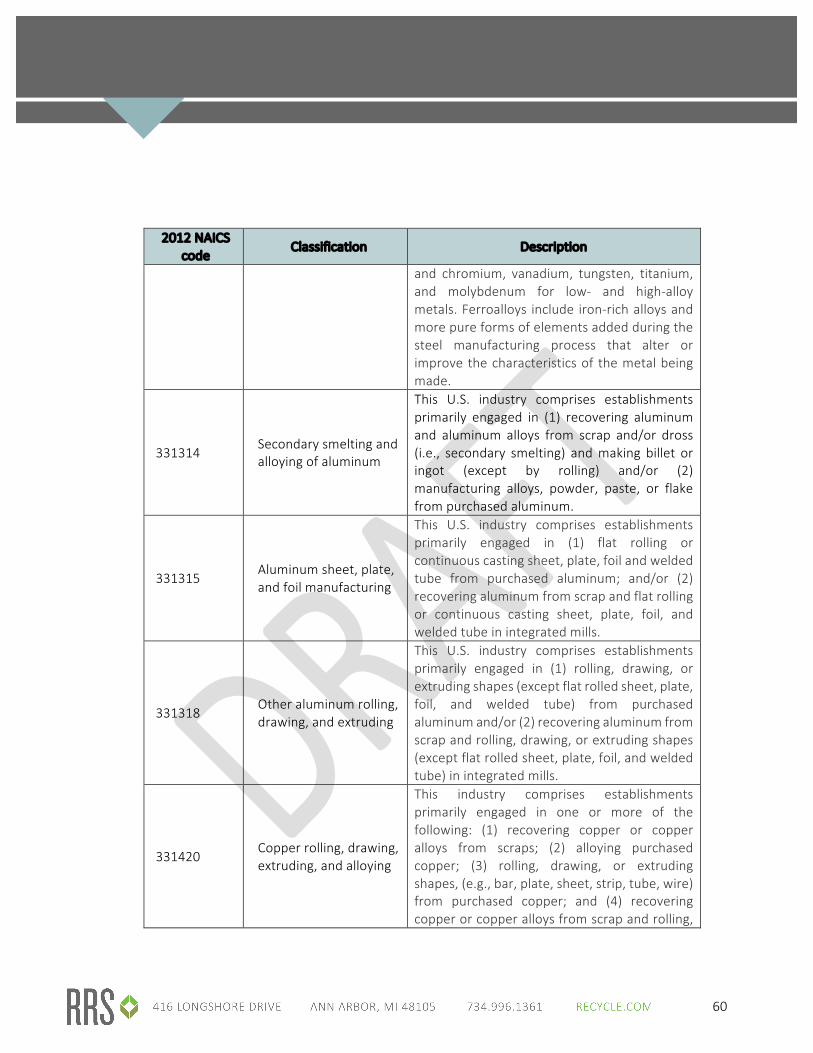
60
2012 NAICS code
Classification Description
and chromium, vanadium, tungsten, titanium, and molybdenum for low-‐ and high-‐alloy metals. Ferroalloys include iron-‐rich alloys and more pure forms of elements added during the steel manufacturing process that alter or improve the characteristics of the metal being made.
331314 Secondary smelting and alloying of aluminum
This U.S. industry comprises establishments primarily engaged in (1) recovering aluminum and aluminum alloys from scrap and/or dross (i.e., secondary smelting) and making billet or ingot (except by rolling) and/or (2) manufacturing alloys, powder, paste, or flake from purchased aluminum.
331315 Aluminum sheet, plate, and foil manufacturing
This U.S. industry comprises establishments primarily engaged in (1) flat rolling or continuous casting sheet, plate, foil and welded tube from purchased aluminum; and/or (2) recovering aluminum from scrap and flat rolling or continuous casting sheet, plate, foil, and welded tube in integrated mills.
331318 Other aluminum rolling, drawing, and extruding
This U.S. industry comprises establishments primarily engaged in (1) rolling, drawing, or extruding shapes (except flat rolled sheet, plate, foil, and welded tube) from purchased aluminum and/or (2) recovering aluminum from scrap and rolling, drawing, or extruding shapes (except flat rolled sheet, plate, foil, and welded tube) in integrated mills.
331420 Copper rolling, drawing, extruding, and alloying
This industry comprises establishments primarily engaged in one or more of the following: (1) recovering copper or copper alloys from scraps; (2) alloying purchased copper; (3) rolling, drawing, or extruding shapes, (e.g., bar, plate, sheet, strip, tube, wire) from purchased copper; and (4) recovering copper or copper alloys from scrap and rolling,
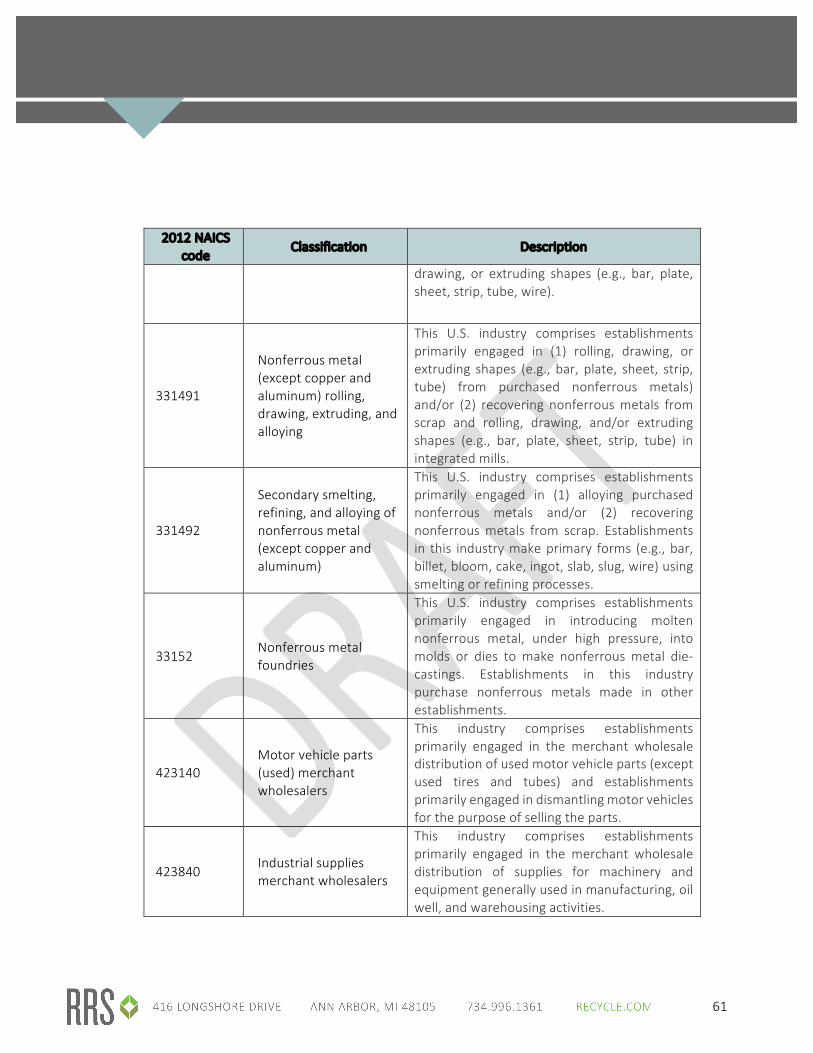
61
2012 NAICS code
Classification Description
drawing, or extruding shapes (e.g., bar, plate, sheet, strip, tube, wire).
331491
Nonferrous metal (except copper and aluminum) rolling, drawing, extruding, and alloying
This U.S. industry comprises establishments primarily engaged in (1) rolling, drawing, or extruding shapes (e.g., bar, plate, sheet, strip, tube) from purchased nonferrous metals) and/or (2) recovering nonferrous metals from scrap and rolling, drawing, and/or extruding shapes (e.g., bar, plate, sheet, strip, tube) in integrated mills.
331492
Secondary smelting, refining, and alloying of nonferrous metal (except copper and aluminum)
This U.S. industry comprises establishments primarily engaged in (1) alloying purchased nonferrous metals and/or (2) recovering nonferrous metals from scrap. Establishments in this industry make primary forms (e.g., bar, billet, bloom, cake, ingot, slab, slug, wire) using smelting or refining processes.
33152 Nonferrous metal foundries
This U.S. industry comprises establishments primarily engaged in introducing molten nonferrous metal, under high pressure, into molds or dies to make nonferrous metal die-‐castings. Establishments in this industry purchase nonferrous metals made in other establishments.
423140 Motor vehicle parts (used) merchant wholesalers
This industry comprises establishments primarily engaged in the merchant wholesale distribution of used motor vehicle parts (except used tires and tubes) and establishments primarily engaged in dismantling motor vehicles for the purpose of selling the parts.
423840 Industrial supplies merchant wholesalers
This industry comprises establishments primarily engaged in the merchant wholesale distribution of supplies for machinery and equipment generally used in manufacturing, oil well, and warehousing activities.

62
2012 NAICS code
Classification Description
423930 Recyclable material merchant wholesalers
This industry comprises establishments primarily engaged in the merchant wholesale distribution of automotive scrap, industrial scrap, and other recyclable materials. Included in this industry are auto wreckers primarily engaged in dismantling motor vehicles for the purpose of wholesaling scrap.
453310 Used merchandise stores
This industry comprises establishments primarily engaged in retailing used merchandise, antiques, and secondhand goods (except motor vehicles, such as automobiles, RVs, motorcycles, and boats; motor vehicle parts; tires; and mobile homes).
541990 All other professional, scientific, and technical services
This industry comprises establishments primarily engaged in the provision of professional, scientific, or technical services (except legal services; accounting, tax preparation, bookkeeping, and related services; architectural, engineering, and related services; specialized design services; computer systems design and related services; management, scientific, and technical consulting services; scientific research and development services; advertising, public relations and related services; market research and public opinion polling; photographic services; translation and interpretation services; and veterinary services).
562111 Solid waste collection
This U.S. industry comprises establishments primarily engaged in one or more of the following: (1) collecting and/or hauling nonhazardous solid waste (i.e., garbage) within a local area; (2) operating nonhazardous solid waste transfer stations; and (3) collecting and/or hauling mixed recyclable materials within a local area.
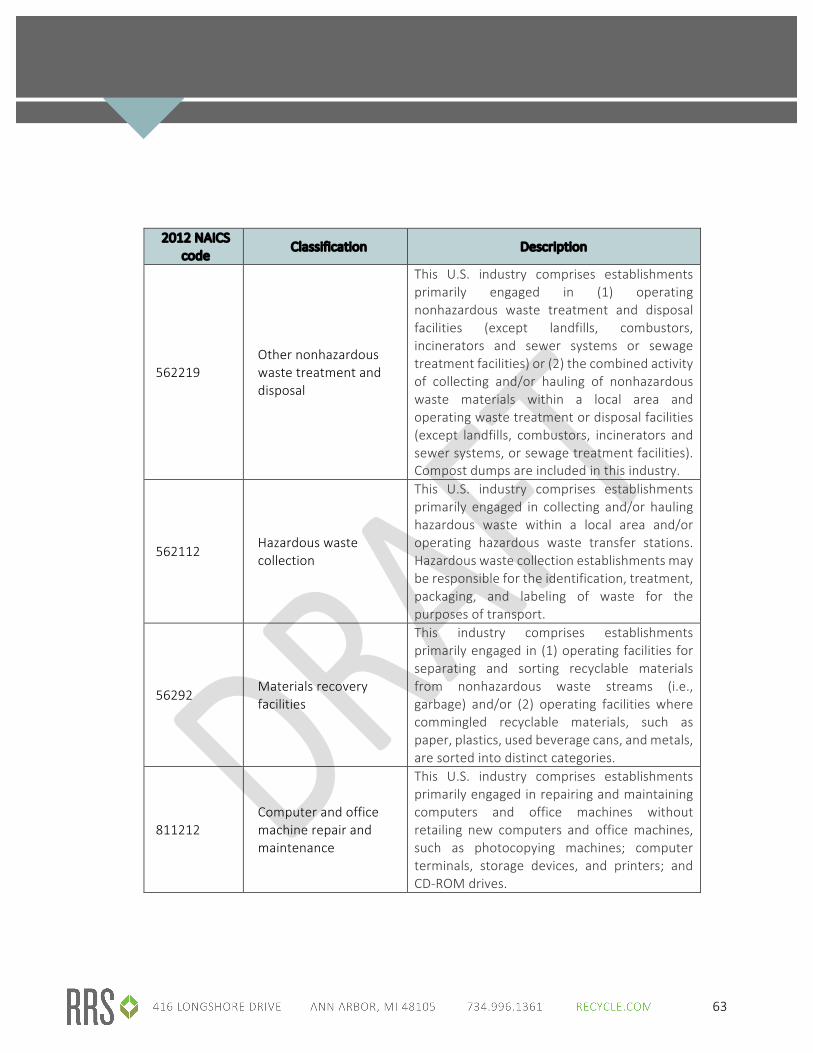
63
2012 NAICS code
Classification Description
562219 Other nonhazardous waste treatment and disposal
This U.S. industry comprises establishments primarily engaged in (1) operating nonhazardous waste treatment and disposal facilities (except landfills, combustors, incinerators and sewer systems or sewage treatment facilities) or (2) the combined activity of collecting and/or hauling of nonhazardous waste materials within a local area and operating waste treatment or disposal facilities (except landfills, combustors, incinerators and sewer systems, or sewage treatment facilities). Compost dumps are included in this industry.
562112 Hazardous waste collection
This U.S. industry comprises establishments primarily engaged in collecting and/or hauling hazardous waste within a local area and/or operating hazardous waste transfer stations. Hazardous waste collection establishments may be responsible for the identification, treatment, packaging, and labeling of waste for the purposes of transport.
56292 Materials recovery facilities
This industry comprises establishments primarily engaged in (1) operating facilities for separating and sorting recyclable materials from nonhazardous waste streams (i.e., garbage) and/or (2) operating facilities where commingled recyclable materials, such as paper, plastics, used beverage cans, and metals, are sorted into distinct categories.
811212 Computer and office machine repair and maintenance
This U.S. industry comprises establishments primarily engaged in repairing and maintaining computers and office machines without retailing new computers and office machines, such as photocopying machines; computer terminals, storage devices, and printers; and CD-‐ROM drives.
0
MANAGING CHANGE IN A RESOURCE-‐CONSTRAINED WORLD
RRS is a consultancy with a vision. We see a world where resources are managed to maximize economic and social benefit while minimizing environmental impact. A world where abundance keeps pace with societal needs.
We have assembled a unique team of strategists, engineers, economists and communications specialists with core strengths in materials and recovery, coupled with expertise in life cycle management and applied sustainable design. These experts operate confidently across the supply chain, identifying the most leveraged opportunities to affect change, and developing pathways to long-‐term value.
RRS has been working toward this vision since 1986. Our clients are leaders in materials management, and in partnership we have achieved outstanding results. We remain nimble and responsive, providing informed, innovative, actionable solutions to the sustainability challenges of our time.
![Turning Back [updated 6.5.2015]](https://static.fdokumen.com/doc/165x107/6335f35102a8c1a4ec01fd86/turning-back-updated-652015.jpg)